UNITED STATES
SECURITIES AND EXCHANGE COMMISSION
Washington, DC 20549
FORM N-CSR/A
CERTIFIED SHAREHOLDER REPORT OF REGISTERED
MANAGEMENT INVESTMENT COMPANIES
Investment Company Act file number 811-05583
Franklin Templeton Variable Insurance Products Trust
(Exact name of registrant as specified in charter)
One Franklin Parkway, San Mateo, CA 94403-1906
(Address of principal executive offices) (Zip code)
Craig S. Tyle, One Franklin Parkway, San Mateo, CA 94403-1906
(Name and address of agent for service)
Registrant’s telephone number, including area code: (650) 312-2000
Date of fiscal year end: 12/31
Date of reporting period: 12/31/14
| Item 1. | Reports to Stockholders. |
| | |
 | | Annual Report December 31, 2014 |
Franklin Templeton
Variable Insurance Products Trust

Franklin Templeton Variable Insurance
Products Trust Annual Report
| | | | |
| Table of Contents | | | |
| |
| Important Notes to Performance Information | | | i | |
| *Franklin Templeton Variable Insurance Products Trust Statement of Additional Information Supplement | | | SAI-1 | |
| |
| Fund Summaries | | | | |
Franklin Flex Cap Growth VIP Fund (formerly, Franklin Flex Cap Growth Securities Fund) | | | FFC-1 | |
*Prospectus Supplement | | | FFC-6 | |
Franklin Founding Funds Allocation VIP Fund (formerly, Franklin Templeton VIP Founding Funds Allocation Fund) | | | FFA-1 | |
Franklin Global Real Estate VIP Fund (formerly, Franklin Global Real Estate Securities Fund) | | | FGR-1 | |
*Prospectus Supplement | | | FGR-6 | |
Franklin Growth and Income VIP Fund (formerly, Franklin Growth and Income Securities Fund) | | | FGI-1 | |
Franklin High Income VIP Fund (formerly, Franklin High Income Securities Fund) | | | FH-1 | |
Franklin Income VIP Fund (formerly, Franklin Income Securities Fund) | | | FI-1 | |
Franklin Large Cap Growth VIP Fund (formerly, Franklin Large Cap Growth Securities Fund) | | | FLG-1 | |
Franklin Mutual Global Discovery VIP Fund (formerly, Mutual Global Discovery Securities Fund) | | | MGD-1 | |
Franklin Mutual Shares VIP Fund (formerly, Mutual Shares Securities Fund) | | | MS-1 | |
Franklin Rising Dividends VIP Fund (formerly, Franklin Rising Dividends Securities Fund) | | | FRD-1 | |
*Prospectus Supplement | | | FRD-6 | |
Franklin Small Cap Value VIP Fund (formerly, Franklin Small Cap Value Securities Fund) | | | FSV-1 | |
*Prospectus Supplement | | | FSV-6 | |
Franklin Small-Mid Cap Growth VIP Fund (formerly, Franklin Small-Mid Cap Growth Securities Fund) | | | FSC-1 | |
Franklin Strategic Income VIP Fund (formerly, Franklin Strategic Income Securities Fund) | | | FSI-1 | |
*Prospectus and Statement of Additional Information Supplements | | | FSI-6 | |
Franklin U.S. Government Securities VIP Fund (formerly, Franklin U.S. Government Fund) | | | FUS-1 | |
Templeton Developing Markets VIP Fund (formerly, Templeton Developing Markets Securities Fund) | | | TD-1 | |
Templeton Foreign VIP Fund (formerly, Templeton Foreign Securities Fund) | | | TF-1 | |
Templeton Global Bond VIP Fund (formerly, Templeton Global Bond Securities Fund) | | | TGB-1 | |
Templeton Growth VIP Fund (formerly, Templeton Growth Securities Fund) | | | TG-1 | |
| Index Descriptions | | | I-1 | |
| Board Members and Officers | | | BOD-1 | |
| Shareholder Information | | | SI-1 | |
*Not part of the annual report. Retain for your records.
|
| Not FDIC Insured | May Lose Value | No Bank Guarantee |
MASTER CLASS – 2
FRANKLIN TEMPLETON VARIABLE INSURANCE PRODUCTS TRUST
Important Notes to Performance Information
Performance data is historical and cannot predict or guarantee future results. Principal value and investment return will fluctuate with market conditions, and you may have a gain or loss when you withdraw your money. Inception dates of the funds may have preceded the effective dates of the subaccounts, contracts or their availability in all states.
When reviewing the index comparisons, please keep in mind that indexes have a number of inherent performance differentials over the funds. First, unlike the funds, which must hold a minimum amount of cash to maintain liquidity, indexes do not have a cash component. Second, the funds are actively managed and, thus, are subject to management fees to cover salaries of securities analysts or portfolio managers in addition to other expenses. Indexes are unmanaged and do not include any commissions or other expenses typically associated with investing in securities. Third, indexes often contain a different mix of securities than the fund to which they are compared. Additionally, please remember that indexes are simply a measure of performance and cannot be invested in directly.
SUPPLEMENT DATED SEPTEMBER 24, 2014
TOTHE STATEMENTOF ADDITIONAL INFORMATION
DATED MAY 1, 2014OF
FRANKLIN TEMPLETON VARIABLE INSURANCE PRODUCTS TRUST (the “Trust”)
The following section is added to the Trust’s Statement of Additional Information before the section “Performance” on page 100:
Calculation of Net Asset Value
The Fund’s net asset value per share is generally calculated to two decimal places, but it will generally be calculated to four decimal places in connection with redemptions of two-thirds or more of the Fund’s assets.
Please keep this supplement with your statement of additional information for future reference.
SAI-1
Franklin Flex Cap Growth VIP Fund
(Formerly, Franklin Flex Cap Growth Securities Fund)
This annual report for Franklin Flex Cap Growth VIP Fund covers the fiscal year ended December 31, 2014.
Class 2 Performance Summary as of December 31, 2014
Average annual total return of Class 2 shares* represents the average annual change in value, assuming reinvestment of dividends and capital gains. Average returns smooth out variations in returns, which can be significant; they are not the same as year-by-year results.
| | | | | | | | | | | | |
| Periods ended 12/31/14 | | 1-Year | | | 5-Year | | | Since Inception (3/1/05) | |
Average Annual Total Return | | | +6.11% | | | | +12.01% | | | | +6.93% | |
*The Fund has an expense reduction contractually guaranteed through at least 4/30/15 and a fee waiver associated with its investments in a Franklin Templeton money fund, contractually guaranteed through at least its current fiscal year-end. Fund investment results reflect the expense reduction and fee waiver, to the extent applicable; without these reductions, the results would have been lower.
Performance reflects the Fund’s Class 2 operating expenses, but does not include any contract fees, expenses or sales charges. If they had been included, performance would be lower. These charges and deductions, particularly for variable life policies, can have a significant effect on contract values and insurance benefits. See the contract prospectus for a complete description of these expenses, including sales charges.
Performance data represent past performance, which does not guarantee future results. Investment return and principal value will fluctuate, and you may have a gain or loss when you sell your shares. Current performance may differ from figures shown.
Total Return Index Comparison for a Hypothetical $10,000 Investment (3/1/05–12/31/14)
The graph below shows the change in value of a hypothetical $10,000 investment in the Fund over the indicated period and includes reinvestment of any income or distributions. The Fund’s performance* is compared to the performance of the Russell 1000® Growth Index, the Russell 3000® Growth Index and the Standard & Poors® 500 Index (S&P 500®). One cannot invest directly in an index, and an index is not representative of the Fund’s portfolio. Please see Important Notes to Performance Information preceding the Fund Summaries.
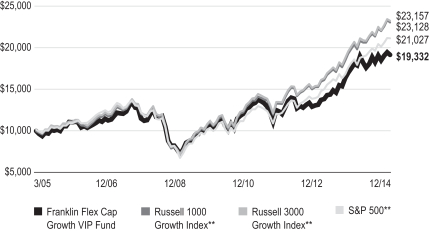
**Source: Morningstar. Please see Index Descriptions following the Fund Summaries.
FRANKLIN FLEX CAP GROWTH VIP FUND
Fund Goal and Main Investments
Franklin Flex Cap Growth VIP Fund seeks capital appreciation. Under normal market conditions, the Fund invests predominantly in equity securities of companies that the investment manager believes have the potential for capital appreciation.
Fund Risks
All investments involve risks, including possible loss of principal. Growth stock prices reflect projections of future earnings or revenues, and can, therefore, fall dramatically if the company fails to meet those projections. Smaller, midsized and relatively new or unseasoned companies can be particularly sensitive to changing economic conditions, and their prospects for growth are less certain than those of larger, more established companies. Historically, these securities have experienced more price volatility than larger company stocks, especially over the short term. To the extent the Fund focuses on particular countries, regions, industries, sectors or types of investment from time to time, it may be subject to greater risk of adverse developments in such areas of focus than a fund that invests in a wider variety of countries, regions, industries, sectors or investments. Foreign securities involve special risks, including currency fluctuations and economic and political uncertainties. The Fund is actively managed but there is no guarantee that the manager’s investment decisions will produce the desired results. The Fund’s prospectus also includes a description of the main investment risks.
Performance Overview
You can find the Fund’s one-year total return in the Performance Summary. In comparison, the Russell 1000® Growth Index generated a +13.05% total return, the Russell 3000® Growth Index delivered a +12.44% total return, and the S&P 500 produced a +13.69% total return for the same period.1
Economic and Market Overview
The U.S. economy continued to grow during the year ended December 31, 2014, underpinned in some quarters by manufacturing activity, consumer and business spending, and federal defense spending. Home sales experienced some weakness resulting from reduced inventory, higher mortgage rates and tight credit requirements but began to recover in May as mortgage rates declined. Home prices stayed higher than a year earlier. Retail sales generally improved, supported by job growth and lower
gasoline prices in the latter part of 2014. The unemployment rate declined to 5.6% in December 2014 from 6.7% in December 2013.2 Inflation, as measured by the Consumer Price Index, remained low.
In January 2014, the U.S. Federal Reserve Board (Fed) began reducing its large-scale bond purchases $10 billion a month and ended the buying program in October. But it continued its practice of maintaining holdings of longer term securities at sizable levels. The Fed believed underlying economic strength could support ongoing progress in labor market conditions. The Fed also noted that although inflation might remain low in the near term, the likelihood of inflation running persistently below 2% had diminished. Toward period-end, the Fed stated that it could be patient with regard to raising interest rates and that the interest rate might not rise for at least a couple of meetings, possibly implying at least the first two meetings of 2015.
Investor confidence grew during the period as corporate profits rose and the economy generally strengthened. The market endured sell-offs when many investors reacted to political instability in certain emerging markets, crises in Ukraine and the Middle East, weakness in Europe and Japan, and moderating economic data in China. U.S. stocks rose overall for the 12 months under review as the S&P 500 and Dow Jones Industrial Average reached all-time highs.3
Investment Strategy
We use fundamental, bottom-up research to seek companies meeting our criteria of growth potential, quality and valuation. In seeking sustainable growth characteristics, we look for companies we believe can produce sustainable earnings and cash flow growth, evaluating the long-term market opportunity and competitive structure of an industry to target leaders and emerging leaders. We define quality companies as those with strong and improving competitive positions in attractive markets. We also believe important attributes of quality are experienced and talented management teams as well as financial strength reflected in the capital structure, gross and operating margins, free cash flow generation and returns on capital employed. Our valuation analysis includes a range of potential outcomes based on an assessment of multiple scenarios. In assessing value, we consider whether security prices fully reflect the balance of the sustainable growth opportunities relative to business and financial risks.
1. Source: Morningstar.
One cannot invest directly in an index, and an index is not representative of the Fund’s portfolio. Please see Index Descriptions following the Fund Summaries.
2. Source: Bureau of Labor Statistics.
3. Please see Index Descriptions following the Fund Summaries.
FRANKLIN FLEX CAP GROWTH VIP FUND
Manager’s Discussion
During the 12 months under review, most sectors represented in the Fund’s portfolio delivered gains and contributed to absolute performance. Relative to the Russell 3000® Growth Index, key contributors included an overweighting in health care, as well as stock selection and an underweighting in telecommunication services.4 Also helping relative results was an underweighting in the energy sector, which suffered from weak crude oil prices resulting from slower global demand growth and strong world supply.
In the health care sector, generic pharmaceutical company Actavis and life sciences tools and services firm Illumina were among the top performers. Actavis’s shares rallied after the company announced in February that it would acquire Forest Laboratories to strengthen its specialty pharmaceuticals portfolio and reported that its acquisition of specialty drug maker Warner Chilcott had helped earnings results. Actavis agreed to acquire several other companies in 2014, including multi-specialty global health care firm Allergan, which would make the combined company one of the largest pharmaceutical companies worldwide. Accretive acquisitions boosted Actavis’s revenues and earnings in recent quarters. Illumina announced strong quarterly earnings, supported by healthy global demand for its sequencing products and services. The company also raised its revenue and earnings guidance for full year 2014.
Other notable contributors included our off-benchmark investment in Netherlands-based integrated circuit manufacturer NXP Semiconductors, as well as our positions in equipment rental company United Rentals5 and athletic apparel and footwear manufacturer Under Armour. NXP Semiconductors generated better-than-expected earnings, driven by product revenue growth and cost control. Additionally, NXP benefited from company-specific product cycles and strong demand trends from certain customers and expected to experience seasonality in certain business segments. United Rentals delivered stronger-than-expected quarterly earnings, driven by growth in equipment rentals and sales. Under Armour reported solid quarterly revenues and raised guidance for full year 2014 as footwear demand and international sales gained momentum.
In contrast, major detractors from relative performance included stock selection in the consumer discretionary and industrials sectors.6
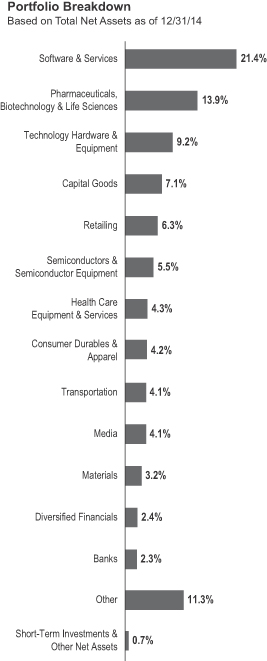
4. The health care sector comprises health care equipment and services; and pharmaceuticals, biotechnology and life sciences in the SOI.
5. No longer held by period-end.
6. The consumer discretionary sector comprises automobiles and components, consumer durables and apparel, consumer services, media and retailing in the SOI. The industrials sector comprises capital goods, commercial and professional services, and transportation in the SOI.
FRANKLIN FLEX CAP GROWTH VIP FUND
| | | | |
| Top 10 Holdings | | | |
| 12/31/14 | | | |
Company
Sector/Industry | | % of Total
Net Assets | |
Apple Inc.
Technology Hardware & Equipment | | | 6.2% | |
Facebook Inc., A
Software & Services | | | 3.1% | |
MasterCard Inc., A
Software & Services | | | 2.8% | |
Celgene Corp.
Pharmaceuticals, Biotechnology & Life Sciences | | | 2.7% | |
Actavis PLC
Pharmaceuticals, Biotechnology & Life Sciences | | | 2.7% | |
Visa Inc., A
Software & Services | | | 2.1% | |
Precision Castparts Corp.
Capital Goods | | | 2.0% | |
LinkedIn Corp., A
Software & Services | | | 1.8% | |
Amazon.com Inc.
Retailing | | | 1.6% | |
Ecolab Inc.
Materials | | | 1.6% | |
The dollar value, number of shares or principal amount, and names of all portfolio holdings are listed in the Fund’s Statement of Investments (SOI).
Within consumer discretionary, full-service restaurant company Chuy’s Holdings and casino resort operator Wynn Resorts5 detracted from relative returns. Chuy’s Holdings’ share price declined after the company reported lower-than-expected third-quarter earnings and lowered its fiscal-year 2014 guidance. Shares of Wynn Resorts, which generates most of its revenue from Las Vegas and Macau, were hurt by a decline in Macau gambling revenues.
In the industrials sector, key detractors included our position in hydrocarbon and gas production and storage equipment manufacturer Chart Industries5 and our off-benchmark investment in satellite imagery service provider DigitalGlobe.5 Chart Industries reported weaker-than-expected quarterly earnings and lowered its full-year 2014 guidance, citing headwinds in its biomedical segment, uncertainty about China’s liquefied natural gas demand and weak crude oil prices. DigitalGlobe’s shares fell after the company reported fourth-quarter 2013 revenues and a fiscal-year 2014 revenue outlook that missed expectations. News that Google5 would acquire a competitor also weighed on the stock.
Other key detractors included our position in 3D printer manufacturer Stratasys, which delivered stronger-than-expected earnings for 2014’s first three quarters, driven partly by contributions from recent acquisitions and higher margin products. However, the company lowered its full-year 2014 guidance because of costs associated with its acquisition of cloud-based collaboration tools provider GrabCAD, which Stratasys expected would improve accessibility to its 3D printing solutions.
Thank you for your participation in Franklin Flex Cap Growth VIP Fund. We look forward to serving your future investment needs.
The foregoing information reflects our analysis, opinions and portfolio holdings as of December 31, 2014, the end of the reporting period. The way we implement our main investment strategies and the resulting portfolio holdings may change depending on factors such as market and economic conditions. These opinions may not be relied upon as investment advice or an offer for a particular security. The information is not a complete analysis of every aspect of any market, country, industry, security or the Fund. Statements of fact are from sources considered reliable, but the investment manager makes no representation or warranty as to their completeness or accuracy. Although historical performance is no guarantee of future results, these insights may help you understand our investment management philosophy.
FRANKLIN FLEX CAP GROWTH VIP FUND
Class 2 Fund Expenses
As an investor in a variable insurance contract (Contract) that indirectly provides for investment in an underlying mutual fund, you can incur transaction and/or ongoing expenses at both the Fund level and the Contract level.
| • | | Transaction expenses can include sales charges (loads) on purchases, redemption fees, surrender fees, transfer fees and premium taxes. |
| • | | Ongoing expenses can include management fees, distribution and service (12b-1) fees, contract fees, annual maintenance fees, mortality and expense risk fees and other fees and expenses. All mutual funds and Contracts have some types of ongoing expenses. |
The expenses shown in the table are meant to highlight ongoing expenses at the Fund level only and do not include ongoing expenses at the Contract level, or transaction expenses at either the Fund or Contract level. While the Fund does not have transaction expenses, if the transaction and ongoing expenses at the Contract level were included, the expenses shown below would be higher. You should consult your Contract prospectus or disclosure document for more information.
The table shows Fund-level ongoing expenses and can help you understand these expenses and compare them with those of other mutual funds offered through the Contract. The table assumes a $1,000 investment held for the six months indicated. Please refer to the Fund prospectus for additional information on operating expenses.
Actual Fund Expenses
The first line (Actual) of the table provides actual account values and expenses. The “Ending Account Value” is derived from the Fund’s actual return, which includes the effect of ongoing Fund expenses, but does not include the effect of ongoing Contract expenses.
You can estimate the Fund-level expenses you incurred during the period by following these steps. Of course, your account value and expenses will differ from those in this illustration:
| 1. | Divide your account value by $1,000. |
If an account had an $8,600 value,
then $8,600 ÷ $1,000 = 8.6.
| 2. | Multiply the result by the number under the heading “Fund-Level Expenses Incurred During Period.” |
If Fund-Level Expenses Incurred During Period were $7.50, then 8.6 × $7.50 = $64.50.
In this illustration, the estimated expenses incurred this period at the Fund level are $64.50.
Hypothetical Example for Comparison
with Other Mutual Funds
Information in the second line (Hypothetical) of the table can help you compare ongoing expenses of the Fund with those of other mutual funds offered through the Contract. This information may not be used to estimate the actual ending account balance or expenses you incurred during the period. The hypothetical “Ending Account Value” is based on the Fund’s actual expense ratio and an assumed 5% annual rate of return before expenses, which does not represent the Fund’s actual return. The figure under the heading “Fund-Level Expenses Incurred During Period” shows the hypothetical expenses your account would have incurred under this scenario. You can compare this figure with the 5% hypothetical examples that appear in shareholder reports of other funds offered through a Contract.
| | | | | | | | | | | | |
| Class 2 | | Beginning Account Value 7/1/14 | | | Ending Account Value 12/31/14 | | | Fund-Level Expenses
Incurred During Period* 7/1/14–12/31/14 | |
Actual | | | $1,000 | | | | $1,014.00 | | | | $4.87 | |
Hypothetical (5% return before expenses) | | | $1,000 | | | | $1,020.37 | | | | $4.89 | |
*Expenses are calculated using the most recent six-month annualized expense ratio, net of expense waivers, for the Fund’s Class 2 shares (0.96%), which does not include any ongoing expenses of the Contract for which the Fund is an investment option, multiplied by the average account value over the period, multiplied by 184/365 to reflect the one-half year period.
SUPPLEMENT DATED SEPTEMBER 30, 2014
TOTHE PROSPECTUS DATED MAY 1, 2014
OF
FRANKLIN FLEX CAP GROWTH VIP FUND
(a series of Franklin Templeton Variable Insurance Products Trust)
The prospectus is amended as follows:
I. The “Fund Summary – Annual Fund Operating Expenses” table beginning on page FFC-S1 in the Fund’s Class 2 prospectus is replaced with the following:
Annual Fund Operating Expenses
(expenses that you pay each year as a percentage of the value of your investment)
| | | | |
| | | Class 2 | |
| Management fees1, 2 | | | 1.00% | |
| Distribution and service (12b-1) fees | | | 0.25% | |
| Other expenses1, 2 | | | 0.16% | |
| Total annual Fund operating expenses1 | | | 1.41% | |
| Fee waiver and/or expense reimbursement3 | | | -0.45% | |
| Total annual Fund operating expenses after fee waiver and/or expense reimbursement1, 3 | | | 0.96% | |
| 1. | Management fees and other expenses have been restated to reflect increased fees due to a decline in the assets of the Fund as a result of shareholder redemptions. |
| 2. | Management fees and other expenses have been restated to reflect current fiscal year fees and expenses as a result of the bundling of the Fund’s investment management agreement with its fund administration agreement effective May 1, 2013. Such combined investment management fees are described further under “Management” in the Fund’s prospectus. Total annual fund operating expenses are not affected by such bundling. |
| 3. | The investment manager has contractually agreed to waive or assume certain expenses so that common expenses (excluding Rule 12b-1 fees, acquired fund fees and expenses and certain non-routine expenses) do not exceed 0.71% until at least April 30, 2015. Contractual fee waiver and/or expense reimbursement agreements may not be terminated during the terms set forth above. Expenses included in the table above were restated to reflect the increased cap on operating expenses from 0.68% to 0.71% effective May 1, 2014. |
II. The “Fund Summary – Example” table beginning on page FFC-S1 in the Fund’s Class 2 prospectus is replaced with the following:
| | | | | | | | |
| | | 1 Year | | 3 Years | | 5 Years | | 10 Years |
| Class 2 | | $ 98 | | $ 402 | | $ 728 | | �� $ 1,652 |
III. The “Fund Summary – Annual Fund Operating Expenses” table beginning on page FFC-S1 in the Fund’s Class 4 prospectus is replaced with the following:
Annual Fund Operating Expenses
(expenses that you pay each year as a percentage of the value of your investment)
| | | | |
| | | Class 4 | |
| Management fees1, 2 | | | 1.00% | |
| Distribution and service (12b-1) fees | | | 0.35% | |
| Other expenses1, 2 | | | 0.16% | |
| Total annual Fund operating expenses1 | | | 1.51% | |
| Fee waiver and/or expense reimbursement3 | | | -0.45% | |
| Total annual Fund operating expenses after fee waiver and/or expense reimbursement1, 3 | | | 1.06% | |
| 1. | Management fees and other expenses have been restated to reflect increased fees due to a decline in the assets of the Fund as a result of shareholder redemptions. |
| 2. | Management fees and other expenses have been restated to reflect current fiscal year fees and expenses as a result of the bundling of the Fund’s investment management agreement with its fund administration agreement effective May 1, 2013. Such combined investment management fees are described further under “Management” in the Fund’s prospectus. Total annual fund operating expenses are not affected by such bundling. |
| 3. | The investment manager has contractually agreed to waive or assume certain expenses so that common expenses (excluding Rule 12b-1 fees, acquired fund fees and expenses and certain non-routine expenses) do not exceed 0.71% until at least April 30, 2015. Contractual fee waiver and/or expense reimbursement agreements may not be terminated during the terms set forth above. Expenses included in the table above were restated to reflect the increased cap on operating expenses from 0.68% to 0.71% effective May 1, 2014. |
IV. The “Fund Summary – Example” table beginning on page FFC-S1 in the Fund’s Class 4 prospectus is replaced with the following:
| | | | | | | | |
| | | 1 Year | | 3 Years | | 5 Years | | 10 Years |
| Class 4 | | $ 108 | | $ 433 | | $ 781 | | $ 1,763 |
Please keep this supplement with your prospectus for future reference.
FRANKLIN TEMPLETON VARIABLE INSURANCE PRODUCTS TRUST
Financial Highlights
Franklin Flex Cap Growth VIP Fund
| | | | | | | | | | | | | | | | | | | | |
| | | Year Ended December 31, | |
| | | 2014 | | | 2013 | | | 2012 | | | 2011 | | | 2010 | |
| Class 2 | | | | | | | | | | | | | | | | | | | | |
Per share operating performance
(for a share outstanding throughout the year) | | | | | | | | | | | | | | | | | | | | |
| | | | | |
Net asset value, beginning of year | | | $18.11 | | | | $13.21 | | | | $12.09 | | | | $12.70 | | | | $10.93 | |
| | | | |
| | | | | |
| Income from investment operationsa: | | | | | | | | | | | | | | | | | | | | |
| | | | | |
Net investment income (loss)b | | | (0.08 | ) | | | (0.01 | ) | | | 0.01 | | | | (0.02 | ) | | | (0.02 | ) |
| | | | | |
Net realized and unrealized gains (losses) | | | 1.09 | | | | 4.95 | | | | 1.11 | | | | (0.59 | ) | | | 1.79 | |
| | | | |
Total from investment operations | | | 1.01 | | | | 4.94 | | | | 1.12 | | | | (0.61 | ) | | | 1.77 | |
| | | | |
| | | | | |
| Less distributions from: | | | | | | | | | | | | | | | | | | | | |
| | | | | |
Net investment income | | | — | | | | (— | )c | | | — | | | | — | | | | — | |
| | | | | |
Net realized gains | | | (2.51 | ) | | | (0.04 | ) | | | — | | | | — | | | | — | |
| | | | |
Total distributions | | | (2.51 | ) | | | (0.04 | ) | | | — | | | | — | | | | — | |
| | | | |
Net asset value, end of year | | | $16.61 | | | | $18.11 | | | | $13.21 | | | | $12.09 | | | | $12.70 | |
| | | | |
| | | | | |
Total returnd | | | 6.11% | | | | 37.48% | | | | 9.26% | | | | (4.80)% | | | | 16.19% | |
| | | | | |
| Ratios to average net assets | | | | | | | | | | | | | | | | | | | | |
| | | | | |
Expenses before waiver and payments by affiliates | | | 1.20% | | | | 1.18% | | | | 1.18% | | | | 1.16% | | | | 1.18% | |
| | | | | |
Expenses net of waiver and payments by affiliates | | | 0.95% | | | | 0.93% | | | | 0.93% | | | | 0.93% | | | | 0.93% | |
| | | | | |
Net investment income (loss) | | | (0.46)% | | | | (0.09)% | | | | 0.09% | | | | (0.14)% | | | | (0.17)% | |
| | | | | |
| Supplemental data | | | | | | | | | | | | | | | | | | | | |
| | | | | |
Net assets, end of year (000’s) | | | $93,354 | | | | $169,123 | | | | $159,122 | | | | $188,527 | | | | $227,774 | |
| | | | | |
Portfolio turnover rate | | | 52.83% | | | | 52.15% | | | | 43.50% | | | | 63.99% | | | | 60.00% | |
aThe amount shown for a share outstanding throughout the period may not correlate with the Statement of Operations for the period due to the timing of sales and repurchases of the Fund shares in relation to income earned and/or fluctuating fair value of the investments of the Fund.
bBased on average daily shares outstanding.
cAmount rounds to less than $0.01 per share.
dTotal return does not include fees, charges or expenses imposed by the variable annuity and life insurance contracts for which the Franklin Templeton Variable Insurance Products Trust serves as an underlying investment vehicle.
| | | | |
| FFC-8 | | Annual Report | The accompanying notes are an integral part of these financial statements. | | |
FRANKLIN TEMPLETON VARIABLE INSURANCE PRODUCTS TRUST
FINANCIAL HIGHLIGHTS
Franklin Flex Cap Growth VIP Fund (continued)
| | | | | | | | | | | | | | | | | | | | |
| | | Year Ended December 31, | |
| | | 2014 | | | 2013 | | | 2012 | | | 2011 | | | 2010 | |
| Class 4 | | | | | | | | | | | | | | | | | | | | |
Per share operating performance
(for a share outstanding throughout the year) | | | | | | | | | | | | | | | | | | | | |
| | | | | |
Net asset value, beginning of year | | | $17.96 | | | | $13.12 | | | | $12.01 | | | | $12.63 | | | | $10.88 | |
| | | | |
| | | | | |
| Income from investment operationsa: | | | | | | | | | | | | | | | | | | | | |
| | | | | |
Net investment income (loss)b | | | (0.10 | ) | | | (0.03 | ) | | | (— | )c | | | (0.03 | ) | | | (0.03 | ) |
| | | | | |
Net realized and unrealized gains (losses) | | | 1.09 | | | | 4.91 | | | | 1.11 | | | | (0.59 | ) | | | 1.78 | |
| | | | |
Total from investment operations | | | 0.99 | | | | 4.88 | | | | 1.11 | | | | (0.62 | ) | | | 1.75 | |
| | | | |
| | | | | |
Less distributions from net realized gains | | | (2.51 | ) | | | (0.04 | ) | | | — | | | | — | | | | — | |
| | | | |
Net asset value, end of year | | | $16.44 | | | | $17.96 | | | | $13.12 | | | | $12.01 | | | | $12.63 | |
| | | | |
| | | | | |
Total returnd | | | 5.98% | | | | 37.28% | | | | 9.24% | | | | (4.91)% | | | | 16.08% | |
| | | | | |
| Ratios to average net assets | | | | | | | | | | | | | | | | | | | | |
| | | | | |
Expenses before waiver and payments by affiliates | | | 1.30% | | | | 1.28% | | | | 1.28% | | | | 1.26% | | | | 1.28% | |
| | | | | |
Expenses net of waiver and payments by affiliates | | | 1.05% | | | | 1.03% | | | | 1.03% | | | | 1.03% | | | | 1.03% | |
| | | | | |
Net investment income (loss) | | | (0.56)% | | | | (0.19)% | | | | (0.01)% | | | | (0.24)% | | | | (0.27)% | |
| | | | | |
| Supplemental data | | | | | | | | | | | | | | | | | | | | |
| | | | | |
Net assets, end of year (000’s) | | | $31,355 | | | | $251,339 | | | | $216,607 | | | | $270,598 | | | | $263,746 | |
| | | | | |
Portfolio turnover rate | | | 52.83% | | | | 52.15% | | | | 43.50% | | | | 63.99% | | | | 60.00% | |
aThe amount shown for a share outstanding throughout the period may not correlate with the Statement of Operations for the period due to the timing of sales and repurchases of the Fund shares in relation to income earned and/or fluctuating fair value of the investments of the Fund.
bBased on average daily shares outstanding.
cAmount rounds to less than $0.01 per share.
dTotal return does not include fees, charges or expenses imposed by the variable annuity and life insurance contracts for which Franklin Templeton Variable Insurance Products Trust serves as an underlying investment vehicle.
| | | | | | |
| | | The accompanying notes are an integral part of these financial statements. | Annual Report | | | FFC-9 | |
FRANKLIN TEMPLETON VARIABLE INSURANCE PRODUCTS TRUST
Statement of Investments, December 31, 2014
| | | | | | | | | | |
| Franklin Flex Cap Growth VIP Fund | |
| | | | | Shares | | | Value | |
| | Common Stocks 99.3% | | | | | | | | |
| | Automobiles & Components 1.3% | | | | | | | | |
| | BorgWarner Inc. | | | 20,000 | | | $ | 1,099,000 | |
| a | | Tesla Motors Inc. | | | 2,250 | | | | 500,422 | |
| | | | | | | | | | |
| | | | | | | | | 1,599,422 | |
| | | | | | | | | | |
| | Banks 2.3% | | | | | | | | |
| a | | Signature Bank | | | 9,500 | | | | 1,196,620 | |
| a | | SVB Financial Group | | | 10,250 | | | | 1,189,717 | |
| | Talmer Bancorp Inc., A | | | 35,000 | | | | 491,400 | |
| | | | | | | | | | |
| | | | | | | | | 2,877,737 | |
| | | | | | | | | | |
| | Capital Goods 7.1% | | | | | | | | |
| | AMETEK Inc. | | | 12,200 | | | | 642,086 | |
| | Cummins Inc. | | | 1,500 | | | | 216,255 | |
| a | | HD Supply Holdings Inc. | | | 40,000 | | | | 1,179,600 | |
| | Honeywell International Inc. | | | 9,500 | | | | 949,240 | |
| a | | The KEYW Holding Corp. | | | 21,323 | | | | 221,333 | |
| | Pall Corp. | | | 9,000 | | | | 910,890 | |
| | Precision Castparts Corp. | | | 10,500 | | | | 2,529,240 | |
| a | | Proto Labs Inc. | | | 9,000 | | | | 604,440 | |
| | Rockwell Automation Inc. | | | 5,750 | | | | 639,400 | |
| | Roper Industries Inc. | | | 6,250 | | | | 977,187 | |
| | | | | | | | | | |
| | | | | | | | | 8,869,671 | |
| | | | | | | | | | |
| | Commercial & Professional Services 1.8% | | | | | | | | |
| a | | IHS Inc., A | | | 13,500 | | | | 1,537,380 | |
| a | | Stericycle Inc. | | | 5,500 | | | | 720,940 | |
| | | | | | | | | | |
| | | | | | | | | 2,258,320 | |
| | | | | | | | | | |
| | Consumer Durables & Apparel 4.2% | | | | | | | | |
| | Harman International Industries Inc. | | | 5,590 | | | | 596,509 | |
| a | | Michael Kors Holdings Ltd. | | | 12,000 | | | | 901,200 | |
| | NIKE Inc., B | | | 16,500 | | | | 1,586,475 | |
| a | | TRI Pointe Homes Inc. | | | 67,500 | | | | 1,029,375 | |
| a | | Under Armour Inc., A | | | 17,000 | | | | 1,154,300 | |
| | | | | | | | | | |
| | | | | | | | | 5,267,859 | |
| | | | | | | | | | |
| | Consumer Services 1.8% | | | | | | | | |
| a | | Buffalo Wild Wings Inc. | | | 4,530 | | | | 817,122 | |
| a | | Chipotle Mexican Grill Inc. | | | 1,300 | | | | 889,863 | |
| a | | Chuy’s Holdings Inc. | | | 1,772 | | | | 34,855 | |
| a | | Noodles & Co. | | | 18,000 | | | | 474,300 | |
| | | | | | | | | | |
| | | | | | | | | 2,216,140 | |
| | | | | | | | | | |
| | Diversified Financials 2.4% | | | | | | | | |
| a | | Affiliated Managers Group Inc. | | | 4,250 | | | | 902,020 | |
| | Financial Engines Inc. | | | 11,000 | | | | 402,050 | |
| | Intercontinental Exchange Inc. | | | 2,800 | | | | 614,012 | |
| | T. Rowe Price Group Inc. | | | 12,100 | | | | 1,038,906 | |
| | | | | | | | | | |
| | | | | | | | | 2,956,988 | |
| | | | | | | | | | |
| | Energy 1.8% | | | | | | | | |
| a | | Diamondback Energy Inc. | | | 13,500 | | | | 807,030 | |
| a | | FMC Technologies Inc. | | | 9,000 | | | | 421,560 | |
| | Oceaneering International Inc. | | | 7,500 | | | | 441,075 | |
FRANKLIN TEMPLETON VARIABLE INSURANCE PRODUCTS TRUST
STATEMENT OF INVESTMENTS
Franklin Flex Cap Growth VIP Fund (continued)
| | | | | | | | | | |
| | | | | Shares | | | Value | |
| | Common Stocks (continued) | | | | | | | | |
| | Energy (continued) | | | | | | | | |
| a | | Rice Energy Inc. | | | 30,000 | | | $ | 629,100 | |
| | | | | | | | | | |
| | | | | | | | | 2,298,765 | |
| | | | | | | | | | |
| | Food & Staples Retailing 0.9% | | | | | | | | |
| a | | Sprouts Farmers Markets LLC | | | 7,620 | | | | 258,928 | |
| | Whole Foods Market Inc. | | | 16,500 | | | | 831,930 | |
| | | | | | | | | | |
| | | | | | | | | 1,090,858 | |
| | | | | | | | | | |
| | Food, Beverage & Tobacco 1.8% | | | | | | | | |
| a | | Boston Beer Inc., A | | | 2,410 | | | | 697,791 | |
| | Mead Johnson Nutrition Co., A | | | 7,000 | | | | 703,780 | |
| a | | Monster Beverage Corp. | | | 7,750 | | | | 839,713 | |
| | | | | | | | | | |
| | | | | | | | | 2,241,284 | |
| | | | | | | | | | |
| | Health Care Equipment & Services 4.3% | | | | | | | | |
| a | | Cerner Corp. | | | 15,120 | | | | 977,659 | |
| a | | DexCom Inc. | | | 15,000 | | | | 825,750 | |
| a | | Envision Healthcare Holdings Inc. | | | 40,000 | | | | 1,387,600 | |
| a | | Insulet Corp. | | | 16,000 | | | | 736,960 | |
| | McKesson Corp. | | | 6,810 | | | | 1,413,620 | |
| | | | | | | | | | |
| | | | | | | | | 5,341,589 | |
| | | | | | | | | | |
| | Materials 3.2% | | | | | | | | |
| | Cytec Industries Inc. | | | 20,000 | | | | 923,400 | |
| | Ecolab Inc. | | | 19,500 | | | | 2,038,140 | |
| | Praxair Inc. | | | 7,500 | | | | 971,700 | |
| | | | | | | | | | |
| | | | | | | | | 3,933,240 | |
| | | | | | | | | | |
| | Media 4.1% | | | | | | | | |
| a | | Charter Communications Inc., A | | | 7,500 | | | | 1,249,650 | |
| a | | IMAX Corp. (Canada) | | | 20,000 | | | | 618,000 | |
| | Twenty-First Century Fox Inc., B | | | 37,500 | | | | 1,383,375 | |
| | The Walt Disney Co. | | | 20,000 | | | | 1,883,800 | |
| | | | | | | | | | |
| | | | | | | | | 5,134,825 | |
| | | | | | | | | | |
| | Pharmaceuticals, Biotechnology & Life Sciences 13.9% | | | | | | | | |
| a | | Actavis PLC | | | 13,000 | | | | 3,346,330 | |
| a | | Alnylam Pharmaceuticals Inc. | | | 9,000 | | | | 873,000 | |
| a | | Biogen Idec Inc. | | | 5,500 | | | | 1,866,975 | |
| | Bristol-Myers Squibb Co. | | | 21,100 | | | | 1,245,533 | |
| a | | Celgene Corp. | | | 30,000 | | | | 3,355,800 | |
| a | | Celldex Therapeutics Inc. | | | 37,820 | | | | 690,215 | |
| a | | Illumina Inc. | | | 7,000 | | | | 1,292,060 | |
| a | | Jazz Pharmaceuticals PLC | | | 4,500 | | | | 736,785 | |
| a | | Karyopharm Therapeutics Inc. | | | 13,500 | | | | 505,305 | |
| | Perrigo Co. PLC | | | 8,590 | | | | 1,435,904 | |
| a | | Quintiles Transnational Holdings Inc. | | | 13,000 | | | | 765,310 | |
| a | | Regeneron Pharmaceuticals Inc. | | | 2,400 | | | | 984,600 | |
| a | | Revance Therapeutics Inc. | | | 15,000 | | | | 254,100 | |
| | | | | | | | | | |
| | | | | | | | | 17,351,917 | |
| | | | | | | | | | |
| | Real Estate 1.3% | | | | | | | | |
| | American Tower Corp. | | | 16,000 | | | | 1,581,600 | |
| | | | | | | | | | |
FRANKLIN TEMPLETON VARIABLE INSURANCE PRODUCTS TRUST
STATEMENT OF INVESTMENTS
Franklin Flex Cap Growth VIP Fund (continued)
| | | | | | | | | | |
| | | | | Shares | | | Value | |
| | Common Stocks (continued) | | | | | | | | |
| | Retailing 6.3% | | | | | | | | |
| | Advance Auto Parts Inc. | | | 4,500 | | | $ | 716,760 | |
| a | | Amazon.com Inc. | | | 6,600 | | | | 2,048,310 | |
| | Dick’s Sporting Goods Inc. | | | 9,250 | | | | 459,263 | |
| a | | LKQ Corp. | | | 45,000 | | | | 1,265,400 | |
| a | | Netflix Inc. | | | 1,550 | | | | 529,495 | |
| a | | The Priceline Group Inc. | | | 1,500 | | | | 1,710,315 | |
| | Tractor Supply Co. | | | 15,000 | | | | 1,182,300 | |
| | | | | | | | | | |
| | | | | | | | | 7,911,843 | |
| | | | | | | | | | |
| | Semiconductors & Semiconductor Equipment 5.5% | | | | | | | | |
| | Applied Materials Inc. | | | 47,000 | | | | 1,171,240 | |
| a | | Cavium Inc. | | | 23,360 | | | | 1,444,115 | |
| | Microchip Technology Inc. | | | 25,000 | | | | 1,127,750 | |
| a | | Nanometrics Inc. | | | 21,507 | | | | 361,748 | |
| a | | NXP Semiconductors NV (Netherlands) | | | 24,200 | | | | 1,848,880 | |
| | Xilinx Inc. | | | 20,420 | | | | 883,982 | |
| | | | | | | | | | |
| | | | | | | | | 6,837,715 | |
| | | | | | | | | | |
| | Software & Services 21.4% | | | | | | | | |
| a | | Alliance Data Systems Corp. | | | 2,750 | | | | 786,638 | |
| a | | ANSYS Inc. | | | 6,500 | | | | 533,000 | |
| a | | Bottomline Technologies Inc. | | | 9,800 | | | | 247,744 | |
| a | | BroadSoft Inc. | | | 18,000 | | | | 522,360 | |
| a | | Cognizant Technology Solutions Corp., A | | | 11,200 | | | | 589,792 | |
| a | | CoStar Group Inc. | | | 6,650 | | | | 1,221,139 | |
| a | | Demandware Inc. | | | 9,500 | | | | 546,630 | |
| a | | Electronic Arts Inc. | | | 37,000 | | | | 1,739,555 | |
| a | | Facebook Inc., A | | | 50,000 | | | | 3,901,000 | |
| a | | FleetCor Technologies Inc. | | | 12,000 | | | | 1,784,520 | |
| a | | Fortinet Inc. | | | 10,500 | | | | 321,930 | |
| a | | Guidewire Software Inc. | | | 7,500 | | | | 379,725 | |
| a | | HomeAway Inc. | | | 22,500 | | | | 670,050 | |
| a | | LinkedIn Corp., A | | | 10,000 | | | | 2,297,100 | |
| | MasterCard Inc., A | | | 40,000 | | | | 3,446,400 | |
| a | | Mobileye NV | | | 8,400 | | | | 340,704 | |
| a | | NetSuite Inc. | | | 9,300 | | | | 1,015,281 | |
| a | | Salesforce.com Inc. | | | 21,000 | | | | 1,245,510 | |
| a | | ServiceNow Inc. | | | 5,500 | | | | 373,175 | |
| a | | Splunk Inc. | | | 8,000 | | | | 471,600 | |
| a | | Twitter Inc. | | | 18,160 | | | | 651,399 | |
| | Visa Inc., A | | | 10,000 | | | | 2,622,000 | |
| a | | Workday Inc. | | | 4,530 | | | | 369,693 | |
| a | | Yelp Inc. | | | 12,000 | | | | 656,760 | |
| | | | | | | | | | |
| | | | | | | | | 26,733,705 | |
| | | | | | | | | | |
| | Technology Hardware & Equipment 9.2% | | | | | | | | |
| | Apple Inc. | | | 70,000 | | | | 7,726,600 | |
| a | | Palo Alto Networks Inc. | | | 9,500 | | | | 1,164,415 | |
| | QUALCOMM Inc. | | | 18,000 | | | | 1,337,940 | |
| | SanDisk Corp. | | | 6,500 | | | | 636,870 | |
| a | | Stratasys Ltd. | | | 7,000 | | | | 581,770 | |
| | | | | | | | | | |
| | | | | | | | | 11,447,595 | |
| | | | | | | | | | |
FRANKLIN TEMPLETON VARIABLE INSURANCE PRODUCTS TRUST
STATEMENT OF INVESTMENTS
Franklin Flex Cap Growth VIP Fund (continued)
| | | | | | | | | | |
| | | | | Shares | | | Value | |
| | Common Stocks (continued) | | | | | | | | |
| | Telecommunication Services 0.6% | | | | | | | | |
| a | | SBA Communications Corp. | | | 6,510 | | | $ | 721,048 | |
| | | | | | | | | | |
| | Transportation 4.1% | | | | | | | | |
| a | | Genesee & Wyoming Inc. | | | 11,000 | | | | 989,120 | |
| a | | Hub Group Inc., A | | | 25,000 | | | | 952,000 | |
| | Kansas City Southern | | | 5,500 | | | | 671,165 | |
| a | | Spirit Airlines Inc. | | | 18,500 | | | | 1,398,230 | |
| | Union Pacific Corp. | | | 9,500 | | | | 1,131,735 | |
| | | | | | | | | | |
| | | | | | | | | 5,142,250 | |
| | | | | | | | | | |
| | | |
| | Total Common Stocks (Cost $75,463,742) | | | | | | | 123,814,371 | |
| | | | | | | | | | |
| | Short Term Investments (Cost $3,647,947) 2.9% | | | | | | | | |
| | Money Market Funds 2.9% | | | | | | | | |
| a,b | | Institutional Fiduciary Trust Money Market Portfolio | | | 3,647,947 | | | | 3,647,947 | |
| | | | | | | | | | |
| | Total Investments (Cost $79,111,689) 102.2% | | | | | | | 127,462,318 | |
| | Other Assets, less Liabilities (2.2)% | | | | | | | (2,753,018 | ) |
| | | | | | | | | | |
| | Net Assets 100.0% | | | | | | $ | 124,709,300 | |
| | | | | | | | | | |
aNon-income producing.
bSee Note 3(e) regarding investments in Institutional Fiduciary Trust Money Market Portfolio.
| | | | | | |
| | | The accompanying notes are an integral part of these financial statements. | Annual Report | | | FFC-13 | |
FRANKLIN TEMPLETON VARIABLE INSURANCE PRODUCTS TRUST
Financial Statements
Statement of Assets and Liabilities
December 31, 2014
| | | | |
| | | Franklin Flex
Cap Growth
VIP Fund | |
Assets: | | | | |
Investments in securities: | | | | |
Cost - Unaffiliated issuers | | $ | 75,463,742 | |
Cost - Sweep Money Fund (Note 3e) | | | 3,647,947 | |
| | | | |
Total cost of investments | | $ | 79,111,689 | |
| | | | |
Value - Unaffiliated issuers | | $ | 123,814,371 | |
Value - Sweep Money Fund (Note 3e) | | | 3,647,947 | |
| | | | |
Total value of investments | | | 127,462,318 | |
Receivables: | | | | |
Investment securities sold | | | 80,529 | |
Capital shares sold | | | 8,344 | |
Dividends | | | 63,481 | |
Other assets | | | 37 | |
| | | | |
Total assets | | | 127,614,709 | |
| | | | |
Liabilities: | | | | |
Payables: | | | | |
Investment securities purchased | | | 2,584,039 | |
Capital shares redeemed | | | 133,608 | |
Management fees | | | 73,173 | |
Distribution fees | | | 58,295 | |
Accrued expenses and other liabilities | | | 56,294 | |
| | | | |
Total liabilities | | | 2,905,409 | |
| | | | |
Net assets, at value | | $ | 124,709,300 | |
| | | | |
Net assets consist of: | | | | |
Paid-in capital | | $ | 1,524,744 | |
Net unrealized appreciation (depreciation) | | | 48,350,629 | |
Accumulated net realized gain (loss) | | | 74,833,927 | |
| | | | |
Net assets, at value | | $ | 124,709,300 | |
| | | | |
| |
| Class 2: | | | | |
Net assets, at value | | $ | 93,353,938 | |
| | | | |
Shares outstanding | | | 5,620,893 | |
| | | | |
Net asset value and maximum offering price per share | | $ | 16.61 | |
| | | | |
| |
| Class 4: | | | | |
Net assets, at value | | $ | 31,355,362 | |
| | | | |
Shares outstanding | | | 1,907,838 | |
| | | | |
Net asset value and maximum offering price per share | | $ | 16.44 | |
| | | | |
| | | | |
| FFC-14 | | Annual Report | The accompanying notes are an integral part of these financial statements. | | |
FRANKLIN TEMPLETON VARIABLE INSURANCE PRODUCTS TRUST
FINANCIAL STATEMENTS
Statement of Operations
for the year ended December 31, 2014
| | | | |
| | | Franklin Flex
Cap Growth
VIP Fund | |
Investment income: | | | | |
Dividends | | $ | 1,500,901 | |
Income from securities loaned | | | 202,181 | |
| | | | |
Total investment income | | | 1,703,082 | |
| | | | |
Expenses: | | | | |
Management fees (Note 3a) | | | 3,172,516 | |
Distribution fees: (Note 3c) | | | | |
Class 2 | | | 376,264 | |
Class 4 | | | 689,689 | |
Custodian fees (Note 4) | | | 2,946 | |
Reports to shareholders | | | 62,803 | |
Professional fees | | | 51,487 | |
Trustees’ fees and expenses | | | 1,672 | |
Other | | | 9,579 | |
| | | | |
Total expenses | | | 4,366,956 | |
Expenses waived/paid by affiliates (Note 3e and 3f) | | | (867,831 | ) |
| | | | |
Net expenses | | | 3,499,125 | |
| | | | |
Net investment income (loss) | | | (1,796,043 | ) |
| | | | |
Realized and unrealized gains (losses): | | | | |
Net realized gain (loss) from investments | | | 136,983,635 | |
Net change in unrealized appreciation (depreciation) on investments | | | (121,113,931 | ) |
| | | | |
Net realized and unrealized gain (loss) | | | 15,869,704 | |
| | | | |
Net increase (decrease) in net assets resulting from operations | | $ | 14,073,661 | |
| | | | |
| | | | | | |
| | | The accompanying notes are an integral part of these financial statements. | Annual Report | | | FFC-15 | |
FRANKLIN TEMPLETON VARIABLE INSURANCE PRODUCTS TRUST
FINANCIAL STATEMENTS
Statements of Changes in Net Assets
| | | | | | | | |
| | | Franklin Flex Cap Growth VIP Fund | |
| | | Year Ended December 31, | |
| | | 2014 | | | 2013 | |
Increase (decrease) in net assets: | | | | | | | | |
Operations: | | | | | | | | |
Net investment income (loss) | | $ | (1,796,043 | ) | | $ | (590,415 | ) |
Net realized gain (loss) from investments | | | 136,983,635 | | | | 60,105,842 | |
Net change in unrealized appreciation (depreciation) on investments | | | (121,113,931 | ) | | | 67,788,666 | |
| | | | |
Net increase (decrease) in net assets resulting from operations | | | 14,073,661 | | | | 127,304,093 | |
| | | | |
Distributions to shareholders from: | | | | | | | | |
Net investment income: | | | | | | | | |
Class 2 | | | — | | | | (6,555 | ) |
Net realized gains: | | | | | | | | |
Class 2 | | | (23,244,460 | ) | | | (449,397 | ) |
Class 4 | | | (34,835,360 | ) | | | (654,813 | ) |
| | | | |
Total distributions to shareholders | | | (58,079,820 | ) | | | (1,110,765 | ) |
| | | | |
Capital share transactions: (Note 2) | | | | | | | | |
Class 2 | | | (59,517,033 | ) | | | (41,676,643 | ) |
Class 4 | | | (192,229,021 | ) | | | (39,784,837 | ) |
| | | | |
Total capital share transactions | | | (251,746,054 | ) | | | (81,461,480 | ) |
| | | | |
Net increase (decrease) in net assets | | | (295,752,213 | ) | | | 44,731,848 | |
Net assets (there is no undistributed net investment income at beginning or end of year): | | | | | | | | |
Beginning of year | | | 420,461,513 | | | | 375,729,665 | |
| | | | |
End of year | | $ | 124,709,300 | | | $ | 420,461,513 | |
| | | | |
| | | | |
| FFC-16 | | Annual Report | The accompanying notes are an integral part of these financial statements. | | |
FRANKLIN TEMPLETON VARIABLE INSURANCE PRODUCTS TRUST
Notes to Financial Statements
Franklin Flex Cap Growth VIP Fund
1. Organization and Significant Accounting Policies
Franklin Templeton Variable Insurance Products Trust (Trust) is registered under the Investment Company Act of 1940, as amended, (1940 Act) as an open-end management investment company, consisting of nineteen separate funds and applies the specialized accounting and reporting guidance in U.S. Generally Accepted Accounting Principles (U.S. GAAP). Franklin Flex Cap Growth VIP Fund (Fund) is included in this report. The financial statements of the remaining funds in the Trust are presented separately. Shares of the Fund are generally sold only to insurance company separate accounts to fund the benefits of variable life insurance policies or variable annuity contracts. At December 31, 2014, 40.33% of the Fund’s shares were held through one insurance company. Investment activities of these insurance company separate accounts could have a material impact on the Fund. The Fund offers two classes of shares: Class 2 and Class 4. Each class of shares differs by its distribution fees, voting rights on matters affecting a single class and its exchange privilege.
Effective May 1, 2014, Franklin Flex Cap Growth Securities Fund was renamed Franklin Flex Cap Growth VIP Fund.
The following summarizes the Fund’s significant accounting policies.
a. Financial Instrument Valuation
The Fund’s investments in financial instruments are carried at fair value daily. Fair value is the price that would be received to sell an asset or paid to transfer a liability in an orderly transaction between market participants on the measurement date. The Fund calculates the net asset value (NAV) per share at the close of the New York Stock Exchange (NYSE), generally at 4 p.m. Eastern time (NYSE close) on each day the NYSE is open for trading. Under compliance policies and procedures approved by the Trust’s Board of Trustees (the Board), the Fund’s administrator has responsibility for oversight of valuation, including leading the cross-functional Valuation and Liquidity Oversight Committee (VLOC). The VLOC provides administration and oversight of the Fund’s valuation policies and procedures, which are approved annually by the Board. Among other things, these procedures allow the Fund to utilize independent pricing services, quotations from securities and financial instrument dealers, and other market sources to determine fair value.
Equity securities listed on an exchange or on the NASDAQ National Market System are valued at the last quoted sale price
or the official closing price of the day, respectively. Foreign equity securities are valued as of the close of trading on the foreign stock exchange on which the security is primarily traded or as of the NYSE close, whichever is earlier. The value is then converted into its U.S. dollar equivalent at the foreign exchange rate in effect at the NYSE close on the day that the value of the security is determined. Over-the-counter securities are valued within the range of the most recent quoted bid and ask prices. Securities that trade in multiple markets or on multiple exchanges are valued according to the broadest and most representative market. Certain equity securities are valued based upon fundamental characteristics or relationships to similar securities. Investments in open-end mutual funds and non-registered money market funds are valued at the closing NAV.
The Fund has procedures to determine the fair value of financial instruments for which market prices are not reliable or readily available. Under these procedures, the VLOC convenes on a regular basis to review such financial instruments and considers a number of factors, including significant unobservable valuation inputs, when arriving at fair value. The VLOC primarily employs a market-based approach which may use related or comparable assets or liabilities, recent transactions, market multiples, book values, and other relevant information for the investment to determine the fair value of the investment. An income-based valuation approach may also be used in which the anticipated future cash flows of the investment are discounted to calculate fair value. Discounts may also be applied due to the nature or duration of any restrictions on the disposition of the investments. Due to the inherent uncertainty of valuations of such investments, the fair values may differ significantly from the values that would have been used had an active market existed. The VLOC employs various methods for calibrating these valuation approaches including a regular review of key inputs and assumptions, transactional back-testing or disposition analysis, and reviews of any related market activity.
b. Securities Lending
The Fund participates in an agency based securities lending program. The Fund receives cash collateral against the loaned securities in an amount equal to at least 102% of the fair value of the loaned securities. Collateral is maintained over the life of the loan in an amount not less than 100% of the fair value of loaned securities, as determined at the close of fund business each day; any additional collateral required due to changes in security values is delivered to the Fund on the next business
FRANKLIN TEMPLETON VARIABLE INSURANCE PRODUCTS TRUST
NOTES TO FINANCIAL STATEMENTS
Franklin Flex Cap Growth VIP Fund (continued)
1. Organization and Significant Accounting Policies (continued)
b. Securities Lending (continued)
day. The collateral is invested in a non-registered money fund. The Fund receives income from the investment of cash collateral, in addition to lending fees and rebates paid by the borrower. The Fund bears the market risk with respect to the collateral investment, securities loaned, and the risk that the agent may default on its obligations to the Fund. The securities lending agent has agreed to indemnify the Fund in the event of default by a third party borrower. At December 31, 2014, the Fund had no securities on loan.
c. Income and Deferred Taxes
It is the Fund’s policy to qualify as a regulated investment company under the Internal Revenue Code. The Fund intends to distribute to shareholders substantially all of its taxable income and net realized gains to relieve it from federal income and if applicable, excise taxes. As a result, no provision for U.S. federal income taxes is required.
The Fund may be subject to foreign taxation related to income received, capital gains on the sale of securities and certain foreign currency transactions in the foreign jurisdictions in which it invests. Foreign taxes, if any, are recorded based on the tax regulations and rates that exist in the foreign markets in which the Fund invests. When a capital gain tax is determined to apply the Fund records an estimated deferred tax liability in an amount that would be payable if the securities were disposed of on the valuation date.
The Fund recognizes the tax benefits of uncertain tax positions only when the position is “more likely than not” to be sustained upon examination by the tax authorities based on the technical merits of the tax position. As of December 31, 2014, and for all open tax years, the Fund has determined that no liability for unrecognized tax benefits is required in the Fund’s financial statements related to uncertain tax positions taken on a tax return (or expected to be taken on future tax returns). Open tax years are those that remain subject to examination and are based on each tax jurisdiction statute of limitation.
d. Security Transactions, Investment Income, Expenses and Distributions
Security transactions are accounted for on trade date. Realized gains and losses on security transactions are determined on a
specific identification basis. Estimated expenses are accrued daily. Dividend income is recorded on the ex-dividend date. Distributions to shareholders are recorded on the ex-dividend date and are determined according to income tax regulations (tax basis). Distributable earnings determined on a tax basis may differ from earnings recorded in accordance with U.S. GAAP. These differences may be permanent or temporary. Permanent differences are reclassified among capital accounts to reflect their tax character. These reclassifications have no impact on net assets or the results of operations. Temporary differences are not reclassified, as they may reverse in subsequent periods.
Common expenses incurred by the Trust are allocated among the funds based on the ratio of net assets of each fund to the combined net assets of the Trust. Fund specific expenses are charged directly to the fund that incurred the expense.
Realized and unrealized gains and losses and net investment income, not including class specific expenses, are allocated daily to each class of shares based upon the relative proportion of net assets of each class. Differences in per share distributions, by class, are generally due to differences in class specific expenses.
Distributions received by the Fund from certain securities may be a return of capital (ROC). Such distributions reduce the cost basis of the securities, and any distributions in excess of the cost basis are recognized as capital gains.
e. Accounting Estimates
The preparation of financial statements in accordance with U.S. GAAP requires management to make estimates and assumptions that affect the reported amounts of assets and liabilities at the date of the financial statements and the amounts of income and expenses during the reporting period. Actual results could differ from those estimates.
f. Guarantees and Indemnifications
Under the Trust’s organizational documents, its officers and trustees are indemnified by the Trust against certain liabilities arising out of the performance of their duties to the Trust. Additionally, in the normal course of business, the Trust, on behalf of the Fund, enters into contracts with service providers that contain general indemnification clauses. The Trust’s maximum exposure under these arrangements is unknown as this would involve future claims that may be made against the Trust that have not yet occurred. Currently, the Trust expects the risk of loss to be remote.
FRANKLIN TEMPLETON VARIABLE INSURANCE PRODUCTS TRUST
NOTES TO FINANCIAL STATEMENTS
Franklin Flex Cap Growth VIP Fund (continued)
2. Shares of Beneficial Interest
At December 31, 2014, there were an unlimited number of shares authorized (without par value). Transactions in the Fund’s shares were as follows:
| | | | | | | | | | | | | | | | | | |
| | | Year Ended December 31, | |
| | | 2014 | | | | | 2013 | |
| | | Shares | | | Amount | | | | | Shares | | | Amount | |
| | | | | |
| Class 2 Shares: | | | | | | | | | | | | | | | | | | |
Shares sold | | | 1,271,685 | | | $ | 22,546,625 | | | | | | 1,113,999 | | | $ | 16,865,422 | |
Shares issued in reinvestment of distributions | | | 1,454,597 | | | | 23,244,460 | | | | | | 30,996 | | | | 455,952 | |
Shares redeemed | | | (6,444,966 | ) | | | (105,308,118 | ) | | | | | (3,846,981 | ) | | | (58,998,017 | ) |
| | | | |
Net increase (decrease) | | | (3,718,684 | ) | | $ | (59,517,033 | ) | | | | | (2,701,986 | ) | | $ | (41,676,643 | ) |
| | | | |
| Class 4 Shares: | | | | | | | | | | | | | | | | | | |
Shares sold | | | 1,157,788 | | | $ | 20,021,648 | | | | | | 1,584,158 | | | $ | 24,181,871 | |
Shares issued on reinvestment of distributions | | | 2,201,982 | | | | 34,835,359 | | | | | | 44,850 | | | | 654,813 | |
Shares redeemed | | | (15,445,351 | ) | | | (247,086,028 | ) | | | | | (4,145,079 | ) | | | (64,621,521 | ) |
| | | | |
Net increase (decrease) | | | (12,085,581 | ) | | $ | (192,229,021 | ) | | | | | (2,516,071 | ) | | $ | (39,784,837 | ) |
| | | | |
3. Transactions With Affiliates
Franklin Resources, Inc. is the holding company for various subsidiaries that together are referred to as Franklin Templeton Investments. Certain officers and trustees of the Fund are also officers and/or directors of the following subsidiaries:
| | |
| Subsidiary | | Affiliation |
Franklin Advisers, Inc. (Advisers) | | Investment manager |
Franklin Templeton Services, LLC (FT Services) | | Administrative manager |
Franklin Templeton Distributors, Inc. (Distributors) | | Principal underwriter |
Franklin Templeton Investor Services, LLC (Investor Services) | | Transfer agent |
a. Management Fees
The Fund pays an investment management fee to Advisers based on the average daily net assets of the Fund as follows:
| | |
| Annualized Fee Rate | | Net Assets |
1.000% | | Up to and including $100 million |
0.900% | | Over $100 million, up to and including $250 million |
0.850% | | Over $250 million, up to and including $10 billion |
0.800% | | Over $10 billion, up to and including $12.5 billion |
0.775% | | Over $12.5 billion, up to and including $15 billion |
0.750% | | In excess of $15 billion |
b. Administrative Fees
Under an agreement with Advisers, FT Services provides administrative services to the Fund. The fee is paid by Advisers based on the Fund’s average daily net assets, and is not an additional expense of the Fund.
FRANKLIN TEMPLETON VARIABLE INSURANCE PRODUCTS TRUST
NOTES TO FINANCIAL STATEMENTS
Franklin Flex Cap Growth VIP Fund (continued)
3. Transactions With Affiliates (continued)
c. Distribution Fees
The Board has adopted distribution plans for Class 2 and Class 4 shares pursuant to Rule 12b-1 under the 1940 Act. Under the Fund’s compensation distribution plans, the Fund pays Distributors for costs incurred in connection with the servicing, sale and distribution of the Fund’s shares up to 0.35% per year of its average daily net assets of each class. Some distribution fees are not charged on shares held by affiliates. The Board has agreed to limit the current rate to 0.25% per year for Class 2. The plan year, for purposes of monitoring compliance with the maximum annual plan rates, is February 1 through January 31.
d. Transfer Agent Fees
Investor Services, under terms of an agreement, performs shareholder servicing for the Fund and is not paid by the Fund for the services.
e. Investments in Institutional Fiduciary Trust Money Market Portfolio
The Fund invests in Institutional Fiduciary Trust Money Market Portfolio (Sweep Money Fund), an affiliated open-end management investment company. Management fees paid by the Fund are waived on assets invested in the Sweep Money Fund, as noted on the Statement of Operations, in an amount not to exceed the management and administrative fees paid directly or indirectly by the Sweep Money Fund. Prior to January 1, 2014, the waiver was accounted for as a reduction to management fees.
f. Waiver and Expense Reimbursements
Advisers has contractually agreed in advance to waive or limit its fees and to assume as its own expense certain expenses otherwise payable by the Fund so that the expenses (excluding distribution fees, and acquired fund fees and expenses, for Class 2 and Class 4 of the Fund do not exceed 0.71% based on the average net assets of each class (other than certain non-routine expenses or costs, including those relating to litigation, indemnification, reorganizations, and liquidations) until April 30, 2015. Prior to May 1, 2014, expenses were limited to 0.68%.
4. Expense Offset Arrangement
The Fund has entered into an arrangement with its custodian whereby credits realized as a result of uninvested cash balances are used to reduce a portion of the Fund’s custodian expenses. During the year ended December 31, 2014, there were no credits earned.
5. Income Taxes
The tax character of distributions paid during the years ended December 31, 2014 and 2013, was as follows:
| | | | | | | | |
| | | 2014 | | | 2013 | |
Distributions paid from: | | | | | | | | |
Ordinary income | | $ | 5,771,146 | | | $ | 6,555 | |
Long term capital gain | | | 52,308,674 | | | | 1,104,210 | |
| | | | |
| | $ | 58,079,820 | | | $ | 1,110,765 | |
| | | | |
FRANKLIN TEMPLETON VARIABLE INSURANCE PRODUCTS TRUST
NOTES TO FINANCIAL STATEMENTS
Franklin Flex Cap Growth VIP Fund (continued)
At December 31, 2014, the cost of investments, net unrealized appreciation (depreciation), undistributed ordinary income and undistributed long term capital gains for income tax purposes were as follows:
| | | | |
Cost of investments | | $ | 79,791,127 | |
| | | | |
Unrealized appreciation | | $ | 48,152,786 | |
Unrealized depreciation | | | (481,595 | ) |
| | | | |
Net unrealized appreciation (depreciation) | | $ | 47,671,191 | |
| | | | |
Undistributed ordinary income | | $ | 1,430,846 | |
Undistributed long term capital gains | | | 74,082,521 | |
| | | | |
Distributable earnings | | $ | 75,513,367 | |
| | | | |
Differences between income and/or capital gains as determined on a book basis and a tax basis are primarily due to differing treatments of wash sales.
The Fund utilized a tax accounting practice to treat a portion of the proceeds from capital shares redeemed as a distribution from realized capital gains.
6. Investment Transactions
Purchases and sales of investments (excluding short term securities) for the year ended December 31, 2014, aggregated $173,311,920 and $487,707,849, respectively.
7. Credit Facility
The Fund, together with other U.S. registered and foreign investment funds (collectively, Borrowers), managed by Franklin Templeton Investments, are borrowers in a joint syndicated senior unsecured credit facility totaling $1.5 billion (Global Credit Facility) which matured on February 13, 2015. This Global Credit Facility provides a source of funds to the Borrowers for temporary and emergency purposes, including the ability to meet future unanticipated or unusually large redemption requests. The Borrowers expect to renew the Global Credit Facility for a total of $2 billion effective February 13, 2015, which matures on February 12, 2016.
Under the terms of the Global Credit Facility, the Fund shall, in addition to interest charged on any borrowings made by the Fund and other costs incurred by the Fund, pay its share of fees and expenses incurred in connection with the implementation and maintenance of the Global Credit Facility, based upon its relative share of the aggregate net assets of all of the Borrowers, including an annual commitment fee of 0.07% based upon the unused portion of the Global Credit Facility. These fees are reflected in other expenses on the Statement of Operations. During the year ended December 31, 2014, the Fund did not use the Global Credit Facility.
8. Fair Value Measurements
The Fund follows a fair value hierarchy that distinguishes between market data obtained from independent sources (observable inputs) and the Fund’s own market assumptions (unobservable inputs). These inputs are used in determining the value of the Fund’s financial instruments and are summarized in the following fair value hierarchy:
| | • | | Level 1 – quoted prices in active markets for identical financial instruments |
| | • | | Level 2 – other significant observable inputs (including quoted prices for similar financial instruments, interest rates, prepayment speed, credit risk, etc.) |
| | • | | Level 3 – significant unobservable inputs (including the Fund’s own assumptions in determining the fair value of financial instruments) |
FRANKLIN TEMPLETON VARIABLE INSURANCE PRODUCTS TRUST
NOTES TO FINANCIAL STATEMENTS
Franklin Flex Cap Growth VIP Fund (continued)
8. Fair Value Measurements (continued)
The input levels are not necessarily an indication of the risk or liquidity associated with financial instruments at that level.
For movements between the levels within the fair value hierarchy, the Fund has adopted a policy of recognizing the transfers as of the date of the underlying event which caused the movement.
At December 31, 2014, all of the Fund’s investments in financial instruments carried at fair value were valued using Level 1 inputs. For detailed categories, see the accompanying Statement of Investments.
9. New Accounting Pronouncements
In June 2014, the Financial Accounting Standards Board issued Accounting Standards Update (ASU) No. 2014-11, Transfers and Servicing (Topic 860), Repurchase-to-Maturity Transactions, Repurchase Financings, and Disclosures. The ASU changes the accounting for certain repurchase agreements and expands disclosure requirements related to repurchase agreements, securities lending, repurchase-to-maturity and similar transactions. The ASU is effective for interim and annual reporting periods beginning after December 15, 2014. Management has reviewed the requirements and believes the adoption of this ASU will not have a material impact on the financial statements.
10. Subsequent Events
The Fund has evaluated subsequent events through the issuance of the financial statements and determined that no events have occurred that require disclosure other than those already disclosed in the financial statements.
FRANKLIN TEMPLETON VARIABLE INSURANCE PRODUCTS TRUST
Report of Independent Registered Public Accounting Firm
Franklin Flex Cap Growth VIP Fund
To the Board of Trustees and Shareholders of Franklin Templeton Variable Insurance Products Trust
In our opinion, the accompanying statement of assets and liabilities, including the statement of investments, and the related statements of operations and of changes in net assets and the financial highlights present fairly, in all material respects, the financial position of Franklin Flex Cap Growth VIP Fund (the “Fund”) at December 31, 2014, the results of its operations for the year then ended, the changes in its net assets for each of the two years in the period then ended and the financial highlights for each of the five years in the period then ended, in conformity with accounting principles generally accepted in the United States of America. These financial statements and financial highlights (hereafter referred to as “financial statements”) are the responsibility of the Fund’s management. Our responsibility is to express an opinion on these financial statements based on our audits. We conducted our audits of these financial statements in accordance with the standards of the Public Company Accounting Oversight Board (United States). Those standards require that we plan and perform the audit to obtain reasonable assurance about whether the financial statements are free of material misstatement. An audit includes examining, on a test basis, evidence supporting the amounts and disclosures in the financial statements, assessing the accounting principles used and significant estimates made by management, and evaluating the overall financial statement presentation. We believe that our audits, which included confirmation of securities at December 31, 2014 by correspondence with the custodian and brokers, provides a reasonable basis for our opinion.
PricewaterhouseCoopers LLP
San Francisco, California
February 13, 2015
FRANKLIN TEMPLETON VARIABLE INSURANCE PRODUCTS TRUST
Tax Information (unaudited)
Franklin Flex Cap Growth VIP Fund
Under Section 852(b)(3)(C) of the Internal Revenue Code (Code), the Fund hereby reports the maximum amount allowable but no less than $111,791,004 as a long term capital gain dividend for the fiscal year ended December 31, 2014.
Under Section 854(b)(1)(A) of the Code, the Fund hereby reports 22.76% of the ordinary income dividends as income qualifying for the dividends received deduction for the fiscal year ended December 31, 2014.
Franklin Founding Funds Allocation VIP Fund
(Formerly, Franklin Templeton VIP Founding Funds Allocation Fund)
This annual report for Franklin Founding Funds Allocation VIP Fund covers the fiscal year ended December 31, 2014.
Class 2 Performance Summary as of December 31, 2014
Average annual total return of Class 2 shares* represents the average annual change in value, assuming reinvestment of dividends and capital gains. Average returns smooth out variations in returns, which can be significant; they are not the same as year-by-year results.
| | | | | | | | | | | | |
| Periods ended 12/31/14 | | 1-Year | | | 5-Year | | | Inception (7/2/07) | |
Average Annual Total Return | | | +2.85% | | | | +9.77% | | | | +2.90% | |
*The Fund has an expense reduction contractually guaranteed through at least 4/30/15. Fund investment results reflect the expense reduction, to the extent applicable; without this reduction, the results would have been lower.
Performance reflects the Fund’s Class 2 operating expenses, but does not include any contract fees, expenses or sales charges. If they had been included, performance would be lower. These charges and deductions, particularly for variable life policies, can have a significant effect on contract values and insurance benefits. See the contract prospectus for a complete description of these expenses, including sales charges.
Performance data represent past performance, which does not guarantee future results. Investment return and principal value will fluctuate, and you may have a gain or loss when you sell your shares. Current performance may differ from figures shown.
Total Return Index Comparison for a Hypothetical $10,000 Investment (7/2/07–12/31/14)
The graph below shows the change in value of a hypothetical $10,000 investment in the Fund over the indicated period and includes reinvestment of any income or distributions. The Fund’s performance* is compared to the performance of the Standard & Poor’s® 500 Index (S&P 500®) and the MSCI World Index. One cannot invest directly in an index, and an index is not representative of the Fund’s portfolio. Please see Important Notes to Performance Information preceding the Fund Summaries.
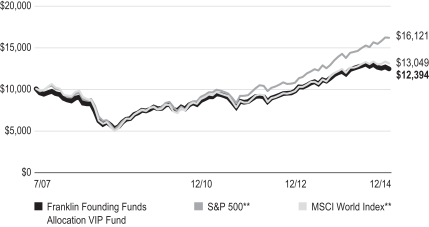
**Source: Morningstar. Please see Index Descriptions following the Fund Summaries.
FRANKLIN FOUNDING FUNDS ALLOCATION VIP FUND
Fund Goals and Main Investments
Franklin Founding Funds Allocation VIP Fund seeks capital appreciation, with income as a secondary goal. Under normal market conditions, the Fund invests equal portions in Class 1 shares of Franklin Income VIP Fund, Franklin Mutual Shares VIP Fund and Templeton Growth VIP Fund.
Fund Risks
All investments involve risks, including possible loss of principal. Because the Fund invests in underlying funds that may engage in a variety of investment strategies involving certain risks, the Fund may be subject to these same risks. Stock prices fluctuate, sometimes rapidly and dramatically, due to factors affecting individual companies, particular industries or sectors, or general market conditions. Bonds are affected by changes in interest rates and the creditworthiness of their issuers. Bond prices generally move in the opposite direction of interest rates. Thus, as prices of bonds adjust to a rise in interest rates, the Fund’s share price may decline. Higher yielding, lower rated corporate bonds entail a greater degree of credit risk compared to investment-grade securities. Foreign investing carries additional risks such as currency and market volatility and political or social instability, risks that are heightened in developing countries. Value securities may not increase in price as anticipated or may decline further in value. The Fund’s prospectus also includes a description of the main investment risks.
Performance Overview
You can find the Fund’s one-year total return in the Performance Summary. In comparison, the S&P 500 generated a +13.69% total return and the MSCI World Index produced a +5.50% total return for the same period.1
Economic and Market Overview
The global economy grew moderately during 2014 as U.S. economic growth expanded while growth rates in much of the rest of the world declined. U.S. economic activity was supported in some quarters by increased consumer spending, business investment and federal defense spending. The housing market strengthened, and lower gasoline prices and improved job growth contributed to rising retail sales. The U.S. Federal Reserve Board (Fed) began reducing its large-scale bond purchases $10 billion a month in January and ended the buying program in October. But it continued its practice of maintaining
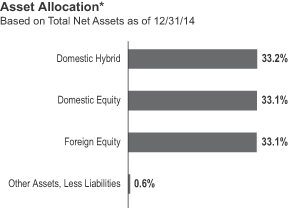
*The asset allocation is based on the Statement of Investments (SOI), which classifies each underlying fund into a broad asset class.
The dollar value, number of shares or principal amount, and names of all portfolio holdings are listed in the Fund’s SOI.
holdings of longer term securities at sizable levels. Toward period-end, the Fed stated that it could be patient with regard to raising interest rates and that the interest rate might not rise for at least a couple of meetings, possibly implying at least the first two meetings of 2015.
Outside the U.S., the U.K. economy grew relatively well, supported by the services and manufacturing sectors. In the eurozone, economic growth remained subdued, as concerns persisted about the potential negative impacts to growth from the crisis in Ukraine and China’s moderating growth rate. In June, the European Central Bank (ECB) reduced its main interest rate and, for the first time, set a negative deposit rate; the ECB reduced both rates again in September. The ECB broadened its monetary easing stance by implementing an asset purchase program to prevent deflation and stimulate the economy. Japan’s second- and third-quarter economic contractions indicated the economy was in a recession, although private consumption and exports improved in the third quarter. In October, the Bank of Japan expanded its stimulus measures amid weak domestic demand and as substantially lower crude oil prices exerted further downward pressure on inflation. Near period-end, Japan’s ruling coalition was reelected in early parliamentary elections and subsequently announced a fresh stimulus package aimed at reviving economic growth.
Global developed market stocks, as measured by the MSCI World Index, advanced overall during the 12-month period amid a generally accommodative monetary policy environment
1. Source: Morningstar.
One cannot invest directly in an index, and an index is not representative of the Fund’s portfolio. Please see Index Descriptions following the Fund Summaries.
FRANKLIN FOUNDING FUNDS ALLOCATION VIP FUND
and continued strength in corporate earnings. In several emerging markets, economic growth generally moderated. Emerging market stocks overall, as measured by the MSCI Emerging Markets Index, fell for the year, amid headwinds such as soft domestic demand, weak exports, plummeting crude oil prices, regional geopolitical tensions and concerns about possible U.S. interest rate increases. Many emerging market currencies depreciated against the U.S. dollar, leading several central banks to raise interest rates seeking to support their currencies. Several other central banks lowered interest rates to promote economic growth. Gold prices ended the year lower amid benign global inflation and a strong U.S. dollar.
Investment Strategy
The Fund normally invests its assets in an equally weighted combination of Class 1 shares of Franklin Income VIP Fund, Franklin Mutual Shares VIP Fund and Templeton Growth VIP Fund. These underlying funds, in turn, invest in a variety of U.S. and foreign equity securities and, to a lesser extent, fixed income and money market securities. As market conditions affect the underlying funds, we rebalance the Fund’s allocations seeking to maintain equal weightings of approximately 33 1⁄3% of total net assets in each underlying fund whenever the actual allocations exceed plus or minus 3% of the fixed allocation percentages.
Manager’s Discussion
The Fund’s performance can be attributed largely to its allocation among the underlying funds and their investments in domestic and foreign equities, fixed income securities, and short-term investments and other net assets.
During the year under review, Franklin Mutual Shares VIP Fund – Class 1 and Franklin Income VIP Fund – Class 1 underperformed the S&P 500. Templeton Growth VIP Fund – Class 1 underperformed the MSCI World Index.
Thank you for your participation in Franklin Founding Funds Allocation VIP Fund. We look forward to serving your future investment needs.
The foregoing information reflects our analysis, opinions and portfolio holdings as of December 31, 2014, the end of the reporting period. The way we implement our main investment strategies and the resulting portfolio holdings may change depending on factors such as market and economic conditions. These opinions may not be relied upon as investment advice or an offer for a particular security. The information is not a complete analysis of every aspect of any market, country, industry, security or the Fund. Statements of fact are from sources considered reliable, but the investment manager makes no representation or warranty as to their completeness or accuracy. Although historical performance is no guarantee of future results, these insights may help you understand our investment management philosophy.
FRANKLIN FOUNDING FUNDS ALLOCATION VIP FUND
Class 2 Fund Expenses
As an investor in a variable insurance contract (Contract) that indirectly provides for investment in an underlying mutual fund, you can incur transaction and/or ongoing expenses at both the Fund level and the Contract level.
| • | | Transaction expenses can include sales charges (loads) on purchases, redemption fees, surrender fees, transfer fees and premium taxes. |
| • | | Ongoing expenses can include management fees, distribution and service (12b-1) fees, contract fees, annual maintenance fees, mortality and expense risk fees and other fees and expenses. All mutual funds and Contracts have some types of ongoing expenses. |
The expenses shown in the table are meant to highlight ongoing expenses at the Fund level only and do not include ongoing expenses at the Contract level, or transaction expenses at either the Fund or Contract level. While the Fund does not have transaction expenses, if the transaction and ongoing expenses at the Contract level were included, the expenses shown below would be higher. You should consult your Contract prospectus or disclosure document for more information.
The table shows Fund-level ongoing expenses and can help you understand these expenses and compare them with those of other mutual funds offered through the Contract. The table assumes a $1,000 investment held for the six months indicated. Please refer to the Fund prospectus for additional information on operating expenses.
Actual Fund Expenses
The first line (Actual) of the table provides actual account values and expenses. The “Ending Account Value” is derived from the Fund’s actual return, which includes the effect of ongoing Fund expenses, but does not include the effect of ongoing Contract expenses.
You can estimate the Fund-level expenses you incurred during the period by following these steps. Of course, your account value and expenses will differ from those in this illustration:
| 1. | Divide your account value by $1,000. |
If an account had an $8,600 value, then $8,600 ÷ $1,000 = 8.6.
| 2. | Multiply the result by the number under the heading “Fund-Level Expenses Incurred During Period.” |
If Fund-Level Expenses Incurred During Period were $7.50, then 8.6 × $7.50 = $64.50.
In this illustration, the estimated expenses incurred this period at the Fund level are $64.50.
Hypothetical Example for Comparison with Other Mutual Funds
Information in the second line (Hypothetical) of the table can help you compare ongoing expenses of the Fund with those of other mutual funds offered through the Contract. This information may not be used to estimate the actual ending account balance or expenses you incurred during the period. The hypothetical “Ending Account Value” is based on the Fund’s actual expense ratio and an assumed 5% annual rate of return before expenses, which does not represent the Fund’s actual return. The figure under the heading “Fund-Level Expenses Incurred During Period” shows the hypothetical expenses your account would have incurred under this scenario. You can compare this figure with the 5% hypothetical examples that appear in shareholder reports of other funds offered through a Contract.
| | | | | | | | | | | | | | | | |
| Class 2 | | Beginning Account
Value 7/1/14 | | | Ending Account
Value 12/31/14 | | | Expenses Paid
During Period* 7/1/14–12/31/14 | | | Expenses Paid
During Period** 7/1/14–12/31/14 | |
Actual | | | $1,000 | | | | $ 956.20 | | | | $1.73 | | | | $4.98 | |
Hypothetical (5% return before expenses) | | | $1,000 | | | | $1,023.44 | | | | $1.79 | | | | $5.14 | |
*Expenses are calculated using the most recent six-month annualized expense ratio excluding expenses of the underlying funds, net of expense waivers, for the Fund’s Class 2 shares (0.35%), which does not include any ongoing expenses of the Contract for which the Fund is an investment option, multiplied by the average account value over the period, multiplied by 184/365 to reflect the one-half year period.
**Expenses are calculated using the most recent six-month annualized expense ratio including expenses of the underlying funds, net of expense waivers, for the Fund’s Class 2 shares (1.01%), which does not include any ongoing expenses of the Contract for which the Fund is an investment option, multiplied by the average account value over the period, multiplied by 184/365 to reflect the one-half year period.
FRANKLIN TEMPLETON VARIABLE INSURANCE PRODUCTS TRUST
Financial Highlights
Franklin Founding Funds Allocation VIP Fund
| | | | | | | | | | | | | | | | | | | | |
| | | Year Ended December 31, | |
| | | 2014 | | | 2013 | | | 2012 | | | 2011 | | | 2010 | |
| Class 1 | | | | | | | | | | | | | | | | | | | | |
Per share operating performance (for a share outstanding throughout the year) | | | | | | | | | | | | | | | | | | | | |
| | | | | |
Net asset value, beginning of year | | | $7.47 | | | | $8.55 | | | | $7.63 | | | | $7.73 | | | | $7.15 | |
| | | | |
| | | | | |
| Income from investment operationsa: | | | | | | | | | | | | | | | | | | | | |
| | | | | |
Net investment incomeb,c | | | 0.22 | | | | 0.30 | | | | 0.26 | | | | 0.25 | | | | 0.24 | |
| | | | | |
Net realized and unrealized gains (losses) | | | 0.02 | | | | 1.42 | | | | 0.90 | | | | (0.35 | ) | | | 0.52 | |
| | | | |
Total from investment operations | | | 0.24 | | | | 1.72 | | | | 1.16 | | | | (0.10 | ) | | | 0.76 | |
| | | | |
| | | | | |
| Less distributions from: | | | | | | | | | | | | | | | | | | | | |
| | | | | |
Net investment income | | | (0.23 | ) | | | (1.15 | ) | | | (0.24 | ) | | | (— | )d | | | (0.18 | ) |
| | | | | |
Net realized gains | | | (0.01 | ) | | | (1.65 | ) | | | — | | | | — | | | | (— | )d |
| | | | |
Total distributions | | | (0.24 | ) | | | (2.80 | ) | | | (0.24 | ) | | | (— | )d | | | (0.18 | ) |
| | | | |
Net asset value, end of year | | | $7.47 | | | | $7.47 | | | | $8.55 | | | | $7.63 | | | | $7.73 | |
| | | | |
| | | | | |
Total returne | | | 3.05% | | | | 24.14% | | | | 15.56% | | | | (1.28)% | | | | 10.64% | |
| | | | | |
| Ratios to average net assets | | | | | | | | | | | | | | | | | | | | |
| | | | | |
Expenses before waiver and payments by affiliatesf | | | 0.11% | | | | 0.11% | | | | 0.11% | | | | 0.11% | | | | 0.11% | |
| | | | | |
Expenses net of waiver and payments by affiliatesf | | | 0.10% | | | | 0.10% | | | | 0.10% | | | | 0.10% | | | | 0.10% | |
| | | | | |
Net investment incomec | | | 2.88% | | | | 3.67% | | | | 4.06% | | | | 3.44% | | | | 3.04% | |
| | | | | |
| Supplemental data | | | | | | | | | | | | | | | | | | | | |
| | | | | |
Net assets, end of year (000’s) | | | $1,114 | | | | $952 | | | | $767 | | | | $470 | | | | $437 | |
| | | | | |
Portfolio turnover rate | | | 4.80% | | | | 3.91% | | | | 28.46% | g | | | 58.42% | | | | 17.81% | |
aThe amount shown for a share outstanding throughout the period may not correlate with the Statement of Operations for the period due to the timing of sales and repurchases of the Fund shares in relation to income earned and/or fluctuating fair value of the investments of the Fund.
bBased on average daily shares outstanding.
cRecognition of net investment income by the Fund is affected by the timing of declaration of dividends by the Underlying Funds in which the Fund invests.
dAmount rounds to less than $0.01 per share.
eTotal return does not include fees, charges or expenses imposed by the variable annuity and life insurance contracts for which the Franklin Templeton Variable Insurance Products Trust serves as an underlying investment vehicle.
fDoes not include expenses of the Underlying Funds in which the Fund invests. The weighted average indirect expenses of the Underlying Funds was 0.66% for the year ended December 31, 2014.
gExcludes the value of portfolio securities delivered as a result of a redemption in-kind.
| | | | | | |
| | | The accompanying notes are an integral part of these financial statements. | Annual Report | | | FFA-5 | |
FRANKLIN TEMPLETON VARIABLE INSURANCE PRODUCTS TRUST
FINANCIAL HIGHLIGHTS
Franklin Founding Funds Allocation VIP Fund (continued)
| | | | | | | | | | | | | | | | | | | | |
| | | Year Ended December 31, | |
| | | 2014 | | | 2013 | | | 2012 | | | 2011 | | | 2010 | |
| Class 2 | | | | | | | | | | | | | | | | | | | | |
Per share operating performance (for a share outstanding throughout the year) | | | | | | | | | | | | | | | | | | | | |
| | | | | |
Net asset value, beginning of year | | | $7.42 | | | | $8.51 | | | | $7.59 | | | | $7.71 | | | | $7.14 | |
| | | | |
| | | | | |
| Income from investment operationsa: | | | | | | | | | | | | | | | | | | | | |
| | | | | |
Net investment incomeb,c | | | 0.20 | | | | 0.27 | | | | 0.25 | | | | 0.23 | | | | 0.21 | |
| | | | | |
Net realized and unrealized gains (losses) | | | 0.02 | | | | 1.42 | | | | 0.89 | | | | (0.35 | ) | | | 0.52 | |
| | | | |
Total from investment operations | | | 0.22 | | | | 1.69 | | | | 1.14 | | | | (0.12 | ) | | | 0.73 | |
| | | | |
| | | | | |
| Less distributions from: | | | | | | | | | | | | | | | | | | | | |
| | | | | |
Net investment income | | | (0.21 | ) | | | (1.13 | ) | | | (0.22 | ) | | | (— | )d | | | (0.16 | ) |
| | | | | |
Net realized gains | | | (0.01 | ) | | | (1.65 | ) | | | — | | | | — | | | | (— | )d |
| | | | |
Total distributions | | | (0.22 | ) | | | (2.78 | ) | | | (0.22 | ) | | | (— | )d | | | (0.16 | ) |
| | | | |
Net asset value, end of year | | | $7.42 | | | | $7.42 | | | | $8.51 | | | | $7.59 | | | | $7.71 | |
| | | | |
| | | | | |
Total returne | | | 2.85% | | | | 23.77% | | | | 15.33% | | | | (1.54)% | | | | 10.25% | |
| | | | | |
| Ratios to average net assets | | | | | | | | | | | | | | | | | | | | |
| | | | | |
Expenses before waiver and payments by affiliatesf | | | 0.36% | | | | 0.36% | | | | 0.36% | | | | 0.36% | | | | 0.36% | |
| | | | | |
Expenses net of waiver and payments by affiliatesf | | | 0.35% | | | | 0.35% | | | | 0.35% | | | | 0.35% | | | | 0.35% | |
| | | | | |
Net investment incomec | | | 2.63% | | | | 3.42% | | | | 3.81% | | | | 3.19% | | | | 2.79% | |
| | | | | |
| Supplemental data | | | | | | | | | | | | | | | | | | | | |
| | | | | |
Net assets, end of year (000’s) | | | $557,704 | | | | $547,506 | | | | $472,686 | | | | $448,101 | | | | $488,057 | |
| | | | | |
Portfolio turnover rate | | | 4.80% | | | | 3.91% | | | | 28.46% | g | | | 58.42% | | | | 17.81% | |
aThe amount shown for a share outstanding throughout the period may not correlate with the Statement of Operations for the period due to the timing of sales and repurchases of the Fund shares in relation to income earned and/or fluctuating fair value of the investments of the Fund.
bBased on average daily shares outstanding.
cRecognition of net investment income by the Fund is affected by the timing of declaration of dividends by the Underlying Funds in which the Fund invests.
dAmount rounds to less than $0.01 per share.
eTotal return does not include fees, charges or expenses imposed by the variable annuity and life insurance contracts for which the Franklin Templeton Variable Insurance Products Trust serves as an underlying investment vehicle.
fDoes not include expenses of the Underlying Funds in which the Fund invests. The weighted average indirect expenses of the Underlying Funds was 0.66% for the year ended December 31, 2014.
gExcludes the value of portfolio securities delivered as a result of a redemption in-kind.
| | | | |
| FFA-6 | | Annual Report | The accompanying notes are an integral part of these financial statements. | | |
FRANKLIN TEMPLETON VARIABLE INSURANCE PRODUCTS TRUST
FINANCIAL HIGHLIGHTS
Franklin Founding Funds Allocation VIP Fund (continued)
| | | | | | | | | | | | | | | | | | | | |
| | | Year Ended December 31, | |
| | | 2014 | | | 2013 | | | 2012 | | | 2011 | | | 2010 | |
| Class 4 | | | | | | | | | | | | | | | | | | | | |
Per share operating performance (for a share outstanding throughout the year) | | | | | | | | | | | | | | | | | | | | |
| | | | | |
Net asset value, beginning of year | | | $7.54 | | | | $8.49 | | | | $7.58 | | | | $7.71 | | | | $7.14 | |
| | | | |
| | | | | |
| Income from investment operationsa: | | | | | | | | | | | | | | | | | | | | |
| | | | | |
Net investment incomeb,c | | | 0.20 | | | | 0.26 | | | | 0.30 | | | | 0.24 | | | | 0.19 | |
| | | | | |
Net realized and unrealized gains (losses) | | | 0.02 | | | | 1.43 | | | | 0.83 | | | | (0.37 | ) | | | 0.54 | |
| | | | |
Total from investment operations | | | 0.22 | | | | 1.69 | | | | 1.13 | | | | (0.13 | ) | | | 0.73 | |
| | | | |
| | | | | |
| Less distributions from: | | | | | | | | | | | | | | | | | | | | |
| | | | | |
Net investment income | | | (0.21 | ) | | | (0.99 | ) | | | (0.22 | ) | | | (— | )d | | | (0.16 | ) |
| | | | | |
Net realized gains | | | (0.01 | ) | | | (1.65 | ) | | | — | | | | — | | | | (— | )d |
| | | | |
Total distributions | | | (0.22 | ) | | | (2.64 | ) | | | (0.22 | ) | | | (— | )d | | | (0.16 | ) |
| | | | |
Net asset value, end of year | | | $7.54 | | | | $7.54 | | | | $8.49 | | | | $7.58 | | | | $7.71 | |
| | | | |
| | | | | |
Total returne | | | 2.75% | | | | 23.68% | | | | 15.17% | | | | (1.67)% | | | | 10.24% | |
| | | | | |
| Ratios to average net assets | | | | | | | | | | | | | | | | | | | | |
| | | | | |
Expenses before waiver and payments by affiliatesf | | | 0.46% | | | | 0.46% | | | | 0.46% | | | | 0.46% | | | | 0.46% | |
| | | | | |
Expenses net of waiver and payments by affiliatesf | | | 0.45% | | | | 0.45% | | | | 0.45% | | | | 0.45% | | | | 0.45% | |
| | | | | |
Net investment incomec | | | 2.53% | | | | 3.32% | | | | 3.71% | | | | 3.09% | | | | 2.69% | |
| | | | | |
| Supplemental data | | | | | | | | | | | | | | | | | | | | |
| | | | | |
Net assets, end of year (000’s) | | | $702,324 | | | | $676,781 | | | | $493,813 | | | | $2,860,928 | | | | $3,036,272 | |
| | | | | |
Portfolio turnover rate | | | 4.80% | | | | 3.91% | | | | 28.46% | g | | | 58.42% | | | | 17.81% | |
aThe amount shown for a share outstanding throughout the period may not correlate with the Statement of Operations for the period due to the timing of sales and repurchases of the Fund shares in relation to income earned and/or fluctuating fair value of the investments of the Fund.
bBased on average daily shares outstanding.
cRecognition of net investment income by the Fund is affected by the timing of declaration of dividends by the Underlying Funds in which the Fund invests.
dAmount rounds to less than $0.01 per share.
eTotal return does not include fees, charges or expenses imposed by the variable annuity and life insurance contracts for which Franklin Templeton Variable Insurance Products Trust serves as an underlying investment vehicle.
fDoes not include expenses of the Underlying Funds in which the Fund invests. The weighted average indirect expenses of the Underlying Funds was 0.66% for the year ended December 31, 2014.
gExcludes the value of portfolio securities delivered as a result of a redemption in-kind.
| | | | | | |
| | | The accompanying notes are an integral part of these financial statements. | Annual Report | | | FFA-7 | |
FRANKLIN TEMPLETON VARIABLE INSURANCE PRODUCTS TRUST
Statement of Investments, December 31, 2014
Franklin Founding Funds Allocation VIP Fund
| | | | | | | | | | |
| | | | | Shares | | | Value | |
| | Investments in Underlying Fundsa | | | | | | | | |
| | Domestic Equity 33.1% | | | | | | | | |
| | Franklin Mutual Shares VIP Fund, Class 1 | | | 18,222,604 | | | $ | 417,479,858 | |
| | | | | | | | | | |
| | Domestic Hybrid 33.2% | | | | | | | | |
| | Franklin Income VIP Fund, Class 1 | | | 25,395,586 | | | | 418,519,258 | |
| | | | | | | | | | |
| | Foreign Equity 33.1% | | | | | | | | |
| | Templeton Growth VIP Fund, Class 1 | | | 28,094,843 | | | | 417,208,413 | |
| | | | | | | | | | |
| | | |
| | Total Investments in Underlying Funds (Cost $904,036,051) 99.4% | | | | | | | 1,253,207,529 | |
| | Other Assets, less Liabilities 0.6% | | | | | | | 7,933,684 | |
| | | | | | | | | | |
| | Net Assets 100.0% | | | | | | $ | 1,261,141,213 | |
| | | | | | | | | | |
aSee Note 3(d) regarding investments in Underlying Funds.
| | | | |
| FFA-8 | | Annual Report | The accompanying notes are an integral part of these financial statements. | | |
FRANKLIN TEMPLETON VARIABLE INSURANCE PRODUCTS TRUST
Financial Statements
Statement of Assets and Liabilities
December 31, 2014
| | | | |
| | | Franklin Founding
Funds Allocation
VIP Fund | |
Assets: | | | | |
Investments in Underlying Funds: (Note 3d) | | | | |
Cost | | $ | 904,036,051 | |
| | | | |
Value | | $ | 1,253,207,529 | |
Cash | | | 10,732,335 | |
Receivables from capital shares sold | | | 1,194,849 | |
Other assets | | | 105 | |
| | | | |
Total assets | | | 1,265,134,818 | |
| | | | |
Liabilities: | | | | |
Payables: | | | | |
Capital shares redeemed | | | 3,175,535 | |
Administrative fees | | | 78,302 | |
Distribution fees | | | 655,956 | |
Accrued expenses and other liabilities | | | 83,812 | |
| | | | |
Total liabilities | | | 3,993,605 | |
| | | | |
Net assets, at value | | $ | 1,261,141,213 | |
| | | | |
Net assets consist of: | | | | |
Paid-in capital | | $ | 933,717,015 | |
Undistributed net investment income | | | 31,617,896 | |
Net unrealized appreciation (depreciation) | | | 349,171,478 | |
Accumulated net realized gain (loss) | | | (53,365,176 | ) |
| | | | |
Net assets, at value | | $ | 1,261,141,213 | |
| | | | |
| |
| Class 1: | | | | |
Net assets, at value | | $ | 1,113,673 | |
| | | | |
Shares outstanding | | | 149,087 | |
| | | | |
Net asset value and maximum offering price per share | | $ | 7.47 | |
| | | | |
| |
| Class 2: | | | | |
Net assets, at value | | $ | 557,703,613 | |
| | | | |
Shares outstanding | | | 75,174,882 | |
| | | | |
Net asset value and maximum offering price per share | | $ | 7.42 | |
| | | | |
| |
| Class 4: | | | | |
Net assets, at value | | $ | 702,323,927 | |
| | | | |
Shares outstanding | | | 93,205,355 | |
| | | | |
Net asset value and maximum offering price per share | | $ | 7.54 | |
| | | | |
| | | | | | |
| | | The accompanying notes are an integral part of these financial statements. | Annual Report | | | FFA-9 | |
FRANKLIN TEMPLETON VARIABLE INSURANCE PRODUCTS TRUST
FINANCIAL STATEMENTS
Statement of Operations
for the year ended December 31, 2014
| | | | |
| | | Franklin Founding
Funds Allocation
VIP Fund | |
Investment income: | | | | |
Dividends from Underlying Funds (Note 3d) | | $ | 38,513,333 | |
| | | | |
Expenses: | | | | |
Administrative fees (Note 3a) | | | 1,293,974 | |
Distribution fees: (Note 3b) | | | | |
Class 2 | | | 1,406,298 | |
Class 4 | | | 2,557,243 | |
Reports to shareholders | | | 110,315 | |
Professional fees | | | 32,208 | |
Trustees’ fees and expenses | | | 5,013 | |
Other | | | 7,667 | |
| | | | |
Total expenses | | | 5,412,718 | |
Expenses waived/paid by affiliates (Note 3e) | | | (155,153 | ) |
| | | | |
Net expenses | | | 5,257,565 | |
| | | | |
Net investment income | | | 33,255,768 | |
| | | | |
Realized and unrealized gains (losses): | | | | |
Net realized gain (loss) from: | | | | |
Sale of investments in Underlying Funds (Note 3d) | | | (677,936 | ) |
Realized gain distributions by Underlying Funds (Note 3d) | | | 2,262,901 | |
| | | | |
Net realized gain (loss) | | | 1,584,965 | |
| | | | |
Net change in unrealized appreciation (depreciation) on investments in Underlying Funds | | | (1,653,471 | ) |
| | | | |
Net realized and unrealized gain (loss) | | | (68,506 | ) |
| | | | |
Net increase (decrease) in net assets resulting from operations | | $ | 33,187,262 | |
| | | | |
| | | | |
| FFA-10 | | Annual Report | The accompanying notes are an integral part of these financial statements. | | |
FRANKLIN TEMPLETON VARIABLE INSURANCE PRODUCTS TRUST
FINANCIAL STATEMENTS
Statements of Changes in Net Assets
| | | | | | | | |
| | | Franklin Founding Funds Allocation VIP Fund | |
| | | Year Ended December 31, | |
| | | 2014 | | | 2013 | |
Increase (decrease) in net assets: | | | | | | | | |
Operations: | | | | | | | | |
Net investment income | | $ | 33,255,768 | | | $ | 36,642,567 | |
Net realized gain (loss) from Underlying Funds | | | 1,584,965 | | | | 3,163,496 | |
Net change in unrealized appreciation (depreciation) on investments in Underlying Funds | | | (1,653,471 | ) | | | 190,487,276 | |
| | | | |
Net increase (decrease) in net assets resulting from operations | | | 33,187,262 | | | | 230,293,339 | |
| | | | |
Distributions to shareholders from: | | | | | | | | |
Net investment income: | | | | | | | | |
Class 1 | | | (32,764 | ) | | | (113,893 | ) |
Class 2 | | | (15,578,364 | ) | | | (60,502,595 | ) |
Class 4 | | | (19,895,877 | ) | | | (59,385,848 | ) |
Net realized gains: | | | | | | | | |
Class 1 | | | (924 | ) | | | (162,965 | ) |
Class 2 | | | (475,173 | ) | | | (88,234,067 | ) |
Class 4 | | | (618,180 | ) | | | (98,339,718 | ) |
| | | | |
Total distributions to shareholders | | | (36,601,282 | ) | | | (306,739,086 | ) |
| | | | |
Capital share transactions: (Note 2) | | | | | | | | |
Class 1 | | | 164,958 | | | | 268,891 | |
Class 2 | | | 11,105,994 | | | | 115,298,186 | |
Class 4 | | | 28,046,285 | | | | 218,850,531 | |
| | | | |
Total capital share transactions | | | 39,317,237 | | | | 334,417,608 | |
| | | | |
Net increase (decrease) in net assets | | | 35,903,217 | | | | 257,971,861 | |
Net assets: | | | | | | | | |
Beginning of year | | | 1,225,237,996 | | | | 967,266,135 | |
| | | | |
End of year | | $ | 1,261,141,213 | | | $ | 1,225,237,996 | |
| | | | |
Undistributed net investment income included in net assets: | | | | | | | | |
End of year | | $ | 31,617,896 | | | $ | 33,877,400 | |
| | | | |
| | | | | | |
| | | The accompanying notes are an integral part of these financial statements. | Annual Report | | | FFA-11 | |
FRANKLIN TEMPLETON VARIABLE INSURANCE PRODUCTS TRUST
Notes to Financial Statements
Franklin Founding Funds Allocation VIP Fund
1. Organization and Significant Accounting Policies
Franklin Templeton Variable Insurance Products Trust (Trust) is registered under the Investment Company Act of 1940, as amended, (1940 Act) as an open-end management investment company, consisting of nineteen separate funds and applies the specialized accounting and reporting guidance in U.S. Generally Accepted Accounting Principles (U.S. GAAP). Franklin Founding Funds Allocation VIP Fund (Fund) is included in this report. The financial statements of the remaining funds in the Trust are presented separately. The Fund invests primarily in other funds of the Trust (Underlying Funds). Shares of the Fund are generally sold only to insurance company separate accounts to fund the benefits of variable life insurance policies or variable annuity contracts. The Fund offers three classes of shares: Class 1, Class 2, and Class 4. Each class of shares differs by its distribution fees, voting rights on matters affecting a single class and its exchange privilege.
The accounting policies of the Underlying Funds are outlined in their respective shareholder reports. A copy of the Underlying Funds’ shareholder reports is available on the U.S. Securities and Exchange Commission (SEC) website at sec.gov or at the SEC’s Public Reference Room in Washington, D.C. The Underlying Funds’ shareholder reports are not covered by this report.
Effective May 31, 2014, Franklin Templeton VIP Founding Funds Allocation Fund was renamed Franklin Founding Funds Allocation VIP Fund.
The following summarizes the Fund’s significant accounting policies.
a. Financial Instrument Valuation
The Fund’s investments in financial instruments are carried at fair value daily. Fair value is the price that would be received to sell an asset or paid to transfer a liability in an orderly transaction between market participants on the measurement date. The Fund calculates the net asset value (NAV) per share at the close of the New York Stock Exchange (NYSE), generally at 4 p.m. Eastern time (NYSE close) on each day the NYSE is open for trading. Under compliance policies and procedures approved by the Trust’s Board of Trustees (the Board), the Fund’s administrator has responsibility for oversight of valuation, including leading the cross-functional Valuation and Liquidity Oversight Committee (VLOC). The VLOC provides administration and oversight of the Fund’s valuation policies
and procedures, which are approved annually by the Board. Among other things, these procedures allow the Fund to utilize independent pricing services, quotations from securities and financial instrument dealers, and other market sources to determine fair value. Investments in the Underlying Funds are valued at their closing NAV each trading day.
b. Income Taxes
It is the Fund’s policy to qualify as a regulated investment company under the Internal Revenue Code. The Fund intends to distribute to shareholders substantially all of its taxable income and net realized gains to relieve it from federal income and if applicable, excise taxes. As a result, no provision for U.S. federal income taxes is required.
The Fund recognizes the tax benefits of uncertain tax positions only when the position is “more likely than not” to be sustained upon examination by the tax authorities based on the technical merits of the tax position. As of December 31, 2014, and for all open tax years, the Fund has determined that no liability for unrecognized tax benefits is required in the Fund’s financial statements related to uncertain tax positions taken on a tax return (or expected to be taken on future tax returns). Open tax years are those that remain subject to examination and are based on each tax jurisdiction statute of limitation.
c. Security Transactions, Investment Income, Expenses and Distributions
Security transactions are accounted for on trade date. Realized gains and losses on security transactions are determined on a specific identification basis. Estimated expenses are accrued daily. Dividend income and realized gain distributions by Underlying Funds are recorded on the ex-dividend date. Distributions to shareholders are recorded on the ex-dividend date and are determined according to income tax regulations (tax basis). Distributable earnings determined on a tax basis may differ from earnings recorded in accordance with U.S. GAAP. These differences may be permanent or temporary. Permanent differences are reclassified among capital accounts to reflect their tax character. These reclassifications have no impact on net assets or the results of operations. Temporary differences are not reclassified, as they may reverse in subsequent periods.
Common expenses incurred by the Trust are allocated among the funds based on the ratio of net assets of each fund to the combined net assets of the Trust. Fund specific expenses are charged directly to the fund that incurred the expense.
FRANKLIN TEMPLETON VARIABLE INSURANCE PRODUCTS TRUST
NOTES TO FINANCIAL STATEMENTS
Franklin Founding Funds Allocation VIP Fund (continued)
The Fund indirectly bears its proportionate share of expenses from the Underlying Funds. Since the Underlying Funds have varied expense levels and the Fund may own different proportions of the Underlying Funds at different times, the amount of expenses incurred indirectly by the Fund will vary.
Realized and unrealized gains and losses and net investment income, not including class specific expenses, are allocated daily to each class of shares based upon the relative proportion of net assets of each class. Differences in per share distributions, by class, are generally due to differences in class specific expenses.
d. Accounting Estimates
The preparation of financial statements in accordance with U.S. GAAP requires management to make estimates and assumptions that affect the reported amounts of assets and liabilities at the
date of the financial statements and the amounts of income and expenses during the reporting period. Actual results could differ from those estimates.
e. Guarantees and Indemnifications
Under the Trust’s organizational documents, its officers and trustees are indemnified by the Trust against certain liabilities arising out of the performance of their duties to the Trust. Additionally, in the normal course of business, the Trust, on behalf of the Fund, enters into contracts with service providers that contain general indemnification clauses. The Trust’s maximum exposure under these arrangements is unknown as this would involve future claims that may be made against the Trust that have not yet occurred. Currently, the Trust expects the risk of loss to be remote.
2. Shares of Beneficial Interest
At December 31, 2014, there were an unlimited number of shares authorized (without par value). Transactions in the Fund’s shares were as follows:
| | | | | | | | | | | | | | | | | | |
| | | Year Ended December 31, | |
| | | 2014 | | | | | 2013 | |
| | | Shares | | | Amount | | | | | Shares | | | Amount | |
| | | | | |
| Class 1 Shares: | | | | | | | | | | | | | | | | | | |
Shares sold | | | 37,779 | | | $ | 289,740 | | | | | | 24,967 | | | $ | 213,393 | |
Shares issued in reinvestment of distributions | | | 4,341 | | | | 33,688 | | | | | | 41,633 | | | | 276,858 | |
Shares redeemed | | | (20,435 | ) | | | (158,470 | ) | | | | | (28,865 | ) | | | (221,360 | ) |
| | | | |
Net increase (decrease) | | | 21,685 | | | $ | 164,958 | | | | | | 37,735 | | | $ | 268,891 | |
| | | | |
| Class 2 Shares: | | | | | | | | | | | | | | | | | | |
Shares sold | | | 11,044,608 | | | $ | 83,657,513 | | | | | | 9,475,437 | | | $ | 72,686,096 | |
Shares issued in reinvestment of distributions | | | 2,082,171 | | | | 16,053,537 | | | | | | 22,467,774 | | | | 148,736,662 | |
Shares redeemed | | | (11,722,596 | ) | | | (88,605,056 | ) | | | | | (13,700,538 | ) | | | (106,124,572 | ) |
| | | | |
Net increase (decrease) | | | 1,404,183 | | | $ | 11,105,994 | | | | | | 18,242,673 | | | $ | 115,298,186 | |
| | | | |
| Class 4 Shares: | | | | | | | | | | | | | | | | | | |
Shares sold | | | 13,809,688 | | | $ | 106,773,129 | | | | | | 14,101,836 | | | $ | 107,566,000 | |
Shares issued on reinvestment of distributions | | | 2,616,589 | | | | 20,514,057 | | | | | | 23,436,191 | | | | 157,725,566 | |
Shares redeemed | | | (12,995,650 | ) | | | (99,240,901 | ) | | | | | (5,915,495 | ) | | | (46,441,035 | ) |
| | | | |
Net increase (decrease) | | | 3,430,627 | | | $ | 28,046,285 | | | | | | 31,622,532 | | | $ | 218,850,531 | |
| | | | |
FRANKLIN TEMPLETON VARIABLE INSURANCE PRODUCTS TRUST
NOTES TO FINANCIAL STATEMENTS
Franklin Founding Funds Allocation VIP Fund (continued)
3. Transactions With Affiliates
Franklin Resources, Inc. is the holding company for various subsidiaries that together are referred to as Franklin Templeton Investments. Certain officers and trustees of the Fund are also officers and/or directors/trustees of certain of the Underlying Funds and of the following subsidiaries:
| | |
| Subsidiary | | Affiliation |
Franklin Templeton Services, LLC (FT Services) | | Administrative manager |
Franklin Templeton Distributors, Inc. (Distributors) | | Principal underwriter |
Franklin Templeton Investor Services, LLC (Investor Services) | | Transfer agent |
a. Administrative Fees
The Fund pays an administrative fee to FT Services of 0.10% per year of the average daily net assets of the Fund for administrative services including monitoring and rebalancing the percentage of the Fund’s investments in the Underlying Funds.
b. Distribution Fees
The Board has adopted distribution plans for Class 2 and Class 4 shares pursuant to Rule 12b-1 under the 1940 Act. Under the Fund’s compensation distribution plans, the Fund pays Distributors for costs incurred in connection with the servicing, sale and distribution of the Fund’s shares up to 0.35% per year of its average daily net assets of each class. Some distribution fees are not charged on shares held by affiliates. The Board has agreed to limit the current rate to 0.25% per year for Class 2. The plan year, for purposes of monitoring compliance with the maximum annual plan rates, is February 1 through January 31.
c. Transfer Agent Fees
Investor Services, under terms of an agreement, performs shareholder servicing for the Fund and is not paid by the Fund for the services.
d. Investments in Underlying Funds
The Fund invests primarily in the Underlying Funds which are managed by affiliates of the Fund’s administrative manager, FT Services. The Fund does not invest in the Underlying Funds for the purpose of exercising a controlling influence over the management or policies. Investments in Underlying Funds for the year ended December 31, 2014, were as follows:
| | | | | | | | | | | | | | | | | | | | | | | | | | | | | | | | |
| Underlying Funds | | Number
of Shares
Held at
Beginning
of Year | | | Gross
Additions | | | Gross
Reductions | | | Number
of Shares
Held at
End of
Year | | | Value at
End of
Year | | | Investment
Income | | | Realized
Gain
(Loss) | | | % of
Underlying
Fund Shares
Outstanding
Held at End
of Year | |
Franklin Income VIP Fund, Class 1a | | | 24,462,601 | | | | 2,153,488 | | | | (1,220,503 | ) | | | 25,395,586 | | | $ | 418,519,258 | | | $ | 21,984,390 | | | $ | (846,306 | ) | | | 5.73% | |
Franklin Mutual Shares VIP Fund, Class 1b | | | 18,485,942 | | | | 1,194,264 | | | | (1,457,602 | ) | | | 18,222,604 | | | | 417,479,858 | | | | 9,790,126 | | | | 2,856,091 | | | | 8.20% | |
Templeton Growth VIP Fund, Class 1c | | | 26,312,175 | | | | 2,326,382 | | | | (543,714 | ) | | | 28,094,843 | | | | 417,208,413 | | | | 6,738,817 | | | | (424,820 | ) | | | 22.87% | |
| | | | | | | | | | | | | | | | | | | | | | | | |
Total | | | | | | | | | | | | | | | | | | $ | 1,253,207,529 | | | $ | 38,513,333 | | | $ | 1,584,965 | | | | | |
| | | | | | | | | | | | | | | | | | | | | | | | |
aEffective May 1, 2014, Franklin Income Securities Fund was renamed Franklin Income VIP Fund.
bEffective May 1, 2014, Mutual Shares Securities Fund was renamed Franklin Mutual Shares VIP Fund.
cEffective May 1, 2014, Templeton Growth Securities Fund was renamed Templeton Growth VIP Fund.
e. Waiver and Expense Reimbursements
FT Services contractually agreed in advance to waive or limit its fees and to assume as its own expense certain expenses otherwise payable by the Fund so that the expenses (excluding distribution fees, and acquired fund fees and expenses) for each class of the Fund do not exceed 0.10% based on the average net assets of each class (other than certain non-routine expenses or costs, including those relating to litigation, indemnification, reorganizations, and liquidations) until April 30, 2015.
FRANKLIN TEMPLETON VARIABLE INSURANCE PRODUCTS TRUST
NOTES TO FINANCIAL STATEMENTS
Franklin Founding Funds Allocation VIP Fund (continued)
4. Expense Offset Arrangement
The Fund has entered into an arrangement with its custodian whereby credits realized as a result of uninvested cash balances are used to reduce a portion of the Fund’s custodian expenses. During the year ended December 31, 2014, there were no credits earned.
5. Income Taxes
The tax character of distributions paid during the years ended December 31, 2014 and 2013, was as follows:
| | | | | | | | |
| | | 2014 | | | 2013 | |
Distributions paid from: | | | | | | | | |
Ordinary income | | $ | 36,432,932 | | | $ | 120,002,336 | |
Long term capital gain | | | 168,350 | | | | 186,736,750 | |
| | | | |
| | $ | 36,601,282 | | | $ | 306,739,086 | |
| | | | |
At December 31, 2014, the cost of investments, net unrealized appreciation (depreciation), undistributed ordinary income and undistributed long term capital gains for income tax purposes were as follows:
| | | | |
Cost of investments | | $ | 959,173,368 | |
| | | | |
Unrealized appreciation | | $ | 294,034,161 | |
Unrealized depreciation | | | — | |
| | | | |
Net unrealized appreciation (depreciation) | | $ | 294,034,161 | |
| | | | |
Undistributed ordinary income | | $ | 31,617,896 | |
Undistributed long term capital gains | | | 1,772,132 | |
| | | | |
Distributable earnings | | $ | 33,390,028 | |
| | | | |
Differences between income and/or capital gains as determined on a book basis and a tax basis are primarily due to differing treatment of wash sales.
6. Investment Transactions
Purchases and sales of Underlying Funds (excluding short term securities) for the year ended December 31, 2014, aggregated $100,776,235 and $61,620,662, respectively.
7. Credit Facility
The Fund, together with other U.S. registered and foreign investment funds (collectively, Borrowers), managed by Franklin Templeton Investments, are borrowers in a joint syndicated senior unsecured credit facility totaling $1.5 billion (Global Credit Facility) which matured on February 13, 2015. This Global Credit Facility provides a source of funds to the Borrowers for temporary and emergency purposes, including the ability to meet future unanticipated or unusually large redemption requests. The Borrowers expect to renew the Global Credit Facility for a total of $2 billion effective February 13, 2015, which matures on February 12, 2016.
Under the terms of the Global Credit Facility, the Fund shall, in addition to interest charged on any borrowings made by the Fund and other costs incurred by the Fund, pay its share of fees and expenses incurred in connection with the implementation and maintenance of the Global Credit Facility, based upon its relative share of the aggregate net assets of all of the Borrowers, including an annual commitment fee of 0.07% based upon the unused portion of the Global Credit Facility. These fees are reflected in other expenses on the Statement of Operations. During the year ended December 31, 2014, the Fund did not use the Global Credit Facility.
FRANKLIN TEMPLETON VARIABLE INSURANCE PRODUCTS TRUST
NOTES TO FINANCIAL STATEMENTS
Franklin Founding Funds Allocation VIP Fund (continued)
8. Fair Value Measurements
The Fund follows a fair value hierarchy that distinguishes between market data obtained from independent sources (observable inputs) and the Fund’s own market assumptions (unobservable inputs). These inputs are used in determining the value of the Fund’s financial instruments and are summarized in the following fair value hierarchy:
| | • | | Level 1 – quoted prices in active markets for identical financial instruments |
| | • | | Level 2 – other significant observable inputs (including quoted prices for similar financial instruments, interest rates, prepayment speed, credit risk, etc.) |
| | • | | Level 3 – significant unobservable inputs (including the Fund’s own assumptions in determining the fair value of financial instruments) |
The input levels are not necessarily an indication of the risk or liquidity associated with financial instruments at that level.
For movements between the levels within the fair value hierarchy, the Fund has adopted a policy of recognizing the transfers as of the date of the underlying event which caused the movement.
At December 31, 2014, all of the Fund’s investments in financial instruments carried at fair value were valued using Level 1 inputs. For detailed categories, see the accompanying Statement of Investments.
9. Subsequent Events
The Fund has evaluated subsequent events through the issuance of the financial statements and determined that no events have occurred that require disclosure other than those already disclosed in the financial statements.
FRANKLIN TEMPLETON VARIABLE INSURANCE PRODUCTS TRUST
Report of Independent Registered Public Accounting Firm
Franklin Founding Funds Allocation VIP Fund
To the Board of Trustees and Shareholders of Franklin Templeton Variable Insurance Products Trust
In our opinion, the accompanying statement of assets and liabilities, including the statement of investments, and the related statements of operations and of changes in net assets and the financial highlights present fairly, in all material respects, the financial position of Franklin Founding Funds Allocation VIP Fund (the “Fund”) at December 31, 2014, the results of its operations for the year then ended, the changes in its net assets for each of the two years in the period then ended and the financial highlights for each of the five years in the period then ended, in conformity with accounting principles generally accepted in the United States of America. These financial statements and financial highlights (hereafter referred to as “financial statements”) are the responsibility of the Fund’s management. Our responsibility is to express an opinion on these financial statements based on our audits. We conducted our audits of these financial statements in accordance with the standards of the Public Company Accounting Oversight Board (United States). Those standards require that we plan and perform the audit to obtain reasonable assurance about whether the financial statements are free of material misstatement. An audit includes examining, on a test basis, evidence supporting the amounts and disclosures in the financial statements, assessing the accounting principles used and significant estimates made by management, and evaluating the overall financial statement presentation. We believe that our audits, which included confirmation of securities at December 31, 2014 by correspondence with the custodian and brokers, provides a reasonable basis for our opinion.
PricewaterhouseCoopers LLP
San Francisco, California
February 13, 2015
FRANKLIN TEMPLETON VARIABLE INSURANCE PRODUCTS TRUST
Tax Information (unaudited)
Franklin Founding Funds Allocation VIP Fund
Under Section 852(b)(3)(C) of the Internal Revenue Code (Code), the Fund hereby reports the maximum amount allowable but no less than $168,350 as a long term capital gain dividend for the fiscal year ended December 31, 2014.
Under Section 854(b)(1)(A) of the Code, the Fund hereby reports 39.80% of the ordinary income dividends as income qualifying for the dividends received deduction for the fiscal year ended December 31, 2014.
At December 31, 2014, the Fund, a qualified fund of funds under Section 852(g)(2) of the Code, received an allocation of foreign taxes paid from one or more of its underlying funds. The Fund elects to treat foreign taxes paid as allowed under Section 853 of the Code. This election will allow shareholders of record as of the 2015 distribution date, to treat their proportionate share of foreign taxes paid by the underlying funds as having been paid directly by them. The shareholder shall consider these amounts as foreign taxes paid in the tax year in which they receive the Fund distribution.
Franklin Global Real Estate VIP Fund
(Formerly, Franklin Global Real Estate Securities Fund)
This annual report for Franklin Global Real Estate VIP Fund covers the fiscal year ended December 31, 2014.
Class 2 Performance Summary as of December 31, 2014
Average annual total return of Class 2 shares represents the average annual change in value, assuming reinvestment of dividends and capital gains. Average returns smooth out variations in returns, which can be significant; they are not the same as year-by-year results.
| | | | | | | | | | | | |
| Periods ended 12/31/14 | | 1-Year | | | 5-Year | | | 10-Year | |
Average Annual Total Return | | | +15.01% | | | | +11.34% | | | | +2.43% | |
Performance reflects the Fund’s Class 2 operating expenses, but does not include any contract fees, expenses or sales charges. If they had been included, performance would be lower. These charges and deductions, particularly for variable life policies, can have a significant effect on contract values and insurance benefits. See the contract prospectus for a complete description of these expenses, including sales charges.
Performance data represent past performance, which does not guarantee future results. Investment return and principal value will fluctuate, and you may have a gain or loss when you sell your shares. Current performance may differ from figures shown.
Total Return Index Comparison for a Hypothetical $10,000 Investment (1/1/05–12/31/14)
The graph below shows the change in value of a hypothetical $10,000 investment in the Fund over the indicated period and includes reinvestment of any income or distributions. The Fund’s performance is compared to the performance of the FTSE® EPRA®/NAREIT® Developed Index. One cannot invest directly in an index, and an index is not representative of the Fund’s portfolio. Please see Important Notes to Performance Information preceding the Fund Summaries.
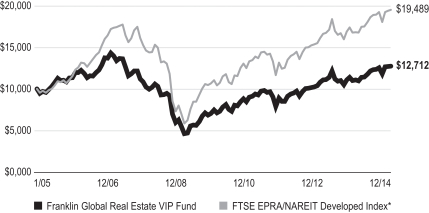
*Source: Morningstar. Please see Index Descriptions following the Fund Summaries.
FRANKLIN GLOBAL REAL ESTATE VIP FUND
Fund Goal and Main Investments
Franklin Global Real Estate VIP Fund seeks high total return. Under normal market conditions, the Fund invests at least 80% of its net assets in investments of companies located anywhere in the world that operate in the real estate sector.
Fund Risks
All investments involve risks, including possible loss of principal. The Fund concentrates in real estate securities, which involve special risks, such as declines in the value of real estate and increased susceptibility to adverse economic or regulatory developments affecting the sector. The Fund’s investments in REITs involve additional risks; since REITs typically are invested in a limited number of projects or in a particular market segment, they are more susceptible to adverse developments affecting a single project or market segment than more broadly diversified investments. Foreign investing, especially in emerging markets, involves additional risks such as currency and market volatility, as well as political and social instability. The Fund is actively managed but there is no guarantee that the manager’s investment decisions will produce the desired results. The Fund’s prospectus also includes a description of the main investment risks.
What is a REIT?
A REIT is a type of real estate company that is dedicated to owning and usually operating income-producing real estate properties such as apartments, hotels, industrial properties, office buildings or shopping centers. Equity REITs generally receive income from rents received, are generally operated by experienced property management teams and typically concentrate on a specific geographic region or property type.
Performance Overview
You can find the Fund’s one-year total return in the Performance Summary. In comparison, the FTSE EPRA/NAREIT Developed Index posted a +15.89% total return for the same period.1
Economic and Market Overview
The global economy grew moderately during 2014 as U.S. economic growth expanded while growth rates in much of the rest of the world declined. U.S. economic activity was supported in some quarters by increased consumer spending, business investment and federal defense spending. The housing market strengthened, and lower gasoline prices and improved
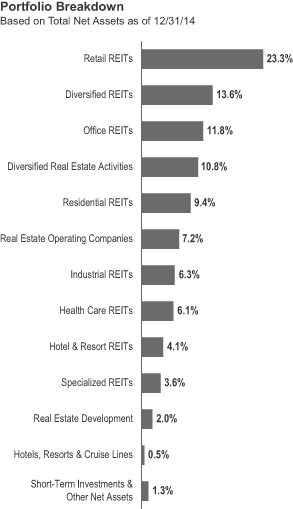
job growth contributed to rising retail sales. The U.S. Federal Reserve Board (Fed) began reducing its large-scale bond purchases $10 billion a month in January and ended the buying program in October. But it continued its practice of maintaining holdings of longer term securities at sizable levels. Toward period-end, the Fed stated that it could be patient with regard to raising interest rates and that the interest rate might not rise for at least a couple of meetings, possibly implying at least the first two meetings of 2015.
Outside the U.S., the U.K. economy grew relatively well, supported by the services and manufacturing sectors. In the eurozone, economic growth remained subdued, as concerns persisted about the potential negative impacts to growth from the crisis in Ukraine and China’s moderating growth rate. In June, the European Central Bank (ECB) reduced its main
1. Source: Morningstar.
One cannot invest directly in an index, and an index is not representative of the Fund’s portfolio. Please see Index Descriptions following the Fund Summaries.
FRANKLIN GLOBAL REAL ESTATE VIP FUND
interest rate and, for the first time, set a negative deposit rate; the ECB reduced both rates again in September. The ECB broadened its monetary easing stance by implementing an asset purchase program to prevent deflation and stimulate the economy. Japan’s second- and third-quarter economic contractions indicated the economy was in a recession, although private consumption and exports improved in the third quarter. In October, the Bank of Japan expanded its stimulus measures amid weak domestic demand and as substantially lower crude oil prices exerted further downward pressure on inflation. Near period-end, Japan’s ruling coalition was reelected in early parliamentary elections and subsequently announced a fresh stimulus package aimed at reviving economic growth.
Global developed market stocks, as measured by the MSCI World Index, advanced overall during the 12-month period amid a generally accommodative monetary policy environment and continued strength in corporate earnings. In several emerging markets, economic growth generally moderated. Emerging market stocks overall, as measured by the MSCI Emerging Markets Index, fell for the year, amid headwinds such as soft domestic demand, weak exports, plummeting crude oil prices, regional geopolitical tensions and concerns about possible U.S. interest rate increases. Many emerging market currencies depreciated against the U.S. dollar, leading several central banks to raise interest rates seeking to support their currencies. Several other central banks lowered interest rates to promote economic growth. Gold prices ended the year lower amid benign global inflation and a strong U.S. dollar.
Global Real Estate Market Overview
Overall, global real estate markets rose during the 12 months under review. According to the FTSE EPRA/NAREIT Developed Index, in U.S. dollar terms, the U.S. and Germany far outpaced the index and led global real estate markets. Australia, Hong Kong, New Zealand and the U.K. also posted strong results. In contrast, some markets represented in the index lost value, including China and Japan.
Investment Strategy
We seek to limit price volatility by investing across markets and property types and seek to provide a consistently high level of income in our pursuit of high total return. When selecting investments for the Fund’s portfolio, we apply a “bottom-up” stock selection process that incorporates macro-level views in the evaluation process. Our portfolio construction process combines bottom-up analysis of individual stock and real estate
| | | | |
| Top 10 Countries | | | |
| 12/31/14 | | | |
| | | % of Total
Net Assets | |
| U.S. | | | 52.5% | |
| Japan | | | 11.7% | |
| Hong Kong | | | 7.4% | |
| U.K. | | | 6.4% | |
| Australia | | | 5.4% | |
| France | | | 4.0% | |
| Singapore | | | 3.6% | |
| Germany | | | 2.2% | |
| Canada | | | 1.6% | |
| Sweden | | | 1.5% | |
market fundamentals and top-down macro overlays to provide country/regional, property type, and company size perspectives in identifying international/local cyclical and thematic trends that highlight investment opportunities.
Manager’s Discussion
During the 12 months under review, stock selection in the office space sector was a key contributor to the Fund’s performance relative to the FTSE EPRA/NAREIT Developed Index, supported by our position in mid-capitalization, U.S.-based, office REIT Kilroy Realty. Shares of the west coast-focused office space landlord performed well during the reporting period, largely reflecting strong office fundamentals, especially in San Diego, West Los Angeles, San Francisco and Seattle, the company’s core markets. Since 2010, Kilroy has grown successfully and reached new markets including San Francisco and Seattle, where office fundamentals remained strong with healthy tenant demand and limited supply. In our view, Kilroy’s sizable near and future development pipeline could generate a bigger portion of its future earnings as these developments begin operations.
The Fund’s investment in U.S.-based self-storage REIT Extra Space Storage also enhanced relative performance.2 Among self-storage REITs, Extra Space Storage outperformed the index. The company’s results reflected solid storage sector fundamentals and superior core growth compared with other property sectors amid limited supply. Extra Space Storage also started to experience increased revenue contribution from its recently completed acquisitions.
2. Self-storage companies are in Specialized REITs in the SOI.
FRANKLIN GLOBAL REAL ESTATE VIP FUND
The Fund’s investments in apartment REITs such as Essex Property Trust also boosted relative returns. Shares benefited from strong fundamentals in western U.S. apartment markets, particularly in the San Francisco Bay Area and Seattle. In addition, Essex closed its acquisition of BRE Properties (a Fund holding prior to acquisition) in April 2014, which was viewed favorably by investors after Essex’s management indicated that progress in integration and extraction of synergies had exceeded expectations.
In contrast, key detractors from the Fund’s relative performance included stock selection in the diversified sector, particularly our position in Mitsubishi Estate. Shares lagged the property benchmark during the period. Along with other Japanese developers, Mitsubishi Estate was held back by concerns over weakness in the Japanese economy, uncertainty surrounding a consumption tax hike and risks of deflation amid lower oil prices. Although the company began to raise rents for office properties in Marunouchi amid improving fundamentals, the impact to profit growth remained modest due to the length of lease terms.
Security selection in the hotel/resort sector also weighed on results. Shares of U.S.-based hotelier Starwood Hotels & Resorts Worldwide underperformed during the reporting period. Unlike some other U.S.-based hotel companies, Starwood generated a significant portion of its revenues from international markets including emerging markets. Therefore, the stock’s volatility increased in recent months given heightened global economic and geopolitical risks, especially in emerging markets. Despite reporting healthy core results, the company indicated its revenue growth expectations for 2015 were muted, reflecting management’s conservative outlook for the near future given the ongoing concerns.
The Fund’s overweighted investment in French retail property operator and developer Klepierre also proved detrimental to relative performance. Although this position provided a positive total return in euros, the declining euro led to a negative return in U.S.-dollar terms. Without regard for foreign currency changes, the shares largely underperformed those of other global retail property companies. In July, Klepierre announced it would buy Dutch retail property company Corio (not a Fund holding) in an exchange of shares. This transaction weighed negatively on performance during the second half of 2014.
Thank you for your participation in Franklin Global Real Estate VIP Fund. We look forward to serving your future investment needs.
| | | | |
Top 10 Holdings | | | |
| 12/31/14 | | | |
Company
Sector/Industry, Country | | % of Total
Net Assets | |
Simon Property Group Inc.
Retail REITs, U.S. | | | 5.0% | |
Mitsui Fudosan Co. Ltd.
Diversified Real Estate Activities, Japan | | | 3.7% | |
Unibail-Rodamco SE
Retail REITs, France | | | 3.0% | |
Mitsubishi Estate Co. Ltd.
Diversified Real Estate Activities, Japan | | | 2.5% | |
Vornado Realty Trust
Diversified REITs, U.S. | | | 2.3% | |
Health Care REIT Inc.
Health Care REITs, U.S. | | | 2.2% | |
Prologis Inc.
Industrial REITs, U.S. | | | 2.1% | |
Equity Residential
Residential REITs, U.S. | | | 2.1% | |
Boston Properties Inc.
Office REITs, U.S. | | | 2.1% | |
Host Hotels & Resorts Inc.
Hotel & Resort REITs, U.S. | | | 2.1% | |
The dollar value, number of shares or principal amount, and names of all portfolio holdings are listed in the Fund’s Statement of Investments (SOI).
The foregoing information reflects our analysis, opinions and portfolio holdings as of December 31, 2014, the end of the reporting period. The way we implement our main investment strategies and the resulting portfolio holdings may change depending on factors such as market and economic conditions. These opinions may not be relied upon as investment advice or an offer for a particular security. The information is not a complete analysis of every aspect of any market, country, industry, security or the Fund. Statements of fact are from sources considered reliable, but the investment manager makes no representation or warranty as to their completeness or accuracy. Although historical performance is no guarantee of future results, these insights may help you understand our investment management philosophy.
FRANKLIN GLOBAL REAL ESTATE VIP FUND
Class 2 Fund Expenses
As an investor in a variable insurance contract (Contract) that indirectly provides for investment in an underlying mutual fund, you can incur transaction and/or ongoing expenses at both the Fund level and the Contract level.
| • | | Transaction expenses can include sales charges (loads) on purchases, redemption fees, surrender fees, transfer fees and premium taxes. |
| • | | Ongoing expenses can include management fees, distribution and service (12b-1) fees, contract fees, annual maintenance fees, mortality and expense risk fees and other fees and expenses. All mutual funds and Contracts have some types of ongoing expenses. |
The expenses shown in the table are meant to highlight ongoing expenses at the Fund level only and do not include ongoing expenses at the Contract level, or transaction expenses at either the Fund or Contract level. While the Fund does not have transaction expenses, if the transaction and ongoing expenses at the Contract level were included, the expenses shown below would be higher. You should consult your Contract prospectus or disclosure document for more information.
The table shows Fund-level ongoing expenses and can help you understand these expenses and compare them with those of other mutual funds offered through the Contract. The table assumes a $1,000 investment held for the six months indicated. Please refer to the Fund prospectus for additional information on operating expenses.
Actual Fund Expenses
The first line (Actual) of the table provides actual account values and expenses. The “Ending Account Value” is derived from the Fund’s actual return, which includes the effect of ongoing Fund expenses, but does not include the effect of ongoing Contract expenses.
You can estimate the Fund-level expenses you incurred during the period by following these steps. Of course, your account value and expenses will differ from those in this illustration:
| 1. | Divide your account value by $1,000. |
If an account had an $8,600 value,
then $8,600 ÷ $1,000 = 8.6.
| 2. | Multiply the result by the number under the heading “Fund-Level Expenses Incurred During Period.” |
If Fund-Level Expenses Incurred During Period were $7.50, then 8.6 × $7.50 = $64.50.
In this illustration, the estimated expenses incurred this period at the Fund level are $64.50.
Hypothetical Example for Comparison with Other Mutual Funds
Information in the second line (Hypothetical) of the table can help you compare ongoing expenses of the Fund with those of other mutual funds offered through the Contract. This information may not be used to estimate the actual ending account balance or expenses you incurred during the period. The hypothetical “Ending Account Value” is based on the Fund’s actual expense ratio and an assumed 5% annual rate of return before expenses, which does not represent the Fund’s actual return. The figure under the heading “Fund-Level Expenses Incurred During Period” shows the hypothetical expenses your account would have incurred under this scenario. You can compare this figure with the 5% hypothetical examples that appear in shareholder reports of other funds offered through a Contract.
| | | | | | | | | | | | |
| Class 2 | | Beginning Account Value 7/1/14 | | | Ending Account
Value 12/31/14 | | | Fund-Level Expenses
Incurred During Period* 7/1/14–12/31/14 | |
Actual | | | $1,000 | | | | $1,033.00 | | | | $6.97 | |
Hypothetical (5% return before expenses) | | | $1,000 | | | | $1,018.35 | | | | $6.92 | |
*Expenses are calculated using the most recent six-month annualized expense ratio, for the Fund’s Class 2 shares (1.36%), which does not include any ongoing expenses of the Contract for which the Fund is an investment option, multiplied by the average account value over the period, multiplied by 184/365 to reflect the one-half year period.
SUPPLEMENT DATED SEPTEMBER 1, 2014
TO THE PROSPECTUSES DATED MAY 1, 2014
OF
FRANKLIN GLOBAL REAL ESTATE VIP FUND
(series of Franklin Templeton Variable Insurance Products Trust)
The prospectus is amended as follows:
I. The Fund Summary “Portfolio Managers” section beginning on page FGR-S5 is revised as follows:
Portfolio Managers
WILSON MAGEE Portfolio Manager of FT Institutional and portfolio manager of the Fund since 2010.
DANIEL PETTERSSON Portfolio Manager and Research Analyst of FT Institutional and portfolio manager of the Fund since September 2014.
II. The portfolio management team in “Fund Details – Management” section beginning on page FGR-D6 is revised as follows:
The Fund is managed by a team of dedicated professionals focused on investments in the global real estate securities market. The portfolio managers of the team are as follows:
| | |
WILSON MAGEE
Portfolio Manager of FT Institutional | | Mr. Magee assumed the duties of lead portfolio manager of the Fund in 2010. He has primary responsibility for the investments of the Fund. He has final authority over all aspects of the Fund’s investment portfolio, including but not limited to, purchases and sales of individual securities, portfolio risk assessment, and the management of daily cash balances in accordance with anticipated investment management requirements. The degree to which he may perform these functions, and the nature of these functions, may change from time to time. He joined Franklin Templeton Investments in 2010. Prior to joining Franklin Templeton Investments, he was President and portfolio manager of Colony Investment Management. He previously was a portfolio manager at Goldman Sachs Asset Management and Grantham Mayo Van Otterloo (GMO) and an investor at AEW Capital Management. |
| |
DANIEL PETTERSSON
Portfolio Manager and Research Analyst of FT Institutional | | Mr. Pettersson has been a portfolio manager of the Fund since September 2014, providing research and advice on the purchases and sales of individual securities, and portfolio risk assessment. Prior to joining Franklin Templeton in 2006, Mr. Pettersson’s real estate experience included his work at JM AB, a Swedish real estate developer located in Stockholm and a public company listed on the Nordic Stock Exchange. |
Please keep this supplement with your prospectus for future reference.
FRANKLIN TEMPLETON VARIABLE INSURANCE PRODUCTS TRUST
Financial Highlights
Franklin Global Real Estate VIP Fund
| | | | | | | | | | | | | | | | | | | | |
| | | Year Ended December 31, | |
| | | 2014 | | | 2013 | | | 2012 | | | 2011 | | | 2010 | |
| Class 1 | | | | | | | | | | | | | | | | | | | | |
Per share operating performance
(for a share outstanding throughout the year) | | | | | | | | | | | | | | | | | | | | |
| | | | | |
Net asset value, beginning of year | | | $14.29 | | | | $14.66 | | | | $11.47 | | | | $13.12 | | | | $11.16 | |
| | | | |
| | | | | |
| Income from investment operationsa: | | | | | | | | | | | | | | | | | | | | |
| | | | | |
Net investment incomeb | | | 0.26 | | | | 0.24 | | | | 0.25 | | | | 0.21 | | | | 0.38 | |
| | | | | |
Net realized and unrealized gains (losses) | | | 1.92 | | | | 0.13 | | | | 2.94 | | | | (0.83 | ) | | | 1.94 | |
| | | | |
Total from investment operations | | | 2.18 | | | | 0.37 | | | | 3.19 | | | | (0.62 | ) | | | 2.32 | |
| | | | |
Less distributions from net investment income and net foreign currency gains | | | (0.11 | ) | | | (0.74 | ) | | | — | | | | (1.03 | ) | | | (0.36 | ) |
| | | | |
Net asset value, end of year | | | $16.36 | | | | $14.29 | | | | $14.66 | | | | $11.47 | | | | $13.12 | |
| | | | |
| | | | | |
Total returnc | | | 15.27% | | | | 2.61% | | | | 27.81% | | | | (5.45)% | | | | 21.24% | |
| | | | | |
| Ratios to average net assets | | | | | | | | | | | | | | | | | | | | |
| | | | | |
Expenses before waiver and payments by affiliates | | | 1.10% | | | | 1.10% | | | | 1.11% | | | | 1.12% | | | | 1.11% | |
| | | | | |
Expenses net of waiver and payments by affiliates | | | 1.10% | d | | | 1.10% | | | | 1.07% | | | | 0.98% | | | | 0.86% | |
| | | | | |
Net investment income | | | 1.66% | | | | 1.62% | | | | 1.92% | | | | 1.64% | | | | 3.24% | |
| | | | | |
| Supplemental data | | | | | | | | | | | | | | | | | | | | |
| | | | | |
Net assets, end of year (000’s) | | | $35,686 | | | | $34,276 | | | | $38,329 | | | | $33,670 | | | | $40,430 | |
| | | | | |
Portfolio turnover rate | | | 16.67% | | | | 21.29% | | | | 22.29% | | | | 28.95% | | | | 76.52% | |
aThe amount shown for a share outstanding throughout the period may not correlate with the Statement of Operations for the period due to the timing of sales and repurchases of the Fund shares in relation to income earned and/or fluctuating fair value of the investments of the Fund.
bBased on average daily shares outstanding.
cTotal return does not include fees, charges or expenses imposed by the variable annuity and life insurance contracts for which Franklin Templeton Variable Insurance Products Trust serves as an underlying investment vehicle.
dBenefit of expense reduction rounds to less than 0.01%.
| | | | |
| | | The accompanying notes are an integral part of these financial statements. | Annual Report | | FGR-7 |
FRANKLIN TEMPLETON VARIABLE INSURANCE PRODUCTS TRUST
FINANCIAL HIGHLIGHTS
Franklin Global Real Estate VIP Fund (continued)
| | | | | | | | | | | | | | | | | | | | |
| | | Year Ended December 31, | |
| | | 2014 | | | 2013 | | | 2012 | | | 2011 | | | 2010 | |
| Class 2 | | | | | | | | | | | | | | | | | | | | |
Per share operating performance
(for a share outstanding throughout the year) | | | | | | | | | | | | | | | | | | | | |
| | | | | |
Net asset value, beginning of year | | | $13.93 | | | | $14.27 | | | | $11.20 | | | | $12.83 | | | | $10.92 | |
| | | | |
| | | | | |
| Income from investment operationsa: | | | | | | | | | | | | | | | | | | | | |
| | | | | |
Net investment incomeb | | | 0.21 | | | | 0.20 | | | | 0.21 | | | | 0.17 | | | | 0.34 | |
| | | | | |
Net realized and unrealized gains (losses) | | | 1.88 | | | | 0.13 | | | | 2.86 | | | | (0.81 | ) | | | 1.90 | |
| | | | |
Total from investment operations | | | 2.09 | | | | 0.33 | | | | 3.07 | | | | (0.64 | ) | | | 2.24 | |
| | | | |
Less distributions from net investment income and net foreign currency gains | | | (0.07 | ) | | | (0.67 | ) | | | — | | | | (0.99 | ) | | | (0.33 | ) |
| | | | |
Net asset value, end of year | | | $15.95 | | | | $13.93 | | | | $14.27 | | | | $11.20 | | | | $12.83 | |
| | | | |
| | | | | |
Total returnc | | | 15.01% | | | | 2.32% | | | | 27.41% | | | | (5.65)% | | | | 20.97% | |
| | | | | |
| Ratios to average net assets | | | | | | | | | | | | | | | | | | | | |
| | | | | |
Expenses before waiver and payments by affiliates | | | 1.35% | | | | 1.35% | | | | 1.36% | | | | 1.37% | | | | 1.36% | |
| | | | | |
Expenses net of waiver and payments by affiliates | | | 1.35% | d | | | 1.35% | | | | 1.32% | | | | 1.23% | | | | 1.11% | |
| | | | | |
Net investment income | | | 1.41% | | | | 1.37% | | | | 1.67% | | | | 1.39% | | | | 2.99% | |
| | | | | |
| Supplemental data | | | | | | | | | | | | | | | | | | | | |
| | | | | |
Net assets, end of year (000’s) | | | $333,554 | | | | $328,825 | | | | $344,044 | | | | $292,356 | | | | $352,854 | |
| | | | | |
Portfolio turnover rate | | | 16.67% | | | | 21.29% | | | | 22.29% | | | | 28.95% | | | | 76.52% | |
aThe amount shown for a share outstanding throughout the period may not correlate with the Statement of Operations for the period due to the timing of sales and repurchases of the Fund shares in relation to income earned and/or fluctuating fair value of the investments of the Fund.
bBased on average daily shares outstanding.
cTotal return does not include fees, charges or expenses imposed by the variable annuity and life insurance contracts for which Franklin Templeton Variable Insurance Products Trust serves as an underlying investment vehicle.
dBenefit of expense reduction rounds to less than 0.01%.
| | | | |
| FGR-8 | | Annual Report | The accompanying notes are an integral part of these financial statements. | | |
FRANKLIN TEMPLETON VARIABLE INSURANCE PRODUCTS TRUST
Statement of Investments, December 31, 2014
| | | | | | | | | | | | | | |
| Franklin Global Real Estate VIP Fund | | | | | | | | | |
| | | | | Country | | | Shares/Warrants | | | Value | |
| | Common Stocks and Other Equity Interests 98.7% | | | | | | | | | | | | |
| | Diversified Real Estate Activities 10.8% | | | | | | | | | | | | |
| | CapitaLand Ltd. | | | Singapore | | | | 907,262 | | | $ | 2,266,785 | |
| | Hang Lung Properties Ltd. | | | Hong Kong | | | | 493,248 | | | | 1,383,572 | |
| | Mitsubishi Estate Co. Ltd. | | | Japan | | | | 426,360 | | | | 9,092,952 | |
| | Mitsui Fudosan Co. Ltd. | | | Japan | | | | 502,857 | | | | 13,659,917 | |
| | Sun Hung Kai Properties Ltd. | | | Hong Kong | | | | 355,533 | | | | 5,424,275 | |
| | Sun Hung Kai Properties Ltd., wts., 4/22/16 | | | Hong Kong | | | | 31,044 | | | | 78,471 | |
| | Tokyo Tatemono Co. Ltd. | | | Japan | | | | 512,815 | | | | 3,770,415 | |
| | The Wharf Holdings Ltd. | | | Hong Kong | | | | 605,906 | | | | 4,375,929 | |
| | | | | | | | | | | | | | |
| | | | | | | | | | | | | 40,052,316 | |
| | | | | | | | | | | | | | |
| | Diversified REITs 13.6% | | | | | | | | | | | | |
| a | | Activia Properties Inc., 144A | | | Japan | | | | 245 | | | | 2,138,702 | |
| | American Assets Trust Inc. | | | United States | | | | 66,239 | | | | 2,636,974 | |
| | British Land Co. PLC | | | United Kingdom | | | | 384,031 | | | | 4,651,037 | |
| | Canadian REIT | | | Canada | | | | 55,414 | | | | 2,185,065 | |
| | Hulic REIT Inc. | | | Japan | | | | 565 | | | | 858,640 | |
| a | | Hulic REIT Inc., 144A | | | Japan | | | | 1,157 | | | | 1,758,312 | |
| | Kenedix Office Investment Corp. | | | Japan | | | | 561 | | | | 3,169,597 | |
| | Land Securities Group PLC | | | United Kingdom | | | | 331,681 | | | | 5,981,588 | |
| | Liberty Property Trust | | | United States | | | | 27,106 | | | | 1,019,999 | |
| | Mirvac Group | | | Australia | | | | 1,595,249 | | | | 2,318,487 | |
| | Spirit Realty Capital Inc. | | | United States | | | | 147,700 | | | | 1,756,153 | |
| | Stockland | | | Australia | | | | 1,183,856 | | | | 3,982,468 | |
| | Suntec REIT | | | Singapore | | | | 1,481,730 | | | | 2,192,173 | |
| | TF Administradora Industrial S de RL de CV | | | Mexico | | | | 402,000 | | | | 843,475 | |
| a | | TF Administradora Industrial S de RL de CV, 144A | | | Mexico | | | | 371,070 | | | | 778,578 | |
| | Vornado Realty Trust | | | United States | | | | 71,768 | | | | 8,447,811 | |
| | Wereldhave NV | | | Netherlands | | | | 40,988 | | | | 2,826,942 | |
| | WP Carey Inc. | | | United States | | | | 37,226 | | | | 2,609,543 | |
| | | | | | | | | | | | | | |
| | | | | | | | | | | | | 50,155,544 | |
| | | | | | | | | | | | | | |
| | Health Care REITs 6.1% | | | | | | | | | | | | |
| | HCP Inc. | | | United States | | | | 152,241 | | | | 6,703,171 | |
| | Health Care REIT Inc. | | | United States | | | | 106,264 | | | | 8,040,997 | |
| | Sabra Health Care REIT Inc. | | | United States | | | | 58,426 | | | | 1,774,398 | |
| | Senior Housing Properties Trust | | | United States | | | | 79,482 | | | | 1,757,347 | |
| | Ventas Inc. | | | United States | | | | 59,987 | | | | 4,301,068 | |
| | | | | | | | | | | | | | |
| | | | | | | | | | | | | 22,576,981 | |
| | | | | | | | | | | | | | |
| | Hotel & Resort REITs 4.1% | | | | | | | | | | | | |
| | Hoshino Resorts REIT Inc. | | | Japan | | | | 89 | | | | 939,578 | |
| | Host Hotels & Resorts Inc. | | | United States | | | | 319,167 | | | | 7,586,600 | |
| | Pebblebrook Hotel Trust | | | United States | | | | 101,522 | | | | 4,632,449 | |
| | Sunstone Hotel Investors Inc. | | | United States | | | | 110,427 | | | | 1,823,150 | |
| | | | | | | | | | | | | | |
| | | | | | | | | | | | | 14,981,777 | |
| | | | | | | | | | | | | | |
| | Hotels, Resorts & Cruise Lines 0.5% | | | | | | | | | | | | |
| | Melia Hotels International SA | | | Spain | | | | 73,548 | | | | 788,478 | |
| | Starwood Hotels & Resorts Worldwide Inc. | | | United States | | | | 14,624 | | | | 1,185,568 | |
| | | | | | | | | | | | | | |
| | | | | | | | | | | | | 1,974,046 | |
| | | | | | | | | | | | | | |
| | Industrial REITs 6.3% | | | | | | | | | | | | |
| | Ascendas REIT | | | Singapore | | | | 674,308 | | | | 1,211,392 | |
FRANKLIN TEMPLETON VARIABLE INSURANCE PRODUCTS TRUST
STATEMENT OF INVESTMENTS
Franklin Global Real Estate VIP Fund (continued)
| | | | | | | | | | | | | | |
| | | | | Country | | | Shares/Warrants | | | Value | |
| | Common Stocks and Other Equity Interests (continued) | | | | | | | | | | | | |
| | Industrial REITs (continued) | | | | | | | | | | | | |
| a | | Ascendas REIT, 144A | | | Singapore | | | | 149,961 | | | $ | 269,404 | |
| | First Industrial Realty Trust Inc. | | | United States | | | | 54,300 | | | | 1,116,408 | |
| a | | GLP J-REIT, 144A | | | Japan | | | | 941 | | | | 1,049,177 | |
| | Goodman Group | | | Australia | | | | 918,259 | | | | 4,266,126 | |
| | Mapletree Logistics Trust | | | Singapore | | | | 1,845,530 | | | | 1,650,780 | |
| | Nippon Prologis REIT Inc. | | | Japan | | | | 731 | | | | 1,589,807 | |
| a | | Nippon Prologis REIT Inc., 144A | | | Japan | | | | 842 | | | | 1,831,214 | |
| | Prologis Inc. | | | United States | | | | 184,164 | | | | 7,924,577 | |
| | STAG Industrial Inc. | | | United States | | | | 93,052 | | | | 2,279,774 | |
| | | | | | | | | | | | | | |
| | | | | | | | | | | | | 23,188,659 | |
| | | | | | | | | | | | | | |
| | Office REITs 11.8% | | | | | | | | | | | | |
| | Alexandria Real Estate Equities Inc. | | | United States | | | | 45,807 | | | | 4,064,913 | |
| | Boston Properties Inc. | | | United States | | | | 59,480 | | | | 7,654,481 | |
| | Brandywine Realty Trust | | | United States | | | | 166,046 | | | | 2,653,415 | |
| | Coresite Realty Corp. | | | United States | | | | 16,287 | | | | 636,008 | |
| | Derwent London PLC | | | United Kingdom | | | | 78,599 | | | | 3,697,420 | |
| | Digital Realty Trust Inc. | | | United States | | | | 53,043 | | | | 3,516,751 | |
| | Douglas Emmett Inc. | | | United States | | | | 63,067 | | | | 1,791,103 | |
| | Great Portland Estates PLC | | | United Kingdom | | | | 325,126 | | | | 3,739,991 | |
| | Highwoods Properties Inc. | | | United States | | | | 58,017 | | | | 2,568,993 | |
| | Japan Real Estate Investment Corp. | | | Japan | | | | 490 | | | | 2,371,792 | |
| | Kilroy Realty Corp. | | | United States | | | | 65,218 | | | | 4,504,607 | |
| b | | Paramount Group Inc. | | | United States | | | | 57,190 | | | | 1,063,162 | |
| | SL Green Realty Corp. | | | United States | | | | 43,793 | | | | 5,212,243 | |
| | | | | | | | | | | | | | |
| | | | | | | | | | | | | 43,474,879 | |
| | | | | | | | | | | | | | |
| | Real Estate Development 2.0% | | | | | | | | | | | | |
| | China Overseas Land & Investment Ltd. | | | China | | | | 274,657 | | | | 818,238 | |
| b | | Howard Hughes Corp. | | | United States | | | | 11,076 | | | | 1,444,532 | |
| | Keppel Land Ltd. | | | Singapore | | | | 766,676 | | | | 1,979,191 | |
| | KWG Property Holdings Ltd. | | | China | | | | 1,587,500 | | | | 1,087,140 | |
| | Sino Land Co. Ltd. | | | Hong Kong | | | | 1,398,288 | | | | 2,243,334 | |
| | | | | | | | | | | | | | |
| | | | | | | | | | | | | 7,572,435 | |
| | | | | | | | | | | | | | |
| | Real Estate Operating Companies 7.2% | | | | | | | | | | | | |
| | Castellum AB | | | Sweden | | | | 98,780 | | | | 1,546,465 | |
| | Deutsche Euroshop AG | | | Germany | | | | 35,837 | | | | 1,569,515 | |
| a | | Deutsche Euroshop AG, 144A | | | Germany | | | | 8,669 | | | | 379,667 | |
| b | | Gagfah SA | | | Germany | | | | 124,840 | | | | 2,794,543 | |
| a,b | | Gagfah SA, 144A | | | Germany | | | | 18,450 | | | | 413,003 | |
| | Global Logistic Properties Ltd. | | | Singapore | | | | 1,562,170 | | | | 2,924,352 | |
| b | | Hemfosa Fastigheter AB | | | Sweden | | | | 38,720 | | | | 819,172 | |
| a,b | | Hemfosa Fastigheter AB, 144A | | | Sweden | | | | 40,020 | | | | 846,675 | |
| a,b | | Hispania Activos Inmobiliarios SAU, 144A | | | Spain | | | | 36,062 | | | | 473,004 | |
| | Hong Kong Land Holdings Ltd. | | | Hong Kong | | | | 871,843 | | | | 5,893,659 | |
| | Hufvudstaden AB, A | | | Sweden | | | | 166,066 | | | | 2,163,366 | |
| | Hysan Development Co. Ltd. | | | Hong Kong | | | | 525,347 | | | | 2,347,613 | |
| | LEG Immobilien AG | | | Germany | | | | 5,990 | | | | 449,297 | |
| a | | LEG Immobilien AG, 144A | | | Germany | | | | 34,710 | | | | 2,603,524 | |
| | Unite Group PLC | | | United Kingdom | | | | 176,195 | | | | 1,277,053 | |
| a | | Unite Group PLC, 144A | | | United Kingdom | | | | 9,824 | | | | 71,204 | |
| | | | | | | | | | | | | | |
| | | | | | | | | | | | | 26,572,112 | |
| | | | | | | | | | | | | | |
FRANKLIN TEMPLETON VARIABLE INSURANCE PRODUCTS TRUST
STATEMENT OF INVESTMENTS
Franklin Global Real Estate VIP Fund (continued)
| | | | | | | | | | | | | | |
| | | | | Country | | | Shares/Warrants | | | Value | |
| | Common Stocks and Other Equity Interests (continued) | | | | | | | | | | | | |
| | Residential REITs 9.4% | | | | | | | | | | | | |
| | Apartment Investment & Management Co., A | | | United States | | | | 99,605 | | | $ | 3,700,326 | |
| | AvalonBay Communities Inc. | | | United States | | | | 30,267 | | | | 4,945,325 | |
| | Boardwalk REIT | | | Canada | | | | 25,536 | | | | 1,353,271 | |
| | Camden Property Trust | | | United States | | | | 17,121 | | | | 1,264,215 | |
| | Education Realty Trust Inc. | | | United States | | | | 23,166 | | | | 847,644 | |
| | Equity Lifestyle Properties Inc. | | | United States | | | | 59,200 | | | | 3,051,760 | |
| | Equity Residential | | | United States | | | | 107,228 | | | | 7,703,259 | |
| | Essex Property Trust Inc. | | | United States | | | | 26,805 | | | | 5,537,913 | |
| | Invincible Investment Corp. | | | Japan | | | | 2,175 | | | | 913,019 | |
| | Post Properties Inc. | | | United States | | | | 26,488 | | | | 1,556,700 | |
| | UDR Inc. | | | United States | | | | 120,131 | | | | 3,702,437 | |
| | | | | | | | | | | | | | |
| | | | | | | | | | | | | 34,575,869 | |
| | | | | | | | | | | | | | |
| | Retail REITs 23.3% | | | | | | | | | | | | |
| | CapitaMall Trust | | | Singapore | | | | 403,279 | | | | 620,991 | |
| | DDR Corp. | | | United States | | | | 148,216 | | | | 2,721,246 | |
| | Eurocommercial Properties NV, IDR | | | Netherlands | | | | 36,385 | | | | 1,548,389 | |
| | Federal Realty Investment Trust | | | United States | | | | 25,809 | | | | 3,444,469 | |
| | Federation Centres | | | Australia | | | | 786,410 | | | | 1,842,838 | |
| | General Growth Properties Inc. | | | United States | | | | 236,317 | | | | 6,647,597 | |
| | Hammerson PLC | | | United Kingdom | | | | 430,353 | | | | 4,058,287 | |
| | Kimco Realty Corp. | | | United States | | | | 80,969 | | | | 2,035,561 | |
| | Klepierre | | | France | | | | 87,700 | | | | 3,791,560 | |
| | The Link REIT | | | Hong Kong | | | | 908,788 | | | | 5,684,357 | |
| | The Macerich Co. | | | United States | | | | 46,564 | | | | 3,883,903 | |
| | Realty Income Corp. | | | United States | | | | 37,503 | | | | 1,789,268 | |
| | Regency Centers Corp. | | | United States | | | | 52,093 | | | | 3,322,492 | |
| | RioCan REIT | | | Canada | | | | 96,726 | | | | 2,201,480 | |
| b | | Scentre Group | | | Australia | | | | 1,369,991 | | | | 3,915,092 | |
| | Simon Property Group Inc. | | | United States | | | | 101,908 | | | | 18,558,466 | |
| | Taubman Centers Inc. | | | United States | | | | 36,682 | | | | 2,803,238 | |
| | Unibail-Rodamco SE | | | France | | | | 43,004 | | | | 11,075,615 | |
| | Weingarten Realty Investors | | | United States | | | | 77,310 | | | | 2,699,665 | |
| | Westfield Corp. | | | Australia | | | | 474,554 | | | | 3,495,010 | |
| | | | | | | | | | | | | | |
| | | | | | | | | | | | | 86,139,524 | |
| | | | | | | | | | | | | | |
| | Specialized REITs 3.6% | | | | | | | | | | | | |
| | CubeSmart | | | United States | | | | 118,584 | | | | 2,617,149 | |
| | Extra Space Storage Inc. | | | United States | | | | 65,504 | | | | 3,841,154 | |
| | Public Storage | | | United States | | | | 36,014 | | | | 6,657,188 | |
| | | | | | | | | | | | | | |
| | | | | | | | | | | | | 13,115,491 | |
| | | | | | | | | | | | | | |
| | | | |
| | Total Common Stocks and Other Equity Interests
(Cost $225,114,001) | | | | | | | | | | | 364,379,633 | |
| | | | | | | | | | | | | | |
FRANKLIN TEMPLETON VARIABLE INSURANCE PRODUCTS TRUST
STATEMENT OF INVESTMENTS
Franklin Global Real Estate VIP Fund (continued)
| | | | | | | | | | | | | | |
| | | | | Country | | | Principal Amount | | | Value | |
| | Short Term Investments (Cost $4,298,066) 1.1% | | | | | | | | | | | | |
| | Repurchase Agreements 1.1% | | | | | | | | | | | | |
| c | | Joint Repurchase Agreement, 0.057%, 1/02/15 (Maturity Value $4,298,080) | | | United States | | | $ | 4,298,066 | | | $ | 4,298,066 | |
| | BNP Paribas Securities Corp. (Maturity Value $362,199)
HSBC Securities (USA) Inc. (Maturity Value $2,994,172)
Merrill Lynch, Pierce, Fenner & Smith Inc. (Maturity Value $941,709) | | | | | | | | | | | | |
| | Collateralized by U.S. Government Agency Securities,
0.00% - 1.50%, 1/20/15 - 10/09/19; U.S. Government Agency
Securities, Strips, 6/01/17; and U.S. Treasury
Notes, 1.625% - 4.50%, 11/15/15 - 11/30/20 (valued at $4,384,569). | | | | | | | | | | | | |
| | | | | | | | | | | | | | |
| | Total Investments (Cost $229,412,067) 99.8% | | | | | | | | | | | 368,677,699 | |
| | Other Assets, less Liabilities 0.2% | | | | | | | | | | | 562,380 | |
| | | | | | | | | | | | | | |
| | Net Assets 100.0% | | | | | | | | | | $ | 369,240,079 | |
| | | | | | | | | | | | | | |
See Abbreviations on page FGR-22.
aSecurity was purchased pursuant to Rule 144A under the Securities Act of 1933 and may be sold in transactions exempt from registration only to qualified institutional buyers or in a public offering registered under the Securities Act of 1933. These securities have been deemed liquid under guidelines approved by the Trust’s Board of Trustees. At December 31, 2014, the aggregate value of these securities was $12,612,464, representing 3.42% of net assets.
bNon-income producing.
cSee Note 1(c) regarding joint repurchase agreement.
| | | | |
| FGR-12 | | Annual Report | The accompanying notes are an integral part of these financial statements. | | |
FRANKLIN TEMPLETON VARIABLE INSURANCE PRODUCTS TRUST
Financial Statements
Statement of Assets and Liabilities
December 31, 2014
| | | | |
| | | Franklin Global
Real Estate
VIP Fund | |
Assets: | | | | |
Investments in securities: | | | | |
Cost - Unaffiliated issuers | | $ | 225,114,001 | |
Cost - Repurchase agreements | | | 4,298,066 | |
| | | | |
Total cost of investments | | $ | 229,412,067 | |
| | | | |
Value - Unaffiliated issuers | | $ | 364,379,633 | |
Value - Repurchase agreements | | | 4,298,066 | |
| | | | |
Total value of investments | | | 368,677,699 | |
Foreign currency, at value (cost $11,917) | | | 11,328 | |
Receivables: | | | | |
Investment securities sold | | | 257,447 | |
Capital shares sold | | | 14,841 | |
Dividends | | | 1,325,756 | |
Other assets | | | 31 | |
| | | | |
Total assets | | | 370,287,102 | |
| | | | |
Liabilities: | | | | |
Payables: | | | | |
Capital shares redeemed | | | 430,970 | |
Management fees | | | 330,716 | |
Distribution fees | | | 140,123 | |
Reports to shareholders | | | 84,328 | |
Accrued expenses and other liabilities | | | 60,886 | |
| | | | |
Total liabilities | | | 1,047,023 | |
| | | | |
Net assets, at value | | $ | 369,240,079 | |
| | | | |
Net assets consist of: | | | | |
Paid-in capital | | $ | 559,833,081 | |
Undistributed net investment income | | | 4,016,887 | |
Net unrealized appreciation (depreciation) | | | 139,257,782 | |
Accumulated net realized gain (loss) | | | (333,867,671 | ) |
| | | | |
Net assets, at value | | $ | 369,240,079 | |
| | | | |
| |
| Class 1: | | | | |
Net assets, at value | | $ | 35,685,856 | |
| | | | |
Shares outstanding | | | 2,181,671 | |
| | | | |
Net asset value and maximum offering price per share | | $ | 16.36 | |
| | | | |
| |
| Class 2: | | | | |
Net assets, at value | | $ | 333,554,223 | |
| | | | |
Shares outstanding | | | 20,915,975 | |
| | | | |
Net asset value and maximum offering price per share | | $ | 15.95 | |
| | | | |
| | | | |
| | | The accompanying notes are an integral part of these financial statements. | Annual Report | | FGR-13 |
FRANKLIN TEMPLETON VARIABLE INSURANCE PRODUCTS TRUST
FINANCIAL STATEMENTS
Statement of Operations
for the year ended December 31, 2014
| | | | |
| | | Franklin Global
Real Estate
VIP Fund | |
Investment income: | | | | |
Dividends (net of foreign taxes of $416,344) | | $ | 10,212,049 | |
Interest | | | 1,529 | |
Income from securities loaned | | | 3,090 | |
| | | | |
Total investment income | | | 10,216,668 | |
| | | | |
Expenses: | | | | |
Management fees (Note 3a) | | | 3,877,416 | |
Distribution fees - Class 2 (Note 3c) | | | 834,583 | |
Custodian fees (Note 4) | | | 31,311 | |
Reports to shareholders | | | 85,951 | |
Professional fees | | | 65,009 | |
Trustees’ fees and expenses | | | 1,454 | |
Other | | | 18,118 | |
| | | | |
Total expenses | | | 4,913,842 | |
Expense reductions (Note 4) | | | (9 | ) |
| | | | |
Net expenses | | | 4,913,833 | |
| | | | |
Net investment income | | | 5,302,835 | |
| | | | |
Realized and unrealized gains (losses): | | | | |
Net realized gain (loss) from: | | | | |
Investments | | | 18,798,711 | |
Realized gain distributions from REITs | | | 1,145,225 | |
Foreign currency transactions | | | (136,943 | ) |
| | | | |
Net realized gain (loss) | | | 19,806,993 | |
| | | | |
Net change in unrealized appreciation (depreciation) on: | | | | |
Investments | | | 26,403,638 | |
Translation of other assets and liabilities denominated in foreign currencies | | | (4,557 | ) |
| | | | |
Net change in unrealized appreciation (depreciation) | | | 26,399,081 | |
| | | | |
Net realized and unrealized gain (loss) | | | 46,206,074 | |
| | | | |
Net increase (decrease) in net assets resulting from operations | | $ | 51,508,909 | |
| | | | |
| | | | |
| FGR-14 | | Annual Report | The accompanying notes are an integral part of these financial statements. | | |
FRANKLIN TEMPLETON VARIABLE INSURANCE PRODUCTS TRUST
FINANCIAL STATEMENTS
Statements of Changes in Net Assets
| | | | | | | | |
| | | Franklin Global Real Estate VIP Fund | |
| | | Year Ended December 31, | |
| | | 2014 | | | 2013 | |
Increase (decrease) in net assets: | | | | | | | | |
Operations: | | | | | | | | |
Net investment income | | $ | 5,302,835 | | | $ | 5,357,758 | |
Net realized gain (loss) from investments, realized gain distributions from REITs and foreign currency transactions | | | 19,806,993 | | | | 16,305,580 | |
Net change in unrealized appreciation (depreciation) on investments, translation of other assets and liabilities denominated in foreign currencies and deferred taxes | | | 26,399,081 | | | | (13,068,801 | ) |
| | | | |
Net increase (decrease) in net assets resulting from operations | | | 51,508,909 | | | | 8,594,537 | |
| | | | |
Distributions to shareholders from: | | | | | | | | |
Net investment income: | | | | | | | | |
Class 1 | | | (245,080 | ) | | | (1,817,696 | ) |
Class 2 | | | (1,512,651 | ) | | | (15,833,743 | ) |
| | | | |
Total distributions to shareholders | | | (1,757,731 | ) | | | (17,651,439 | ) |
| | | | |
Capital share transactions: (Note 2) | | | | | | | | |
Class 1 | | | (3,375,482 | ) | | | (3,263,237 | ) |
Class 2 | | | (40,236,768 | ) | | | (6,951,491 | ) |
| | | | |
Total capital share transactions | | | (43,612,250 | ) | | | (10,214,728 | ) |
| | | | |
Net increase (decrease) in net assets | | | 6,138,928 | | | | (19,271,630 | ) |
Net assets: | | | | | | | | |
Beginning of year | | | 363,101,151 | | | | 382,372,781 | |
| | | | |
End of year | | $ | 369,240,079 | | | $ | 363,101,151 | |
| | | | |
Undistributed net investment income (distributions in excess of net investment income) included in net assets: | | | | | | | | |
End of year | | $ | 4,016,887 | | | $ | (6,128,309 | ) |
| | | | |
| | | | |
| | | The accompanying notes are an integral part of these financial statements. | Annual Report | | FGR-15 |
FRANKLIN TEMPLETON VARIABLE INSURANCE PRODUCTS TRUST
Notes to Financial Statements
Franklin Global Real Estate VIP Fund
1. Organization and Significant Accounting Policies
Franklin Templeton Variable Insurance Products Trust (Trust) is registered under the Investment Company Act of 1940, as amended, (1940 Act) as an open-end management investment company, consisting of nineteen separate funds and applies the specialized accounting and reporting guidance in U.S. Generally Accepted Accounting Principles (U.S. GAAP). Franklin Global Real Estate VIP Fund (Fund) is included in this report. The financial statements of the remaining funds in the Trust are presented separately. Shares of the Fund are generally sold only to insurance company separate accounts to fund the benefits of variable life insurance policies or variable annuity contracts. At December 31, 2014, 58.74% of the Fund’s shares were held through one insurance company. Investment activities of these insurance company separate accounts could have a material impact on the Fund. The Fund offers two classes of shares: Class 1 and Class 2. Each class of shares differs by its distribution fees, voting rights on matters affecting a single class and its exchange privilege.
Effective May 1, 2014, Franklin Global Real Estate Securities Fund was renamed Franklin Global Real Estate VIP Fund.
The following summarizes the Fund’s significant accounting policies.
a. Financial Instrument Valuation
The Fund’s investments in financial instruments are carried at fair value daily. Fair value is the price that would be received to sell an asset or paid to transfer a liability in an orderly transaction between market participants on the measurement date. The Fund calculates the net asset value per share at the close of the New York Stock Exchange (NYSE), generally at 4 p.m. Eastern time (NYSE close) on each day the NYSE is open for trading. Under compliance policies and procedures approved by the Trust’s Board of Trustees (the Board), the Fund’s administrator has responsibility for oversight of valuation, including leading the cross-functional Valuation and Liquidity Oversight Committee (VLOC). The VLOC provides administration and oversight of the Fund’s valuation policies and procedures, which are approved annually by the Board. Among other things, these procedures allow the Fund to utilize independent pricing services, quotations from securities and financial instrument dealers, and other market sources to determine fair value.
Equity securities listed on an exchange or on the NASDAQ National Market System are valued at the last quoted sale price or the official closing price of the day, respectively. Foreign equity securities are valued as of the close of trading on the foreign stock exchange on which the security is primarily traded or as of the NYSE close, whichever is earlier. The value is then converted into its U.S. dollar equivalent at the foreign exchange rate in effect at the NYSE close on the day that the value of the security is determined. Over-the-counter (OTC) securities are valued within the range of the most recent quoted bid and ask prices. Securities that trade in multiple markets or on multiple exchanges are valued according to the broadest and most representative market. Certain equity securities are valued based upon fundamental characteristics or relationships to similar securities. Repurchase agreements are valued at cost, which approximates fair value.
The Fund has procedures to determine the fair value of financial instruments for which market prices are not reliable or readily available. Under these procedures, the VLOC convenes on a regular basis to review such financial instruments and considers a number of factors, including significant unobservable valuation inputs, when arriving at fair value. The VLOC primarily employs a market-based approach which may use related or comparable assets or liabilities, recent transactions, market multiples, book values, and other relevant information for the investment to determine the fair value of the investment. An income-based valuation approach may also be used in which the anticipated future cash flows of the investment are discounted to calculate fair value. Discounts may also be applied due to the nature or duration of any restrictions on the disposition of the investments. Due to the inherent uncertainty of valuations of such investments, the fair values may differ significantly from the values that would have been used had an active market existed. The VLOC employs various methods for calibrating these valuation approaches including a regular review of key inputs and assumptions, transactional back-testing or disposition analysis, and reviews of any related market activity.
Trading in securities on foreign securities stock exchanges and OTC markets may be completed before the daily NYSE close. In addition, trading in certain foreign markets may not take place on every NYSE business day. Occasionally, events occur between the time at which trading in a foreign security is completed and the close of the NYSE that might call into question the reliability of the value of a portfolio security held by the Fund. As a result, differences may arise between the value of
FRANKLIN TEMPLETON VARIABLE INSURANCE PRODUCTS TRUST
NOTES TO FINANCIAL STATEMENTS
Franklin Global Real Estate VIP Fund (continued)
the Fund’s portfolio securities as determined at the foreign market close and the latest indications of value at the close of the NYSE. In order to minimize the potential for these differences, the VLOC monitors price movements following the close of trading in foreign stock markets through a series of country specific market proxies (such as baskets of American Depositary Receipts, futures contracts and exchange traded funds). These price movements are measured against established trigger thresholds for each specific market proxy to assist in determining if an event has occurred that may call into question the reliability of the values of the foreign securities held by the Fund. If such an event occurs, the securities may be valued using fair value procedures, which may include the use of independent pricing services.
Also, when the last day of the reporting period is a non-business day, certain foreign markets may be open on those days that the NYSE is closed, which could result in differences between the value of the Fund’s portfolio securities on the last business day and the last calendar day of the reporting period. Any significant security valuation changes due to an open foreign market are adjusted and reflected by the Fund for financial reporting purposes.
b. Foreign Currency Translation
Portfolio securities and other assets and liabilities denominated in foreign currencies are translated into U.S. dollars based on the exchange rate of such currencies against U.S. dollars on the date of valuation. The Fund may enter into foreign currency exchange contracts to facilitate transactions denominated in a foreign currency. Purchases and sales of securities, income and expense items denominated in foreign currencies are translated into U.S. dollars at the exchange rate in effect on the transaction date. Portfolio securities and assets and liabilities denominated in foreign currencies contain risks that those currencies will decline in value relative to the U.S. dollar. Occasionally, events may impact the availability or reliability of foreign exchange rates used to convert the U.S. dollar equivalent value. If such an event occurs, the foreign exchange rate will be valued at fair value using procedures established and approved by the Board.
The Fund does not separately report the effect of changes in foreign exchange rates from changes in market prices on securities held. Such changes are included in net realized and unrealized gain or loss from investments on the Statement of Operations.
Realized foreign exchange gains or losses arise from sales of foreign currencies, currency gains or losses realized between the trade and settlement dates on securities transactions and the difference between the recorded amounts of dividends, interest, and foreign withholding taxes and the U.S. dollar equivalent of the amounts actually received or paid. Net unrealized foreign exchange gains and losses arise from changes in foreign exchange rates on foreign denominated assets and liabilities other than investments in securities held at the end of the reporting period.
c. Joint Repurchase Agreement
The Fund enters into a joint repurchase agreement whereby its uninvested cash balance is deposited into a joint cash account with other funds managed by the investment manager or an affiliate of the investment manager and is used to invest in one or more repurchase agreements. The value and face amount of the joint repurchase agreement are allocated to the funds based on their pro-rata interest. A repurchase agreement is accounted for as a loan by the Fund to the seller, collateralized by securities which are delivered to the Fund’s custodian. The fair value, including accrued interest, of the initial collateralization is required to be at least 102% of the dollar amount invested by the funds, with the value of the underlying securities marked to market daily to maintain coverage of at least 100%. Repurchase agreements are subject to the terms of Master Repurchase Agreements (MRAs) with approved counterparties (sellers). The MRAs contain various provisions, including but not limited to events of default and maintenance of collateral for repurchase agreements. In the event of default by either the seller or the Fund, certain MRAs may permit the non-defaulting party to net and close-out all transactions, if any, traded under such agreements. The Fund may sell securities it holds as collateral and apply the proceeds towards the repurchase price and any other amounts owed by the seller to the Fund in the event of default by the seller. This could involve costs or delays in addition to a loss on the securities if their value falls below the repurchase price owed by the seller. The joint repurchase agreement held by the Fund at year end, as indicated in the Statement of Investments, had been entered into on December 31, 2014.
d. Securities Lending
The Fund participates in an agency based securities lending program. The Fund receives cash collateral against the loaned securities in an amount equal to at least 102% of the fair value of the loaned securities. Collateral is maintained over the life of
FRANKLIN TEMPLETON VARIABLE INSURANCE PRODUCTS TRUST
NOTES TO FINANCIAL STATEMENTS
Franklin Global Real Estate VIP Fund (continued)
1. Organization and Significant Accounting Policies (continued)
d. Securities Lending (continued)
the loan in an amount not less than 100% of the fair value of loaned securities, as determined at the close of fund business each day; any additional collateral required due to changes in security values is delivered to the Fund on the next business day. The collateral is invested in a non-registered money fund. The Fund receives income from the investment of cash collateral, in addition to lending fees and rebates paid by the borrower. The Fund bears the market risk with respect to the collateral investment, securities loaned, and the risk that the agent may default on its obligations to the Fund. The securities lending agent has agreed to indemnify the Fund in the event of default by a third party borrower. At December 31, 2014, the Fund had no securities on loan.
e. Income and Deferred Taxes
It is the Fund’s policy to qualify as a regulated investment company under the Internal Revenue Code. The Fund intends to distribute to shareholders substantially all of its taxable income and net realized gains to relieve it from federal income and if applicable, excise taxes. As a result, no provision for U.S. federal income taxes is required.
The Fund may be subject to foreign taxation related to income received, capital gains on the sale of securities and certain foreign currency transactions in the foreign jurisdictions in which it invests. Foreign taxes, if any, are recorded based on the tax regulations and rates that exist in the foreign markets in which the Fund invests. When a capital gain tax is determined to apply the Fund records an estimated deferred tax liability in an amount that would be payable if the securities were disposed of on the valuation date. As a result of several court cases, in certain countries across the European Union, the Fund has filed additional tax reclaims for previously withheld taxes on dividends earned in those countries. These additional filings are subject to various administrative proceedings by the local jurisdictions’ tax authorities within the European Union, as well as a number of related judicial proceedings. At this time, uncertainty exists as to the ultimate resolution of these proceedings, the likelihood of receipt of these reclaims, and the potential timing of payment, and accordingly, no amounts are reflected in the financial statements.
The Fund recognizes the tax benefits of uncertain tax positions only when the position is “more likely than not” to be sustained
upon examination by the tax authorities based on the technical merits of the tax position. As of December 31, 2014, and for all open tax years, the Fund has determined that no liability for unrecognized tax benefits is required in the Fund’s financial statements related to uncertain tax positions taken on a tax return (or expected to be taken on future tax returns). Open tax years are those that remain subject to examination and are based on each tax jurisdiction statute of limitation.
f. Security Transactions, Investment Income, Expenses and Distributions
Security transactions are accounted for on trade date. Realized gains and losses on security transactions are determined on a specific identification basis. Interest income and estimated expenses are accrued daily. Dividend income is recorded on the ex-dividend date except for certain foreign securities where the dividend rate is not available. In such cases, the dividend is recorded as soon as the information is received by the Fund. Distributions to shareholders are recorded on the ex-dividend date and are determined according to income tax regulations (tax basis). Distributable earnings determined on a tax basis may differ from earnings recorded in accordance with U.S. GAAP. These differences may be permanent or temporary. Permanent differences are reclassified among capital accounts to reflect their tax character. These reclassifications have no impact on net assets or the results of operations. Temporary differences are not reclassified, as they may reverse in subsequent periods.
Common expenses incurred by the Trust are allocated among the funds based on the ratio of net assets of each fund to the combined net assets of the Trust. Fund specific expenses are charged directly to the fund that incurred the expense.
Realized and unrealized gains and losses and net investment income, not including class specific expenses, are allocated daily to each class of shares based upon the relative proportion of net assets of each class. Differences in per share distributions, by class, are generally due to differences in class specific expenses.
Distributions received by the Fund from certain securities may be a return of capital (ROC). Such distributions reduce the cost basis of the securities, and any distributions in excess of the cost basis are recognized as capital gains. For Real Estate Investment Trust (REIT) securities, the Fund records ROC estimates, if any, on the ex-dividend date and are adjusted once actual tax designations are known.
g. Accounting Estimates
The preparation of financial statements in accordance with U.S. GAAP requires management to make estimates and assumptions
FRANKLIN TEMPLETON VARIABLE INSURANCE PRODUCTS TRUST
NOTES TO FINANCIAL STATEMENTS
Franklin Global Real Estate VIP Fund (continued)
that affect the reported amounts of assets and liabilities at the date of the financial statements and the amounts of income and expenses during the reporting period. Actual results could differ from those estimates.
h. Guarantees and Indemnifications
Under the Trust’s organizational documents, its officers and trustees are indemnified by the Trust against certain liabilities
arising out of the performance of their duties to the Trust. Additionally, in the normal course of business, the Trust, on behalf of the Fund, enters into contracts with service providers that contain general indemnification clauses. The Trust’s maximum exposure under these arrangements is unknown as this would involve future claims that may be made against the Trust that have not yet occurred. Currently, the Trust expects the risk of loss to be remote.
2. Shares of Beneficial Interest
At December 31, 2014, there were an unlimited number of shares authorized (without par value). Transactions in the Fund’s shares were as follows:
| | | | | | | | | | | | | | | | | | |
| | | Year Ended December 31, | |
| | | 2014 | | | | | 2013 | |
| | | Shares | | | Amount | | | | | Shares | | | Amount | |
| | | | | |
| Class 1 Shares: | | | | | | | | | | | | | | | | | | |
Shares sold | | | 35,637 | | | $ | 504,194 | | | | | | 36,029 | | | $ | 545,808 | |
Shares issued in reinvestment of distributions | | | 15,710 | | | | 245,080 | | | | | | 127,468 | | | | 1,817,696 | |
Shares redeemed | | | (268,861 | ) | | | (4,124,756 | ) | | | | | (379,619 | ) | | | (5,626,741 | ) |
| | | | |
Net increase (decrease) | | | (217,514 | ) | | $ | (3,375,482 | ) | | | | | (216,122 | ) | | $ | (3,263,237 | ) |
| | | | |
| Class 2 Shares: | | | | | | | | | | | | | | | | | | |
Shares sold | | | 356,475 | | | $ | 5,291,990 | | | | | | 1,380,638 | | | $ | 20,243,191 | |
Shares issued in reinvestment of distributions | | | 99,321 | | | | 1,512,651 | | | | | | 1,136,665 | | | | 15,833,743 | |
Shares redeemed | | | (3,144,492 | ) | | | (47,041,409 | ) | | | | | (3,013,876 | ) | | | (43,028,425 | ) |
| | | | |
Net increase (decrease) | | | (2,688,696 | ) | | $ | (40,236,768 | ) | | | | | (496,573 | ) | | $ | (6,951,491 | ) |
| | | | |
3. Transactions With Affiliates
Franklin Resources, Inc. is the holding company for various subsidiaries that together are referred to as Franklin Templeton Investments. Certain officers and trustees of the Fund are also officers, and/or directors of the following subsidiaries:
| | |
| Subsidiary | | Affiliation |
Franklin Templeton Institutional, LLC (FT Institutional) | | Investment manager |
Franklin Templeton Services, LLC (FT Services) | | Administrative manager |
Franklin Templeton Distributors, Inc. (Distributors) | | Principal underwriter |
Franklin Templeton Investor Services, LLC (Investor Services) | | Transfer agent |
a. Management Fees
The Fund pays an investment management fee to FT Institutional based on the average daily net assets of the Fund as follows:
| | |
| Annualized Fee Rate | | Net Assets |
1.050% | | Up to and including $500 million |
0.950% | | Over $500 million, up to and including $1 billion |
0.900% | | Over $1 billion, up to and including $1.5 billion |
FRANKLIN TEMPLETON VARIABLE INSURANCE PRODUCTS TRUST
NOTES TO FINANCIAL STATEMENTS
Franklin Global Real Estate VIP Fund (continued)
3. Transactions With Affiliates (continued)
a. Management Fees (continued)
| | |
| Annualized Fee Rate | | Net Assets |
0.850% | | Over $1.5 billion, up to and including $6.5 billion |
0.830% | | Over $6.5 billion, up to and including $11.5 billion |
0.810% | | Over $11.5 billion, up to and including $16.5 billion |
0.790% | | Over $16.5 billion, up to and including $19 billion |
0.780% | | Over $19 billion, up to and including $21.5 billion |
0.770% | | In excess of $21.5 billion |
b. Administrative Fees
Under an agreement with FT Institutional, FT Services provides administrative services to the Fund. The fee is paid by FT Institutional based on the Fund’s average daily net assets, and is not an additional expense of the Fund.
c. Distribution Fees
The Board has adopted a distribution plan for Class 2 shares pursuant to Rule 12b-1 under the 1940 Act. Under the Fund’s compensation distribution plan, the Fund pays Distributors for costs incurred in connection with the servicing, sale and distribution of the Fund’s shares up to 0.35% per year of its average daily net assets of Class 2. Some distribution fees are not charged on shares held by affiliates. The Board has agreed to limit the current rate to 0.25% per year for Class 2. The plan year, for purposes of monitoring compliance with the maximum annual plan rates, is February 1 through January 31.
d. Transfer Agent Fees
Investor Services, under terms of an agreement, performs shareholder servicing for the Fund and is not paid by the Fund for the services.
4. Expense Offset Arrangement
The Fund has entered into an arrangement with its custodian whereby credits realized as a result of uninvested cash balances are used to reduce a portion of the Fund’s custodian expenses. During the year ended December 31, 2014, the custodian fees were reduced as noted in the Statement of Operations.
5. Income Taxes
For tax purposes, capital losses may be carried over to offset future capital gains. Capital loss carryforwards with no expiration, if any, must be fully utilized before those losses with expiration dates.
At December 31, 2014, capital loss carryforwards were as follows:
| | | | |
Capital loss carryforwards subject to expiration: | | | | |
2016 | | $ | 114,212,692 | |
2017 | | | 207,448,609 | |
2018 | | | 2,192,369 | |
| | | | |
Total capital loss carryforwards | | $ | 323,853,670 | |
| | | | |
During the year ended December 31, 2014, the Fund utilized $11,202,004 of capital loss carryforwards.
The tax character of distributions paid during the years ended December 31, 2014 and 2013, was as follows:
| | | | | | | | |
| | | 2014 | | | 2013 | |
Distributions paid from ordinary income | | $ | 1,766,355 | | | $ | 17,651,439 | |
| | | | |
FRANKLIN TEMPLETON VARIABLE INSURANCE PRODUCTS TRUST
NOTES TO FINANCIAL STATEMENTS
Franklin Global Real Estate VIP Fund (continued)
At December 31, 2014, the cost of investments, net unrealized appreciation (depreciation) and undistributed ordinary income for income tax purposes were as follows:
| | | | |
Cost of investments | | $ | 247,620,021 | |
| | | | |
Unrealized appreciation | | $ | 125,172,352 | |
Unrealized depreciation | | | (4,114,674 | ) |
| | | | |
Net unrealized appreciation (depreciation) | | $ | 121,057,678 | |
| | | | |
Distributable earnings - undistributed ordinary income | | $ | 12,210,590 | |
| | | | |
Differences between income and/or capital gains as determined on a book basis and a tax basis are primarily due to differing treatment of passive foreign investment company shares and wash sales.
6. Investment Transactions
Purchases and sales of investments (excluding short term securities) for the year ended December 31, 2014, aggregated $60,906,306 and $99,097,816, respectively.
7. Concentration of Risk
Investing in foreign securities may include certain risks and considerations not typically associated with investing in U.S. securities, such as fluctuating currency values and changing local and regional economic, political and social conditions, which may result in greater market volatility. In addition, certain foreign securities may not be as liquid as U.S. securities.
The Fund invests a large percentage of its total assets in REIT securities. Such concentration may subject the Fund to special risks associated with real estate securities. These securities may be more sensitive to economic or regulatory developments due to a variety of factors such as local, regional, national and global economic conditions, interest rates and tax considerations.
8. Credit Facility
The Fund, together with other U.S. registered and foreign investment funds (collectively, Borrowers), managed by Franklin Templeton Investments, are borrowers in a joint syndicated senior unsecured credit facility totaling $1.5 billion (Global Credit Facility) which matured on February 13, 2015. This Global Credit Facility provides a source of funds to the Borrowers for temporary and emergency purposes, including the ability to meet future unanticipated or unusually large redemption requests. The Borrowers expect to renew the Global Credit Facility for a total of $2 billion effective February 13, 2015, which matures on February 12, 2016.
Under the terms of the Global Credit Facility, the Fund shall, in addition to interest charged on any borrowings made by the Fund and other costs incurred by the Fund, pay its share of fees and expenses incurred in connection with the implementation and maintenance of the Global Credit Facility, based upon its relative share of the aggregate net assets of all of the Borrowers, including an annual commitment fee of 0.07% based upon the unused portion of the Global Credit Facility. These fees are reflected in other expenses on the Statement of Operations. During the year ended December 31, 2014, the Fund did not use the Global Credit Facility.
9. Fair Value Measurements
The Fund follows a fair value hierarchy that distinguishes between market data obtained from independent sources (observable inputs) and the Fund’s own market assumptions (unobservable inputs). These inputs are used in determining the value of the Fund’s financial instruments and are summarized in the following fair value hierarchy:
| | • | | Level 1 – quoted prices in active markets for identical financial instruments |
| | • | | Level 2 – other significant observable inputs (including quoted prices for similar financial instruments, interest rates, prepayment speed, credit risk, etc.) |
FRANKLIN TEMPLETON VARIABLE INSURANCE PRODUCTS TRUST
NOTES TO FINANCIAL STATEMENTS
Franklin Global Real Estate VIP Fund (continued)
9. Fair Value Measurements (continued)
| | • | | Level 3 – significant unobservable inputs (including the Fund’s own assumptions in determining the fair value of financial instruments) |
The input levels are not necessarily an indication of the risk or liquidity associated with financial instruments at that level.
For movements between the levels within the fair value hierarchy, the Fund has adopted a policy of recognizing the transfers as of the date of the underlying event which caused the movement.
A summary of inputs used as of December 31, 2014, in valuing the Fund’s assets carried at fair value, is as follows:
| | | | | | | | | | | | | | | | |
| | | Level 1 | | | Level 2 | | | Level 3 | | | Total | |
| | | | |
| Assets: | | | | | | | | | | | | | | | | |
Investments in Securities: | | | | | | | | | | | | | | | | |
Equity Investmentsa | | $ | 364,379,633 | | | $ | — | | | $ | — | | | $ | 364,379,633 | |
Short Term Investments | | | — | | | | 4,298,066 | | | | — | | | | 4,298,066 | |
| | | | |
Total Investments in Securities | | $ | 364,379,633 | | | $ | 4,298,066 | | | $ | — | | | $ | 368,677,699 | |
| | | | |
aFor detailed categories, see the accompanying Statement of Investments.
10. New Accounting Pronouncements
In June 2014, the Financial Accounting Standards Board issued Accounting Standards Update (ASU) No. 2014-11, Transfers and Servicing (Topic 860), Repurchase-to-Maturity Transactions, Repurchase Financings, and Disclosures. The ASU changes the accounting for certain repurchase agreements and expands disclosure requirements related to repurchase agreements, securities lending, repurchase-to-maturity and similar transactions. The ASU is effective for interim and annual reporting periods beginning after December 15, 2014. Management has reviewed the requirements and believes the adoption of this ASU will not have a material impact on the financial statements.
11. Subsequent Events
The Fund has evaluated subsequent events through the issuance of the financial statements and determined that no events have occurred that require disclosure other than those already disclosed in the financial statements.
Abbreviations
| | |
| Selected Portfolio |
| |
| IDR | | International Depositary Receipt |
| |
| REIT | | Real Estate Investment Trust |
FRANKLIN TEMPLETON VARIABLE INSURANCE PRODUCTS TRUST
Report of Independent Registered Public Accounting Firm
Franklin Global Real Estate VIP Fund
To the Board of Trustees and Shareholders of Franklin Templeton Variable Insurance Products Trust
In our opinion, the accompanying statement of assets and liabilities, including the statement of investments, and the related statements of operations and of changes in net assets and the financial highlights present fairly, in all material respects, the financial position of Franklin Global Real Estate VIP Fund (the “Fund”) at December 31, 2014, the results of its operations for the year then ended, the changes in its net assets for each of the two years in the period then ended and the financial highlights for each of the five years in the period then ended, in conformity with accounting principles generally accepted in the United States of America. These financial statements and financial highlights (hereafter referred to as “financial statements”) are the responsibility of the Fund’s management. Our responsibility is to express an opinion on these financial statements based on our audits. We conducted our audits of these financial statements in accordance with the standards of the Public Company Accounting Oversight Board (United States). Those standards require that we plan and perform the audit to obtain reasonable assurance about whether the financial statements are free of material misstatement. An audit includes examining, on a test basis, evidence supporting the amounts and disclosures in the financial statements, assessing the accounting principles used and significant estimates made by management, and evaluating the overall financial statement presentation. We believe that our audits, which included confirmation of securities at December 31, 2014 by correspondence with the custodian and brokers, provides a reasonable basis for our opinion.
PricewaterhouseCoopers LLP
San Francisco, California
February 13, 2015
FRANKLIN TEMPLETON VARIABLE INSURANCE PRODUCTS TRUST
Tax Information (unaudited)
Franklin Global Real Estate VIP Fund
Under Section 854(b)(1)(A) of the Internal Revenue Code, the Fund hereby reports 6.68% of the ordinary income dividends as income qualifying for the dividends received deduction for the fiscal year ended December 31, 2014.
Franklin Growth and Income VIP Fund
(Formerly, Franklin Growth and Income Securities Fund)
This annual report for Franklin Growth and Income VIP Fund covers the fiscal year ended December 31, 2014.
Class 2 Performance Summary as of December 31, 2014
Average annual total return of Class 2 shares represents the average annual change in value, assuming reinvestment of dividends and capital gains. Average returns smooth out variations in returns, which can be significant; they are not the same as year-by-year results.
| | | | | | | | | | | | |
| Periods ended 12/31/14 | | 1-Year | | | 5-Year | | | 10-Year | |
Average Annual Total Return | | | +9.14% | | | | +13.66% | | | | +6.12% | |
Performance reflects the Fund’s Class 2 operating expenses, but does not include any contract fees, expenses or sales charges. If they had been included, performance would be lower. These charges and deductions, particularly for variable life policies, can have a significant effect on contract values and insurance benefits. See the contract prospectus for a complete description of these expenses, including sales charges.
Performance data represent past performance, which does not guarantee future results. Investment return and principal value will fluctuate, and you may have a gain or loss when you sell your shares. Current performance may differ from figures shown.
Total Return Index Comparison for a Hypothetical $10,000 Investment (1/1/05–12/31/14)
The graph below shows the change in value of a hypothetical $10,000 investment in the Fund over the indicated period and includes reinvestment of any income or distributions. The Fund’s performance is compared to the performance of the Standard & Poor’s® 500 Index (S&P 500®), the Lipper VIP Equity Income Funds Classification Average and the Consumer Price Index (CPI). One cannot invest directly in an index, and an index is not representative of the Fund’s portfolio. Please see Important Notes to Performance Information preceding the Fund Summaries.
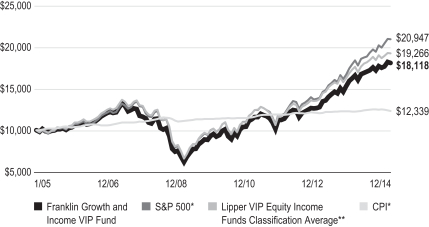
*Source: Morningstar. Please see Index Descriptions following the Fund Summaries.
**Source: Lipper, a Thomson Reuters Company. Please see Index Descriptions following the Fund Summaries.
FRANKLIN GROWTH AND INCOME VIP FUND
Fund Goals and Main Investments
Franklin Growth and Income VIP Fund seeks capital appreciation with current income as a secondary goal. Under normal market conditions, the Fund invests predominantly in equity securities, including securities convertible into common stock.
Fund Risks
All investments involve risks, including possible loss of principal. Stock prices fluctuate, sometimes rapidly and dramatically, due to factors affecting individual companies, particular industries or sectors, or general market conditions. Convertible securities are subject to the risks of stocks when the underlying stock price is high relative to the conversion price and debt securities when the underlying stock price is low relative to the conversion price. The Fund’s investment in foreign securities also involves special risks, including currency fluctuations and economic as well as political uncertainty. The Fund is actively managed but there is no guarantee that the manager’s investment decisions will produce the desired results. The Fund’s prospectus also includes a description of the main investment risks.
Performance Overview
You can find the Fund’s one-year total return in the Performance Summary. In comparison, the Fund’s benchmark, the Standard & Poor’s 500 Index (S&P 500), produced a +13.69% total return.1 The Fund’s peers as measured by the Lipper VIP Equity Income Funds Classification Average posted a +9.48% return for the same period.2
Economic and Market Overview
The U.S. economy continued to grow during the year ended December 31, 2014, underpinned in some quarters by manufacturing activity, consumer and business spending and federal defense spending. Home sales experienced some weakness resulting from reduced inventory, higher mortgage rates and tight credit requirements but began to recover in May as mortgage rates declined. Home prices stayed higher than a year earlier. Retail sales generally improved, supported by job growth and lower gasoline prices in the latter part of 2014. The unemployment rate declined to 5.6% in December 2014 from 6.7% in December 2013.3 Inflation, as measured by the Consumer Price Index, remained low.
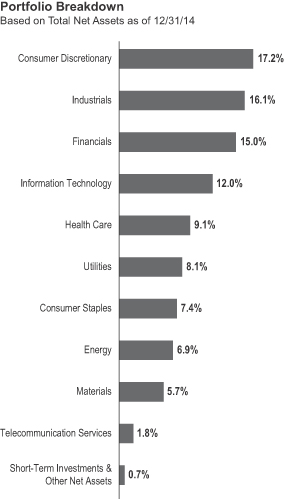
In January 2014, the U.S. Federal Reserve Board (Fed) began reducing its large-scale bond purchases $10 billion a month and ended the buying program in October. But it continued its practice of maintaining holdings of longer term securities at sizable levels. The Fed believed underlying economic strength could support ongoing progress in labor market conditions. The Fed also noted that although inflation might remain low in the near term, the likelihood of inflation running persistently below 2% had diminished. Toward period-end, the Fed stated that it could be patient with regard to raising interest rates and that the interest rate might not rise for at least a couple of meetings, possibly implying at least the first two meetings of 2015.
1. Source: Morningstar.
2. Source: Lipper, a Thomson Reuters Company.
One cannot invest directly in an index, and an index is not representative of the Fund’s portfolio. Please see Index Descriptions following the Fund Summaries.
3. Source: Bureau of Labor Statistics.
FRANKLIN GROWTH AND INCOME VIP FUND
Investor confidence grew during the period as corporate profits rose and the economy generally strengthened. The market endured sell-offs when many investors reacted to political instability in certain emerging markets, crises in Ukraine and the Middle East, weakness in Europe and Japan, and moderating economic data in China. U.S. stocks rose overall for the 12 months under review as the S&P 500 and Dow Jones Industrial Average reached all-time highs.4
Investment Strategy
We seek to invest in a broadly diversified portfolio of equity securities that we consider to be financially strong, with a focus on “blue chip” companies. We apply a bottom-up approach to investing in individual securities. We will assess the market price of a company’s securities relative to our evaluation of the company’s long-term earnings, asset value and cash flow potential. We also consider a company’s price/earnings ratio, profit margins, balance sheet and liquidation value. We consider dividend yield in selecting stocks for the Fund because we believe that, over time, dividend income can contribute significantly to total return and can be a more consistent source of investment return than capital appreciation. We seek to take advantage of price dislocations that result from the market’s short-term focus and choose to invest in those companies that, in our opinion, offer the best trade-off between growth opportunity, business and financial risk, and valuation.
Manager’s Discussion
During the 12 months under review, most of the sectors the Fund invested in rose in value, as did most of the portfolio’s individual securities, supporting overall performance. Key contributing sectors included information technology (IT), consumer discretionary, utilities and industrials, while detracting sectors included energy and materials.
Among IT holdings, top contributors included semiconductor maker Intel, software firm Microsoft and networking solutions provider Cisco. Intel shares gained after the company announced it would increase its quarterly dividends in 2015. Healthy second- and third-quarter 2014 earnings and revenues also boosted stock performance. Leading consumer discretionary performers included fashion retailer L Brands and home improvement retailer Lowe’s. L Brands, a new holding, reported strong quarterly earnings, supported by improved sales across its Victoria’s Secret and Bath & Body Works brands, and raised earnings guidance for fiscal year 2014. In utilities, natural gas
| | | | |
| Top 10 Holdings | | | |
| 12/31/14 | | | |
Company
Sector/Industry | | % of Total
Net Assets | |
Intel Corp.
Information Technology | | | 2.4% | |
Cisco Systems Inc.
Information Technology | | | 2.2% | |
BlackRock Inc.
Financials | | | 2.2% | |
NIKE Inc., B
Consumer Discretionary | | | 2.1% | |
L Brands Inc.
Consumer Discretionary | | | 2.1% | |
JPMorgan Chase & Co.
Financials | | | 2.1% | |
Target Corp.
Consumer Discretionary | | | 2.1% | |
PG&E Corp.
Utilities | | | 2.1% | |
Republic Services Inc.
Industrials | | | 2.1% | |
PepsiCo Inc.
Consumer Staples | | | 2.1% | |
The dollar value, number of shares or principal amount, and names of all portfolio holdings are listed in the Fund’s Statement of Investments.
and electricity provider PG&E and electric power holding company Duke Energy were among the top performers. PG&E’s shares gained after the company reported better-than-expected third-quarter 2014 results, mainly driven by receipt of incremental revenues following the California Public Utilities Commission’s final decision in the 2014 General Rate Case.
Within industrials, security and aerospace company Lockheed Martin and waste management company Republic Services led contributors. Shares of Lockheed Martin gained after the Pentagon announced a deal with the company for additional F-35 fighter jets. The stock also surged after the company reached an agreement with Turkish missile manufacturer Roketsan to produce and market SOM-J air-to-surface cruise missiles for the F-35 Lightning II combat jet. Lockheed Martin shares also benefited from better-than-expected earnings in the second and third quarters of 2014.
In contrast, investments in the energy and materials sectors detracted notably from the Fund’s performance. Energy stocks retreated as crude oil prices fell sharply during 2014 due to
4. Please see Index Descriptions following the Fund Summaries.
FRANKLIN GROWTH AND INCOME VIP FUND
excess supply and weak global demand. Oil refiner HollyFrontier, a new position, led detractors in the energy sector. The company reported muted quarterly earnings, mainly due to lower refining margins. The stock plunged owing to the possibility of the U.S. exporting oil, which could affect the refiner’s margins. Among materials holdings, Freeport-McMoRan and BHP Billiton hurt the Fund’s performance. Freeport-McMoRan’s share price fell after it reported a decline in its third-quarter 2014 earnings, primarily due to falling copper, gold and oil prices, and approached potential buyers for its onshore oil wells in California to reduce debts. Other key detractors included casino and resort operating company Wynn Resorts, which we sold, and machinery manufacturer Caterpillar, a new holding. Wynn Resorts, which generates most of its revenue from Las Vegas and Macau, suffered a decline as gambling revenues in Macau fell sharply in October. Gambling revenues in Macau have been declining since June 2014, due to the anti-corruption stance of China’s government and tighter visa policies.
Thank you for your participation in Franklin Growth and Income VIP Fund. We look forward to serving your future investment needs.
The foregoing information reflects our analysis, opinions and portfolio holdings as of December 31, 2014, the end of the reporting period. The way we implement our main investment strategies and the resulting portfolio holdings may change depending on factors such as market and economic conditions. These opinions may not be relied upon as investment advice or an offer for a particular security. The information is not a complete analysis of every aspect of any market, country, industry, security or the Fund. Statements of fact are from sources considered reliable, but the investment manager makes no representation or warranty as to their completeness or accuracy. Although historical performance is no guarantee of future results, these insights may help you understand our investment management philosophy.
FRANKLIN GROWTH AND INCOME VIP FUND
Class 2 Fund Expenses
As an investor in a variable insurance contract (Contract) that indirectly provides for investment in an underlying mutual fund, you can incur transaction and/or ongoing expenses at both the Fund level and the Contract level.
| • | | Transaction expenses can include sales charges (loads) on purchases, redemption fees, surrender fees, transfer fees and premium taxes. |
| • | | Ongoing expenses can include management fees, distribution and service (12b-1) fees, contract fees, annual maintenance fees, mortality and expense risk fees and other fees and expenses. All mutual funds and Contracts have some types of ongoing expenses. |
The expenses shown in the table are meant to highlight ongoing expenses at the Fund level only and do not include ongoing expenses at the Contract level, or transaction expenses at either the Fund or Contract level. While the Fund does not have transaction expenses, if the transaction and ongoing expenses at the Contract level were included, the expenses shown below would be higher. You should consult your Contract prospectus or disclosure document for more information.
The table shows Fund-level ongoing expenses and can help you understand these expenses and compare them with those of other mutual funds offered through the Contract. The table assumes a $1,000 investment held for the six months indicated. Please refer to the Fund prospectus for additional information on operating expenses.
Actual Fund Expenses
The first line (Actual) of the table provides actual account values and expenses. The “Ending Account Value” is derived from the Fund’s actual return, which includes the effect of ongoing Fund expenses, but does not include the effect of ongoing Contract expenses.
You can estimate the Fund-level expenses you incurred during the period by following these steps. Of course, your account value and expenses will differ from those in this illustration:
| 1. | Divide your account value by $1,000. |
If an account had an $8,600 value,
then $8,600 ÷ $1,000 = 8.6.
| 2. | Multiply the result by the number under the heading |
“Fund-Level Expenses Incurred During Period.”
If Fund-Level Expenses Incurred During Period were $7.50, then 8.6 × $7.50 = $64.50.
In this illustration, the estimated expenses incurred this period at the Fund level are $64.50.
Hypothetical Example for Comparison
with Other Mutual Funds
Information in the second line (Hypothetical) of the table can help you compare ongoing expenses of the Fund with those of other mutual funds offered through the Contract. This information may not be used to estimate the actual ending account balance or expenses you incurred during the period. The hypothetical “Ending Account Value” is based on the Fund’s actual expense ratio and an assumed 5% annual rate of return before expenses, which does not represent the Fund’s actual return. The figure under the heading “Fund-Level Expenses Incurred During Period” shows the hypothetical expenses your account would have incurred under this scenario. You can compare this figure with the 5% hypothetical examples that appear in shareholder reports of other funds offered through a Contract.
| | | | | | | | | | | | |
| Class 2 | | Beginning Account Value 7/1/14 | | | Ending Account
Value 12/31/14 | | | Fund-Level Expenses
Incurred During Period* 7/1/14–12/31/14 | |
Actual | | | $1,000 | | | | $1,030.80 | | | | $4.15 | |
Hypothetical (5% return before expenses) | | | $1,000 | | | | $1,021.12 | | | | $4.13 | |
*Expenses are calculated using the most recent six-month annualized expense ratio for the Fund’s Class 2 shares (0.81%), which does not include any ongoing expenses of the Contract for which the Fund is an investment option, multiplied by the average account value over the period, multiplied by 184/365 to reflect the one-half year period.
FRANKLIN TEMPLETON VARIABLE INSURANCE PRODUCTS TRUST
Financial Highlights
Franklin Growth and Income VIP Fund
| | | | | | | | | | | | | | | | | | | | |
| | | Year Ended December 31, | |
| | | 2014 | | | 2013 | | | 2012 | | | 2011 | | | 2010 | |
| Class 1 | | | | | | | | | | | | | | | | | | | | |
Per share operating performance
(for a share outstanding throughout the year) | | | | | | | | | | | | | | | | | | | | |
| | | | | |
Net asset value, beginning of year | | | $15.97 | | | | $12.64 | | | | $11.60 | | | | $11.76 | | | | $10.47 | |
| | | | |
| | | | | |
| Income from investment operationsa: | | | | | | | | | | | | | | | | | | | | |
| | | | | |
Net investment incomeb | | | 0.53 | c | | | 0.33 | | | | 0.35 | | | | 0.33 | | | | 0.38 | |
| | | | | |
Net realized and unrealized gains (losses) | | | 0.95 | | | | 3.40 | | | | 1.08 | | | | (0.03 | ) | | | 1.32 | |
| | | | |
Total from investment operations | | | 1.48 | | | | 3.73 | | | | 1.43 | | | | 0.30 | | | | 1.70 | |
| | | | |
Less distributions from net investment income | | | (0.43 | ) | | | (0.40 | ) | | | (0.39 | ) | | | (0.46 | ) | | | (0.41 | ) |
| | | | |
Net asset value, end of year | | | $17.02 | | | | $15.97 | | | | $12.64 | | | | $11.60 | | | | $11.76 | |
| | | | |
| | | | | |
Total returnd | | | 9.40% | | | | 29.96% | | | | 12.53% | | | | 2.64% | | | | 16.93% | |
| | | | | |
| Ratios to average net assets | | | | | | | | | | | | | | | | | | | | |
| | | | | |
Expenses | | | 0.57% | e | | | 0.58% | e | | | 0.60% | | | | 0.59% | | | | 0.59% | |
| | | | | |
Net investment income | | | 3.26% | c | | | 2.29% | | | | 2.86% | | | | 2.80% | | | | 3.62% | |
| | | | | |
| Supplemental data | | | | | | | | | | | | | | | | | | | | |
| | | | | |
Net assets, end of year (000’s) | | | $168,961 | | | | $175,860 | | | | $154,463 | | | | $156,830 | | | | $176,590 | |
| | | | | |
Portfolio turnover rate | | | 20.54% | | | | 35.16% | | | | 30.00% | | | | 32.93% | | | | 26.83% | |
aThe amount shown for a share outstanding throughout the period may not correlate with the Statement of Operations for the period due to the timing of sales and repurchases of the Fund shares in relation to income earned and/or fluctuating fair value of the investments of the Fund.
bBased on average daily shares outstanding.
cNet investment income per share includes approximately $0.12 per share received in the form of special dividends paid in connection with certain Fund holdings. Excluding these amounts, the ratio of net investment income to average net assets would have been 2.53%.
dTotal return does not include fees, charges or expenses imposed by the variable annuity and life insurance contracts for which Franklin Templeton Variable Insurance Products Trust serves as an underlying investment vehicle.
eBenefit of expense reduction rounds to less than 0.01%.
| | | | |
| FGI-6 | | Annual Report | The accompanying notes are an integral part of these financial statements. | | |
FRANKLIN TEMPLETON VARIABLE INSURANCE PRODUCTS TRUST
FINANCIAL HIGHLIGHTS
Franklin Growth and Income VIP Fund (continued)
| | | | | | | | | | | | | | | | | | | | |
| | | Year Ended December 31, | |
| | | 2014 | | | 2013 | | | 2012 | | | 2011 | | | 2010 | |
| Class 2 | | | | | | | | | | | | | | | | | | | | |
Per share operating performance
(for a share outstanding throughout the year) | | | | | | | | | | | | | | | | | | | | |
| | | | | |
Net asset value, beginning of year | | | $15.73 | | | | $12.46 | | | | $11.44 | | | | $11.60 | | | | $10.33 | |
| | | | |
| | | | | |
| Income from investment operationsa: | | | | | | | | | | | | | | | | | | | | |
| | | | | |
Net investment incomeb | | | 0.48 | c | | | 0.29 | | | | 0.32 | | | | 0.29 | | | | 0.35 | |
| | | | | |
Net realized and unrealized gains (losses) | | | 0.94 | | | | 3.35 | | | | 1.05 | | | | (0.02 | ) | | | 1.31 | |
| | | | |
Total from investment operations | | | 1.42 | | | | 3.64 | | | | 1.37 | | | | 0.27 | | | | 1.66 | |
| | | | |
| | | | | |
| Less distributions from net investment income | | | (0.39 | ) | | | (0.37 | ) | | | (0.35 | ) | | | (0.43 | ) | | | (0.39 | ) |
| | | | |
Net asset value, end of year | | | $16.76 | | | | $15.73 | | | | $12.46 | | | | $11.44 | | | | $11.60 | |
| | | | |
| | | | | |
Total returnd | | | 9.14% | | | | 29.60% | | | | 12.23% | | | | 2.41% | | | | 16.68% | |
| | | | | |
| Ratios to average net assets | | | | | | | | | | | | | | | | | | | | |
| | | | | |
Expenses | | | 0.82% | e | | | 0.83% | e | | | 0.85% | | | | 0.84% | | | | 0.84% | |
| | | | | |
Net investment income | | | 3.01% | c | | | 2.04% | | | | 2.61% | | | | 2.55% | | | | 3.37% | |
| | | | | |
| Supplemental data | | | | | | | | | | | | | | | | | | | | |
| | | | | |
Net assets, end of year (000’s) | | | $138,191 | | | | $150,966 | | | | $131,400 | | | | $129,309 | | | | $151,481 | |
| | | | | |
Portfolio turnover rate | | | 20.54% | | | | 35.16% | | | | 30.00% | | | | 32.93% | | | | 26.83% | |
aThe amount shown for a share outstanding throughout the period may not correlate with the Statement of Operations for the period due to the timing of sales and repurchases of the Fund shares in relation to income earned and/or fluctuating fair value of the investments of the Fund.
bBased on average daily shares outstanding.
cNet investment income per share includes approximately $0.12 per share received in the form of special dividends paid in connection with certain Fund holdings. Excluding these amounts, the ratio of net investment income to average net assets would have been 2.28%.
dTotal return does not include fees, charges or expenses imposed by the variable annuity and life insurance contracts for which Franklin Templeton Variable Insurance Products Trust serves as an underlying investment vehicle.
eBenefit of expense reduction rounds to less than 0.01%.
| | | | | | |
| | | The accompanying notes are an integral part of these financial statements. | Annual Report | | | FGI-7 | |
FRANKLIN TEMPLETON VARIABLE INSURANCE PRODUCTS TRUST
Statement of Investments, December 31, 2014
| | | | | | | | | | | | | | |
| Franklin Growth and Income VIP Fund | | | | |
| | | | | Country | | | Shares | | | Value | |
| | Common Stocks 90.9% | | | | | | | | | | | | |
| | Consumer Discretionary 15.7% | | | | | | | | | | | | |
| | Ford Motor Co. | | | United States | | | | 360,900 | | | $ | 5,593,950 | |
| | General Motors Co. | | | United States | | | | 32,188 | | | | 1,123,683 | |
| | L Brands Inc. | | | United States | | | | 75,600 | | | | 6,543,180 | |
| | Las Vegas Sands Corp. | | | United States | | | | 68,900 | | | | 4,007,224 | |
| | Lowe’s Cos. Inc. | | | United States | | | | 88,600 | | | | 6,095,680 | |
| | McDonald’s Corp. | | | United States | | | | 59,300 | | | | 5,556,410 | |
| | NIKE Inc., B | | | United States | | | | 68,200 | | | | 6,557,430 | |
| | Starwood Hotels & Resorts Worldwide Inc. | | | United States | | | | 76,600 | | | | 6,209,962 | |
| | Target Corp. | | | United States | | | | 84,700 | | | | 6,429,577 | |
| | | | | | | | | | | | | | |
| | | | | | | | | | | | | 48,117,096 | |
| | | | | | | | | | | | | | |
| | Consumer Staples 7.4% | | | | | | | | | | | | |
| | Diageo PLC, ADR | | | United Kingdom | | | | 42,100 | | | | 4,803,189 | |
| | Mead Johnson Nutrition Co., A | | | United States | | | | 48,700 | | | | 4,896,298 | |
| | Nestle SA | | | Switzerland | | | | 49,400 | | | | 3,624,754 | |
| | PepsiCo Inc. | | | United States | | | | 66,900 | | | | 6,326,064 | |
| | The Procter & Gamble Co. | | | United States | | | | 34,300 | | | | 3,124,387 | |
| | | | | | | | | | | | | | |
| | | | | | | | | | | | | 22,774,692 | |
| | | | | | | | | | | | | | |
| | Energy 6.0% | | | | | | | | | | | | |
| | BP PLC, ADR | | | United Kingdom | | | | 56,500 | | | | 2,153,780 | |
| | Chevron Corp. | | | United States | | | | 24,900 | | | | 2,793,282 | |
| | Exxon Mobil Corp. | | | United States | | | | 54,244 | | | | 5,014,858 | |
| | HollyFrontier Corp. | | | United States | | | | 90,000 | | | | 3,373,200 | |
| | Royal Dutch Shell PLC, A, ADR | | | United Kingdom | | | | 76,100 | | | | 5,094,895 | |
| | | | | | | | | | | | | | |
| | | | | | | | | | | | | 18,430,015 | |
| | | | | | | | | | | | | | |
| | Financials 13.8% | | | | | | | | | | | | |
| | Aflac Inc. | | | United States | | | | 79,300 | | | | 4,844,437 | |
| | Bank of America Corp. | | | United States | | | | 140,800 | | | | 2,518,912 | |
| | BlackRock Inc. | | | United States | | | | 19,300 | | | | 6,900,908 | |
| | JPMorgan Chase & Co. | | | United States | | | | 102,770 | | | | 6,431,347 | |
| | Marsh & McLennan Cos. Inc. | | | United States | | | | 73,100 | | | | 4,184,244 | |
| | MetLife Inc. | | | United States | | | | 105,178 | | | | 5,689,078 | |
| | T. Rowe Price Group Inc. | | | United States | | | | 66,900 | | | | 5,744,034 | |
| | Wells Fargo & Co. | | | United States | | | | 107,500 | | | | 5,893,150 | |
| | | | | | | | | | | | | | |
| | | | | | | | | | | | | 42,206,110 | |
| | | | | | | | | | | | | | |
| | Health Care 9.1% | | | | | | | | | | | | |
| | Bristol-Myers Squibb Co. | | | United States | | | | 42,700 | | | | 2,520,581 | |
| | Eli Lilly & Co. | | | United States | | | | 84,100 | | | | 5,802,059 | |
| | Johnson & Johnson | | | United States | | | | 49,300 | | | | 5,155,301 | |
| | Pfizer Inc. | | | United States | | | | 144,400 | | | | 4,498,060 | |
| | Roche Holding AG | | | Switzerland | | | | 20,700 | | | | 5,619,523 | |
| | Sanofi, ADR | | | France | | | | 97,000 | | | | 4,424,170 | |
| | | | | | | | | | | | | | |
| | | | | | | | | | | | | 28,019,694 | |
| | | | | | | | | | | | | | |
| | Industrials 14.0% | | | | | | | | | | | | |
| | The Boeing Co. | | | United States | | | | 32,200 | | | | 4,185,356 | |
| | Caterpillar Inc. | | | United States | | | | 48,600 | | | | 4,448,358 | |
| | General Electric Co. | | | United States | | | | 181,200 | | | | 4,578,924 | |
| | Honeywell International Inc. | | | United States | | | | 62,800 | | | | 6,274,976 | |
| | Lockheed Martin Corp. | | | United States | | | | 32,700 | | | | 6,297,039 | |
| | Republic Services Inc. | | | United States | | | | 158,300 | | | | 6,371,575 | |
| | United Parcel Service Inc., B | | | United States | | | | 45,000 | | | | 5,002,650 | |
| | United Technologies Corp. | | | United States | | | | 49,700 | | | | 5,715,500 | |
| | | | | | | | | | | | | | |
| | | | | | | | | | | | | 42,874,378 | |
| | | | | | | | | | | | | | |
FRANKLIN TEMPLETON VARIABLE INSURANCE PRODUCTS TRUST
STATEMENT OF INVESTMENTS
Franklin Growth and Income VIP Fund (continued)
| | | | | | | | | | | | | | |
| | | | | Country | | | Shares | | | Value | |
| | Common Stocks (continued) | | | | | | | | | | | | |
| | Information Technology 12.0% | | | | | | | | | | | | |
| | CA Inc. | | | United States | | | | 170,900 | | | $ | 5,203,905 | |
| | Cisco Systems Inc. | | | United States | | | | 248,208 | | | | 6,903,905 | |
| | Intel Corp. | | | United States | | | | 198,900 | | | | 7,218,081 | |
| | Maxim Integrated Products Inc. | | | United States | | | | 182,200 | | | | 5,806,714 | |
| | Microsoft Corp. | | | United States | | | | 128,300 | | | | 5,959,535 | |
| | Seagate Technology PLC | | | United States | | | | 86,300 | | | | 5,738,950 | |
| | | | | | | | | | | | | | |
| | | | | | | | | | | | | 36,831,090 | |
| | | | | | | | | | | | | | |
| | Materials 4.8% | | | | | | | | | | | | |
| | BHP Billiton PLC | | | Australia | | | | 123,300 | | | | 2,668,526 | |
| | The Dow Chemical Co. | | | United States | | | | 121,300 | | | | 5,532,493 | |
| | Freeport-McMoRan Inc., B | | | United States | | | | 91,888 | | | | 2,146,504 | |
| | Potash Corp. of Saskatchewan Inc. | | | Canada | | | | 126,300 | | | | 4,460,916 | |
| | | | | | | | | | | | | | |
| | | | | | | | | | | | | 14,808,439 | |
| | | | | | | | | | | | | | |
| | Telecommunication Services 1.8% | | | | | | | | | | | | |
| | Verizon Communications Inc. | | | United States | | | | 120,401 | | | | 5,632,359 | |
| | | | | | | | | | | | | | |
| | Utilities 6.3% | | | | | | | | | | | | |
| | Dominion Resources Inc. | | | United States | | | | 57,100 | | | | 4,390,990 | |
| | Duke Energy Corp. | | | United States | | | | 62,103 | | | | 5,188,085 | |
| | PG&E Corp. | | | United States | | | | 119,800 | | | | 6,378,152 | |
| | Xcel Energy Inc. | | | United States | | | | 97,800 | | | | 3,512,976 | |
| | | | | | | | | | | | | | |
| | | | | | | | | | | | | 19,470,203 | |
| | | | | | | | | | | | | | |
| | | | |
| | Total Common Stocks (Cost $200,633,629) | | | | | | | | | | | 279,164,076 | |
| | | | | | | | | | | | | | |
| a | | Equity-Linked Securities (Cost $5,125,650) 1.5% | | | | | | | | | | | | |
| | Consumer Discretionary 1.5% | | | | | | | | | | | | |
| b | | Barclays Bank PLC into Amazon.com Inc., 3.00%, 144A | | | United States | | | | 15,000 | | | | 4,697,040 | |
| | | | | | | | | | | | | | |
| | Convertible Preferred Stocks 6.9% | | | | | | | | | | | | |
| | Energy 0.9% | | | | | | | | | | | | |
| b | | Chesapeake Energy Corp., 5.75%, cvt. pfd., 144A | | | United States | | | | 2,700 | | | | 2,770,875 | |
| | | | | | | | | | | | | | |
| | Financials 1.2% | | | | | | | | | | | | |
| | Bank of America Corp., 7.25%, cvt. pfd., L | | | United States | | | | 3,100 | | | | 3,605,207 | |
| | | | | | | | | | | | | | |
| | Industrials 2.1% | | | | | | | | | | | | |
| | Genesee & Wyoming Inc., 5.00%, cvt. pfd. | | | United States | | | | 9,200 | | | | 1,067,660 | |
| | Stanley Black & Decker Inc., 6.25%, cvt., pfd. | | | United States | | | | 45,300 | | | | 5,333,622 | |
| | | | | | | | | | | | | | |
| | | | | | | | | | | | | 6,401,282 | |
| | | | | | | | | | | | | | |
| | Materials 0.9% | | | | | | | | | | | | |
| | Alcoa Inc., 5.375%, cvt. pfd. | | | United States | | | | 56,400 | | | | 2,845,380 | |
| | | | | | | | | | | | | | |
| | Utilities 1.8% | | | | | | | | | | | | |
| | NextEra Energy Inc., 5.799%, cvt. pfd. | | | United States | | | | 62,000 | | | | 3,576,780 | |
| | NextEra Energy Inc., 5.889%, cvt. pfd. | | | United States | | | | 28,100 | | | | 1,881,014 | |
| | | | | | | | | | | | | | |
| | | | | | | | | | | | | 5,457,794 | |
| | | | | | | | | | | | | | |
| | | | |
| | Total Convertible Preferred Stocks (Cost $17,339,140) | | | | | | | | | | | 21,080,538 | |
| | | | | | | | | | | | | | |
| | | | |
| | Total Investments before Short Term Investments
(Cost $223,098,419) | | | | | | | | | | | 304,941,654 | |
| | | | | | | | | | | | | | |
FRANKLIN TEMPLETON VARIABLE INSURANCE PRODUCTS TRUST
STATEMENT OF INVESTMENTS
Franklin Growth and Income VIP Fund (continued)
| | | | | | | | | | | | | | |
| | | | | Country | | | Principal Amount | | | Value | |
| | Short Term Investments (Cost $1,890,415) 0.6% | | | | | | | | | | | | |
| | Repurchase Agreements 0.6% | | | | | | | | | | | | |
| c | | Joint Repurchase Agreement, 0.057%, 1/02/15
(Maturity Value $1,890,421) | |
|
United States |
| |
$ |
1,890,415 |
| |
$ |
1,890,415 |
|
| | BNP Paribas Securities Corp. (Maturity Value $159,305) HSBC Securities (USA) Inc. (Maturity Value $1,316,924) Merrill Lynch, Pierce, Fenner & Smith Inc. (Maturity Value $414,192) | | | | | | | | | | | | |
| | Collateralized by U.S. Government Agency Securities, 0.00% - 1.50%, 1/20/15 - 10/09/19; U.S. Government Agency Securities, Strips, 6/01/17; and U.S. Treasury Notes, 1.625% - 4.50%, 11/15/15 - 11/30/20 (valued at $1,928,462) | | | | | | | | | | | | |
| | | | | | | | | | | | | | |
| | Total Investments (Cost $224,988,834) 99.9% | | | | | | | | | | | 306,832,069 | |
| | Other Assets, less Liabilities 0.1% | | | | | | | | | | | 320,260 | |
| | | | | | | | | | | | | | |
| | Net Assets 100.0% | | | | | | | | | | $ | 307,152,329 | |
| | | | | | | | | | | | | | |
See Abbreviations on page FGI-20.
aSee Note 1(d) regarding equity-linked securities.
bSecurity was purchased pursuant to Rule 144A under the Securities Act of 1933 and may be sold in transactions exempt from registration only to qualified institutional buyers or in a public offering registered under the Securities Act of 1933. These securities have been deemed liquid under guidelines approved by the Trust’s Board of Trustees. At December 31, 2014, the aggregate value of these securities was $7,467,915 representing 2.43% of net assets.
cSee Note 1(c) regarding joint repurchase agreement.
| | | | | | |
| | FGI-10 | | | Annual Report | The accompanying notes are an integral part of these financial statements. | | |
FRANKLIN TEMPLETON VARIABLE INSURANCE PRODUCTS TRUST
Financial Statements
Statement of Assets and Liabilities
December 31, 2014
| | | | |
| | | Franklin Growth
and Income
VIP Fund | |
Assets: | | | | |
Investments in securities: | | | | |
Cost - Unaffiliated issuers | | $ | 223,098,419 | |
Cost - Repurchase agreements | | | 1,890,415 | |
| | | | |
Total cost of investments | | $ | 224,988,834 | |
| | | | |
Value - Unaffiliated issuers | | $ | 304,941,654 | |
Value - Repurchase agreements | | | 1,890,415 | |
| | | | |
Total value of investments | | | 306,832,069 | |
Receivables: | | | | |
Capital shares sold | | | 263,779 | |
Dividends | | | 500,127 | |
Other assets | | | 27 | |
| | | | |
Total assets | | | 307,596,002 | |
| | | | |
Liabilities: | | | | |
Payables: | | | | |
Capital shares redeemed | | | 154,073 | |
Management fees | | | 139,120 | |
Distribution fees | | | 58,153 | |
Reports to shareholders | | | 49,000 | |
Professional fees | | | 41,228 | |
Accrued expenses and other liabilities | | | 2,099 | |
| | | | |
Total liabilities | | | 443,673 | |
| | | | |
Net assets, at value | | $ | 307,152,329 | |
| | | | |
Net assets consist of: | | | | |
Paid-in capital | | $ | 208,829,174 | |
Undistributed net investment income | | | 9,979,465 | |
Net unrealized appreciation (depreciation) | | | 81,834,120 | |
Accumulated net realized gain (loss) | | | 6,509,570 | |
| | | | |
Net assets, at value | | $ | 307,152,329 | |
| | | | |
| |
| Class 1: | | | | |
Net assets, at value | | $ | 168,961,489 | |
| | | | |
Shares outstanding | | | 9,927,214 | |
| | | | |
Net asset value and maximum offering price per share | | $ | 17.02 | |
| | | | |
| |
| Class 2: | | | | |
Net assets, at value | | $ | 138,190,840 | |
| | | | |
Shares outstanding | | | 8,246,430 | |
| | | | |
Net asset value and maximum offering price per share | | $ | 16.76 | |
| | | | |
| | | | | | |
| | | The accompanying notes are an integral part of these financial statements. | Annual Report | | | FGI-11 | |
FRANKLIN TEMPLETON VARIABLE INSURANCE PRODUCTS TRUST
FINANCIAL STATEMENTS
Statement of Operations
for the year ended December 31, 2014
| | | | |
| | | Franklin Growth
and Income
VIP Fund | |
Investment income: | | | | |
Dividends | | $ | 11,976,037 | |
Interest | | | 1,745 | |
| | | | |
Total investment income | | | 11,977,782 | |
| | | | |
Expenses: | | | | |
Management fees (Note 3a) | | | 1,659,139 | |
Distribution fees - Class 2 (Note 3c) | | | 355,464 | |
Custodian fees (Note 4) | | | 3,833 | |
Reports to shareholders | | | 62,991 | |
Professional fees | | | 45,747 | |
Trustees’ fees and expenses | | | 1,249 | |
Other | | | 11,703 | |
| | | | |
Total expenses | | | 2,140,126 | |
Expense reductions (Note 4) | | | (6 | ) |
| | | | |
Net expenses | | | 2,140,120 | |
| | | | |
Net investment income | | | 9,837,662 | |
| | | | |
Realized and unrealized gains (losses): | | | | |
Net realized gain (loss) from: | | | | |
Investments | | | 23,743,855 | |
Foreign currency transactions | | | 20,169 | |
| | | | |
Net realized gain (loss) | | | 23,764,024 | |
| | | | |
Net change in unrealized appreciation (depreciation) on: | | | | |
Investments | | | (6,132,827 | ) |
Translation of other assets and liabilities denominated in foreign currencies | | | (11,622 | ) |
| | | | |
Net change in unrealized appreciation (depreciation) | | | (6,144,449 | ) |
| | | | |
Net realized and unrealized gain (loss) | | | 17,619,575 | |
| | | | |
Net increase (decrease) in net assets resulting from operations | | $ | 27,457,237 | |
| | | | |
| | | | |
| FGI-12 | | Annual Report | The accompanying notes are an integral part of these financial statements. | | |
FRANKLIN TEMPLETON VARIABLE INSURANCE PRODUCTS TRUST
FINANCIAL STATEMENTS
Statements of Changes in Net Assets
| | | | | | | | |
| | | Franklin Growth and Income VIP Fund | |
| | | Year Ended December 31, | |
| | | 2014 | | | 2013 | |
Increase (decrease) in net assets: | | | | | | | | |
Operations: | | | | | | | | |
Net investment income | | $ | 9,837,662 | | | $ | 6,736,411 | |
Net realized gain (loss) from investments and foreign currency transactions | | | 23,764,024 | | | | 28,487,148 | |
Net change in unrealized appreciation (depreciation) on investments and translation of other assets and liabilities denominated in foreign currencies | | | (6,144,449 | ) | | | 45,062,156 | |
| | | | |
Net increase (decrease) in net assets resulting from operations | | | 27,457,237 | | | | 80,285,715 | |
| | | | |
Distributions to shareholders from: | | | | | | | | |
Net investment income: | | | | | | | | |
Class 1 | | | (4,441,593 | ) | | | (4,583,247 | ) |
Class 2 | | | (3,421,107 | ) | | | (3,711,240 | ) |
| | | | |
Total distributions to shareholders | | | (7,862,700 | ) | | | (8,294,487 | ) |
| | | | |
Capital share transactions: (Note 2) | | | | | | | | |
Class 1 | | | (17,675,242 | ) | | | (17,413,301 | ) |
Class 2 | | | (21,593,267 | ) | | | (13,615,221 | ) |
| | | | |
Total capital share transactions | | | (39,268,509 | ) | | | (31,028,522 | ) |
| | | | |
Net increase (decrease) in net assets | | | (19,673,972 | ) | | | 40,962,706 | |
Net assets: | | | | | | | | |
Beginning of year | | | 326,826,301 | | | | 285,863,595 | |
| | | | |
End of year | | $ | 307,152,329 | | | $ | 326,826,301 | |
| | | | |
Undistributed net investment income included in net assets: | | | | | | | | |
End of year | | $ | 9,979,465 | | | $ | 7,938,540 | |
| | | | |
| | | | | | |
| | | The accompanying notes are an integral part of these financial statements. | Annual Report | | | FGI-13 | |
FRANKLIN TEMPLETON VARIABLE INSURANCE PRODUCTS TRUST
Notes to Financial Statements
Franklin Growth and Income VIP Fund
1. Organization and Significant Accounting Policies
Franklin Templeton Variable Insurance Products Trust (Trust) is registered under the Investment Company Act of 1940, as amended, (1940 Act) as an open-end management investment company, consisting of nineteen separate funds and applies the specialized accounting and reporting guidance in U.S. Generally Accepted Accounting Principles (U.S. GAAP). Franklin Growth and Income VIP Fund (Fund) is included in this report. The financial statements of the remaining funds in the Trust are presented separately. Shares of the Fund are generally sold only to insurance company separate accounts to fund the benefits of variable life insurance policies or variable annuity contracts. At December 31, 2014, 78.90% of the Fund’s shares were held through one insurance company. Investment activities of these insurance company separate accounts could have a material impact on the Fund. The Fund offers two classes of shares: Class 1 and Class 2. Each class of shares differs by its distribution fees, voting rights on matters affecting a single class and its exchange privilege.
Effective May 1, 2014, Franklin Growth and Income Securities Fund was renamed Franklin Growth and Income VIP Fund.
The following summarizes the Fund’s significant accounting policies.
a. Financial Instrument Valuation
The Fund’s investments in financial instruments are carried at fair value daily. Fair value is the price that would be received to sell an asset or paid to transfer a liability in an orderly transaction between market participants on the measurement date. The Fund calculates the net asset value per share at the close of the New York Stock Exchange (NYSE), generally at 4 p.m. Eastern time (NYSE close) on each day the NYSE is open for trading. Under compliance policies and procedures approved by the Trust’s Board of Trustees (the Board), the Fund’s administrator has responsibility for oversight of valuation, including leading the cross-functional Valuation and Liquidity Oversight Committee (VLOC). The VLOC provides administration and oversight of the Fund’s valuation policies and procedures, which are approved annually by the Board. Among other things, these procedures allow the Fund to utilize independent pricing services, quotations from securities and financial instrument dealers, and other market sources to determine fair value.
Equity securities listed on an exchange or on the NASDAQ National Market System are valued at the last quoted sale price
or the official closing price of the day, respectively. Foreign equity securities are valued as of the close of trading on the foreign stock exchange on which the security is primarily traded or as of the NYSE close, whichever is earlier. The value is then converted into its U.S. dollar equivalent at the foreign exchange rate in effect at the NYSE close on the day that the value of the security is determined. Over-the-counter (OTC) securities are valued within the range of the most recent quoted bid and ask prices. Securities that trade in multiple markets or on multiple exchanges are valued according to the broadest and most representative market. Certain equity securities are valued based upon fundamental characteristics or relationships to similar securities. Repurchase agreements are valued at cost, which approximates fair value.
The Fund has procedures to determine the fair value of financial instruments for which market prices are not reliable or readily available. Under these procedures, the VLOC convenes on a regular basis to review such financial instruments and considers a number of factors, including significant unobservable valuation inputs, when arriving at fair value. The VLOC primarily employs a market-based approach which may use related or comparable assets or liabilities, recent transactions, market multiples, book values, and other relevant information for the investment to determine the fair value of the investment. An income-based valuation approach may also be used in which the anticipated future cash flows of the investment are discounted to calculate fair value. Discounts may also be applied due to the nature or duration of any restrictions on the disposition of the investments. Due to the inherent uncertainty of valuations of such investments, the fair values may differ significantly from the values that would have been used had an active market existed. The VLOC employs various methods for calibrating these valuation approaches including a regular review of key inputs and assumptions, transactional back-testing or disposition analysis, and reviews of any related market activity.
Trading in securities on foreign securities stock exchanges and OTC markets may be completed before the daily NYSE close. In addition, trading in certain foreign markets may not take place on every NYSE business day. Occasionally, events occur between the time at which trading in a foreign security is completed and the close of the NYSE that might call into question the reliability of the value of a portfolio security held by the Fund. As a result, differences may arise between the value of the Fund’s portfolio securities as determined at the foreign market close and the latest indications of value at the
FRANKLIN TEMPLETON VARIABLE INSURANCE PRODUCTS TRUST
NOTES TO FINANCIAL STATEMENTS
Franklin Growth and Income VIP Fund (continued)
close of the NYSE. In order to minimize the potential for these differences, the VLOC monitors price movements following the close of trading in foreign stock markets through a series of country specific market proxies (such as baskets of American Depositary Receipts, futures contracts and exchange traded funds). These price movements are measured against established trigger thresholds for each specific market proxy to assist in determining if an event has occurred that may call into question the reliability of the values of the foreign securities held by the Fund. If such an event occurs, the securities may be valued using fair value procedures, which may include the use of independent pricing services.
Also, when the last day of the reporting period is a non-business day, certain foreign markets may be open on those days that the NYSE is closed, which could result in differences between the value of the Fund’s portfolio securities on the last business day and the last calendar day of the reporting period. Any significant security valuation changes due to an open foreign market are adjusted and reflected by the Fund for financial reporting purposes.
b. Foreign Currency Translation
Portfolio securities and other assets and liabilities denominated in foreign currencies are translated into U.S. dollars based on the exchange rate of such currencies against U.S. dollars on the date of valuation. The Fund may enter into foreign currency exchange contracts to facilitate transactions denominated in a foreign currency. Purchases and sales of securities, income and expense items denominated in foreign currencies are translated into U.S. dollars at the exchange rate in effect on the transaction date. Portfolio securities and assets and liabilities denominated in foreign currencies contain risks that those currencies will decline in value relative to the U.S. dollar. Occasionally, events may impact the availability or reliability of foreign exchange rates used to convert the U.S. dollar equivalent value. If such an event occurs, the foreign exchange rate will be valued at fair value using procedures established and approved by the Board.
The Fund does not separately report the effect of changes in foreign exchange rates from changes in market prices on securities held. Such changes are included in net realized and unrealized gain or loss from investments on the Statement of Operations.
Realized foreign exchange gains or losses arise from sales of foreign currencies, currency gains or losses realized between the trade and settlement dates on securities transactions and the difference between the recorded amounts of dividends, interest,
and foreign withholding taxes and the U.S. dollar equivalent of the amounts actually received or paid. Net unrealized foreign exchange gains and losses arise from changes in foreign exchange rates on foreign denominated assets and liabilities other than investments in securities held at the end of the reporting period.
c. Joint Repurchase Agreement
The Fund enters into a joint repurchase agreement whereby its uninvested cash balance is deposited into a joint cash account with other funds managed by the investment manager or an affiliate of the investment manager and is used to invest in one or more repurchase agreements. The value and face amount of the joint repurchase agreement are allocated to the funds based on their pro-rata interest. A repurchase agreement is accounted for as a loan by the Fund to the seller, collateralized by securities which are delivered to the Fund’s custodian. The fair value, including accrued interest, of the initial collateralization is required to be at least 102% of the dollar amount invested by the funds, with the value of the underlying securities marked to market daily to maintain coverage of at least 100%. Repurchase agreements are subject to the terms of Master Repurchase Agreements (MRAs) with approved counterparties (sellers). The MRAs contain various provisions, including but not limited to events of default and maintenance of collateral for repurchase agreements. In the event of default by either the seller or the Fund, certain MRAs may permit the non-defaulting party to net and close-out all transactions, if any, traded under such agreements. The Fund may sell securities it holds as collateral and apply the proceeds towards the repurchase price and any other amounts owed by the seller to the Fund in the event of default by the seller. This could involve costs or delays in addition to a loss on the securities if their value falls below the repurchase price owed by the seller. The joint repurchase agreement held by the Fund at year end, as indicated in the Statement of Investments, had been entered into on December 31, 2014.
d. Equity-Linked Securities
The Fund invests in equity-linked securities. Equity-linked securities are hybrid financial instruments that generally combine both debt and equity characteristics into a single note form. Income received from equity-linked securities is recorded as realized gains in the Statement of Operations and may be based on the performance of an underlying equity security, an equity index, or an option position. The risks of investing in equity-linked securities include unfavorable price movements in
FRANKLIN TEMPLETON VARIABLE INSURANCE PRODUCTS TRUST
NOTES TO FINANCIAL STATEMENTS
Franklin Growth and Income VIP Fund (continued)
1. Organization and Significant Accounting Policies (continued)
d. Equity-Linked Securities (continued)
the underlying security and the credit risk of the issuing financial institution. There may be no guarantee of a return of principal with equity-linked securities and the appreciation potential may be limited. Equity-linked securities may be more volatile and less liquid than other investments held by the Fund.
e. Income and Deferred Taxes
It is the Fund’s policy to qualify as a regulated investment company under the Internal Revenue Code. The Fund intends to distribute to shareholders substantially all of its taxable income and net realized gains to relieve it from federal income and if applicable, excise taxes. As a result, no provision for U.S. federal income taxes is required.
The Fund may be subject to foreign taxation related to income received, capital gains on the sale of securities and certain foreign currency transactions in the foreign jurisdictions in which it invests. Foreign taxes, if any, are recorded based on the tax regulations and rates that exist in the foreign markets in which the Fund invests. When a capital gain tax is determined to apply the Fund records an estimated deferred tax liability in an amount that would be payable if the securities were disposed of on the valuation date. As a result of several court cases, in certain countries across the European Union, the Fund has filed additional tax reclaims for previously withheld taxes on dividends earned in those countries. These additional filings are subject to various administrative proceedings by the local jurisdictions’ tax authorities within the European Union, as well as a number of related judicial proceedings. At this time, uncertainty exists as to the ultimate resolution of these proceedings, the likelihood of receipt of these reclaims, and the potential timing of payment, and accordingly, no amounts are reflected in the financial statements.
The Fund recognizes the tax benefits of uncertain tax positions only when the position is “more likely than not” to be sustained upon examination by the tax authorities based on the technical merits of the tax position. As of December 31, 2014, and for all open tax years, the Fund has determined that no liability for unrecognized tax benefits is required in the Fund’s financial statements related to uncertain tax positions taken on a tax return (or expected to be taken on future tax returns). Open tax
years are those that remain subject to examination and are based on each tax jurisdiction statute of limitation.
f. Security Transactions, Investment Income, Expenses and Distributions
Security transactions are accounted for on trade date. Realized gains and losses on security transactions are determined on a specific identification basis. Interest income and estimated expenses are accrued daily. Dividend income is recorded on the ex-dividend date except for certain foreign securities where the dividend rate is not available. In such cases, the dividend is recorded as soon as the information is received by the Fund. Distributions to shareholders are recorded on the ex-dividend date and are determined according to income tax regulations (tax basis). Distributable earnings determined on a tax basis may differ from earnings recorded in accordance with U.S. GAAP. These differences may be permanent or temporary. Permanent differences are reclassified among capital accounts to reflect their tax character. These reclassifications have no impact on net assets or the results of operations. Temporary differences are not reclassified, as they may reverse in subsequent periods.
Common expenses incurred by the Trust are allocated among the funds based on the ratio of net assets of each fund to the combined net assets of the Trust. Fund specific expenses are charged directly to the fund that incurred the expense.
Realized and unrealized gains and losses and net investment income, not including class specific expenses, are allocated daily to each class of shares based upon the relative proportion of net assets of each class. Differences in per share distributions, by class, are generally due to differences in class specific expenses.
g. Accounting Estimates
The preparation of financial statements in accordance with U.S. GAAP requires management to make estimates and assumptions that affect the reported amounts of assets and liabilities at the date of the financial statements and the amounts of income and expenses during the reporting period. Actual results could differ from those estimates.
h. Guarantees and Indemnifications
Under the Trust’s organizational documents, its officers and trustees are indemnified by the Trust against certain liabilities arising out of the performance of their duties to the Trust. Additionally, in the normal course of business, the Trust, on behalf
FRANKLIN TEMPLETON VARIABLE INSURANCE PRODUCTS TRUST
NOTES TO FINANCIAL STATEMENTS
Franklin Growth and Income VIP Fund (continued)
of the Fund, enters into contracts with service providers that contain general indemnification clauses. The Trust’s maximum exposure under these arrangements is unknown as this would
involve future claims that may be made against the Trust that have not yet occurred. Currently, the Trust expects the risk of loss to be remote.
2. Shares of Beneficial Interest
At December 31, 2014, there were an unlimited number of shares authorized (without par value). Transactions in the Fund’s shares were as follows:
| | | | | | | | | | | | | | | | | | |
| | | Year Ended December 31, | |
| | | 2014 | | | | | 2013 | |
| | | Shares | | | Amount | | | | | Shares | | | Amount | |
| | | | | |
| Class 1 Shares: | | | | | | | | | | | | | | | | | | |
Shares sold | | | 1,787 | | | $ | 29,600 | | | | | | 37,520 | | | $ | 537,654 | |
Shares issued in reinvestment of distributions | | | 273,329 | | | | 4,441,593 | | | | | | 326,675 | | | | 4,583,247 | |
Shares redeemed | | | (1,356,798 | ) | | | (22,146,435 | ) | | | | | (1,571,602 | ) | | | (22,534,202 | ) |
| | | | |
Net increase (decrease) | | | (1,081,682 | ) | | $ | (17,675,242 | ) | | | | | (1,207,407 | ) | | $ | (17,413,301 | ) |
| | | | |
| Class 2 Shares: | | | | | | | | | | | | | | | | | | |
Shares sold | | | 349,345 | | | $ | 5,677,772 | | | | | | 905,864 | | | $ | 12,758,976 | |
Shares issued in reinvestment of distributions | | | 213,552 | | | | 3,421,107 | | | | | | 268,347 | | | | 3,711,240 | |
Shares redeemed | | | (1,911,427 | ) | | | (30,692,146 | ) | | | | | (2,124,043 | ) | | | (30,085,437 | ) |
| | | | |
Net increase (decrease) | | | (1,348,530 | ) | | $ | (21,593,267 | ) | | | | | (949,832 | ) | | $ | (13,615,221 | ) |
| | | | |
3. Transactions With Affiliates
Franklin Resources, Inc. is the holding company for various subsidiaries that together are referred to as Franklin Templeton Investments. Certain officers and trustees of the Fund are also officers and/or directors of the following subsidiaries:
| | |
| Subsidiary | | Affiliation |
Franklin Advisers, Inc. (Advisers) | | Investment manager |
Franklin Templeton Services, LLC (FT Services) | | Administrative manager |
Franklin Templeton Distributors, Inc. (Distributors) | | Principal underwriter |
Franklin Templeton Investor Services, LLC (Investor Services) | | Transfer agent |
a. Management Fees
The Fund pays an investment management fee to Advisers based on the average daily net assets of the Fund as follows:
| | |
| Annualized Fee Rate | | Net Assets |
0.625% | | Up to and including $100 million |
0.500% | | Over $100 million, up to and including $250 million |
0.450% | | Over $250 million, up to and including $7.5 billion |
0.440% | | Over $7.5 billion, up to and including $10 billion |
0.430% | | Over $10 billion, up to and including $12.5 billion |
0.420% | | Over $12.5 billion, up to and including $15 billion |
0.400% | | In excess of $15 billion |
FRANKLIN TEMPLETON VARIABLE INSURANCE PRODUCTS TRUST
NOTES TO FINANCIAL STATEMENTS
Franklin Growth and Income VIP Fund (continued)
3. Transactions With Affiliates (continued)
b. Administrative Fees
Under an agreement with Advisers, FT Services provides administrative services to the Fund. The fee is paid by Advisers based on the Fund’s average daily net assets, and is not an additional expense of the Fund.
c. Distribution Fees
The Board has adopted a distribution plan for Class 2 shares pursuant to Rule 12b-1 under the 1940 Act. Under the Fund’s compensation distribution plan, the Fund pays Distributors for costs incurred in connection with the servicing, sale and distribution of the Fund’s shares up to 0.35% per year of its average daily net assets. Some distribution fees are not charged on shares held by affiliates. The Board has agreed to limit the current rate to 0.25% per year for Class 2. The plan year, for purposes of monitoring compliance with the maximum annual plan rate, is February 1 through January 31.
d. Transfer Agent Fees
Investor Services, under terms of an agreement, performs shareholder servicing for the Fund and is not paid by the Fund for the services.
4. Expense Offset Arrangement
The Fund has entered into an arrangement with its custodian whereby credits realized as a result of uninvested cash balances are used to reduce a portion of the Fund’s custodian expenses. During the year ended December 31, 2014, the custodian fees were reduced as noted in the Statement of Operations.
5. Income Taxes
For tax purposes, capital losses may be carried over to offset future capital gains. Capital loss carryforwards with no expiration, if any, must be fully utilized before those losses with expiration dates.
During the year ended December 31, 2014, the Fund utilized $17,114,556 of capital loss carryforwards.
The tax character of distributions paid during the years ended December 31, 2014 and 2013, was as follows:
| | | | | | | | |
| | | 2014 | | | 2013 | |
Distributions paid from ordinary income | | $ | 7,862,700 | | | $ | 8,294,487 | |
| | | | |
At December 31, 2014, the cost of investments, net unrealized appreciation (depreciation), undistributed ordinary income and undistributed long term capital gains for income tax purposes were as follows:
| | | | |
Cost of investments | | $ | 225,106,797 | |
| | | | |
Unrealized appreciation | | $ | 88,022,604 | |
Unrealized depreciation | | | (6,297,332 | ) |
| | | | |
Net unrealized appreciation (depreciation) | | $ | 81,725,272 | |
| | | | |
Undistributed ordinary income | | $ | 10,186,591 | |
Undistributed long term capital gains | | | 6,481,128 | |
| | | | |
Distributable earnings | | $ | 16,667,719 | |
| | | | |
Differences between income and/or capital gains as determined on a book basis and a tax basis are primarily due to differing treatments of equity-linked securities, corporate actions, bond discounts and premiums, and wash sales.
FRANKLIN TEMPLETON VARIABLE INSURANCE PRODUCTS TRUST
NOTES TO FINANCIAL STATEMENTS
Franklin Growth and Income VIP Fund (continued)
6. Investment Transactions
Purchases and sales of investments (excluding short term securities) for the year ended December 31, 2014, aggregated $63,637,090 and $103,402,653, respectively.
7. Credit Facility
The Fund, together with other U.S. registered and foreign investment funds (collectively, Borrowers), managed by Franklin Templeton Investments, are borrowers in a joint syndicated senior unsecured credit facility totaling $1.5 billion (Global Credit Facility) which matured on February 13, 2015. This Global Credit Facility provides a source of funds to the Borrowers for temporary and emergency purposes, including the ability to meet future unanticipated or unusually large redemption requests. The Borrowers expect to renew the Global Credit Facility for a total of $2 billion effective February 13, 2015, which matures on February 12, 2016.
Under the terms of the Global Credit Facility, the Fund shall, in addition to interest charged on any borrowings made by the Fund and other costs incurred by the Fund, pay its share of fees and expenses incurred in connection with the implementation and maintenance of the Global Credit Facility, based upon its relative share of the aggregate net assets of all of the Borrowers, including an annual commitment fee of 0.07% based upon the unused portion of the Global Credit Facility. These fees are reflected in other expenses on the Statement of Operations. During the year ended December 31, 2014, the Fund did not use the Global Credit Facility.
8. Fair Value Measurements
The Fund follows a fair value hierarchy that distinguishes between market data obtained from independent sources (observable inputs) and the Fund’s own market assumptions (unobservable inputs). These inputs are used in determining the value of the Fund’s financial instruments and are summarized in the following fair value hierarchy:
| | • | | Level 1 – quoted prices in active markets for identical financial instruments |
| | • | | Level 2 – other significant observable inputs (including quoted prices for similar financial instruments, interest rates, prepayment speed, credit risk, etc.) |
| | • | | Level 3 – significant unobservable inputs (including the Fund’s own assumptions in determining the fair value of financial instruments) |
The input levels are not necessarily an indication of the risk or liquidity associated with financial instruments at that level.
For movements between the levels within the fair value hierarchy, the Fund has adopted a policy of recognizing the transfers as of the date of the underlying event which caused the movement.
A summary of inputs used as of December 31, 2014, in valuing the Fund’s assets carried at fair value, is as follows:
| | | | | | | | | | | | | | | | |
| | | Level 1 | | | Level 2 | | | Level 3 | | | Total | |
| | | | |
| Assets: | | | | | | | | | | | | | | | | |
Investments in Securities: | | | | | | | | | | | | | | | | |
Equity Investments:a | | | | | | | | | | | | | | | | |
Energy | | $ | 18,430,015 | | | $ | 2,770,875 | | | $ | — | | | $ | 21,200,890 | |
All Other Equity Investmentsb | | | 279,043,724 | | | | — | | | | — | | | | 279,043,724 | |
Equity-Linked Securities | | | — | | | | 4,697,040 | | | | — | | | | 4,697,040 | |
Short Term Investments | | | — | | | | 1,890,415 | | | | — | | | | 1,890,415 | |
| | | | |
Total Investments in Securities | | $ | 297,473,739 | | | $ | 9,358,330 | | | $ | — | | | $ | 306,832,069 | |
| | | | |
aIncludes common and convertible preferred stocks.
bFor detailed categories, see the accompanying Statement of Investments.
FRANKLIN TEMPLETON VARIABLE INSURANCE PRODUCTS TRUST
NOTES TO FINANCIAL STATEMENTS
Franklin Growth and Income VIP Fund (continued)
9. Subsequent Events
The Fund has evaluated subsequent events through the issuance of the financial statements and determined that no events have occurred that require disclosure other than those already disclosed in the financial statements.
Abbreviations
| | |
| Selected Portfolio |
| |
| ADR | | American Depositary Receipt |
FRANKLIN TEMPLETON VARIABLE INSURANCE PRODUCTS TRUST
Report of Independent Registered Public Accounting Firm
Franklin Growth and Income VIP Fund
To the Board of Trustees and Shareholders of Franklin Templeton Variable Insurance Products Trust
In our opinion, the accompanying statement of assets and liabilities, including the statement of investments, and the related statements of operations and of changes in net assets and the financial highlights present fairly, in all material respects, the financial position of Franklin Growth and Income VIP Fund (the “Fund”) at December 31, 2014, the results of its operations for the year then ended, the changes in its net assets for each of the two years in the period then ended and the financial highlights for each of the five years in the period then ended, in conformity with accounting principles generally accepted in the United States of America. These financial statements and financial highlights (hereafter referred to as “financial statements”) are the responsibility of the Fund’s management. Our responsibility is to express an opinion on these financial statements based on our audits. We conducted our audits of these financial statements in accordance with the standards of the Public Company Accounting Oversight Board (United States). Those standards require that we plan and perform the audit to obtain reasonable assurance about whether the financial statements are free of material misstatement. An audit includes examining, on a test basis, evidence supporting the amounts and disclosures in the financial statements, assessing the accounting principles used and significant estimates made by management, and evaluating the overall financial statement presentation. We believe that our audits, which included confirmation of securities at December 31, 2014 by correspondence with the custodian and brokers, provides a reasonable basis for our opinion.
PricewaterhouseCoopers LLP
San Francisco, California
February 13, 2015
FRANKLIN TEMPLETON VARIABLE INSURANCE PRODUCTS TRUST
Tax Information (unaudited)
Franklin Growth and Income VIP Fund
Under Section 854(b)(1)(A) of the Internal Revenue Code, the Fund hereby reports 96.42% of the ordinary income dividends as income qualifying for the dividends received deduction for the fiscal year ended December 31, 2014.
Franklin High Income VIP Fund
(Formerly, Franklin High Income Securities Fund)
This annual report for Franklin High Income VIP Fund covers the fiscal year ended December 31, 2014.
Class 2 Performance Summary as of December 31, 2014
Average annual total return of Class 2 shares represents the average annual change in value, assuming reinvestment of dividends and capital gains. Average returns smooth out variations in returns, which can be significant; they are not the same as year-by-year results.
| | | | | | | | | | | | |
| Periods ended 12/31/14 | | 1-Year | | | 5-Year | | | 10-Year | |
Average Annual Total Return | | | -0.02% | | | | +8.09% | | | | +6.47% | |
Performance reflects the Fund’s Class 2 operating expenses, but does not include any contract fees, expenses or sales charges. If they had been included, performance would be lower. These charges and deductions, particularly for variable life policies, can have a significant effect on contract values and insurance benefits. See the contract prospectus for a complete description of these expenses, including sales charges.
Performance data represent past performance, which does not guarantee future results. Investment return and principal value will fluctuate, and you may have a gain or loss when you sell your shares. Current performance may differ from figures shown.
Total Return Index Comparison for a Hypothetical $10,000 Investment (1/1/05–12/31/14)
The graph below shows the change in value of a hypothetical $10,000 investment in the Fund over the indicated period and includes reinvestment of any income or distributions. The Fund’s performance is compared to the performance of the Credit Suisse (CS) High Yield Index and the Lipper VIP High Yield Funds Classification Average. One cannot invest directly in an index, and an index is not representative of the Fund’s portfolio. Please see Important Notes to Performance Information preceding the Fund Summaries.
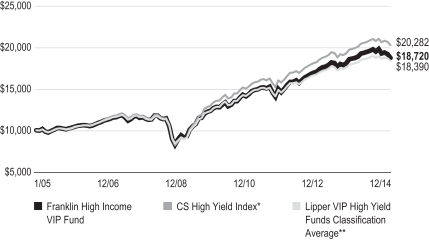
*Source: Credit Suisse Group. Please see Index Descriptions following the Fund Summaries.
**Source: Lipper, a Thomson Reuters Company. Please see Index Descriptions following the Fund Summaries.
FRANKLIN HIGH INCOME VIP FUND
Fund Goals and Main Investments
Franklin High Income VIP Fund seeks a high level of current income with capital appreciation as a secondary goal. Under normal market conditions, the Fund invests predominantly in high yield, lower rated debt securities and preferred stocks.
Fund Risks
All investments involve risks, including possible loss of principal. The risks associated with higher yielding, lower rated securities include higher risk of default and loss of principal. Changes in the financial strength of a bond issuer or in a bond’s credit rating may affect its value. In addition, interest rate movements will affect the Fund’s share price and yield. Bond prices generally move in the opposite direction of interest rates. Thus, as prices of bonds in the Fund adjust to a rise in interest rates, the Fund’s share price may decline. Investment in foreign securities also involves special risks, including currency fluctuations, and political and economic uncertainty. The Fund is actively managed but there is no guarantee that the manager’s investment decisions will produce the desired results. The Fund’s prospectus also includes a description of the main investment risks.
Performance Overview
You can find the Fund’s one-year total return in the Performance Summary. In comparison, the Fund’s benchmark, the CS High Yield Index, posted a +1.86% total return for the period under review.1 The Fund’s peers, as measured by the Lipper VIP High Yield Funds Classification Average, delivered a +1.59% total return.2
Economic and Market Overview
The U.S. economy continued to grow during the year ended December 31, 2014, underpinned in some quarters by manufacturing activity, consumer and business spending, and federal defense spending. Home sales experienced weakness resulting from reduced inventory, higher mortgage rates and tight credit requirements but began to recover in May as mortgage rates declined. Home prices stayed higher than a year earlier. Retail sales generally improved, supported by job growth and lower gasoline prices in the latter part of 2014. The unemployment rate declined to 5.6% in December 2014 from 6.7% in December 2013.3 Inflation, as measured by the Consumer Price Index, remained low.
In January 2014, the U.S. Federal Reserve Board (Fed) began reducing its large-scale bond purchases $10 billion a month and ended the buying program in October. But it continued its practice of maintaining holdings of longer term securities at sizable levels. The Fed believed underlying economic strength could support ongoing progress in labor market conditions. The Fed also noted that although inflation might remain low in the near term, the likelihood of inflation running persistently below 2% had diminished. Toward period-end, the Fed stated that it could be patient with regard to raising interest rates and that the interest rate might not rise for at least a couple of meetings, possibly implying at least the first two meetings of 2015.
The 10-year Treasury yield declined from 3.04% at the beginning of the period to 2.17% at period-end, as investors shifted to less risky assets given the crises in Ukraine and the Middle East, weak economic data in Europe and Japan, record-low bond yields and lower Treasury issuance.
Investment Strategy
We are research-driven, fundamental investors who rely on a team of analysts to provide in-depth industry expertise and use qualitative and quantitative analyses to evaluate companies. As bottom-up investors, we focus primarily on individual securities. We also consider sectors when choosing investments. In selecting securities for the Fund’s investment portfolio, we do not rely principally on ratings assigned by rating agencies, but perform our own independent analysis to evaluate an issuer’s creditworthiness. We consider a variety of factors, including an issuer’s experience and managerial strength, its sensitivity to economic conditions and its current financial condition.
Manager’s Discussion
In the first half of 2014, investor demand for high yield bonds was strong, driven by a mostly benign interest rate environment and a continued mild corporate bond default rate. Additionally, the low absolute level of interest rates seemed to support a healthy risk appetite among investors searching for greater income from their investments. However, financial market conditions became more volatile during the second half of 2014. Considering energy is one of the largest sectors in the high yield market, the dramatic fall in oil prices severely affected the sector’s bond prices. This negative momentum spread throughout the high yield market, and investor concerns led to cash
1. Source: Credit Suisse Group.
2. Source: Lipper, a Thomson Reuters Company.
One cannot invest directly in an index, and an index is not representative of the Fund’s portfolio. Please see Index Descriptions following the Fund Summaries.
3. Source: Bureau of Labor Statistics.
FRANKLIN HIGH INCOME VIP FUND
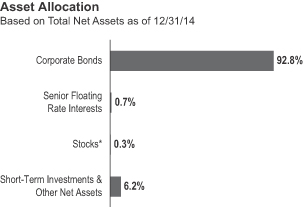
*Includes common and convertible preferred shares.
| | | | |
| Top 10 Sectors/Industries | | | |
| 12/31/14 | | | |
| | | % of Total
Net Assets | |
| Energy | | | 18.6% | |
| Materials | | | 11.1% | |
| Media | | | 10.8% | |
| Telecommunication Services | | | 10.2% | |
| Banks | | | 5.3% | |
| Health Care Equipment & Services | | | 5.0% | |
| Consumer Services | | | 3.8% | |
| Software & Services | | | 3.6% | |
| Diversified Financials | | | 3.6% | |
| Food, Beverage & Tobacco | | | 3.4% | |
The dollar value, number of shares or principal amount, and names of all portfolio holdings are listed in the Fund’s Statement of Investments (SOI).
outflows from high yield retail mutual funds, further exacerbating downward pricing pressure. The market reached some stability by year-end, however, and the CS High Yield Index posted a small positive return for the year as a decline in prices was more than offset by coupon income. As investors seemed more risk averse toward year-end, bonds with lower credit ratings underperformed their higher quality counterparts for the year. The Fund was positioned with a fairly neutral ratings exposure compared to the CS High Yield Index. Consequently, the Fund’s relative performance in 2014 was pressured by its overweighted exposure to the energy sector, as well as certain individual security selections.
We drew on our fundamental research process to make individual investments and overweight or underweight certain industries relative to the CS High Yield Index in an effort to outperform. Although certain of the Fund’s positionings enhanced relative performance versus its benchmark, our overall industry exposure negatively impacted relative returns. For example, what we deemed as strong asset protection in the energy sector guided us to an overweighted position. However, bond prices of energy producers and energy service providers fell in conjunction with weaker commodity prices. Following a fairly steady decline in oil prices over the summer and fall, the decline in oil and energy bond prices accelerated following the November decision by the Organization of the Petroleum Exporting Countries not to cut production. In addition, a warmer-than-expected start to winter pushed natural gas prices lower. These factors placed tremendous downward pressure on bond prices in the energy sector. Correspondingly, the energy
sector underperformed the benchmark, weighing on the Fund’s overweighted allocation and security selection in the sector.
Slowing demand from China, coupled with global oversupply in many commodities, put pricing pressure on the metals and mining industry.4 This trend led to weaker operating results, which in turn weighed on bond prices and led our overweighting to hinder relative performance. However, our security selection contributed as we avoided several of the worst performing securities within the industry. In contrast, the Fund’s underweighted positioning in the information technology sector detracted from relative returns.5 Issuers in the sector benefited from improved demand as well as access to public equity markets. The corresponding deleveraging of some companies’ balance sheets drove the sector’s relative outperformance versus the benchmark.
Certain industry exposures positively impacted relative returns, such as our overweighting in cable.6 A higher quality bias within the industry coupled with generally credit-positive merger and acquisition activity helped the industry outperform the market. Another industry we overweighted, health care, also aided relative performance.7 The Affordable Care Act helped stimulate demand as well as facilitate payments to health care providers. This situation resulted in higher volumes and lower bad debt for most of the industry, particularly hospitals, which are large sector components. Similarly, our overweighting in the
4. Metals and mining is part of materials in the SOI.
5. Information technology comprises technology hardware and equipment in the SOI.
6. Cable is part of media in the SOI.
7. Health care comprises health care equipment and services in the SOI.
FRANKLIN HIGH INCOME VIP FUND
packaging industry benefited relative performance.8 After experiencing consolidation over the past three years, pricing power has strengthened, leading to higher margins and steady credit improvements for industry participants. Correspondingly, bond prices improved and drove industry outperformance versus the benchmark.
Thank you for your participation in Franklin High Income VIP Fund. We look forward to serving your future investment needs.
The foregoing information reflects our analysis, opinions and portfolio holdings as of December 31, 2014, the end of the reporting period. The way we implement our main investment strategies and the resulting portfolio holdings may change depending on factors such as market and economic conditions. These opinions may not be relied upon as investment advice or an offer for a particular security. The information is not a complete analysis of every aspect of any market, country, industry, security or the Fund. Statements of fact are from sources considered reliable, but the investment manager makes no representation or warranty as to their completeness or accuracy. Although historical performance is no guarantee of future results, these insights may help you understand our investment management philosophy.
8. Packaging is part of materials in the SOI.
FRANKLIN HIGH INCOME VIP FUND
Class 2 Fund Expenses
As an investor in a variable insurance contract (Contract) that indirectly provides for investment in an underlying mutual fund, you can incur transaction and/or ongoing expenses at both the Fund level and the Contract level.
| • | | Transaction expenses can include sales charges (loads) on purchases, redemption fees, surrender fees, transfer fees and premium taxes. |
| • | | Ongoing expenses can include management fees, distribution and service (12b-1) fees, contract fees, annual maintenance fees, mortality and expense risk fees and other fees and expenses. All mutual funds and Contracts have some types of ongoing expenses. |
The expenses shown in the table are meant to highlight ongoing expenses at the Fund level only and do not include ongoing expenses at the Contract level, or transaction expenses at either the Fund or Contract level. While the Fund does not have transaction expenses, if the transaction and ongoing expenses at the Contract level were included, the expenses shown below would be higher. You should consult your Contract prospectus or disclosure document for more information.
The table shows Fund-level ongoing expenses and can help you understand these expenses and compare them with those of other mutual funds offered through the Contract. The table assumes a $1,000 investment held for the six months indicated. Please refer to the Fund prospectus for additional information on operating expenses.
Actual Fund Expenses
The first line (Actual) of the table provides actual account values and expenses. The “Ending Account Value” is derived from the Fund’s actual return, which includes the effect of ongoing Fund expenses, but does not include the effect of ongoing Contract expenses.
You can estimate the Fund-level expenses you incurred during the period by following these steps. Of course, your account value and expenses will differ from those in this illustration:
| 1. | Divide your account value by $1,000. |
If an account had an $8,600 value, then $8,600 ÷ $1,000 = 8.6.
| 2. | Multiply the result by the number under the heading “Fund-Level Expenses Incurred During Period.” |
If Fund-Level Expenses Incurred During Period were $7.50, then 8.6 × $7.50 = $64.50.
In this illustration, the estimated expenses incurred this period at the Fund level are $64.50.
Hypothetical Example for Comparison with Other Mutual Funds
Information in the second line (Hypothetical) of the table can help you compare ongoing expenses of the Fund with those of other mutual funds offered through the Contract. This information may not be used to estimate the actual ending account balance or expenses you incurred during the period. The hypothetical “Ending Account Value” is based on the Fund’s actual expense ratio and an assumed 5% annual rate of return before expenses, which does not represent the Fund’s actual return. The figure under the heading “Fund-Level Expenses Incurred During Period” shows the hypothetical expenses your account would have incurred under this scenario. You can compare this figure with the 5% hypothetical examples that appear in shareholder reports of other funds offered through a Contract.
| | | | | | | | | | | | |
| Class 2 | | Beginning Account Value 7/1/14 | | | Ending Account
Value 12/31/14 | | | Fund-Level Expenses
Incurred During Period* 7/1/14–12/31/14 | |
Actual | | | $1,000 | | | | $ 946.80 | | | | $4.02 | |
Hypothetical (5% return before expenses) | | | $1,000 | | | | $1,021.07 | | | | $4.18 | |
*Expenses are calculated using the most recent six-month annualized expense ratio for the Fund’s Class 2 shares (0.82%), which does not include any ongoing expenses of the Contract for which the Fund is an investment option, multiplied by the average account value over the period, multiplied by 184/365 to reflect the one-half year period.
FRANKLIN TEMPLETON VARIABLE INSURANCE PRODUCTS TRUST
Financial Highlights
Franklin High Income VIP Fund
| | | | | | | | | | | | | | | | | | | | |
| | | Year Ended December 31, | |
| | | 2014 | | | 2013 | | | 2012 | | | 2011 | | | 2010 | |
| Class 1 | | | | | | | | | | | | | | | | | | | | |
Per share operating performance
(for a share outstanding throughout the year) | | | | | | | | | | | | | | | | | | | | |
| | | | | |
Net asset value, beginning of year | | | $7.02 | | | | $7.01 | | | | $6.52 | | | | $6.63 | | | | $6.26 | |
| | | | |
| | | | | |
| Income from investment operationsa: | | | | | | | | | | | | | | | | | | | | |
| | | | | |
Net investment incomeb | | | 0.42 | | | | 0.46 | | | | 0.48 | | | | 0.50 | | | | 0.49 | |
| | | | | |
Net realized and unrealized gains (losses) | | | (0.38 | ) | | | 0.09 | | | | 0.51 | | | | (0.19 | ) | | | 0.32 | |
| | | | |
Total from investment operations | | | 0.04 | | | | 0.55 | | | | 0.99 | | | | 0.31 | | | | 0.81 | |
| | | | |
Less distributions from net investment income | | | (0.44 | ) | | | (0.54 | ) | | | (0.50 | ) | | | (0.42 | ) | | | (0.44 | ) |
| | | | |
Net asset value, end of year | | | $6.62 | | | | $7.02 | | | | $7.01 | | | | $6.52 | | | | $6.63 | |
| | | | |
| | | | | |
Total returnc | | | 0.21% | | | | 8.17% | | | | 15.94% | | | | 4.63% | | | | 13.71% | |
| | | | | |
| Ratios to average net assets | | | | | | | | | | | | | | | | | | | | |
| | | | | |
Expenses | | | 0.57% | d | | | 0.58% | d | | | 0.58% | | | | 0.58% | | | | 0.61% | |
| | | | | |
Net investment income | | | 6.00% | | | | 6.63% | | | | 7.15% | | | | 7.52% | | | | 7.71% | |
| | | | | |
| Supplemental data | | | | | | | | | | | | | | | | | | | | |
| | | | | |
Net assets, end of year (000’s) | | | $34,552 | | | | $39,300 | | | | $42,166 | | | | $41,971 | | | | $48,051 | |
| | | | | |
Portfolio turnover rate | | | 39.46% | | | | 30.78% | | | | 37.03% | | | | 45.11% | | | | 60.80% | |
aThe amount shown for a share outstanding throughout the period may not correlate with the Statement of Operations for the period due to the timing of sales and repurchases of the Fund shares in relation to income earned and/or fluctuating fair value of the investments of the Fund.
bBased on average daily shares outstanding.
cTotal return does not include fees, charges or expenses imposed by the variable annuity and life insurance contracts for which Franklin Templeton Variable Insurance Products Trust serves as an underlying investment vehicle.
dBenefit of expense reduction rounds to less than 0.01%.
| | | | |
| FH-6 | | Annual Report | The accompanying notes are an integral part of these financial statements. | | |
FRANKLIN TEMPLETON VARIABLE INSURANCE PRODUCTS TRUST
FINANCIAL HIGHLIGHTS
Franklin High Income VIP Fund (continued)
| | | | | | | | | | | | | | | | | | | | |
| | | Year Ended December 31, | |
| | | 2014 | | | 2013 | | | 2012 | | | 2011 | | | 2010 | |
| Class 2 | | | | | | | | | | | | | | | | | | | | |
Per share operating performance
(for a share outstanding throughout the year) | | | | | | | | | | | | | | | | | | | | |
| | | | | |
Net asset value, beginning of year | | | $6.81 | | | | $6.82 | | | | $6.36 | | | | $6.47 | | | | $6.13 | |
| | | | |
| | | | | |
| Income from investment operationsa: | | | | | | | | | | | | | | | | | | | | |
| | | | | |
Net investment incomeb | | | 0.39 | | | | 0.43 | | | | 0.46 | | | | 0.47 | | | | 0.47 | |
| | | | | |
Net realized and unrealized gains (losses) | | | (0.37 | ) | | | 0.08 | | | | 0.48 | | | | (0.18 | ) | | | 0.30 | |
| | | | |
Total from investment operations | | | 0.02 | | | | 0.51 | | | | 0.94 | | | | 0.29 | | | | 0.77 | |
| | | | |
Less distributions from net investment income | | | (0.42 | ) | | | (0.52 | ) | | | (0.48 | ) | | | (0.40 | ) | | | (0.43 | ) |
| | | | |
Net asset value, end of year | | | $6.41 | | | | $6.81 | | | | $6.82 | | | | $6.36 | | | | $6.47 | |
| | | | |
| | | | | |
Total returnc | | | (0.02)% | | | | 7.83% | | | | 15.56% | | | | 4.56% | | | | 13.26% | |
| | | | | |
| Ratios to average net assets | | | | | | | | | | | | | | | | | | | | |
| | | | | |
Expenses | | | 0.82% | d | | | 0.83% | d | | | 0.83% | | | | 0.83% | | | | 0.86% | |
| | | | | |
Net investment income | | | 5.75% | | | | 6.38% | | | | 6.90% | | | | 7.27% | | | | 7.46% | |
| | | | | |
| Supplemental data | | | | | | | | | | | | | | | | | | | | |
| | | | | |
Net assets, end of year (000’s) | | | $261,944 | | | | $291,826 | | | | $281,851 | | | | $249,452 | | | | $239,824 | |
| | | | | |
Portfolio turnover rate | | | 39.46% | | | | 30.78% | | | | 37.03% | | | | 45.11% | | | | 60.80% | |
aThe amount shown for a share outstanding throughout the period may not correlate with the Statement of Operations for the period due to the timing of sales and repurchases of the Fund shares in relation to income earned and/or fluctuating fair value of the investments of the Fund.
bBased on average daily shares outstanding.
cTotal return does not include fees, charges or expenses imposed by the variable annuity and life insurance contracts for which Franklin Templeton Variable Insurance Products Trust serves as an underlying investment vehicle.
dBenefit of expense reduction rounds to less than 0.01%.
| | | | | | |
| | | The accompanying notes are an integral part of these financial statements. | Annual Report | | | FH-7 | |
FRANKLIN TEMPLETON VARIABLE INSURANCE PRODUCTS TRUST
FINANCIAL HIGHLIGHTS
Franklin High Income VIP Fund (continued)
| | | | | | | | | | | | | | | | | | | | |
| | | Year Ended December 31, | |
| | | 2014 | | | 2013 | | | 2012 | | | 2011 | | | 2010 | |
| Class 4 | | | | | | | | | | | | | | | | | | | | |
Per share operating performance
(for a share outstanding throughout the year) | | | | | | | | | | | | | | | | | | | | |
| | | | | |
Net asset value, beginning of year | | | $6.94 | | | | $6.94 | | | | $6.46 | | | | $6.57 | | | | $6.22 | |
| | | | |
| | | | | |
| Income from investment operationsa: | | | | | | | | | | | | | | | | | | | | |
| | | | | |
Net investment incomeb | | | 0.39 | | | | 0.43 | | | | 0.46 | | | | 0.47 | | | | 0.47 | |
| | | | | |
Net realized and unrealized gains (losses) | | | (0.38 | ) | | | 0.08 | | | | 0.49 | | | | (0.18 | ) | | | 0.31 | |
| | | | |
Total from investment operations | | | 0.01 | | | | 0.51 | | | | 0.95 | | | | 0.29 | | | | 0.78 | |
| | | | |
Less distributions from net investment income | | | (0.41 | ) | | | (0.51 | ) | | | (0.47 | ) | | | (0.40 | ) | | | (0.43 | ) |
| | | | |
Net asset value, end of year | | | $6.54 | | | | $6.94 | | | | $6.94 | | | | $6.46 | | | | $6.57 | |
| | | | |
| | | | | |
Total returnc | | | (0.15)% | | | | 7.72% | | | | 15.50% | | | | 4.39% | | | | 13.31% | |
| | | | | |
| Ratios to average net assets | | | | | | | | | | | | | | | | | | | | |
| | | | | |
Expenses | | | 0.92% | d | | | 0.93% | d | | | 0.93% | | | | 0.93% | | | | 0.96% | |
| | | | | |
Net investment income | | | 5.65% | | | | 6.28% | | | | 6.80% | | | | 7.17% | | | | 7.36% | |
| | | | | |
| Supplemental data | | | | | | | | | | | | | | | | | | | | |
| | | | | |
Net assets, end of year (000’s) | | | $25,740 | | | | $27,789 | | | | $27,664 | | | | $27,055 | | | | $25,934 | |
| | | | | |
Portfolio turnover rate | | | 39.46% | | | | 30.78% | | | | 37.03% | | | | 45.11% | | | | 60.80% | |
aThe amount shown for a share outstanding throughout the period may not correlate with the Statement of Operations for the period due to the timing of sales and repurchases of the Fund shares in relation to income earned and/or fluctuating fair value of the investments of the Fund.
bBased on average daily shares outstanding.
cTotal return does not include fees, charges or expenses imposed by the variable annuity and life insurance contracts for which Franklin Templeton Variable Insurance Products Trust serves as an underlying investment vehicle.
dBenefit of expense reduction rounds to less than 0.01%.
| | | | |
| FH-8 | | Annual Report | The accompanying notes are an integral part of these financial statements. | | |
FRANKLIN TEMPLETON VARIABLE INSURANCE PRODUCTS TRUST
Statement of Investments, December 31, 2014
| | | | | | | | | | | | | | |
| Franklin High Income VIP Fund | | | | |
| | | | | Country | | | Shares | | | Value | |
| | | | | | | | | | | | | | |
| | Common Stocks 0.2% | | | | | | | | | | | | |
| | Materials 0.1% | | | | | | | | | | | | |
| | NewPage Holdings Inc. | | | United States | | | | 5,000 | | | $ | 453,750 | |
| | | | | | | | | | | | | | |
| | Transportation 0.1% | | | | | | | | | | | | |
| a | | CEVA Holdings LLC | | | United Kingdom | | | | 224 | | | | 173,817 | |
| | | | | | | | | | | | | | |
| | | | |
| | Total Common Stocks (Cost $1,274,328) | | | | | | | | | | | 627,567 | |
| | | | | | | | | | | | | | |
| | Convertible Preferred Stocks 0.1% | | | | | | | | | | | | |
| | Transportation 0.1% | | | | | | | | | | | | |
| a | | CEVA Holdings LLC, cvt. pfd., A-1 | | | United Kingdom | | | | 6 | | | | 6,000 | |
| a | | CEVA Holdings LLC, cvt. pfd., A-2 | | | United Kingdom | | | | 486 | | | | 376,270 | |
| | | | | | | | | | | | | | |
| | | | |
| | Total Convertible Preferred Stocks
(Cost $731,856) | | | | | | | | | | | 382,270 | |
| | | | | | | | | | | | | | |
| | | | |
| | | | | | | | Principal Amount* | | | | |
| | Corporate Bonds 92.8% | | | | | | | | | | | | |
| | Automobiles & Components 0.7% | | | | | | | | | | | | |
| | The Goodyear Tire & Rubber Co., senior note, 6.50%, 3/01/21 | | | United States | | | | 2,200,000 | | | | 2,343,000 | |
| | | | | | | | | | | | | | |
| | Banks 5.3% | | | | | | | | | | | | |
| b | | Bank of America Corp., junior sub. bond, M, 8.125% to 5/15/18, FRN thereafter, Perpetual | | | United States | | | | 2,500,000 | | | | 2,709,375 | |
| | CIT Group Inc., senior note, | | | | | | | | | | | | |
| | 5.375%, 5/15/20 | | | United States | | | | 1,700,000 | | | | 1,803,106 | |
| | 5.00%, 8/15/22 | | | United States | | | | 2,700,000 | | | | 2,784,375 | |
| b | | Citigroup Inc., junior sub. bond, M, 6.30% to 5/15/24, FRN thereafter, Perpetual | | | United States | | | | 2,800,000 | | | | 2,765,000 | |
| b | | JPMorgan Chase & Co., junior sub. bond, | | | | | | | | | | | | |
| | R, 6.00% to 8/01/23, FRN thereafter, Perpetual | | | United States | | | | 2,500,000 | | | | 2,481,250 | |
| | V, 5.00% to 7/30/19, FRN thereafter, Perpetual | | | United States | | | | 1,400,000 | | | | 1,376,812 | |
| | Royal Bank of Scotland Group PLC, sub. note, | | | | | | | | | | | | |
| | 6.125%, 12/15/22 | | | United Kingdom | | | | 2,000,000 | | | | 2,176,250 | |
| | 5.125%, 5/28/24 | | | United Kingdom | | | | 900,000 | | | | 916,875 | |
| | | | | | | | | | | | | | |
| | | | | | | | | | | | | 17,013,043 | |
| | | | | | | | | | | | | | |
| | Capital Goods 2.1% | | | | | | | | | | | | |
| c | | Abengoa Finance SAU, senior note, 144A, | | | | | | | | | | | | |
| | 8.875%, 11/01/17 | | | Spain | | | | 2,500,000 | | | | 2,421,875 | |
| | 7.75%, 2/01/20 | | | Spain | | | | 400,000 | | | | 357,000 | |
| c | | AECOM Technology Corp., | | | | | | | | | | | | |
| | senior bond, 144A, 5.875%, 10/15/24 | | | United States | | | | 200,000 | | | | 205,000 | |
| | senior note, 144A, 5.75%, 10/15/22 | | | United States | | | | 300,000 | | | | 307,500 | |
| | Navistar International Corp., senior note, 8.25%, 11/01/21 | | | United States | | | | 1,500,000 | | | | 1,485,000 | |
| | TransDigm Inc., | | | | | | | | | | | | |
| | senior sub. bond, 6.50%, 7/15/24 | | | United States | | | | 500,000 | | | | 505,000 | |
| | senior sub. note, 6.00%, 7/15/22 | | | United States | | | | 500,000 | | | | 501,250 | |
| c | | Zachry Holdings Inc., senior note, 144A, 7.50%, 2/01/20 | | | United States | | | | 1,100,000 | | | | 1,111,000 | |
| | | | | | | | | | | | | | |
| | | | | | | | | | | | | 6,893,625 | |
| | | | | | | | | | | | | | |
| | Commercial & Professional Services 1.0% | | | | | | | | | | | | |
| c | | Algeco Scotsman Global Finance PLC, senior secured note, first lien, 144A, 8.50%, 10/15/18 | | | United Kingdom | | | | 1,300,000 | | | | 1,263,438 | |
| d,e | | Goss Graphic Systems Inc., senior sub. note, 12.25%, 11/19/05 | | | United States | | | | 1,912,374 | | | | 191 | |
| c | | IHS Inc., senior note, 144A, 5.00%, 11/01/22 | | | United States | | | | 600,000 | | | | 597,000 | |
| | United Rentals North America Inc., senior bond, 5.75%, 11/15/24 | | | United States | | | | 1,400,000 | | | | 1,445,500 | |
| | | | | | | | | | | | | | |
| | | | | | | | | | | | | 3,306,129 | |
| | | | | | | | | | | | | | |
FRANKLIN TEMPLETON VARIABLE INSURANCE PRODUCTS TRUST
STATEMENT OF INVESTMENTS
Franklin High Income VIP Fund (continued)
| | | | | | | | | | | | | | |
| | | | | Country | | | Principal Amount* | | | Value | |
| | | | | | | | | | | | | | |
| | Corporate Bonds (continued) | | | | | | | | | | | | |
| | Consumer Durables & Apparel 3.2% | | | | | | | | | | | | |
| | KB Home, | | | | | | | | | | | | |
| | senior bond, 7.50%, 9/15/22 | | | United States | | | | 2,100,000 | | | $ | 2,236,500 | |
| | senior note, 4.75%, 5/15/19 | | | United States | | | | 600,000 | | | | 592,500 | |
| | senior note, 7.00%, 12/15/21 | | | United States | | | | 700,000 | | | | 738,063 | |
| | Standard Pacific Corp., senior note, 6.25%, 12/15/21 | | | United States | | | | 1,500,000 | | | | 1,545,000 | |
| c | | Taylor Morrison Communities Inc./Monarch Communities Inc.,
senior note, 144A, | | | | | | | | | | | | |
| | 7.75%, 4/15/20 | | | United States | | | | 1,140,000 | | | | 1,214,100 | |
| | 5.25%, 4/15/21 | | | United States | | | | 900,000 | | | | 891,000 | |
| | 5.625%, 3/01/24 | | | United States | | | | 1,500,000 | | | | 1,455,000 | |
| | Visant Corp., senior note, 10.00%, 10/01/17 | | | United States | | | | 1,900,000 | | | | 1,672,000 | |
| | | | | | | | | | | | | | |
| | | | | | | | | | | | | 10,344,163 | |
| | | | | | | | | | | | | | |
| | Consumer Services 3.8% | | | | | | | | | | | | |
| c | | 1011778 BC ULC/New Red Finance Inc., secured note, second lien, 144A, 6.00%, 4/01/22 | | | Canada | | | | 2,000,000 | | | | 2,060,000 | |
| c | | 24 Hour Holdings III LLC, senior note, 144A, 8.00%, 6/01/22 | | | United States | | | | 2,000,000 | | | | 1,610,000 | |
| | Caesars Entertainment Operating Co. Inc., senior secured note, first lien, 11.25%, 6/01/17 | | | United States | | | | 2,600,000 | | | | 1,918,800 | |
| c,d | | Fontainebleau Las Vegas, senior secured note, first lien, 144A,
11.00%, 6/15/15 | | | United States | | | | 1,700,000 | | | | 21,250 | |
| | MGM Resorts International, senior note, | | | | | | | | | | | | |
| | 5.25%, 3/31/20 | | | United States | | | | 2,900,000 | | | | 2,885,500 | |
| | 6.625%, 12/15/21 | | | United States | | | | 300,000 | | | | 316,500 | |
| | Pinnacle Entertainment Inc., | | | | | | | | | | | | |
| | senior note, 6.375%, 8/01/21 | | | United States | | | | 600,000 | | | | 621,000 | |
| | senior sub. note, 7.75%, 4/01/22 | | | United States | | | | 1,100,000 | | | | 1,149,500 | |
| c | | Scientific Games International Inc., | | | | | | | | | | | | |
| | senior note, 144A, 10.00%, 12/01/22 | | | United States | | | | 1,100,000 | | | | 1,013,375 | |
| | senior secured note, first lien, 144A, 7.00%, 1/01/22 | | | United States | | | | 800,000 | | | | 814,000 | |
| | | | | | | | | | | | | | |
| | | | | | | | | | | | | 12,409,925 | |
| | | | | | | | | | | | | | |
| | Diversified Financials 3.6% | | | | | | | | | | | | |
| c | | AerCap Ireland Capital Ltd./AerCap Global Aviation Trust, senior note, 144A, 5.00%, 10/01/21 | | | Netherlands | | | | 1,100,000 | | | | 1,146,063 | |
| | Ally Financial Inc., senior bond, 5.125%, 9/30/24 | | | United States | | | | 800,000 | | | | 814,000 | |
| | E*TRADE Financial Corp., senior note, 5.375%, 11/15/22 | | | United States | | | | 1,300,000 | | | | 1,332,500 | |
| | Navient Corp., senior note, | | | | | | | | | | | | |
| | 8.45%, 6/15/18 | | | United States | | | | 800,000 | | | | 894,000 | |
| | 5.50%, 1/15/19 | | | United States | | | | 3,500,000 | | | | 3,587,500 | |
| c | | NOVA Chemicals Corp., senior bond, 144A, 5.00%, 5/01/25 | | | Canada | | | | 2,000,000 | | | | 1,990,000 | |
| c | | OneMain Financial Holdings Inc., senior note, 144A, 7.25%, 12/15/21 | | | United States | | | | 1,700,000 | | | | 1,751,000 | |
| | | | | | | | | | | | | | |
| | | | | | | | | | | | | 11,515,063 | |
| | | | | | | | | | | | | | |
| | Energy 18.6% | | | | | | | | | | | | |
| c | | California Resources Corp., | | | | | | | | | | | | |
| | senior bond, 144A, 6.00%, 11/15/24 | | | United States | | | | 1,000,000 | | | | 850,000 | |
| | senior note, 144A, 5.50%, 9/15/21 | | | United States | | | | 800,000 | | | | 688,000 | |
| | CGG SA, senior note, 6.875%, 1/15/22 | | | France | | | | 2,300,000 | | | | 1,752,312 | |
| | CHC Helicopter SA, | | | | | | | | | | | | |
| | senior note, 9.375%, 6/01/21 | | | Canada | | | | 260,000 | | | | 245,700 | |
| | senior secured note, first lien, 9.25%, 10/15/20 | | | Canada | | | | 2,700,000 | | | | 2,632,500 | |
| | Chesapeake Energy Corp., senior note, 6.625%, 8/15/20 | | | United States | | | | 3,000,000 | | | | 3,202,500 | |
| c | | Compressco Partners LP/Finance Corp., senior note, 144A, 7.25%, 8/15/22 | | | United States | | | | 700,000 | | | | 609,000 | |
FRANKLIN TEMPLETON VARIABLE INSURANCE PRODUCTS TRUST
STATEMENT OF INVESTMENTS
Franklin High Income VIP Fund (continued)
| | | | | | | | | | | | | | |
| | | | | Country | | | Principal Amount* | | | Value | |
| | | | | | | | | | | | | | |
| | Corporate Bonds (continued) | | | | | | | | | | | | |
| | Energy (continued) | | | | | | | | | | | | |
| | CONSOL Energy Inc., senior note, | | | | | | | | | | | | |
| | 8.25%, 4/01/20 | | | United States | | | | 1,000,000 | | | $ | 1,041,250 | |
| | 6.375%, 3/01/21 | | | United States | | | | 300,000 | | | | 301,500 | |
| | c144A, 5.875%, 4/15/22 | | | United States | | | | 1,100,000 | | | | 1,028,500 | |
| c | | Drill Rigs Holdings Inc., secured note, 144A, 6.50%, 10/01/17 | | | United States | | | | 2,000,000 | | | | 1,670,000 | |
| | Energy Transfer Equity LP, | | | | | | | | | | | | |
| | senior bond, 5.875%, 1/15/24 | | | United States | | | | 400,000 | | | | 408,000 | |
| | senior note, 7.50%, 10/15/20 | | | United States | | | | 2,600,000 | | | | 2,899,000 | |
| | Energy XXI Gulf Coast Inc., senior note, | | | | | | | | | | | | |
| | 7.50%, 12/15/21 | | | United States | | | | 1,000,000 | | | | 545,000 | |
| | c144A, 6.875%, 3/15/24 | | | United States | | | | 1,200,000 | | | | 651,000 | |
| c | | EnQuest PLC, senior note, 144A, 7.00%, 4/15/22 | | | United Kingdom | | | | 1,200,000 | | | | 737,250 | |
| | EPL Oil & Gas Inc., senior note, 8.25%, 2/15/18 | | | United States | | | | 1,400,000 | | | | 1,071,000 | |
| | Goodrich Petroleum Corp., senior note, 8.875%, 3/15/19 | | | United States | | | | 2,500,000 | | | | 1,237,500 | |
| | Halcon Resources Corp., senior note, | | | | | | | | | | | | |
| | 8.875%, 5/15/21 | | | United States | | | | 2,500,000 | | | | 1,893,750 | |
| | 9.25%, 2/15/22 | | | United States | | | | 1,100,000 | | | | 816,750 | |
| c | | Kinder Morgan Inc., senior secured bond, first lien, 144A, 5.625%, 11/15/23 | | | United States | | | | 1,500,000 | | | | 1,608,390 | |
| | Linn Energy LLC/Finance Corp., senior note, | | | | | | | | | | | | |
| | 8.625%, 4/15/20 | | | United States | | | | 2,000,000 | | | | 1,750,000 | |
| | 7.75%, 2/01/21 | | | United States | | | | 700,000 | | | | 593,250 | |
| | 6.50%, 9/15/21 | | | United States | | | | 300,000 | | | | 244,500 | |
| | Martin Midstream Partners LP/Martin Midstream Finance Corp., senior note, 7.25%, 2/15/21 | | | United States | | | | 1,100,000 | | | | 1,039,500 | |
| c | | Memorial Resource Development Corp., senior note, 144A, 5.875%, 7/01/22 | | | United States | | | | 1,100,000 | | | | 998,250 | |
| | Midstates Petroleum Co. Inc./LLC, senior note, 9.25%, 6/01/21 | | | United States | | | | 2,000,000 | | | | 1,020,000 | |
| c | | Murray Energy Corp., senior secured note, 144A, 8.625%, 6/15/21 | | | United States | | | | 1,300,000 | | | | 1,248,000 | |
| c | | Ocean Rig UDW Inc., senior note, 144A, 7.25%, 4/01/19 | | | United States | | | | 2,700,000 | | | | 1,908,562 | |
| | Offshore Group Investment Ltd., | | | | | | | | | | | | |
| | senior bond, first lien, 7.125%, 4/01/23 | | | United States | | | | 1,000,000 | | | | 720,000 | |
| | senior secured note, first lien, 7.50%, 11/01/19 | | | United States | | | | 2,000,000 | | | | 1,502,500 | |
| | PBF Holding Co. LLC, first lien, 8.25%, 2/15/20 | | | United States | | | | 2,500,000 | | | | 2,525,000 | |
| | Peabody Energy Corp., senior note, | | | | | | | | | | | | |
| | 6.50%, 9/15/20 | | | United States | | | | 1,700,000 | | | | 1,483,250 | |
| | 6.25%, 11/15/21 | | | United States | | | | 1,700,000 | | | | 1,459,875 | |
| | Penn Virginia Corp., senior note, 8.50%, 5/01/20 | | | United States | | | | 1,200,000 | | | | 966,000 | |
| | Penn Virginia Resource Partners LP/Penn Virginia Resource Finance Corp., senior note, | | | | | | | | | | | | |
| | 8.375%, 6/01/20 | | | United States | | | | 902,000 | | | | 967,395 | |
| | 6.50%, 5/15/21 | | | United States | | | | 600,000 | | | | 609,000 | |
| | QEP Resources Inc., senior note, | | | | | | | | | | | | |
| | 5.375%, 10/01/22 | | | United States | | | | 1,500,000 | | | | 1,425,000 | |
| | 5.25%, 5/01/23 | | | United States | | | | 1,500,000 | | | | 1,410,000 | |
| | Quicksilver Resources Inc., | | | | | | | | | | | | |
| | c,fsecured note, second lien, 144A, FRN, 7.00%, 6/21/19 | | | United States | | | | 1,000,000 | | | | 747,500 | |
| | senior note, 9.125%, 8/15/19 | | | United States | | | | 500,000 | | | | 127,500 | |
| c | | Regency Energy Partners LP/Regency Energy Finance Corp., senior note, 144A, 8.375%, 6/01/19 | | | United States | | | | 2,500,000 | | | | 2,631,250 | |
| | Sabine Pass Liquefaction LLC, | | | | | | | | | | | | |
| | first lien, 5.625%, 2/01/21 | | | United States | | | | 2,400,000 | | | | 2,370,000 | |
| | first lien, 5.625%, 4/15/23 | | | United States | | | | 900,000 | | | | 884,250 | |
| | senior secured, first lien, 5.75%, 5/15/24 | | | United States | | | | 200,000 | | | | 197,250 | |
| | Samson Investment Co., senior note, 9.75%, 2/15/20 | | | United States | | | | 2,700,000 | | | | 1,132,313 | |
FRANKLIN TEMPLETON VARIABLE INSURANCE PRODUCTS TRUST
STATEMENT OF INVESTMENTS
Franklin High Income VIP Fund (continued)
| | | | | | | | | | | | | | |
| | | | | Country | | | Principal Amount* | | | Value | |
| | | | | | | | | | | | | | |
| | Corporate Bonds (continued) | | | | | | | | | | | | |
| | Energy (continued) | | | | | | | | | | | | |
| | Sanchez Energy Corp., senior note, | | | | | | | | | | | | |
| | 7.75%, 6/15/21 | | | United States | | | | 1,800,000 | | | $ | 1,683,000 | |
| | c 144A, 6.125%, 1/15/23 | | | United States | | | | 700,000 | | | | 589,750 | |
| c | | Ultra Petroleum Corp., senior bond, 144A, 6.125%, 10/01/24 | | | United States | | | | 2,100,000 | | | | 1,816,500 | |
| | | | | | | | | | | | | | |
| | | | | | | | | | | | | 59,938,297 | |
| | | | | | | | | | | | | | |
| | Food, Beverage & Tobacco 3.4% | | | | | | | | | | | | |
| | Constellation Brands Inc., senior bond, 4.75%, 11/15/24 | | | United States | | | | 900,000 | | | | 913,500 | |
| c | | Cott Beverages Inc., senior note, 144A, 6.75%, 1/01/20 | | | United States | | | | 1,100,000 | | | | 1,102,750 | |
| c | | Dole Food Co. Inc., senior secured note, 144A, 7.25%, 5/01/19 | | | United States | | | | 1,500,000 | | | | 1,498,125 | |
| c | | JBS USA LLC/Finance Inc., | | | | | | | | | | | | |
| | senior bond, 144A, 5.875%, 7/15/24 | | | United States | | | | 600,000 | | | | 595,500 | |
| | senior note, 144A, 8.25%, 2/01/20 | | | United States | | | | 2,600,000 | | | | 2,749,500 | |
| | Post Holdings Inc., senior note, | | | | | | | | | | | | |
| | 7.375%, 2/15/22 | | | United States | | | | 1,600,000 | | | | 1,604,000 | |
| | c 144A, 6.75%, 12/01/21 | | | United States | | | | 1,100,000 | | | | 1,069,750 | |
| | c 144A, 6.00%, 12/15/22 | | | United States | | | | 300,000 | | | | 282,375 | |
| | WhiteWave Foods Co., senior note, 5.375%, 10/01/22 | | | United States | | | | 1,100,000 | | | | 1,135,750 | |
| | | | | | | | | | | | | | |
| | | | | | | | | | | | | 10,951,250 | |
| | | | | | | | | | | | | | |
| | Health Care Equipment & Services 5.0% | | | | | | | | | | | | |
| | Alere Inc., | | | | | | | | | | | | |
| | senior note, 7.25%, 7/01/18 | | | United States | | | | 2,200,000 | | | | 2,299,000 | |
| | senior sub. note, 6.50%, 6/15/20 | | | United States | | | | 300,000 | | | | 303,750 | |
| | CHS/Community Health Systems Inc., senior note, | | | | | | | | | | | | |
| | 8.00%, 11/15/19 | | | United States | | | | 1,200,000 | | | | 1,284,000 | |
| | 7.125%, 7/15/20 | | | United States | | | | 700,000 | | | | 747,250 | |
| | 6.875%, 2/01/22 | | | United States | | | | 1,300,000 | | | | 1,383,687 | |
| | DaVita HealthCare Partners Inc., senior bond, 5.125%, 7/15/24 | | | United States | | | | 1,400,000 | | | | 1,430,625 | |
| | HCA Inc., | | | | | | | | | | | | |
| | senior note, 5.875%, 5/01/23 | | | United States | | | | 2,500,000 | | | | 2,640,625 | |
| | senior secured note, first lien, 5.00%, 3/15/24 | | | United States | | | | 2,300,000 | | | | 2,369,000 | |
| | Tenet Healthcare Corp., senior note, | | | | | | | | | | | | |
| | 8.125%, 4/01/22 | | | United States | | | | 3,000,000 | | | | 3,360,000 | |
| | c 144A, 5.00%, 3/01/19 | | | United States | | | | 200,000 | | | | 200,750 | |
| | | | | | | | | | | | | | |
| | | | | | | | | | | | | 16,018,687 | |
| | | | | | | | | | | | | | |
| | Materials 11.0% | | | | | | | | | | | | |
| | ArcelorMittal, senior note, 6.00%, 3/01/21 | | | Luxembourg | | | | 1,900,000 | | | | 1,969,093 | |
| c | | Ardagh Packaging Finance PLC, senior note, 144A, 9.125%, 10/15/20 | | | Luxembourg | | | | 600,000 | | | | 640,500 | |
| c | | Ardagh Packaging Finance PLC/Ardagh MP Holdings USA Inc., senior note, 144A, | | | | | | | | | | | | |
| | 6.25%, 1/31/19 | | | Luxembourg | | | | 300,000 | | | | 294,000 | |
| | 7.00%, 11/15/20 | | | Luxembourg | | | | 176,471 | | | | 179,118 | |
| | 6.75%, 1/31/21 | | | Luxembourg | | | | 300,000 | | | | 296,813 | |
| | 6.00%, 6/30/21 | | | Luxembourg | | | | 1,900,000 | | | | 1,819,250 | |
| c | | Barminco Finance Pty. Ltd., senior note, 144A, 9.00%, 6/01/18 | | | Australia | | | | 2,000,000 | | | | 1,801,250 | |
| c | | BlueScope Steel Ltd./BlueScope Steel Finance, senior note, 144A, 7.125%, 5/01/18 | | | Australia | | | | 2,000,000 | | | | 2,080,000 | |
| c | | Cemex Finance LLC, senior secured note, 144A, 6.00%, 4/01/24 | | | Mexico | | | | 1,700,000 | | | | 1,645,812 | |
| c | | Constellium NV, senior note, 144A, 5.75%, 5/15/24 | | | Netherlands | | | | 1,100,000 | | | | 962,500 | |
| c | | Eldorado Gold Corp., senior note, 144A, 6.125%, 12/15/20 | | | Canada | | | | 3,100,000 | | | | 3,022,500 | |
FRANKLIN TEMPLETON VARIABLE INSURANCE PRODUCTS TRUST
STATEMENT OF INVESTMENTS
Franklin High Income VIP Fund (continued)
| | | | | | | | | | | | | | |
| | | | | Country | | | Principal Amount* | | | Value | |
| | | | | | | | | | | | | | |
| | Corporate Bonds (continued) | | | | | | | | | | | | |
| | Materials (continued) | | | | | | | | | | | | |
| c | | First Quantum Minerals Ltd., senior note, 144A, | | | | | | | | | | | | |
| | 6.75%, 2/15/20 | | | Canada | | | | 2,000,000 | | | $ | 1,820,000 | |
| | 7.00%, 2/15/21 | | | Canada | | | | 1,836,000 | | | | 1,661,580 | |
| c | | FMG Resources (August 2006) Pty. Ltd., senior note, 144A, | | | | | | | | | | | | |
| | 6.875%, 2/01/18 | | | Australia | | | | 888,889 | | | | 811,667 | |
| | 8.25%, 11/01/19 | | | Australia | | | | 500,000 | | | | 456,875 | |
| c | | Ineos Finance PLC, senior secured note, 144A, 7.50%, 5/01/20 | | | Switzerland | | | | 500,000 | | | | 525,937 | |
| c | | Ineos Group Holdings SA, senior note, 144A, | | | | | | | | | | | | |
| | 6.125%, 8/15/18 | | | Switzerland | | | | 1,300,000 | | | | 1,254,500 | |
| | 5.875%, 2/15/19 | | | Switzerland | | | | 700,000 | | | | 665,000 | |
| | Olin Corp., senior bond, 5.50%, 8/15/22 | | | United States | | | | 1,700,000 | | | | 1,729,750 | |
| c | | Owens-Brockway Glass Container Inc., senior note, 144A, 5.00%, 1/15/22 | | | United States | | | | 1,300,000 | | | | 1,327,625 | |
| c | | Polymer Group Inc., senior note, 144A, 6.875%, 6/01/19 | | | United States | | | | 1,500,000 | | | | 1,445,625 | |
| c | | Rain CII Carbon LLC/CII Carbon Corp., second lien, 144A, 8.25%, 1/15/21 | | | United States | | | | 1,200,000 | | | | 1,233,000 | |
| | Reynolds Group Issuer Inc./LLC/SA, | | | | | | | | | | | | |
| | first lien, 5.75%, 10/15/20 | | | United States | | | | 1,400,000 | | | | 1,442,000 | |
| | senior note, 8.50%, 5/15/18 | | | United States | | | | 2,800,000 | | | | 2,870,000 | |
| | senior note, 9.00%, 4/15/19 | | | United States | | | | 1,200,000 | | | | 1,248,000 | |
| | senior note, 9.875%, 8/15/19 | | | United States | | | | 200,000 | | | | 213,000 | |
| | senior note, 8.25%, 2/15/21 | | | United States | | | | 400,000 | | | | 412,000 | |
| c | | Sealed Air Corp., senior note, 144A, 8.375%, 9/15/21 | | | United States | | | | 100,000 | | | | 112,250 | |
| c | | Steel Dynamics Inc., | | | | | | | | | | | | |
| | senior bond, 144A, 5.50%, 10/01/24 | | | United States | | | | 800,000 | | | | 822,000 | |
| | senior note, 144A, 5.125%, 10/01/21 | | | United States | | | | 800,000 | | | | 815,000 | |
| | | | | | | | | | | | | | |
| | | | | | | | | | | | | 35,576,645 | |
| | | | | | | | | | | | | | |
| | Media 10.8% | | | | | | | | | | | | |
| c | | Anna Merger Sub Inc., senior note, 144A, 7.75%, 10/01/22 | | | United States | | | | 1,100,000 | | | | 1,116,500 | |
| | CCO Holdings LLC/CCO Holdings Capital Corp., | | | | | | | | | | | | |
| | senior bond, 5.25%, 9/30/22 | | | United States | | | | 900,000 | | | | 901,125 | |
| | senior note, 6.50%, 4/30/21 | | | United States | | | | 1,500,000 | | | | 1,580,625 | |
| | CCOH Safari LLC, senior bond, 5.75%, 12/01/24 | | | United States | | | | 600,000 | | | | 608,250 | |
| | Clear Channel Worldwide Holdings Inc., | | | | | | | | | | | | |
| | senior note, 6.50%, 11/15/22 | | | United States | | | | 1,000,000 | | | | 1,035,000 | |
| | senior sub. note, 7.625%, 3/15/20 | | | United States | | | | 1,100,000 | | | | 1,163,250 | |
| | CSC Holdings LLC, senior note, | | | | | | | | | | | | |
| | 6.75%, 11/15/21 | | | United States | | | | 1,500,000 | | | | 1,663,125 | |
| | c 144A, 5.25%, 6/01/24 | | | United States | | | | 1,000,000 | | | | 1,007,500 | |
| c | | DISH DBS Corp., senior note, 144A, 5.875%, 11/15/24 | | | United States | | | | 3,100,000 | | | | 3,123,250 | |
| | Gannett Co. Inc., | | | | | | | | | | | | |
| | senior bond, 6.375%, 10/15/23 | | | United States | | | | 2,000,000 | | | | 2,130,000 | |
| | senior note, 5.125%, 7/15/20 | | | United States | | | | 1,400,000 | | | | 1,435,000 | |
| | iHeartCommunications Inc., | | | | | | | | | | | | |
| | senior secured bond, first lien, 9.00%, 3/01/21 | | | United States | | | | 2,500,000 | | | | 2,459,375 | |
| | c senior secured note, first lien, 144A, 9.00%, 9/15/22 | | | United States | | | | 700,000 | | | | 687,750 | |
| c | | Nielsen Finance LLC/Co., senior note, 144A, 5.00%, 4/15/22 | | | United States | | | | 1,000,000 | | | | 1,006,250 | |
| c,g | | Radio One Inc., senior sub. note, 144A, 9.25%, 2/15/20 | | | United States | | | | 800,000 | | | | 700,000 | |
| c | | Sirius XM Radio Inc., senior bond, 144A, 6.00%, 7/15/24 | | | United States | | | | 2,500,000 | | | | 2,568,750 | |
| c | | Unitymedia KabelBW GmbH, senior bond, 144A, 6.125%, 1/15/25 | | | Germany | �� | | | 1,200,000 | | | | 1,243,500 | |
FRANKLIN TEMPLETON VARIABLE INSURANCE PRODUCTS TRUST
STATEMENT OF INVESTMENTS
Franklin High Income VIP Fund (continued)
| | | | | | | | | | | | | | |
| | | | | Country | | | Principal Amount* | | | Value | |
| | | | | | | | | | | | | | |
| | Corporate Bonds (continued) | | | | | | | | | | | | |
| | Media (continued) | | | | | | | | | | | | |
| c | | Univision Communications Inc., senior secured note, 144A, | | | | | | | | | | | | |
| | 6.875%, 5/15/19 | | | United States | | | | 2,500,000 | | | $ | 2,609,375 | |
| | 7.875%, 11/01/20 | | | United States | | | | 700,000 | | | | 749,000 | |
| c | | UPCB Finance III Ltd., senior secured note, 144A, 6.625%, 7/01/20 | | | Netherlands | | | | 1,000,000 | | | | 1,052,500 | |
| c | | UPCB Finance VI Ltd., senior secured note, 144A, 6.875%, 1/15/22 | | | Netherlands | | | | 500,000 | | | | 544,688 | |
| c | | Virgin Media Finance PLC, senior bond, 144A, 6.375%, 4/15/23 | | | United Kingdom | | | | 1,700,000 | | | | 1,789,250 | |
| c | | Virgin Media Secured Finance PLC, senior secured bond, first lien, 144A, 5.50%, 1/15/25 | | | United Kingdom | | | | 1,100,000 | | | | 1,139,187 | |
| c | | WMG Acquisition Corp., senior note, 144A, 5.625%, 4/15/22 | | | United States | | | | 2,500,000 | | | | 2,431,250 | |
| | | | | | | | | | | | | | |
| | | | | | | | | | | | | 34,744,500 | |
| | | | | | | | | | | | | | |
| | Pharmaceuticals, Biotechnology & Life Sciences 3.3% | | | | | | | | | | | | |
| c | | inVentiv Health Inc., senior secured note, 144A, 9.00%, 1/15/18 | | | United States | | | | 300,000 | | | | 307,500 | |
| c,h | | Jaguar Holding Co. I, senior note, 144A, PIK, 9.375%, 10/15/17 | | | United States | | | | 2,400,000 | | | | 2,458,800 | |
| c | | Jaguar Holding Co. II/Merger Sub Inc., senior note, 144A, 9.50%, 12/01/19 | | | United States | | | | 700,000 | | | | 753,375 | |
| | Par Pharmaceutical Cos. Inc., senior note, 7.375%, 10/15/20 | | | United States | | | | 3,300,000 | | | | 3,465,000 | |
| c | | Valeant Pharmaceuticals International Inc., senior note, 144A, | | | | | | | | | | | | |
| | 7.50%, 7/15/21 | | | United States | | | | 200,000 | | | | 216,750 | |
| | 5.625%, 12/01/21 | | | United States | | | | 300,000 | | | | 303,000 | |
| c | | VPI Escrow Corp., senior note, 144A, 6.375%, 10/15/20 | | | United States | | | | 3,000,000 | | | | 3,146,250 | |
| | | | | | | | | | | | | | |
| | | | | | | | | | | | | 10,650,675 | |
| | | | | | | | | | | | | | |
| | Retailing 1.0% | | | | | | | | | | | | |
| c | | American Builders & Contractors Supply Co. Inc., senior note, 144A, 5.625%, 4/15/21 | | | United States | | | | 2,100,000 | | | | 2,115,750 | |
| c | | New Look Bondco I PLC, secured note, 144A, 8.375%, 5/14/18 | | | United Kingdom | | | | 1,000,000 | | | | 1,054,375 | |
| | | | | | | | | | | | | | |
| | | | | | | | | | | | | 3,170,125 | |
| | | | | | | | | | | | | | |
| | Semiconductors & Semiconductor Equipment 0.1% | | | | | | | | | | | | |
| | Freescale Semiconductor Inc., senior note, 8.05%, 2/01/20 | | | United States | | | | 472,000 | | | | 499,140 | |
| | | | | | | | | | | | | | |
| | Software & Services 3.6% | | | | | | | | | | | | |
| c | | BMC Software Finance Inc., senior note, 144A, 8.125%, 7/15/21 | | | United States | | | | 2,500,000 | | | | 2,362,500 | |
| | Equinix Inc., senior bond, 5.375%, 4/01/23 | | | United States | | | | 3,300,000 | | | | 3,316,500 | |
| | First Data Corp., | | | | | | | | | | | | |
| | senior bond, 12.625%, 1/15/21 | | | United States | | | | 1,000,000 | | | | 1,190,000 | |
| | senior note, 11.25%, 1/15/21 | | | United States | | | | 646,000 | | | | 734,825 | |
| | csenior secured bond, 144A, 8.25%, 1/15/21 | | | United States | | | | 2,500,000 | | | | 2,687,500 | |
| | Sterling International Inc., senior note, 11.00%, 10/01/19 | | | United States | | | | 1,200,000 | | | | 1,281,000 | |
| | | | | | | | | | | | | | |
| | | | | | | | | | | | | 11,572,325 | |
| | | | | | | | | | | | | | |
| | Technology Hardware & Equipment 1.6% | | | | | | | | | | | | |
| c | | Alcatel-Lucent USA Inc., senior note, 144A, 6.75%, 11/15/20 | | | France | | | | 3,400,000 | | | | 3,605,700 | |
| c | | Blackboard Inc., senior note, 144A, 7.75%, 11/15/19 | | | United States | | | | 1,500,000 | | | | 1,511,250 | |
| | | | | | | | | | | | | | |
| | | | | | | | | | | | | 5,116,950 | |
| | | | | | | | | | | | | | |
| | Telecommunication Services 10.2% | | | | | | | | | | | | |
| | CenturyLink Inc., | | | | | | | | | | | | |
| | senior bond, 6.75%, 12/01/23 | | | United States | | | | 100,000 | | | | 109,875 | |
| | senior note, 6.45%, 6/15/21 | | | United States | | | | 400,000 | | | | 431,000 | |
| | senior note, 5.80%, 3/15/22 | | | United States | | | | 2,500,000 | | | | 2,606,250 | |
| c | | Digicel Group Ltd., senior note, 144A, 8.25%, 9/30/20 | | | Bermuda | | | | 2,000,000 | | | | 1,957,500 | |
FRANKLIN TEMPLETON VARIABLE INSURANCE PRODUCTS TRUST
STATEMENT OF INVESTMENTS
Franklin High Income VIP Fund (continued)
| | | | | | | | | | | | | | |
| | | | | Country | | | Principal Amount* | | | Value | |
| | | | | | | | | | | | | | |
| | Corporate Bonds (continued) | | | | | | | | | | | | |
| | Telecommunication Services (continued) | | | | | | | | | | | | |
| c | | Digicel Ltd., senior note, 144A, 6.00%, 4/15/21 | | | Bermuda | | | | 2,200,000 | | | $ | 2,091,375 | |
| | Frontier Communications Corp., | | | | | | | | | | | | |
| | senior bond, 7.625%, 4/15/24 | | | United States | | | | 200,000 | | | | 207,000 | |
| | senior note, 8.50%, 4/15/20 | | | United States | | | | 2,000,000 | | | | 2,240,000 | |
| | senior note, 8.75%, 4/15/22 | | | United States | | | | 900,000 | | | | 1,010,250 | |
| | senior note, 7.875%, 1/15/27 | | | United States | | | | 200,000 | | | | 200,500 | |
| | Intelsat Jackson Holdings SA, | | | | | | | | | | | | |
| | senior bond, 5.50%, 8/01/23 | | | Luxembourg | | | | 1,500,000 | | | | 1,495,312 | |
| | senior note, 7.50%, 4/01/21 | | | Luxembourg | | | | 3,800,000 | | | | 4,080,250 | |
| c | | Millicom International Cellular SA, senior note, 144A, 6.625%, 10/15/21 | | | Luxembourg | | | | 200,000 | | | | 205,625 | |
| | Sprint Corp., senior bond, | | | | | | | | | | | | |
| | 7.875%, 9/15/23 | | | United States | | | | 500,000 | | | | 496,100 | |
| | 7.125%, 6/15/24 | | | United States | | | | 500,000 | | | | 467,500 | |
| | Sprint Nextel Corp., senior note, | | | | | | | | | | | | |
| | 8.375%, 8/15/17 | | | United States | | | | 3,000,000 | | | | 3,247,500 | |
| | c144A, 9.00%, 11/15/18 | | | United States | | | | 3,000,000 | | | | 3,419,700 | |
| | T-Mobile USA Inc., | | | | | | | | | | | | |
| | senior bond, 6.50%, 1/15/24 | | | United States | | | | 400,000 | | | | 411,000 | |
| | senior bond, 6.375%, 3/01/25 | | | United States | | | | 1,100,000 | | | | 1,120,350 | |
| | senior note, 6.542%, 4/28/20 | | | United States | | | | 1,600,000 | | | | 1,658,000 | |
| | senior note, 6.125%, 1/15/22 | | | United States | | | | 200,000 | | | | 203,750 | |
| c | | Wind Acquisition Finance SA, | | | | | | | | | | | | |
| | senior note, 144A, 7.375%, 4/23/21 | | | Italy | | | | 3,500,000 | | | | 3,307,500 | |
| | senior secured note, first lien, 144A, 4.75%, 7/15/20 | | | Italy | | | | 2,000,000 | | | | 1,900,000 | |
| | | | | | | | | | | | | | |
| | | | | | | | | | | | | 32,866,337 | |
| | | | | | | | | | | | | | |
| | Transportation 1.2% | | | | | | | | | | | | |
| c | | Florida East Coast Holdings Corp., | | | | | | | | | | | | |
| | secured note, first lien, 144A, 6.75%, 5/01/19 | | | United States | | | | 900,000 | | | | 893,250 | |
| | senior note, 144A, 9.75%, 5/01/20 | | | United States | | | | 500,000 | | | | 500,000 | |
| c | | Stena AB, senior bond, 144A, 7.00%, 2/01/24 | | | Sweden | | | | 1,000,000 | | | | 917,500 | |
| c | | Stena International SA, secured bond, 144A, 5.75%, 3/01/24 | | | Sweden | | | | 1,500,000 | | | | 1,417,500 | |
| | | | | | | | | | | | | | |
| | | | | | | | | | | | | 3,728,250 | |
| | | | | | | | | | | | | | |
| | Utilities 3.3% | | | | | | | | | | | | |
| | Calpine Corp., | | | | | | | | | | | | |
| | senior bond, 5.75%, 1/15/25 | | | United States | | | | 1,200,000 | | | | 1,216,500 | |
| | senior note, 5.375%, 1/15/23 | | | United States | | | | 1,300,000 | | | | 1,314,625 | |
| | csenior secured bond, first lien, 144A, 7.875%, 1/15/23 | | | United States | | | | 698,000 | | | | 773,035 | |
| | csenior secured bond, first lien, 144A, 5.875%, 1/15/24 | | | United States | | | | 400,000 | | | | 428,000 | |
| | csenior secured note, first lien, 144A, 6.00%, 1/15/22 | | | United States | | | | 100,000 | | | | 107,000 | |
| c | | InterGen NV, secured bond, 144A, 7.00%, 6/30/23 | | | Netherlands | | | | 2,500,000 | | | | 2,387,500 | |
| c | | NGL Energy Partners LP/NGL Energy Finance Corp., senior note, 144A, 5.125%, 7/15/19 | | | United States | | | | 500,000 | | | | 480,625 | |
| c | | NRG Yield Operating LLC, senior bond, 144A, 5.375%, 8/15/24 | | | United States | | | | 2,000,000 | | | | 2,040,000 | |
| c,d | | Texas Competitive Electric Holdings Co. LLC/Texas Competitive Electric Holdings Finance Inc., senior secured note, 144A, 11.50%, 10/01/20 | | | United States | | | | 2,500,000 | | | | 1,781,250 | |
| | | | | | | | | | | | | | |
| | | | | | | | | | | | | 10,528,535 | |
| | | | | | | | | | | | | | |
| | | | |
| | Total Corporate Bonds (Cost $310,742,789) | | | | | | | | | | | 299,186,664 | |
| | | | | | | | | | | | | | |
FRANKLIN TEMPLETON VARIABLE INSURANCE PRODUCTS TRUST
STATEMENT OF INVESTMENTS
Franklin High Income VIP Fund (continued)
| | | | | | | | | | | | | | |
| | | | | Country | | | Principal Amount* | | | Value | |
| | | | | | | | | | | | | | |
| | | | |
| f,i | | Senior Floating Rate Interests (Cost $2,327,917) 0.7% | | | | | | | | | | | | |
| | Household & Personal Products 0.7% | | | | | | | | | | | | |
| | Sun Products Corp., Tranche B Term Loan, 5.50%, 3/23/20 | | | United States | | | | 2,346,427 | | | $ | 2,193,909 | |
| | | | | | | | | | | | | | |
| | | | |
| | | | | | | | Shares | | | | |
| | Escrows and Litigation Trusts (Cost $—) 0.0% | | | | | | | | | | | | |
| a,e | | NewPage Corp., Litigation Trust | | | United States | | | | 2,500,000 | | | | — | |
| | | | | | | | | | | | | | |
| | | | |
| | Total Investments before Short Term Investments
(Cost $315,076,890) | | | | | | | | | | | 302,390,410 | |
| | | | | | | | | | | | | | |
| | | | |
| | | | | | | | Principal Amount* | | | | |
| | | | |
| | Short Term Investments (Cost $16,927,549) 5.3% | | | | | | | | | | | | |
| | Repurchase Agreements 5.3% | | | | | | | | | | | | |
| j | | Joint Repurchase Agreement, 0.057%, 1/02/15
(Maturity Value $16,927,602) | | | United States | | | | 16,927,549 | | | | 16,927,549 | |
| | BNP Paribas Securities Corp. (Maturity Value $1,426,489)
HSBC Securities (USA) Inc. (Maturity Value $11,792,275)
Merrill Lynch, Pierce, Fenner & Smith Inc. (Maturity Value $3,708,838)
| | | | | | | | | | | | |
| | Collateralized by U.S. Government Agency Securities, 0.00% - 1.50%, 1/20/15 - 10/09/19; U.S. Government Agency Securities, Strips, 6/01/17; and U.S. Treasury Notes, 1.625% - 4.50%, 11/15/15 - 11/30/20 (valued at $17,268,235) | | | | | | | | | | | | |
| | | | | | | | | | | | | | |
| | Total Investments (Cost $332,004,439) 99.1% | | | | | | | | | | | 319,317,959 | |
| | Other Assets, less Liabilities 0.9% | | | | | | | | | | | 2,918,447 | |
| | | | | | | | | | | | | | |
| | Net Assets 100.0% | | | | | | | | | | $ | 322,236,406 | |
| | | | | | | | | | | | | | |
See Abbreviations on page FH-27.
*The principal amount is stated in U.S. dollars unless otherwise indicated.
aNon-income producing.
bPerpetual security with no stated maturity date.
cSecurity was purchased pursuant to Rule 144A under the Securities Act of 1933 and may be sold in transactions exempt from registration only to qualified institutional buyers or in a public offering registered under the Securities Act of 1933. These securities have been deemed liquid under guidelines approved by the Trust’s Board of Trustees. At December 31, 2014, the aggregate value of these securities was $138,100,965, representing 42.86% of net assets.
dSee Note 7 regarding defaulted securities.
eSecurity has been deemed illiquid because it may not be able to be sold within seven days. At December 31, 2014, the aggregate value of these securities was $191, representing less than 0.01% of net assets.
fThe coupon rate shown represents the rate at period end.
gAt December 31, 2014, pursuant to the Fund’s policies and the requirements of applicable securities law, the Fund may be restricted from trading this security for a limited or extended period of time.
hIncome may be received in additional securities and/or cash.
iSee Note 1(e) regarding senior floating rate interests.
jSee Note 1(c) regarding joint repurchase agreement.
| | | | |
| FH-16 | | Annual Report | The accompanying notes are an integral part of these financial statements. | | |
FRANKLIN TEMPLETON VARIABLE INSURANCE PRODUCTS TRUST
Financial Statements
Statement of Assets and Liabilities
December 31, 2014
| | | | |
| | | Franklin High
Income VIP
Fund | |
Assets: | | | | |
Investments in securities: | | | | |
Cost - Unaffiliated issuers | | $ | 315,076,890 | |
Cost - Repurchase agreements | | | 16,927,549 | |
| | | | |
Total cost of investments | | $ | 332,004,439 | |
| | | | |
Value - Unaffiliated issuers | | $ | 302,390,410 | |
Value - Repurchase agreements | | | 16,927,549 | |
| | | | |
Total value of investments | | | 319,317,959 | |
Receivables: | | | | |
Capital shares sold | | | 585,762 | |
Dividends and interest | | | 5,267,737 | |
Other assets | | | 112 | |
| | | | |
Total assets | | | 325,171,570 | |
| | | | |
Liabilities: | | | | |
Payables: | | | | |
Capital shares redeemed | | | 70,296 | |
Management fees | | | 142,599 | |
Distribution fees | | | 124,506 | |
Funds advanced by custodian | | | 2,500,000 | |
Accrued expenses and other liabilities | | | 97,763 | |
| | | | |
Total liabilities | | | 2,935,164 | |
| | | | |
Net assets, at value | | $ | 322,236,406 | |
| | | | |
Net assets consist of: | | | | |
Paid-in capital | | $ | 331,587,521 | |
Undistributed net investment income | | | 19,094,317 | |
Net unrealized appreciation (depreciation) | | | (12,686,480 | ) |
Accumulated net realized gain (loss) | | | (15,758,952 | ) |
| | | | |
Net assets, at value | | $ | 322,236,406 | |
| | | | |
| |
| Class 1: | | | | |
Net assets, at value | | $ | 34,552,260 | |
| | | | |
Shares outstanding | | | 5,219,193 | |
| | | | |
Net asset value and maximum offering price per share | | $ | 6.62 | |
| | | | |
| |
| Class 2: | | | | |
Net assets, at value | | $ | 261,944,147 | |
| | | | |
Shares outstanding | | | 40,845,987 | |
| | | | |
Net asset value and maximum offering price per share | | $ | 6.41 | |
| | | | |
| |
| Class 4: | | | | |
Net assets, at value | | $ | 25,739,999 | |
| | | | |
Shares outstanding | | | 3,933,338 | |
| | | | |
Net asset value and maximum offering price per share | | $ | 6.54 | |
| | | | |
| | | | | | |
| | | The accompanying notes are an integral part of these financial statements. | Annual Report | | | FH-17 | |
FRANKLIN TEMPLETON VARIABLE INSURANCE PRODUCTS TRUST
FINANCIAL STATEMENTS
Statement of Operations
for the year ended December 31, 2014
| | | | |
| | | Franklin High
Income VIP
Fund | |
Investment income: | | | | |
Dividends | | $ | 39,488 | |
Interest | | | 23,449,400 | |
| | | | |
Total investment income | | | 23,488,888 | |
| | | | |
Expenses: | | | | |
Management fees (Note 3a) | | | 1,860,239 | |
Distribution fees: (Note 3c) | | | | |
Class 2 | | | 729,711 | |
Class 4 | | | 97,921 | |
Custodian fees (Note 4) | | | 3,226 | |
Reports to shareholders | | | 93,095 | |
Professional fees | | | 49,561 | |
Trustees’ fees and expenses | | | 1,437 | |
Other | | | 28,279 | |
| | | | |
Total expenses | | | 2,863,469 | |
Expense reductions (Note 4) | | | (34 | ) |
| | | | |
Net expenses | | | 2,863,435 | |
| | | | |
Net investment income | | | 20,625,453 | |
| | | | |
Realized and unrealized gains (losses): | | | | |
Net realized gain (loss) from: | | | | |
Investments | | | 7,935,628 | |
Foreign currency transactions | | | (5,812 | ) |
| | | | |
Net realized gain (loss) | | | 7,929,816 | |
| | | | |
Net change in unrealized appreciation (depreciation) on: | | | | |
Investments | | | (26,634,518 | ) |
Translation of other assets and liabilities denominated in foreign currencies | | | 2,562 | |
| | | | |
Net change in unrealized appreciation (depreciation) | | | (26,631,956 | ) |
| | | | |
Net realized and unrealized gain (loss) | | | (18,702,140 | ) |
| | | | |
Net increase (decrease) in net assets resulting from operations | | $ | 1,923,313 | |
| | | | |
| | | | |
| FH-18 | | Annual Report | The accompanying notes are an integral part of these financial statements. | | |
FRANKLIN TEMPLETON VARIABLE INSURANCE PRODUCTS TRUST
FINANCIAL STATEMENTS
Statements of Changes in Net Assets
| | | | | | | | |
| | | Franklin High Income VIP Fund | |
| | | Year Ended December 31, | |
| | | 2014 | | | 2013 | |
Increase (decrease) in net assets: | | | | | | | | |
Operations: | | | | | | | | |
Net investment income | | $ | 20,625,453 | | | $ | 22,562,058 | |
Net realized gain (loss) from investments and foreign currency transactions | | | 7,929,816 | | | | 5,546,800 | |
Net change in unrealized appreciation (depreciation) on investments and translation of other assets and liabilities denominated in foreign currencies | | | (26,631,956 | ) | | | (1,216,918 | ) |
| | | | |
Net increase (decrease) in net assets resulting from operations | | | 1,923,313 | | | | 26,891,940 | |
| | | | |
Distributions to shareholders from: | | | | | | | | |
Net investment income: | | | | | | | | |
Class 1 | | | (2,292,485 | ) | | | (2,998,716 | ) |
Class 2 | | | (18,595,621 | ) | | | (20,021,935 | ) |
Class 4 | | | (1,613,962 | ) | | | (1,982,283 | ) |
| | | | |
Total distributions to shareholders | | | (22,502,068 | ) | | | (25,002,934 | ) |
| | | | |
Capital share transactions: (Note 2) | | | | | | | | |
Class 1 | | | (2,696,242 | ) | | | (3,089,037 | ) |
Class 2 | | | (12,927,786 | ) | | | 8,408,156 | |
Class 4 | | | (475,860 | ) | | | 25,255 | |
| | | | |
Total capital share transactions | | | (16,099,888 | ) | | | 5,344,374 | |
| | | | |
Net increase (decrease) in net assets | | | (36,678,643 | ) | | | 7,233,380 | |
Net assets: | | | | | | | | |
Beginning of year | | | 358,915,049 | | | | 351,681,669 | |
| | | | |
End of year | | $ | 322,236,406 | | | $ | 358,915,049 | |
| | | | |
Undistributed net investment income included in net assets: | | | | | | | | |
End of year | | $ | 19,094,317 | | | $ | 20,624,091 | |
| | | | |
| | | | | | |
| | | The accompanying notes are an integral part of these financial statements. | Annual Report | | | FH-19 | |
FRANKLIN TEMPLETON VARIABLE INSURANCE PRODUCTS TRUST
Notes to Financial Statements
Franklin High Income VIP Fund
1. Organization and Significant Accounting Policies
Franklin Templeton Variable Insurance Products Trust (Trust) is registered under the Investment Company Act of 1940, as amended, (1940 Act) as an open-end management investment company, consisting of nineteen separate funds and applies the specialized accounting and reporting guidance in U.S. Generally Accepted Accounting Principles (U.S. GAAP). Franklin High Income VIP Fund (Fund) is included in this report. The financial statements of the remaining funds in the Trust are presented separately. Shares of the Fund are generally sold only to insurance company separate accounts to fund the benefits of variable life insurance policies or variable annuity contracts. At December 31, 2014, 84.97% of the Fund’s shares were held through one insurance company. Investment activities of these insurance company separate accounts could have a material impact on the Fund. The Fund offers three classes of shares: Class 1, Class 2, and Class 4. Each class of shares differs by its distribution fees, voting rights on matters affecting a single class and its exchange privilege.
Effective May 1, 2014, Franklin High Income Securities Fund was renamed Franklin High Income VIP Fund.
The following summarizes the Fund’s significant accounting policies.
a. Financial Instrument Valuation
The Fund’s investments in financial instruments are carried at fair value daily. Fair value is the price that would be received to sell an asset or paid to transfer a liability in an orderly transaction between market participants on the measurement date. The Fund calculates the net asset value per share at the close of the New York Stock Exchange (NYSE), generally at 4 p.m. Eastern time (NYSE close) on each day the NYSE is open for trading. Under compliance policies and procedures approved by the Trust’s Board of Trustees (the Board), the Fund’s administrator has responsibility for oversight of valuation, including leading the cross-functional Valuation and Liquidity Oversight Committee (VLOC). The VLOC provides administration and oversight of the Fund’s valuation policies and procedures, which are approved annually by the Board. Among other things, these procedures allow the Fund to utilize independent pricing services, quotations from securities and financial instrument dealers, and other market sources to determine fair value.
Equity securities listed on an exchange or on the NASDAQ National Market System are valued at the last quoted sale price
or the official closing price of the day, respectively. Foreign equity securities are valued as of the close of trading on the foreign stock exchange on which the security is primarily traded or as of the NYSE close, whichever is earlier. The value is then converted into its U.S. dollar equivalent at the foreign exchange rate in effect at the NYSE close on the day that the value of the security is determined. Over-the-counter (OTC) securities are valued within the range of the most recent quoted bid and ask prices. Securities that trade in multiple markets or on multiple exchanges are valued according to the broadest and most representative market. Certain equity securities are valued based upon fundamental characteristics or relationships to similar securities.
Debt securities generally trade in the OTC market rather than on a securities exchange. The Fund’s pricing services use multiple valuation techniques to determine fair value. In instances where sufficient market activity exists, the pricing services may utilize a market-based approach through which quotes from market makers are used to determine fair value. In instances where sufficient market activity may not exist or is limited, the pricing services also utilize proprietary valuation models which may consider market characteristics such as benchmark yield curves, credit spreads, estimated default rates, anticipated market interest rate volatility, coupon rates, anticipated timing of principal repayments, underlying collateral, and other unique security features in order to estimate the relevant cash flows, which are then discounted to calculate the fair value. Securities denominated in a foreign currency are converted into their U.S. dollar equivalent at the foreign exchange rate in effect at the NYSE close on the date that the values of the foreign debt securities are determined. Repurchase agreements are valued at cost, which approximates fair value.
The Fund has procedures to determine the fair value of financial instruments for which market prices are not reliable or readily available. Under these procedures, the VLOC convenes on a regular basis to review such financial instruments and considers a number of factors, including significant unobservable valuation inputs, when arriving at fair value. The VLOC primarily employs a market-based approach which may use related or comparable assets or liabilities, recent transactions, market multiples, book values, and other relevant information for the investment to determine the fair value of the investment. An income-based valuation approach may also be used in which the anticipated future cash flows of the investment are discounted to calculate fair value. Discounts may also be applied due to the nature or duration of any restrictions on the disposition of the
FRANKLIN TEMPLETON VARIABLE INSURANCE PRODUCTS TRUST
NOTES TO FINANCIAL STATEMENTS
Franklin High Income VIP Fund (continued)
investments. Due to the inherent uncertainty of valuations of such investments, the fair values may differ significantly from the values that would have been used had an active market existed. The VLOC employs various methods for calibrating these valuation approaches including a regular review of key inputs and assumptions, transactional back-testing or disposition analysis, and reviews of any related market activity.
Trading in securities on foreign securities stock exchanges and OTC markets may be completed before the daily NYSE close. In addition, trading in certain foreign markets may not take place on every NYSE business day. Occasionally, events occur between the time at which trading in a foreign security is completed and the close of the NYSE that might call into question the reliability of the value of a portfolio security held by the Fund. As a result, differences may arise between the value of the Fund’s portfolio securities as determined at the foreign market close and the latest indications of value at the close of the NYSE. In order to minimize the potential for these differences, the VLOC monitors price movements following the close of trading in foreign stock markets through a series of country specific market proxies (such as baskets of American Depositary Receipts, futures contracts and exchange traded funds). These price movements are measured against established trigger thresholds for each specific market proxy to assist in determining if an event has occurred that may call into question the reliability of the values of the foreign securities held by the Fund. If such an event occurs, the securities may be valued using fair value procedures, which may include the use of independent pricing services.
Also, when the last day of the reporting period is a non-business day, certain foreign markets may be open on those days that the NYSE is closed, which could result in differences between the value of the Fund’s portfolio securities on the last business day and the last calendar day of the reporting period. Any significant security valuation changes due to an open foreign market are adjusted and reflected by the Fund for financial reporting purposes.
b. Foreign Currency Translation
Portfolio securities and other assets and liabilities denominated in foreign currencies are translated into U.S. dollars based on the exchange rate of such currencies against U.S. dollars on the date of valuation. The Fund may enter into foreign currency exchange contracts to facilitate transactions denominated in a foreign currency. Purchases and sales of securities, income and
expense items denominated in foreign currencies are translated into U.S. dollars at the exchange rate in effect on the transaction date. Portfolio securities and assets and liabilities denominated in foreign currencies contain risks that those currencies will decline in value relative to the U.S. dollar. Occasionally, events may impact the availability or reliability of foreign exchange rates used to convert the U.S. dollar equivalent value. If such an event occurs, the foreign exchange rate will be valued at fair value using procedures established and approved by the Board.
The Fund does not separately report the effect of changes in foreign exchange rates from changes in market prices on securities held. Such changes are included in net realized and unrealized gain or loss from investments on the Statement of Operations.
Realized foreign exchange gains or losses arise from sales of foreign currencies, currency gains or losses realized between the trade and settlement dates on securities transactions and the difference between the recorded amounts of dividends, interest, and foreign withholding taxes and the U.S. dollar equivalent of the amounts actually received or paid. Net unrealized foreign exchange gains and losses arise from changes in foreign exchange rates on foreign denominated assets and liabilities other than investments in securities held at the end of the reporting period.
c. Joint Repurchase Agreement
The Fund enters into a joint repurchase agreement whereby its uninvested cash balance is deposited into a joint cash account with other funds managed by the investment manager or an affiliate of the investment manager and is used to invest in one or more repurchase agreements. The value and face amount of the joint repurchase agreement are allocated to the funds based on their pro-rata interest. A repurchase agreement is accounted for as a loan by the Fund to the seller, collateralized by securities which are delivered to the Fund’s custodian. The fair value, including accrued interest, of the initial collateralization is required to be at least 102% of the dollar amount invested by the funds, with the value of the underlying securities marked to market daily to maintain coverage of at least 100%. Repurchase agreements are subject to the terms of Master Repurchase Agreements (MRAs) with approved counterparties (sellers). The MRAs contain various provisions, including but not limited to events of default and maintenance of collateral for repurchase agreements. In the event of default by either the seller or the Fund, certain MRAs may permit the non-defaulting party to net
FRANKLIN TEMPLETON VARIABLE INSURANCE PRODUCTS TRUST
NOTES TO FINANCIAL STATEMENTS
Franklin High Income VIP Fund (continued)
1. Organization and Significant Accounting Policies (continued)
c. Joint Repurchase Agreement (continued)
and close-out all transactions, if any, traded under such agreements. The Fund may sell securities it holds as collateral and apply the proceeds towards the repurchase price and any other amounts owed by the seller to the Fund in the event of default by the seller. This could involve costs or delays in addition to a loss on the securities if their value falls below the repurchase price owed by the seller. The joint repurchase agreement held by the Fund at year end, as indicated in the Statement of Investments, had been entered into on December 31, 2014.
d. Derivative Financial Instruments
The Fund invested in derivatives in order to manage risk or gain exposure to various other investments or markets. Derivatives are financial contracts based on an underlying or notional amount, require no initial investment or an initial net investment that is smaller than would normally be required to have a similar response to changes in market factors, and require or permit net settlement. Derivatives contain various risks including the potential inability of the counterparty to fulfill their obligations under the terms of the contract, the potential for an illiquid secondary market, and/or the potential for market movements which expose the fund to gains or losses in excess of the amounts shown in the Statement of Assets and Liabilities. Realized gain and loss and unrealized appreciation and depreciation on these contracts for the period are included in the Statement of Operations.
The Fund entered into forward exchange contracts primarily to manage and/or gain exposure to certain foreign currencies. A forward exchange contract is an agreement between the fund and a counterparty to buy or sell a foreign currency at a specific exchange rate on a future date.
See Note 8 regarding other derivative information.
e. Senior Floating Rate Interests
The Fund invests in senior secured corporate loans that pay interest at rates which are periodically reset by reference to a base lending rate plus a spread. These base lending rates are generally the prime rate offered by a designated U.S. bank or the London InterBank Offered Rate (LIBOR). Senior secured corporate loans often require prepayment of principal from
excess cash flows or at the discretion of the borrower. As a result, actual maturity may be substantially less than the stated maturity. Senior secured corporate loans in which the Fund invests are generally readily marketable, but may be subject to certain restrictions on resale.
f. Income and Deferred Taxes
It is the Fund’s policy to qualify as a regulated investment company under the Internal Revenue Code. The Fund intends to distribute to shareholders substantially all of its taxable income and net realized gains to relieve it from federal income and if applicable, excise taxes. As a result, no provision for U.S. federal income taxes is required.
The Fund may be subject to foreign taxation related to income received, capital gains on the sale of securities and certain foreign currency transactions in the foreign jurisdictions in which it invests. Foreign taxes, if any, are recorded based on the tax regulations and rates that exist in the foreign markets in which the Fund invests. When a capital gain tax is determined to apply the Fund records an estimated deferred tax liability in an amount that would be payable if the securities were disposed of on the valuation date.
The Fund recognizes the tax benefits of uncertain tax positions only when the position is “more likely than not” to be sustained upon examination by the tax authorities based on the technical merits of the tax position. As of December 31, 2014, and for all open tax years, the Fund has determined that no liability for unrecognized tax benefits is required in the Fund’s financial statements related to uncertain tax positions taken on a tax return (or expected to be taken on future tax returns). Open tax years are those that remain subject to examination and are based on each tax jurisdiction statute of limitation.
g. Security Transactions, Investment Income, Expenses and Distributions
Security transactions are accounted for on trade date. Realized gains and losses on security transactions are determined on a specific identification basis. Interest income and estimated expenses are accrued daily. Amortization of premium and accretion of discount on debt securities are included in interest income. Facility fees are recognized as income over the expected term of the loan. Dividend income is recorded on the ex-dividend date except for certain foreign securities where the dividend rate is not available. In such cases, the dividend is recorded as soon as the information is received by the Fund. Distributions to
FRANKLIN TEMPLETON VARIABLE INSURANCE PRODUCTS TRUST
NOTES TO FINANCIAL STATEMENTS
Franklin High Income VIP Fund (continued)
shareholders are recorded on the ex-dividend date and are determined according to income tax regulations (tax basis). Distributable earnings determined on a tax basis may differ from earnings recorded in accordance with U.S. GAAP. These differences may be permanent or temporary. Permanent differences are reclassified among capital accounts to reflect their tax character. These reclassifications have no impact on net assets or the results of operations. Temporary differences are not reclassified, as they may reverse in subsequent periods.
Common expenses incurred by the Trust are allocated among the funds based on the ratio of net assets of each fund to the combined net assets of the Trust. Fund specific expenses are charged directly to the fund that incurred the expense.
Realized and unrealized gains and losses and net investment income, not including class specific expenses, are allocated daily to each class of shares based upon the relative proportion of net assets of each class. Differences in per share distributions, by class, are generally due to differences in class specific expenses.
h. Accounting Estimates
The preparation of financial statements in accordance with U.S. GAAP requires management to make estimates and assumptions that affect the reported amounts of assets and liabilities at the date of the financial statements and the amounts of income and expenses during the reporting period. Actual results could differ from those estimates.
i. Guarantees and Indemnifications
Under the Trust’s organizational documents, its officers and trustees are indemnified by the Trust against certain liabilities arising out of the performance of their duties to the Trust.
Additionally, in the normal course of business, the Trust, on behalf of the Fund, enters into contracts with service providers that contain general indemnification clauses. The Trust’s maximum exposure under these arrangements is unknown as this would involve future claims that may be made against the Trust that have not yet occurred. Currently, the Trust expects the risk of loss to be remote.
2. Shares of Beneficial Interest
At December 31, 2014, there were an unlimited number of shares authorized (without par value). Transactions in the Fund’s shares were as follows:
| | | | | | | | | | | | | | | | | | |
| | | Year Ended December 31, | |
| | | 2014 | | | | | 2013 | |
| | | Shares | | | Amount | | | | | Shares | | | Amount | |
| | | | | |
| Class 1 Shares: | | | | | | | | | | | | | | | | | | |
Shares sold | | | 120,684 | | | $ | 836,723 | | | | | | 296,126 | | | $ | 2,094,060 | |
Shares issued in reinvestment of distributions | | | 329,854 | | | | 2,292,485 | | | | | | 448,910 | | | | 2,998,716 | |
Shares redeemed | | | (832,231 | ) | | | (5,825,450 | ) | | | | | (1,160,278 | ) | | | (8,181,813 | ) |
| | | | |
Net increase (decrease) | | | (381,693 | ) | | $ | (2,696,242 | ) | | | | | (415,242 | ) | | $ | (3,089,037 | ) |
| | | | |
| Class 2 Shares: | | | | | | | | | | | | | | | | | | |
Shares sold | | | 13,791,290 | | | $ | 93,795,388 | | | | | | 8,384,624 | | | $ | 56,291,181 | |
Shares issued in reinvestment of distributions | | | 2,754,907 | | | | 18,595,621 | | | | | | 3,085,044 | | | | 20,021,935 | |
Shares redeemed | | | (18,545,301 | ) | | | (125,318,795 | ) | | | | | (9,961,173 | ) | | | (67,904,960 | ) |
| | | | |
Net increase (decrease) | | | (1,999,104 | ) | | $ | (12,927,786 | ) | | | | | 1,508,495 | | | $ | 8,408,156 | |
| | | | |
| Class 4 Shares: | | | | | | | | | | | | | | | | | | |
Shares sold | | | 276,687 | | | $ | 1,933,896 | | | | | | 232,056 | | | $ | 1,586,635 | |
Shares issued on reinvestment of distributions | | | 234,247 | | | | 1,613,962 | | | | | | 299,438 | | | | 1,982,283 | |
Shares redeemed | | | (581,606 | ) | | | (4,023,718 | ) | | | | | (515,161 | ) | | | (3,543,663 | ) |
| | | | |
Net increase (decrease) | | | (70,672 | ) | | $ | (475,860 | ) | | | | | 16,333 | | | $ | 25,255 | |
| | | | |
FRANKLIN TEMPLETON VARIABLE INSURANCE PRODUCTS TRUST
NOTES TO FINANCIAL STATEMENTS
Franklin High Income VIP Fund (continued)
3. Transactions With Affiliates
Franklin Resources, Inc. is the holding company for various subsidiaries that together are referred to as Franklin Templeton Investments. Certain officers and trustees of the Fund are also officers and/or directors of the following subsidiaries:
| | |
| Subsidiary | | Affiliation |
Franklin Advisers, Inc. (Advisers) | | Investment manager |
Franklin Templeton Services, LLC (FT Services) | | Administrative manager |
Franklin Templeton Distributors, Inc. (Distributors) | | Principal underwriter |
Franklin Templeton Investor Services, LLC (Investor Services) | | Transfer agent |
a. Management Fees
The Fund pays an investment management fee to Advisers based on the average daily net assets of the Fund as follows:
| | |
| Annualized Fee Rate | | Net Assets |
0.625% | | Up to and including $100 million |
0.500% | | Over $100 million, up to and including $250 million |
0.450% | | Over $250 million, up to and including $7.5 billion |
0.440% | | Over $7.5 billion, up to and including $10 billion |
0.430% | | Over $10 billion, up to and including $12.5 billion |
0.420% | | Over $12.5 billion, up to and including $15 billion |
0.400% | | In excess of $15 billion |
b. Administrative Fees
Under an agreement with Advisers, FT Services provides administrative services to the Fund. The fee is paid by Advisers based on the Fund’s average daily net assets, and is not an additional expense of the Fund.
c. Distribution Fees
The Board has adopted distribution plans for Class 2 and Class 4 shares pursuant to Rule 12b-1 under the 1940 Act. Under the Fund’s compensation distribution plans, the Fund pays Distributors for costs incurred in connection with the servicing, sale and distribution of the Fund’s shares up to 0.35% per year of its average daily net assets. Some distribution fees are not charged on shares held by affiliates. The Board has agreed to limit the current rate to 0.25% per year for Class 2. The plan year, for purposes of monitoring compliance with the maximum annual plan rate, is February 1 through January 31.
d. Transfer Agent Fees
Investor Services, under terms of an agreement, performs shareholder servicing for the Fund and is not paid by the Fund for the services.
4. Expense Offset Arrangement
The Fund has entered into an arrangement with its custodian whereby credits realized as a result of uninvested cash balances are used to reduce a portion of the Fund’s custodian expenses. During the year ended December 31, 2014, the custodian fees were reduced as noted in the Statement of Operations.
FRANKLIN TEMPLETON VARIABLE INSURANCE PRODUCTS TRUST
NOTES TO FINANCIAL STATEMENTS
Franklin High Income VIP Fund (continued)
5. Income Taxes
For tax purposes, capital losses may be carried over to offset future capital gains. Capital loss carryforwards with no expiration, if any, must be fully utilized before those losses with expiration dates.
At December 31, 2014, capital loss carryforwards were as follows:
| | | | |
Capital loss carryforwards subject to expiration: | | | | |
2016 | | $ | 5,101,475 | |
2017 | | | 10,621,353 | |
| | | | |
Total capital loss carryforwards | | $ | 15,722,828 | |
| | | | |
During the year ended December 31, 2014, the Fund utilized $7,582,975 of capital loss carrryforwards.
The tax character of distributions paid during the years ended December 31, 2014 and 2013, was as follows:
| | | | | | | | |
| | | 2014 | | | 2013 | |
Distributions paid from ordinary income | | $ | 22,502,068 | | | $ | 25,002,934 | |
| | | | |
At December 31, 2014, the cost of investments, net unrealized appreciation (depreciation) and undistributed ordinary income for income tax purposes were as follows:
| | | | |
Cost of investments | | $ | 332,967,756 | |
| | | | |
Unrealized appreciation | | $ | 7,157,236 | |
Unrealized depreciation | | | (20,807,034 | ) |
| | | | |
Net unrealized appreciation (depreciation) | | $ | (13,649,798 | ) |
| | | | |
Distributable earnings – undistributed ordinary income | | $ | 20,062,102 | |
| | | | |
Differences between income and/or capital gains as determined on a book basis and a tax basis are primarily due to differing treatments of defaulted securities and bond discounts and premiums.
6. Investment Transactions
Purchases and sales of investments (excluding short term securities) for the year ended December 31, 2014, aggregated $134,544,880 and $149,753,264 respectively.
7. Credit Risk and Defaulted Securities
At December 31, 2014, the Fund had 92.93% of its portfolio invested in high yield , senior secured floating rate notes, or other securities rated below investment grade. These securities may be more sensitive to economic conditions causing greater price volatility and are potentially subject to a greater risk of loss due to default than higher rated securities.
The Fund held defaulted securities and/or other securities for which the income has been deemed uncollectible. At December 31, 2014, the aggregate value of these securities was $1,802,691 representing 0.56% of the Fund’s net assets. The Fund discontinues accruing income on securities for which income has been deemed uncollectible and provides an estimate for losses on interest receivable. The securities have been identified on the accompanying Statement of Investments.
FRANKLIN TEMPLETON VARIABLE INSURANCE PRODUCTS TRUST
NOTES TO FINANCIAL STATEMENTS
Franklin High Income VIP Fund (continued)
8. Other Derivative Information
For the year ended December 31, 2014, the effect of the derivative contracts for the Fund’s Statement of Operations was as follows:
| | | | | | | | | | |
Derivatives Contracts
Not Accounted for
as Hedging Instruments | | Statement of Operations Locations | | Realized
Gain (Loss)
for the Year | | | Change In
Unrealized
Appreciation
(Depreciation)
for the Year | |
Foreign exchange contracts | | Net realized gain (loss) from foreign currency transactions / Net change in unrealized appreciation (depreciation) on translation of other assets and liabilities denominated in foreign currencies | | $ | 1,380 | | | $ | 2,567 | |
For the year ended December 31, 2014, the average month end fair value of derivatives represented 0.01% of average month end net assets. The average month end number of open derivatives contracts for the year was 2.
See note 1(d) regarding derivative financial instruments.
9. Credit Facility
The Fund, together with other U.S. registered and foreign investment funds (collectively, Borrowers), managed by Franklin Templeton Investments, are borrowers in a joint syndicated senior unsecured credit facility totaling $1.5 billion (Global Credit Facility) which matured on February 13, 2015. This Global Credit Facility provides a source of funds to the Borrowers for temporary and emergency purposes, including the ability to meet future unanticipated or unusually large redemption requests. The Borrowers expect to renew the Global Credit Facility for a total of $2 billion effective February 13, 2015, which matures on February 12, 2016.
Under the terms of the Global Credit Facility, the Fund shall, in addition to interest charged on any borrowings made by the Fund and other costs incurred by the Fund, pay its share of fees and expenses incurred in connection with the implementation and maintenance of the Global Credit Facility, based upon its relative share of the aggregate net assets of all of the Borrowers, including an annual commitment fee of 0.07% based upon the unused portion of the Global Credit Facility. These fees are reflected in other expenses on the Statement of Operations. During the year ended December 31, 2014, the Fund did not use the Global Credit Facility.
10. Fair Value Measurements
The Fund follows a fair value hierarchy that distinguishes between market data obtained from independent sources (observable inputs) and the Fund’s own market assumptions (unobservable inputs). These inputs are used in determining the value of the Fund’s financial instruments and are summarized in the following fair value hierarchy:
| | • | | Level 1 – quoted prices in active markets for identical financial instruments |
| | • | | Level 2 – other significant observable inputs (including quoted prices for similar financial instruments, interest rates, prepayment speed, credit risk, etc.) |
| | • | | Level 3 – significant unobservable inputs (including the Fund’s own assumptions in determining the fair value of financial instruments) |
The input levels are not necessarily an indication of the risk or liquidity associated with financial instruments at that level.
For movements between the levels within the fair value hierarchy, the Fund has adopted a policy of recognizing the transfers as of the date of the underlying event which caused the movement.
FRANKLIN TEMPLETON VARIABLE INSURANCE PRODUCTS TRUST
NOTES TO FINANCIAL STATEMENTS
Franklin High Income VIP Fund (continued)
A summary of inputs used as of December 31, 2014, in valuing the Fund’s assets carried at fair value, is as follows:
| | | | | | | | | | | | | | | | |
| | | Level 1 | | | Level 2 | | | Level 3 | | | Total | |
| | | | |
| Assets: | | | | | | | | | | | | | | | | |
Investments in Securities: | | | | | | | | | | | | | | | | |
Equity Investments:a | | | | | | | | | | | | | | | | |
Materials | | $ | — | | | $ | 453,750 | | | $ | — | | | $ | 453,750 | |
Transportation | | | — | | | | — | | | | 556,087 | | | | 556,087 | |
Corporate Bonds | | | — | | | | 299,165,223 | | | | 21,441 | | | | 299,186,664 | |
Senior Floating Rate Interests | | | — | | | | 2,193,909 | | | | — | | | | 2,193,909 | |
Escrows and Litigation Trusts | | | — | | | | — | | | | — | b | | | — | |
Short Term Investments | | | — | | | | 16,927,549 | | | | — | | | | 16,927,549 | |
| | | | |
Total Investments in Securities | | $ | — | | | $ | 318,740,431 | | | $ | 577,528 | | | $ | 319,317,959 | |
| | | | |
aIncludes common and convertible preferred stocks.
bIncludes securities determined to have no value at December 31, 2014.
A reconciliation of assets in which Level 3 inputs are used in determining fair value is presented when there are significant Level 3 financial instruments at the end of the year.
11. Subsequent Events
The Fund has evaluated subsequent events through the issuance of the financial statements and determined that no events have occurred that require disclosure other than those already disclosed in the financial statements.
Abbreviations
| | |
| Selected Portfolio |
| |
| FRN | | Floating Rate Note |
| |
| PIK | | Payment-In-Kind |
FRANKLIN TEMPLETON VARIABLE INSURANCE PRODUCTS TRUST
Report of Independent Registered Public Accounting Firm
Franklin High Income VIP Fund
To the Board of Trustees and Shareholders of Franklin Templeton Variable Insurance Products Trust
In our opinion, the accompanying statement of assets and liabilities, including the statement of investments, and the related statements of operations and of changes in net assets and the financial highlights present fairly, in all material respects, the financial position of Franklin High Income VIP Fund (the “Fund”) at December 31, 2014, the results of its operations for the year then ended, the changes in its net assets for each of the two years in the period then ended and the financial highlights for each of the five years in the period then ended, in conformity with accounting principles generally accepted in the United States of America. These financial statements and financial highlights (hereafter referred to as “financial statements”) are the responsibility of the Fund’s management. Our responsibility is to express an opinion on these financial statements based on our audits. We conducted our audits of these financial statements in accordance with the standards of the Public Company Accounting Oversight Board (United States). Those standards require that we plan and perform the audit to obtain reasonable assurance about whether the financial statements are free of material misstatement. An audit includes examining, on a test basis, evidence supporting the amounts and disclosures in the financial statements, assessing the accounting principles used and significant estimates made by management, and evaluating the overall financial statement presentation. We believe that our audits, which included confirmation of securities at December 31, 2014 by correspondence with the custodian and brokers, provides a reasonable basis for our opinion.
PricewaterhouseCoopers LLP
San Francisco, California
February 13, 2015
Franklin Income VIP Fund
(Formerly, Franklin Income Securities Fund)
This annual report for Franklin Income VIP Fund covers the fiscal year ended December 31, 2014.
Class 2 Performance Summary as of December 31, 2014
Average annual total return of Class 2 shares represents the average annual change in value, assuming reinvestment of dividends and capital gains. Average returns smooth out variations in returns, which can be significant; they are not the same as year-by-year results.
| | | | | | | | | | | | |
| Periods ended 12/31/14 | | 1-Year | | | 5-Year | | | 10-Year | |
Average Annual Total Return | | | +4.62% | | | | +9.15% | | | | +6.30% | |
Performance reflects the Fund’s Class 2 operating expenses, but does not include any contract fees, expenses or sales charges. If they had been included, performance would be lower. These charges and deductions, particularly for variable life policies, can have a significant effect on contract values and insurance benefits. See the contract prospectus for a complete description of these expenses, including sales charges.
Performance data represent past performance, which does not guarantee future results. Investment return and principal value will fluctuate, and you may have a gain or loss when you sell your shares. Current performance may differ from figures shown.
Total Return Index Comparison for a Hypothetical $10,000 Investment (1/1/05–12/31/14)
The graph below shows the change in value of a hypothetical $10,000 investment in the Fund over the indicated period and includes reinvestment of any income or distributions. The Fund’s performance is compared to the performance of the Standard & Poor’s® 500 Index (S&P 500®) and the Barclays U.S. Aggregate Index. One cannot invest directly in an index, and an index is not representative of the Fund’s portfolio. Please see Important Notes to Performance Information preceding the Fund Summaries.
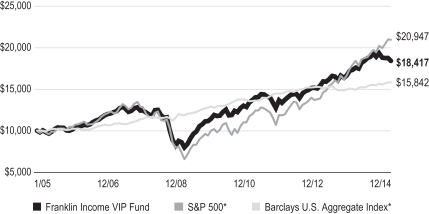
*Source: Morningstar. Please see Index Descriptions following the Fund Summaries.
FRANKLIN INCOME VIP FUND
Fund Goal and Main Investments
Franklin Income VIP Fund seeks to maximize income while maintaining prospects for capital appreciation. Under normal market conditions, the Fund invests in both equity and debt securities.
Fund Risks
All investments involve risks, including possible loss of principal. The Fund’s share price and yield will be affected by interest rate movements. Bond prices generally move in the opposite direction of interest rates. Thus, as prices of bonds in the Fund adjust to a rise in interest rates, the Fund’s share price may decline. Changes in the financial strength of a bond issuer or in a bond’s credit rating may affect its value. The Fund’s portfolio includes a substantial portion of higher yielding, lower rated corporate bonds because of the relatively higher yields they offer. Floating rate loans are lower rated, higher yielding instruments, which are subject to increased risk of default and can potentially result in loss of principal. These securities carry a greater degree of credit risk relative to investment-grade securities. Stock prices fluctuate, sometimes rapidly and dramatically, due to factors affecting individual companies, particular industries or sectors, or general market conditions. The Fund is actively managed but there is no guarantee that the manager’s investment decisions will produce the desired results. The Fund’s prospectus also includes a description of the main investment risks.
Performance Overview
You can find the Fund’s one-year total return in the Performance Summary. For comparison, the Fund’s equity benchmark, the S&P 500, posted a +13.69% total return, and its fixed income benchmark, the Barclays U.S. Aggregate Index, produced a +5.97% total return for the same period.1
Economic and Market Overview
The U.S. economy continued to grow during the year ended December 31, 2014, underpinned in some quarters by manufacturing activity, consumer and business spending, and federal defense spending. Home sales experienced some weakness resulting from reduced inventory, higher mortgage rates and tight credit requirements but began to recover in May as mortgage rates declined. Home prices stayed higher than a year earlier. Retail sales generally improved, supported by job growth
and lower gasoline prices in the latter part of 2014. The unemployment rate declined to 5.6% in December 2014 from 6.7% in December 2013.2 Inflation, as measured by the Consumer Price Index, remained low.
In January 2014, the U.S. Federal Reserve Board (Fed) began reducing its large-scale bond purchases $10 billion a month and ended the buying program in October. But it continued its practice of maintaining holdings of longer term securities at sizable levels. The Fed believed underlying economic strength could support ongoing progress in labor market conditions. The Fed also noted that although inflation might remain low in the near term, the likelihood of inflation running persistently below 2% had diminished. Toward period-end, the Fed stated that it could be patient with regard to raising interest rates and that the interest rate might not rise for at least a couple of meetings, possibly implying at least the first two meetings of 2015.
Investor confidence grew during the period as corporate profits rose and the economy generally strengthened. The market endured sell-offs when many investors reacted to political instability in certain emerging markets, crises in Ukraine and the Middle East, weakness in Europe and Japan, and moderating economic data in China. U.S. stocks rose overall for the 12 months under review as the S&P 500 and Dow Jones Industrial Average reached all-time highs.3
The 10-year Treasury yield declined from 3.04% at the beginning of the period to 2.17% at period-end, as investors shifted to less risky assets given the crises in Ukraine and the Middle East, weak economic data in Europe and Japan, record-low bond yields and lower Treasury issuance.
Investment Strategy
We search for undervalued or out-of-favor securities we believe offer opportunities for income today and growth tomorrow. We generally perform independent analysis of the debt securities being considered for the Fund’s portfolio, rather than relying principally on ratings assigned by rating agencies. In analyzing debt and equity securities, we consider a variety of factors, including: a security’s relative value based on such factors as anticipated cash flow, interest or dividend coverage, asset coverage, and earnings prospects; the experience and strength of a company’s management; a company’s sensitivity to changes in interest rates and business conditions; a company’s debt maturity
1. Source: Morningstar.
One cannot invest directly in an index, and an index is not representative of the Fund’s portfolio. Please see Index Descriptions following the Fund Summaries.
2. Source: Bureau of Labor Statistics.
3. Please see Index Descriptions following the Fund Summaries.
FRANKLIN INCOME VIP FUND
schedules and borrowing requirements; and a company’s changing financial condition and market recognition of the change.
Manager’s Discussion
During the 12 months under review, we maintained a heavier position in equities relative to fixed income securities, which contributed positively to Fund performance. Although the Fund remained well diversified, we incrementally reduced the Fund’s overall equity weighting from 60.0% to 57.4% of total net assets by taking profits in select strong-performing equity holdings. The Fund’s fixed income exposure declined slightly from 35.7% to 34.5% of total net assets for the year under review. The Fund’s cash position increased from 4.3% to 8.1% of total net assets.
Equity securities generally performed well across many sectors, driven by continued, albeit modest, earnings growth, together with improving U.S. economic and employment outlooks. The Fund generated strong performance from a wide range of sectors including utilities, information technology and health care. In contrast, disappointing global economic activity and a worsening outlook weighed heavily on commodity prices and led to significant declines in security prices in the energy and materials sectors, which detracted from Fund performance.
The utilities sector represented one of the Fund’s largest weightings and was a key positive contributor. The sector delivered strong returns buoyed by the decline in long-term interest rates and the stable returns and growth generated by many electric and multi-utilities that attracted investors seeking yield. Individual utilities contributors included PG&E, an electric and natural gas utility that benefited from an improved regulatory environment and what we considered were attractive opportunities for rate base growth. Integrated utility Duke Energy performed well as investors gained increased understanding of the company’s future growth opportunities in generation and distribution. Other strong equity contributors included Intel, one of the world’s leaders in the design, manufacture and sale of semiconductor technology for a broad range of computing devices, which benefited from improved demand for personal computers, growth in mobile computing and “connected” devices, and a greater need for network security and advanced computing capability. Among equity financials holdings, Wells Fargo & Co. and Bank of America positively impacted results largely because of improved loan growth and an improving regulatory environment that contributed to strengthened financial profiles and higher dividends for shareholders.
Equity performance detractors were concentrated in the energy and materials sectors, as slowing global economic growth
| | | | |
| Portfolio Breakdown | | | |
| 12/31/14 | | | |
| | | % of Total
Net Assets | |
| Equity* | | | 57.4% | |
Utilities | | | 13.4% | |
Energy | | | 9.2% | |
Materials | | | 8.2% | |
Financials | | | 5.8% | |
Health Care | | | 4.8% | |
Industrials | | | 4.7% | |
Information Technology | | | 4.2% | |
Other | | | 7.1% | |
| Fixed Income | | | 34.5% | |
Energy | | | 7.7% | |
Consumer Discretionary | | | 6.5% | |
Information Technology | | | 4.7% | |
Telecommunication Services | | | 3.5% | |
Financials | | | 3.3% | |
Materials | | | 2.5% | |
Health Care | | | 2.0% | |
Other | | | 4.3% | |
| Short-Term Investments & Other Net Assets | | | 8.1% | |
*Includes convertible bonds.
reduced demand for many commodities and as advances in extraction technologies led to supply growth, especially from oil and gas shale fields. The collapse of crude oil prices in the fourth quarter of 2014 weighed on share prices for many multi-national integrated oil companies, particularly Fund holdings in BP, Chevron and Royal Dutch Shell. Similarly, the more focused upstream producers and independent exploration and production companies such as Canadian Oil Sands, SandRidge Energy and Cobalt International Energy, a new holding, detracted with the pullback in global oil prices. Within the materials sector, our holdings in diversified mining companies such as Rio Tinto, BHP Billiton and Freeport-McMoRan hindered performance.
Fixed income markets generally performed well during the period despite lagging considerably behind equity markets as modest income and price returns helped the Barclays U.S. Aggregate Index deliver a moderate total return. The primary positive contributor to fixed income returns was the continued favorable environment for long-term interest rates, which led the 10-year U.S. Treasury to rally over the course of the year and its yield to correspondingly fall. In sharp contrast to their investment grade counterparts, noninvestment-grade fixed
FRANKLIN INCOME VIP FUND
| | | | |
| Top Five Equity Holdings | | | |
| 12/31/14 | | | |
Company
Sector/Industry | | % of Total
Net Assets | |
Bank of America Corp.* Financials | | | 1.9% | |
Royal Dutch Shell PLC, A, ADR (U.K.) Energy | | | 1.8% | |
Wells Fargo & Co. Financials | | | 1.7% | |
General Electric Co. Industrials | | | 1.7% | |
The Dow Chemical Co. Materials | | | 1.6% | |
*Includes equity-linked notes.
income markets struggled as investors became wary of sector valuations and as credit spreads widened.
The decline in long-term interest rates during the period provided fixed income markets with favorable conditions that enabled many of the Fund’s high yield corporate bonds to generate positive returns; however, the Fund’s corporate bonds overall had a small negative return. Communications4 sector holdings including Charter Communications5 and Cablevision Systems benefited from demand for video and data services, and iHeart Communications continued to improve its liquidity and financial positioning amid stable demand from advertisers. Technology6 sector positions were led by First Data, a leader in financial transaction systems and processing, and Freescale Semiconductor, a leader in embedded semiconductor processing solutions for the automotive, consumer, industrial and networking markets.
As was the case among the Fund’s equity holdings, major fixed income detractors were concentrated in the commodity-related energy and basic industry7 sectors. The high yield bonds and term loans of exploration and production and oilfield services and equipment companies were severely hurt by lower commodity prices that reduced cash flow and impacted the upstream industry’s spending plans. Investor concerns regarding the long-term viability of many of the more highly leveraged producers weighed on the securities prices of Samson Investment, W&T Offshore, Energy XXI Gulf Coast and
| | | | |
Top Five Fixed Income and Senior Floating Rate Interests Holdings* | | | |
| 12/31/14 | | | |
Issuer
Sector/Industry | | % of Total
Net Assets | |
First Data Corp. Information Technology | | | 2.8% | |
iHeartCommunications Inc. Consumer Discretionary | | | 1.8% | |
JPMorgan Chase & Co. Financials | | | 1.5% | |
Sprint Nextel Corp. Telecommunication Services | | | 1.1% | |
HCA Inc. Health Care | | | 1.0% | |
*Does not include convertible bonds.
The dollar value, number of shares or principal amount, and names of all portfolio holdings are listed in the Fund’s Statement of Investments (SOI).
SandRidge Energy. Basic industry holdings, particularly those engaged in coal mining, slumped further as reduced demand kept pressure on pricing. Among these, Peabody Energy, Alpha Natural Resources, Arch Coal and Walter Energy detracted from results during the period.
Thank you for your participation in Franklin Income VIP Fund. We look forward to serving your future investment needs.
The foregoing information reflects our analysis, opinions and portfolio holdings as of December 31, 2014, the end of the reporting period. The way we implement our main investment strategies and the resulting portfolio holdings may change depending on factors such as market and economic conditions. These opinions may not be relied upon as investment advice or an offer for a particular security. The information is not a complete analysis of every aspect of any market, country, industry, security or the Fund. Statements of fact are from sources considered reliable, but the investment manager makes no representation or warranty as to their completeness or accuracy. Although historical performance is no guarantee of future results, these insights may help you understand our investment management philosophy.
4. Communications companies are in consumer discretionary and telecommunication services in the fixed income section of the SOI.
5. Charter Communications comprises CCO Holdings in the SOI.
6. Technology holdings are in information technology in the fixed income section of the SOI.
7. Basic industry holdings are in energy and materials in the fixed income section of the SOI.
FRANKLIN INCOME VIP FUND
Class 2 Fund Expenses
As an investor in a variable insurance contract (Contract) that indirectly provides for investment in an underlying mutual fund, you can incur transaction and/or ongoing expenses at both the Fund level and the Contract level.
| • | | Transaction expenses can include sales charges (loads) on purchases, redemption fees, surrender fees, transfer fees and premium taxes. |
| • | | Ongoing expenses can include management fees, distribution and service (12b-1) fees, contract fees, annual maintenance fees, mortality and expense risk fees and other fees and expenses. All mutual funds and Contracts have some types of ongoing expenses. |
The expenses shown in the table are meant to highlight ongoing expenses at the Fund level only and do not include ongoing expenses at the Contract level, or transaction expenses at either the Fund or Contract level. While the Fund does not have transaction expenses, if the transaction and ongoing expenses at the Contract level were included, the expenses shown below would be higher. You should consult your Contract prospectus or disclosure document for more information.
The table shows Fund-level ongoing expenses and can help you understand these expenses and compare them with those of other mutual funds offered through the Contract. The table assumes a $1,000 investment held for the six months indicated. Please refer to the Fund prospectus for additional information on operating expenses.
Actual Fund Expenses
The first line (Actual) of the table provides actual account values and expenses. The “Ending Account Value” is derived from the Fund’s actual return, which includes the effect of ongoing Fund expenses, but does not include the effect of ongoing Contract expenses.
You can estimate the Fund-level expenses you incurred during the period by following these steps. Of course, your account value and expenses will differ from those in this illustration:
| 1. | Divide your account value by $1,000. |
If an account had an $8,600 value, then $8,600 ÷ $1,000 = 8.6.
| 2. | Multiply the result by the number under the heading “Fund-Level Expenses Incurred During Period.” |
If Fund-Level Expenses Incurred During Period were $7.50, then 8.6 × $7.50 = $64.50.
In this illustration, the estimated expenses incurred this period at the Fund level are $64.50.
Hypothetical Example for Comparison with Other Mutual Funds
Information in the second line (Hypothetical) of the table can help you compare ongoing expenses of the Fund with those of other mutual funds offered through the Contract. This information may not be used to estimate the actual ending account balance or expenses you incurred during the period. The hypothetical “Ending Account Value” is based on the Fund’s actual expense ratio and an assumed 5% annual rate of return before expenses, which does not represent the Fund’s actual return. The figure under the heading “Fund-Level Expenses Incurred During Period” shows the hypothetical expenses your account would have incurred under this scenario. You can compare this figure with the 5% hypothetical examples that appear in shareholder reports of other funds offered through a Contract.
| | | | | | | | | | | | |
| Class 2 | | Beginning Account Value 7/1/14 | | | Ending Account
Value 12/31/14 | | | Fund-Level Expenses
Incurred During Period* 7/1/14–12/31/14 | |
Actual | | | $1,000 | | | | $ 953.50 | | | | $3.55 | |
Hypothetical (5% return before expenses) | | | $1,000 | | | | $1,021.58 | | | | $3.67 | |
*Expenses are calculated using the most recent six-month annualized expense ratio for the Fund’s Class 2 shares (0.72%), which does not include any ongoing expenses of the Contract for which the Fund is an investment option, multiplied by the average account value over the period, multiplied by 184/365 to reflect the one-half year period.
FRANKLIN TEMPLETON VARIABLE INSURANCE PRODUCTS TRUST
Financial Highlights
Franklin Income VIP Fund
| | | | | | | | | | | | | | | | | | | | |
| | | Year Ended December 31, | |
| | | 2014 | | | 2013 | | | 2012 | | | 2011 | | | 2010 | |
| Class 1 | | | | | | | | | | | | | | | | | | | | |
Per share operating performance
(for a share outstanding throughout the year) | | | | | | | | | | | | | | | | | | | | |
| | | | | |
Net asset value, beginning of year | | | $16.53 | | | | $15.47 | | | | $14.68 | | | | $15.16 | | | | $14.43 | |
| | | | |
| | | | | |
| Income from investment operationsa: | | | | | | | | | | | | | | | | | | | | |
| | | | | |
Net investment incomeb | | | 0.72 | | | | 0.81 | | | | 0.91 | | | | 0.96 | | | | 0.89 | |
| | | | | |
Net realized and unrealized gains (losses) | | | 0.11 | | | | 1.31 | | | | 0.90 | | | | (0.54 | ) | | | 0.85 | |
| | | | |
Total from investment operations | | | 0.83 | | | | 2.12 | | | | 1.81 | | | | 0.42 | | | | 1.74 | |
| | | | |
Less distributions from net investment income | | | (0.88 | ) | | | (1.06 | ) | | | (1.02 | ) | | | (0.90 | ) | | | (1.01 | ) |
| | | | |
Net asset value, end of year | | | $16.48 | | | | $16.53 | | | | $15.47 | | | | $14.68 | | | | $15.16 | |
| | | | |
| | | | | |
Total returnc | | | 4.92% | | | | 14.18% | | | | 12.91% | | | | 2.71% | | | | 12.87% | |
| | | | | |
| Ratios to average net assets | | | | | | | | | | | | | | | | | | | | |
| | | | | |
Expenses | | | 0.47% | d | | | 0.47% | d | | | 0.47% | | | | 0.47% | d | | | 0.47% | d |
| | | | | |
Net investment income | | | 4.26% | | | | 5.07% | | | | 6.03% | | | | 6.35% | | | | 6.28% | |
| | | | | |
| Supplemental data | | | | | | | | | | | | | | | | | | | | |
| | | | | |
Net assets, end of year (000’s) | | | $714,664 | | | | $695,004 | | | | $584,391 | | | | $1,300,935 | | | | $1,449,028 | |
| | | | | |
Portfolio turnover rate | | | 24.77% | | | | 21.71% | | | | 26.66% | e | | | 28.65% | | | | 41.65% | |
aThe amount shown for a share outstanding throughout the period may not correlate with the Statement of Operations for the period due to the timing of sales and repurchases of the Fund shares in relation to income earned and/or fluctuating fair value of the investments of the Fund.
bBased on average daily shares outstanding.
cTotal return does not include fees, charges or expenses imposed by the variable annuity and life insurance contracts for which Franklin Templeton Variable Insurance Products Trust serves as an underlying investment vehicle.
dBenefit of expense reduction rounds to less than 0.01%.
eExcludes the value of portfolio securities delivered as a result of a redemption in-kind.
| | | | |
| FI-6 | | Annual Report | The accompanying notes are an integral part of these financial statements. | | |
FRANKLIN TEMPLETON VARIABLE INSURANCE PRODUCTS TRUST
FINANCIAL HIGHLIGHTS
Franklin Income VIP Fund (continued)
| | | | | | | | | | | | | | | | | | | | |
| | | Year Ended December 31, | |
| | | 2014 | | | 2013 | | | 2012 | | | 2011 | | | 2010 | |
| Class 2 | | | | | | | | | | | | | | | | | | | | |
Per share operating performance
(for a share outstanding throughout the year) | | | | | | | | | | | | | | | | | | | | |
| | | | | |
Net asset value, beginning of year | | | $16.07 | | | | $15.07 | | | | $14.32 | | | | $14.82 | | | | $14.12 | |
| | | | |
| | | | | |
| Income from investment operationsa: | | | | | | | | | | | | | | | | | | | | |
| | | | | |
Net investment incomeb | | | 0.66 | | | | 0.75 | | | | 0.85 | | | | 0.90 | | | | 0.86 | |
| | | | | |
Net realized and unrealized gains (losses) | | | 0.11 | | | | 1.27 | | | | 0.88 | | | | (0.53 | ) | | | 0.82 | |
| | | | |
Total from investment operations | | | 0.77 | | | | 2.02 | | | | 1.73 | | | | 0.37 | | | | 1.68 | |
| | | | |
Less distributions from net investment income | | | (0.84 | ) | | | (1.02 | ) | | | (0.98 | ) | | | (0.87 | ) | | | (0.98 | ) |
| | | | |
Net asset value, end of year | | | $16.00 | | | | $16.07 | | | | $15.07 | | | | $14.32 | | | | $14.82 | |
| | | | |
| | | | | |
Total returnc | | | 4.62% | | | | 13.94% | | | | 12.65% | | | | 2.38% | | | | 12.67% | |
| | | | | |
| Ratios to average net assets | | | | | | | | | | | | | | | | | | | | |
| | | | | |
Expenses | | | 0.72% | d | | | 0.72% | d | | | 0.72% | | | | 0.72% | d | | | 0.72% | d |
| | | | | |
Net investment income | | | 4.01% | | | | 4.82% | | | | 5.78% | | | | 6.10% | | | | 6.03% | |
| | | | | |
| Supplemental data | | | | | | | | | | | | | | | | | | | | |
| | | | | |
Net assets, end of year (000’s) | | | $6,022,804 | | | | $6,188,045 | | | | $6,182,997 | | | | $5,915,637 | | | | $6,309,207 | |
| | | | | |
Portfolio turnover rate | | | 24.77% | | | | 21.71% | | | | 26.66% | e | | | 28.65% | | | | 41.65% | |
aThe amount shown for a share outstanding throughout the period may not correlate with the Statement of Operations for the period due to the timing of sales and repurchases of the Fund shares in relation to income earned and/or fluctuating fair value of the investments of the Fund.
bBased on average daily shares outstanding.
cTotal return does not include fees, charges or expenses imposed by the variable annuity and life insurance contracts for which Franklin Templeton Variable Insurance Products Trust serves as an underlying investment vehicle.
dBenefit of expense reduction rounds to less than 0.01%.
eExcludes the value of portfolio securities delivered as a result of a redemption in-kind.
| | | | | | |
| | | The accompanying notes are an integral part of these financial statements. | Annual Report | | | FI-7 | |
FRANKLIN TEMPLETON VARIABLE INSURANCE PRODUCTS TRUST
FINANCIAL HIGHLIGHTS
Franklin Income VIP Fund (continued)
| | | | | | | | | | | | | | | | | | | | |
| | | Year Ended December 31, | |
| | | 2014 | | | 2013 | | | 2012 | | | 2011 | | | 2010 | |
| Class 4 | | | | | | | | | | | | | | | | | | | | |
Per share operating performance
(for a share outstanding throughout the year) | | | | | | | | | | | | | | | | | | | | |
| | | | | |
Net asset value, beginning of year | | | $16.36 | | | | $15.32 | | | | $14.54 | | | | $15.04 | | | | $14.33 | |
| | | | |
| | | | | |
| Income from investment operationsa: | | | | | | | | | | | | | | | | | | | | |
| | | | | |
Net investment incomeb | | | 0.66 | | | | 0.75 | | | | 0.85 | | | | 0.90 | | | | 0.85 | |
| | | | | |
Net realized and unrealized gains (losses) | | | 0.11 | | | | 1.30 | | | | 0.90 | | | | (0.54 | ) | | | 0.84 | |
| | | | |
Total from investment operations | | | 0.77 | | | | 2.05 | | | | 1.75 | | | | 0.36 | | | | 1.69 | |
| | | | |
Less distributions from net investment income | | | (0.82 | ) | | | (1.01 | ) | | | (0.97 | ) | | | (0.86 | ) | | | (0.98 | ) |
| | | | |
Net asset value, end of year | | | $16.31 | | | | $16.36 | | | | $15.32 | | | | $14.54 | | | | $15.04 | |
| | | | |
| | | | | |
Total returnc | | | 4.52% | | | | 13.85% | | | | 12.56% | | | | 2.29% | | | | 12.54% | |
| | | | | |
| Ratios to average net assets | | | | | | | | | | | | | | | | | | | | |
| | | | | |
Expenses | | | 0.82% | d | | | 0.82% | d | | | 0.82% | | | | 0.82% | d | | | 0.82% | d |
| | | | | |
Net investment income | | | 3.91% | | | | 4.72% | | | | 5.68% | | | | 6.00% | | | | 5.93% | |
| | | | | |
| Supplemental data | | | | | | | | | | | | | | | | | | | | |
| | | | | |
Net assets, end of year (000’s) | | | $378,545 | | | | $397,652 | | | | $436,405 | | | | $431,435 | | | | $415,541 | |
| | | | | |
Portfolio turnover rate | | | 24.77% | | | | 21.71% | | | | 26.66% | e | | | 28.65% | | | | 41.65% | |
aThe amount shown for a share outstanding throughout the period may not correlate with the Statement of Operations for the period due to the timing of sales and repurchases of the Fund shares in relation to income earned and/or fluctuating fair value of the investments of the Fund.
bBased on average daily shares outstanding.
cTotal return does not include fees, charges or expenses imposed by the variable annuity and life insurance contracts for which Franklin Templeton Variable Insurance Products Trust serves as an underlying investment vehicle.
dBenefit of expense reduction rounds to less than 0.01%.
eExcludes the value of portfolio securities delivered as a result of a redemption in-kind.
| | | | |
| FI-8 | | Annual Report | The accompanying notes are an integral part of these financial statements. | | |
FRANKLIN TEMPLETON VARIABLE INSURANCE PRODUCTS TRUST
Statement of Investments, December 31, 2014
| | | | | | | | | | | | | | |
| Franklin Income VIP Fund | | | | |
| | | | | Country | | | Shares/Warrants | | | Value | |
| | Common Stocks and Other Equity Interests 49.9% | | | | | | | | | | | | |
| | Consumer Discretionary 3.2% | | | | | | | | | | | | |
| a | | Dex Media Inc. | | | United States | | | | 458,876 | | | $ | 4,116,118 | |
| | Ford Motor Co. | | | United States | | | | 3,750,000 | | | | 58,125,000 | |
| | General Motors Co. | | | United States | | | | 1,839,100 | | | | 64,202,981 | |
| | Las Vegas Sands Corp. | | | United States | | | | 200,000 | | | | 11,632,000 | |
| | Target Corp. | | | United States | | | | 1,181,100 | | | | 89,657,301 | |
| | | | | | | | | | | | | | |
| | | | | | | | | | | | | 227,733,400 | |
| | | | | | | | | | | | | | |
| | Consumer Staples 0.8% | | | | | | | | | | | | |
| | PepsiCo Inc. | | | United States | | | | 584,000 | | | | 55,223,040 | |
| | | | | | | | | | | | | | |
| | Energy 7.7% | | | | | | | | | | | | |
| | BP PLC, ADR | | | United Kingdom | | | | 2,942,400 | | | | 112,164,288 | |
| | Canadian Oil Sands Ltd. | | | Canada | | | | 2,000,000 | | | | 17,946,179 | |
| | Chevron Corp. | | | United States | | | | 700,000 | | | | 78,526,000 | |
| | Devon Energy Corp. | | | United States | | | | 650,000 | | | | 39,786,500 | |
| | Eni SpA | | | Italy | | | | 776,500 | | | | 13,633,088 | |
| | Exxon Mobil Corp. | | | United States | | | | 484,850 | | | | 44,824,382 | |
| | Halliburton Co. | | | United States | | | | 250,000 | | | | 9,832,500 | |
| | Occidental Petroleum Corp. | | | United States | | | | 150,000 | | | | 12,091,500 | |
| | Royal Dutch Shell PLC, A, ADR | | | United Kingdom | | | | 1,951,748 | | | | 130,669,529 | |
| | Schlumberger Ltd. | | | United States | | | | 250,000 | | | | 21,352,500 | |
| | Spectra Energy Corp. | | | United States | | | | 600,000 | | | | 21,780,000 | |
| | Total SA, B, ADR | | | France | | | | 932,900 | | | | 47,764,480 | |
| | | | | | | | | | | | | | |
| | | | | | | | | | | | | 550,370,946 | |
| | | | | | | | | | | | | | |
| | Financials 2.7% | | | | | | | | | | | | |
| | Bank of America Corp. | | | United States | | | | 473,900 | | | | 8,478,071 | |
| | Commonwealth Bank of Australia | | | Australia | | | | 374,700 | | | | 26,203,980 | |
| | HSBC Holdings PLC | | | United Kingdom | | | | 1,841,457 | | | | 17,468,518 | |
| | JPMorgan Chase & Co. | | | United States | | | | 735,100 | | | | 46,002,558 | |
| | MetLife Inc. | | | United States | | | | 761,108 | | | | 41,168,332 | |
| | Wells Fargo & Co. | | | United States | | | | 1,000,000 | | | | 54,820,000 | |
| | | | | | | | | | | | | | |
| | | | | | | | | | | | | 194,141,459 | |
| | | | | | | | | | | | | | |
| | Health Care 4.8% | | | | | | | | | | | | |
| | Eli Lilly & Co. | | | United States | | | | 434,800 | | | | 29,996,852 | |
| | Johnson & Johnson | | | United States | | | | 417,800 | | | | 43,689,346 | |
| | Merck & Co. Inc. | | | United States | | | | 1,523,200 | | | | 86,502,528 | |
| | Pfizer Inc. | | | United States | | | | 3,638,975 | | | | 113,354,071 | |
| | Roche Holding AG | | | Switzerland | | | | 92,619 | | | | 25,143,702 | |
| | Sanofi, ADR | | | France | | | | 868,292 | | | | 39,602,798 | |
| | | | | | | | | | | | | | |
| | | | | | | | | | | | | 338,289,297 | |
| | | | | | | | | | | | | | |
| | Industrials 4.5% | | | | | | | | | | | | |
| | The Boeing Co. | | | United States | | | | 231,800 | | | | 30,129,364 | |
| a | | CEVA Holdings LLC | | | United Kingdom | | | | 13,012 | | | | 10,084,502 | |
| | Deere & Co. | | | United States | | | | 224,200 | | | | 19,834,974 | |
| | General Electric Co. | | | United States | | | | 4,656,200 | | | | 117,662,174 | |
| | Lockheed Martin Corp. | | | United States | | | | 253,200 | | | | 48,758,724 | |
| | Raytheon Co. | | | United States | | | | 150,000 | | | | 16,225,500 | |
| | Republic Services Inc. | | | United States | | | | 527,300 | | | | 21,223,825 | |
| | United Technologies Corp. | | | United States | | | | 75,000 | | | | 8,625,000 | |
| | Waste Management Inc. | | | United States | | | | 928,200 | | | | 47,635,224 | |
| | | | | | | | | | | | | | |
| | | | | | | | | | | | | 320,179,287 | |
| | | | | | | | | | | | | | |
FRANKLIN TEMPLETON VARIABLE INSURANCE PRODUCTS TRUST
STATEMENT OF INVESTMENTS
Franklin Income VIP Fund (continued)
| | | | | | | | | | | | | | |
| | | | | Country | | | Shares/Warrants | | | Value | |
| | Common Stocks and Other Equity Interests (continued) | | | | | | | | | | | | |
| | Information Technology 3.4% | | | | | | | | | | | | |
| | Apple Inc. | | | United States | | | | 350,000 | | | $ | 38,633,000 | |
| | Cisco Systems Inc. | | | United States | | | | 1,400,000 | | | | 38,941,000 | |
| a,b | | First Data Holdings Inc., B | | | United States | | | | 4,929,600 | | | | 20,984,469 | |
| | Intel Corp. | | | United States | | | | 1,500,000 | | | | 54,435,000 | |
| | Microsoft Corp. | | | United States | | | | 687,500 | | | | 31,934,375 | |
| | Texas Instruments Inc. | | | United States | | | | 924,800 | | | | 49,444,432 | |
| | Xilinx Inc. | | | United States | | | | 183,400 | | | | 7,939,386 | |
| | | | | | | | | | | | | | |
| | | | | | | | | | | | | 242,311,662 | |
| | | | | | | | | | | | | | |
| | Materials 7.7% | | | | | | | | | | | | |
| | Agrium Inc. | | | Canada | | | | 650,000 | | | | 61,568,000 | |
| | Barrick Gold Corp. | | | Canada | | | | 1,000,000 | | | | 10,750,000 | |
| | BASF SE | | | Germany | | | | 250,000 | | | | 21,138,699 | |
| | BHP Billiton PLC | | | Australia | | | | 2,784,192 | | | | 60,257,011 | |
| | The Dow Chemical Co. | | | United States | | | | 2,525,700 | | | | 115,197,177 | |
| | E. I. du Pont de Nemours and Co. | | | United States | | | | 1,047,500 | | | | 77,452,150 | |
| | Freeport-McMoRan Inc., B | | | United States | | | | 1,500,000 | | | | 35,040,000 | |
| | Goldcorp Inc. | | | Canada | | | | 1,508,600 | | | | 27,939,272 | |
| | LyondellBasell Industries NV, A | | | United States | | | | 500,000 | | | | 39,695,000 | |
| | The Mosaic Co. | | | United States | | | | 300,000 | | | | 13,695,000 | |
| | Rio Tinto PLC, ADR | | | United Kingdom | | | | 1,845,100 | | | | 84,985,306 | |
| | | | | | | | | | | | | | |
| | | | | | | | | | | | | 547,717,615 | |
| | | | | | | | | | | | | | |
| | Telecommunication Services 2.1% | | | | | | | | | | | | |
| | AT&T Inc. | | | United States | | | | 1,621,000 | | | | 54,449,390 | |
| | CenturyLink Inc. | | | United States | | | | 500,000 | | | | 19,790,000 | |
| | Telstra Corp. Ltd. | | | Australia | | | | 3,446,331 | | | | 16,799,158 | |
| | Verizon Communications Inc. | | | United States | | | | 1,123,892 | | | | 52,575,668 | |
| | Vodafone Group PLC | | | United Kingdom | | | | 2,115,279 | | | | 7,340,960 | |
| | | | | | | | | | | | | | |
| | | | | | | | | | | | | 150,955,176 | |
| | | | | | | | | | | | | | |
| | Utilities 13.0% | | | | | | | | | | | | |
| | AGL Resources Inc. | | | United States | | | | 290,732 | | | | 15,847,801 | |
| | American Electric Power Co. Inc. | | | United States | | | | 400,000 | | | | 24,288,000 | |
| | Dominion Resources Inc. | | | United States | | | | 700,000 | | | | 53,830,000 | |
| | Duke Energy Corp. | | | United States | | | | 1,302,500 | | | | 108,810,850 | |
| a,c | | Dynegy Inc. | | | United States | | | | 1,250,000 | | | | 37,937,500 | |
| a,c | | Dynegy Inc., wts., 10/02/17 | | | United States | | | | 242,666 | | | | 977,944 | |
| | Entergy Corp. | | | United States | | | | 538,100 | | | | 47,072,988 | |
| | Exelon Corp. | | | United States | | | | 2,877,200 | | | | 106,686,576 | |
| | FirstEnergy Corp. | | | United States | | | | 845,900 | | | | 32,981,641 | |
| d | | HK Electric Investments & HK Electric Investments Ltd., 144A | | | Hong Kong | | | | 3,117,900 | | | | 2,058,776 | |
| | NextEra Energy Inc. | | | United States | | | | 651,300 | | | | 69,226,677 | |
| | PG&E Corp. | | | United States | | | | 1,935,300 | | | | 103,035,372 | |
| | Pinnacle West Capital Corp. | | | United States | | | | 260,500 | | | | 17,794,755 | |
| | PPL Corp. | | | United States | | | | 1,365,400 | | | | 49,604,982 | |
| | Public Service Enterprise Group Inc. | | | United States | | | | 923,500 | | | | 38,242,135 | |
| | Sempra Energy | | | United States | | | | 368,300 | | | | 41,013,888 | |
| | The Southern Co. | | | United States | | | | 1,888,200 | | | | 92,729,502 | |
| | TECO Energy Inc. | | | United States | | | | 1,253,700 | | | | 25,688,313 | |
FRANKLIN TEMPLETON VARIABLE INSURANCE PRODUCTS TRUST
STATEMENT OF INVESTMENTS
Franklin Income VIP Fund (continued)
| | | | | | | | | | | | | | |
| | | | | Country | | | Shares/Warrants | | | Value | |
| | Common Stocks and Other Equity Interests (continued) | | | | | | | | | | | | |
| | Utilities (continued) | | | | | | | | | | | | |
| | Xcel Energy Inc. | | | United States | | | | 1,510,964 | | | $ | 54,273,827 | |
| | | | | | | | | | | | | | |
| | | | | | | | | | | | | 922,101,527 | |
| | | | | | | | | | | | | | |
| | | | |
| | Total Common Stocks and Other Equity Interests (Cost $2,892,681,102) | | | | | | | | | | | 3,549,023,409 | |
| | | | | | | | | | | | | | |
| e | | Equity-Linked Securities 2.7% | | | | | | | | | | | | |
| | Consumer Staples 0.3% | | | | | | | | | | | | |
| d | | Citigroup Inc. into Whole Foods Market Inc., 7.00%, 144A | | | United States | | | | 485,000 | | | | 21,611,309 | |
| | | | | | | | | | | | | | |
| | Energy 1.0% | | | | | | | | | | | | |
| d | | Citigroup Inc. into Cabot Oil & Gas Corp., 6.00%, 144A | | | United States | | | | 696,000 | | | | 20,889,883 | |
| d | | Credit Suisse New York into Baker Hughes Inc., 6.00%, 144A | | | United States | | | | 200,000 | | | | 10,862,620 | |
| d | | JPMorgan Chase & Co. into Anadarko Petroleum Corp., 7.00%, 144A | | | United States | | | | 470,000 | | | | 38,933,296 | |
| | | | | | | | | | | | | | |
| | | | | | | | | | | | | 70,685,799 | |
| | | | | | | | | | | | | | |
| | Financials 0.6% | | | | | | | | | | | | |
| d | | The Goldman Sachs Group into Bank of America Corp., 6.00%, 144A | | | United States | | | | 2,150,000 | | | | 38,714,190 | |
| | | | | | | | | | | | | | |
| | Information Technology 0.8% | | | | | | | | | | | | |
| d | | Bank of America Corp. into Intel Corp., 6.50%, 144A | | | United States | | | | 1,045,000 | | | | 38,106,970 | |
| d | | Bank of America Corp. into Freescale Semiconductor Ltd., 7.00%, 144A | | | United States | | | | 950,000 | | | | 21,726,690 | |
| | | | | | | | | | | | | | |
| | | | | | | | | | | | | 59,833,660 | |
| | | | | | | | | | | | | | |
| | | | |
| | Total Equity-Linked Securities (Cost $186,768,257) | | | | | | | | | | | 190,844,958 | |
| | | | | | | | | | | | | | |
| | Convertible Preferred Stocks 3.7% | | | | | | | | | | | | |
| | Consumer Discretionary 0.2% | | | | | | | | | | | | |
| | Fiat Chrysler Automobiles NV, 7.875%, cvt. pfd. | | | United Kingdom | | | | 100,000 | | | | 10,750,000 | |
| | | | | | | | | | | | | | |
| | Energy 0.2% | | | | | | | | | | | | |
| | Halcon Resources Corp., 5.75%, cvt. pfd., A | | | United States | | | | 10,000 | | | | 3,258,750 | |
| | Sanchez Energy Corp., 6.50%, cvt. pfd., B | | | United States | | | | 200,000 | | | | 6,836,000 | |
| | SandRidge Energy Inc., 7.00%, cvt. pfd. | | | United States | | | | 121,600 | | | | 6,791,360 | |
| | | | | | | | | | | | | | |
| | | | | | | | | | | | | 16,886,110 | |
| | | | | | | | | | | | | | |
| | Financials 2.3% | | | | | | | | | | | | |
| | Bank of America Corp., 7.25%, cvt. pfd., L | | | United States | | | | 78,200 | | | | 90,944,254 | |
| | FelCor Lodging Trust Inc., 7.80%, cvt. pfd., A | | | United States | | | | 167,325 | | | | 4,273,480 | |
| a | | FNMA, 5.375%, cvt. pfd. | | | United States | | | | 475 | | | | 5,818,750 | |
| | Wells Fargo & Co., 7.50%, cvt. pfd., A | | | United States | | | | 53,000 | | | | 64,262,235 | |
| | | | | | | | | | | | | | |
| | | | | | | | | | | | | 165,298,719 | |
| | | | | | | | | | | | | | |
| | Industrials 0.2% | | | | | | | | | | | | |
| a | | CEVA Holdings LLC, cvt. pfd., A-1 | | | United Kingdom | | | | 397 | | | | 397,000 | |
| a | | CEVA Holdings LLC, cvt. pfd., A-2 | | | United Kingdom | | | | 14,711 | | | | 11,400,948 | |
| | | | | | | | | | | | | | |
| | | | | | | | | | | | | 11,797,948 | |
| | | | | | | | | | | | | | |
| | Materials 0.4% | | | | | | | | | | | | |
| | Alcoa Inc., 5.375%, cvt. pfd. | | | United States | | | | 500,000 | | | | 25,225,000 | |
| | ArcelorMittal, 6.00%, cvt. pfd. | | | Luxembourg | | | | 160,000 | | | | 2,768,000 | |
| | | | | | | | | | | | | | |
| | | | | | | | | | | | | 27,993,000 | |
| | | | | | | | | | | | | | |
FRANKLIN TEMPLETON VARIABLE INSURANCE PRODUCTS TRUST
STATEMENT OF INVESTMENTS
Franklin Income VIP Fund (continued)
| | | | | | | | | | | | | | |
| | | | | Country | | | Shares/Warrants | | | Value | |
| | Convertible Preferred Stocks (continued) | | | | | | | | | | | | |
| | Utilities 0.4% | | | | | | | | | | | | |
| | Dominion Resources Inc., 6.00%, cvt. pfd., B | | | United States | | | | 145,000 | | | $ | 8,717,400 | |
| | Dominion Resources Inc., 6.125%, cvt. pfd., A | | | United States | | | | 145,000 | | | | 8,701,450 | |
| | Dominion Resources Inc., 6.375%, cvt. pfd., A | | | United States | | | | 162,000 | | | | 8,425,620 | |
| | NextEra Energy Inc., 5.889%, cvt. pfd. | | | United States | | | | 83,100 | | | | 5,562,714 | |
| | | | | | | | | | | | | | |
| | | | | | | | | | | | | 31,407,184 | |
| | | | | | | | | | | | | | |
| | | | |
| | Total Convertible Preferred Stocks
(Cost $275,974,258) | | | | | | | | | | | 264,132,961 | |
| | | | | | | | | | | | | | |
| | Preferred Stocks 0.2% | | | | | | | | | | | | |
| | Financials 0.2% | | | | | | | | | | | | |
| a | | FHLMC, 8.375%, pfd., Z | | | United States | | | | 745,175 | | | | 2,943,441 | |
| a | | FNMA, 6.75%, pfd. | | | United States | | | | 406,950 | | | | 1,216,781 | |
| a | | FNMA, 7.625%, pfd., R | | | United States | | | | 694,650 | | | | 2,354,864 | |
| a | | FNMA, 8.25%, pfd. | | | United States | | | | 739,375 | | | | 2,861,381 | |
| | Morgan Stanley, 6.375%, pfd., I | | | United States | | | | 350,000 | | | | 8,858,500 | |
| | | | | | | | | | | | | | |
| | | | |
| | Total Preferred Stocks (Cost $73,403,750) | | | | | | | | | | | 18,234,967 | |
| | | | | | | | | | | | | | |
| | | | |
| | | | | | | | Principal Amount* | | | | |
| | Convertible Bonds 0.9% | | | | | | | | | | | | |
| | Consumer Discretionary 0.5% | | | | | | | | | | | | |
| d | | Volkswagen International Finance, cvt., sub. note, 144A, 5.50%, 11/09/15 | | | Germany | | | | 25,000,000 | EUR | | | 33,647,225 | |
| | | | | | | | | | | | | | |
| | Energy 0.3% | | | | | | | | | | | | |
| d,f | | American Energy-Permian Basin LLC, cvt., 144A, PIK, 8.00%, 5/01/22 | | | United States | | | | 5,000,000 | | | | 4,339,320 | |
| | Cobalt International Energy Inc., cvt., senior bond, 3.125%,
5/15/24 | | | United States | | | | 25,000,000 | | | | 16,890,625 | |
| | | | | | | | | | | | | | |
| | | | | | | | | | | | | 21,229,945 | |
| | | | | | | | | | | | | | |
| | Materials 0.1% | | | | | | | | | | | | |
| | Cemex SAB de CV, cvt., sub. note, 3.75%, 3/15/18 | | | Mexico | | | | 5,690,000 | | | | 6,932,241 | |
| | | | | | | | | | | | | | |
| | | | |
| | Total Convertible Bonds (Cost $67,008,977) | | | | | | | | | | | 61,809,411 | |
| | | | | | | | | | | | | | |
| | Corporate Bonds 32.1% | | | | | | | | | | | | |
| | Consumer Discretionary 5.6% | | | | | | | | | | | | |
| d | | 1011778 BC ULC/New Red Finance Inc., secured note, second lien, 144A, 6.00%, 4/01/22 | | | Canada | | | | 10,000,000 | | | | 10,300,000 | |
| d | | Academy Ltd./Finance Corp., senior note, 144A, 9.25%, 8/01/19 | | | United States | | | | 5,300,000 | | | | 5,591,500 | |
| d | | Altice SA, senior secured note, 144A, 7.75%, 5/15/22 | | | Luxembourg | | | | 3,000,000 | | | | 3,011,250 | |
| | Cablevision Systems Corp., senior note, 7.75%, 4/15/18 | | | United States | | | | 10,000,000 | | | | 11,037,500 | |
| d | | CBS Outdoor Americas Capital LLC/CBS Outdoor Americas Capital Corp., | | | | | | | | | | | | |
| | senior bond, 144A, 5.625%, 2/15/24 | | | United States | | | | 1,600,000 | | | | 1,612,000 | |
| | senior note, 144A, 5.25%, 2/15/22 | | | United States | | | | 1,600,000 | | | | 1,616,000 | |
| | CCO Holdings LLC/CCO Holdings Capital Corp., | | | | | | | | | | | | |
| | senior bond, 5.25%, 9/30/22 | | | United States | | | | 2,700,000 | | | | 2,703,375 | |
| | senior note, 6.50%, 4/30/21 | | | United States | | | | 15,000,000 | | | | 15,806,250 | |
| | Chrysler Group LLC/CG Co-Issuer Inc., senior secured note, | | | | | | | | | | | | |
| | 8.00%, 6/15/19 | | | United States | | | | 25,000,000 | | | | 26,406,250 | |
| | 8.25%, 6/15/21 | | | United States | | | | 15,400,000 | | | | 17,132,500 | |
FRANKLIN TEMPLETON VARIABLE INSURANCE PRODUCTS TRUST
STATEMENT OF INVESTMENTS
Franklin Income VIP Fund (continued)
| | | | | | | | | | | | | | |
| | | | | Country | | | Principal Amount* | | | Value | |
| | Corporate Bonds (continued) | | | | | | | | | | | | |
| | Consumer Discretionary (continued) | | | | | | | | | | | | |
| | Clear Channel Worldwide Holdings Inc., senior sub. note, 7.625%, 3/15/20 | | | United States | | | | 8,750,000 | | | $ | 9,253,125 | |
| | CSC Holdings LLC, senior note, 6.75%, 11/15/21 | | | United States | | | | 15,400,000 | | | | 17,074,750 | |
| g | | Cumulus Media Holdings Inc., senior note, 7.75%, 5/01/19 | | | United States | | | | 10,000,000 | | | | 10,137,500 | |
| f | | Dex Media Inc., senior sub. note, PIK, 14.00%, 1/29/17 | | | United States | | | | 16,544,628 | | | | 7,235,727 | |
| | DISH DBS Corp., | | | | | | | | | | | | |
| | senior bond, 5.00%, 3/15/23 | | | United States | | | | 15,000,000 | | | | 14,550,000 | |
| | d senior note, 144A, 5.875%, 11/15/24 | | | United States | | | | 8,300,000 | | | | 8,362,250 | |
| | Dollar General Corp., senior bond, 3.25%, 4/15/23 | | | United States | | | | 5,000,000 | | | | 4,559,320 | |
| | The Goodyear Tire & Rubber Co., senior note, | | | | | | | | | | | | |
| | 8.25%, 8/15/20 | | | United States | | | | 4,900,000 | | | | 5,218,500 | |
| | 6.50%, 3/01/21 | | | United States | | | | 12,600,000 | | | | 13,419,000 | |
| | HD Supply Inc., | | | | | | | | | | | | |
| | d first lien, 144A, 5.25%, 12/15/21 | | | United States | | | | 6,000,000 | | | | 6,120,000 | |
| | senior note, 7.50%, 7/15/20 | | | United States | | | | 10,000,000 | | | | 10,525,000 | |
| | iHeartCommunications Inc., | | | | | | | | | | | | |
| | f senior note, PIK, 14.00%, 2/01/21 | | | United States | | | | 13,465,320 | | | | 10,933,611 | |
| | senior secured bond, first lien, 9.00%, 3/01/21 | | | United States | | | | 24,100,000 | | | | 23,708,375 | |
| | senior secured note, first lien, 9.00%, 12/15/19 | | | United States | | | | 18,000,000 | | | | 17,797,500 | |
| | d senior secured note, first lien, 144A, 9.00%, 9/15/22 | | | United States | | | | 14,600,000 | | | | 14,344,500 | |
| | KB Home, | | | | | | | | | | | | |
| | senior bond, 7.50%, 9/15/22 | | | United States | | | | 6,500,000 | | | | 6,922,500 | |
| | senior note, 7.25%, 6/15/18 | | | United States | | | | 10,600,000 | | | | 11,342,000 | |
| d | | Laureate Education Inc., 144A, 9.25%, 9/01/19 | | | United States | | | | 5,000,000 | | | | 5,175,000 | |
| | MGM Resorts International, senior note, | | | | | | | | | | | | |
| | 10.00%, 11/01/16 | | | United States | | | | 10,000,000 | | | | 11,175,000 | |
| | 8.625%, 2/01/19 | | | United States | | | | 3,700,000 | | | | 4,213,375 | |
| | 5.25%, 3/31/20 | | | United States | | | | 5,000,000 | | | | 4,975,000 | |
| | 6.75%, 10/01/20 | | | United States | | | | 5,500,000 | | | | 5,788,750 | |
| d | | Numericable Group SA, senior note, first lien, 144A, 6.00%, 5/15/22 | | | France | | | | 10,000,000 | | | | 10,056,500 | |
| | Shea Homes LP/Funding Corp., senior secured note, 8.625%, 5/15/19 | | | United States | | | | 6,700,000 | | | | 7,068,500 | |
| d | | Sirius XM Radio Inc., | | | | | | | | | | | | |
| | senior bond, 144A, 6.00%, 7/15/24 | | | United States | | | | 14,600,000 | | | | 15,001,500 | |
| | senior note, 144A, 5.75%, 8/01/21 | | | United States | | | | 5,000,000 | | | | 5,137,500 | |
| d | | Univision Communications Inc., senior secured note, 144A, | | | | | | | | | | | | |
| | 6.875%, 5/15/19 | | | United States | | | | 15,000,000 | | | | 15,656,250 | |
| | 5.125%, 5/15/23 | | | United States | | | | 10,000,000 | | | | 10,150,000 | |
| d | | Virgin Media Secured Finance PLC, senior secured bond, first lien, 144A, 5.50%, 1/15/25 | | | United Kingdom | | | | 7,000,000 | | | | 7,249,375 | |
| | Visant Corp., senior note, 10.00%, 10/01/17 | | | United States | | | | 12,800,000 | | | | 11,264,000 | |
| | | | | | | | | | | | | | |
| | | | | | | | | | | | | 399,631,033 | |
| | | | | | | | | | | | | | |
| | Consumer Staples 0.8% | | | | | | | | | | | | |
| d | | Albertsons Holdings/Saturn Acquisition, senior note, 144A, 7.75%, 10/15/22 | | | United States | | | | 5,000,000 | | | | 5,150,000 | |
| | Alliance One International Inc., secured note, second lien, 9.875%, 7/15/21 | | | United States | | | | 10,000,000 | | | | 8,975,000 | |
| d | | JBS USA LLC/Finance Inc., senior note, 144A, | | | | | | | | | | | | |
| | 8.25%, 2/01/20 | | | United States | | | | 10,000,000 | | | | 10,575,000 | |
| | 7.25%, 6/01/21 | | | United States | | | | 17,400,000 | | | | 18,009,000 | |
| | U.S. Foods Inc., 8.50%, 6/30/19 | | | United States | | | | 10,000,000 | | | | 10,610,000 | |
| | | | | | | | | | | | | | |
| | | | | | | | | | | | | 53,319,000 | |
| | | | | | | | | | | | | | |
FRANKLIN TEMPLETON VARIABLE INSURANCE PRODUCTS TRUST
STATEMENT OF INVESTMENTS
Franklin Income VIP Fund (continued)
| | | | | | | | | | | | | | |
| | | | | Country | | | Principal Amount* | | | Value | |
| | Corporate Bonds (continued) | | | | | | | | | | | | |
| | Energy 7.2% | | | | | | | | | | | | |
| | Alpha Natural Resources Inc., senior note, 6.25%, 6/01/21 | | | United States | | | | 2,500,000 | | | $ | 712,500 | |
| d | | American Energy-Woodford LLC/Finance Corp., senior note, 144A, 9.00%, 9/15/22 | | | United States | | | | 5,000,000 | | | | 3,250,000 | |
| d | | Antero Resources Corp., senior note, 144A, 5.125%, 12/01/22 | | | United States | | | | 6,000,000 | | | | 5,685,000 | |
| | Antero Resources Finance Corp., senior note, 5.375%, 11/01/21 | | | United States | | | | 2,200,000 | | | | 2,136,750 | |
| | Arch Coal Inc., senior note, | | | | | | | | | | | | |
| | g 7.00%, 6/15/19 | | | United States | | | | 5,500,000 | | | | 1,677,500 | |
| | 7.25%, 6/15/21 | | | United States | | | | 12,500,000 | | | | 3,703,125 | |
| | Bill Barrett Corp., senior note, | | | | | | | | | | | | |
| | 7.625%, 10/01/19 | | | United States | | | | 4,000,000 | | | | 3,660,000 | |
| | 7.00%, 10/15/22 | | | United States | | | | 10,000,000 | | | | 8,100,000 | |
| | BreitBurn Energy Partners LP/BreitBurn Finance Corp., senior bond, 7.875%, 4/15/22 | | | United States | | | | 10,000,000 | | | | 7,775,000 | |
| d | | California Resources Corp., | | | | | | | | | | | | |
| | senior bond, 144A, 6.00%, 11/15/24 | | | United States | | | | 5,500,000 | | | | 4,675,000 | |
| | senior note, 144A, 5.50%, 9/15/21 | | | United States | | | | 12,500,000 | | | | 10,750,000 | |
| d | | Calumet Specialty Products Partners LP/Calumet Finance Corp., senior note, 144A, 6.50%, 4/15/21 | | | United States | | | | 5,000,000 | | | | 4,487,500 | |
| | CGG SA, senior note, 6.50%, 6/01/21 | | | France | | | | 11,100,000 | | | | 8,491,500 | |
| | CHC Helicopter SA, senior secured note, first lien, 9.25%, 10/15/20 | | | Canada | | | | 22,500,000 | | | | 21,937,500 | |
| | Chesapeake Energy Corp., senior note, 5.375%, 6/15/21 | | | United States | | | | 15,000,000 | | | | 15,065,625 | |
| | Clayton Williams Energy Inc., senior note, 7.75%, 4/01/19 | | | United States | | | | 1,500,000 | | | | 1,282,500 | |
| | CONSOL Energy Inc., senior note, | | | | | | | | | | | | |
| | 8.25%, 4/01/20 | | | United States | | | | 1,800,000 | | | | 1,874,250 | |
| | d144A, 5.875%, 4/15/22 | | | United States | | | | 21,500,000 | | | | 20,102,500 | |
| | Denbury Resources Inc., | | | | | | | | | | | | |
| | senior note, 5.50%, 5/01/22 | | | United States | | | | 17,000,000 | | | | 15,640,000 | |
| | senior sub. note, 4.625%, 7/15/23 | | | United States | | | | 5,000,000 | | | | 4,362,500 | |
| | Energy XXI Gulf Coast Inc., senior note, | | | | | | | | | | | | |
| | 9.25%, 12/15/17 | | | United States | | | | 20,764,000 | | | | 13,808,060 | |
| | d 144A, 6.875%, 3/15/24 | | | United States | | | | 11,810,000 | | | | 6,406,925 | |
| d | | EnQuest PLC, senior note, 144A, 7.00%, 4/15/22 | | | United Kingdom | | | | 15,000,000 | | | | 9,215,625 | |
| | EP Energy LLC/Everest Acquisition Finance Inc., senior note, 9.375%, 5/01/20 | | | United States | | | | 10,000,000 | | | | 10,150,000 | |
| | EXCO Resources Inc., senior note, 7.50%, 9/15/18 | | | United States | | | | 12,500,000 | | | | 9,617,187 | |
| d | | Gibson Energy Inc., senior note, 144A, 6.75%, 7/15/21 | | | Canada | | | | 7,000,000 | | | | 7,017,500 | |
| | Halcon Resources Corp., senior note, | | | | | | | | | | | | |
| | 9.75%, 7/15/20 | | | United States | | | | 12,500,000 | | | | 9,437,500 | |
| | 8.875%, 5/15/21 | | | United States | | | | 3,500,000 | | | | 2,651,250 | |
| | 9.25%, 2/15/22 | | | United States | | | | 5,800,000 | | | | 4,306,500 | |
| d | | Hercules Offshore Inc., senior note, 144A, | | | | | | | | | | | | |
| | 10.25%, 4/01/19 | | | United States | | | | 3,000,000 | | | | 1,605,000 | |
| | 8.75%, 7/15/21 | | | United States | | | | 5,000,000 | | | | 2,350,000 | |
| | 6.75%, 4/01/22 | | | United States | | | | 1,500,000 | | | | 652,500 | |
| | Kinder Morgan Inc., | | | | | | | | | | | | |
| | senior note, MTN, 7.75%, 1/15/32 | | | United States | | | | 22,000,000 | | | | 27,170,000 | |
| | dsenior secured bond, first lien, 144A, 5.625%, 11/15/23 | | | United States | | | | 9,800,000 | | | | 10,508,148 | |
| | dsenior secured note, 144A, 5.00%, 2/15/21 | | | United States | | | | 2,400,000 | | | | 2,500,087 | |
| | Linn Energy LLC/Finance Corp., senior note, | | | | | | | | | | | | |
| | 6.25%, 11/01/19 | | | United States | | | | 2,500,000 | | | | 2,137,500 | |
| | 8.625%, 4/15/20 | | | United States | | | | 20,000,000 | | | | 17,500,000 | |
FRANKLIN TEMPLETON VARIABLE INSURANCE PRODUCTS TRUST
STATEMENT OF INVESTMENTS
Franklin Income VIP Fund (continued)
| | | | | | | | | | | | | | |
| | | | | Country | | | Principal Amount* | | | Value | |
| | Corporate Bonds (continued) | | | | | | | | | | | | |
| | Energy (continued) | | | | | | | | | | | | |
| | Magnum Hunter Resources Corp., senior note, 9.75%, 5/15/20 | | | United States | | | | 5,000,000 | | | $ | 3,975,000 | |
| | Midstates Petroleum Co. Inc./LLC, senior note, | | | | | | | | | | | | |
| | 10.75%, 10/01/20 | | | United States | | | | 5,000,000 | | | | 2,700,000 | |
| | 9.25%, 6/01/21 | | | United States | | | | 7,500,000 | | | | 3,825,000 | |
| d | | NGPL PipeCo LLC, secured note, 144A, 7.119%, 12/15/17 | | | United States | | | | 10,250,000 | | | | 10,121,875 | |
| d | | Niska Gas Storage Canada ULC/Finance Corp., senior note, 144A, 6.50%, 4/01/19 | | | United States | | | | 11,500,000 | | | | 8,711,250 | |
| d | | Ocean Rig UDW Inc., senior note, 144A, 7.25%, 4/01/19 | | | United States | | | | 7,500,000 | | | | 5,301,563 | |
| | Offshore Group Investment Ltd., senior secured note, first lien, 7.50%, 11/01/19 | | | United States | | | | 6,500,000 | | | | 4,883,125 | |
| | Peabody Energy Corp., senior note, 6.25%, 11/15/21 | | | United States | | | | 15,000,000 | | | | 12,881,250 | |
| | Penn Virginia Corp., senior note, 8.50%, 5/01/20 | | | United States | | | | 9,300,000 | | | | 7,486,500 | |
| | Quicksilver Resources Inc., senior note, 9.125%, 8/15/19 | | | United States | | | | 20,000,000 | | | | 5,100,000 | |
| | Regency Energy Partners LP/Regency Energy Finance Corp., senior note, 5.875%, 3/01/22 | | | United States | | | | 3,900,000 | | | | 3,909,750 | |
| | Rex Energy Corp., senior note, 8.875%, 12/01/20 | | | United States | | | | 5,000,000 | | | | 4,500,000 | |
| d | | Rice Energy Inc., senior note, 144A, 6.25%, 5/01/22 | | | United States | | | | 7,831,000 | | | | 7,321,985 | |
| | Sabine Pass Liquefaction LLC, | | | | | | | | | | | | |
| | first lien, 5.625%, 2/01/21 | | | United States | | | | 15,100,000 | | | | 14,911,250 | |
| | senior secured, first lien, 5.75%, 5/15/24 | | | United States | | | | 9,900,000 | | | | 9,763,875 | |
| | Sabine Pass LNG LP, | | | | | | | | | | | | |
| | first lien, 6.50%, 11/01/20 | | | United States | | | | 10,000,000 | | | | 10,150,000 | |
| | senior secured note, 7.50%, 11/30/16 | | | United States | | | | 10,000,000 | | | | 10,450,000 | |
| | Samson Investment Co., senior note, 9.75%, 2/15/20 | | | United States | | | | 12,500,000 | | | | 5,242,188 | |
| | Sanchez Energy Corp., senior note, | | | | | | | | | | | | |
| | 7.75%, 6/15/21 | | | United States | | | | 10,000,000 | | | | 9,350,000 | |
| | d144A, 6.125%, 1/15/23 | | | United States | | | | 13,000,000 | | | | 10,952,500 | |
| | SandRidge Energy Inc., senior note, | | | | | | | | | | | | |
| | 8.75%, 1/15/20 | | | United States | | | | 20,000,000 | | | | 13,800,000 | |
| | 7.50%, 3/15/21 | | | United States | | | | 15,000,000 | | | | 9,675,000 | |
| | 8.125%, 10/15/22 | | | United States | | | | 10,000,000 | | | | 6,350,000 | |
| | 7.50%, 2/15/23 | | | United States | | | | 6,600,000 | | | | 4,257,000 | |
| | Stone Energy Corp., senior bond, 7.50%, 11/15/22 | | | United States | | | | 15,000,000 | | | | 12,975,000 | |
| | Transocean Inc., senior bond, 6.50%, 11/15/20 | | | United States | | | | 5,000,000 | | | | 4,747,460 | |
| | W&T Offshore Inc., senior note, 8.50%, 6/15/19 | | | United States | | | | 40,500,000 | | | | 26,932,500 | |
| | | | | | | | | | | | | | |
| | | | | | | | | | | | | 512,676,603 | |
| | | | | | | | | | | | | | |
| | Financials 3.3% | | | | | | | | | | | | |
| h | | Bank of America Corp., junior sub. bond, M, 8.125% to 5/15/18, FRN thereafter, Perpetual | | | United States | | | | 5,000,000 | | | | 5,418,750 | |
| h | | Citigroup Inc., | | | | | | | | | | | | |
| | junior sub. bond, 5.35% to 5/15/23, FRN thereafter, Perpetual | | | United States | | | | 10,000,000 | | | | 9,275,000 | |
| | junior sub. bond, 5.95% to 1/30/23, FRN thereafter, Perpetual | | | United States | | | | 4,500,000 | | | | 4,438,125 | |
| | junior sub. bond, M, 6.30% to 5/15/24, FRN thereafter, Perpetual | | | United States | | | | 16,800,000 | | | | 16,590,000 | |
| | junior sub. note, 5.90% to 2/15/23, FRN thereafter, Perpetual | | | United States | | | | 12,500,000 | | | | 12,250,000 | |
| | International Lease Finance Corp., senior note, 8.75%, 3/15/17 | | | United States | | | | 15,000,000 | | | | 16,650,000 | |
| d | | Jefferies Finance LLC/JFIN Co-Issuer Corp., senior note, 144A, 7.50%, 4/15/21 | | | United States | | | | 5,000,000 | | | | 4,668,750 | |
| h | | JPMorgan Chase & Co., | | | | | | | | | | | | |
| | junior sub. bond, R, 6.00% to 8/01/23, FRN thereafter, Perpetual | | | United States | | | | 3,200,000 | | | | 3,176,000 | |
| | junior sub. bond, V, 5.00% to 7/30/19, FRN thereafter, Perpetual | | | United States | | | | 10,000,000 | | | | 9,834,370 | |
| | junior sub. note, I, 7.90% to 4/30/19, FRN thereafter, Perpetual | | | United States | | | | 85,000,000 | | | | 91,910,500 | |
FRANKLIN TEMPLETON VARIABLE INSURANCE PRODUCTS TRUST
STATEMENT OF INVESTMENTS
Franklin Income VIP Fund (continued)
| | | | | | | | | | | | | | |
| | | | | Country | | | Principal Amount* | | | Value | |
| | Corporate Bonds (continued) | | | | | | | | | | | | |
| | Financials (continued) | | | | | | | | | | | | |
| | Morgan Stanley, senior note, 5.50%, 1/26/20 | | | United States | | | | 15,000,000 | | | $ | 16,895,760 | |
| | Nationstar Mortgage LLC/Nationstar Capital Corp., senior note, 9.625%, 5/01/19 | | | United States | | | | 4,400,000 | | | | 4,675,000 | |
| | Navient Corp., senior note, 6.125%, 3/25/24 | | | United States | | | | 5,000,000 | | | | 4,925,000 | |
| d | | OneMain Financial Holdings Inc., senior note, 144A, | | | | | | | | | | | | |
| | 6.75%, 12/15/19 | | | United States | | | | 10,000,000 | | | | 10,225,000 | |
| | 7.25%, 12/15/21 | | | United States | | | | 5,000,000 | | | | 5,150,000 | |
| h | | PNC Financial Services Group Inc., junior sub. note, 4.85% to 6/01/23, FRN thereafter, Perpetual | | | United States | | | | 8,000,000 | | | | 7,570,664 | |
| h | | Wells Fargo & Co., junior sub. bond, S, 5.90% to 6/15/24, FRN thereafter, Perpetual | | | United States | | | | 7,900,000 | | | | 7,979,000 | |
| | | | | | | | | | | | | | |
| | | | | | | | | | | | | 231,631,919 | |
| | | | | | | | | | | | | | |
| | Health Care 2.0% | | | | | | | | | | | | |
| | CHS/Community Health Systems Inc., | | | | | | | | | | | | |
| | senior note, 6.875%, 2/01/22 | | | United States | | | | 6,400,000 | | | | 6,812,000 | |
| | senior secured note, 5.125%, 8/01/21 | | | United States | | | | 2,600,000 | | | | 2,710,500 | |
| | DaVita HealthCare Partners Inc., senior bond, 5.125%, 7/15/24 | | | United States | | | | 5,000,000 | | | | 5,109,375 | |
| | HCA Inc., | | | | | | | | | | | | |
| | senior note, 7.50%, 2/15/22 | | | United States | | | | 25,000,000 | | | | 28,625,000 | |
| | senior note, 5.875%, 5/01/23 | | | United States | | | | 7,500,000 | | | | 7,921,875 | |
| | senior secured bond, first lien, 5.25%, 4/15/25 | | | United States | | | | 5,000,000 | | | | 5,231,250 | |
| | senior secured note, 6.50%, 2/15/20 | | | United States | | | | 16,500,000 | | | | 18,529,500 | |
| | senior secured note, first lien, 5.00%, 3/15/24 | | | United States | | | | 10,400,000 | | | | 10,712,000 | |
| d,f | | Jaguar Holding Co. I, senior note, 144A, PIK, 9.375%, 10/15/17 | | | United States | | | | 10,200,000 | | | | 10,449,900 | |
| | Tenet Healthcare Corp., senior note, | | | | | | | | | | | | |
| | 8.00%, 8/01/20 | | | United States | | | | 10,426,000 | | | | 11,025,495 | |
| | 8.125%, 4/01/22 | | | United States | | | | 22,500,000 | | | | 25,200,000 | |
| | d 144A, 5.00%, 3/01/19 | | | United States | | | | 3,400,000 | | | | 3,412,750 | |
| d | | Valeant Pharmaceuticals International Inc., senior note, 144A, 7.50%, 7/15/21 | | | United States | | | | 7,700,000 | | | | 8,344,875 | |
| | | | | | | | | | | | | | |
| | | | | | | | | | | | | 144,084,520 | |
| | | | | | | | | | | | | | |
| | Industrials 1.3% | | | | | | | | | | | | |
| d | | Abengoa Finance SAU, senior note, 144A, 8.875%, 11/01/17 | | | Spain | | | | 12,900,000 | | | | 12,496,875 | |
| d | | Abengoa Greenfield SA, senior note, 144A, 6.50%, 10/01/19 | | | Spain | | | | 5,000,000 | | | | 4,371,875 | |
| d | | Algeco Scotsman Global Finance PLC, | | | | | | | | | | | | |
| | senior note, 144A, 10.75%, 10/15/19 | | | United Kingdom | | | | 5,000,000 | | | | 4,337,500 | |
| | senior secured note, first lien, 144A, 8.50%, 10/15/18 | | | United Kingdom | | | | 9,900,000 | | | | 9,621,563 | |
| d | | Bombardier Inc., senior bond, 144A, 6.125%, 1/15/23 | | | Canada | | | | 7,500,000 | | | | 7,668,750 | |
| d | | CEVA Group PLC, senior note, first lien, 144A, 4.00%, 5/01/18 | | | United Kingdom | | | | 12,691,882 | | | | 11,264,045 | |
| | Hertz Corp., senior note, 6.75%, 4/15/19 | | | United States | | | | 9,500,000 | | | | 9,832,500 | |
| | Navistar International Corp., senior note, 8.25%, 11/01/21 | | | United States | | | | 16,300,000 | | | | 16,137,000 | |
| d | | Stena AB, senior bond, 144A, 7.00%, 2/01/24 | | | Sweden | | | | 5,800,000 | | | | 5,321,500 | |
| | TransDigm Inc., | | | | | | | | | | | | |
| | senior sub. bond, 6.50%, 7/15/24 | | | United States | | | | 2,700,000 | | | | 2,727,000 | |
| | senior sub. note, 6.00%, 7/15/22 | | | United States | | | | 2,700,000 | | | | 2,706,750 | |
| | United Rentals North America Inc., senior sub. note, 8.375%, 9/15/20 | | | United States | | | | 8,800,000 | | | | 9,482,000 | |
| | | | | | | | | | | | | | |
| | | | | | | | | | | | | 95,967,358 | |
| | | | | | | | | | | | | | |
| | Information Technology 4.3% | | | | | | | | | | | | |
| d | | BMC Software Finance Inc., senior note, 144A, 8.125%, 7/15/21 | | | United States | | | | 16,500,000 | | | | 15,592,500 | |
FRANKLIN TEMPLETON VARIABLE INSURANCE PRODUCTS TRUST
STATEMENT OF INVESTMENTS
Franklin Income VIP Fund (continued)
| | | | | | | | | | | | | | |
| | | | | Country | | | Principal Amount* | | | Value | |
| | Corporate Bonds (continued) | | | | | | | | | | | | |
| | Information Technology (continued) | | | | | | | | | | | | |
| d,f | | Boxer Parent Co. Inc., senior note, 144A, PIK, 9.00%, 10/15/19 | | | United States | | | | 10,000,000 | | | $ | 8,550,000 | |
| | CDW LLC/Finance Corp., senior note, 8.50%, 4/01/19 | | | United States | | | | 4,495,000 | | | | 4,759,081 | |
| d,f | | CommScope Holdings Co. Inc., senior note, 144A, PIK, 6.625%, 6/01/20 | | | United States | | | | 11,200,000 | | | | 11,592,000 | |
| | First Data Corp., | | | | | | | | | | | | |
| | senior bond, 12.625%, 1/15/21 | | | United States | | | | 80,000,000 | | | | 95,200,000 | |
| | d senior secured bond, 144A, 8.25%, 1/15/21 | | | United States | | | | 45,000,000 | | | | 48,375,000 | |
| | d,f senior secured note, 144A, PIK, 8.75%, 1/15/22 | | | United States | | | | 33,188,000 | | | | 35,843,040 | |
| | Freescale Semiconductor Inc., senior note, | | | | | | | | | | | | |
| | 8.05%, 2/01/20 | | | United States | | | | 7,454,000 | | | | 7,882,605 | |
| | 10.75%, 8/01/20 | | | United States | | | | 54,846,000 | | | | 60,056,370 | |
| | Infor U.S. Inc., senior note, 9.375%, 4/01/19 | | | United States | | | | 4,100,000 | | | | 4,402,375 | |
| | NCR Corp., senior note, 5.00%, 7/15/22 | | | United States | | | | 5,000,000 | | | | 4,900,000 | |
| | Sterling International Inc., senior note, 11.00%, 10/01/19 | | | United States | | | | 7,500,000 | | | | 8,006,250 | |
| | | | | | | | | | | | | | |
| | | | | | | | | | | | | 305,159,221 | |
| | | | | | | | | | | | | | |
| | Materials 2.5% | | | | | | | | | | | | |
| | AngloGold Ashanti Holdings PLC, senior note, 8.50%, 7/30/20 | | | South Africa | | | | 6,000,000 | | | | 6,386,250 | |
| d | | Ardagh Packaging Finance PLC/Ardagh MP Holdings USA Inc., senior note, 144A, | | | | | | | | | | | | |
| | 6.25%, 1/31/19 | | | Luxembourg | | | | 2,800,000 | | | | 2,744,000 | |
| | 6.75%, 1/31/21 | | | Luxembourg | | | | 3,000,000 | | | | 2,968,125 | |
| d | | Cemex Finance LLC, senior secured note, 144A, | | | | | | | | | | | | |
| | 9.375%, 10/12/22 | | | Mexico | | | | 7,100,000 | | | | 7,952,000 | |
| | 6.00%, 4/01/24 | | | Mexico | | | | 14,700,000 | | | | 14,231,438 | |
| d | | Cemex SAB de CV, senior secured note, 144A, | | | | | | | | | | | | |
| | 9.00%, 1/11/18 | | | Mexico | | | | 5,581,000 | | | | 5,839,121 | |
| | 9.50%, 6/15/18 | | | Mexico | | | | 12,000,000 | | | | 13,200,000 | |
| d | | Consolidated Minerals Ltd., senior secured note, 144A, 8.00%, 5/15/20 | | | Jersey Islands | | | | 5,000,000 | | | | 3,781,250 | |
| | Dynacast International LLC/Finance Inc., 9.25%, 7/15/19 | | | United States | | | | 5,000,000 | | | | 5,387,500 | |
| d | | First Quantum Minerals Ltd., senior note, 144A, | | | | | | | | | | | | |
| | 6.75%, 2/15/20 | | | Canada | | | | 2,300,000 | | | | 2,093,000 | |
| | 7.00%, 2/15/21 | | | Canada | | | | 2,300,000 | | | | 2,081,500 | |
| d | | FMG Resources (August 2006) Pty. Ltd., senior note, 144A, | | | | | | | | | | | | |
| | g 6.875%, 2/01/18 | | | Australia | | | | 5,288,889 | | | | 4,829,417 | |
| | 8.25%, 11/01/19 | | | Australia | | | | 15,000,000 | | | | 13,706,250 | |
| | HudBay Minerals Inc., senior note, 9.50%, 10/01/20 | | | Canada | | | | 10,000,000 | | | | 9,750,000 | |
| d | | Ineos Finance PLC, senior secured note, 144A, 8.375%, 2/15/19 | | | Switzerland | | | | 5,100,000 | | | | 5,431,500 | |
| d | | Ineos Group Holdings SA, senior note, 144A, 5.75%, 2/15/19 | | | Switzerland | | | | 5,700,000 | EUR | | | 6,672,847 | |
| d | | Kerling PLC, senior secured note, 144A, 10.625%, 2/01/17 | | | United Kingdom | | | | 9,400,000 | EUR | | | 11,563,547 | |
| | Reynolds Group Issuer Inc./LLC/SA, | | | | | | | | | | | | |
| | first lien, 5.75%, 10/15/20 | | | United States | | | | 14,200,000 | | | | 14,626,000 | |
| | senior note, 9.00%, 4/15/19 | | | United States | | | | 5,000,000 | | | | 5,200,000 | |
| | senior note, 9.875%, 8/15/19 | | | United States | | | | 16,800,000 | | | | 17,892,000 | |
| | senior note, 8.25%, 2/15/21 | | | United States | | | | 5,200,000 | | | | 5,356,000 | |
| | senior secured note, 6.875%, 2/15/21 | | | United States | | | | 10,000,000 | | | | 10,487,500 | |
| d | | Walter Energy Inc., first lien, 144A, 9.50%, 10/15/19 | | | United States | | | | 10,000,000 | | | | 7,650,000 | |
| | | | | | | | | | | | | | |
| | | | | | | | | | | | | 179,829,245 | |
| | | | | | | | | | | | | | |
| | Telecommunication Services 3.5% | | | | | | | | | | | | |
| | CenturyLink Inc., senior bond, 6.75%, 12/01/23 | | | United States | | | | 1,700,000 | | | | 1,867,875 | |
FRANKLIN TEMPLETON VARIABLE INSURANCE PRODUCTS TRUST
STATEMENT OF INVESTMENTS
Franklin Income VIP Fund (continued)
| | | | | | | | | | | | | | |
| | | | | Country | | | Principal Amount* | | | Value | |
| | Corporate Bonds (continued) | | | | | | | | | | | | |
| | Telecommunication Services (continued) | | | | | | | | | | | | |
| | Frontier Communications Corp., senior note, | | | | | | | | | | | | |
| | 8.50%, 4/15/20 | | | United States | | | | 12,900,000 | | | $ | 14,448,000 | |
| | 9.25%, 7/01/21 | | | United States | | | | 7,400,000 | | | | 8,574,750 | |
| | 7.125%, 1/15/23 | | | United States | | | | 8,800,000 | | | | 8,998,000 | |
| | Intelsat Jackson Holdings SA, senior bond, 5.50%, 8/01/23 | | | Luxembourg | | | | 13,400,000 | | | | 13,358,125 | |
| | Sprint Corp., senior bond, | | | | | | | | | | | | |
| | 7.875%, 9/15/23 | | | United States | | | | 37,500,000 | | | | 37,207,500 | |
| | 7.125%, 6/15/24 | | | United States | | | | 8,200,000 | | | | 7,667,000 | |
| | Sprint Nextel Corp., | | | | | | | | | | | | |
| | 11.50%, 11/15/21 | | | United States | | | | 30,000,000 | | | | 36,225,000 | |
| | senior note, 9.125%, 3/01/17 | | | United States | | | | 13,300,000 | | | | 14,662,585 | |
| | senior note, 7.00%, 8/15/20 | | | United States | | | | 7,500,000 | | | | 7,537,500 | |
| | d senior note, 144A, 9.00%, 11/15/18 | | | United States | | | | 20,000,000 | | | | 22,798,000 | |
| | T-Mobile USA Inc., | | | | | | | | | | | | |
| | senior bond, 6.625%, 4/01/23 | | | United States | | | | 15,000,000 | | | | 15,435,000 | |
| | senior note, 6.542%, 4/28/20 | | | United States | | | | 11,200,000 | | | | 11,606,000 | |
| | senior note, 6.633%, 4/28/21 | | | United States | | | | 5,000,000 | | | | 5,150,000 | |
| | senior note, 6.731%, 4/28/22 | | | United States | | | | 5,000,000 | | | | 5,168,750 | |
| d | | Telecom Italia SpA, senior note, 144A, 5.303%, 5/30/24 | | | Italy | | | | 7,500,000 | | | | 7,617,187 | |
| | Verizon Communications Inc., | | | | | | | | | | | | |
| | senior bond, 6.55%, 9/15/43 | | | United States | | | | 7,300,000 | | | | 9,366,082 | |
| | senior note, 5.15%, 9/15/23 | | | United States | | | | 6,900,000 | | | | 7,624,597 | |
| d | | Wind Acquisition Finance SA, senior note, 144A, 7.375%, 4/23/21 | | | Italy | | | | 15,000,000 | | | | 14,175,000 | |
| | | | | | | | | | | | | | |
| | | | | | | | | | | | | 249,486,951 | |
| | | | | | | | | | | | | | |
| | Utilities 1.6% | | | | | | | | | | | | |
| | Calpine Corp., | | | | | | | | | | | | |
| | senior bond, 5.75%, 1/15/25 | | | United States | | | | 10,000,000 | | | | 10,137,500 | |
| | senior note, 5.375%, 1/15/23 | | | United States | | | | 14,500,000 | | | | 14,663,125 | |
| | d senior secured bond, first lien, 144A, 7.875%, 1/15/23 | | | United States | | | | 3,936,000 | | | | 4,359,120 | |
| d | | Dynegy Finance I Inc./Dynegy Finance II Inc., senior note, 144A, | | | | | | | | | | | | |
| | 6.75%, 11/01/19 | | | United States | | | | 25,000,000 | | | | 25,468,750 | |
| | 7.375%, 11/01/22 | | | United States | | | | 18,300,000 | | | | 18,643,125 | |
| d | | InterGen NV, secured bond, 144A, 7.00%, 6/30/23 | | | Netherlands | | | | 25,000,000 | | | | 23,875,000 | |
| d | | NGL Energy Partners LP/NGL Energy Finance Corp., senior note, 144A, 6.875%, 10/15/21 | | | United States | | | | 10,000,000 | | | | 9,900,000 | |
| d | | NRG Yield Operating LLC, senior bond, 144A, 5.375%, 8/15/24 | | | United States | | | | 6,600,000 | | | | 6,732,000 | |
| | | | | | | | | | | | | | |
| | | | | | | | | | | | | 113,778,620 | |
| | | | | | | | | | | | | | |
| | | | |
| | Total Corporate Bonds (Cost $2,300,715,254) | | | | | | | | | | | 2,285,564,470 | |
| | | | | | | | | | | | | | |
| i,j | | Senior Floating Rate Interests 2.4% | | | | | | | | | | | | |
| | Consumer Discretionary 0.9% | | | | | | | | | | | | |
| | iHeartCommunications Inc., | | | | | | | | | | | | |
| | Tranche D Term Loan, 6.919%, 1/30/19 | | | United States | | | | 50,864,664 | | | | 48,051,237 | |
| | Tranche E Term Loan, 7.669%, 7/30/19 | | | United States | | | | 13,142,769 | | | | 12,633,486 | |
| | SuperMedia Inc., Exit Term Loan, 11.60%, 12/31/16 | | | United States | | | | 753,341 | | | | 605,969 | |
| | | | | | | | | | | | | | |
| | | | | | | | | | | | | 61,290,692 | |
| | | | | | | | | | | | | | |
| | Consumer Staples 0.2% | | | | | | | | | | | | |
| | U.S. Foods Inc., Term Loan, 4.50%, 3/31/19 | | | United States | | | | 14,775,000 | | | | 14,710,359 | |
| | | | | | | | | | | | | | |
FRANKLIN TEMPLETON VARIABLE INSURANCE PRODUCTS TRUST
STATEMENT OF INVESTMENTS
Franklin Income VIP Fund (continued)
| | | | | | | | | | | | | | |
| | | | | Country | | | Principal Amount* | | | Value | |
| i,j | | Senior Floating Rate Interests (continued) | | | | | | | | | | | | |
| | Energy 0.5% | | | | | | | | | | | | |
| | Drillships Financing Holding Inc., Tranche B-1 Term Loan,
6.00%, 3/31/21 | | | Marshall Islands | | | | 14,886,935 | | | $ | 11,872,331 | |
| | Fieldwood Energy LLC, Second Lien Loans, 8.375%, 9/30/20 | | | United States | | | | 10,000,000 | | | | 7,365,000 | |
| | Quicksilver Resources Inc., Second Lien Loans, 7.00%, 6/21/19 | | | United States | | | | 25,000,000 | | | | 19,000,000 | |
| | | | | | | | | | | | | | |
| | | | | | | | | | | | | 38,237,331 | |
| | | | | | | | | | | | | | |
| | Industrials 0.4% | | | | | | | | | | | | |
| | CEVA Group PLC, Pre-Funded L/C, 6.50%, 3/19/21 | | | United States | | | | 5,418,719 | | | | 5,091,905 | |
| | CEVA Intercompany BV, Dutch BV Term Loan, 6.50%, 3/19/21 | | | Netherlands | | | | 5,671,429 | | | | 5,329,373 | |
| | CEVA Logistics Canada ULC, Canadian Term Loan, 6.50%, 3/19/21 | | | Canada | | | | 977,833 | | | | 918,858 | |
| | CEVA Logistics U.S. Holdings Inc., U.S. Term Loan, 6.50%, 3/19/21 | | | United States | | | | 7,822,660 | | | | 7,350,860 | |
| | Navistar Inc., Tranche B Term Loan, 5.75%, 8/17/17 | | | United States | | | | 6,081,022 | | | | 6,065,819 | |
| | | | | | | | | | | | | | |
| | | | | | | | | | | | | 24,756,815 | |
| | | | | | | | | | | | | | |
| | Information Technology 0.4% | | | | | | | | | | | | |
| | First Data Corp., 2018 New Dollar Term Loan, 3.667%, 3/24/18 | | | United States | | | | 22,436,455 | | | | 22,015,771 | |
| | SRA International Inc., Term Loan, 6.50%, 7/20/18 | | | United States | | | | 7,469,520 | | | | 7,478,857 | |
| | | | | | | | | | | | | | |
| | | | | | | | | | | | | 29,494,628 | |
| | | | | | | | | | | | | | |
| | | | |
| | Total Senior Floating Rate Interests (Cost $179,332,889) | | | | | | | | | | | 168,489,825 | |
| | | | | | | | | | | | | | |
| | | | |
| | | | | | | | Shares | | | | |
| | Escrows and Litigation Trusts 0.0%† | | | | | | | | | | | | |
| a | | Motors Liquidation Co., Escrow Account, cvt. pfd., C | | | United States | | | | 1,400,000 | | | | 14,000 | |
| a,k | | SuperMedia Inc., Litigation Trust | | | United States | | | | 3,472,135 | | | | — | |
| | | | | | | | | | | | | | |
| | | | |
| | Total Escrows and Litigation Trusts (Cost $101,664) | | | | | | | | | | | 14,000 | |
| | | | | | | | | | | | | | |
| | | | |
| | Total Investments before Short Term Investments (Cost $5,975,986,151) | | | | | | | | | | | 6,538,114,001 | |
| | | | | | | | | | | | | | |
| | | | |
| | | | | | | | Principal Amount* | | | | |
| | Short Term Investments 5.4% | | | | | | | | | | | | |
| | U.S. Government and Agency Securities 4.3% | | | | | | | | | | | | |
| l | | FHLB, | | | | | | | | | | | | |
| | 1/02/15 | | | United States | | | | 25,000,000 | | | | 25,000,000 | |
| | 1/14/15 | | | United States | | | | 100,000,000 | | | | 99,999,700 | |
| | 1/21/15 | | | United States | | | | 85,000,000 | | | | 84,999,575 | |
| l | | FNMA, 1/05/15 | | | United States | | | | 49,186,000 | | | | 49,185,951 | |
| l | | U.S. Treasury Bill, 1/02/15 | | | United States | | | | 50,000,000 | | | | 50,000,000 | |
| | | | | | | | | | | | | | |
| | | | |
| | Total U.S. Government and Agency Securities (Cost $309,181,683) | | | | | | | | | | | 309,185,226 | |
| | | | | | | | | | | | | | |
| | | | |
| | Total Investments before Money Market Funds and Repurchase Agreements (Cost $6,285,167,834) | | | | | | | | | | | 6,847,299,227 | |
| | | | | | | | | | | | | | |
FRANKLIN TEMPLETON VARIABLE INSURANCE PRODUCTS TRUST
STATEMENT OF INVESTMENTS
Franklin Income VIP Fund (continued)
| | | | | | | | | | | | | | |
| | | | | Country | | | Principal Amount* | | | Value | |
| | Repurchase Agreements (Cost $71,647,836) 1.0% | | | | | | | | | | | | |
| m | | Joint Repurchase Agreement, 0.057%, 1/02/15 (Maturity Value $71,648,063) | | | United States | | | | 71,647,836 | | | $ | 71,647,836 | |
| | | | | | | | | | | | | | |
| | BNP Paribas Securities Corp. (Maturity Value $6,037,782) | | | | | | | | | | | | |
| | HSBC Securities (USA) Inc. (Maturity Value $49,912,190) Merrill Lynch, Pierce, Fenner & Smith Inc. (Maturity Value $15,698,091) | | | | | | | | | | | | |
| | Collateralized by U.S. Government Agency Securities, 0.000% - 1.50%, 1/20/15 - 10/09/19; U.S. Government Agency Securities, Strips, 6/01/17; and U.S. Treasury Notes, 1.625% - 4.50%, 11/15/15 - 11/30/20 (valued at $73,089,829) | | | | | | | | | | | | |
| | | | |
| | | | | | | | Shares | | | | |
| n | | Investments from Cash Collateral Received for Loaned Securities (Cost $5,160,980) 0.1% | | | | | | | | | | | | |
| | Money Market Funds 0.1% | | | | | | | | | | | | |
| o | | BNY Mellon Overnight Government Fund, 0.072% | | | United States | | | | 5,160,980 | | | | 5,160,980 | |
| | | | | | | | | | | | | | |
| | Total Investments (Cost $6,361,976,650) 97.3% | | | | | | | | | | | 6,924,108,043 | |
| | Other Assets, less Liabilities 2.7% | | | | | | | | | | | 191,905,223 | |
| | | | | | | | | | | | | | |
| | Net Assets 100.0% | | | | | | | | | | $ | 7,116,013,266 | |
| | | | | | | | | | | | | | |
See Abbreviations on page FI-32.
*The principal amount is stated in U.S. dollars unless otherwise indicated.
†Rounds to less than 0.1% of net assets.
aNon-income producing.
bSee Note 8 regarding restricted securities.
cAt December 31, 2014, pursuant to the Fund’s policies and the requirements of applicable securities law, the Fund may be restricted from trading these securities for a limited or extended period of time.
dSecurity was purchased pursuant to Rule 144A under the Securities Act of 1933 and may be sold in transactions exempt from registration only to qualified institutional buyers or in a public offering registered under the Securities Act of 1933. These securities have been deemed liquid under guidelines approved by the Trust’s Board of Trustees. At December 31, 2014, the aggregate value of these securities was $971,256,642, representing 13.65% of net assets.
eSee Note 1(d) regarding equity-linked securities.
fIncome may be received in additional securities and/or cash.
gA portion or all of the security is on loan at December 31, 2014. See Note 1(e).
hPerpetual security with no stated maturity date.
iSee Note 1(f) regarding senior floating rate interests.
jThe coupon rate shown represents the rate at period end.
kSecurity has been deemed illiquid because it may not be able to be sold within seven days.
lThe security is traded on a discount basis with no stated coupon rate.
mSee Note 1(c) regarding joint repurchase agreement.
nSee Note 1(e) regarding securities on loan.
oThe rate shown is the annualized seven-day yield at period end.
| | | | |
| FI-20 | | Annual Report | The accompanying notes are an integral part of these financial statements. | | |
FRANKLIN TEMPLETON VARIABLE INSURANCE PRODUCTS TRUST
Financial Statements
Statement of Assets and Liabilities
December 31, 2014
| | | | |
| | | Franklin Income
VIP Fund | |
Assets: | | | | |
Investments in securities: | | | | |
Cost - Unaffiliated issuers | | $ | 6,290,328,814 | |
Cost - Repurchase agreements | | | 71,647,836 | |
| | | | |
Total cost of investments | | $ | 6,361,976,650 | |
| | | | |
Value - Unaffiliated issuers | | $ | 6,852,460,207 | |
Value - Repurchase agreements | | | 71,647,836 | |
| | | | |
Total value of investments (includes securities loaned in the amount of $4,938,811) | | | 6,924,108,043 | |
Cash | | | 92,022,072 | |
Receivables: | | | | |
Investment securities sold | | | 45,270,528 | |
Capital shares sold | | | 6,948,498 | |
Dividends and interest | | | 62,018,505 | |
Other assets | | | 631 | |
| | | | |
Total assets | | | 7,130,368,277 | |
| | | | |
Liabilities: | | | | |
Payables: | | | | |
Investment securities purchased | | | 255,575 | |
Capital shares redeemed | | | 2,544,886 | |
Management fees | | | 2,755,852 | |
Distribution fees | | | 2,791,938 | |
Payable upon return of securities loaned | | | 5,160,980 | |
Accrued expenses and other liabilities | | | 845,780 | |
| | | | |
Total liabilities | | | 14,355,011 | |
| | | | |
Net assets, at value | | $ | 7,116,013,266 | |
| | | | |
Net assets consist of: | | | | |
Paid-in capital | | $ | 6,997,238,896 | |
Undistributed net investment income | | | 285,827,668 | |
Net unrealized appreciation (depreciation) | | | 561,891,661 | |
Accumulated net realized gain (loss) | | | (728,944,959 | ) |
| | | | |
Net assets, at value | | $ | 7,116,013,266 | |
| | | | |
| |
| Class 1: | | | | |
Net assets, at value | | $ | 714,663,840 | |
| | | | |
Shares outstanding | | | 43,363,008 | |
| | | | |
Net asset value and maximum offering price per share | | $ | 16.48 | |
| | | | |
| |
| Class 2: | | | | |
Net assets, at value | | $ | 6,022,804,327 | |
| | | | |
Shares outstanding | | | 376,432,254 | |
| | | | |
Net asset value and maximum offering price per share | | $ | 16.00 | |
| | | | |
| |
| Class 4: | | | | |
Net assets, at value | | $ | 378,545,099 | |
| | | | |
Shares outstanding | | | 23,213,333 | |
| | | | |
Net asset value and maximum offering price per share | | $ | 16.31 | |
| | | | |
| | | | | | |
| | | The accompanying notes are an integral part of these financial statements. | Annual Report | | | FI-21 | |
FRANKLIN TEMPLETON VARIABLE INSURANCE PRODUCTS TRUST
FINANCIAL STATEMENTS
Statement of Operations
for the year ended December 31, 2014
| | | | |
| | | Franklin Income
VIP Fund | |
Investment income: | | | | |
Dividends | | $ | 153,911,805 | |
Interest | | | 197,524,636 | |
Income from securities loaned | | | 787,813 | |
| | | | |
Total investment income | | | 352,224,254 | |
| | | | |
Expenses: | | | | |
Management fees (Note 3a) | | | 33,738,136 | |
Distribution fees: (Note 3c) | | | | |
Class 2 | | | 15,789,181 | |
Class 4 | | | 1,392,360 | |
Custodian fees (Note 4) | | | 105,982 | |
Reports to shareholders | | | 832,683 | |
Professional fees | | | 159,687 | |
Trustees’ fees and expenses | | | 29,192 | |
Other | | | 129,449 | |
| | | | |
Total expenses | | | 52,176,670 | |
Expense reductions (Note 4) | | | (1,565 | ) |
| | | | |
Net expenses | | | 52,175,105 | |
| | | | |
Net investment income | | | 300,049,149 | |
| | | | |
Realized and unrealized gains (losses): | | | | |
Net realized gain (loss) from: | | | | |
Investments | | | 328,621,693 | |
Foreign currency transactions | | | (745,927 | ) |
| | | | |
Net realized gain (loss) | | | 327,875,766 | |
| | | | |
Net change in unrealized appreciation (depreciation) on: | | | | |
Investments | | | (288,316,303 | ) |
Translation of other assets and liabilities denominated in foreign currencies | | | (353,707 | ) |
| | | | |
Net change in unrealized appreciation (depreciation) | | | (288,670,010 | ) |
| | | | |
Net realized and unrealized gain (loss) | | | 39,205,756 | |
| | | | |
Net increase (decrease) in net assets resulting from operations | | $ | 339,254,905 | |
| | | | |
| | | | |
| FI-22 | | Annual Report | The accompanying notes are an integral part of these financial statements. | | |
FRANKLIN TEMPLETON VARIABLE INSURANCE PRODUCTS TRUST
FINANCIAL STATEMENTS
Statements of Changes in Net Assets
| | | | | | | | |
| | | Franklin Income VIP Fund | |
| | | Year Ended December 31, | |
| | | 2014 | | | 2013 | |
Increase (decrease) in net assets: | | | | | | | | |
Operations: | | | | | | | | |
Net investment income | | $ | 300,049,149 | | | $ | 352,220,004 | |
Net realized gain (loss) from investments and foreign currency transactions | | | 327,875,766 | | | | 58,814,586 | |
Net change in unrealized appreciation (depreciation) on investments and translation of other assets and liabilities denominated in foreign currencies | | | (288,670,010 | ) | | | 532,304,482 | |
| | | | |
Net increase (decrease) in net assets resulting from operations | | | 339,254,905 | | | | 943,339,072 | |
| | | | |
Distributions to shareholders from: | | | | | | | | |
Net investment income: | | | | | | | | |
Class 1 | | | (37,211,436 | ) | | | (40,171,484 | ) |
Class 2 | | | (314,580,044 | ) | | | (401,855,498 | ) |
Class 4 | | | (19,237,312 | ) | | | (27,978,841 | ) |
| | | | |
Total distributions to shareholders | | | (371,028,792 | ) | | | (470,005,823 | ) |
| | | | |
Capital share transactions: (Note 2) | | | | | | | | |
Class 1 | | | 23,158,016 | | | | 66,533,168 | |
Class 2 | | | (137,432,835 | ) | | | (397,831,491 | ) |
Class 4 | | | (18,639,257 | ) | | | (65,127,276 | ) |
| | | | |
Total capital share transactions | | | (132,914,076 | ) | | | (396,425,599 | ) |
| | | | |
Net increase (decrease) in net assets | | | (164,687,963 | ) | | | 76,907,650 | |
Net assets: | | | | | | | | |
Beginning of year | | | 7,280,701,229 | | | | 7,203,793,579 | |
| | | | |
End of year | | $ | 7,116,013,266 | | | $ | 7,280,701,229 | |
| | | | |
Undistributed net investment income included in net assets: | | | | | | | | |
End of year | | $ | 285,827,668 | | | $ | 344,943,832 | |
| | | | |
| | | | | | |
| | | The accompanying notes are an integral part of these financial statements. | Annual Report | | | FI-23 | |
FRANKLIN TEMPLETON VARIABLE INSURANCE PRODUCTS TRUST
Notes to Financial Statements
Franklin Income VIP Fund
1. Organization and Significant Accounting Policies
Franklin Templeton Variable Insurance Products Trust (Trust) is registered under the Investment Company Act of 1940, as amended, (1940 Act) as an open-end management investment company, consisting of nineteen separate funds and applies the specialized accounting and reporting guidance in U.S. Generally Accepted Accounting Principles (U.S. GAAP). Franklin Income VIP Fund (Fund) is included in this report. The financial statements of the remaining funds in the Trust are presented separately. Shares of the Fund are generally sold only to insurance company separate accounts to fund the benefits of variable life insurance policies or variable annuity contracts. The Fund offers three classes of shares: Class 1, Class 2, and Class 4. Each class of shares differs by its distribution fees, voting rights on matters affecting a single class and its exchange privilege.
Effective May 1, 2014, Franklin Income Securities Fund was renamed Franklin Income VIP Fund.
The following summarizes the Fund’s significant accounting policies.
a. Financial Instrument Valuation
The Fund’s investments in financial instruments are carried at fair value daily. Fair value is the price that would be received to sell an asset or paid to transfer a liability in an orderly transaction between market participants on the measurement date. The Fund calculates the net asset value (NAV) per share at the close of the New York Stock Exchange (NYSE), generally at 4 p.m. Eastern time (NYSE close) on each day the NYSE is open for trading. Under compliance policies and procedures approved by the Trust’s Board of Trustees (the Board), the Fund’s administrator has responsibility for oversight of valuation, including leading the cross-functional Valuation and Liquidity Oversight Committee (VLOC). The VLOC provides administration and oversight of the Fund’s valuation policies and procedures, which are approved annually by the Board. Among other things, these procedures allow the Fund to utilize independent pricing services, quotations from securities and financial instrument dealers, and other market sources to determine fair value.
Equity securities listed on an exchange or on the NASDAQ National Market System are valued at the last quoted sale price or the official closing price of the day, respectively. Foreign equity securities are valued as of the close of trading on the foreign stock exchange on which the security is primarily traded
or as of the NYSE close, whichever is earlier. The value is then converted into its U.S. dollar equivalent at the foreign exchange rate in effect at the NYSE close on the day that the value of the security is determined. Over-the-counter (OTC) securities are valued within the range of the most recent quoted bid and ask prices. Securities that trade in multiple markets or on multiple exchanges are valued according to the broadest and most representative market. Certain equity securities are valued based upon fundamental characteristics or relationships to similar securities. Investments in non-registered money market funds are valued at the closing NAV.
Debt securities generally trade in the OTC market rather than on a securities exchange. The Fund’s pricing services use multiple valuation techniques to determine fair value. In instances where sufficient market activity exists, the pricing services may utilize a market-based approach through which quotes from market makers are used to determine fair value. In instances where sufficient market activity may not exist or is limited, the pricing services also utilize proprietary valuation models which may consider market characteristics such as benchmark yield curves, credit spreads, estimated default rates, anticipated market interest rate volatility, coupon rates, anticipated timing of principal repayments, underlying collateral, and other unique security features in order to estimate the relevant cash flows, which are then discounted to calculate the fair value. Securities denominated in a foreign currency are converted into their U.S. dollar equivalent at the foreign exchange rate in effect at the NYSE close on the date that the values of the foreign debt securities are determined. Repurchase agreements are valued at cost, which approximates fair value.
The Fund has procedures to determine the fair value of financial instruments for which market prices are not reliable or readily available. Under these procedures, the VLOC convenes on a regular basis to review such financial instruments and considers a number of factors, including significant unobservable valuation inputs, when arriving at fair value. The VLOC primarily employs a market-based approach which may use related or comparable assets or liabilities, recent transactions, market multiples, book values, and other relevant information for the investment to determine the fair value of the investment. An income-based valuation approach may also be used in which the anticipated future cash flows of the investment are discounted to calculate fair value. Discounts may also be applied due to the nature or duration of any restrictions on the disposition of the investments. Due to the inherent uncertainty of valuations of
FRANKLIN TEMPLETON VARIABLE INSURANCE PRODUCTS TRUST
NOTES TO FINANCIAL STATEMENTS
Franklin Income VIP Fund (continued)
such investments, the fair values may differ significantly from the values that would have been used had an active market existed. The VLOC employs various methods for calibrating these valuation approaches including a regular review of key inputs and assumptions, transactional back-testing or disposition analysis, and reviews of any related market activity.
Trading in securities on foreign securities stock exchanges and OTC markets may be completed before the daily NYSE close. In addition, trading in certain foreign markets may not take place on every NYSE business day. Occasionally, events occur between the time at which trading in a foreign security is completed and the close of the NYSE that might call into question the reliability of the value of a portfolio security held by the Fund. As a result, differences may arise between the value of the Fund’s portfolio securities as determined at the foreign market close and the latest indications of value at the close of the NYSE. In order to minimize the potential for these differences, the VLOC monitors price movements following the close of trading in foreign stock markets through a series of country specific market proxies (such as baskets of American Depositary Receipts, futures contracts and exchange traded funds). These price movements are measured against established trigger thresholds for each specific market proxy to assist in determining if an event has occurred that may call into question the reliability of the values of the foreign securities held by the Fund. If such an event occurs, the securities may be valued using fair value procedures, which may include the use of independent pricing services.
Also, when the last day of the reporting period is a non-business day, certain foreign markets may be open on those days that the NYSE is closed, which could result in differences between the value of the Fund’s portfolio securities on the last business day and the last calendar day of the reporting period. Any significant security valuation changes due to an open foreign market are adjusted and reflected by the Fund for financial reporting purposes.
b. Foreign Currency Translation
Portfolio securities and other assets and liabilities denominated in foreign currencies are translated into U.S. dollars based on the exchange rate of such currencies against U.S. dollars on the date of valuation. The Fund may enter into foreign currency exchange contracts to facilitate transactions denominated in a foreign currency. Purchases and sales of securities, income and expense items denominated in foreign currencies are translated
into U.S. dollars at the exchange rate in effect on the transaction date. Portfolio securities and assets and liabilities denominated in foreign currencies contain risks that those currencies will decline in value relative to the U.S. dollar. Occasionally, events may impact the availability or reliability of foreign exchange rates used to convert the U.S. dollar equivalent value. If such an event occurs, the foreign exchange rate will be valued at fair value using procedures established and approved by the Board.
The Fund does not separately report the effect of changes in foreign exchange rates from changes in market prices on securities held. Such changes are included in net realized and unrealized gain or loss from investments on the Statement of Operations.
Realized foreign exchange gains or losses arise from sales of foreign currencies, currency gains or losses realized between the trade and settlement dates on securities transactions and the difference between the recorded amounts of dividends, interest, and foreign withholding taxes and the U.S. dollar equivalent of the amounts actually received or paid. Net unrealized foreign exchange gains and losses arise from changes in foreign exchange rates on foreign denominated assets and liabilities other than investments in securities held at the end of the reporting period.
c. Joint Repurchase Agreement
The Fund enters into a joint repurchase agreement whereby its uninvested cash balance is deposited into a joint cash account with other funds managed by the investment manager or an affiliate of the investment manager and is used to invest in one or more repurchase agreements. The value and face amount of the joint repurchase agreement are allocated to the funds based on their pro-rata interest. A repurchase agreement is accounted for as a loan by the Fund to the seller, collateralized by securities which are delivered to the Fund’s custodian. The fair value, including accrued interest, of the initial collateralization is required to be at least 102% of the dollar amount invested by the funds, with the value of the underlying securities marked to market daily to maintain coverage of at least 100%. Repurchase agreements are subject to the terms of Master Repurchase Agreements (MRAs) with approved counterparties (sellers). The MRAs contain various provisions, including but not limited to events of default and maintenance of collateral for repurchase agreements. In the event of default by either the seller or the Fund, certain MRAs may permit the non-defaulting party to net and close-out all transactions, if any, traded under such
FRANKLIN TEMPLETON VARIABLE INSURANCE PRODUCTS TRUST
NOTES TO FINANCIAL STATEMENTS
Franklin Income VIP Fund (continued)
1. Organization and Significant Accounting
Policies (continued)
c. Joint Repurchase Agreement (continued)
agreements. The Fund may sell securities it holds as collateral and apply the proceeds towards the repurchase price and any other amounts owed by the seller to the Fund in the event of default by the seller. This could involve costs or delays in addition to a loss on the securities if their value falls below the repurchase price owed by the seller. The joint repurchase agreement held by the Fund at year end, as indicated in the Statement of Investments, had been entered into on December 31, 2014.
d. Equity-Linked Securities
The Fund invests in equity-linked securities. Equity-linked securities are hybrid financial instruments that generally combine both debt and equity characteristics into a single note form. Income received from equity-linked securities is recorded as realized gains in the Statement of Operations and may be based on the performance of an underlying equity security, an equity index, or an option position. The risks of investing in equity-linked securities include unfavorable price movements in the underlying security and the credit risk of the issuing financial institution. There may be no guarantee of a return of principal with equity-linked securities and the appreciation potential may be limited. Equity-linked securities may be more volatile and less liquid than other investments held by the Fund.
e. Securities Lending
The Fund participates in an agency based securities lending program. The Fund receives cash collateral against the loaned securities in an amount equal to at least 102% of the fair value of the loaned securities. Collateral is maintained over the life of the loan in an amount not less than 100% of the fair value of loaned securities, as determined at the close of fund business each day; any additional collateral required due to changes in security values is delivered to the Fund on the next business day. The collateral is invested in a non-registered money fund as indicated on the Statement of Investments. The Fund receives income from the investment of cash collateral, in addition to lending fees and rebates paid by the borrower. The Fund bears the market risk with respect to the collateral investment, securities loaned, and the risk that the agent may default on its obligations to the Fund. The securities lending agent has agreed to indemnify the Fund in the event of default by a third party borrower.
f. Senior Floating Rate Interests
The Fund invests in senior secured corporate loans that pay interest at rates which are periodically reset by reference to a base lending rate plus a spread. These base lending rates are generally the prime rate offered by a designated U.S. bank or the London InterBank Offered Rate (LIBOR). Senior secured corporate loans often require prepayment of principal from excess cash flows or at the discretion of the borrower. As a result, actual maturity may be substantially less than the stated maturity. Senior secured corporate loans in which the Fund invests are generally readily marketable, but may be subject to certain restrictions on resale.
g. Income and Deferred Taxes
It is the Fund’s policy to qualify as a regulated investment company under the Internal Revenue Code. The Fund intends to distribute to shareholders substantially all of its taxable income and net realized gains to relieve it from federal income and if applicable, excise taxes. As a result, no provision for U.S. federal income taxes is required.
The Fund may be subject to foreign taxation related to income received, capital gains on the sale of securities and certain foreign currency transactions in the foreign jurisdictions in which it invests. Foreign taxes, if any, are recorded based on the tax regulations and rates that exist in the foreign markets in which the Fund invests. When a capital gain tax is determined to apply the Fund records an estimated deferred tax liability in an amount that would be payable if the securities were disposed of on the valuation date. As a result of several court cases, in certain countries across the European Union, the Fund has filed additional tax reclaims for previously withheld taxes on dividends earned in those countries. These additional filings are subject to various administrative proceedings by the local jurisdictions’ tax authorities within the European Union, as well as a number of related judicial proceedings. At this time, uncertainty exists as to the ultimate resolution of these proceedings, the likelihood of receipt of these reclaims, and the potential timing of payment, and accordingly, no amounts are reflected in the financial statements.
The Fund recognizes the tax benefits of uncertain tax positions only when the position is “more likely than not” to be sustained upon examination by the tax authorities based on the technical merits of the tax position. As of December 31, 2014, and for all open tax years, the Fund has determined that no liability for unrecognized tax benefits is required in the Fund’s financial
FRANKLIN TEMPLETON VARIABLE INSURANCE PRODUCTS TRUST
NOTES TO FINANCIAL STATEMENTS
Franklin Income VIP Fund (continued)
statements related to uncertain tax positions taken on a tax return (or expected to be taken on future tax returns). Open tax years are those that remain subject to examination and are based on each tax jurisdiction statute of limitation.
h. Security Transactions, Investment Income, Expenses and Distributions
Security transactions are accounted for on trade date. Realized gains and losses on security transactions are determined on a specific identification basis. Interest income and estimated expenses are accrued daily. Amortization of premium and accretion of discount on debt securities are included in interest income. Facility fees are recognized as income over the expected term of the loan. Dividend income is recorded on the ex-dividend date except for certain foreign securities where the dividend rate is not available. In such cases, the dividend is recorded as soon as the information is received by the Fund. Distributions to shareholders are recorded on the ex-dividend date and are determined according to income tax regulations (tax basis). Distributable earnings determined on a tax basis may differ from earnings recorded in accordance with U.S. GAAP. These differences may be permanent or temporary. Permanent differences are reclassified among capital accounts to reflect their tax character. These reclassifications have no impact on net assets or the results of operations. Temporary differences are not reclassified, as they may reverse in subsequent periods.
Common expenses incurred by the Trust are allocated among the funds based on the ratio of net assets of each fund to the
combined net assets of the Trust. Fund specific expenses are charged directly to the fund that incurred the expense.
Realized and unrealized gains and losses and net investment income, not including class specific expenses, are allocated daily to each class of shares based upon the relative proportion of net assets of each class. Differences in per share distributions, by class, are generally due to differences in class specific expenses.
i. Accounting Estimates
The preparation of financial statements in accordance with U.S. GAAP requires management to make estimates and assumptions that affect the reported amounts of assets and liabilities at the date of the financial statements and the amounts of income and expenses during the reporting period. Actual results could differ from those estimates.
j. Guarantees and Indemnifications
Under the Trust’s organizational documents, its officers and trustees are indemnified by the Trust against certain liabilities arising out of the performance of their duties to the Trust. Additionally, in the normal course of business, the Trust, on behalf of the Fund, enters into contracts with service providers that contain general indemnification clauses. The Trust’s maximum exposure under these arrangements is unknown as this would involve future claims that may be made against the Trust that have not yet occurred. Currently, the Trust expects the risk of loss to be remote.
2. Shares of Beneficial Interest
At December 31, 2014, there were an unlimited number of shares authorized (without par value). Transactions in the Fund’s shares were as follows:
| | | | | | | | | | | | | | | | | | |
| | | Year Ended December 31, | |
| | | 2014 | | | | | 2013 | |
| | | Shares | | | Amount | | | | | Shares | | | Amount | |
| | | | | |
| Class 1 Shares: | | | | | | | | | | | | | | | | | | |
Shares sold | | | 2,465,196 | | | $ | 42,146,383 | | | | | | 4,144,696 | | | $ | 65,962,113 | |
Shares issued in reinvestment of distributions | | | 2,182,489 | | | | 37,211,436 | | | | | | 2,620,449 | | | | 40,171,484 | |
Shares redeemed | | | (3,341,982 | ) | | | (56,199,803 | ) | | | | | (2,480,546 | ) | | | (39,600,429 | ) |
| | | | |
Net increase (decrease) | | | 1,305,703 | | | $ | 23,158,016 | | | | | | 4,284,599 | | | $ | 66,533,168 | |
| | | | |
FRANKLIN TEMPLETON VARIABLE INSURANCE PRODUCTS TRUST
NOTES TO FINANCIAL STATEMENTS
Franklin Income VIP Fund (continued)
2. Shares of Beneficial Interest (continued)
| | | | | | | | | | | | | | | | | | |
| | | Year Ended December 31, | |
| | | 2014 | | | | | 2013 | |
| | | Shares | | | Amount | | | | | Shares | | | Amount | |
| | | | | |
| Class 2 Shares: | | | | | | | | | | | | | | | | | | |
Shares sold | | | 37,540,981 | | | $ | 619,277,066 | | | | | | 35,402,352 | | | $ | 551,266,014 | |
Shares issued in reinvestment of distributions | | | 18,973,465 | | | | 314,580,044 | | | | | | 26,915,974 | | | | 401,855,498 | |
Shares redeemed | | | (65,224,564 | ) | | | (1,071,289,945 | ) | | | | | (87,475,715 | ) | | | (1,350,953,003 | ) |
| | | | |
Net increase (decrease) | | | (8,710,118 | ) | | $ | (137,432,835 | ) | | | | | (25,157,389 | ) | | $ | (397,831,491 | ) |
| | | | |
| Class 4 Shares: | | | | | | | | | | | | | | | | | | |
Shares sold | | | 3,949,673 | | | $ | 66,366,931 | | | | | | 3,337,474 | | | $ | 52,791,548 | |
Shares issued on reinvestment of distributions | | | 1,137,629 | | | | 19,237,312 | | | | | | 1,839,503 | | | | 27,978,841 | |
Shares redeemed | | | (6,186,364 | ) | | | (104,243,500 | ) | | | | | (9,346,237 | ) | | | (145,897,665 | ) |
| | | | |
Net increase (decrease) | | | (1,099,062 | ) | | $ | (18,639,257 | ) | | | | | (4,169,260 | ) | | $ | (65,127,276 | ) |
| | | | |
3. Transactions With Affiliates
Franklin Resources, Inc. is the holding company for various subsidiaries that together are referred to as Franklin Templeton Invest-ments. Certain officers and trustees of the Fund are also officers and/or directors of the following subsidiaries:
| | |
| Subsidiary | | Affiliation |
Franklin Advisers, Inc. (Advisers) | | Investment manager |
Templeton Investment Counsel, LLC (TIC) | | Investment manager |
Franklin Templeton Services, LLC (FT Services) | | Administrative manager |
Franklin Templeton Distributors, Inc. (Distributors) | | Principal underwriter |
Franklin Templeton Investor Services, LLC (Investor Services) | | Transfer agent |
a. Management Fees
The Fund pays an investment management fee to Advisers based on the average daily net assets of the Fund as follows:
| | |
| Annualized Fee Rate | | Net Assets |
0.625% | | Up to and including $100 million |
0.500% | | Over $100 million, up to and including $250 million |
0.450% | | Over $250 million, up to and including $7.5 billion |
0.440% | | Over $7.5 billion, up to and including $10 billion |
0.430% | | Over $10 billion, up to and including $12.5 billion |
0.420% | | Over $12.5 billion, up to and including $15 billion |
0.400% | | In excess of $15 billion |
Under a subadvisory agreement, TIC, an affiliate of Advisers, provides subadvisory services to the Fund. The subadvisory fee is paid by Advisers based on the Fund’s average daily net assets, and is not an additional expense of the Fund. Effective February 1, 2014, the subadvisory agreement was terminated.
b. Administrative Fees
Under an agreement with Advisers, FT Services provides administrative services to the Fund. The fee is paid by Advisers based on the Fund’s average daily net assets, and is not an additional expense of the Fund.
FRANKLIN TEMPLETON VARIABLE INSURANCE PRODUCTS TRUST
NOTES TO FINANCIAL STATEMENTS
Franklin Income VIP Fund (continued)
c. Distribution Fees
The Board has adopted distribution plans for Class 2 and Class 4 shares pursuant to Rule 12b-1 under the 1940 Act. Under the Fund’s compensation distribution plans, the Fund pays Distributors for costs incurred in connection with the servicing, sale and distribution of the Fund’s shares up to 0.35% per year of its average daily net assets of each class. Some distribution fees are not charged on shares held by affiliates. The Board has agreed to limit the current rate to 0.25% per year for Class 2. The plan year, for purposes of monitoring compliance with the maximum annual plan rates, is February 1 through January 31.
d. Transfer Agent Fees
Investor Services, under terms of an agreement, performs shareholder servicing for the Fund and is not paid by the Fund for the services.
4. Expense Offset Arrangement
The Fund has entered into an arrangement with its custodian whereby credits realized as a result of uninvested cash balances are used to reduce a portion of the Fund’s custodian expenses. During the year ended December 31, 2014, the custodian fees were reduced as noted in the Statement of Operations.
5. Income Taxes
For tax purposes, capital losses may be carried over to offset future capital gains. Capital loss carryforwards with no expiration, if any, must be fully utilized before those losses with expiration dates.
At December 31, 2014, capital loss carryforwards were as follows:
| | | | |
Capital loss carryforwards subject to expiration: | | | | |
2016 | | $ | 50,251,090 | |
2017 | | | 521,405,875 | |
2018 | | | 157,561,044 | |
| | | | |
Total capital loss carryforwards | | $ | 729,218,009 | |
| | | | |
During the year ended December 31, 2014, the Fund utilized $314,699,036 of capital loss carryforwards.
The tax character of distributions paid during the years ended December 31, 2014 and 2013, was as follows:
| | | | | | | | |
| | | 2014 | | | 2013 | |
Distributions paid from ordinary income | | $ | 371,028,792 | | | $ | 470,005,823 | |
| | | | |
At December 31, 2014, the cost of investments, net unrealized appreciation (depreciation) and undistributed ordinary income for income tax purposes were as follows:
| | | | |
Cost of investments | | $ | 6,369,540,133 | |
| | | | |
Unrealized appreciation | | $ | 1,072,574,189 | |
Unrealized depreciation | | | (518,006,279 | ) |
| | | | |
Net unrealized appreciation (depreciation) | | $ | 554,567,910 | |
| | | | |
Distributable earnings - undistributed ordinary income | | $ | 293,094,579 | |
| | | | |
Differences between income and/or capital gains as determined on a book basis and a tax basis are primarily due to differing treatments of bond discounts and premiums and equity-linked securities.
FRANKLIN TEMPLETON VARIABLE INSURANCE PRODUCTS TRUST
NOTES TO FINANCIAL STATEMENTS
Franklin Income VIP Fund (continued)
6. Investment Transactions
Purchases and sales of investments (excluding short term securities) for the year ended December 31, 2014, aggregated $1,735,401,572 and $2,203,659,865, respectively.
7. Credit Risk
At December 31, 2014, the Fund had 32.50% of its portfolio invested in high yield, senior secured floating rate notes, or other securities rated below investment grade. These securities may be more sensitive to economic conditions causing greater price volatility and are potentially subject to a greater risk of loss due to default than higher rated securities.
8. Restricted Securities
The Fund invests in securities that are restricted under the Securities Act of 1933 (1933 Act) or which are subject to legal, contractual, or other agreed upon restrictions on resale. Restricted securities are often purchased in private placement transactions, and cannot be sold without prior registration unless the sale is pursuant to an exemption under the 1933 Act. Disposal of these securities may require greater effort and expense, and prompt sale at an acceptable price may be difficult. The Fund may have registration rights for restricted securities. The issuer generally incurs all registration costs.
At December 31, 2014, the Fund held investments in restricted securities, excluding certain securities exempt from registration under the 1933 Act deemed to be liquid, as follows:
| | | | | | | | | | | | | | |
| Shares | | Issuer | | Acquisition
Date | | | Cost | | | Value | |
| 4,929,600 | | First Data Holdings Inc., B (Value is 0.29% of Net Assets) | | | 6/26/14 | | | $ | 19,718,400 | | | $ | 20,984,469 | |
| | | | | | | | | | |
9. Credit Facility
The Fund, together with other U.S. registered and foreign investment funds (collectively, Borrowers), managed by Franklin Templeton Investments, are borrowers in a joint syndicated senior unsecured credit facility totaling $1.5 billion (Global Credit Facility) which matured on February 13, 2015. This Global Credit Facility provides a source of funds to the Borrowers for temporary and emergency purposes, including the ability to meet future unanticipated or unusually large redemption requests. The Borrowers expect to renew the Global Credit Facility for a total of $2 billion effective February 13, 2015, which matures on February 12, 2016.
Under the terms of the Global Credit Facility, the Fund shall, in addition to interest charged on any borrowings made by the Fund and other costs incurred by the Fund, pay its share of fees and expenses incurred in connection with the implementation and maintenance of the Global Credit Facility, based upon its relative share of the aggregate net assets of all of the Borrowers, including an annual commitment fee of 0.07% based upon the unused portion of the Global Credit Facility. These fees are reflected in other expenses on the Statement of Operations. During the year ended December 31, 2014, the Fund did not use the Global Credit Facility.
10. Fair Value Measurements
The Fund follows a fair value hierarchy that distinguishes between market data obtained from independent sources (observable inputs) and the Fund’s own market assumptions (unobservable inputs). These inputs are used in determining the value of the Fund’s financial instruments and are summarized in the following fair value hierarchy:
| | • | | Level 1 – quoted prices in active markets for identical financial instruments |
| | • | | Level 2 – other significant observable inputs (including quoted prices for similar financial instruments, interest rates, prepayment speed, credit risk, etc.) |
| | • | | Level 3 – significant unobservable inputs (including the Fund’s own assumptions in determining the fair value of financial instruments) |
FRANKLIN TEMPLETON VARIABLE INSURANCE PRODUCTS TRUST
NOTES TO FINANCIAL STATEMENTS
Franklin Income VIP Fund (continued)
The input levels are not necessarily an indication of the risk or liquidity associated with financial instruments at that level.
For movements between the levels within the fair value hierarchy, the Fund has adopted a policy of recognizing the transfers as of the date of the underlying event which caused the movement.
A summary of inputs used as of December 31, 2014, in valuing the Fund’s assets carried at fair value, is as follows:
| | | | | | | | | | | | | | | | |
| | | Level 1 | | | Level 2 | | | Level 3 | | | Total | |
| | | | |
| Assets: | | | | | | | | | | | | | | | | |
Investments in Securities: | | | | | | | | | | | | | | | | |
Equity Investments:a | | | | | | | | | | | | | | | | |
Energy | | $ | 550,370,946 | | | $ | 13,627,360 | | | $ | 3,258,750 | | | $ | 567,257,056 | |
Financials | | | 371,856,395 | | | | 5,818,750 | | | | — | | | | 377,675,145 | |
Industrials | | | 310,094,785 | | | | — | | | | 21,882,450 | | | | 331,977,235 | |
Information Technology | | | 221,327,193 | | | | — | | | | 20,984,469 | | | | 242,311,662 | |
All Other Equity Investmentsb | | | 2,312,170,239 | | | | — | | | | — | | | | 2,312,170,239 | |
Equity-Linked Securities | | | — | | | | 190,844,958 | | | | — | | | | 190,844,958 | |
Convertible Bonds | | | — | | | | 61,809,411 | | | | — | | | | 61,809,411 | |
Corporate Bonds | | | — | | | | 2,285,564,470 | | | | — | | | | 2,285,564,470 | |
Senior Floating Rate Interests | | | — | | | | 168,489,825 | | | | — | | | | 168,489,825 | |
Escrows and Litigation Trusts | | | — | | | | — | | | | 14,000 | c | | | 14,000 | |
Short Term Investments | | | 50,000,000 | | | | 335,994,042 | | | | — | | | | 385,994,042 | |
| | | | |
Total Investments in Securities | | $ | 3,815,819,558 | | | $ | 3,062,148,816 | | | $ | 46,139,669 | | | $ | 6,924,108,043 | |
| | | | |
aIncludes common, preferred, and convertible preferred stocks as well as other equity investments.
bFor detailed categories, see the accompanying Statement of Investments.
cIncludes securities determined to have no value at December 31, 2014.
A reconciliation of assets in which Level 3 inputs are used in determining fair value is presented when there are significant Level 3 financial instruments at the end of the year.
11. New Accounting Pronouncements
In June 2014, the Financial Accounting Standards Board issued Accounting Standards Update (ASU) No. 2014-11, Transfers and Servicing (Topic 860), Repurchase-to-Maturity Transactions, Repurchase Financings, and Disclosures. The ASU changes the accounting for certain repurchase agreements and expands disclosure requirements related to repurchase agreements, securities lending, repurchase-to-maturity and similar transactions. The ASU is effective for interim and annual reporting periods beginning after December 15, 2014. Management has reviewed the requirements and believes the adoption of this ASU will not have a material impact on the financial statements.
12. Subsequent Events
The Fund has evaluated subsequent events through the issuance of the financial statements and determined that no events have occurred that require disclosure other than those already disclosed in the financial statements.
FRANKLIN TEMPLETON VARIABLE INSURANCE PRODUCTS TRUST
NOTES TO FINANCIAL STATEMENTS
Franklin Income VIP Fund (continued)
Abbreviations
| | | | | | |
| Currency | | Selected Portfolio |
| | | |
| EUR | | Euro | | ADR | | American Depositary Receipt |
| | | |
| | | | FHLB | | Federal Home Loan Bank |
| | | |
| | | | FHLMC | | Federal Home Loan Mortgage Corp. |
| | | |
| | | | FNMA | | Federal National Mortgage Association |
| | | |
| | | | FRN | | Floating Rate Note |
| | | |
| | | | L/C | | Letter of Credit |
| | | |
| | | | MTN | | Medium Term Note |
| | | |
| | | | PIK | | Payment-In-Kind |
FRANKLIN TEMPLETON VARIABLE INSURANCE PRODUCTS TRUST
Report of Independent Registered Public Accounting Firm
Franklin Income VIP Fund
To the Board of Trustees and Shareholders of Franklin Templeton Variable Insurance Products Trust
In our opinion, the accompanying statement of assets and liabilities, including the statement of investments, and the related statements of operations and of changes in net assets and the financial highlights present fairly, in all material respects, the financial position of Franklin Income VIP Fund (the “Fund”) at December 31, 2014, the results of its operations for the year then ended, the changes in its net assets for each of the two years in the period then ended and the financial highlights for each of the five years in the period then ended, in conformity with accounting principles generally accepted in the United States of America. These financial statements and financial highlights (hereafter referred to as “financial statements”) are the responsibility of the Fund’s management. Our responsibility is to express an opinion on these financial statements based on our audits. We conducted our audits of these financial statements in accordance with the standards of the Public Company Accounting Oversight Board (United States). Those standards require that we plan and perform the audit to obtain reasonable assurance about whether the financial statements are free of material misstatement. An audit includes examining, on a test basis, evidence supporting the amounts and disclosures in the financial statements, assessing the accounting principles used and significant estimates made by management, and evaluating the overall financial statement presentation. We believe that our audits, which included confirmation of securities at December 31, 2014 by correspondence with the custodian and brokers, provides a reasonable basis for our opinion.
PricewaterhouseCoopers LLP
San Francisco, California
February 13, 2015
FRANKLIN TEMPLETON VARIABLE INSURANCE PRODUCTS TRUST
Tax Information (unaudited)
Franklin Income VIP Fund
Under Section 854(b)(1)(A) of the Internal Revenue Code, the Fund hereby reports 28.06% of the ordinary income dividends as income qualifying for the dividends received deduction for the fiscal year ended December 31, 2014.
Franklin Large Cap Growth VIP Fund
(Formerly, Franklin Large Cap Growth Securities Fund)
This annual report for Franklin Large Cap Growth VIP Fund covers the fiscal year ended December 31, 2014.
Class 2 Performance Summary as of December 31, 2014
Average annual total return of Class 2 shares represents the average annual change in value, assuming reinvestment of dividends and capital gains. Average returns smooth out variations in returns, which can be significant; they are not the same as year-by-year results.
| | | | | | | | | | | | |
| Periods ended 12/31/14 | | 1-Year | | | 5-Year | | | 10-Year | |
Average Annual Total Return | | | +12.46% | | | | +12.31% | | | | +6.09% | |
Performance reflects the Fund’s Class 2 operating expenses, but does not include any contract fees, expenses or sales charges. If they had been included, performance would be lower. These charges and deductions, particularly for variable life policies, can have a significant effect on contract values and insurance benefits. See the contract prospectus for a complete description of these expenses, including sales charges.
Performance data represent past performance, which does not guarantee future results. Investment return and principal value will fluctuate, and you may have a gain or loss when you sell your shares. Current performance may differ from figures shown.
Total Return Index Comparison for a Hypothetical $10,000 Investment (1/1/05–12/31/14)
The graph below shows the change in value of a hypothetical $10,000 investment in the Fund over the indicated period and includes reinvestment of any income or distributions. The Fund’s performance is compared to the performance of the Standard & Poor’s® 500 Index (S&P 500®). One cannot invest directly in an index, and an index is not representative of the Fund’s portfolio. Please see Important Notes to Performance Information preceding the Fund Summaries.
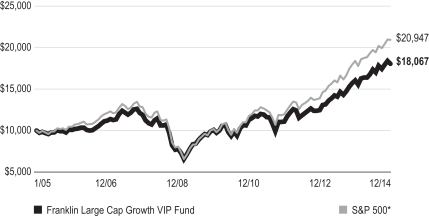
*Source: Morningstar. Please see Index Descriptions following the Fund Summaries.
FRANKLIN LARGE CAP GROWTH VIP FUND
Fund Goal and Main Investments
Franklin Large Cap Growth VIP Fund seeks capital appreciation. Under normal market conditions, the Fund invests at least 80% of its net assets in investments of large capitalization companies. For this Fund, large capitalization companies are those with market capitalization values within those of the top 50% of companies in the Russell 1000® Index at the time of purchase.1
Fund Risks
All investments involve risks, including possible loss of principal. Stock prices fluctuate, sometimes rapidly and dramatically, due to factors affecting individual companies, particular industries or sectors, or general market conditions. The Fund may focus on particular sectors of the market from time to time, which can carry greater risks of adverse developments in such sectors. Smaller or midsized companies can be particularly sensitive to changing economic conditions, and their prospects for growth are less certain than those of larger, more established companies. Investments in foreign securities may involve special risks including currency fluctuations and economic and political uncertainty. The Fund is actively managed but there is no guarantee that the manager’s investment decisions will produce the desired results. The Fund’s prospectus also includes a description of the main investment risks.
Performance Overview
You can find the Fund’s one-year total return in the Performance Summary. In comparison, the Fund’s benchmark, the S&P 500, generated a +13.69% total return.2
Economic and Market Overview
The U.S. economy continued to grow during the year ended December 31, 2014, underpinned in some quarters by manufacturing activity, consumer and business spending, and federal defense spending. Home sales experienced some weakness resulting from reduced inventory, higher mortgage rates and tight credit requirements but began to recover in May as mortgage rates declined. Home prices stayed higher than a year earlier. Retail sales generally improved, supported by job growth and lower gasoline prices in the latter part of 2014. The unemployment rate declined to 5.6% in December 2014 from
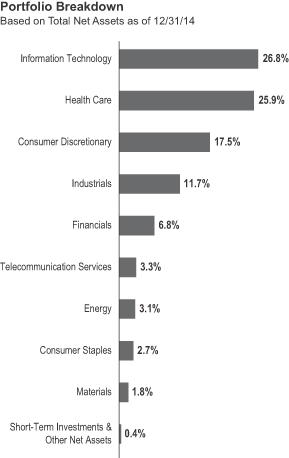
6.7% in December 2013.3 Inflation, as measured by the Consumer Price Index, remained low.
In January 2014, the U.S. Federal Reserve Board (Fed) began reducing its large-scale bond purchases $10 billion a month and ended the buying program in October. But it continued its practice of maintaining holdings of longer term securities at sizable levels. The Fed believed underlying economic strength could support ongoing progress in labor market conditions. The Fed also noted that although inflation might remain low in the near term, the likelihood of inflation running persistently below 2% had diminished. Toward period-end, the Fed stated that it could be patient with regard to raising interest rates and that the interest rate might not rise for at least a couple of meetings, possibly implying at least the first two meetings of 2015.
1. Please see Index Descriptions following the Fund Summaries.
2. Source: Morningstar.
One cannot invest directly in an index, and an index is not representative of the Fund’s portfolio. Please see Index Descriptions following the Fund Summaries.
3. Source: Bureau of Labor Statistics.
FRANKLIN LARGE CAP GROWTH VIP FUND
Investor confidence grew during the period as corporate profits rose and the economy generally strengthened. The market endured sell-offs when many investors reacted to political instability in certain emerging markets, crises in Ukraine and the Middle East, weakness in Europe and Japan, and moderating economic data in China. U.S. stocks rose overall for the 12 months under review as the S&P 500 and Dow Jones Industrial Average reached all-time highs.1
Investment Strategy
We are a research driven, fundamental investor, pursuing a growth strategy. As a “bottom-up” investor focusing primarily on individual securities, we seek companies that have identifiable drivers of future earnings growth and that present, in our opinion, the best trade-off between that potential earnings growth, business and financial risk, and valuation.
Manager’s Discussion
Looking back on the key factors impacting the Fund’s returns during the 12 months under review, we would like to remind shareholders that our investment strategy is primarily bottom-up and driven by individual stock selection. However, we recognize that a sector-based discussion can be a helpful way to organize a portfolio review of key performance drivers. We employed our long-held strategy: bottom-up, individual-company, fundamental research aimed at opportunistically finding what we believed to be outstanding large-cap companies across all sectors, at valuations we believed understated their fair worth, with future growth potential being a key driver of estimated worth.
During the year under review, nearly all sectors represented in the Fund’s portfolio contributed to absolute performance. Relative to the S&P 500, key contributors included stock selection and an overweighting in health care and an underweighting in energy.
In health care, our positions in biopharmaceutical firm Celgene4 and generic pharmaceutical company Actavis aided relative results. Celgene delivered strong earnings, driven largely by robust product sales growth in the U.S. and international markets. Revlimid, its top product and a market leader in multiple myeloma therapy, was recommended for European Commission approval by the European Medicines Agency as a treatment for adults suffering from multiple myeloma and ineligible for stem cell transplants. Actavis’s shares rallied after the company announced in February that it would acquire Forest Laboratories
| | | | |
| Top 10 Holdings | | | |
| 12/31/14 | | | |
Company Sector/Industry | | % of Total
Net Assets | |
Celgene Corp. Health Care | | | 4.1% | |
Actavis PLC Health Care | | | 3.9% | |
MasterCard Inc., A Information Technology | | | 3.5% | |
SBA Communications Corp. Telecommunication Services | | | 3.3% | |
Apple Inc. Information Technology | | | 3.1% | |
Facebook Inc., A Information Technology | | | 3.0% | |
Google Inc., A & C Information Technology | | | 2.6% | |
Gilead Sciences Inc. Health Care | | | 2.3% | |
Precision Castparts Corp. Industrials | | | 2.2% | |
The Walt Disney Co. Consumer Discretionary | | | 2.2% | |
The dollar value, number of shares or principal amount, and names of all portfolio holdings are listed in the Fund’s Statement of Investments.
to strengthen its specialty pharmaceuticals portfolio and reported that its acquisition of specialty drug maker Warner Chilcott had helped earnings results. Actavis agreed to acquire several other companies in 2014, including multi-specialty global health care firm Allergan, also a Fund holding, which would make the combined company one of the largest pharmaceutical companies worldwide. Accretive acquisitions boosted Actavis’s revenues and earnings in recent quarters.
In the energy sector, stocks retreated as crude oil prices fell sharply in 2014 because of excess supply and weak global demand growth. An underweighting in these stocks, notably integrated energy companies Exxon Mobil and Chevron, both of which we sold during the period, contributed to the Fund’s relative performance.
Other notable contributors included an investment in American Airlines Group, one of the world’s largest airlines.4,5 Its share price rose as the company increased earnings and provided a positive outlook for 2015.
4. New holding this period.
5. Not part of the index.
FRANKLIN LARGE CAP GROWTH VIP FUND
In contrast, key detractors from the Fund’s relative performance included our stock selection in the consumer discretionary and industrials sectors.
In consumer discretionary, our investment in casino resort operator Las Vegas Sands4,5 and position in luxury goods maker and retailer Michael Kors Holdings4 hurt relative results. Las Vegas Sands’ share price reached a multi-year high in March 2014 but corrected after gambling revenues in Macau fell due to the Chinese government’s anti-corruption campaign. Las Vegas Sands continued to benefit from its mass gaming and non-gaming operations in Macau, and it maintained a strong balance sheet and steady cash flow. Michael Kors posted solid revenues and earnings, but its share price declined as discounts on its fall inventory led to narrower margins.
In the industrials sector, key detractors included our position in Flowserve, a provider of flow control products and services for the global infrastructure markets.4 Although the company delivered healthy earnings in the first half of the year, its revenues declined in the third quarter, resulting largely from project delays by some customers, unfavorable foreign currency exchange rates and costs related to its divestment of a Russia-focused business.
Other key detractors included natural and organic foods retailer Whole Foods Market and energy equipment and services company Halliburton, both of which we sold during the period. Whole Foods Market’s share price fell after disappointing earnings reports. Halliburton’s shares were pressured by the company’s announcement it would acquire another large company and by a sharp decline in crude oil prices.
Thank you for your participation in Franklin Large Cap Growth VIP Fund. We look forward to serving your future investment needs.
The foregoing information reflects our analysis, opinions and portfolio holdings as of December 31, 2014, the end of the reporting period. The way we implement our main investment strategies and the resulting portfolio holdings may change depending on factors such as market and economic conditions. These opinions may not be relied upon as investment advice or an offer for a particular security. The information is not a complete analysis of every aspect of any market, country, industry, security or the Fund. Statements of fact are from sources considered reliable, but the investment manager makes no representation or warranty as to their completeness or accuracy. Although historical performance is no guarantee of future results, these insights may help you understand our investment management philosophy.
FRANKLIN LARGE CAP GROWTH VIP FUND
Class 2 Fund Expenses
As an investor in a variable insurance contract (Contract) that indirectly provides for investment in an underlying mutual fund, you can incur transaction and/or ongoing expenses at both the Fund level and the Contract level.
| • | | Transaction expenses can include sales charges (loads) on purchases, redemption fees, surrender fees, transfer fees and premium taxes. |
| • | | Ongoing expenses can include management fees, distribution and service (12b-1) fees, contract fees, annual maintenance fees, mortality and expense risk fees and other fees and expenses. All mutual funds and Contracts have some types of ongoing expenses. |
The expenses shown in the table are meant to highlight ongoing expenses at the Fund level only and do not include ongoing expenses at the Contract level, or transaction expenses at either the Fund or Contract level. While the Fund does not have transaction expenses, if the transaction and ongoing expenses at the Contract level were included, the expenses shown below would be higher. You should consult your Contract prospectus or disclosure document for more information.
The table shows Fund-level ongoing expenses and can help you understand these expenses and compare them with those of other mutual funds offered through the Contract. The table assumes a $1,000 investment held for the six months indicated. Please refer to the Fund prospectus for additional information on operating expenses.
Actual Fund Expenses
The first line (Actual) of the table provides actual account values and expenses. The “Ending Account Value” is derived from the Fund’s actual return, which includes the effect of ongoing Fund expenses, but does not include the effect of ongoing Contract expenses.
You can estimate the Fund-level expenses you incurred during the period by following these steps. Of course, your account value and expenses will differ from those in this illustration:
| 1. | Divide your account value by $1,000. |
If an account had an $8,600 value,
then $8,600 ÷ $1,000 = 8.6.
| 2. | Multiply the result by the number under the heading “Fund-Level Expenses Incurred During Period.” |
If Fund-Level Expenses Incurred During Period were $7.50, then 8.6 × $7.50 = $64.50.
In this illustration, the estimated expenses incurred this period at the Fund level are $64.50.
Hypothetical Example for Comparison with Other Mutual Funds
Information in the second line (Hypothetical) of the table can help you compare ongoing expenses of the Fund with those of other mutual funds offered through the Contract. This information may not be used to estimate the actual ending account balance or expenses you incurred during the period. The hypothetical “Ending Account Value” is based on the Fund’s actual expense ratio and an assumed 5% annual rate of return before expenses, which does not represent the Fund’s actual return. The figure under the heading “Fund-Level Expenses Incurred During Period” shows the hypothetical expenses your account would have incurred under this scenario. You can compare this figure with the 5% hypothetical examples that appear in shareholder reports of other funds offered through a Contract.
| | | | | | | | | | | | |
| Class 2 | | Beginning Account Value 7/1/14 | | | Ending Account
Value 12/31/14 | | | Fund-Level Expenses
Incurred During Period* 7/1/14–12/31/14 | |
Actual | | | $1,000 | | | | $1,039.40 | | | | $5.40 | |
Hypothetical (5% return before expenses) | | | $1,000 | | | | $1,019.91 | | | | $5.35 | |
*Expenses are calculated using the most recent six-month annualized expense ratio for the Fund’s Class 2 shares (1.05%), which does not include any ongoing expenses of the Contract for which the Fund is an investment option, multiplied by the average account value over the period, multiplied by 184/365 to reflect the one-half year period.
FRANKLIN TEMPLETON VARIABLE INSURANCE PRODUCTS TRUST
Financial Highlights
Franklin Large Cap Growth VIP Fund
| | | | | | | | | | | | | | | | | | | | |
| | | Year Ended December 31, | |
| | | 2014 | | | 2013 | | | 2012 | | | 2011 | | | 2010 | |
| Class 1 | | | | | | | | | | | | | | | | | | | | |
Per share operating performance (for a share outstanding throughout the year) | | | | | | | | | | | | | | | | | | | | |
| | | | | |
Net asset value, beginning of year | | | $20.91 | | | | $16.43 | | | | $14.75 | | | | $15.07 | | | | $13.62 | |
| | | | |
| | | | | |
| Income from investment operationsa: | | | | | | | | | | | | | | | | | | | | |
| | | | | |
Net investment incomeb | | | 0.11 | | | | 0.24 | | | | 0.21 | | | | 0.15 | | | | 0.12 | |
| | | | | |
Net realized and unrealized gains (losses) | | | 2.54 | | | | 4.48 | | | | 1.65 | | | | (0.33 | ) | | | 1.48 | |
| | | | |
Total from investment operations | | | 2.65 | | | | 4.72 | | | | 1.86 | | | | (0.18 | ) | | | 1.60 | |
| | | | |
Less distributions from net investment income | | | (0.30 | ) | | | (0.24 | ) | | | (0.18 | ) | | | (0.14 | ) | | | (0.15 | ) |
| | | | |
Net asset value, end of year | | | $23.26 | | | | $20.91 | | | | $16.43 | | | | $14.75 | | | | $15.07 | |
| | | | |
| | | | | |
Total returnc | | | 12.74% | | | | 28.92% | | | | 12.65% | | | | (1.22)% | | | | 11.85% | |
| | | | | |
| Ratios to average net assets | | | | | | | | | | | | | | | | | | | | |
| | | | | |
Expenses | | | 0.79% | | | | 0.79% | | | | 0.80% | | | | 0.80% | | | | 0.79% | |
| | | | | |
Net investment income | | | 0.50% | | | | 1.27% | | | | 1.31% | | | | 0.99% | | | | 0.86% | |
| | | | | |
| Supplemental data | | | | | | | | | | | | | | | | | | | | |
| | | | | |
Net assets, end of year (000’s) | | | $54,971 | | | | $54,291 | | | | $46,756 | | | | $48,666 | | | | $58,265 | |
| | | | | |
Portfolio turnover rate | | | 93.53% | | | | 28.27% | | | | 33.88% | | | | 56.61% | | | | 46.75% | |
aThe amount shown for a share outstanding throughout the period may not correlate with the Statement of Operations for the period due to the timing of sales and repurchases of the Fund shares in relation to income earned and/or fluctuating fair value of the investments of the Fund.
bBased on average daily shares outstanding.
cTotal return does not include fees, charges or expenses imposed by the variable annuity and life insurance contracts for which Franklin Templeton Variable Insurance Products Trust serves as an underlying investment vehicle.
| | | | |
| FLG-6 | | Annual Report | The accompanying notes are an integral part of these financial statements. | | |
FRANKLIN TEMPLETON VARIABLE INSURANCE PRODUCTS TRUST
FINANCIAL HIGHLIGHTS
Franklin Large Cap Growth VIP Fund (continued)
| | | | | | | | | | | | | | | | | | | | |
| | | Year Ended December 31, | |
| | | 2014 | | | 2013 | | | 2012 | | | 2011 | | | 2010 | |
| Class 2 | | | | | | | | | | | | | | | | | | | | |
Per share operating performance (for a share outstanding throughout the year) | | | | | | | | | | | | | | | | | | | | |
| | | | | |
Net asset value, beginning of year | | | $20.62 | | | | $16.20 | | | | $14.54 | | | | $14.86 | | | | $13.43 | |
| | | | |
| | | | | |
| Income from investment operationsa: | | | | | | | | | | | | | | | | | | | | |
| | | | | |
Net investment incomeb | | | 0.06 | | | | 0.19 | | | | 0.17 | | | | 0.11 | | | | 0.08 | |
| | | | | |
Net realized and unrealized gains (losses) | | | 2.50 | | | | 4.42 | | | | 1.62 | | | | (0.33 | ) | | | 1.46 | |
| | | | |
Total from investment operations | | | 2.56 | | | | 4.61 | | | | 1.79 | | | | (0.22 | ) | | | 1.54 | |
| | | | |
Less distributions from net investment income | | | (0.24 | ) | | | (0.19 | ) | | | (0.13 | ) | | | (0.10 | ) | | | (0.11 | ) |
| | | | |
Net asset value, end of year | | | $22.94 | | | | $20.62 | | | | $16.20 | | | | $14.54 | | | | $14.86 | |
| | | | |
| | | | | |
Total returnc | | | 12.46% | | | | 28.63% | | | | 12.37% | | | | (1.51)% | | | | 11.59% | |
| | | | | |
| Ratios to average net assets | | | | | | | | | | | | | | | | | | | | |
| | | | | |
Expenses | | | 1.04% | | | | 1.04% | | | | 1.05% | | | | 1.05% | | | | 1.04% | |
| | | | | |
Net investment income | | | 0.25% | | | | 1.02% | | | | 1.06% | | | | 0.74% | | | | 0.61% | |
| | | | | |
| Supplemental data | | | | | | | | | | | | | | | | | | | | |
| | | | | |
Net assets, end of year (000’s) | | | $256,098 | | | | $285,477 | | | | $278,989 | | | | $293,226 | | | | $357,405 | |
| | | | | |
Portfolio turnover rate | | | 93.53% | | | | 28.27% | | | | 33.88% | | | | 56.61% | | | | 46.75% | |
aThe amount shown for a share outstanding throughout the period may not correlate with the Statement of Operations for the period due to the timing of sales and repurchases of the Fund shares in relation to income earned and/or fluctuating fair value of the investments of the Fund.
bBased on average daily shares outstanding.
cTotal return does not include fees, charges or expenses imposed by the variable annuity and life insurance contracts for which Franklin Templeton Variable Insurance Products Trust serves as an underlying investment vehicle.
| | | | | | |
| | | The accompanying notes are an integral part of these financial statements. | Annual Report | | | FLG-7 | |
FRANKLIN TEMPLETON VARIABLE INSURANCE PRODUCTS TRUST
Statement of Investments, December 31, 2014
| | | | | | | | | | |
| Franklin Large Cap Growth VIP Fund | |
| | | | | Shares | | | Value | |
| | | | | | | | | | |
| | Common Stocks 99.6% | | | | | | | | |
| | Consumer Discretionary 17.5% | | | | | | | | |
| a | | Amazon.com Inc. | | | 16,460 | | | $ | 5,108,361 | |
| a | | Buffalo Wild Wings Inc. | | | 10,631 | | | | 1,917,620 | |
| a | | Chipotle Mexican Grill Inc. | | | 5,764 | | | | 3,945,516 | |
| a | | DISH Network Corp., A | | | 26,794 | | | | 1,953,015 | |
| | Harman International Industries Inc. | | | 29,118 | | | | 3,107,182 | |
| a | | Kate Spade & Co. | | | 53,169 | | | | 1,701,940 | |
| | Las Vegas Sands Corp. | | | 78,083 | | | | 4,541,307 | |
| a | | Liberty Broadband Corp., C | | | 19,974 | | | | 995,105 | |
| | Lowe’s Cos. Inc. | | | 49,446 | | | | 3,401,885 | |
| a | | Michael Kors Holdings Ltd. | | | 25,475 | | | | 1,913,172 | |
| | NIKE Inc., B | | | 43,861 | | | | 4,217,235 | |
| a | | The Priceline Group Inc. | | | 4,801 | | | | 5,474,148 | |
| | Starbucks Corp. | | | 63,870 | | | | 5,240,533 | |
| a | | Under Armour Inc., A | | | 61,770 | | | | 4,194,183 | |
| | The Walt Disney Co. | | | 71,240 | | | | 6,710,096 | |
| | | | | | | | | | |
| | | | | | | | | 54,421,298 | |
| | | | | | | | | | |
| | Consumer Staples 2.7% | | | | | | | | |
| a | | Boston Beer Inc., A | | | 6,996 | | | | 2,025,622 | |
| | Mead Johnson Nutrition Co., A | | | 31,160 | | | | 3,132,826 | |
| a | | Monster Beverage Corp. | | | 29,074 | | | | 3,150,168 | |
| | | | | | | | | | |
| | | | | | | | | 8,308,616 | |
| | | | | | | | | | |
| | Energy 3.1% | | | | | | | | |
| | Anadarko Petroleum Corp. | | | 56,155 | | | | 4,632,787 | |
| a | | Diamondback Energy Inc. | | | 39,604 | | | | 2,367,527 | |
| | Schlumberger Ltd. | | | 31,390 | | | | 2,681,020 | |
| | | | | | | | | | |
| | | | | | | | | 9,681,334 | |
| | | | | | | | | | |
| | Financials 6.8% | | | | | | | | |
| a | | Affiliated Managers Group Inc. | | | 15,423 | | | | 3,273,378 | |
| | American Tower Corp. | | | 23,959 | | | | 2,368,347 | |
| | BlackRock Inc. | | | 6,778 | | | | 2,423,542 | |
| a | | CBRE Group Inc. | | | 115,801 | | | | 3,966,184 | |
| | The Charles Schwab Corp. | | | 127,242 | | | | 3,841,436 | |
| | Outfront Media Inc. | | | 78,179 | | | | 2,098,324 | |
| a | | Signature Bank | | | 26,255 | | | | 3,307,080 | |
| | | | | | | | | | |
| | | | | | | | | 21,278,291 | |
| | | | | | | | | | |
| | Health Care 25.9% | | | | | | | | |
| a | | Actavis PLC | | | 46,614 | | | | 11,998,910 | |
| | Allergan Inc. | | | 11,933 | | | | 2,536,836 | |
| a | | Alnylam Pharmaceuticals Inc. | | | 29,227 | | | | 2,835,019 | |
| a | | Biogen Idec Inc. | | | 18,439 | | | | 6,259,119 | |
| a | | Celgene Corp. | | | 114,783 | | | | 12,839,626 | |
| a | | Celldex Therapeutics Inc. | | | 102,921 | | | | 1,878,308 | |
| a | | Envision Healthcare Holdings Inc. | | | 64,847 | | | | 2,249,542 | |
| a | | Gilead Sciences Inc. | | | 77,473 | | | | 7,302,605 | |
| a | | HMS Holdings Corp. | | | 145,812 | | | | 3,082,466 | |
| a | | Illumina Inc. | | | 21,902 | | | | 4,042,671 | |
| a | | Incyte Corp. | | | 32,992 | | | | 2,412,045 | |
| a | | Jazz Pharmaceuticals PLC | | | 18,941 | | | | 3,101,210 | |
| a | | Karyopharm Therapeutics Inc. | | | 52,125 | | | | 1,951,039 | |
FRANKLIN TEMPLETON VARIABLE INSURANCE PRODUCTS TRUST
STATEMENT OF INVESTMENTS
Franklin Large Cap Growth VIP Fund (continued)
| | | | | | | | | | |
| | | | | Shares | | | Value | |
| | | | | | | | | | |
| | Common Stocks (continued) | | | | | | | | |
| | Health Care (continued) | | | | | | | | |
| a | | Medivation Inc. | | | 47,547 | | | $ | 4,736,157 | |
| | Perrigo Co. PLC | | | 27,891 | | | | 4,662,260 | |
| a | | Sagent Pharmaceuticals Inc. | | | 50,804 | | | | 1,275,688 | |
| a | | Valeant Pharmaceuticals International Inc. (Canada) | | | 34,098 | | | | 4,879,765 | |
| a | | VWR Corp. | | | 96,776 | | | | 2,503,595 | |
| | | | | | | | | | |
| | | | | | | | | 80,546,861 | |
| | | | | | | | | | |
| | Industrials 11.7% | | | | | | | | |
| | Allegiant Travel Co. | | | 13,554 | | | | 2,037,573 | |
| | American Airlines Group Inc. | | | 93,042 | | | | 4,989,842 | |
| | Cummins Inc. | | | 16,027 | | | | 2,310,612 | |
| a | | DigitalGlobe Inc. | | | 68,172 | | | | 2,111,287 | |
| | Flowserve Corp. | | | 74,041 | | | | 4,429,873 | |
| a | | Hexcel Corp. | | | 42,989 | | | | 1,783,614 | |
| a | | IHS Inc., A | | | 28,616 | | | | 3,258,790 | |
| | Kansas City Southern | | | 31,794 | | | | 3,879,822 | |
| | Precision Castparts Corp. | | | 27,933 | | | | 6,728,501 | |
| | Union Pacific Corp. | | | 15,990 | | | | 1,904,889 | |
| a | | United Rentals Inc. | | | 28,870 | | | | 2,945,029 | |
| | | | | | | | | | |
| | | | | | | | | 36,379,832 | |
| | | | | | | | | | |
| | Information Technology 26.8% | | | | | | | | |
| a | | Adobe Systems Inc. | | | 42,916 | | | | 3,119,993 | |
| a | | Alibaba Group Holding Ltd., ADR (China) | | | 26,476 | | | | 2,751,916 | |
| | Apple Inc. | | | 86,643 | | | | 9,563,654 | |
| | Avago Technologies Ltd. (Singapore) | | | 41,780 | | | | 4,202,650 | |
| a | | BroadSoft Inc. | | | 71,630 | | | | 2,078,703 | |
| a | | Facebook Inc., A | | | 120,024 | | | | 9,364,273 | |
| a | | Google Inc., A | | | 8,211 | | | | 4,357,249 | |
| a | | Google Inc., C | | | 7,068 | | | | 3,720,595 | |
| a | | LinkedIn Corp., A | | | 9,823 | | | | 2,256,441 | |
| | MasterCard Inc., A | | | 127,154 | | | | 10,955,589 | |
| | Microsoft Corp. | | | 118,005 | | | | 5,481,332 | |
| | Mobileye NV | | | 32,579 | | | | 1,321,404 | |
| a | | NetSuite Inc. | | | 24,141 | | | | 2,635,473 | |
| a | | NXP Semiconductors NV (Netherlands) | | | 51,120 | | | | 3,905,568 | |
| a | | Palo Alto Networks Inc. | | | 21,253 | | | | 2,604,980 | |
| | QUALCOMM Inc. | | | 21,609 | | | | 1,606,197 | |
| a | | Salesforce.com Inc. | | | 44,850 | | | | 2,660,054 | |
| a | | ServiceNow Inc. | | | 32,683 | | | | 2,217,542 | |
| | Texas Instruments Inc. | | | 30,280 | | | | 1,618,920 | |
| a | | ViaSat Inc. | | | 37,512 | | | | 2,364,381 | |
| | Visa Inc., A | | | 17,863 | | | | 4,683,679 | |
| | | | | | | | | | |
| | | | | | | | | 83,470,593 | |
| | | | | | | | | | |
| | Materials 1.8% | | | | | | | | |
| a | | Axalta Coating Systems Ltd. | | | 39,600 | | | | 1,030,392 | |
| | LyondellBasell Industries NV, A | | | 37,184 | | | | 2,952,038 | |
| | Martin Marietta Materials Inc. | | | 14,785 | | | | 1,631,081 | |
| | | | | | | | | | |
| | | | | | | | | 5,613,511 | |
| | | | | | | | | | |
FRANKLIN TEMPLETON VARIABLE INSURANCE PRODUCTS TRUST
STATEMENT OF INVESTMENTS
Franklin Large Cap Growth VIP Fund (continued)
| | | | | | | | | | |
| | | | | Shares | | | Value | |
| | | | | | | | | | |
| | Common Stocks (continued) | | | | | | | | |
| | Telecommunication Services 3.3% | | | | | | | | |
| a | | SBA Communications Corp. | | | 91,232 | | | $ | 10,104,856 | |
| | | | | | | | | | |
| | | |
| | Total Common Stocks (Cost $241,304,657) | | | | | | | 309,805,192 | |
| | | | | | | | | | |
| | | |
| | | | | Principal Amount | | | | |
| | Short Term Investments (Cost $1,729,036) 0.5% | | | | | | | | |
| | Repurchase Agreements 0.5% | | | | | | | | |
| b | | Joint Repurchase Agreement, 0.057%, 01/02/15 (Maturity Value $1,729,041) | | $ | 1,729,036 | | | | 1,729,036 | |
| | BNP Paribas Securities Corp. (Maturity Value $145,706)
HSBC Securities (USA) Inc. (Maturity Value $1,204,502)
Merrill Lynch, Pierce, Fenner & Smith Inc. (Maturity Value $378,833) | | | | | | | | |
| | Collateralized by U.S. Government Agency Securities, 0.000% - 1.50%, 1/20/15 - 10/09/19;
U.S. Government Agency Securities, Strips, 6/01/17; and
U.S. Treasury Notes, 1.625% - 4.50%, 11/15/15 - 11/30/20 (valued at $1,763,835). | | | | | | | | |
| | | | | | | | | | |
| | Total Investments (Cost $243,033,693) 100.1% | | | | | | | 311,534,228 | |
| | Other Assets, less Liabilities (0.1)% | | | | | | | (465,974 | ) |
| | | | | | | | | | |
| | Net Assets 100.0% | | | | | | $ | 311,068,254 | |
| | | | | | | | | | |
See Abbreviations on page FLG-20.
aNon-income producing.
bSee Note 1(c) regarding joint repurchase agreement.
| | | | |
| FLG-10 | | Annual Report | The accompanying notes are an integral part of these financial statements. | | |
FRANKLIN TEMPLETON VARIABLE INSURANCE PRODUCTS TRUST
Financial Statements
Statement of Assets and Liabilities
December 31, 2014
| | | | |
| | | Franklin Large
Cap Growth
VIP Fund | |
Assets: | | | | |
Investments in securities: | | | | |
Cost - Unaffiliated issuers | | $ | 241,304,657 | |
Cost - Repurchase agreements | | | 1,729,036 | |
| | | | |
Total cost of investments | | $ | 243,033,693 | |
| | | | |
Value - Unaffiliated issuers | | $ | 309,805,192 | |
Value - Repurchase agreements | | | 1,729,036 | |
| | | | |
Total value of investments | | | 311,534,228 | |
Receivables: | | | | |
Capital shares sold | | | 243 | |
Dividends | | | 205,778 | |
Due from brokers | | | 671,792 | |
Other assets | | | 193 | |
| | | | |
Total assets | | | 312,412,234 | |
| | | | |
Liabilities: | | | | |
Payables: | | | | |
Capital shares redeemed | | | 218,253 | |
Management fees | | | 199,847 | |
Distribution fees | | | 108,340 | |
Reports to shareholders | | | 69,836 | |
Funds advanced by custodian | | | 709,423 | |
Accrued expenses and other liabilities | | | 38,281 | |
| | | | |
Total liabilities | | | 1,343,980 | |
| | | | |
Net assets, at value | | $ | 311,068,254 | |
| | | | |
Net assets consist of: | | | | |
Paid-in capital | | $ | 164,815,145 | |
Undistributed net investment income | | | 983,278 | |
Net unrealized appreciation (depreciation) | | | 68,500,535 | |
Accumulated net realized gain (loss) | | | 76,769,296 | |
| | | | |
Net assets, at value | | $ | 311,068,254 | |
| | | | |
| |
| Class 1: | | | | |
Net assets, at value | | $ | 54,970,707 | |
| | | | |
Shares outstanding | | | 2,362,916 | |
| | | | |
Net asset value and maximum offering price per share | | $ | 23.26 | |
| | | | |
| |
| Class 2: | | | | |
Net assets, at value | | $ | 256,097,547 | |
| | | | |
Shares outstanding | | | 11,163,978 | |
| | | | |
Net asset value and maximum offering price per share | | $ | 22.94 | |
| | | | |
| | | | | | |
| | | The accompanying notes are an integral part of these financial statements. | Annual Report | | | FLG-11 | |
FRANKLIN TEMPLETON VARIABLE INSURANCE PRODUCTS TRUST
FINANCIAL STATEMENTS
Statement of Operations
for the year ended December 31, 2014
| | | | |
| | | Franklin Large
Cap Growth
VIP Fund | |
Investment income: | | | | |
Dividends | | $ | 4,129,543 | |
Interest | | | 2,894 | |
| | | | |
Total investment income | | | 4,132,437 | |
| | | | |
Expenses: | | | | |
Management fees (Note 3a) | | | 2,385,727 | |
Distribution fees - Class 2 (Note 3c) | | | 658,767 | |
Custodian fees (Note 4) | | | 4,680 | |
Reports to shareholders | | | 87,410 | |
Professional fees | | | 41,307 | |
Trustees’ fees and expenses | | | 1,281 | |
Other | | | 9,144 | |
| | | | |
Total expenses | | | 3,188,316 | |
| | | | |
Net investment income | | | 944,121 | |
| | | | |
Realized and unrealized gains (losses): | | | | |
Net realized gain (loss) from: | | | | |
Investments | | | 106,970,144 | |
Foreign currency transactions | | | (3,691 | ) |
| | | | |
Net realized gain (loss) | | | 106,966,453 | |
| | | | |
Net change in unrealized appreciation (depreciation) on investments | | | (70,957,037 | ) |
| | | | |
Net realized and unrealized gain (loss) | | | 36,009,416 | |
| | | | |
Net increase (decrease) in net assets resulting from operations | | $ | 36,953,537 | |
| | | | |
| | | | |
| FLG-12 | | Annual Report | The accompanying notes are an integral part of these financial statements. | | |
FRANKLIN TEMPLETON VARIABLE INSURANCE PRODUCTS TRUST
FINANCIAL STATEMENTS
Statements of Changes in Net Assets
| | | | | | | | |
| | | Franklin Large Cap Growth VIP Fund | |
| | | Year Ended December 31, | |
| | | 2014 | | | 2013 | |
Increase (decrease) in net assets: | | | | | | | | |
Operations: | | | | | | | | |
Net investment income | | $ | 944,121 | | | $ | 3,571,905 | |
Net realized gain (loss) from investments and foreign currency transactions | | | 106,966,453 | | | | 34,945,789 | |
Net change in unrealized appreciation (depreciation) on investments | | | (70,957,037 | ) | | | 46,349,997 | |
| | | | |
Net increase (decrease) in net assets resulting from operations | | | 36,953,537 | | | | 84,867,691 | |
| | | | |
Distributions to shareholders from: | | | | | | | | |
Net investment income: | | | | | | | | |
Class 1 | | | (729,509 | ) | | | (652,010 | ) |
Class 2 | | | (2,842,675 | ) | | | (3,061,884 | ) |
| | | | |
Total distributions to shareholders | | | (3,572,184 | ) | | | (3,713,894 | ) |
| | | | |
Capital share transactions: (Note 2) | | | | | | | | |
Class 1 | | | (5,100,024 | ) | | | (4,699,193 | ) |
Class 2 | | | (56,981,465 | ) | | | (62,431,458 | ) |
| | | | |
Total capital share transactions | | | (62,081,489 | ) | | | (67,130,651 | ) |
| | | | |
Net increase (decrease) in net assets | | | (28,700,136 | ) | | | 14,023,146 | |
Net assets: | | | | | | | | |
Beginning of year | | | 339,768,390 | | | | 325,745,244 | |
| | | | |
End of year | | $ | 311,068,254 | | | $ | 339,768,390 | |
| | | | |
Undistributed net investment income included in net assets: | | | | | | | | |
End of year | | $ | 983,278 | | | $ | 3,615,032 | |
| | | | |
| | | | | | |
| | | The accompanying notes are an integral part of these financial statements. | Annual Report | | | FLG-13 | |
FRANKLIN TEMPLETON VARIABLE INSURANCE PRODUCTS TRUST
Notes to Financial Statements
Franklin Large Cap Growth VIP Fund
1. Organization and Significant Accounting Policies
Franklin Templeton Variable Insurance Products Trust (Trust) is registered under the Investment Company Act of 1940, as amended, (1940 Act) as an open-end management investment company, consisting of nineteen separate funds and applies the specialized accounting and reporting guidance in U.S. Generally Accepted Accounting Principles (U.S. GAAP). Franklin Large Cap Growth VIP Fund (Fund) is included in this report. The financial statements of the remaining funds in the Trust are presented separately. Shares of the Fund are generally sold only to insurance company separate accounts to fund the benefits of variable life insurance policies or variable annuity contracts. At December 31, 2014, 46.23% of the Fund’s shares were held through one insurance company. Investment activities of these insurance company separate accounts could have a material impact on the Fund. The Fund offers two classes of shares: Class 1 and Class 2. Each class of shares differs by its distribution fees, voting rights on matters affecting a single class and its exchange privilege.
Effective May 1, 2014, Franklin Large Cap Growth Securities Fund was renamed Franklin Large Cap Growth VIP Fund.
The following summarizes the Fund’s significant accounting policies.
a. Financial Instrument Valuation
The Fund’s investments in financial instruments are carried at fair value daily. Fair value is the price that would be received to sell an asset or paid to transfer a liability in an orderly transaction between market participants on the measurement date. The Fund calculates the net asset value per share at the close of the New York Stock Exchange (NYSE), generally at 4 p.m. Eastern time (NYSE close) on each day the NYSE is open for trading. Under compliance policies and procedures approved by the Trust’s Board of Trustees (the Board), the Fund’s administrator has responsibility for oversight of valuation, including leading the cross-functional Valuation and Liquidity Oversight Committee (VLOC). The VLOC provides administration and oversight of the Fund’s valuation policies and procedures, which are approved annually by the Board. Among other things, these procedures allow the Fund to utilize independent pricing services, quotations from securities and financial instrument dealers, and other market sources to determine fair value.
Equity securities listed on an exchange or on the NASDAQ National Market System are valued at the last quoted sale price
or the official closing price of the day, respectively. Foreign equity securities are valued as of the close of trading on the foreign stock exchange on which the security is primarily traded or as of the NYSE close, whichever is earlier. The value is then converted into its U.S. dollar equivalent at the foreign exchange rate in effect at the NYSE close on the day that the value of the security is determined. Over-the-counter (OTC) securities are valued within the range of the most recent quoted bid and ask prices. Securities that trade in multiple markets or on multiple exchanges are valued according to the broadest and most representative market. Certain equity securities are valued based upon fundamental characteristics or relationships to similar securities. Repurchase agreements are valued at cost, which approximates fair value.
The Fund has procedures to determine the fair value of financial instruments for which market prices are not reliable or readily available. Under these procedures, the VLOC convenes on a regular basis to review such financial instruments and considers a number of factors, including significant unobservable valuation inputs, when arriving at fair value. The VLOC primarily employs a market-based approach which may use related or comparable assets or liabilities, recent transactions, market multiples, book values, and other relevant information for the investment to determine the fair value of the investment. An income-based valuation approach may also be used in which the anticipated future cash flows of the investment are discounted to calculate fair value. Discounts may also be applied due to the nature or duration of any restrictions on the disposition of the investments. Due to the inherent uncertainty of valuations of such investments, the fair values may differ significantly from the values that would have been used had an active market existed. The VLOC employs various methods for calibrating these valuation approaches including a regular review of key inputs and assumptions, transactional back-testing or disposition analysis, and reviews of any related market activity.
Trading in securities on foreign securities stock exchanges and OTC markets may be completed before the daily NYSE close. In addition, trading in certain foreign markets may not take place on every NYSE business day. Occasionally, events occur between the time at which trading in a foreign security is completed and the close of the NYSE that might call into question the reliability of the value of a portfolio security held by the Fund. As a result, differences may arise between the value of the Fund’s portfolio securities as determined at the foreign market close and the latest indications of value at the close of
FRANKLIN TEMPLETON VARIABLE INSURANCE PRODUCTS TRUST
NOTES TO FINANCIAL STATEMENTS
Franklin Large Cap Growth VIP Fund (continued)
the NYSE. In order to minimize the potential for these differences, the VLOC monitors price movements following the close of trading in foreign stock markets through a series of country specific market proxies (such as baskets of American Depositary Receipts, futures contracts and exchange traded funds). These price movements are measured against established trigger thresholds for each specific market proxy to assist in determining if an event has occurred that may call into question the reliability of the values of the foreign securities held by the Fund. If such an event occurs, the securities may be valued using fair value procedures, which may include the use of independent pricing services.
Also, when the last day of the reporting period is a non-business day, certain foreign markets may be open on those days that the NYSE is closed, which could result in differences between the value of the Fund’s portfolio securities on the last business day and the last calendar day of the reporting period. Any significant security valuation changes due to an open foreign market are adjusted and reflected by the Fund for financial reporting purposes.
b. Foreign Currency Translation
Portfolio securities and other assets and liabilities denominated in foreign currencies are translated into U.S. dollars based on the exchange rate of such currencies against U.S. dollars on the date of valuation. The Fund may enter into foreign currency exchange contracts to facilitate transactions denominated in a foreign currency. Purchases and sales of securities, income and expense items denominated in foreign currencies are translated into U.S. dollars at the exchange rate in effect on the transaction date. Portfolio securities and assets and liabilities denominated in foreign currencies contain risks that those currencies will decline in value relative to the U.S. dollar. Occasionally, events may impact the availability or reliability of foreign exchange rates used to convert the U.S. dollar equivalent value. If such an event occurs, the foreign exchange rate will be valued at fair value using procedures established and approved by the Board.
The Fund does not separately report the effect of changes in foreign exchange rates from changes in market prices on securities held. Such changes are included in net realized and unrealized gain or loss from investments on the Statement of Operations.
Realized foreign exchange gains or losses arise from sales of foreign currencies, currency gains or losses realized between the trade and settlement dates on securities transactions and the difference between the recorded amounts of dividends, interest,
and foreign withholding taxes and the U.S. dollar equivalent of the amounts actually received or paid. Net unrealized foreign exchange gains and losses arise from changes in foreign exchange rates on foreign denominated assets and liabilities other than investments in securities held at the end of the reporting period.
c. Joint Repurchase Agreement
The Fund enters into a joint repurchase agreement whereby its uninvested cash balance is deposited into a joint cash account with other funds managed by the investment manager or an affiliate of the investment manager and is used to invest in one or more repurchase agreements. The value and face amount of the joint repurchase agreement are allocated to the funds based on their pro-rata interest. A repurchase agreement is accounted for as a loan by the Fund to the seller, collateralized by securities which are delivered to the Fund’s custodian. The fair value, including accrued interest, of the initial collateralization is required to be at least 102% of the dollar amount invested by the funds, with the value of the underlying securities marked to market daily to maintain coverage of at least 100%. Repurchase agreements are subject to the terms of Master Repurchase Agreements (MRAs) with approved counterparties (sellers). The MRAs contain various provisions, including but not limited to events of default and maintenance of collateral for repurchase agreements. In the event of default by either the seller or the Fund, certain MRAs may permit the non-defaulting party to net and close-out all transactions, if any, traded under such agreements. The Fund may sell securities it holds as collateral and apply the proceeds towards the repurchase price and any other amounts owed by the seller to the Fund in the event of default by the seller. This could involve costs or delays in addition to a loss on the securities if their value falls below the repurchase price owed by the seller. The joint repurchase agreement held by the Fund at year end, as indicated in the Statement of Investments, had been entered into on December 31, 2014.
d. Income and Deferred Taxes
It is the Fund’s policy to qualify as a regulated investment company under the Internal Revenue Code. The Fund intends to distribute to shareholders substantially all of its taxable income and net realized gains to relieve it from federal income and if applicable, excise taxes. As a result, no provision for U.S. federal income taxes is required.
The Fund may be subject to foreign taxation related to income received, capital gains on the sale of securities and certain foreign
FRANKLIN TEMPLETON VARIABLE INSURANCE PRODUCTS TRUST
NOTES TO FINANCIAL STATEMENTS
Franklin Large Cap Growth VIP Fund (continued)
1. Organization and Significant Accounting Policies (continued)
d. Income and Deferred Taxes (continued)
currency transactions in the foreign jurisdictions in which it invests. Foreign taxes, if any, are recorded based on the tax regulations and rates that exist in the foreign markets in which the Fund invests. When a capital gain tax is determined to apply the Fund records an estimated deferred tax liability in an amount that would be payable if the securities were disposed of on the valuation date.
The Fund recognizes the tax benefits of uncertain tax positions only when the position is “more likely than not” to be sustained upon examination by the tax authorities based on the technical merits of the tax position. As of December 31, 2014, and for all open tax years, the Fund has determined that no liability for unrecognized tax benefits is required in the Fund’s financial statements related to uncertain tax positions taken on a tax return (or expected to be taken on future tax returns). Open tax years are those that remain subject to examination and are based on each tax jurisdiction statute of limitation.
e. Security Transactions, Investment Income, Expenses and Distributions
Security transactions are accounted for on trade date. Realized gains and losses on security transactions are determined on a specific identification basis. Estimated expenses are accrued daily. Dividend income is recorded on the ex-dividend date except for certain foreign securities where the dividend rate is not available. In such cases, the dividend is recorded as soon as the information is received by the Fund. Distributions to shareholders are recorded on the ex-dividend date and are determined according to income tax regulations (tax basis). Distributable earnings determined on a tax basis may differ from earnings recorded in accordance with U.S. GAAP. These differences may be permanent or temporary. Permanent differences are
reclassified among capital accounts to reflect their tax character. These reclassifications have no impact on net assets or the results of operations. Temporary differences are not reclassified, as they may reverse in subsequent periods.
Common expenses incurred by the Trust are allocated among the funds based on the ratio of net assets of each fund to the combined net assets of the Trust. Fund specific expenses are charged directly to the fund that incurred the expense.
Realized and unrealized gains and losses and net investment income, not including class specific expenses, are allocated daily to each class of shares based upon the relative proportion of net assets of each class. Differences in per share distributions, by class, are generally due to differences in class specific expenses.
f. Accounting Estimates
The preparation of financial statements in accordance with U.S. GAAP requires management to make estimates and assumptions that affect the reported amounts of assets and liabilities at the date of the financial statements and the amounts of income and expenses during the reporting period. Actual results could differ from those estimates.
g. Guarantees and Indemnifications
Under the Trust’s organizational documents, its officers and trustees are indemnified by the Trust against certain liabilities arising out of the performance of their duties to the Trust. Additionally, in the normal course of business, the Trust, on behalf of the Fund, enters into contracts with service providers that contain general indemnification clauses. The Trust’s maximum exposure under these arrangements is unknown as this would involve future claims that may be made against the Trust that have not yet occurred. Currently, the Trust expects the risk of loss to be remote.
FRANKLIN TEMPLETON VARIABLE INSURANCE PRODUCTS TRUST
NOTES TO FINANCIAL STATEMENTS
Franklin Large Cap Growth VIP Fund (continued)
2. Shares of Beneficial Interest
At December 31, 2014, there were an unlimited number of shares authorized (without par value). Transactions in the Fund’s shares were as follows:
| | | | | | | | | | | | | | | | | | |
| | | Year Ended December 31, | |
| | | 2014 | | | | | 2013 | |
| | | Shares | | | Amount | | | | | Shares | | | Amount | |
| | | | | |
| Class 1 Shares: | | | | | | | | | | | | | | | | | | |
Shares sold | | | 23,998 | | | $ | 507,108 | | | | | | 49,133 | | | $ | 921,214 | |
Shares issued in reinvestment of distributions | | | 33,235 | | | | 729,509 | | | | | | 35,282 | | | | 652,010 | |
Shares redeemed | | | (290,268 | ) | | | (6,336,641 | ) | | | | | (333,854 | ) | | | (6,272,417 | ) |
| | | | |
Net increase (decrease) | | | (233,035 | ) | | $ | (5,100,024 | ) | | | | | (249,439 | ) | | $ | (4,699,193 | ) |
| | | | |
| Class 2 Shares: | | | | | | | | | | | | | | | | | | |
Shares sold | | | 570,172 | | | $ | 12,631,684 | | | | | | 1,055,133 | | | $ | 19,291,413 | |
Shares issued in reinvestment of distributions | | | 131,120 | | | | 2,842,675 | | | | | | 167,774 | | | | 3,061,884 | |
Shares redeemed | | | (3,381,155 | ) | | | (72,455,824 | ) | | | | | (4,595,616 | ) | | | (84,784,755 | ) |
| | | | |
Net increase (decrease) | | | (2,679,863 | ) | | $ | (56,981,465 | ) | | | | | (3,372,709 | ) | | $ | (62,431,458 | ) |
| | | | |
3. Transactions With Affiliates
Franklin Resources, Inc. is the holding company for various subsidiaries that together are referred to as Franklin Templeton Investments. Certain officers and trustees of the Fund are also officers and/or directors of the following subsidiaries:
| | |
| Subsidiary | | Affiliation |
Franklin Advisers, Inc. (Advisers) | | Investment manager |
Franklin Templeton Services, LLC (FT Services) | | Administrative manager |
Franklin Templeton Distributors, Inc. (Distributors) | | Principal underwriter |
Franklin Templeton Investor Services, LLC (Investor Services) | | Transfer agent |
a. Management Fees
The Fund pays an investment management fee to Advisers based on the average daily net assets of the Fund as follows:
| | |
| Annualized Fee Rate | | Net Assets |
0.750% | | Up to and including $500 million |
0.625% | | Over $500 million, up to and including $1 billion |
0.500% | | In excess of $1 billion |
b. Administrative Fees
Under an agreement with Advisers, FT Services provides administrative services to the Fund. The fee is paid by Advisers based on the Fund’s average daily net assets, and is not an additional expense of the Fund.
c. Distribution Fees
The Board has adopted a distribution plan for Class 2 shares pursuant to Rule 12b-1 under the 1940 Act. Under the Fund’s compensation distribution plan, the Fund pays Distributors for costs incurred in connection with the servicing, sale and distribution of the
FRANKLIN TEMPLETON VARIABLE INSURANCE PRODUCTS TRUST
NOTES TO FINANCIAL STATEMENTS
Franklin Large Cap Growth VIP Fund (continued)
3. Transactions With Affiliates (continued)
c. Distribution Fees (continued)
Fund’s shares up to 0.35% per year of its average daily net assets. Some distribution fees are not charged on shares held by affiliates. The Board has agreed to limit the current rate to 0.25% per year for Class 2. The plan year, for purposes of monitoring compliance with the maximum annual plan rate, is February 1 through January 31.
d. Transfer Agent Fees
Investor Services, under terms of an agreement, performs shareholder servicing for the Fund and is not paid by the Fund for the services.
4. Expense Offset Arrangement
The Fund has entered into an arrangement with its custodian whereby credits realized as a result of uninvested cash balances are used to reduce a portion of the Fund’s custodian expenses. During the year ended December 31, 2014, there were no credits earned.
5. Income Taxes
For tax purposes, capital losses may be carried over to offset future capital gains. Capital loss carryforwards with no expiration, if any, must be fully utilized before those losses with expiration dates. During the year ended December 31, 2014, the Fund utilized $25,412,541 of capital loss carryforwards.
The tax character of distributions paid during the years ended December 31, 2014 and 2013, was as follows:
| | | | | | | | |
| | | 2014 | | | 2013 | |
Distributions paid from ordinary income | | $ | 3,572,184 | | | $ | 3,713,894 | |
| | | | |
At December 31, 2014, the cost of investments, net unrealized appreciation (depreciation), undistributed ordinary income and undistributed long term capital gains for income tax purposes were as follows:
| | | | |
Cost of investments | | $ | 243,312,766 | |
| | | | |
Unrealized appreciation | | $ | 75,096,051 | |
Unrealized depreciation | | | (6,874,589 | ) |
| | | | |
Net unrealized appreciation (depreciation) | | $ | 68,221,462 | |
| | | | |
Undistributed ordinary income | | $ | 983,278 | |
Undistributed long term capital gains | | | 77,048,371 | |
| | | | |
Distributable earnings | | $ | 78,031,649 | |
| | | | |
Differences between income and/or capital gains as determined on a book basis and a tax basis are primarily due to differing treatment of wash sales.
6. Investment Transactions
Purchases and sales of investments (excluding short term securities) for the year ended December 31, 2014, aggregated $290,816,332 and $346,173,296, respectively.
FRANKLIN TEMPLETON VARIABLE INSURANCE PRODUCTS TRUST
NOTES TO FINANCIAL STATEMENTS
Franklin Large Cap Growth VIP Fund (continued)
7. Credit Facility
The Fund, together with other U.S. registered and foreign investment funds (collectively, Borrowers), managed by Franklin Templeton Investments, are borrowers in a joint syndicated senior unsecured credit facility totaling $1.5 billion (Global Credit Facility) which matured on February 13, 2015. This Global Credit Facility provides a source of funds to the Borrowers for temporary and emergency purposes, including the ability to meet future unanticipated or unusually large redemption requests. The Borrowers expect to renew the Global Credit Facility for a total of $2 billion effective February 13, 2015, which matures on February 12, 2016.
Under the terms of the Global Credit Facility, the Fund shall, in addition to interest charged on any borrowings made by the Fund and other costs incurred by the Fund, pay its share of fees and expenses incurred in connection with the implementation and maintenance of the Global Credit Facility, based upon its relative share of the aggregate net assets of all of the Borrowers, including an annual commitment fee of 0.07% based upon the unused portion of the Global Credit Facility. These fees are reflected in other expenses on the Statement of Operations. During the year ended December 31, 2014, the Fund did not use the Global Credit Facility.
8. Fair Value Measurements
The Fund follows a fair value hierarchy that distinguishes between market data obtained from independent sources (observable inputs) and the Fund’s own market assumptions (unobservable inputs). These inputs are used in determining the value of the Fund’s financial instruments and are summarized in the following fair value hierarchy:
| | • | | Level 1 – quoted prices in active markets for identical financial instruments |
| | • | | Level 2 – other significant observable inputs (including quoted prices for similar financial instruments, interest rates, prepayment speed, credit risk, etc.) |
| | • | | Level 3 – significant unobservable inputs (including the Fund’s own assumptions in determining the fair value of financial instruments) |
The input levels are not necessarily an indication of the risk or liquidity associated with financial instruments at that level.
For movements between the levels within the fair value hierarchy, the Fund has adopted a policy of recognizing the transfers as of the date of the underlying event which caused the movement.
A summary of inputs used as of December 31, 2014, in valuing the Fund’s assets carried at fair value, is as follows:
| | | | | | | | | | | | | | | | |
| | | Level 1 | | | Level 2 | | | Level 3 | | | Total | |
| | | | |
| Assets: | | | | | | | | | | | | | | | | |
Investments in Securities: | | | | | | | | | | | | | | | | |
Equity Investmentsa | | $ | 309,805,192 | | | $ | — | | | $ | — | | | $ | 309,805,192 | |
Short Term Investments | | | — | | | | 1,729,036 | | | | — | | | | 1,729,036 | |
| | | | |
Total Investments in Securities | | $ | 309,805,192 | | | $ | 1,729,036 | | | $ | — | | | $ | 311,534,228 | |
| | | | |
aFor detailed categories, see the accompanying Statement of Investments.
FRANKLIN TEMPLETON VARIABLE INSURANCE PRODUCTS TRUST
NOTES TO FINANCIAL STATEMENTS
Franklin Large Cap Growth VIP Fund (continued)
9. New Accounting Pronouncements
In June 2014, the Financial Accounting Standards Board issued Accounting Standards Update (ASU) No. 2014-11, Transfers and Servicing (Topic 860), Repurchase-to-Maturity Transactions, Repurchase Financings, and Disclosures. The ASU changes the accounting for certain repurchase agreements and expands disclosure requirements related to repurchase agreements, securities lending, repurchase-to-maturity and similar transactions. The ASU is effective for interim and annual reporting periods beginning after December 15, 2014. Management has reviewed the requirements and believes the adoption of this ASU will not have a material impact on the financial statements.
10. Subsequent Events
The Fund has evaluated subsequent events through the issuance of the financial statements and determined that no events have occurred that require disclosure other than those already disclosed in the financial statements.
Abbreviations
| | |
| Selected Portfolio |
| |
| ADR | | American Depositary Receipt |
FRANKLIN TEMPLETON VARIABLE INSURANCE PRODUCTS TRUST
Report of Independent Registered Public Accounting Firm
Franklin Large Cap Growth VIP Fund
To the Board of Trustees and Shareholders of Franklin Templeton Variable Insurance Products Trust
In our opinion, the accompanying statement of assets and liabilities, including the statement of investments, and the related statements of operations and of changes in net assets and the financial highlights present fairly, in all material respects, the financial position of Franklin Large Cap Growth VIP Fund (the “Fund”) at December 31, 2014, the results of its operations for the year then ended, the changes in its net assets for each of the two years in the period then ended and the financial highlights for each of the five years in the period then ended, in conformity with accounting principles generally accepted in the United States of America. These financial statements and financial highlights (hereafter referred to as “financial statements”) are the responsibility of the Fund’s management. Our responsibility is to express an opinion on these financial statements based on our audits. We conducted our audits of these financial statements in accordance with the standards of the Public Company Accounting Oversight Board (United States). Those standards require that we plan and perform the audit to obtain reasonable assurance about whether the financial statements are free of material misstatement. An audit includes examining, on a test basis, evidence supporting the amounts and disclosures in the financial statements, assessing the accounting principles used and significant estimates made by management, and evaluating the overall financial statement presentation. We believe that our audits, which included confirmation of securities at December 31, 2014 by correspondence with the custodian and brokers, provide a reasonable basis for our opinion.
PricewaterhouseCoopers LLP
San Francisco, California
February 13, 2015
FRANKLIN TEMPLETON VARIABLE INSURANCE PRODUCTS TRUST
Tax Information (unaudited)
Franklin Large Cap Growth VIP Fund
Under Section 854(b)(1)(A) of the Internal Revenue Code, the Fund hereby reports 92.17% of the ordinary income dividends as income qualifying for the dividends received deduction for the fiscal year ended December 31, 2014.
Franklin Mutual Global Discovery VIP Fund
(Formerly, Mutual Global Discovery Securities Fund)
This annual report for Franklin Mutual Global Discovery VIP Fund covers the fiscal year ended December 31, 2014.
Class 2 Performance Summary as of December 31, 2014
Average annual total return of Class 2 shares represents the average annual change in value, assuming reinvestment of dividends and capital gains. Average returns smooth out variations in returns, which can be significant; they are not the same as year-by-year results.
| | | | | | | | | | | | |
| Periods ended 12/31/14 | | 1-Year | | | 5-Year | | | 10-Year | |
Average Annual Total Return | | | +5.71% | | | | +10.69% | | | | +8.87% | |
Performance reflects the Fund’s Class 2 operating expenses, but does not include any contract fees, expenses or sales charges. If they had been included, performance would be lower. These charges and deductions, particularly for variable life policies, can have a significant effect on contract values and insurance benefits. See the contract prospectus for a complete description of these expenses, including sales charges.
Performance data represent past performance, which does not guarantee future results. Investment return and principal value will fluctuate, and you may have a gain or loss when you sell your shares. Current performance may differ from figures shown.
Total Return Index Comparison for a Hypothetical $10,000 Investment (1/1/05–12/31/14)
The graph below shows the change in value of a hypothetical $10,000 investment in the Fund over the indicated period and includes reinvestment of any income or distributions. The Fund’s performance is compared to the performance of the MSCI World Index and the Standard & Poor’s® 500 Index (S&P 500®). One cannot invest directly in an index, and an index is not representative of the Fund’s portfolio. Please see Important Notes to Performance Information preceding the Fund Summaries.
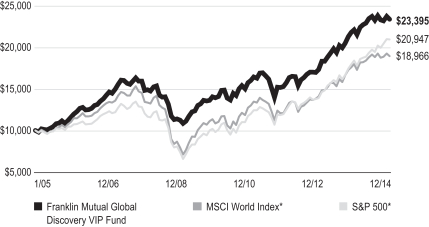
*Source: Morningstar. Please see Index Descriptions following the Fund Summaries.
FRANKLIN MUTUAL GLOBAL DISCOVERY VIP FUND
Fund Goal and Main Investments
Franklin Mutual Global Discovery VIP Fund seeks capital appreciation. Under normal market conditions, the Fund invests primarily in U.S. and foreign equity securities that the investment manager believes are undervalued.
Fund Risks
All investments involve risks, including possible loss of principal. Value securities may not increase in price as anticipated, or may decline further in value. The Fund’s investments in foreign securities involve certain risks including currency fluctuations, and economic and political uncertainties. Smaller company stocks have exhibited greater price volatility than larger company stocks, particularly over the short term. The Fund’s investments in companies engaged in mergers, reorganizations or liquidations also involve special risks as pending deals may not be completed on time or on favorable terms. The Fund may invest in lower rated bonds, which entail higher credit risk. The Fund is actively managed but there is no guarantee that the manager’s investment decisions will produce the desired results. The Fund’s prospectus also includes a description of the main investment risks.
Performance Overview
You can find the Fund’s one-year total return in the Performance Summary. In comparison, the Fund’s benchmark, the MSCI World Index, generated a +5.50% total return and the S&P 500 posted a +13.69% total return for the same period.1
Economic and Market Overview
The global economy grew moderately during the 12 months under review as U.S. economic growth expanded while growth rates in much of the rest of the world declined. As measured by the MSCI World Index, stocks in global developed markets advanced overall during the 12-month period amid a generally accommodative monetary policy environment and continued strength in corporate earnings.2 Oil prices declined sharply during the 12-month period, resulting from weak global demand growth and strong world supply, and gold prices ended lower amid benign global inflation and a strong U.S. dollar.
U.S. economic growth trends were generally encouraging during the period. Economic activity expanded for most of 2014, supported in some quarters by increased consumer spending, business
investment and federal defense spending. The U.S. Federal Reserve Board (Fed) began reducing its large-scale bond purchases $10 billion a month in January and ended the buying program in October. But it continued its practice of maintaining holdings of longer term securities at sizable levels. The Fed believed underlying economic strength could support ongoing progress in labor market conditions. Toward period-end, the Fed stated that it could be patient with regard to raising interest rates and that the interest rate might not rise for at least a couple of meetings, possibly implying at least the first two meetings of 2015.
Outside the U.S., the U.K. economy grew relatively well, supported by the services and manufacturing sectors. In the eurozone, economic growth remained subdued, as concerns persisted about the potential negative impacts to growth from the crisis in Ukraine and China’s moderating growth rate. However, third-quarter economic growth, though meager, exceeded expectations, especially in the region’s major economies of Germany and France. In June, the European Central Bank (ECB) reduced its main interest rate and, for the first time, set a negative deposit rate; the ECB reduced both rates again in September. The ECB broadened its monetary easing stance by implementing an asset purchase program to prevent deflation and stimulate the economy. Toward period-end, the ECB cut its 2014 growth forecast for the eurozone and attributed the reduction to geopolitical risks dampening confidence and private investment.
Japan’s second- and third-quarter economic contractions indicated the economy was in a recession. However, private consumption and exports improved in the third quarter. In October, the Bank of Japan expanded its stimulus measures amid weak domestic demand and as substantially lower crude oil prices exerted further downward pressure on inflation. Toward period-end, Japan’s ruling coalition was reelected in early parliamentary elections and subsequently announced a fresh stimulus package aimed at reviving economic growth.
In several emerging markets, economic growth generally moderated. However, Brazil exited recession as government spending prior to a presidential election drove third-quarter economic growth. Emerging market equities, as measured by the MSCI Emerging Markets Index, fell for the 12-month period, amid headwinds such as soft domestic demand and weak exports in several countries.2 Falling crude oil prices and geopolitical tensions in certain regions, as well as concerns about the timing of
1. Source: Morningstar.
One cannot invest directly in an index, and an index is not representative of the Fund’s portfolio. Please see Index Descriptions following the Fund Summaries.
2. Please see Index Descriptions following the Fund Summaries.
FRANKLIN MUTUAL GLOBAL DISCOVERY VIP FUND
U.S. interest rate increases, also pressured emerging market equities. Many emerging market currencies depreciated against the U.S. dollar, leading central banks in several countries to raise interest rates in an effort to curb inflation and support their currencies. Several other central banks lowered interest rates to promote economic growth. After implementing monetary stimulus measures to support specific sectors, China’s central bank increased its efforts to bolster the economy by cutting its benchmark interest rates for the first time since July 2012. In contrast, Russia’s central bank raised its key interest rate sharply toward period-end to limit further devaluation of the Russian ruble and contain rising inflation.
Investment Strategy
At Mutual Series, we are committed to our distinctive value approach to investing. Our major investment strategy is investing in undervalued stocks. When selecting undervalued equities, we are attracted to fundamentally strong companies with healthy balance sheets, high-quality assets, substantial free cash flow and shareholder-oriented management teams and whose stocks are trading at discounts to our assessment of the companies’ intrinsic or business value. We also look for asset rich companies whose shares may be trading at depressed levels due to concerns over short-term earnings disappointments, litigation, management strategy or other perceived negatives. While the vast majority of our undervalued equity investments are made in publicly traded companies globally, we may invest occasionally in privately held companies as well.
We complement this more traditional investment strategy with two others. One is distressed investing, which is complex and can take many forms. The most common distressed investment the Fund undertakes is the purchase of financially troubled or bankrupt companies’ debt at a substantial discount to face value. After the financially distressed company is reorganized, often in bankruptcy court, the old debt is typically replaced with new securities issued by the financially stronger company.
The other piece of our investment strategy is participating in arbitrage situations, another highly specialized field. When companies announce proposed mergers or takeovers, commonly referred to as “deals,” the target company may trade at a discount to the bid it ultimately accepts. One form of arbitrage involves purchasing the target company’s stock when it is trading below the value we believe it would receive in a deal. In keeping with our commitment to a relatively conservative investment approach, we typically focus our arbitrage efforts on
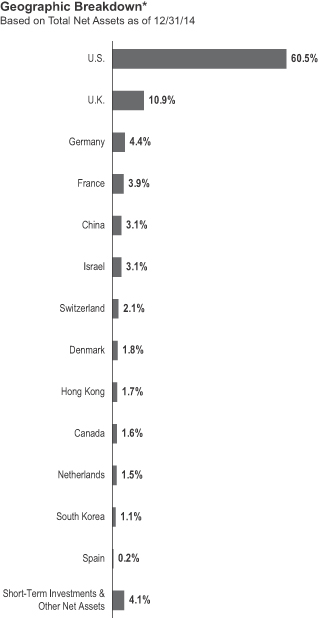
*Weightings may be negative or may not total 100% due to rounding, use of any derivatives, unsettled trades or other factors.
announced deals, and eschew rumored deals or other situations we consider relatively risky.
In addition, it is our practice to hedge the Fund’s currency exposure when we deem it advantageous for our shareholders.
FRANKLIN MUTUAL GLOBAL DISCOVERY VIP FUND
What is meant by “hedge”?
To hedge an investment is to take a position intended to offset potential losses/gains that may be incurred by a companion financial instrument.
| | | | |
| Top 10 Sectors/Industries | | | |
| Based on Equity Securities | | | |
| 12/31/14 | | | |
| | | % of Total
Net Assets | |
| Banks | | | 17.1% | |
| Insurance | | | 7.9% | |
| Oil, Gas & Consumable Fuels | | | 7.7% | |
| Pharmaceuticals | | | 6.8% | |
| Media | | | 6.3% | |
| Tobacco | | | 5.2% | |
| Software | | | 4.9% | |
| Food & Staples Retailing | | | 3.7% | |
| Health Care Equipment & Supplies | | | 3.5% | |
| Technology Hardware, Storage & Peripherals | | | 2.8% | |
Manager’s Discussion
Many Fund holdings increased in value during the 12-month period. Top contributors included technology leader Apple, Teva Pharmaceutical Industries and software company Microsoft.
During the year Apple reported consistently good quarterly results, driven by its strong iPhone business. In addition, the company announced a trio of shareholder friendly actions. These included an enhanced share repurchase program of $90 billion, up from $60 billion, with the same end date of December 2015, an 8% increase in the dividend, and a seven-for-one stock split that went into effect in early June. In September, the company released its highly anticipated iPhone 6, which sold 10 million units in its first two days. The iPhone sales drove a strong fiscal fourth quarter via healthy sales volumes and a strong product mix that led to a higher average selling price for the period. In October, the company refreshed its product line-up ahead of the holiday season, including launches of the new iPad Air 2, iPad Mini 3, iMac with Retina Display and an updated Mac Mini. Apple also announced the commencement of support for Apple Pay, its mobile payment and digital wallet application.
The performance of Israel-based Teva Pharmaceutical Industries was largely driven by positive events related to the company’s most profitable drug, Copaxone, used to prevent the relapse of multiple sclerosis. In March, the U.S. Supreme Court agreed to hear Teva’s appeal (with oral arguments occurring in
October) to maintain a patent, which further delayed the entrance of generic competition. The delay provided Teva the opportunity to convert more U.S. patients to its new formulation and allowed it to potentially retain a higher portion of the franchise once generic alternatives entered the market. In December, Teva received more good news regarding Copaxone with the new formulation gaining European Union approval. Investors also reacted favorably to the January 2014 announcement of a new chief executive officer (CEO) as the market believed he could successfully carry on Teva’s cost-cutting restructuring program.
Microsoft shares rose as the company named a new CEO in February. We viewed the hiring of Microsoft insider Satya Nadella as positive given his technical background and track record of reaching beyond Microsoft and embracing other technologies. A good example of Nadella’s openness was the March announcement that the company’s Office productivity suite would be made available for the Apple iPad. Nadella also announced a restructuring plan in July. The restructuring was intended to simplify the company’s operations and align the recently acquired Nokia Devices and Services business with the overall strategy.
During the period under review, some of the Fund’s investments negatively affected performance. These included retailer Metro, offshore drilling company Transocean and energy exploration and production firm Apache.
Upheaval in Ukraine and Russia’s involvement disrupted Germany-based retailer Metro’s planned partial initial public offering (IPO) of its Russia cash-and-carry business. The IPO was important as it would have provided a benchmark valuation for this important Metro operation and allowed Metro to fund growth and further reduce debt with the capital raised. Instead, the company sought to raise cash by selling other non-core assets, such as the September sale of its stake in U.K.-based Booker and its operations in Vietnam. As of year-end, we believed the market assigned little value to Metro’s Russian operations, despite the fact that the business continued to perform well amid deteriorating economic conditions within Russia. In our view, Metro stock has material upside potential should the situation in Ukraine be resolved and conditions in Russia improve in a reasonable time frame.
Transocean is a Switzerland-headquartered company providing offshore contract drilling services. The offshore drilling market continued to be mired in a downturn with little clarity regarding the length and depth of the current cycle as oil prices plunged during the second half of 2014. Oil companies pushed back projects, leaving a number of new rigs without contracts and increasing
FRANKLIN MUTUAL GLOBAL DISCOVERY VIP FUND
potential downtime between jobs for existing rigs. The growing fleet of uncontracted rigs at period-end portended, in our view, weak second-half results and a challenging start to 2015. On a positive note, the company started a Master Limited Partnership (MLP), Transocean Partners, which went public in September. The MLP may provide Transocean with a way to generate cash by selling (dropping down) assets into Transocean Partners while still controlling the operations of those assets.
Share prices of energy sector companies almost universally plunged during the second half of 2014, driven by a collapse in oil prices. The spot price of crude oil declined nearly 50% from its 2014 peak price in June. Apache was hit especially hard due to its current restructuring efforts. In early May, Apache took a significant step in its program of monetizing capital-intensive, long-lead-time assets, selling non-producing deepwater oil and gas projects in the Gulf of Mexico that were a drain on cash flow. However, during the second half of 2014, investors became concerned that Apache’s attempts to sell additional assets would be unsuccessful and failed asset sales would result in a weak balance sheet at a time of depressed commodity prices. In December, Apache sold its liquefied natural gas assets and some upstream Australian assets for $2.75 billion. In our view, the sales materially strengthened the company’s balance sheet and could result in reduced future capital requirements.
During the period, the Fund held currency forwards and futures to somewhat hedge the currency risk of the portfolio’s non-U.S. dollar investments. The hedges had a positive impact on the Fund’s performance during the period.
What is a currency forward contract?
A currency forward contract, or a currency forward, is an agreement between the Fund and a counterparty to buy or sell a foreign currency at a specific exchange rate on a future date.
What is a futures contract?
A futures contract, or a future, is an agreement between the Fund and a counterparty made through a U.S. or foreign futures exchange to buy or sell an asset at a specific price on a future date.
| | | | |
| Top 10 Equity Holdings | | | |
| 12/31/14 | | | |
Company
Sector/Industry, Country | | % of Total
Net Assets | |
Merck & Co. Inc. Pharmaceuticals, U.S. | | | 2.6% | |
Microsoft Corp. Software, U.S. | | | 2.5% | |
Medtronic Inc. Health Care Equipment & Supplies, U.S. | | | 2.5% | |
Wells Fargo & Co. Banks, U.S. | | | 2.3% | |
Royal Dutch Shell PLC, A Oil, Gas & Consumable Fuels, U.K. | | | 2.1% | |
Apple Inc. Technology Hardware, Storage & Peripherals, U.S. | | | 2.0% | |
Teva Pharmaceutical Industries Ltd., ADR Pharmaceuticals, Israel | | | 2.0% | |
American International Group Inc. Insurance, U.S. | | | 1.8% | |
A.P. Moeller-Maersk AS, B Marine, Denmark | | | 1.8% | |
ACE Ltd. Insurance, U.S. | | | 1.7% | |
The dollar value, number of shares or principal amount, and names of all portfolio holdings are listed in the Fund’s Statement of Investments.
Thank you for your participation in Franklin Mutual Global Discovery VIP Fund. We look forward to serving your future investment needs.
The foregoing information reflects our analysis, opinions and portfolio holdings as of December 31, 2014, the end of the reporting period. The way we implement our main investment strategies and the resulting portfolio holdings may change depending on factors such as market and economic conditions. These opinions may not be relied upon as investment advice or an offer for a particular security. The information is not a complete analysis of every aspect of any market, country, industry, security or the Fund. Statements of fact are from sources considered reliable, but the investment manager makes no representation or warranty as to their completeness or accuracy. Although historical performance is no guarantee of future results, these insights may help you understand our investment management philosophy.
FRANKLIN MUTUAL GLOBAL DISCOVERY VIP FUND
Class 2 Fund Expenses
As an investor in a variable insurance contract (Contract) that indirectly provides for investment in an underlying mutual fund, you can incur transaction and/or ongoing expenses at both the Fund level and the Contract level.
| • | | Transaction expenses can include sales charges (loads) on purchases, redemption fees, surrender fees, transfer fees and premium taxes. |
| • | | Ongoing expenses can include management fees, distribution and service (12b-1) fees, contract fees, annual maintenance fees, mortality and expense risk fees and other fees and expenses. All mutual funds and Contracts have some types of ongoing expenses. |
The expenses shown in the table are meant to highlight ongoing expenses at the Fund level only and do not include ongoing expenses at the Contract level, or transaction expenses at either the Fund or Contract level. While the Fund does not have transaction expenses, if the transaction and ongoing expenses at the Contract level were included, the expenses shown below would be higher. You should consult your Contract prospectus or disclosure document for more information.
The table shows Fund-level ongoing expenses and can help you understand these expenses and compare them with those of other mutual funds offered through the Contract. The table assumes a $1,000 investment held for the six months indicated. Please refer to the Fund prospectus for additional information on operating expenses.
Actual Fund Expenses
The first line (Actual) of the table provides actual account values and expenses. The “Ending Account Value” is derived from the Fund’s actual return, which includes the effect of ongoing Fund expenses, but does not include the effect of ongoing Contract expenses.
You can estimate the Fund-level expenses you incurred during the period by following these steps. Of course, your account value and expenses will differ from those in this illustration:
| 1. | Divide your account value by $1,000. |
If an account had an $8,600 value, then $8,600 ÷ $1,000 = 8.6.
| 2. | Multiply the result by the number under the heading “Fund-Level Expenses Incurred During Period.” |
If Fund-Level Expenses Incurred During Period were $7.50, then 8.6 × $7.50 = $64.50.
In this illustration, the estimated expenses incurred this period at the Fund level are $64.50.
Hypothetical Example for Comparison with Other Mutual Funds
Information in the second line (Hypothetical) of the table can help you compare ongoing expenses of the Fund with those of other mutual funds offered through the Contract. This information may not be used to estimate the actual ending account balance or expenses you incurred during the period. The hypothetical “Ending Account Value” is based on the Fund’s actual expense ratio and an assumed 5% annual rate of return before expenses, which does not represent the Fund’s actual return. The figure under the heading “Fund-Level Expenses Incurred During Period” shows the hypothetical expenses your account would have incurred under this scenario. You can compare this figure with the 5% hypothetical examples that appear in shareholder reports of other funds offered through a Contract.
| | | | | | | | | | | | |
| Class 2 | | Beginning Account Value 7/1/14 | | | Ending Account Value 12/31/14 | | | Fund-Level Expenses
Incurred During Period* 7/1/14–12/31/14 | |
Actual | | | $1,000 | | | | $ 985.90 | | | | $6.31 | |
Hypothetical (5% return before expenses) | | | $1,000 | | | | $1,018.85 | | | | $6.41 | |
*Expenses are calculated using the most recent six-month annualized expense ratio for the Fund’s Class 2 shares (1.26%), which does not include any ongoing expenses of the Contract for which the Fund is an investment option, multiplied by the average account value over the period, multiplied by 184/365 to reflect the one-half year period.
FRANKLIN TEMPLETON VARIABLE INSURANCE PRODUCTS TRUST
Financial Highlights
Franklin Mutual Global Discovery VIP Fund
| | | | | | | | | | | | | | | | | | | | |
| | | Year Ended December 31, | |
| | | 2014 | | | 2013 | | | 2012 | | | 2011 | | | 2010 | |
| Class 1 | | | | | | | | | | | | | | | | | | | | |
Per share operating performance
(for a share outstanding throughout the year) | | | | | | | | | | | | | | | | | | | | |
| | | | | |
Net asset value, beginning of year | | | $23.31 | | | | $20.55 | | | | $19.66 | | | | $21.16 | | | | $19.14 | |
| | | | |
| | | | | |
| Income from investment operationsa: | | | | | | | | | | | | | | | | | | | | |
| | | | | |
Net investment incomeb | | | 0.68 | c | | | 0.46 | | | | 0.43 | | | | 0.52 | | | | 0.38 | |
| | | | | |
Net realized and unrealized gains (losses) | | | 0.76 | | | | 5.03 | | | | 2.21 | | | | (1.09 | ) | | | 1.94 | |
| | | | |
Total from investment operations | | | 1.44 | | | | 5.49 | | | | 2.64 | | | | (0.57 | ) | | | 2.32 | |
| | | | |
| | | | | |
| Less distributions from: | | | | | | | | | | | | | | | | | | | | |
| | | | | |
Net investment income | | | (0.57 | ) | | | (0.58 | ) | | | (0.64 | ) | | | (0.50 | ) | | | (0.30 | ) |
| | | | | |
Net realized gains | | | (1.57 | ) | | | (2.15 | ) | | | (1.11 | ) | | | (0.43 | ) | | | — | |
| | | | |
Total distributions | | | (2.14 | ) | | | (2.73 | ) | | | (1.75 | ) | | | (0.93 | ) | | | (0.30 | ) |
| | | | |
Net asset value, end of year | | | $22.61 | | | | $23.31 | | | | $20.55 | | | | $19.66 | | | | $21.16 | |
| | | | |
| | | | | |
Total returnd | | | 5.98% | | | | 27.95% | | | | 13.63% | | | | (2.73)% | | | | 12.24% | |
| | | | | |
| Ratios to average net assets | | | | | | | | | | | | | | | | | | | | |
| | | | | |
Expensese | | | 1.00% | f | | | 0.97% | f | | | 0.99% | | | | 0.97% | f | | | 1.00% | f |
| | | | | |
Expenses incurred in connection with securities sold short | | | 0.03% | | | | —% | g | | | —% | g | | | —% | g | | | 0.02% | |
| | | | | |
Net investment income | | | 2.85% | c | | | 2.13% | | | | 2.12% | | | | 2.34% | | | | 1.93% | |
| | | | | |
| Supplemental data | | | | | | | | | | | | | | | | | | | | |
| | | | | |
Net assets, end of year (000’s) | | | $2,313 | | | | $2,465 | | | | $1,136 | | | | $974 | | | | $84,213 | |
| | | | | |
Portfolio turnover rate | | | 22.18% | | | | 15.58% | | | | 25.63% | | | | 26.17% | h | | | 49.31% | |
aThe amount shown for a share outstanding throughout the period may not correlate with the Statement of Operations for the period due to the timing of sales and repurchases of the Fund shares in relation to income earned and/or fluctuating fair value of the investments of the Fund.
bBased on average daily shares outstanding.
cNet investment income per share includes approximately $0.34 per share received in the form of special dividends paid in connection with certain Fund’s holdings. Excluding these amounts, the ratio of net investment income to average net assets would have been 1.40%.
dTotal return does not include fees, charges or expenses imposed by the variable annuity and life insurance contracts for which the Franklin Templeton Variable Insurance Products Trust serves as an underlying investment vehicle.
eIncludes dividend or interest expense on securities sold short and security borrowing fees, if any. See below for the ratios of such expenses to average net assets for the periods presented. See Note 1(e).
fBenefit of expense reduction rounds to less than 0.01%.
gRounds to less than 0.01%.
hExcludes the value of portfolio securities delivered as a result of a redemption in-kind.
| | | | | | |
| | | The accompanying notes are an integral part of these financial statements. | Annual Report | | | MGD-7 | |
FRANKLIN TEMPLETON VARIABLE INSURANCE PRODUCTS TRUST
FINANCIAL HIGHLIGHTS
Franklin Mutual Global Discovery VIP Fund (continued)
| | | | | | | | | | | | | | | | | | | | |
| | | Year Ended December 31, | |
| | | 2014 | | | 2013 | | | 2012 | | | 2011 | | | 2010 | |
| Class 2 | | | | | | | | | | | | | | | | | | | | |
Per share operating performance
(for a share outstanding throughout the year) | | | | | | | | | | | | | | | | | | | | |
| | | | | |
Net asset value, beginning of year | | | $22.84 | | | | $20.17 | | | | $19.30 | | | | $20.80 | | | | $18.81 | |
| | | | |
| | | | | |
| Income from investment operationsa: | | | | | | | | | | | | | | | | | | | | |
| | | | | |
Net investment incomeb | | | 0.60 | c | | | 0.42 | | | | 0.38 | | | | 0.43 | | | | 0.33 | |
| | | | | |
Net realized and unrealized gains (losses) | | | 0.75 | | | | 4.92 | | | | 2.15 | | | | (1.04 | ) | | | 1.91 | |
| | | | |
Total from investment operations | | | 1.35 | | | | 5.34 | | | | 2.53 | | | | (0.61 | ) | | | 2.24 | |
| | | | |
| | | | | |
| Less distributions from: | | | | | | | | | | | | | | | | | | | | |
| | | | | |
Net investment income | | | (0.51 | ) | | | (0.52 | ) | | | (0.55 | ) | | | (0.46 | ) | | | (0.25 | ) |
| | | | | |
Net realized gains | | | (1.57 | ) | | | (2.15 | ) | | | (1.11 | ) | | | (0.43 | ) | | | — | |
| | | | |
Total distributions | | | (2.08 | ) | | | (2.67 | ) | | | (1.66 | ) | | | (0.89 | ) | | | (0.25 | ) |
| | | | |
Net asset value, end of year | | | $22.11 | | | | $22.84 | | | | $20.17 | | | | $19.30 | | | | $20.80 | |
| | | | |
| | | | | |
Total returnd | | | 5.71% | | | | 27.61% | | | | 13.36% | | | | (2.96)% | | | | 11.96% | |
| | | | | |
| Ratios to average net assets | | | | | | | | | | | | | | | | | | | | |
| | | | | |
Expensese | | | 1.25% | f | | | 1.22% | f | | | 1.24% | | | | 1.22% | f | | | 1.25% | f |
| | | | | |
Expenses incurred in connection with securities sold short | | | 0.03% | | | | —% | g | | | —% | g | | | —% | g | | | 0.02% | |
| | | | | |
Net investment income | | | 2.60% | c | | | 1.88% | | | | 1.87% | | | | 2.09% | | | | 1.68% | |
| | | | | |
| Supplemental data | | | | | | | | | | | | | | | | | | | | |
| | | | | |
Net assets, end of year (000’s) | | | $685,711 | | | | $684,780 | | | | $660,465 | | | | $712,161 | | | | $1,351,223 | |
| | | | | |
Portfolio turnover rate | | | 22.18% | | | | 15.58% | | | | 25.63% | | | | 26.17% | h | | | 49.31% | |
aThe amount shown for a share outstanding throughout the period may not correlate with the Statement of Operations for the period due to the timing of sales and repurchases of the Fund shares in relation to income earned and/or fluctuating fair value of the investments of the Fund.
bBased on average daily shares outstanding.
cNet investment income per share includes approximately $0.34 per share received in the form of special dividends paid in connection with certain Fund’s holdings. Excluding these amounts, the ratio of net investment income to average net assets would have been 1.15%.
dTotal return does not include fees, charges or expenses imposed by the variable annuity and life insurance contracts for which the Franklin Templeton Variable Insurance Products Trust serves as an underlying investment vehicle.
eIncludes dividend or interest expense on securities sold short and security borrowing fees, if any. See below for the ratios of such expenses to average net assets for the periods presented. See Note 1(e).
fBenefit of expense reduction rounds to less than 0.01%.
gRounds to less than 0.01%.
hExcludes the value of portfolio securities delivered as a result of a redemption in-kind.
| | | | |
| MGD-8 | | Annual Report | The accompanying notes are an integral part of these financial statements. | | |
FRANKLIN TEMPLETON VARIABLE INSURANCE PRODUCTS TRUST
FINANCIAL HIGHLIGHTS
Franklin Mutual Global Discovery VIP Fund (continued)
| | | | | | | | | | | | | | | | | | | | |
| | | Year Ended December 31, | |
| | | 2014 | | | 2013 | | | 2012 | | | 2011 | | | 2010 | |
| Class 4 | | | | | | | | | | | | | | | | | | | | |
Per share operating performance
(for a share outstanding throughout the year) | | | | | | | | | | | | | | | | | | | | |
| | | | | |
Net asset value, beginning of year | | | $23.10 | | | | $20.38 | | | | $19.50 | | | | $21.02 | | | | $19.02 | |
| | | | |
| | | | | |
| Income from investment operationsa: | | | | | | | | | | | | | | | | | | | | |
| | | | | |
Net investment incomeb | | | 0.61 | c | | | 0.40 | | | | 0.36 | | | | 0.40 | | | | 0.31 | |
| | | | | |
Net realized and unrealized gains (losses) | | | 0.73 | | | | 4.97 | | | | 2.19 | | | | (1.05 | ) | | | 1.94 | |
| | | | |
Total from investment operations | | | 1.34 | | | | 5.37 | | | | 2.55 | | | | (0.65 | ) | | | 2.25 | |
| | | | |
| | | | | |
| Less distributions from: | | | | | | | | | | | | | | | | | | | | |
| | | | | |
Net investment income | | | (0.48 | ) | | | (0.50 | ) | | | (0.56 | ) | | | (0.44 | ) | | | (0.25 | ) |
| | | | | |
Net realized gains | | | (1.57 | ) | | | (2.15 | ) | | | (1.11 | ) | | | (0.43 | ) | | | — | |
| | | | |
Total distributions | | | (2.05 | ) | | | (2.65 | ) | | | (1.67 | ) | | | (0.87 | ) | | | (0.25 | ) |
| | | | |
Net asset value, end of year | | | $22.39 | | | | $23.10 | | | | $20.38 | | | | $19.50 | | | | $21.02 | |
| | | | |
| | | | | |
Total returnd | | | 5.60% | | | | 27.52% | | | | 13.27% | | | | (3.08)% | | | | 11.87% | |
| | | | | |
| Ratios to average net assets | | | | | | | | | | | | | | | | | | | | |
| | | | | |
Expensese | | | 1.35% | f | | | 1.32% | f | | | 1.34% | | | | 1.32% | f | | | 1.35% | f |
| | | | | |
Expenses incurred in connection with securities sold short | | | 0.03% | | | | —% | g | | | —% | g | | | —% | g | | | 0.02% | |
| | | | | |
Net investment income | | | 2.50% | c | | | 1.78% | | | | 1.77% | | | | 1.99% | | | | 1.58% | |
| | | | | |
| Supplemental data | | | | | | | | | | | | | | | | | | | | |
| | | | | |
Net assets, end of year (000’s) | | | $59,961 | | | | $70,354 | | | | $62,346 | | | | $66,695 | | | | $70,613 | |
| | | | | |
Portfolio turnover rate | | | 22.18% | | | | 15.58% | | | | 25.63% | | | | 26.17% | h | | | 49.31% | |
aThe amount shown for a share outstanding throughout the period may not correlate with the Statement of Operations for the period due to the timing of sales and repurchases of the Fund shares in relation to income earned and/or fluctuating fair value of the investments of the Fund.
bBased on average daily shares outstanding.
cNet investment income per share includes approximately $0.34 per share received in the form of special dividends paid in connection with certain Fund’s holdings. Excluding these amounts, the ratio of net investment income to average net assets would have been 1.05%.
dTotal return does not include fees, charges or expenses imposed by the variable annuity and life insurance contracts for which the Franklin Templeton Variable Insurance Products Trust serves as an underlying investment vehicle.
eIncludes dividend or interest expense on securities sold short and security borrowing fees, if any. See below for the ratios of such expenses to average net assets for the periods presented. See Note 1(e).
fBenefit of expense reduction rounds to less than 0.01%.
gRounds to less than 0.01%.
hExcludes the value of portfolio securities delivered as a result of a redemption in-kind.
| | | | | | |
| | | The accompanying notes are an integral part of these financial statements. | Annual Report | | | MGD-9 | |
FRANKLIN TEMPLETON VARIABLE INSURANCE PRODUCTS TRUST
Statement of Investments, December 31, 2014
| | | | | | | | | | | | | | |
| Franklin Mutual Global Discovery VIP Fund | | | | | | | |
| | | | | Country | | | Shares/
Rights/Units | | | Value | |
| | Common Stocks and Other Equity Interests 90.2% | | | | | | | | | | | | |
| | Aerospace & Defense 1.2% | | | | | | | | | | | | |
| a | | B/E Aerospace Inc. | | | United States | | | | 65,840 | | | $ | 3,820,037 | |
| a | | KLX Inc. | | | United States | | | | 32,920 | | | | 1,357,950 | |
| | Safran SA | | | France | | | | 59,465 | | | | 3,687,574 | |
| | | | | | | | | | | | | | |
| | | | | | | | | | | | | 8,865,561 | |
| | | | | | | | | | | | | | |
| | Auto Components 0.8% | | | | | | | | | | | | |
| | Cie Generale des Etablissements Michelin, B | | | France | | | | 30,800 | | | | 2,805,162 | |
| a,b | | International Automotive Components Group Brazil LLC | | | Brazil | | | | 424,073 | | | | 40,109 | |
| a,b,c | | International Automotive Components Group North America LLC | | | United States | | | | 4,052,916 | | | | 3,068,787 | |
| | | | | | | | | | | | | | |
| | | | | | | | | | | | | 5,914,058 | |
| | | | | | | | | | | | | | |
| | Automobiles 1.4% | | | | | | | | | | | | |
| | General Motors Co. | | | United States | | | | 214,110 | | | | 7,474,580 | |
| | Hyundai Motor Co. | | | South Korea | | | | 20,953 | | | | 3,237,508 | |
| | | | | | | | | | | | | | |
| | | | | | | | | | | | | 10,712,088 | |
| | | | | | | | | | | | | | |
| | Banks 17.1% | | | | | | | | | | | | |
| | Barclays PLC | | | United Kingdom | | | | 2,052,511 | | | | 7,790,171 | |
| | BNP Paribas SA | | | France | | | | 117,870 | | | | 7,025,594 | |
| a | | Capital Bank Financial Corp., A | | | United States | | | | 78,494 | | | | 2,103,639 | |
| a,d | | Capital Bank Financial Corp., B, 144A, non-voting | | | United States | | | | 269,922 | | | | 7,233,910 | |
| | CIT Group Inc. | | | United States | | | | 108,462 | | | | 5,187,737 | |
| | Citigroup Inc. | | | United States | | | | 229,050 | | | | 12,393,895 | |
| | Citizens Financial Group Inc. | | | United States | | | | 90,486 | | | | 2,249,482 | |
| a | | Commerzbank AG | | | Germany | | | | 598,393 | | | | 7,950,130 | |
| | HSBC Holdings PLC | | | United Kingdom | | | | 586,355 | | | | 5,562,309 | |
| | Industrial and Commercial Bank of China Ltd., H | | | China | | | | 9,380,679 | | | | 6,847,432 | |
| a | | ING Groep NV, IDR | | | Netherlands | | | | 756,040 | | | | 9,907,375 | |
| | JPMorgan Chase & Co. | | | United States | | | | 131,280 | | | | 8,215,502 | |
| | KB Financial Group Inc. | | | South Korea | | | | 85,560 | | | | 2,827,854 | |
| | PNC Financial Services Group Inc. | | | United States | | | | 112,821 | | | | 10,292,660 | |
| a | | Seacoast Banking Corp. of Florida | | | United States | | | | 398,000 | | | | 5,472,500 | |
| | Societe Generale SA | | | France | | | | 118,614 | | | | 5,021,868 | |
| | SunTrust Banks Inc. | | | United States | | | | 111,578 | | | | 4,675,118 | |
| | Wells Fargo & Co. | | | United States | | | | 307,140 | | | | 16,837,415 | |
| | | | | | | | | | | | | | |
| | | | | | | | | | | | | 127,594,591 | |
| | | | | | | | | | | | | | |
| | Beverages 1.3% | | | | | | | | | | | | |
| | Coca-Cola Enterprises Inc. | | | United States | | | | 19,931 | | | | 881,349 | |
| | PepsiCo Inc. | | | United States | | | | 90,367 | | | | 8,545,103 | |
| | | | | | | | | | | | | | |
| | | | | | | | | | | | | 9,426,452 | |
| | | | | | | | | | | | | | |
| | Capital Markets 0.6% | | | | | | | | | | | | |
| | Credit Suisse Group AG | | | Switzerland | | | | 171,112 | | | | 4,316,525 | |
| | | | | | | | | | | | | | |
| | Communications Equipment 1.3% | | | | | | | | | | | | |
| | Cisco Systems Inc. | | | United States | | | | 359,180 | | | | 9,990,592 | |
| | | | | | | | | | | | | | |
| | Consumer Finance 0.5% | | | | | | | | | | | | |
| a | | Ally Financial Inc. | | | United States | | | | 151,600 | | | | 3,580,792 | |
| | | | | | | | | | | | | | |
| | Diversified Consumer Services 0.1% | | | | | | | | | | | | |
| | Cengage Learning Holdings II LP | | | United States | | | | 22,762 | | | | 512,145 | |
| | | | | | | | | | | | | | |
FRANKLIN TEMPLETON VARIABLE INSURANCE PRODUCTS TRUST
STATEMENT OF INVESTMENTS
Franklin Mutual Global Discovery VIP Fund (continued)
| | | | | | | | | | | | | | |
| | | | | Country | | | Shares/
Rights/Units | | | Value | |
| | Common Stocks and Other Equity Interests (continued) | | | | | | | | | |
| | Diversified Telecommunication Services 0.0% | | | | | | | | | | | | |
| a,e,f | | Global Crossing Holdings Ltd., Contingent Distribution | | | United States | | | | 2,236,777 | | | $ | — | |
| | | | | | | | | | | | | | |
| | Energy Equipment & Services 1.5% | | | | | | | | | | | | |
| | Baker Hughes Inc. | | | United States | | | | 141,757 | | | | 7,948,315 | |
| | Ensco PLC, A | | | United States | | | | 42,249 | | | | 1,265,358 | |
| g | | Transocean Ltd. | | | United States | | | | 120,473 | | | | 2,208,270 | |
| | | | | | | | | | | | | | |
| | | | | | | | | | | | | 11,421,943 | |
| | | | | | | | | | | | | | |
| | Food & Staples Retailing 3.7% | | | | | | | | | | | | |
| | CVS Health Corp. | | | United States | | | | 46,236 | | | | 4,452,989 | |
| | Empire Co. Ltd., A | | | Canada | | | | 72,193 | | | | 5,447,191 | |
| | Metro AG | | | Germany | | | | 318,004 | | | | 9,738,904 | |
| | Walgreens Boots Alliance Inc. | | | United States | | | | 102,904 | | | | 7,841,285 | |
| | | | | | | | | | | | | | |
| | | | | | | | | | | | | 27,480,369 | |
| | | | | | | | | | | | | | |
| | Health Care Equipment & Supplies 3.5% | | | | | | | | | | | | |
| | Medtronic Inc. | | | United States | | | | 257,980 | | | | 18,626,156 | |
| | Stryker Corp. | | | United States | | | | 83,662 | | | | 7,891,836 | |
| | | | | | | | | | | | | | |
| | | | | | | | | | | | | 26,517,992 | |
| | | | | | | | | | | | | | |
| | Health Care Providers & Services 0.9% | | | | | | | | | | | | |
| | Cigna Corp. | | | United States | | | | 63,106 | | | | 6,494,238 | |
| | | | | | | | | | | | | | |
| | Hotels, Restaurants & Leisure 1.4% | | | | | | | | | | | | |
| | Accor SA | | | France | | | | 233,913 | | | | 10,568,517 | |
| | | | | | | | | | | | | | |
| | Independent Power & Renewable Electricity Producers 1.1% | | | | | | | | | | | | |
| | NRG Energy Inc. | | | United States | | | | 299,277 | | | | 8,065,515 | |
| | | | | | | | | | | | | | |
| | Industrial Conglomerates 2.0% | | | | | | | | | | | | |
| | Jardine Strategic Holdings Ltd. | | | Hong Kong | | | | 371,698 | | | | 12,712,072 | |
| | Koninklijke Philips NV | | | Netherlands | | | | 51,504 | | | | 1,505,024 | |
| | Siemens AG | | | Germany | | | | 3,785 | | | | 429,361 | |
| | | | | | | | | | | | | | |
| | | | | | | | | | | | | 14,646,457 | |
| | | | | | | | | | | | | | |
| | Insurance 7.9% | | | | | | | | | | | | |
| | ACE Ltd. | | | United States | | | | 112,290 | | | | 12,899,875 | |
| a | | Alleghany Corp. | | | United States | | | | 2,730 | | | | 1,265,355 | |
| | The Allstate Corp. | | | United States | | | | 104,847 | | | | 7,365,502 | |
| | American International Group Inc. | | | United States | | | | 243,553 | | | | 13,641,404 | |
| | China Pacific Insurance (Group) Co. Ltd., H | | | China | | | | 998,479 | | | | 5,041,360 | |
| | E-L Financial Corp. Ltd. | | | Canada | | | | 5,378 | | | | 3,189,171 | |
| | MetLife Inc. | | | United States | | | | 63,096 | | | | 3,412,863 | |
| a,b | | Olympus Re Holdings Ltd. | | | United States | | | | 2,140 | | | | — | |
| | PartnerRe Ltd. | | | United States | | | | 58,470 | | | | 6,673,181 | |
| | PICC Property and Casualty Co. Ltd., H | | | China | | | | 180,838 | | | | 351,696 | |
| | Zurich Insurance Group AG | | | Switzerland | | | | 17,558 | | | | 5,504,756 | |
| | | | | | | | | | | | | | |
| | | | | | | | | | | | | 59,345,163 | |
| | | | | | | | | | | | | | |
| | IT Services 1.1% | | | | | | | | | | | | |
| | Xerox Corp. | | | United States | | | | 612,817 | | | | 8,493,644 | |
| | | | | | | | | | | | | | |
| | Marine 1.8% | | | | | | | | | | | | |
| | A.P. Moeller-Maersk AS, B | | | Denmark | | | | 6,595 | | | | 13,254,505 | |
| | | | | | | | | | | | | | |
FRANKLIN TEMPLETON VARIABLE INSURANCE PRODUCTS TRUST
STATEMENT OF INVESTMENTS
Franklin Mutual Global Discovery VIP Fund (continued)
| | | | | | | | | | | | | | |
| | | | | Country | | | Shares/
Rights/Units | | | Value | |
| | Common Stocks and Other Equity Interests (continued) | | | | | | | | | |
| | Media 6.3% | | | | | | | | | | | | |
| | CBS Corp., B | | | United States | | | | 91,632 | | | $ | 5,070,915 | |
| | Comcast Corp., Special A | | | United States | | | | 48,623 | | | | 2,798,983 | |
| a | | DIRECTV | | | United States | | | | 111,180 | | | | 9,639,306 | |
| | Reed Elsevier PLC | | | United Kingdom | | | | 229,978 | | | | 3,943,134 | |
| | Time Warner Cable Inc. | | | United States | | | | 62,129 | | | | 9,447,336 | |
| | Time Warner Inc. | | | United States | | | | 66,132 | | | | 5,648,995 | |
| a | | Tribune Media Co., A | | | United States | | | | 37,010 | | | | 2,212,088 | |
| a | | Tribune Media Co., B | | | United States | | | | 26,867 | | | | 1,605,840 | |
| | Tribune Publishing Co. | | | United States | | | | 17,670 | | | | 404,643 | |
| | Twenty-First Century Fox Inc., B | | | United States | | | | 170,160 | | | | 6,277,202 | |
| | | | | | | | | | | | | | |
| | | | | | | | | | | | | 47,048,442 | |
| | | | | | | | | | | | | | |
| | Metals & Mining 2.0% | | | | | | | | | | | | |
| | Anglo American PLC | | | United Kingdom | | | | 151,808 | | | | 2,840,660 | |
| | Freeport-McMoRan Inc., B | | | United States | | | | 135,280 | | | | 3,160,141 | |
| a | | ThyssenKrupp AG | | | Germany | | | | 344,296 | | | | 8,856,877 | |
| | | | | | | | | | | | | | |
| | | | | | | | | | | | | 14,857,678 | |
| | | | | | | | | | | | | | |
| | Multiline Retail 0.4% | | | | | | | | | | | | |
| | Kohl’s Corp. | | | United States | | | | 55,561 | | | | 3,391,443 | |
| | | | | | | | | | | | | | |
| | Oil, Gas & Consumable Fuels 7.7% | | | | | | | | | | | | |
| | Anadarko Petroleum Corp. | | | United States | | | | 41,180 | | | | 3,397,350 | |
| | Apache Corp. | | | United States | | | | 149,500 | | | | 9,369,165 | |
| | BG Group PLC | | | United Kingdom | | | | 224,778 | | | | 3,030,626 | |
| | BP PLC | | | United Kingdom | | | | 1,028,014 | | | | 6,585,722 | |
| | China Shenhua Energy Co. Ltd., H | | | China | | | | 2,009,534 | | | | 5,934,824 | |
| | CONSOL Energy Inc. | | | United States | | | | 114,311 | | | | 3,864,855 | |
| | Marathon Oil Corp. | | | United States | | | | 178,885 | | | | 5,060,657 | |
| | Repsol SA | | | Spain | | | | 65,116 | | | | 1,224,796 | |
| | Repsol SA (interim line) | | | Spain | | | | 1,915 | | | | 36,020 | |
| a | | Repsol SA, rts., 1/08/15 | | | Spain | | | | 6 | | | | 3 | |
| | Royal Dutch Shell PLC, A | | | United Kingdom | | | | 469,862 | | | | 15,725,623 | |
| | Talisman Energy Inc. | | | Canada | | | | 428,960 | | | | 3,358,757 | |
| | | | | | | | | | | | | | |
| | | | | | | | | | | | | 57,588,398 | |
| | | | | | | | | | | | | | |
| | Paper & Forest Products 0.2% | | | | | | | | | | | | |
| | NewPage Holdings Inc. | | | United States | | | | 19,416 | | | | 1,762,002 | |
| | | | | | | | | | | | | | |
| | Personal Products 0.4% | | | | | | | | | | | | |
| | Avon Products Inc. | | | United States | | | | 311,441 | | | | 2,924,431 | |
| | | | | | | | | | | | | | |
| | Pharmaceuticals 6.8% | | | | | | | | | | | | |
| | Eli Lilly & Co. | | | United States | | | | 122,317 | | | | 8,438,650 | |
| a | | Hospira Inc. | | | United States | | | | 44,053 | | | | 2,698,246 | |
| | Merck & Co. Inc. | | | United States | | | | 346,558 | | | | 19,681,029 | |
| | Novartis AG, ADR | | | Switzerland | | | | 60,628 | | | | 5,617,791 | |
| | Teva Pharmaceutical Industries Ltd., ADR | | | Israel | | | | 257,877 | | | | 14,830,506 | |
| | | | | | | | | | | | | | |
| | | | | | | | | | | | | 51,266,222 | |
| | | | | | | | | | | | | | |
| | Real Estate Management & Development 1.0% | | | | | | | | | | | | |
| f | | Canary Wharf Group PLC | | | United Kingdom | | | | 487,324 | | | | 4,108,670 | |
| | Dalian Wanda Commercial Properties Co. Ltd., H | | | China | | | | 482,100 | | | | 3,068,325 | |
| | | | | | | | | | | | | | |
| | | | | | | | | | | | | 7,176,995 | |
| | | | | | | | | | | | | | |
FRANKLIN TEMPLETON VARIABLE INSURANCE PRODUCTS TRUST
STATEMENT OF INVESTMENTS
Franklin Mutual Global Discovery VIP Fund (continued)
| | | | | | | | | | | | | | |
| | | | | Country | | | Shares/
Rights/Units | | | Value | |
| | Common Stocks and Other Equity Interests (continued) | | | | | | | | | |
| | Road & Rail 0.3% | | | | | | | | | | | | |
| a | | CAR Inc. | | | China | | | | 1,626,783 | | | $ | 2,190,318 | |
| | | | | | | | | | | | | | |
| | Semiconductors & Semiconductor Equipment 0.3% | | | | | | | | | | | | |
| a | | SK Hynix Semiconductor Inc. | | | South Korea | | | | 53,632 | | | | 2,341,398 | |
| | | | | | | | | | | | | | |
| | Software 4.9% | | | | | | | | | | | | |
| a | | Check Point Software Technologies Ltd. | | | Israel | | | | 106,122 | | | | 8,338,005 | |
| | Microsoft Corp. | | | United States | | | | 406,422 | | | | 18,878,302 | |
| | Symantec Corp. | | | United States | | | | 364,800 | | | | 9,358,944 | |
| | | | | | | | | | | | | | |
| | | | | | | | | | | | | 36,575,251 | |
| | | | | | | | | | | | | | |
| | Specialty Retail 1.0% | | | | | | | | | | | | |
| | Kingfisher PLC | | | United Kingdom | | | | 1,354,320 | | | | 7,187,882 | |
| | | | | | | | | | | | | | |
| | Technology Hardware, Storage & Peripherals 2.8% | | | | | | | | | | | | |
| | Apple Inc. | | | United States | | | | 138,547 | | | | 15,292,818 | |
| | Hewlett-Packard Co. | | | United States | | | | 146,350 | | | | 5,873,025 | |
| | | | | | | | | | | | | | |
| | | | | | | | | | | | | 21,165,843 | |
| | | | | | | | | | | | | | |
| | Tobacco 5.2% | | | | | | | | | | | | |
| | Altria Group Inc. | | | United States | | | | 176,234 | | | | 8,683,049 | |
| | British American Tobacco PLC | | | United Kingdom | | | | 220,778 | | | | 12,044,433 | |
| | Lorillard Inc. | | | United States | | | | 197,019 | | | | 12,400,376 | |
| | Philip Morris International Inc. | | | United States | | | | 75,124 | | | | 6,118,850 | |
| | | | | | | | | | | | | | |
| | | | | | | | | | | | | 39,246,708 | |
| | | | | | | | | | | | | | |
| | Wireless Telecommunication Services 1.7% | | | | | | | | | | | | |
| | Vodafone Group PLC | | | United Kingdom | | | | 3,618,505 | | | | 12,557,824 | |
| | | | | | | | | | | | | | |
| | | | |
| | Total Common Stocks and Other Equity Interests
(Cost $499,445,334) | | | | | | | | | | | 674,481,982 | |
| | | | | | | | | | | | | | |
| | Preferred Stocks 1.4% | | | | | | | | | | | | |
| | Automobiles 0.8% | | | | | | | | | | | | |
| | Volkswagen AG, pfd. | | | Germany | | | | 26,396 | | | | 5,897,566 | |
| | | | | | | | | | | | | | |
| | Diversified Financial Services 0.6% | | | | | | | | | | | | |
| a,b | | Hightower Holding LLC, pfd., A, Series 2 | | | United States | | | | 2,172,000 | | | | 5,052,941 | |
| | | | | | | | | | | | | | |
| | | | |
| | Total Preferred Stocks (Cost $10,942,486) | | | | | | | | | | | 10,950,507 | |
| | | | | | | | | | | | | | |
| | | | |
| | | | | | | | Principal Amount* | | | | |
| | Corporate Bonds, Notes and Senior Floating Rate Interests 2.9% | | | | | | | | | | | | |
| d | | Avaya Inc., senior note, 144A, 10.50%, 3/01/21 | | | United States | | | | 609,000 | | | | 523,740 | |
| h,i | | Caesars Entertainment Operating Co. Inc., Senior Tranche, first lien, B7, 9.75%, 3/01/17 | | | United States | | | | 1,176,090 | | | | 1,043,192 | |
| h,i | | Cengage Learning Acquisitions Inc., First Lien Exit Term Loan, 7.00%, 3/31/20 | | | United States | | | | 146,890 | | | | 145,605 | |
| | iHeartCommunications Inc., | | | | | | | | | | | | |
| | senior secured note, first lien, 9.00%, 12/15/19 | | | United States | | | | 5,184,000 | | | | 5,125,680 | |
| | h,iTranche B Term Loan, 3.819%, 1/29/16 | | | United States | | | | 49,521 | | | | 49,010 | |
| | h,iTranche C Term Loan, 3.819%, 1/29/16 | | | United States | | | | 7,331 | | | | 7,249 | |
| | h,iTranche D Term Loan, 6.919%, 1/30/19 | | | United States | | | | 6,889,154 | | | | 6,508,101 | |
| | h,iTranche E Term Loan, 7.669%, 7/30/19 | | | United States | | | | 2,213,881 | | | | 2,128,093 | |
FRANKLIN TEMPLETON VARIABLE INSURANCE PRODUCTS TRUST
STATEMENT OF INVESTMENTS
Franklin Mutual Global Discovery VIP Fund (continued)
| | | | | | | | | | | | | | |
| | | | | Country | | | Principal Amount* | | | Value | |
| | Corporate Bonds, Notes and Senior Floating Rate Interests (continued) | | | | | | | | | | | | |
| h,i | | JC Penney Corp. Inc., Term Loan, 6.00%, 5/22/18 | | | United States | | | | 722,990 | | | $ | 712,597 | |
| d | | NGPL PipeCo LLC, | | | | | | | | | | | | |
| | secured note, 144A, 7.119%, 12/15/17 | | | United States | | | | 1,086,000 | | | | 1,072,425 | |
| | gsenior secured note, 144A, 9.625%, 6/01/19 | | | United States | | | | 2,369,000 | | | | 2,386,767 | |
| | Walter Energy Inc., | | | | | | | | | | | | |
| | h,iB, Term Loan, 7.25%, 4/01/18 | | | United States | | | | 1,651,867 | | | | 1,285,359 | |
| | dfirst lien, 144A, 9.50%, 10/15/19 | | | United States | | | | 966,000 | | | | 738,990 | |
| | d,g,jsecond lien, 144A, PIK, 11.50%, 4/01/20 | | | United States | | | | 778,000 | | | | 256,778 | |
| | | | | | | | | | | | | | |
| | | | |
| | Total Corporate Bonds, Notes and Senior Floating Rate Interests (Cost $22,071,131) | | | | | | | | | | | 21,983,586 | |
| | | | | | | | | | | | | | |
| | Corporate Notes and Senior Floating Rate Interests in Reorganization 1.1% | | | | | | | | | | | | |
| b,k | | Broadband Ventures III LLC, secured promissory note, 5.00%, 2/01/12 | | | United States | | | | 595 | | | | — | |
| h,i,k | | Texas Competitive Electric Holdings Co. LLC, Extended Term Loan, 4.648%, 10/10/17 | | | United States | | | | 5,912,264 | | | | 3,828,191 | |
| d,k | | Texas Competitive Electric Holdings Co. LLC/Texas Competitive Electric Holdings Finance Inc., senior secured note, 144A, 11.50%, 10/01/20 | | | United States | | | | 5,895,000 | | | | 4,200,187 | |
| | | | | | | | | | | | | | |
| | | | |
| | Total Corporate Notes and Senior Floating Rate Interests in Reorganization (Cost $10,546,425) | | | | | | | | | | | 8,028,378 | |
| | | | | | | | | | | | | | |
| | | | |
| | | | | | | | Shares | | | | |
| | Companies in Liquidation 0.6% | | | | | | | | | | | | |
| a | | Adelphia Recovery Trust | | | United States | | | | 5,379,562 | | | | 12,911 | |
| a,e | | Adelphia Recovery Trust, Arahova Contingent Value Vehicle, Contingent Distribution | | | United States | | | | 386,774 | | | | 3,868 | |
| a,e,f | | Century Communications Corp., Contingent Distribution | | | United States | | | | 1,074,000 | | | | — | |
| a,b | | FIM Coinvestor Holdings I, LLC | | | United States | | | | 2,077,368 | | | | — | |
| a,l | | Lehman Brothers Holdings Inc., Bankruptcy Claim | | | United States | | | | 17,348,669 | | | | 4,337,167 | |
| a,e,f | | NewPage Corp., Litigation Trust, Contingent Distribution | | | United States | | | | 4,854,000 | | | | — | |
| a,e,f | | Tribune Media Litigation Trust, Contingent Distribution | | | United States | | | | 56,883 | | | | — | |
| | | | | | | | | | | | | | |
| | | | |
| | Total Companies in Liquidation (Cost $5,290,112) | | | | | | | | | | | 4,353,946 | |
| | | | | | | | | | | | | | |
| | | | |
| | | | | | | | Principal Amount* | | | | |
| | Municipal Bonds (Cost $2,111,088) 0.3% | | | | | | | | | | | | |
| | Puerto Rico Commonwealth GO, Refunding, Series A, 8.00%, 7/01/35 | | | United States | | | | 2,261,000 | | | | 1,975,549 | |
| | | | | | | | | | | | | | |
| | | | |
| | Total Investments before Short Term Investments
(Cost $550,406,576) | | | | | | | | | | | 721,773,948 | |
| | | | | | | | | | | | | | |
FRANKLIN TEMPLETON VARIABLE INSURANCE PRODUCTS TRUST
STATEMENT OF INVESTMENTS
Franklin Mutual Global Discovery VIP Fund (continued)
| | | | | | | | | | | | | | |
| | | | | Country | | | Principal Amount* | | | Value | |
| | Short Term Investments 2.8% | | | | | | | | | | | | |
| | U.S. Government and Agency Securities 2.5% | | | | | | | | | | | | |
| m | | FHLB, 1/02/15 | | | United States | | | | 1,400,000 | | | $ | 1,400,000 | |
| m,n | | U.S. Treasury Bills, 1/02/15 - 5/14/15 | | | United States | | | | 17,350,000 | | | | 17,349,370 | |
| | | | | | | | | | | | | | |
| | | | |
| | Total U.S. Government and Agency Securities (Cost $18,748,604) | | | | | | | | | | | 18,749,370 | |
| | | | | | | | | | | | | | |
| | | | |
| | Total Investments before Money Market Funds (Cost $569,155,180) | | | | | | | | | | | 740,523,318 | |
| | | | | | | | | | | | | | |
| | | | |
| | | | | | | | Shares | | | | |
| o | | Investments from Cash Collateral Received for Loaned Securities (Cost $1,964,154) 0.3% | | | | | | | | | | | | |
| | Money Market Funds 0.3% | | | | | | | | | | | | |
| p | | BNY Mellon Overnight Government Fund, 0.072% | | | United States | | | | 1,964,154 | | | | 1,964,154 | |
| | | | | | | | | | | | | | |
| | Total Investments (Cost $571,119,334) 99.3% | | | | | | | | | | | 742,487,472 | |
| | Securities Sold Short (0.6)% | | | | | | | | | | | (4,854,863 | ) |
| | Other Assets, less Liabilities 1.3% | | | | | | | | | | | 10,353,046 | |
| | | | | | | | | | | | | | |
| | Net Assets 100.0% | | | | | | | | | | $ | 747,985,655 | |
| | | | | | | | | | | | | | |
| q | | Securities Sold Short (Proceeds $5,054,971) (0.6)% | | | | | | | | | |
| | Common Stocks (0.6)% | | | | | | | | | | | | |
| | Diversified Telecommunication Services (0.6)% | | | | | | | | | | | | |
| | AT&T Inc. | | | United States | | | | 144,533 | | | $ | (4,854,863 | ) |
| | | | | | | | | | | | | | |
*The principal amount is stated in U.S. dollars unless otherwise indicated.
aNon-income producing.
bSee Note 8 regarding restricted securities.
cAt December 31, 2014, pursuant to the Fund’s policies and the requirements of applicable securities law, the Fund may be restricted from trading this security for a limited or extended period of time.
dSecurity was purchased pursuant to Rule 144A under the Securities Act of 1933 and may be sold in transactions exempt from registration only to qualified institutional buyers or in a public offering registered under the Securities Act of 1933. These securities have been deemed liquid under guidelines approved by the Trust’s Board of Trustees. At December 31, 2014, the aggregate value of these securities was $16,412,797, representing 2.19% of net assets.
eContingent distributions represent the right to receive additional distributions, if any, during the reorganization of the underlying company. Shares represent total underlying principal of debt securities.
fSecurity has been deemed illiquid because it may not be able to be sold within seven days. At December 31, 2014, the aggregate value of these securities was $4,108,670, representing 0.55% of net assets.
gA portion or all of the security is on loan at December 31, 2014. See Note 1(f).
hSee Note 1(g) regarding senior floating rate interests.
iThe coupon rate shown represents the rate at period end.
jIncome may be received in additional securities and/or cash.
kSee Note 7 regarding credit risk and defaulted securities.
lBankruptcy claims represent the right to receive distributions, if any, during the liquidation of the underlying pool of assets. Shares represent amount of allowed unsecured claims.
mThe security is traded on a discount basis with no stated coupon rate.
nSecurity or a portion of the security has been pledged as collateral for securities sold short and open futures contracts. At December 31, 2014, the aggregate value of these securities and/or cash pledged as collateral was $8,548,878, representing 1.14% of net assets.
oSee Note 1(f) regarding securities on loan.
pThe rate shown is the annualized seven-day yield at period end.
qSee Note 1(e) regarding securities sold short.
FRANKLIN TEMPLETON VARIABLE INSURANCE PRODUCTS TRUST
STATEMENT OF INVESTMENTS
Franklin Mutual Global Discovery VIP Fund (continued)
At December 31, 2014, the Fund had the following futures contracts outstanding. See Note 1(c).
| | | | | | | | | | | | | | | | | | | | | | | | |
| Futures Contracts | | | | | | | | | | | | | | | | | | |
| Description | | Type | | | Number of
Contracts | | | Notional
Value | | | Expiration
Date | | | Unrealized
Appreciation | | | Unrealized
Depreciation | |
| Currency Contracts | | | | | | | | | | | | | | | | | | | | | | | | |
CHF/USD | | | Short | | | | 2 | | | $ | 251,850 | | | | 3/16/15 | | | $ | 5,869 | | | $ | — | |
EUR/USD | | | Short | | | | 244 | | | | 36,926,350 | | | | 3/16/15 | | | | 889,557 | | | | — | |
GBP/USD | | | Short | | | | 212 | | | | 20,630,250 | | | | 3/16/15 | | | | 119,799 | | | | — | |
| | | | | | | | | | | | | | | | | | | | |
Net unrealized appreciation (depreciation) | | | $ | 1,015,225 | | | | | |
| | | | | | | | | | | | | | | | | | | | | | | | |
At December 31, 2014, the Fund had the following forward exchange contracts outstanding. See Note 1(c).
| | | | | | | | | | | | | | | | | | | | | | | | | | | | |
| Forward Exchange Contracts | |
| Currency | | Counterpartya | | | Type | | | Quantity | | | Contract
Amount | | | Settlement
Date | | | Unrealized
Appreciation | | | Unrealized
Depreciation | |
Euro | | | BOFA | | | | Buy | | | | 62,119 | | | $ | 77,835 | | | | 1/20/15 | | | $ | — | | | $ | (2,654 | ) |
Euro | | | BOFA | | | | Sell | | | | 234,863 | | | | 310,282 | | | | 1/20/15 | | | | 26,035 | | | | — | |
Euro | | | BONY | | | | Buy | | | | 224,335 | | | | 279,180 | | | | 1/20/15 | | | | — | | | | (7,675 | ) |
Euro | | | DBAB | | | | Buy | | | | 366,036 | | | | 455,962 | | | | 1/20/15 | | | | — | | | | (12,961 | ) |
Euro | | | DBAB | | | | Sell | | | | 420,141 | | | | 557,159 | | | | 1/20/15 | | | | 48,675 | | | | — | |
Euro | | | FBCO | | | | Buy | | | | 280,569 | | | | 349,638 | | | | 1/20/15 | | | | — | | | | (10,075 | ) |
Euro | | | FBCO | | | | Sell | | | | 131,344 | | | | 174,977 | | | | 1/20/15 | | | | 16,015 | | | | — | |
Euro | | | HSBC | | | | Buy | | | | 352,533 | | | | 438,561 | | | | 1/20/15 | | | | — | | | | (11,902 | ) |
Euro | | | HSBC | | | | Sell | | | | 611,754 | | | | 816,909 | | | | 1/20/15 | | | | 76,522 | | | | — | |
Euro | | | SCBT | | | | Sell | | | | 239,523 | | | | 316,561 | | | | 1/20/15 | | | | 26,674 | | | | — | |
Euro | | | SSBT | | | | Buy | | | | 374,550 | | | | 466,580 | | | | 1/20/15 | | | | — | | | | (13,274 | ) |
Euro | | | SSBT | | | | Sell | | | | 134,992 | | | | 178,390 | | | | 1/20/15 | | | | 15,013 | | | | — | |
British Pound | | | BOFA | | | | Buy | | | | 1,520,270 | | | | 2,480,687 | | | | 1/21/15 | | | | — | | | | (111,442 | ) |
British Pound | | | BZWS | | | | Buy | | | | 1,586,023 | | | | 2,557,212 | | | | 1/21/15 | | | | — | | | | (85,494 | ) |
British Pound | | | DBAB | | | | Sell | | | | 3,447,464 | | | | 5,879,317 | | | | 1/21/15 | | | | 506,661 | | | | — | |
British Pound | | | FBCO | | | | Buy | | | | 568,431 | | | | 928,038 | | | | 1/21/15 | | | | — | | | | (42,174 | ) |
British Pound | | | FBCO | | | | Sell | | | | 72,578 | | | | 117,656 | | | | 1/21/15 | | | | 4,548 | | | | — | |
British Pound | | | HSBC | | | | Buy | | | | 96,469 | | | | 162,092 | | | | 1/21/15 | | | | — | | | | (11,751 | ) |
British Pound | | | HSBC | | | | Sell | | | | 2,424,144 | | | | 4,135,590 | | | | 1/21/15 | | | | 357,714 | | | | — | |
British Pound | | | SCBT | | | | Sell | | | | 124,777 | | | | 202,231 | | | | 1/21/15 | | | | 7,774 | | | | — | |
British Pound | | | SSBT | | | | Buy | | | | 295,457 | | | | 495,080 | | | | 1/21/15 | | | | — | | | | (34,630 | ) |
British Pound | | | SSBT | | | | Sell | | | | 3,197,314 | | | | 5,457,176 | | | | 1/21/15 | | | | 474,363 | | | | — | |
South Korean Won | | | BOFA | | | | Sell | | | | 2,704,847,671 | | | | 2,578,029 | | | | 2/12/15 | | | | 115,027 | | | | (4,647 | ) |
South Korean Won | | | BONY | | | | Sell | | | | 140,593,045 | | | | 136,229 | | | | 2/12/15 | | | | 7,965 | | | | — | |
South Korean Won | | | FBCO | | | | Buy | | | | 68,366,719 | | | | 62,550 | | | | 2/12/15 | | | | — | | | | (178 | ) |
South Korean Won | | | FBCO | | | | Sell | | | | 2,399,126,376 | | | | 2,307,949 | | | | 2/12/15 | | | | 120,929 | | | | (1,718 | ) |
South Korean Won | | | HSBC | | | | Buy | | | | 1,244,472,266 | | | | 1,131,505 | | | | 2/12/15 | | | | 7,588 | | | | (3,753 | ) |
South Korean Won | | | HSBC | | | | Sell | | | | 5,263,250,893 | | | | 5,024,736 | | | | 2/12/15 | | | | 225,181 | | | | (2,141 | ) |
Swiss Franc | | | BOFA | | | | Buy | | | | 148,821 | | | | 153,643 | | | | 2/12/15 | | | | — | | | | (3,842 | ) |
Swiss Franc | | | BOFA | | | | Sell | | | | 1,765,381 | | | | 1,952,448 | | | | 2/12/15 | | | | 175,439 | | | | — | |
Swiss Franc | | | DBAB | | | | Buy | | | | 223,217 | | | | 231,427 | | | | 2/12/15 | | | | — | | | | (6,739 | ) |
Swiss Franc | | | DBAB | | | | Sell | | | | 80,450 | | | | 87,164 | | | | 2/12/15 | | | | 6,184 | | | | — | |
Swiss Franc | | | FBCO | | | | Buy | | | | 253,437 | | | | 263,769 | | | | 2/12/15 | | | | — | | | | (8,663 | ) |
Swiss Franc | | | FBCO | | | | Sell | | | | 70,617 | | | | 74,996 | | | | 2/12/15 | | | | 3,913 | | | | — | |
Swiss Franc | | | HSBC | | | | Buy | | | | 8,608 | | | | 8,899 | | | | 2/12/15 | | | | — | | | | (234 | ) |
Swiss Franc | | | HSBC | | | | Sell | | | | 21,773 | | | | 22,134 | | | | 2/12/15 | | | | 218 | | | | — | |
Swiss Franc | | | SSBT | | | | Buy | | | | 299,201 | | | | 309,853 | | | | 2/12/15 | | | | — | | | | (8,682 | ) |
Swiss Franc | | | SSBT | | | | Sell | | | | 10,234 | | | | 10,646 | | | | 2/12/15 | | | | 344 | | | | — | |
British Pound | | | BOFA | | | | Buy | | | | 2,242,999 | | | | 3,611,418 | | | | 2/19/15 | | | | — | | | | (116,628 | ) |
British Pound | | | BOFA | | | | Sell | | | | 2,747,190 | | | | 4,536,866 | | | | 2/19/15 | | | | 256,503 | | | | — | |
British Pound | | | BONY | | | | Buy | | | | 200,600 | | | | 320,694 | | | | 2/19/15 | | | | — | | | | (8,142 | ) |
British Pound | | | BZWS | | | | Buy | | | | 53,437 | | | | 84,876 | | | | 2/19/15 | | | | — | | | | (1,616 | ) |
FRANKLIN TEMPLETON VARIABLE INSURANCE PRODUCTS TRUST
STATEMENT OF INVESTMENTS
Franklin Mutual Global Discovery VIP Fund (continued)
| | | | | | | | | | | | | | | | | | | | | | | | | | | | |
| Forward Exchange Contracts (continued) | |
| Currency | | Counterpartya | | | Type | | | Quantity | | | Contract
Amount | | | Settlement
Date | | | Unrealized
Appreciation | | | Unrealized
Depreciation | |
British Pound | | | DBAB | | | | Buy | | | | 403,461 | | | $ | 642,442 | | | | 2/19/15 | | | $ | — | | | $ | (13,814 | ) |
British Pound | | | DBAB | | | | Sell | | | | 49,695 | | | | 77,854 | | | | 2/19/15 | | | | 425 | | | | — | |
British Pound | | | FBCO | | | | Buy | | | | 687,340 | | | | 1,100,241 | | | | 2/19/15 | | | | — | | | | (29,305 | ) |
British Pound | | | FBCO | | | | Sell | | | | 2,543,161 | | | | 4,200,763 | | | | 2/19/15 | | | | 238,295 | | | | — | |
British Pound | | | HSBC | | | | Buy | | | | 535,887 | | | | 858,134 | | | | 2/19/15 | | | | — | | | | (23,176 | ) |
British Pound | | | HSBC | | | | Sell | | | | 808,794 | | | | 1,289,975 | | | | 2/19/15 | | | | 29,804 | | | | — | |
British Pound | | | SCBT | | | | Buy | | | | 35,672 | | | | 57,750 | | | | 2/19/15 | | | | — | | | | (2,170 | ) |
British Pound | | | SCBT | | | | Sell | | | | 154,166 | | | | 249,172 | | | | 2/19/15 | | | | 8,967 | | | | — | |
British Pound | | | SSBT | | | | Buy | | | | 644,899 | | | | 1,028,030 | | | | 2/19/15 | | | | — | | | | (23,220 | ) |
British Pound | | | SSBT | | | | Sell | | | | 2,411,323 | | | | 3,985,602 | | | | 2/19/15 | | | | 228,549 | | | | — | |
Euro | | | BOFA | | | | Sell | | | | 1,448,155 | | | | 1,886,745 | | | | 2/27/15 | | | | 133,539 | | | | — | |
Euro | | | BONY | | | | Sell | | | | 246,309 | | | | 323,114 | | | | 2/27/15 | | | | 24,921 | | | | — | |
Euro | | | DBAB | | | | Sell | | | | 1,344,910 | | | | 1,761,553 | | | | 2/27/15 | | | | 133,342 | | | | — | |
Euro | | | FBCO | | | | Sell | | | | 1,082,837 | | | | 1,403,679 | | | | 2/27/15 | | | | 92,745 | | | | — | |
Euro | | | HSBC | | | | Sell | | | | 476,710 | | | | 625,431 | | | | 2/27/15 | | | | 48,303 | | | | — | |
Euro | | | SCBT | | | | Sell | | | | 423,935 | | | | 554,215 | | | | 2/27/15 | | | | 40,980 | | | | — | |
Euro | | | SSBT | | | | Sell | | | | 251,052 | | | | 327,397 | | | | 2/27/15 | | | | 23,462 | | | | — | |
Canadian Dollar | | | BONY | | | | Buy | | | | 87,566 | | | | 78,286 | | | | 3/18/15 | | | | — | | | | (3,008 | ) |
Canadian Dollar | | | BONY | | | | Sell | | | | 238,611 | | | | 212,290 | | | | 3/18/15 | | | | 7,163 | | | | — | |
Canadian Dollar | | | DBAB | | | | Sell | | | | 564,421 | | | | 490,510 | | | | 3/18/15 | | | | 5,291 | | | | — | |
Canadian Dollar | | | SCBT | | | | Buy | | | | 84,071 | | | | 74,859 | | | | 3/18/15 | | | | — | | | | (2,586 | ) |
Canadian Dollar | | | SCBT | | | | Sell | | | | 9,326,591 | | | | 8,474,105 | | | | 3/18/15 | | | | 456,275 | | | | — | |
Canadian Dollar | | | SSBT | | | | Buy | | | | 68,388 | | | | 60,531 | | | | 3/18/15 | | | | — | | | | (1,740 | ) |
Euro | | | BOFA | | | | Sell | | | | 1,853,806 | | | | 2,334,324 | | | | 4/16/15 | | | | 88,993 | | | | — | |
Euro | | | BONY | | | | Sell | | | | 260,030 | | | | 325,987 | | | | 4/16/15 | | | | 11,039 | | | | — | |
Euro | | | BZWS | | | | Sell | | | | 224,315 | | | | 282,695 | | | | 4/16/15 | | | | 11,004 | | | | — | |
Euro | | | DBAB | | | | Sell | | | | 3,217,304 | | | | 4,057,911 | | | | 4/16/15 | | | | 161,111 | | | | — | |
Euro | | | FBCO | | | | Sell | | | | 2,317,230 | | | | 2,914,338 | | | | 4/16/15 | | | | 107,708 | | | | — | |
Euro | | | HSBC | | | | Sell | | | | 817,942 | | | | 1,031,235 | | | | 4/16/15 | | | | 40,543 | | | | — | |
Euro | | | SCBT | | | | Sell | | | | 130,014 | | | | 162,953 | | | | 4/16/15 | | | | 5,480 | | | | — | |
Euro | | | SSBT | | | | Sell | | | | 721,586 | | | | 911,350 | | | | 4/16/15 | | | | 37,365 | | | | — | |
British Pound | | | BOFA | | | | Sell | | | | 121,809 | | | | 190,277 | | | | 4/22/15 | | | | 590 | | | | — | |
British Pound | | | HSBC | | | | Sell | | | | 2,791,917 | | | | 4,488,901 | | | | 4/22/15 | | | | 141,170 | | | | — | |
British Pound | | | SCBT | | | | Sell | | | | 2,974,595 | | | | 4,792,073 | | | | 4/22/15 | | | | 159,866 | | | | — | |
Euro | | | BOFA | | | | Sell | | | | 3,706,940 | | | | 4,626,789 | | | | 5/18/15 | | | | 135,397 | | | | — | |
Euro | | | BONY | | | | Sell | | | | 52,730 | | | | 64,278 | | | | 5/18/15 | | | | 389 | | | | — | |
Euro | | | DBAB | | | | Sell | | | | 4,342,380 | | | | 5,408,048 | | | | 5/18/15 | | | | 146,745 | | | | — | |
Euro | | | FBCO | | | | Sell | | | | 3,823,872 | | | | 4,773,759 | | | | 5/18/15 | | | | 140,689 | | | | — | |
Euro | | | HSBC | | | | Sell | | | | 830,837 | | | | 1,028,865 | | | | 5/18/15 | | | | 22,209 | | | | — | |
Euro | | | SSBT | | | | Sell | | | | 429,704 | | | | 537,163 | | | | 5/18/15 | | | | 16,525 | | | | — | |
British Pound | | | BOFA | | | | Buy | | | | 132,595 | | | | 206,881 | | | | 5/21/15 | | | | — | | | | (444 | ) |
British Pound | | | BOFA | | | | Sell | | | | 2,235,735 | | | | 3,498,925 | | | | 5/21/15 | | | | 18,121 | | | | — | |
British Pound | | | FBCO | | | | Buy | | | | 52,495 | | | | 81,720 | | | | 5/21/15 | | | | 9 | | | | — | |
British Pound | | | FBCO | | | | Sell | | | | 1,610,500 | | | | 2,518,499 | | | | 5/21/15 | | | | 11,121 | | | | — | |
British Pound | | | HSBC | | | | Buy | | | | 221,130 | | | | 345,726 | | | | 5/21/15 | | | | — | | | | (1,449 | ) |
British Pound | | | SSBT | | | | Sell | | | | 2,951,169 | | | | 4,615,628 | | | | 5/21/15 | | | | 20,966 | | | | — | |
| | | | | | | | | | | | | | | | | | | | | | | | |
Unrealized appreciation (depreciation) | | | | 5,228,386 | | | | (611,927 | ) |
| | | | | | | | | | | | | | | | | | | | | | | | |
Net unrealized appreciation (depreciation) | | | $ | 4,616,459 | | | | | |
| | | | | | | | | | | | | | | | | | | | | | | | | | | | |
aMay be comprised of multiple contracts with the same counterparty, currency and settlement date.
See Abbreviations on page MGD-34.
| | | | | | |
| | | The accompanying notes are an integral part of these financial statements. | Annual Report | | | MGD-17 | |
FRANKLIN TEMPLETON VARIABLE INSURANCE PRODUCTS TRUST
Financial Statements
Statement of Assets and Liabilities
December 31, 2014
| | | | |
| | | Franklin Mutual
Global Discovery
VIP Fund | |
Assets: | | | | |
Investments in securities: | | | | |
Cost | | $ | 571,119,334 | |
| | | | |
Value (includes securities loaned in the amount of $1,883,779) | | $ | 742,487,472 | |
Restricted cash (Note 1d) | | | 1,470,000 | |
Foreign currency, at value (cost $1,693,476) | | | 1,696,266 | |
Receivables: | | | | |
Investment securities sold | | | 1,279,306 | |
Capital shares sold | | | 186,830 | |
Dividends and interest | | | 1,277,848 | |
Due from brokers | | | 5,039,024 | |
Variation margin | | | 139,773 | |
Unrealized appreciation on forward exchange contracts | | | 5,228,386 | |
Other assets | | | 157,539 | |
| | | | |
Total assets | | | 758,962,444 | |
| | | | |
Liabilities: | | | | |
Payables: | | | | |
Capital shares redeemed | | | 790,652 | |
Management fees | | | 596,370 | |
Distribution fees | | | 322,383 | |
Funds advanced by custodian | | | 179,484 | |
Securities sold short, at value (proceeds $5,054,971) | | | 4,854,863 | |
Payable upon return of securities loaned | | | 1,964,154 | |
Due to brokers | | | 1,470,000 | |
Unrealized depreciation on forward exchange contracts | | | 611,927 | |
Accrued expenses and other liabilities | | | 186,956 | |
| | | | |
Total liabilities | | | 10,976,789 | |
| | | | |
Net assets, at value | | $ | 747,985,655 | |
| | | | |
Net assets consist of: | | | | |
Paid-in capital | | $ | 518,684,359 | |
Undistributed net investment income | | | 20,534,780 | |
Net unrealized appreciation (depreciation) | | | 177,193,054 | |
Accumulated net realized gain (loss) | | | 31,573,462 | |
| | | | |
Net assets, at value | | $ | 747,985,655 | |
| | | | |
| | | | |
| MGD-18 | | Annual Report | The accompanying notes are an integral part of these financial statements. | | |
FRANKLIN TEMPLETON VARIABLE INSURANCE PRODUCTS TRUST
FINANCIAL STATEMENTS
Statement of Assets and Liabilities (continued)
December 31, 2014
| | | | |
| | | Franklin Mutual
Global Discovery
VIP Fund | |
| |
| Class 1: | | | | |
Net assets, at value | | $ | 2,313,327 | |
| | | | |
Shares outstanding | | | 102,295 | |
| | | | |
Net asset value and maximum offering price per share | | $ | 22.61 | |
| | | | |
| |
| Class 2: | | | | |
Net assets, at value | | $ | 685,711,407 | |
| | | | |
Shares outstanding | | | 31,008,286 | |
| | | | |
Net asset value and maximum offering price per share | | $ | 22.11 | |
| | | | |
| |
| Class 4: | | | | |
Net assets, at value | | $ | 59,960,921 | |
| | | | |
Shares outstanding | | | 2,678,081 | |
| | | | |
Net asset value and maximum offering price per share | | $ | 22.39 | |
| | | | |
| | | | | | |
| | | The accompanying notes are an integral part of these financial statements. | Annual Report | | | MGD-19 | |
FRANKLIN TEMPLETON VARIABLE INSURANCE PRODUCTS TRUST
FINANCIAL STATEMENTS
Statement of Operations
for the year ended December 31, 2014
| | | | |
| | | Franklin Mutual
Global Discovery
VIP Fund | |
Investment income: | | | | |
Dividends | | $ | 26,521,952 | |
Interest | | | 2,813,187 | |
Income from securities loaned | | | 11,936 | |
| | | | |
Total investment income | | | 29,347,075 | |
| | | | |
Expenses: | | | | |
Management fees (Note 3a) | | | 6,791,117 | |
Administrative fees (Note 3b) | | | 337,573 | |
Distribution fees: (Note 3c) | | | | |
Class 2 | | | 1,732,870 | |
Class 4 | | | 231,562 | |
Custodian fees (Note 4) | | | 40,192 | |
Reports to shareholders | | | 146,506 | |
Professional fees | | | 69,104 | |
Trustees’ fees and expenses | | | 3,002 | |
Dividends on securities sold short | | | 212,421 | |
Other | | | 27,793 | |
| | | | |
Total expenses | | | 9,592,140 | |
Expense reductions (Note 4) | | | (76 | ) |
| | | | |
Net expenses | | | 9,592,064 | |
| | | | |
Net investment income | | | 19,755,011 | |
| | | | |
Realized and unrealized gains (losses): | | | | |
Net realized gain (loss) from: | | | | |
Investments | | | 30,316,298 | |
Foreign currency transactions | | | (1,786,136 | ) |
Futures contracts | | | 4,996,648 | |
Securities sold short | | | (392,405 | ) |
| | | | |
Net realized gain (loss) | | | 33,134,405 | |
| | | | |
Net change in unrealized appreciation (depreciation) on: | | | | |
Investments | | | (20,882,091 | ) |
Translation of other assets and liabilities denominated in foreign currencies | | | 10,228,317 | |
| | | | |
Net change in unrealized appreciation (depreciation) | | | (10,653,774 | ) |
| | | | |
Net realized and unrealized gain (loss) | | | 22,480,631 | |
| | | | |
Net increase (decrease) in net assets resulting from operations | | $ | 42,235,642 | |
| | | | |
| | | | |
| MGD-20 | | Annual Report | The accompanying notes are an integral part of these financial statements. | | |
FRANKLIN TEMPLETON VARIABLE INSURANCE PRODUCTS TRUST
FINANCIAL STATEMENTS
Statements of Changes in Net Assets
| | | | | | | | |
| | | Franklin
Mutual Global Discovery VIP Fund | |
| | | Year Ended December 31, | |
| | | 2014 | | | 2013 | |
Increase (decrease) in net assets: | | | | | | | | |
Operations: | | | | | | | | |
Net investment income | | $ | 19,755,011 | | | $ | 14,042,917 | |
Net realized gain (loss) from investments, written options, foreign currency transactions, futures contracts and securities sold short | | | 33,134,405 | | | | 51,438,971 | |
Net change in unrealized appreciation (depreciation) on investments and translation of other assets and liabilities denominated in foreign currencies | | | (10,653,774 | ) | | | 116,840,987 | |
| | | | |
Net increase (decrease) in net assets resulting from operations | | | 42,235,642 | | | | 182,322,875 | |
| | | | |
Distributions to shareholders from: | | | | | | | | |
Net investment income: | | | | | | | | |
Class 1 | | | (43,196 | ) | | | (52,604 | ) |
Class 2 | | | (14,775,740 | ) | | | (14,417,027 | ) |
Class 4 | | | (1,243,714 | ) | | | (1,382,402 | ) |
Net realized gains: | | | | | | | | |
Class 1 | | | (119,891 | ) | | | (195,304 | ) |
Class 2 | | | (45,727,518 | ) | | | (59,917,989 | ) |
Class 4 | | | (4,102,276 | ) | | | (5,990,316 | ) |
| | | | |
Total distributions to shareholders | | | (66,012,335 | ) | | | (81,955,642 | ) |
| | | | |
Capital share transactions: (Note 2) | | | | | | | | |
Class 1 | | | (105,551 | ) | | | 1,149,200 | |
Class 2 | | | 23,195,730 | | | | (67,039,527 | ) |
Class 4 | | | (8,926,689 | ) | | | (825,524 | ) |
| | | | |
Total capital share transactions | | | 14,163,490 | | | | (66,715,851 | ) |
| | | | |
Net increase (decrease) in net assets | | | (9,613,203 | ) | | | 33,651,382 | |
Net assets: | | | | | | | | |
Beginning of year | | | 757,598,858 | | | | 723,947,476 | |
| | | | |
End of year | | $ | 747,985,655 | | | $ | 757,598,858 | |
| | | | |
Undistributed net investment income included in net assets: | | | | | | | | |
End of year | | $ | 20,534,780 | | | $ | 15,025,568 | |
| | | | |
| | | | | | |
| | | The accompanying notes are an integral part of these financial statements. | Annual Report | | | MGD-21 | |
FRANKLIN TEMPLETON VARIABLE INSURANCE PRODUCTS TRUST
Notes to Financial Statements
Franklin Mutual Global Discovery VIP Fund
1. Organization and Significant Accounting Policies
Franklin Templeton Variable Insurance Products Trust (Trust) is registered under the Investment Company Act of 1940, as amended, (1940 Act) as an open-end management investment company, consisting of nineteen separate funds and applies the specialized accounting and reporting guidance in U.S. Generally Accepted Accounting Principles (U.S. GAAP). Franklin Mutual Global Discovery VIP Fund (Fund) is included in this report. The financial statements of the remaining funds in the Trust are presented separately. Shares of the Fund are generally sold only to insurance company separate accounts to fund the benefits of variable life insurance policies or variable annuity contracts. At December 31, 2014, 60.55% of the Fund’s shares were held through one insurance company. Investment activities of these insurance company separate accounts could have a material impact on the Fund. The Fund offers three classes of shares: Class 1, Class 2, and Class 4. Each class of shares differs by its distribution fees, voting rights on matters affecting a single class and its exchange privilege.
Effective May 1, 2014, Mutual Global Discovery Securities Fund was renamed Franklin Mutual Global Discovery VIP Fund.
The following summarizes the Fund’s significant accounting policies.
a. Financial Instrument Valuation
The Fund’s investments in financial instruments are carried at fair value daily. Fair value is the price that would be received to sell an asset or paid to transfer a liability in an orderly transaction between market participants on the measurement date. The Fund calculates the net asset value (NAV) per share at the close of the New York Stock Exchange (NYSE), generally at 4 p.m. Eastern time (NYSE close) on each day the NYSE is open for trading. Under compliance policies and procedures approved by the Trust’s Board of Trustees (the Board), the Fund’s administrator has responsibility for oversight of valuation, including leading the cross-functional Valuation and Liquidity Oversight Committee (VLOC). The VLOC provides administration and oversight of the Fund’s valuation policies and procedures, which are approved annually by the Board. Among other things, these procedures allow the Fund to utilize independent pricing services, quotations from securities and financial instrument dealers, and other market sources to determine fair value.
Equity securities and derivative financial instruments (derivatives) listed on an exchange or on the NASDAQ National Market System are valued at the last quoted sale price or the
official closing price of the day, respectively. Foreign equity securities are valued as of the close of trading on the foreign stock exchange on which the security is primarily traded or as of the NYSE close, whichever is earlier. The value is then converted into its U.S. dollar equivalent at the foreign exchange rate in effect at the NYSE close on the day that the value of the security is determined. Over-the-counter (OTC) securities are valued within the range of the most recent quoted bid and ask prices. Securities that trade in multiple markets or on multiple exchanges are valued according to the broadest and most representative market. Certain equity securities are valued based upon fundamental characteristics or relationships to similar securities. Investments in non-registered money market funds are valued at the closing NAV.
Debt securities generally trade in the OTC market rather than on a securities exchange. The Fund’s pricing services use multiple valuation techniques to determine fair value. In instances where sufficient market activity exists, the pricing services may utilize a market-based approach through which quotes from market
makers are used to determine fair value. In instances where sufficient market activity may not exist or is limited, the pricing services also utilize proprietary valuation models which may consider market characteristics such as benchmark yield curves, credit spreads, estimated default rates, anticipated market interest rate volatility, coupon rates, anticipated timing of principal repayments, underlying collateral, and other unique security features in order to estimate the relevant cash flows, which are then discounted to calculate the fair value. Securities denominated in a foreign currency are converted into their U.S. dollar equivalent at the foreign exchange rate in effect at the NYSE close on the date that the values of the foreign debt securities are determined.
Certain derivatives trade in the OTC market. The Fund’s pricing services use various techniques including industry standard option pricing models and proprietary discounted cash flow models to determine the fair value of those instruments. The Fund’s net benefit or obligation under the derivative contract, as measured by the fair value of the contract, is included in net assets.
The Fund has procedures to determine the fair value of financial instruments for which market prices are not reliable or readily available. Under these procedures, the VLOC convenes on a regular basis to review such financial instruments and considers a number of factors, including significant unobservable valuation inputs, when arriving at fair value. The VLOC primarily
FRANKLIN TEMPLETON VARIABLE INSURANCE PRODUCTS TRUST
NOTES TO FINANCIAL STATEMENTS
Franklin Mutual Global Discovery VIP Fund (continued)
employs a market-based approach which may use related or comparable assets or liabilities, recent transactions, market multiples, book values, and other relevant information for the investment to determine the fair value of the investment. An income-based valuation approach may also be used in which the anticipated future cash flows of the investment are discounted to calculate fair value. Discounts may also be applied due to the nature or duration of any restrictions on the disposition of the investments. Due to the inherent uncertainty of valuations of such investments, the fair values may differ significantly from the values that would have been used had an active market existed. The VLOC employs various methods for calibrating these valuation approaches including a regular review of key inputs and assumptions, transactional back-testing or disposition analysis, and reviews of any related market activity.
Trading in securities on foreign securities stock exchanges and OTC markets may be completed before the daily NYSE close. In addition, trading in certain foreign markets may not take place on every NYSE business day. Occasionally, events occur between the time at which trading in a foreign security is completed and the close of the NYSE that might call into question the reliability of the value of a portfolio security held by the Fund. As a result, differences may arise between the value of the Fund’s portfolio securities as determined at the foreign market close and the latest indications of value at the close of the NYSE. In order to minimize the potential for these differences, the VLOC monitors price movements following the close of trading in foreign stock markets through a series of country specific market proxies (such as baskets of American Depositary Receipts, futures contracts and exchange traded funds). These price movements are measured against established trigger thresholds for each specific market proxy to assist in determining if an event has occurred that may call into question the reliability of the values of the foreign securities held by the Fund. If such an event occurs, the securities may be valued using fair value procedures, which may include the use of independent pricing services.
Also, when the last day of the reporting period is a non-business day, certain foreign markets may be open on those days that the NYSE is closed, which could result in differences between the value of the Fund’s portfolio securities on the last business day and the last calendar day of the reporting period. Any significant security valuation changes due to an open foreign market are adjusted and reflected by the Fund for financial reporting purposes.
b. Foreign Currency Translation
Portfolio securities and other assets and liabilities denominated in foreign currencies are translated into U.S. dollars based on the exchange rate of such currencies against U.S. dollars on the date of valuation. The Fund may enter into foreign currency exchange contracts to facilitate transactions denominated in a foreign currency. Purchases and sales of securities, income and expense items denominated in foreign currencies are translated into U.S. dollars at the exchange rate in effect on the transaction date. Portfolio securities and assets and liabilities denominated in foreign currencies contain risks that those currencies will decline in value relative to the U.S. dollar. Occasionally, events may impact the availability or reliability of foreign exchange rates used to convert the U.S. dollar equivalent value. If such an event occurs, the foreign exchange rate will be valued at fair value using procedures established and approved by the Board.
The Fund does not separately report the effect of changes in foreign exchange rates from changes in market prices on securities held. Such changes are included in net realized and unrealized gain or loss from investments on the Statement of Operations.
Realized foreign exchange gains or losses arise from sales of foreign currencies, currency gains or losses realized between the trade and settlement dates on securities transactions and the difference between the recorded amounts of dividends, interest, and foreign withholding taxes and the U.S. dollar equivalent of the amounts actually received or paid. Net unrealized foreign exchange gains and losses arise from changes in foreign exchange rates on foreign denominated assets and liabilities other than investments in securities held at the end of the reporting period.
c. Derivative Financial Instruments
The Fund invested in derivatives in order to manage risk or gain exposure to various other investments or markets. Derivatives are financial contracts based on an underlying or notional amount, require no initial investment or an initial net investment that is smaller than would normally be required to have a similar response to changes in market factors, and require or permit net settlement. Derivatives contain various risks including the potential inability of the counterparty to fulfill their obligations under the terms of the contract, the potential for an illiquid secondary market, and/or the potential for market movements which expose the Fund to gains or losses in excess of the
FRANKLIN TEMPLETON VARIABLE INSURANCE PRODUCTS TRUST
NOTES TO FINANCIAL STATEMENTS
Franklin Mutual Global Discovery VIP Fund (continued)
1. Organization and Significant Accounting Policies (continued)
c. Derivative Financial Instruments (continued)
amounts shown on the Statement of Assets and Liabilities. Realized gain and loss and unrealized appreciation and depreciation on these contracts for the period are included in the Statement of Operations.
Derivative counterparty credit risk is managed through a formal evaluation of the creditworthiness of all potential counterparties. The Fund attempts to reduce its exposure to counterparty credit risk on OTC derivatives, whenever possible, by entering into International Swaps and Derivatives Association (ISDA) master agreements with certain counterparties. These agreements contain various provisions, including but not limited to collateral requirements, events of default, or early termination. Termination events applicable to the counterparty include certain deteriorations in the credit quality of the counterparty. Termination events applicable to the Fund include failure of the Fund to maintain certain net asset levels and/or limit the decline in net assets over various periods of time. In the event of default or early termination, the ISDA master agreement gives the non-defaulting party the right to net and close-out all transactions traded, whether or not arising under the ISDA agreement, to one net amount payable by one counterparty to the other. However, absent an event of default or early termination, OTC derivative assets and liabilities are presented gross and not offset in the Statement of Assets and Liabilities. Early termination by the counterparty may result in an immediate payment by the Fund of any net liability owed to that counterparty under the ISDA agreement. At December 31, 2014, the Fund had OTC derivatives in a net liability position of $76,106.
Collateral requirements differ by type of derivative. Collateral or initial margin requirements are set by the broker or exchange clearing house for exchange traded and centrally cleared derivatives. Initial margin deposited is held at the exchange and can be in the form of cash and/or securities. For OTC derivatives traded under an ISDA master agreement, posting of collateral is required by either the fund or the applicable counterparty if the total net exposure of all OTC derivatives with the applicable counterparty exceeds the minimum transfer amount, which typically ranges from $100,000 to $250,000, and can vary depending on the counterparty and the type of the agreement. Generally, collateral is determined at the close of fund business each day and any additional collateral required
due to changes in derivative values may be delivered by the fund or the counterparty within a few business days. Collateral pledged and/or received by the fund for OTC derivatives, if any, is held in segregated accounts with the fund’s custodian/counterparty broker and can be in the form of cash and/or securities. Unrestricted cash may be invested according to the Fund’s investment objectives.
At December 31, 2014, the Fund received $2,137,141 in a Federal Republic of Germany Note and U.S. Treasury Notes.
The Fund entered into exchange traded futures contracts primarily to manage exposure to certain foreign currencies. A futures contract is an agreement between the Fund and a counterparty to buy or sell an asset for a specified price on a future date. Required initial margins are pledged by the Fund, and the daily change in fair value is accounted for as a variation margin payable or receivable on the Statement of Assets and Liabilities.
The Fund entered into OTC forward exchange contracts primarily to manage exposure to certain foreign currencies. A forward exchange contract is an agreement between the Fund and a counterparty to buy or sell a foreign currency at a specific exchange rate on a future date.
The Fund purchased or wrote exchange traded option contracts primarily to manage exposure to equity price risk. An option is a contract entitling the holder to purchase or sell a specific amount of shares or units of an asset or notional amount of a swap (swaption), at a specified price. Options purchased are recorded as an asset while options written are recorded as a liability. Upon exercise of an option, the acquisition cost or sales proceeds of the underlying investment is adjusted by any premium received or paid. Upon expiration of an option, any premium received or paid is recorded as a realized gain or loss. Upon closing an option other than through expiration or exercise, the difference between the premium and the cost to close the position is recorded as a realized gain or loss.
See Notes 6 and 9 regarding investment transactions and other derivative information, respectively.
d. Restricted Cash
At December 31, 2014, the Fund held restricted cash in connection with investments in certain derivative securities. Restricted cash is held in a segregated account with the Fund’s custodian and is reflected in the Statement of Assets and Liabilities.
FRANKLIN TEMPLETON VARIABLE INSURANCE PRODUCTS TRUST
NOTES TO FINANCIAL STATEMENTS
Franklin Mutual Global Discovery VIP Fund (continued)
e. Securities Sold Short
The Fund is engaged in selling securities short, which obligates the Fund to replace a borrowed security with the same security at current fair value. The Fund incurs a loss if the price of the security increases between the date of the short sale and the date on which the Fund replaces the borrowed security. The Fund realizes a gain if the price of the security declines between those dates. Gains are limited to the price at which the Fund sold the security short, while losses are potentially unlimited in size.
The Fund is required to establish a margin account with the broker lending the security sold short. While the short sale is outstanding, the broker retains the proceeds of the short sale to the extent necessary to meet margin requirements until the short position is closed out. A deposit must also be maintained with the Fund’s custodian/counterparty broker consisting of cash and/or securities having a value equal to a specified percentage of the value of the securities sold short. The Fund is obligated to pay fees for borrowing the securities sold short and is required to pay the counterparty any dividends and/or interest due on securities sold short. Such dividends and/or interest and any security borrowing fees are recorded as an expense to the Fund.
f. Securities Lending
The Fund participates in an agency based securities lending program. The Fund receives cash collateral against the loaned securities in an amount equal to at least 102% of the fair value of the loaned securities. Collateral is maintained over the life of the loan in an amount not less than 100% of the fair value of loaned securities, as determined at the close of fund business each day; any additional collateral required due to changes in security values is delivered to the Fund on the next business day. The collateral is invested in a non-registered money fund as indicated in the Statement of Investments. The Fund receives income from the investment of cash collateral, in addition to lending fees and rebates paid by the borrower. The Fund bears the market risk with respect to the collateral investment, securities loaned, and the risk that the agent may default on its obligations to the Fund. The securities lending agent has agreed to indemnify the Fund in the event of default by a third party borrower.
g. Senior Floating Rate Interests
The Fund invests in senior secured corporate loans that pay interest at rates which are periodically reset by reference to a base lending rate plus a spread. These base lending rates are generally the prime rate offered by a designated U.S. bank or the
London InterBank Offered Rate (LIBOR). Senior secured corporate loans often require prepayment of principal from excess cash flows or at the discretion of the borrower. As a result, actual maturity may be substantially less than the stated maturity. Senior secured corporate loans in which the Fund invests are generally readily marketable, but may be subject to certain restrictions on resale.
h. Income and Deferred Taxes
It is the Fund’s policy to qualify as a regulated investment company under the Internal Revenue Code. The Fund intends to distribute to shareholders substantially all of its taxable income and net realized gains to relieve it from federal income and if applicable, excise taxes. As a result, no provision for U.S. federal income taxes is required.
The Fund may be subject to foreign taxation related to income received, capital gains on the sale of securities and certain foreign currency transactions in the foreign jurisdictions in which it invests. Foreign taxes, if any, are recorded based on the tax regulations and rates that exist in the foreign markets in which the Fund invests. When a capital gain tax is determined to apply the Fund records an estimated deferred tax liability in an amount that would be payable if the securities were disposed of on the valuation date. As a result of several court cases, in certain countries across the European Union, the Fund has filed additional tax reclaims for previously withheld taxes on dividends earned in those countries. These additional filings are subject to various administrative proceedings by the local jurisdictions’ tax authorities within the European Union, as well as a number of related judicial proceedings. At this time, uncertainty exists as to the ultimate resolution of these proceedings, the likelihood of receipt of these reclaims, and the potential timing of any payment and accordingly, no amounts are reflected in the financial statements.
The Fund recognizes the tax benefits of uncertain tax positions only when the position is “more likely than not” to be sustained upon examination by the tax authorities based on the technical merits of the tax position. As of December 31, 2014, and for all open tax years, the Fund has determined that no liability for unrecognized tax benefits is required in the Fund’s financial statements related to uncertain tax positions taken on a tax return (or expected to be taken on future tax returns). Open tax years are those that remain subject to examination and are based on each tax jurisdiction statute of limitation.
FRANKLIN TEMPLETON VARIABLE INSURANCE PRODUCTS TRUST
NOTES TO FINANCIAL STATEMENTS
Franklin Mutual Global Discovery VIP Fund (continued)
1. Organization and Significant Accounting Policies (continued)
i. Security Transactions, Investment Income, Expenses and Distributions
Security transactions are accounted for on trade date. Realized gains and losses on security transactions are determined on a specific identification basis. Interest income and estimated expenses are accrued daily. Amortization of premium and accretion of discount on debt securities are included in interest income. Dividend income and dividends declared on securities sold short are recorded on the ex-dividend date except for certain foreign securities where the dividend rate is not available. In such cases, the dividend is recorded as soon as the information is received by the Fund. Distributions to shareholders are recorded on the ex-dividend date and are determined according to income tax regulations (tax basis). Distributable earnings determined on a tax basis may differ from earnings recorded in accordance with U.S. GAAP. These differences may be permanent or temporary. Permanent differences are reclassified among capital accounts to reflect their tax character. These reclassifications have no impact on net assets or the results of operations. Temporary differences are not reclassified, as they may reverse in subsequent periods.
Common expenses incurred by the Trust are allocated among the funds based on the ratio of net assets of each fund to the
combined net assets of the Trust. Fund specific expenses are charged directly to the fund that incurred the expense.
Realized and unrealized gains and losses and net investment income, not including class specific expenses, are allocated daily to each class of shares based upon the relative proportion of net assets of each class. Differences in per share distributions, by class, are generally due to differences in class specific expenses.
j. Accounting Estimates
The preparation of financial statements in accordance with U.S. GAAP requires management to make estimates and assumptions that affect the reported amounts of assets and liabilities at the date of the financial statements and the amounts of income and expenses during the reporting period. Actual results could differ from those estimates.
k. Guarantees and Indemnifications
Under the Trust’s organizational documents, its officers and trustees are indemnified by the Trust against certain liabilities arising out of the performance of their duties to the Trust. Additionally, in the normal course of business, the Trust, on behalf of the Fund, enters into contracts with service providers that contain general indemnification clauses. The Trust’s maximum exposure under these arrangements is unknown as this would involve future claims that may be made against the Trust that have not yet occurred. Currently, the Trust expects the risk of loss to be remote.
2. Shares of Beneficial Interest
At December 31, 2014, there were an unlimited number of shares authorized (without par value). Transactions in the Fund’s shares were as follows:
| | | | | | | | | | | | | | | | | | |
| | | Year Ended December 31, | |
| | | 2014 | | | | | 2013 | |
| | | Shares | | | Amount | | | | | Shares | | | Amount | |
| | | | | |
| Class 1 Shares: | | | | | | | | | | | | | | | | | | |
Shares sold | | | 31,917 | | | $ | 725,026 | | | | | | 44,760 | | | $ | 1,035,207 | |
Shares issued in reinvestment of distributions | | | 7,051 | | | | 163,086 | | | | | | 11,601 | | | | 247,908 | |
Shares redeemed | | | (42,408 | ) | | | (993,663 | ) | | | | | (5,936 | ) | | | (133,915 | ) |
| | | | |
Net increase (decrease) | | | (3,440 | ) | | $ | (105,551 | ) | | | | | 50,425 | | | $ | 1,149,200 | |
| | | | |
FRANKLIN TEMPLETON VARIABLE INSURANCE PRODUCTS TRUST
NOTES TO FINANCIAL STATEMENTS
Franklin Mutual Global Discovery VIP Fund (continued)
| | | | | | | | | | | | | | | | | | |
| | | Year Ended December 31, | |
| | | 2014 | | | | | 2013 | |
| | | Shares | | | Amount | | | | | Shares | | | Amount | |
| | | | | |
| Class 2 Shares: | | | | | | | | | | | | | | | | | | |
Shares sold | | | 4,023,757 | | | $ | 92,853,300 | | | | | | 4,182,129 | | | $ | 92,856,510 | |
Shares issued in reinvestment of distributions | | | 2,672,405 | | | | 60,503,258 | | | | | | 3,546,518 | | | | 74,335,016 | |
Shares redeemed | | | (5,665,511 | ) | | | (130,160,828 | ) | | | | | (10,488,139 | ) | | | (234,231,053 | ) |
| | | | |
Net increase (decrease) | | | 1,030,651 | | | $ | 23,195,730 | | | | | | (2,759,492 | ) | | $ | (67,039,527 | ) |
| | | | |
| Class 4 Shares: | | | | | | | | | | | | | | | | | | |
Shares sold | | | 84,657 | | | $ | 1,961,531 | | | | | | 372,331 | | | $ | 8,412,949 | |
Shares issued on reinvestment of distributions | | | 233,144 | | | | 5,345,990 | | | | | | 347,770 | | | | 7,372,718 | |
Shares redeemed | | | (685,719 | ) | | | (16,234,210 | ) | | | | | (733,968 | ) | | | (16,611,191 | ) |
| | | | |
Net increase (decrease) | | | (367,918 | ) | | $ | (8,926,689 | ) | | | | | (13,867 | ) | | $ | (825,524 | ) |
| | | | |
3. Transactions With Affiliates
Franklin Resources, Inc. is the holding company for various subsidiaries that together are referred to as Franklin Templeton Investments. Certain officers and trustees of the Fund are also officers and/or directors of the following subsidiaries:
| | |
| Subsidiary | | Affiliation |
Franklin Mutual Advisers, LLC (Franklin Mutual) | | Investment manager |
Franklin Templeton Services, LLC (FT Services) | | Administrative manager |
Franklin Templeton Distributors, Inc. (Distributors) | | Principal underwriter |
Franklin Templeton Investor Services, LLC (Investor Services) | | Transfer agent |
a. Management Fees
The Fund pays an investment management fee to Franklin Mutual based on the average daily net assets of the Fund as follows:
| | |
| Annualized Fee Rate | | Net Assets |
0.950% | | Up to and including $200 million |
0.935% | | Over $200 million, up to and including $700 million |
0.900% | | Over $700 million, up to and including $1.2 billion |
0.875% | | Over $1.2 billion, up to and including $4 billion |
0.845% | | Over $4 billion, up to and including $7 billion |
0.825% | | Over $7 billion, up to and including $10 billion |
0.805% | | In excess of $10 billion |
Effective May 1, 2014, the Fund combined its investment management and administration agreements as approved by the Board. The fees paid under the combined agreement do not exceed the aggregate fees that were paid under the separate agreements.
Prior to May 1, 2014, the Fund paid fees to Franklin Mutual based on the average daily net assets of the Fund as follows:
| | |
| Annualized Fee Rate | | Net Assets |
0.800% | | Up to and including $4 billion |
0.770% | | Over $4 billion, up to and including $7 billion |
0.750% | | Over $7 billion, up to and including $10 billion |
0.730% | | In excess of $10 billion |
FRANKLIN TEMPLETON VARIABLE INSURANCE PRODUCTS TRUST
NOTES TO FINANCIAL STATEMENTS
Franklin Mutual Global Discovery VIP Fund (continued)
3. Transactions With Affiliates (continued)
b. Administrative Fees
Effective May 1, 2014, under an agreement with Franklin Mutual, FT Services provides administrative services to the Fund. The fee is paid by Franklin Mutual based on the Fund’s average daily net assets, and is not an additional expense of the Fund.
Prior to May 1, 2014, the Fund paid fees to FT Services based on the average daily net assets of the Fund as follows:
| | |
| Annualized Fee Rate | | Net Assets |
0.150% | | Up to and including $200 million |
0.135% | | Over $200 million, up to and including $700 million |
0.100% | | Over $700 million, up to and including $1.2 billion |
0.075% | | In excess of $1.2 billion |
c. Distribution Fees
The Board has adopted distribution plans for Class 2 and Class 4 shares pursuant to Rule 12b-1 under the 1940 Act. Under the Fund’s compensation distribution plans, the Fund pays Distributors for costs incurred in connection with the servicing, sale and distribution of the Fund’s shares up to 0.35% per year of its average daily net assets of each class. Some distribution fees are not charged on shares held by affiliates. The Board has agreed to limit the current rate to 0.25% per year for Class 2. The plan year, for purposes of monitoring compliance with the maximum annual plan rates, is February 1 through January 31.
d. Transfer Agent Fees
Investor Services, under terms of an agreement, performs shareholder servicing for the Fund and is not paid by the Fund for the services.
4. Expense Offset Arrangement
The Fund has entered into an arrangement with its custodian whereby credits realized as a result of uninvested cash balances are used to reduce a portion of the Fund’s custodian expenses. During the year ended December 31, 2014, the custodian fees were reduced as noted in the Statement of Operations.
5. Income Taxes
The tax character of distributions paid during the years ended December 31, 2014 and 2013, was as follows:
| | | | | | | | |
| | | 2014 | | | 2013 | |
Distributions paid from: | | | | | | | | |
Ordinary income | | $ | 23,269,495 | | | $ | 18,220,656 | |
Long term capital gain | | | 42,742,840 | | | | 63,734,986 | |
| | | | |
| | $ | 66,012,335 | | | $ | 81,955,642 | |
| | | | |
FRANKLIN TEMPLETON VARIABLE INSURANCE PRODUCTS TRUST
NOTES TO FINANCIAL STATEMENTS
Franklin Mutual Global Discovery VIP Fund (continued)
At December 31, 2014, the cost of investments, net unrealized appreciation (depreciation), undistributed ordinary income and undistributed long term capital gains for income tax purposes were as follows:
| | | | |
Cost of investments | | $ | 570,998,758 | |
| | | | |
Unrealized appreciation | | $ | 208,450,604 | |
Unrealized depreciation | | | (36,961,890 | ) |
| | | | |
Net unrealized appreciation (depreciation) | | $ | 171,488,714 | |
| | | | |
Undistributed ordinary income | | $ | 20,300,159 | |
Undistributed long term capital gains | | | 41,340,807 | |
| | | | |
Distributable earnings | | $ | 61,640,966 | |
| | | | |
Differences between income and/or capital gains as determined on a book basis and a tax basis are primarily due to differing treatments of foreign currency transactions, tax straddles and bond discounts and premiums.
6. Investment Transactions
Purchases and sales of investments (excluding short term securities and securities sold short) for the year ended December 31, 2014, aggregated $162,450,101 and $184,449,486, respectively.
Transactions in options written during the year ended December 31, 2014, were as follows:
| | | | | | | | |
| | | Number of
Contracts | | | Premiums
Received | |
Options outstanding at December 31, 2013 | | | — | | | $ | — | |
Options written | | | 40 | | | | 19,962 | |
Options expired | | | — | | | | — | |
Options exercised | | | (40 | ) | | | (19,962 | ) |
Options closed | | | — | | | | — | |
| | | | |
Options outstanding at December 31, 2014 | | | — | | | $ | — | |
| | | | |
See Notes 1(c) and 9 regarding derivative financial instruments and other derivative information, respectively.
7. Credit Risk and Defaulted Securities
The Fund may purchase the pre-default or defaulted debt of distressed companies. Distressed companies are financially troubled and are about to be or are already involved in financial restructuring or bankruptcy. Risks associated with purchasing these securities include the possibility that the bankruptcy or other restructuring process takes longer than expected, or that distributions in restructuring are less than anticipated, either or both of which may result in unfavorable consequences to the Fund. If it becomes probable that the income on debt securities, including those of distressed companies, will not be collected, the Fund discontinues accruing income and recognizes an adjustment for uncollectible interest.
At December 31, 2014, the aggregate long value of distressed company securities for which interest recognition has been discontinued was $8,028,378, representing 1.07% of the Fund’s net assets. For information as to specific securities, see the accompanying Statement of Investments.
8. Restricted Securities
The Fund invests in securities that are restricted under the Securities Act of 1933 (1933 Act) or which are subject to legal, contractual, or other agreed upon restrictions on resale. Restricted securities are often purchased in private placement transactions, and cannot be sold without prior registration unless the sale is pursuant to an exemption under the 1933 Act. Disposal of these securities
FRANKLIN TEMPLETON VARIABLE INSURANCE PRODUCTS TRUST
NOTES TO FINANCIAL STATEMENTS
Franklin Mutual Global Discovery VIP Fund (continued)
8. Restricted Securities (continued)
may require greater effort and expense, and prompt sale at an acceptable price may be difficult. The Fund may have registration rights for restricted securities. The issuer generally incurs all registration costs.
At December 31, 2014, the Fund held investments in restricted securities, excluding certain securities exempt from registration under the 1933 Act deemed to be liquid, as follows:
| | | | | | | | | | | | | | |
Principal
Amount/
Shares/Units | | Issuer | | Acquisition
Dates | | | Cost | | | Value | |
| 595 | | Broadband Ventures III LLC, secured promissory note, 5.00%, 2/01/12 | | | 7/01/10 - 11/30/12 | | | $ | 595 | | | $ | — | |
| 2,077,368 | | FIM Coinvestor Holdings I, LLC | | | 11/20/06 - 6/02/09 | | | | — | | | | — | |
| 2,172,000 | | Hightower Holding LLC, pfd., A, Series 2 | | | 6/10/10 - 5/10/12 | | | | 5,430,000 | | | | 5,052,941 | |
| 424,073 | | International Automotive Components Group Brazil LLC | | | 4/13/06 - 12/26/08 | | | | 281,629 | | | | 40,109 | |
| 4,052,916 | | International Automotive Components Group North America LLC | | | 1/12/06 - 3/18/13 | | | | 3,247,714 | | | | 3,068,787 | |
| 2,140 | | Olympus Re Holdings Ltd. | | | 12/19/01 | | | | 199,920 | | | | — | |
| | | | | | | | | | |
| | Total Restricted Securities (Value is 1.09% of Net Assets) | | | | | | $ | 9,159,858 | | | $ | 8,161,837 | |
| | | | | | | | | | |
9. Other Derivative Information
At December 31, 2014, the Fund’s investments in derivative contracts are reflected on the Statement of Assets and Liabilities as follows:
| | | | | | | | | | | | |
| | | Asset Derivatives | | | Liability Derivatives | |
Derivative Contracts
Not Accounted for
as Hedging Instruments | | Statement of Assets and
Liabilities Location | | Fair Value | | | Statement of Assets and
Liabilities Location | | Fair Value | |
Foreign exchange contracts | | Unrealized appreciation on forward exchange contracts / Net assets consist of - net unrealized appreciation (depreciation) | | $ | 6,243,611 | a | | Unrealized depreciation on forward exchange contracts | | $ | 611,927 | |
aIncludes cumulative appreciation (depreciation) of futures contracts as reported in the Statement of Investments. Only current day’s variation margin is separately reported within the Statement of Assets and Liabilities.
For the year ended December 31, 2014, the effect of derivative contracts on the Fund’s Statement of Operations was as follows:
| | | | | | | | | | |
Derivative Contracts
Not Accounted for
as Hedging Instruments | | Statement of Operations Locations | | Realized
Gain (Loss)
for the Year | | | Change in
Unrealized
Appreciation
(Depreciation)
for the Year | |
Foreign exchange contracts | | Net realized gain (loss) from foreign currency transactions and futures contracts / Net change in unrealized appreciation (depreciation) on translation of other assets and liabilities denominated in foreign currencies | | $ | 3,281,768 | | | $ | 10,271,228 | |
For the year ended December 31, 2014, the average month end fair value of derivatives represented 0.58% of average month end net assets. The average month end number of open derivative contracts for the year was 219.
See Notes 1(c) and 6 regarding derivative financial instruments and investment transactions, respectively.
FRANKLIN TEMPLETON VARIABLE INSURANCE PRODUCTS TRUST
NOTES TO FINANCIAL STATEMENTS
Franklin Mutual Global Discovery VIP Fund (continued)
10. Holdings of 5% Voting Securities of Portfolio Companies
The 1940 Act defines “affiliated companies” to include investments in portfolio companies in which a fund owns 5% or more of the outstanding voting securities. Investments in “affiliated companies” for the Fund for the year ended December 31, 2014, were as shown below.
| | | | | | | | | | | | | | | | | | | | | | | | | | | | |
| Name of Issuer | | Number of Shares Held at Beginning of Year | | | Gross Additions | | | Gross Reductions | | | Number of Shares Held at End of Year | | | Value at End of Year | | | Investment Income | | | Realized Capital Gain (Loss) | |
| Non-Controlled Affiliates | | | | | | | | | | | | | | | | | | | | | | | | | | | | |
The Bankshares Inc. (Value is 0.00% of Net Assets) | | | 800,000 | | | | — | | | | (800,000 | )a | | | — | | | $ | — | | | $ | — | | | $ | — | |
| | | | | | | | | | | | | | | | | | | | | | | | | | | | |
a Gross reduction was the result of a corporate action.
11. Credit Facility
The Fund, together with other U.S. registered and foreign investment funds (collectively, Borrowers), managed by Franklin Templeton Investments, are borrowers in a joint syndicated senior unsecured credit facility totaling $1.5 billion (Global Credit Facility) which matured on February 13, 2015. This Global Credit Facility provides a source of funds to the Borrowers for temporary and emergency purposes, including the ability to meet future unanticipated or unusually large redemption requests. The Borrowers expect to renew the Global Credit Facility for a total of $2 billion effective February 13, 2015, which matures on February 12, 2016.
Under the terms of the Global Credit Facility, the Fund shall, in addition to interest charged on any borrowings made by the Fund and other costs incurred by the Fund, pay its share of fees and expenses incurred in connection with the implementation and maintenance of the Global Credit Facility, based upon its relative share of the aggregate net assets of all of the Borrowers, including an annual commitment fee of 0.07% based upon the unused portion of the Global Credit Facility. These fees are reflected in other expenses on the Statement of Operations. During the year ended December 31, 2014, the Fund did not use the Global Credit Facility.
12. Fair Value Measurements
The Fund follows a fair value hierarchy that distinguishes between market data obtained from independent sources (observable inputs) and the Fund’s own market assumptions (unobservable inputs). These inputs are used in determining the value of the Fund’s financial instruments and are summarized in the following fair value hierarchy:
| | • | | Level 1 – quoted prices in active markets for identical financial instruments |
| | • | | Level 2 – other significant observable inputs (including quoted prices for similar financial instruments, interest rates, prepayment speed, credit risk, etc.) |
| | • | | Level 3 – significant unobservable inputs (including the Fund’s own assumptions in determining the fair value of financial instruments) |
The input levels are not necessarily an indication of the risk or liquidity associated with financial instruments at that level.
For movements between the levels within the fair value hierarchy, the Fund has adopted a policy of recognizing the transfers as of the date of the underlying event which caused the movement.
FRANKLIN TEMPLETON VARIABLE INSURANCE PRODUCTS TRUST
NOTES TO FINANCIAL STATEMENTS
Franklin Mutual Global Discovery VIP Fund (continued)
12. Fair Value Measurements (continued)
A summary of inputs used as of December 31, 2014, in valuing the Fund’s assets and liabilities carried at fair value, is as follows:
| | | | | | | | | | | | | | | | |
| | | Level 1 | | | Level 2 | | | Level 3 | | | Total | |
| Assets: | | | | | | | | | | | | | | | | |
Investments in Securities: | | | | | | | | | | | | | | | | |
Equity Investments:a | | | | | | | | | | | | | | | | |
Auto Components | | $ | 2,805,162 | | | $ | — | | | $ | 3,108,896 | | | $ | 5,914,058 | |
Banks | | | 120,360,681 | | | | 7,233,910 | | | | — | | | | 127,594,591 | |
Diversified Financial Services | | | — | | | | — | | | | 5,052,941 | | | | 5,052,941 | |
Oil, Gas & Consumable Fuels | | | 57,552,378 | | | | 36,020 | | | | — | | | | 57,588,398 | |
Paper & Forest Products | | | — | | | | 1,762,002 | | | | — | | | | 1,762,002 | |
Real Estate Management & Development | | | 3,068,325 | | | | — | | | | 4,108,670 | | | | 7,176,995 | |
All Other Equity Investmentsb | | | 480,343,504 | | | | — | | | | — | c | | | 480,343,504 | |
Corporate Bonds, Notes and Senior Floating Rate Interests | | | — | | | | 21,983,586 | | | | — | | | | 21,983,586 | |
Corporate Notes and Senior Floating Rate Interests in Reorganization | | | — | | | | 8,028,378 | | | | — | c | | | 8,028,378 | |
Companies in Liquidation | | | 12,911 | | | | 4,341,035 | | | | — | c | | | 4,353,946 | |
Municipal Bonds | | | — | | | | 1,975,549 | | | | — | | | | 1,975,549 | |
Short Term Investments | | | 17,349,370 | | | | 3,364,154 | | | | — | | | | 20,713,524 | |
| | | | |
Total Investments in Securities | | $ | 681,492,331 | | | $ | 48,724,634 | | | $ | 12,270,507 | | | $ | 742,487,472 | |
| | | | |
Other Financial Instruments | | | | | | | | | | | | | | | | |
Futures Contracts | | $ | 1,015,225 | | | $ | — | | | $ | — | | | $ | 1,015,225 | |
Forward Exchange Contracts | | | — | | | | 5,228,386 | | | | — | | | | 5,228,386 | |
| | | | |
Total Other Financial Instruments | | $ | 1,015,225 | | | $ | 5,228,386 | | | $ | — | | | $ | 6,243,611 | |
| | | | |
| | | | |
| Liabilities: | | | | | | | | | | | | | | | | |
Other Financial Instruments | | | | | | | | | | | | | | | | |
Securities Sold Short | | $ | 4,854,863 | | | $ | — | | | $ | — | | | $ | 4,854,863 | |
Forward Exchange Contracts | | | — | | | | 611,927 | | | | — | | | | 611,927 | |
| | | | |
Total Other Financial Instruments | | $ | 4,854,863 | | | $ | 611,927 | | | $ | — | | | $ | 5,466,790 | |
| | | | |
aIncludes common and preferred stocks as well as other equity investments.
bFor detailed categories, see the accompanying Statement of Investments.
cIncludes securities determined to have no value at December 31, 2014.
FRANKLIN TEMPLETON VARIABLE INSURANCE PRODUCTS TRUST
NOTES TO FINANCIAL STATEMENTS
Franklin Mutual Global Discovery VIP Fund (continued)
A reconciliation of assets in which Level 3 inputs are used in determining fair value is presented when there are significant Level 3 financial instruments at the end of the year. At December 31, 2014, the reconciliation of assets is as follows:
| | | | | | | | | | | | | | | | | | | | | | | | | | | | | | | | | | | | | | | | |
| | | Balance
at
Beginning
of
Year | | | Purchases | | | Sales | | | Transfers
Into
Level 3 | | | Transfer
Out of
Level 3a | | | Cost
Basis
Adjust
mentsb | | | Net
Realized
Gain
(Loss) | | | Net
Unrealized
Appr
eciation
(Depre
ciation) | | | Balance
at
End of
Year | | | Net
Change
in
Unrealized
Appre
ciation
(Deprec
iation)
on Assets
Held at
Year End | |
| Assets: | | | | | | | | | | | | | | | | | | | | | | | | | | | | | | | | | | | | | | | | |
Investments in Securities: | | | | | | | | | | | | | | | | | | | | | | | | | | | | | | | | | | | | | | | | |
Equity Investments:c | | | | | | | | | | | | | | | | | | | | | | | | | | | | | | | | | | | | | | | | |
Auto Components | | $ | 2,375,839 | | | $ | — | | | $ | — | | | $ | — | | | $ | — | | | $ | — | | | $ | — | | | $ | 733,057 | | | $ | 3,108,896 | | | $ | 733,057 | |
Banks | | | 3,815,192 | | | | — | | | | — | | | | — | | | | (4,132,633 | ) | | | — | | | | — | | | | 317,441 | | | | — | | | | — | |
Diversified Financial Services | | | 4,131,361 | | | | — | | | | — | | | | — | | | | — | | | | — | | | | — | | | | 921,580 | | | | 5,052,941 | | | | 921,580 | |
Insurance | | | 410,692 | d | | | — | | | | (391,596 | ) | | | — | | | | — | | | | (557 | ) | | | (184,109 | ) | | | 165,570 | | | | — | d | | | 557 | |
Real Estate Management & Development | | | 2,518,473 | | | | — | | | | — | | | | — | | | | — | | | | — | | | | — | | | | 1,590,197 | | | | 4,108,670 | | | | 1,590,197 | |
| | | | |
Total | | $ | 13,251,557 | | | $ | — | | | $ | (391,596 | ) | | $ | — | | | $ | (4,132,633 | ) | | $ | (557 | ) | | $ | (184,109 | ) | | $ | 3,727,845 | | | $ | 12,270,507 | | | $ | 3,245,391 | |
| | | | |
aThe investment was transferred out of Level 3 as a result of a corporation action.
bMay include accretion, amortization, partnership adjustments, and/or other cost basis adjustments.
cIncludes common and preferred stocks as well as other equity investments.
dIncludes securities determined to have no value.
Significant unobservable valuation inputs developed by the VLOC for material Level 3 financial instruments and impact to fair value as a result of changes in unobservable valuation inputs as of December 31, 2014, are as follows:
| | | | | | | | | | | | | | | | |
| Description | | Fair Value at
End of Year | | | Valuation
Technique | | Unobservable Inputs | | Amount/
Range | | | Impact to Fair
Value if Input
Increasesa | |
| Assets: | | | | | | | | | | | | | | | | |
| | | | | |
Investments in Securities: | | | | | | | | | | | | | | | | |
| | | | | |
Equity Investments:b | | | | | | | | | | | | | | | | |
| | | | | |
Auto Components | | $ | 3,068,787 | | | Market comparables | | Discount for lack of marketability EV / EBITDA multiple | |
| 10%
3.6x |
| |
| Decrease
Increased | c
|
Diversified Financial Services | | | 5,052,941 | | | Discounted cash flow model | | Cost of equity Long-term revenue growth rate Adjusted EBITDA margin | |
| 16%
6.2% - 29.0%
5.0% - 26.9% |
| |
| Decrease
Increased Increase |
|
Real Estate Management & Development | | | 4,108,670 | | | Market comparables | | Discount for lack of marketability | | | 8% | | | | Decrease | c |
All Other Investmentse | | | 40,109 | | | | | | | | | | | | | |
Total | | $ | 12,270,507 | | | | | | | | | | | | | |
aRepresents the directional change in the fair value of the Level 3 investments that would result from a significant and reasonable increase in the corresponding input. A significant and reasonable decrease in the input would have the opposite effect. Significant impacts, if any, to fair value and/or net assets have been indicated.
bIncludes common and preferred stocks.
cRepresents a significant impact to fair value but not net assets.
dRepresents a significant impact to fair value and net assets.
eIncludes fair value of immaterial investments developed using various valuation techniques and unobservable inputs. May also include investments with values derived using prior transaction prices or third party pricing information without adjustment for which such inputs are also unobservable.
FRANKLIN TEMPLETON VARIABLE INSURANCE PRODUCTS TRUST
NOTES TO FINANCIAL STATEMENTS
Franklin Mutual Global Discovery VIP Fund (continued)
12. Fair Value Measurements (continued)
Abbreviations List
| | |
| |
| EBITDA | | Earnings before interest, taxes, depreciation and amortization |
| |
| EV | | Enterprise value |
13. New Accounting Pronouncements
In June 2014, the Financial Accounting Standards Board issued Accounting Standards Update (ASU) No. 2014-11, Transfers and Servicing (Topic 860), Repurchase-to-Maturity Transactions, Repurchase Financings, and Disclosures. The ASU changes the accounting for certain repurchase agreements and expands disclosure requirements related to repurchase agreements, securities lending, repurchase-to-maturity and similar transactions. The ASU is effective for interim and annual reporting periods beginning after December 15, 2014. Management has reviewed the requirements and believes the adoption of this ASU will not have a material impact on the financial statements.
14. Subsequent Events
The Fund has evaluated subsequent events through the issuance of the financial statements and determined that no events have occurred that require disclosure other than those already disclosed in the financial statements.
Abbreviations
| | | | | | | | | | |
| Counterparty | | | | Currency | | Selected Portfolio |
| | | | | |
| BOFA | | Bank of America N.A. | | CHF | | Swiss Franc | | ADR | | American Depositary Receipt |
| | | | | |
| BONY | | Bank of New York Mellon | | EUR | | Euro | | FHLB | | Federal Home Loan Bank |
| | | | | |
| BZWS | | Barclays Bank PLC | | GBP | | British Pound | | GO | | General Obligation |
| | | | | |
| DBAB | | Deutsche Bank AG | | USD | | United States Dollar | | IDR | | International Depositary Receipt |
| | | | | |
| FBCO | | Credit Suisse Group AG | | | | | | PIK | | Payment-In-Kind |
| | | | | |
| HSBC | | HSBC Bank USA, N.A. | | | | | | | | |
| | | | | |
| SCBT | | Standard Chartered Bank | | | | | | | | |
| | | | | |
| SSBT | | State Street Bank and Trust Co. | | | | | | | | |
FRANKLIN TEMPLETON VARIABLE INSURANCE PRODUCTS TRUST
Report of Independent Registered Public Accounting Firm
Franklin Mutual Global Discovery VIP Fund
To the Board of Trustees and Shareholders of Franklin Templeton Variable Insurance Products Trust
In our opinion, the accompanying statement of assets and liabilities, including the statement of investments, and the related statements of operations and of changes in net assets and the financial highlights present fairly, in all material respects, the financial position of Franklin Mutual Global Discovery VIP Fund (the “Fund”) at December 31, 2014, the results of its operations for the year then ended, the changes in its net assets for each of the two years in the period then ended and the financial highlights for each of the five years in the period then ended, in conformity with accounting principles generally accepted in the United States of America. These financial statements and financial highlights (hereafter referred to as “financial statements”) are the responsibility of the Fund’s management. Our responsibility is to express an opinion on these financial statements based on our audits. We conducted our audits of these financial statements in accordance with the standards of the Public Company Accounting Oversight Board (United States). Those standards require that we plan and perform the audit to obtain reasonable assurance about whether the financial statements are free of material misstatement. An audit includes examining, on a test basis, evidence supporting the amounts and disclosures in the financial statements, assessing the accounting principles used and significant estimates made by management, and evaluating the overall financial statement presentation. We believe that our audits, which included confirmation of securities at December 31, 2014 by correspondence with the custodian and brokers, provide a reasonable basis for our opinion.
PricewaterhouseCoopers LLP
San Francisco, California
February 13, 2015
FRANKLIN TEMPLETON VARIABLE INSURANCE PRODUCTS TRUST
Tax Information (unaudited)
Franklin Mutual Global Discovery VIP Fund
Under Section 852(b)(3)(C) of the Internal Revenue Code (Code), the Fund hereby reports the maximum amount allowable but no less than $42,742,840 as a long term capital gain dividend for the fiscal year ended December 31, 2014.
Under Section 854(b)(1)(A) of the Code, the Fund hereby reports 31.13% of the ordinary income dividends as income qualifying for the dividends received deduction for the fiscal year ended December 31, 2014.
Franklin Mutual Shares VIP Fund
(Formerly, Mutual Shares Securities Fund)
This annual report for Franklin Mutual Shares VIP Fund covers the fiscal year ended December 31, 2014.
Class 2 Performance Summary as of December 31, 2014
Average annual total return of Class 2 shares represents the average annual change in value, assuming reinvestment of dividends and capital gains. Average returns smooth out variations in returns, which can be significant; they are not the same as year-by-year results.
| | | | | | | | | | | | |
| Periods ended 12/31/14 | | 1-Year | | | 5-Year | | | 10-Year | |
Average Annual Total Return | | | +7.12% | | | | +11.55% | | | | +6.37% | |
Performance reflects the Fund’s Class 2 operating expenses, but does not include any contract fees, expenses or sales charges. If they had been included, performance would be lower. These charges and deductions, particularly for variable life policies, can have a significant effect on contract values and insurance benefits. See the contract prospectus for a complete description of these expenses, including sales charges.
Performance data represent past performance, which does not guarantee future results. Investment return and principal value will fluctuate, and you may have a gain or loss when you sell your shares. Current performance may differ from figures shown.
Total Return Index Comparison for a Hypothetical $10,000 Investment (1/1/05–12/31/14)
The graph below shows the change in value of a hypothetical $10,000 investment in the Fund over the indicated period and includes reinvestment of any income or distributions. The Fund’s performance is compared to the performance of the Standard & Poor’s® 500 Index (S&P 500®). One cannot invest directly in an index, and an index is not representative of the Fund’s portfolio. Please see Important Notes to Performance Information preceding the Fund Summaries.
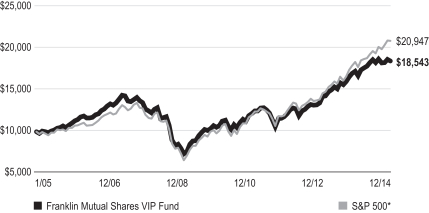
*Source: Morningstar. Please see Index Descriptions following the Fund Summaries.
FRANKLIN MUTUAL SHARES VIP FUND
Fund Goals and Main Investments
Franklin Mutual Shares VIP Fund seeks capital appreciation, with income as a secondary goal. Under normal market conditions, the Fund invests primarily in U.S. and foreign equity securities that the investment manager believes are undervalued.
Fund Risks
All investments involve risks, including possible loss of principal. Value securities may not increase in price as anticipated or may decline further in value. The Fund’s investments in foreign securities involve special risks including currency fluctuations, and economic and political uncertainties. The Fund may also invest in companies engaged in mergers, reorganizations or liquidations, which involve special risks as pending deals may not be completed on time or on favorable terms, as well as lower rated bonds, which entail higher credit risk. The Fund is actively managed but there is no guarantee that the manager’s investment decisions will produce the desired results. The Fund’s prospectus also includes a description of the main investment risks.
Performance Overview
You can find the Fund’s one-year total return in the Performance Summary. In comparison, the Fund’s benchmark, the S&P 500, delivered a +13.69% total return for the period under review.1
Economic and Market Overview
The global economy grew moderately during 2014 as U.S. economic growth expanded while growth rates in much of the rest of the world declined. U.S. economic activity was supported in some quarters by increased consumer spending, business investment and federal defense spending. The housing market strengthened, and lower gasoline prices and improved job growth contributed to rising retail sales. The U.S. Federal Reserve Board (Fed) began reducing its large-scale bond purchases $10 billion a month in January and ended the buying program in October. But it continued its practice of maintaining holdings of longer term securities at sizable levels. Toward period-end, the Fed stated that it could be patient with regard to raising interest rates and that the interest rate might not rise for at least a couple of meetings, possibly implying at least the first two meetings of 2015.
Outside the U.S., the U.K. economy grew relatively well, supported by the services and manufacturing sectors. In the eurozone, economic growth remained subdued, as concerns persisted about the potential negative impacts to growth from the crisis in Ukraine and China’s moderating growth rate. In June, the European Central Bank (ECB) reduced its main interest rate and, for the first time, set a negative deposit rate; the ECB reduced both rates again in September. The ECB broadened its monetary easing stance by implementing an asset purchase program to prevent deflation and stimulate the economy. Japan’s second- and third-quarter economic contractions indicated the economy was in a recession, although private consumption and exports improved in the third quarter. In October, the Bank of Japan expanded its stimulus measures amid weak domestic demand and as substantially lower crude oil prices exerted further downward pressure on inflation. Near period-end, Japan’s ruling coalition was reelected in early parliamentary elections and subsequently announced a fresh stimulus package aimed at reviving economic growth.
Global developed market stocks, as measured by the MSCI World Index, advanced overall during the 12-month period amid a generally accommodative monetary policy environment and continued strength in corporate earnings.2 In several emerging markets, economic growth generally moderated. Emerging market stocks overall, as measured by the MSCI Emerging Markets Index, fell for the year, amid headwinds such as soft domestic demand, weak exports, plummeting crude oil prices, regional geopolitical tensions and concerns about possible U.S. interest rate increases.2 Many emerging market currencies depreciated against the U.S. dollar, leading several central banks to raise interest rates seeking to support their currencies. Several other central banks lowered interest rates to promote economic growth. Gold prices ended the year lower amid benign global inflation and a strong U.S. dollar.
Investment Strategy
At Mutual Series, we are committed to our distinctive value approach to investing. Our major investment strategy is investing in undervalued stocks. When selecting undervalued equities, we are attracted to fundamentally strong companies with healthy balance sheets, high-quality assets, substantial free cash flow and shareholder-oriented management teams and whose stocks are trading at discounts to our assessment of the
1. Source: Morningstar.
One cannot invest directly in an index, and an index is not representative of the Fund’s portfolio. Please see Index Descriptions following the Fund Summaries.
2. Please see Index Descriptions following the Fund Summaries.
FRANKLIN MUTUAL SHARES VIP FUND
companies’ intrinsic or business value. We also look for asset rich companies whose shares may be trading at depressed levels due to concerns over short-term earnings disappointments, litigation, management strategy or other perceived negatives. While the vast majority of our undervalued equity investments are made in publicly traded companies globally, we may invest occasionally in privately held companies as well.
We complement this more traditional investment strategy with two others. One is distressed investing, which is complex and can take many forms. The most common distressed investment the Fund undertakes is the purchase of financially troubled or bankrupt companies’ debt at a substantial discount to face value. After the financially distressed company is reorganized, often in bankruptcy court, the old debt is typically replaced with new securities issued by the financially stronger company.
The other piece of our investment strategy is participating in arbitrage situations, another highly specialized field. When companies announce proposed mergers or takeovers, commonly referred to as “deals,” the target company may trade at a discount to the bid it ultimately accepts. One form of arbitrage involves purchasing the target company’s stock when it is trading below the value we believe it would receive in a deal. In keeping with our commitment to a relatively conservative investment approach, we typically focus our arbitrage efforts on announced deals, and eschew rumored deals or other situations we consider relatively risky.
In addition, it is our practice to hedge the Fund’s currency exposure when we deem it advantageous for our shareholders.
What is meant by “hedge”?
To hedge an investment is to take a position intended to offset potential losses/gains that may be incurred by a companion financial instrument.
Manager’s Discussion
Many Fund holdings increased in value during the 12-month period. Top contributors to performance included technology leader Apple, Teva Pharmaceutical Industries and retailer Kroger.
During the year Apple reported consistently good quarterly results, driven by its strong iPhone business. In addition, the company announced a trio of shareholder friendly actions. These included an enhanced share repurchase program of $90 billion, up from $60 billion, with the same end date of December 2015, an 8% increase in the dividend, and a seven-for-one stock split
| | | | |
| Top 10 Sectors/Industries | | | |
| Based on Equity Securities | | | |
| 12/31/14 | | | |
| | | % of Total
Net Assets | |
| Banks | | | 9.0% | |
| Media | | | 9.0% | |
| Insurance | | | 8.3% | |
| Pharmaceuticals | | | 6.9% | |
| Oil, Gas & Consumable Fuels | | | 6.7% | |
| Tobacco | | | 5.9% | |
| Software | | | 5.1% | |
| Health Care Equipment & Supplies | | | 4.2% | |
| Technology Hardware, Storage & Peripherals | | | 3.8% | |
| Food & Staples Retailing | | | 3.6% | |
that went into effect in early June. In September, the company released its highly anticipated iPhone 6, which sold 10 million units in its first two days. The iPhone sales drove a strong fiscal fourth quarter via healthy sales volumes and a strong product mix that led to a higher average selling price for the period. In October, the company refreshed its product line-up ahead of the holiday season, including launches of the new iPad Air 2, iPad Mini 3, iMac with Retina Display and an updated Mac Mini. Apple also announced the commencement of support for Apple Pay, its mobile payment and digital wallet application.
The performance of Israel-based Teva Pharmaceutical Industries was largely driven by positive events related to the company’s most profitable drug, Copaxone, used to prevent the relapse of multiple sclerosis. In March, the U.S. Supreme Court agreed to hear Teva’s appeal (with oral arguments occurring in October) to maintain a patent, which further delayed the entrance of generic competition. The delay provided Teva the opportunity to convert more U.S. patients to its new formulation and allowed it to potentially retain a higher portion of the franchise once generic alternatives entered the market. In December, Teva received more good news regarding Copaxone with the new formulation gaining European Union approval. Investors also reacted favorably to the January 2014 announcement of a new chief executive officer (CEO) as the market believed he could successfully carry on Teva’s cost-cutting restructuring program.
Kroger is a Cincinnati-based grocery retailer that operates over 2,400 grocery and multi-department stores in 31 states. During 2014, the company reported strong quarterly operating profits while also raising its fiscal year 2014 earnings outlook for three
FRANKLIN MUTUAL SHARES VIP FUND
consecutive quarters. The increase in the full-year outlook was driven in part by the acquisition of Harris Teeter, a stronger outlook for 2014 full-year sales and a decline in gasoline prices, which has helped the U.S. consumer. Kroger’s management team has been executing on a program called “Consumer First” for several years. This program has resonated with Kroger customers, enabling the company to gain market share, leverage fixed costs, drive operating profit growth and increase shareholder value.
During the period under review, some of the Fund’s investments negatively affected performance. These included offshore drilling company Transocean, natural resources firm Freeport-McMoRan and retailer Tesco.
Transocean is a Switzerland-headquartered company providing offshore contract drilling services. The offshore drilling market continued to be mired in a downturn with little clarity regarding the length and depth of the current cycle as oil prices plunged during the second half of 2014. Oil companies pushed back projects, leaving a number of new rigs without contracts and increasing potential downtime between jobs for existing rigs. The growing fleet of uncontracted rigs at period-end portended, in our view, weak second-half results and a challenging start to 2015. On a positive note, the company started a Master Limited Partnership (MLP), Transocean Partners, which went public in September. The MLP may provide Transocean with a way to generate cash by selling (dropping down) assets into Transocean Partners while still controlling the operations of those assets.
Shares of Freeport-McMoRan came under pressure during 2014 due in large part to falling crude oil prices during the second half of the year, as well as lower prices for copper and gold. The company’s stock also came under pressure from events related to its operations in Indonesia. In early 2014, Indonesia’s government issued new mining-related tax and regulatory policies with the apparent intent to force miners to build smelters within the country. In September, production at the company’s Grasberg mine in Indonesia declined following a fatal accident. The workers’ union subsequently threatened to strike, a development that ultimately did not occur. We took a favorable view of agreements announced in May for Freeport to sell shale assets in Texas and to purchase deepwater oil and gas projects in the Gulf of Mexico. We believe the deepwater assets are more attractive than the shale assets, and proceeds from the shale asset sale allowed Freeport to pay off some of its debt. In addition, we had a favorable view on copper over the longer term as we believed supply shortages were likely in the next few years.
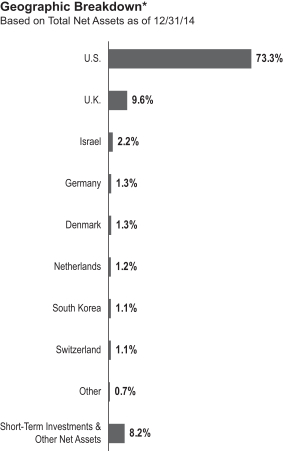
*Weightings may be negative or may not total 100% due to rounding, use of any derivatives, unsettled trades or other factors.
Shares of U.K.-based Tesco fell throughout 2014. In March, the stock declined as investors became more concerned about price competition from major discounters and competitor supermarkets. Then in August, Tesco issued an unexpected trading statement ahead of its scheduled first-half results. The company lowered its profit guidance primarily for its flagship U.K. operations and cut its dividend. The stock price took a further hit in September with the announcement of material accounting irregularities in Tesco’s core U.K. operations and a contemporaneous change of both the company’s CEO and chief financial officer. At year-end, the Fund no longer held Tesco shares.
During the period, the Fund held currency forwards and futures to somewhat hedge the currency risk of the portfolio’s non-U.S. dollar investments. The hedges had a positive impact on the Fund’s performance.
FRANKLIN MUTUAL SHARES VIP FUND
What is a currency forward contract?
A currency forward contract, or currency forward, is an agreement between the Fund and a counterparty to buy or sell a foreign currency at a specific exchange rate on a future date.
What is a futures contract?
A futures contract, or a future, is an agreement between the Fund and a counterparty made through a U.S. or foreign futures exchange to buy or sell an asset at a specific price on a future date.
Thank you for your participation in Franklin Mutual Shares VIP Fund. We look forward to serving your future investment needs.
The foregoing information reflects our analysis, opinions and portfolio holdings as of December 31, 2014, the end of the reporting period. The way we implement our main investment strategies and the resulting portfolio holdings may change depending on factors such as market and economic conditions. These opinions may not be relied upon as investment advice or an offer for a particular security. The information is not a complete analysis of every aspect of any market, country, industry, security or the Fund. Statements of fact are from sources considered reliable, but the investment manager makes no representation or warranty as to their completeness or accuracy. Although historical performance is no guarantee of future results, these insights may help you understand our investment management philosophy.
| | | | |
| Top 10 Equity Holdings | | | |
| 12/31/14 | | | |
Company
Sector/Industry, Country | | % of Total
Net Assets | |
Medtronic Inc. Health Care Equipment & Supplies, U.S. | | | 3.1% | |
Microsoft Corp. Software, U.S. | | | 2.9% | |
Merck & Co. Inc. Pharmaceuticals, U.S. | | | 2.6% | |
Teva Pharmaceutical Industries Ltd., ADR Pharmaceuticals, Israel | | | 2.2% | |
Apple Inc. Technology Hardware, Storage & Peripherals, U.S. | | | 2.2% | |
Twenty-First Century Fox Inc., B Media, U.S. | | | 2.0% | |
PNC Financial Services Group Inc. Banks, U.S. | | | 1.9% | |
American International Group Inc. Insurance, U.S. | | | 1.8% | |
British American Tobacco PLC Tobacco, U.K. | | | 1.7% | |
Time Warner Cable Inc. Media, U.S. | | | 1.7% | |
The dollar value, number of shares or principal amount, and names of all portfolio holdings are listed in the Fund’s Statement of Investments.
FRANKLIN MUTUAL SHARES VIP FUND
Class 2 Fund Expenses
As an investor in a variable insurance contract (Contract) that indirectly provides for investment in an underlying mutual fund, you can incur transaction and/or ongoing expenses at both the Fund level and the Contract level.
| • | | Transaction expenses can include sales charges (loads) on purchases, redemption fees, surrender fees, transfer fees and premium taxes. |
| • | | Ongoing expenses can include management fees, distribution and service (12b-1) fees, contract fees, annual maintenance fees, mortality and expense risk fees and other fees and expenses. All mutual funds and Contracts have some types of ongoing expenses. |
The expenses shown in the table are meant to highlight ongoing expenses at the Fund level only and do not include ongoing expenses at the Contract level, or transaction expenses at either the Fund or Contract level. While the Fund does not have transaction expenses, if the transaction and ongoing expenses at the Contract level were included, the expenses shown below would be higher. You should consult your Contract prospectus or disclosure document for more information.
The table shows Fund-level ongoing expenses and can help you understand these expenses and compare them with those of other mutual funds offered through the Contract. The table assumes a $1,000 investment held for the six months indicated. Please refer to the Fund prospectus for additional information on operating expenses.
Actual Fund Expenses
The first line (Actual) of the table provides actual account values and expenses. The “Ending Account Value” is derived from the Fund’s actual return, which includes the effect of ongoing Fund expenses, but does not include the effect of ongoing Contract expenses.
You can estimate the Fund-level expenses you incurred during the period by following these steps. Of course, your account value and expenses will differ from those in this illustration:
| 1. | Divide your account value by $1,000. |
If an account had an $8,600 value, then $8,600 ÷ $1,000 = 8.6.
| 2. | Multiply the result by the number under the heading “Fund-Level Expenses Incurred During Period.” |
If Fund-Level Expenses Incurred During Period were $7.50, then 8.6 × $7.50 = $64.50.
In this illustration, the estimated expenses incurred this period at the Fund level are $64.50.
Hypothetical Example for Comparison with Other Mutual Funds
Information in the second line (Hypothetical) of the table can help you compare ongoing expenses of the Fund with those of other mutual funds offered through the Contract. This information may not be used to estimate the actual ending account balance or expenses you incurred during the period. The hypothetical “Ending Account Value” is based on the Fund’s actual expense ratio and an assumed 5% annual rate of return before expenses, which does not represent the Fund’s actual return. The figure under the heading “Fund-Level Expenses Incurred During Period” shows the hypothetical expenses your account would have incurred under this scenario. You can compare this figure with the 5% hypothetical examples that appear in shareholder reports of other funds offered through a Contract.
| | | | | | | | | | | | |
| Class 2 | | Beginning Account Value 7/1/14 | | | Ending Account Value 12/31/14 | | | Fund-Level Expenses
Incurred During Period* 7/1/14–12/31/14 | |
Actual | | | $1,000 | | | | $ 991.50 | | | | $5.02 | |
Hypothetical (5% return before expenses) | | | $1,000 | | | | $1,020.16 | | | | $5.09 | |
*Expenses are calculated using the most recent six-month annualized expense ratio for the Fund’s Class 2 shares (1.00%), which does not include any ongoing expenses of the Contract for which the Fund is an investment option, multiplied by the average account value over the period, multiplied by 184/365 to reflect the one-half year period.
FRANKLIN TEMPLETON VARIABLE INSURANCE PRODUCTS TRUST
Financial Highlights
Franklin Mutual Shares VIP Fund
| | | | | | | | | | | | | | | | | | | | |
| | | Year Ended December 31, | |
| | | 2014 | | | 2013 | | | 2012 | | | 2011 | | | 2010 | |
| Class 1 | | | | | | | | | | | | | | | | | | | | |
Per share operating performance
(for a share outstanding throughout the year) | | | | | | | | | | | | | | | | | | | | |
| | | | | |
Net asset value, beginning of year | | | $21.92 | | | | $17.45 | | | | $15.57 | | | | $16.14 | | | | $14.75 | |
| | | | |
| | | | | |
| Income from investment operationsa: | | | | | | | | | | | | | | | | | | | | |
| | | | | |
Net investment incomeb | | | 0.62 | c | | | 0.42 | | | | 0.35 | | | | 0.38 | d | | | 0.40 | e |
| | | | | |
Net realized and unrealized gains (losses) | | | 1.01 | | | | 4.52 | | | | 1.92 | | | | (0.53 | ) | | | 1.27 | |
| | | | |
Total from investment operations | | | 1.63 | | | | 4.94 | | | | 2.27 | | | | (0.15 | ) | | | 1.67 | |
| | | | |
| | | | | |
| Less distributions from: | | | | | | | | | | | | | | | | | | | | |
| | | | | |
Net investment income | | | (0.52 | ) | | | (0.47 | ) | | | (0.39 | ) | | | (0.42 | ) | | | (0.28 | ) |
| | | | | |
Net realized gains | | | (0.12 | ) | | | — | | | | — | | | | — | | | | — | |
| | | | |
Total distributions | | | (0.64 | ) | | | (0.47 | ) | | | (0.39 | ) | | | (0.42 | ) | | | (0.28 | ) |
| | | | |
Net asset value, end of year | | | $22.91 | | | | $21.92 | | | | $17.45 | | | | $15.57 | | | | $16.14 | |
| | | | |
| | | | | |
Total returnf | | | 7.38% | | | | 28.53% | | | | 14.61% | | | | (0.79)% | | | | 11.47% | |
| | | | | |
| Ratios to average net assets | | | | | | | | | | | | | | | | | | | | |
| | | | | |
Expensesg | | | 0.73% | h | | | 0.71% | h | | | 0.71% | | | | 0.73% | h | | | 0.74% | h |
| | | | | |
Expenses incurred in connection with securities sold short | | | 0.03% | | | | —% | i | | | —% | i | | | —% | i | | | 0.02% | |
| | | | | |
Net investment income | | | 2.83% | c | | | 2.08% | | | | 2.06% | | | | 2.28% | d | | | 2.66% | e |
| | | | | |
| Supplemental data | | | | | | | | | | | | | | | | | | | | |
| | | | | |
Net assets, end of year (000’s) | | | $656,463 | | | | $552,163 | | | | $449,343 | | | | $1,170,781 | | | | $1,301,520 | |
| | | | | |
Portfolio turnover rate | | | 21.33% | | | | 24.05% | | | | 34.07% | j | | | 41.02% | | | | 32.05% | |
aThe amount shown for a share outstanding throughout the period may not correlate with the Statement of Operations for the period due to the timing of sales and repurchases of the Fund shares in relation to income earned and/or fluctuating fair value of the investments of the Fund.
bBased on average daily shares outstanding.
cNet investment income per share includes approximately $0.23 per share received in the form of special dividends paid in connection with certain Fund’s holdings. Excluding these amounts, the ratio of net investment income to average net assets would have been 1.79%.
dNet investment income per share includes approximately $0.02 per share related to interest income received that had previously been deemed uncollectible. Excluding this amount, the ratio of net investment income to average net assets would have been 2.14%.
eNet investment income per share includes approximately $0.11 per share received in the form of a special dividend paid in connection with a corporate real estate investment trust (REIT) conversion. Excluding this non-recurring amount, the ratio of the net investment income to average net assets would have been 1.93%.
fTotal return does not include fees, charges or expenses imposed by the variable annuity and life insurance contracts for which Franklin Templeton Variable Insurance Products Trust serves as an underlying investment vehicle.
gIncludes dividend or interest expense on securities sold short and security borrowing fees, if any. See below for the ratios of such expenses to average net assets for the periods presented. See Note 1(f).
hBenefit of expense reduction rounds to less than 0.01%.
iRounds to less than 0.01%.
jExcludes the value of portfolio securities delivered as a result of a redemption in-kind.
| | | | | | |
| | | The accompanying notes are an integral part of these financial statements. | Annual Report | | | MS-7 | |
FRANKLIN TEMPLETON VARIABLE INSURANCE PRODUCTS TRUST
FINANCIAL HIGHLIGHTS
Franklin Mutual Shares VIP Fund (continued)
| | | | | | | | | | | | | | | | | | | | |
| | | Year Ended December 31, | |
| | | 2014 | | | 2013 | | | 2012 | | | 2011 | | | 2010 | |
| Class 2 | | | | | | | | | | | | | | | | | | | | |
Per share operating performance
(for a share outstanding throughout the year) | | | | | | | | | | | | | | | | | | | | |
| | | | | |
Net asset value, beginning of year | | | $21.63 | | | | $17.23 | | | | $15.38 | | | | $15.95 | | | | $14.58 | |
| | | | |
| | | | | |
| Income from investment operationsa: | | | | | | | | | | | | | | | | | | | | |
| | | | | |
Net investment incomeb | | | 0.58 | c | | | 0.36 | | | | 0.30 | | | | 0.32 | d | | | 0.36 | e |
| | | | | |
Net realized and unrealized gains (losses) | | | 0.97 | | | | 4.46 | | | | 1.90 | | | | (0.51 | ) | | | 1.25 | |
| | | | |
Total from investment operations | | | 1.55 | | | | 4.82 | | | | 2.20 | | | | (0.19 | ) | | | 1.61 | |
| | | | |
| | | | | |
| Less distributions from: | | | | | | | | | | | | | | | | | | | | |
| | | | | |
Net investment income | | | (0.46 | ) | | | (0.42 | ) | | | (0.35 | ) | | | (0.38 | ) | | | (0.24 | ) |
| | | | | |
Net realized gains | | | (0.12 | ) | | | — | | | | — | | | | — | | | | — | |
| | | | |
Total distributions | | | (0.58 | ) | | | (0.42 | ) | | | (0.35 | ) | | | (0.38 | ) | | | (0.24 | ) |
| | | | |
Net asset value, end of year | | | $22.60 | | | | $21.63 | | | | $17.23 | | | | $15.38 | | | | $15.95 | |
| | | | |
| | | | | |
Total returnf | | | 7.12% | | | | 28.26% | | | | 14.24% | | | | (1.04)% | | | | 11.19% | |
| | | | | |
| Ratios to average net assets | | | | | | | | | | | | | | | | | | | | |
| | | | | |
Expensesg | | | 0.98% | h | | | 0.96% | h | | | 0.96% | | | | 0.98% | h | | | 0.99% | h |
| | | | | |
Expenses incurred in connection with securities sold short | | | 0.03% | | | | —% | i | | | —% | i | | | —% | i | | | 0.02% | |
| | | | | |
Net investment income | | | 2.58% | c | | | 1.83% | | | | 1.81% | | | | 2.03% | d | | | 2.41% | e |
| | | | | |
| Supplemental data | | | | | | | | | | | | | | | | | | | | |
| | | | | |
Net assets, end of year (000’s) | | | $4,218,342 | | | | $4,558,547 | | | | $4,069,803 | | | | $3,913,220 | | | | $4,188,821 | |
| | | | | |
Portfolio turnover rate | | | 21.33% | | | | 24.05% | | | | 34.07% | j | | | 41.02% | | | | 32.05% | |
aThe amount shown for a share outstanding throughout the period may not correlate with the Statement of Operations for the period due to the timing of sales and repurchases of the Fund shares in relation to income earned and/or fluctuating fair value of the investments of the Fund.
bBased on average daily shares outstanding.
cNet investment income per share includes approximately $0.23 per share received in the form of special dividends paid in connection with certain Fund’s holdings. Excluding these amounts, the ratio of net investment income to average net assets would have been 1.54%.
dNet investment income per share includes approximately $0.02 per share related to interest income received that had previously been deemed uncollectible. Excluding this amount, the ratio of net investment income to average net assets would have been 1.89%.
eNet investment income per share includes approximately $0.11 per share received in the form of a special dividend paid in connection with a corporate real estate investment trust (REIT) conversion. Excluding this non-recurring amount, the ratio of the net investment income to average net assets would have been 1.68%.
fTotal return does not include fees, charges or expenses imposed by the variable annuity and life insurance contracts for which Franklin Templeton Variable Insurance Products Trust serves as an underlying investment vehicle.
gIncludes dividend or interest expense on securities sold short and security borrowing fees, if any. See below for the ratios of such expenses to average net assets for the periods presented. See Note 1(f).
hBenefit of expense reduction rounds to less than 0.01%.
iRounds to less than 0.01%.
jExcludes the value of portfolio securities delivered as a result of a redemption in-kind.
| | | | |
| MS-8 | | Annual Report | The accompanying notes are an integral part of these financial statements. | | |
FRANKLIN TEMPLETON VARIABLE INSURANCE PRODUCTS TRUST
FINANCIAL HIGHLIGHTS
Franklin Mutual Shares VIP Fund (continued)
| | | | | | | | | | | | | | | | | | | | |
| | | Year Ended December 31, | |
| | | 2014 | | | 2013 | | | 2012 | | | 2011 | | | 2010 | |
| Class 4 | | | | | | | | | | | | | | | | | | | | |
Per share operating performance
(for a share outstanding throughout the year) | | | | | | | | | | | | | | | | | | | | |
| | | | | |
Net asset value, beginning of year | | | $21.74 | | | | $17.31 | | | | $15.45 | | | | $16.03 | | | | $14.66 | |
| | | | |
| | | | | |
| Income from investment operationsa: | | | | | | | | | | | | | | | | | | | | |
| | | | | |
Net investment incomeb | | | 0.57 | c | | | 0.34 | | | | 0.28 | | | | 0.30 | d | | | 0.35 | e |
| | | | | |
Net realized and unrealized gains (losses) | | | 0.96 | | | | 4.49 | | | | 1.91 | | | | (0.51 | ) | | | 1.26 | |
| | | | |
Total from investment operations | | | 1.53 | | | | 4.83 | | | | 2.19 | | | | (0.21 | ) | | | 1.61 | |
| | | | |
| | | | | |
| Less distributions from: | | | | | | | | | | | | | | | | | | | | |
| | | | | |
Net investment income | | | (0.43 | ) | | | (0.40 | ) | | | (0.33 | ) | | | (0.37 | ) | | | (0.24 | ) |
| | | | | |
Net realized gains | | | (0.12 | ) | | | — | | | | — | | | | — | | | | — | |
| | | | |
Total distributions | | | (0.55 | ) | | | (0.40 | ) | | | (0.33 | ) | | | (0.37 | ) | | | (0.24 | ) |
| | | | |
Net asset value, end of year | | | $22.72 | | | | $21.74 | | | | $17.31 | | | | $15.45 | | | | $16.03 | |
| | | | |
| | | | | |
Total returnf | | | 7.04% | | | | 28.05% | | | | 14.20% | | | | (1.12)% | | | | 11.06% | |
| | | | | |
| Ratios to average net assets | | | | | | | | | | | | | | | | | | | | |
| | | | | |
Expensesg | | | 1.08% | h | | | 1.06% | h | | | 1.06% | | | | 1.08% | h | | | 1.09% | h |
| | | | | |
Expenses incurred in connection with securities sold short | | | 0.03% | | | | —% | i | | | —% | i | | | —% | i | | | 0.02% | |
| | | | | |
Net investment income | | | 2.48% | c | | | 1.73% | | | | 1.71% | | | | 1.93% | d | | | 2.31% | e |
| | | | | |
| Supplemental data | | | | | | | | | | | | | | | | | | | | |
| | | | | |
Net assets, end of year (000’s) | | | $158,020 | | | | $188,153 | | | | $165,015 | | | | $162,049 | | | | $167,274 | |
| | | | | |
Portfolio turnover rate | | | 21.33% | | | | 24.05% | | | | 34.07% | j | | | 41.02% | | | | 32.05% | |
aThe amount shown for a share outstanding throughout the period may not correlate with the Statement of Operations for the period due to the timing of sales and repurchases of the Fund shares in relation to income earned and/or fluctuating fair value of the investments of the Fund.
bBased on average daily shares outstanding.
cNet investment income per share includes approximately $0.23 per share received in the form of special dividends paid in connection with certain Fund’s holdings. Excluding these amounts, the ratio of net investment income to average net assets would have been 1.44%.
dNet investment income per share includes approximately $0.02 per share related to interest income received that had previously been deemed uncollectible. Excluding this amount, the ratio of net investment income to average net assets would have been 1.79%.
eNet investment income per share includes approximately $0.11 per share received in the form of a special dividend paid in connection with a corporate real estate investment trust (REIT) conversion. Excluding this non-recurring amount, the ratio of the net investment income to average net assets would have been 1.58%.
fTotal return does not include fees, charges or expenses imposed by the variable annuity and life insurance contracts for which Franklin Templeton Variable Insurance Products Trust serves as an underlying investment vehicle.
gIncludes dividend or interest expense on securities sold short and security borrowing fees, if any. See below for the ratios of such expenses to average net assets for the periods presented. See Note 1(f).
hBenefit of expense reduction rounds to less than 0.01%.
iRounds to less than 0.01%.
jExcludes the value of portfolio securities delivered as a result of a redemption in-kind.
| | | | | | |
| | | The accompanying notes are an integral part of these financial statements. | Annual Report | | | MS-9 | |
FRANKLIN TEMPLETON VARIABLE INSURANCE PRODUCTS TRUST
Statement of Investments, December 31, 2014
| | | | | | | | | | | | | | |
| Franklin Mutual Shares VIP Fund | | | | |
| | | | | Country | | | Shares | | | Value | |
| | Common Stocks and Other Equity Interests 84.3% | | | | | | | | | | | | |
| | Aerospace & Defense 1.7% | | | | | | | | | | | | |
| a | | B/E Aerospace Inc. | | | United States | | | | 449,172 | | | $ | 26,060,959 | |
| | Huntington Ingalls Industries Inc. | | | United States | | | | 462,038 | | | | 51,960,793 | |
| a | | KLX Inc. | | | United States | | | | 224,586 | | | | 9,264,173 | |
| | | | | | | | | | | | | | |
| | | | | | | | | | | | | 87,285,925 | |
| | | | | | | | | | | | | | |
| | Auto Components 0.2% | | | | | | | | | | | | |
| a,b | | International Automotive Components Group Brazil LLC | | | Brazil | | | | 1,730,515 | | | | 163,672 | |
| a,b,c | | International Automotive Components Group North America LLC | | | United States | | | | 15,382,424 | | | | 11,647,264 | |
| | | | | | | | | | | | | | |
| | | | | | | | | | | | | 11,810,936 | |
| | | | | | | | | | | | | | |
| | Automobiles 1.4% | | | | | | | | | | | | |
| | General Motors Co. | | | United States | | | | 1,960,940 | | | | 68,456,415 | |
| | | | | | | | | | | | | | |
| | Banks 9.0% | | | | | | | | | | | | |
| | Barclays PLC | | | United Kingdom | | | | 6,895,000 | | | | 26,169,520 | |
| | CIT Group Inc. | | | United States | | | | 643,453 | | | | 30,776,357 | |
| | Citigroup Inc. | | | United States | | | | 1,073,159 | | | | 58,068,633 | |
| | Citizens Financial Group Inc. | | | United States | | | | 612,022 | | | | 15,214,867 | |
| | Columbia Banking System Inc. | | | United States | | | | 163,162 | | | | 4,504,903 | |
| a | | FCB Financial Holdings Inc., A | | | United States | | | | 493,723 | | | | 12,165,335 | |
| | Guaranty Bancorp | | | United States | | | | 209,583 | | | | 3,026,378 | |
| a | | ING Groep NV, IDR | | | Netherlands | | | | 2,238,146 | | | | 29,329,336 | |
| | JPMorgan Chase & Co. | | | United States | | | | 1,079,000 | | | | 67,523,820 | |
| | KB Financial Group Inc. | | | South Korea | | | | 683,068 | | | | 22,576,167 | |
| | PNC Financial Services Group Inc. | | | United States | | | | 1,022,679 | | | | 93,299,005 | |
| | Societe Generale SA | | | France | | | | 214,711 | | | | 9,090,413 | |
| | State Bank Financial Corp. | | | United States | | | | 352,200 | | | | 7,036,956 | |
| | SunTrust Banks Inc. | | | United States | | | | 929,422 | | | | 38,942,782 | |
| | Wells Fargo & Co. | | | United States | | | | 655,860 | | | | 35,954,245 | |
| | | | | | | | | | | | | | |
| | | | | | | | | | | | | 453,678,717 | |
| | | | | | | | | | | | | | |
| | Beverages 1.3% | | | | | | | | | | | | |
| | Coca-Cola Enterprises Inc. | | | United States | | | | 187,519 | | | | 8,292,090 | |
| | PepsiCo Inc. | | | United States | | | | 621,282 | | | | 58,748,426 | |
| | | | | | | | | | | | | | |
| | | | | | | | | | | | | 67,040,516 | |
| | | | | | | | | | | | | | |
| | Capital Markets 0.4% | | | | | | | | | | | | |
| | Credit Suisse Group AG | | | Switzerland | | | | 829,525 | | | | 20,925,857 | |
| | | | | | | | | | | | | | |
| | Chemicals 0.0% | | | | | | | | | | | | |
| a,d,e | | Dow Corning Corp., Contingent Distribution | | | United States | | | | 100,000 | | | | — | |
| | | | | | | | | | | | | | |
| | Communications Equipment 1.4% | | | | | | | | | | | | |
| | Cisco Systems Inc. | | | United States | | | | 2,495,550 | | | | 69,413,723 | |
| | | | | | | | | | | | | | |
| | Consumer Finance 0.5% | | | | | | | | | | | | |
| a | | Ally Financial Inc. | | | United States | | | | 1,050,600 | | | | 24,815,172 | |
| | | | | | | | | | | | | | |
| | Containers & Packaging 0.9% | | | | | | | | | | | | |
| | MeadWestvaco Corp. | | | United States | | | | 1,008,696 | | | | 44,776,016 | |
| | | | | | | | | | | | | | |
| | Diversified Consumer Services 0.1% | | | | | | | | | | | | |
| | Cengage Learning Holdings II LP | | | United States | | | | 289,744 | | | | 6,519,240 | |
| | | | | | | | | | | | | | |
| | Diversified Telecommunication Services 0.6% | | | | | | | | | | | | |
| a,d,e | | Global Crossing Holdings Ltd., Contingent Distribution | | | United States | | | | 9,005,048 | | | | — | |
| | Koninklijke KPN NV | | | Netherlands | | | | 9,848,740 | | | | 31,317,811 | |
| | | | | | | | | | | | | | |
| | | | | | | | | | | | | 31,317,811 | |
| | | | | | | | | | | | | | |
FRANKLIN TEMPLETON VARIABLE INSURANCE PRODUCTS TRUST
STATEMENT OF INVESTMENTS
Franklin Mutual Shares VIP Fund (continued)
| | | | | | | | | | | | | | |
| | | | | Country | | | Shares | | | Value | |
| | Common Stocks and Other Equity Interests (continued) | | | | | | | | | | | | |
| | Energy Equipment & Services 1.4% | | | | | | | | | | | | |
| | Baker Hughes Inc. | | | United States | | | | 896,262 | | | $ | 50,253,411 | |
| | Ensco PLC, A | | | United States | | | | 184,920 | | | | 5,538,354 | |
| f | | Transocean Ltd. | | | United States | | | | 931,007 | | | | 17,065,358 | |
| | | | | | | | | | | | | | |
| | | | | | | | | | | | | 72,857,123 | |
| | | | | | | | | | | | | | |
| | Food & Staples Retailing 3.6% | | | | | | | | | | | | |
| | CVS Health Corp. | | | United States | | | | 504,363 | | | | 48,575,200 | |
| | The Kroger Co. | | | United States | | | | 1,216,930 | | | | 78,139,075 | |
| | Walgreens Boots Alliance Inc. | | | United States | | | | 729,528 | | | | 55,590,034 | |
| | | | | | | | | | | | | | |
| | | | | | | | | | | | | 182,304,309 | |
| | | | | | | | | | | | | | |
| | Health Care Equipment & Supplies 4.2% | | | | | | | | | | | | |
| | Medtronic Inc. | | | United States | | | | 2,132,922 | | | | 153,996,968 | |
| | Stryker Corp. | | | United States | | | | 594,612 | | | | 56,089,750 | |
| | | | | | | | | | | | | | |
| | | | | | | | | | | | | 210,086,718 | |
| | | | | | | | | | | | | | |
| | Health Care Providers & Services 1.2% | | | | | | | | | | | | |
| | Cigna Corp. | | | United States | | | | 572,674 | | | | 58,933,881 | |
| | | | | | | | | | | | | | |
| | Household Products 0.2% | | | | | | | | | | | | |
| | Energizer Holdings Inc. | | | United States | | | | 60,713 | | | | 7,805,263 | |
| | | | | | | | | | | | | | |
| | Independent Power & Renewable Electricity Producers 0.8% | | | | | | | | | | | | |
| | NRG Energy Inc. | | | United States | | | | 1,407,314 | | | | 37,927,112 | |
| | | | | | | | | | | | | | |
| | Insurance 8.3% | | | | | | | | | | | | |
| | ACE Ltd. | | | United States | | | | 607,735 | | | | 69,816,597 | |
| a | | Alleghany Corp. | | | United States | | | | 111,968 | | | | 51,897,168 | |
| | The Allstate Corp. | | | United States | | | | 685,830 | | | | 48,179,557 | |
| | American International Group Inc. | | | United States | | | | 1,588,406 | | | | 88,966,620 | |
| | MetLife Inc. | | | United States | | | | 922,473 | | | | 49,896,565 | |
| a,b | | Olympus Re Holdings Ltd. | | | United States | | | | 16,280 | | | | — | |
| | White Mountains Insurance Group Ltd. | | | United States | | | | 114,635 | | | | 72,232,660 | |
| | Zurich Insurance Group AG | | | Switzerland | | | | 111,270 | | | | 34,885,193 | |
| | | | | | | | | | | | | | |
| | | | | | | | | | | | | 415,874,360 | |
| | | | | | | | | | | | | | |
| | IT Services 1.3% | | | | | | | | | | | | |
| | Xerox Corp. | | | United States | | | | 4,708,324 | | | | 65,257,371 | |
| | | | | | | | | | | | | | |
| | Machinery 1.2% | | | | | | | | | | | | |
| | Caterpillar Inc. | | | United States | | | | 279,216 | | | | 25,556,641 | |
| | CNH Industrial NV (EUR Traded) | | | United Kingdom | | | | 1,150,471 | | | | 9,326,868 | |
| | CNH Industrial NV, special voting (EUR Traded) | | | United Kingdom | | | | 1,844,814 | | | | 14,955,907 | |
| | Federal Signal Corp. | | | United States | | | | 757,221 | | | | 11,691,492 | |
| | | | | | | | | | | | | | |
| | | | | | | | | | | | | 61,530,908 | |
| | | | | | | | | | | | | | |
| | Marine 1.3% | | | | | | | | | | | | |
| | A.P. Moeller-Maersk AS, B | | | Denmark | | | | 32,270 | | | | 64,855,627 | |
| | | | | | | | | | | | | | |
| | Media 9.0% | | | | | | | | | | | | |
| | CBS Corp., B | | | United States | | | | 1,025,107 | | | | 56,729,421 | |
| | Comcast Corp., Special A | | | United States | | | | 278,448 | | | | 16,028,859 | |
| a | | DIRECTV | | | United States | | | | 756,479 | | | | 65,586,729 | |
| | Reed Elsevier PLC | | | United Kingdom | | | | 3,957,770 | | | | 67,858,735 | |
| | Time Warner Cable Inc. | | | United States | | | | 554,196 | | | | 84,271,044 | |
| | Time Warner Inc. | | | United States | | | | 455,598 | | | | 38,917,181 | |
FRANKLIN TEMPLETON VARIABLE INSURANCE PRODUCTS TRUST
STATEMENT OF INVESTMENTS
Franklin Mutual Shares VIP Fund (continued)
| | | | | | | | | | | | | | |
| | | | | Country | | | Shares | | | Value | |
| | Common Stocks and Other Equity Interests (continued) | | | | | | | | | | | | |
| | Media (continued) | | | | | | | | | | | | |
| a | | Tribune Media Co., A | | | United States | | | | 173,164 | | | $ | 10,350,012 | |
| a | | Tribune Media Co., B | | | United States | | | | 185,976 | | | | 11,115,786 | |
| | Tribune Publishing Co. | | | United States | | | | 97,748 | | | | 2,238,429 | |
| | Twenty-First Century Fox Inc., B | | | United States | | | | 2,670,559 | | | | 98,516,922 | |
| | | | | | | | | | | | | | |
| | | | | | | | | | | | | 451,613,118 | |
| | | | | | | | | | | | | | |
| | Metals & Mining 1.9% | | | | | | | | | | | | |
| | Anglo American PLC | | | United Kingdom | | | | 723,643 | | | | 13,540,947 | |
| | Freeport-McMoRan Inc., B | | | United States | | | | 1,867,696 | | | | 43,629,379 | |
| a | | ThyssenKrupp AG | | | Germany | | | | 1,430,635 | | | | 36,802,512 | |
| | | | | | | | | | | | | | |
| | | | | | | | | | | | | 93,972,838 | |
| | | | | | | | | | | | | | |
| | Multiline Retail 0.4% | | | | | | | | | | | | |
| | Kohl’s Corp. | | | United States | | | | 328,513 | | | | 20,052,434 | |
| | | | | | | | | | | | | | |
| | Oil, Gas & Consumable Fuels 6.7% | | | | | | | | | | | | |
| | Anadarko Petroleum Corp. | | | United States | | | | 279,670 | | | | 23,072,775 | |
| | Apache Corp. | | | United States | | | | 907,650 | | | | 56,882,426 | |
| | BG Group PLC | | | United Kingdom | | | | 1,788,200 | | | | 24,109,862 | |
| | BP PLC | | | United Kingdom | | | | 5,137,552 | | | | 32,912,477 | |
| | CONSOL Energy Inc. | | | United States | | | | 755,295 | | | | 25,536,524 | |
| | Marathon Oil Corp. | | | United States | | | | 1,788,098 | | | | 50,585,292 | |
| | Murphy Oil Corp. | | | United States | | | | 502,750 | | | | 25,398,930 | |
| | Royal Dutch Shell PLC, A | | | United Kingdom | | | | 2,322,671 | | | | 77,736,545 | |
| | Talisman Energy Inc. (CAD Traded) | | | Canada | | | | 202,643 | | | | 1,587,988 | |
| | Talisman Energy Inc. (USD Traded) | | | Canada | | | | 2,775,188 | | | | 21,729,722 | |
| | | | | | | | | | | | | | |
| | | | | | | | | | | | | 339,552,541 | |
| | | | | | | | | | | | | | |
| | Paper & Forest Products 1.2% | | | | | | | | | | | | |
| | International Paper Co. | | | United States | | | | 1,175,666 | | | | 62,992,184 | |
| | | | | | | | | | | | | | |
| | Personal Products 0.5% | | | | | | | | | | | | |
| | Avon Products Inc. | | | United States | | | | 2,475,318 | | | | 23,243,236 | |
| | | | | | | | | | | | | | |
| | Pharmaceuticals 6.9% | | | | | | | | | | | | |
| | Eli Lilly & Co. | | | United States | | | | 763,276 | | | | 52,658,411 | |
| a | | Hospira Inc. | | | United States | | | | 787,789 | | | | 48,252,077 | |
| | Merck & Co. Inc. | | | United States | | | | 2,335,928 | | | | 132,657,351 | |
| | Teva Pharmaceutical Industries Ltd., ADR | | | Israel | | | | 1,969,012 | | | | 113,237,880 | |
| | | | | | | | | | | | | | |
| | | | | | | | | | | | | 346,805,719 | |
| | | | | | | | | | | | | | |
| | Real Estate Investment Trusts (REITs) 0.3% | | | | | | | | | | | | |
| | Alexander’s Inc. | | | United States | | | | 40,126 | | | | 17,542,285 | |
| | | | | | | | | | | | | | |
| | Real Estate Management & Development 0.3% | | | | | | | | | | | | |
| e | | Canary Wharf Group PLC | | | United Kingdom | | | | 1,535,898 | | | | 12,949,288 | |
| a | | Forestar Group Inc. | | | United States | | | | 161,671 | | | | 2,489,733 | |
| | | | | | | | | | | | | | |
| | | | | | | | | | | | | 15,439,021 | |
| | | | | | | | | | | | | | |
| | Software 5.1% | | | | | | | | | | | | |
| | CA Inc. | | | United States | | | | 965,033 | | | | 29,385,255 | |
| | Microsoft Corp. | | | United States | | | | 3,126,947 | | | | 145,246,688 | |
| | Symantec Corp. | | | United States | | | | 3,184,665 | | | | 81,702,581 | |
| | | | | | | | | | | | | | |
| | | | | | | | | | | | | 256,334,524 | |
| | | | | | | | | | | | | | |
FRANKLIN TEMPLETON VARIABLE INSURANCE PRODUCTS TRUST
STATEMENT OF INVESTMENTS
Franklin Mutual Shares VIP Fund (continued)
| | | | | | | | | | | | | | |
| | | | | Country | | | Shares | | | Value | |
| | Common Stocks and Other Equity Interests (continued) | | | | | | | | | |
| | Technology Hardware, Storage & Peripherals 3.8% | | | | | | | | | | | | |
| | Apple Inc. | | | United States | | | | 1,010,540 | | | $ | 111,543,405 | |
| | Hewlett-Packard Co. | | | United States | | | | 1,109,027 | | | | 44,505,254 | |
| | Samsung Electronics Co. Ltd. | | | South Korea | | | | 28,252 | | | | 34,276,627 | |
| | | | | | | | | | | | | | |
| | | | | | | | | | | | | 190,325,286 | |
| | | | | | | | | | | | | | |
| | Tobacco 5.9% | | | | | | | | | | | | |
| | Altria Group Inc. | | | United States | | | | 1,248,308 | | | | 61,504,135 | |
| | British American Tobacco PLC | | | United Kingdom | | | | 1,550,387 | | | | 84,580,584 | |
| | Imperial Tobacco Group PLC | | | United Kingdom | | | | 1,209,297 | | | | 53,456,648 | |
| | Lorillard Inc. | | | United States | | | | 1,157,753 | | | | 72,868,974 | |
| | Philip Morris International Inc. | | | United States | | | | 282,010 | | | | 22,969,714 | |
| | | | | | | | | | | | | | |
| | | | | | | | | | | | | 295,380,055 | |
| | | | | | | | | | | | | | |
| | Wireless Telecommunication Services 1.3% | | | | | | | | | | | | |
| | Vodafone Group PLC | | | United Kingdom | | | | 18,909,354 | | | | 65,623,881 | |
| | | | | | | | | | | | | | |
| | | | |
| | Total Common Stocks and Other Equity Interests
(Cost $2,990,557,699) | | | | | | | | | | | 4,242,350,122 | |
| | | | | | | | | | | | | | |
| | Preferred Stocks (Cost $35,233,301) 0.6% | | | | | | | | | | | | |
| | Automobiles 0.6% | | | | | | | | | | | | |
| | Volkswagen AG, pfd. | | | Germany | | | | 135,289 | | | | 30,227,147 | |
| | | | | | | | | | | | | | |
| | | | |
| | | | | | | | Principal Amount* | | | | |
| | Corporate Bonds, Notes and Senior Floating Rate Interests 4.9% | | | | | | | | | | | | |
| | Avaya Inc., | | | | | | | | | | | | |
| | g senior note, 144A, 10.50%, 3/01/21 | | | United States | | | | 18,224,000 | | | | 15,672,640 | |
| | g senior secured note, 144A, 7.00%, 4/01/19 | | | United States | | | | 12,923,000 | | | | 12,664,540 | |
| | h,i Tranche B-3 Term Loan, 4.67%, 10/26/17 | | | United States | | | | 19,407,661 | | | | 18,663,707 | |
| | h,i Tranche B-6 Term Loan, 6.50%, 3/31/18 | | | United States | | | | 4,733,178 | | | | 4,679,930 | |
| h,i | | Caesars Entertainment Operating Co. Inc., Senior Tranche, first lien, | | | | | | | | | | | | |
| | B5B, 5.949%, 3/01/17 | | | United States | | | | 3,251,752 | | | | 2,854,768 | |
| | B6B, 6.949%, 3/01/17 | | | United States | | | | 15,503,483 | | | | 13,701,203 | |
| | B7, 9.75%, 3/01/17 | | | United States | | | | 9,850,500 | | | | 8,737,394 | |
| h,i | | Cengage Learning Acquisitions Inc., First Lien Exit Term Loan, 7.00%, 3/31/20 | | | United States | | | | 1,825,208 | | | | 1,809,237 | |
| | First Data Corp., senior note, 11.75%, 8/15/21 | | | United States | | | | 9,426,000 | | | | 10,863,465 | |
| | iHeartCommunications Inc., | | | | | | | | | | | | |
| | senior secured note, first lien, 9.00%, 12/15/19 | | | United States | | | | 26,449,000 | | | | 26,151,449 | |
| | h,i Tranche B Term Loan, 3.819%, 1/29/16 | | | United States | | | | 260,204 | | | | 257,521 | |
| | h,i Tranche C Term Loan, 3.819%, 1/29/16 | | | United States | | | | 28,080 | | | | 27,764 | |
| | h,i Tranche D Term Loan, 6.919%, 1/30/19 | | | United States | | | | 34,746,619 | | | | 32,824,714 | |
| | h,i Tranche E Term Loan, 7.669%, 7/30/19 | | | United States | | | | 11,168,253 | | | | 10,735,483 | |
| h,i | | JC Penney Corp. Inc., Term Loan, 6.00%, 5/22/18 | | | United States | | | | 26,191,507 | | | | 25,815,004 | |
| | NGPL PipeCo LLC, | | | | | | | | | | | | |
| | g secured note, 144A, 7.119%, 12/15/17 | | | United States | | | | 9,756,000 | | | | 9,634,050 | |
| | f,g senior secured note, 144A, 9.625%, 6/01/19 | | | United States | | | | 14,481,000 | | | | 14,589,608 | |
| | h,i Term Loan B, 6.75%, 9/15/17 | | | United States | | | | 792,371 | | | | 766,619 | |
| h,i | | Toys R US-Delaware Inc., | | | | | | | | | | | | |
| | Filo Term Loan, 8.75%, 10/24/19 | | | United States | | | | 2,560,000 | | | | 2,520,243 | |
| | j Term Loan B4, 9.75%, 4/24/20 | | | United States | | | | 21,675,344 | | | | 19,843,778 | |
FRANKLIN TEMPLETON VARIABLE INSURANCE PRODUCTS TRUST
STATEMENT OF INVESTMENTS
Franklin Mutual Shares VIP Fund (continued)
| | | | | | | | | | | | | | |
| | | | | Country | | | Principal Amount* | | | Value | |
| | Corporate Bonds, Notes and Senior Floating Rate Interests (continued) | | | | | | | | | | | | |
| | Walter Energy Inc., | | | | | | | | | | | | |
| | h,i B, Term Loan, 7.25%, 4/01/18 | | | United States | | | | 11,218,193 | | | $ | 8,729,156 | |
| | g first lien, 144A, 9.50%, 10/15/19 | | | United States | | | | 6,301,000 | | | | 4,820,265 | |
| | f,g,k second lien, 144A, PIK, 11.50%, 4/01/20 | | | United States | | | | 5,262,000 | | | | 1,736,718 | |
| | | | | | | | | | | | | | |
| | | | |
| | Total Corporate Bonds, Notes and Senior Floating Rate Interests (Cost $247,498,693) | | | | | | | | | | | 248,099,256 | |
| | | | | | | | | | | | | | |
| | Corporate Notes and Senior Floating Rate Interests in Reorganization 1.7% | | | | | | | | | | | | |
| b,l | | Broadband Ventures III LLC, secured promissory note, 5.00%, 2/01/12 | | | United States | | | | 1,754 | | | | — | |
| h,i,l | | Texas Competitive Electric Holdings Co. LLC, Extended Term Loan, 4.648%, 10/10/17 | | | United States | | | | 90,618,405 | | | | 58,675,417 | |
| g,l | | Texas Competitive Electric Holdings Co. LLC/Texas Competitive Electric Holdings Finance Inc., senior secured note, 144A, 11.50%, 10/01/20 | | | United States | | | | 39,308,000 | | | | 28,006,950 | |
| | | | | | | | | | | | | | |
| | | | |
| | Total Corporate Notes and Senior Floating Rate Interests in Reorganization (Cost $115,883,307) | | | | | | | | | | | 86,682,367 | |
| | | | | | | | | | | | | | |
| | | | |
| | | | | | | | Shares | | | | |
| | Companies in Liquidation 0.7% | | | | | | | | | | | | |
| a | | Adelphia Recovery Trust | | | United States | | | | 29,283,354 | | | | 70,280 | |
| a,d | | Adelphia Recovery Trust, Arahova Contingent Value Vehicle, Contingent Distribution | | | United States | | | | 1,955,453 | | | | 19,554 | |
| a,b,c,m | | CB FIM Coinvestors LLC | | | United States | | | | 6,400,507 | | | | — | |
| a,d,e | | Century Communications Corp., Contingent Distribution | | | United States | | | | 5,487,000 | | | | — | |
| a,b | | FIM Coinvestor Holdings I, LLC | | | United States | | | | 8,006,950 | | | | — | |
| a,n | | Lehman Brothers Holdings Inc., Bankruptcy Claim | | | United States | | | | 144,058,799 | | | | 36,014,700 | |
| a,d,e | | Tribune Media Litigation Trust, Contingent Distribution | | | United States | | | | 393,761 | | | | — | |
| a,d,e | | Tropicana Litigation Trust, Contingent Distribution | | | United States | | | | 18,305,000 | | | | — | |
| | | | | | | | | | | | | | |
| | | | |
| | Total Companies in Liquidation (Cost $41,876,162) | | | | | | | | | | | 36,104,534 | |
| | | | | | | | | | | | | | |
| | | | |
| | | | | | | | Principal Amount* | | | | |
| | Municipal Bonds (Cost $14,662,575) 0.3% | | | | | | | | | | | | |
| | Puerto Rico Commonwealth GO, Refunding, Series A, 8.00%, 7/01/35 | | | United States | | | | 15,709,000 | | | | 13,725,739 | |
| | | | | | | | | | | | | | |
| | | | |
| | Total Investments before Short Term Investments
(Cost $3,445,711,737) | | | | | | | | | | | 4,657,189,165 | |
| | | | | | | | | | | | | | |
FRANKLIN TEMPLETON VARIABLE INSURANCE PRODUCTS TRUST
STATEMENT OF INVESTMENTS
Franklin Mutual Shares VIP Fund (continued)
| | | | | | | | | | | | | | |
| | | | | Country | | | Principal Amount* | | | Value | |
| | Short Term Investments 7.3% | | | | | | | | | | | | |
| | U.S. Government and Agency Securities 7.0% | | | | | | | | | | | | |
| o | | U.S. Treasury Bills, | | | | | | | | | | | | |
| | 1/02/15 | | | United States | | | | 63,700,000 | | | $ | 63,700,000 | |
| | p 1/29/15 - 7/02/15 | | | United States | | | | 287,680,000 | | | | 287,651,209 | |
| | | | | | | | | | | | | | |
| | | | |
| | Total U.S. Government and Agency Securities
(Cost $351,335,064) | | | | | | | | | | | 351,351,209 | |
| | | | | | | | | | | | | | |
| | | | |
| | Total Investments before Money Market Funds
(Cost $3,797,046,801) | | | | | | | | | | | 5,008,540,374 | |
| | | | | | | | | | | | | | |
| | | | |
| | | | | | | | Shares | | | | |
| q | | Investments from Cash Collateral Received for Loaned Securities (Cost $14,448,795) 0.3% | | | | | | | | | | | | |
| | Money Market Funds 0.3% | | | | | | | | | | | | |
| r | | BNY Mellon Overnight Government Fund, 0.072% | | | United States | | | | 14,448,795 | | | | 14,448,795 | |
| | | | | | | | | | | | | | |
| | Total Investments (Cost $3,811,495,596) 99.8% | | | | | | | | | | | 5,022,989,169 | |
| | Securities Sold Short (0.7)% | | | | | | | | | | | (33,033,145 | ) |
| | Other Assets, less Liabilities 0.9% | | | | | | | | | | | 42,868,703 | |
| | | | | | | | | | | | | | |
| | Net Assets 100.0% | | | | | | | | | | $ | 5,032,824,727 | |
| | | | | | | | | | | | | | |
| s | | Securities Sold Short (Proceeds $34,400,399) (0.7)% | | | | | | | | | | | | |
| | Common Stocks (0.7)% | | | | | | | | | | | | |
| | Diversified Telecommunication Services (0.7)% | | | | | | | | | | | | |
| | AT&T Inc. | | | United States | | | | 983,422 | | | $ | (33,033,145 | ) |
| | | | | | | | | | | | | | |
*The principal amount is stated in U.S. dollars unless otherwise indicated.
aNon-income producing.
bSee Note 8 regarding restricted securities.
cAt December 31, 2014, pursuant to the Fund’s policies and the requirements of applicable securities law, the Fund may be restricted from trading these securities for a limited or extended period of time.
dContingent distributions represent the right to receive additional distributions, if any, during the reorganization of the underlying company. Shares represent total underlying principal of debt securities.
eSecurity has been deemed illiquid because it may not be able to be sold within seven days. At December 31, 2014, the aggregate value of these securities was $12,949,288, representing 0.26% of net assets.
fA portion or all of the security is on loan at December 31, 2014. See Note 1(g).
gSecurity was purchased pursuant to Rule 144A under the Securities Act of 1933 and may be sold in transactions exempt from registration only to qualified institutional buyers or in a public offering registered under the Securities Act of 1933. These securities have been deemed liquid under guidelines approved by the Trust’s Board of Trustees. At December 31, 2014, the aggregate value of these securities was $87,124,771, representing 1.73% of net assets.
hSee Note 1(h) regarding senior floating rate interests.
iThe coupon rate shown represents the rate at period end.
jA portion or all of the security purchased on a delayed delivery basis. See Note 1(c).
kIncome may be received in additional securities and/or cash.
lSee Note 7 regarding credit risk and defaulted securities.
mSee Note 10 regarding holdings of 5% voting securities.
nBankruptcy claims represent the right to receive distributions, if any, during the liquidation of the underlying pool of assets. Shares represent amount of allowed unsecured claims.
oThe security is traded on a discount basis with no stated coupon rate.
pSecurity or a portion of the security has been pledged as collateral for securities sold short, open futures and forward contracts. At December 31, 2014, the value of this security and/or cash pledged as collateral was $54,237,697, representing 1.08% of net assets.
qSee Note 1(g) regarding securities on loan.
rThe rate shown is the annualized seven-day yield at period end.
sSee Note 1(f) regarding securities sold short.
FRANKLIN TEMPLETON VARIABLE INSURANCE PRODUCTS TRUST
STATEMENT OF INVESTMENTS
Franklin Mutual Shares VIP Fund (continued)
At December 31, 2014, the Fund had the following futures contracts outstanding. See Note 1(d).
| | | | | | | | | | | | | | | | | | | | | | | | |
| Futures Contracts | |
| Description | | Type | | | Number of
Contracts | | | Notional
Value | | | Expiration
Date | | | Unrealized
Appreciation | | | Unrealized
Depreciation | |
| Currency Contracts | | | | | | | | | | | | | | | | | | | | | | | | |
CHF/USD | | | Short | | | | 22 | | | $ | 2,770,350 | | | | 3/16/15 | | | $ | 64,556 | | | $ | — | |
EUR/USD | | | Short | | | | 491 | | | | 74,306,713 | | | | 3/16/15 | | | | 1,790,180 | | | | — | |
GBP/USD | | | Short | | | | 1,150 | | | | 111,909,375 | | | | 3/16/15 | | | | 649,288 | | | | — | |
| | | | | | | | | | | | | | | | | | | | |
Net unrealized appreciation (depreciation) | | | $ | 2,504,024 | | | | | |
| | | | | | | | | | | | | | | | | | | | | | | | |
At December 31, 2014, the Fund had the following forward exchange contracts outstanding. See Note 1(d).
| | | | | | | | | | | | | | | | | | | | | | | | | | | | |
| Forward Exchange Contracts | |
| Currency | | Counterpartya | | | Type | | | Quantity | | | Contract
Amount | | | Settlement
Date | | | Unrealized
Appreciation | | | Unrealized
Depreciation | |
Euro | | | BOFA | | | | Buy | | | | 195,842 | | | $ | 243,911 | | | | 1/20/15 | | | $ | — | | | $ | (6,890 | ) |
Euro | | | BOFA | | | | Sell | | | | 103,066 | | | | 136,162 | | | | 1/20/15 | | | | 11,425 | | | | — | |
Euro | | | BONY | | | | Buy | | | | 30,450 | | | | 38,139 | | | | 1/20/15 | | | | — | | | | (1,287 | ) |
Euro | | | DBAB | | | | Buy | | | | 391,686 | | | | 488,087 | | | | 1/20/15 | | | | — | | | | (14,042 | ) |
Euro | | | DBAB | | | | Sell | | | | 408,296 | | | | 539,495 | | | | 1/20/15 | | | | 45,347 | | | | — | |
Euro | | | FBCO | | | | Sell | | | | 71,702 | | | | 94,989 | | | | 1/20/15 | | | | 8,210 | | | | — | |
Euro | | | HSBC | | | | Buy | | | | 391,686 | | | | 487,884 | | | | 1/20/15 | | | | — | | | | (13,839 | ) |
Euro | | | HSBC | | | | Sell | | | | 356,763 | | | | 471,498 | | | | 1/20/15 | | | | 39,719 | | | | — | |
Euro | | | SCBT | | | | Sell | | | | 105,111 | | | | 138,918 | | | | 1/20/15 | | | | 11,705 | | | | — | |
Euro | | | SSBT | | | | Buy | | | | 392,037 | | | | 488,380 | | | | 1/20/15 | | | | — | | | | (13,910 | ) |
Euro | | | SSBT | | | | Sell | | | | 356,763 | | | | 471,456 | | | | 1/20/15 | | | | 39,677 | | | | — | |
British Pound | | | BOFA | | | | Buy | | | | 13,960,725 | | | | 22,756,672 | | | | 1/21/15 | | | | — | | | | (999,760 | ) |
British Pound | | | BZWS | | | | Buy | | | | 11,674,596 | | | | 18,836,564 | | | | 1/21/15 | | | | — | | | | (642,441 | ) |
British Pound | | | DBAB | | | | Sell | | | | 22,492,043 | | | | 38,357,647 | | | | 1/21/15 | | | | 3,305,214 | | | | — | |
British Pound | | | FBCO | | | | Buy | | | | 4,450,184 | | | | 7,263,280 | | | | 1/21/15 | | | | — | | | | (327,948 | ) |
British Pound | | | FBCO | | | | Sell | | | | 479,516 | | | | 777,341 | | | | 1/21/15 | | | | 30,046 | | | | — | |
British Pound | | | HSBC | | | | Buy | | | | 537,697 | | | | 903,465 | | | | 1/21/15 | | | | — | | | | (65,498 | ) |
British Pound | | | HSBC | | | | Sell | | | | 15,812,672 | | | | 26,976,418 | | | | 1/21/15 | | | | 2,333,364 | | | | — | |
British Pound | | | SCBT | | | | Sell | | | | 824,100 | | | | 1,335,653 | | | | 1/21/15 | | | | 51,344 | | | | — | |
British Pound | | | SSBT | | | | Buy | | | | 1,776,769 | | | | 2,976,016 | | | | 1/21/15 | | | | — | | | | (207,033 | ) |
British Pound | | | SSBT | | | | Sell | | | | 20,856,066 | | | | 35,597,133 | | | | 1/21/15 | | | | 3,094,267 | | | | — | |
South Korean Won | | | BOFA | | | | Buy | | | | 1,453,683,558 | | | | 1,356,875 | | | | 2/12/15 | | | | — | | | | (30,670 | ) |
South Korean Won | | | BOFA | | | | Sell | | | | 18,373,971,870 | | | | 17,561,175 | | | | 2/12/15 | | | | 817,060 | | | | (18,571 | ) |
South Korean Won | | | BONY | | | | Sell | | | | 1,460,646,033 | | | | 1,415,308 | | | | 2/12/15 | | | | 82,752 | | | | — | |
South Korean Won | | | FBCO | | | | Buy | | | | 466,294,044 | | | | 426,619 | | | | 2/12/15 | | | | — | | | | (1,216 | ) |
South Korean Won | | | FBCO | | | | Sell | | | | 24,709,570,673 | | | | 23,807,530 | | | | 2/12/15 | | | | 1,264,838 | | | | — | |
South Korean Won | | | HSBC | | | | Buy | | | | 4,560,218,860 | | | | 4,165,599 | | | | 2/12/15 | | | | 17,436 | | | | (22,719 | ) |
South Korean Won | | | HSBC | | | | Sell | | | | 24,119,320,086 | | | | 23,217,452 | | | | 2/12/15 | | | | 1,236,780 | �� | | | (23,531 | ) |
Swiss Franc | | | BOFA | | | | Buy | | | | 1,207,808 | | | | 1,247,421 | | | | 2/12/15 | | | | — | | | | (31,658 | ) |
Swiss Franc | | | BOFA | | | | Sell | | | | 9,790,739 | | | | 10,826,139 | | | | 2/12/15 | | | | 970,911 | | | | — | |
Swiss Franc | | | DBAB | | | | Buy | | | | 2,489,139 | | | | 2,594,372 | | | | 2/12/15 | | | | — | | | | (88,838 | ) |
Swiss Franc | | | DBAB | | | | Sell | | | | 511,795 | | | | 553,792 | | | | 2/12/15 | | | | 38,626 | | | | — | |
Swiss Franc | | | FBCO | | | | Buy | | | | 1,652,528 | | | | 1,715,589 | | | | 2/12/15 | | | | — | | | | (52,176 | ) |
Swiss Franc | | | FBCO | | | | Sell | | | | 455,271 | | | | 483,015 | | | | 2/12/15 | | | | 24,745 | | | | — | |
Swiss Franc | | | HSBC | | | | Buy | | | | 41,715 | | | | 43,126 | | | | 2/12/15 | | | | — | | | | (1,136 | ) |
Swiss Franc | | | HSBC | | | | Sell | | | | 105,631 | | | | 107,382 | | | | 2/12/15 | | | | 1,056 | | | | — | |
Swiss Franc | | | SSBT | | | | Buy | | | | 2,161,559 | | | | 2,238,018 | | | | 2/12/15 | | | | — | | | | (62,221 | ) |
Swiss Franc | | | SSBT | | | | Sell | | | | 72,792 | | | | 75,720 | | | | 2/12/15 | | | | 2,449 | | | | — | |
British Pound | | | BOFA | | | | Buy | | | | 14,672,698 | | | | 23,617,002 | | | | 2/19/15 | | | | — | | | | (755,650 | ) |
British Pound | | | BOFA | | | | Sell | | | | 20,585,699 | | | | 33,879,884 | | | | 2/19/15 | | | | 1,805,559 | | | | — | |
British Pound | | | BZWS | | | | Buy | | | | 328,780 | | | | 522,213 | | | | 2/19/15 | | | | — | | | | (9,945 | ) |
British Pound | | | DBAB | | | | Buy | | | | 2,155,538 | | | | 3,458,176 | | | | 2/19/15 | | | | — | | | | (99,658 | ) |
British Pound | | | DBAB | | | | Sell | | | | 290,717 | | | | 455,448 | | | | 2/19/15 | | | | 2,485 | | | | — | |
FRANKLIN TEMPLETON VARIABLE INSURANCE PRODUCTS TRUST
STATEMENT OF INVESTMENTS
Franklin Mutual Shares VIP Fund (continued)
| | | | | | | | | | | | | | | | | | | | | | | | | | | | |
| Forward Exchange Contracts (continued) | |
| Currency | | Counterpartya | | | Type | | | Quantity | | | Contract
Amount | | | Settlement
Date | | | Unrealized
Appreciation | | | Unrealized
Depreciation | |
British Pound | | | FBCO | | | | Buy | | | | 3,990,864 | | | $ | 6,388,538 | | | | 2/19/15 | | | $ | — | | | $ | (170,422 | ) |
British Pound | | | FBCO | | | | Sell | | | | 16,875,253 | | | | 27,893,010 | | | | 2/19/15 | | | | 1,599,885 | | | | — | |
British Pound | | | HSBC | | | | Buy | | | | 3,194,436 | | | | 5,117,285 | | | | 2/19/15 | | | | — | | | | (140,074 | ) |
British Pound | | | HSBC | | | | Sell | | | | 5,161,615 | | | | 8,203,414 | | | | 2/19/15 | | | | 161,165 | | | | — | |
British Pound | | | SCBT | | | | Buy | | | | 466,309 | | | | 754,917 | | | | 2/19/15 | | | | — | | | | (28,367 | ) |
British Pound | | | SCBT | | | | Sell | | | | 408,270 | | | | 656,327 | | | | 2/19/15 | | | | 20,206 | | | | — | |
British Pound | | | SSBT | | | | Buy | | | | 13,632,537 | | | | 22,093,027 | | | | 2/19/15 | | | | — | | | | (852,338 | ) |
British Pound | | | SSBT | | | | Sell | | | | 22,351,155 | | | | 36,439,973 | | | | 2/19/15 | | | | 1,614,912 | | | | — | |
Euro | | | BOFA | | | | Buy | | | | 59,058 | | | | 74,018 | | | | 2/27/15 | | | | — | | | | (2,519 | ) |
Euro | | | BOFA | | | | Sell | | | | 340,793 | | | | 445,272 | | | | 2/27/15 | | | | 32,692 | | | | — | |
Euro | | | BONY | | | | Buy | | | | 368,679 | | | | 458,434 | | | | 2/27/15 | | | | — | | | | (12,094 | ) |
Euro | | | BONY | | | | Sell | | | | 626,812 | | | | 822,129 | | | | 2/27/15 | | | | 63,281 | | | | — | |
Euro | | | DBAB | | | | Buy | | | | 611,694 | | | | 761,414 | | | | 2/27/15 | | | | — | | | | (20,868 | ) |
Euro | | | DBAB | | | | Sell | | | | 972,518 | | | | 1,269,884 | | | | 2/27/15 | | | | 92,508 | | | | — | |
Euro | | | FBCO | | | | Buy | | | | 397,232 | | | | 492,856 | | | | 2/27/15 | | | | — | | | | (11,948 | ) |
Euro | | | FBCO | | | | Sell | | | | 470,068 | | | | 612,245 | | | | 2/27/15 | | | | 43,159 | | | | — | |
Euro | | | HSBC | | | | Buy | | | | 702,645 | | | | 873,604 | | | | 2/27/15 | | | | — | | | | (22,949 | ) |
Euro | | | HSBC | | | | Sell | | | | 813,358 | | | | 1,060,012 | | | | 2/27/15 | | | | 75,322 | | | | — | |
Euro | | | SCBT | | | | Sell | | | | 500,368 | | | | 649,753 | | | | 2/27/15 | | | | 43,984 | | | | — | |
Euro | | | SSBT | | | | Buy | | | | 634,479 | | | | 789,888 | | | | 2/27/15 | | | | — | | | | (21,757 | ) |
Euro | | | SSBT | | | | Sell | | | | 651,414 | | | | 849,370 | | | | 2/27/15 | | | | 60,737 | | | | — | |
Euro | | | BOFA | | | | Sell | | | | 1,818,249 | | | | 2,311,477 | | | | 4/16/15 | | | | 109,213 | | | | — | |
Euro | | | BONY | | | | Sell | | | | 567,695 | | | | 711,692 | | | | 4/16/15 | | | | 24,100 | | | | — | |
Euro | | | BZWS | | | | Sell | | | | 294,348 | | | | 369,392 | | | | 4/16/15 | | | | 12,878 | | | | — | |
Euro | | | DBAB | | | | Sell | | | | 942,694 | | | | 1,192,820 | | | | 4/16/15 | | | | 51,029 | | | | — | |
Euro | | | FBCO | | | | Sell | | | | 1,162,263 | | | | 1,463,631 | | | | 4/16/15 | | | | 55,897 | | | | — | |
Euro | | | HSBC | | | | Sell | | | | 1,551,770 | | | | 1,960,871 | | | | 4/16/15 | | | | 81,366 | | | | — | |
Euro | | | SCBT | | | | Sell | | | | 283,848 | | | | 355,761 | | | | 4/16/15 | | | | 11,964 | | | | — | |
Euro | | | SSBT | | | | Sell | | | | 1,470,188 | | | | 1,852,108 | | | | 4/16/15 | | | | 71,415 | | | | — | |
British Pound | | | BOFA | | | | Sell | | | | 1,805,602 | | | | 2,820,531 | | | | 4/22/15 | | | | 8,746 | | | | — | |
British Pound | | | HSBC | | | | Sell | | | | 18,037,659 | | | | 28,950,419 | | | | 4/22/15 | | | | 861,161 | | | | — | |
British Pound | | | SCBT | | | | Sell | | | | 18,073,951 | | | | 29,117,135 | | | | 4/22/15 | | | | 971,361 | | | | — | |
Euro | | | BOFA | | | | Sell | | | | 17,483,246 | | | | 21,831,329 | | | | 5/18/15 | | | | 648,326 | | | | — | |
Euro | | | BONY | | | | Sell | | | | 119,151 | | | | 145,245 | | | | 5/18/15 | | | | 880 | | | | — | |
Euro | | | DBAB | | | | Sell | | | | 20,536,211 | | | | 25,642,666 | | | | 5/18/15 | | | | 760,637 | | | | — | |
Euro | | | FBCO | | | | Sell | | | | 18,916,557 | | | | 23,620,331 | | | | 5/18/15 | | | | 700,704 | | | | — | |
Euro | | | HSBC | | | | Sell | | | | 1,477,677 | | | | 1,830,517 | | | | 5/18/15 | | | | 40,138 | | | | — | |
Euro | | | SSBT | | | | Sell | | | | 1,033,901 | | | | 1,293,309 | | | | 5/18/15 | | | | 40,617 | | | | — | |
British Pound | | | BOFA | | | | Buy | | | | 651,914 | | | | 1,017,146 | | | | 5/21/15 | | | | — | | | | (2,184 | ) |
British Pound | | | BOFA | | | | Sell | | | | 11,512,119 | | | | 18,016,466 | | | | 5/21/15 | | | | 93,305 | | | | — | |
British Pound | | | FBCO | | | | Buy | | | | 231,285 | | | | 360,045 | | | | 5/21/15 | | | | 41 | | | | — | |
British Pound | | | FBCO | | | | Sell | | | | 8,292,701 | | | | 12,968,126 | | | | 5/21/15 | | | | 57,261 | | | | — | |
British Pound | | | HSBC | | | | Buy | | | | 1,150,785 | | | | 1,799,525 | | | | 5/21/15 | | | | — | | | | (7,874 | ) |
British Pound | | | SSBT | | | | Sell | | | | 15,195,997 | | | | 23,766,539 | | | | 5/21/15 | | | | 107,967 | | | | — | |
| | | | | | | | | | | | | | | | | | | | | | | | |
Unrealized appreciation (depreciation) | | | | 23,751,872 | | | | (4,784,031 | ) |
| | | | | | | | | | | | | | | | | | | | | | | | |
Net unrealized appreciation (depreciation) | | | $ | 18,967,841 | | | | | |
| | | | | | | | | | | | | | | | | | | | | | | | | | | | |
aMay be comprised of multiple contracts with the same counterparty, currency and settlement date.
See Abbreviations on page MS-33.
| | | | | | |
| | | The accompanying notes are an integral part of these financial statements. | Annual Report | | | MS-17 | |
FRANKLIN TEMPLETON VARIABLE INSURANCE PRODUCTS TRUST
Financial Statements
Statement of Assets and Liabilities
December 31, 2014
| | | | |
| | | Franklin Mutual
Shares VIP
Fund | |
Assets: | | | | |
Investments in securities: | | | | |
Cost | | $ | 3,811,495,596 | |
| | | | |
Value (includes securities loaned in the amount of $13,844,330) | | $ | 5,022,989,169 | |
Cash | | | 413,992 | |
Restricted cash (Note 1e) | | | 5,150,000 | |
Foreign currency, at value (cost $7,590,010) | | | 7,603,838 | |
Receivables: | | | | |
Investment securities sold | | | 3,731,159 | |
Capital shares sold | | | 462,641 | |
Dividends and interest | | | 9,804,952 | |
Due from brokers | | | 34,318,854 | |
Variation margin | | | 192,363 | |
Unrealized appreciation on forward exchange contracts | | | 23,751,872 | |
Other assets | | | 847,031 | |
| | | | |
Total assets | | | 5,109,265,871 | |
| | | | |
Liabilities: | | | | |
Payables: | | | | |
Investment securities purchased | | | 10,686,037 | |
Capital shares redeemed | | | 2,751,849 | |
Management fees | | | 2,954,899 | |
Distribution fees | | | 1,862,959 | |
Securities sold short, at value (proceeds $34,400,399) | | | 33,033,145 | |
Payable upon return of securities loaned | | | 14,448,795 | |
Due to brokers | | | 5,150,000 | |
Unrealized depreciation on forward exchange contracts | | | 4,784,031 | |
Accrued expenses and other liabilities | | | 769,429 | |
| | | | |
Total liabilities | | | 76,441,144 | |
| | | | |
Net assets, at value | | $ | 5,032,824,727 | |
| | | | |
Net assets consist of: | | | | |
Paid-in capital | | $ | 3,400,072,674 | |
Undistributed net investment income | | | 135,335,888 | |
Net unrealized appreciation (depreciation) | | | 1,234,339,868 | |
Accumulated net realized gain (loss) | | | 263,076,297 | |
| | | | |
Net assets, at value | | $ | 5,032,824,727 | |
| | | | |
| | | | |
| MS-18 | | Annual Report | The accompanying notes are an integral part of these financial statements. | | |
FRANKLIN TEMPLETON VARIABLE INSURANCE PRODUCTS TRUST
FINANCIAL STATEMENTS
Statement of Assets and Liabilities (continued)
December 31, 2014
| | | | |
| | | Franklin Mutual
Shares VIP
Fund | |
| |
| Class 1: | | | | |
Net assets, at value | | $ | 656,462,845 | |
| | | | |
Shares outstanding | | | 28,649,881 | |
| | | | |
Net asset value and maximum offering price per share | | $ | 22.91 | |
| | | | |
| |
| Class 2: | | | | |
Net assets, at value | | $ | 4,218,341,780 | |
| | | | |
Shares outstanding | | | 186,624,434 | |
| | | | |
Net asset value and maximum offering price per share | | $ | 22.60 | |
| | | | |
| |
| Class 4: | | | | |
Net assets, at value | | $ | 158,020,102 | |
| | | | |
Shares outstanding | | | 6,954,769 | |
| | | | |
Net asset value and maximum offering price per share | | $ | 22.72 | |
| | | | |
| | | | | | |
| | | The accompanying notes are an integral part of these financial statements. | Annual Report | | | MS-19 | |
FRANKLIN TEMPLETON VARIABLE INSURANCE PRODUCTS TRUST
FINANCIAL STATEMENTS
Statement of Operations
for the year ended December 31, 2014
| | | | |
| | | Franklin Mutual
Shares VIP
Fund | |
Investment income: | | | | |
Dividends | | $ | 155,438,111 | |
Interest | | | 30,503,752 | |
Income from securities loaned | | | 64,238 | |
| | | | |
Total investment income | | | 186,006,101 | |
| | | | |
Expenses: | | | | |
Management fees (Note 3a) | | | 34,241,883 | |
Administrative fees (Note 3b) | | | 1,475,520 | |
Distribution fees: (Note 3c) | | | | |
Class 2 | | | 11,046,947 | |
Class 4 | | | 612,845 | |
Custodian fees (Note 4) | | | 155,385 | |
Reports to shareholders | | | 780,605 | |
Professional fees | | | 195,923 | |
Trustees’ fees and expenses | | | 20,732 | |
Dividends on securities sold short | | | 1,363,635 | |
Other | | | 83,862 | |
| | | | |
Total expenses | | | 49,977,337 | |
Expense reductions (Note 4) | | | (369 | ) |
| | | | |
Net expenses | | | 49,976,968 | |
| | | | |
Net investment income | | | 136,029,133 | |
| | | | |
Realized and unrealized gains (losses): | | | | |
Net realized gain (loss) from: | | | | |
Investments | | | 288,234,079 | |
Foreign currency transactions | | | (18,300,963 | ) |
Futures contracts | | | 13,224,439 | |
Securities sold short | | | (2,788,137 | ) |
| | | | |
Net realized gain (loss) | | | 280,369,418 | |
| | | | |
Net change in unrealized appreciation (depreciation) on: | | | | |
Investments | | | (110,525,830 | ) |
Translation of other assets and liabilities denominated in foreign currencies | | | 49,590,550 | |
| | | | |
Net change in unrealized appreciation (depreciation) | | | (60,935,280 | ) |
| | | | |
Net realized and unrealized gain (loss) | | | 219,434,138 | |
| | | | |
Net increase (decrease) in net assets resulting from operations | | $ | 355,463,271 | |
| | | | |
| | | | |
| MS-20 | | Annual Report | The accompanying notes are an integral part of these financial statements. | | |
FRANKLIN TEMPLETON VARIABLE INSURANCE PRODUCTS TRUST
FINANCIAL STATEMENTS
Statements of Changes in Net Assets
| | | | | | | | |
| | | Franklin Mutual Shares VIP Fund | |
| | | Year Ended December 31, | |
| | | 2014 | | | 2013 | |
Increase (decrease) in net assets: | | | | | | | | |
Operations: | | | | | | | | |
Net investment income | | $ | 136,029,133 | | | $ | 93,933,333 | |
Net realized gain (loss) from investments, written options, foreign currency transactions, futures contracts and securities sold short | | | 280,369,418 | | | | 369,009,836 | |
Net change in unrealized appreciation (depreciation) on investments and translation of other assets and liabilities denominated in foreign currencies | | | (60,935,280 | ) | | | 786,825,157 | |
| | | | |
Net increase (decrease) in net assets resulting from operations | | | 355,463,271 | | | | 1,249,768,326 | |
| | | | |
Distributions to shareholders from: | | | | | | | | |
Net investment income: | | | | | | | | |
Class 1 | | | (14,458,134 | ) | | | (11,380,461 | ) |
Class 2 | | | (87,785,708 | ) | | | (90,294,700 | ) |
Class 4 | | | (3,061,827 | ) | | | (3,535,676 | ) |
Net realized gains: | | | | | | | | |
Class 1 | | | (3,341,870 | ) | | | — | |
Class 2 | | | (22,825,048 | ) | | | — | |
Class 4 | | | (853,086 | ) | | | — | |
| | | | |
Total distributions to shareholders | | | (132,325,673 | ) | | | (105,210,837 | ) |
| | | | |
Capital share transactions: (Note 2) | | | | | | | | |
Class 1 | | | 79,247,758 | | | | (9,960,888 | ) |
Class 2 | | | (529,398,101 | ) | | | (502,396,967 | ) |
Class 4 | | | (39,025,210 | ) | | | (17,497,568 | ) |
| | | | |
Total capital share transactions | | | (489,175,553 | ) | | | (529,855,423 | ) |
| | | | |
Net increase (decrease) in net assets | | | (266,037,955 | ) | | | 614,702,066 | |
Net assets: | | | | | | | | |
Beginning of year | | | 5,298,862,682 | | | | 4,684,160,616 | |
| | | | |
End of year | | $ | 5,032,824,727 | | | $ | 5,298,862,682 | |
| | | | |
Undistributed net investment income included in net assets: | | | | | | | | |
End of year | | $ | 135,335,888 | | | $ | 91,100,656 | |
| | | | |
| | | | | | |
| | | The accompanying notes are an integral part of these financial statements. | Annual Report | | | MS-21 | |
FRANKLIN TEMPLETON VARIABLE INSURANCE PRODUCTS TRUST
Notes to Financial Statements
Franklin Mutual Shares VIP Fund
1. Organization and Significant Accounting Policies
Franklin Templeton Variable Insurance Products Trust (Trust) is registered under the Investment Company Act of 1940, as amended, (1940 Act) as an open-end management investment company, consisting of nineteen separate funds and applies the specialized accounting and reporting guidance in U.S. Generally Accepted Accounting Principles (U.S. GAAP). Franklin Mutual Shares VIP Fund (Fund) is included in this report. The financial statements of the remaining funds in the Trust are presented separately. Shares of the Fund are generally sold only to insurance company separate accounts to fund the benefits of variable life insurance policies or variable annuity contracts. The Fund offers three classes of shares: Class 1, Class 2, and Class 4. Each class of shares differs by its distribution fees, voting rights on matters affecting a single class and its exchange privilege.
Effective May 1, 2014, Mutual Shares Securities Fund was renamed Franklin Mutual Shares VIP Fund.
The following summarizes the Fund’s significant accounting policies.
a. Financial Instrument Valuation
The Fund’s investments in financial instruments are carried at fair value daily. Fair value is the price that would be received to sell an asset or paid to transfer a liability in an orderly transaction between market participants on the measurement date. The Fund calculates the net asset value (NAV) per share at the close of the New York Stock Exchange (NYSE), generally at 4 p.m. Eastern time (NYSE close) on each day the NYSE is open for trading. Under compliance policies and procedures approved by the Trust’s Board of Trustees (the Board), the Fund’s administrator has responsibility for oversight of valuation, including leading the cross-functional Valuation and Liquidity Oversight Committee (VLOC). The VLOC provides administration and oversight of the Fund’s valuation policies and procedures, which are approved annually by the Board. Among other things, these procedures allow the Fund to utilize independent pricing services, quotations from securities and financial instrument dealers, and other market sources to determine fair value.
Equity securities and derivative financial instruments (derivatives) listed on an exchange or on the NASDAQ National Market System are valued at the last quoted sale price or the official closing price of the day, respectively. Foreign equity
securities are valued as of the close of trading on the foreign stock exchange on which the security is primarily traded or as of the NYSE close, whichever is earlier. The value is then converted into its U.S. dollar equivalent at the foreign exchange rate in effect at the NYSE close on the day that the value of the security is determined. Over-the-counter (OTC) securities are valued within the range of the most recent quoted bid and ask prices. Securities that trade in multiple markets or on multiple exchanges are valued according to the broadest and most representative market. Certain equity securities are valued based upon fundamental characteristics or relationships to similar securities. Investments in non-registered money market funds are valued at the closing NAV.
Debt securities generally trade in the OTC market rather than on a securities exchange. The Fund’s pricing services use multiple valuation techniques to determine fair value. In instances where sufficient market activity exists, the pricing services may utilize a market-based approach through which quotes from market makers are used to determine fair value. In instances where sufficient market activity may not exist or is limited, the pricing services also utilize proprietary valuation models which may consider market characteristics such as benchmark yield curves, credit spreads, estimated default rates, anticipated market interest rate volatility, coupon rates, anticipated timing of principal repayments, underlying collateral, and other unique security features in order to estimate the relevant cash flows, which are then discounted to calculate the fair value. Securities denominated in a foreign currency are converted into their U.S. dollar equivalent at the foreign exchange rate in effect at the NYSE close on the date that the values of the foreign debt securities are determined.
Certain derivatives trade in the OTC market. The Fund’s pricing services use various techniques including industry standard option pricing models and proprietary discounted cash flow models to determine the fair value of those instruments. The Fund’s net benefit or obligation under the derivative contract, as measured by the fair value of the contract, is included in net assets.
The Fund has procedures to determine the fair value of financial instruments for which market prices are not reliable or readily available. Under these procedures, the VLOC convenes on a regular basis to review such financial instruments and considers a number of factors, including significant unobservable valuation inputs, when arriving at fair value. The VLOC primarily
FRANKLIN TEMPLETON VARIABLE INSURANCE PRODUCTS TRUST
NOTES TO FINANCIAL STATEMENTS
Franklin Mutual Shares VIP Fund (continued)
employs a market-based approach which may use related or comparable assets or liabilities, recent transactions, market multiples, book values, and other relevant information for the investment to determine the fair value of the investment. An income-based valuation approach may also be used in which the anticipated future cash flows of the investment are discounted to calculate fair value. Discounts may also be applied due to the nature or duration of any restrictions on the disposition of the investments. Due to the inherent uncertainty of valuations of such investments, the fair values may differ significantly from the values that would have been used had an active market existed. The VLOC employs various methods for calibrating these valuation approaches including a regular review of key inputs and assumptions, transactional back-testing or disposition analysis, and reviews of any related market activity.
Trading in securities on foreign securities stock exchanges and OTC markets may be completed before the daily NYSE close. In addition, trading in certain foreign markets may not take place on every NYSE business day. Occasionally, events occur between the time at which trading in a foreign security is completed and the close of the NYSE that might call into question the reliability of the value of a portfolio security held by the Fund. As a result, differences may arise between the value of the Fund’s portfolio securities as determined at the foreign market close and the latest indications of value at the close of the NYSE. In order to minimize the potential for these differences, the VLOC monitors price movements following the close of trading in foreign stock markets through a series of country specific market proxies (such as baskets of American Depositary Receipts, futures contracts and exchange traded funds). These price movements are measured against established trigger thresholds for each specific market proxy to assist in determining if an event has occurred that may call into question the reliability of the values of the foreign securities held by the Fund. If such an event occurs, the securities may be valued using fair value procedures, which may include the use of independent pricing services.
Also, when the last day of the reporting period is a non-business day, certain foreign markets may be open on those days that the NYSE is closed, which could result in differences between the value of the Fund’s portfolio securities on the last business day and the last calendar day of the reporting period. Any significant security valuation changes due to an open foreign market are adjusted and reflected by the Fund for financial reporting purposes.
b. Foreign Currency Translation
Portfolio securities and other assets and liabilities denominated in foreign currencies are translated into U.S. dollars based on the exchange rate of such currencies against U.S. dollars on the date of valuation. The Fund may enter into foreign currency exchange contracts to facilitate transactions denominated in a foreign currency. Purchases and sales of securities, income and expense items denominated in foreign currencies are translated into U.S. dollars at the exchange rate in effect on the transaction date. Portfolio securities and assets and liabilities denominated in foreign currencies contain risks that those currencies will decline in value relative to the U.S. dollar. Occasionally, events may impact the availability or reliability of foreign exchange rates used to convert the U.S. dollar equivalent value. If such an event occurs, the foreign exchange rate will be valued at fair value using procedures established and approved by the Board.
The Fund does not separately report the effect of changes in foreign exchange rates from changes in market prices on securities held. Such changes are included in net realized and unrealized gain or loss from investments on the Statement of Operations.
Realized foreign exchange gains or losses arise from sales of foreign currencies, currency gains or losses realized between the trade and settlement dates on securities transactions and the difference between the recorded amounts of dividends, interest, and foreign withholding taxes and the U.S. dollar equivalent of the amounts actually received or paid. Net unrealized foreign exchange gains and losses arise from changes in foreign exchange rates on foreign denominated assets and liabilities other than investments in securities held at the end of the reporting period.
c. Securities Purchased on a Delayed Delivery Basis
The Fund purchases securities on a delayed delivery basis, with payment and delivery scheduled for a future date. These transactions are subject to market fluctuations and are subject to the risk that the value at delivery may be more or less than the trade date purchase price. Although the Fund will generally purchase these securities with the intention of holding the securities, it may sell the securities before the settlement date. Sufficient assets have been segregated for these securities.
FRANKLIN TEMPLETON VARIABLE INSURANCE PRODUCTS TRUST
NOTES TO FINANCIAL STATEMENTS
Franklin Mutual Shares VIP Fund (continued)
1. Organization and Significant Accounting
Policies (continued)
d. Derivative Financial Instruments
The Fund invested in derivatives in order to manage risk or gain exposure to various other investments or markets. Derivatives are financial contracts based on an underlying or notional amount, require no initial investment or an initial net investment that is smaller than would normally be required to have a similar response to changes in market factors, and require or permit net settlement. Derivatives contain various risks including the potential inability of the counterparty to fulfill their obligations under the terms of the contract, the potential for an illiquid secondary market, and/or the potential for market movements which expose the Fund to gains or losses in excess of the amounts shown on the Statement of Assets and Liabilities. Realized gain and loss and unrealized appreciation and depreciation on these contracts for the period are included in the Statement of Operations.
Derivative counterparty credit risk is managed through a formal evaluation of the creditworthiness of all potential counterparties. The Fund attempts to reduce its exposure to counterparty credit risk on OTC derivatives, whenever possible, by entering into International Swaps and Derivatives Association (ISDA) master agreements with certain counterparties. These agreements contain various provisions, including but not limited to collateral requirements, events of default, or early termination. Termination events applicable to the counterparty include certain deteriorations in the credit quality of the counterparty. Termination events applicable to the Fund include failure of the Fund to maintain certain net asset levels and/or limit the decline in net assets over various periods of time. In the event of default or early termination, the ISDA master agreement gives the non-defaulting party the right to net and close-out all transactions traded, whether or not arising under the ISDA agreement, to one net amount payable by one counterparty to the other. However, absent an event of default or early termination, OTC derivative assets and liabilities are presented gross and not offset in the Statement of Assets and Liabilities. Early termination by the counterparty may result in an immediate payment by the Fund of any net liability owed to that counterparty under the ISDA agreement. At December 31, 2014, the Fund had OTC derivatives in a net liability position of $639,508 and the aggregate value of collateral pledged for such contracts was $579,884.
Collateral requirements differ by type of derivative. Collateral or initial margin requirements are set by the broker or exchange clearing house for exchange traded and centrally cleared derivatives. Initial margin deposited is held at the exchange and can be in the form of cash and/or securities. For OTC derivatives traded under an ISDA master agreement, posting of collateral is required by either the fund or the applicable counterparty if the total net exposure of all OTC derivatives with the applicable counterparty exceeds the minimum transfer amount, which typically ranges from $100,000 to $250,000, and can vary depending on the counterparty and the type of the agreement. Generally, collateral is determined at the close of fund business each day and any additional collateral required due to changes in derivative values may be delivered by the fund or the counterparty within a few business days. Collateral pledged and/or received by the fund for OTC derivatives, if any, is held in segregated accounts with the fund’s custodian/counterparty broker and can be in the form of cash and/or securities. Unrestricted cash may be invested according to the Fund’s investment objectives.
At December 31, 2014, the Fund received $11,628,180 in United Kingdom Treasury Notes, Federal Republic of Germany Bond, and U.S. Treasury Notes as collateral for derivatives.
The Fund entered into exchange traded futures contracts primarily to manage exposure to certain foreign currencies. A futures contract is an agreement between the Fund and a counterparty to buy or sell an asset for a specified price on a future date. Required initial margins are pledged by the Fund, and the daily change in fair value is accounted for as a variation margin payable or receivable on the Statement of Assets and Liabilities.
The Fund entered into OTC forward exchange contracts primarily to manage exposure to certain foreign currencies. A forward exchange contract is an agreement between the Fund and a counterparty to buy or sell a foreign currency at a specific exchange rate on a future date.
The Fund purchased or wrote exchange traded option contracts primarily to manage exposure to equity price risk. An option is a contract entitling the holder to purchase or sell a specific amount of shares or units of an asset or notional amount of a swap (swaption), at a specified price. Options purchased are recorded as an asset while options written are recorded as a liability. Upon exercise of an option, the acquisition cost or sales proceeds of the underlying investment is adjusted by any premium received or paid. Upon expiration of an option, any premium received or paid is recorded as
FRANKLIN TEMPLETON VARIABLE INSURANCE PRODUCTS TRUST
NOTES TO FINANCIAL STATEMENTS
Franklin Mutual Shares VIP Fund (continued)
a realized gain or loss. Upon closing an option other than through expiration or exercise, the difference between the premium and the cost to close the position is recorded as a realized gain or loss.
See Note 9 regarding other derivative information.
e. Restricted Cash
At December 31, 2014, the Fund held restricted cash in connection with investments in certain derivative securities. Restricted cash is held in a segregated account with the Fund’s custodian and is reflected in the Statement of Assets and Liabilities.
f. Securities Sold Short
The Fund is engaged in selling securities short, which obligates the Fund to replace a borrowed security with the same security at current fair value. The Fund incurs a loss if the price of the security increases between the date of the short sale and the date on which the Fund replaces the borrowed security. The Fund realizes a gain if the price of the security declines between those dates. Gains are limited to the price at which the Fund sold the security short, while losses are potentially unlimited in size.
The Fund is required to establish a margin account with the broker lending the security sold short. While the short sale is outstanding, the broker retains the proceeds of the short sale to the extent necessary to meet margin requirements until the short position is closed out. A deposit must also be maintained with the Fund’s custodian/counterparty broker consisting of cash and/or securities having a value equal to a specified percentage of the value of the securities sold short. The Fund is obligated to pay fees for borrowing the securities sold short and is required to pay the counterparty any dividends and/or interest due on securities sold short. Such dividends and/or interest and any security borrowing fees are recorded as an expense to the Fund.
g. Securities Lending
The Fund participates in an agency based securities lending program. The Fund receives cash collateral against the loaned securities in an amount equal to at least 102% of the fair value of the loaned securities. Collateral is maintained over the life of the loan in an amount not less than 100% of the fair value of loaned securities, as determined at the close of fund business each day; any additional collateral required due to changes in security values is delivered to the Fund on the next business day. The collateral is invested in a non-registered money fund as indicated in the Statement of Investments. The Fund receives income from
the investment of cash collateral, in addition to lending fees and rebates paid by the borrower. The Fund bears the market risk with respect to the collateral investment, securities loaned, and the risk that the agent may default on its obligations to the Fund. The securities lending agent has agreed to indemnify the Fund in the event of default by a third party borrower.
h. Senior Floating Rate Interests
The Fund invests in senior secured corporate loans that pay interest at rates which are periodically reset by reference to a base lending rate plus a spread. These base lending rates are generally the prime rate offered by a designated U.S. bank or the London InterBank Offered Rate (LIBOR). Senior secured corporate loans often require prepayment of principal from excess cash flows or at the discretion of the borrower. As a result, actual maturity may be substantially less than the stated maturity. Senior secured corporate loans in which the Fund invests are generally readily marketable, but may be subject to certain restrictions on resale.
i. Income and Deferred Taxes
It is the Fund’s policy to qualify as a regulated investment company under the Internal Revenue Code. The Fund intends to distribute to shareholders substantially all of its taxable income and net realized gains to relieve it from federal income and if applicable, excise taxes. As a result, no provision for U.S. federal income taxes is required.
The Fund may be subject to foreign taxation related to income received, capital gains on the sale of securities and certain foreign currency transactions in the foreign jurisdictions in which it invests. Foreign taxes, if any, are recorded based on the tax regulations and rates that exist in the foreign markets in which the Fund invests. When a capital gain tax is determined to apply the Fund records an estimated deferred tax liability in an amount that would be payable if the securities were disposed of on the valuation date. As a result of several court cases, in certain countries across the European Union, the Fund has filed additional tax reclaims for previously withheld taxes on dividends earned in those countries. These additional filings are subject to various administrative proceedings by the local jurisdictions’ tax authorities within the European Union, as well as a number of related judicial proceedings. At this time, uncertainty exists as to the ultimate resolution of these proceedings, the likelihood of receipt of these reclaims, and the potential timing of payment, and accordingly, no amounts are reflected in the financial statements.
FRANKLIN TEMPLETON VARIABLE INSURANCE PRODUCTS TRUST
NOTES TO FINANCIAL STATEMENTS
Franklin Mutual Shares VIP Fund (continued)
1. Organization and Significant Accounting
Policies (continued)
i. Income and Deferred Taxes (continued)
The Fund recognizes the tax benefits of uncertain tax positions only when the position is “more likely than not” to be sustained upon examination by the tax authorities based on the technical merits of the tax position. As of December 31, 2014, and for all open tax years, the Fund has determined that no liability for unrecognized tax benefits is required in the Fund’s financial statements related to uncertain tax positions taken on a tax return (or expected to be taken on future tax returns). Open tax years are those that remain subject to examination and are based on each tax jurisdiction statute of limitation.
j. Security Transactions, Investment Income, Expenses and Distributions
Security transactions are accounted for on trade date. Realized gains and losses on security transactions are determined on a specific identification basis. Interest income and estimated expenses are accrued daily. Amortization of premium and accretion of discount on debt securities are included in interest income. Dividend income and dividends declared on securities sold short are recorded on the ex-dividend date except for certain foreign securities where the dividend rate is not available. In such cases, the dividend rate is recorded as soon as the information is received by the Fund. Distributions to shareholders are recorded on the ex-dividend date and are determined according to income tax regulations (tax basis). Distributable earnings determined on a tax basis may differ from earnings recorded in accordance with U.S. GAAP. These differences may be permanent or temporary. Permanent differences are reclassified among capital accounts to reflect their tax character. These reclassifications have no impact on net
assets or the results of operations. Temporary differences are not reclassified, as they may reverse in subsequent periods.
Common expenses incurred by the Trust are allocated among the funds based on the ratio of net assets of each fund to the combined net assets of the Trust. Fund specific expenses are charged directly to the fund that incurred the expense.
Realized and unrealized gains and losses and net investment income, not including class specific expenses, are allocated daily to each class of shares based upon the relative proportion of net assets of each class. Differences in per share distributions, by class, are generally due to differences in class specific expenses.
k. Accounting Estimates
The preparation of financial statements in accordance with U.S. GAAP requires management to make estimates and assumptions that affect the reported amounts of assets and liabilities at the date of the financial statements and the amounts of income and expenses during the reporting period. Actual results could differ from those estimates.
l. Guarantees and Indemnifications
Under the Trust’s organizational documents, its officers and trustees are indemnified by the Trust against certain liabilities arising out of the performance of their duties to the Trust. Additionally, in the normal course of business, the Trust, on behalf of the Fund, enters into contracts with service providers that contain general indemnification clauses. The Trust’s maximum exposure under these arrangements is unknown as this would involve future claims that may be made against the Trust that have not yet occurred. Currently, the Trust expects the risk of loss to be remote.
FRANKLIN TEMPLETON VARIABLE INSURANCE PRODUCTS TRUST
NOTES TO FINANCIAL STATEMENTS
Franklin Mutual Shares VIP Fund (continued)
2. Shares of Beneficial Interest
At December 31, 2014, there were an unlimited number of shares authorized (without par value). Transactions in the Fund’s shares were as follows:
| | | | | | | | | | | | | | | | | | |
| | | Year Ended December 31, | |
| | | 2014 | | | | | 2013 | |
| | | Shares | | | Amount | | | | | Shares | | | Amount | |
| | | | | |
| Class 1 Shares: | | | | | | | | | | | | | | | | | | |
Shares sold | | | 5,610,891 | | | $ | 127,714,907 | | | | | | 1,271,063 | | | $ | 25,943,160 | |
Shares issued in reinvestment of distributions | | | 766,251 | | | | 17,800,004 | | | | | | 565,348 | | | | 11,380,461 | |
Shares redeemed | | | (2,917,184 | ) | | | (66,267,153 | ) | | | | | (2,402,608 | ) | | | (47,284,509 | ) |
| | | | |
Net increase (decrease) | | | 3,459,958 | | | $ | 79,247,758 | | | | | | (566,197 | ) | | $ | (9,960,888 | ) |
| | | | |
| Class 2 Shares: | | | | | | | | | | | | | | | | | | |
Shares sold | | | 9,492,120 | | | $ | 213,958,738 | | | | | | 9,115,759 | | | $ | 176,951,746 | |
Shares issued in reinvestment of distributions | | | 4,821,742 | | | | 110,610,757 | | | | | | 4,541,987 | | | | 90,294,700 | |
Shares redeemed | | | (38,420,623 | ) | | | (853,967,596 | ) | | | | | (39,198,203 | ) | | | (769,643,413 | ) |
| | | | |
Net increase (decrease) | | | (24,106,761 | ) | | $ | (529,398,101 | ) | | | | | (25,540,457 | ) | | $ | (502,396,967 | ) |
| | | | |
| | | | | |
| Class 4 Shares: | | | | | | | | | | | | | | | | | | |
Shares sold | | | 237,284 | | | $ | 5,313,846 | | | | | | 622,201 | | | $ | 12,228,440 | |
Shares issued on reinvestment of distributions | | | 169,771 | | | | 3,914,913 | | | | | | 176,961 | | | | 3,535,676 | |
Shares redeemed | | | (2,108,780 | ) | | | (48,253,969 | ) | | | | | (1,677,249 | ) | | | (33,261,684 | ) |
| | | | |
Net increase (decrease) | | | (1,701,725 | ) | | $ | (39,025,210 | ) | | | | | (878,087 | ) | | $ | (17,497,568 | ) |
| | | | |
3. Transactions With Affiliates
Franklin Resources, Inc. is the holding company for various subsidiaries that together are referred to as Franklin Templeton Investments. Certain officers and trustees of the Fund are also officers and/or directors of the following subsidiaries:
| | |
| Subsidiary | | Affiliation |
Franklin Mutual Advisers, LLC (Franklin Mutual) | | Investment manager |
Franklin Templeton Services, LLC (FT Services) | | Administrative manager |
Franklin Templeton Distributors, Inc. (Distributors) | | Principal underwriter |
Franklin Templeton Investor Services, LLC (Investor Services) | | Transfer agent |
a. Management Fees
The Fund pays an investment management fee to Franklin Mutual based on the average daily net assets of the Fund as follows:
| | |
| Annualized Fee Rate | | Net Assets |
0.750% | | Up to and including $200 million |
0.735% | | Over $200 million, up to and including $700 million |
0.700% | | Over $700 million, up to and including $1.2 billion |
0.675% | | Over $1.2 billion, up to and including $5 billion |
0.645% | | Over $5 billion, up to and including $10 billion |
0.625% | | Over $10 billion, up to and including $15 billion |
0.605% | | Over $15 billion, up to and including $20 billion |
0.585% | | In excess of $20 billion |
FRANKLIN TEMPLETON VARIABLE INSURANCE PRODUCTS TRUST
NOTES TO FINANCIAL STATEMENTS
Franklin Mutual Shares VIP Fund (continued)
3. Transactions With Affiliates (continued)
a. Management Fees (continued)
Effective May 1, 2014, the Fund combined its investment management and administration agreements as approved by the Board. The fees paid under the combined agreement do not exceed the aggregate fees that were paid under the separate agreements.
Prior to May 1, 2014, the Fund paid fees to Franklin Mutual based on the average daily net assets of the Fund as follows:
| | |
| Annualized Fee Rate | | Net Assets |
0.600% | | Up to and including $5 billion |
0.570% | | Over $5 billion, up to and including $10 billion |
0.550% | | Over $10 billion, up to and including $15 billion |
0.530% | | Over $15 billion, up to and including $20 billion |
0.510% | | In excess of $20 billion |
b. Administrative Fees
Effective May 1, 2014, under an agreement with Franklin Mutual, FT Services provides administrative services to the Fund. The fee is paid by Franklin Mutual based on the Fund’s average daily net assets, and is not an additional expense of the Fund.
Prior to May 1, 2014, the Fund paid administrative fees to FT Services based on the average daily net assets of the Fund as follows:
| | |
| Annualized Fee Rate | | Net Assets |
0.150% | | Up to and including $200 million |
0.135% | | Over $200 million, up to and including $700 million |
0.100% | | Over $700 million, up to and including $1.2 billion |
0.075% | | In excess of $1.2 billion |
c. Distribution Fees
The Board has adopted distribution plans for Class 2 and Class 4 shares pursuant to Rule 12b-1 under the 1940 Act. Under the Fund’s compensation distribution plans, the Fund pays Distributors for costs incurred in connection with the servicing, sale and distribution of the Fund’s shares up to 0.35% per year of its average daily net assets. Some distribution fees are not charged on shares held by affiliates. The Board has agreed to limit the current rate to 0.25% per year for Class 2. The plan year, for purposes of monitoring compliance with the maximum annual plan rates, is February 1 through January 31.
d. Transfer Agent Fees
Investor Services, under terms of an agreement, performs shareholder servicing for the Fund and is not paid by the Fund for the services.
e. Other Affiliated Transactions
At December 31, 2014, Franklin Templeton Variable Insurance Products Trust – Franklin Founding Funds Allocation VIP Fund owned 8.20% of the Fund’s outstanding shares.
4. Expense Offset Arrangement
The Fund has entered into an arrangement with its custodian whereby credits realized as a result of uninvested cash balances are used to reduce a portion of the Fund’s custodian expenses. During the year ended December 31, 2014, the custodian fees were reduced as noted in the Statement of Operations.
FRANKLIN TEMPLETON VARIABLE INSURANCE PRODUCTS TRUST
NOTES TO FINANCIAL STATEMENTS
Franklin Mutual Shares VIP Fund (continued)
5. Income Taxes
The tax character of distributions paid during the years ended December 31, 2014 and 2013, was as follows:
| | | | | | | | |
| | | 2014 | | | 2013 | |
Distributions paid from: | | | | | | | | |
Ordinary income | | $ | 105,305,669 | | | $ | 105,210,837 | |
Long term capital gain | | | 27,020,004 | | | | — | |
| | | | |
| | $ | 132,325,673 | | | $ | 105,210,837 | |
| | | | |
At December 31, 2014, the cost of investments, net unrealized appreciation (depreciation), undistributed ordinary income and undistributed long term capital gains for income tax purposes were as follows:
| | | | |
Cost of investments | | $ | 3,839,936,519 | |
| | | | |
Unrealized appreciation | | $ | 1,439,316,969 | |
Unrealized depreciation | | | (256,264,319 | ) |
| | | | |
Net unrealized appreciation (depreciation) | | $ | 1,183,052,650 | |
| | | | |
Undistributed ordinary income | | $ | 141,938,607 | |
Undistributed long term capital gains | | | 309,874,621 | |
| | | | |
Distributable earnings | | $ | 451,813,228 | |
| | | | |
Differences between income and/or capital gains as determined on a book basis and a tax basis are primarily due to differing treatments of foreign currency transactions, and bond discounts and premiums.
6. Investment Transactions
Purchases and sales of investments (excluding short term securities and securities sold short) for the year ended December 31, 2014, aggregated $1,037,069,828 and $1,605,445,498, respectively.
7. Credit Risk and Defaulted Securities
The Fund may purchase the pre-default or defaulted debt of distressed companies. Distressed companies are financially troubled and are about to be or are already involved in financial restructuring or bankruptcy. Risks associated with purchasing these securities include the possibility that the bankruptcy or other restructuring process takes longer than expected, or that distributions in restructuring are less than anticipated, either or both of which may result in unfavorable consequences to the Fund. If it becomes probable that the income on debt securities, including those of distressed companies, will not be collected, the Fund discontinues accruing income and recognizes an adjustment for uncollectible interest.
At December 31, 2014, the aggregate long value of distressed company securities for which interest recognition has been discontinued was $86,682,367, representing 1.72% of the Fund’s net assets. For information as to specific securities, see the accompanying Statement of Investments.
8. Restricted Securities
The Fund invests in securities that are restricted under the Securities Act of 1933 (1933 Act) or which are subject to legal, contractual, or other agreed upon restrictions on resale. Restricted securities are often purchased in private placement transactions, and cannot be sold without prior registration unless the sale is pursuant to an exemption under the 1933 Act. Disposal of these securities may require greater effort and expense, and prompt sale at an acceptable price may be difficult. The Fund may have registration rights for restricted securities. The issuer generally incurs all registration costs.
FRANKLIN TEMPLETON VARIABLE INSURANCE PRODUCTS TRUST
NOTES TO FINANCIAL STATEMENTS
Franklin Mutual Shares VIP Fund (continued)
8. Restricted Securities (continued)
At December 31, 2014, the Fund held investments in restricted securities, excluding certain securities exempt from registration under the 1933 Act deemed to be liquid, as follows:
| | | | | | | | | | | | | | |
Principal
Amount/
Shares | | Issuer | | Acquisition
Dates | | | Cost | | | Value | |
| 1,754 | | Broadband Ventures III LLC, secured promissory note, 5.00%, 2/01/12 | | | 7/01/10 - 11/30/12 | | | $ | 1,754 | | | $ | — | |
| 6,400,507 | | CB FIM Coinvestors LLC | | | 1/15/09 - 6/02/09 | | | | — | | | | — | |
| 8,006,950 | | FIM Coinvestor Holdings I, LLC | | | 11/20/06 - 6/02/09 | | | | — | | | | — | |
| 1,730,515 | | International Automotive Components Group Brazil LLC | | | 4/13/06 - 12/26/08 | | | | 1,149,241 | | | | 163,672 | |
| 15,382,424 | | International Automotive Components Group North America LLC | | | 1/12/06 - 3/18/13 | | | | 12,591,586 | | | | 11,647,264 | |
| 16,280 | | Olympus Re Holdings Ltd. | | | 12/19/01 | | | | 1,520,888 | | | | — | |
| | | | | | | | | | |
| | Total Restricted Securities (Value is 0.23% of Net Assets) | | | | | | $ | 15,263,469 | | | $ | 11,810,936 | |
| | | | | | | | | | |
9. Other Derivative Information
At December 31, 2014, the Fund’s investments in derivative contracts are reflected on the Statement of Assets and Liabilities as follows:
| | | | | | | | | | | | |
| | | Asset Derivatives | | | Liability Derivatives | |
Derivative Contracts
Not Accounted for
as Hedging Instruments | | Statement of Assets and
Liabilities Location | | Fair Value | | | Statement of Assets and
Liabilities Location | | Fair Value | |
Foreign exchange contracts | | Unrealized appreciation on forward exchange contracts / Net assets consist of - net unrealized appreciation (depreciation) | | $ | 26,255,896a | | | Unrealized depreciation on forward exchange contracts | | $
| 4,784,031
|
|
aIncludes cumulative appreciation (depreciation) of futures contracts as reported in the Statement of Investments. Only current day’s variation margin is separately reported within the Statement of Assets and Liabilities.
For the year ended December 31, 2014, the effect of derivative contracts on the Fund’s Statement of Operations was as follows:
| | | | | | | | | | |
Derivative Contracts
Not Accounted for
as Hedging Instruments | | Statement of Operations Locations | | Realized
Gain (Loss)
for the Year | | | Change in
Unrealized
Appreciation
(Depreciation)
for the Year | |
Foreign exchange contracts | | Net realized gain (loss) from foreign currency transactions and futures contracts / Net change in unrealized appreciation (depreciation) on translation of other assets and liabilities denominated in foreign currencies | | $ | (4,431,674 | ) | | $ | 49,678,899 | |
For the year ended December 31, 2014, the average month end fair value of derivatives represented 0.40% of average month end net assets. The average month end number of open derivative contracts for the year was 213.
See Note 1(d) regarding derivative financial instruments.
FRANKLIN TEMPLETON VARIABLE INSURANCE PRODUCTS TRUST
NOTES TO FINANCIAL STATEMENTS
Franklin Mutual Shares VIP Fund (continued)
10. Holdings of 5% Voting Securities of Portfolio Companies
The 1940 Act defines “affiliated companies” to include investments in portfolio companies in which a fund owns 5% or more of the outstanding voting securities. Investments in “affiliated companies” for the Fund for the year ended December 31, 2014, were as shown below.
| | | | | | | | | | | | | | | | | | | | | | | | | | | | |
| Name of Issuer | | Number of Shares
Held at Beginning
of Year | | | Gross
Additions | | | Gross
Reductions | | | Number of Shares
Held at End
of Year | | | Value at
End of
Year | | | Investment
Income | | | Realized Capital
Gain (Loss) | |
| Non-Controlled Affiliates | | | | | | | | | | | | | | | | | | | | | | | | | | | | |
CB FIM Coinvestors LLC (Value is 0.00% of Net Assets) | | | 6,400,507 | | | | — | | | | — | | | | 6,400,507 | | | $ | — | | | $ | — | | | $ | — | |
| | | | | | | | | | | | | | | | | | | | |
11. Credit Facility
The Fund, together with other U.S. registered and foreign investment funds (collectively, Borrowers), managed by Franklin Templeton Investments, are borrowers in a joint syndicated senior unsecured credit facility totaling $1.5 billion (Global Credit Facility) which matured on February 13, 2015. This Global Credit Facility provides a source of funds to the Borrowers for temporary and emergency purposes, including the ability to meet future unanticipated or unusually large redemption requests. The Borrowers expect to renew the Global Credit Facility for a total of $2 billion effective February 13, 2015, which matures on February 12, 2016.
Under the terms of the Global Credit Facility, the Fund shall, in addition to interest charged on any borrowings made by the Fund and other costs incurred by the Fund, pay its share of fees and expenses incurred in connection with the implementation and maintenance of the Global Credit Facility, based upon its relative share of the aggregate net assets of all of the Borrowers, including an annual commitment fee of 0.07% based upon the unused portion of the Global Credit Facility. These fees are reflected in other expenses on the Statement of Operations. During the year ended December 31, 2014, the Fund did not use the Global Credit Facility.
12. Fair Value Measurements
The Fund follows a fair value hierarchy that distinguishes between market data obtained from independent sources (observable inputs) and the Fund’s own market assumptions (unobservable inputs). These inputs are used in determining the value of the Fund’s financial instruments and are summarized in the following fair value hierarchy:
| | • | | Level 1 – quoted prices in active markets for identical financial instruments |
| | • | | Level 2 – other significant observable inputs (including quoted prices for similar financial instruments, interest rates, prepayment speed, credit risk, etc.) |
| | • | | Level 3 – significant unobservable inputs (including the Fund’s own assumptions in determining the fair value of financial instruments) |
The input levels are not necessarily an indication of the risk or liquidity associated with financial instruments at that level.
For movements between the levels within the fair value hierarchy, the Fund has adopted a policy of recognizing the transfers as of the date of the underlying event which caused the movement.
FRANKLIN TEMPLETON VARIABLE INSURANCE PRODUCTS TRUST
NOTES TO FINANCIAL STATEMENTS
Franklin Mutual Shares VIP Fund (continued)
12. Fair Value Measurements (continued)
A summary of inputs used as of December 31, 2014, in valuing the Fund’s assets and liabilities carried at fair value, is as follows:
| | | | | | | | | | | | | | | | |
| | | Level 1 | | | Level 2 | | | Level 3 | | | Total | |
| Assets: | | | | | | | | | | | | | | | | |
Investments in Securities: | | | | | | | | | | | | | | | | |
Equity Investments:a | | | | | | | | | | | | | | | | |
Auto Components | | $ | — | | | $ | — | | | $ | 11,810,936 | | | $ | 11,810,936 | |
Machinery | | | 46,575,001 | | | | 14,955,907 | | | | — | | | | 61,530,908 | |
Real Estate Management & Development | | | 2,489,733 | | | | — | | | | 12,949,288 | | | | 15,439,021 | |
All Other Equity Investmentsb | | | 4,183,796,404 | | | | — | | | | — | c | | | 4,183,796,404 | |
Corporate Bonds, Notes and Senior Floating Rate Interests | | | — | | | | 248,099,256 | | | | — | | | | 248,099,256 | |
Corporate Notes and Senior Floating Rate Interests in Reorganization | | | — | | | | 86,682,367 | | | | — | c | | | 86,682,367 | |
Companies in Liquidation | | | 70,280 | | | | 36,034,254 | | | | — | c | | | 36,104,534 | |
Municipal Bonds | | | — | | | | 13,725,739 | | | | — | | | | 13,725,739 | |
Short Term Investments | | | 351,351,209 | | | | 14,448,795 | | | | — | | | | 365,800,004 | |
| | | | |
Total Investments in Securities | | $ | 4,584,282,627 | | | $ | 413,946,318 | | | $ | 24,760,224 | | | $ | 5,022,989,169 | |
| | | | |
Other Financial Instruments | | | | | | | | | | | | | | | | |
Futures Contracts | | $ | 2,504,024 | | | $ | — | | | $ | — | | | $ | 2,504,024 | |
Forward Exchange Contracts | | | — | | | | 23,751,872 | | | | — | | | | 23,751,872 | |
| | | | |
Total Other Financial Instruments | | $ | 2,504,024 | | | $ | 23,751,872 | | | $ | — | | | $ | 26,255,896 | |
| | | | |
| | | | |
| Liabilities: | | | | | | | | | | | | | | | | |
Other Financial Instruments | | | | | | | | | | | | | | | | |
Securities Sold Short | | $ | 33,033,145 | | | $ | — | | | $ | — | | | $ | 33,033,145 | |
Forward Exchange Contracts | | | — | | | | 4,784,031 | | | | — | | | | 4,784,031 | |
| | | | |
Total Other Financial Instruments | | $ | 33,033,145 | | | $ | 4,784,031 | | | $ | — | | | $ | 37,817,176 | |
| | | | |
aIncludes common and preferred stocks as well as other equity investments.
bFor detailed categories, see the accompanying Statement of Investments.
cIncludes securities determined to have no value at December 31, 2014.
A reconciliation of assets in which Level 3 inputs are used in determining fair value is presented when there are significant Level 3 financial instruments at the end of the year.
13. New Accounting Pronouncements
In June 2014, the Financial Accounting Standards Board issued Accounting Standards Update (ASU) No. 2014-11, Transfers and Servicing (Topic 860), Repurchase-to-Maturity Transactions, Repurchase Financings, and Disclosures. The ASU changes the accounting for certain repurchase agreements and expands disclosure requirements related to repurchase agreements, securities lending, repurchase-to-maturity and similar transactions. The ASU is effective for interim and annual reporting periods beginning after December 15, 2014. Management has reviewed the requirements and believes the adoption of this ASU will not have a material impact on the financial statements.
14. Subsequent Events
The Fund has evaluated subsequent events through the issuance of the financial statements and determined that no events have occurred that require disclosure other than those already disclosed in the financial statements.
FRANKLIN TEMPLETON VARIABLE INSURANCE PRODUCTS TRUST
NOTES TO FINANCIAL STATEMENTS
Franklin Mutual Shares VIP Fund (continued)
Abbreviations
| | | | | | | | | | |
| Counterparty | | Currency | | Selected Portfolio |
| | | | | |
| BOFA | | Bank of America Corp. | | CAD | | Canadian Dollar | | ADR | | American Depositary Receipt |
| | | | | |
| BONY | | Bank of New York Mellon | | CHF | | Swiss Franc | | GO | | General Obligation |
| | | | | |
| BZWS | | Barclays Bank PLC | | EUR | | Euro | | IDR | | International Depositary Receipt |
| | | | | |
| DBAB | | Deutsche Bank AG | | GBP | | British Pound | | PIK | | Payment-In-Kind |
| | | | | |
| FBCO | | Credit Suisse Group AG | | USD | | United States Dollar | | | | |
| | | | | |
| HSBC | | HSBC Bank USA, N.A. | | | | | | | | |
| | | | | |
| SCBT | | Standard Chartered Bank | | | | | | | | |
| | | | | |
| SSBT | | State Street Bank and Trust Co. | | | | | | | | |
FRANKLIN TEMPLETON VARIABLE INSURANCE PRODUCTS TRUST
Report of Independent Registered Public Accounting Firm
Franklin Mutual Shares VIP Fund
To the Board of Trustees and Shareholders of Franklin Templeton Variable Insurance Products Trust
In our opinion, the accompanying statement of assets and liabilities, including the statement of investments, and the related statements of operations and of changes in net assets and the financial highlights present fairly, in all material respects, the financial position of Franklin Mutual Shares VIP Fund (the “Fund”) at December 31, 2014, the results of its operations for the year then ended, the changes in its net assets for each of the two years in the period then ended and the financial highlights for each of the five years in the period then ended, in conformity with accounting principles generally accepted in the United States of America. These financial statements and financial highlights (hereafter referred to as “financial statements”) are the responsibility of the Fund’s management. Our responsibility is to express an opinion on these financial statements based on our audits. We conducted our audits of these financial statements in accordance with the standards of the Public Company Accounting Oversight Board (United States). Those standards require that we plan and perform the audit to obtain reasonable assurance about whether the financial statements are free of material misstatement. An audit includes examining, on a test basis, evidence supporting the amounts and disclosures in the financial statements, assessing the accounting principles used and significant estimates made by management, and evaluating the overall financial statement presentation. We believe that our audits, which included confirmation of securities at December 31, 2014 by correspondence with the custodian and brokers, provides a reasonable basis for our opinion.
PricewaterhouseCoopers LLP
San Francisco, California
February 13, 2015
FRANKLIN TEMPLETON VARIABLE INSURANCE PRODUCTS TRUST
Tax Information (unaudited)
Franklin Mutual Shares VIP Fund
Under Section 852(b)(3)(C) of the Internal Revenue Code (Code), the Fund hereby reports the maximum amount allowable but no less than $27,020,004 as a long term capital gain distribution for the fiscal year ended December 31, 2014.
Under Section 854(b)(1)(A) of the Code, the Fund hereby reports 58.87% of the ordinary income dividends as income qualifying for the dividends received deduction for the fiscal year ended December 31, 2014.
Franklin Rising Dividends VIP Fund
(Formerly, Franklin Rising Dividends Securities Fund)
This annual report for Franklin Rising Dividends VIP Fund covers the fiscal year ended December 31, 2014.
Class 2 Performance Summary as of December 31, 2014
Average annual total return of Class 2 shares* represents the average annual change in value, assuming reinvestment of dividends and capital gains. Average returns smooth out variations in returns, which can be significant; they are not the same as year-by-year results.
| | | | | | | | | | | | |
| Periods ended 12/31/14 | | 1-Year | | | 5-Year | | | 10-Year | |
Average Annual Total Return | | | +8.72% | | | | +15.09% | | | | +7.37% | |
*The Fund has a fee waiver associated with its investments in a Franklin Templeton money fund, contractually guaranteed through at least its current fiscal year-end. Fund investment results reflect the fee waiver, to the extent applicable; without this reduction, the results would have been lower.
Performance reflects the Fund’s Class 2 operating expenses, but does not include any contract fees, expenses or sales charges. If they had been included, performance would be lower. These charges and deductions, particularly for variable life policies, can have a significant effect on contract values and insurance benefits. See the contract prospectus for a complete description of these expenses, including sales charges.
Performance data represent past performance, which does not guarantee future results. Investment return and principal value will fluctuate, and you may have a gain or loss when you sell your shares. Current performance may differ from figures shown.
Total Return Index Comparison for a Hypothetical $10,000 Investment (1/1/05–12/31/14)
The graph below shows the change in value of a hypothetical $10,000 investment in the Fund over the indicated period and includes reinvestment of any income or distributions. The Fund’s performance* is compared to the performance of the Standard & Poor’s® 500 Index (S&P 500®). One cannot invest directly in an index, and an index is not representative of the Fund’s portfolio. Please see Important Notes to Performance Information preceding the Fund Summaries.
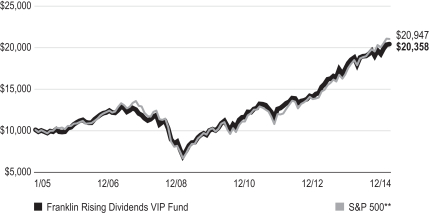
**Source: Morningstar. Please see Index Descriptions following the Fund Summaries.
FRANKLIN RISING DIVIDENDS VIP FUND
Fund Goal and Main Investments
Franklin Rising Dividends VIP Fund seeks long-term capital appreciation, with preservation of capital as an important consideration. Under normal market conditions, the Fund invests at least 80% of its net assets in equity securities of companies that have paid rising dividends.
Fund Risks
All investments involve risks, including possible loss of principal. Value securities may not increase in price as anticipated or may decline further in value. While smaller and midsized companies may offer substantial opportunities for capital growth, they also involve heightened risks and should be considered speculative. Historically, smaller- and midsized-company securities have been more volatile in price than larger company securities, especially over the short term. The Fund is actively managed but there is no guarantee that the manager’s investment decisions will produce the desired results. The Fund’s prospectus also includes a description of the main investment risks.
Performance Overview
You can find the Fund’s one-year total return in the Performance Summary. In comparison, the S&P 500 rose 13.69% for the same period.1 Please note the Fund employs a bottom-up stock selection process, and the managers invest in securities without regard to benchmark comparisons.
Economic and Market Overview
The U.S. economy continued to grow during the year ended December 31, 2014, underpinned in some quarters by manufacturing activity, consumer and business spending, and federal defense spending. Home sales experienced some weakness resulting from reduced inventory, higher mortgage rates and tight credit requirements but began to recover in May as mortgage rates declined. Home prices stayed higher than a year earlier. Retail sales generally improved, supported by job growth and lower gasoline prices in the latter part of 2014. The unemployment rate declined to 5.6% in December 2014 from 6.7% in December 2013.2 Inflation, as measured by the Consumer Price Index, remained low.
In January 2014, the U.S. Federal Reserve Board (Fed) began reducing its large-scale bond purchases $10 billion a month and ended the buying program in October. But it continued its practice of maintaining holdings of longer term securities at sizable levels. The Fed believed underlying economic strength could support ongoing progress in labor market conditions. The Fed also noted that although inflation might remain low in the near term, the likelihood of inflation running persistently below 2% had diminished. Toward period-end, the Fed stated that it could be patient with regard to raising interest rates and that the interest rate might not rise for at least a couple of meetings, possibly implying at least the first two meetings of 2015.
Investor confidence grew during the period as corporate profits rose and the economy generally strengthened. The market endured sell-offs when many investors reacted to political instability in certain emerging markets, crises in Ukraine and the Middle East, weakness in Europe and Japan, and moderating economic data in China. U.S. stocks rose overall for the 12 months under review as the S&P 500 and Dow Jones Industrial Average reached all-time highs.3
Investment Strategy
We are a research-driven, fundamental investment adviser, pursuing a disciplined value-oriented strategy. As bottom-up investors concentrating primarily on individual securities, we seek fundamentally sound companies that we believe meet our screening criteria, which include consistent, substantial dividend increases; reinvested earnings; and strong balance sheets. We attempt to acquire such stocks at attractive prices, often when they are out of favor with other investors. In following these criteria, we do not necessarily focus on companies whose securities pay a high dividend but rather on companies that consistently raise their dividends.
Manager’s Discussion
During the 12 months under review, three holdings that helped absolute Fund performance were Air Products and Chemicals, Becton, Dickinson & Co., and Stryker. Shares of Air Products and Chemicals, an industrial gas producer, benefited from solid earnings performance over the year and positive sentiment surrounding the ongoing involvement of an activist shareholder. The share price rose sharply in June after the appointment
1. Source: Morningstar.
One cannot invest directly in an index, and an index is not representative of the Fund’s portfolio. Please see Index Descriptions following the Fund Summaries.
2. Source: Bureau of Labor Statistics.
3. Please see Index Descriptions following the Fund Summaries.
FRANKLIN RISING DIVIDENDS VIP FUND
of new chief executive officer Seifi Ghasemi and again in September when he announced his reorganization plan. The company has a 32-year history of increasing dividends. Becton, Dickinson & Co., a manufacturer of medical devices, reported solid results through most of 2014, with the largest gain occurring in the second half of the year after the company announced it intended to buy CareFusion. The stock rose again in November after the company announced it intended to finance a portion of the acquisition through the repatriation of overseas cash, thereby taking on less debt and enabling greater cash accretion in the first year following the deal. Becton has raised its dividend for the past 43 years. Shares of Stryker, a medical technology company, rose sharply in the second half of 2014 partly resulting, in our view, from a strong earnings report in October, suggesting a pickup in hip and knee surgery end markets. Stryker’s management has been enthusiastic about the commercial prospects of the company’s robotic assisted surgery platform, obtained from its acquisition of MAKO Surgical Corp. in late 2013. Speculation continued throughout 2014 about whether Stryker would buy Smith & Nephew, a British-based medical equipment manufacturer. The deal would hold the possibility of a tax inversion for Stryker. The company has a 22-year history of dividend increases.
Detractors from absolute Fund performance included Pentair, Dover and Chevron. Shares of Pentair, a manufacturer of water pumps and filtration systems, continued to struggle during the period, as ongoing weakness in its water transport business and concerns regarding the company’s exposure to oil and gas end markets were compounded by a reduction in previous 2014 and 2015 full-year earnings-per-share guidance. The lower guidance was largely driven by management’s decision to sell the troubled water transport business; however, the weaker-than-anticipated global economic environment also contributed to the revision, as management struggled to fully offset economic headwinds with cost structure improvements. Pentair has 38 years of dividend increases. After a solid first-half performance, shares of Dover, an industrial products and equipment manufacturer, declined sharply over the second half of 2014, ending the year down. Concerns regarding Dover’s exposure to energy end markets were the primary cause of its share price weakness, as investors worried the oil price decline would lead to a drop in U.S. shale production and hence, less demand for the company’s oil production equipment. Dover’s management expected its energy end markets to be a headwind in 2015. The company has raised dividends for the past 59 years. Shares of Chevron, a global, integrated energy company, declined in line
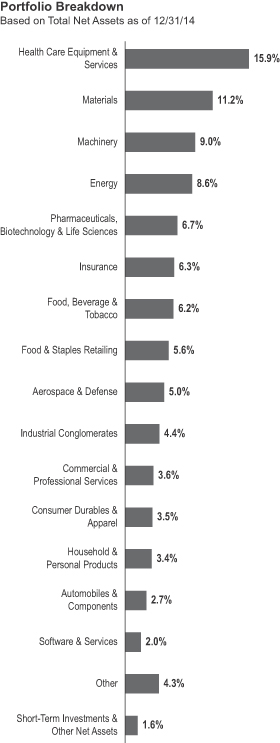
FRANKLIN RISING DIVIDENDS VIP FUND
with the broader energy sector, as the unexpected and severe oil price decline over the second half of the year resulted in indiscriminate selling across the sector. However, we continued to hold Chevron and believe that over time, the company’s scale, geographic diversity and integrated downstream activities should provide operational resilience in an uncertain energy price environment. Chevron has 27 years of dividend increases.
During the period, we initiated new positions including Schlumberger, an oilfield services company with a substantial history of dividend increases; Microsoft, a global software and services provider (11 years of consecutive dividend increases); Accenture, a management consulting, technology and outsourcing services firm (10 years); CVS Health, an integrated pharmacy health care provider (12 years); and EOG Resources, an oil and gas exploration and production company with a substantial history of dividend increases. We added to our positions in Honeywell International, a diversified industrial company, with a history of dividend increases; Bunge, a global agribusiness and food company (13 years); and QUALCOMM, a digital communications products and services manufacturer (11 years), among others. Positions that we liquidated included Family Dollar Stores, Superior Uniform Group, Hill-Rom Holdings, Mercury General and Cohu. We reduced our holdings in International Business Machines, Air Products and Chemicals, and Teleflex, among others.
Our 10 largest positions on December 31, 2014, represented 33.9% of the Fund’s total net assets. It is interesting to note how these 10 companies would respond, in aggregate, to the Fund’s screening criteria based on a simple average of statistical measures. On average, these 10 companies have raised their dividends 33 years in a row and by 344% in the past 10 years. Their most recent year-over-year dividend increases averaged 8.8% with a yield of 2.0% on December 31, 2014, and a dividend payout ratio of 34.7%, based on estimates of calendar year 2015 operating earnings. The average price/earnings ratio was 19.5 times calendar year 2014 estimates versus 18.2 for that of the unmanaged S&P 500.
Thank you for your participation in Franklin Rising Dividends VIP Fund. We look forward to continuing to serve your investment needs.
| | | | |
| Top 10 Holdings | | | |
| 12/31/14 | | | |
Company
Sector/Industry | | % of Total
Net Assets | |
Roper Industries Inc.
Industrial Conglomerates | | | 4.0% | |
Praxair Inc.
Materials | | | 3.7% | |
United Technologies Corp.
Aerospace & Defense | | | 3.7% | |
Johnson & Johnson
Pharmaceuticals, Biotechnology & Life Sciences | | | 3.5% | |
Becton, Dickinson & Co.
Health Care Equipment & Services | | | 3.4% | |
Dover Corp.
Machinery | | | 3.3% | |
Chevron Corp.
Energy | | | 3.1% | |
West Pharmaceutical Services Inc.
Health Care Equipment & Services | | | 3.1% | |
Stryker Corp.
Health Care Equipment & Services | | | 3.1% | |
Wal-Mart Stores Inc.
Food & Staples Retailing | | | 3.0% | |
The dollar value, number of shares or principal amount, and names of all portfolio holdings are listed in the Fund’s Statement of Investments (SOI).
The foregoing information reflects our analysis, opinions and portfolio holdings as of December 31, 2014, the end of the reporting period. The way we implement our main investment strategies and the resulting portfolio holdings may change depending on factors such as market and economic conditions. These opinions may not be relied upon as investment advice or an offer for a particular security. The information is not a complete analysis of every aspect of any market, country, industry, security or the Fund. Statements of fact are from sources considered reliable, but the investment manager makes no representation or warranty as to their completeness or accuracy. Although historical performance is no guarantee of future results, these insights may help you understand our investment management philosophy.
FRANKLIN RISING DIVIDENDS VIP FUND
Class 2 Fund Expenses
As an investor in a variable insurance contract (Contract) that indirectly provides for investment in an underlying mutual fund, you can incur transaction and/or ongoing expenses at both the Fund level and the Contract level.
| • | | Transaction expenses can include sales charges (loads) on purchases, redemption fees, surrender fees, transfer fees and premium taxes. |
| • | | Ongoing expenses can include management fees, distribution and service (12b-1) fees, contract fees, annual maintenance fees, mortality and expense risk fees and other fees and expenses. All mutual funds and Contracts have some types of ongoing expenses. |
The expenses shown in the table are meant to highlight ongoing expenses at the Fund level only and do not include ongoing expenses at the Contract level, or transaction expenses at either the Fund or Contract level. While the Fund does not have transaction expenses, if the transaction and ongoing expenses at the Contract level were included, the expenses shown below would be higher. You should consult your Contract prospectus or disclosure document for more information.
The table shows Fund-level ongoing expenses and can help you understand these expenses and compare them with those of other mutual funds offered through the Contract. The table assumes a $1,000 investment held for the six months indicated. Please refer to the Fund prospectus for additional information on operating expenses.
Actual Fund Expenses
The first line (Actual) of the table provides actual account values and expenses. The “Ending Account Value” is derived from the Fund’s actual return, which includes the effect of ongoing Fund expenses, but does not include the effect of ongoing Contract expenses.
You can estimate the Fund-level expenses you incurred during the period by following these steps. Of course, your account value and expenses will differ from those in this illustration:
| 1. | Divide your account value by $1,000. |
If an account had an $8,600 value, then $8,600 ÷ $1,000 = 8.6.
| 2. | Multiply the result by the number under the heading “Fund-Level Expenses Incurred During Period.” |
If Fund-Level Expenses Incurred During Period were $7.50, then 8.6 × $7.50 = $64.50.
In this illustration, the estimated expenses incurred this period at the Fund level are $64.50.
Hypothetical Example for Comparison with Other Mutual Funds
Information in the second line (Hypothetical) of the table can help you compare ongoing expenses of the Fund with those of other mutual funds offered through the Contract. This information may not be used to estimate the actual ending account balance or expenses you incurred during the period. The hypothetical “Ending Account Value” is based on the Fund’s actual expense ratio and an assumed 5% annual rate of return before expenses, which does not represent the Fund’s actual return. The figure under the heading “Fund-Level Expenses Incurred During Period” shows the hypothetical expenses your account would have incurred under this scenario. You can compare this figure with the 5% hypothetical examples that appear in shareholder reports of other funds offered through a Contract.
| | | | | | | | | | | | |
| Class 2 | | Beginning Account Value 7/1/14 | | | Ending Account Value 12/31/14 | | | Fund-Level Expenses Incurred During Period* 7/1/14–12/31/14 | |
Actual | | | $1,000 | | | | $1,043.10 | | | | $4.48 | |
Hypothetical (5% return before expenses) | | | $1,000 | | | | $1,020.82 | | | | $4.43 | |
*Expenses are calculated using the most recent six-month annualized expense ratio, net of expense waivers, for the Fund’s Class 2 shares (0.87%), which does not include any ongoing expenses of the Contract for which the Fund is an investment option, multiplied by the average account value over the period, multiplied by 184/365 to reflect the one-half year period.
SUPPLEMENT DATED OCTOBER 1, 2014
TO THE PROSPECTUSES DATED MAY 1, 2014
OF
FRANKLIN RISING DIVIDENDS VIP FUND
(A series of Franklin Templeton Variable Insurance Products Trust)
The prospectus is amended as follows:
I. The Fund Summary “Portfolio Managers” section beginning on page FRD-S4 is revised to remove reference to William J. Lippman and revise Donald G. Taylor’s biography to the following:
Portfolio Managers
DONALD G. TAYLOR, CPA President and Chief Investment Officer of Advisory Services and portfolio manager of the Fund since 1996.
NICHOLAS P. B. GETAZ, CFA Research Analyst of Advisory Services and portfolio manager of the Fund since February 2014.
BRUCE C. BAUGHMAN, CPA Senior Vice President of Advisory Services and portfolio manager of the Fund since inception (1992).
II. The portfolio management team in the “Fund Details – Management” section beginning on page FRD-D6 is revised to remove reference to William J. Lippman and revise Donald G. Taylor’s title to the following:
The Fund is managed by a team of dedicated professionals focused on investments that have paid rising dividends. The portfolio managers of the team are as follows:
| | |
| DONALD G. TAYLOR, CPA President and Chief Investment Officer of Advisory Services | | Mr. Taylor has been the lead portfolio manager of the Fund since 1996. He has primary responsibility for the investments of the Fund. He has final authority over all aspects of the Fund’s investment portfolio, including but not limited to, purchases and sales of individual securities, portfolio risk assessment, and the management of daily cash balances in accordance with anticipated investment management requirements. The degree to which he may perform these functions, and the nature of these functions, may change from time to time. He joined Franklin Templeton Investments in 1996. |
| |
NICHOLAS P. B. GETAZ, CFA Research Analyst of Advisory Services | | Mr. Getaz has been portfolio manager of the Fund since February 2014, providing support to the lead portfolio manager(s) as needed. He joined Franklin Templeton Investments in 2011. |
| | |
| |
| BRUCE C. BAUGHMAN, CPA Senior Vice President of Advisory Services | | Mr. Baughman has been a portfolio manager of the Fund since its inception (1992), providing support to the lead portfolio manager(s) as needed. He joined Franklin Templeton Investments in 1988. |
CFA® and Chartered Financial Analyst® are trademarks owned by CFA Institute.
Please keep this supplement with your prospectus for future reference.
FRANKLIN TEMPLETON VARIABLE INSURANCE PRODUCTS TRUST
Financial Highlights
Franklin Rising Dividends VIP Fund
| | | | | | | | | | | | | | | | | | | | |
| | | Year Ended December 31, | |
| | | 2014 | | | 2013 | | | 2012 | | | 2011 | | | 2010 | |
| Class 1 | | | | | | | | | | | | | | | | | | | | |
Per share operating performance
(for a share outstanding throughout the year) | | | | | | | | | | | | | | | | | | | | |
| | | | | |
Net asset value, beginning of year | | | $28.14 | | | | $22.03 | | | | $20.01 | | | | $19.15 | | | | $16.13 | |
| | | | |
| | | | | |
| Income from investment operationsa: | | | | | | | | | | | | | | | | | | | | |
| | | | | |
Net investment incomeb | | | 0.45 | | | | 0.40 | | | | 0.41 | | | | 0.36 | | | | 0.32 | |
| | | | | |
Net realized and unrealized gains (losses) | | | 2.03 | | | | 6.16 | | | | 2.00 | | | | 0.83 | | | | 3.01 | |
| | | | |
Total from investment operations | | | 2.48 | | | | 6.56 | | | | 2.41 | | | | 1.19 | | | | 3.33 | |
| | | | |
| | | | | |
| Less distributions from: | | | | | | | | | | | | | | | | | | | | |
| | | | | |
Net investment income | | | (0.44 | ) | | | (0.45 | ) | | | (0.39 | ) | | | (0.33 | ) | | | (0.31 | ) |
| | | | | |
Net realized gains | | | (0.55 | ) | | | — | | | | — | | | | — | | | | — | |
| | | | |
Total distributions | | | (0.99 | ) | | | (0.45 | ) | | | (0.39 | ) | | | (0.33 | ) | | | (0.31 | ) |
| | | | |
Net asset value, end of year | | | $29.63 | | | | $28.14 | | | | $22.03 | | | | $20.01 | | | | $19.15 | |
| | | | |
| | | | | |
Total returnc | | | 9.01% | | | | 30.05% | | | | 12.18% | | | | 6.29% | | | | 20.94% | |
| | | | | |
| Ratios to average net assets | | | | | | | | | | | | | | | | | | | | |
| | | | | |
Expenses | | | 0.62% | d | | | 0.61% | | | | 0.63% | | | | 0.63% | | | | 0.64% | |
| | | | | |
Net investment income | | | 1.58% | | | | 1.59% | | | | 1.96% | | | | 1.87% | | | | 1.88% | |
| | | | | |
| Supplemental data | | | | | | | | | | | | | | | | | | | | |
| | | | | |
Net assets, end of year (000’s) | | | $160,480 | | | | $168,380 | | | | $141,455 | | | | $140,297 | | | | $148,544 | |
| | | | | |
Portfolio turnover rate | | | 8.61% | | | | 0.07% | | | | 11.19% | | | | 12.76% | | | | 8.97% | |
aThe amount shown for a share outstanding throughout the period may not correlate with the Statement of Operations for the period due to the timing of sales and repurchases of the Fund shares in relation to income earned and/or fluctuating fair value of the investments of the Fund.
bBased on average daily shares outstanding.
cTotal return does not include fees, charges or expenses imposed by the variable annuity and life insurance contracts for which Franklin Templeton Variable Insurance Products Trust serves as an underlying investment vehicle.
dBenefit of waiver and payments by affiliates rounds to less than 0.01%.
| | | | |
| FRD-8 | | Annual Report | The accompanying notes are an integral part of these financial statements. | | |
FRANKLIN TEMPLETON VARIABLE INSURANCE PRODUCTS TRUST
FINANCIAL HIGHLIGHTS
Franklin Rising Dividends VIP Fund (continued)
| | | | | | | | | | | | | | | | | | | | |
| | | Year Ended December 31, | |
| | | 2014 | | | 2013 | | | 2012 | | | 2011 | | | 2010 | |
| Class 2 | | | | | | | | | | | | | | | | | | | | |
Per share operating performance (for a share outstanding throughout the year) | | | | | | | | | | | | | | | | | | | | |
| | | | | |
Net asset value, beginning of year | | | $27.62 | | | | $21.64 | | | | $19.65 | | | | $18.82 | | | | $15.86 | |
| | | | |
| | | | | |
| Income from investment operationsa: | | | | | | | | | | | | | | | | | | | | |
| | | | | |
Net investment incomeb | | | 0.37 | | | | 0.33 | | | | 0.35 | | | | 0.31 | | | | 0.28 | |
| | | | | |
Net realized and unrealized gains (losses) | | | 1.99 | | | | 6.04 | | | | 1.98 | | | | 0.81 | | | | 2.95 | |
| | | | |
Total from investment operations | | | 2.36 | | | | 6.37 | | | | 2.33 | | | | 1.12 | | | | 3.23 | |
| | | | |
| | | | | |
| Less distributions from: | | | | | | | | | | | | | | | | | | | | |
| | | | | |
Net investment income | | | (0.37 | ) | | | (0.39 | ) | | | (0.34 | ) | | | (0.29 | ) | | | (0.27 | ) |
| | | | | |
Net realized gains | | | (0.55 | ) | | | — | | | | — | | | | — | | | | — | |
| | | | |
Total distributions | | | (0.92 | ) | | | (0.39 | ) | | | (0.34 | ) | | | (0.29 | ) | | | (0.27 | ) |
| | | | |
Net asset value, end of year | | | $29.06 | | | | $27.62 | | | | $21.64 | | | | $19.65 | | | | $18.82 | |
| | | | |
| | | | | |
Total returnc | | | 8.72% | | | | 29.69% | | | | 11.96% | | | | 6.00% | | | | 20.64% | |
| | | | | |
| Ratios to average net assets | | | | | | | | | | | | | | | | | | | | |
| | | | | |
Expenses | | | 0.87% | d | | | 0.86% | | | | 0.88% | | | | 0.88% | | | | 0.89% | |
| | | | | |
Net investment income | | | 1.33% | | | | 1.34% | | | | 1.71% | | | | 1.62% | | | | 1.63% | |
| | | | | |
| Supplemental data | | | | | | | | | | | | | | | | | | | | |
| | | | | |
Net assets, end of year (000’s) | | | $1,667,816 | | | | $1,752,012 | | | | $1,550,084 | | | | $1,523,396 | | | | $1,572,732 | |
| | | | | |
Portfolio turnover rate | | | 8.61% | | | | 0.07% | | | | 11.19% | | | | 12.76% | | | | 8.97% | |
aThe amount shown for a share outstanding throughout the period may not correlate with the Statement of Operations for the period due to the timing of sales and repurchases of the Fund shares in relation to income earned and/or fluctuating fair value of the investments of the Fund.
bBased on average daily shares outstanding.
cTotal return does not include fees, charges or expenses imposed by the variable annuity and life insurance contracts for which Franklin Templeton Variable Insurance Products Trust serves as an underlying investment vehicle.
dBenefit of waiver and payments by affiliates rounds to less than 0.01%.
| | | | | | |
| | | The accompanying notes are an integral part of these financial statements. | Annual Report | | | FRD-9 | |
FRANKLIN TEMPLETON VARIABLE INSURANCE PRODUCTS TRUST
FINANCIAL HIGHLIGHTS
Franklin Rising Dividends VIP Fund (continued)
| | | | | | | | | | | | | | | | | | | | |
| | | Year Ended December 31, | |
| | | 2014 | | | 2013 | | | 2012 | | | 2011 | | | 2010 | |
| Class 4 | | | | | | | | | | | | | | | | | | | | |
Per share operating performance
(for a share outstanding throughout the year) | | | | | | | | | | | | | | | | | | | | |
| | | | | |
Net asset value, beginning of year | | | $27.76 | | | | $21.78 | | | | $19.83 | | | | $19.04 | | | | $16.09 | |
| | | | |
| | | | | |
| Income from investment operationsa: | | | | | | | | | | | | | | | | | | | | |
| | | | | |
Net investment incomeb | | | 0.35 | | | | 0.32 | | | | 0.35 | | | | 0.31 | | | | 0.32 | |
| | | | | |
Net realized and unrealized gains (losses) | | | 2.00 | | | | 6.07 | | | | 1.96 | | | | 0.80 | | | | 2.94 | |
| | | | |
Total from investment operations | | | 2.35 | | | | 6.39 | | | | 2.31 | | | | 1.11 | | | | 3.26 | |
| | | | |
| | | | | |
| Less distributions from: | | | | | | | | | | | | | | | | | | | | |
| | | | | |
Net investment income | | | (0.37 | ) | | | (0.41 | ) | | | (0.36 | ) | | | (0.32 | ) | | | (0.31 | ) |
| | | | | |
Net realized gains | | | (0.55 | ) | | | — | | | | — | | | | — | | | | — | |
| | | | |
Total distributions | | | (0.92 | ) | | | (0.41 | ) | | | (0.36 | ) | | | (0.32 | ) | | | (0.31 | ) |
| | | | |
Net asset value, end of year | | | $29.19 | | | | $27.76 | | | | $21.78 | | | | $19.83 | | | | $19.04 | |
| | | | |
| | | | | |
Total returnc | | | 8.62% | | | | 29.57% | | | | 11.78% | | | | 5.89% | | | | 20.62% | |
| | | | | |
| Ratios to average net assets | | | | | | | | | | | | | | | | | | | | |
| | | | | |
Expenses | | | 0.97% | d | | | 0.96% | | | | 0.98% | | | | 0.98% | | | | 0.99% | |
| | | | | |
Net investment income | | | 1.23% | | | | 1.24% | | | | 1.61% | | | | 1.52% | | | | 1.53% | |
| | | | | |
| Supplemental data | | | | | | | | | | | | | | | | | | | | |
| | | | | |
Net assets, end of year (000’s) | | | $15,503 | | | | $12,028 | | | | $6,432 | | | | $3,020 | | | | $1,007 | |
| | | | | |
Portfolio turnover rate | | | 8.61% | | | | 0.07% | | | | 11.19% | | | | 12.76% | | | | 8.97% | |
aThe amount shown for a share outstanding throughout the period may not correlate with the Statement of Operations for the period due to the timing of sales and repurchases of the Fund shares in relation to income earned and/or fluctuating fair value of the investments of the Fund.
bBased on average daily shares outstanding.
cTotal return does not include fees, charges or expenses imposed by the variable annuity and life insurance contracts for which Franklin Templeton Variable Insurance Products Trust serves as an underlying investment vehicle.
dBenefit of waiver and payments by affiliates rounds to less than 0.01%.
| | | | |
| FRD-10 | | Annual Report | The accompanying notes are an integral part of these financial statements. | | |
FRANKLIN TEMPLETON VARIABLE INSURANCE PRODUCTS TRUST
Statement of Investments, December 31, 2014
| | | | | | | | | | |
| Franklin Rising Dividends VIP Fund | |
| | | | | Shares | | | Value | |
| | | | | | | | | | |
| | Common Stocks 98.4% | | | | | | | | |
| | Aerospace & Defense 5.0% | | | | | | | | |
| | General Dynamics Corp. | | | 53,000 | | | $ | 7,293,860 | |
| | Honeywell International Inc. | | | 171,100 | | | | 17,096,312 | |
| | United Technologies Corp. | | | 590,900 | | | | 67,953,500 | |
| | | | | | | | | | |
| | | | | | | | | 92,343,672 | |
| | | | | | | | | | |
| | Automobiles & Components 2.7% | | | | | | | | |
| | Johnson Controls Inc. | | | 1,040,500 | | | | 50,297,770 | |
| | | | | | | | | | |
| | Commercial & Professional Services 3.6% | | | | | | | | |
| | ABM Industries Inc. | | | 814,288 | | | | 23,329,351 | |
| | Brady Corp., A | | | 653,579 | | | | 17,868,850 | |
| | Cintas Corp. | | | 225,700 | | | | 17,703,908 | |
| | Matthews International Corp., A | | | 138,000 | | | | 6,716,460 | |
| | | | | | | | | | |
| | | | | | | | | 65,618,569 | |
| | | | | | | | | | |
| | Consumer Durables & Apparel 3.5% | | | | | | | | |
| | Leggett & Platt Inc. | | | 332,800 | | | | 14,180,608 | |
| | NIKE Inc., B | | | 528,500 | | | | 50,815,275 | |
| | | | | | | | | | |
| | | | | | | | | 64,995,883 | |
| | | | | | | | | | |
| | Consumer Services 1.4% | | | | | | | | |
| | McDonald’s Corp. | | | 254,345 | | | | 23,832,127 | |
| | Yum! Brands Inc. | | | 25,400 | | | | 1,850,390 | |
| | | | | | | | | | |
| | | | | | | | | 25,682,517 | |
| | | | | | | | | | |
| | Diversified Financials 0.5% | | | | | | | | |
| | State Street Corp. | | | 110,500 | | | | 8,674,250 | |
| | | | | | | | | | |
| | Energy 8.6% | | | | | | | | |
| a | | California Resources Corp. | | | 148,316 | | | | 817,221 | |
| | Chevron Corp. | | | 517,700 | | | | 58,075,586 | |
| | EOG Resources Inc. | | | 31,500 | | | | 2,900,205 | |
| | Exxon Mobil Corp. | | | 365,500 | | | | 33,790,475 | |
| | Occidental Petroleum Corp. | | | 370,790 | | | | 29,889,382 | |
| | Schlumberger Ltd. | | | 384,000 | | | | 32,797,440 | |
| | | | | | | | | | |
| | | | | | | | | 158,270,309 | |
| | | | | | | | | | |
| | Food & Staples Retailing 5.6% | | | | | | | | |
| | CVS Health Corp. | | | 71,600 | | | | 6,895,796 | |
| | Wal-Mart Stores Inc. | | | 652,964 | | | | 56,076,548 | |
| | Walgreens Boots Alliance Inc. | | | 531,300 | | | | 40,485,060 | |
| | | | | | | | | | |
| | | | | | | | | 103,457,404 | |
| | | | | | | | | | |
| | Food, Beverage & Tobacco 6.2% | | | | | | | | |
| | Archer-Daniels-Midland Co. | | | 713,000 | | | | 37,076,000 | |
| | Bunge Ltd. | | | 166,400 | | | | 15,127,424 | |
| | McCormick & Co. Inc. | | | 383,000 | | | | 28,456,900 | |
| | PepsiCo Inc. | | | 363,900 | | | | 34,410,384 | |
| | | | | | | | | | |
| | | | | | | | | 115,070,708 | |
| | | | | | | | | | |
| | Health Care Equipment & Services 15.9% | | | | | | | | |
| | Abbott Laboratories | | | 641,800 | | | | 28,893,836 | |
| | Becton, Dickinson and Co. | | | 453,143 | | | | 63,059,380 | |
| | DENTSPLY International Inc. | | | 4,000 | | | | 213,080 | |
| | Medtronic Inc. | | | 730,000 | | | | 52,706,000 | |
FRANKLIN TEMPLETON VARIABLE INSURANCE PRODUCTS TRUST
STATEMENT OF INVESTMENTS
Franklin Rising Dividends VIP Fund (continued)
| | | | | | | | | | |
| | | | | Shares | | | Value | |
| | Common Stocks (continued) | | | | | | | | |
| | Health Care Equipment & Services (continued) | | | | | | | | |
| | Stryker Corp. | | | 608,400 | | | $ | 57,390,372 | |
| | Teleflex Inc. | | | 285,253 | | | | 32,752,750 | |
| | West Pharmaceutical Services Inc. | | | 1,086,534 | | | | 57,847,070 | |
| | | | | | | | | | |
| | | | | | | | | 292,862,488 | |
| | | | | | | | | | |
| | Household & Personal Products 3.4% | | | | | | | | |
| | Colgate-Palmolive Co. | | | 191,000 | | | | 13,215,290 | |
| | The Procter & Gamble Co. | | | 538,600 | | | | 49,061,074 | |
| | | | | | | | | | |
| | | | | | | | | 62,276,364 | |
| | | | | | | | | | |
| | Industrial Conglomerates 4.4% | | | | | | | | |
| | Carlisle Cos. Inc. | | | 96,261 | | | | 8,686,593 | |
| | Roper Industries Inc. | | | 469,350 | | | | 73,382,872 | |
| | | | | | | | | | |
| | | | | | | | | 82,069,465 | |
| | | | | | | | | | |
| | Insurance 6.3% | | | | | | | | |
| | Aflac Inc. | | | 276,200 | | | | 16,873,058 | |
| | Arthur J. Gallagher & Co. | | | 704,000 | | | | 33,144,320 | |
| | The Chubb Corp. | | | 45,000 | | | | 4,656,150 | |
| | Erie Indemnity Co., A | | | 508,302 | | | | 46,138,572 | |
| | Old Republic International Corp. | | | 678,708 | | | | 9,929,498 | |
| | RLI Corp. | | | 124,142 | | | | 6,132,615 | |
| | | | | | | | | | |
| | | | | | | | | 116,874,213 | |
| | | | | | | | | | |
| | Machinery 9.0% | | | | | | | | |
| | Donaldson Co. Inc. | | | 350,068 | | | | 13,523,127 | |
| | Dover Corp. | | | 839,376 | | | | 60,200,047 | |
| | Hillenbrand Inc. | | | 1,027,300 | | | | 35,441,850 | |
| | Pentair PLC (United Kingdom) | | | 844,000 | | | | 56,058,480 | |
| | | | | | | | | | |
| | | | | | | | | 165,223,504 | |
| | | | | | | | | | |
| | Materials 11.2% | | | | | | | | |
| | Air Products and Chemicals Inc. | | | 378,900 | | | | 54,648,747 | |
| | Albemarle Corp. | | | 694,700 | | | | 41,772,311 | |
| | Bemis Co. Inc. | | | 172,199 | | | | 7,785,117 | |
| | Ecolab Inc. | | | 107,000 | | | | 11,183,640 | |
| | Nucor Corp. | | | 447,055 | | | | 21,928,048 | |
| | Praxair Inc. | | | 530,460 | | | | 68,726,397 | |
| | | | | | | | | | |
| | | | | | | | | 206,044,260 | |
| | | | | | | | | | |
| | Media 0.8% | | | | | | | | |
| | John Wiley & Sons Inc., A | | | 237,600 | | | | 14,075,424 | |
| | | | | | | | | | |
| | Pharmaceuticals, Biotechnology & Life Sciences 6.7% | | | | | | | | |
| | AbbVie Inc. | | | 300,800 | | | | 19,684,352 | |
| | Johnson & Johnson | | | 617,700 | | | | 64,592,889 | |
| | Perrigo Co. PLC | | | 1,500 | | | | 250,740 | |
| | Pfizer Inc. | | | 1,242,100 | | | | 38,691,415 | |
| | Roche Holding AG, ADR (Switzerland) | | | 25,000 | | | | 849,750 | |
| | | | | | | | | | |
| | | | | | | | | 124,069,146 | |
| | | | | | | | | | |
FRANKLIN TEMPLETON VARIABLE INSURANCE PRODUCTS TRUST
STATEMENT OF INVESTMENTS
Franklin Rising Dividends VIP Fund (continued)
| | | | | | | | | | |
| | | | | Shares | | | Value | |
| | Common Stocks (continued) | | | | | | | | |
| | Retailing 0.5% | | | | | | | | |
| | Ross Stores Inc. | | | 29,000 | | | $ | 2,733,540 | |
| | Target Corp. | | | 85,800 | | | | 6,513,078 | |
| | | | | | | | | | |
| | | | | | | | | 9,246,618 | |
| | | | | | | | | | |
| | Semiconductors & Semiconductor Equipment 0.2% | | | | | | | | |
| | Texas Instruments Inc. | | | 59,000 | | | | 3,154,435 | |
| | | | | | | | | | |
| | Software & Services 2.0% | | | | | | | | |
| | Accenture PLC, A | | | 142,500 | | | | 12,726,675 | |
| | International Business Machines Corp. | | | 24,700 | | | | 3,962,868 | |
| | Microsoft Corp. | | | 456,500 | | | | 21,204,425 | |
| | | | | | | | | | |
| | | | | | | | | 37,893,968 | |
| | | | | | | | | | |
| | Technology Hardware & Equipment 0.8% | | | | | | | | |
| a | | Knowles Corp. | | | 285,500 | | | | 6,723,525 | |
| | QUALCOMM Inc. | | | 114,500 | | | | 8,510,785 | |
| | | | | | | | | | |
| | | | | | | | | 15,234,310 | |
| | | | | | | | | | |
| | Trading Companies & Distributors 0.0%† | | | | | | | | |
| | W.W. Grainger Inc. | | | 1,000 | | | | 254,890 | |
| | | | | | | | | | |
| | Transportation 0.1% | | | | | | | | |
| | United Parcel Service Inc., B | | | 9,500 | | | | 1,056,115 | |
| | | | | | | | | | |
| | | |
| | Total Common Stocks (Cost $966,214,535) | | | | | | | 1,814,746,282 | |
| | | | | | | | | | |
| | Short Term Investments (Cost $20,601,446) 1.1% | | | | | | | | |
| | Money Market Funds 1.1% | | | | | | | | |
| a,b | | Institutional Fiduciary Trust Money Market Portfolio | | | 20,601,446 | | | | 20,601,446 | |
| | | | | | | | | | |
| | Total Investments (Cost $986,815,981) 99.5% | | | | | | | 1,835,347,728 | |
| | Other Assets, less Liabilities 0.5% | | | | | | | 8,451,401 | |
| | | | | | | | | | |
| | Net Assets 100.0% | | | | | | $ | 1,843,799,129 | |
| | | | | | | | | | |
See Abbreviations on page FRD-22.
†Rounds to less than 0.1% of net assets.
aNon-income producing.
bSee Note 3(e) regarding investments in Institutional Fiduciary Trust Money Market Portfolio.
| | | | | | |
| | | The accompanying notes are an integral part of these financial statements. | Annual Report | | | FRD-13 | |
FRANKLIN TEMPLETON VARIABLE INSURANCE PRODUCTS TRUST
Financial Statements
Statement of Assets and Liabilities
December 31, 2014
| | | | |
| | | Franklin Rising
Dividends VIP
Fund | |
Assets: | | | | |
Investments in securities: | | | | |
Cost - Unaffiliated issuers | | $ | 966,214,535 | |
Cost - Sweep Money Fund (Note 3e) | | | 20,601,446 | |
| | | | |
Total cost of investments | | $ | 986,815,981 | |
| | | | |
Value - Unaffiliated issuers | | $ | 1,814,746,282 | |
Value - Sweep Money Fund (Note 3e) | | | 20,601,446 | |
| | | | |
Total value of investments | | | 1,835,347,728 | |
Cash | | | 47,915 | |
Receivables: | | | | |
Investment securities sold | | | 8,128,376 | |
Capital shares sold | | | 269,259 | |
Dividends | | | 3,030,967 | |
Other assets | | | 295 | |
| | | | |
Total assets | | | 1,846,824,540 | |
| | | | |
Liabilities: | | | | |
Payables: | | | | |
Capital shares redeemed | | | 1,153,406 | |
Management fees | | | 942,502 | |
Distribution fees | | | 703,610 | |
Reports to shareholders | | | 165,487 | |
Accrued expenses and other liabilities | | | 60,406 | |
| | | | |
Total liabilities | | | 3,025,411 | |
| | | | |
Net assets, at value | | $ | 1,843,799,129 | |
| | | | |
Net assets consist of: | | | | |
Paid-in capital | | $ | 788,596,919 | |
Undistributed net investment income | | | 24,965,968 | |
Net unrealized appreciation (depreciation) | | | 848,531,747 | |
Accumulated net realized gain (loss) | | | 181,704,495 | |
| | | | |
Net assets, at value | | $ | 1,843,799,129 | |
| | | | |
| |
| Class 1: | | | | |
Net assets, at value | | $ | 160,480,304 | |
| | | | |
Shares outstanding | | | 5,416,806 | |
| | | | |
Net asset value and maximum offering price per share | | $ | 29.63 | |
| | | | |
| |
| Class 2: | | | | |
Net assets, at value | | $ | 1,667,816,325 | |
| | | | |
Shares outstanding | | | 57,389,011 | |
| | | | |
Net asset value and maximum offering price per share | | $ | 29.06 | |
| | | | |
| |
| Class 4: | | | | |
Net assets, at value | | $ | 15,502,500 | |
| | | | |
Shares outstanding | | | 531,076 | |
| | | | |
Net asset value and maximum offering price per share | | $ | 29.19 | |
| | | | |
| | | | |
| FRD-14 | | Annual Report | The accompanying notes are an integral part of these financial statements. | | |
FRANKLIN TEMPLETON VARIABLE INSURANCE PRODUCTS TRUST
FINANCIAL STATEMENTS
Statement of Operations
for the year ended December 31, 2014
| | | | |
| | | Franklin Rising
Dividends VIP
Fund | |
Investment income: | | | | |
Dividends | | $ | 40,706,027 | |
| | | | |
Expenses: | | | | |
Management fees (Note 3a) | | | 11,147,149 | |
Distribution fees: (Note 3c) | | | | |
Class 2 | | | 4,198,143 | |
Class 4 | | | 46,154 | |
Custodian fees (Note 4) | | | 16,494 | |
Reports to shareholders | | | 245,233 | |
Professional fees | | | 65,413 | |
Trustees’ fees and expenses | | | 7,397 | |
Other | | | 29,822 | |
| | | | |
Total expenses | | | 15,755,805 | |
Expenses waived/paid by affiliates (Note 3e) | | | (21,312 | ) |
| | | | |
Net expenses | | | 15,734,493 | |
| | | | |
Net investment income | | | 24,971,534 | |
| | | | |
Realized and unrealized gains (losses): | | | | |
Net realized gain (loss) from investments | | | 183,292,710 | |
Net change in unrealized appreciation (depreciation) on investments | | | (59,038,904 | ) |
| | | | |
Net realized and unrealized gain (loss) | | | 124,253,806 | |
| | | | |
Net increase (decrease) in net assets resulting from operations | | $ | 149,225,340 | |
| | | | |
| | | | | | |
| | | The accompanying notes are an integral part of these financial statements. | Annual Report | | | FRD-15 | |
FRANKLIN TEMPLETON VARIABLE INSURANCE PRODUCTS TRUST
FINANCIAL STATEMENTS
Statements of Changes in Net Assets
| | | | | | | | |
| | | Franklin Rising Dividends VIP Fund | |
| | | Year Ended December 31, | |
| | | 2014 | | | 2013 | |
Increase (decrease) in net assets: | | | | | | | | |
Operations: | | | | | | | | |
Net investment income | | $ | 24,971,534 | | | $ | 25,051,212 | |
Net realized gain (loss) from investments | | | 183,292,710 | | | | 109,495,187 | |
Net change in unrealized appreciation (depreciation) on investments | | | (59,038,904 | ) | | | 341,536,473 | |
| | | | |
Net increase (decrease) in net assets resulting from operations | | | 149,225,340 | | | | 476,082,872 | |
| | | | |
Distributions to shareholders from: | | | | | | | | |
Net investment income: | | | | | | | | |
Class 1 | | | (2,478,710 | ) | | | (2,772,388 | ) |
Class 2 | | | (22,406,447 | ) | | | (26,490,890 | ) |
Class 4 | | | (165,391 | ) | | | (163,605 | ) |
Net realized gains: | | | | | | | | |
Class 1 | | | (3,072,165 | ) | | | — | |
Class 2 | | | (32,971,551 | ) | | | — | |
Class 4 | | | (247,432 | ) | | | — | |
| | | | |
Total distributions to shareholders | | | (61,341,696 | ) | | | (29,426,883 | ) |
| | | | |
Capital share transactions: (Note 2) | | | | | | | | |
Class 1 | | | (16,079,195 | ) | | | (11,198,645 | ) |
Class 2 | | | (163,125,563 | ) | | | (204,341,308 | ) |
Class 4 | | | 2,701,123 | | | | 3,331,799 | |
| | | | |
Total capital share transactions | | | (176,503,635 | ) | | | (212,208,154 | ) |
| | | | |
Net increase (decrease) in net assets | | | (88,619,991 | ) | | | 234,447,835 | |
Net assets: | | | | | | | | |
Beginning of year | | | 1,932,419,120 | | | | 1,697,971,285 | |
| | | | |
End of year | | $ | 1,843,799,129 | | | $ | 1,932,419,120 | |
| | | | |
Undistributed net investment income included in net assets: | | | | | | | | |
End of year | | $ | 24,965,968 | | | $ | 25,044,982 | |
| | | | |
| | | | |
| FRD-16 | | Annual Report | The accompanying notes are an integral part of these financial statements. | | |
FRANKLIN TEMPLETON VARIABLE INSURANCE PRODUCTS TRUST
Notes to Financial Statements
Franklin Rising Dividends VIP Fund
1. Organization and Significant Accounting Policies
Franklin Templeton Variable Insurance Products Trust (Trust) is registered under the Investment Company Act of 1940, as amended, (1940 Act) as an open-end management investment company, consisting of nineteen separate funds and applies the specialized accounting and reporting guidance in U.S. Generally Accepted Accounting Principles (U.S. GAAP). Franklin Rising Dividends VIP Fund (Fund) is included in this report. The financial statements of the remaining funds in the Trust are presented separately. Shares of the Fund are generally sold only to insurance company separate accounts to fund the benefits of variable life insurance policies or variable annuity contracts. At December 31, 2014, 40.53% of the Fund’s shares were held through one insurance company. Investment activities of these insurance company separate accounts could have a material impact on the Fund. The Fund offers three classes of shares: Class 1, Class 2, and Class 4. Each class of shares differs by its distribution fees, voting rights on matters affecting a single class and its exchange privilege.
Effective May 1, 2014, Franklin Rising Dividends Securities Fund was renamed Franklin Rising Dividends VIP Fund.
The following summarizes the Fund’s significant accounting policies.
a. Financial Instrument Valuation
The Fund’s investments in financial instruments are carried at fair value daily. Fair value is the price that would be received to sell an asset or paid to transfer a liability in an orderly transaction between market participants on the measurement date. The Fund calculates the net asset value (NAV) per share at the close of the New York Stock Exchange (NYSE), generally at 4 p.m. Eastern time (NYSE close) on each day the NYSE is open for trading. Under compliance policies and procedures approved by the Trust’s Board of Trustees (the Board), the Fund’s administrator has responsibility for oversight of valuation, including leading the cross-functional Valuation and Liquidity Oversight Committee (VLOC). The VLOC provides administration and oversight of the Fund’s valuation policies and procedures, which are approved annually by the Board. Among other things, these procedures allow the Fund to utilize independent pricing services, quotations from securities and financial instrument dealers, and other market sources to determine fair value.
Equity securities listed on an exchange or on the NASDAQ National Market System are valued at the last quoted sale price
or the official closing price of the day, respectively. Foreign equity securities are valued as of the close of trading on the foreign stock exchange on which the security is primarily traded or as of the NYSE close, whichever is earlier. The value is then converted into its U.S. dollar equivalent at the foreign exchange rate in effect at the NYSE close on the day that the value of the security is determined. Over-the-counter (OTC) securities are valued within the range of the most recent quoted bid and ask prices. Securities that trade in multiple markets or on multiple exchanges are valued according to the broadest and most representative market. Certain equity securities are valued based upon fundamental characteristics or relationships to similar securities. Investments in open-end mutual funds are valued at the closing NAV.
The Fund has procedures to determine the fair value of financial instruments for which market prices are not reliable or readily available. Under these procedures, the VLOC convenes on a regular basis to review such financial instruments and considers a number of factors, including significant unobservable valuation inputs, when arriving at fair value. The VLOC primarily employs a market-based approach which may use related or comparable assets or liabilities, recent transactions, market multiples, book values, and other relevant information for the investment to determine the fair value of the investment. An income-based valuation approach may also be used in which the anticipated future cash flows of the investment are discounted to calculate fair value. Discounts may also be applied due to the nature or duration of any restrictions on the disposition of the investments. Due to the inherent uncertainty of valuations of such investments, the fair values may differ significantly from the values that would have been used had an active market existed. The VLOC employs various methods for calibrating these valuation approaches including a regular review of key inputs and assumptions, transactional back-testing or disposition analysis, and reviews of any related market activity.
Trading in securities on foreign securities stock exchanges and OTC markets may be completed before the daily NYSE close. In addition, trading in certain foreign markets may not take place on every NYSE business day. Occasionally, events occur between the time at which trading in a foreign security is completed and the close of the NYSE that might call into question the reliability of the value of a portfolio security held by the Fund. As a result, differences may arise between the value of the Fund’s portfolio securities as determined at the foreign market close and the latest indications of value at the close of
FRANKLIN TEMPLETON VARIABLE INSURANCE PRODUCTS TRUST
NOTES TO FINANCIAL STATEMENTS
Franklin Rising Dividends VIP Fund (continued)
1. Organization and Significant Accounting Policies (continued)
a. Financial Instrument Valuation (continued)
the NYSE. In order to minimize the potential for these differences, the VLOC monitors price movements following the close of trading in foreign stock markets through a series of country specific market proxies (such as baskets of American Depositary Receipts, futures contracts and exchange traded funds). These price movements are measured against established trigger thresholds for each specific market proxy to assist in determining if an event has occurred that may call into question the reliability of the values of the foreign securities held by the Fund. If such an event occurs, the securities may be valued using fair value procedures, which may include the use of independent pricing services.
Also, when the last day of the reporting period is a non-business day, certain foreign markets may be open on those days that the NYSE is closed, which could result in differences between the value of the Fund’s portfolio securities on the last business day and the last calendar day of the reporting period. Any significant security valuation changes due to an open foreign market are adjusted and reflected by the Fund for financial reporting purposes.
b. Income and Deferred Taxes
It is the Fund’s policy to qualify as a regulated investment company under the Internal Revenue Code. The Fund intends to distribute to shareholders substantially all of its taxable income and net realized gains to relieve it from federal income and if applicable, excise taxes. As a result, no provision for U.S. federal income taxes is required.
The Fund may be subject to foreign taxation related to income received, capital gains on the sale of securities and certain foreign currency transactions in the foreign jurisdictions in which it invests. Foreign taxes, if any, are recorded based on the tax regulations and rates that exist in the foreign markets in which the Fund invests. When a capital gain tax is determined to apply the Fund records an estimated deferred tax liability in an amount that would be payable if the securities were disposed of on the valuation date.
The Fund recognizes the tax benefits of uncertain tax positions only when the position is “more likely than not” to be sustained
upon examination by the tax authorities based on the technical merits of the tax position. As of December 31, 2014, and for all open tax years, the Fund has determined that no liability for unrecognized tax benefits is required in the Fund’s financial statements related to uncertain tax positions taken on a tax return (or expected to be taken on future tax returns). Open tax years are those that remain subject to examination and are based on each tax jurisdiction statute of limitation.
c. Security Transactions, Investment Income, Expenses and Distributions
Security transactions are accounted for on trade date. Realized gains and losses on security transactions are determined on a specific identification basis. Estimated expenses are accrued daily. Dividend income is recorded on the ex-dividend date except for certain foreign securities where the dividend rate is not available. In such cases, the dividend is recorded as soon as the information is received by the Fund. Distributions to shareholders are recorded on the ex-dividend date and are determined according to income tax regulations (tax basis). Distributable earnings determined on a tax basis may differ from earnings recorded in accordance with U.S. GAAP. These differences may be permanent or temporary. Permanent differences are reclassified among capital accounts to reflect their tax character. These reclassifications have no impact on net assets or the results of operations. Temporary differences are not reclassified, as they may reverse in subsequent periods.
Common expenses incurred by the Trust are allocated among the funds based on the ratio of net assets of each fund to the combined net assets of the Trust. Fund specific expenses are charged directly to the fund that incurred the expense.
Realized and unrealized gains and losses and net investment income, not including class specific expenses, are allocated daily to each class of shares based upon the relative proportion of net assets of each class. Differences in per share distributions, by class, are generally due to differences in class specific expenses.
d. Accounting Estimates
The preparation of financial statements in accordance with U.S. GAAP requires management to make estimates and assumptions that affect the reported amounts of assets and liabilities at the date of the financial statements and the amounts of income and expenses during the reporting period. Actual results could differ from those estimates.
FRANKLIN TEMPLETON VARIABLE INSURANCE PRODUCTS TRUST
NOTES TO FINANCIAL STATEMENTS
Franklin Rising Dividends VIP Fund (continued)
e. Guarantees and Indemnifications
Under the Trust’s organizational documents, its officers and trustees are indemnified by the Trust against certain liabilities arising out of the performance of their duties to the Trust. Additionally, in the normal course of business, the Trust, on behalf of the Fund, enters into contracts with service providers that contain general indemnification clauses. The Trust’s maximum exposure under these arrangements is unknown as this would involve future claims that may be made against the Trust that have not yet occurred. Currently, the Trust expects the risk of loss to be remote.
2. Shares of Beneficial Interest
At December 31, 2014, there were an unlimited number of shares authorized (without par value). Transactions in the Fund’s shares were as follows:
| | | | | | | | | | | | | | | | | | |
| | | Year Ended December 31, | |
| | | 2014 | | | | | 2013 | |
| | | Shares | | | Amount | | | | | Shares | | | Amount | |
| | | | | |
| Class 1 Shares: | | | | | | | | | | | | | | | | | | |
Shares sold | | | 159,314 | | | $ | 4,468,085 | | | | | | 425,367 | | | $ | 10,754,937 | |
Shares issued in reinvestment of distributions | | | 197,681 | | | | 5,550,875 | | | | | | 111,610 | | | | 2,772,388 | |
Shares redeemed | | | (923,627 | ) | | | (26,098,155 | ) | | | | | (973,756 | ) | | | (24,725,970 | ) |
| | | | |
Net increase (decrease) | | | (566,632 | ) | | $ | (16,079,195 | ) | | | | | (436,779 | ) | | $ | (11,198,645 | ) |
| | | | |
| Class 2 Shares: | | | | | | | | | | | | | | | | | | |
Shares sold | | | 5,801,510 | | | $ | 162,781,330 | | | | | | 6,187,499 | | | $ | 153,726,999 | |
Shares issued in reinvestment of distributions | | | 2,007,904 | | | | 55,377,998 | | | | | | 1,085,247 | | | | 26,490,890 | |
Shares redeemed | | | (13,846,241 | ) | | | (381,284,891 | ) | | | | | (15,483,753 | ) | | | (384,559,197 | ) |
| | | | |
Net increase (decrease) | | | (6,036,827 | ) | | $ | (163,125,563 | ) | | | | | (8,211,007 | ) | | $ | (204,341,308 | ) |
| | | | |
| Class 4 Shares: | | | | | | | | | | | | | | | | | | |
Shares sold | | | 178,786 | | | $ | 4,991,418 | | | | | | 216,130 | | | $ | 5,332,125 | |
Shares issued on reinvestment of distributions | | | 14,893 | | | | 412,823 | | | | | | 6,664 | | | | 163,605 | |
Shares redeemed | | | (95,832 | ) | | | (2,703,118 | ) | | | | | (84,878 | ) | | | (2,163,931 | ) |
| | | | |
Net increase (decrease) | | | 97,847 | | | $ | 2,701,123 | | | | | | 137,916 | | | $ | 3,331,799 | |
| | | | |
3. Transactions With Affiliates
Franklin Resources, Inc. is the holding company for various subsidiaries that together are referred to as Franklin Templeton
Investments. Certain officers and trustees of the Fund are also officers and/or directors of the following subsidiaries:
| | |
| Subsidiary | | Affiliation |
Franklin Advisory Services, LLC (Advisory Services) | | Investment manager |
Franklin Templeton Services, LLC (FT Services) | | Administrative manager |
Franklin Templeton Distributors, Inc. (Distributors) | | Principal underwriter |
Franklin Templeton Investor Services, LLC (Investor Services) | | Transfer agent |
FRANKLIN TEMPLETON VARIABLE INSURANCE PRODUCTS TRUST
NOTES TO FINANCIAL STATEMENTS
Franklin Rising Dividends VIP Fund (continued)
3. Transactions With Affiliates (continued)
a. Management Fees
The Fund pays an investment management fee to Advisory Services based on the average daily net assets of the Fund as follows:
| | |
| Annualized Fee Rate | | Net Assets |
0.750% | | Up to and including $500 million |
0.625% | | Over $500 million, up to and including $1 billion |
0.500% | | In excess of $1 billion |
b. Administrative Fees
Under an agreement with Advisory Services, FT Services provides administrative services to the Fund. The fee is paid by Advisory Services based on the Fund’s average daily net assets, and is not an additional expense of the Fund.
c. Distribution Fees
The Board has adopted distribution plans for Class 2 and Class 4 shares pursuant to Rule 12b-1 under the 1940 Act. Under the Fund’s compensation distribution plans, the Fund pays Distributors for costs incurred in connection with the servicing, sale and distribution of the Fund’s shares up to 0.35% per year of its average daily net assets. Some distribution fees are not charged on shares held by affiliates. The Board has agreed to limit the current rate to 0.25% per year for Class 2. The plan year, for purposes of monitoring compliance with the maximum annual plan rates, is February 1 through January 31.
d. Transfer Agent Fees
Investor Services, under terms of an agreement, performs shareholder servicing for the Fund and is not paid by the Fund for the services.
e. Investments in Institutional Fiduciary Trust Money Market Portfolio
The Fund invests in Institutional Fiduciary Trust Money Market Portfolio (Sweep Money Fund), an affiliated open-end management investment company. Management fees paid by the Fund are waived on assets invested in the Sweep Money Fund, as noted on the Statement of Operations, in an amount not to exceed the management and administrative fees paid directly or indirectly by the Sweep Money Fund. Prior to January 1, 2014, the waiver was accounted for as a reduction to management fees.
4. Expense Offset Arrangement
The Fund has entered into an arrangement with its custodian whereby credits realized as a result of uninvested cash balances are used to reduce a portion of the Fund’s custodian expenses. During the year ended December 31, 2014, there were no credits earned.
5. Income Taxes
The tax character of distributions paid during the years ended December 31, 2014 and 2013, was as follows:
| | | | | | | | |
| | | 2014 | | | 2013 | |
Distributions paid from: | | | | | | | | |
Ordinary income | | $ | 25,050,548 | | | $ | 29,426,883 | |
Long term capital gain | | | 36,291,148 | | | | — | |
| | | | |
| | $ | 61,341,696 | | | $ | 29,426,883 | |
| | | | |
FRANKLIN TEMPLETON VARIABLE INSURANCE PRODUCTS TRUST
NOTES TO FINANCIAL STATEMENTS
Franklin Rising Dividends VIP Fund (continued)
At December 31, 2014, the cost of investments, net unrealized appreciation (depreciation), undistributed ordinary income and undistributed long term capital gains for income tax purposes were as follows:
| | | | |
Cost of investments | | $ | 986,938,224 | |
| | | | |
Unrealized appreciation | | $ | 854,533,014 | |
Unrealized depreciation | | | (6,123,510 | ) |
| | | | |
Net unrealized appreciation (depreciation) | | $ | 848,409,504 | |
| | | | |
Undistributed ordinary income | | $ | 25,119,933 | |
Undistributed long term capital gains | | | 181,672,772 | |
| | | | |
Distributable earnings | | $ | 206,792,705 | |
| | | | |
Differences between income and/or capital gains as determined on a book basis and a tax basis are primarily due to differing treatment of wash sales.
6. Investment Transactions
Purchases and sales of investments (excluding short term securities) for the year ended December 31, 2014, aggregated $157,265,687 and $367,114,593, respectively.
7. Credit Facility
The Fund, together with other U.S. registered and foreign investment funds (collectively, Borrowers), managed by Franklin Templeton Investments, are borrowers in a joint syndicated senior unsecured credit facility totaling $1.5 billion (Global Credit Facility) which matured on February 13, 2015. This Global Credit Facility provides a source of funds to the Borrowers for temporary and emergency purposes, including the ability to meet future unanticipated or unusually large redemption requests. The Borrowers expect to renew the Global Credit Facility for a total of $2 billion effective February 13, 2015, which matures on February 12, 2016.
Under the terms of the Global Credit Facility, the Fund shall, in addition to interest charged on any borrowings made by the Fund and other costs incurred by the Fund, pay its share of fees and expenses incurred in connection with the implementation and maintenance of the Global Credit Facility, based upon its relative share of the aggregate net assets of all of the Borrowers, including an annual commitment fee of 0.07% based upon the unused portion of the Global Credit Facility. These fees are reflected in other expenses on the Statement of Operations. During the year ended December 31, 2014, the Fund did not use the Global Credit Facility.
8. Fair Value Measurements
The Fund follows a fair value hierarchy that distinguishes between market data obtained from independent sources (observable inputs) and the Fund’s own market assumptions (unobservable inputs). These inputs are used in determining the value of the Fund’s financial instruments and are summarized in the following fair value hierarchy:
| | • | | Level 1 – quoted prices in active markets for identical financial instruments |
| | • | | Level 2 – other significant observable inputs (including quoted prices for similar financial instruments, interest rates, prepayment speed, credit risk, etc.) |
| | • | | Level 3 – significant unobservable inputs (including the Fund’s own assumptions in determining the fair value of financial instruments) |
The input levels are not necessarily an indication of the risk or liquidity associated with financial instruments at that level.
FRANKLIN TEMPLETON VARIABLE INSURANCE PRODUCTS TRUST
NOTES TO FINANCIAL STATEMENTS
Franklin Rising Dividends VIP Fund (continued)
8. Fair Value Measurements (continued)
For movements between the levels within the fair value hierarchy, the Fund has adopted a policy of recognizing the transfers as of the date of the underlying event which caused the movement.
At December 31, 2014, all of the Fund’s investments in financial instruments carried at fair value were valued using Level 1 inputs. For detailed categories, see the accompanying Statement of Investments.
9. New Accounting Pronouncements
In June 2014, the Financial Accounting Standards Board issued Accounting Standards Update (ASU) No. 2014-11, Transfers and Servicing (Topic 860), Repurchase-to-Maturity Transactions, Repurchase Financings, and Disclosures. The ASU changes the accounting for certain repurchase agreements and expands disclosure requirements related to repurchase agreements, securities lending, repurchase-to-maturity and similar transactions. The ASU is effective for interim and annual reporting periods beginning after December 15, 2014. Management has reviewed the requirements and believes the adoption of this ASU will not have a material impact on the financial statements.
10. Subsequent Events
The Fund has evaluated subsequent events through the issuance of the financial statements and determined that no events have occurred that require disclosure other than those already disclosed in the financial statements.
Abbreviations
| | |
| Selected Portfolio |
| |
| ADR | | American Depositary Receipt |
FRANKLIN TEMPLETON VARIABLE INSURANCE PRODUCTS TRUST
Report of Independent Registered Public Accounting Firm
Franklin Rising Dividends VIP Fund
To the Board of Trustees and Shareholders of Franklin Templeton Variable Insurance Products Trust
In our opinion, the accompanying statement of assets and liabilities, including the statement of investments, and the related statements of operations and of changes in net assets and the financial highlights present fairly, in all material respects, the financial position of Franklin Rising Dividends VIP Fund (the “Fund”) at December 31, 2014, the results of its operations for the year then ended, the changes in its net assets for each of the two years in the period then ended and the financial highlights for each of the five years in the period then ended, in conformity with accounting principles generally accepted in the United States of America. These financial statements and financial highlights (hereafter referred to as “financial statements”) are the responsibility of the Fund’s management. Our responsibility is to express an opinion on these financial statements based on our audits. We conducted our audits of these financial statements in accordance with the standards of the Public Company Accounting Oversight Board (United States). Those standards require that we plan and perform the audit to obtain reasonable assurance about whether the financial statements are free of material misstatement. An audit includes examining, on a test basis, evidence supporting the amounts and disclosures in the financial statements, assessing the accounting principles used and significant estimates made by management, and evaluating the overall financial statement presentation. We believe that our audits, which included confirmation of securities at December 31, 2014 by correspondence with the custodian, transfer agent and brokers, provides a reasonable basis for our opinion.
PricewaterhouseCoopers LLP
San Francisco, California
February 13, 2015
FRANKLIN TEMPLETON VARIABLE INSURANCE PRODUCTS TRUST
Tax Information (unaudited)
Franklin Rising Dividends VIP Fund
Under Section 852(b)(3)(C) of the Internal Revenue Code (Code), the Fund hereby reports the maximum amount allowable but no less than $36,291,148 as a long term capital gain dividend for the fiscal year ended December 31, 2014.
Under Section 854(b)(1)(A) of the Code, the Fund hereby reports 100% of the ordinary income dividends as income qualifying for the dividends received deduction for the fiscal year ended December 31, 2014.
Franklin Small Cap Value VIP Fund
(Formerly, Franklin Small Cap Value Securities Fund)
This annual report for Franklin Small Cap Value VIP Fund covers the fiscal year ended December 31, 2014.
Class 2 Performance Summary as of December 31, 2014
Average annual total return of Class 2 shares* represents the average annual change in value, assuming reinvestment of dividends and capital gains. Average returns smooth out variations in returns, which can be significant; they are not the same as year-by-year results.
| | | | | | | | | | | | |
| Periods ended 12/31/14 | | 1-Year | | | 5-Year | | | 10-Year | |
Average Annual Total Return | | | +0.57% | | | | +14.89% | | | | +7.96% | |
*The Fund has a fee waiver associated with its investments in a Franklin Templeton money fund, contractually guaranteed through at least its current fiscal year-end. Fund investment results reflect the fee waiver, to the extent applicable; without this reduction, the results would have been lower.
Performance reflects the Fund’s Class 2 operating expenses, but does not include any contract fees, expenses or sales charges. If they had been included, performance would be lower. These charges and deductions, particularly for variable life policies, can have a significant effect on contract values and insurance benefits. See the contract prospectus for a complete description of these expenses, including sales charges.
Performance data represent past performance, which does not guarantee future results. Investment return and principal value will fluctuate, and you may have a gain or loss when you sell your shares. Current performance may differ from figures shown.
Total Return Index Comparison for a Hypothetical $10,000 Investment (1/1/05–12/31/14)
The graph below shows the change in value of a hypothetical $10,000 investment in the Fund over the indicated period and includes reinvestment of any income or distributions. The Fund’s performance* is compared to the performance of the Russell 2500™ Value Index. One cannot invest directly in an index, and an index is not representative of the Fund’s portfolio. Please see Important Notes to Performance Information preceding the Fund Summaries.
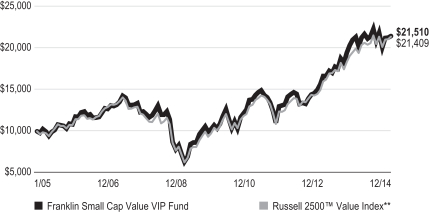
**Source: Morningstar. Please see Index Descriptions following the Fund Summaries.
FRANKLIN SMALL CAP VALUE VIP FUND
Fund Goal and Main Investments
Franklin Small Cap Value VIP Fund seeks long-term total return. Under normal market conditions, the Fund invests at least 80% of its net assets in investments of small capitalization companies. For this Fund, small capitalization companies are those with market capitalizations under $3.5 billion at the time of purchase. The Fund generally invests in equity securities of companies that the manager believes are undervalued and have the potential for capital appreciation.
Fund Risks
All investments involve risks, including possible loss of principal. The Fund’s investments in smaller company stocks carry special risks as such stocks have historically exhibited greater price volatility than large-company stocks, particularly over the short term. Additionally, smaller companies often have relatively small revenues, limited product lines and a small market share. In addition, the Fund may invest up to 25% of its total assets in foreign securities, which involve special risks, including currency fluctuations and economic and political uncertainty. The Fund is actively managed but there is no guarantee that the manager’s investment decisions will produce the desired results. The Fund’s prospectus also includes a description of the main investment risks.
Performance Overview
You can find the Fund’s one-year total return in the Performance Summary. For comparison, the Fund’s benchmark, the Russell 2500TM Value Index, rose 7.11% for the same period.1 Please note the Fund employs a bottom-up stock selection process, and the managers invest in securities without regard to benchmark comparisons.
Economic and Market Overview
The U.S. economy continued to grow during the year ended December 31, 2014, underpinned in some quarters by manufacturing activity, consumer and business spending, and federal defense spending. Home sales experienced some weakness resulting from reduced inventory, higher mortgage rates and tight credit requirements but began to recover in May as mortgage rates declined. Home prices stayed higher than a year
earlier. Retail sales generally improved, supported by job growth and lower gasoline prices in the latter part of 2014. The unemployment rate declined to 5.6% in December 2014 from 6.7% in December 2013.2 Inflation, as measured by the Consumer Price Index, remained low.
In January 2014, the U.S. Federal Reserve Board (Fed) began reducing its large-scale bond purchases $10 billion a month and ended the buying program in October. But it continued its practice of maintaining holdings of longer term securities at sizable levels. The Fed believed underlying economic strength could support ongoing progress in labor market conditions. The Fed also noted that although inflation might remain low in the near term, the likelihood of inflation running persistently below 2% had diminished. Toward period-end, the Fed stated that it could be patient with regard to raising interest rates and that the interest rate might not rise for at least a couple of meetings, possibly implying at least the first two meetings of 2015.
Investor confidence grew during the period as corporate profits rose and the economy generally strengthened. The market endured sell-offs when many investors reacted to political instability in certain emerging markets, crises in Ukraine and the Middle East, weakness in Europe and Japan, and moderating economic data in China. U.S. stocks rose overall for the 12 months under review as the Standard & Poor’s® 500 Index and Dow Jones Industrial Average reached all-time highs.3
Investment Strategy
We generally invest in stocks that we believe are undervalued and have the potential for capital appreciation. We consider a stock price a “value” when it trades at less than the price at which we believe it would trade if the market reflected all factors relating to the company’s worth. Accordingly, we invest in companies that we believe have, for example, stock prices that are low relative to current or historical or future earnings, book value, cash flow or sales; recent sharp price declines but the potential for good long-term earnings prospects; and valuable intangibles not reflected in the stock price. Companies in which we may invest include those that may be considered out of favor, such as companies attempting to recover from bankruptcy, business setbacks, adverse events or cyclical downturns, or that may be considered potential takeover targets.
1. Source: Morningstar.
One cannot invest directly in an index, and an index is not representative of the Fund’s portfolio. Please see Index Descriptions following the Fund Summaries.
2. Source: Bureau of Labor Statistics.
3. Please see Index Descriptions following the Fund Summaries.
FRANKLIN SMALL CAP VALUE VIP FUND
Manager’s Discussion
Contributors to absolute Fund performance included Trinity Industries, Protective Life and STERIS. Trinity Industries, a railcar manufacturer, experienced increased demand for railcars to transport oil, commodities and autos resulting from rising energy and auto production, and a positive response to asset sales and acquisitions. Protective Life, a life insurance company, was the subject of an all cash takeover by Dai-ichi Life Insurance at a 34% premium to Protective’s then share price. STERIS, a manufacturer and supplier of sterilization products and services primarily for the health care industry, reported earnings growth driven by increased organic demand and the benefit from prior acquisitions. In addition, the company was also expected to benefit from a sizable strategic acquisition anticipated to be completed in 2015.
Detractors from absolute Fund performance included Civeo, Unit Corp. and Tidewater. Civeo, a spin-off of Fund holding Oil States International, is a leading provider of lodging and related services tied mostly to oil exploration and production and mining companies in Canada and Australia. The stock was negatively impacted by substantially lower-than-expected earnings guidance because of an uncertain contracting environment as oil and other commodity prices came under pressure. Unit Corp., an onshore oil and gas exploration, production and drilling services provider, was negatively impacted by the precipitous drop in energy prices that began in mid-2014. Tidewater suffered from a sharp decline in oil prices, weaker-than-expected deepwater day rates and higher maintenance expenses.
During the period, we initiated new positions including Axiall, a chemicals and building products manufacturer; Maple Leaf Foods, a packaged consumer foods manufacturer; Minerals Technologies, a global producer of value-added specialty minerals; GrainCorp, a grain products and services provider; and Gerresheimer, a glass and plastics maker for the pharmaceuticals industry. We also added to our holdings in Sensient Technologies, a color, flavor and fragrance manufacturer; H.B. Fuller, an industrial adhesive producer; and Enersys, an industrial battery manufacturer; among others.
We eliminated positions including the aforementioned Trinity Industries and Protective Life, Harman International Industries, Autoliv and Atwood Oceanics, among others. Some holdings
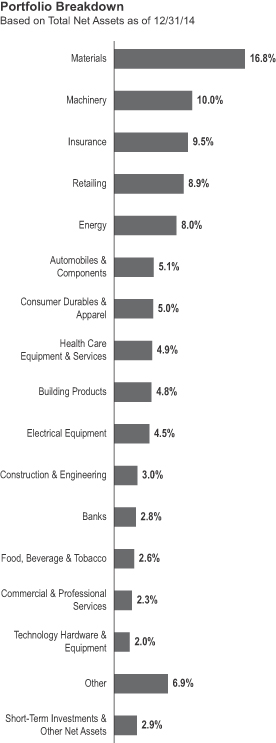
FRANKLIN SMALL CAP VALUE VIP FUND
we reduced included Reliance Steel & Aluminum, Steel Dynamics and EnPro Industries, among others. The acquisition of Schawk by Matthews International was announced at a 36% premium to Schawk’s then share price, and we sold our position before the deal was completed.
Thank you for your participation in Franklin Small Cap Value VIP Fund. We look forward to serving your future investment needs.
The foregoing information reflects our analysis, opinions and portfolio holdings as of December 31, 2014, the end of the reporting period. The way we implement our main investment strategies and the resulting portfolio holdings may change depending on factors such as market and economic conditions. These opinions may not be relied upon as investment advice or an offer for a particular security. The information is not a complete analysis of every aspect of any market, country, industry, security or the Fund. Statements of fact are from sources considered reliable, but the investment manager makes no representation or warranty as to their completeness or accuracy. Although historical performance is no guarantee of future results, these insights may help you understand our investment management philosophy.
| | | | |
| Top 10 Holdings | | | |
| 12/31/14 | | | |
Company
Sector/Industry | | % of Total
Net Assets | |
Sensient Technologies Corp.
Materials | | | 2.7% | |
Thor Industries Inc.
Automobiles & Components | | | 2.5% | |
La-Z-Boy Inc.
Consumer Durables & Apparel | | | 2.2% | |
STERIS Corp.
Health Care Equipment & Services | | | 2.2% | |
Group 1 Automotive Inc.
Retailing | | | 2.2% | |
StanCorp Financial Group Inc.
Insurance | | | 2.1% | |
Axiall Corp.
Materials | | | 2.1% | |
RPM International Inc.
Materials | | | 2.1% | |
H.B. Fuller Co.
Materials | | | 2.0% | |
Regal-Beloit Corp.
Electrical Equipment | | | 1.9% | |
The dollar value, number of shares or principal amount, and names of all portfolio holdings are listed in the Fund’s Statement of Investments (SOI).
FRANKLIN SMALL CAP VALUE VIP FUND
Class 2 Fund Expenses
As an investor in a variable insurance contract (Contract) that indirectly provides for investment in an underlying mutual fund, you can incur transaction and/or ongoing expenses at both the Fund level and the Contract level.
| • | | Transaction expenses can include sales charges (loads) on purchases, redemption fees, surrender fees, transfer fees and premium taxes. |
| • | | Ongoing expenses can include management fees, distribution and service (12b-1) fees, contract fees, annual maintenance fees, mortality and expense risk fees and other fees and expenses. All mutual funds and Contracts have some types of ongoing expenses. |
The expenses shown in the table are meant to highlight ongoing expenses at the Fund level only and do not include ongoing expenses at the Contract level, or transaction expenses at either the Fund or Contract level. While the Fund does not have transaction expenses, if the transaction and ongoing expenses at the Contract level were included, the expenses shown below would be higher. You should consult your Contract prospectus or disclosure document for more information.
The table shows Fund-level ongoing expenses and can help you understand these expenses and compare them with those of other mutual funds offered through the Contract. The table assumes a $1,000 investment held for the six months indicated. Please refer to the Fund prospectus for additional information on operating expenses.
Actual Fund Expenses
The first line (Actual) of the table provides actual account values and expenses. The “Ending Account Value” is derived from the Fund’s actual return, which includes the effect of ongoing Fund expenses, but does not include the effect of ongoing Contract expenses.
You can estimate the Fund-level expenses you incurred during the period by following these steps. Of course, your account value and expenses will differ from those in this illustration:
| 1. | Divide your account value by $1,000. |
If an account had an $8,600 value, then $8,600 ÷ $1,000 = 8.6.
| 2. | Multiply the result by the number under the heading “Fund-Level Expenses Incurred During Period.” |
If Fund-Level Expenses Incurred During Period were $7.50, then 8.6 × $7.50 = $64.50.
In this illustration, the estimated expenses incurred this period at the Fund level are $64.50.
Hypothetical Example for Comparison with Other Mutual Funds
Information in the second line (Hypothetical) of the table can help you compare ongoing expenses of the Fund with those of other mutual funds offered through the Contract. This information may not be used to estimate the actual ending account balance or expenses you incurred during the period. The hypothetical “Ending Account Value” is based on the Fund’s actual expense ratio and an assumed 5% annual rate of return before expenses, which does not represent the Fund’s actual return. The figure under the heading “Fund-Level Expenses Incurred During Period” shows the hypothetical expenses your account would have incurred under this scenario. You can compare this figure with the 5% hypothetical examples that appear in shareholder reports of other funds offered through a Contract.
| | | | | | | | | | | | |
| Class 2 | | Beginning Account
Value 7/1/14 | | | Ending Account
Value 12/31/14 | | | Fund-Level Expenses
Incurred During Period* 7/1/14–12/31/14 | |
Actual | | | $1,000 | | | | $ 962.10 | | | | $4.40 | |
Hypothetical (5% return before expenses) | | | $1,000 | | | | $1,020.72 | | | | $4.53 | |
*Expenses are calculated using the most recent six-month annualized expense ratio, net of expense waivers, for the Fund’s Class 2 shares (0.89%), which does not include any ongoing expenses of the Contract for which the Fund is an investment option, multiplied by the average account value over the period, multiplied by 184/365 to reflect the one-half year period.
SUPPLEMENT DATED OCTOBER 1, 2014
TO THE PROSPECTUSES DATED MAY 1, 2014
OF
FRANKLIN SMALL CAP VALUE VIP FUND
(A series of Franklin Templeton Variable Insurance Products Trust)
The prospectus is amended as follows:
I. The Fund Summary “Portfolio Managers” section beginning on page FSV-S4 is revised to remove reference to William J. Lippman and revise Donald G. Taylor’s biography to the following:
Portfolio Managers
STEVEN B. RAINERI Portfolio Manager of Advisory Services and portfolio manager of the Fund since 2012.
DONALD G. TAYLOR, CPA President and Chief Investment Officer of Advisory Services and portfolio manager of the Fund since inception (1998).
BRUCE C. BAUGHMAN, CPA Senior Vice President of Advisory Services and portfolio manager of the Fund since inception (1998).
II. The portfolio management team in the “Fund Details – Management” section beginning on page FSV-D4 is revised to remove reference to William J. Lippman and revise Donald G. Taylor’s title to the following:
The Fund is managed by a team of dedicated professionals focused on investments of small cap value companies. The portfolio managers of the team are as follows:
| | |
STEVEN B. RAINERI Portfolio Manager of Advisory Services | | Mr. Raineri has been a co-lead portfolio manager of the Fund since 2012. He joined Franklin Templeton Investments in 2005. Mr. Raineri, as co-lead portfolio manager of the Fund, has primary responsibility for the investments of the Fund. He has final authority over all aspects of the Fund’s investment portfolio, including but not limited to, purchases and sales of individual securities, portfolio risk assessment, and the management of daily cash balances in accordance with anticipated investment management requirements. The degree to which he may perform these functions, and the nature of these functions, may change from time to time. Mr. Baughman and Mr. Taylor provide support to the lead portfolio manager(s) of the Fund as needed. |
| |
| DONALD G. TAYLOR, CPA President and Chief Investment Officer of Advisory Services | | Mr. Taylor has been a portfolio manager of the Fund since its inception (1998). He joined Franklin Templeton Investments in 1996. |
| |
| BRUCE C. BAUGHMAN, CPA Senior Vice President of Advisory Services | | Mr. Baughman has been a portfolio manager of the Fund since its inception (1998). He joined Franklin Templeton Investments in 1988. |
Please keep this supplement with your prospectus for future reference.
FRANKLIN TEMPLETON VARIABLE INSURANCE PRODUCTS TRUST
Financial Highlights
Franklin Small Cap Value VIP Fund
| | | | | | | | | | | | | | | | | | | | |
| | | Year Ended December 31, | |
| | | 2014 | | | 2013 | | | 2012 | | | 2011 | | | 2010 | |
| Class 1 | | | | | | | | | | | | | | | | | | | | |
Per share operating performance
(for a share outstanding throughout the year) | | | | | | | | | | | | | | | | | | | | |
| | | | | |
Net asset value, beginning of year | | | $24.54 | | | | $18.58 | | | | $15.82 | | | | $16.55 | | | | $13.00 | |
| | | | |
| | | | | |
| Income from investment operationsa: | | | | | | | | | | | | | | | | | | | | |
| | | | | |
Net investment incomeb | | | 0.19 | | | | 0.19 | | | | 0.29 | c | | | 0.16 | | | | 0.14 | |
| | | | | |
Net realized and unrealized gains (losses) | | | 0.06 | | | | 6.45 | | | | 2.64 | | | | (0.74 | ) | | | 3.54 | |
| | | | |
Total from investment operations | | | 0.25 | | | | 6.64 | | | | 2.93 | | | | (0.58 | ) | | | 3.68 | |
| | | | |
| | | | | |
| Less distributions from: | | | | | | | | | | | | | | | | | | | | |
| | | | | |
Net investment income | | | (0.20 | ) | | | (0.32 | ) | | | (0.17 | ) | | | (0.15 | ) | | | (0.13 | ) |
| | | | | |
Net realized gains | | | (1.78 | ) | | | (0.36 | ) | | | — | | | | — | | | | — | |
| | | | |
Total distributions | | | (1.98 | ) | | | (0.68 | ) | | | (0.17 | ) | | | (0.15 | ) | | | (0.13 | ) |
| | | | |
Net asset value, end of year | | | $22.81 | | | | $24.54 | | | | $18.58 | | | | $15.82 | | | | $16.55 | |
| | | | |
| | | | | |
Total returnd | | | 0.88% | | | | 36.50% | | | | 18.75% | | | | (3.53)% | | | | 28.49% | |
| | | | | |
| Ratios to average net assets | | | | | | | | | | | | | | | | | | | | |
| | | | | |
Expenses | | | 0.63% | e | | | 0.63% | | | | 0.67% | | | | 0.66% | | | | 0.67% | |
| | | | | |
Net investment income | | | 0.82% | | | | 0.90% | | | | 1.70% | c | | | 1.02% | | | | 0.98% | |
| | | | | |
| Supplemental data | | | | | | | | | | | | | | | | | | | | |
| | | | | |
Net assets, end of year (000’s) | | | $57,843 | | | | $62,408 | | | | $40,133 | | | | $39,374 | | | | $47,300 | |
| | | | | |
Portfolio turnover rate | | | 19.45% | | | | 10.44% | | | | 5.84% | | | | 14.39% | | | | 15.92% | |
aThe amount shown for a share outstanding throughout the period may not correlate with the Statement of Operations for the period due to the timing of sales and repurchases of the Fund shares in relation to income earned and/or fluctuating fair value of the investments of the Fund.
bBased on average daily shares outstanding.
cNet investment income per share includes approximately $0.10 per share received in the form of special dividends. Excluding these amounts, the ratio of net investment income to average net assets would have been 1.10%.
dTotal return does not include fees, charges or expenses imposed by the variable annuity and life insurance contracts for which Franklin Templeton Variable Insurance
Products Trust serves as an underlying investment vehicle.
eBenefit of waiver and payments by affiliates and expense reduction rounds to less than 0.01%.
| | | | | | |
| | | The accompanying notes are an integral part of these financial statements. | Annual Report | | | FSV-7 | |
FRANKLIN TEMPLETON VARIABLE INSURANCE PRODUCTS TRUST
FINANCIAL HIGHLIGHTS
Franklin Small Cap Value VIP Fund (continued)
| | | | | | | | | | | | | | | | | | | | |
| | | Year Ended December 31, | |
| | | 2014 | | | 2013 | | | 2012 | | | 2011 | | | 2010 | |
| Class 2 | | | | | | | | | | | | | | | | | | | | |
Per share operating performance
(for a share outstanding throughout the year) | | | | | | | | | | | | | | | | | | | | |
| | | | | |
Net asset value, beginning of year | | | $24.07 | | | | $18.23 | | | | $15.53 | | | | $16.25 | | | | $12.77 | |
| | | | |
| | | | | |
| Income from investment operationsa: | | | | | | | | | | | | | | | | | | | | |
| | | | | |
Net investment incomeb | | | 0.13 | | | | 0.14 | | | | 0.24 | c | | | 0.12 | | | | 0.10 | |
| | | | | |
Net realized and unrealized gains (losses) | | | 0.05 | | | | 6.34 | | | | 2.59 | | | | (0.73 | ) | | | 3.48 | |
| | | | |
Total from investment operations | | | 0.18 | | | | 6.48 | | | | 2.83 | | | | (0.61 | ) | | | 3.58 | |
| | | | |
| | | | | |
| Less distributions from: | | | | | | | | | | | | | | | | | | | | |
| | | | | |
Net investment income | | | (0.15 | ) | | | (0.28 | ) | | | (0.13 | ) | | | (0.11 | ) | | | (0.10 | ) |
| | | | | |
Net realized gains | | | (1.78 | ) | | | (0.36 | ) | | | — | | | | — | | | | — | |
| | | | |
Total distributions | | | (1.93 | ) | | | (0.64 | ) | | | (0.13 | ) | | | (0.11 | ) | | | (0.10 | ) |
| | | | |
Net asset value, end of year | | | $22.32 | | | | $24.07 | | | | $18.23 | | | | $15.53 | | | | $16.25 | |
| | | | |
| | | | | |
Total returnd | | | 0.57% | | | | 36.24% | | | | 18.39% | | | | (3.76)% | | | | 28.22% | |
| | | | | |
| Ratios to average net assets | | | | | | | | | | | | | | | | | | | | |
| | | | | |
Expenses | | | 0.88% | e | | | 0.88% | | | | 0.92% | | | | 0.91% | | | | 0.92% | |
| | | | | |
Net investment income | | | 0.57% | | | | 0.65% | | | | 1.45% | c | | | 0.77% | | | | 0.73% | |
| | | | | |
| Supplemental data | | | | | | | | | | | | | | | | | | | | |
| | | | | |
Net assets, end of year (000’s) | | | $1,445,325 | | | | $1,606,802 | | | | $1,286,573 | | | | $1,211,168 | | | | $1,362,292 | |
| | | | | |
Portfolio turnover rate | | | 19.45% | | | | 10.44% | | | | 5.84% | | | | 14.39% | | | | 15.92% | |
aThe amount shown for a share outstanding throughout the period may not correlate with the Statement of Operations for the period due to the timing of sales and repurchases of the Fund shares in relation to income earned and/or fluctuating fair value of the investments of the Fund.
bBased on average daily shares outstanding.
cNet investment income per share includes approximately $0.10 per share received in the form of special dividends. Excluding these amounts, the ratio of net investment income to average net assets would have been 0.85%.
dTotal return does not include fees, charges or expenses imposed by the variable annuity and life insurance contracts for which Franklin Templeton Variable Insurance Products Trust serves as an underlying investment vehicle.
eBenefit of waiver and payments by affiliates and expense reduction rounds to less than 0.01%.
| | | | | | |
| | FSV-8 | | | Annual Report | The accompanying notes are an integral part of these financial statements. | | |
FRANKLIN TEMPLETON VARIABLE INSURANCE PRODUCTS TRUST
FINANCIAL HIGHLIGHTS
Franklin Small Cap Value VIP Fund (continued)
| | | | | | | | | | | | | | | | | | | | |
| | | Year Ended December 31, | |
| | | 2014 | | | 2013 | | | 2012 | | | 2011 | | | 2010 | |
| Class 4 | | | | | | | | | | | | | | | | | | | | |
Per share operating performance
(for a share outstanding throughout the year) | | | | | | | | | | | | | | | | | | | | |
| | | | | |
Net asset value, beginning of year | | | $24.37 | | | | $18.44 | | | | $15.71 | | | | $16.44 | | | | $12.92 | |
| | | | |
| | | | | |
| Income from investment operationsa: | | | | | | | | | | | | | | | | | | | | |
| | | | | |
Net investment incomeb | | | 0.11 | | | | 0.12 | | | | 0.22 | c | | | 0.11 | | | | 0.09 | |
| | | | | |
Net realized and unrealized gains (losses) | | | 0.05 | | | | 6.42 | | | | 2.63 | | | | (0.75 | ) | | | 3.53 | |
| | | | |
Total from investment operations | | | 0.16 | | | | 6.54 | | | | 2.85 | | | | (0.64 | ) | | | 3.62 | |
| | | | |
| | | | | |
| Less distributions from: | | | | | | | | | | | | | | | | | | | | |
| | | | | |
Net investment income | | | (0.12 | ) | | | (0.25 | ) | | | (0.12 | ) | | | (0.09 | ) | | | (0.10 | ) |
| | | | | |
Net realized gains | | | (1.78 | ) | | | (0.36 | ) | | | — | | | | — | | | | — | |
| | | | |
Total distributions | | | (1.90 | ) | | | (0.61 | ) | | | (0.12 | ) | | | (0.09 | ) | | | (0.10 | ) |
| | | | |
Net asset value, end of year | | | $22.63 | | | | $24.37 | | | | $18.44 | | | | $15.71 | | | | $16.44 | |
| | | | |
| | | | | |
Total returnd | | | 0.48% | | | | 36.12% | | | | 18.27% | | | | (3.87)% | | | | 28.14% | |
| | | | | |
| Ratios to average net assets | | | | | | | | | | | | | | | | | | | | |
| | | | | |
Expenses | | | 0.98% | e | | | 0.98% | | | | 1.02% | | | | 1.01% | | | | 1.02% | |
| | | | | |
Net investment income | | | 0.47% | | | | 0.55% | | | | 1.35% | c | | | 0.67% | | | | 0.63% | |
| | | | | |
| Supplemental data | | | | | | | | | | | | | | | | | | | | |
| | | | | |
Net assets, end of year (000’s) | | | $30,452 | | | | $35,936 | | | | $32,424 | | | | $34,284 | | | | $39,075 | |
| | | | | |
Portfolio turnover rate | | | 19.45% | | | | 10.44% | | | | 5.84% | | | | 14.39% | | | | 15.92% | |
aThe amount shown for a share outstanding throughout the period may not correlate with the Statement of Operations for the period due to the timing of sales and repurchases of the Fund shares in relation to income earned and/or fluctuating fair value of the investments of the Fund.
bBased on average daily shares outstanding.
cNet investment income per share includes approximately $0.10 per share received in the form of special dividends. Excluding these amounts, the ratio of net investment income to average net assets would have been 0.75%.
dTotal return does not include fees, charges or expenses imposed by the variable annuity and life insurance contracts for which Franklin Templeton Variable Insurance Products Trust serves as an underlying investment vehicle.
eBenefit of waiver and payments by affiliates and expense reduction rounds to less than 0.01%.
| | | | | | |
| | | The accompanying notes are an integral part of these financial statements. | Annual Report | | | FSV-9 | |
FRANKLIN TEMPLETON VARIABLE INSURANCE PRODUCTS TRUST
Statement of Investments, December 31, 2014
| | | | | | | | | | |
| Franklin Small Cap Value VIP Fund | |
| | | | | Shares | | | Value | |
| | Common Stocks 96.7% | | | | | | | | |
| | Aerospace & Defense 1.8% | | | | | | | | |
| | AAR Corp. | | | 984,700 | | | $ | 27,354,966 | |
| | | | | | | | | | |
| | Automobiles & Components 5.1% | | | | | | | | |
| a | | Drew Industries Inc. | | | 223,800 | | | | 11,429,466 | |
| | Gentex Corp. | | | 587,300 | | | | 21,219,149 | |
| | Thor Industries Inc. | | | 680,900 | | | | 38,041,883 | |
| | Winnebago Industries Inc. | | | 331,200 | | | | 7,206,912 | |
| | | | | | | | | | |
| | | | | | | | | 77,897,410 | |
| | | | | | | | | | |
| | Banks 2.8% | | | | | | | | |
| | Chemical Financial Corp. | | | 398,954 | | | | 12,223,951 | |
| | EverBank Financial Corp. | | | 367,152 | | | | 6,997,917 | |
| | OFG Bancorp. (Puerto Rico) | | | 602,000 | | | | 10,023,300 | |
| | Peoples Bancorp Inc. | | | 158,000 | | | | 4,096,940 | |
| | TrustCo Bank Corp. NY | | | 1,388,700 | | | | 10,081,962 | |
| | | | | | | | | | |
| | | | | | | | | 43,424,070 | |
| | | | | | | | | | |
| | Building Products 4.8% | | | | | | | | |
| | Apogee Enterprises Inc. | | | 424,700 | | | | 17,994,539 | |
| a | | Gibraltar Industries Inc. | | | 842,300 | | | | 13,695,798 | |
| | Simpson Manufacturing Co. Inc. | | | 433,400 | | | | 14,995,640 | |
| | Universal Forest Products Inc. | | | 504,700 | | | | 26,850,040 | |
| | | | | | | | | | |
| | | | | | | | | 73,536,017 | |
| | | | | | | | | | |
| | Commercial & Professional Services 2.3% | | | | | | | | |
| | Civeo Corp. | | | 562,400 | | | | 2,311,464 | |
| | McGrath RentCorp | | | 399,318 | | | | 14,319,543 | |
| | MSA Safety Inc. | | | 357,113 | | | | 18,959,129 | |
| | | | | | | | | | |
| | | | | | | | | 35,590,136 | |
| | | | | | | | | | |
| | Construction & Engineering 3.0% | | | | | | | | |
| | EMCOR Group Inc. | | | 367,400 | | | | 16,345,626 | |
| | Granite Construction Inc. | | | 775,000 | | | | 29,465,500 | |
| | | | | | | | | | |
| | | | | | | | | 45,811,126 | |
| | | | | | | | | | |
| | Consumer Durables & Apparel 5.0% | | | | | | | | |
| | Brunswick Corp. | | | 445,000 | | | | 22,810,700 | |
| a | | Helen of Troy Ltd. | | | 17,700 | | | | 1,151,562 | |
| | Hooker Furniture Corp. | | | 445,000 | | | | 7,640,650 | |
| | La-Z-Boy Inc. | | | 1,281,100 | | | | 34,384,724 | |
| a | | M/I Homes Inc. | | | 435,900 | | | | 10,008,264 | |
| | | | | | | | | | |
| | | | | | | | | 75,995,900 | |
| | | | | | | | | | |
| | Electrical Equipment 4.5% | | | | | | | | |
| | EnerSys | | | 254,210 | | | | 15,689,841 | |
| | Franklin Electric Co. Inc. | | | 389,264 | | | | 14,609,078 | |
| | Powell Industries Inc. | | | 195,000 | | | | 9,568,650 | |
| | Regal-Beloit Corp. | | | 397,000 | | | | 29,854,400 | |
| | | | | | | | | | |
| | | | | | | | | 69,721,969 | |
| | | | | | | | | | |
| | Energy 7.6% | | | | | | | | |
| | Bristow Group Inc. | | | 442,300 | | | | 29,098,917 | |
| | Energen Corp. | | | 220,000 | | | | 14,027,200 | |
| a | | Helix Energy Solutions Group Inc. | | | 631,200 | | | | 13,697,040 | |
| | Hunting PLC (United Kingdom) | | | 706,900 | | | | 5,856,306 | |
FRANKLIN TEMPLETON VARIABLE INSURANCE PRODUCTS TRUST
STATEMENT OF INVESTMENTS
Franklin Small Cap Value VIP Fund (continued)
| | | | | | | | | | |
| | | | | Shares | | | Value | |
| | Common Stocks (continued) | | | | | | | | |
| | Energy (continued) | | | | | | | | |
| a | | Oil States International Inc. | | | 299,900 | | | $ | 14,665,110 | |
| | Rowan Cos. PLC | | | 529,000 | | | | 12,336,280 | |
| | Tidewater Inc. | | | 202,800 | | | | 6,572,748 | |
| a | | Unit Corp. | | | 577,900 | | | | 19,706,390 | |
| | | | | | | | | | |
| | | | | | | | | 115,959,991 | |
| | | | | | | | | | |
| | Food, Beverage & Tobacco 2.6% | | | | | | | | |
| | GrainCorp Ltd. (Australia) | | | 1,725,000 | | | | 11,619,816 | |
| | Maple Leaf Foods Inc. (Canada) | | | 1,699,600 | | | | 28,496,200 | |
| | | | | | | | | | |
| | | | | | | | | 40,116,016 | |
| | | | | | | | | | |
| | Health Care Equipment & Services 4.9% | | | | | | | | |
| | Hill-Rom Holdings Inc. | | | 344,000 | | | | 15,693,280 | |
| | STERIS Corp. | | | 530,000 | | | | 34,370,500 | |
| | Teleflex Inc. | | | 211,800 | | | | 24,318,876 | |
| | | | | | | | | | |
| | | | | | | | | 74,382,656 | |
| | | | | | | | | | |
| | Industrial Conglomerates 1.8% | | | | | | | | |
| | Carlisle Cos. Inc. | | | 308,900 | | | | 27,875,136 | |
| | | | | | | | | | |
| | Insurance 9.5% | | | | | | | | |
| | Arthur J. Gallagher & Co. | | | 168,200 | | | | 7,918,856 | |
| | Aspen Insurance Holdings Ltd. | | | 538,700 | | | | 23,578,899 | |
| | Assurant Inc. | | | 51,800 | | | | 3,544,674 | |
| | The Hanover Insurance Group Inc. | | | 345,000 | | | | 24,605,400 | |
| | HCC Insurance Holdings Inc. | | | 188,200 | | | | 10,072,464 | |
| | Montpelier Re Holdings Ltd. | | | 413,800 | | | | 14,822,316 | |
| | Old Republic International Corp. | | | 1,075,900 | | | | 15,740,417 | |
| | StanCorp Financial Group Inc. | | | 467,400 | | | | 32,652,564 | |
| | Validus Holdings Ltd. | | | 317,800 | | | | 13,207,768 | |
| | | | | | | | | | |
| | | | | | | | | 146,143,358 | |
| | | | | | | | | | |
| | Machinery 10.0% | | | | | | | | |
| | Astec Industries Inc. | | | 523,800 | | | | 20,590,578 | |
| | Briggs & Stratton Corp. | | | 410,200 | | | | 8,376,284 | |
| a | | EnPro Industries Inc. | | | 245,000 | | | | 15,376,200 | |
| | Hillenbrand Inc. | | | 545,200 | | | | 18,809,400 | |
| | Kennametal Inc. | | | 228,500 | | | | 8,178,015 | |
| | Lincoln Electric Holdings Inc. | | | 272,700 | | | | 18,840,843 | |
| b | | Lindsay Corp. | | | 166,000 | | | | 14,232,840 | |
| | Mueller Industries Inc. | | | 712,200 | | | | 24,314,508 | |
| a | | Wabash National Corp. | | | 1,726,900 | | | | 21,344,484 | |
| | Watts Water Technologies Inc., A | | | 55,000 | | | | 3,489,200 | |
| | | | | | | | | | |
| | | | | | | | | 153,552,352 | |
| | | | | | | | | | |
| | Materials 16.8% | | | | | | | | |
| | A. Schulman Inc. | | | 601,466 | | | | 24,377,417 | |
| | Allegheny Technologies Inc. | | | 120,000 | | | | 4,172,400 | |
| | AptarGroup Inc. | | | 65,000 | | | | 4,344,600 | |
| | Axiall Corp. | | | 752,900 | | | | 31,975,663 | |
| | Cabot Corp. | | | 506,800 | | | | 22,228,248 | |
| | Carpenter Technology Corp. | | | 493,500 | | | | 24,304,875 | |
| | H.B. Fuller Co. | | | 677,700 | | | | 30,177,981 | |
| | Minerals Technologies Inc. | | | 262,900 | | | | 18,258,405 | |
FRANKLIN TEMPLETON VARIABLE INSURANCE PRODUCTS TRUST
STATEMENT OF INVESTMENTS
Franklin Small Cap Value VIP Fund (continued)
| | | | | | | | | | |
| | | | | Shares | | | Value | |
| | Common Stocks (continued) | | | | | | | | |
| | Materials (continued) | | | | | | | | |
| | Reliance Steel & Aluminum Co. | | | 119,900 | | | $ | 7,346,273 | |
| | RPM International Inc. | | | 620,000 | | | | 31,440,200 | |
| | Sensient Technologies Corp. | | | 681,500 | | | | 41,121,710 | |
| | Steel Dynamics Inc. | | | 551,500 | | | | 10,886,610 | |
| | Stepan Co. | | | 181,400 | | | | 7,270,512 | |
| | | | | | | | | | |
| | | | | | | | | 257,904,894 | |
| | | | | | | | | | |
| | Pharmaceuticals, Biotechnology & Life Sciences 0.6% | | | | | | | | |
| | Gerresheimer AG (Germany) | | | 167,421 | | | | 9,105,944 | |
| | | | | | | | | | |
| | Real Estate 0.0%† | | | | | | | | |
| | Excel Trust Inc. | | | 12,000 | | | | 160,680 | |
| | | | | | | | | | |
| | Retailing 8.9% | | | | | | | | |
| | Brown Shoe Co. Inc. | | | 800,000 | | | | 25,720,000 | |
| | The Cato Corp., A | | | 438,600 | | | | 18,500,148 | |
| a | | Genesco Inc. | | | 261,908 | | | | 20,067,391 | |
| | Group 1 Automotive Inc. | | | 373,600 | | | | 33,482,032 | |
| | The Men’s Wearhouse Inc. | | | 517,000 | | | | 22,825,550 | |
| a | | The Pep Boys - Manny, Moe & Jack | | | 837,100 | | | | 8,220,322 | |
| a | | West Marine Inc. | | | 610,700 | | | | 7,890,244 | |
| | | | | | | | | | |
| | | | | | | | | 136,705,687 | |
| | | | | | | | | | |
| | Semiconductors & Semiconductor Equipment 0.6% | | | | | | | | |
| | Cohu Inc. | | | 736,000 | | | | 8,758,400 | |
| | | | | | | | | | |
| | Technology Hardware & Equipment 2.0% | | | | | | | | |
| a | | Ingram Micro Inc., A | | | 507,100 | | | | 14,016,244 | |
| a | | Multi-Fineline Electronix Inc. | | | 140,400 | | | | 1,576,692 | |
| a | | Rofin-Sinar Technologies Inc. | | | 508,700 | | | | 14,635,299 | |
| | | | | | | | | | |
| | | | | | | | | 30,228,235 | |
| | | | | | | | | | |
| | Trading Companies & Distributors 0.7% | | | | | | | | |
| | Applied Industrial Technologies Inc. | | | 251,200 | | | | 11,452,208 | |
| | | | | | | | | | |
| | Transportation 1.4% | | | | | | | | |
| a | | Genesee & Wyoming Inc. | | | 126,377 | | | | 11,363,820 | |
| | SkyWest Inc. | | | 714,800 | | | | 9,492,544 | |
| | | | | | | | | | |
| | | | | | | | | 20,856,364 | |
| | | | | | | | | | |
| | Total Common Stocks (Cost $974,309,478) | | | | | | | 1,482,533,515 | |
| | | | | | | | | | |
| | | |
| | | | | Principal Amount | | | | |
| | Corporate Bonds (Cost $7,669,460) 0.4% | | | | | | | | |
| | Energy 0.4% | | | | | | | | |
| | Unit Corp., senior sub. note, 6.625%, 5/15/21 | | $ | 7,944,000 | | | | 7,149,600 | |
| | | | | | | | | | |
| | Total Investments before Short Term Investments (Cost $981,978,938) | | | | | | | 1,489,683,115 | |
| | | | | | | | | | |
| | | |
| | | | | Shares | | | | |
| | Short Term Investments 3.9% | | | | | | | | |
| | Money Market Funds (Cost $43,920,522) 2.9% | | | | | | | | |
| a,c | | Institutional Fiduciary Trust Money Market Portfolio | | | 43,920,522 | | | | 43,920,522 | |
| | | | | | | | | | |
FRANKLIN TEMPLETON VARIABLE INSURANCE PRODUCTS TRUST
STATEMENT OF INVESTMENTS
Franklin Small Cap Value VIP Fund (continued)
| | | | | | | | | | |
| | | | | Principal Amount | | | Value | |
| d | | Investments from Cash Collateral Received for Loaned Securities 1.0% | | | | | |
| e | | Joint Repurchase Agreements 1.0% | | | | | | | | |
| | Barclays Capital Inc., 0.05%, 1/02/15 (Maturity Value $3,477,439) | | $ | 3,477,429 | | | $ | 3,477,429 | |
| | Collateralized by U.S. Treasury Notes, 1.50% - 2.125%, 8/31/18 - 6/30/21 (valued at $3,546,978) | | | | | | | | |
| | BNP Paribas Securities Corp., 0.05%, 1/02/15 (Maturity Value $3,477,439) | | | 3,477,429 | | | | 3,477,429 | |
| | Collateralized by U.S. Treasury Notes, 1.00% - 2.00%, 11/30/19 - 11/15/21 (valued at $3,546,978) | | | | | | | | |
| | Citigroup Global Markets Inc., 0.06%, 1/02/15 (Maturity Value $732,062) | | | 732,060 | | | | 732,060 | |
| | Collateralized by fU.S. Treasury Bill, 5/07/15; U.S. Treasury Bonds, 2.75% - 9.25%, 2/15/16 - 8/15/43; U.S. Treasury Bonds, Index Linked, 0.625% - 3.625%, 1/15/26 - 2/15/43; U.S. Treasury Notes, 0.25% - 3.375%, 1/31/15 - 11/30/19; U.S. Treasury Notes, Index Linked, 0.50% - 2.625%, 4/15/15 7/15/20; and U.S. Treasury Strips, 11/15/15 - 5/15/44 (valued at $746,701) | | | | | | | | |
| | HSBC Securities (USA) Inc., 0.06%, 1/02/15 (Maturity Value $3,477,441) | | | 3,477,429 | | | | 3,477,429 | |
| | Collateralized by U.S. Government Agency Securities, 0.25% - 7.25%, 10/15/15 - 7/15/32; U.S. Government Agency Securities, zero cpn., 12/01/15 3/17/31; and U.S. Government Agency Strips, 1/15/15 - 4/15/30 (valued at $3,546,986) | | | | | | | | |
| | RBC Capital Markets LLC, 0.06%, 1/02/15 (Maturity Value $3,477,441) | | | 3,477,429 | | | | 3,477,429 | |
| | Collateralized by fU.S. Treasury Bill, 10/15/15; U.S. Treasury Bonds, 3.00% - 6.25%, 8/15/23 - 11/15/44; U.S. Treasury Bonds, Index Linked, 0.125% - 2.125%, 4/15/17 - 2/15/41; U.S. Treasury Notes, 0.25% - 2.125%, 7/31/15 - 11/30/21; U.S. Treasury Notes, Index Linked, 0.625% - 1.875%, 7/15/15 - 7/15/21; and U.S. Treasury Strips, 2/15/15 - 5/15/44 (valued at $3,546,979) | | | | | | | | |
| | | | | | | | | | |
| | Total Joint Repurchase Agreements (Cost $14,641,776) | | | | | | | 14,641,776 | |
| | | | | | | | | | |
| | Total Investments (Cost $1,040,541,236) 101.0% | | | | | | | 1,548,245,413 | |
| | Other Assets, less Liabilities (1.0)% | | | | | | | (14,625,401 | ) |
| | | | | | | | | | |
| | Net Assets 100.0% | | | | | | $ | 1,533,620,012 | |
| | | | | | | | | | |
†Rounds to less than 0.1% of net assets.
aNon-income producing.
bA portion or all of the security is on loan at December 31, 2014. See Note 1(d).
cSee Note 3(e) regarding investments in Institutional Fiduciary Trust Money Market Portfolio.
dSee Note 1(d) regarding securities on loan.
eSee Note 1(c) regarding joint repurchase agreements.
fThe security is traded on a discount basis with no stated coupon rate.
| | | | | | |
| | | The accompanying notes are an integral part of these financial statements. | Annual Report | | | FSV-13 | |
FRANKLIN TEMPLETON VARIABLE INSURANCE PRODUCTS TRUST
Financial Statements
Statement of Assets and Liabilities
December 31, 2014
| | | | |
| | | Franklin Small
Cap Value
VIP Fund | |
Assets: | | | | |
Investments in securities: | | | | |
Cost - Unaffiliated issuers | | $ | 981,978,938 | |
Cost - Sweep Money Fund (Note 3e) | | | 43,920,522 | |
Cost - Repurchase agreements | | | 14,641,776 | |
| | | | |
Total cost of investments | | $ | 1,040,541,236 | |
| | | | |
Value - Unaffiliated issuers | | $ | 1,489,683,115 | |
Value - Sweep Money Fund (Note 3e) | | | 43,920,522 | |
Value - Repurchase agreements | | | 14,641,776 | |
| | | | |
Total value of investments (includes securities loaned in the amount of $14,224,266) | | | 1,548,245,413 | |
Receivables: | | | | |
Investment securities sold | | | 1,476,033 | |
Capital shares sold | | | 179,797 | |
Dividends and interest | | | 1,494,602 | |
Other assets | | | 141 | |
| | | | |
Total assets | | | 1,551,395,986 | |
| | | | |
Liabilities: | | | | |
Payables: | | | | |
Investment securities purchased | | | 161,379 | |
Capital shares redeemed | | | 1,231,588 | |
Management fees | | | 784,556 | |
Distribution fees | | | 621,178 | |
Payable upon return of securities loaned | | | 14,641,776 | |
Accrued expenses and other liabilities | | | 335,497 | |
| | | | |
Total liabilities | | | 17,775,974 | |
| | | | |
Net assets, at value | | $ | 1,533,620,012 | |
| | | | |
Net assets consist of: | | | | |
Paid-in capital | | $ | 812,435,237 | |
Undistributed net investment income | | | 8,474,380 | |
Net unrealized appreciation (depreciation) | | | 507,704,177 | |
Accumulated net realized gain (loss) | | | 205,006,218 | |
| | | | |
Net assets, at value | | $ | 1,533,620,012 | |
| | | | |
| | | | | | |
| | FSV-14 | | | Annual Report | The accompanying notes are an integral part of these financial statements. | | |
FRANKLIN TEMPLETON VARIABLE INSURANCE PRODUCTS TRUST
FINANCIAL STATEMENTS
Statement of Assets and Liabilities (continued)
December 31, 2014
| | | | |
| | | Franklin Small
Cap Value
VIP Fund | |
| |
| Class 1: | | | | |
Net assets, at value | | $ | 57,843,144 | |
| | | | |
Shares outstanding | | | 2,536,210 | |
| | | | |
Net asset value and maximum offering price per share | | $ | 22.81 | |
| | | | |
| |
| Class 2: | | | | |
Net assets, at value | | $ | 1,445,325,278 | |
| | | | |
Shares outstanding | | | 64,742,832 | |
| | | | |
Net asset value and maximum offering price per share | | $ | 22.32 | |
| | | | |
| |
| Class 4: | | | | |
Net assets, at value | | $ | 30,451,590 | |
| | | | |
Shares outstanding | | | 1,345,369 | |
| | | | |
Net asset value and maximum offering price per share | | $ | 22.63 | |
| | | | |
| | | | | | |
| | | The accompanying notes are an integral part of these financial statements. | Annual Report | | | FSV-15 | |
FRANKLIN TEMPLETON VARIABLE INSURANCE PRODUCTS TRUST
FINANCIAL STATEMENTS
Statement of Operations
for the year ended December 31, 2014
| | | | |
| | | Franklin Small
Cap Value
VIP Fund | |
Investment income: | | | | |
Dividends | | $ | 22,275,512 | |
Interest | | | 56,037 | |
Income from securities loaned | | | 854,179 | |
| | | | |
Total investment income | | | 23,185,728 | |
| | | | |
Expenses: | | | | |
Management fees (Note 3a) | | | 9,088,117 | |
Administrative fees (Note 3b) | | | 596,175 | |
Distribution fees: (Note 3c) | | | | |
Class 2 | | | 3,773,855 | |
Class 4 | | | 112,514 | |
Custodian fees (Note 4) | | | 17,703 | |
Reports to shareholders | | | 383,800 | |
Professional fees | | | 55,193 | |
Trustees’ fees and expenses | | | 6,472 | |
Other | | | 25,168 | |
| | | | |
Total expenses | | | 14,058,997 | |
Expense reductions (Note 4) | | | (178 | ) |
Expenses waived/paid by affiliates (Note 3e) | | | (40,012 | ) |
| | | | |
Net expenses | | | 14,018,807 | |
| | | | |
Net investment income | | | 9,166,921 | |
| | | | |
Realized and unrealized gains (losses): | | | | |
Net realized gain (loss) from: | | | | |
Investments | | | 205,096,961 | |
Foreign currency transactions | | | (126,767 | ) |
| | | | |
Net realized gain (loss) | | | 204,970,194 | |
| | | | |
Net change in unrealized appreciation (depreciation) on investments | | | (206,772,254 | ) |
| | | | |
Net realized and unrealized gain (loss) | | | (1,802,060 | ) |
| | | | |
Net increase (decrease) in net assets resulting from operations | | $ | 7,364,861 | |
| | | | |
| | | | | | |
| | FSV-16 | | | Annual Report | The accompanying notes are an integral part of these financial statements. | | |
FRANKLIN TEMPLETON VARIABLE INSURANCE PRODUCTS TRUST
FINANCIAL STATEMENTS
Statements of Changes in Net Assets
| | | | | | | | |
| | | Franklin Small Cap Value VIP Fund | |
| | | Year Ended December 31, | |
| | | 2014 | | | 2013 | |
Increase (decrease) in net assets: | | | | | | | | |
Operations: | | | | | | | | |
Net investment income | | $ | 9,166,921 | | | $ | 10,009,153 | |
Net realized gain (loss) from investments and foreign currency transactions | | | 204,970,194 | | | | 119,472,862 | |
Net change in unrealized appreciation (depreciation) on investments | | | (206,772,254 | ) | | | 344,133,096 | |
| | | | |
Net increase (decrease) in net assets resulting from operations | | | 7,364,861 | | | | 473,615,111 | |
| | | | |
Distributions to shareholders from: | | | | | | | | |
Net investment income: | | | | | | | | |
Class 1 | | | (493,372 | ) | | | (615,112 | ) |
Class 2 | | | (9,349,846 | ) | | | (18,772,536 | ) |
Class 4 | | | (160,210 | ) | | | (406,547 | ) |
Net realized gains: | | | | | | | | |
Class 1 | | | (4,292,308 | ) | | | (681,161 | ) |
Class 2 | | | (112,743,662 | ) | | | (24,226,581 | ) |
Class 4 | | | (2,435,910 | ) | | | (585,151 | ) |
| | | | |
Total distributions to shareholders | | | (129,475,308 | ) | | | (45,287,088 | ) |
| | | | |
Capital share transactions: (Note 2) | | | | | | | | |
Class 1 | | | (206,770 | ) | | | 7,328,882 | |
Class 2 | | | (46,032,420 | ) | | | (83,608,654 | ) |
Class 4 | | | (3,176,134 | ) | | | (6,031,999 | ) |
| | | | |
Total capital share transactions | | | (49,415,324 | ) | | | (82,311,771 | ) |
| | | | |
Net increase (decrease) in net assets | | | (171,525,771 | ) | | | 346,016,252 | |
Net assets: | | | | | | | | |
Beginning of year | | | 1,705,145,783 | | | | 1,359,129,531 | |
| | | | |
End of year | | $ | 1,533,620,012 | | | $ | 1,705,145,783 | |
| | | | |
Undistributed net investment income included in net assets: | | | | | | | | |
End of year | | $ | 8,474,380 | | | $ | 9,437,652 | |
| | | | |
| | | | | | |
| | | The accompanying notes are an integral part of these financial statements. | Annual Report | | | FSV-17 | |
FRANKLIN TEMPLETON VARIABLE INSURANCE PRODUCTS TRUST
Notes to Financial Statements
Franklin Small Cap Value VIP Fund
1. Organization and Significant Accounting Policies
Franklin Templeton Variable Insurance Products Trust (Trust) is registered under the Investment Company Act of 1940, as amended, (1940 Act) as an open-end management investment company, consisting of nineteen separate funds and applies the specialized accounting and reporting guidance in U.S. Generally Accepted Accounting Principles (U.S. GAAP). Franklin Small Cap Value VIP Fund (Fund) is included in this report. The financial statements of the remaining funds in the Trust are presented separately. Shares of the Fund are generally sold only to insurance company separate accounts to fund the benefits of variable life insurance policies or variable annuity contracts. The Fund offers three classes of shares: Class 1, Class 2 and Class 4. Each class of shares differs by its distribution fees, voting rights on matters affecting a single class and its exchange privilege.
Effective May 1, 2014, Franklin Small Cap Value Securities Fund was renamed Franklin Small Cap Value VIP Fund.
The following summarizes the Fund’s significant accounting policies.
a. Financial Instrument Valuation
The Fund’s investments in financial instruments are carried at fair value daily. Fair value is the price that would be received to sell an asset or paid to transfer a liability in an orderly transaction between market participants on the measurement date. The Fund calculates the net asset value (NAV) per share at the close of the New York Stock Exchange (NYSE), generally at 4 p.m. Eastern time (NYSE close) on each day the NYSE is open for trading. Under compliance policies and procedures approved by the Trust’s Board of Trustees (the Board), the Fund’s administrator has responsibility for oversight of valuation, including leading the cross-functional Valuation and Liquidity Oversight Committee (VLOC). The VLOC provides administration and oversight of the Fund’s valuation policies and procedures, which are approved annually by the Board. Among other things, these procedures allow the Fund to utilize independent pricing services, quotations from securities and financial instrument dealers, and other market sources to determine fair value.
Equity securities listed on an exchange or on the NASDAQ National Market System are valued at the last quoted sale price or the official closing price of the day, respectively. Foreign equity securities are valued as of the close of trading on the
foreign stock exchange on which the security is primarily traded or as of the NYSE close, whichever is earlier. The value is then converted into its U.S. dollar equivalent at the foreign exchange rate in effect at the NYSE close on the day that the value of the security is determined. Over-the-counter (OTC) securities are valued within the range of the most recent quoted bid and ask prices. Securities that trade in multiple markets or on multiple exchanges are valued according to the broadest and most representative market. Certain equity securities are valued based upon fundamental characteristics or relationships to similar securities. Investments in open-end mutual funds are valued at the closing NAV.
Debt securities generally trade in the OTC market rather than on a securities exchange. The Fund’s pricing services use multiple valuation techniques to determine fair value. In instances where sufficient market activity exists, the pricing services may utilize a market-based approach through which quotes from market makers are used to determine fair value. In instances where sufficient market activity may not exist or is limited, the pricing services also utilize proprietary valuation models which may consider market characteristics such as benchmark yield curves, credit spreads, estimated default rates, anticipated market interest rate volatility, coupon rates, anticipated timing of principal repayments, underlying collateral, and other unique security features in order to estimate the relevant cash flows, which are then discounted to calculate the fair value. Repurchase agreements are valued at cost, which approximates fair value.
The Fund has procedures to determine the fair value of financial instruments for which market prices are not reliable or readily available. Under these procedures, the VLOC convenes on a regular basis to review such financial instruments and considers a number of factors, including significant unobservable valuation inputs, when arriving at fair value. The VLOC primarily employs a market-based approach which may use related or comparable assets or liabilities, recent transactions, market multiples, book values, and other relevant information for the investment to determine the fair value of the investment. An income-based valuation approach may also be used in which the anticipated future cash flows of the investment are discounted to calculate fair value. Discounts may also be applied due to the nature or duration of any restrictions on the disposition of the investments. Due to the inherent uncertainty of valuations of such investments, the fair values may differ significantly from the values that would have been used had an active market existed. The VLOC employs various methods for calibrating
FRANKLIN TEMPLETON VARIABLE INSURANCE PRODUCTS TRUST
NOTES TO FINANCIAL STATEMENTS
Franklin Small Cap Value VIP Fund (continued)
these valuation approaches including a regular review of key inputs and assumptions, transactional back-testing or disposition analysis, and reviews of any related market activity.
Trading in securities on foreign securities stock exchanges and OTC markets may be completed before the daily NYSE close. In addition, trading in certain foreign markets may not take place on every NYSE business day. Occasionally, events occur between the time at which trading in a foreign security is completed and the close of the NYSE that might call into question the reliability of the value of a portfolio security held by the Fund. As a result, differences may arise between the value of the Fund’s portfolio securities as determined at the foreign market close and the latest indications of value at the close of the NYSE. In order to minimize the potential for these differences, the VLOC monitors price movements following the close of trading in foreign stock markets through a series of country specific market proxies (such as baskets of American Depositary Receipts, futures contracts and exchange traded funds). These price movements are measured against established trigger thresholds for each specific market proxy to assist in determining if an event has occurred that may call into question the reliability of the values of the foreign securities held by the Fund. If such an event occurs, the securities may be valued using fair value procedures, which may include the use of independent pricing services.
Also, when the last day of the reporting period is a non-business day, certain foreign markets may be open on those days that the NYSE is closed, which could result in differences between the value of the Fund’s portfolio securities on the last business day and the last calendar day of the reporting period. Any significant security valuation changes due to an open foreign market are adjusted and reflected by the Fund for financial reporting purposes.
b. Foreign Currency Translation
Portfolio securities and other assets and liabilities denominated in foreign currencies are translated into U.S. dollars based on the exchange rate of such currencies against U.S. dollars on the date of valuation. The Fund may enter into foreign currency exchange contracts to facilitate transactions denominated in a foreign currency. Purchases and sales of securities, income and expense items denominated in foreign currencies are translated into U.S. dollars at the exchange rate in effect on the transaction date. Portfolio securities and assets and liabilities denominated
in foreign currencies contain risks that those currencies will decline in value relative to the U.S. dollar. Occasionally, events may impact the availability or reliability of foreign exchange rates used to convert the U.S. dollar equivalent value. If such an event occurs, the foreign exchange rate will be valued at fair value using procedures established and approved by the Board.
The Fund does not separately report the effect of changes in foreign exchange rates from changes in market prices on securities held. Such changes are included in net realized and unrealized gain or loss from investments on the Statement of Operations.
Realized foreign exchange gains or losses arise from sales of foreign currencies, currency gains or losses realized between the trade and settlement dates on securities transactions and the difference between the recorded amounts of dividends, interest, and foreign withholding taxes and the U.S. dollar equivalent of the amounts actually received or paid. Net unrealized foreign exchange gains and losses arise from changes in foreign exchange rates on foreign denominated assets and liabilities other than investments in securities held at the end of the reporting period.
c. Joint Repurchase Agreement
The Fund enters into a joint repurchase agreement whereby its uninvested cash balance is deposited into a joint cash account with other funds managed by the investment manager or an affiliate of the investment manager and is used to invest in one or more repurchase agreements. The value and face amount of the joint repurchase agreement are allocated to the funds based on their pro-rata interest. A repurchase agreement is accounted for as a loan by the Fund to the seller, collateralized by securities which are delivered to the Fund’s custodian. The fair value, including accrued interest, of the initial collateralization is required to be at least 102% of the dollar amount invested by the funds, with the value of the underlying securities marked to market daily to maintain coverage of at least 100%. Repurchase agreements are subject to the terms of Master Repurchase Agreements (MRAs) with approved counterparties (sellers). The MRAs contain various provisions, including but not limited to events of default and maintenance of collateral for repurchase agreements. In the event of default by either the seller or the Fund, certain MRAs may permit the non-defaulting party to net and close-out all transactions, if any, traded under such agreements. The Fund may sell securities it holds as collateral and apply the proceeds towards the repurchase price and any other amounts owed by the seller to the Fund in the event of default
FRANKLIN TEMPLETON VARIABLE INSURANCE PRODUCTS TRUST
NOTES TO FINANCIAL STATEMENTS
Franklin Small Cap Value VIP Fund (continued)
1. Organization and Significant Accounting Policies (continued)
c. Joint Repurchase Agreement (continued)
by the seller. This could involve costs or delays in addition to a loss on the securities if their value falls below the repurchase price owed by the seller. The joint repurchase agreement held by the Fund at year end, as indicated in the Statement of Investments, had been entered into on December 31, 2014.
d. Securities Lending
The Fund participates in an agency based securities lending program. The Fund receives cash collateral against the loaned securities in an amount equal to at least 102% of the fair value of the loaned securities. Collateral is maintained over the life of the loan in an amount not less than 100% of the fair value of loaned securities, as determined at the close of fund business each day; any additional collateral required due to changes in security values is delivered to the Fund on the next business day. The collateral is invested in joint repurchase agreements as indicated on the Statement of Investments. The Fund receives income from the investment of cash collateral, in addition to lending fees and rebates paid by the borrower. The Fund bears the market risk with respect to the collateral investment, securities loaned, and the risk that the agent may default on its obligations to the Fund. The securities lending agent has agreed to indemnify the Fund in the event of default by a third party borrower.
e. Income and Deferred Taxes
It is the Fund’s policy to qualify as a regulated investment company under the Internal Revenue Code. The Fund intends to distribute to shareholders substantially all of its taxable income and net realized gains to relieve it from federal income and if applicable, excise taxes. As a result, no provision for U.S. federal income taxes is required.
The Fund may be subject to foreign taxation related to income received, capital gains on the sale of securities and certain foreign currency transactions in the foreign jurisdictions in which it invests. Foreign taxes, if any, are recorded based on the tax regulations and rates that exist in the foreign markets in which the Fund invests. When a capital gain tax is determined to apply the Fund records an estimated deferred tax liability in an amount that would be payable if the securities were disposed of on the valuation date.
The Fund recognizes the tax benefits of uncertain tax positions only when the position is “more likely than not” to be sustained
upon examination by the tax authorities based on the technical merits of the tax position. As of December 31, 2014, and for all open tax years, the Fund has determined that no liability for unrecognized tax benefits is required in the Fund’s financial statements related to uncertain tax positions taken on a tax return (or expected to be taken on future tax returns). Open tax years are those that remain subject to examination and are based on each tax jurisdiction statute of limitation.
f. Security Transactions, Investment Income, Expenses and Distributions
Security transactions are accounted for on trade date. Realized gains and losses on security transactions are determined on a specific identification basis. Interest income and estimated expenses are accrued daily. Amortization of premium and accretion of discount on debt securities are included in interest income. Dividend income recorded on the ex-dividend date except for certain foreign securities where the dividend rate is not available. In such cases, the dividend is recorded as soon as the information is received by the Fund. Distributions to shareholders are recorded on the ex-dividend date and are determined according to income tax regulations (tax basis). Distributable earnings determined on a tax basis may differ from earnings recorded in accordance with U.S. GAAP. These differences may be permanent or temporary. Permanent differences are reclassified among capital accounts to reflect their tax character. These reclassifications have no impact on net assets or the results of operations. Temporary differences are not reclassified, as they may reverse in subsequent periods.
Common expenses incurred by the Trust are allocated among the funds based on the ratio of net assets of each fund to the combined net assets of the Trust. Fund specific expenses are charged directly to the fund that incurred the expense.
Realized and unrealized gains and losses and net investment income, not including class specific expenses, are allocated daily to each class of shares based upon the relative proportion of net assets of each class. Differences in per share distributions, by class, are generally due to differences in class specific expenses.
g. Accounting Estimates
The preparation of financial statements in accordance with U.S. GAAP requires management to make estimates and assumptions that affect the reported amounts of assets and liabilities at the date of the financial statements and the amounts of income and expenses during the reporting period. Actual results could differ from those estimates.
FRANKLIN TEMPLETON VARIABLE INSURANCE PRODUCTS TRUST
NOTES TO FINANCIAL STATEMENTS
Franklin Small Cap Value VIP Fund (continued)
h. Guarantees and Indemnifications
Under the Trust’s organizational documents, its officers and trustees are indemnified by the Trust against certain liabilities arising out of the performance of their duties to the Trust. Additionally, in the normal course of business, the Trust, on behalf of the Fund, enters into contracts with service providers that contain general indemnification clauses. The Trust’s maximum exposure under these arrangements is unknown as this would involve future claims that may be made against the Trust that have not yet occurred. Currently, the Trust expects the risk of loss to be remote.
2. Shares of Beneficial Interest
At December 31, 2014, there were an unlimited number of shares authorized (without par value). Transactions in the Fund’s shares were as follows:
| | | | | | | | | | | | | | | | | | |
| | | Year Ended December 31, | |
| | | 2014 | | | | | 2013 | |
| | | Shares | | | Amount | | | | | Shares | | | Amount | |
| | | | | |
| Class 1 Shares: | | | | | | | | | | | | | | | | | | |
Shares sold | | | 175,851 | | | $ | 4,068,553 | | | | | | 854,519 | | | $ | 17,437,814 | |
Shares issued in reinvestment of distributions | | | 206,102 | | | | 4,785,680 | | | | | | 64,172 | | | | 1,296,273 | |
Shares redeemed | | | (388,575 | ) | | | (9,061,003 | ) | | | | | (536,406 | ) | | | (11,405,205 | ) |
| | | | |
Net increase (decrease) | | | (6,622 | ) | | $ | (206,770 | ) | | | | | 382,285 | | | $ | 7,328,882 | |
| | | | |
| Class 2 Shares: | | | | | | | | | | | | | | | | | | |
Shares sold | | | 5,020,152 | | | $ | 113,569,546 | | | | | | 6,730,565 | | | $ | 138,529,743 | |
Shares issued in reinvestment of distributions | | | 5,364,390 | | | | 122,093,507 | | | | | | 2,167,294 | | | | 42,999,117 | |
Shares redeemed | | | (12,408,353 | ) | | | (281,695,473 | ) | | | | | (12,704,970 | ) | | | (265,137,514 | ) |
| | | | |
Net increase (decrease) | | | (2,023,811 | ) | | $ | (46,032,420 | ) | | | | | (3,807,111 | ) | | $ | (83,608,654 | ) |
| | | | |
| Class 4 Shares: | | | | | | | | | | | | | | | | | | |
Shares sold | | | 176,245 | | | $ | 3,946,345 | | | | | | 205,689 | | | $ | 4,293,023 | |
Shares issued on reinvestment of distributions | | | 112,435 | | | | 2,596,120 | | | | | | 49,338 | | | | 991,698 | |
Shares redeemed | | | (418,040 | ) | | | (9,718,599 | ) | | | | | (538,222 | ) | | | (11,316,720 | ) |
| | | | |
Net increase (decrease) | | | (129,360 | ) | | $ | (3,176,134 | ) | | | | | (283,195 | ) | | $ | (6,031,999 | ) |
| | | | |
3. Transactions With Affiliates
Franklin Resources, Inc. is the holding company for various subsidiaries that together are referred to as Franklin Templeton Investments. Certain officers and trustees of the Fund are also officers and/or directors of the following subsidiaries:
| | |
| Subsidiary | | Affiliation |
Franklin Advisory Services, LLC (Advisory Services) | | Investment manager |
Franklin Templeton Services, LLC (FT Services) | | Administrative manager |
Franklin Templeton Distributors, Inc. (Distributors) | | Principal underwriter |
Franklin Templeton Investor Services, LLC (Investor Services) | | Transfer agent |
FRANKLIN TEMPLETON VARIABLE INSURANCE PRODUCTS TRUST
NOTES TO FINANCIAL STATEMENTS
Franklin Small Cap Value VIP Fund (continued)
3. Transactions With Affiliates (continued)
a. Management Fees
The Fund pays an investment management fee to Advisory Services based on the average daily net assets of the Fund as follows:
| | |
| Annualized Fee Rate | | Net Assets |
0.750% | | Up to and including $200 million |
0.635% | | Over $200 million, up to and including $700 million |
0.600% | | Over $700 million, up to and including $1.2 billion |
0.575% | | Over $1.2 billion, up to and including $1.3 billion |
0.475% | | In excess of $1.3 billion |
Effective May 1, 2014, the Fund combined its investment management and administration agreements as approved by the Board. The fees paid under the combined agreement do not exceed the aggregate fees that were paid under the separate agreements.
Prior to May 1, 2014, the Fund paid fees to Advisory Services based on the average daily net assets of the Fund as follows:
| | |
| Annualized Fee Rate | | Net Assets |
0.600% | | Up to and including $200 million |
0.500% | | Over $200 million, up to and including $1.3 billion |
0.400% | | In excess of $1.3 billion |
b. Administrative Fees
Effective May 1, 2014, under an agreement with Advisory Services, FT Services provides administrative services to the Fund. The fee is paid by Advisory Services based on the Fund’s average daily net assets, and is not an additional expense of the Fund.
Prior to May 1, 2014, the Fund paid administrative fees to FT Services of based on the average daily net assets of the Fund as follows:
| | |
| Annualized Fee Rate | | Net Assets |
0.150% | | Up to and including $200 million |
0.135% | | Over $200 million, up to and including $700 million |
0.100% | | Over $700 million, up to and including $1.2 billion |
0.075% | | In excess of $1.2 billion |
c. Distribution Fees
The Board has adopted distribution plans for Class 2 and Class 4 shares pursuant to Rule 12b-1 under the 1940 Act. Under the Fund’s compensation distribution plans, the Fund pays Distributors for costs incurred in connection with the servicing, sale and distribution of the Fund’s shares up to 0.35% per year of its average daily net assets of each class. Some distribution fees are not charged on shares held by affiliates. The Board has agreed to limit the current rate to 0.25% per year for Class 2. The plan year, for purposes of monitoring compliance with the maximum annual plan rates, is February 1 through January 31.
d. Transfer Agent Fees
Investor Services, under terms of an agreement, performs shareholder servicing for the Fund and is not paid by the Fund for the services.
FRANKLIN TEMPLETON VARIABLE INSURANCE PRODUCTS TRUST
NOTES TO FINANCIAL STATEMENTS
Franklin Small Cap Value VIP Fund (continued)
e. Investments in Institutional Fiduciary Trust Money Market Portfolio
The Fund invests in Institutional Fiduciary Trust Money Market Portfolio (Sweep Money Fund), an affiliated open-end management investment company. Management fees paid by the Fund are waived on assets invested in the Sweep Money Fund, as noted on the Statement of Operations, in an amount not to exceed the management and administrative fees paid directly or indirectly by the Sweep Money Fund. Prior to January 1, 2014, the waiver was accounted for as a reduction to management fees.
4. Expense Offset Arrangement
The Fund has entered into an arrangement with its custodian whereby credits realized as a result of uninvested cash balances are used to reduce a portion of the Fund’s custodian expenses. During the year ended December 31, 2014, the custodian fees were reduced as noted in the Statement of Operations.
5. Income Taxes
The tax character of distributions paid during the years ended December 31, 2014 and 2013, was as follows:
| | | | | | | | |
| | | 2014 | | | 2013 | |
Distributions paid from: | | | | | | | | |
Ordinary income | | $ | 16,187,412 | | | $ | 19,794,195 | |
Long term capital gain | | | 113,287,896 | | | | 25,492,893 | |
| | | | |
| | $ | 129,475,308 | | | $ | 45,287,088 | |
| | | | |
At December 31, 2014, the cost of investments, net unrealized appreciation (depreciation), undistributed ordinary income and undistributed long term capital gains for income tax purposes were as follows:
| | | | |
Cost of investments | | $ | 1,041,186,367 | |
| | | | |
Unrealized appreciation | | $ | 543,172,981 | |
Unrealized depreciation | | | (36,113,935 | ) |
| | | | |
Net unrealized appreciation (depreciation) | | $ | 507,059,046 | |
| | | | |
Undistributed ordinary income | | $ | 11,864,222 | |
Undistributed long term capital gains | | | 202,261,508 | |
| | | | |
Distributable earnings | | $ | 214,125,730 | |
| | | | |
Differences between income and/or capital gains as determined on a book basis and a tax basis are primarily due to differing treatment of passive foreign investment company shares.
6. Investment Transactions
Purchases and sales of investments (excluding short term securities) for the year ended December 31, 2014, aggregated $302,369,904 and $449,603,046 respectively.
7. Credit Facility
The Fund, together with other U.S. registered and foreign investment funds (collectively, Borrowers), managed by Franklin Templeton Investments, are borrowers in a joint syndicated senior unsecured credit facility totaling $1.5 billion (Global Credit Facility) which matured on February 13, 2015. This Global Credit Facility provides a source of funds to the Borrowers for temporary and emergency purposes, including the ability to meet future unanticipated or unusually large redemption requests. The Borrowers expect to renew the Global Credit Facility for a total of $2 billion effective February 13, 2015, which matures on February 12, 2016.
FRANKLIN TEMPLETON VARIABLE INSURANCE PRODUCTS TRUST
NOTES TO FINANCIAL STATEMENTS
Franklin Small Cap Value VIP Fund (continued)
7. Credit Facility (continued)
Under the terms of the Global Credit Facility, the Fund shall, in addition to interest charged on any borrowings made by the Fund and other costs incurred by the Fund, pay its share of fees and expenses incurred in connection with the implementation and maintenance of the Global Credit Facility, based upon its relative share of the aggregate net assets of all of the Borrowers, including an annual commitment fee of 0.07% based upon the unused portion of the Global Credit Facility. These fees are reflected in other expenses on the Statement of Operations. During the year ended December 31, 2014, the Fund did not use the Global Credit Facility.
8. Fair Value Measurements
The Fund follows a fair value hierarchy that distinguishes between market data obtained from independent sources (observable inputs) and the Fund’s own market assumptions (unobservable inputs). These inputs are used in determining the value of the Fund’s financial instruments and are summarized in the following fair value hierarchy:
| | • | | Level 1 – quoted prices in active markets for identical financial instruments |
| | • | | Level 2 – other significant observable inputs (including quoted prices for similar financial instruments, interest rates, prepayment speed, credit risk, etc.) |
| | • | | Level 3 – significant unobservable inputs (including the Fund’s own assumptions in determining the fair value of financial instruments) |
The input levels are not necessarily an indication of the risk or liquidity associated with financial instruments at that level.
For movements between the levels within the fair value hierarchy, the Fund has adopted a policy of recognizing the transfers as of the date of the underlying event which caused the movement.
A summary of inputs used as of December 31, 2014, in valuing the Fund’s assets carried at fair value, is as follows:
| | | | | | | | | | | | | | | | |
| | | Level 1 | | | Level 2 | | | Level 3 | | | Total | |
| | | | |
| Assets: | | | | | | | | | | | | | | | | |
Investments in Securities: | | | | | | | | | | | | | | | | |
Equity Investmentsa | | $ | 1,482,533,515 | | | $ | — | | | $ | — | | | $ | 1,482,533,515 | |
Corporate Bonds | | | — | | | | 7,149,600 | | | | — | | | | 7,149,600 | |
Short Term Investments | | | 43,920,522 | | | | 14,641,776 | | | | — | | | | 58,562,298 | |
| | | | |
Total Investments in Securities | | $ | 1,526,454,037 | | | $ | 21,791,376 | | | $ | — | | | $ | 1,548,245,413 | |
| | | | |
aFor detailed categories, see the accompanying Statement of Investments.
9. New Accounting Pronouncements
In June 2014, the Financial Accounting Standards Board issued Accounting Standards Update (ASU) No. 2014-11, Transfers and Servicing (Topic 860), Repurchase-to-Maturity Transactions, Repurchase Financings, and Disclosures. The ASU changes the accounting for certain repurchase agreements and expands disclosure requirements related to repurchase agreements, securities lending, repurchase-to-maturity and similar transactions. The ASU is effective for interim and annual reporting periods beginning after December 15, 2014. Management has reviewed the requirements and believes the adoption of this ASU will not have a material impact on the financial statements.
10. Subsequent Events
The Fund has evaluated subsequent events through the issuance of the financial statements and determined that no events have occurred that require disclosure other than those already disclosed in the financial statements.
FRANKLIN TEMPLETON VARIABLE INSURANCE PRODUCTS TRUST
Report of Independent Registered Public Accounting Firm
Franklin Small Cap Value VIP Fund
To the Board of Trustees and Shareholders of Franklin Templeton Variable Insurance Products Trust
In our opinion, the accompanying statement of assets and liabilities, including the statement of investments, and the related statements of operations and of changes in net assets and the financial highlights present fairly, in all material respects, the financial position of Franklin Small Cap Value VIP Fund (the “Fund”) at December 31, 2014, the results of its operations for the year then ended, the changes in its net assets for each of the two years in the period then ended and the financial highlights for each of the five years in the period then ended, in conformity with accounting principles generally accepted in the United States of America. These financial statements and financial highlights (hereafter referred to as “financial statements”) are the responsibility of the Fund’s management. Our responsibility is to express an opinion on these financial statements based on our audits. We conducted our audits of these financial statements in accordance with the standards of the Public Company Accounting Oversight Board (United States). Those standards require that we plan and perform the audit to obtain reasonable assurance about whether the financial statements are free of material misstatement. An audit includes examining, on a test basis, evidence supporting the amounts and disclosures in the financial statements, assessing the accounting principles used and significant estimates made by management, and evaluating the overall financial statement presentation. We believe that our audits, which included confirmation of securities at December 31, 2014 by correspondence with the custodian, transfer agent and brokers, provides a reasonable basis for our opinion.
PricewaterhouseCoopers LLP
San Francisco, California
February 13, 2015
FRANKLIN TEMPLETON VARIABLE INSURANCE PRODUCTS TRUST
Tax Information (unaudited)
Franklin Small Cap Value VIP Fund
Under Section 852(b)(3)(C) of the Internal Revenue Code (Code), the Fund hereby reports the maximum amount allowable but no less than $113,287,896 as a long term capital gain dividend for the fiscal year ended December 31, 2014.
Under Section 854(b)(1)(A) of the Code, the Fund hereby reports 100% of the ordinary income dividends as income qualifying for the dividends received deduction for the fiscal year ended December 31, 2014.
Franklin Small-Mid Cap Growth VIP Fund
(Formerly, Franklin Small-Mid Cap Growth Securities Fund)
This annual report for Franklin Small-Mid Cap Growth VIP Fund covers the fiscal year ended December 31, 2014.
Class 2 Performance Summary as of December 31, 2014
Average annual total return of Class 2 shares* represents the average annual change in value, assuming reinvestment of dividends and capital gains. Average returns smooth out variations in returns, which can be significant; they are not the same as year-by-year results.
| | | | | | | | | | | | |
| Periods ended 12/31/14 | | 1-Year | | | 5-Year | | | 10-Year | |
Average Annual Total Return | | | +7.47% | | | | +14.86% | | | | +7.66% | |
*The Fund has a fee waiver associated with its investments in a Franklin Templeton money fund, contractually guaranteed through at least its current fiscal year-end. Fund investment results reflect the fee waiver, to the extent applicable; without this reduction, the results would have been lower.
Performance reflects the Fund’s Class 2 operating expenses, but does not include any contract fees, expenses or sales charges. If they had been included, performance would be lower. These charges and deductions, particularly for variable life policies, can have a significant effect on contract values and insurance benefits. See the contract prospectus for a complete description of these expenses, including sales charges.
Performance data represent past performance, which does not guarantee future results. Investment return and principal value will fluctuate, and you may have a gain or loss when you sell your shares. Current performance may differ from figures shown.
Total Return Index Comparison for a Hypothetical $10,000 Investment (1/1/05–12/31/14)
The graph below shows the change in value of a hypothetical $10,000 investment in the Fund over the indicated period and includes reinvestment of any income or distributions. The Fund’s performance* is compared to the performance of the Russell Midcap® Growth Index and the Standard & Poor’s® 500 Index (S&P 500®). One cannot invest directly in an index, and an index is not representative of the Fund’s portfolio. Please see Important Notes to Performance Information preceding the Fund Summaries.
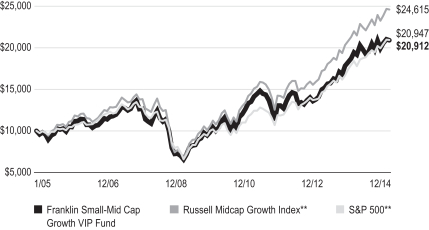
**Source: Morningstar. Please see Index Descriptions following the Fund Summaries.
FRANKLIN SMALL-MID CAP GROWTH VIP FUND
Fund Goal and Main Investments
Franklin Small-Mid Cap Growth VIP Fund seeks long-term capital growth. Under normal market conditions, the Fund invests at least 80% of its net assets in equity securities of small capitalization and mid-capitalization companies. For this Fund, small cap companies are those within the market capitalization range of companies in the Russell 2500TM Index at the time of purchase, and midcap companies are those within the market capitalization range of companies in the Russell Midcap® Index at the time of purchase.1
Fund Risks
All investments involve risks, including possible loss of principal. Growth stock prices reflect projections of future earnings or revenues, and can, therefore, fall dramatically if the company fails to meet those projections. Smaller, midsized or relatively new or unseasoned companies can be particularly sensitive to changing economic conditions, and their prospects for growth are less certain than those of larger, more established companies. Historically, these securities have experienced more price volatility than larger company stocks, especially over the short term. To the extent the Fund focuses on particular countries, regions, industries, sectors or types of investment from time to time, it may be subject to greater risk of adverse developments in such areas of focus than a fund that invests in a wider variety of countries, regions, industries, sectors or investments. From time to time, the trading market for a particular security or type of security in which the Fund invests may become less liquid or even illiquid. The Fund is actively managed but there is no guarantee that the manager’s investment decisions will produce the desired results. The Fund’s prospectus also includes a description of the main investment risks.
Performance Overview
You can find the Fund’s one-year total return in the Performance Summary. In comparison, the Fund’s narrow benchmark, the Russell Midcap® Growth Index, generated a total return of +11.90%, and its broad benchmark, the S&P 500, produced a +13.69% total return for the same period.2
Economic and Market Overview
The U.S. economy continued to grow during the year ended December 31, 2014, underpinned in some quarters by manufacturing activity, consumer and business spending, and
federal defense spending. Home sales experienced some weakness resulting from reduced inventory, higher mortgage rates and tight credit requirements but began to recover in May as mortgage rates declined. Home prices stayed higher than a year earlier. Retail sales generally improved, supported by job growth and lower gasoline prices in the latter part of 2014. The unemployment rate declined to 5.6% in December 2014 from 6.7% in December 2013.3 Inflation, as measured by the Consumer Price Index, remained low.
In January 2014, the U.S. Federal Reserve Board (Fed) began reducing its large-scale bond purchases $10 billion a month and ended the buying program in October. But it continued its practice of maintaining holdings of longer term securities at sizable levels. The Fed believed underlying economic strength could support ongoing progress in labor market conditions. The Fed also noted that although inflation might remain low in the near term, the likelihood of inflation running persistently below 2% had diminished. Toward period-end, the Fed stated that it could be patient with regard to raising interest rates and that the interest rate might not rise for at least a couple of meetings, possibly implying at least the first two meetings of 2015.
Investor confidence grew during the period as corporate profits rose and the economy generally strengthened. The market endured sell-offs when many investors reacted to political instability in certain emerging markets, crises in Ukraine and the Middle East, weakness in Europe and Japan, and moderating economic data in China. U.S. stocks rose overall for the 12 months under review as the S&P 500 and Dow Jones Industrial Average reached all-time highs.1
Investment Strategy
We use fundamental, bottom-up research to seek companies meeting our criteria of growth potential, quality and valuation. In seeking sustainable growth characteristics, we look for companies we believe can produce sustainable earnings and cash flow growth, evaluating the long-term market opportunity and competitive structure of an industry to target leaders and emerging leaders. We define quality companies as those with strong and improving competitive positions in attractive markets. We also believe important attributes of quality are experienced and talented management teams as well as financial strength reflected in the capital structure, gross and operating margins, free cash flow generation and returns on capital employed. Our valuation analysis includes a range of potential
1. Please see Index Descriptions following the Fund Summaries.
2. Source: Morningstar.
One cannot invest directly in an index, and an index is not representative of the Fund’s portfolio. Please see Index Descriptions following the Fund Summaries.
3. Source: Bureau of Labor Statistics.
FRANKLIN SMALL-MID CAP GROWTH VIP FUND
outcomes based on an assessment of multiple scenarios. In assessing value, we consider whether security prices fully reflect the balance of the sustainable growth opportunities relative to business and financial risks.
Manager’s Discussion
Most sectors represented in the Fund’s portfolio delivered positive returns and contributed to absolute performance during the 12 months under review. Relative to the Russell Midcap® Growth Index, key contributors included stock selection in information technology (IT) and an overweighting in health care.
In the IT sector, top contributors included our off-benchmark investment in Netherlands-based, integrated circuit manufacturer NXP Semiconductors and position in Singapore-based, analog semiconductor devices manufacturer Avago Technologies. NXP Semiconductors generated better-than-expected earnings, driven by product revenue growth and cost control. Additionally, NXP benefited from company-specific product cycles and strong demand trends from certain customers and expected to experience seasonality in certain business segments. Avago Technologies acquired storage and networking semiconductor developer LSI in May 2014 to position itself as a diversified semiconductor market leader. The combined businesses helped Avago significantly increase its revenues, driven by the wireless communications and enterprise storage segments, and deliver stronger-than-expected fiscal-year 2014 revenues and earnings.
Among the Fund’s health care holdings, our position in hospitals and health care facilities operator HCA Holdings and off-benchmark investment in medical technology company CareFusion aided relative results. HCA benefited from health care reform and an increase in hospital admissions, which helped it deliver better-than-expected results. The company’s higher full-year 2014 earnings guidance and share repurchase program also supported its stock performance. CareFusion’s share price surged after medical equipment supplier Becton, Dickinson & Co. announced an agreement to acquire the company to improve its role in providing drug management and patient safety services to hospitals. We closed our position after the acquisition announcement.
Other notable individual contributors included positions in athletic apparel and footwear manufacturer Under Armour and discount airline operator Spirit Airlines. Under Armour reported solid quarterly revenues and raised guidance for full year 2014
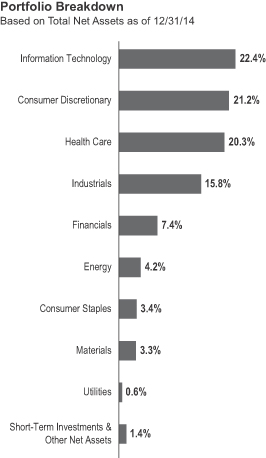
as footwear demand and international sales gained momentum. Spirit Airlines continued to report stronger-than-expected earnings results, supported by flight volume growth and improved operational performance. Also supporting its stock price were a share repurchase program, falling crude oil prices and an award for fuel efficiency.
In contrast, key detractors from the Fund’s relative performance included stock selection in the consumer discretionary and industrials sectors.
Among the Fund’s consumer discretionary holdings, notable detractors included our off-benchmark investment in Wolverine World Wide, a designer and manufacturer of branded footwear, apparel and accessories, as well as positions in GNC Holdings, a specialty retailer of health and wellness products, and Dick’s Sporting Goods, a sports and fitness retailer. Wolverine World Wide’s share price fell in January 2014 after the company said it expected international efforts for newly acquired brands to
FRANKLIN SMALL-MID CAP GROWTH VIP FUND
| | | | |
| Top 10 Holdings | | | |
| 12/31/14 | | | |
Company
Sector/Industry | | % of Total
Net Assets | |
NXP Semiconductors NV (Netherlands)
Information Technology | | | 1.5% | |
AMETEK Inc.
Industrials | | | 1.4% | |
Affiliated Managers Group Inc.
Financials | | | 1.4% | |
HCA Holdings Inc.
Health Care | | | 1.4% | |
Perrigo Co. PLC
Health Care | | | 1.3% | |
Intercontinental Exchange Inc.
Financials | | | 1.3% | |
Jarden Corp.
Consumer Discretionary | | | 1.3% | |
Robert Half International Inc.
Industrials | | | 1.2% | |
Signature Bank
Financials | | | 1.2% | |
Chipotle Mexican Grill Inc.
Consumer Discretionary | | | 1.2% | |
The dollar value, number of shares or principal amount, and names of all portfolio holdings are listed in the Fund’s Statement of Investments.
begin showing results only in the latter half of the year. Shares began to recover in 2014’s second half after the company improved its earnings and unveiled a plan to close approximately 140 stores in 2014 and 2015 to optimize its operations. GNC’s shares suffered in the first half of 2014, and we closed our position in the company. Dick’s Sporting Goods’ share price declined after the company reported weakness in its golf and hunting businesses. However, the company reported better results later in the year aided by its golf business restructuring and strong results from other categories, particularly women’s and youth apparel.
In the industrials sector, key detractors included our position in Flowserve, a provider of flow control products and services for the global infrastructure markets. Although Flowserve delivered healthy earnings in the first half of the year, its revenues declined in the third quarter, resulting largely from project delays by some customers, unfavorable foreign currency exchange rates and costs related to its divestment of a Russia-focused business.
Key individual detractors included our new, off-benchmark investment in Rex Energy and new position in Concho Resources. These independent oil and gas companies, along with other energy companies, were negatively affected by a sharp decline in crude oil prices in 2014, resulting from excess supply and weak global demand growth.
Thank you for your participation in Franklin Small-Mid Cap Growth VIP Fund. We look forward to serving your future investment needs.
The foregoing information reflects our analysis, opinions and portfolio holdings as of December 31, 2014, the end of the reporting period. The way we implement our main investment strategies and the resulting portfolio holdings may change depending on factors such as market and economic conditions. These opinions may not be relied upon as investment advice or an offer for a particular security. The information is not a complete analysis of every aspect of any market, country, industry, security or the Fund. Statements of fact are from sources considered reliable, but the investment manager makes no representation or warranty as to their completeness or accuracy. Although historical performance is no guarantee of future results, these insights may help you understand our investment management philosophy.
FRANKLIN SMALL-MID CAP GROWTH VIP FUND
Class 2 Fund Expenses
As an investor in a variable insurance contract (Contract) that indirectly provides for investment in an underlying mutual fund, you can incur transaction and/or ongoing expenses at both the Fund level and the Contract level.
| • | | Transaction expenses can include sales charges (loads) on purchases, redemption fees, surrender fees, transfer fees and premium taxes. |
| • | | Ongoing expenses can include management fees, distribution and service (12b-1) fees, contract fees, annual maintenance fees, mortality and expense risk fees and other fees and expenses. All mutual funds and Contracts have some types of ongoing expenses. |
The expenses shown in the table are meant to highlight ongoing expenses at the Fund level only and do not include ongoing expenses at the Contract level, or transaction expenses at either the Fund or Contract level. While the Fund does not have transaction expenses, if the transaction and ongoing expenses at the Contract level were included, the expenses shown below would be higher. You should consult your Contract prospectus or disclosure document for more information.
The table shows Fund-level ongoing expenses and can help you understand these expenses and compare them with those of other mutual funds offered through the Contract. The table assumes a $1,000 investment held for the six months indicated. Please refer to the Fund prospectus for additional information on operating expenses.
Actual Fund Expenses
The first line (Actual) of the table provides actual account values and expenses. The “Ending Account Value” is derived from the Fund’s actual return, which includes the effect of ongoing Fund expenses, but does not include the effect of ongoing Contract expenses.
You can estimate the Fund-level expenses you incurred during the period by following these steps. Of course, your account value and expenses will differ from those in this illustration:
| 1. | Divide your account value by $1,000. |
If an account had an $8,600 value,
then $8,600 ÷ $1,000 = 8.6.
| 2. | Multiply the result by the number under the heading “Fund-Level Expenses Incurred During Period.” |
If Fund-Level Expenses Incurred During Period were $7.50, then 8.6 × $7.50 = $64.50.
In this illustration, the estimated expenses incurred this period at the Fund level are $64.50.
Hypothetical Example for Comparison
with Other Mutual Funds
Information in the second line (Hypothetical) of the table can help you compare ongoing expenses of the Fund with those of other mutual funds offered through the Contract. This information may not be used to estimate the actual ending account balance or expenses you incurred during the period. The hypothetical “Ending Account Value” is based on the Fund’s actual expense ratio and an assumed 5% annual rate of return before expenses, which does not represent the Fund’s actual return. The figure under the heading “Fund-Level Expenses Incurred During Period” shows the hypothetical expenses your account would have incurred under this scenario. You can compare this figure with the 5% hypothetical examples that appear in shareholder reports of other funds offered through a Contract.
| | | | | | | | | | | | |
| Class 2 | | Beginning Account Value 7/1/14 | | | Ending Account Value 12/31/14 | | | Fund-Level Expenses
Incurred During Period* 7/1/14–12/31/14 | |
Actual | | | $1,000 | | | | $1,019.90 | | | | $5.35 | |
Hypothetical (5% return before expenses) | | | $1,000 | | | | $1,019.91 | | | | $5.35 | |
*Expenses are calculated using the most recent six-month annualized expense ratio, net of expense waivers, for the Fund’s Class 2 shares (1.05%), which does not include any ongoing expenses of the Contract for which the Fund is an investment option, multiplied by the average account value over the period, multiplied by 184/365 to reflect the one-half year period.
FRANKLIN TEMPLETON VARIABLE INSURANCE PRODUCTS TRUST
Financial Highlights
Franklin Small-Mid Cap Growth VIP Fund
| | | | | | | | | | | | | | | | | | | | |
| | | Year Ended December 31, | |
| | | 2014 | | | 2013 | | | 2012 | | | 2011 | | | 2010 | |
| Class 1 | | | | | | | | | | | | | | | | | | | | |
Per share operating performance
(for a share outstanding throughout the year) | | | | | | | | | | | | | | | | | | | | |
| | | | | |
Net asset value, beginning of year | | | $28.38 | | | | $21.87 | | | | $21.19 | | | | $22.21 | | | | $17.36 | |
| | | | |
| | | | | |
| Income from investment operationsa: | | | | | | | | | | | | | | | | | | | | |
| | | | | |
Net investment income (loss)b | | | (0.07 | ) | | | (0.09 | ) | | | (0.01 | )c | | | (0.05 | ) | | | (0.01 | ) |
| | | | | |
Net realized and unrealized gains (losses) | | | 2.04 | | | | 8.19 | | | | 2.27 | | | | (0.97 | ) | | | 4.86 | |
| | | | |
Total from investment operations | | | 1.97 | | | | 8.10 | | | | 2.26 | | | | (1.02 | ) | | | 4.85 | |
| | | | |
| | | | | |
| Less distributions from net realized gains | | | (5.40 | ) | | | (1.59 | ) | | | (1.58 | ) | | | — | | | | — | |
| | | | |
Net asset value, end of year | | | $24.95 | | | | $28.38 | | | | $21.87 | | | | $21.19 | | | | $22.21 | |
| | | | |
| | | | | |
Total returnd | | | 7.78% | | | | 38.50% | | | | 11.12% | | | | (4.59)% | | | | 27.94% | |
| | | | | |
| Ratios to average net assets | | | | | | | | | | | | | | | | | | | | |
| | | | | |
Expenses | | | 0.80% | e | | | 0.80% | f | | | 0.80% | | | | 0.79% | | | | 0.79% | |
| | | | | |
Net investment income (loss) | | | (0.29)% | | | | (0.35)% | | | | (0.03)% | c | | | (0.21)% | | | | (0.07)% | |
| | | | | |
| Supplemental data | | | | | | | | | | | | | | | | | | | | |
| | | | | |
Net assets, end of year (000’s) | | | $99,803 | | | | $98,020 | | | | $75,977 | | | | $76,384 | | | | $89,826 | |
| | | | | |
Portfolio turnover rate | | | 48.73% | | | | 42.77% | | | | 41.44% | | | | 45.00% | | | | 46.69% | |
aThe amount shown for a share outstanding throughout the period may not correlate with the Statement of Operations for the period due to the timing of sales and repurchases of the Fund shares in relation to income earned and/or fluctuating fair value of the investments of the Fund.
bBased on average daily shares outstanding.
cNet investment income per share includes approximately $0.03 per share received in the form of special dividends. Excluding these amounts, the ratio of net investment income to average net assets would have been (0.16)%.
dTotal return does not include fees, charges or expenses imposed by the variable annuity and life insurance contracts for which Franklin Templeton Variable Insurance Products Trust serves as an underlying investment vehicle.
eBenefit of waiver and payments by affiliates rounds to less than 0.01%.
fBenefit of expense reduction rounds to less than 0.01%.
| | | | |
| FSC-6 | | Annual Report | The accompanying notes are an integral part of these financial statements. | | |
FRANKLIN TEMPLETON VARIABLE INSURANCE PRODUCTS TRUST
FINANCIAL HIGHLIGHTS
Franklin Small-Mid Cap Growth VIP Fund (continued)
| | | | | | | | | | | | | | | | | | | | |
| | | Year Ended December 31, | |
| | | 2014 | | | 2013 | | | 2012 | | | 2011 | | | 2010 | |
| Class 2 | | | | | | | | | | | | | | | | | | | | |
Per share operating performance
(for a share outstanding throughout the year) | | | | | | | | | | | | | | | | | | | | |
| | | | | |
Net asset value, beginning of year | | | $27.16 | | | | $21.04 | | | | $20.49 | | | | $21.54 | | | | $16.87 | |
| | | | |
| | | | | |
| Income from investment operationsa: | | | | | | | | | | | | | | | | | | | | |
| | | | | |
Net investment income (loss)b | | | (0.13 | ) | | | (0.14 | ) | | | (0.06 | )c | | | (0.10 | ) | | | (0.06 | ) |
| | | | | |
Net realized and unrealized gains (losses) | | | 1.93 | | | | 7.85 | | | | 2.19 | | | | (0.95 | ) | | | 4.73 | |
| | | | |
Total from investment operations | | | 1.80 | | | | 7.71 | | | | 2.13 | | | | (1.05 | ) | | | 4.67 | |
| | | | |
Less distributions from net realized gains | | | (5.40 | ) | | | (1.59 | ) | | | (1.58 | ) | | | — | | | | — | |
| | | | |
Net asset value, end of year | | | $23.56 | | | | $27.16 | | | | $21.04 | | | | $20.49 | | | | $21.54 | |
| | | | |
| | | | | |
Total returnd | | | 7.47% | | | | 38.15% | | | | 10.85% | | | | (4.87)% | | | | 27.68% | |
| | | | | |
| Ratios to average net assets | | | | | | | | | | | | | | | | | | | | |
| | | | | |
Expenses | | | 1.05% | e | | | 1.05% | f | | | 1.05% | | | | 1.04% | | | | 1.04% | |
| | | | | |
Net investment income (loss) | | | (0.54)% | | | | (0.60)% | | | | (0.28)% | c | | | (0.46)% | | | | (0.32)% | |
| | | | | |
| Supplemental data | | | | | | | | | | | | | | | | | | | | |
| | | | | |
Net assets, end of year (000’s) | | | $582,772 | | | | $660,806 | | | | $670,193 | | | | $717,086 | | | | $939,481 | |
| | | | | |
Portfolio turnover rate | | | 48.73% | | | | 42.77% | | | | 41.44% | | | | 45.00% | | | | 46.69% | |
aThe amount shown for a share outstanding throughout the period may not correlate with the Statement of Operations for the period due to the timing of sales and repurchases of the Fund shares in relation to income earned and/or fluctuating fair value of the investments of the Fund.
bBased on average daily shares outstanding.
cNet investment income per share includes approximately $0.03 per share received in the form of special dividends. Excluding these amounts, the ratio of net investment income to average net assets would have been (0.41)%.
dTotal return does not include fees, charges or expenses imposed by the variable annuity and life insurance contracts for which Franklin Templeton Variable Insurance Products Trust serves as an underlying investment vehicle.
eBenefit of waiver and payments by affiliates rounds to less than 0.01%.
fBenefit of expense reduction rounds to less than 0.01%.
| | | | | | |
| | | The accompanying notes are an integral part of these financial statements. | Annual Report | | | FSC-7 | |
FRANKLIN TEMPLETON VARIABLE INSURANCE PRODUCTS TRUST
FINANCIAL HIGHLIGHTS
Franklin Small-Mid Cap Growth VIP Fund (continued)
| | | | | | | | | | | | | | | | | | | | |
| | | Year Ended December 31, | |
| | | 2014 | | | 2013 | | | 2012 | | | 2011 | | | 2010 | |
| Class 4 | | | | | | | | | | | | | | | | | | | | |
Per share operating performance
(for a share outstanding throughout the year) | | | | | | | | | | | | | | | | | | | | |
| | | | | |
Net asset value, beginning of year | | | $27.72 | | | | $21.47 | | | | $20.90 | | | | $21.98 | | | | $17.24 | |
| | | | |
| | | | | |
| Income from investment operationsa: | | | | | | | | | | | | | | | | | | | | |
| | | | | |
Net investment income (loss)b | | | (0.16 | ) | | | (0.17 | ) | | | (0.09 | )c | | | (0.12 | ) | | | (0.07 | ) |
| | | | | |
Net realized and unrealized gains (losses) | | | 1.98 | | | | 8.01 | | | | 2.24 | | | | (0.96 | ) | | | 4.81 | |
| | | | |
Total from investment operations | | | 1.82 | | | | 7.84 | | | | 2.15 | | | | (1.08 | ) | | | 4.74 | |
| | | | |
| | | | | |
Less distributions from net realized gains | | | (5.40 | ) | | | (1.59 | ) | | | (1.58 | ) | | | — | | | | — | |
| | | | |
Net asset value, end of year | | | $24.14 | | | | $27.72 | | | | $21.47 | | | | $20.90 | | | | $21.98 | |
| | | | |
| | | | | |
Total returnd | | | 7.39% | | | | 37.99% | | | | 10.79% | | | | (4.91)% | | | | 27.49% | |
| | | | | |
| Ratios to average net assets | | | | | | | | | | | | | | | | | | | | |
| | | | | |
Expenses | | | 1.15% | e | | | 1.15% | f | | | 1.15% | | | | 1.14% | | | | 1.14% | |
| | | | | |
Net investment income (loss) | | | (0.64)% | | | | (0.70)% | | | | (0.38)% | c | | | (0.56)% | | | | (0.42)% | |
| | | | | |
| Supplemental data | | | | | | | | | | | | | | | | | | | | |
| | | | | |
Net assets, end of year (000’s) | | | $16,384 | | | | $19,132 | | | | $12,000 | | | | $12,664 | | | | $15,413 | |
| | | | | |
Portfolio turnover rate | | | 48.73% | | | | 42.77% | | | | 41.44% | | | | 45.00% | | | | 46.69% | |
aThe amount shown for a share outstanding throughout the period may not correlate with the Statement of Operations for the period due to the timing of sales and repurchases of the Fund shares in relation to income earned and/or fluctuating fair value of the investments of the Fund.
bBased on average daily shares outstanding.
cNet investment income per share includes approximately $0.03 per share received in the form of special dividends. Excluding these amounts, the ratio of net investment income to average net assets would have been (0.51)%.
dTotal return does not include fees, charges or expenses imposed by the variable annuity and life insurance contracts for which Franklin Templeton Variable Insurance Products Trust serves as an underlying investment vehicle.
eBenefit of waiver and payments by affiliates rounds to less than 0.01%.
fBenefit of expense reduction rounds to less than 0.01%.
| | | | |
| FSC-8 | | Annual Report | The accompanying notes are an integral part of these financial statements. | | |
FRANKLIN TEMPLETON VARIABLE INSURANCE PRODUCTS TRUST
Statement of Investments, December 31, 2014
| | | | | | | | | | |
| Franklin Small-Mid Cap Growth VIP Fund | |
| | | | | Shares | | | Value | |
| | | | | | | | | | |
| | | | | | | | | | |
| | Common Stocks 98.6% | | | | | | | | |
| | Consumer Discretionary 21.2% | | | | | | | | |
| | Advance Auto Parts Inc. | | | 33,400 | | | $ | 5,319,952 | |
| | BorgWarner Inc. | | | 105,100 | | | | 5,775,245 | |
| a | | Buffalo Wild Wings Inc. | | | 36,400 | | | | 6,565,832 | |
| a | | Charter Communications Inc., A | | | 28,200 | | | | 4,698,684 | |
| a | | Chipotle Mexican Grill Inc. | | | 12,200 | | | | 8,351,022 | |
| | Dick’s Sporting Goods Inc. | | | 115,200 | | | | 5,719,680 | |
| a | | Dollar Tree Inc. | | | 67,300 | | | | 4,736,574 | |
| a | | Global Eagle Entertainment Inc. | | | 263,000 | | | | 3,579,430 | |
| a | | Grand Canyon Education Inc. | | | 100,400 | | | | 4,684,664 | |
| | Harman International Industries Inc. | | | 62,500 | | | | 6,669,375 | |
| a | | IMAX Corp. (Canada) | | | 172,300 | | | | 5,324,070 | |
| a | | Jarden Corp. | | | 186,950 | | | | 8,951,166 | |
| b | | KB Home | | | 405,300 | | | | 6,707,715 | |
| | L Brands Inc. | | | 61,700 | | | | 5,340,135 | |
| a | | Liberty Broadband Corp., C | | | 40,500 | | | | 2,017,710 | |
| | Marriott International Inc., A | | | 104,300 | | | | 8,138,529 | |
| a | | MGM Resorts International | | | 262,491 | | | | 5,612,058 | |
| a | | Netflix Inc. | | | 18,200 | | | | 6,217,302 | |
| | Nordstrom Inc. | | | 45,200 | | | | 3,588,428 | |
| a | | Norwegian Cruise Line Holdings Ltd. | | | 82,800 | | | | 3,871,728 | |
| | Polaris Industries Inc. | | | 13,800 | | | | 2,087,112 | |
| a | | Shutterfly Inc. | | | 71,700 | | | | 2,989,531 | |
| a | | Tenneco Inc. | | | 126,500 | | | | 7,161,165 | |
| | Tractor Supply Co. | | | 67,500 | | | | 5,320,350 | |
| a | | Under Armour Inc., A | | | 69,176 | | | | 4,697,050 | |
| a,b | | Wayfair Inc., A | | | 64,700 | | | | 1,284,295 | |
| | Wolverine World Wide Inc. | | | 129,800 | | | | 3,825,206 | |
| | Wynn Resorts Ltd. | | | 25,050 | | | | 3,726,438 | |
| a,b | | Zoe’s Kitchen Inc. | | | 111,100 | | | | 3,323,001 | |
| a,b | | Zulily Inc. | | | 86,000 | | | | 2,012,400 | |
| | | | | | | | | | |
| | | | | | | | | 148,295,847 | |
| | | | | | | | | | |
| | Consumer Staples 3.4% | | | | | | | | |
| a | | Boston Beer Inc., A | | | 22,100 | | | | 6,398,834 | |
| a,b | | Freshpet Inc. | | | 139,900 | | | | 2,386,694 | |
| a | | Monster Beverage Corp. | | | 49,900 | | | | 5,406,665 | |
| a | | TreeHouse Foods Inc. | | | 69,100 | | | | 5,910,123 | |
| | Whole Foods Market Inc. | | | 79,200 | | | | 3,993,264 | |
| | | | | | | | | | |
| | | | | | | | | 24,095,580 | |
| | | | | | | | | | |
| | Energy 4.2% | | | | | | | | |
| | Cabot Oil & Gas Corp., A | | | 209,800 | | | | 6,212,178 | |
| a | | Cheniere Energy Inc. | | | 24,000 | | | | 1,689,600 | |
| a | | Concho Resources Inc. | | | 65,600 | | | | 6,543,600 | |
| a | | Diamondback Energy Inc. | | | 79,100 | | | | 4,728,598 | |
| | EQT Corp. | | | 73,500 | | | | 5,563,950 | |
| | Oceaneering International Inc. | | | 50,600 | | | | 2,975,786 | |
| a,b | | Rex Energy Corp. | | | 257,900 | | | | 1,315,290 | |
| | | | | | | | | | |
| | | | | | | | | 29,029,002 | |
| | | | | | | | | | |
| | Financials 7.4% | | | | | | | | |
| a | | Affiliated Managers Group Inc. | | | 47,000 | | | | 9,975,280 | |
| | Brown & Brown Inc. | | | 126,300 | | | | 4,156,533 | |
FRANKLIN TEMPLETON VARIABLE INSURANCE PRODUCTS TRUST
STATEMENT OF INVESTMENTS
Franklin Small-Mid Cap Growth VIP Fund (continued)
| | | | | | | | | | |
| | | | | Shares | | | Value | |
| | | | | | | | | | |
| | Common Stocks (continued) | | | | | | | | |
| | Financials (continued) | | | | | | | | |
| | Intercontinental Exchange Inc. | | | 42,608 | | | $ | 9,343,508 | |
| | Jones Lang LaSalle Inc. | | | 19,100 | | | | 2,863,663 | |
| | Lazard Ltd., A | | | 104,500 | | | | 5,228,135 | |
| | LPL Financial Holdings Inc. | | | 99,200 | | | | 4,419,360 | |
| a | | Signature Bank | | | 66,700 | | | | 8,401,532 | |
| | T. Rowe Price Group Inc. | | | 82,800 | | | | 7,109,208 | |
| | | | | | | | | | |
| | | | | | | | | 51,497,219 | |
| | | | | | | | | | |
| | Health Care 20.3% | | | | | | | | |
| | Agilent Technologies Inc. | | | 92,500 | | | | 3,786,950 | |
| a | | Alnylam Pharmaceuticals Inc. | | | 44,100 | | | | 4,277,700 | |
| a | | BioMarin Pharmaceutical Inc. | | | 27,300 | | | | 2,467,920 | |
| a | | Catamaran Corp. | | | 118,000 | | | | 6,106,500 | |
| a | | Celldex Therapeutics Inc. | | | 178,400 | | | | 3,255,800 | |
| a | | Cerner Corp. | | | 100,000 | | | | 6,466,000 | |
| | The Cooper Cos. Inc. | | | 44,900 | | | | 7,277,841 | |
| a | | DaVita HealthCare Partners Inc. | | | 83,700 | | | | 6,339,438 | |
| | DENTSPLY International Inc. | | | 109,500 | | | | 5,833,065 | |
| a | | DexCom Inc. | | | 52,900 | | | | 2,912,145 | |
| a | | Edwards Lifesciences Corp. | | | 34,300 | | | | 4,369,134 | |
| a | | Envision Healthcare Holdings Inc. | | | 171,400 | | | | 5,945,866 | |
| a | | HCA Holdings Inc. | | | 134,700 | | | | 9,885,633 | |
| a | | HeartWare International Inc. | | | 22,106 | | | | 1,623,243 | |
| a | | HMS Holdings Corp. | | | 126,000 | | | | 2,663,640 | |
| a | | Hologic Inc. | | | 96,800 | | | | 2,588,432 | |
| a | | Illumina Inc. | | | 29,300 | | | | 5,408,194 | |
| a | | Impax Laboratories Inc. | | | 227,700 | | | | 7,213,536 | |
| a | | Incyte Corp. | | | 24,400 | | | | 1,783,884 | |
| a | | Insulet Corp. | | | 49,600 | | | | 2,284,576 | |
| a,b | | Intercept Pharmaceuticals Inc. | | | 6,100 | | | | 951,600 | |
| a | | Karyopharm Therapeutics Inc. | | | 56,913 | | | | 2,130,254 | |
| a,b | | Keryx Biopharmaceuticals Inc. | | | 125,100 | | | | 1,770,165 | |
| a | | Medivation Inc. | | | 36,846 | | | | 3,670,230 | |
| a | | Mettler-Toledo International Inc. | | | 19,500 | | | | 5,897,970 | |
| a | | Nevro Corp. | | | 16,300 | | | | 630,321 | |
| | Perrigo Co. PLC | | | 56,385 | | | | 9,425,317 | |
| a | | Portola Pharmaceuticals Inc. | | | 27,700 | | | | 784,464 | |
| a | | Puma Biotechnology Inc. | | | 6,300 | | | | 1,192,401 | |
| a | | Quintiles Transnational Holdings Inc. | | | 136,500 | | | | 8,035,755 | |
| a | | Revance Therapeutics Inc. | | | 115,000 | | | | 1,948,100 | |
| a | | Sagent Pharmaceuticals Inc. | | | 70,800 | | | | 1,777,788 | |
| | St. Jude Medical Inc. | | | 106,500 | | | | 6,925,695 | |
| a | | Tandem Diabetes Care Inc. | | | 113,800 | | | | 1,445,260 | |
| a | | Vertex Pharmaceuticals Inc. | | | 25,400 | | | | 3,017,520 | |
| | | | | | | | | | |
| | | | | | | | | 142,092,337 | |
| | | | | | | | | | |
| | Industrials 15.8% | | | | | | | | |
| a | | The Advisory Board Co. | | | 79,100 | | | | 3,874,318 | |
| | Allegiant Travel Co. | | | 25,292 | | | | 3,802,146 | |
| | AMETEK Inc. | | | 190,000 | | | | 9,999,700 | |
| a | | B/E Aerospace Inc. | | | 60,000 | | | | 3,481,200 | |
| a | | DigitalGlobe Inc. | | | 193,300 | | | | 5,986,501 | |
FRANKLIN TEMPLETON VARIABLE INSURANCE PRODUCTS TRUST
STATEMENT OF INVESTMENTS
Franklin Small-Mid Cap Growth VIP Fund (continued)
| | | | | | | | | | |
| | | | | Shares | | | Value | |
| | | | | | | | | | |
| | Common Stocks (continued) | | | | | | | | |
| | Industrials (continued) | | | | | | | | |
| | Flowserve Corp. | | | 88,100 | | | $ | 5,271,023 | |
| a | | Genesee & Wyoming Inc. | | | 55,200 | | | | 4,963,584 | |
| a | | HD Supply Holdings Inc. | | | 245,500 | | | | 7,239,795 | |
| a | | Hexcel Corp. | | | 140,200 | | | | 5,816,898 | |
| a | | IHS Inc., A | | | 66,400 | | | | 7,561,632 | |
| | J.B. Hunt Transport Services Inc. | | | 48,500 | | | | 4,086,125 | |
| | Kansas City Southern | | | 28,400 | | | | 3,465,652 | |
| | L-3 Communications Holdings Inc. | | | 41,600 | | | | 5,250,336 | |
| a | | Proto Labs Inc. | | | 72,900 | | | | 4,895,964 | |
| | Robert Half International Inc. | | | 145,300 | | | | 8,482,614 | |
| | Rockwell Automation Inc. | | | 30,900 | | | | 3,436,080 | |
| | Roper Industries Inc. | | | 48,870 | | | | 7,640,825 | |
| a | | Spirit Airlines Inc. | | | 93,400 | | | | 7,059,172 | |
| | Towers Watson & Co. | | | 22,500 | | | | 2,546,325 | |
| a | | WABCO Holdings Inc. | | | 55,600 | | | | 5,825,768 | |
| | | | | | | | | | |
| | | | | | | | | 110,685,658 | |
| | | | | | | | | | |
| | Information Technology 22.4% | | | | | | | | |
| a | | Alliance Data Systems Corp. | | | 10,400 | | | | 2,974,920 | |
| a | | ANSYS Inc. | | | 43,500 | | | | 3,567,000 | |
| | Applied Materials Inc. | | | 300,600 | | | | 7,490,952 | |
| | Avago Technologies Ltd. (Singapore) | | | 73,400 | | | | 7,383,306 | |
| a | | Bottomline Technologies Inc. | | | 109,500 | | | | 2,768,160 | |
| a | | Cognex Corp. | | | 158,600 | | | | 6,554,938 | |
| a | | CoStar Group Inc. | | | 24,600 | | | | 4,517,298 | |
| a | | Demandware Inc. | | | 51,100 | | | | 2,940,294 | |
| a | | Electronic Arts Inc. | | | 138,500 | | | | 6,511,578 | |
| | Equinix Inc. | | | 24,883 | | | | 5,641,723 | |
| | Fidelity National Information Services Inc. | | | 50,772 | | | | 3,158,018 | |
| a | | FleetCor Technologies Inc. | | | 45,800 | | | | 6,810,918 | |
| a,b | | Freescale Semiconductor Ltd. | | | 134,600 | | | | 3,395,958 | |
| a | | HomeAway Inc. | | | 113,300 | | | | 3,374,074 | |
| | Intersil Corp., A | | | 404,900 | | | | 5,858,903 | |
| a | | JDS Uniphase Corp. | | | 307,600 | | | | 4,220,272 | |
| | Lam Research Corp. | | | 43,500 | | | | 3,451,290 | |
| a | | LinkedIn Corp., A | | | 22,700 | | | | 5,214,417 | |
| a,b | | Mobileye NV | | | 21,425 | | | | 868,998 | |
| a | | NetSuite Inc. | | | 32,500 | | | | 3,548,025 | |
| a | | NXP Semiconductors NV (Netherlands) | | | 135,700 | | | | 10,367,480 | |
| a | | Pandora Media Inc. | | | 172,600 | | | | 3,077,458 | |
| a | | Red Hat Inc. | | | 82,900 | | | | 5,731,706 | |
| a | | Semtech Corp. | | | 92,200 | | | | 2,541,954 | |
| a | | ServiceNow Inc. | | | 33,800 | | | | 2,293,330 | |
| a,b | | Stratasys Ltd. | | | 65,700 | | | | 5,460,327 | |
| a | | Trimble Navigation Ltd. | | | 104,300 | | | | 2,768,122 | |
| a | | Twitter Inc. | | | 161,500 | | | | 5,793,005 | |
| a | | Vantiv Inc., A | | | 104,800 | | | | 3,554,816 | |
| a | | VeriFone Systems Inc. | | | 109,100 | | | | 4,058,520 | |
| a | | ViaSat Inc. | | | 132,000 | | | | 8,319,960 | |
| a | | Workday Inc. | | | 27,900 | | | | 2,276,919 | |
| | Xilinx Inc. | | | 104,800 | | | | 4,536,792 | |
FRANKLIN TEMPLETON VARIABLE INSURANCE PRODUCTS TRUST
STATEMENT OF INVESTMENTS
Franklin Small-Mid Cap Growth VIP Fund (continued)
| | | | | | | | | | |
| | | | | Shares | | | Value | |
| | | | | | | | | | |
| | Common Stocks (continued) | | | | | | | | |
| | Information Technology (continued) | | | | | | | | |
| a | | Yelp Inc. | | | 102,100 | | | $ | 5,587,933 | |
| | | | | | | | | | |
| | | | | | | | | 156,619,364 | |
| | | | | | | | | | |
| | Materials 3.3% | | | | | | | | |
| a | | Axalta Coating Systems Ltd. | | | 291,700 | | | | 7,590,034 | |
| | Cytec Industries Inc. | | | 118,600 | | | | 5,475,762 | |
| | H.B. Fuller Co. | | | 93,213 | | | | 4,150,775 | |
| | Martin Marietta Materials Inc. | | | 50,300 | | | | 5,549,096 | |
| | | | | | | | | | |
| | | | | | | | | 22,765,667 | |
| | | | | | | | | | |
| | Utilities 0.6% | | | | | | | | |
| a | | Calpine Corp. | | | 185,800 | | | | 4,111,754 | |
| | | | | | | | | | |
| | | |
| | Total Common Stocks (Cost $478,113,747) | | | | | | | 689,192,428 | |
| | | | | | | | | | |
| | Short Term Investments 5.7% | | | | | | | | |
| | Money Market Funds (Cost $12,577,150) 1.8% | | | | | | | | |
| a,c | | Institutional Fiduciary Trust Money Market Portfolio | | | 12,577,150 | | | | 12,577,150 | |
| | | | | | | | | | |
| d | | Investments from Cash Collateral Received for Loaned Securities
(Cost $27,805,125) 3.9% | | | | | | | | |
| | Money Market Funds 3.9% | | | | | | | | |
| e | | BNY Mellon Overnight Government Fund, 0.072% | | | 27,805,125 | | | | 27,805,125 | |
| | | | | | | | | | |
| | Total Investments (Cost $518,496,022) 104.3% | | | | | | | 729,574,703 | |
| | Other Assets, less Liabilities (4.3)% | | | | | | | (30,615,790 | ) |
| | | | | | | | | | |
| | Net Assets 100.0% | | | | | | $ | 698,958,913 | |
| | | | | | | | | | |
aNon-income producing.
bA portion or all of the security is on loan at December 31, 2014. See Note 1(c).
cSee Note 3(e) regarding investments in Institutional Fiduciary Trust Money Market Portfolio.
dSee Note 1(c) regarding securities on loan.
eThe rate shown is the annualized seven-day yield at period end.
| | | | |
| FSC-12 | | Annual Report | The accompanying notes are an integral part of these financial statements. | | |
FRANKLIN TEMPLETON VARIABLE INSURANCE PRODUCTS TRUST
Financial Statements
Statement of Assets and Liabilities
December 31, 2014
| | | | |
| | | Franklin Small-Mid
Cap Growth
VIP Fund | |
Assets: | | | | |
Investments in securities: | | | | |
Cost - Unaffiliated issuers | | $ | 505,918,872 | |
Cost - Sweep Money Fund (Note 3e) | | | 12,577,150 | |
| | | | |
Total cost of investments | | $ | 518,496,022 | |
| | | | |
Value - Unaffiliated issuers | | $ | 716,997,553 | |
Value - Sweep Money Fund (Note 3e) | | | 12,577,150 | |
| | | | |
Total value of investments (includes securities loaned in the amount of $27,364,211) | | | 729,574,703 | |
Receivables: | | | | |
Investment securities sold | | | 1,355,508 | |
Capital shares sold | | | 120,400 | |
Dividends and interest | | | 186,182 | |
Due from brokers | | | 1,362,150 | |
Other assets | | | 352 | |
| | | | |
Total assets | | | 732,599,295 | |
| | | | |
Liabilities: | | | | |
Payables: | | | | |
Investment securities purchased | | | 2,829,872 | |
Capital shares redeemed | | | 455,764 | |
Management fees | | | 457,653 | |
Distribution fees | | | 255,175 | |
Funds advanced by custodian | | | 1,634,580 | |
Payable upon return of securities loaned | | | 27,805,125 | |
Accrued expenses and other liabilities | | | 202,213 | |
| | | | |
Total liabilities | | | 33,640,382 | |
| | | | |
Net assets, at value | | $ | 698,958,913 | |
| | | | |
Net assets consist of: | | | | |
Paid-in capital | | $ | 326,534,889 | |
Undistributed net investment income | | | 3,992 | |
Net unrealized appreciation (depreciation) | | | 211,078,681 | |
Accumulated net realized gain (loss) | | | 161,341,351 | |
| | | | |
Net assets, at value | | $ | 698,958,913 | |
| | | | |
| |
| Class 1: | | | | |
Net assets, at value | | $ | 99,802,515 | |
| | | | |
Shares outstanding | | | 4,000,192 | |
| | | | |
Net asset value and maximum offering price per share | | $ | 24.95 | |
| | | | |
| |
| Class 2: | | | | |
Net assets, at value | | $ | 582,772,151 | |
| | | | |
Shares outstanding | | | 24,733,327 | |
| | | | |
Net asset value and maximum offering price per share | | $ | 23.56 | |
| | | | |
| |
| Class 4: | | | | |
Net assets, at value | | $ | 16,384,247 | |
| | | | |
Shares outstanding | | | 678,798 | |
| | | | |
Net asset value and maximum offering price per share | | $ | 24.14 | |
| | | | |
| | | | | | |
| | | The accompanying notes are an integral part of these financial statements. | Annual Report | | | FSC-13 | |
FRANKLIN TEMPLETON VARIABLE INSURANCE PRODUCTS TRUST
FINANCIAL STATEMENTS
Statement of Operations
for the year ended December 31, 2014
| | | | |
| | | Franklin Small-Mid
Cap Growth
VIP Fund | |
Investment income: | | | | |
Dividends | | $ | 3,595,313 | |
Income from securities loaned | | | 138,644 | |
| | | | |
Total investment income | | | 3,733,957 | |
| | | | |
Expenses: | | | | |
Management fees (Note 3a) | | | 5,613,906 | |
Distribution fees: (Note 3c) | | | | |
Class 2 | | | 1,535,545 | |
Class 4 | | | 61,714 | |
Custodian fees (Note 4) | | | 6,985 | |
Reports to shareholders | | | 181,592 | |
Professional fees | | | 49,497 | |
Trustees’ fees and expenses | | | 2,956 | |
Other | | | 14,850 | |
| | | | |
Total expenses | | | 7,467,045 | |
Expenses waived/paid by affiliates (Note 3e) | | | (8,562 | ) |
| | | | |
Net expenses | | | 7,458,483 | |
| | | | |
Net investment income (loss) | | | (3,724,526 | ) |
| | | | |
Realized and unrealized gains (losses): | | | | |
Net realized gain (loss) from: | | | | |
Investments | | | 165,567,639 | |
Foreign currency transactions | | | 883 | |
| | | | |
Net realized gain (loss) | | | 165,568,522 | |
| | | | |
Net change in unrealized appreciation (depreciation) on investments | | | (110,422,791 | ) |
| | | | |
Net realized and unrealized gain (loss) | | | 55,145,731 | |
| | | | |
Net increase (decrease) in net assets resulting from operations | | $ | 51,421,205 | |
| | | | |
| | | | |
| FSC-14 | | Annual Report | The accompanying notes are an integral part of these financial statements. | | |
FRANKLIN TEMPLETON VARIABLE INSURANCE PRODUCTS TRUST
FINANCIAL STATEMENTS
Statements of Changes in Net Assets
| | | | | | | | |
| | | Franklin Small-Mid Cap Growth VIP Fund | |
| | | Year Ended December 31, | |
| | | 2014 | | | 2013 | |
Increase (decrease) in net assets: | | | | | | | | |
Operations: | | | | | | | | |
Net investment income (loss) | | $ | (3,724,526 | ) | | $ | (4,372,919 | ) |
Net realized gain (loss) from investments and foreign currency transactions | | | 165,568,522 | | | | 148,360,735 | |
Net change in unrealized appreciation (depreciation) on investments | | | (110,422,791 | ) | | | 103,931,403 | |
| | | | |
Net increase (decrease) in net assets resulting from operations | | | 51,421,205 | | | | 247,919,219 | |
| | | | |
Distributions to shareholders from: | | | | | | | | |
Net realized gains: | | | | | | | | |
Class 1 | | | (18,164,400 | ) | | | (5,305,025 | ) |
Class 2 | | | (120,447,127 | ) | | | (39,304,696 | ) |
Class 4 | | | (3,536,394 | ) | | | (836,392 | ) |
| | | | |
Total distributions to shareholders | | | (142,147,921 | ) | | | (45,446,113 | ) |
| | | | |
Capital share transactions: (Note 2) | | | | | | | | |
Class 1 | | | 12,658,981 | | | | (739,844 | ) |
Class 2 | | | (469,072 | ) | | | (185,107,692 | ) |
Class 4 | | | (462,764 | ) | | | 3,163,185 | |
| | | | |
Total capital share transactions | | | 11,727,145 | | | | (182,684,351 | ) |
| | | | |
Net increase (decrease) in net assets | | | (78,999,571 | ) | | | 19,788,755 | |
Net assets: | | | | | | | | |
Beginning of year | | | 777,958,484 | | | | 758,169,729 | |
| | | | |
End of year | | $ | 698,958,913 | | | $ | 777,958,484 | |
| | | | |
Undistributed net investment income included in net assets: | | | | | | | | |
End of year | | $ | 3,992 | | | $ | 2,662 | |
| | | | |
| | | | | | |
| | | The accompanying notes are an integral part of these financial statements. | Annual Report | | | FSC-15 | |
FRANKLIN TEMPLETON VARIABLE INSURANCE PRODUCTS TRUST
Notes to Financial Statements
Franklin Small-Mid Cap Growth VIP Fund
1. Organization and Significant Accounting Policies
Franklin Templeton Variable Insurance Products Trust (Trust) is registered under the Investment Company Act of 1940, as amended, (1940 Act) as an open-end management investment company, consisting of nineteen separate funds and applies the specialized accounting and reporting guidance in U.S. Generally Accepted Accounting Principles (U.S. GAAP). Franklin Small-Mid Cap Growth VIP Fund (Fund) is included in this report. The financial statements of the remaining funds in the Trust are presented separately. Shares of the Fund are generally sold only to insurance company separate accounts to fund the benefits of variable life insurance policies or variable annuity contracts. At December 31, 2014, 41.86% of the Fund’s shares were held through one insurance company. Investment activities of these insurance company separate accounts could have a material impact on the Fund. The Fund offers three classes of shares: Class 1, Class 2, and Class 4. Each class of shares differs by its distribution fees, voting rights on matters affecting a single class and its exchange privilege.
Effective May 1, 2014, Franklin Small-Mid Cap Growth Securities Fund was renamed Franklin Small-Mid Cap Growth VIP Fund.
The following summarizes the Fund’s significant accounting policies.
a. Financial Instrument Valuation
The Fund’s investments in financial instruments are carried at fair value daily. Fair value is the price that would be received to sell an asset or paid to transfer a liability in an orderly transaction between market participants on the measurement date. The Fund calculates the net asset value (NAV) per share at the close of the New York Stock Exchange (NYSE), generally at 4 p.m. Eastern time (NYSE close) on each day the NYSE is open for trading. Under compliance policies and procedures approved by the Trust’s Board of Trustees (the Board), the Fund’s administrator has responsibility for oversight of valuation, including leading the cross-functional Valuation and Liquidity Oversight Committee (VLOC). The VLOC provides administration and oversight of the Fund’s valuation policies and procedures, which are approved annually by the Board. Among other things, these procedures allow the Fund to utilize independent pricing services, quotations from securities and financial instrument dealers, and other market sources to determine fair value.
Equity securities listed on an exchange or on the NASDAQ National Market System are valued at the last quoted sale price or the official closing price of the day, respectively. Foreign equity securities are valued as of the close of trading on the foreign stock exchange on which the security is primarily traded or as of the NYSE close, whichever is earlier. The value is then converted into its U.S. dollar equivalent at the foreign exchange rate in effect at the NYSE close on the day that the value of the security is determined. Over-the-counter (OTC) securities are valued within the range of the most recent quoted bid and ask prices. Securities that trade in multiple markets or on multiple exchanges are valued according to the broadest and most representative market. Certain equity securities are valued based upon fundamental characteristics or relationships to similar securities. Investments in open-end mutual funds and non-registered money market funds are valued at the closing NAV.
The Fund has procedures to determine the fair value of financial instruments for which market prices are not reliable or readily available. Under these procedures, the VLOC convenes on a regular basis to review such financial instruments and considers a number of factors, including significant unobservable valuation inputs, when arriving at fair value. The VLOC primarily employs a market-based approach which may use related or comparable assets or liabilities, recent transactions, market multiples, book values, and other relevant information for the investment to determine the fair value of the investment. An income-based valuation approach may also be used in which the anticipated future cash flows of the investment are discounted to calculate fair value. Discounts may also be applied due to the nature or duration of any restrictions on the disposition of the investments. Due to the inherent uncertainty of valuations of such investments, the fair values may differ significantly from the values that would have been used had an active market existed. The VLOC employs various methods for calibrating these valuation approaches including a regular review of key inputs and assumptions, transactional back-testing or disposition analysis, and reviews of any related market activity.
Trading in securities on foreign securities stock exchanges and OTC markets may be completed before the daily NYSE close. In addition, trading in certain foreign markets may not take place on every NYSE business day. Occasionally, events occur between the time at which trading in a foreign security is completed and the close of the NYSE that might call into question the reliability of the value of a portfolio security held by the Fund. As a result, differences may arise between the value of
FRANKLIN TEMPLETON VARIABLE INSURANCE PRODUCTS TRUST
NOTES TO FINANCIAL STATEMENTS
Franklin Small-Mid Cap Growth VIP Fund (continued)
the Fund’s portfolio securities as determined at the foreign market close and the latest indications of value at the close of the NYSE. In order to minimize the potential for these differences, the VLOC monitors price movements following the close of trading in foreign stock markets through a series of country specific market proxies (such as baskets of American Depositary Receipts, futures contracts and exchange traded funds). These price movements are measured against established trigger thresholds for each specific market proxy to assist in determining if an event has occurred that may call into question the reliability of the values of the foreign securities held by the Fund. If such an event occurs, the securities may be valued using fair value procedures, which may include the use of independent pricing services.
Also, when the last day of the reporting period is a non-business day, certain foreign markets may be open on those days that the NYSE is closed, which could result in differences between the value of the Fund’s portfolio securities on the last business day and the last calendar day of the reporting period. Any significant security valuation changes due to an open foreign market are adjusted and reflected by the Fund for financial reporting purposes.
b. Foreign Currency Translation
Portfolio securities and other assets and liabilities denominated in foreign currencies are translated into U.S. dollars based on the exchange rate of such currencies against U.S. dollars on the date of valuation. The Fund may enter into foreign currency exchange contracts to facilitate transactions denominated in a foreign currency. Purchases and sales of securities, income and expense items denominated in foreign currencies are translated into U.S. dollars at the exchange rate in effect on the transaction date. Portfolio securities and assets and liabilities denominated in foreign currencies contain risks that those currencies will decline in value relative to the U.S. dollar. Occasionally, events may impact the availability or reliability of foreign exchange rates used to convert the U.S. dollar equivalent value. If such an event occurs, the foreign exchange rate will be valued at fair value using procedures established and approved by the Board.
The Fund does not separately report the effect of changes in foreign exchange rates from changes in market prices on securities held. Such changes are included in net realized and unrealized gain or loss from investments on the Statement of Operations.
Realized foreign exchange gains or losses arise from sales of foreign currencies, currency gains or losses realized between the trade and settlement dates on securities transactions and the difference between the recorded amounts of dividends, interest, and foreign withholding taxes and the U.S. dollar equivalent of the amounts actually received or paid. Net unrealized foreign exchange gains and losses arise from changes in foreign exchange rates on foreign denominated assets and liabilities other than investments in securities held at the end of the reporting period.
c. Securities Lending
The Fund participates in an agency based securities lending program. The Fund receives cash collateral against the loaned securities in an amount equal to at least 102% of the fair value of the loaned securities. Collateral is maintained over the life of the loan in an amount not less than 100% of the fair value of loaned securities, as determined at the close of fund business each day; any additional collateral required due to changes in security values is delivered to the Fund on the next business day. The collateral is invested in a non-registered money fund as indicated on the Statement of Investments. The Fund receives income from the investment of cash collateral, in addition to lending fees and rebates paid by the borrower. The Fund bears the market risk with respect to the collateral investment, securities loaned, and the risk that the agent may default on its obligations to the Fund. The securities lending agent has agreed to indemnify the Fund in the event of default by a third party borrower.
d. Income and Deferred Taxes
It is the Fund’s policy to qualify as a regulated investment company under the Internal Revenue Code. The Fund intends to distribute to shareholders substantially all of its taxable income and net realized gains to relieve it from federal income and if applicable, excise taxes. As a result, no provision for U.S. federal income taxes is required.
The Fund may be subject to foreign taxation related to income received, capital gains on the sale of securities and certain foreign currency transactions in the foreign jurisdictions in which it invests. Foreign taxes, if any, are recorded based on the tax regulations and rates that exist in the foreign markets in which the Fund invests. When a capital gain tax is determined to apply the Fund records an estimated deferred tax liability in an amount that would be payable if the securities were disposed of on the valuation date.
FRANKLIN TEMPLETON VARIABLE INSURANCE PRODUCTS TRUST
NOTES TO FINANCIAL STATEMENTS
Franklin Small-Mid Cap Growth VIP Fund (continued)
1. Organization and Significant Accounting Policies (continued)
d. Income and Deferred Taxes (continued)
The Fund recognizes the tax benefits of uncertain tax positions only when the position is “more likely than not” to be sustained upon examination by the tax authorities based on the technical merits of the tax position. As of December 31, 2014, and for all open tax years, the Fund has determined that no liability for unrecognized tax benefits is required in the Fund’s financial statements related to uncertain tax positions taken on a tax return (or expected to be taken on future tax returns). Open tax years are those that remain subject to examination and are based on each tax jurisdiction statute of limitation.
e. Security Transactions, Investment Income, Expenses and Distributions
Security transactions are accounted for on trade date. Realized gains and losses on security transactions are determined on a specific identification basis. Estimated expenses are accrued daily. Dividend income is recorded on the ex-dividend date except for certain foreign securities where the dividend rate is not available. In such cases, the dividend is recorded as soon as the information is received by the Fund. Distributions to shareholders are recorded on the ex-dividend date and are determined according to income tax regulations (tax basis). Distributable earnings determined on a tax basis may differ from earnings recorded in accordance with U.S. GAAP. These differences may be permanent or temporary. Permanent differences are reclassified among capital accounts to reflect their tax character. These reclassifications have no impact on net assets or the results of operations. Temporary differences are not reclassified, as they may reverse in subsequent periods.
Common expenses incurred by the Trust are allocated among the funds based on the ratio of net assets of each fund to the combined net assets of the Trust. Fund specific expenses are charged directly to the fund that incurred the expense.
Realized and unrealized gains and losses and net investment income, not including class specific expenses, are allocated daily to each class of shares based upon the relative proportion of net assets of each class. Differences in per share distributions, by class, are generally due to differences in class specific expenses.
f. Accounting Estimates
The preparation of financial statements in accordance with U.S. GAAP requires management to make estimates and assumptions that affect the reported amounts of assets and liabilities at the date of the financial statements and the amounts of income and expenses during the reporting period. Actual results could differ from those estimates.
g. Guarantees and Indemnifications
Under the Trust’s organizational documents, its officers and trustees are indemnified by the Trust against certain liabilities arising out of the performance of their duties to the Trust. Additionally, in the normal course of business, the Trust, on behalf of the Fund, enters into contracts with service providers that contain general indemnification clauses. The Trust’s maximum exposure under these arrangements is unknown as this would involve future claims that may be made against the Trust that have not yet occurred. Currently, the Trust expects the risk of loss to be remote.
FRANKLIN TEMPLETON VARIABLE INSURANCE PRODUCTS TRUST
NOTES TO FINANCIAL STATEMENTS
Franklin Small-Mid Cap Growth VIP Fund (continued)
2. Shares of Beneficial Interest
At December 31, 2014, there were an unlimited number of shares authorized (without par value). Transactions in the Fund’s shares were as follows:
| | | | | | | | | | | | | | | | | | |
| | | Year Ended December 31, | |
| | | 2014 | | | | | 2013 | |
| | | Shares | | | Amount | | | | | Shares | | | Amount | |
| | | | | |
| Class 1 Shares: | | | | | | | | | | | | | | | | | | |
Shares sold | | | 274,487 | | | $ | 7,229,775 | | | | | | 208,707 | | | $ | 5,257,737 | |
Shares issued in reinvestment of distributions | | | 759,699 | | | | 18,164,400 | | | | | | 224,030 | | | | 5,305,025 | |
Shares redeemed | | | (487,310 | ) | | | (12,735,194 | ) | | | | | (452,875 | ) | | | (11,302,606 | ) |
| | | | |
Net increase (decrease) | | | 546,876 | | | $ | 12,658,981 | | | | | | (20,138 | ) | | $ | (739,844 | ) |
| | | | |
| Class 2 Shares: | | | | | | | | | | | | | | | | | | |
Shares sold | | | 897,666 | | | $ | 22,309,519 | | | | | | 1,537,143 | | | $ | 36,852,173 | |
Shares issued in reinvestment of distributions | | | 5,327,162 | | | | 120,447,127 | | | | | | 1,732,248 | | | | 39,304,696 | |
Shares redeemed | | | (5,821,755 | ) | | | (143,225,718 | ) | | | | | (10,791,872 | ) | | | (261,264,561 | ) |
| | | | |
Net increase (decrease) | | | 403,073 | | | $ | (469,072 | ) | | | | | (7,522,481 | ) | | $ | (185,107,692 | ) |
| | | | |
| Class 4 Shares: | | | | | | | | | | | | | | | | | | |
Shares sold | | | 67,020 | | | $ | 1,726,663 | | | | | | 272,840 | | | $ | 6,706,822 | |
Shares issued on reinvestment of distributions | | | 152,628 | | | | 3,536,394 | | | | | | 36,098 | | | | 836,392 | |
Shares redeemed | | | (231,062 | ) | | | (5,725,821 | ) | | | | | (177,757 | ) | | | (4,380,029 | ) |
| | | | |
Net increase (decrease) | | | (11,414 | ) | | $ | (462,764 | ) | | | | | 131,181 | | | $ | 3,163,185 | |
| | | | |
3. Transactions With Affiliates
Franklin Resources, Inc. is the holding company for various subsidiaries that together are referred to as Franklin Templeton Investments. Certain officers and trustees of the Fund are also officers and/or directors of the following subsidiaries:
| | |
| Subsidiary | | Affiliation |
Franklin Advisers, Inc. (Advisers) | | Investment manager |
Franklin Templeton Services, LLC (FT Services) | | Administrative manager |
Franklin Templeton Distributors, Inc. (Distributors) | | Principal underwriter |
Franklin Templeton Investor Services, LLC (Investor Services) | | Transfer agent |
a. Management Fees
The Fund pays an investment management fee to Advisers based on the average daily net assets of the Fund as follows:
| | |
| Annualized Fee Rate | | Net Assets |
0.800% | | Up to and including $500 million |
0.700% | | Over $500 million, up to and including $1 billion |
0.650% | | Over $1 billion, up to and including $1.5 billion |
0.600% | | Over $1.5 billion, up to and including $6.5 billion |
0.575% | | Over $6.5 billion, up to and including $11.5 billion |
0.550% | | Over $11.5 billion, up to and including $16.5 billion |
0.540% | | Over $16.5 billion, up to and including $19 billion |
0.530% | | Over $19 billion, up to and including $21.5 billion |
0.520% | | In excess of $21.5 billion |
FRANKLIN TEMPLETON VARIABLE INSURANCE PRODUCTS TRUST
NOTES TO FINANCIAL STATEMENTS
Franklin Small-Mid Cap Growth VIP Fund (continued)
3. Transactions With Affiliates (continued)
b. Administrative Fees
Under an agreement with Advisers, FT Services provides administrative services to the Fund. The fee is paid by Advisers based on the Fund’s average daily net assets, and is not an additional expense of the Fund.
c. Distribution Fees
The Board has adopted distribution plans for Class 2 and Class 4 shares pursuant to Rule 12b-1 under the 1940 Act. Under the Fund’s compensation distribution plans, the Fund pays Distributors for costs incurred in connection with the servicing, sale and distribution of the Fund’s shares up to 0.35% per year of its average daily net assets of each class. Some distribution fees are not charged on shares held by affiliates. The Board has agreed to limit the current rate to 0.25% per year for Class 2. The plan year, for purposes of monitoring compliance with the maximum annual plan rates, is February 1 through January 31.
d. Transfer Agent Fees
Investor Services, under terms of an agreement, performs shareholder servicing for the Fund and is not paid by the Fund for the services.
e. Investments in Institutional Fiduciary Trust Money Market Portfolio
The Fund invests in Institutional Fiduciary Trust Money Market Portfolio (Sweep Money Fund), an affiliated open-end management investment company. Management fees paid by the Fund are waived on assets invested in the Sweep Money Fund, as noted on the Statement of Operations, in an amount not to exceed the management and administrative fees paid directly or indirectly by the Sweep Money Fund. Prior to January 1, 2014, the waiver was accounted for as a reduction to management fees.
4. Expense Offset Arrangement
The Fund has entered into an arrangement with its custodian whereby credits realized as a result of uninvested cash balances are used to reduce a portion of the Fund’s custodian expenses. During the year ended December 31, 2014, there were no credits earned.
5. Income Taxes
The tax character of distributions paid during the years ended December 31, 2014 and 2013, was as follows:
| | | | | | | | |
| | | 2014 | | | 2013 | |
Distributions paid from: | | | | | | | | |
Ordinary income | | $ | 16,670,971 | | | $ | — | |
Long term capital gain | | | 125,476,950 | | | | 45,446,113 | |
| | | | |
| | $ | 142,147,921 | | | $ | 45,446,113 | |
| | | | |
At December 31, 2014, the cost of investments, net unrealized appreciation (depreciation), undistributed ordinary income and undistributed long term capital gains for income tax purposes were as follows:
| | | | |
Cost of investments | | $ | 519,477,618 | |
| | | | |
Unrealized appreciation | | $ | 225,507,700 | |
Unrealized depreciation | | | (15,410,615 | ) |
| | | | |
Net unrealized appreciation (depreciation) | | $ | 210,097,085 | |
| | | | |
Undistributed ordinary income | | $ | 11,956,994 | |
Undistributed long term capital gains | | | 150,369,944 | |
| | | | |
Distributable earnings | | $ | 162,326,938 | |
| | | | |
FRANKLIN TEMPLETON VARIABLE INSURANCE PRODUCTS TRUST
NOTES TO FINANCIAL STATEMENTS
Franklin Small-Mid Cap Growth VIP Fund (continued)
Differences between income and/or capital gains as determined on a book basis and a tax basis are primarily due to differing treatments of wash sales.
6. Investment Transactions
Purchases and sales of investments (excluding short term securities) for the year ended December 31, 2014, aggregated $353,539,689 and $488,663,803, respectively.
7. Credit Facility
The Fund, together with other U.S. registered and foreign investment funds (collectively, Borrowers), managed by Franklin Templeton Investments, are borrowers in a joint syndicated senior unsecured credit facility totaling $1.5 billion (Global Credit Facility) which matured on February 13, 2015. This Global Credit Facility provides a source of funds to the Borrowers for temporary and emergency purposes, including the ability to meet future unanticipated or unusually large redemption requests. The Borrowers expect to renew the Global Credit Facility for a total of $2 billion effective February 13, 2015, which matures on February 12, 2016.
Under the terms of the Global Credit Facility, the Fund shall, in addition to interest charged on any borrowings made by the Fund and other costs incurred by the Fund, pay its share of fees and expenses incurred in connection with the implementation and maintenance of the Global Credit Facility, based upon its relative share of the aggregate net assets of all of the Borrowers, including an annual commitment fee of 0.07% based upon the unused portion of the Global Credit Facility. These fees are reflected in other expenses on the Statement of Operations. During the year ended December 31, 2014, the Fund did not use the Global Credit Facility.
8. Fair Value Measurements
The Fund follows a fair value hierarchy that distinguishes between market data obtained from independent sources (observable inputs) and the Fund’s own market assumptions (unobservable inputs). These inputs are used in determining the value of the Fund’s financial instruments and are summarized in the following fair value hierarchy:
| | • | | Level 1 – quoted prices in active markets for identical financial instruments |
| | • | | Level 2 – other significant observable inputs (including quoted prices for similar financial instruments, interest rates, prepayment speed, credit risk, etc.) |
| | • | | Level 3 – significant unobservable inputs (including the Fund’s own assumptions in determining the fair value of financial instruments) |
The input levels are not necessarily an indication of the risk or liquidity associated with financial instruments at that level.
For movements between the levels within the fair value hierarchy, the Fund has adopted a policy of recognizing the transfers as of the date of the underlying event which caused the movement.
A summary of inputs used as of December 31, 2014, in valuing the Fund’s assets carried at fair value, is as follows:
| | | | | | | | | | | | | | | | |
| | | Level 1 | | | Level 2 | | | Level 3 | | | Total | |
| | | | |
| Assets: | | | | | | | | | | | | | | | | |
Investments in Securities: | | | | | | | | | | | | | | | | |
Equity Investmentsa | | $ | 689,192,428 | | | $ | — | | | $ | — | | | $ | 689,192,428 | |
Short Term Investments | | | 12,577,150 | | | | 27,805,125 | | | | — | | | | 40,382,275 | |
| | | | |
Total Investments in Securities | | $ | 701,769,578 | | | $ | 27,805,125 | | | $ | — | | | $ | 729,574,703 | |
| | | | |
aFor detailed categories, see the accompanying Statement of Investments.
FRANKLIN TEMPLETON VARIABLE INSURANCE PRODUCTS TRUST
NOTES TO FINANCIAL STATEMENTS
Franklin Small-Mid Cap Growth VIP Fund (continued)
9. New Accounting Pronouncements
In June 2014, the Financial Accounting Standards Board issued Accounting Standards Update (ASU) No. 2014-11, Transfers and Servicing (Topic 860), Repurchase-to-Maturity Transactions, Repurchase Financings, and Disclosures. The ASU changes the accounting for certain repurchase agreements and expands disclosure requirements related to repurchase agreements, securities lending, repurchase-to-maturity and similar transactions. The ASU is effective for interim and annual reporting periods beginning after December 15, 2014. Management has reviewed the requirements and believes the adoption of this ASU will not have a material impact on the financial statements.
10. Subsequent Events
The Fund has evaluated subsequent events through the issuance of the financial statements and determined that no events have occurred that require disclosure other than those already disclosed in the financial statements.
FRANKLIN TEMPLETON VARIABLE INSURANCE PRODUCTS TRUST
Report of Independent Registered Public Accounting Firm
Franklin Small-Mid Cap Growth VIP Fund
To the Board of Trustees and Shareholders of Franklin Templeton Variable Insurance Products Trust
In our opinion, the accompanying statement of assets and liabilities, including the statement of investments, and the related statements of operations and of changes in net assets and the financial highlights present fairly, in all material respects, the financial position of Franklin Small-Mid Cap Growth VIP Fund (the “Fund”) at December 31, 2014, the results of its operations for the year then ended, the changes in its net assets for each of the two years in the period then ended and the financial highlights for each of the five years in the period then ended, in conformity with accounting principles generally accepted in the United States of America. These financial statements and financial highlights (hereafter referred to as “financial statements”) are the responsibility of the Fund’s management. Our responsibility is to express an opinion on these financial statements based on our audits. We conducted our audits of these financial statements in accordance with the standards of the Public Company Accounting Oversight Board (United States). Those standards require that we plan and perform the audit to obtain reasonable assurance about whether the financial statements are free of material misstatement. An audit includes examining, on a test basis, evidence supporting the amounts and disclosures in the financial statements, assessing the accounting principles used and significant estimates made by management, and evaluating the overall financial statement presentation. We believe that our audits, which included confirmation of securities at December 31, 2014 by correspondence with the custodian, transfer agent and brokers, provides a reasonable basis for our opinion.
PricewaterhouseCoopers LLP
San Francisco, California
February 13, 2015
FRANKLIN TEMPLETON VARIABLE INSURANCE PRODUCTS TRUST
Tax Information (unaudited)
Franklin Small-Mid Cap Growth VIP Fund
Under Section 852(b)(3)(C) of the Internal Revenue Code (Code), the Fund hereby reports the maximum amount allowable but no less than $125,476,950 as a long term capital gain dividend for the fiscal year ended December 31, 2014.
Under Section 854(b)(1)(A) of the Code, the Fund hereby reports 19.56% of the ordinary income dividends as income qualifying for the dividends received deduction for the fiscal year ended December 31, 2014.
Franklin Strategic Income VIP Fund
(Formerly, Franklin Strategic Income Securities Fund)
This annual report for Franklin Strategic Income VIP Fund covers the fiscal year ended December 31, 2014.
Class 2 Performance Summary as of December 31, 2014
Average annual total return of Class 2 shares* represents the average annual change in value, assuming reinvestment of dividends and capital gains. Average returns smooth out variations in returns, which can be significant; they are not the same as year-by-year results.
| | | | | | | | | | | | |
| Periods ended 12/31/14 | | 1-Year | | | 5-Year | | | 10-Year | |
Average Annual Total Return | | | +1.86% | | | | +6.19% | | | | +5.77% | |
*The Fund has a fee waiver associated with its investments in a Franklin Templeton money fund, contractually guaranteed through at least its current fiscal year-end. Fund investment results reflect the fee waiver, to the extent applicable; without this reduction, the results would have been lower.
Performance reflects the Fund’s Class 2 operating expenses, but does not include any contract fees, expenses or sales charges. If they had been included, performance would be lower. These charges and deductions, particularly for variable life policies, can have a significant effect on contract values and insurance benefits. See the contract prospectus for a complete description of these expenses, including sales charges.
Performance data represent past performance, which does not guarantee future results. Investment return and principal value will fluctuate, and you may have a gain or loss when you sell your shares. Current performance may differ from figures shown.
Total Return Index Comparison for a Hypothetical $10,000 Investment (1/1/05–12/31/14)
The graph below shows the change in value of a hypothetical $10,000 investment in the Fund over the indicated period and includes reinvestment of any income or distributions. The Fund’s performance* is compared to the performance of the Barclays U.S. Aggregate Index and the Lipper Multi-Sector Income Funds Classification Average. One cannot invest directly in an index, and an index is not representative of the Fund’s portfolio. Please see Important Notes to Performance Information preceding the Fund Summaries.
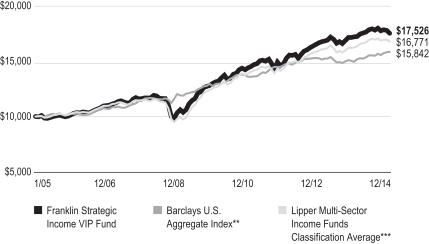
**Source: Morningstar. Please see Index Descriptions following the Fund Summaries.
***Source: Lipper, a Thomson Reuters Company. Please see Index Descriptions following the Fund Summaries.
FRANKLIN STRATEGIC INCOME VIP FUND
Fund Goals and Main Investments
Franklin Strategic Income VIP Fund seeks a high level of current income, with capital appreciation over the long term as a secondary goal. Under normal market conditions, the Fund invests primarily to predominantly in U.S. and foreign debt securities, including those in emerging markets.
Fund Risks
All investments involve risks, including possible loss of principal. Bond prices generally move in the opposite direction of interest rates. Thus, as prices of bonds in the Fund adjust to a rise in interest rates, the Fund’s share price may decline. Changes in the financial strength of a bond issuer or in a bond’s credit rating may affect its value. High yields reflect the higher credit risks associated with certain lower rated securities held in the portfolio. Floating rate loans and high yield corporate bonds are rated below investment grade and are subject to greater risk of default, which could result in loss of principal — a risk that may be heightened in a slowing economy. The risks of foreign securities include currency fluctuations and political uncertainty. Investments in developing markets involve heightened risks related to the same factors, in addition to those associated with their relatively small size and lesser liquidity. Investing in derivative securities and the use of foreign currency techniques involve special risks as such may not achieve the anticipated benefits and/or may result in losses to the Fund. The Fund is actively managed but there is no guarantee that the manager’s investment decisions will produce the desired results. The Fund’s prospectus also includes a description of the main investment risks.
Performance Overview
You can find the Fund’s one-year total return in the Performance Summary. For comparison, the Fund’s benchmark, the Barclays U.S. Aggregate Index, delivered a +5.97% total return for the period under review.1 The Fund’s peers, as measured by the Lipper Multi-Sector Income Funds Classification Average, produced a +3.03% return.2
Economic and Market Overview
The U.S. economy continued to grow during the year ended December 31, 2014, underpinned in some quarters by manufacturing activity, consumer and business spending, and federal
defense spending. Home sales experienced weakness resulting from reduced inventory, higher mortgage rates and tight credit requirements but began to recover in May as mortgage rates declined. Home prices stayed higher than a year earlier. Retail sales generally improved, supported by job growth and lower gasoline prices in the latter part of 2014. The unemployment rate declined to 5.6% in December 2014 from 6.7% in December 2013.3 Inflation, as measured by the Consumer Price Index, remained low.
In January 2014, the U.S. Federal Reserve Board (Fed) began reducing its large-scale bond purchases $10 billion a month and ended the buying program in October. But it continued its practice of maintaining holdings of longer term securities at sizable levels. The Fed believed underlying economic strength could support ongoing progress in labor market conditions. The Fed also noted that although inflation might remain low in the near term, the likelihood of inflation running persistently below 2% had diminished. Toward period-end, the Fed stated that it could be patient with regard to raising interest rates and that the interest rate might not rise for at least a couple of meetings, possibly implying at least the first two meetings of 2015.
The 10-year Treasury yield declined from 3.04% at the beginning of the period to 2.17% at period-end, as investors shifted to less risky assets given the crises in Ukraine and the Middle East, weak economic data in Europe and Japan, record-low bond yields and lower Treasury issuance.
The U.S. dollar broadly strengthened over the course of the year while oil prices weakened significantly, particularly in the final months. Global liquidity from the Bank of Japan (BOJ) and the European Central Bank (ECB) helped dampen volatility in emerging markets, and it helped compensate for the withdrawal of liquidity from the ending of the Fed’s bond buying program in October. Some emerging market economies had healthy current account and fiscal balances with strong export-driven economies, while others struggled with deficits and economic imbalances.
Investment Strategy
We allocate our investments among the various types of debt available based on our assessment of changing economic, global market, industry and issuer conditions. We use a top-down analysis of macroeconomic trends, combined with a bottom-up fundamental analysis of market sectors, industries
1. Source: Morningstar.
2. Source: Lipper, a Thomson Reuters Company.
One cannot invest directly in an index, and an index is not representative of the Fund’s portfolio. Please see Index Descriptions following the Fund Summaries.
3. Source: Bureau of Labor Statistics.
FRANKLIN STRATEGIC INCOME VIP FUND
and issuers, seeking to take advantage of varying sector reactions to economic events. For example, we may evaluate business cycles, yield curves, country risk, and the relative interest rates among currencies, and values between and within markets. In selecting debt securities, we generally conduct our own analysis of the security’s intrinsic value rather than simply relying on the coupon rate or rating. We may also enter into various transactions involving certain currency-, interest rate- or credit-related derivative instruments.
Manager’s Discussion
Contrary to year-end 2013 consensus forecasts, longer term U.S. interest rates moved markedly lower over the course of 2014. Initially, weaker first-quarter economic growth following a cold winter led rates lower. However, even as the U.S. economy recovered during the remainder of the year, fairly subdued levels of inflation, helped by declining energy prices, as well as some risk aversion due to geopolitical conflicts from Russia to the Middle East, caused rates to remain low by period-end. The Fed announced the end of new asset purchases as part of its quantitative easing (QE) program, but an expected ramp-up in QE by the ECB and the BOJ also maintained global demand for G3 (U.S., eurozone and Japan) government bonds. Although periods of risk aversion did cause financial market volatility during the period, for the past year domestic equity markets rose, and the Standard & Poor’s® 500 Index gained 13.69%, supported by corporate earnings and an outlook for improving U.S. economic growth heading into 2015.1
The Fund posted a positive total return for the review period but lagged the Barclays U.S. Aggregate Index and the Lipper Multi-Sector Income Funds Classification Average. Given the decline in longer term rates during the period, longer duration U.S. fixed income securities performed well. Additionally, high yield corporates underperformed as did certain non-U.S. dollar government bond sectors due to a stronger U.S. dollar. Consequently, relative to the Fund’s benchmarks, the Fund’s heavier weightings to high yield and global bonds detracted from performance, as did the Fund’s lesser exposure to U.S. interest rate duration than the benchmark. In contrast, the Fund’s short position in the Japanese yen aided returns given weakness in the yen relative to the U.S. dollar. The Fund’s longer duration municipal bonds, investment-grade corporate holdings and commercial mortgage-backed securities also added to returns, as did exposure to the leveraged bank loan sector.
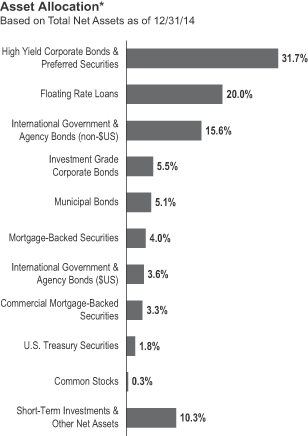
*Figures reflect certain derivatives held in the portfolio (or their underlying reference assets) and may not total 100% or may be negative due to rounding, use of derivatives, unsettled trades or other factors. The breakdown may not match the Statement of Investments (SOI).
The dollar value, number of shares or principal amount, and names of all portfolio holdings are listed in the Fund’s SOI.
What is duration?
Duration is a measure of a bond’s price sensitivity to interest rate changes. In general, a portfolio of securities with a lower duration can be expected to be less sensitive to interest rate changes than a portfolio with a higher duration.
In the corporate sectors, credit fundamentals remained largely supportive, with growing corporate earnings and relatively subdued default rates. However, several years into the economic recovery, management teams have been getting more comfortable taking on incremental leverage for certain capital projects, mergers and acquisitions activity, and shareholder remuneration. Moreover, weakness in certain commodity prices, including coal, iron ore and oil, negatively impacted sentiment in the
FRANKLIN STRATEGIC INCOME VIP FUND
mining and energy sectors during the period. A significant drop in crude oil prices caused meaningful downward pressure on high yield energy bonds during 2014’s fourth quarter. Finally, relatively robust new-issue supply combined with retail fund outflows in the high yield and leveraged loans sectors also added some downward pressure on security prices. Overall, with what we believed was still a supportive intermediate-term fundamental backdrop, the Fund increased its exposure to leveraged loans during the period while raising its weighting in high yield corporate bonds during the latter half of 2014. However, as investment-grade corporate bonds tended to have longer interest rate duration and appreciated during the period, the Fund reduced its exposure to this asset class.
Internationally, given the stronger outlook for the U.S. economy compared to other foreign developed markets, the broad trade-weighted U.S. dollar rallied during the period. As a result, the Fund’s position in certain non-U.S. dollar global bonds and currencies detracted from performance, with particular weakness in the Brazilian real, Chilean peso, Mexican peso and Uruguayan peso. Conversely, the Fund’s short position in the Japanese yen, through the use of currency forwards, added to returns, as that currency declined relative to the U.S. dollar. Overall, the Fund reduced its non-U.S. dollar weighting during the year, given an outlook for stronger relative U.S. economic growth. The Fund maintained fairly modest exposure to hard currency emerging market bonds, although a position in Ukraine debt securities detracted from performance given the nation’s conflict with Russia.
What is a currency forward contract?
A currency forward contract, or a currency forward, is an agreement between the Fund and a counterparty to buy or sell a foreign currency at a specific exchange rate on a future date.
With the decline in longer term U.S. rates, the more rate-sensitive fixed income sectors (Treasuries, agencies and mortgage-backed
securities) generally posted positive returns during the period. The Fund maintained a lower exposure to these sectors, preferring higher income opportunities in the corporate credit markets.
The combination of lower U.S. rates and some inflows into dedicated municipal bond funds helped to support performance in this sector. However, concerns regarding Puerto Rico’s debt burden as well as the commonwealth’s prospective treatment of certain municipal obligations in a restructuring scenario put pressure on select issues over the past year. Given overall strong performance from municipal securities, the Fund reduced its exposure to municipal debt during the period.
The portfolio utilized derivatives, including currency forwards and credit derivatives.
What is a credit derivative?
A credit derivative is a contract agreement between the Fund and a counterparty that is principally used by the Fund to gain or increase exposure to certain high yield securities or segments of the high yield bond market and/or to hedge against credit risk.
Thank you for your participation in Franklin Strategic Income VIP Fund. We look forward to serving your future investment needs.
The foregoing information reflects our analysis, opinions and portfolio holdings as of December 31, 2014, the end of the reporting period. The way we implement our main investment strategies and the resulting portfolio holdings may change depending on factors such as market and economic conditions. These opinions may not be relied upon as investment advice or an offer for a particular security. The information is not a complete analysis of every aspect of any market, country, industry, security or the Fund. Statements of fact are from sources considered reliable, but the investment manager makes no representation or warranty as to their completeness or accuracy. Although historical performance is no guarantee of future results, these insights may help you understand our investment management philosophy.
FRANKLIN STRATEGIC INCOME VIP FUND
Class 2 Fund Expenses
As an investor in a variable insurance contract (Contract) that indirectly provides for investment in an underlying mutual fund, you can incur transaction and/or ongoing expenses at both the Fund level and the Contract level.
| • | | Transaction expenses can include sales charges (loads) on purchases, redemption fees, surrender fees, transfer fees and premium taxes. |
| • | | Ongoing expenses can include management fees, distribution and service (12b-1) fees, contract fees, annual maintenance fees, mortality and expense risk fees and other fees and expenses. All mutual funds and Contracts have some types of ongoing expenses. |
The expenses shown in the table are meant to highlight ongoing expenses at the Fund level only and do not include ongoing expenses at the Contract level, or transaction expenses at either the Fund or Contract level. While the Fund does not have transaction expenses, if the transaction and ongoing expenses at the Contract level were included, the expenses shown below would be higher. You should consult your Contract prospectus or disclosure document for more information.
The table shows Fund-level ongoing expenses and can help you understand these expenses and compare them with those of other mutual funds offered through the Contract. The table assumes a $1,000 investment held for the six months indicated. Please refer to the Fund prospectus for additional information on operating expenses.
Actual Fund Expenses
The first line (Actual) of the table provides actual account values and expenses. The “Ending Account Value” is derived from the Fund’s actual return, which includes the effect of ongoing Fund expenses, but does not include the effect of ongoing Contract expenses.
You can estimate the Fund-level expenses you incurred during the period by following these steps. Of course, your account value and expenses will differ from those in this illustration:
| 1. | Divide your account value by $1,000. |
If an account had an $8,600 value,
then $8,600 ÷ $1,000 = 8.6.
| 2. | Multiply the result by the number under the heading “Fund-Level Expenses Incurred During Period.” |
If Fund-Level Expenses Incurred During Period were $7.50, then 8.6 × $7.50 = $64.50.
In this illustration, the estimated expenses incurred this period at the Fund level are $64.50.
Hypothetical Example for Comparison with Other Mutual Funds
Information in the second line (Hypothetical) of the table can help you compare ongoing expenses of the Fund with those of other mutual funds offered through the Contract. This information may not be used to estimate the actual ending account balance or expenses you incurred during the period. The hypothetical “Ending Account Value” is based on the Fund’s actual expense ratio and an assumed 5% annual rate of return before expenses, which does not represent the Fund’s actual return. The figure under the heading “Fund-Level Expenses Incurred During Period” shows the hypothetical expenses your account would have incurred under this scenario. You can compare this figure with the 5% hypothetical examples that appear in shareholder reports of other funds offered through a Contract.
| | | | | | | | | | | | |
| Class 2 | | Beginning Account Value 7/1/14 | | | Ending Account
Value 12/31/14 | | | Fund-Level Expenses
Incurred During Period* 7/1/14–12/31/14 | |
Actual | | $ | 1,000 | | | $ | 978.00 | | | $ | 4.34 | |
Hypothetical (5% return before expenses) | | $ | 1,000 | | | $ | 1,020.82 | | | $ | 4.43 | |
*Expenses are calculated using the most recent six-month annualized expense ratio, net of expense waivers, for the Fund’s Class 2 shares (0.87%), which does not include any ongoing expenses of the Contract for which the Fund is an investment option, multiplied by the average account value over the period, multiplied by 184/365 to reflect the one-half year period.
SUPPLEMENT DATED DECEMBER 15, 2014
TO THE PROSPECTUSES DATED MAY 1, 2014
OF
FRANKLIN STRATEGIC INCOME VIP FUND
(A series of Franklin Templeton Variable Insurance Products Trust)
The prospectus is amended as follows:
I. The fourth paragraph of the Fund Summary “Principal Investment Strategies” section beginning on page FSI-S1 is replaced with the following:
For purposes of pursuing its investment goals, the Fund regularly enters into various currency-related transactions involving derivative instruments, including currency and cross currency forwards, currency swaps, and currency and currency index futures contracts. The Fund may also enter into interest rate and credit-related transactions involving derivative instruments, including interest rate, fixed income total return and credit default swaps and bond/interest rate futures contracts. The use of these derivative transactions may allow the Fund to obtain net long or net short exposures to selected currencies, interest rates, durations or credit risks. These derivative instruments may be used for hedging purposes, to enhance Fund returns or to obtain exposure to various market sectors.
II. The Fund Summary “Principal Risks – Derivative Instruments” section on page FSI-S3 is replaced with the following:
Derivative Instruments The performance of derivative instruments depends largely on the performance of an underlying instrument, such as a currency, security, interest rate or index, and such instruments often have risks similar to the underlying instrument, in addition to other risks. Derivatives involve costs and can create economic leverage in the Fund’s portfolio which may result in significant volatility and cause the Fund to participate in losses (as well as gains) in an amount that exceeds the Fund’s initial investment. Other risks include illiquidity, mispricing or improper valuation of the derivative instrument, and imperfect correlation between the value of the derivative and the underlying instrument so that the Fund may not realize the intended benefits. When used for hedging, the change in value of the derivative may also not correlate specifically with the currency, security or other risk being hedged. With over-the-counter derivatives, there is the risk that the other party to the transaction will fail to perform.
III. The ninth paragraph of the Fund Details “Principal Investment Policies and Practices” section beginning on page FSI-D1 is replaced with the following:
For purposes of pursuing its investment goals, the Fund regularly enters into currency-related transactions involving derivative instruments, including currency and cross currency forwards, currency swaps, currency and currency index futures contracts, and currency options. The Fund may also enter into interest rate and credit-related transactions involving certain derivative instruments, including interest rate and credit default swaps and interest rate and/or bond futures contracts (including U.S. Treasury futures contracts) and options thereon, and fixed income total return and inflation index swaps. The use of such derivative transactions may allow the Fund to obtain net long or net short exposures to selected currencies, interest rates, countries, durations or credit risks. The Fund may use currency, interest rate or credit-related derivative strategies for the purposes of enhancing Fund returns, increasing liquidity,
gaining exposure to particular instruments in more efficient or less expensive ways and/or hedging risks relating to changes in currency exchange rates, credit risks, interest rates and other market factors.
IV. The fourteenth paragraph of the Fund Details “Principal Investment Policies and Practices” section beginning on page FSI-D1 is replaced with the following:
Swap agreements, such as interest rate, fixed income total return, currency, inflation index and credit default swaps, are contracts between the Fund and another party (the swap counterparty) involving the exchange of payments on specified terms over periods ranging from a few days to multiple years. A swap agreement may be negotiated bilaterally and traded over-the-counter (OTC) between the two parties (for an uncleared swap) or, in some instances, must be transacted through a futures commission merchant (FCM) and cleared through a clearinghouse that serves as a central counterparty (for a cleared swap). In a basic swap transaction, the Fund agrees with the swap counterparty to exchange the returns (or differentials in rates of return) earned or realized on a particular “notional amount” of underlying instruments. The notional amount is the set amount selected by the parties as the basis on which to calculate the obligations that they have agreed to exchange. The parties typically do not actually exchange the notional amount. Instead, they agree to exchange the returns that would be earned or realized if the notional amount were invested in given instruments or at given interest rates.
V. The Fund Details “Principal Investment Policies and Practices” section beginning on page FSI-D1 is revised to add the following paragraph immediately following the paragraph that begins with “An interest rate swap…”:
A total return swap is an agreement between two parties, pursuant to which one pays (and the other receives) an amount equal to the total return (including, typically, income and capital gains distributions, principal prepayment or credit losses) of an underlying reference asset (e.g., a note, bond or securities index) in exchange for a regular payment, at a floating rate based on LIBOR, or alternatively at a fixed rate or the total rate of return on another financial instrument. A Fund may take either position in a total return swap (i.e., the Fund may receive or pay the total return on the underlying reference asset).
Please keep this supplement with your prospectus for future reference.
SUPPLEMENT DATED DECEMBER 15, 2014
TO THE STATEMENT OF ADDITIONAL INFORMATION
DATED MAY 1, 2014
OF
FRANKLIN STRATEGIC INCOME VIP FUND
(A series of Franklin Templeton Variable Insurance Products Trust)
The statement of additional information is amended as follows:
I. The following is added to the “Glossary of Investments, Techniques, Strategies and Their Risks – Derivative instruments – Swaps” section:
Fixed income total return swaps. Generally, a total return swap is an agreement between two parties, pursuant to which one pays (and the other receives) an amount equal to the total return (including, typically, income and capital gains distributions, principal prepayment or credit losses) of an underlying reference asset (e.g., a note, bond or securities index) in exchange for a regular payment, at a floating rate based on LIBOR, or alternatively at a fixed rate or the total rate of return on another financial instrument. A Fund may take either position in a total return swap (i.e., the Fund may receive or pay the total return on the underlying reference asset). A fixed income total return swap may be written on many different kinds of underlying reference assets, and may include different indices for various kinds of debt securities (e.g., U.S. investment grade bonds, high yield bonds or emerging market bonds). A fixed income total return swap is similar to other swaps, such as interest rate swaps where payment streams are exchanged between a fund and the counterparty.
Please keep this supplement with your statement of additional information for future reference.
FRANKLIN TEMPLETON VARIABLE INSURANCE PRODUCTS TRUST
Financial Highlights
Franklin Strategic Income VIP Fund
| | | | | | | | | | | | | | | | | | | | |
| | | Year Ended December 31, | |
| | | 2014 | | | 2013 | | | 2012 | | | 2011 | | | 2010 | |
| Class 1 | | | | | | | | | | | | | | | | | | | | |
Per share operating performance
(for a share outstanding throughout the year) | | | | | | | | | | | | | | | | | | | | |
| | | | | |
Net asset value, beginning of year | | | $12.64 | | | | $13.17 | | | | $12.55 | | | | $12.99 | | | | $12.28 | |
| | | | |
| | | | | |
| Income from investment operationsa: | | | | | | | | | | | | | | | | | | | | |
| | | | | |
Net investment incomeb | | | 0.54 | | | | 0.59 | | | | 0.65 | | | | 0.69 | | | | 0.72 | |
| | | | | |
Net realized and unrealized gains (losses) | | | (0.25 | ) | | | (0.15 | ) | | | 0.92 | | | | (0.32 | ) | | | 0.61 | |
| | | | |
Total from investment operations | | | 0.29 | | | | 0.44 | | | | 1.57 | | | | 0.37 | | | | 1.33 | |
| | | | |
| | | | | |
| Less distributions from: | | | | | | | | | | | | | | | | | | | | |
| | | | | |
Net investment income and net foreign currency gains | | | (0.78 | ) | | | (0.80 | ) | | | (0.93 | ) | | | (0.81 | ) | | | (0.62 | ) |
| | | | | |
Net realized gains | | | (0.25 | ) | | | (0.17 | ) | | | (0.02 | ) | | | — | | | | — | |
| | | | |
Total distributions | | | (1.03 | ) | | | (0.97 | ) | | | (0.95 | ) | | | (0.81 | ) | | | (0.62 | ) |
| | | | |
Net asset value, end of year | | | $11.90 | | | | $12.64 | | | | $13.17 | | | | $12.55 | | | | $12.99 | |
| | | | |
| | | | | |
Total returnc | | | 2.12% | | | | 3.52% | | | | 13.12% | | | | 2.78% | | | | 11.21% | |
| | | | | |
| Ratios to average net assets | | | | | | | | | | | | | | | | | | | | |
| | | | | |
Expenses before waiver and payments by affiliates | | | 0.63% | | | | 0.60% | | | | 0.58% | | | | 0.60% | | | | 0.59% | |
| | | | | |
Expenses net of waiver and payments by affiliates | | | 0.62% | d | | | 0.60% | d | | | 0.58% | | | | 0.60% | d | | | 0.59% | d |
| | | | | |
Net investment income | | | 4.34% | | | | 4.58% | | | | 5.04% | | | | 5.36% | | | | 5.71% | |
| | | | | |
| Supplemental data | | | | | | | | | | | | | | | | | | | | |
| | | | | |
Net assets, end of year (000’s) | | | $574,850 | | | | $705,493 | | | | $1,019,537 | | | | $1,043,690 | | | | $1,195,149 | |
| | | | | |
Portfolio turnover rate | | | 55.64% | | | | 48.06% | | | | 49.98% | | | | 55.65% | | | | 56.46% | |
| | | | | |
Portfolio turnover rate excluding mortgage dollar rollse | | | 48.86% | | | | 47.01% | | | | 48.75% | | | | 55.65% | | | | 56.46% | |
aThe amount shown for a share outstanding throughout the period may not correlate with the Statement of Operations for the period due to the timing of sales and repurchases of the Fund shares in relation to income earned and/or fluctuating fair value of the investments of the Fund.
bBased on average daily shares outstanding.
cTotal return does not include fees, charges or expenses imposed by the variable annuity and life insurance contracts for which Franklin Templeton Variable Insurance Products Trust serves as an underlying investment vehicle.
dBenefit of expense reduction rounds to less than 0.01%.
eSee Note 1(h) regarding mortgage dollar rolls.
| | | | | | |
| | | The accompanying notes are an integral part of these financial statements. | Annual Report | | | FSI-9 | |
FRANKLIN TEMPLETON VARIABLE INSURANCE PRODUCTS TRUST
FINANCIAL HIGHLIGHTS
Franklin Strategic Income VIP Fund (continued)
| | | | | | | | | | | | | | | | | | | | |
| | | Year Ended December 31, | |
| | | 2014 | | | 2013 | | | 2012 | | | 2011 | | | 2010 | |
| Class 2 | | | | | | | | | | | | | | | | | | | | |
Per share operating performance
(for a share outstanding throughout the year) | | | | | | | | | | | | | | | | | | | | |
| | | | | |
Net asset value, beginning of year | | | $12.30 | | | | $12.84 | | | | $12.27 | | | | $12.72 | | | | $12.05 | |
| | | | |
| | | | | |
| Income from investment operationsa: | | | | | | | | | | | | | | | | | | | | |
| | | | | |
Net investment incomeb | | | 0.49 | | | | 0.54 | | | | 0.60 | | | | 0.64 | | | | 0.68 | |
| | | | | |
Net realized and unrealized gains (losses) | | | (0.24 | ) | | | (0.13 | ) | | | 0.89 | | | | (0.30 | ) | | | 0.59 | |
| | | | |
Total from investment operations | | | 0.25 | | | | 0.41 | | | | 1.49 | | | | 0.34 | | | | 1.27 | |
| | | | |
| | | | | |
| Less distributions from: | | | | | | | | | | | | | | | | | | | | |
| | | | | |
Net investment income and net foreign currency gains | | | (0.75 | ) | | | (0.78 | ) | | | (0.90 | ) | | | (0.79 | ) | | | (0.60 | ) |
| | | | | |
Net realized gains | | | (0.25 | ) | | | (0.17 | ) | | | (0.02 | ) | | | — | | | | — | |
| | | | |
Total distributions | | | (1.00 | ) | | | (0.95 | ) | | | (0.92 | ) | | | (0.79 | ) | | | (0.60 | ) |
| | | | |
Net asset value, end of year | | | $11.55 | | | | $12.30 | | | | $12.84 | | | | $12.27 | | | | $12.72 | |
| | | | |
| | | | | |
Total returnc | | | 1.86% | | | | 3.32% | | | | 12.75% | | | | 2.57% | | | | 10.91% | |
| | | | | |
| Ratios to average net assets | | | | | | | | | | | | | | | | | | | | |
| | | | | |
Expenses before waiver and payments by affiliates | | | 0.88% | | | | 0.85% | | | | 0.83% | | | | 0.85% | | | | 0.84% | |
| | | | | |
Expenses net of waiver and payments by affiliates | | | 0.87% | d | | | 0.85% | d | | | 0.83% | | | | 0.85% | d | | | 0.84% | d |
| | | | | |
Net investment income | | | 4.09% | | | | 4.33% | | | | 4.79% | | | | 5.11% | | | | 5.46% | |
| | | | | |
| Supplemental data | | | | | | | | | | | | | | | | | | | | |
| | | | | |
Net assets, end of year (000’s) | | | $206,571 | | | | $175,307 | | | | $158,451 | | | | $123,749 | | | | $101,347 | |
| | | | | |
Portfolio turnover rate | | | 55.64% | | | | 48.06% | | | | 49.98% | | | | 55.65% | | | | 56.46% | |
| | | | | |
Portfolio turnover rate excluding mortgage dollar rollse | | | 48.86% | | | | 47.01% | | | | 48.75% | | | | 55.65% | | | | 56.46% | |
aThe amount shown for a share outstanding throughout the period may not correlate with the Statement of Operations for the period due to the timing of sales and repurchases of the Fund shares in relation to income earned and/or fluctuating fair value of the investments of the Fund.
bBased on average daily shares outstanding.
cTotal return does not include fees, charges or expenses imposed by the variable annuity and life insurance contracts for which Franklin Templeton Variable Insurance Products Trust serves as an underlying investment vehicle.
dBenefit of expense reduction rounds to less than 0.01%.
eSee Note 1(h) regarding mortgage dollar rolls.
| | | | |
| FSI-10 | | Annual Report | The accompanying notes are an integral part of these financial statements. | | |
FRANKLIN TEMPLETON VARIABLE INSURANCE PRODUCTS TRUST
FINANCIAL HIGHLIGHTS
Franklin Strategic Income VIP Fund (continued)
| | | | | | | | | | | | | | | | | | | | |
| | | Year Ended December 31, | |
| | | 2014 | | | 2013 | | | 2012 | | | 2011 | | | 2010 | |
| Class 4 | | | | | | | | | | | | | | | | | | | | |
Per share operating performance
(for a share outstanding throughout the year) | | | | | | | | | | | | | | | | | | | | |
| | | | | |
Net asset value, beginning of year | | | $12.51 | | | | $13.04 | | | | $12.44 | | | | $12.88 | | | | $12.20 | |
| | | | |
| | | | | |
| Income from investment operationsa: | | | | | | | | | | | | | | | | | | | | |
| | | | | |
Net investment incomeb | | | 0.49 | | | | 0.54 | | | | 0.60 | | | | 0.64 | | | | 0.67 | |
| | | | | |
Net realized and unrealized gains (losses) | | | (0.25 | ) | | | (0.14 | ) | | | 0.91 | | | | (0.31 | ) | | | 0.60 | |
| | | | |
Total from investment operations | | | 0.24 | | | | 0.40 | | | | 1.51 | | | | 0.33 | | | | 1.27 | |
| | | | |
| | | | | |
| Less distributions from: | | | | | | | | | | | | | | | | | | | | |
| | | | | |
Net investment income and net foreign currency gains | | | (0.72 | ) | | | (0.76 | ) | | | (0.89 | ) | | | (0.77 | ) | | | (0.59 | ) |
| | | | | |
Net realized gains | | | (0.25 | ) | | | (0.17 | ) | | | (0.02 | ) | | | — | | | | — | |
| | | | |
Total distributions | | | (0.97 | ) | | | (0.93 | ) | | | (0.91 | ) | | | (0.77 | ) | | | (0.59 | ) |
| | | | |
Net asset value, end of year | | | $11.78 | | | | $12.51 | | | | $13.04 | | | | $12.44 | | | | $12.88 | |
| | | | |
| | | | | |
Total returnc | | | 1.75% | | | | 3.17% | | | | 12.67% | | | | 2.46% | | | | 10.88% | |
| | | | | |
| Ratios to average net assets | | | | | | | | | | | | | | | | | | | | |
| | | | | |
Expenses before waiver and payments by affiliates | | | 0.98% | | | | 0.95% | | | | 0.93% | | | | 0.95% | | | | 0.94% | |
| | | | | |
Expenses net of waiver and payments by affiliates | | | 0.97% | d | | | 0.95% | d | | | 0.93% | | | | 0.95% | d | | | 0.94% | d |
| | | | | |
Net investment income | | | 3.99% | | | | 4.23% | | | | 4.69% | | | | 5.01% | | | | 5.36% | |
| | | | | |
| Supplemental data | | | | | | | | | | | | | | | | | | | | |
| | | | | |
Net assets, end of year (000’s) | | | $113,986 | | | | $134,970 | | | | $196,479 | | | | $188,786 | | | | $188,178 | |
| | | | | |
Portfolio turnover rate | | | 55.64% | | | | 48.06% | | | | 49.98% | | | | 55.65% | | | | 56.46% | |
| | | | | |
Portfolio turnover rate excluding mortgage dollar rollse | | | 48.86% | | | | 47.01% | | | | 48.75% | | | | 55.65% | | | | 56.46% | |
aThe amount shown for a share outstanding throughout the period may not correlate with the Statement of Operations for the period due to the timing of sales and repurchases of the Fund shares in relation to income earned and/or fluctuating fair value of the investments of the Fund.
bBased on average daily shares outstanding.
cTotal return does not include fees, charges or expenses imposed by the variable annuity and life insurance contracts for which Franklin Templeton Variable Insurance Products Trust serves as an underlying investment vehicle.
dBenefit of expense reduction rounds to less than 0.01%.
eSee Note 1(h) regarding mortgage dollar rolls.
| | | | | | |
| | | The accompanying notes are an integral part of these financial statements. | Annual Report | | | FSI-11 | |
FRANKLIN TEMPLETON VARIABLE INSURANCE PRODUCTS TRUST
Statement of Investments, December 31, 2014
| | | | | | | | | | | | | | |
| Franklin Strategic Income VIP Fund | | | | | | | | | |
| | | | | Country | | | Shares/Units | | | Value | |
| | Common Stocks and Other Equity Interests 1.5% | | | | | | | | | | | | |
| | Consumer Services 0.3% | | | | | | | | | | | | |
| a,b,c | | Turtle Bay Resort | | | United States | | | | 1,901,449 | | | $ | 2,566,956 | |
| | | | | | | | | | | | | | |
| | Diversified Financials 1.1% | | | | | | | | | | | | |
| | iShares iBoxx High Yield Corporate Bond ETF | | | United States | | | | 110,000 | | | | 9,856,000 | |
| | | | | | | | | | | | | | |
| | Materials 0.1% | | | | | | | | | | | | |
| | NewPage Holdings Inc. | | | United States | | | | 5,000 | | | | 453,750 | |
| | | | | | | | | | | | | | |
| | Transportation 0.0%† | | | | | | | | | | | | |
| a | | CEVA Holdings LLC | | | United Kingdom | | | | 224 | | | | 173,817 | |
| | | | | | | | | | | | | | |
| | | | |
| | Total Common Stocks and Other Equity Interests (Cost $13,344,286) | | | | | | | | | | | 13,050,523 | |
| | | | | | | | | | | | | | |
| | Convertible Preferred Stocks 0.0%† | | | | | | | | | | | | |
| | Transportation 0.0%† | | | | | | | | | | | | |
| a | | CEVA Holdings LLC, cvt. pfd., A-1 | | | United Kingdom | | | | 6 | | | | 6,000 | |
| a | | CEVA Holdings LLC, cvt. pfd., A-2 | | | United Kingdom | | | | 486 | | | | 376,270 | |
| | | | | | | | | | | | | | |
| | | | |
| | Total Convertible Preferred Stocks (Cost $731,856) | | | | | | | | | | | 382,270 | |
| | | | | | | | | | | | | | |
| | Preferred Stocks (Cost $625,000) 0.1% | | | | | | | | | | | | |
| | Diversified Financials 0.1% | | | | | | | | | | | | |
| | GMAC Capital Trust I, 8.125%, pfd. | | | United States | | | | 25,000 | | | | 659,500 | |
| | | | | | | | | | | | | | |
| | | | |
| | | | | | | | Principal Amount* | | | | |
| | Corporate Bonds 35.8% | | | | | | | | | | | | |
| | Automobiles & Components 0.4% | | | | | | | | | | | | |
| d | | Avis Budget Finance PLC, senior note, 144A, 6.00%, 3/01/21 | | | United States | | | | 1,000,000 | EUR | | | 1,275,037 | |
| | The Goodyear Tire & Rubber Co., senior note, 6.50%, 3/01/21 | | | United States | | | | 2,000,000 | | | | 2,130,000 | |
| | | | | | | | | | | | | | |
| | | | | | | | | | | | | 3,405,037 | |
| | | | | | | | | | | | | | |
| | Banks 2.6% | | | | | | | | | | | | |
| | Bank of America Corp., | | | | | | | | | | | | |
| | e junior sub. bond, M, 8.125% to 5/15/18, FRN thereafter, Perpetual | | | United States | | | | 2,500,000 | | | | 2,709,375 | |
| | senior note, 5.65%, 5/01/18 | | | United States | | | | 1,500,000 | | | | 1,667,733 | |
| | CIT Group Inc., senior note, | | | | | | | | | | | | |
| | 5.375%, 5/15/20 | | | United States | | | | 1,000,000 | | | | 1,060,650 | |
| | 5.00%, 8/15/22 | | | United States | | | | 2,500,000 | | | | 2,578,125 | |
| | Citigroup Inc., | | | | | | | | | | | | |
| | e junior sub. bond, M, 6.30% to 5/15/24, FRN thereafter, Perpetual | | | United States | | | | 700,000 | | | | 691,250 | |
| | senior note, 3.875%, 10/25/23 | | | United States | | | | 3,000,000 | | | | 3,124,020 | |
| | sub. bond, 5.50%, 9/13/25 | | | United States | | | | 500,000 | | | | 554,386 | |
| | sub. note, 4.05%, 7/30/22 | | | United States | | | | 300,000 | | | | 310,903 | |
| | JPMorgan Chase & Co., | | | | | | | | | | | | |
| | e junior sub. bond, R, 6.00% to 8/01/23, FRN thereafter, Perpetual | | | United States | | | | 1,500,000 | | | | 1,488,750 | |
| | e junior sub. bond, V, 5.00% to 7/30/19, FRN thereafter, Perpetual | | | United States | | | | 200,000 | | | | 196,687 | |
| | e junior sub. note, X, 6.10% to 10/01/24, FRN thereafter, Perpetual | | | United States | | | | 500,000 | | | | 500,000 | |
| | senior note, 4.25%, 10/15/20 | | | United States | | | | 1,000,000 | | | | 1,075,929 | |
| | sub. note, 3.375%, 5/01/23 | | | United States | | | | 1,000,000 | | | | 990,381 | |
| | sub. note, 3.875%, 9/10/24 | | | United States | | | | 1,000,000 | | | | 1,002,054 | |
| | Royal Bank of Scotland Group PLC, sub. note, 6.125%, 12/15/22 | | | United Kingdom | | | | 1,000,000 | | | | 1,088,125 | |
| | The Royal Bank of Scotland PLC, sub. note, 6.934%, 4/09/18 | | | United Kingdom | | | | 1,500,000 | EUR | | | 2,095,191 | |
FRANKLIN TEMPLETON VARIABLE INSURANCE PRODUCTS TRUST
STATEMENT OF INVESTMENTS
Franklin Strategic Income VIP Fund (continued)
| | | | | | | | | | | | | | |
| | | | | Country | | | Principal Amount* | | | Value | |
| | Corporate Bonds (continued) | | | | | | | | | | | | |
| | Banks (continued) | | | | | | | | | | | | |
| e | | Wells Fargo & Co., junior sub. bond, S, 5.90% to 6/15/24, FRN thereafter, Perpetual | | | United States | | | | 2,500,000 | | | $ | 2,525,000 | |
| | | | | | | | | | | | | | |
| | | | | | | | | | | | | 23,658,559 | |
| | | | | | | | | | | | | | |
| | Capital Goods 0.8% | | | | | | | | | | | | |
| d | | Abengoa Finance SAU, senior note, 144A, | | | | | | | | | | | | |
| | 8.875%, 11/01/17 | | | Spain | | | | 2,000,000 | | | | 1,937,500 | |
| | 7.75%, 2/01/20 | | | Spain | | | | 200,000 | | | | 178,500 | |
| d | | AECOM Technology Corp., | | | | | | | | | | | | |
| | senior bond, 144A, 5.875%, 10/15/24 | | | United States | | | | 200,000 | | | | 205,000 | |
| | senior note, 144A, 5.75%, 10/15/22 | | | United States | | | | 300,000 | | | | 307,500 | |
| d | | KM Germany Holdings GmbH, senior secured note, first lien, 144A, 8.75%, 12/15/20 | | | Germany | | | | 900,000 | EUR | | | 1,184,287 | |
| | Navistar International Corp., senior note, 8.25%, 11/01/21 | | | United States | | | | 1,500,000 | | | | 1,485,000 | |
| | Terex Corp., senior note, 6.00%, 5/15/21 | | | United States | | | | 1,000,000 | | | | 1,025,000 | |
| | TransDigm Inc., | | | | | | | | | | | | |
| | senior sub. bond, 6.50%, 7/15/24 | | | United States | | | | 500,000 | | | | 505,000 | |
| | senior sub. note, 6.00%, 7/15/22 | | | United States | | | | 400,000 | | | | 401,000 | |
| | | | | | | | | | | | | | |
| | | | | | | | | | | | | 7,228,787 | |
| | | | | | | | | | | | | | |
| | Consumer Durables & Apparel 1.0% | | | | | | | | | | | | |
| d | | Financiere Gaillon 8 SAS, senior note, 144A, 7.00%, 9/30/19 | | | France | | | | 1,200,000 | EUR | | | 1,415,700 | |
| d | | INVISTA Finance LLC, senior secured note, 144A, 4.25%, 10/15/19 | | | United States | | | | 2,500,000 | | | | 2,512,500 | |
| | KB Home, senior note, | | | | | | | | | | | | |
| | 4.75%, 5/15/19 | | | United States | | | | 1,000,000 | | | | 987,500 | |
| | 7.00%, 12/15/21 | | | United States | | | | 1,600,000 | | | | 1,687,000 | |
| | M/I Homes Inc., senior note, 8.625%, 11/15/18 | | | United States | | | | 300,000 | | | | 312,750 | |
| | Toll Brothers Finance Corp., senior bond, 5.625%, 1/15/24 | | | United States | | | | 1,100,000 | | | | 1,166,000 | |
| | Visant Corp., senior note, 10.00%, 10/01/17 | | | United States | | | | 1,400,000 | | | | 1,232,000 | |
| | | | | | | | | | | | | | |
| | | | | | | | | | | | | 9,313,450 | |
| | | | | | | | | | | | | | |
| | Consumer Services 1.3% | | | | | | | | | | | | |
| d | | 1011778 BC ULC/New Red Finance Inc., secured note, second lien, 144A, 6.00%, 4/01/22 | | | Canada | | | | 2,000,000 | | | | 2,060,000 | |
| | Caesars Entertainment Operating Co. Inc., senior secured note, first lien, 11.25%, 6/01/17 | | | United States | | | | 2,600,000 | | | | 1,918,800 | |
| d,f | | Financiere Quick SAS, 144A, FRN, 7.582%, 10/15/19 | | | France | | | | 1,600,000 | EUR | | | 1,488,242 | |
| d,g | | Fontainebleau Las Vegas, senior secured note, first lien, 144A, 11.00%, 6/15/15 | | | United States | | | | 2,500,000 | | | | 31,250 | |
| | MGM Resorts International, senior note, | | | | | | | | | | | | |
| | 6.625%, 7/15/15 | | | United States | | | | 2,500,000 | | | | 2,550,000 | |
| | 6.75%, 10/01/20 | | | United States | | | | 200,000 | | | | 210,500 | |
| | 6.625%, 12/15/21 | | | United States | | | | 500,000 | | | | 527,500 | |
| | Pinnacle Entertainment Inc., senior note, 6.375%, 8/01/21 | | | United States | | | | 700,000 | | | | 724,500 | |
| d | | Scientific Games International Inc., | | | | | | | | | | | | |
| | senior note, 144A, 10.00%, 12/01/22 | | | United States | | | | 1,100,000 | | | | 1,013,375 | |
| | senior secured note, first lien, 144A, 7.00%, 1/01/22 | | | United States | | | | 800,000 | | | | 814,000 | |
| | | | | | | | | | | | | | |
| | | | | | | | | | | | | 11,338,167 | |
| | | | | | | | | | | | | | |
| | Diversified Financials 2.0% | | | | | | | | | | | | |
| d | | AerCap Ireland Capital Ltd./AerCap Global Aviation Trust,
senior note, 144A, 5.00%, 10/01/21 | | | Netherlands | | | | 1,100,000 | | | | 1,146,063 | |
FRANKLIN TEMPLETON VARIABLE INSURANCE PRODUCTS TRUST
STATEMENT OF INVESTMENTS
Franklin Strategic Income VIP Fund (continued)
| | | | | | | | | | | | | | |
| | | | | Country | | | Principal Amount* | | | Value | |
| | Corporate Bonds (continued) | | | | | | | | | | | | |
| | Diversified Financials (continued) | | | | | | | | | | | | |
| | Ally Financial Inc., senior note, 7.50%, 9/15/20 | | | United States | | | | 3,000,000 | | | $ | 3,525,000 | |
| | Deutsche Bank AG, sub. bond, 4.296% to 5/24/23, FRN thereafter, 5/24/28 | | | Germany | | | | 3,500,000 | | | | 3,405,482 | |
| | E*TRADE Financial Corp., senior note, | | | | | | | | | | | | |
| | 6.375%, 11/15/19 | | | United States | | | | 1,100,000 | | | | 1,171,500 | |
| | 5.375%, 11/15/22 | | | United States | | | | 700,000 | | | | 717,500 | |
| | General Electric Capital Corp., senior note, A, 8.50%, 4/06/18 | | | United States | | | | 29,000,000 | MXN | | | 2,179,277 | |
| | GMAC Inc., sub. note, 8.00%, 12/31/18 | | | United States | | | | 500,000 | | | | 568,750 | |
| | Navient Corp., senior note, | | | | | | | | | | | | |
| | 8.45%, 6/15/18 | | | United States | | | | 1,800,000 | | | | 2,011,500 | |
| | 5.50%, 1/15/19 | | | United States | | | | 1,500,000 | | | | 1,537,500 | |
| | 6.125%, 3/25/24 | | | United States | | | | 500,000 | | | | 492,500 | |
| d | | Neuberger Berman Group LLC/Finance Corp., senior note, 144A, 5.875%, 3/15/22 | | | United States | | | | 1,400,000 | | | | 1,480,500 | |
| | | | | | | | | | | | | | |
| | | | | | | | | | | | | 18,235,572 | |
| | | | | | | | | | | | | | |
| | Energy 7.0% | | | | | | | | | | | | |
| | Access Midstream Partner LP/ACMP Finance Corp., senior note, | | | | | | | | | | | | |
| | 5.875%, 4/15/21 | | | United States | | | | 1,500,000 | | | | 1,571,250 | |
| | 6.125%, 7/15/22 | | | United States | | | | 600,000 | | | | 640,500 | |
| | BreitBurn Energy Partners LP/BreitBurn Finance Corp., senior bond, 7.875%, 4/15/22 | | | United States | | | | 2,700,000 | | | | 2,099,250 | |
| d | | California Resources Corp., | | | | | | | | | | | | |
| | senior bond, 144A, 6.00%, 11/15/24 | | | United States | | | | 1,500,000 | | | | 1,275,000 | |
| | senior note, 144A, 5.50%, 9/15/21 | | | United States | | | | 800,000 | | | | 688,000 | |
| | CGG SA, senior note, | | | | | | | | | | | | |
| | 7.75%, 5/15/17 | | | France | | | | 159,000 | | | | 137,138 | |
| | 6.50%, 6/01/21 | | | France | | | | 1,800,000 | | | | 1,377,000 | |
| | 6.875%, 1/15/22 | | | France | | | | 200,000 | | | | 152,375 | |
| | CHC Helicopter SA, | | | | | | | | | | | | |
| | senior note, 9.375%, 6/01/21 | | | Canada | | | | 260,000 | | | | 245,700 | |
| | senior secured note, first lien, 9.25%, 10/15/20 | | | Canada | | | | 1,800,000 | | | | 1,755,000 | |
| | Chesapeake Energy Corp., senior note, | | | | | | | | | | | | |
| | 6.625%, 8/15/20 | | | United States | | | | 1,000,000 | | | | 1,067,500 | |
| | 6.125%, 2/15/21 | | | United States | | | | 1,500,000 | | | | 1,582,500 | |
| | 5.75%, 3/15/23 | | | United States | | | | 1,000,000 | | | | 1,035,000 | |
| | Clayton Williams Energy Inc., senior note, 7.75%, 4/01/19 | | | United States | | | | 2,000,000 | | | | 1,710,000 | |
| d | | CONSOL Energy Inc., senior note, 144A, 5.875%, 4/15/22 | | | United States | | | | 2,000,000 | | | | 1,870,000 | |
| | Energy Transfer Equity LP, senior note, 7.50%, 10/15/20 | | | United States | | | | 3,000,000 | | | | 3,345,000 | |
| | Energy Transfer Partners LP, senior note, 5.20%, 2/01/22 | | | United States | | | | 1,000,000 | | | | 1,071,095 | |
| | Energy XXI Gulf Coast Inc., senior note, | | | | | | | | | | | | |
| | 9.25%, 12/15/17 | | | United States | | | | 2,000,000 | | | | 1,330,000 | |
| | d 144A, 6.875%, 3/15/24 | | | United States | | | | 1,000,000 | | | | 542,500 | |
| d | | EnQuest PLC, senior note, 144A, 7.00%, 4/15/22 | | | United Kingdom | | | | 1,500,000 | | | | 921,563 | |
| | Freeport-McMoran Oil & Gas LLC/FCX Oil & Gas Inc., senior note, 6.875%, 2/15/23 | | | United States | | | | 672,000 | | | | 749,280 | |
| d,h | | Gaz Capital SA, (OJSC Gazprom), loan participation, | | | | | | | | | | | | |
| | senior bond, 144A, 6.51%, 3/07/22 | | | Russia | | | | 500,000 | | | | 450,125 | |
| | senior note, 144A, 5.092%, 11/29/15 | | | Russia | | | | 1,500,000 | | | | 1,473,337 | |
| | senior note, 144A, 3.85%, 2/06/20 | | | Russia | | | | 1,500,000 | | | | 1,241,407 | |
| | Halcon Resources Corp., senior note, | | | | | | | | | | | | |
| | 8.875%, 5/15/21 | | | United States | | | | 2,000,000 | | | | 1,515,000 | |
| | 9.25%, 2/15/22 | | | United States | | | | 800,000 | | | | 594,000 | |
FRANKLIN TEMPLETON VARIABLE INSURANCE PRODUCTS TRUST
STATEMENT OF INVESTMENTS
Franklin Strategic Income VIP Fund (continued)
| | | | | | | | | | | | | | |
| | | | | Country | | | Principal Amount* | | | Value | |
| | Corporate Bonds (continued) | | | | | | | | | | | | |
| | Energy (continued) | | | | | | | | | | | | |
| d | | Kinder Morgan Finance Co. LLC, senior secured note, 144A, 6.00%, 1/15/18 | | | United States | | | | 2,000,000 | | | $ | 2,177,600 | |
| | Kinder Morgan Inc., senior note, 6.50%, 9/15/20 | | | United States | | | | 1,500,000 | | | | 1,699,278 | |
| | Linn Energy LLC/Finance Corp., senior note, | | | | | | | | | | | | |
| | 8.625%, 4/15/20 | | | United States | | | | 2,000,000 | | | | 1,750,000 | |
| | 7.75%, 2/01/21 | | | United States | | | | 1,200,000 | | | | 1,017,000 | |
| | 6.50%, 9/15/21 | | | United States | | | | 200,000 | | | | 163,000 | |
| d | | LUKOIL International Finance BV, senior note, 144A, 4.563%, 4/24/23 | | | Russia | | | | 3,500,000 | | | | 2,800,455 | |
| | Martin Midstream Partners LP/Martin Midstream Finance Corp., senior note, 7.25%, 2/15/21 | | | United States | | | | 1,900,000 | | | | 1,795,500 | |
| | Midstates Petroleum Co. Inc./LLC, senior note, 9.25%, 6/01/21 | | | United States | | | | 1,700,000 | | | | 867,000 | |
| | Oasis Petroleum Inc., senior note, 6.875%, 3/15/22 | | | United States | | | | 1,300,000 | | | | 1,189,500 | |
| | Offshore Group Investment Ltd., | | | | | | | | | | | | |
| | senior bond, first lien, 7.125%, 4/01/23 | | | United States | | | | 700,000 | | | | 504,000 | |
| | senior secured note, first lien, 7.50%, 11/01/19 | | | United States | | | | 2,000,000 | | | | 1,502,500 | |
| | PBF Holding Co. LLC, first lien, 8.25%, 2/15/20 | | | United States | | | | 1,000,000 | | | | 1,010,000 | |
| | Peabody Energy Corp., senior note, | | | | | | | | | | | | |
| | 6.50%, 9/15/20 | | | United States | | | | 2,500,000 | | | | 2,181,250 | |
| | 6.25%, 11/15/21 | | | United States | | | | 1,500,000 | | | | 1,288,125 | |
| | Penn Virginia Corp., senior note, 8.50%, 5/01/20 | | | United States | | | | 1,500,000 | | | | 1,207,500 | |
| | Penn Virginia Resource Partners LP/Penn Virginia Resource Finance Corp., senior note, | | | | | | | | | | | | |
| | 8.375%, 6/01/20 | | | United States | | | | 1,172,000 | | | | 1,256,970 | |
| | 6.50%, 5/15/21 | | | United States | | | | 400,000 | | | | 406,000 | |
| d,f | | Quicksilver Resources Inc., secured note, second lien, 144A, FRN, 7.00%, 6/21/19 | | | United States | | | | 1,500,000 | | | | 1,121,250 | |
| | Regency Energy Partners LP/Regency Energy Finance Corp., senior note, | | | | | | | | | | | | |
| | 5.875%, 3/01/22 | | | United States | | | | 200,000 | | | | 200,500 | |
| | 5.00%, 10/01/22 | | | United States | | | | 400,000 | | | | 380,000 | |
| | Sabine Pass Liquefaction LLC, | | | | | | | | | | | | |
| | first lien, 5.625%, 2/01/21 | | | United States | | | | 2,500,000 | | | | 2,468,750 | |
| | first lien, 5.625%, 4/15/23 | | | United States | | | | 900,000 | | | | 884,250 | |
| | senior secured, first lien, 5.75%, 5/15/24 | | | United States | | | | 300,000 | | | | 295,875 | |
| | Samson Investment Co., senior note, 9.75%, 2/15/20 | | | United States | | | | 2,500,000 | | | | 1,048,438 | |
| | Sanchez Energy Corp., senior note, | | | | | | | | | | | | |
| | 7.75%, 6/15/21 | | | United States | | | | 1,700,000 | | | | 1,589,500 | |
| | d 144A, 6.125%, 1/15/23 | | | United States | | | | 600,000 | | | | 505,500 | |
| | W&T Offshore Inc., senior note, 8.50%, 6/15/19 | | | United States | | | | 2,000,000 | | | | 1,330,000 | |
| | | | | | | | | | | | | | |
| | | | | | | | | | | | | 63,079,261 | |
| | | | | | | | | | | | | | |
| | Food & Staples Retailing 0.2% | | | | | | | | | | | | |
| d | | Cencosud SA, senior note, 144A, 4.875%, 1/20/23 | | | Chile | | | | 1,500,000 | | | | 1,479,248 | |
| | | | | | | | | | | | | | |
| | Food, Beverage & Tobacco 0.9% | | | | | | | | | | | | |
| | Constellation Brands Inc., senior note, 4.25%, 5/01/23 | | | United States | | | | 1,000,000 | | | | 995,000 | |
| | Del Monte Corp., senior note, 7.625%, 2/15/19 | | | United States | | | | 1,736,000 | | | | 1,709,960 | |
| d | | JBS USA LLC/Finance Inc., senior note, 144A, | | | | | | | | | | | | |
| | 8.25%, 2/01/20 | | | United States | | | | 2,400,000 | | | | 2,538,000 | |
| | 7.25%, 6/01/21 | | | United States | | | | 300,000 | | | | 310,500 | |
FRANKLIN TEMPLETON VARIABLE INSURANCE PRODUCTS TRUST
STATEMENT OF INVESTMENTS
Franklin Strategic Income VIP Fund (continued)
| | | | | | | | | | | | | | |
| | | | | Country | | | Principal Amount* | | | Value | |
| | Corporate Bonds (continued) | | | | | | | | | | | | |
| | Food, Beverage & Tobacco (continued) | | | | | | | | | | | | |
| d | | Post Holdings Inc., senior note, 144A, | | | | | | | | | | | | |
| | 6.75%, 12/01/21 | | | United States | | | | 1,700,000 | | | $ | 1,653,250 | |
| | 6.00%, 12/15/22 | | | United States | | | | 400,000 | | | | 376,500 | |
| d | | Smithfield Foods Inc., senior note, 144A, 5.875%, 8/01/21 | | | United States | | | | 600,000 | | | | 612,375 | |
| | | | | | | | | | | | | | |
| | | | | | | | | | | | | 8,195,585 | |
| | | | | | | | | | | | | | |
| | Health Care Equipment & Services 1.7% | | | | | | | | | | | | |
| | Alere Inc., senior sub. note, 6.50%, 6/15/20 | | | United States | | | | 800,000 | | | | 810,000 | |
| d | | AmSurg Corp., senior note, 144A, 5.625%, 7/15/22 | | | United States | | | | 400,000 | | | | 412,000 | |
| | CHS/Community Health Systems Inc., | | | | | | | | | | | | |
| | senior note, 8.00%, 11/15/19 | | | United States | | | | 1,500,000 | | | | 1,605,000 | |
| | senior note, 6.875%, 2/01/22 | | | United States | | | | 400,000 | | | | 425,750 | |
| | senior secured note, first lien, 5.125%, 8/15/18 | | | United States | | | | 600,000 | | | | 622,500 | |
| | DaVita HealthCare Partners Inc., | | | | | | | | | | | | |
| | senior bond, 5.125%, 7/15/24 | | | United States | | | | 500,000 | | | | 510,938 | |
| | senior note, 5.75%, 8/15/22 | | | United States | | | | 1,500,000 | | | | 1,595,625 | |
| | HCA Inc., | | | | | | | | | | | | |
| | senior note, 7.50%, 2/15/22 | | | United States | | | | 1,500,000 | | | | 1,717,500 | |
| | senior note, 5.875%, 5/01/23 | | | United States | | | | 1,500,000 | | | | 1,584,375 | |
| | senior secured bond, first lien, 5.25%, 4/15/25 | | | United States | | | | 600,000 | | | | 627,750 | |
| | senior secured note, 5.875%, 3/15/22 | | | United States | | | | 1,000,000 | | | | 1,097,500 | |
| | Omnicare Inc., senior note, 4.75%, 12/01/22 | | | United States | | | | 700,000 | | | | 712,250 | |
| | Tenet Healthcare Corp., senior note, | | | | | | | | | | | | |
| | 8.125%, 4/01/22 | | | United States | | | | 1,700,000 | | | | 1,904,000 | |
| | d 144A, 5.00%, 3/01/19 | | | United States | | | | 500,000 | | | | 501,875 | |
| | d 144A, 5.50%, 3/01/19 | | | United States | | | | 1,200,000 | | | | 1,233,000 | |
| | | | | | | | | | | | | | |
| | | | | | | | | | | | | 15,360,063 | |
| | | | | | | | | | | | | | |
| | Insurance 0.9% | | | | | | | | | | | | |
| | MetLife Inc., junior sub. note, 6.40% to 12/15/36, FRN thereafter, 12/15/66 | | | United States | | | | 1,500,000 | | | | 1,680,000 | |
| d | | Mitsui Sumitomo Insurance Co. Ltd., junior sub. note, 144A, 7.00% to 3/15/22, FRN thereafter, 3/15/72 | | | Japan | | | | 2,500,000 | | | | 2,881,113 | |
| d | | Nippon Life Insurance Co., sub. bond, 144A, 5.10% to 10/16/24, FRN thereafter, 10/16/44 | | | Japan | | | | 3,500,000 | | | | 3,660,142 | |
| | | | | | | | | | | | | | |
| | | | | | | | | | | | | 8,221,255 | |
| | | | | | | | | | | | | | |
| | Materials 4.7% | | | | | | | | | | | | |
| | ArcelorMittal, senior note, | | | | | | | | | | | | |
| | 6.00%, 3/01/21 | | | Luxembourg | | | | 3,000,000 | | | | 3,109,095 | |
| | 6.75%, 2/25/22 | | | Luxembourg | | | | 500,000 | | | | 533,750 | |
| d | | Ardagh Packaging Finance PLC, senior note, 144A, 9.125%, 10/15/20 | | | Luxembourg | | | | 500,000 | | | | 533,750 | |
| d | | Ardagh Packaging Finance PLC/Ardagh MP Holdings USA Inc., senior note, 144A, | | | | | | | | | | | | |
| | 6.25%, 1/31/19 | | | Luxembourg | | | | 200,000 | | | | 196,000 | |
| | 7.00%, 11/15/20 | | | Luxembourg | | | | 105,882 | | | | 107,471 | |
| | 6.75%, 1/31/21 | | | Luxembourg | | | | 200,000 | | | | 197,875 | |
| | 6.00%, 6/30/21 | | | Luxembourg | | | | 1,300,000 | | | | 1,244,750 | |
| d | | Barminco Finance Pty. Ltd., senior note, 144A, 9.00%, 6/01/18 | | | Australia | | | | 1,500,000 | | | | 1,350,938 | |
| | Celanese US Holdings LLC, senior note, 3.25%, 10/15/19 | | | United States | | | | 700,000 | EUR | | | 878,762 | |
| d | | Cemex Finance LLC, senior secured note, 144A, 6.00%, 4/01/24 | | | Mexico | | | | 1,000,000 | | | | 968,125 | |
FRANKLIN TEMPLETON VARIABLE INSURANCE PRODUCTS TRUST
STATEMENT OF INVESTMENTS
Franklin Strategic Income VIP Fund (continued)
| | | | | | | | | | | | | | |
| | | | | Country | | | Principal Amount* | | | Value | |
| | Corporate Bonds (continued) | | | | | | | | | | | | |
| | Materials (continued) | | | | | | | | | | | | |
| d | | Cemex SAB de CV, | | | | | | | | | | | | |
| | first lien, 144A, 5.70%, 1/11/25 | | | Mexico | | | | 1,500,000 | | | $ | 1,449,375 | |
| | secured note, 144A, 5.875%, 3/25/19 | | | Mexico | | | | 1,000,000 | | | | 1,014,375 | |
| | senior secured note, 144A, 9.00%, 1/11/18 | | | Mexico | | | | 500,000 | | | | 523,125 | |
| d | | Ceramtec Group GmbH, senior note, 144A, 8.25%, 8/15/21 | | | Germany | | | | 1,400,000 | EUR | | | 1,832,696 | |
| d | | First Quantum Minerals Ltd., senior note, 144A, | | | | | | | | | | | | |
| | 6.75%, 2/15/20 | | | Canada | | | | 1,400,000 | | | | 1,274,000 | |
| | 7.00%, 2/15/21 | | | Canada | | | | 1,725,000 | | | | 1,561,125 | |
| d | | FMG Resources (August 2006) Pty. Ltd., senior note, 144A, | | | | | | | | | | | | |
| | 6.875%, 2/01/18 | | | Australia | | | | 1,111,111 | | | | 1,014,583 | |
| | 8.25%, 11/01/19 | | | Australia | | | | 2,500,000 | | | | 2,284,375 | |
| | Freeport-McMoRan Inc., senior note, 4.55%, 11/14/24 | | | United States | | | | 2,500,000 | | | | 2,432,325 | |
| d | | Glencore Funding LLC, senior note, 144A, | | | | | | | | | | | | |
| | 4.125%, 5/30/23 | | | Switzerland | | | | 1,000,000 | | | | 977,471 | |
| | 4.625%, 4/29/24 | | | Switzerland | | | | 500,000 | | | | 504,450 | |
| d | | Ineos Finance PLC, senior secured note, 144A, | | | | | | | | | | | | |
| | 8.375%, 2/15/19 | | | Switzerland | | | | 200,000 | | | | 213,000 | |
| | 7.50%, 5/01/20 | | | Switzerland | | | | 300,000 | | | | 315,563 | |
| d | | Ineos Group Holdings SA, senior note, 144A, | | | | | | | | | | | | |
| | 6.125%, 8/15/18 | | | Switzerland | | | | 700,000 | | | | 675,500 | |
| | 6.50%, 8/15/18 | | | Switzerland | | | | 700,000 | EUR | | | 838,001 | |
| | 5.75%, 2/15/19 | | | Switzerland | | | | 300,000 | EUR | | | 351,202 | |
| d | | Kerling PLC, senior secured note, 144A, 10.625%, 2/01/17 | | | United Kingdom | | | | 650,000 | EUR | | | 799,607 | |
| | Novelis Inc., senior note, 8.75%, 12/15/20 | | | Canada | | | | 1,600,000 | | | | 1,704,000 | |
| d | | Owens-Brockway Glass Container Inc., senior note, 144A, 5.00%, 1/15/22 | | | United States | | | | 1,300,000 | | | | 1,327,625 | |
| | Reynolds Group Issuer Inc./LLC/SA, | | | | | | | | | | | | |
| | first lien, 5.75%, 10/15/20 | | | United States | | | | 900,000 | | | | 927,000 | |
| | senior note, 8.50%, 5/15/18 | | | United States | | | | 1,000,000 | | | | 1,025,000 | |
| | senior note, 8.25%, 2/15/21 | | | United States | | | | 1,000,000 | | | | 1,030,000 | |
| | senior secured note, first lien, 7.125%, 4/15/19 | | | United States | | | | 1,000,000 | | | | 1,036,250 | |
| d | | Sealed Air Corp., | | | | | | | | | | | | |
| | senior bond, 144A, 5.125%, 12/01/24 | | | United States | | | | 1,000,000 | | | | 1,012,500 | |
| | senior note, 144A, 8.375%, 9/15/21 | | | United States | | | | 800,000 | | | | 898,000 | |
| | senior note, 144A, 4.875%, 12/01/22 | | | United States | | | | 1,000,000 | | | | 995,000 | |
| d | | Steel Dynamics Inc., | | | | | | | | | | | | |
| | senior bond, 144A, 5.50%, 10/01/24 | | | United States | | | | 1,000,000 | | | | 1,027,500 | |
| | senior note, 144A, 5.125%, 10/01/21 | | | United States | | | | 1,000,000 | | | | 1,018,750 | |
| d | | U.S. Coatings Acquisition Inc./Flash Dutch 2 BV, 144A, 5.75%, 2/01/21 | | | United States | | | | 1,000,000 | EUR | | | 1,278,819 | |
| d | | Xstrata Finance Canada Ltd., senior note, 144A, 4.95%, 11/15/21 | | | Switzerland | | | | 1,500,000 | | | | 1,584,769 | |
| | | | | | | | | | | | | | |
| | | | | | | | | | | | | 42,046,502 | |
| | | | | | | | | | | | | | |
| | Media 3.8% | | | | | | | | | | | | |
| | CCO Holdings LLC/CCO Holdings Capital Corp., senior bond, 5.25%, 9/30/22 | | | United States | | | | 2,000,000 | | | | 2,002,500 | |
| | CCOH Safari LLC, senior bond, 5.75%, 12/01/24 | | | United States | | | | 1,100,000 | | | | 1,115,125 | |
| | Clear Channel Worldwide Holdings Inc., | | | | | | | | | | | | |
| | senior note, 6.50%, 11/15/22 | | | United States | | | | 1,000,000 | | | | 1,035,000 | |
| | senior sub. note, 7.625%, 3/15/20 | | | United States | | | | 200,000 | | | | 208,500 | |
| | senior sub. note, 7.625%, 3/15/20 | | | United States | | | | 500,000 | | | | 528,750 | |
FRANKLIN TEMPLETON VARIABLE INSURANCE PRODUCTS TRUST
STATEMENT OF INVESTMENTS
Franklin Strategic Income VIP Fund (continued)
| | | | | | | | | | | | | | |
| | | | | Country | | | Principal Amount* | | | Value | |
| | Corporate Bonds (continued) | | | | | | | | | | | | |
| | Media (continued) | | | | | | | | | | | | |
| | CSC Holdings LLC, senior note, 6.75%, 11/15/21 | | | United States | | | | 3,000,000 | | | $ | 3,326,250 | |
| | DISH DBS Corp., senior note, | | | | | | | | | | | | |
| | 7.125%, 2/01/16 | | | United States | | | | 2,000,000 | | | | 2,107,500 | |
| | 6.75%, 6/01/21 | | | United States | | | | 500,000 | | | | 538,750 | |
| | 5.875%, 7/15/22 | | | United States | | | | 500,000 | | | | 513,750 | |
| | d 144A, 5.875%, 11/15/24 | | | United States | | | | 400,000 | | | | 403,000 | |
| | Gannett Co. Inc., | | | | | | | | | | | | |
| | senior bond, 6.375%, 10/15/23 | | | United States | | | | 1,900,000 | | | | 2,023,500 | |
| | d senior bond, 144A, 5.50%, 9/15/24 | | | United States | | | | 300,000 | | | | 301,500 | |
| | senior note, 5.125%, 7/15/20 | | | United States | | | | 1,000,000 | | | | 1,025,000 | |
| | iHeartCommunications Inc., | | | | | | | | | | | | |
| | senior secured bond, first lien, 9.00%, 3/01/21 | | | United States | | | | 2,400,000 | | | | 2,361,000 | |
| | d senior secured note, first lien, 144A, 9.00%, 9/15/22 | | | United States | | | | 700,000 | | | | 687,750 | |
| d | | Nielsen Finance LLC/Co., senior note, 144A, 5.00%, 4/15/22 | | | United States | | | | 1,500,000 | | | | 1,509,375 | |
| d | | Sirius XM Radio Inc., senior bond, 144A, 6.00%, 7/15/24 | | | United States | | | | 1,700,000 | | | | 1,746,750 | |
| d | | Unitymedia Hessen GmbH & Co. KG/Unitymedia NRW GmbH, senior secured note, 144A, 5.625%, 4/15/23 | | | Germany | | | | 800,000 | EUR | | | 1,053,334 | |
| d | | Unitymedia KabelBW GmbH, senior bond, 144A, 6.125%, 1/15/25 | | | Germany | | | | 1,700,000 | | | | 1,761,625 | |
| d | | Univision Communications Inc., | | | | | | | | | | | | |
| | senior secured bond, 144A, 6.75%, 9/15/22 | | | United States | | | | 436,000 | | | | 468,700 | |
| | senior secured note, 144A, 7.875%, 11/01/20 | | | United States | | | | 1,500,000 | | | | 1,605,000 | |
| d | | UPCB Finance II Ltd., senior secured note, 144A, 6.375%, 7/01/20 | | | Netherlands | | | | 2,000,000 | EUR | | | 2,547,292 | |
| d | | Videotron Ltd., senior bond, 144A, 5.375%, 6/15/24 | | | Canada | | | | 800,000 | | | | 818,000 | |
| d | | Virgin Media Finance PLC, senior bond, 144A, 6.375%, 10/15/24 | | | United Kingdom | | | | 900,000 | GBP | | | 1,515,056 | |
| d | | Virgin Media Secured Finance PLC, senior secured bond, first lien, 144A, 5.50%, 1/15/25 | | | United Kingdom | | | | 1,900,000 | | | | 1,967,688 | |
| d | | VTR Finance BV, senior secured note, 144A, 6.875%, 1/15/24 | | | Chile | | | | 900,000 | | | | 920,250 | |
| | | | | | | | | | | | | | |
| | | | | | | | | | | | | 34,090,945 | |
| | | | | | | | | | | | | | |
| | Pharmaceuticals, Biotechnology & Life Sciences 1.1% | | | | | | | | | | | | |
| d | | Grifols Worldwide Operations Ltd., senior note, 144A, 5.25%, 4/01/22 | | | United States | | | | 700,000 | | | | 717,640 | |
| d,i | | Jaguar Holding Co. I, senior note, 144A, PIK, 9.375%, 10/15/17 | | | United States | | | | 2,500,000 | | | | 2,561,250 | |
| d | | Valeant Pharmaceuticals International Inc., senior note, 144A, 7.50%, 7/15/21 | | | United States | | | | 1,200,000 | | | | 1,300,500 | |
| d | | VPI Escrow Corp., senior note, 144A, 6.375%, 10/15/20 | | | United States | | | | 2,400,000 | | | | 2,517,000 | |
| | Zoetis Inc., senior bond, 3.25%, 2/01/23 | | | United States | | | | 2,500,000 | | | | 2,470,410 | |
| | | | | | | | | | | | | | |
| | | | | | | | | | | | | 9,566,800 | |
| | | | | | | | | | | | | | |
| | Real Estate 0.1% | | | | | | | | | | | | |
| | Crown Castle International Corp., senior bond, 5.25%, 1/15/23 | | | United States | | | | 500,000 | | | | 512,500 | |
| | | | | | | | | | | | | | |
| | Retailing 0.4% | | | | | | | | | | | | |
| d | | Edcon Pty. Ltd., secured note, 144A, 9.50%, 3/01/18 | | | South Africa | | | | 1,800,000 | EUR | | | 1,756,013 | |
| d | | New Look Bondco I PLC, 144A, 8.75%, 5/14/18 | | | United Kingdom | | | | 1,300,000 | GBP | | | 2,134,302 | |
| | | | | | | | | | | | | | |
| | | | | | | | | | | | | 3,890,315 | |
| | | | | | | | | | | | | | |
| | Software & Services 1.1% | | | | | | | | | | | | |
| d | | BMC Software Finance Inc., senior note, 144A, 8.125%, 7/15/21 | | | United States | | | | 2,500,000 | | | | 2,362,500 | |
| | Equinix Inc., senior bond, 5.375%, 4/01/23 | | | United States | | | | 2,000,000 | | | | 2,010,000 | |
| | First Data Corp., | | | | | | | | | | | | |
| | senior bond, 12.625%, 1/15/21 | | | United States | | | | 300,000 | | | | 357,000 | |
| | d senior secured bond, 144A, 8.25%, 1/15/21 | | | United States | | | | 3,500,000 | | | | 3,762,500 | |
FRANKLIN TEMPLETON VARIABLE INSURANCE PRODUCTS TRUST
STATEMENT OF INVESTMENTS
Franklin Strategic Income VIP Fund (continued)
| | | | | | | | | | | | | | |
| | | | | Country | | | Principal Amount* | | | Value | |
| | Corporate Bonds (continued) | | | | | | | | | | | | |
| | Software & Services (continued) | | | | | | | | | | | | |
| | Sterling International Inc., senior note, 11.00%, 10/01/19 | | | United States | | | | 1,100,000 | | | $ | 1,174,250 | |
| | | | | | | | | | | | | | |
| | | | | | | | | | | | | 9,666,250 | |
| | | | | | | | | | | | | | |
| | Technology Hardware & Equipment 0.3% | | | | | | | | | | | | |
| d | | Alcatel-Lucent USA Inc., senior note, 144A, 6.75%, 11/15/20 | | | France | | | | 2,000,000 | | | | 2,121,000 | |
| d,i | | CommScope Holdings Co. Inc., senior note, 144A, PIK, 6.625%, 6/01/20 | | | United States | | | | 200,000 | | | | 207,000 | |
| | | | | | | | | | | | | | |
| | | | | | | | | | | | | 2,328,000 | |
| | | | | | | | | | | | | | |
| | Telecommunication Services 3.4% | | | | | | | | | | | | |
| | CenturyLink Inc., | | | | | | | | | | | | |
| | senior bond, 6.75%, 12/01/23 | | | United States | | | | 200,000 | | | | 219,750 | |
| | senior note, 6.00%, 4/01/17 | | | United States | | | | 1,000,000 | | | | 1,066,250 | |
| | senior note, 6.45%, 6/15/21 | | | United States | | | | 1,000,000 | | | | 1,077,500 | |
| d | | Digicel Group Ltd., senior note, 144A, 8.25%, 9/30/20 | | | Bermuda | | | | 1,500,000 | | | | 1,468,125 | |
| d | | Digicel Ltd., senior note, 144A, 6.00%, 4/15/21 | | | Bermuda | | | | 1,000,000 | | | | 950,625 | |
| d | | eAccess Ltd., senior note, 144A, 8.25%, 4/01/18 | | | Japan | | | | 1,000,000 | | | | 1,051,875 | |
| | Frontier Communications Corp., | | | | | | | | | | | | |
| | senior bond, 7.625%, 4/15/24 | | | United States | | | | 600,000 | | | | 621,000 | |
| | senior note, 8.50%, 4/15/20 | | | United States | | | | 2,000,000 | | | | 2,240,000 | |
| | senior note, 8.75%, 4/15/22 | | | United States | | | | 500,000 | | | | 561,250 | |
| | senior note, 7.875%, 1/15/27 | | | United States | | | | 400,000 | | | | 401,000 | |
| | Intelsat Jackson Holdings SA, | | | | | | | | | | | | |
| | senior bond, 6.625%, 12/15/22 | | | Luxembourg | | | | 1,600,000 | | | | 1,652,000 | |
| | senior note, 7.25%, 10/15/20 | | | Luxembourg | | | | 1,000,000 | | | | 1,058,750 | |
| | senior note, 7.50%, 4/01/21 | | | Luxembourg | | | | 1,000,000 | | | | 1,073,750 | |
| d | | Millicom International Cellular SA, senior note, 144A, 6.625%, 10/15/21 | | | Luxembourg | | | | 1,500,000 | | | | 1,542,187 | |
| d,i | | Mobile Challenger Intermediate Group SA, secured note, 144A, PIK, 8.75%, 3/15/19 | | | Switzerland | | | | 600,000 | EUR | | | 738,705 | |
| d | | Play Finance 1 SA, senior note, 144A, 6.50%, 8/01/19 | | | Poland | | | | 500,000 | EUR | | | 642,812 | |
| d | | Play Finance 2 SA, senior secured note, 144A, 5.25%, 2/01/19 | | | Poland | | | | 800,000 | EUR | | | 1,005,268 | |
| | Sprint Corp., senior bond, 7.875%, 9/15/23 | | | United States | | | | 500,000 | | | | 496,100 | |
| | Sprint Nextel Corp., senior note, | | | | | | | | | | | | |
| | 8.375%, 8/15/17 | | | United States | | | | 1,200,000 | | | | 1,299,000 | |
| | 6.00%, 11/15/22 | | | United States | | | | 500,000 | | | | 461,875 | |
| | d 144A, 9.00%, 11/15/18 | | | United States | | | | 1,500,000 | | | | 1,709,850 | |
| | d 144A, 7.00%, 3/01/20 | | | United States | | | | 800,000 | | | | 868,000 | |
| | T-Mobile USA Inc., | | | | | | | | | | | | |
| | senior bond, 6.50%, 1/15/24 | | | United States | | | | 300,000 | | | | 308,250 | |
| | senior bond, 6.375%, 3/01/25 | | | United States | | | | 1,300,000 | | | | 1,324,050 | |
| | senior note, 6.542%, 4/28/20 | | | United States | | | | 1,400,000 | | | | 1,450,750 | |
| | senior note, 6.125%, 1/15/22 | | | United States | | | | 200,000 | | | | 203,750 | |
| | Verizon Communications Inc., senior note, 5.15%, 9/15/23 | | | United States | | | | 2,000,000 | | | | 2,210,028 | |
| d | | Wind Acquisition Finance SA, senior secured note, 144A, | | | | | | | | | | | | |
| | 4.00%, 7/15/20 | | | Italy | | | | 600,000 | EUR | | | 715,110 | |
| | 7.00%, 4/23/21 | | | Italy | | | | 2,000,000 | EUR | | | 2,377,481 | |
| | | | | | | | | | | | | | |
| | | | | | | | | | | | | 30,795,091 | |
| | | | | | | | | | | | | | |
| | Transportation 0.7% | | | | | | | | | | | | |
| d | | Florida East Coast Holdings Corp., | | | | | | | | | | | | |
| | secured note, first lien, 144A, 6.75%, 5/01/19 | | | United States | | | | 900,000 | | | | 893,250 | |
| | senior note, 144A, 9.75%, 5/01/20 | | | United States | | | | 400,000 | | | | 400,000 | |
FRANKLIN TEMPLETON VARIABLE INSURANCE PRODUCTS TRUST
STATEMENT OF INVESTMENTS
Franklin Strategic Income VIP Fund (continued)
| | | | | | | | | | | | | | |
| | | | | Country | | | Principal Amount* | | | Value | |
| | Corporate Bonds (continued) | | | | | | | | | | | | |
| | Transportation (continued) | | | | | | | | | | | | |
| | Hertz Corp., senior note, | | | | | | | | | | | | |
| | 6.75%, 4/15/19 | | | United States | | | | 1,500,000 | | | $ | 1,552,500 | |
| | 6.25%, 10/15/22 | | | United States | | | | 1,500,000 | | | | 1,522,500 | |
| d | | Stena AB, senior bond, 144A, 7.00%, 2/01/24 | | | Sweden | | | | 900,000 | | | | 825,750 | |
| d | | Stena International SA, secured bond, 144A, 5.75%, 3/01/24 | | | Sweden | | | | 1,100,000 | | | | 1,039,500 | |
| | | | | | | | | | | | | | |
| | | | | | | | | | | | | 6,233,500 | |
| | | | | | | | | | | | | | |
| | Utilities 1.4% | | | | | | | | | | | | |
| | Calpine Corp., | | | | | | | | | | | | |
| | senior bond, 5.75%, 1/15/25 | | | United States | | | | 1,200,000 | | | | 1,216,500 | |
| | senior note, 5.375%, 1/15/23 | | | United States | | | | 1,300,000 | | | | 1,314,625 | |
| | d senior secured bond, first lien, 144A, 5.875%, 1/15/24 | | | United States | | | | 600,000 | | | | 642,000 | |
| | d senior secured note, first lien, 144A, 6.00%, 1/15/22 | | | United States | | | | 100,000 | | | | 107,000 | |
| d | | Dynegy Finance I Inc./Dynegy Finance II Inc., senior secured bond, first lien, 144A, 7.625%, 11/01/24 | | | United States | | | | 1,300,000 | | | | 1,327,625 | |
| d,e | | EDF SA, sub. note, 144A, 5.25% to 1/29/23, FRN thereafter, Perpetual | | | France | | | | 3,000,000 | | | | 3,077,100 | |
| d | | InterGen NV, secured bond, 144A, 7.00%, 6/30/23 | | | Netherlands | | | | 2,500,000 | | | | 2,387,500 | |
| d,g | | Texas Competitive Electric Holdings Co. LLC/Texas Competitive Electric Holdings Finance Inc., senior secured note, first lien, 144A, 11.50%, 10/01/15 | | | United States | | | | 3,000,000 | | | | 2,137,500 | |
| | | | | | | | | | | | | | |
| | | | | | | | | | | | | 12,209,850 | |
| | | | | | | | | | | | | | |
| | | | |
| | Total Corporate Bonds (Cost $328,498,730) | | | | | | | | | | | 320,854,737 | |
| | | | | | | | | | | | | | |
| f,j | | Senior Floating Rate Interests 18.6% | | | | | | | | | | | | |
| | Automobiles & Components 0.8% | | | | | | | | | | | | |
| | Crowne Group LLC, Term Loan, 6.00%, 9/30/20 | | | United States | | | | 1,646,573 | | | | 1,621,875 | |
| | FRAM Group Holdings Inc. (Autoparts Holdings), | | | | | | | | | | | | |
| | Second Lien Term Loan, 10.50%, 1/29/18 | | | United States | | | | 1,458,729 | | | | 1,455,082 | |
| | Term Loan, 6.50%, 7/29/17 | | | United States | | | | 2,290,008 | | | | 2,283,138 | |
| | Henniges Automotive Holdings Inc., Term Loans, 5.50%, 6/12/21 | | | United States | | | | 810,662 | | | | 810,662 | |
| | UCI International Inc., Term Loan, 5.50%, 7/26/17 | | | United States | | | | 579,767 | | | | 577,835 | |
| | | | | | | | | | | | | | |
| | | | | | | | | | | | | 6,748,592 | |
| | | | | | | | | | | | | | |
| | Capital Goods 1.1% | | | | | | | | | | | | |
| | Alfred Fueling Systems Inc. (Wayne Fueling), | | | | | | | | | | | | |
| | First Lien Initial Term Loan, 4.75%, 6/20/21 | | | United States | | | | 491,885 | | | | 483,277 | |
| | Second Lien Initial Term Loan, 8.50%, 6/20/22 | | | United States | | | | 845,106 | | | | 823,978 | |
| | Doncasters U.S. Finance LLC, | | | | | | | | | | | | |
| | Second Lien Term Loan, 9.50%, 10/09/20 | | | United States | | | | 125,226 | | | | 124,130 | |
| | Term B Loans, 4.50%, 4/09/20 | | | United States | | | | 297,841 | | | | 296,538 | |
| k | | Erickson Inc., Purchase Price Notes, 6.00%, 11/02/20 | | | United States | | | | 190,406 | | | | 154,522 | |
| | Onsite Rental Group Operations Pty. Ltd., Term B Loan, 5.50%, 7/30/21 | | | United States | | | | 2,167,856 | | | | 2,146,177 | |
| | Sensus USA Inc., | | | | | | | | | | | | |
| | First Lien Term Loan, 4.50% - 5.50%, 5/09/17 | | | United States | | | | 1,318,102 | | | | 1,291,740 | |
| | Second Lien Term Loan, 8.50%, 5/09/18 | | | United States | | | | 3,032,186 | | | | 2,903,318 | |
| | Signode Industrial Group U.S. Inc., Initial Term B Loan, 3.75%, 5/01/21 | | | United States | | | | 839,167 | | | | 807,698 | |
| | TransDigm Inc., | | | | | | | | | | | | |
| | Tranche C Term Loan, 3.75%, 2/28/20 | | | United States | | | | 406,538 | | | | 400,270 | |
| | Tranche D Term Loan, 3.75%, 6/04/21 | | | United States | | | | 292,729 | | | | 287,899 | |
FRANKLIN TEMPLETON VARIABLE INSURANCE PRODUCTS TRUST
STATEMENT OF INVESTMENTS
Franklin Strategic Income VIP Fund (continued)
| | | | | | | | | | | | | | |
| | | | | Country | | | Principal Amount* | | | Value | |
| f,j | | Senior Floating Rate Interests (continued) | | | | | | | | | | | | |
| | Capital Goods (continued) | | | | | | | | | | | | |
| l | | WireCo Worldgroup Inc., Term Loan, 7.00%, 2/15/17 | | | United States | | | | 48,726 | | | $ | 48,818 | |
| | | | | | | | | | | | | | |
| | | | | | | | | | | | | 9,768,365 | |
| | | | | | | | | | | | | | |
| | Commercial & Professional Services 0.8% | | | | | | | | | | | | |
| | AlixPartners LLP, Second Lien 2013 Recapitalization Term Loan,
9.00%, 7/10/21 | | | United States | | | | 2,678,927 | | | | 2,710,183 | |
| | Interactive Data Corp., Term Loan, 4.75%, 5/02/21 | | | United States | | | | 4,218,422 | | | | 4,198,384 | |
| | | | | | | | | | | | | | |
| | | | | | | | | | | | | 6,908,567 | |
| | | | | | | | | | | | | | |
| | Consumer Durables & Apparel 0.0%† | | | | | | | | | | | | |
| l | | Varsity Brands Inc., First Lien Term Loan, 7.25%, 12/16/21 | | | United States | | | | 328,408 | | | | 327,997 | |
| | | | | | | | | | | | | | |
| | Consumer Services 2.5% | | | | | | | | | | | | |
| | 24 Hour Fitness Worldwide Inc., Term Loan, 4.75%, 5/30/21 | | | United States | | | | 1,277,820 | | | | 1,233,895 | |
| | Caesars Entertainment Resort Properties LLC, Term B Loans, 7.00%, 10/11/20 | | | United States | | | | 4,070,809 | | | | 3,863,878 | |
| | Cannery Casino Resorts LLC, | | | | | | | | | | | | |
| | Second Lien Term Loan, 10.00%, 10/02/19 | | | United States | | | | 780,000 | | | | 612,300 | |
| | Term Loan, 6.00%, 10/02/18 | | | United States | | | | 2,604,913 | | | | 2,441,020 | |
| | ClubCorp Club Operations Inc., Term B Loans, 4.50%, 7/24/20 | | | United States | | | | 138,479 | | | | 136,662 | |
| | Diamond Resorts Corp., Term Loans, 5.50%, 5/09/21 | | | United States | | | | 572,424 | | | | 569,562 | |
| | Fitness International LLC, Term B Loan, 5.50%, 7/01/20 | | | United States | | | | 3,134,569 | | | | 3,024,859 | |
| | ROC Finance LLC, Funded Term B Loans, 5.00%, 4/08/19 | | | United States | | | | 314,906 | | | | 295,618 | |
| | TGI Friday’s Inc., | | | | | | | | | | | | |
| | First Lien Initial Term Loan, 5.25% - 6.50%, 7/15/20 | | | United States | | | | 479,779 | | | | 478,579 | |
| | l Second Lien Initial Term Loan, 9.25%, 7/15/21 | | | United States | | | | 500,000 | | | | 492,500 | |
| | Town Sports International LLC, Initial Term Loan,
4.50% - 5.75%, 11/15/20 | | | United States | | | | 1,017,795 | | | | 735,357 | |
| | Travelport Finance Luxembourg S.A.R.L., Initial Term Loan, 6.00%, 9/02/21 | | | Luxembourg | | | | 2,359,471 | | | | 2,360,061 | |
| c,i | | Turtle Bay Holdings LLC, Term Loan B, PIK, 3.00%, 6/30/16 | | | United States | | | | 6,401,230 | | | | 6,145,181 | |
| | | | | | | | | | | | | | |
| | | | | | | | | | | | | 22,389,472 | |
| | | | | | | | | | | | | | |
| | Diversified Financials 0.6% | | | | | | | | | | | | |
| | Guggenheim Partners Investment Management Holdings LLC, Initial Term Loan, 5.50%, 7/22/20 | | | United States | | | | 932,033 | | | | 925,625 | |
| l | | Realogy Group LLC, Initial Term B Loans, 5.25%, 3/05/20 | | | United States | | | | 92,166 | | | | 90,860 | |
| | Trans Union LLC, 2014 Replacement Term Loan, 4.00%, 4/09/21 | | | United States | | | | 4,159,657 | | | | 4,110,261 | |
| | | | | | | | | | | | | | |
| | | | | | | | | | | | | 5,126,746 | |
| | | | | | | | | | | | | | |
| | Energy 1.2% | | | | | | | | | | | | |
| | Bowie Resource Holdings LLC, Second Lien Initial Term Loan,
11.75%, 2/16/21 | | | United States | | | | 480,257 | | | | 473,053 | |
| | Citgo Petroleum Corp., Term B Loan, 4.50%, 7/29/21 | | | United States | | | | 224,013 | | | | 223,453 | |
| | Drillships Ocean Ventures Inc. and Drillships Vent, Term Loan, 5.50%, 7/25/21 | | | United States | | | | 717,677 | | | | 582,216 | |
| | Fieldwood Energy LLC, Second Lien Loans, 8.375%, 9/30/20 | | | United States | | | | 468,000 | | | | 344,682 | |
| | Foresight Energy LLC, Term Loans, 5.50%, 8/23/20 | | | United States | | | | 720,000 | | | | 711,000 | |
| | McJunkin Red Man Corp., 2013 Term Loan, 5.00%, 11/11/19 | | | United States | | | | 723,792 | | | | 676,746 | |
| | OSG Bulk Ships Inc., Initial Term Loan, 5.25%, 8/05/19 | | | United States | | | | 1,245,444 | | | | 1,217,421 | |
| | OSG International Inc., Initial Term Loan, (OIN), 5.75%, 8/05/19 | | | United States | | | | 2,022,339 | | | | 1,971,780 | |
| l | | Peabody Energy Corp., Term Loan, 4.25%, 9/24/20 | | | United States | | | | 1,240,345 | | | | 1,126,646 | |
| l | | UTEX Industries Inc., First Lien Initial Term Loan, 5.00%, 5/22/21 | | | United States | | | | 3,160,867 | | | | 2,939,607 | |
FRANKLIN TEMPLETON VARIABLE INSURANCE PRODUCTS TRUST
STATEMENT OF INVESTMENTS
Franklin Strategic Income VIP Fund (continued)
| | | | | | | | | | | | | | |
| | | | | Country | | | Principal Amount* | | | Value | |
| f,j | | Senior Floating Rate Interests (continued) | | | | | | | | | | | | |
| | Energy (continued) | | | | | | | | | | | | |
| | Westmoreland Coal Co., Term Loan, 7.50%, 12/16/20 | | | United States | | | | 664,630 | | | $ | 652,999 | |
| | | | | | | | | | | | | | |
| | | | | | | | | | | | | 10,919,603 | |
| | | | | | | | | | | | | | |
| | Food & Staples Retailing 0.2% | | | | | | | | | | | | |
| | AdvancePierre Foods Inc., Second Lien Term Loan, 9.50%, 10/10/17 | | | United States | | | | 1,805,558 | | | | 1,787,502 | |
| | | | | | | | | | | | | | |
| | Food, Beverage & Tobacco 0.2% | | | | | | | | | | | | |
| | Big Heart Pet Brands (Del Monte Pet), Initial Term Loans, 3.50%, 2/24/20 | | | United States | | | | 1,690,987 | | | | 1,627,575 | |
| | CSM Bakery Supplies LLC (U.S. Acquisition), Second Lien Term Loan, 8.75%, 7/03/21 | | | United States | | | | 128,913 | | | | 125,368 | |
| | | | | | | | | | | | | | |
| | | | | | | | | | | | | 1,752,943 | |
| | | | | | | | | | | | | | |
| | Health Care Equipment & Services 1.5% | | | | | | | | | | | | |
| | Carestream Health Inc., Second Lien Loan, 9.50%, 12/07/19 | | | United States | | | | 685,642 | | | | 680,786 | |
| | Community Health Systems Inc., 2021 Term D Loan, 4.25%, 1/27/21 | | | United States | | | | 2,778,862 | | | | 2,776,933 | |
| | Connolly LLC, | | | | | | | | | | | | |
| | Initial Term Loan, 5.00%, 5/14/21 | | | United States | | | | 1,766,986 | | | | 1,760,360 | |
| | Second Lien Initial Term Loan, 8.00%, 5/14/22 | | | United States | | | | 423,200 | | | | 421,084 | |
| | Dialysis Newco Inc., Second Lien Term Loan B, 7.75%, 10/22/21 | | | United States | | | | 267,300 | | | | 266,632 | |
| | Millennium Health LLC, Tranche B Term Loan, 5.25%, 4/16/21 | | | United States | | | | 2,713,769 | | | | 2,704,442 | |
| | Surgery Centers Holdings Inc., | | | | | | | | | | | | |
| | Second Lien Term Loan, 8.50%, 11/03/21 | | | United States | | | | 404,200 | | | | 392,074 | |
| | Term Loan, 5.25%, 11/03/20 | | | United States | | | | 70,600 | | | | 68,923 | |
| | Truven Health Analytics Inc., New Tranche B Term Loan, 4.50%, 6/06/19 | | | United States | | | | 1,740,077 | | | | 1,694,400 | |
| | U.S. Renal Care Inc., Tranche B-2 Term Loan, 4.25%, 7/03/19 | | | United States | | | | 3,042,441 | | | | 3,000,607 | |
| | | | | | | | | | | | | | |
| | | | | | | | | | | | | 13,766,241 | |
| | | | | | | | | | | | | | |
| | Household & Personal Products 0.8% | | | | | | | | | | | | |
| | FGI Operating Co. LLC (Freedom Group), Term B Loans, 5.50%, 4/19/19 | | | United States | | | | 3,882,930 | | | | 3,805,271 | |
| | Sun Products Corp., Tranche B Term Loan, 5.50%, 3/23/20 | | | United States | | | | 3,895,804 | | | | 3,642,577 | |
| | | | | | | | | | | | | | |
| | | | | | | | | | | | | 7,447,848 | |
| | | | | | | | | | | | | | |
| | Materials 3.6% | | | | | | | | | | | | |
| | Appvion Inc., Term Loan, 5.75% - 6.75%, 6/28/19 | | | United States | | | | 1,025,189 | | | | 1,014,297 | |
| | Arysta Lifescience SPC LLC, | | | | | | | | | | | | |
| | Initial Term Loan, 4.50%, 5/29/20 | | | United States | | | | 3,453,831 | | | | 3,439,439 | |
| | Second Lien Initial Term Loan, 8.25%, 11/30/20 | | | United States | | | | 551,458 | | | | 551,114 | |
| | Atkore International Inc., Second Lien Initial Term Loan, 7.75%, 10/09/21 | | | United States | | | | 219,800 | | | | 215,404 | |
| | AZ Chem US Inc., First Lien Initial Term Loan, 5.75%, 6/12/21 | | | United States | | | | 1,478,894 | | | | 1,461,332 | |
| | Caraustar Industries Inc., | | | | | | | | | | | | |
| | Initial Term Loan, 7.50%, 5/01/19 | | | United States | | | | 1,683,063 | | | | 1,673,596 | |
| | l Term Loan C, 9.00%,5/01/19 | | | United States | | | | 2,740,000 | | | | 2,698,900 | |
| | CD&R Millennium U.S. Acquico LLC, Second Lien Initial Term Loan, 8.25%, 7/31/22 | | | United States | | | | 585,000 | | | | 570,375 | |
| | Cyanco Intermediate Corp., Initial Term Loan, 5.50%, 5/01/20 | | | United States | | | | 3,385,395 | | | | 3,283,833 | |
| l | | Exopack Holdings SA, USD Term Loan, 5.25%, 5/08/19 | | | Luxembourg | | | | 3,692,818 | | | | 3,685,126 | |
FRANKLIN TEMPLETON VARIABLE INSURANCE PRODUCTS TRUST
STATEMENT OF INVESTMENTS
Franklin Strategic Income VIP Fund (continued)
| | | | | | | | | | | | | | |
| | | | | Country | | | Principal Amount* | | | Value | |
| f,j | | Senior Floating Rate Interests (continued) | | | | | | | | | | | | |
| | Materials (continued) | | | | | | | | | | | | |
| l | | FMG America Finance Inc. (Fortescue Metals Group), Loans, 3.75%, 6/30/19 | | | United States | | | | 827,208 | | | $ | 755,690 | |
| | HII Holding Corp. (Houghton International), Second Lien Term Loan, 9.50%, 12/20/20 | | | United States | | | | 575,175 | | | | 575,175 | |
| l | | Ineos U.S. Finance LLC, Dollar Term Loan, 5.25%, 5/04/18 | | | United States | | | | 301,326 | | | | 293,308 | |
| | MacDermid Holdings LLC, First Lien Tranche B Term Loan, 4.00%, 6/07/20 | | | United States | | | | 2,285,464 | | | | 2,246,184 | |
| | OCI Beaumont LLC, Term B-3 Loan, 5.00%, 8/20/19 | | | United States | | | | 1,064,011 | | | | 1,055,366 | |
| | Oxbow Carbon LLC, | | | | | | | | | | | | |
| | First Lien Tranche B Term Loan, 4.25%, 7/19/19 | | | United States | | | | 337,855 | | | | 311,671 | |
| | Second Lien Initial Term Loan, 8.00%, 1/19/20 | | | United States | | | | 311,538 | | | | 274,154 | |
| | OXEA GmbH, Second Lien Term Loan, 8.25%, 7/15/20 | | | Luxembourg | | | | 838,599 | | | | 802,958 | |
| | Prescrix Inc., Second Lien Term Loan, 8.00%, 5/02/22 | | | United States | | | | 663,243 | | | | 658,269 | |
| | Reynolds Group Holdings Inc., U.S. Term Loan, 4.00%, 12/01/18 | | | United States | | | | 2,752,731 | | | | 2,709,227 | |
| | Solenis International LP and Solenis Holdings, Second Lien Term Loan, 7.75%, 7/31/22 | | | United States | | | | 174,800 | | | | 170,867 | |
| | Tronox Pigments (Netherlands) BV, Term Loan, 4.00%, 3/19/20 | | | Netherlands | | | | 265,759 | | | | 262,104 | |
| | Univar Inc., Term B Loan, 5.00%, 6/30/17 | | | United States | | | | 442,956 | | | | 429,747 | |
| l | | Walter Energy Inc., B Term Loan, 7.25%, 4/01/18 | | | United States | | | | 3,746,209 | | | | 2,915,019 | |
| | | | | | | | | | | | | | |
| | | | | | | | | | | | | 32,053,155 | |
| | | | | | | | | | | | | | |
| | Media 1.6% | | | | | | | | | | | | |
| | AP NMT Acquisition BV, Second Lien Dollar Term B Loan, 10.00%, 8/13/22 | | | Netherlands | | | | 1,290,000 | | | | 1,244,850 | |
| | Cengage Learning Acquisitions Inc., First Lien Exit Term Loan, 7.00%, 3/31/20 | | | United States | | | | 3,087,626 | | | | 3,060,610 | |
| | Cumulus Media Holdings Inc., Term Loans, 4.25%, 12/23/20 | | | United States | | | | 459,266 | | | | 445,201 | |
| | NEP/NCP Holdco Inc., Second Lien Term Loan, 9.50%, 7/22/20 | | | United States | | | | 678,796 | | | | 668,614 | |
| c | | Radio One Inc., Term Loan, 7.50%, 3/31/16 | | | United States | | | | 2,066,387 | | | | 2,050,889 | |
| | William Morris Endeavor Entertainment LLC, | | | | | | | | | | | | |
| | Term Loans First Lien, 5.25%, 5/06/21 | | | United States | | | | 2,765,480 | | | | 2,675,602 | |
| | Term Loans Second Lien, 8.25%, 5/06/22 | | | United States | | | | 4,543,017 | | | | 4,372,654 | |
| | | | | | | | | | | | | | |
| | | | | | | | | | | | | 14,518,420 | |
| | | | | | | | | | | | | | |
| | Real Estate 0.0%† | | | | | | | | | | | | |
| | Capital Automotive LP, Second Lien Term Loan, 6.00%, 4/30/20 | | | United States | | | | 182,500 | | | | 182,500 | |
| | | | | | | | | | | | | | |
| | Retailing 1.8% | | | | | | | | | | | | |
| | BJ’s Wholesale Club Inc., | | | | | | | | | | | | |
| | 2013 (Nov) Replacement Loans, 4.50%, 9/26/19 | | | United States | | | | 3,530,563 | | | | 3,476,132 | |
| | Second Lien 2013 (Nov) Replacement Loans, 8.50%, 3/26/20 | | | United States | | | | 1,915,908 | | | | 1,890,363 | |
| | Evergreen AcqCo. 1 LP (Savers), Term Loan, 5.00%, 7/09/19 | | | United States | | | | 4,157,730 | | | | 4,100,561 | |
| | Harbor Freight Tools USA Inc., Loans, 4.75%, 7/26/19 | | | United States | | | | 1,095,527 | | | | 1,094,431 | |
| | JC Penney Corp. Inc., Term Loan, 5.00%, 6/20/19 | | | United States | | | | 478 | | | | 461 | |
| | The Men’s Wearhouse Inc., Tranche B Term Loan, 4.50%, 6/18/21 | | | United States | | | | 1,183,276 | | | | 1,178,839 | |
| | Party City Holdings Inc., 2014 Replacement Term Loan, 4.00% - 5.25%, 7/27/19 | | | United States | | | | 1,402,113 | | | | 1,374,071 | |
| | Sungard Availability Services Capital Inc., Tranche B Term Loan, 6.00%, 3/31/19 | | | United States | | | | 3,246,752 | | | | 2,830,087 | |
| | | | | | | | | | | | | | |
| | | | | | | | | | | | | 15,944,945 | |
| | | | | | | | | | | | | | |
FRANKLIN TEMPLETON VARIABLE INSURANCE PRODUCTS TRUST
STATEMENT OF INVESTMENTS
Franklin Strategic Income VIP Fund (continued)
| | | | | | | | | | | | | | |
| | | | | Country | | | Principal Amount* | | | Value | |
| f,j | | Senior Floating Rate Interests (continued) | | | | | | | | | | | | |
| | Semiconductors & Semiconductor Equipment 0.1% | | | | | | | | | | | | |
| | M/A-COM Technology Solutions Holdings Inc., Initial Term Loan, 4.50%, 5/07/21 | | | United States | | | | 520,982 | | | $ | 520,982 | |
| | | | | | | | | | | | | | |
| | Software & Services 1.3% | | | | | | | | | | | | |
| | BMC Software Finance Inc., Initial U.S. Term Loans, 5.00%, 9/10/20 | | | United States | | | | 4,856,465 | | | | 4,721,397 | |
| l | | MoneyGram International Inc., Term Loan, 4.25%, 3/28/20 | | | United States | | | | 5,166,286 | | | | 4,791,730 | |
| | Vertafore Inc., Second Lien Term Loan, 9.75%, 10/27/17 | | | United States | | | | 2,015,657 | | | | 2,027,414 | |
| l | | Worldpay U.S. Inc., | | | | | | | | | | | | |
| | Facility B2A-II Loan, 6.25%, 11/30/19 | | | United States | | | | 297,300 | | | | 297,857 | |
| | Facility C2 Loan, 5.75%, 11/30/19 | | | United States | | | | 106,549 | | | | 106,316 | |
| | | | | | | | | | | | | | |
| | | | | | | | | | | | | 11,944,714 | |
| | | | | | | | | | | | | | |
| | Technology Hardware & Equipment 0.2% | | | | | | | | | | | | |
| | Dell International LLC, Term B Loan, 4.50%, 4/29/20 | | | United States | | | | 1,306,268 | | | | 1,304,518 | |
| | Presidio Inc., Term Loan, 5.00%, 3/31/17 | | | United States | | | | 702,189 | | | | 702,628 | |
| | | | | | | | | | | | | | |
| | | | | | | | | | | | | 2,007,146 | |
| | | | | | | | | | | | | | |
| | Transportation 0.3% | | | | | | | | | | | | |
| | Global Tip Finance BV/Finance America LLC, Facility C Commitment, 7.00%, 10/16/20 | | | United States | | | | 2,424,189 | | | | 2,412,068 | |
| | | | | | | | | | | | | | |
| | | | |
| | Total Senior Floating Rate Interests (Cost $170,403,405) | | | | | | | | | | | 166,527,806 | |
| | | | | | | | | | | | | | |
| | Foreign Government and Agency Securities 18.2% | | | | | | | | | | | | |
| | Government of Canada, 1.00%, 5/01/15 | | | Canada | | | | 5,755,000 | CAD | | | 4,956,759 | |
| | Government of Hungary, | | | | | | | | | | | | |
| | 5.50%, 2/12/16 | | | Hungary | | | | 1,864,700,000 | HUF | | | 7,437,507 | |
| | 5.50%, 12/22/16 | | | Hungary | | | | 46,690,000 | HUF | | | 190,838 | |
| | 6.50%, 6/24/19 | | | Hungary | | | | 206,000,000 | HUF | | | 896,291 | |
| | 7.50%, 11/12/20 | | | Hungary | | | | 313,570,000 | HUF | | | 1,460,322 | |
| | A, 6.75%, 11/24/17 | | | Hungary | | | | 104,470,000 | HUF | | | 446,879 | |
| | A, 5.50%, 12/20/18 | | | Hungary | | | | 34,100,000 | HUF | | | 142,988 | |
| | A, 7.00%, 6/24/22 | | | Hungary | | | | 930,000 | HUF | | | 4,372 | |
| | A, 6.00%, 11/24/23 | | | Hungary | | | | 1,270,000 | HUF | | | 5,775 | |
| | senior note, 6.25%, 1/29/20 | | | Hungary | | | | 4,597,000 | | | | 5,175,670 | |
| | senior note, 6.375%, 3/29/21 | | | Hungary | | | | 1,000,000 | | | | 1,144,430 | |
| | Government of Indonesia, FR34, 12.80%, 6/15/21 | | | Indonesia | | | | 17,235,000,000 | IDR | | | 1,733,381 | |
| | Government of Ireland, 5.00%, 10/18/20 | | | Ireland | | | | 3,000,000 | EUR | | | 4,545,577 | |
| | Government of Malaysia, | | | | | | | | | | | | |
| | 3.741%, 2/27/15 | | | Malaysia | | | | 12,310,000 | MYR | | | 3,522,917 | |
| | 3.835%, 8/12/15 | | | Malaysia | | | | 7,475,000 | MYR | | | 2,144,052 | |
| | 4.72%, 9/30/15 | | | Malaysia | | | | 10,268,000 | MYR | | | 2,965,254 | |
| | 3.197%, 10/15/15 | | | Malaysia | | | | 4,730,000 | MYR | | | 1,350,739 | |
| | senior bond, 3.814%, 2/15/17 | | | Malaysia | | | | 2,500,000 | MYR | | | 717,746 | |
| | senior bond, 4.24%, 2/07/18 | | | Malaysia | | | | 600,000 | MYR | | | 174,303 | |
| | senior note, 3.172%, 7/15/16 | | | Malaysia | | | | 28,100,000 | MYR | | | 7,992,407 | |
| | Government of Mexico, | | | | | | | | | | | | |
| | 6.00%, 6/18/15 | | | Mexico | | | | 18,020 | m MXN | | | 123,816 | |
| | 8.00%, 12/17/15 | | | Mexico | | | | 753,560 | m MXN | | | 5,338,389 | |
| | 6.25%, 6/16/16 | | | Mexico | | | | 699,310 | m MXN | | | 4,924,668 | |
| | 7.25%, 12/15/16 | | | Mexico | | | | 790,330 | m MXN | | | 5,724,533 | |
FRANKLIN TEMPLETON VARIABLE INSURANCE PRODUCTS TRUST
STATEMENT OF INVESTMENTS
Franklin Strategic Income VIP Fund (continued)
| | | | | | | | | | | | | | |
| | | | | Country | | | Principal Amount* | | | Value | |
| | Foreign Government and Agency Securities (continued) | | | | | | | | | |
| | Government of Poland, | | | | | | | | | | | | |
| | 5.50%, 4/25/15 | | | Poland | | | | 5,300,000 | PLN | | $ | 1,515,622 | |
| | 6.25%, 10/24/15 | | | Poland | | | | 9,134,000 | PLN | | | 2,672,432 | |
| | 4.75%, 10/25/16 | | | Poland | | | | 31,000,000 | PLN | | | 9,216,504 | |
| | Strip, 7/25/15 | | | Poland | | | | 2,052,000 | PLN | | | 574,410 | |
| | Strip, 1/25/16 | | | Poland | | | | 1,066,000 | PLN | | | 295,572 | |
| d | | Government of Portugal, 144A, 5.125%, 10/15/24 | | | Portugal | | | | 7,000,000 | | | | 7,380,800 | |
| d | | Government of Serbia, senior note, 144A, | | | | | | | | | | | | |
| | 4.875%, 2/25/20 | | | Serbia | | | | 4,410,000 | | | | 4,426,339 | |
| | 7.25%, 9/28/21 | | | Serbia | | | | 1,000,000 | | | | 1,124,125 | |
| | Government of Singapore, senior note, 1.125%, 4/01/16 | | | Singapore | | | | 7,350,000 | SGD | | | 5,585,068 | |
| | Government of Sri Lanka, | | | | | | | | | | | | |
| | A, 11.75%, 3/15/15 | | | Sri Lanka | | | | 1,160,000 | LKR | | | 8,944 | |
| | A, 6.50%, 7/15/15 | | | Sri Lanka | | | | 28,980,000 | LKR | | | 221,640 | |
| | A, 6.40%, 8/01/16 | | | Sri Lanka | | | | 19,500,000 | LKR | | | 148,514 | |
| | B, 6.40%, 10/01/16 | | | Sri Lanka | | | | 16,000,000 | LKR | | | 121,534 | |
| | B, 8.50%, 7/15/18 | | | Sri Lanka | | | | 15,280,000 | LKR | | | 121,470 | |
| | C, 8.50%, 4/01/18 | | | Sri Lanka | | | | 8,070,000 | LKR | | | 64,034 | |
| | D, 8.50%, 6/01/18 | | | Sri Lanka | | | | 54,050,000 | LKR | | | 429,782 | |
| | Government of Sweden, 4.50%, 8/12/15 | | | Sweden | | | | 26,000,000 | SEK | | | 3,422,112 | |
| | Government of the Philippines, | | | | | | | | | | | | |
| | senior bond, 7.00%, 1/27/16 | | | Philippines | | | | 80,000,000 | PHP | | | 1,853,835 | |
| | senior note, 1.625%, 4/25/16 | | | Philippines | | | | 155,000,000 | PHP | | | 3,427,783 | |
| d | | Government of Ukraine, | | | | | | | | | | | | |
| | 144A, 7.75%, 9/23/20 | | | Ukraine | | | | 3,850,000 | | | | 2,345,728 | |
| | senior bond, 144A, 7.80%, 11/28/22 | | | Ukraine | | | | 2,790,000 | | | | 1,667,346 | |
| | senior note, 144A, 7.95%, 2/23/21 | | | Ukraine | | | | 2,120,000 | | | | 1,289,893 | |
| | senior note, 144A, 7.50%, 4/17/23 | | | Ukraine | | | | 1,000,000 | | | | 589,530 | |
| n | | Government of Uruguay, senior bond, Index Linked, 4.375%, 12/15/28 | | | Uruguay | | | | 192,368,980 | UYU | | | 7,971,782 | |
| | Korea Monetary Stabilization Bond, | | | | | | | | | | | | |
| | senior bond, 2.47%, 4/02/15 | | | South Korea | | | | 4,622,600,000 | KRW | | | 4,230,645 | |
| | senior bond, 2.80%, 8/02/15 | | | South Korea | | | | 1,324,510,000 | KRW | | | 1,216,039 | |
| | senior bond, 2.81%, 10/02/15 | | | South Korea | | | | 6,000,000,000 | KRW | | | 5,515,967 | |
| | senior note, 2.74%, 2/02/15 | | | South Korea | | | | 1,617,220,000 | KRW | | | 1,479,345 | |
| | senior note, 2.76%, 6/02/15 | | | South Korea | | | | 5,045,300,000 | KRW | | | 4,625,867 | |
| | Korea Treasury Bond, senior note, | | | | | | | | | | | | |
| | 3.25%, 6/10/15 | | | South Korea | | | | 210,800,000 | KRW | | | 193,703 | |
| | 2.75%, 12/10/15 | | | South Korea | | | | 5,847,900,000 | KRW | | | 5,380,383 | |
| | 3.00%, 12/10/16 | | | South Korea | | | | 5,500,000,000 | KRW | | | 5,114,921 | |
| | Nota Do Tesouro Nacional, | | | | | | | | | | | | |
| | 10.00%, 1/01/17 | | | Brazil | | | | 6,200 | o BRL | | | 2,222,517 | |
| | p Index Linked, 6.00%, 5/15/15 | | | Brazil | | | | 1,390 | o BRL | | | 1,326,942 | |
| | p Index Linked, 6.00%, 8/15/16 | | | Brazil | | | | 1,604 | o BRL | | | 1,517,596 | |
| | p Index Linked, 6.00%, 8/15/18 | | | Brazil | | | | 5,525 | o BRL | | | 5,186,197 | |
| | Uruguay Notas del Tesoro, | | | | | | | | | | | | |
| | 10.50%, 3/21/15 | | | Uruguay | | | | 1,700,000 | UYU | | | 69,193 | |
| | 10.25%, 8/22/15 | | | Uruguay | | | | 59,720,000 | UYU | | | 2,431,639 | |
| | 9.50%, 1/27/16 | | | Uruguay | | | | 9,220,000 | UYU | | | 379,015 | |
| | n 18, Index Linked, 2.25%, 8/23/17 | | | Uruguay | | | | 26,165,056 | UYU | | | 1,017,617 | |
FRANKLIN TEMPLETON VARIABLE INSURANCE PRODUCTS TRUST
STATEMENT OF INVESTMENTS
Franklin Strategic Income VIP Fund (continued)
| | | | | | | | | | | | | | |
| | | | | Country | | | Principal Amount* | | | Value | |
| | Foreign Government and Agency Securities (continued) | | | | | | | | | |
| | Uruguay Treasury Bill, Strip, | | | | | | | | | | | | |
| | 7/02/15 | | | Uruguay | | | | 510,000 | UYU | | $ | 19,585 | |
| | 8/20/15 | | | Uruguay | | | | 35,364,000 | UYU | | | 1,335,945 | |
| | | | | | | | | | | | | | |
| | | | |
| | Total Foreign Government and Agency Securities
(Cost $178,618,520) | | | | | | | | | | | 162,857,528 | |
| | | | | | | | | | | | | | |
| | U.S. Government and Agency Securities 1.8% | | | | | | | | | | | | |
| | U.S. Treasury Bond, | | | | | | | | | | | | |
| | 4.50%, 2/15/16 | | | United States | | | | 1,000,000 | | | | 1,046,211 | |
| | 7.875%, 2/15/21 | | | United States | | | | 900,000 | | | | 1,216,055 | |
| | U.S. Treasury Note, | | | | | | | | | | | | |
| | 4.625%, 2/15/17 | | | United States | | | | 600,000 | | | | 649,102 | |
| | 4.75%, 8/15/17 | | | United States | | | | 2,900,000 | | | | 3,184,449 | |
| | 3.75%, 11/15/18 | | | United States | | | | 7,000,000 | | | | 7,627,536 | |
| | n Index Linked, 0.125%, 4/15/16 | | | United States | | | | 2,474,248 | | | | 2,467,290 | |
| | | | | | | | | | | | | | |
| | | | |
| | Total U.S. Government and Agency Securities
(Cost $15,720,021) | | | | | | | | | | | 16,190,643 | |
| | | | | | | | | | | | | | |
| | Asset-Backed Securities and Commercial Mortgage-Backed Securities 5.7% | | | | | | | | | | | | |
| | Banks 3.3% | | | | | | | | | | | | |
| | Banc of America Commercial Mortgage Trust, 2006-4, AJ, 5.695%, 7/10/46 | | | United States | | | | 1,807,000 | | | | 1,877,446 | |
| f | | Bear Stearns Adjustable Rate Mortgage Trust, 2004-4, A6, FRN, 3.517%, 6/25/34 | | | United States | | | | 2,238,662 | | | | 2,308,574 | |
| | Bear Stearns Commercial Mortgage Securities Inc., | | | | | | | | | | | | |
| | f 2006-PW11, AJ, FRN, 5.605%, 3/11/39 | | | United States | | | | 1,000,000 | | | | 1,032,955 | |
| | f 2006-PW12, AJ, FRN, 5.751%, 9/11/38 | | | United States | | | | 1,440,000 | | | | 1,483,436 | |
| | 2006-PW13, AJ, 5.611%, 9/11/41 | | | United States | | | | 5,100,000 | | | | 5,240,293 | |
| | Citigroup Commercial Mortgage Trust, | | | | | | | | | | | | |
| | 2006-C5, AJ, 5.482%, 10/15/49 | | | United States | | | | 2,520,000 | | | | 2,472,801 | |
| | f 2007-C6, AM, FRN, 5.706%, 6/10/17 | | | United States | | | | 2,500,000 | | | | 2,673,498 | |
| f | | Citigroup/Deutsche Bank Commercial Mortgage Trust, 2006-CD3, AJ, FRN, 5.688%, 10/15/48 | | | United States | | | | 2,700,000 | | | | 2,633,594 | |
| | Countrywide Asset-Backed Certificates, 2005-11, AF4, 5.21%, 3/25/34 | | | United States | | | | 1,275,000 | | | | 1,158,229 | |
| | Greenwich Capital Commercial Funding Corp., | | | | | | | | | | | | |
| | f 2006-GG7, AJ, FRN, 5.82%, 7/10/38 | | | United States | | | | 2,560,000 | | | | 2,630,450 | |
| | 2007-GG9, AM, 5.475%, 3/10/39 | | | United States | | | | 1,030,000 | | | | 1,081,150 | |
| | JP Morgan Chase Commercial Mortgage Securities Trust, | | | | | | | | | | | | |
| | 2006-CB17, AM, 5.464%, 12/12/43 | | | United States | | | | 760,000 | | | | 788,340 | |
| | f 2006-LDP7, AJ, FRN, 5.873%, 4/15/45 | | | United States | | | | 1,680,000 | | | | 1,690,214 | |
| f | | Merrill Lynch Mortgage Investors Trust, 2005-A6, 2A3, FRN, 0.55%, 8/25/35 | | | United States | | | | 350,000 | | | | 324,945 | |
| f | | Morgan Stanley Capital I Trust, 2006-HQ8, AJ, FRN, 5.497%, 3/12/44 | | | United States | | | | 200,000 | | | | 205,503 | |
| | Wells Fargo Mortgage Backed Securities Trust, | | | | | | | | | | | | |
| | f 2004-W, A9, FRN, 2.616%, 11/25/34 | | | United States | | | | 1,184,527 | | | | 1,218,511 | |
| | 2007-3, 3A1, 5.50%, 4/25/37 | | | United States | | | | 407,108 | | | | 420,990 | |
| | | | | | | | | | | | | | |
| | | | | | | | | | | | | 29,240,929 | |
| | | | | | | | | | | | | | |
FRANKLIN TEMPLETON VARIABLE INSURANCE PRODUCTS TRUST
STATEMENT OF INVESTMENTS
Franklin Strategic Income VIP Fund (continued)
| | | | | | | | | | | | | | |
| | | | | Country | | | Principal Amount* | | | Value | |
| | Asset-Backed Securities and Commercial Mortgage-Backed Securities (continued) | | | | | | | | | | | | |
| | Diversified Financials 2.4% | | | | | | | | | | | | |
| d,f | | ARES CLO Funds, 2007-12A, B, 144A, FRN, 1.233%, 11/25/20 | | | United States | | | | 1,380,000 | | | $ | 1,360,211 | |
| d,f | | Atrium CDO Corp., 10A, C, 144A, FRN, 2.829%, 7/16/25 | | | United States | | | | 1,400,000 | | | | 1,339,940 | |
| d,f | | Atrium XI, 11A, C, 144A, FRN, 3.435%, 10/23/25 | | | Cayman Islands | | | | 1,820,000 | | | | 1,795,521 | |
| d,f | | BCAP LLC Trust, 2009-RR1, 2A2, 144A, FRN, 2.615%, 5/26/35 | | | United States | | | | 440,000 | | | | 436,854 | |
| d,f | | Catamaran CLO Ltd., 2013-1A, C, 144A, FRN, 2.834%, 1/27/25 | | | Cayman Islands | | | | 1,130,000 | | | | 1,069,048 | |
| d,f | | Cent CDO Ltd., 2007-15A, A2B, 144A, FRN, 0.579%, 3/11/21 | | | United States | | | | 1,251,000 | | | | 1,173,726 | |
| d,f | | Cent CLO LP, 2013-17A, D, 144A, FRN, 3.233%, 1/30/25 | | | Cayman Islands | | | | 784,314 | | | | 760,761 | |
| d,f | | CIFC Funding Ltd., 2007-3A, A1J, 144A, FRN, 0.634%, 7/26/21 | | | United States | | | | 960,000 | | | | 923,462 | |
| d,f | | ColumbusNova CLO Ltd., 2007-2A, A2, 144A, FRN, 1.231%, 10/15/21 | | | United States | | | | 860,000 | | | | 841,149 | |
| d,f | | CT CDO IV Ltd., 2006-4A, A1, 144A, FRN, 0.476%, 10/20/43 | | | United States | | | | 1,461,964 | | | | 1,449,479 | |
| d,f | | Eaton Vance CDO Ltd., 2014-1A, | | | | | | | | | | | | |
| | A, 144A, FRN, 1.685%, 7/15/26 | | | Cayman Islands | | | | 2,000,000 | | | | 1,985,600 | |
| | B, 144A, FRN, 2.285%, 7/15/26 | | | United States | | | | 426,000 | | | | 414,681 | |
| | C, 144A, FRN, 3.235%, 7/15/26 | | | United States | | | | 167,100 | | | | 162,602 | |
| d | | G-Force LLC, 2005-RRA, C, 144A, 5.20%, 8/22/36 | | | United States | | | | 2,000,000 | | | | 1,932,710 | |
| f | | Impac Secured Assets Trust, 2007-2, FRN, 0.42%, 4/25/37 | | | United States | | | | 342,107 | | | | 316,693 | |
| d,f | | ING Investment Management CLO Ltd., | | | | | | | | | | | | |
| | 2013-1A, B, 144A, FRN, 3.131%, 4/15/24 | | | Cayman Islands | | | | 270,000 | | | | 260,782 | |
| | 2013-1A, C, 144A, FRN, 3.731%, 4/15/24 | | | Cayman Islands | | | | 440,000 | | | | 418,242 | |
| | 2013-2A, B, 144A, FRN, 2.914%, 4/25/25 | | | United States | | | | 1,080,000 | | | | 1,038,528 | |
| | MortgageIT Trust, 2004-1, A2, 1.07%, 11/25/34 | | | United States | | | | 428,268 | | | | 416,130 | |
| d,f | | Newcastle CDO Ltd., 2004-5A, 1, 144A, FRN, 0.595%, 12/24/39 | | | United States | | | | 499,337 | | | | 490,743 | |
| f | | Opteum Mortgage Acceptance Corp. Trust, 2005-4, 1APT, FRN, 0.48%, 11/25/35 | | | United States | | | | 703,519 | | | | 667,683 | |
| | Residential Asset Securities Corp., 2004-KS1, AI4, 4.213%, 4/25/32 | | | United States | | | | 39,021 | | | | 38,999 | |
| | Structured Asset Securities Corp., 2005-2XS, 2A2, 1.656%, 2/25/35 | | | United States | | | | 374,569 | | | | 363,017 | |
| f,q | | Talisman 6 Finance, Reg S, FRN, 0.262%, 10/22/16 | | | Germany | | | | 1,666,863 | EUR | | | 1,992,620 | |
| f | | Thornburg Mortgage Securities Trust, 2005-1, A3, FRN, 2.234%, 4/25/45 | | | United States | | | | 389,232 | | | | 391,914 | |
| | | | | | | | | | | | | | |
| | | | | | | | | | | | | 22,041,095 | |
| | | | | | | | | | | | | | |
| | | | |
| | Total Asset-Backed Securities and Commercial Mortgage-Backed Securities (Cost $48,972,136) | | | | | | | | | | | 51,282,024 | |
| | | | | | | | | | | | | | |
| | Mortgage-Backed Securities 3.1% | | | | | | | | | | | | |
| f | | Federal Home Loan Mortgage Corp. (FHLMC) Adjustable Rate 0.0%† | | | | | | | | | |
| | FHLMC, 2.348%, 1/01/33 | | | United States | | | | 59,855 | | | | 62,458 | |
| | | | | | | | | | | | | | |
| | Federal Home Loan Mortgage Corp. (FHLMC) Fixed Rate 0.2% | | | | | | | | | | | | |
| | FHLMC Gold 15 Year, 5.50%, 7/01/17 - 7/01/19 | | | United States | | | | 90,706 | | | | 96,389 | |
| | FHLMC Gold 15 Year, 6.00%, 5/01/17 | | | United States | | | | 3,998 | | | | 4,168 | |
| | FHLMC Gold 15 Year, 6.50%, 5/01/16 | | | United States | | | | 379 | | | | 388 | |
| l | | FHLMC Gold 30 Year, 3.50%, 1/01/42 | | | United States | | | | 148,000 | | | | 153,897 | |
| | FHLMC Gold 30 Year, 5.00%, 4/01/34 - 8/01/35 | | | United States | | | | 388,336 | | | | 429,657 | |
| | FHLMC Gold 30 Year, 5.50%, 3/01/33 - 1/01/35 | | | United States | | | | 365,995 | | | | 411,229 | |
| | FHLMC Gold 30 Year, 6.00%, 4/01/33 - 2/01/36 | | | United States | | | | 319,783 | | | | 364,767 | |
| | FHLMC Gold 30 Year, 6.50%, 12/01/23 - 6/01/36 | | | United States | | | | 76,567 | | | | 87,736 | |
| | FHLMC Gold 30 Year, 7.00%, 9/01/21 - 4/01/30 | | | United States | | | | 32,452 | | | | 36,857 | |
FRANKLIN TEMPLETON VARIABLE INSURANCE PRODUCTS TRUST
STATEMENT OF INVESTMENTS
Franklin Strategic Income VIP Fund (continued)
| | | | | | | | | | | | | | |
| | | | | Country | | | Principal Amount* | | | Value | |
| | Mortgage-Backed Securities (continued) | | | | | | | | | | | | |
| | Federal Home Loan Mortgage Corp. (FHLMC) Fixed Rate (continued) | | | | | | | | | |
| | FHLMC Gold 30 Year, 7.50%, 8/01/30 - 7/01/31 | | | United States | | | | 1,245 | | | $ | 1,364 | |
| | | | | | | | | | | | | | �� |
| | | | | | | | | | | | | 1,586,452 | |
| | | | | | | | | | | | | | |
| f | | Federal National Mortgage Association (FNMA) Adjustable Rate 0.0%† | | | | | | | | | |
| | FNMA, 2.31% - 2.33%, 4/01/20 - 12/01/34 | | | United States | | | | 214,239 | | | | 227,099 | |
| | | | | | | | | | | | | | |
| | Federal National Mortgage Association (FNMA) Fixed Rate 2.7% | | | | | | | | | | | | |
| | FNMA 15 Year, 2.50%, 7/01/22 - 6/01/27 | | | United States | | | | 607,676 | | | | 620,941 | |
| | FNMA 15 Year, 3.00%, 10/01/27 | | | United States | | | | 5,241,524 | | | | 5,463,969 | |
| | FNMA 15 Year, 4.50%, 6/01/19 - 3/01/20 | | | United States | | | | 128,656 | | | | 135,518 | |
| | FNMA 15 Year, 5.00%, 10/01/17 - 6/01/18 | | | United States | | | | 94,512 | | | | 99,648 | |
| | FNMA 15 Year, 5.50%, 3/01/16 - 11/01/18 | | | United States | | | | 552,873 | | | | 584,218 | |
| | FNMA 15 Year, 6.00%, 4/01/16 - 7/01/16 | | | United States | | | | 854 | | | | 859 | |
| l | | FNMA 30 Year, 3.00%, 1/01/43 | | | United States | | | | 7,143,000 | | | | 7,226,149 | |
| l | | FNMA 30 Year, 3.50%, 1/01/42 | | | United States | | | | 1,087,000 | | | | 1,133,198 | |
| l | | FNMA 30 Year, 4.00%, 1/01/41 | | | United States | | | | 7,409,000 | | | | 7,907,863 | |
| | FNMA 30 Year, 5.00%, 4/01/30 | | | United States | | | | 130,124 | | | | 144,265 | |
| | FNMA 30 Year, 6.50%, 6/01/28 - 10/01/37 | | | United States | | | | 368,129 | | | | 420,170 | |
| | | | | | | | | | | | | | |
| | | | | | | | | | | | | 23,736,798 | |
| | | | | | | | | | | | | | |
| | Government National Mortgage Association (GNMA) Fixed Rate 0.2% | | | | | | | | | |
| | GNMA I SF 30 Year, 5.00%, 11/15/33 - 7/15/34 | | | United States | | | | 441,687 | | | | 489,201 | |
| | GNMA I SF 30 Year, 6.50%, 2/15/32 | | | United States | | | | 2,164 | | | | 2,471 | |
| | GNMA I SF 30 Year, 7.00%, 10/15/28 - 6/15/32 | | | United States | | | | 32,104 | | | | 33,858 | |
| | GNMA I SF 30 Year, 7.50%, 9/15/30 | | | United States | | | | 1,636 | | | | 1,969 | |
| l | | GNMA II SF 30 Year, 3.50%, 1/01/43 | | | United States | | | | 820,000 | | | | 860,808 | |
| | GNMA II SF 30 Year, 5.00%, 9/20/33 - 11/20/33 | | | United States | | | | 130,124 | | | | 144,661 | |
| | GNMA II SF 30 Year, 6.00%, 11/20/34 | | | United States | | | | 149,979 | | | | 172,286 | |
| | GNMA II SF 30 Year, 6.50%, 4/20/31 - 2/20/34 | | | United States | | | | 70,608 | | | | 82,467 | |
| | GNMA II SF 30 Year, 7.50%, 1/20/28 - 4/20/32 | | | United States | | | | 17,319 | | | | 20,249 | |
| | | | | | | | | | | | | | |
| | | | | | | | | | | | | 1,807,970 | |
| | | | | | | | | | | | | | |
| | | | |
| | Total Mortgage-Backed Securities (Cost $26,939,088) | | | | | | | | | | | 27,420,777 | |
| | | | | | | | | | | | | | |
| | Municipal Bonds 3.9% | | | | | | | | | | | | |
| | Arkansas State GO, Four-Lane Highway Construction and Improvement Bonds, 3.25%, 6/15/22 | | | United States | | | | 400,000 | | | | 433,352 | |
| | California State GO, Various Purpose, | | | | | | | | | | | | |
| | 5.25%, 11/01/40 | | | United States | | | | 560,000 | | | | 645,854 | |
| | Refunding, 5.25%, 3/01/38 | | | United States | | | | 1,500,000 | | | | 1,632,060 | |
| | Refunding, 5.00%, 4/01/38 | | | United States | | | | 2,000,000 | | | | 2,180,720 | |
| | Refunding, NATL Insured, 4.50%, 12/01/32 | | | United States | | | | 300,000 | | | | 313,008 | |
| | Refunding, Series 1, AGMC Insured, 4.75%, 9/01/31 | | | United States | | | | 290,000 | | | | 299,982 | |
| | Colorado State ISD, GO, Mitchell and Scurry Counties, School Building, PSF Guarantee, 5.00%, 8/15/43 | | | United States | | | | 300,000 | | | | 343,011 | |
| | Evansville Local Public Improvement Bond Bank Revenue, Sewage Works Project, Series A, 5.00%, 7/01/36 | | | United States | | | | 675,000 | | | | 765,848 | |
| | Florida Hurricane Catastrophe Fund Finance Corp. Revenue,
Series A, 2.995%, 7/01/20 | | | United States | | | | 3,000,000 | | | | 3,038,400 | |
| | Illinois State GO, | | | | | | | | | | | | |
| | 5.877%, 3/01/19 | | | United States | | | | 2,000,000 | | | | 2,210,240 | |
| | Build America Bonds, 7.35%, 7/01/35 | | | United States | | | | 1,000,000 | | | | 1,177,250 | |
FRANKLIN TEMPLETON VARIABLE INSURANCE PRODUCTS TRUST
STATEMENT OF INVESTMENTS
Franklin Strategic Income VIP Fund (continued)
| | | | | | | | | | | | | | |
| | | | | Country | | | Principal Amount* | | | Value | |
| | Municipal Bonds (continued) | | | | | | | | | | | | |
| | Massachusetts State GO, Consolidated Loan of 2014,
Series A, 4.50%, 12/01/43 | | | United States | | | | 2,300,000 | | | $ | 2,482,344 | |
| | Minnesota State GO, Various Purpose, Refunding,
Series F, 4.00%, 10/01/24 | | | United States | | | | 2,650,000 | | | | 3,009,128 | |
| | Nassau County GO, General Improvement Bonds, Series B, 5.00%, | | | | | | | | | | | | |
| | 4/01/39 | | | United States | | | | 1,500,000 | | | | 1,674,495 | |
| | 4/01/43 | | | United States | | | | 1,600,000 | | | | 1,764,336 | |
| | New Jersey EDA Revenue, School Facilities Construction, Refunding,
Series NN, 5.00%, 3/01/30 | | | United States | | | | 700,000 | | | | 767,641 | |
| | New York City HDC Revenue, Series B1, 5.00%, 7/01/33 | | | United States | | | | 500,000 | | | | 572,010 | |
| | New York City Municipal Water Finance Authority Water and Sewer
System Revenue, Second General Resolution, Fiscal 2014, | | | | | | | | | | | | |
| | Refunding, Series BB, 5.00%, 6/15/46 | | | United States | | | | 2,430,000 | | | | 2,745,535 | |
| | New York State Urban Development Corp. Revenue, State Personal
Income Tax, General Purpose, Series C, 5.00%, 3/15/29 | | | United States | | | | 1,500,000 | | | | 1,766,445 | |
| | Puerto Rico Electric Power Authority Power Revenue, | | | | | | | | | | | | |
| | Series A, 6.75%, 7/01/36 | | | United States | | | | 3,465,000 | | | | 1,754,364 | |
| | Series XX, 5.25%, 7/01/40 | | | United States | | | | 165,000 | | | | 83,541 | |
| | Puerto Rico Sales Tax FICO Revenue, Capital Appreciation, Refunding, Series A, zero cpn., 8/01/26 | | | United States | | | | 275,000 | | | | 101,585 | |
| | Puerto Rico Sales Tax FICO Sales Tax Revenue, | | | | | | | | | | | | |
| | Capital Appreciation, Series A, zero cpn., 8/01/25 | | | United States | | | | 320,000 | | | | 128,835 | |
| | first subordinate, Series A, 5.75%, 8/01/37 | | | United States | | | | 500,000 | | | | 372,480 | |
| | first subordinate, Series A, 6.50%, 8/01/44 | | | United States | | | | 2,500,000 | | | | 2,006,575 | |
| | Refunding, Series A, NATL RE, FGIC Insured, zero cpn., 8/01/45 | | | United States | | | | 3,700,000 | | | | 531,394 | |
| | Refunding, Series B, 6.05%, 8/01/37 | | | United States | | | | 915,000 | | | | 669,140 | |
| | Refunding, Series B, 6.05%, 8/01/38 | | | United States | | | | 1,120,000 | | | | 817,656 | |
| | South Carolina State Public Service Authority Revenue, Refunding,
Series B, 5.00%, 12/01/38 | | | United States | | | | 1,000,000 | | | | 1,123,620 | |
| | | | | | | | | | | | | | |
| | | | |
| | Total Municipal Bonds (Cost $34,692,948) | | | | | | | | | | | 35,410,849 | |
| | | | | | | | | | | | | | |
| | | | |
| | | | | | | | Shares | | | | |
| | Escrows and Litigation Trusts 0.0% | | | | | | | | | | | | |
| a,k | | Comfort Co. Inc., Escrow Account | | | United States | | | | 13,427 | | | | — | |
| a,k | | NewPage Corp., Litigation Trust | | | United States | | | | 2,500,000 | | | | — | |
| | | | | | | | | | | | | | |
| | | | |
| | Total Escrows and Litigation Trusts (Cost $ —) | | | | | | | | | | | — | |
| | | | | | | | | | | | | | |
| | | | |
| | Total Investments before Short Term Investments
(Cost $818,545,990) | | | | | | | | | | | 794,636,657 | |
| | | | | | | | | | | | | | |
| | | | |
| | | | | | | | Principal Amount* | | | | |
| | Short Term Investments 10.8% | | | | | | | | | | | | |
| | Foreign Government and Agency Securities (Cost $475,130) 0.1% | | | | | | | | | | | | |
| | Government of Canada, 1.50%, 8/01/15 | | | Canada | | | | 550,000 | CAD | | | 475,015 | |
| | | | | | | | | | | | | | |
| | | | |
| | Total Investments before Money Market Funds
(Cost $819,021,120) | | | | | | | | | | | 795,111,672 | |
| | | | | | | | | | | | | | |
FRANKLIN TEMPLETON VARIABLE INSURANCE PRODUCTS TRUST
STATEMENT OF INVESTMENTS
Franklin Strategic Income VIP Fund (continued)
| | | | | | | | | | | | | | |
| | | | | Country | | | Shares | | | Value | |
| | Money Market Funds (Cost $96,065,603) 10.7% | | | | | | | | | | | | |
| a,r | | Institutional Fiduciary Trust Money Market Portfolio | | | United States | | | | 96,065,603 | | | $ | 96,065,603 | |
| | | | | | | | | | | | | | |
| | Total Investments (Cost $915,086,723) 99.5% | | | | | | | | | | | 891,177,275 | |
| | Other Assets, less Liabilities 0.5% | | | | | | | | | | | 4,230,066 | |
| | | | | | | | | | | | | | |
| | Net Assets 100.0% | | | | | | | | | | $ | 895,407,341 | |
| | | | | | | | | | | | | | |
†Rounds to less than 0.1% of net assets.
*The principal amount is stated in U.S. dollars unless otherwise indicated.
aNon-income producing.
bThe security is owned by FT Holdings Corporation III, a wholly-owned subsidiary of the Fund. See Note 1(g).
cAt December 31, 2014, pursuant to the Fund’s policies and the requirements of applicable securities law, the Fund may be restricted from trading these securities for a limited or extended period of time.
dSecurity was purchased pursuant to Rule 144A under the Securities Act of 1933 and may be sold in transactions exempt from registration only to qualified institutional buyers or in a public offering registered under the Securities Act of 1933. These securities have been deemed liquid under guidelines approved by the Trust’s Board of Trustees. At December 31, 2014, the aggregate value of these securities was $176,474,602, representing 19.71% of net assets.
ePerpetual security with no stated maturity date.
fThe coupon rate shown represents the rate at period end.
gSee Note 7 regarding defaulted securities.
hSee Note 1(f) regarding loan participation notes.
iIncome may be received in additional securities and/or cash.
jSee Note 1(i) regarding senior floating rate interests.
kSecurity has been deemed illiquid because it may not be able to be sold within seven days. At December 31, 2014, the aggregate value of these securities was $154,522, representing 0.02% of net assets.
lA portion or all of the security purchased on a delayed delivery or to-be-announced (TBA) basis. See Note 1(c).
mPrincipal amount is stated in 100 Mexican Peso Units
nPrincipal amount of security is adjusted for inflation. See Note 1(k).
oPrincipal amount is stated in 1,000 Brazilian Real Units.
pRedemption price at maturity is adjusted for inflation. See Note 1(k).
qSecurity was purchased pursuant to Regulation S under the Securities Act of 1933, which exempts from registration securities offered and sold outside of the United States. Such a security cannot be sold in the United States without either an effective registration statement filed pursuant to the Securities Act of 1933, or pursuant to an exemption from registration. This security has been deemed liquid under guidelines approved by the Trust’s Board of Trustees. At December 31, 2014, the value of this security was $1,992,620, representing 0.22% of net assets.
rSee Note 3(e) regarding investments in Institutional Fiduciary Trust Money Market Portfolio.
FRANKLIN TEMPLETON VARIABLE INSURANCE PRODUCTS TRUST
STATEMENT OF INVESTMENTS
Franklin Strategic Income VIP Fund (continued)
At December 31, 2014, the Fund had the following forward exchange contracts outstanding. See Note 1(d).
| | | | | | | | | | | | | | | | | | | | | | | | | | | | |
| Forward Exchange Contracts | |
| Currency | | Counterpartya | | | Type | | | Quantity | | | Contract
Amount | | | Settlement
Date | | | Unrealized
Appreciation | | | Unrealized
Depreciation | |
Chilean Peso | | | BZWS | | | | Buy | | | | 477,650,000 | | | $ | 823,534 | | | | 1/09/15 | | | $ | — | | | $ | (37,357 | ) |
Chilean Peso | | | DBAB | | | | Buy | | | | 140,000,000 | | | | 241,421 | | | | 1/09/15 | | | | — | | | | (10,991 | ) |
Euro | | | BZWS | | | | Buy | | | | 3,948,823 | | | | 4,995,538 | | | | 1/09/15 | | | | — | | | | (216,986 | ) |
Euro | | | BZWS | | | | Sell | | | | 4,116,197 | | | | 5,626,760 | | | | 1/09/15 | | | | 645,666 | | | | — | |
Euro | | | DBAB | | | | Buy | | | | 5,924,086 | | | | 8,066,131 | | | | 1/09/15 | | | | — | | | | (897,273 | ) |
Euro | | | DBAB | | | | Sell | | | | 7,328,957 | | | | 9,971,255 | | | | 1/09/15 | | | | 1,102,333 | | | | — | |
Euro | | | JPHQ | | | | Buy | | | | 2,590,000 | | | | 3,302,657 | | | | 1/09/15 | | | | — | | | | (168,445 | ) |
Euro | | | JPHQ | | | | Sell | | | | 7,574,544 | | | | 10,313,425 | | | | 1/09/15 | | | | 1,147,313 | | | | — | |
Indian Rupee | | | DBAB | | | | Buy | | | | 307,316,000 | | | | 4,589,980 | | | | 1/09/15 | | | | 276,658 | | | | — | |
Indian Rupee | | | HSBC | | | | Buy | | | | 144,338,000 | | | | 2,139,801 | | | | 1/09/15 | | | | 145,927 | | | | — | |
Indian Rupee | | | JPHQ | | | | Buy | | | | 23,701,000 | | | | 356,835 | | | | 1/09/15 | | | | 18,492 | | | | — | |
Japanese Yen | | | BZWS | | | | Sell | | | | 136,513,000 | | | | 1,336,671 | | | | 1/09/15 | | | | 197,312 | | | | — | |
Japanese Yen | | | CITI | | | | Sell | | | | 127,820,000 | | | | 1,250,365 | | | | 1/09/15 | | | | 183,559 | | | | — | |
Japanese Yen | | | DBAB | | | | Buy | | | | 379,925,000 | | | | 3,508,727 | | | | 1/09/15 | | | | — | | | | (337,814 | ) |
Japanese Yen | | | DBAB | | | | Sell | | | | 987,554,000 | | | | 9,622,124 | | | | 1/09/15 | | | | 1,379,843 | | | | — | |
Japanese Yen | | | GSCO | | | | Sell | | | | 42,760,000 | | | | 417,639 | | | | 1/09/15 | | | | 60,758 | | | | — | |
Japanese Yen | | | HSBC | | | | Sell | | | | 247,910,000 | | | | 2,397,324 | | | | 1/09/15 | | | | 328,228 | | | | — | |
Japanese Yen | | | JPHQ | | | | Sell | | | | 149,719,000 | | | | 1,472,570 | | | | 1/09/15 | | | | 222,991 | | | | — | |
Singapore Dollar | | | DBAB | | | | Buy | | | | 1,663,000 | | | | 1,319,773 | | | | 1/09/15 | | | | — | | | | (64,773 | ) |
Euro | | | DBAB | | | | Buy | | | | 2,150,000 | | | | 2,876,399 | | | | 2/09/15 | | | | — | | | | (273,846 | ) |
Euro | | | DBAB | | | | Sell | | | | 3,561,422 | | | | 4,905,641 | | | | 2/09/15 | | | | 594,576 | | | | — | |
Euro | | | JPHQ | | | | Sell | | | | 1,889,700 | | | | 2,614,801 | | | | 2/09/15 | | | | 327,339 | | | | — | |
Indian Rupee | | | CITI | | | | Buy | | | | 4,537,000 | | | | 68,123 | | | | 2/09/15 | | | | 3,311 | | | | — | |
Japanese Yen | | | DBAB | | | | Sell | | | | 257,790,000 | | | | 2,516,252 | | | | 2/09/15 | | | | 364,132 | | | | — | |
Japanese Yen | | | HSBC | | | | Sell | | | | 85,800,000 | | | | 837,049 | | | | 2/09/15 | | | | 120,761 | | | | — | |
Japanese Yen | | | JPHQ | | | | Sell | | | | 181,500,000 | | | | 1,771,692 | | | | 2/09/15 | | | | 256,468 | | | | — | |
Singapore Dollar | | | DBAB | | | | Buy | | | | 973,400 | | | | 768,575 | | | | 2/09/15 | | | | — | | | | (34,377 | ) |
Singapore Dollar | | | JPHQ | | | | Buy | | | | 694,000 | | | | 548,088 | | | | 2/09/15 | | | | — | | | | (24,630 | ) |
Swedish Krona | | | DBAB | | | | Buy | | | | 91,336,000 | | | | 14,011,490 | | | | 2/09/15 | | | | — | | | | (2,298,768 | ) |
Swedish Krona | | | DBAB | | | | Sell | | | | 52,750,000 | | | | 7,001,670 | | | | 2/09/15 | | | | 237,129 | | | | — | |
British Pound | | | DBAB | | | | Sell | | | | 380,363 | | | | 643,957 | | | | 3/09/15 | | | | 51,408 | | | | — | |
Chilean Peso | | | DBAB | | | | Buy | | | | 314,000,000 | | | | 543,629 | | | | 3/09/15 | | | | — | | | | (29,644 | ) |
Chilean Peso | | | JPHQ | | | | Buy | | | | 234,301,000 | | | | 408,546 | | | | 3/09/15 | | | | — | | | | (25,020 | ) |
Chilean Peso | | | MSCO | | | | Buy | | | | 220,380,000 | | | | 389,861 | | | | 3/09/15 | | | | — | | | | (29,122 | ) |
Euro | | | BZWS | | | | Sell | | | | 132,570 | | | | 182,984 | | | | 3/09/15 | | | | 22,474 | | | | — | |
Euro | | | DBAB | | | | Buy | | | | 3,154,283 | | | | 3,961,374 | | | | 3/09/15 | | | | — | | | | (142,319 | ) |
Euro | | | DBAB | | | | Sell | | | | 14,178,711 | | | | 19,458,828 | | | | 3/09/15 | | | | 2,291,922 | | | | — | |
Euro | | | HSBC | | | | Sell | | | | 142,717 | | | | 196,450 | | | | 3/09/15 | | | | 23,655 | | | | — | |
Euro | | | JPHQ | | | | Sell | | | | 2,118,679 | | | | 2,926,091 | | | | 3/09/15 | | | | 360,895 | | | | — | |
Japanese Yen | | | DBAB | | | | Sell | | | | 780,622,000 | | | | 7,656,519 | | | | 3/09/15 | | | | 1,137,991 | | | | — | |
Japanese Yen | | | HSBC | | | | Sell | | | | 80,270,000 | | | | 785,267 | | | | 3/09/15 | | | | 114,978 | | | | — | |
Japanese Yen | | | JPHQ | | | | Sell | | | | 235,580,000 | | | | 2,304,140 | | | | 3/09/15 | | | | 336,945 | | | | — | |
Singapore Dollar | | | DBAB | | | | Buy | | | | 7,316,140 | | | | 5,840,520 | | | | 3/09/15 | | | | — | | | | (323,568 | ) |
Singapore Dollar | | | DBAB | | | | Sell | | | | 2,651,000 | | | | 1,999,095 | | | | 3/09/15 | | | | 30 | | | | — | |
Singapore Dollar | | | HSBC | | | | Buy | | | | 837,000 | | | | 669,900 | | | | 3/09/15 | | | | — | | | | (38,736 | ) |
Singapore Dollar | | | JPHQ | | | | Buy | | | | 4,945,200 | | | | 3,938,045 | | | | 3/09/15 | | | | — | | | | (208,971 | ) |
British Pound | | | DBAB | | | | Sell | | | | 1,674,528 | | | | 2,746,518 | | | | 5/07/15 | | | | 139,162 | | | | — | |
Chilean Peso | | | CITI | | | | Buy | | | | 377,668,000 | | | | 634,203 | | | | 5/07/15 | | | | — | | | | (19,050 | ) |
Chilean Peso | | | JPHQ | | | | Buy | | | | 1,598,650,000 | | | | 2,727,027 | | | | 5/07/15 | | | | — | | | | (123,112 | ) |
Euro | | | BZWS | | | | Sell | | | | 4,318,741 | | | | 5,524,305 | | | | 5/07/15 | | | | 292,263 | | | | — | |
Euro | | | CITI | | | | Sell | | | | 1,058,200 | | | | 1,427,103 | | | | 5/07/15 | | | | 145,121 | | | | — | |
Euro | | | DBAB | | | | Sell | | | | 10,374,678 | | | | 13,742,245 | | | | 5/07/15 | | | | 1,173,593 | | | | — | |
Euro | | | GSCO | | | | Sell | | | | 369,000 | | | | 468,398 | | | | 5/07/15 | | | | 21,364 | | | | — | |
Euro | | | JPHQ | | | | Sell | | | | 6,561,135 | | | | 8,572,596 | | | | 5/07/15 | | | | 623,951 | | | | — | |
Indian Rupee | | | DBAB | | | | Sell | | | | 31,625,000 | | | | 500,000 | | | | 5/07/15 | | | | 9,526 | | | | — | |
FRANKLIN TEMPLETON VARIABLE INSURANCE PRODUCTS TRUST
STATEMENT OF INVESTMENTS
| | | | | | | | | | | | | | | | | | | | | | | | | | | | |
| Forward Exchange Contracts (continued) | |
| Currency | | Counterpartya | | | Type | | | Quantity | | | Contract
Amount | | | Settlement
Date | | | Unrealized
Appreciation | | | Unrealized
Depreciation | |
Japanese Yen | | | BZWS | | | | Sell | | | | 60,047,000 | | | $ | 587,731 | | | | 5/07/15 | | | $ | 85,961 | | | $ | — | |
Japanese Yen | | | CITI | | | | Sell | | | | 31,757,000 | | | | 310,679 | | | | 5/07/15 | | | | 45,309 | | | | — | |
Japanese Yen | | | DBAB | | | | Sell | | | | 27,184,000 | | | | 265,287 | | | | 5/07/15 | | | | 38,130 | | | | — | |
Japanese Yen | | | HSBC | | | | Sell | | | | 147,626,000 | | | | 1,444,594 | | | | 5/07/15 | | | | 210,991 | | | | — | |
Japanese Yen | | | JPHQ | | | | Sell | | | | 366,653,000 | | | | 3,477,968 | | | | 5/07/15 | | | | 414,115 | | | | — | |
Malaysian Ringgit | | | DBAB | | | | Buy | | | | 6,892,000 | | | | 2,087,852 | | | | 5/07/15 | | | | — | | | | (139,500 | ) |
Singapore Dollar | | | DBAB | | | | Sell | | | | 1,249,000 | | | | 999,240 | | | | 5/07/15 | | | | 58,209 | | | | — | |
Euro | | | BZWS | | | | Sell | | | | 529,706 | | | | 668,870 | | | | 6/18/15 | | | | 26,855 | | | | — | |
Euro | | | CITI | | | | Sell | | | | 3,868,000 | | | | 4,772,277 | | | | 6/18/15 | | | | 84,177 | | | | — | |
Euro | | | DBAB | | | | Sell | | | | 6,574,489 | | | | 8,210,401 | | | | 6/18/15 | | | | 241,980 | | | | — | |
Euro | | | JPHQ | | | | Sell | | | | 2,176,103 | | | | 2,718,786 | | | | 6/18/15 | | | | 81,302 | | | | — | |
Indian Rupee | | | DBAB | | | | Buy | | | | 128,000,000 | | | | 2,008,473 | | | | 6/18/15 | | | | — | | | | (36,800 | ) |
Japanese Yen | | | DBAB | | | | Sell | | | | 1,175,702,500 | | | | 10,237,325 | | | | 6/18/15 | | | | 407,799 | | | | — | |
Japanese Yen | | | JPHQ | | | | Sell | | | | 548,120,000 | | | | 4,864,378 | | | | 6/18/15 | | | | 294,015 | | | | (12,224 | ) |
Japanese Yen | | | MSCO | | | | Sell | | | | 12,500,000 | | | | 110,358 | | | | 6/18/15 | | | | 5,851 | | | | — | |
Malaysian Ringgit | | | DBAB | | | | Buy | | | | 623,200 | | | | 184,734 | | | | 6/18/15 | | | | — | | | | (9,157 | ) |
Malaysian Ringgit | | | HSBC | | | | Buy | | | | 376,000 | | | | 110,530 | | | | 6/18/15 | | | | — | | | | (4,597 | ) |
| | | | | | | | | | | | | | | | | | | | | | | | |
Unrealized appreciation (depreciation) | | | | 16,352,768 | | | | (5,507,080 | ) |
| | | | | | | | | | | | | | | | | | | | | | | | |
Net unrealized appreciation (depreciation) | | | $ | 10,845,688 | | | | | |
| | | | | | | | | | | | | | | | | | | | | | | | | | | | |
aMay be comprised of multiple contracts with the same counterparty, currency and settlement date.
At December 31, 2014, the Fund had the following credit default swap contracts outstanding. See Note 1(d).
Credit Default Swap Contracts
| | | | | | | | | | | | | | | | | | | | | | | | | | | | | | | | | | |
| Description | | Counterparty /
Exchange | | | Notional
Amounta | | | Periodic
Payment
Rate | | | Expiration
Date | | | Upfront
Premiums
Paid
(Received) | | | Unrealized
Appreciation | | | Unrealized
Depreciation | | | Market
Value | | | Ratingb |
| OTC Swaps | | | | | | | | | | | | | | | | | | | | | | | | | | | | | | | | | | |
| Contracts to Sell Protectionc | | | | | | | | | | | | | | | | | | | | | | | | | | | |
| Traded Index | | | | | | | | | | | | | | | | | | | | | | | | | | | | | | | | | | |
MCDX.NA.21 | | | CITI | | | | 7,000,000 | | | | 1.00 | % | | | 12/20/18 | | | $ | (104,821 | ) | | $ | 173,015 | | | $ | — | | | $ | 68,194 | | | Non Investment
Grade |
MCDX.NA.23 | | | CITI | | | | 3,000,000 | | | | 1.00 | % | | | 12/20/19 | | | | 19,683 | | | | 2,602 | | | | — | | | | 22,285 | | | Non Investment
Grade |
| | | | | | | | | | | | | | | | | | | | | | | | | | | | | | | | | | |
Net unrealized appreciation (depreciation) | | | $ | 175,617 | | | | | | | | | | | |
| | | | | | | | | | | | | | | | | | | | | | | | | | | | | | | | | | |
aIn U.S. dollars unless otherwise indicated. For contracts to sell protection, the notional amount is equal to the maximum potential amount of the future payments and no recourse provisions have been entered into in association with the contracts.
bBased on Standard and Poor’s (S&P) Rating for single name swaps and internal ratings for index swaps. Internal ratings based on mapping into equivalent ratings from external vendors.
cThe fund enters contracts to sell protection to create a long credit position. Performance triggers include default, bankruptcy or restructuring for single name swaps and failure to pay or bankruptcy of the underlying securities for traded index swaps.
See Note 9 regarding other derivative information.
See Abbreviations on page FSI-49.
| | | | |
| FSI-32 | | Annual Report | The accompanying notes are an integral part of these financial statements. | | |
Franklin Strategic Income VIP Fund (continued)
FRANKLIN TEMPLETON VARIABLE INSURANCE PRODUCTS TRUST
Financial Statements
Statement of Assets and Liabilities
December 31, 2014
| | | | |
| | | Franklin Strategic
Income VIP Fund | |
Assets: | | | | |
Investments in securities: | | | | |
Cost - Unaffiliated issuers | | $ | 819,021,120 | |
Cost - Sweep Money Fund (Note 3e) | | | 96,065,603 | |
| | | | |
Total cost of investments | | $ | 915,086,723 | |
| | | | |
Value - Unaffiliated issuers | | $ | 795,111,672 | |
Value - Sweep Money Fund (Note 3e) | | | 96,065,603 | |
| | | | |
Total value of investments | | | 891,177,275 | |
Cash | | | 182,186 | |
Restricted cash (Note 1e) | | | 5,579,400 | |
Foreign currency, at value (cost $895,888) | | | 895,812 | |
Receivables: | | | | |
Investment securities sold | | | 8,259,331 | |
Capital shares sold | | | 219,339 | |
Dividends and interest | | | 9,346,168 | |
OTC swaps (premiums paid $20,637) | | | 19,683 | |
Unrealized appreciation on forward exchange contracts | | | 16,352,768 | |
Unrealized appreciation on OTC swap contracts | | | 175,617 | |
Other assets | | | 89 | |
| | | | |
Total assets | | | 932,207,668 | |
| | | | |
Liabilities: | | | | |
Payables: | | | | |
Investment securities purchased | | | 24,528,561 | |
Capital shares redeemed | | | 251,919 | |
Management fees | | | 436,276 | |
Distribution fees | | | 153,261 | |
Due to brokers | | | 5,579,400 | |
OTC Swaps (premiums received $137,569) | | | 104,821 | |
Unrealized depreciation on forward exchange contracts | | | 5,507,080 | |
Unrealized depreciation on unfunded loan commitments (Note 8) | | | 19,110 | |
Deferred tax | | | 11,099 | |
Accrued expenses and other liabilities | | | 208,800 | |
| | | | |
Total liabilities | | | 36,800,327 | |
| | | | |
Net assets, at value | | $ | 895,407,341 | |
| | | | |
Net assets consist of: | | | | |
Paid-in capital | | $ | 853,292,288 | |
Undistributed net investment income | | | 39,238,788 | |
Net unrealized appreciation (depreciation) | | | (13,091,622 | ) |
Accumulated net realized gain (loss) | | | 15,967,887 | |
| | | | |
Net assets, at value | | $ | 895,407,341 | |
| | | | |
| | | | | | |
| | | The accompanying notes are an integral part of these financial statements. | Annual Report | | | FSI-33 | |
FRANKLIN TEMPLETON VARIABLE INSURANCE PRODUCTS TRUST
FINANCIAL STATEMENTS
Statement of Assets and Liabilities (continued)
December 31, 2014
| | | | |
| | | Franklin Strategic
Income VIP Fund | |
| |
| Class 1: | | | | |
Net assets, at value | | $ | 574,850,182 | |
| | | | |
Shares outstanding | | | 48,308,043 | |
| | | | |
Net asset value and maximum offering price per share | | $ | 11.90 | |
| | | | |
| |
| Class 2: | | | | |
Net assets, at value | | $ | 206,570,686 | |
| | | | |
Shares outstanding | | | 17,887,815 | |
| | | | |
Net asset value and maximum offering price per share | | $ | 11.55 | |
| | | | |
| |
| Class 4: | | | | |
Net assets, at value | | $ | 113,986,473 | |
| | | | |
Shares outstanding | | | 9,674,546 | |
| | | | |
Net asset value and maximum offering price per share | | $ | 11.78 | |
| | | | |
| | | | |
| FSI-34 | | Annual Report | The accompanying notes are an integral part of these financial statements. | | |
FRANKLIN TEMPLETON VARIABLE INSURANCE PRODUCTS TRUST
FINANCIAL STATEMENTS
Statement of Operations
for the year ended December 31, 2014
| | | | |
| | | Franklin Strategic
Income VIP Fund | |
Investment income: | | | | |
Dividends | | $ | 137,853 | |
Interest | | | 48,006,997 | |
| | | | |
Total investment income | | | 48,144,850 | |
| | | | |
Expenses: | | | | |
Management fees (Note 3a) | | | 5,595,205 | |
Distribution fees: (Note 3c) | | | | |
Class 2 | | | 480,827 | |
Class 4 | | | 451,080 | |
Custodian fees (Note 4) | | | 126,357 | |
Reports to shareholders | | | 206,080 | |
Professional fees | | | 101,661 | |
Trustees’ fees and expenses | | | 3,913 | |
Other | | | 82,245 | |
| | | | |
Total expenses | | | 7,047,368 | |
Expense reductions (Note 4) | | | (1,130 | ) |
Expenses waived/paid by affiliates (Note 3e) | | | (75,838 | ) |
| | | | |
Net expenses | | | 6,970,400 | |
| | | | |
Net investment income | | | 41,174,450 | |
| | | | |
Realized and unrealized gains (losses): | | | | |
Net realized gain (loss) from: | | | | |
Investments | | | 18,635,732 | |
Foreign currency transactions | | | 2,286,891 | |
Swap contracts | | | 973,216 | |
| | | | |
Net realized gain (loss) | | | 21,895,839 | |
| | | | |
Net change in unrealized appreciation (depreciation) on: | | | | |
Investments | | | (52,758,469 | ) |
Translation of other assets and liabilities denominated in foreign currencies | | | 11,194,003 | |
Change in deferred taxes on unrealized appreciation | | | 30 | |
| | | | |
Net change in unrealized appreciation (depreciation) | | | (41,564,436 | ) |
| | | | |
Net realized and unrealized gain (loss) | | | (19,668,597 | ) |
| | | | |
Net increase (decrease) in net assets resulting from operations | | $ | 21,505,853 | |
| | | | |
| | | | | | |
| | | The accompanying notes are an integral part of these financial statements. | Annual Report | | | FSI-35 | |
FRANKLIN TEMPLETON VARIABLE INSURANCE PRODUCTS TRUST
FINANCIAL STATEMENTS
Statements of Changes in Net Assets
| | | | | | | | |
| | | Franklin Strategic Income VIP Fund | |
| | | Year Ended December 31, | |
| | | 2014 | | | 2013 | |
Increase (decrease) in net assets: | | | | | | | | |
Operations: | | | | | | | | |
Net investment income | | $ | 41,174,450 | | | $ | 54,238,182 | |
Net realized gain (loss) from investments, foreign currency transactions and swap contracts | | | 21,895,839 | | | | 22,020,933 | |
Net change in unrealized appreciation (depreciation) on investments, translation of other assets and liabilities denominated in foreign currencies and deferred taxes | | | (41,564,436 | ) | | | (37,991,817 | ) |
| | | | |
Net increase (decrease) in net assets resulting from operations | | | 21,505,853 | | | | 38,267,298 | |
| | | | |
Distributions to shareholders from: | | | | | | | | |
Net investment income and net foreign currency gains: | | | | | | | | |
Class 1 | | | (39,220,893 | ) | | | (54,987,119 | ) |
Class 2 | | | (11,269,863 | ) | | | (10,246,664 | ) |
Class 4 | | | (7,512,342 | ) | | | (10,775,092 | ) |
Net realized gains: | | | | | | | | |
Class 1 | | | (12,517,628 | ) | | | (11,433,439 | ) |
Class 2 | | | (3,732,579 | ) | | | (2,203,428 | ) |
Class 4 | | | (2,588,163 | ) | | | (2,384,488 | ) |
| | | | |
Total distributions to shareholders | | | (76,841,468 | ) | | | (92,030,230 | ) |
| | | | |
Capital share transactions: (Note 2) | | | | | | | | |
Class 1 | | | (94,647,397 | ) | | | (275,817,937 | ) |
Class 2 | | | 43,236,033 | | | | 23,867,593 | |
Class 4 | | | (13,615,799 | ) | | | (52,983,286 | ) |
| | | | |
Total capital share transactions | | | (65,027,163 | ) | | | (304,933,630 | ) |
| | | | |
Net increase (decrease) in net assets | | | (120,362,778 | ) | | | (358,696,562 | ) |
Net assets: | | | | | | | | |
Beginning of year | | | 1,015,770,119 | | | | 1,374,466,681 | |
| | | | |
End of year | | $ | 895,407,341 | | | $ | 1,015,770,119 | |
| | | | |
Undistributed net investment income included in net assets: | | | | | | | | |
End of year | | $ | 39,238,788 | | | $ | 50,393,655 | |
| | | | |
| | | | |
| FSI-36 | | Annual Report | The accompanying notes are an integral part of these financial statements. | | |
FRANKLIN TEMPLETON VARIABLE INSURANCE PRODUCTS TRUST
Notes to Financial Statements
Franklin Strategic Income VIP Fund
1. Organization and Significant Accounting Policies
Franklin Templeton Variable Insurance Products Trust (Trust) is registered under the Investment Company Act of 1940, as amended, (1940 Act) as an open-end management investment company, consisting of nineteen separate funds and applies the specialized accounting and reporting guidance in U.S. Generally Accepted Accounting Principles (U.S. GAAP). Franklin Strategic Income VIP Fund (Fund) is included in this report. The financial statements of the remaining funds in the Trust are presented separately. Shares of the Fund are generally sold only to insurance company separate accounts to fund the benefits of variable life insurance policies or variable annuity contracts. At December 31, 2014, 77.75% of the Fund’s shares were held through one insurance company. Investment activities of these insurance company separate accounts could have a material impact on the Fund. The Fund offers three classes of shares: Class 1, Class 2, and Class 4. Each class of shares differs by its distribution fees, voting rights on matters affecting a single class and its exchange privilege.
Effective May 1, 2014, Franklin Strategic Income Securities Fund was renamed Franklin Strategic Income VIP Fund.
The following summarizes the Fund’s significant accounting policies.
a. Financial Instrument Valuation
The Fund’s investments in financial instruments are carried at fair value daily. Fair value is the price that would be received to sell an asset or paid to transfer a liability in an orderly transaction between market participants on the measurement date. The Fund calculates the net asset value (NAV) per share at the close of the New York Stock Exchange (NYSE), generally at 4 p.m. Eastern time (NYSE close) on each day the NYSE is open for trading. Under compliance policies and procedures approved by the Trust’s Board of Trustees (the Board), the Fund’s administrator has responsibility for oversight of valuation, including leading the cross-functional Valuation and Liquidity Oversight Committee (VLOC). The VLOC provides administration and oversight of the Fund’s valuation policies and procedures, which are approved annually by the Board. Among other things, these procedures allow the Fund to utilize independent pricing services, quotations from securities and financial instrument dealers, and other market sources to determine fair value.
Equity securities listed on an exchange or on the NASDAQ National Market System are valued at the last quoted sale price or the official closing price of the day, respectively. Foreign equity securities are valued as of the close of trading on the foreign stock exchange on which the security is primarily traded or as of the NYSE close, whichever is earlier. The value is then converted into its U.S. dollar equivalent at the foreign exchange rate in effect at the NYSE close on the day that the value of the security is determined. Over-the-counter (OTC) securities are valued within the range of the most recent quoted bid and ask prices. Securities that trade in multiple markets or on multiple exchanges are valued according to the broadest and most representative market. Certain equity securities are valued based upon fundamental characteristics or relationships to similar securities. Investments in open-end mutual funds are valued at the closing NAV.
Debt securities generally trade in the OTC market rather than on a securities exchange. The Fund’s pricing services use multiple valuation techniques to determine fair value. In instances where sufficient market activity exists, the pricing services may utilize a market-based approach through which quotes from market makers are used to determine fair value. In instances where sufficient market activity may not exist or is limited, the pricing services also utilize proprietary valuation models which may consider market characteristics such as benchmark yield curves, credit spreads, estimated default rates, anticipated market interest rate volatility, coupon rates, anticipated timing of principal repayments, underlying collateral, and other unique security features in order to estimate the relevant cash flows, which are then discounted to calculate the fair value. Securities denominated in a foreign currency are converted into their U.S. dollar equivalent at the foreign exchange rate in effect at the NYSE close on the date that the values of the foreign debt securities are determined.
Certain derivative financial instruments (derivatives) trade in the OTC market. The Fund’s pricing services use various techniques including industry standard option pricing models and proprietary discounted cash flow models to determine the fair value of those instruments. The Fund’s net benefit or obligation under the derivative contract, as measured by the fair value of the contract, is included in net assets.
The Fund has procedures to determine the fair value of financial instruments for which market prices are not reliable or readily available. Under these procedures, the VLOC convenes on a
FRANKLIN TEMPLETON VARIABLE INSURANCE PRODUCTS TRUST
NOTES TO FINANCIAL STATEMENTS
Franklin Strategic Income VIP Fund (continued)
1. Organization and Significant Accounting Policies (continued)
a. Financial Instrument Valuation (continued)
regular basis to review such financial instruments and considers a number of factors, including significant unobservable valuation inputs, when arriving at fair value. The VLOC primarily employs a market-based approach which may use related or comparable assets or liabilities, recent transactions, market multiples, book values, and other relevant information for the investment to determine the fair value of the investment. An income-based valuation approach may also be used in which the anticipated future cash flows of the investment are discounted to calculate fair value. Discounts may also be applied due to the nature or duration of any restrictions on the disposition of the investments. Due to the inherent uncertainty of valuations of such investments, the fair values may differ significantly from the values that would have been used had an active market existed. The VLOC employs various methods for calibrating these valuation approaches including a regular review of key inputs and assumptions, transactional back-testing or disposition analysis, and reviews of any related market activity.
Trading in securities on foreign securities stock exchanges and OTC markets may be completed before the daily NYSE close. In addition, trading in certain foreign markets may not take place on every NYSE business day. Occasionally, events occur between the time at which trading in a foreign security is completed and the close of the NYSE that might call into question the reliability of the value of a portfolio security held by the Fund. As a result, differences may arise between the value of the Fund’s portfolio securities as determined at the foreign market close and the latest indications of value at the close of the NYSE. In order to minimize the potential for these differences, the VLOC monitors price movements following the close of trading in foreign stock markets through a series of country specific market proxies (such as baskets of American Depositary Receipts, futures contracts and exchange traded funds). These price movements are measured against established trigger thresholds for each specific market proxy to assist in determining if an event has occurred that may call into question the reliability of the values of the foreign securities held by the Fund. If such an event occurs, the securities may be valued using fair value procedures, which may include the use of independent pricing services.
Also, when the last day of the reporting period is a non-business day, certain foreign markets may be open on those days that the NYSE is closed, which could result in differences between the value of the Fund’s portfolio securities on the last business day and the last calendar day of the reporting period. Any significant security valuation changes due to an open foreign market are adjusted and reflected by the Fund for financial reporting purposes.
b. Foreign Currency Translation
Portfolio securities and other assets and liabilities denominated in foreign currencies are translated into U.S. dollars based on the exchange rate of such currencies against U.S. dollars on the date of valuation. The Fund may enter into foreign currency exchange contracts to facilitate transactions denominated in a foreign currency. Purchases and sales of securities, income and expense items denominated in foreign currencies are translated into U.S. dollars at the exchange rate in effect on the transaction date. Portfolio securities and assets and liabilities denominated in foreign currencies contain risks that those currencies will decline in value relative to the U.S. dollar. Occasionally, events may impact the availability or reliability of foreign exchange rates used to convert the U.S. dollar equivalent value. If such an event occurs, the foreign exchange rate will be valued at fair value using procedures established and approved by the Board.
The Fund does not separately report the effect of changes in foreign exchange rates from changes in market prices on securities held. Such changes are included in net realized and unrealized gain or loss from investments on the Statement of Operations.
Realized foreign exchange gains or losses arise from sales of foreign currencies, currency gains or losses realized between the trade and settlement dates on securities transactions and the difference between the recorded amounts of dividends, interest, and foreign withholding taxes and the U.S. dollar equivalent of the amounts actually received or paid. Net unrealized foreign exchange gains and losses arise from changes in foreign exchange rates on foreign denominated assets and liabilities other than investments in securities held at the end of the reporting period.
c. Securities Purchased on a Delayed Delivery and TBA Basis
The Fund purchases securities on a delayed delivery and to-be-announced (TBA) basis, with payment and delivery scheduled for a future date. These transactions are subject to market
FRANKLIN TEMPLETON VARIABLE INSURANCE PRODUCTS TRUST
NOTES TO FINANCIAL STATEMENTS
Franklin Strategic Income VIP Fund (continued)
fluctuations and are subject to the risk that the value at delivery may be more or less than the trade date purchase price. Although the Fund will generally purchase these securities with the intention of holding the securities, it may sell the securities before the settlement date. Sufficient assets have been segregated for these securities.
d. Derivative Financial Instruments
The Fund invested in derivatives in order to manage risk or gain exposure to various other investments or markets. Derivatives are financial contracts based on an underlying or notional amount, require no initial investment or an initial net investment that is smaller than would normally be required to have a similar response to changes in market factors, and require or permit net settlement. Derivatives contain various risks including the potential inability of the counterparty to fulfill their obligations under the terms of the contract, the potential for an illiquid secondary market, and/or the potential for market movements which expose the Fund to gains or losses in excess of the amounts shown on the Statement of Assets and Liabilities. Realized gain and loss and unrealized appreciation and depreciation on these contracts for the period are included in the Statement of Operations.
Derivative counterparty credit risk is managed through a formal evaluation of the creditworthiness of all potential counterparties. The Fund attempts to reduce its exposure to counterparty credit risk on OTC derivatives, whenever possible, by entering into International Swaps and Derivatives Association (ISDA) master agreements with certain counterparties. These agreements contain various provisions, including but not limited to collateral requirements, events of default, or early termination. Termination events applicable to the counterparty include certain deteriorations in the credit quality of the counterparty. Termination events applicable to the Fund include failure of the Fund to maintain certain net asset levels and/or limit the decline in net assets over various periods of time. In the event of default or early termination, the ISDA master agreement gives the non-defaulting party the right to net and close-out all transactions traded, whether or not arising under the ISDA agreement, to one net amount payable by one counterparty to the other. However, absent an event of default or early termination, OTC derivative assets and liabilities are presented gross and not offset in the Statement of Assets and Liabilities. Early termination by the counterparty may result in an immediate payment by the Fund of any net liability owed to that counterparty under the ISDA agreement.
Collateral requirements differ by type of derivative. Collateral terms are contract specific for OTC derivatives. For OTC derivatives traded under an ISDA master agreement, posting of collateral is required by either the fund or the applicable counterparty if the total net exposure of all OTC derivatives with the applicable counterparty exceeds the minimum transfer amount, which typically ranges from $100,000 to $250,000, and can vary depending on the counterparty and the type of the agreement. Generally, collateral is determined at the close of fund business each day and any additional collateral required due to changes in derivative values may be delivered by the fund or the counterparty within a few business days. Collateral pledged and/or received by the fund, if any, is held in segregated accounts with the fund’s custodian/counterparty broker and can be in the form of cash and/or securities. Unrestricted cash may be invested according to the Fund’s investment objectives.
The Fund entered into OTC forward exchange contracts primarily to manage and/or gain exposure to certain foreign currencies. A forward exchange contract is an agreement between the Fund and a counterparty to buy or sell a foreign currency at a specific exchange rate on a future date.
The Fund entered into credit default swap contracts primarily to manage exposure to credit risk. A credit default swap is an agreement between the Fund and a counterparty whereby the buyer of the contract receives credit protection and the seller of the contract guarantees the credit worthiness of a referenced debt obligation. These agreements may be privately negotiated in the over-the-counter market (“OTC credit default swaps”) or may be executed in a multilateral trade facility platform, such as a registered exchange (“centrally cleared credit default swaps”). The underlying referenced debt obligation may be a single issuer of corporate or sovereign debt, a credit index, or a tranche of a credit index. In the event of a default of the underlying referenced debt obligation, the buyer is entitled to receive the notional amount of the credit default swap contract from the seller in exchange for the referenced debt obligation, a net settlement amount equal to the notional amount of the credit default swap less the recovery value of the referenced debt obligation, or other agreed upon amount. For centrally cleared credit default swaps, required initial margins are pledged by the Fund, and the daily change in fair value is accounted for as a variation margin payable or receivable on the Statement of Assets and Liabilities. Over the term of the contract, the buyer pays the seller a periodic stream of payments, provided that no
FRANKLIN TEMPLETON VARIABLE INSURANCE PRODUCTS TRUST
NOTES TO FINANCIAL STATEMENTS
Franklin Strategic Income VIP Fund (continued)
1. Organization and Significant Accounting Policies (continued)
d. Derivative Financial Instruments (continued)
event of default has occurred. Such periodic payments are accrued daily as an unrealized appreciation or depreciation until the payments are made, at which time they are realized. Payments received or paid to initiate a credit default swap contract are reflected on the Statement of Assets and Liabilities and represent compensating factors between stated terms of the credit default swap agreement and prevailing market conditions (credit spreads and other relevant factors). These upfront payments are amortized over the term of the contract as a realized gain or loss on the Statement of Operations.
See Note 9 regarding other derivative information.
e. Restricted Cash
At December 31, 2014, the Fund held restricted cash in connection with investments in certain derivative securities. Restricted cash is held in a segregated account with the Fund’s custodian and is reflected in the Statement of Assets and Liabilities.
f. Loan Participation Notes
The Fund invests in loan participation notes (“Participations”). Participations are loans originally issued to a borrower by one or more financial institutions (the “Lender”) and subsequently sold to other investors, such as the Fund. Participations typically result in the Fund having a contractual relationship only with the Lender and not with the borrower. The Fund has the right to receive from the Lender any payments of principal, interest and fees which the Lender received from the borrower. The Fund generally has no rights to either enforce compliance by the borrower with the terms of the loan agreement or to any collateral relating to the original loan. As a result, the Fund assumes the credit risk of both the borrower and the Lender that is selling the Participation. The Participations may also involve interest rate risk and liquidity risk, including the potential default or insolvency of the borrower and/or the Lender.
g. FT Holdings Corporation III (FT Subsidiary)
The Fund invests in certain financial instruments through its investment in the FT Subsidiary. FT Subsidiary is a Delaware Corporation, is a wholly-owned subsidiary of the Fund, and is able to invest in certain financial instruments consistent with the
investment objective of the Fund. At December 31, 2014, FT Subsidiary’s investment, Turtle Bay Resort, as well as any other assets and liabilities of FT Subsidiary are reflected in the Fund’s Statement of Investments and Statement of Assets and Liabilities. The financial statements have been consolidated and include the accounts of the Fund and FT Subsidiary. All intercompany transactions and balances have been eliminated.
h. Mortgage Dollar Rolls
The Fund enters into mortgage dollar rolls, typically on a TBA basis. Mortgage dollar rolls are agreements between the Fund and a financial institution to simultaneously sell and repurchase mortgage-backed securities at a future date. Gains or losses are realized on the initial sale, and the difference between the repurchase price and the sale price is recorded as an unrealized gain or loss to the Fund upon entering into the mortgage dollar roll. In addition, the Fund may invest the cash proceeds that are received from the initial sale. During the period between the sale and repurchase, the Fund is not entitled to principal and interest paid on the mortgage backed securities. The risks of mortgage dollar roll transactions include the potential inability of the counterparty to fulfill its obligations.
i. Senior Floating Rate Interests
The Fund invests in senior secured corporate loans that pay interest at rates which are periodically reset by reference to a base lending rate plus a spread. These base lending rates are generally the prime rate offered by a designated U.S. bank or the London InterBank Offered Rate (LIBOR). Senior secured corporate loans often require prepayment of principal from excess cash flows or at the discretion of the borrower. As a result, actual maturity may be substantially less than the stated maturity. Senior secured corporate loans in which the Fund invests are generally readily marketable, but may be subject to certain restrictions on resale.
j. Income and Deferred Taxes
It is the Fund’s policy to qualify as a regulated investment company under the Internal Revenue Code. The Fund intends to distribute to shareholders substantially all of its taxable income and net realized gains to relieve it from federal income and if applicable, excise taxes. As a result, no provision for U.S. federal income taxes is required.
The Fund may be subject to foreign taxation related to income received, capital gains on the sale of securities and certain
FRANKLIN TEMPLETON VARIABLE INSURANCE PRODUCTS TRUST
NOTES TO FINANCIAL STATEMENTS
Franklin Strategic Income VIP Fund (continued)
foreign currency transactions in the foreign jurisdictions in which it invests. Foreign taxes, if any, are recorded based on the tax regulations and rates that exist in the foreign markets in which the Fund invests. When a capital gain tax is determined to apply the Fund records an estimated deferred tax liability in an amount that would be payable if the securities were disposed of on the valuation date.
The Fund recognizes the tax benefits of uncertain tax positions only when the position is “more likely than not” to be sustained upon examination by the tax authorities based on the technical merits of the tax position. As of December 31, 2014, and for all open tax years, the Fund has determined that no liability for unrecognized tax benefits is required in the Fund’s financial statements related to uncertain tax positions taken on a tax return (or expected to be taken on future tax returns). Open tax years are those that remain subject to examination and are based on each tax jurisdiction statute of limitation.
k. Security Transactions, Investment Income, Expenses and Distributions
Security transactions are accounted for on trade date. Realized gains and losses on security transactions are determined on a specific identification basis. Interest income and estimated expenses are accrued daily. Amortization of premium and accretion of discount on debt securities are included in interest income. Facility fees are recognized as income over the expected term of the loan. Dividend income is recorded on the ex-dividend date. Distributions to shareholders are recorded on the ex-dividend date and are determined according to income tax regulations (tax basis). Distributable earnings determined on a tax basis may differ from earnings recorded in accordance with U.S. GAAP. These differences may be permanent or temporary. Permanent differences are reclassified among capital accounts to reflect their tax character. These reclassifications have no impact on net assets or the results of operations. Temporary differences are not reclassified, as they may reverse in subsequent periods.
Common expenses incurred by the Trust are allocated among the funds based on the ratio of net assets of each fund to the combined net assets of the Trust. Fund specific expenses are charged directly to the fund that incurred the expense.
Realized and unrealized gains and losses and net investment income, not including class specific expenses, are allocated daily to each class of shares based upon the relative proportion of net assets of each class. Differences in per share distributions, by class, are generally due to differences in class specific expenses.
Inflation-indexed bonds are adjusted for inflation through periodic increases or decreases in the security’s interest accruals, face amount, or principal redemption value, by amounts corresponding to the rate of inflation as measured by an index. Any increase or decrease in the face amount or principal redemption value will be included as interest income on the Statement of Operations.
l. Accounting Estimates
The preparation of financial statements in accordance with U.S. GAAP requires management to make estimates and assumptions that affect the reported amounts of assets and liabilities at the date of the financial statements and the amounts of income and expenses during the reporting period. Actual results could differ from those estimates.
m. Guarantees and Indemnifications
Under the Trust’s organizational documents, its officers and trustees are indemnified by the Trust against certain liabilities arising out of the performance of their duties to the Trust. Additionally, in the normal course of business, the Trust, on behalf of the Fund, enters into contracts with service providers that contain general indemnification clauses. The Trust’s maximum exposure under these arrangements is unknown as this would involve future claims that may be made against the Trust that have not yet occurred. Currently, the Trust expects the risk of loss to be remote.
FRANKLIN TEMPLETON VARIABLE INSURANCE PRODUCTS TRUST
NOTES TO FINANCIAL STATEMENTS
Franklin Strategic Income VIP Fund (continued)
2. Shares of Beneficial Interest
At December 31, 2014, there were an unlimited number of shares authorized (without par value). Transactions in the Fund’s shares were as follows:
| | | | | | | | | | | | | | | | | | |
| | | Year Ended December 31, | |
| | | 2014 | | | | | 2013 | |
| | | Shares | | | Amount | | | | | Shares | | | Amount | |
| | | | | |
| Class 1 Shares: | | | | | | | | | | | | | | | | | | |
Shares sold | | | 702,662 | | | $ | 8,745,867 | | | | | | 782,903 | | | $ | 10,091,023 | |
Shares issued in reinvestment of distributions | | | 4,268,855 | | | | 51,738,520 | | | | | | 5,373,832 | | | | 66,420,558 | |
Shares redeemed | | | (12,467,167 | ) | | | (155,131,784 | ) | | | | | (27,765,536 | ) | | | (352,329,518 | ) |
| | | | |
Net increase (decrease) | | | (7,495,650 | ) | | $ | (94,647,397 | ) | | | | | (21,608,801 | ) | | $ | (275,817,937 | ) |
| | | | |
| Class 2 Shares: | | | | | | | | | | | | | | | | | | |
Shares sold | | | 6,058,039 | | | $ | 72,800,016 | | | | | | 4,461,765 | | | $ | 56,022,684 | |
Shares issued in reinvestment of distributions | | | 1,273,552 | | | | 15,002,442 | | | | | | 1,034,061 | | | | 12,450,092 | |
Shares redeemed | | | (3,696,063 | ) | | | (44,566,425 | ) | | | | | (3,579,730 | ) | | | (44,605,183 | ) |
| | | | |
Net increase (decrease) | | | 3,635,528 | | | $ | 43,236,033 | | | | | | 1,916,096 | | | $ | 23,867,593 | |
| | | | |
| Class 4 Shares: | | | | | | | | | | | | | | | | | | |
Shares sold | | | 732,854 | | | $ | 9,004,820 | | | | | | 930,235 | | | $ | 11,782,444 | |
Shares issued on reinvestment of distributions | | | 839,610 | | | | 10,100,506 | | | | | | 1,074,251 | | | | 13,159,580 | |
Shares redeemed | | | (2,683,922 | ) | | | (32,721,125 | ) | | | | | (6,283,838 | ) | | | (77,925,310 | ) |
| | | | |
Net increase (decrease) | | | (1,111,458 | ) | | $ | (13,615,799 | ) | | | | | (4,279,352 | ) | | $ | (52,983,286 | ) |
| | | | |
3. Transactions With Affiliates
Franklin Resources, Inc. is the holding company for various subsidiaries that together are referred to as Franklin Templeton Investments. Certain officers and trustees of the Fund are also officers and/or directors of the following subsidiaries:
| | |
| Subsidiary | | Affiliation |
Franklin Advisers, Inc. (Advisers) | | Investment manager |
Franklin Templeton Services, LLC (FT Services) | | Administrative manager |
Franklin Templeton Distributors, Inc. (Distributors) | | Principal underwriter |
Franklin Templeton Investor Services, LLC (Investor Services) | | Transfer agent |
FRANKLIN TEMPLETON VARIABLE INSURANCE PRODUCTS TRUST
NOTES TO FINANCIAL STATEMENTS
Franklin Strategic Income VIP Fund (continued)
a. Management Fees
The Fund pays an investment management fee to Advisers based on the average daily net assets of the Fund as follows:
| | |
| Annualized Fee Rate | | Net Assets |
0.625% | | Up to and including $500 million |
0.525% | | Over $500 million, up to and including $1 billion |
0.480% | | Over $1 billion, up to and including $1.5 billion |
0.435% | | Over $1.5 billion, up to and including $6.5 billion |
0.415% | | Over $6.5 billion, up to and including $11.5 billion |
0.400% | | Over $11.5 billion, up to and including $16.5 billion |
0.390% | | Over $16.5 billion, up to and including $19 billion |
0.380% | | Over $19 billion, up to and including $21.5 billion |
0.370% | | In excess of $21.5 billion |
b. Administrative Fees
Under an agreement with Advisers, FT Services provides administrative services to the Fund. The fee is paid by Advisers based on the Fund’s average daily net assets, and is not an additional expense of the Fund.
c. Distribution Fees
The Board has adopted distribution plans for Class 2 and Class 4 shares pursuant to Rule 12b-1 under the 1940 Act. Under the Fund’s compensation distribution plans, the Fund pays Distributors for costs incurred in connection with the servicing, sale and distribution of the Fund’s shares up to 0.25%, and 0.35% per year of its average daily net assets of Class 2 and Class 4, respectively. Some distribution fees are not charged on shares held by affiliates. The plan year, for purposes of monitoring compliance with the maximum annual plan rates, is February 1 through January 31.
d. Transfer Agent Fees
Investor Services, under terms of an agreement, performs shareholder servicing for the Fund and is not paid by the Fund for the services.
e. Investments in Institutional Fiduciary Trust Money Market Portfolio
The Fund invests in Institutional Fiduciary Trust Money Market Portfolio (Sweep Money Fund), an affiliated open-end management investment company. Management fees paid by the Fund are waived on assets invested in the Sweep Money Fund, as noted on the Statement of Operations, in an amount not to exceed the management and administrative fees paid directly or indirectly by the Sweep Money Fund. Prior to January 1, 2014, the waiver was accounted for as a reduction to management fees.
4. Expense Offset Arrangement
The Fund has entered into an arrangement with its custodian whereby credits realized as a result of uninvested cash balances are used to reduce a portion of the Fund’s custodian expenses. During the year ended December 31, 2014, the custodian fees were reduced as noted in the Statement of Operations.
FRANKLIN TEMPLETON VARIABLE INSURANCE PRODUCTS TRUST
NOTES TO FINANCIAL STATEMENTS
Franklin Strategic Income VIP Fund (continued)
5. Income Taxes
The tax character of distributions paid during the years ended December 31, 2014 and 2013, was as follows:
| | | | | | | | |
| | | 2014 | | | 2013 | |
| | |
Distributions paid from: | | | | | | | | |
Ordinary income | | $ | 59,337,862 | | | $ | 79,686,221 | |
Long term capital gain | | | 17,503,606 | | | | 12,344,009 | |
| | | | |
| | $ | 76,841,468 | | | $ | 92,030,230 | |
| | | | |
At December 31, 2014, the cost of investments, net unrealized appreciation (depreciation), undistributed ordinary income and undistributed long term capital gains for income tax purposes were as follows:
| | | | |
Cost of investments | | $ | 917,305,934 | |
| | | | |
Unrealized appreciation | | $ | 20,839,065 | |
Unrealized depreciation | | | (46,967,724 | ) |
| | | | |
Net unrealized appreciation (depreciation) | | $ | (26,128,659 | ) |
| | | | |
| |
Undistributed ordinary income | | $ | 55,480,213 | |
Undistributed long term capital gains | | | 14,270,924 | |
| | | | |
Distributable earnings | | $ | 69,751,137 | |
| | | | |
Differences between income and/or capital gains as determined on a book basis and a tax basis are primarily due to differing treatments of foreign currency transactions and bond discounts and premiums.
6. Investment Transactions
Purchases and sales of investments (excluding short term securities) for the year ended December 31, 2014, aggregated $478,174,188 and $532,087,943, respectively.
7. Credit Risk and Defaulted Securities
At December 31, 2014, the Fund had 57.01% of its portfolio invested in high yield, senior secured floating rate notes, or other securities rated below investment grade. These securities may be more sensitive to economic conditions causing greater price volatility and are potentially subject to a greater risk of loss due to default than higher rated securities.
The Fund held defaulted securities and/or other securities for which the income has been deemed uncollectible. At December 31, 2014, the aggregate value of these securities was $2,168,750, representing 0.24% of the Fund’s net assets. The Fund discontinues accruing income on securities for which income has been deemed uncollectible and provides an estimate for losses on interest receivable. The securities have been identified on the accompanying Statement of Investments.
8. Unfunded Loan Commitments
The Fund enters into certain credit agreements, all or a portion of which may be unfunded. The Fund is obligated to fund these loan commitments at the borrowers’ discretion. Funded portions of credit agreements are presented on the Statement of Investments.
At December 31, 2014, unfunded commitments were as follows:
| | | | |
| Borrower | | Unfunded
Commitment | |
Patriot Coal Corp., L/C Facility, 6.50%, 12/18/18 | | $ | 173,376 | |
| | | | |
FRANKLIN TEMPLETON VARIABLE INSURANCE PRODUCTS TRUST
NOTES TO FINANCIAL STATEMENTS
Franklin Strategic Income VIP Fund (continued)
Unfunded loan commitments and funded portions of credit agreements are marked to market daily and any unrealized appreciation or depreciation is included in the Statement of Assets and Liabilities and the Statement of Operations.
9. Other Derivative Information
At December 31, 2014, the Fund’s investments in derivative contracts are reflected on the Statement of Assets and Liabilities as follows:
| | | | | | | | | | | | |
| | | Asset Derivatives | | | Liability Derivatives | |
Derivative Contracts Not Accounted for as Hedging Instruments | | Statement of Assets and
Liabilities Location | | Fair Value | | | Statement of Assets and
Liabilities Location | | Fair Value | |
Foreign exchange contracts | | Unrealized appreciation on forward exchange contracts | | $ | 16,352,768 | | | Unrealized depreciation on forward exchange contracts | | $ | 5,507,080 | |
| | | | |
Credit contracts | | Unrealized appreciation on OTC swap contracts | | | 175,617 | | | Unrealized depreciation on OTC swap contracts | | | — | |
For the year ended December 31, 2014, the effect of derivative contracts on the Fund’s Statement of Operations was as follows:
| | | | | | | | | | |
Derivative Contracts Not Accounted for as Hedging Instruments | | Statement of Operations Locations | | Realized
Gain (Loss)
for the Year | | | Change in
Unrealized
Appreciation
(Depreciation)
for the Year | |
Foreign exchange contracts | | Net realized gain (loss) from foreign currency transactions / Net change in unrealized appreciation (depreciation) on translation of other assets and liabilities denominated in foreign currencies | | $ | 2,520,387 | | | $ | 11,455,572 | |
| | | |
Credit contracts | | Net realized gain (loss) from swap contracts / Net change in unrealized appreciation (depreciation) on investments | | | 973,216 | | | | (71,683 | ) |
At December 31, 2014, the Fund’s OTC derivative assets and liabilities, are as follows:
| | | | | | | | |
| | | Gross and Net Amounts
of Assets and Liabilities
Presented in the
Statement of Assets and
Liabilities | |
| | | Assetsa | | | Liabilitiesa | |
| Derivatives | | | | | | | | |
Forward exchange contracts | | $ | 16,352,768 | | | $ | 5,507,080 | |
Swap Contracts | | | 195,300 | | | | 104,821 | |
| | | | |
Total | | $ | 16,548,068 | | | $ | 5,611,901 | |
| | | | |
aAbsent an event of default or early termination, OTC derivative assets and liabilities are presented gross and not offset in the Statement of Assets and Liabilities.
FRANKLIN TEMPLETON VARIABLE INSURANCE PRODUCTS TRUST
NOTES TO FINANCIAL STATEMENTS
Franklin Strategic Income VIP Fund (continued)
9. Other Derivative Information (continued)
At December 31, 2014, the Fund’s OTC derivative assets which may be offset against the Fund’s OTC derivative liabilities and collateral received from the counterparty, is as follows:
| | | | | | | | | | | | | | | | | | | | |
| | | | | | Amounts Not Offset in the Statement of
Assets and Liabilities | | | | |
| | | Gross and Net
Amounts of Assets
Presented in the
Statement of
Assets and Liabilities | | | Financial
Instruments
Available for Offset | | | Financial
Instruments
Collateral
Receiveda,b | | | Cash Collateral
Receivedb | | | Net Amount (Not
less than zero) | |
| Counterparty | | | | | | | | | | | | | | | | | | | | |
BZWS | | $ | 1,270,531 | | | $ | (254,343 | ) | | $ | — | | | $ | (839,000 | ) | | $ | 177,188 | |
CITI | | | 656,777 | | | | (123,871 | ) | | | (338,840 | ) | | | — | | | | 194,066 | |
DBAB | | | 9,504,421 | | | | (4,598,830 | ) | | | — | | | | (4,690,000 | ) | | | 215,591 | |
GSCO | | | 82,122 | | | | — | | | | — | | | | — | | | | 82,122 | |
HSBC | | | 944,540 | | | | (43,333 | ) | | | (901,207 | ) | | | — | | | | — | |
JPHQ | | | 4,083,826 | | | | (562,402 | ) | | | (3,521,424 | ) | | | — | | | | — | |
MSCO | | | 5,851 | | | | (5,851 | ) | | | — | | | | — | | | | — | |
| | | | |
Total | | $ | 16,548,068 | | | $ | (5,588,630 | ) | | $ | (4,761,471 | ) | | $ | (5,529,000 | ) | | $ | 668,967 | |
| | | | |
aAt December 31, 2014, the Fund received United Kingdom Treasury Bonds and Notes, U.S. Government Agency Securities and U.S. Treasury Bonds and Notes as collateral for derivatives.
bIn some instances, the collateral amounts disclosed in the table above were adjusted due to the requirement to limit the collateral amounts to avoid the effect of overcollateralization. Actual collateral received and/or pledged may be more than the amounts disclosed herein.
At December 31, 2014, the Fund’s OTC derivative liabilities which may be offset against the Fund’s OTC derivative assets and collateral pledged to the counterparty, is as follows:
| | | | | | | | | | | | | | | | | | | | |
| | | | | | Amounts Not Offset in the Statement of
Assets and Liabilities | | | | |
| | | Gross and Net
Amounts of Liabilities
Presented in the
Statement of
Assets and Liabilities | | | Financial
Instruments
Available for Offset | | | Financial
Instruments
Collateral
Pledged | | | Cash Collateral
Pledged | | | Net Amount (Not
less than zero) | |
| Counterparty | | | | | | | | | | | | | | | | | | | | |
BZWS | | $ | 254,343 | | | $ | (254,343 | ) | | $ | — | | | $ | — | | | $ | — | |
CITI | | | 123,871 | | | | (123,871 | ) | | | — | | | | — | | | | — | |
DBAB | | | 4,598,830 | | | | (4,598,830 | ) | | | — | | | | — | | | | — | |
GSCO | | | — | | | | — | | | | — | | | | — | | | | — | |
HSBC | | | 43,333 | | | | (43,333 | ) | | | — | | | | — | | | | — | |
JPHQ | | | 562,402 | | | | (562,402 | ) | | | — | | | | — | | | | — | |
MSCO | | | 29,122 | | | | (5,851 | ) | | | — | | | | — | | | | 23,271 | |
| | | | |
Total | | $ | 5,611,901 | | | $ | (5,588,630 | ) | | $ | — | | | $ | — | | | $ | 23,271 | |
| | | | |
For the year ended December 31, 2014, the average month end fair value of derivatives represented 1.08% of average month end net assets. The average month end number of open derivative contracts for the year was 203.
See Note 1(d) regarding derivative financial instruments.
FRANKLIN TEMPLETON VARIABLE INSURANCE PRODUCTS TRUST
NOTES TO FINANCIAL STATEMENTS
Franklin Strategic Income VIP Fund (continued)
10. Credit Facility
The Fund, together with other U.S. registered and foreign investment funds (collectively, Borrowers), managed by Franklin Templeton Investments, are borrowers in a joint syndicated senior unsecured credit facility totaling $1.5 billion (Global Credit Facility) which matured on February 13, 2015. This Global Credit Facility provides a source of funds to the Borrowers for temporary and emergency purposes, including the ability to meet future unanticipated or unusually large redemption requests. The Borrowers expect to renew the Global Credit Facility for a total of $2 billion effective February 13, 2015, which matures on February 12, 2016.
Under the terms of the Global Credit Facility, the Fund shall, in addition to interest charged on any borrowings made by the Fund and other costs incurred by the Fund, pay its share of fees and expenses incurred in connection with the implementation and maintenance of the Global Credit Facility, based upon its relative share of the aggregate net assets of all of the Borrowers, including an annual commitment fee of 0.07% based upon the unused portion of the Global Credit Facility. These fees are reflected in other expenses on the Statement of Operations. During the year ended December 31, 2014, the Fund did not use the Global Credit Facility.
11. Fair Value Measurements
The Fund follows a fair value hierarchy that distinguishes between market data obtained from independent sources (observable inputs) and the Fund’s own market assumptions (unobservable inputs). These inputs are used in determining the value of the Fund’s financial instruments and are summarized in the following fair value hierarchy:
| | • | | Level 1 – quoted prices in active markets for identical financial instruments |
| | • | | Level 2 – other significant observable inputs (including quoted prices for similar financial instruments, interest rates, prepayment speed, credit risk, etc.) |
| | • | | Level 3 – significant unobservable inputs (including the Fund’s own assumptions in determining the fair value of financial instruments) |
The input levels are not necessarily an indication of the risk or liquidity associated with financial instruments at that level.
For movements between the levels within the fair value hierarchy, the Fund has adopted a policy of recognizing the transfers as of the date of the underlying event which caused the movement.
A summary of inputs used as of December 31, 2014, in valuing the Fund’s assets and liabilities carried at fair value, is as follows:
| | | | | | | | | | | | | | | | |
| | | Level 1 | | | Level 2 | | | Level 3 | | | Total | |
| Assets: | | | | | | | | | | | | | | | | |
Investments in Securities: | | | | | | | | | | | | | | | | |
Equity Investments:a | | | | | | | | | | | | | | | | |
Consumer Services | | $ | — | | | $ | — | | | $ | 2,566,956 | | | $ | 2,566,956 | |
Materials | | | — | | | | 453,750 | | | | — | | | | 453,750 | |
Transportation | | | — | | | | — | | | | 556,087 | | | | 556,087 | |
All Other Equity Investmentsb | | | 10,515,500 | | | | — | | | | — | | | | 10,515,500 | |
Corporate Bonds | | | — | | | | 320,823,487 | | | | 31,250 | | | | 320,854,737 | |
Senior Floating Rate Interests | | | — | | | | 166,373,284 | | | | 154,522 | | | | 166,527,806 | |
Foreign Government and Agency Securities | | | — | | | | 162,857,528 | | | | — | | | | 162,857,528 | |
U.S. Government and Agency Securities | | | — | | | | 16,190,643 | | | | — | | | | 16,190,643 | |
Asset-Backed Securities and Commercial Mortgage-Backed Securities | | | — | | | | 51,282,024 | | | | — | | | | 51,282,024 | |
Mortgage-Backed Securities | | | — | | | | 27,420,777 | | | | — | | | | 27,420,777 | |
Municipal Bonds | | | — | | | | 35,410,849 | | | | — | | | | 35,410,849 | |
Escrows and Litigation Trusts | | | — | | | | — | | | | — | c | | | — | |
Short Term Investments | | | 96,065,603 | | | | 475,015 | | | | — | | | | 96,540,618 | |
| | | | |
Total Investments in Securities | | $ | 106,581,103 | | | $ | 781,287,357 | | | $ | 3,308,815 | | | $ | 891,177,275 | |
| | | | |
FRANKLIN TEMPLETON VARIABLE INSURANCE PRODUCTS TRUST
NOTES TO FINANCIAL STATEMENTS
Franklin Strategic Income VIP Fund (continued)
11. Fair Value Measurements (continued)
| | | | | | | | | | | | | | | | |
| | | Level 1 | | | Level 2 | | | Level 3 | | | Total | |
Other Financial Instruments | | | | | | | | | | | | | | | | |
Forward Exchange Contracts | | $ | — | | | $ | 16,352,768 | | | $ | — | | | $ | 16,352,768 | |
Swap Contracts | | | — | | | | 175,617 | | | | — | | | | 175,617 | |
| | | | |
Total Other Financial Instruments | | $ | — | | | $ | 16,528,385 | | | $ | — | | | $ | 16,528,385 | |
| | | | |
| | | | |
| Liabilities: | | | | | | | | | | | | | | | | |
Other Financial Instruments | | | | | | | | | | | | | | | | |
Forward Exchange Contracts | | $ | — | | | $ | 5,507,080 | | | $ | — | | | $ | 5,507,080 | |
Unfunded Loan Commitments | | | — | | | | 19,110 | | | | — | | | | 19,110 | |
| | | | |
Total Other Financial Instruments | | $ | — | | | $ | 5,526,190 | | | $ | — | | | $ | 5,526,190 | |
| | | | |
aIncludes common, preferred and convertible preferred stocks.
bFor detailed categories, see the accompanying Statement of Investments.
cIncludes securities determined to have no value at December 31, 2014.
A reconciliation of assets in which Level 3 inputs are used in determining fair value is presented when there are significant Level 3 financial instruments at the end of the year.
12. Subsequent Events
The Fund has evaluated subsequent events through the issuance of the financial statements and determined that no events have occurred that require disclosure other than those already disclosed in the financial statements.
FRANKLIN TEMPLETON VARIABLE INSURANCE PRODUCTS TRUST
NOTES TO FINANCIAL STATEMENTS
Franklin Strategic Income VIP Fund (continued)
Abbreviations
| | | | | | | | | | |
| Counterparty | | | | Currency | | Selected Portfolio |
| | | | | |
| BZWS | | Barclays Bank PLC | | BRL | | Brazilian Real | | AGMC | | Assured Guaranty Municipal Corp. |
| | | | | |
| CITI | | Citigroup, Inc. | | CAD | | Canadian Dollar | | CDO | | Collateralized Debt Obligation |
| | | | | |
| DBAB | | Deutsche Bank AG | | EUR | | Euro | | CLO | | Collateralized Loan Obligation |
| | | | | |
| GSCO | | The Goldman Sachs Group, | | GBP | | British Pound | | EDA | | Economic Development Authority |
| | | | | |
| HSBC | | HSBC Bank USA, N.A. | | HUF | | Hungarian Forint | | ETF | | Exchange Traded Fund |
| | | | | |
| JPHQ | | JP Morgan Chase & Co. | | IDR | | Indonesian Rupiah | | FGIC | | Financial Guaranty Insurance Co. |
| | | | | |
| MSCO | | Morgan Stanley | | KRW | | South Korean Won | | FICO | | Financing Corp. |
| | | | | |
| | | | LKR | | Sri Lankan Rupee | | FRN | | Floating Rate Note |
| | | | | |
| | | | MXN | | Mexican Peso | | GO | | General Obligation |
| | | | | |
| | | | MYR | | Malaysian Ringgit | | HDC | | Housing Development Corp. |
| | | | | |
| | | | PHP | | Philippine Peso | | ISD | | Independent School District |
| | | | | |
| | | | PLN | | Polish Zloty | | NATL | | National Public Financial Guarantee Corp. |
| | | | | |
| | | | SEK | | Swedish Krona | | NATL RE | | National Public Financial Guarantee Corp. Reinsured |
| | | | | |
| | | | SGD | | Singapore Dollar | | PIK | | Payment-In-Kind |
| | | | | |
| | | | UYU | | Uruguayan Peso | | PSF | | Permanent School Fund |
FRANKLIN TEMPLETON VARIABLE INSURANCE PRODUCTS TRUST
Report of Independent Registered Public Accounting Firm
Franklin Strategic Income VIP Fund
To the Board of Trustees and Shareholders of Franklin Templeton Variable Insurance Products Trust
In our opinion, the accompanying statement of assets and liabilities, including the statement of investments, and the related statements of operations and of changes in net assets and the financial highlights present fairly, in all material respects, the financial position of Franklin Strategic Income VIP Fund (the “Fund”) at December 31, 2014, the results of its operations for the year then ended, the changes in its net assets for each of the two years in the period then ended and the financial highlights for each of the five years in the period then ended, in conformity with accounting principles generally accepted in the United States of America. These financial statements and financial highlights (hereafter referred to as “financial statements”) are the responsibility of the Fund’s management. Our responsibility is to express an opinion on these financial statements based on our audits. We conducted our audits of these financial statements in accordance with the standards of the Public Company Accounting Oversight Board (United States). Those standards require that we plan and perform the audit to obtain reasonable assurance about whether the financial statements are free of material misstatement. An audit includes examining, on a test basis, evidence supporting the amounts and disclosures in the financial statements, assessing the accounting principles used and significant estimates made by management, and evaluating the overall financial statement presentation. We believe that our audits, which included confirmation of securities at December 31, 2014 by correspondence with the custodian, transfer agent and brokers, provides a reasonable basis for our opinion.
PricewaterhouseCoopers LLP
San Francisco, California
February 13, 2015
FRANKLIN TEMPLETON VARIABLE INSURANCE PRODUCTS TRUST
Tax Information (unaudited)
Franklin Strategic Income VIP Fund
Under Section 852(b)(3)(C) of the Internal Revenue Code, the Fund hereby reports the maximum amount allowable but no less than $17,503,606 as a long term capital gain dividend for the fiscal year ended December 31, 2014.
Franklin U.S. Government Securities VIP Fund
(Formerly, Franklin U.S. Government Fund)
This annual report for Franklin U.S. Government Securities VIP Fund covers the fiscal year ended December 31, 2014.
Class 2 Performance Summary as of December 31, 2014
Average annual total return of Class 2 shares represents the average annual change in value, assuming reinvestment of dividends and capital gains. Average returns smooth out variations in returns, which can be significant; they are not the same as year-by-year results.
| | | | | | | | | | | | |
| Periods ended 12/31/14 | | 1-Year | | | 5-Year | | | 10-Year | |
Average Annual Total Return | | | +3.38% | | | | +2.76% | | | | +3.74% | |
Performance reflects the Fund’s Class 2 operating expenses, but does not include any contract fees, expenses or sales charges. If they had been included, performance would be lower. These charges and deductions, particularly for variable life policies, can have a significant effect on contract values and insurance benefits. See the contract prospectus for a complete description of these expenses, including sales charges.
Performance data represent past performance, which does not guarantee future results. Investment return and principal value will fluctuate, and you may have a gain or loss when you sell your shares. Current performance may differ from figures shown.
Total Return Index Comparison for a Hypothetical $10,000 Investment (1/1/05–12/31/14)
The graph below shows the change in value of a hypothetical $10,000 investment in the Fund over the indicated period and includes reinvestment of any income or distributions. The Fund’s performance is compared to the performance of the Barclays U.S. Government Index: Intermediate Component, the Lipper VIP General U.S. Government Funds Classification Average and the Consumer Price Index (CPI). One cannot invest directly in an index, and an index is not representative of the Fund’s portfolio. Please see Important Notes to Performance Information preceding the Fund Summaries.
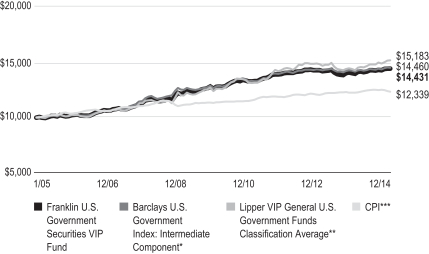
*Source: Morningstar. Please see Index Descriptions following the Fund Summaries.
**Source: Lipper, a Thomson Reuters Company. Please see Index Descriptions following the Fund Summaries.
***Source: Bureau of Labor Statistics, bls.gov/cpi. Please see Index Descriptions following the Fund Summaries.
FRANKLIN U.S. GOVERNMENT SECURITIES VIP FUND
Fund Goal and Main Investments
The Fund seeks income. Under normal market conditions, the Fund invests at least 80% of its net assets in U.S. government securities.
Fund Risks
All investments involve risks, including possible loss of principal. The Fund’s share price and yield will be affected by interest rate movements and mortgage prepayments. Bond prices generally move in the opposite direction of interest rates. Thus, as prices of bonds in the Fund adjust to a rise in interest rates, the Fund’s share price may decline. Changes in the financial strength of a bond issuer or in a bond’s credit rating may affect its value. The Fund is actively managed but there is no guarantee that the manager’s investment decisions will produce the desired results. The Fund’s prospectus also includes a description of the main investment risks.
Performance Overview
You can find the Fund’s one-year total return in the Performance Summary. In comparison, the Fund’s primary benchmark, the Barclays U.S. Government Index: Intermediate Component, produced a +2.52% total return.1 The Fund’s secondary benchmark, the Lipper VIP General U.S. Government Funds Classification Average, posted a +6.67% total return.2 Funds in the Lipper average may allocate as much as 35% of their investments in asset types other than U.S. government and agency mortgage-backed securities.
Economic and Market Overview
The U.S. economy continued to grow during the year ended December 31, 2014, underpinned in some quarters by manufacturing activity, consumer and business spending, and federal defense spending. Home sales experienced weakness resulting from reduced inventory, higher mortgage rates and tight credit requirements but began to recover in May as mortgage rates declined. Home prices stayed higher than a year earlier. Retail sales generally improved, supported by job growth and lower gasoline prices in the latter part of 2014. The unemployment rate declined to 5.6% in December 2014 from 6.7% in December 2013.3 Inflation, as measured by the Consumer Price Index, remained low.
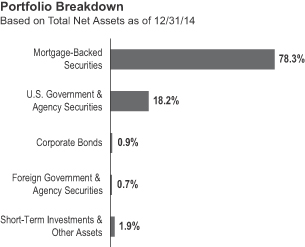
The dollar value, number of shares or principal amount, and names of all portfolio holdings are listed in the Fund’s Statement of Investments.
In January 2014, the U.S. Federal Reserve Board (Fed) began reducing its large-scale bond purchases $10 billion a month and ended the buying program in October. But it continued its practice of maintaining holdings of longer term securities at sizable levels. The Fed believed underlying economic strength could support ongoing progress in labor market conditions. The Fed also noted that although inflation might remain low in the near term, the likelihood of inflation running persistently below 2% had diminished. Toward period-end, the Fed stated that it could be patient with regard to raising interest rates and that the interest rate might not rise for at least a couple of meetings, possibly implying at least the first two meetings of 2015.
The 10-year Treasury yield declined from 3.04% at the beginning of the period to 2.17% at period-end, as investors shifted to less risky assets given the crises in Ukraine and the Middle East, weak economic data in Europe and Japan, record-low bond yields and lower Treasury issuance.
Investment Strategy
Using our straightforward investment approach, we seek to produce current income with a high degree of credit safety from a conservatively managed portfolio of U.S. government securities. Analyzing securities using proprietary and nonproprietary research, we seek to identify attractive investment opportunities.
1. Source: Morningstar.
2. Source: Lipper, a Thomson Reuters Company.
One cannot invest directly in an index, and an index is not representative of the Fund’s portfolio. Please see Index Descriptions following the Fund Summaries.
3. Source: Bureau of Labor Statistics.
FRANKLIN U.S. GOVERNMENT SECURITIES VIP FUND
Manager’s Discussion
The overall mortgage market outpaced Treasuries during the period, yet GNMA mortgage-backed securities (MBS) underperformed Treasuries and their conventional agency mortgage counterparts. In our view, agency mortgages were fully valued. Questions still remained, however, about the demand source for agency MBS now that the Fed has ended its buying program. We felt demand from banks, mortgage real estate investment trusts, overseas investors and domestic money managers would need to rise to compensate for the Fed’s reduced presence in the MBS sector. Despite the low interest rate and mortgage rate environment over the period, mortgage credit issuance continued to be constrained and actual prepayment levels remained relatively low.
The Fund maintains a consistent and disciplined approach to our investment strategy. The Fund’s investment process and strategy have not changed and the team continues to look for strong cash flow fundamentals and valuations seeking to uncover opportunities across the agency mortgage and agency debenture universe. The Fund emphasizes agency pass-throughs and invests in other agency securities for diversification purposes.
During the period, we were more weighted toward GNMA IIs (pools of mortgages from multiple issuers) than GNMA Is
(pools of mortgages from single issuers). Over the period, we increased exposure to GNMA II 4.0% coupons while reducing the allocation to 3.5% coupons. At year-end, our heaviest allocation was in 3.5% and 4.0% coupons. The Fund’s allocation to lower-coupon securities was additive to relative performance while our overweighted position in higher coupon securities compared with the benchmark index detracted from relative performance.
Thank you for your participation in Franklin U.S. Government Securities VIP Fund. We look forward to serving your future investment needs.
The foregoing information reflects our analysis, opinions and portfolio holdings as of December 31, 2014, the end of the reporting period. The way we implement our main investment strategies and the resulting portfolio holdings may change depending on factors such as market and economic conditions. These opinions may not be relied upon as investment advice or an offer for a particular security. The information is not a complete analysis of every aspect of any market, country, industry, security or the Fund. Statements of fact are from sources considered reliable, but the investment manager makes no representation or warranty as to their completeness or accuracy. Although historical performance is no guarantee of future results, these insights may help you understand our investment management philosophy.
FRANKLIN U.S. GOVERNMENT SECURITIES VIP FUND
Class 2 Fund Expenses
As an investor in a variable insurance contract (Contract) that indirectly provides for investment in an underlying mutual fund, you can incur transaction and/or ongoing expenses at both the Fund level and the Contract level.
| • | | Transaction expenses can include sales charges (loads) on purchases, redemption fees, surrender fees, transfer fees and premium taxes. |
| • | | Ongoing expenses can include management fees, distribution and service (12b-1) fees, contract fees, annual maintenance fees, mortality and expense risk fees and other fees and expenses. All mutual funds and Contracts have some types of ongoing expenses. |
The expenses shown in the table are meant to highlight ongoing expenses at the Fund level only and do not include ongoing expenses at the Contract level, or transaction expenses at either the Fund or Contract level. While the Fund does not have transaction expenses, if the transaction and ongoing expenses at the Contract level were included, the expenses shown below would be higher. You should consult your Contract prospectus or disclosure document for more information.
The table shows Fund-level ongoing expenses and can help you understand these expenses and compare them with those of other mutual funds offered through the Contract. The table assumes a $1,000 investment held for the six months indicated. Please refer to the Fund prospectus for additional information on operating expenses.
Actual Fund Expenses
The first line (Actual) of the table provides actual account values and expenses. The “Ending Account Value” is derived from the Fund’s actual return, which includes the effect of ongoing Fund expenses, but does not include the effect of ongoing Contract expenses.
You can estimate the Fund-level expenses you incurred during the period by following these steps. Of course, your account value and expenses will differ from those in this illustration:
| 1. | Divide your account value by $1,000. |
If an account had an $8,600 value,
then $8,600 ÷ $1,000 = 8.6.
| 2. | Multiply the result by the number under the heading “Fund-Level Expenses Incurred During Period.” |
If Fund-Level Expenses Incurred During Period were $7.50, then 8.6 × $7.50 = $64.50.
In this illustration, the estimated expenses incurred this period at the Fund level are $64.50.
Hypothetical Example for Comparison with Other Mutual Funds
Information in the second line (Hypothetical) of the table can help you compare ongoing expenses of the Fund with those of other mutual funds offered through the Contract. This information may not be used to estimate the actual ending account balance or expenses you incurred during the period. The hypothetical “Ending Account Value” is based on the Fund’s actual expense ratio and an assumed 5% annual rate of return before expenses, which does not represent the Fund’s actual return. The figure under the heading “Fund-Level Expenses Incurred During Period” shows the hypothetical expenses your account would have incurred under this scenario. You can compare this figure with the 5% hypothetical examples that appear in shareholder reports of other funds offered through a Contract.
| | | | | | | | | | | | |
| Class 2 | | Beginning Account Value 7/1/14 | | | Ending Account Value 12/31/14 | | | Fund-Level Expenses
Incurred During Period* 7/1/14–12/31/14 | |
Actual | | | $1,000 | | | | $1,009.50 | | | | $3.80 | |
Hypothetical (5% return before expenses) | | | $1,000 | | | | $1,021.42 | | | | $3.82 | |
*Expenses are calculated using the most recent six-month annualized expense ratio for the Fund’s Class 2 shares (0.75%), which does not include any ongoing expenses of the Contract for which the Fund is an investment option, multiplied by the average account value over the period, multiplied by 184/365 to reflect the one-half year period.
FRANKLIN TEMPLETON VARIABLE INSURANCE PRODUCTS TRUST
Financial Highlights
Franklin U.S. Government Securities VIP Fund
| | | | | | | | | | | | | | | | | | | | |
| | | Year Ended December 31, | |
| | | 2014 | | | 2013 | | | 2012 | | | 2011 | | | 2010 | |
| Class 1 | | | | | | | | | | | | | | | | | | | | |
Per share operating performance
(for a share outstanding throughout the year) | | | | | | | | | | | | | | | | | | | | |
| | | | | |
Net asset value, beginning of year | | | $12.91 | | | | $13.57 | | | | $13.67 | | | | $13.34 | | | | $13.08 | |
| | | | |
| | | | | |
| Income from investment operationsa: | | | | | | | | | | | | | | | | | | | | |
| | | | | |
Net investment incomeb | | | 0.24 | | | | 0.24 | | | | 0.32 | | | | 0.42 | | | | 0.47 | |
| | | | | |
Net realized and unrealized gains (losses) | | | 0.22 | | | | (0.51 | ) | | | (0.03 | ) | | | 0.36 | | | | 0.25 | |
| | | | |
Total from investment operations | | | 0.46 | | | | (0.27 | ) | | | 0.29 | | | | 0.78 | | | | 0.72 | |
| | | | |
Less distributions from net investment income | | | (0.37 | ) | | | (0.39 | ) | | | (0.39 | ) | | | (0.45 | ) | | | (0.46 | ) |
| | | | |
Net asset value, end of year | | | $13.00 | | | | $12.91 | | | | $13.57 | | | | $13.67 | | | | $13.34 | |
| | | | |
| | | | | |
Total returnc | | | 3.64% | | | | (1.99)% | | | | 2.12% | | | | 5.96% | | | | 5.56% | |
| | | | | |
| Ratios to average net assets | | | | | | | | | | | | | | | | | | | | |
| | | | | |
Expenses | | | 0.49% | d | | | 0.49% | d | | | 0.50% | | | | 0.51% | | | | 0.52% | |
| | | | | |
Net investment income | | | 1.84% | | | | 1.84% | | | | 2.36% | | | | 3.11% | | | | 3.51% | |
| | | | | |
| Supplemental data | | | | | | | | | | | | | | | | | | | | |
| | | | | |
Net assets, end of year (000’s) | | | $90,656 | | | | $99,947 | | | | $126,536 | | | | $136,628 | | | | $157,551 | |
| | | | | |
Portfolio turnover rate | | | 42.88% | | | | 69.47% | | | | 45.89% | | | | 37.89% | | | | 51.04% | |
| | | | | |
Portfolio turnover rate excluding mortgage dollar rollse | | | 42.88% | | | | 67.80% | | | | 45.89% | | | | 37.89% | | | | 51.04% | |
aThe amount shown for a share outstanding throughout the period may not correlate with the Statement of Operations for the period due to the timing of sales and repurchases of the Fund shares in relation to income earned and/or fluctuating fair value of the investments of the Fund.
bBased on average daily shares outstanding.
cTotal return does not include fees, charges or expenses imposed by the variable annuity and life insurance contracts for which Franklin Templeton Variable Insurance Products Trust serves as an underlying investment vehicle.
dBenefit of expense reduction rounds to less than 0.01%.
eSee Note 1(c) regarding mortgage dollar rolls.
| | | | |
| | | The accompanying notes are an integral part of these financial statements. | Annual Report | | FUS-5 |
FRANKLIN TEMPLETON VARIABLE INSURANCE PRODUCTS TRUST
FINANCIAL HIGHLIGHTS
Franklin U.S. Government Securities VIP Fund (continued)
| | | | | | | | | | | | | | | | | | | | |
| | | Year Ended December 31, | |
| | | 2014 | | | 2013 | | | 2012 | | | 2011 | | | 2010 | |
| Class 2 | | | | | | | | | | | | | | | | | | | | |
Per share operating performance
(for a share outstanding throughout the year) | | | | | | | | | | | | | | | | | | | | |
| | | | | |
Net asset value, beginning of year | | | $12.65 | | | | $13.31 | | | | $13.42 | | | | $13.11 | | | | $12.87 | |
| | | | |
| | | | | |
| Income from investment operationsa: | | | | | | | | | | | | | | | | | | | | |
| | | | | |
Net investment incomeb | | | 0.20 | | | | 0.21 | | | | 0.28 | | | | 0.38 | | | | 0.43 | |
| | | | | |
Net realized and unrealized gains (losses) | | | 0.22 | | | | (0.50 | ) | | | (0.03 | ) | | | 0.35 | | | | 0.24 | |
| | | | |
Total from investment operations | | | 0.42 | | | | (0.29 | ) | | | 0.25 | | | | 0.73 | | | | 0.67 | |
| | | | |
Less distributions from net investment income | | | (0.34 | ) | | | (0.37 | ) | | | (0.36 | ) | | | (0.42 | ) | | | (0.43 | ) |
| | | | |
Net asset value, end of year | | | $12.73 | | | | $12.65 | | | | $13.31 | | | | $13.42 | | | | $13.11 | |
| | | | |
| | | | | |
Total returnc | | | 3.38% | | | | (2.24)% | | | | 1.89% | | | | 5.68% | | | | 5.28% | |
| | | | | |
| Ratios to average net assets | | | | | | | | | | | | | | | | | | | | |
| | | | | |
Expenses | | | 0.74% | d | | | 0.74% | d | | | 0.75% | | | | 0.76% | | | | 0.77% | |
| | | | | |
Net investment income | | | 1.59% | | | | 1.59% | | | | 2.11% | | | | 2.86% | | | | 3.26% | |
| | | | | |
| Supplemental data | | | | | | | | | | | | | | | | | | | | |
| | | | | |
Net assets, end of year (000’s) | | | $1,369,037 | | | | $1,267,994 | | | | $1,206,089 | | | | $894,699 | | | | $703,997 | |
| | | | | |
Portfolio turnover rate | | | 42.88% | | | | 69.47% | | | | 45.89% | | | | 37.89% | | | | 51.04% | |
| | | | | |
Portfolio turnover rate excluding mortgage dollar rollse | | | 42.88% | | | | 67.80% | | | | 45.89% | | | | 37.89% | | | | 51.04% | |
aThe amount shown for a share outstanding throughout the period may not correlate with the Statement of Operations for the period due to the timing of sales and repurchases of the Fund shares in relation to income earned and/or fluctuating fair value of the investments of the Fund.
bBased on average daily shares outstanding.
cTotal return does not include fees, charges or expenses imposed by the variable annuity and life insurance contracts for which Franklin Templeton Variable Insurance Products Trust serves as an underlying investment vehicle.
dBenefit of expense reduction rounds to less than 0.01%.
eSee Note 1(c) regarding mortgage dollar rolls.
| | | | |
| FUS-6 | | Annual Report | The accompanying notes are an integral part of these financial statements. | | |
FRANKLIN TEMPLETON VARIABLE INSURANCE PRODUCTS TRUST
Statement of Investments, December 31, 2014
| | | | | | | | | | |
| Franklin U.S. Government Securities VIP Fund | | | | | | |
| | | | | Principal Amount* | | | Value | |
| | Corporate Bonds 0.9% | | | | | | | | |
| | New Valley Generation IV, secured bond, 4.687%, 1/15/22 | | | 2,962,730 | | | $ | 3,251,223 | |
| | Private Export Funding Corp., secured bond, 2.80%, 5/15/22 | | | 9,000,000 | | | | 9,139,518 | |
| | | | | | | | | | |
| | | |
| | Total Corporate Bonds (Cost $12,637,729) | | | | | | | 12,390,741 | |
| | | | | | | | | | |
| | Foreign Government and Agency Securities 0.2% | | | | | | | | |
| a | | International Bank for Reconstruction and Development, | | | | | | | | |
| | 2, zero cpn., 2/15/16 (Supranational) | | | 1,868,000 | | | | 1,854,724 | |
| | Principal Strip, 7/15/17 (Supranational) | | | 1,761,000 | | | | 1,697,190 | |
| | | | | | | | | | |
| | | |
| | Total Foreign Government and Agency Securities
(Cost $3,561,812) | | | | | | | 3,551,914 | |
| | | | | | | | | | |
| | Mortgage-Backed Securities 78.3% | | | | | | | | |
| b | | Federal Home Loan Mortgage Corp. (FHLMC) Adjustable Rate 6.8% | | | | | | | | |
| | FHLMC, 1.607% - 2.241%, 10/01/16 - 6/01/42 | | | 6,092,942 | | | | 6,412,038 | |
| | FHLMC, 2.241% - 2.256%, 12/01/22 - 1/01/42 | | | 13,666,568 | | | | 14,527,599 | |
| | FHLMC, 2.257% - 2.27%, 9/01/30 - 4/01/38 | | | 680,164 | | | | 727,796 | |
| | FHLMC, 2.273% - 2.275%, 4/01/36 - 9/01/37 | | | 13,195,329 | | | | 14,150,854 | |
| | FHLMC, 2.277% - 2.307%, 10/01/22 - 10/01/38 | | | 13,061,465 | | | | 14,005,641 | |
| | FHLMC, 2.31% - 2.378%, 2/01/19 - 7/01/41 | | | 12,622,249 | | | | 13,455,359 | |
| | FHLMC, 2.381% - 2.595%, 12/01/18 - 9/01/38 | | | 13,031,857 | | | | 13,898,690 | |
| | FHLMC, 2.597%, 4/01/40 | | | 14,086,806 | | | | 15,065,572 | |
| | FHLMC, 2.605% - 6.058%, 8/01/24 - 8/01/41 | | | 6,169,957 | | | | 6,548,658 | |
| | | | | | | | | | |
| | | | | | | | | 98,792,207 | |
| | | | | | | | | | |
| | Federal Home Loan Mortgage Corp. (FHLMC) Fixed Rate 3.4% | | | | | | | | |
| | FHLMC Gold 15 Year, 4.50%, 3/01/25 - 4/01/25 | | | 3,133,267 | | | | 3,380,045 | |
| | FHLMC Gold 30 Year, 3.00%, 5/01/43 | | | 669,383 | | | | 677,630 | |
| | FHLMC Gold 30 Year, 3.50%, 3/01/32 - 5/01/43 | | | 7,851,096 | | | | 8,262,767 | |
| | FHLMC Gold 30 Year, 4.00%, 9/01/40 - 12/01/41 | | | 12,876,655 | | | | 13,746,696 | |
| | FHLMC Gold 30 Year, 4.50%, 5/01/40 - 7/01/41 | | | 6,249,126 | | | | 6,781,028 | |
| | FHLMC Gold 30 Year, 5.00%, 9/01/33 - 4/01/40 | | | 8,183,298 | | | | 9,048,974 | |
| | FHLMC Gold 30 Year, 5.50%, 7/01/33 - 5/01/38 | | | 2,964,527 | | | | 3,335,397 | |
| | FHLMC Gold 30 Year, 6.00%, 1/01/24 - 8/01/35 | | | 2,042,397 | | | | 2,327,208 | |
| | FHLMC Gold 30 Year, 6.50%, 12/01/23 - 5/01/35 | | | 795,132 | | | | 905,587 | |
| | FHLMC Gold 30 Year, 7.00%, 4/01/24 - 10/01/32 | | | 376,876 | | | | 420,495 | |
| | FHLMC Gold 30 Year, 7.50%, 12/01/22 - 5/01/24 | | | 5,708 | | | | 6,079 | |
| | FHLMC Gold 30 Year, 8.00%, 9/01/21 - 5/01/22 | | | 7,164 | | | | 8,278 | |
| | FHLMC Gold 30 Year, 8.50%, 10/01/21 - 7/01/31 | | | 585,802 | | | | 695,301 | |
| | FHLMC PC 30 Year, 8.00%, 1/01/17 - 5/01/17 | | | 2,545 | | | | 2,553 | |
| | FHLMC PC 30 Year, 8.50%, 9/01/20 | | | 388 | | | | 406 | |
| | | | | | | | | | |
| | | | | | | | | 49,598,444 | |
| | | | | | | | | | |
| b | | Federal National Mortgage Association (FNMA) Adjustable Rate 12.3% | | | | | | | | |
| | FNMA, 0.882% - 1.996%, 4/01/16 - 10/01/44 | | | 13,608,253 | | | | 14,270,668 | |
| | FNMA, 1.997% - 2.020%, 8/01/31 - 3/01/37 | | | 8,066,429 | | | | 8,509,060 | |
| | FNMA, 2.026% - 2.128%, 11/01/17 - 1/01/40 | | | 12,396,174 | | | | 13,035,100 | |
| | FNMA, 2.13% - 2.136%, 3/01/32 - 10/01/35 | | | 13,670,015 | | | | 14,541,321 | |
| | FNMA, 2.136% - 2.170%, 1/01/18 - 8/01/37 | | | 3,814,935 | | | | 4,089,966 | |
| | FNMA, 2.171% - 2.183%, 7/01/33 - 1/01/37 | | | 13,701,955 | | | | 14,591,423 | |
| | FNMA, 2.184% - 2.251%, 1/01/17 - 10/01/41 | | | 11,449,018 | | | | 12,194,700 | |
| | FNMA, 2.256% - 2.265%, 6/01/27 - 9/01/36 | | | 3,802,241 | | | | 4,052,169 | |
| | FNMA, 2.265% - 2.29%, 10/01/19 - 9/01/39 | | | 13,470,294 | | | | 14,342,043 | |
FRANKLIN TEMPLETON VARIABLE INSURANCE PRODUCTS TRUST
STATEMENT OF INVESTMENTS
Franklin U.S. Government Securities VIP Fund (continued)
| | | | | | | | | | |
| | | | | Principal Amount* | | | Value | |
| | Mortgage-Backed Securities (continued) | | | | | | | | |
| b | | Federal National Mortgage Association (FNMA) Adjustable Rate (continued) | | | | | | | | |
| | FNMA, 2.290% - 2.309%, 9/01/23 - 7/01/38 | | | 13,524,542 | | | $ | 14,343,567 | |
| | FNMA, 2.31% - 2.402%, 6/01/21 - 12/01/40 | | | 13,580,216 | | | | 14,440,194 | |
| | FNMA, 2.405% - 2.415%, 12/01/30 - 12/01/36 | | | 1,221,667 | | | | 1,293,436 | |
| | FNMA, 2.418%, 9/01/37 | | | 34,757,219 | | | | 37,277,508 | |
| | FNMA, 2.419% - 7.21%, 8/01/18 - 11/01/47 | | | 11,758,028 | | | | 12,373,366 | |
| | | | | | | | | | |
| | | | | | | | | 179,354,521 | |
| | | | | | | | | | |
| | Federal National Mortgage Association (FNMA) Fixed Rate 5.8% | | | | | | | | |
| | FNMA 15 Year, 5.50%, 6/01/16 - 1/01/25 | | | 3,130,592 | | | | 3,434,999 | |
| | FNMA 15 Year, 6.00%, 8/01/17 - 9/01/17 | | | 133,474 | | | | 138,683 | |
| | FNMA 30 Year, 3.00%, 12/01/42 | | | 334,303 | | | | 338,621 | |
| | FNMA 30 Year, 4.00%, 1/01/41 - 6/01/41 | | | 10,317,055 | | | | 11,027,331 | |
| | FNMA 30 Year, 4.00%, 8/01/41 | | | 5,509,444 | | | | 5,888,645 | |
| | FNMA 30 Year, 4.50%, 8/01/40 - 12/01/40 | | | 10,055,216 | | | | 10,932,151 | |
| | FNMA 30 Year, 4.50%, 4/01/41 - 6/01/41 | | | 5,339,225 | | | | 5,803,621 | |
| | FNMA 30 Year, 4.50%, 12/01/43 | | | 19,513,381 | | | | 21,212,905 | |
| | FNMA 30 Year, 5.00%, 3/01/34 - 7/01/41 | | | 11,696,531 | | | | 12,938,797 | |
| | FNMA 30 Year, 5.50%, 12/01/32 - 8/01/35 | | | 3,562,489 | | | | 3,999,031 | |
| | FNMA 30 Year, 6.00%, 1/01/24 - 8/01/38 | | | 5,428,293 | | | | 6,159,890 | |
| | FNMA 30 Year, 6.50%, 1/01/24 - 9/01/36 | | | 928,213 | | | | 1,058,261 | |
| | FNMA 30 Year, 7.50%, 4/01/23 - 8/01/25 | | | 35,455 | | | | 38,032 | |
| | FNMA 30 Year, 8.00%, 3/01/22 - 2/01/25 | | | 127,322 | | | | 133,648 | |
| | FNMA 30 Year, 8.50%, 3/01/20 - 6/01/21 | | | 1,166 | | | | 1,266 | |
| | FNMA 30 Year, 9.00%, 10/01/26 | | | 115,405 | | | | 129,550 | |
| | FNMA GL 30 Year, 8.00%, 8/01/19 | | | 15,291 | | | | 15,464 | |
| | FNMA PL 30 Year, 5.50%, 4/01/34 | | | 1,764,000 | | | | 1,956,567 | |
| | | | | | | | | | |
| | | | | | | | | 85,207,462 | |
| | | | | | | | | | |
| | Government National Mortgage Association (GNMA) Fixed Rate 50.0% | | | | | | | | |
| | GNMA I SF 30 Year, 3.00%, 7/15/42 | | | 729,648 | | | | 750,213 | |
| | GNMA I SF 30 Year, 4.50%, 1/15/39 - 11/15/39 | | | 11,497,875 | | | | 12,623,122 | |
| | GNMA I SF 30 Year, 4.50%, 2/15/40 - 6/15/40 | | | 12,545,314 | | | | 13,763,895 | |
| | GNMA I SF 30 Year, 4.50%, 7/15/40 - 6/15/41 | | | 9,841,872 | | | | 10,834,845 | |
| | GNMA I SF 30 Year, 5.00%, 6/15/30 - 2/15/39 | | | 9,419,389 | | | | 10,431,382 | |
| | GNMA I SF 30 Year, 5.00%, 4/15/39 - 10/15/39 | | | 11,271,664 | | | | 12,490,550 | |
| | GNMA I SF 30 Year, 5.00%, 10/15/39 - 1/15/40 | | | 10,235,867 | | | | 11,369,222 | |
| | GNMA I SF 30 Year, 5.00%, 2/15/40 - 3/15/40 | | | 13,075,845 | | | | 14,534,281 | |
| | GNMA I SF 30 Year, 5.00%, 4/15/40 - 9/15/40 | | | 6,227,005 | | | | 6,914,052 | |
| | GNMA I SF 30 Year, 5.50%, 11/15/28 - 10/15/39 | | | 11,725,971 | | | | 13,165,761 | |
| | GNMA I SF 30 Year, 6.00%, 11/15/23 - 11/15/38 | | | 6,458,215 | | | | 7,370,182 | |
| | GNMA I SF 30 Year, 6.50%, 5/15/23 - 9/15/38 | | | 3,123,505 | | | | 3,590,641 | |
| | GNMA I SF 30 Year, 7.00%, 9/15/22 - 1/15/32 | | | 881,958 | | | | 941,968 | |
| | GNMA I SF 30 Year, 7.50%, 2/15/17 - 8/15/33 | | | 847,063 | | | | 986,392 | |
| | GNMA I SF 30 Year, 8.00%, 3/15/17 - 5/15/24 | | | 241,419 | | | | 253,806 | |
| | GNMA I SF 30 Year, 8.50%, 6/15/22 - 12/15/24 | | | 99,509 | | | | 105,714 | |
| | GNMA I SF 30 Year, 9.00%, 6/15/16 - 5/15/20 | | | 18,595 | | | | 18,695 | |
| | GNMA I SF 30 Year, 9.50%, 7/15/16 - 12/15/20 | | | 68,787 | | | | 71,276 | |
| | GNMA I SF 30 Year, 10.00%, 11/15/17 - 8/15/21 | | | 39,396 | | | | 41,542 | |
| | GNMA II SF 30 Year, 3.00%, 12/20/42 | | | 353,674 | | | | 362,214 | |
| | GNMA II SF 30 Year, 3.50%, 12/20/40 - 7/20/42 | | | 4,905,307 | | | | 5,159,401 | |
| | GNMA II SF 30 Year, 3.50%, 8/20/42 | | | 14,960,910 | | | | 15,734,181 | |
| | GNMA II SF 30 Year, 3.50%, 9/20/42 | | | 42,019,170 | | | | 44,190,993 | |
FRANKLIN TEMPLETON VARIABLE INSURANCE PRODUCTS TRUST
STATEMENT OF INVESTMENTS
Franklin U.S. Government Securities VIP Fund (continued)
| | | | | | | | | | |
| | | | | Principal Amount* | | | Value | |
| | Mortgage-Backed Securities (continued) | | | | | | | | |
| | Government National Mortgage Association (GNMA) Fixed Rate (continued) | | | | | | | | |
| | GNMA II SF 30 Year, 3.50%, 10/20/42 | | | 12,940,391 | | | $ | 13,609,235 | |
| | GNMA II SF 30 Year, 3.50%, 11/20/42 | | | 25,658,299 | | | | 26,984,499 | |
| | GNMA II SF 30 Year, 3.50%, 12/20/42 | | | 18,833,548 | | | | 19,807,007 | |
| | GNMA II SF 30 Year, 3.50%, 1/20/43 | | | 31,825,822 | | | | 33,470,808 | |
| | GNMA II SF 30 Year, 3.50%, 3/20/43 | | | 12,152,056 | | | | 12,778,305 | |
| | GNMA II SF 30 Year, 3.50%, 4/20/43 | | | 15,469,261 | | | | 16,265,670 | |
| | GNMA II SF 30 Year, 3.50%, 5/20/43 | | | 26,698,936 | | | | 28,073,676 | |
| | GNMA II SF 30 Year, 3.50%, 6/20/43 | | | 12,234,733 | | | | 12,864,413 | |
| | GNMA II SF 30 Year, 3.50%, 12/20/44 | | | 48,515,900 | | | | 51,020,296 | |
| | GNMA II SF 30 Year, 4.00%, 11/20/39 - 12/20/40 | | | 11,682,860 | | | | 12,570,613 | |
| | GNMA II SF 30 Year, 4.00%, 1/20/41 - 3/20/41 | | | 11,462,775 | | | | 12,337,370 | |
| | GNMA II SF 30 Year, 4.00%, 11/20/41 | | | 15,949,680 | | | | 17,129,509 | |
| | GNMA II SF 30 Year, 4.00%, 7/20/41 - 2/20/44 | | | 11,558,331 | | | | 12,476,524 | |
| | GNMA II SF 30 Year, 4.00%, 7/20/44 | | | 10,462,369 | | | | 11,235,080 | |
| | GNMA II SF 30 Year, 4.00%, 8/20/44 | | | 66,607,317 | | | | 71,549,750 | |
| | GNMA II SF 30 Year, 4.00%, 9/20/44 | | | 19,668,630 | | | | 21,134,286 | |
| | GNMA II SF 30 Year, 4.00%, 11/20/44 | | | 23,999,916 | | | | 25,794,342 | |
| | GNMA II SF 30 Year, 4.50%, 10/20/39 - 1/20/41 | | | 11,923,814 | | | | 13,086,885 | |
| | GNMA II SF 30 Year, 4.50%, 3/30/41 - 5/20/41 | | | 10,077,340 | | | | 11,055,996 | |
| | GNMA II SF 30 Year, 4.50%, 6/20/41 | | | 8,551,519 | | | | 9,377,415 | |
| | GNMA II SF 30 Year, 4.50%, 7/20/41 | | | 8,788,870 | | | | 9,635,962 | |
| | GNMA II SF 30 Year, 4.50%, 9/20/41 | | | 13,283,765 | | | | 14,556,829 | |
| | GNMA II SF 30 Year, 4.50%, 10/20/41 - 3/20/42 | | | 10,971,342 | | | | 12,030,539 | |
| | GNMA II SF 30 Year, 4.50%, 2/20/44 | | | 7,421,958 | | | | 8,122,427 | |
| | GNMA II SF 30 Year, 4.50%, 10/20/44 | | | 10,449,563 | | | | 11,447,012 | |
| | GNMA II SF 30 Year, 5.00%, 9/20/33 - 5/20/40 | | | 11,897,208 | | | | 13,256,166 | |
| | GNMA II SF 30 Year, 5.00%, 6/20/40 - 10/20/42 | | | 10,812,363 | | | | 12,058,936 | |
| | GNMA II SF 30 Year, 5.00%, 6/20/44 | | | 9,699,925 | | | | 10,815,233 | |
| | GNMA II SF 30 Year, 5.50%, 5/20/34 - 6/20/38 | | | 10,177,600 | | | | 11,487,795 | |
| | GNMA II SF 30 Year, 6.00%, 11/20/23 - 7/20/39 | | | 6,201,428 | | | | 7,056,818 | |
| | GNMA II SF 30 Year, 6.50%, 12/20/27 - 4/20/34 | | | 836,971 | | | | 971,242 | |
| | GNMA II SF 30 Year, 7.00%, 5/20/32 | | | 14,294 | | | | 17,196 | |
| | GNMA II SF 30 Year, 7.50%, 11/20/17 - 5/20/33 | | | 171,032 | | | | 194,986 | |
| | GNMA II SF 30 Year, 8.00%, 9/20/16 - 8/20/26 | | | 9,873 | | | | 11,892 | |
| | GNMA II SF 30 Year, 9.50%, 4/20/25 | | | 2,617 | | | | 2,631 | |
| | | | | | | | | | |
| | | | | | | | | 729,991,671 | |
| | | | | | | | | | |
| | | |
| | Total Mortgage-Backed Securities (Cost $1,126,687,688) | | | | | | | 1,142,944,305 | |
| | | | | | | | | | |
| | U.S. Government and Agency Securities 18.7% | | | | | | | | |
| | AID-Israel, | | | | | | | | |
| | 7-Z, U.S. Government Guaranteed, Strip, 8/15/22 | | | 5,619,000 | | | | 4,669,125 | |
| | U.S. Government Guaranteed, Strip, 5/01/17 | | | 5,000,000 | | | | 4,872,660 | |
| | Federal Agricultural Mortgage Corp., | | | | | | | | |
| | 1.41%, 3/06/20 | | | 10,000,000 | | | | 9,639,150 | |
| | 2.66%, 4/12/22 | | | 7,000,000 | | | | 7,227,703 | |
| | 4.30%, 5/13/19 | | | 1,010,000 | | | | 1,117,302 | |
| c | | Federal Agricultural Mortgage Corp. Guaranteed Trust 07-1, 144A, 5.125%, 4/19/17 | | | 13,000,000 | | | | 14,198,847 | |
| | FFCB, 1.50%, 11/16/15 | | | 10,000,000 | | | | 10,106,730 | |
FRANKLIN TEMPLETON VARIABLE INSURANCE PRODUCTS TRUST
STATEMENT OF INVESTMENTS
Franklin U.S. Government Securities VIP Fund (continued)
| | | | | | | | | | |
| | | | | Principal Amount* | | | Value | |
| | U.S. Government and Agency Securities (continued) | | | | | | | | |
| | FHLB, | | | | | | | | |
| | 4.75%, 12/16/16 | | | 17,000,000 | | | $ | 18,418,310 | |
| | 5.25%, 6/05/17 | | | 9,000,000 | | | | 9,918,801 | |
| | FICO, | | | | | | | | |
| | 1P, Strip, 5/11/18 | | | 10,000,000 | | | | 9,524,430 | |
| | 12, Strip, 6/06/18 | | | 4,627,000 | | | | 4,393,739 | |
| | 13P, Strip, 12/27/18 | | | 2,500,000 | | | | 2,338,712 | |
| | 15, Strip, 3/07/16 | | | 15,000,000 | | | | 14,897,895 | |
| | 15P, Strip, 3/07/19 | | | 1,798,000 | | | | 1,664,817 | |
| | 16, Strip, 4/05/17 | | | 12,367,000 | | | | 12,081,186 | |
| | A-P, Strip, 2/08/18 | | | 1,000,000 | | | | 961,135 | |
| | B-P, Strip, 4/06/18 | | | 1,405,000 | | | | 1,342,101 | |
| | D-P, Strip, 9/26/19 | | | 7,605,000 | | | | 6,953,928 | |
| | E-P, Strip, 11/02/18 | | | 8,896,000 | | | | 8,334,520 | |
| | FNMA, senior note, 5.375%, 6/12/17 | | | 17,800,000 | | | | 19,693,137 | |
| | Government of Tunisia, 1.686%, 7/16/19 | | | 7,000,000 | | | | 7,005,328 | |
| | Overseas Private Investment Corp., A, | | | | | | | | |
| | Strip, 11/15/20 | | | 2,575,000 | | | | 2,938,850 | |
| | zero cpn., 2/18/18 | | | 682,174 | | | | 688,344 | |
| | SBA, | | | | | | | | |
| | b FRN, 3.125%, 3/25/18 | | | 246,155 | | | | 246,902 | |
| | PC, 1995-20L, 1, 6.45%, 12/01/15 | | | 39,924 | | | | 40,919 | |
| | PC, 1996-20L, 1, 6.70%, 12/01/16 | | | 84,941 | | | | 87,910 | |
| | PC, 1997-20G, 1, 6.85%, 7/01/17 | | | 105,948 | | | | 109,944 | |
| | PC, 1998-20I, 1, 6.00%, 9/01/18 | | | 386,557 | | | | 403,574 | |
| | TVA, | | | | | | | | |
| | 1.875%, 8/15/22 | | | 6,000,000 | | | | 5,823,990 | |
| | 5.88%, 4/01/36 | | | 5,000,000 | | | | 6,839,573 | |
| | Strip, 11/01/18 | | | 2,644,000 | | | | 2,467,918 | |
| | Strip, 6/15/19 | | | 5,973,000 | | | | 5,474,625 | |
| | Strip, 6/15/20 | | | 6,138,000 | | | | 5,470,781 | |
| d | | U.S. Treasury Bond, Index Linked, | | | | | | | | |
| | 0.125%, 4/15/19 | | | 10,133,690 | | | | 10,035,920 | |
| | 2.00%, 1/15/26 | | | 13,160,062 | | | | 15,115,055 | |
| | U.S. Treasury Note, | | | | | | | | |
| | 0.875%, 11/30/16 | | | 2,500,000 | | | | 2,510,937 | |
| | 1.25%, 1/31/19 | | | 10,000,000 | | | | 9,905,080 | |
| | 1.75%, 10/31/18 | | | 3,000,000 | | | | 3,038,556 | |
| | 2.50%, 4/30/15 | | | 6,950,000 | | | | 7,005,517 | |
| | 4.25%, 8/15/15 | | | 20,000,000 | | | | 20,503,120 | |
| | Ukraine Government Agency for International Development Bonds, 1.844%, 5/16/19 | | | 5,000,000 | | | | 5,046,250 | |
| | | | | | | | | | |
| | | |
| | Total U.S. Government and Agency Securities (Cost $269,673,322) | | | | | | | 273,113,321 | |
| | | | | | | | | | |
| | | |
| | Total Investments before Short Term Investments
(Cost $1,412,560,551) | | | | | | | 1,432,000,281 | |
| | | | | | | | | | |
FRANKLIN TEMPLETON VARIABLE INSURANCE PRODUCTS TRUST
STATEMENT OF INVESTMENTS
Franklin U.S. Government Securities VIP Fund (continued)
| | | | | | | | | | |
| | | | | Principal Amount* | | | Value | |
| | Short Term Investments (Cost $24,143,503) 1.7% | | | | | | | | |
| | Repurchase Agreements 1.7% | | | | | | | | |
| e | | Joint Repurchase Agreement, 0.057%, 1/02/15 (Maturity Value $24,143,579) | | | 24,143,503 | | | $ | 24,143,503 | |
| | BNP Paribas Securities Corp. (Maturity Value $2,034,579)
HSBC Securities (USA) Inc. (Maturity Value $16,819,142)
Merrill Lynch, Pierce, Fenner & Smith Inc. (Maturity Value $5,289,858) | | | | | | | | |
| | Collateralized by U.S. Government Agency Securities, 0.00% - 1.50%, 1/20/15 - 10/09/19;
U.S. Government Agency Securities, Strips, 6/01/17; and U.S. Treasury Notes, 1.625% - 4.50%, 11/15/15 - 11/30/20 (valued at $24,629,418) | | | | | | | | |
| | Total Investments (Cost $1,436,704,054) 99.8% | | | | | | | 1,456,143,784 | |
| | Other Assets, less Liabilities 0.2% | | | | | | | 3,549,464 | |
| | | | | | | | | | |
| | Net Assets 100.0% | | | | | | $ | 1,459,693,248 | |
| | | | | | | | | | |
See Abbreviations on page FUS-20.
*The principal amount is stated in U.S. dollars unless otherwise indicated.
aA supranational organization is an entity formed by two or more central governments through international treaties.
bThe coupon rate shown represents the rate at period end.
cSecurity was purchased pursuant to Rule 144A under the Securities Act of 1933 and may be sold in transactions exempt from registration only to qualified institutional buyers or in a public offering registered under the Securities Act of 1933. This security has been deemed liquid under guidelines approved by the Trust’s Board of Trustees. At December 31, 2014, the value of this security was $14,198,847, representing 0.97% of net assets.
dPrincipal amount of security is adjusted for inflation. See Note 1(e).
eSee Note 1(b) regarding joint repurchase agreement.
| | | | |
| | | The accompanying notes are an integral part of these financial statements. | Annual Report | | FUS-11 |
FRANKLIN TEMPLETON VARIABLE INSURANCE PRODUCTS TRUST
Financial Statements
Statement of Assets and Liabilities
December 31, 2014
| | | | |
| | | Franklin U.S.
Government
Securities
VIP Fund | |
Assets: | | | | |
Investments in securities: | | | | |
Cost - Unaffiliated issuers | | $ | 1,412,560,551 | |
Cost - Repurchase agreements | | | 24,143,503 | |
| | | | |
Total cost of investments | | $ | 1,436,704,054 | |
| | | | |
Value - Unaffiliated issuers | | $ | 1,432,000,281 | |
Value - Repurchase agreements | | | 24,143,503 | |
| | | | |
Total value of investments | | | 1,456,143,784 | |
Receivables: | | | | |
Investment securities sold | | | 1,119,522 | |
Capital shares sold | | | 164,831 | |
Interest | | | 4,566,788 | |
Other assets | | | 121 | |
| | | | |
Total assets | | | 1,461,995,046 | |
| | | | |
Liabilities: | | | | |
Payables: | | | | |
Capital shares redeemed | | | 955,611 | |
Management fees | | | 579,826 | |
Distribution fees | | | 572,576 | |
Reports to shareholders | | | 139,975 | |
Accrued expenses and other liabilities | | | 53,810 | |
| | | | |
Total liabilities | | | 2,301,798 | |
| | | | |
Net assets, at value | | $ | 1,459,693,248 | |
| | | | |
Net assets consist of: | | | | |
Paid-in capital | | $ | 1,449,996,151 | |
Undistributed net investment income | | | 29,347,353 | |
Net unrealized appreciation (depreciation) | | | 19,439,730 | |
Accumulated net realized gain (loss) | | | (39,089,986 | ) |
| | | | |
Net assets, at value | | $ | 1,459,693,248 | |
| | | | |
| |
| Class 1: | | | | |
Net assets, at value | | $ | 90,656,370 | |
| | | | |
Shares outstanding | | | 6,972,120 | |
| | | | |
Net asset value and maximum offering price per share | | $ | 13.00 | |
| | | | |
| |
| Class 2: | | | | |
Net assets, at value | | $ | 1,369,036,878 | |
| | | | |
Shares outstanding | | | 107,526,273 | |
| | | | |
Net asset value and maximum offering price per share | | $ | 12.73 | |
| | | | |
| | | | |
| FUS-12 | | Annual Report | The accompanying notes are an integral part of these financial statements. | | |
FRANKLIN TEMPLETON VARIABLE INSURANCE PRODUCTS TRUST
FINANCIAL STATEMENTS
Statement of Operations
for the year ended December 31, 2014
| | | | |
| | | Franklin U.S.
Government
Securities
VIP Fund | |
Investment income: | | | | |
Interest | | $ | 43,279,509 | |
Paydown gain (loss) | | | (10,048,594 | ) |
| | | | |
Total investment income | | | 33,230,915 | |
| | | | |
Expenses: | | | | |
Management fees (Note 3a) | | | 6,646,023 | |
Distribution fees - Class 2 (Note 3c) | | | 3,313,255 | |
Custodian fees (Note 4) | | | 12,826 | |
Reports to shareholders | | | 214,369 | |
Professional fees | | | 57,513 | |
Trustees’ fees and expenses | | | 5,487 | |
Other | | | 94,925 | |
| | | | |
Total expenses | | | 10,344,398 | |
Expense reductions (Note 4) | | | (7 | ) |
| | | | |
Net expenses | | | 10,344,391 | |
| | | | |
Net investment income | | | 22,886,524 | |
| | | | |
Realized and unrealized gains (losses): | | | | |
Net realized gain (loss) from investments | | | 423,321 | |
Net change in unrealized appreciation (depreciation) on investments | | | 24,473,688 | |
| | | | |
Net realized and unrealized gain (loss) | | | 24,897,009 | |
| | | | |
Net increase (decrease) in net assets resulting from operations | | $ | 47,783,533 | |
| | | | |
| | | | |
| | | The accompanying notes are an integral part of these financial statements. | Annual Report | | FUS-13 |
FRANKLIN TEMPLETON VARIABLE INSURANCE PRODUCTS TRUST
FINANCIAL STATEMENTS
Statements of Changes in Net Assets
| | | | | | | | |
| | | Franklin
U.S. Government Securities VIP Fund | |
| | | Year Ended December 31, | |
| | | 2014 | | | 2013 | |
Increase (decrease) in net assets: | | | | | | | | |
Operations: | | | | | | | | |
Net investment income | | $ | 22,886,524 | | | $ | 22,010,219 | |
Net realized gain (loss) from investments | | | 423,321 | | | | (4,159,151 | ) |
Net change in unrealized appreciation (depreciation) on investments | | | 24,473,688 | | | | (49,606,935 | ) |
| | | | |
Net increase (decrease) in net assets resulting from operations | | | 47,783,533 | | | | (31,755,867 | ) |
| | | | |
Distributions to shareholders from: | | | | | | | | |
Net investment income: | | | | | | | | |
Class 1 | | | (2,743,382 | ) | | | (3,416,984 | ) |
Class 2 | | | (35,038,168 | ) | | | (35,241,458 | ) |
| | | | |
Total distributions to shareholders | | | (37,781,550 | ) | | | (38,658,442 | ) |
| | | | |
Capital share transactions: (Note 2) | | | | | | | | |
Class 1 | | | (10,061,210 | ) | | | (20,692,170 | ) |
Class 2 | | | 91,810,860 | | | | 126,422,957 | |
| | | | |
Total capital share transactions | | | 81,749,650 | | | | 105,730,787 | |
| | | | |
Net increase (decrease) in net assets | | | 91,751,633 | | | | 35,316,478 | |
Net assets: | | | | | | | | |
Beginning of year | | | 1,367,941,615 | | | | 1,332,625,137 | |
| | | | |
End of year | | $ | 1,459,693,248 | | | $ | 1,367,941,615 | |
| | | | |
Undistributed net investment income included in net assets: | | | | | | | | |
End of year | | $ | 29,347,353 | | | $ | 33,340,615 | |
| | | | |
| | | | | | |
| | FUS-14 | | | Annual Report | The accompanying notes are an integral part of these financial statements. | | |
FRANKLIN TEMPLETON VARIABLE INSURANCE PRODUCTS TRUST
Notes to Financial Statements
Franklin U.S. Government Securities VIP Fund
1. Organization and Significant Accounting Policies
Franklin Templeton Variable Insurance Products Trust (Trust) is registered under the Investment Company Act of 1940, as amended, (1940 Act) as an open-end management investment company, consisting of nineteen separate funds and applies the specialized accounting and reporting guidance in U.S. Generally Accepted Accounting Principles (U.S. GAAP). Franklin U.S. Government Securities VIP Fund (Fund) is included in this report. The financial statements of the remaining funds in the Trust are presented separately. Shares of the Fund are generally sold only to insurance company separate accounts to fund the benefits of variable life insurance policies or variable annuity contracts. At December 31, 2014, 43.70% of the Fund’s shares were held through one insurance company. Investment activities of these insurance company separate accounts could have a material impact on the Fund. The Fund offers two classes of shares: Class 1 and Class 2. Each class of shares differs by its distribution fees, voting rights on matters affecting a single class and its exchange privilege.
Effective May 1, 2014, Franklin U.S. Government Fund was renamed Franklin U.S. Government Securities VIP Fund.
The following summarizes the Fund’s significant accounting policies.
a. Financial Instrument Valuation
The Fund’s investments in financial instruments are carried at fair value daily. Fair value is the price that would be received to sell an asset or paid to transfer a liability in an orderly transaction between market participants on the measurement date. The Fund calculates the net asset value per share at the close of the New York Stock Exchange (NYSE), generally at 4 p.m. Eastern time (NYSE close) on each day the NYSE is open for trading. Under compliance policies and procedures approved by the Trust’s Board of Trustees (the Board), the Fund’s administrator has responsibility for oversight of valuation, including leading the cross-functional Valuation and Liquidity Oversight Committee (VLOC). The VLOC provides administration and oversight of the Fund’s valuation policies and procedures, which are approved annually by the Board. Among other things, these procedures allow the Fund to utilize independent pricing services, quotations from securities and financial instrument dealers, and other market sources to determine fair value.
Debt securities generally trade in the over-the-counter market rather than on a securities exchange. The Fund’s pricing services use multiple valuation techniques to determine fair value. In instances where sufficient market activity exists, the pricing services may utilize a market-based approach through which quotes from market makers are used to determine fair value. In instances where sufficient market activity may not exist or is limited, the pricing services also utilize proprietary valuation models which may consider market characteristics such as benchmark yield curves, credit spreads, estimated default rates, anticipated market interest rate volatility, coupon rates, anticipated timing of principal repayments, underlying collateral, and other unique security features in order to estimate the relevant cash flows, which are then discounted to calculate the fair value. Repurchase agreements are valued at cost, which approximates fair value.
The Fund has procedures to determine the fair value of financial instruments for which market prices are not reliable or readily available. Under these procedures, the VLOC convenes on a regular basis to review such financial instruments and considers a number of factors, including significant unobservable valuation inputs, when arriving at fair value. The VLOC primarily employs a market-based approach which may use related or comparable assets or liabilities, recent transactions, market multiples, book values, and other relevant information for the investment to determine the fair value of the investment. An income-based valuation approach may also be used in which the anticipated future cash flows of the investment are discounted to calculate fair value. Discounts may also be applied due to the nature or duration of any restrictions on the disposition of the investments. Due to the inherent uncertainty of valuations of such investments, the fair values may differ significantly from the values that would have been used had an active market existed. The VLOC employs various methods for calibrating these valuation approaches including a regular review of key inputs and assumptions, transactional back-testing or disposition analysis, and reviews of any related market activity.
b. Joint Repurchase Agreement
The Fund enters into a joint repurchase agreement whereby its uninvested cash balance is deposited into a joint cash account with other funds managed by the investment manager or an affiliate of the investment manager and is used to invest in one or more repurchase agreements. The value and face amount of the joint repurchase agreement are allocated to the funds based
FRANKLIN TEMPLETON VARIABLE INSURANCE PRODUCTS TRUST
NOTES TO FINANCIAL STATEMENTS
Franklin U.S. Government Securities VIP Fund (continued)
1. Organization and Significant Accounting Policies (continued)
b. Joint Repurchase Agreement (continued)
on their pro-rata interest. A repurchase agreement is accounted for as a loan by the Fund to the seller, collateralized by securities which are delivered to the Fund’s custodian. The fair value, including accrued interest, of the initial collateralization is required to be at least 102% of the dollar amount invested by the funds, with the value of the underlying securities marked to market daily to maintain coverage of at least 100%. Repurchase agreements are subject to the terms of Master Repurchase Agreements (MRAs) with approved counterparties (sellers). The MRAs contain various provisions, including but not limited to events of default and maintenance of collateral for repurchase agreements. In the event of default by either the seller or the Fund, certain MRAs may permit the non-defaulting party to net and close-out all transactions, if any, traded under such agreements. The Fund may sell securities it holds as collateral and apply the proceeds towards the repurchase price and any other amounts owed by the seller to the Fund in the event of default by the seller. This could involve costs or delays in addition to a loss on the securities if their value falls below the repurchase price owed by the seller. The joint repurchase agreement held by the Fund at year end, as indicated in the Statement of Investments, had been entered into on December 31, 2014.
c. Mortgage Dollar Rolls
The Fund enters into mortgage dollar rolls, typically on a TBA basis. Mortgage dollar rolls are agreements between the Fund and a financial institution to simultaneously sell and repurchase mortgage-backed securities at a future date. Gains or losses are realized on the initial sale, and the difference between the repurchase price and the sale price is recorded as an unrealized gain or loss to the Fund upon entering into the mortgage dollar roll. In addition, the Fund may invest the cash proceeds that are received from the initial sale. During the period between the sale and repurchase, the Fund is not entitled to principal and interest paid on the mortgage backed securities. The risks of mortgage dollar roll transactions include the potential inability of the counterparty to fulfill its obligations.
d. Income Taxes
It is the Fund’s policy to qualify as a regulated investment company under the Internal Revenue Code. The Fund intends to distribute to shareholders substantially all of its taxable income
and net realized gains to relieve it from federal income and if applicable, excise taxes. As a result, no provision for U.S. federal income taxes is required.
The Fund recognizes the tax benefits of uncertain tax positions only when the position is “more likely than not” to be sustained upon examination by the tax authorities based on the technical merits of the tax position. As of December 31, 2014, and for all open tax years, the Fund has determined that no liability for unrecognized tax benefits is required in the Fund’s financial statements related to uncertain tax positions taken on a tax return (or expected to be taken on future tax returns). Open tax years are those that remain subject to examination and are based on each tax jurisdiction statute of limitation.
e. Security Transactions, Investment Income, Expenses and Distributions
Security transactions are accounted for on trade date. Realized gains and losses on security transactions are determined on a specific identification basis. Interest income and estimated expenses are accrued daily. Amortization of premium and accretion of discount on debt securities are included in interest income. Paydown gains and losses are recorded separately in the Statement of Operations. Distributions to shareholders are recorded on the ex-dividend date and are determined according to income tax regulations (tax basis). Distributable earnings determined on a tax basis may differ from earnings recorded in accordance with U.S. GAAP. These differences may be permanent or temporary. Permanent differences are reclassified among capital accounts to reflect their tax character. These reclassifications have no impact on net assets or the results of operations. Temporary differences are not reclassified, as they may reverse in subsequent periods.
Common expenses incurred by the Trust are allocated among the funds based on the ratio of net assets of each fund to the combined net assets of the Trust. Fund specific expenses are charged directly to the fund that incurred the expense.
Realized and unrealized gains and losses and net investment income, not including class specific expenses, are allocated daily to each class of shares based upon the relative proportion of net assets of each class. Differences in per share distributions, by class, are generally due to differences in class specific expenses.
Inflation-indexed bonds are adjusted for inflation through periodic increases or decreases in the security’s interest accruals, face amount, or principal redemption value, by amounts corresponding to the rate of inflation as measured by an index.
FRANKLIN TEMPLETON VARIABLE INSURANCE PRODUCTS TRUST
NOTES TO FINANCIAL STATEMENTS
Franklin U.S. Government Securities VIP Fund (continued)
Any increase or decrease in the face amount or principal redemption value will be included as interest income in the Statement of Operations.
f. Accounting Estimates
The preparation of financial statements in accordance with U.S. GAAP requires management to make estimates and assumptions that affect the reported amounts of assets and liabilities at the date of the financial statements and the amounts of income and expenses during the reporting period. Actual results could differ from those estimates.
g. Guarantees and Indemnifications
Under the Trust’s organizational documents, its officers and trustees are indemnified by the Trust against certain liabilities arising out of the performance of their duties to the Trust. Additionally, in the normal course of business, the Trust, on behalf of the Fund, enters into contracts with service providers that contain general indemnification clauses. The Trust’s maximum exposure under these arrangements is unknown as this would involve future claims that may be made against the Trust that have not yet occurred. Currently, the Trust expects the risk of loss to be remote.
2. Shares of Beneficial Interest
At December 31, 2014, there were an unlimited number of shares authorized (without par value). Transactions in the Fund’s shares were as follows:
| | | | | | | | | | | | | | | | | | |
| | | Year Ended December 31, | |
| | | 2014 | | | | | 2013 | |
| | | Shares | | | Amount | | | | | Shares | | | Amount | |
| | | | | |
| Class 1 Shares: | | | | | | | | | | | | | | | | | | |
Shares sold | | | 242,868 | | | $ | 3,161,287 | | | | | | 543,938 | | | $ | 7,320,837 | |
Shares issued in reinvestment of distributions | | | 214,159 | | | | 2,743,382 | | | | | | 262,643 | | | | 3,416,984 | |
Shares redeemed | | | (1,229,027 | ) | | | (15,965,879 | ) | | | | | (2,385,700 | ) | | | (31,429,991 | ) |
| | | | |
Net increase (decrease) | | | (772,000 | ) | | $ | (10,061,210 | ) | | | | | (1,579,119 | ) | | $ | (20,692,170 | ) |
| | | | |
| Class 2 Shares: | | | | | | | | | | | | | | | | | | |
Shares sold | | | 13,830,012 | | | $ | 175,846,470 | | | | | | 21,495,475 | | | $ | 278,880,113 | |
Shares issued in reinvestment of distributions | | | 2,789,663 | | | | 35,038,168 | | | | | | 2,759,707 | | | | 35,241,458 | |
Shares redeemed | | | (9,358,233 | ) | | | (119,073,778 | ) | | | | | (14,590,310 | ) | | | (187,698,614 | ) |
| | | | |
Net increase (decrease) | | | 7,261,442 | | | $ | 91,810,860 | | | | | | 9,664,872 | | | $ | 126,422,957 | |
| | | | |
3. Transactions With Affiliates
Franklin Resources, Inc. is the holding company for various subsidiaries that together are referred to as Franklin Templeton Investments. Certain officers and trustees of the Fund are also officers and/or directors of the following subsidiaries:
| | |
| Subsidiary | | Affiliation |
Franklin Advisers, Inc. (Advisers) | | Investment manager |
Franklin Templeton Services, LLC (FT Services) | | Administrative manager |
Franklin Templeton Distributors, Inc. (Distributors) | | Principal underwriter |
Franklin Templeton Investor Services, LLC (Investor Services) | | Transfer agent |
FRANKLIN TEMPLETON VARIABLE INSURANCE PRODUCTS TRUST
NOTES TO FINANCIAL STATEMENTS
Franklin U.S. Government Securities VIP Fund (continued)
3. Transactions With Affiliates (continued)
a. Management Fees
The Fund pays an investment management fee to Advisers based on the average daily net assets of the Fund as follows:
| | |
| Annualized Fee Rate | | Net Assets |
0.625% | | Up to and including $100 million |
0.500% | | Over $100 million, up to and including $250 million |
0.450% | | Over $250 million, up to and including $7.5 billion |
0.440% | | Over $7.5 billion, up to and including $10 billion |
0.430% | | Over $10 billion, up to and including $12.5 billion |
0.420% | | Over $12.5 billion, up to and including $15 billion |
0.400% | | In excess of $15 billion |
b. Administrative Fees
Under an agreement with Advisers, FT Services provides administrative services to the Fund. The fee is paid by Advisers based on the Fund’s average daily net assets, and is not an additional expense of the Fund.
c. Distribution Fees
The Board has adopted a distribution plan for Class 2 shares pursuant to Rule 12b-1 under the 1940 Act. Under the Fund’s compensation distribution plan, the Fund pays Distributors for costs incurred in connection with the servicing, sale and distribution of the Fund’s shares up to 0.35% per year of its average daily net assets. Some distribution fees are not charged on shares held by affiliates. The Board has agreed to limit the current rate to 0.25% per year for Class 2. The plan year, for purposes of monitoring compliance with the maximum annual plan rate, is February 1 through January 31.
d. Transfer Agent Fees
Investor Services, under terms of an agreement, performs shareholder servicing for the Fund and is not paid by the Fund for the services.
4. Expense Offset Arrangement
The Fund has entered into an arrangement with its custodian whereby credits realized as a result of uninvested cash balances are used to reduce a portion of the Fund’s custodian expenses. During the year ended December 31, 2014, the custodian fees were reduced as noted in the Statement of Operations.
5. Income Taxes
For tax purposes, capital losses may be carried over to offset future capital gains. Capital loss carryforwards with no expiration, if any, must be fully utilized before those losses with expiration dates.
At December 31, 2014, capital loss carryforwards were as follows:
| | | | |
Capital loss carryforwards subject to expiration: | | | | |
2015 | | $ | 2,329,071 | |
2016 | | | 841,479 | |
2017 | | | 401,851 | |
2018 | | | 426,637 | |
| |
Capital loss carryforwards not subject to expiration: | | | | |
Short term | | | 17,923,545 | |
Long term | | | 16,965,019 | |
| | | | |
Total capital loss carryforwards | | $ | 38,887,602 | |
| | | | |
FRANKLIN TEMPLETON VARIABLE INSURANCE PRODUCTS TRUST
NOTES TO FINANCIAL STATEMENTS
Franklin U.S. Government Securities VIP Fund (continued)
On December 31, 2014, the Fund had expired capital loss carryforwards of $1,618,397, which were reclassified to paid-in capital.
The tax character of distributions paid during the years ended December 31, 2014 and 2013, was as follows:
| | | | | | | | |
| | | 2014 | | | 2013 | |
Distributions paid from ordinary income | | $ | 37,781,550 | | | $ | 38,658,442 | |
| | | | |
At December 31, 2014, the cost of investments, net unrealized appreciation (depreciation) and undistributed ordinary income for income tax purposes were as follows:
| | | | |
Cost of investments | | $ | 1,443,435,135 | |
| | | | |
Unrealized appreciation | | $ | 25,206,320 | |
Unrealized depreciation | | | (12,497,671 | ) |
| | | | |
Net unrealized appreciation (depreciation) | | $ | 12,708,649 | |
| | | | |
Distributable earnings – undistributed ordinary income | | $ | 35,889,880 | |
| | | | |
Differences between income and/or capital gains as determined on a book basis and a tax basis are primarily due to differing treatments of paydown losses and bond discounts and premiums.
6. Investment Transactions
Purchases and sales of investments (excluding short term securities) for the year ended December 31, 2014, aggregated $696,375,642 and $591,456,921, respectively.
7. Credit Facility
The Fund, together with other U.S. registered and foreign investment funds (collectively, Borrowers), managed by Franklin Templeton Investments, are borrowers in a joint syndicated senior unsecured credit facility totaling $1.5 billion (Global Credit Facility) which matured on February 13, 2015. This Global Credit Facility provides a source of funds to the Borrowers for temporary and emergency purposes, including the ability to meet future unanticipated or unusually large redemption requests. The Borrowers expect to renew the Global Credit Facility for a total of $2 billion effective February 13, 2015, which matures on February 12, 2016.
Under the terms of the Global Credit Facility, the Fund shall, in addition to interest charged on any borrowings made by the Fund and other costs incurred by the Fund, pay its share of fees and expenses incurred in connection with the implementation and maintenance of the Global Credit Facility, based upon its relative share of the aggregate net assets of all of the Borrowers, including an annual commitment fee of 0.07% based upon the unused portion of the Global Credit Facility. These fees are reflected in other expenses on the Statement of Operations. During the year ended December 31, 2014, the Fund did not use the Global Credit Facility.
8. Fair Value Measurements
The Fund follows a fair value hierarchy that distinguishes between market data obtained from independent sources (observable inputs) and the Fund’s own market assumptions (unobservable inputs). These inputs are used in determining the value of the Fund’s financial instruments and are summarized in the following fair value hierarchy:
| | • | | Level 1 – quoted prices in active markets for identical financial instruments |
| | • | | Level 2 – other significant observable inputs (including quoted prices for similar financial instruments, interest rates, prepayment speed, credit risk, etc.) |
| | • | | Level 3 – significant unobservable inputs (including the Fund’s own assumptions in determining the fair value of financial instruments) |
FRANKLIN TEMPLETON VARIABLE INSURANCE PRODUCTS TRUST
NOTES TO FINANCIAL STATEMENTS
Franklin U.S. Government Securities VIP Fund (continued)
8. Fair Value Measurements (continued)
The input levels are not necessarily an indication of the risk or liquidity associated with financial instruments at that level.
For movements between the levels within the fair value hierarchy, the Fund has adopted a policy of recognizing the transfers as of the date of the underlying event which caused the movement.
At December 31, 2014, all of the Fund’s investments in financial instruments carried at fair value were valued using Level 2 inputs.
9. Subsequent Events
The Fund has evaluated subsequent events through the issuance of the financial statements and determined that no events have occurred that require disclosure other than those already disclosed in the financial statements.
Abbreviations
| | |
| Selected Portfolio |
| |
| FFCB | | Federal Farm Credit Bank |
| |
| FHLB | | Federal Home Loan Bank |
| |
| FICO | | Financing Corp. |
| |
| FRN | | Floating Rate Note |
| |
| GL | | Government Loan |
| |
| PC | | Participation Certificate |
| |
| PL | | Project Loan |
| |
| SBA | | Small Business Administration |
| |
| SF | | Single Family |
| |
| TVA | | Tennessee Valley Authority |
FRANKLIN TEMPLETON VARIABLE INSURANCE PRODUCTS TRUST
Report of Independent Registered Public Accounting Firm
Franklin U.S. Government Securities VIP Fund
To the Board of Trustees and Shareholders of Franklin Templeton Variable Insurance Product Trust
In our opinion, the accompanying statement of assets and liabilities, including the statement of investments, and the related statements of operations and of changes in net assets and the financial highlights present fairly, in all material respects, the financial position of Franklin U.S. Government Securities VIP Fund (the “Fund”) at December 31, 2014, the results of its operations for the year then ended, the changes in its net assets for each of the two years in the period then ended and the financial highlights for each of the five years in the period then ended, in conformity with accounting principles generally accepted in the United States of America. These financial statements and financial highlights (hereafter referred to as “financial statements”) are the responsibility of the Fund’s management. Our responsibility is to express an opinion on these financial statements based on our audits. We conducted our audits of these financial statements in accordance with the standards of the Public Company Accounting Oversight Board (United States). Those standards require that we plan and perform the audit to obtain reasonable assurance about whether the financial statements are free of material misstatement. An audit includes examining, on a test basis, evidence supporting the amounts and disclosures in the financial statements, assessing the accounting principles used and significant estimates made by management, and evaluating the overall financial statement presentation. We believe that our audits, which included confirmation of securities at December 31, 2014 by correspondence with the custodian and brokers, provides a reasonable basis for our opinion.
PricewaterhouseCoopers LLP
San Francisco, California
February 13, 2015
Templeton Developing Markets VIP Fund
(Formerly, Templeton Developing Markets Securities Fund)
This annual report for Templeton Developing Markets VIP Fund covers the fiscal year ended December 31, 2014.
Class 2 Performance Summary as of December 31, 2014
Average annual total return of Class 2 shares* represents the average annual change in value, assuming reinvestment of dividends and capital gains. Average returns smooth out variations in returns, which can be significant; they are not the same as year-by-year results.
| | | | | | | | | | | | |
| Periods ended 12/31/14 | | 1-Year | | | 5-Year | | | 10-Year | |
Average Annual Total Return | | | -8.39% | | | | +0.32% | | | | +5.72% | |
*The Fund has a fee waiver associated with its investments in a Franklin Templeton money fund, contractually guaranteed through at least its current fiscal year-end. Fund investment results reflect the fee waiver, to the extent applicable; without this reduction, the results would have been lower.
Performance reflects the Fund’s Class 2 operating expenses, but does not include any contract fees, expenses or sales charges. If they had been included, performance would be lower. These charges and deductions, particularly for variable life policies, can have a significant effect on contract values and insurance benefits. See the contract prospectus for a complete description of these expenses, including sales charges.
Performance data represent past performance, which does not guarantee future results. Investment return and principal value will fluctuate, and you may have a gain or loss when you sell your shares. Current performance may differ from figures shown.
Total Return Index Comparison for a Hypothetical $10,000 Investment (1/1/05–12/31/14)
The graph below shows the change in value of a hypothetical $10,000 investment in the Fund over the indicated period and includes reinvestment of any income or distributions. The Fund’s performance* is compared to the performance of the MSCI Emerging Markets (EM) Index and the Standard & Poor’s®/International Finance Corporation Investable (S&P®/IFCI) Composite Index. One cannot invest directly in an index, and an index is not representative of the Fund’s portfolio. Please see Important Notes to Performance Information preceding the Fund Summaries.
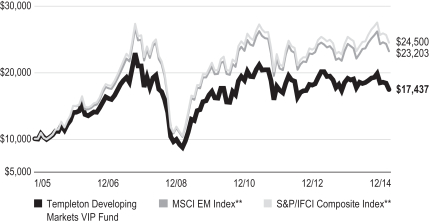
**Source: Morningstar. Please see Index Descriptions following the Fund Summaries.
TEMPLETON DEVELOPING MARKETS VIP FUND
Fund Goal and Main Investments
Templeton Developing Markets VIP Fund seeks long-term capital appreciation. Under normal market conditions, the Fund invests at least 80% of its net assets in emerging market investments.
Fund Risks
All investments involve risks, including possible loss of principal. Special risks are associated with foreign investing, including currency fluctuations, economic instability and political developments. Investments in developing markets, of which frontier markets are a subset, involve heightened risks related to the same factors, in addition to those associated with these markets’ smaller size, lesser liquidity and lack of established legal, political, business and social frameworks to support securities markets. Because these frameworks are typically even less developed in frontier markets, as well as various factors including the increased potential for extreme price volatility, illiquidity, trade barriers and exchange controls, the risks associated with developing markets are magnified in frontier markets. The Fund is designed for the aggressive portion of a well-diversified portfolio. The Fund is actively managed but there is no guarantee that the manager’s investment decisions will produce the desired results. The Fund’s prospectus also includes a description of the main investment risks.
Performance Overview
You can find the Fund’s one-year total return in the Performance Summary. In comparison, the MSCI EM Index had a -1.82% total return, and the S&P/IFCI Composite Index had a -1.12% total return for the same period.1 Please note index performance numbers are for reference and we do not attempt to track an index but rather undertake investments on the basis of fundamental research.
Economic and Market Overview
The global economy grew moderately during the 12 months under review as many developed markets continued to recover and many emerging markets continued to expand. Although several emerging market countries faced headwinds such as soft domestic demand, weak exports and geopolitical crises, emerging market economies overall continued to grow faster than developed market economies. China’s economy stabilized in 2014 as fiscal and monetary stimulus measures implemented in
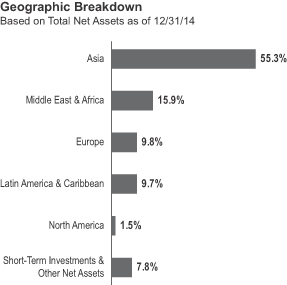
the year’s second half gained traction. Strength in production and consumer spending offset weakness in fixed-asset investment. Domestic demand continued to account for a greater portion of China’s gross domestic product, as the government’s market friendly policies supported new economic drivers. Emerging market countries showing signs of economic improvement included India, Poland and Mexico, while others, including Russia, South Africa and South Korea, showed signs of moderation. Although Brazil exited recession as government spending drove third-quarter economic growth, it continued to face headwinds such as lower commodity prices.
Central bank actions varied across emerging markets. Several central banks, including those of Russia, Brazil and South Africa, raised interest rates in response to rising inflation and weakening currencies. In contrast, the central banks of Chile, Mexico and South Korea lowered interest rates to promote economic growth. After raising interest rates early in the year to support the Turkish lira, Turkey’s central bank began easing monetary policy to boost economic growth. The People’s Bank of China cut its benchmark interest rate for the first time since July 2012.
Emerging markets experienced volatility in 2014 amid concerns about the U.S. Federal Reserve Board’s (Fed’s) timing of interest rate increases, moderating global economic growth and geopolitical tensions in several regions. Also weighing on investor sentiment was a sharp decline in crude oil prices,
1. Source: Morningstar.
One cannot invest directly in an index, and an index is not representative of the Fund’s portfolio. Please see Index Descriptions following the Fund Summaries.
TEMPLETON DEVELOPING MARKETS VIP FUND
which pressured several oil-producing countries’ financial positions and currencies. However, India’s and Indonesia’s announced economic reforms following their national elections, China’s fiscal and monetary stimulus measures, the European Central Bank’s monetary easing and the Fed’s accommodative policy provided investors with some optimism.
For the 12 months ended December 31, 2014, emerging market stocks, as measured by the MSCI EM Index, rose 5.57% in local currency terms, as many investors seemed to focus on the relatively attractive valuations of many emerging market stocks.1 However, weak local currencies led to a 1.82% decline in U.S. dollar terms.1 European emerging markets overall underperformed, as did Latin America. Asia generally performed well, as many countries in the region delivered double-digit gains. In addition, the Middle East and Africa region produced solid returns.
Investment Strategy
We employ a fundamental research, value-oriented, long-term investment approach. We focus on the market price of a company’s securities relative to our evaluation of its long-term earnings, asset value and cash flow potential. We also consider a company’s profit and loss outlook, balance sheet strength, cash flow trends and asset value in relation to the current price. Our analysis considers the company’s corporate governance behavior as well as its position in its sector, the economic framework and political environment. We invest in securities without regard to benchmark comparisons.
Manager’s Discussion
During the year under review, key contributors to the Fund’s absolute performance included Emaar Properties, Remgro and TSMC (Taiwan Semiconductor Manufacturing Co.).
Emaar Properties is a major property developer and manager with operations throughout the Middle East, notably in Dubai, United Arab Emirates (UAE). Dubai’s rising tourism boosted Emaar’s hotel and retail operations, and a property sector recovery in the earlier part of the year also supported the company’s operations. The UAE’s inclusion in the MSCI EM Index in June further boosted Emaar’s share price. However, signs of a property price decline in the emirate during the final months of 2014 led to a share price correction.
Remgro is a South African conglomerate with a diversified portfolio of financial and industrial assets that we believe provides an attractive means to address growth in the South African and broader African economies. The share price appreciation during the year, in our view, reflected investors’
| | | | |
Top 10 Countries | | | |
| 12/31/14 | | | |
| | | % of Total
Net Assets | |
| China | | | 20.4% | |
| South Africa | | | 11.5% | |
| Thailand | | | 10.9% | |
| India | | | 10.9% | |
| Brazil | | | 8.0% | |
| Belgium | | | 3.6% | |
| U.K. | | | 3.5% | |
| Indonesia | | | 3.4% | |
| Taiwan | | | 3.1% | |
| South Korea | | | 2.9% | |
confidence in Africa’s financials and industrials sectors, while sentiment in the commodity sector remained relatively weaker.
TSMC, the world’s largest independent integrated circuit foundry, showed strong growth in the past few years, resulting from increased demand for chips used in mobile devices such as smartphones and tablets. Strong corporate results, management updates suggesting rising market share and progress in the commercialization of the most advanced technology supported the company’s share price performance.
In contrast, key detractors from the Fund’s absolute performance included Petrobras (Petroleo Brasileiro), Avon Products and SJM Holdings.
Petrobras, a new holding this period, is Brazil’s main oil and gas producer, refiner and distributor. The company’s links with government and political figures were scrutinized in the final quarter of 2014 amid accusations of bribery and corrupt practices. Delays in the release of third-quarter results and the sharp decline in oil and gas prices also weighed on sentiment. The decision of the Organization of the Petroleum Exporting Countries to maintain oil production levels despite a global oversupply led prices to fall more than 40% in 2014’s fourth quarter.
Avon Products is a U.S.-listed global cosmetics company with substantial operations in various emerging market countries, most notably Brazil. Its third-quarter corporate results, impacted by Brazil’s sluggish economy, disappointed investors. Concerns about the company’s ability to service its substantial debts in a weak market environment led two major rating agencies to downgrade the company’s debt rating to below investment grade, further weighing on investor sentiment. Also pressuring shares were the economic and currency crises in Russia, another substantial market for the company.
TEMPLETON DEVELOPING MARKETS VIP FUND
SJM Holdings, a Hong Kong-listed, Macau-based gaming and entertainment company, lost ground in 2014 after strong stock performance in 2013, as the Chinese government’s anti-corruption and anti-extravagance policies negatively affected casino revenues. Macau’s annual gambling revenues declined in 2014 for the first time since China liberalized the administrative region’s casinos in 2001.
It is important to recognize the effect of currency movements on the Fund’s performance. In general, if the value of the U.S. dollar goes up compared with a foreign currency, an investment traded in that foreign currency will go down in value because it will be worth fewer U.S. dollars. This can have a negative effect on Fund performance. Conversely, when the U.S. dollar weakens in relation to a foreign currency, an investment traded in that foreign currency will increase in value, which can contribute to Fund performance. For the 12 months ended December 31, 2014, the U.S. dollar rose in value relative to most currencies. As a result, the Fund’s performance was negatively affected by the portfolio’s investment predominantly in securities with non-U.S. currency exposure.
In the past 12 months, we increased the Fund’s holdings largely in Thailand, South Africa, India, Indonesia and China via China H, Red Chip and P Chip shares as we continued to search for investment opportunities we considered to be attractive.2 We initiated investments in several markets, including Greece and Peru, and made some purchases in other emerging markets, including Turkey and Taiwan. Additionally, we made some purchases in developed market countries, such as the U.S. and Belgium, where we identified select companies with significant
emerging market operations. In sector terms, we increased the Fund’s holdings mainly in materials, energy, financials and health care.3 Key purchases included new positions in Itau Unibanco Holding, a leading Brazilian commercial bank; Brilliance China Automotive Holdings, a major Chinese automobile manufacturer with a joint venture with BMW; and Naspers, a South Africa-based multinational media group.
Conversely, we reduced the Fund’s investments in Hong Kong, the UAE, Macau and Brazil to focus on stocks we considered to be more attractively valued within our investment universe. We
| | | | |
Top 10 Holdings | | | |
| 12/31/14 | | | |
Company
Sector/Industry, Country | | % of Total
Net Assets | |
Remgro Ltd.
Diversified Financial Services, South Africa | | | 5.0% | |
Tata Consultancy Services Ltd.
IT Services, India | | | 4.7% | |
Siam Commercial Bank PCL, fgn.
Banks, Thailand | | | 4.2% | |
Naspers Ltd., N
Media, South Africa | | | 4.2% | |
Brilliance China Automotive Holdings Ltd.
Automobiles, China | | | 4.2% | |
Itau Unibanco Holding SA, ADR
Banks, Brazil | | | 3.8% | |
Anheuser-Busch InBev NV
Beverages, Belgium | | | 3.6% | |
Unilever PLC
Food Products, U.K. | | | 3.5% | |
TSMC (Taiwan Semiconductor Manufacturing Co.) Ltd.
Semiconductors & Semiconductor Equipment, Taiwan | | | 3.1% | |
China Construction Bank Corp., H
Banks, China | | | 3.0% | |
The dollar value, number of shares or principal amount, and names of all portfolio holdings are listed in the Fund’s Statement of Investments (SOI).
also eliminated exposures to several countries, including Nigeria and Singapore. In sector terms, some of the largest sales were in consumer staples and consumer discretionary.4 Key sales included a reduction of the Fund’s holding in Emaar Properties. We closed the Fund’s positions in Ambev, a Brazil-based global beer and soft drink producer, and British American Tobacco, a U.K.-listed global tobacco company. Additionally, we closed the Fund’s positions in a number of Macau casino resort operators, including Sands China, Melco Crown Entertainment and SJM Holdings, mentioned earlier.
Thank you for your participation in Templeton Developing Markets VIP Fund. We look forward to serving your future investment needs.
2. “China H” denotes shares of China-incorporated, Hong Kong Stock Exchange-listed companies with most businesses in China. “Red Chip” denotes shares of Hong Kong Stock Exchange-listed companies substantially owned by Chinese mainland state entities, with significant exposure to China. “P Chip” denotes shares of Hong Kong Stock Exchange-listed companies controlled by Chinese mainland individuals and incorporated outside of China, with a majority of their business in China.
3. The materials sector comprises chemicals, construction materials, and metals and mining in the SOI. The energy sector comprises oil, gas and consumable fuels in the SOI. The financials sector comprises banks, diversified financial services, insurance, and real estate management and development in the SOI. The health care sector comprises biotechnology and pharmaceuticals in the SOI.
4. The consumer staples sector comprises beverages, food products, food and staples retailing, personal products and tobacco in the SOI. The consumer discretionary sector comprises automobiles; hotels, restaurants and leisure; media; specialty retail; and textiles, apparel and luxury goods in the SOI.
TEMPLETON DEVELOPING MARKETS VIP FUND
The foregoing information reflects our analysis, opinions and portfolio holdings as of December 31, 2014, the end of the reporting period. The way we implement our main investment strategies and the resulting portfolio holdings may change depending on factors such as market and economic conditions. These opinions may not be relied upon as investment advice or an offer for a particular security. The information is not a complete analysis of every aspect of any market, country, industry, security or the Fund. Statements of fact are from sources considered reliable, but the investment manager makes no representation or warranty as to their completeness or accuracy. Although historical performance is no guarantee of future results, these insights may help you understand our investment management philosophy.
TEMPLETON DEVELOPING MARKETS VIP FUND
Class 2 Fund Expenses
As an investor in a variable insurance contract (Contract) that indirectly provides for investment in an underlying mutual fund, you can incur transaction and/or ongoing expenses at both the Fund level and the Contract level.
| • | | Transaction expenses can include sales charges (loads) on purchases, redemption fees, surrender fees, transfer fees and premium taxes. |
| • | | Ongoing expenses can include management fees, distribution and service (12b-1) fees, contract fees, annual maintenance fees, mortality and expense risk fees and other fees and expenses. All mutual funds and Contracts have some types of ongoing expenses. |
The expenses shown in the table are meant to highlight ongoing expenses at the Fund level only and do not include ongoing expenses at the Contract level, or transaction expenses at either the Fund or Contract level. While the Fund does not have transaction expenses, if the transaction and ongoing expenses at the Contract level were included, the expenses shown below would be higher. You should consult your Contract prospectus or disclosure document for more information.
The table shows Fund-level ongoing expenses and can help you understand these expenses and compare them with those of other mutual funds offered through the Contract. The table assumes a $1,000 investment held for the six months indicated. Please refer to the Fund prospectus for additional information on operating expenses.
Actual Fund Expenses
The first line (Actual) of the table provides actual account values and expenses. The “Ending Account Value” is derived from the Fund’s actual return, which includes the effect of ongoing Fund expenses, but does not include the effect of ongoing Contract expenses.
You can estimate the Fund-level expenses you incurred during the period by following these steps. Of course, your account value and expenses will differ from those in this illustration:
| 1. | Divide your account value by $1,000. |
If an account had an $8,600 value, then $8,600 ÷ $1,000 = 8.6.
| 2. | Multiply the result by the number under the heading “Fund-Level Expenses Incurred During Period.” |
If Fund-Level Expenses Incurred During Period were $7.50, then 8.6 × $7.50 = $64.50.
In this illustration, the estimated expenses incurred this period at the Fund level are $64.50.
Hypothetical Example for Comparison with Other Mutual Funds
Information in the second line (Hypothetical) of the table can help you compare ongoing expenses of the Fund with those of other mutual funds offered through the Contract. This information may not be used to estimate the actual ending account balance or expenses you incurred during the period. The hypothetical “Ending Account Value” is based on the Fund’s actual expense ratio and an assumed 5% annual rate of return before expenses, which does not represent the Fund’s actual return. The figure under the heading “Fund-Level Expenses Incurred During Period” shows the hypothetical expenses your account would have incurred under this scenario. You can compare this figure with the 5% hypothetical examples that appear in shareholder reports of other funds offered through a Contract.
| | | | | | | | | | | | |
| Class 2 | | Beginning Account Value 7/1/14 | | | Ending Account Value 12/31/14 | | | Fund-Level Expenses
Incurred During Period* 7/1/14–12/31/14 | |
Actual | | | $1,000 | | | | $ 909.10 | | | | $7.70 | |
Hypothetical (5% return before expenses) | | | $1,000 | | | | $1,017.14 | | | | $8.13 | |
*Expenses are calculated using the most recent six-month annualized expense ratio, net of expense waivers, for the Fund’s Class 2 shares (1.60%), which does not include any ongoing expenses of the Contract for which the Fund is an investment option, multiplied by the average account value over the period, multiplied by 184/365 to reflect the one-half year period.
FRANKLIN TEMPLETON VARIABLE INSURANCE PRODUCTS TRUST
Financial Highlights
Templeton Developing Markets VIP Fund
| | | | | | | | | | | | | | | | | | | | |
| | | Year Ended December 31, | |
| | | 2014 | | | 2013 | | | 2012 | | | 2011 | | | 2010 | |
| Class 1 | | | | | | | | | | | | | | | | | | | | |
Per share operating performance
(for a share outstanding throughout the year) | | | | | | | | | | | | | | | | | | | | |
| | | | | |
Net asset value, beginning of year | | | $10.26 | | | | $10.58 | | | | $9.50 | | | | $11.40 | | | | $9.86 | |
| | | | |
| | | | | |
| Income from investment operationsa: | | | | | | | | | | | | | | | | | | | | |
| | | | | |
Net investment incomeb | | | 0.15 | c | | | 0.13 | | | | 0.19 | | | | 0.17 | | | | 0.09 | |
| | | | | |
Net realized and unrealized gains (losses) | | | (0.97 | ) | | | (0.22 | ) | | | 1.06 | | | | (1.94 | ) | | | 1.63 | |
| | | | |
Total from investment operations | | | (0.82 | ) | | | (0.09 | ) | | | 1.25 | | | | (1.77 | ) | | | 1.72 | |
| | | | |
Less distributions from net investment income | | | (0.17 | ) | | | (0.23 | ) | | | (0.17 | ) | | | (0.13 | ) | | | (0.18 | ) |
| | | | |
Redemption feesd | | | — | | | | — | | | | — | | | | — | | | | — | |
| | | | |
Net asset value, end of year | | | $9.27 | | | | $10.26 | | | | $10.58 | | | | $9.50 | | | | $11.40 | |
| | | | |
| | | | | |
Total returne | | | (8.09)% | | | | (0.73)% | | | | 13.40% | | | | (15.67)% | | | | 17.83% | |
| | | | | |
| Ratios to average net assets | | | | | | | | | | | | | | | | | | | | |
| | | | | |
Expenses | | | 1.36% | f | | | 1.35% | | | | 1.35% | | | | 1.40% | | | | 1.49% | g |
| | | | | |
Net investment income | | | 1.51% | c | | | 1.25% | | | | 1.93% | | | | 1.57% | | | | 0.87% | |
| | | | | |
| Supplemental data | | | | | | | | | | | | | | | | | | | | |
| | | | | |
Net assets, end of year (000’s) | | | $114,487 | | | | $145,707 | | | | $203,568 | | | | $232,544 | | | | $347,242 | |
| | | | | |
Portfolio turnover rate | | | 82.87% | | | | 44.59% | | | | 24.45% | | | | 14.90% | | | | 24.41% | |
aThe amount shown for a share outstanding throughout the period may not correlate with the Statement of Operations for the period due to the timing of sales and repurchases of the Fund shares in relation to income earned and/or fluctuating fair value of the investments of the Fund.
bBased on average daily shares outstanding.
cNet investment income per share includes approximately $0.04 per share received in the form of special dividends. Excluding these amounts, the ratio of net investment income to average net assets would have been 1.11%.
dAmount rounds to less than $0.01 per share.
eTotal return does not include fees, charges or expenses imposed by the variable annuity and life insurance contracts for which the Franklin Templeton Variable Insurance Products Trust serves as an underlying investment vehicle.
fBenefit of waiver and payments by affiliates rounds to less than 0.01%.
gBenefit of expense reduction rounds to less than 0.01%.
| | | | | | |
| | | The accompanying notes are an integral part of these financial statements. | Annual Report | | | TD-7 | |
FRANKLIN TEMPLETON VARIABLE INSURANCE PRODUCTS TRUST
FINANCIAL HIGHLIGHTS
Templeton Developing Markets VIP Fund (continued)
| | | | | | | | | | | | | | | | | | | | |
| | | Year Ended December 31, | |
| | | 2014 | | | 2013 | | | 2012 | | | 2011 | | | 2010 | |
| Class 2 | | | | | | | | | | | | | | | | | | | | |
Per share operating performance
(for a share outstanding throughout the year) | | | | | | | | | | | | | | | | | | | | |
| | | | | |
Net asset value, beginning of year | | | $10.19 | | | | $10.50 | | | | $9.42 | | | | $11.30 | | | | $9.78 | |
| | | | |
| | | | | |
| Income from investment operationsa: | | | | | | | | | | | | | | | | | | | | |
| | | | | |
Net investment incomeb | | | 0.12 | c | | | 0.10 | | | | 0.17 | | | | 0.14 | | | | 0.06 | |
| | | | | |
Net realized and unrealized gains (losses) | | | (0.96 | ) | | | (0.21 | ) | | | 1.05 | | | | (1.92 | ) | | | 1.62 | |
| | | | |
Total from investment operations | | | (0.84 | ) | | | (0.11 | ) | | | 1.22 | | | | (1.78 | ) | | | 1.68 | |
| | | | |
Less distributions from net investment income | | | (0.15 | ) | | | (0.20 | ) | | | (0.14 | ) | | | (0.10 | ) | | | (0.16 | ) |
| | | | |
Redemption feesd | | | — | | | | — | | | | — | | | | — | | | | — | |
| | | | |
Net asset value, end of year | | | $9.20 | | | | $10.19 | | | | $10.50 | | | | $9.42 | | | | $11.30 | |
| | | | |
| | | | | |
Total returne | | | (8.39)% | | | | (0.92)% | | | | 13.16% | | | | (15.86)% | | | | 17.58% | |
| | | | | |
| Ratios to average net assets | | | | | | | | | | | | | | | | | | | | |
| | | | | |
Expenses | | | 1.61% | f | | | 1.60% | | | | 1.60% | | | | 1.65% | | | | 1.74% | g |
| | | | | |
Net investment income | | | 1.26% | c | | | 1.00% | | | | 1.68% | | | | 1.32% | | | | 0.62% | |
| | | | | |
| Supplemental data | | | | | | | | | | | | | | | | | | | | |
| | | | | |
Net assets, end of year (000’s) | | | $250,813 | | | | $274,683 | | | | $291,638 | | | | $295,223 | | | | $392,546 | |
| | | | | |
Portfolio turnover rate | | | 82.87% | | | | 44.59% | | | | 24.45% | | | | 14.90% | | | | 24.41% | |
aThe amount shown for a share outstanding throughout the period may not correlate with the Statement of Operations for the period due to the timing of sales and repurchases of the Fund shares in relation to income earned and/or fluctuating fair value of the investments of the Fund.
bBased on average daily shares outstanding.
cNet investment income per share includes approximately $0.04 per share received in the form of special dividends. Excluding these amounts, the ratio of net investment income to average net assets would have been 0.86%.
dAmount rounds to less than $0.01 per share.
eTotal return does not include fees, charges or expenses imposed by the variable annuity and life insurance contracts for which the Franklin Templeton Variable Insurance Products Trust serves as an underlying investment vehicle.
fBenefit of waiver and payments by affiliates rounds to less than 0.01%.
gBenefit of expense reduction rounds to less than 0.01%.
| | | | | | |
| | TD-8 | | | Annual Report | The accompanying notes are an integral part of these financial statements. | | |
FRANKLIN TEMPLETON VARIABLE INSURANCE PRODUCTS TRUST
FINANCIAL HIGHLIGHTS
Templeton Developing Markets VIP Fund (continued)
| | | | | | | | | | | | | | | | | | | | |
| | | Year Ended December 31, | |
| | | 2014 | | | 2013 | | | 2012 | | | 2011 | | | 2010 | |
| Class 4 | | | | | | | | | | | | | | | | | | | | |
Per share operating performance
(for a share outstanding throughout the year) | | | | | | | | | | | | | | | | | | | | |
| | | | | |
Net asset value, beginning of year | | | $10.20 | | | | $10.50 | | | | $9.42 | | | | $11.30 | | | | $9.80 | |
| | | | |
| | | | | |
| Income from investment operationsa: | | | | | | | | | | | | | | | | | | | | |
| | | | | |
Net investment incomeb | | | 0.12 | c | | | 0.10 | | | | 0.16 | | | | 0.13 | | | | 0.05 | |
| | | | | |
Net realized and unrealized gains (losses) | | | (0.97 | ) | | | (0.21 | ) | | | 1.04 | | | | (1.91 | ) | | | 1.61 | |
| | | | |
Total from investment operations | | | (0.85 | ) | | | (0.11 | ) | | | 1.20 | | | | (1.78 | ) | | | 1.66 | |
| | | | |
Less distributions from net investment income | | | (0.13 | ) | | | (0.19 | ) | | | (0.12 | ) | | | (0.10 | ) | | | (0.16 | ) |
| | | | |
Redemption feesd | | | — | | | | — | | | | — | | | | — | | | | — | |
| | | | |
Net asset value, end of year | | | $9.22 | | | | $10.20 | | | | $10.50 | | | | $9.42 | | | | $11.30 | |
| | | | |
| | | | | |
Total returne | | | (8.48)% | | | | (1.07)% | | | | 13.06% | | | | (15.88)% | | | | 17.41% | |
| | | | | |
| Ratios to average net assets | | | | | | | | | | | | | | | | | | | | |
| | | | | |
Expenses | | | 1.71% | f | | | 1.70% | | | | 1.70% | | | | 1.75% | | | | 1.84% | g |
| | | | | |
Net investment income | | | 1.16% | c | | | 0.90% | | | | 1.58% | | | | 1.22% | | | | 0.52% | |
| | | | | |
| Supplemental data | | | | | | | | | | | | | | | | | | | | |
| | | | | |
Net assets, end of year (000’s) | | | $11,106 | | | | $15,225 | | | | $23,341 | | | | $24,380 | | | | $37,198 | |
| | | | | |
Portfolio turnover rate | | | 82.87% | | | | 44.59% | | | | 24.45% | | | | 14.90% | | | | 24.41% | |
aThe amount shown for a share outstanding throughout the period may not correlate with the Statement of Operations for the period due to the timing of sales and repurchases of the Fund shares in relation to income earned and/or fluctuating fair value of the investments of the Fund.
bBased on average daily shares outstanding.
cNet investment income per share includes approximately $0.04 per share received in the form of special dividends. Excluding these amounts, the ratio of net investment income to average net assets would have been 0.76%.
dAmount rounds to less than $0.01 per share.
eTotal return does not include fees, charges or expenses imposed by the variable annuity and life insurance contracts for which Franklin Templeton Variable Insurance Products Trust serves as an underlying investment vehicle.
fBenefit of waiver and payments by affiliates rounds to less than 0.01%.
gBenefit of expense reduction rounds to less than 0.01%.
| | | | | | |
| | | The accompanying notes are an integral part of these financial statements. | Annual Report | | | TD-9 | |
FRANKLIN TEMPLETON VARIABLE INSURANCE PRODUCTS TRUST
Statement of Investments, December 31, 2014
| | | | | | | | | | | | | | |
| Templeton Developing Markets VIP Fund | | | | |
| | | | | Industry | | | Shares | | | Value | |
| | Common Stocks 88.1% | | | | | | | | | | | | |
| | Argentina 0.2% | | | | | | | | | | | | |
| a | | Grupo Clarin SA, B, GDR, Reg S | | | Media | | | | 70,355 | | | $ | 668,373 | |
| | | | | | | | | | | | | | |
| | Austria 0.2% | | | | | | | | | | | | |
| | OMV AG | | | Oil, Gas & Consumable Fuels | | | | 21,610 | | | | 575,520 | |
| | | | | | | | | | | | | | |
| | Belgium 3.6% | | | | | | | | | | | | |
| | Anheuser-Busch InBev NV | | | Beverages | | | | 120,577 | | | | 13,694,002 | |
| | | | | | | | | | | | | | |
| | Brazil 5.5% | | | | | | | | | | | | |
| | Itau Unibanco Holding SA, ADR | | | Banks | | | | 1,090,710 | | | | 14,190,137 | |
| | M Dias Branco SA | | | Food Products | | | | 115,900 | | | | 3,968,730 | |
| | Souza Cruz SA | | | Tobacco | | | | 369,828 | | | | 2,688,646 | |
| | | | | | | | | | | | | | |
| | | | | | | | | | | | | 20,847,513 | |
| | | | | | | | | | | | | | |
| | Chile 0.6% | | | | | | | | | | | | |
| | Sociedad Quimica Y Minera de Chile SA Soquimich, ADR | | | Chemicals | | | | 94,287 | | | | 2,251,574 | |
| | | | | | | | | | | | | | |
| | China 20.4% | | | | | | | | | | | | |
| b | | Aluminum Corp. of China Ltd., H | | | Metals & Mining | | | | 3,864,400 | | | | 1,779,210 | |
| b,c | | BAIC Motor Corp. Ltd., 144A | | | Automobiles | | | | 1,325,500 | | | | 1,529,959 | |
| | Brilliance China Automotive Holdings Ltd. | | | Automobiles | | | | 9,805,700 | | | | 15,681,128 | |
| | China Construction Bank Corp., H | | | Banks | | | | 13,887,300 | | | | 11,372,830 | |
| | China Life Insurance Co. Ltd., H | | | Insurance | | | | 1,543,000 | | | | 6,029,559 | |
| | China Mobile Ltd. | | | Wireless Telecommunication Services | | | | 440,000 | | | | 5,146,796 | |
| | China Petroleum and Chemical Corp., H | | | Oil, Gas & Consumable Fuels | | | | 7,360,000 | | | | 5,932,460 | |
| b | | China Shipping Development Co. Ltd., H | | | Marine | | | | 7,704,500 | | | | 5,276,136 | |
| | Industrial and Commercial Bank of China Ltd., H | | | Banks | | | | 7,018,300 | | | | 5,123,012 | |
| | NetEase Inc., ADR | | | Internet Software & Services | | | | 31,003 | | | | 3,073,637 | |
| | PetroChina Co. Ltd., H | | | Oil, Gas & Consumable Fuels | | | | 6,970,600 | | | | 7,713,197 | |
| | Tencent Holdings Ltd. | | | Internet Software & Services | | | | 250,000 | | | | 3,627,184 | |
| | Yanzhou Coal Mining Co. Ltd., H | | | Oil, Gas & Consumable Fuels | | | | 5,152,200 | | | | 4,372,156 | |
| | | | | | | | | | | | | | |
| | | | | | | | | | | | | 76,657,264 | |
| | | | | | | | | | | | | | |
| | Greece 0.3% | | | | | | | | | | | | |
| b | | National Bank of Greece SA | | | Banks | | | | 647,599 | | | | 1,151,884 | |
| | | | | | | | | | | | | | |
| | Hong Kong 0.7% | | | | | | | | | | | | |
| | Dairy Farm International Holdings Ltd. | | | Food & Staples Retailing | | | | 187,433 | | | | 1,686,897 | |
| | Giordano International Ltd. | | | Specialty Retail | | | | 315,900 | | | | 140,555 | |
| | MGM China Holdings Ltd. | | | Hotels, Restaurants & Leisure | | | | 326,400 | | | | 830,107 | |
| | | | | | | | | | | | | | |
| | | | | | | | | | | | | 2,657,559 | |
| | | | | | | | | | | | | | |
| | India 10.9% | | | | | | | | | | | | |
| | Biocon Ltd. | | | Biotechnology | | | | 545,046 | | | | 3,679,612 | |
| | Dr. Reddy’s Laboratories Ltd. | | | Pharmaceuticals | | | | 68,010 | | | | 3,502,404 | |
| | Infosys Ltd. | | | IT Services | | | | 130,000 | | | | 4,068,081 | |
| | Reliance Industries Ltd. | | | Oil, Gas & Consumable Fuels | | | | 138,200 | | | | 1,953,786 | |
| | Tata Consultancy Services Ltd. | | | IT Services | | | | 438,340 | | | | 17,789,852 | |
| | Tata Motors Ltd. | | | Automobiles | | | | 1,285,800 | | | | 10,108,324 | |
| | | | | | | | | | | | | | |
| | | | | | | | | | | | | 41,102,059 | |
| | | | | | | | | | | | | | |
| | Indonesia 3.4% | | | | | | | | | | | | |
| | Astra International Tbk PT | | | Automobiles | | | | 12,653,700 | | | | 7,586,090 | |
| | Bank Danamon Indonesia Tbk PT | | | Banks | | | | 4,004,800 | | | | 1,463,199 | |
| | Semen Indonesia (Persero) Tbk PT | | | Construction Materials | | | | 3,016,000 | | | | 3,945,030 | |
| | | | | | | | | | | | | | |
| | | | | | | | | | | | | 12,994,319 | |
| | | | | | | | | | | | | | |
FRANKLIN TEMPLETON VARIABLE INSURANCE PRODUCTS TRUST
STATEMENT OF INVESTMENTS
Templeton Developing Markets VIP Fund (continued)
| | | | | | | | | | | | | | |
| | | | | Industry | | | Shares | | | Value | |
| | Common Stocks (continued) | | | | | | | | | | | | |
| | Kenya 0.7% | | | | | | | | | | | | |
| | Equity Bank Ltd. | | | Banks | | | | 937,377 | | | $ | 517,602 | |
| | Kenya Commercial Bank Ltd. | | | Banks | | | | 3,217,000 | | | | 2,007,294 | |
| | | | | | | | | | | | | | |
| | | | | | | | | | | | | 2,524,896 | |
| | | | | | | | | | | | | | |
| | Pakistan 0.7% | | | | | | | | | | | | |
| | United Bank Ltd. | | | Banks | | | | 1,465,400 | | | | 2,540,317 | |
| | | | | | | | | | | | | | |
| | Peru 0.4% | | | | | | | | | | | | |
| | Compania de Minas Buenaventura SA, ADR | | | Metals & Mining | | | | 153,850 | | | | 1,470,806 | |
| | | | | | | | | | | | | | |
| | Philippines 2.3% | | | | | | | | | | | | |
| | Ayala Corp. | | | Diversified Financial Services | | | | 252,530 | | | | 3,913,270 | |
| b | | Bloomberry Resorts Corp. | | | Hotels, Restaurants & Leisure | | | | 13,485,300 | | | | 3,733,789 | |
| b | | Melco Crown Philippines Resorts Corp. | | | Hotels, Restaurants & Leisure | | | | 3,445,200 | | | | 1,044,676 | |
| | | | | | | | | | | | | | |
| | | | | | | | | | | | | 8,691,735 | |
| | | | | | | | | | | | | | |
| | Qatar 2.1% | | | | | | | | | | | | |
| | Industries Qatar QSC | | | Industrial Conglomerates | | | | 170,907 | | | | 7,884,333 | |
| | | | | | | | | | | | | | |
| | South Africa 11.5% | | | | | | | | | | | | |
| | Kumba Iron Ore Ltd. | | | Metals & Mining | | | | 30,769 | | | | 638,288 | |
| | MTN Group Ltd. | | | Wireless Telecommunication Services | | | | 373,611 | | | | 7,153,030 | |
| | Naspers Ltd., N | | | Media | | | | 121,196 | | | | 15,878,463 | |
| | Remgro Ltd. | | | Diversified Financial Services | | | | 857,524 | | | | 18,833,717 | |
| | Truworths International Ltd. | | | Specialty Retail | | | | 139,837 | | | | 934,463 | |
| | | | | | | | | | | | | | |
| | | | | | | | | | | | | 43,437,961 | |
| | | | | | | | | | | | | | |
| | South Korea 2.9% | | | | | | | | | | | | |
| | Hyundai Development Co. | | | Construction & Engineering | | | | 86,880 | | | | 3,074,035 | |
| | Samsung Electronics Co. Ltd. | | | Technology Hardware, Storage & Peripherals | | | | 3,498 | | | | 4,243,935 | |
| | SK Innovation Co. Ltd. | | | Oil, Gas & Consumable Fuels | | | | 46,511 | | | | 3,618,788 | |
| | | | | | | | | | | | | | |
| | | | | | | | | | | | | 10,936,758 | |
| | | | | | | | | | | | | | |
| | Switzerland 0.5% | | | | | | | | | | | | |
| | Compagnie Financiere Richemont SA | | | Textiles, Apparel & Luxury Goods | | | | 21,519 | | | | 1,922,035 | |
| | | | | | | | | | | | | | |
| | Taiwan 3.1% | | | | | | | | | | | | |
| | Taiwan Semiconductor Manufacturing Co. Ltd. | | | Semiconductors & Semiconductor Equipment | | | | 2,654,000 | | | | 11,823,134 | |
| | | | | | | | | | | | | | |
| | Thailand 10.9% | | | | | | | | | | | | |
| | Kasikornbank PCL, fgn. | | | Banks | | | | 619,000 | | | | 4,311,162 | |
| | Land and Houses PCL, fgn. | | | Real Estate Management & Development | | | | 16,698,900 | | | | 4,596,260 | |
| | PTT Exploration and Production PCL, fgn. | | | Oil, Gas & Consumable Fuels | | | | 642,000 | | | | 2,186,861 | |
| | PTT PCL, fgn. | | | Oil, Gas & Consumable Fuels | | | | 593,300 | | | | 5,846,387 | |
| | Quality Houses PCL, fgn. | | | Real Estate Management & Development | | | | 5,037,800 | | | | 560,777 | |
| | Siam Commercial Bank PCL, fgn. | | | Banks | | | | 2,869,800 | | | | 15,885,146 | |
| | Thai Beverage PCL, fgn. | | | Beverages | | | | 14,863,200 | | | | 7,741,250 | |
| | | | | | | | | | | | | | |
| | | | | | | | | | | | | 41,127,843 | |
| | | | | | | | | | | | | | |
| | Turkey 1.7% | | | | | | | | | | | | |
| | Akbank TAS | | | Banks | | | | 1,089,000 | | | | 4,041,111 | |
| | Tupras-Turkiye Petrol Rafinerileri AS | | | Oil, Gas & Consumable Fuels | | | | 91,900 | | | | 2,177,688 | |
| | | | | | | | | | | | | | |
| | | | | | | | | | | | | 6,218,799 | |
| | | | | | | | | | | | | | |
| | United Arab Emirates 0.5% | | | | | | | | | | | | |
| | Emaar Properties PJSC | | | Real Estate Management & Development | | | | 943,742 | | | | 1,865,362 | |
| | | | | | | | | | | | | | |
FRANKLIN TEMPLETON VARIABLE INSURANCE PRODUCTS TRUST
STATEMENT OF INVESTMENTS
Templeton Developing Markets VIP Fund (continued)
| | | | | | | | | | | | | | |
| | | | | Industry | | | Shares | | | Value | |
| | Common Stocks (continued) | | | | | | | | | | | | |
| | United Kingdom 3.5% | | | | | | | | | | | | |
| | Unilever PLC | | | Food Products | | | | 318,597 | | | $ | 13,050,572 | |
| | | | | | | | | | | | | | |
| | United States 1.5% | | | | | | | | | | | | |
| | Avon Products Inc. | | | Personal Products | | | | 582,973 | | | | 5,474,116 | |
| | | | | | | | | | | | | | |
| | | | |
| | Total Common Stocks
(Cost $295,275,017) | | | | | | | | | | | 331,568,734 | |
| | | | | | | | | | | | | | |
| d | | Participatory Notes 1.1% | | | | | | | | | | | | |
| | Saudi Arabia 1.1% | | | | | | | | | | | | |
| c | | Deutsche Bank AG/London, | | | | | | | | | | | | |
| | Etihad Etisalat Co., 144A, 9/27/16 | | | Wireless Telecommunication Services | | | | 66,819 | | | | 787,059 | |
| | Saudi Basic Industries Corp., 144A, 9/27/16 | | | Chemicals | | | | 103,105 | | | | 2,308,044 | |
| c | | HSBC Bank PLC, Etihad Etisalat Co., 144A, 11/20/17 | | | Wireless Telecommunication Services | | | | 102,495 | | | | 1,207,286 | |
| | | | | | | | | | | | | | |
| | | | |
| | Total Participatory Notes
(Cost $4,985,543) | | | | | | | | | | | 4,302,389 | |
| | | | | | | | | | | | | | |
| | Preferred Stocks 3.0% | | | | | | | | | | | | |
| | Brazil 2.5% | | | | | | | | | | | | |
| | Petroleo Brasileiro SA, ADR, pfd. | | | Oil, Gas & Consumable Fuels | | | | 572,800 | | | | 4,341,824 | |
| | Vale SA, ADR, pfd., A | | | Metals & Mining | | | | 675,050 | | | | 4,900,863 | |
| | | | | | | | | | | | | | |
| | | | | | | | | | | | | 9,242,687 | |
| | | | | | | | | | | | | | |
| | Chile 0.5% | | | | | | | | | | | | |
| | Embotelladora Andina SA, pfd., A | | | Beverages | | | | 818,017 | | | | 1,984,052 | |
| | | | | | | | | | | | | | |
| | | | |
| | Total Preferred Stocks
(Cost $19,598,511) | | | | | | | | | | | 11,226,739 | |
| | | | | | | | | | | | | | |
| | | | |
| | Total Investments before Short Term Investments (Cost $319,859,071) | | | | | | | | | | | 347,097,862 | |
| | | | | | | | | | | | | | |
| | Short Term Investments
(Cost $29,018,398) 7.7% | | | | | | | | | | | | |
| | Money Market Funds 7.7% | | | | | | | | | | | | |
| | United States 7.7% | | | | | | | | | | | | |
| b,e | | Institutional Fiduciary Trust Money Market Portfolio | | | | | | | 29,018,398 | | | | 29,018,398 | |
| | | | | | | | | | | | | | |
| | Total Investments
(Cost $348,877,469) 99.9% | | | | | | | | | | | 376,116,260 | |
| | Other Assets, less Liabilities 0.1% | | | | | | | | | | | 289,349 | |
| | | | | | | | | | | | | | |
| | Net Assets 100.0% | | | | | | | | | | $ | 376,405,609 | |
| | | | | | | | | | | | | | |
See Abbreviations on page TD-24.
aSecurity was purchased pursuant to Regulation S under the Securities Act of 1933, which exempts from registration securities offered and sold outside of the United States. Such a security cannot be sold in the United States without either an effective registration statement filed pursuant to the Securities Act of 1933, or pursuant to an exemption from registration. This security has been deemed liquid under guidelines approved by the Trust’s Board of Trustees.
bNon-income producing.
cSecurity was purchased pursuant to Rule 144A under the Securities Act of 1933 and may be sold in transactions exempt from registration only to qualified institutional buyers or in a public offering registered under the Securities Act of 1933. These securities have been deemed liquid under guidelines approved by the Trust’s Board of Trustees. At December 31, 2014, the aggregate value of these securities was $5,832,348, representing 1.55% of net assets.
dSee Note 1(c) regarding Participatory Notes.
eSee Note 3(e) regarding investments in Institutional Fiduciary Trust Money Market Portfolio.
| | | | | | |
| | TD-12 | | | Annual Report | The accompanying notes are an integral part of these financial statements. | | |
FRANKLIN TEMPLETON VARIABLE INSURANCE PRODUCTS TRUST
Financial Statements
Statement of Assets and Liabilities
December 31, 2014
| | | | |
| | | Templeton
Developing Markets
VIP Fund | |
Assets: | | | | |
Investments in securities: | | | | |
Cost - Unaffiliated issuers | | $ | 319,859,071 | |
Cost - Sweep Money Fund (Note 3e) | | | 29,018,398 | |
| | | | |
Total cost of investments | | $ | 348,877,469 | |
| | | | |
Value - Unaffiliated issuers | | $ | 347,097,862 | |
Value - Sweep Money Fund (Note 3e) | | | 29,018,398 | |
| | | | |
Total value of investments | | | 376,116,260 | |
Receivables: | | | | |
Investment securities sold | | | 1,217,085 | |
Capital shares sold | | | 223,222 | |
Dividends | | | 222,166 | |
Foreign tax | | | 24,667 | |
Other assets | | | 39 | |
| | | | |
Total assets | | | 377,803,439 | |
| | | | |
Liabilities: | | | | |
Payables: | | | | |
Investment securities purchased | | | 441,229 | |
Capital shares redeemed | | | 115,178 | |
Management fees | | | 394,346 | |
Distribution fees | | | 113,662 | |
Custodian fees | | | 72,176 | |
Reports to shareholders | | | 175,890 | |
Deferred tax | | | 29,402 | |
Accrued expenses and other liabilities | | | 55,947 | |
| | | | |
Total liabilities | | | 1,397,830 | |
| | | | |
Net assets, at value | | $ | 376,405,609 | |
| | | | |
Net assets consist of: | | | | |
Paid-in capital | | $ | 311,018,669 | |
Distributions in excess of net investment income | | | (531,967 | ) |
Net unrealized appreciation (depreciation) | | | 27,174,090 | |
Accumulated net realized gain (loss) | | | 38,744,817 | |
| | | | |
Net assets, at value | | $ | 376,405,609 | |
| | | | |
| | | | | | |
| | | The accompanying notes are an integral part of these financial statements. | Annual Report | | | TD-13 | |
FRANKLIN TEMPLETON VARIABLE INSURANCE PRODUCTS TRUST
FINANCIAL STATEMENTS
Statement of Assets and Liabilities (continued)
December 31, 2014
| | | | |
| | | Templeton
Developing Markets
VIP Fund | |
| |
| Class 1: | | | | |
Net assets, at value | | $ | 114,486,612 | |
| | | | |
Shares outstanding | | | 12,348,636 | |
| | | | |
Net asset value and maximum offering price per share | | $ | 9.27 | |
| | | | |
| |
| Class 2: | | | | |
Net assets, at value | | $ | 250,812,576 | |
| | | | |
Shares outstanding | | | 27,259,704 | |
| | | | |
Net asset value and maximum offering price per share | | $ | 9.20 | |
| | | | |
| |
| Class 4: | | | | |
Net assets, at value | | $ | 11,106,421 | |
| | | | |
Shares outstanding | | | 1,204,443 | |
| | | | |
Net asset value and maximum offering price per share | | $ | 9.22 | |
| | | | |
| | | | | | |
| | TD-14 | | | Annual Report | The accompanying notes are an integral part of these financial statements. | | |
FRANKLIN TEMPLETON VARIABLE INSURANCE PRODUCTS TRUST
FINANCIAL STATEMENTS
Statement of Operations
for the year ended December 31, 2014
| | | | |
| | | Templeton
Developing Markets
VIP Fund | |
Investment income: | | | | |
Dividends (net of foreign taxes of $971,948) | | $ | 12,394,221 | |
Income from securities loaned | | | 41,171 | |
| | | | |
Total investment income | | | 12,435,392 | |
| | | | |
Expenses: | | | | |
Management fees (Note 3a) | | | 5,180,805 | |
Administrative fees (Note 3b) | | | 207,590 | |
Distribution fees: (Note 3c) | | | | |
Class 2 | | | 692,996 | |
Class 3 | | | 27,045 | |
Class 4 | | | 46,875 | |
Custodian fees (Note 4) | | | 202,906 | |
Reports to shareholders | | | 219,662 | |
Professional fees | | | 74,491 | |
Trustees’ fees and expenses | | | 1,792 | |
Other | | | 28,261 | |
| | | | |
Total expenses | | | 6,682,423 | |
Expenses waived/paid by affiliates (Note 3e) | | | (15,026 | ) |
| | | | |
Net expenses | | | 6,667,397 | |
| | | | |
Net investment income | | | 5,767,995 | |
| | | | |
Realized and unrealized gains (losses): | | | | |
Net realized gain (loss) from: | | | | |
Investments | | | 66,730,564 | |
Foreign currency transactions | | | 2,076 | |
| | | | |
Net realized gain (loss) | | | 66,732,640 | |
| | | | |
Net change in unrealized appreciation (depreciation) on: | | | | |
Investments | | | (106,603,657 | ) |
Translation of other assets and liabilities denominated in foreign currencies | | | (12,588 | ) |
Change in deferred taxes on unrealized appreciation | | | (29,402 | ) |
| | | | |
Net change in unrealized appreciation (depreciation) | | | (106,645,647 | ) |
| | | | |
Net realized and unrealized gain (loss) | | | (39,913,007 | ) |
| | | | |
Net increase (decrease) in net assets resulting from operations | | $ | (34,145,012 | ) |
| | | | |
| | | | | | |
| | | The accompanying notes are an integral part of these financial statements. | Annual Report | | | TD-15 | |
FRANKLIN TEMPLETON VARIABLE INSURANCE PRODUCTS TRUST
FINANCIAL STATEMENTS
Statements of Changes in Net Assets
| | | | | | | | |
| | | Templeton
Developing Markets VIP Fund | |
| | | Year Ended December 31, | |
| | | 2014 | | | 2013 | |
Increase (decrease) in net assets: | | | | | | | | |
Operations: | | | | | | | | |
Net investment income | | $ | 5,767,995 | | | $ | 5,556,147 | |
Net realized gain (loss) from investments and foreign currency transactions | | | 66,732,640 | | | | 67,962,625 | |
Net change in unrealized appreciation (depreciation) on investments, translation of other assets and liabilities denominated in foreign currencies and deferred taxes | | | (106,645,647 | ) | | | (79,189,158 | ) |
| | | | |
Net increase (decrease) in net assets resulting from operations | | | (34,145,012 | ) | | | (5,670,386 | ) |
| | | | |
Distributions to shareholders from: | | | | | | | | |
Net investment income: | | | | | | | | |
Class 1 | | | (2,319,775 | ) | | | (3,816,779 | ) |
Class 2 | | | (4,358,800 | ) | | | (5,449,449 | ) |
Class 3 | | | — | | | | (777,644 | ) |
Class 4 | | | (173,399 | ) | | | (373,848 | ) |
| | | | |
Total distributions to shareholders | | | (6,851,974 | ) | | | (10,417,720 | ) |
| | | | |
Capital share transactions: (Note 2) | | | | | | | | |
Class 1 | | | (18,560,195 | ) | | | (52,075,044 | ) |
Class 2 | | | 2,280,393 | | | | (8,867,643 | ) |
Class 3 | | | (33,674,042 | ) | | | (12,240,084 | ) |
Class 4 | | | (2,909,339 | ) | | | (7,287,727 | ) |
| | | | |
Total capital share transactions | | | (52,863,183 | ) | | | (80,470,498 | ) |
| | | | |
Redemption fees | | | 68 | | | | 1,204 | |
| | | | |
Net increase (decrease) in net assets | | | (93,860,101 | ) | | | (96,557,400 | ) |
Net assets: | | | | | | | | |
Beginning of year | | | 470,265,710 | | | | 566,823,110 | |
| | | | |
End of year | | $ | 376,405,609 | | | $ | 470,265,710 | |
| | | | |
Distributions in excess of net investment income, end of year | | $ | (531,967 | ) | | $ | (481,395 | ) |
| | | | |
| | | | |
| TD-16 | | Annual Report | The accompanying notes are an integral part of these financial statements. | | |
FRANKLIN TEMPLETON VARIABLE INSURANCE PRODUCTS TRUST
Notes to Financial Statements
Templeton Developing Markets VIP Fund
1. Organization and Significant Accounting Policies
Franklin Templeton Variable Insurance Products Trust (Trust) is registered under the Investment Company Act of 1940, as amended, (1940 Act) as an open-end management investment company, consisting of nineteen separate funds and applies the specialized accounting and reporting guidance in U.S. Generally Accepted Accounting Principles (U.S. GAAP). Templeton Developing Markets VIP Fund (Fund) is included in this report. The financial statements of the remaining funds in the Trust are presented separately. Shares of the Fund are generally sold only to insurance company separate accounts to fund the benefits of variable life insurance policies or variable annuity contracts. The Fund offers three classes of shares: Class 1, Class 2, and Class 4. Effective May 1, 2014, all Class 3 shares were converted to Class 2. Each class of shares differs by its distribution fees, voting rights on matters affecting a single class and its exchange privilege.
Effective May 1, 2014, Templeton Developing Markets Securities Fund was renamed Templeton Developing Markets VIP Fund.
The following summarizes the Fund’s significant accounting policies.
a. Financial Instrument Valuation
The Fund’s investments in financial instruments are carried at fair value daily. Fair value is the price that would be received to sell an asset or paid to transfer a liability in an orderly transaction between market participants on the measurement date. The Fund calculates the net asset value (NAV) per share at the close of the New York Stock Exchange (NYSE), generally at 4 p.m. Eastern time (NYSE close) on each day the NYSE is open for trading. Under compliance policies and procedures approved by the Trust’s Board of Trustees (the Board), the Fund’s administrator has responsibility for oversight of valuation, including leading the cross-functional Valuation and Liquidity Oversight Committee (VLOC). The VLOC provides administration and oversight of the Fund’s valuation policies and procedures, which are approved annually by the Board. Among other things, these procedures allow the Fund to utilize independent pricing services, quotations from securities and financial instrument dealers, and other market sources to determine fair value.
Equity securities listed on an exchange or on the NASDAQ National Market System are valued at the last quoted sale price or the official closing price of the day, respectively. Foreign
equity securities are valued as of the close of trading on the foreign stock exchange on which the security is primarily traded or as of the NYSE close, whichever is earlier. The value is then converted into its U.S. dollar equivalent at the foreign exchange rate in effect at the NYSE close on the day that the value of the security is determined. Over-the-counter (OTC) securities are valued within the range of the most recent quoted bid and ask prices. Securities that trade in multiple markets or on multiple exchanges are valued according to the broadest and most representative market. Certain equity securities are valued based upon fundamental characteristics or relationships to similar securities. Investments in open-end mutual funds are valued at the closing NAV.
The Fund has procedures to determine the fair value of financial instruments for which market prices are not reliable or readily available. Under these procedures, the VLOC convenes on a regular basis to review such financial instruments and considers a number of factors, including significant unobservable valuation inputs, when arriving at fair value. The VLOC primarily employs a market-based approach which may use related or comparable assets or liabilities, recent transactions, market multiples, book values, and other relevant information for the investment to determine the fair value of the investment. An income-based valuation approach may also be used in which the anticipated future cash flows of the investment are discounted to calculate fair value. Discounts may also be applied due to the nature or duration of any restrictions on the disposition of the investments. Due to the inherent uncertainty of valuations of such investments, the fair values may differ significantly from the values that would have been used had an active market existed. The VLOC employs various methods for calibrating these valuation approaches including a regular review of key inputs and assumptions, transactional back-testing or disposition analysis, and reviews of any related market activity.
Trading in securities on foreign securities stock exchanges and OTC markets may be completed before the daily NYSE close. In addition, trading in certain foreign markets may not take place on every NYSE business day. Occasionally, events occur between the time at which trading in a foreign security is completed and the close of the NYSE that might call into question the reliability of the value of a portfolio security held by the Fund. As a result, differences may arise between the value of the Fund’s portfolio securities as determined at the foreign market close and the latest indications of value at the close of the NYSE. In order to minimize the potential for these
FRANKLIN TEMPLETON VARIABLE INSURANCE PRODUCTS TRUST
NOTES TO FINANCIAL STATEMENTS
Templeton Developing Markets VIP Fund (continued)
1. Organization and Significant Accounting Policies (continued)
a. Financial Instrument Valuation (continued)
differences, the VLOC monitors price movements following the close of trading in foreign stock markets through a series of country specific market proxies (such as baskets of American Depositary Receipts, futures contracts and exchange traded funds). These price movements are measured against established trigger thresholds for each specific market proxy to assist in determining if an event has occurred that may call into question the reliability of the values of the foreign securities held by the Fund. If such an event occurs, the securities may be valued using fair value procedures, which may include the use of independent pricing services.
Also, when the last day of the reporting period is a non-business day, certain foreign markets may be open on those days that the NYSE is closed, which could result in differences between the value of the Fund’s portfolio securities on the last business day and the last calendar day of the reporting period. Any significant security valuation changes due to an open foreign market are adjusted and reflected by the Fund for financial reporting purposes.
b. Foreign Currency Translation
Portfolio securities and other assets and liabilities denominated in foreign currencies are translated into U.S. dollars based on the exchange rate of such currencies against U.S. dollars on the date of valuation. The Fund may enter into foreign currency exchange contracts to facilitate transactions denominated in a foreign currency. Purchases and sales of securities, income and expense items denominated in foreign currencies are translated into U.S. dollars at the exchange rate in effect on the transaction date. Portfolio securities and assets and liabilities denominated in foreign currencies contain risks that those currencies will decline in value relative to the U.S. dollar. Occasionally, events may impact the availability or reliability of foreign exchange rates used to convert the U.S. dollar equivalent value. If such an event occurs, the foreign exchange rate will be valued at fair value using procedures established and approved by the Board.
The Fund does not separately report the effect of changes in foreign exchange rates from changes in market prices on securities held. Such changes are included in net realized and unrealized gain or loss from investments on the Statement of Operations.
Realized foreign exchange gains or losses arise from sales of foreign currencies, currency gains or losses realized between the trade and settlement dates on securities transactions and the difference between the recorded amounts of dividends, interest, and foreign withholding taxes and the U.S. dollar equivalent of the amounts actually received or paid. Net unrealized foreign exchange gains and losses arise from changes in foreign exchange rates on foreign denominated assets and liabilities other than investments in securities held at the end of the reporting period.
c. Participatory Notes
The Fund invests in Participatory Notes (P-Notes). P-notes are promissory notes that are designed to offer a return linked to the performance of a particular underlying equity security or market. P-Notes are issued by banks or broker-dealers and allow the fund to gain exposure to common stocks in markets where direct investment is not allowed. Income received from P-Notes is recorded as dividend income in the Statement of Operations. P-Notes may contain various risks including the potential inability of the counterparty to fulfill their obligations under the terms of the contract. These securities may be more volatile and less liquid than other investments held by the Fund.
d. Securities Lending
The Fund participates in an agency based securities lending program. The Fund receives cash collateral against the loaned securities in an amount equal to at least 102% of the fair value of the loaned securities. Collateral is maintained over the life of the loan in an amount not less than 100% of the fair value of loaned securities, as determined at the close of fund business each day; any additional collateral required due to changes in security values is delivered to the Fund on the next business day. The collateral is invested in a non-registered money fund. The Fund receives income from the investment of cash collateral, in addition to lending fees and rebates paid by the borrower. The Fund bears the market risk with respect to the collateral investment, securities loaned, and the risk that the agent may default on its obligations to the Fund. The securities lending agent has agreed to indemnify the Fund in the event of default by a third party borrower. At December 31, 2014, the Fund had no securities on loan.
e. Income and Deferred Taxes
It is the Fund’s policy to qualify as a regulated investment company under the Internal Revenue Code. The Fund intends to distribute to shareholders substantially all of its taxable income
FRANKLIN TEMPLETON VARIABLE INSURANCE PRODUCTS TRUST
NOTES TO FINANCIAL STATEMENTS
Templeton Developing Markets VIP Fund (continued)
and net realized gains to relieve it from federal income and if applicable, excise taxes. As a result, no provision for U.S. federal income taxes is required.
The Fund may be subject to foreign taxation related to income received, capital gains on the sale of securities and certain foreign currency transactions in the foreign jurisdictions in which it invests. Foreign taxes, if any, are recorded based on the tax regulations and rates that exist in the foreign markets in which the Fund invests. When a capital gain tax is determined to apply the Fund records an estimated deferred tax liability in an amount that would be payable if the securities were disposed of on the valuation date.
The Fund recognizes the tax benefits of uncertain tax positions only when the position is “more likely than not” to be sustained upon examination by the tax authorities based on the technical merits of the tax position. As of December 31, 2014, and for all open tax years, the Fund has determined that no liability for unrecognized tax benefits is required in the Fund’s financial statements related to uncertain tax positions taken on a tax return (or expected to be taken on future tax returns). Open tax years are those that remain subject to examination and are based on each tax jurisdiction statute of limitation.
f. Security Transactions, Investment Income, Expenses and Distributions
Security transactions are accounted for on trade date. Realized gains and losses on security transactions are determined on a specific identification basis. Estimated expenses are accrued daily. Dividend income is recorded on the ex-dividend date except for certain foreign securities where the dividend rate is not available. In such cases, the dividend is recorded as soon as the information is received by the Fund. Distributions to shareholders are recorded on the ex-dividend date and are determined according to income tax regulations (tax basis). Distributable earnings determined on a tax basis may differ from earnings recorded in accordance with U.S. GAAP. These differences may be permanent or temporary. Permanent differences are reclassified among capital accounts to reflect their tax character. These reclassifications have no impact on net assets or the results of operations. Temporary differences are not reclassified, as they may reverse in subsequent periods.
Common expenses incurred by the Trust are allocated among the funds based on the ratio of net assets of each fund to the combined net assets of the Trust. Fund specific expenses are
charged directly to the fund that incurred the expense.
Realized and unrealized gains and losses and net investment income, not including class specific expenses, are allocated daily to each class of shares based upon the relative proportion of net assets of each class. Differences in per share distributions, by class, are generally due to differences in class specific expenses.
g. Accounting Estimates
The preparation of financial statements in accordance with U.S. GAAP requires management to make estimates and assumptions that affect the reported amounts of assets and liabilities at the date of the financial statements and the amounts of income and expenses during the reporting period. Actual results could differ from those estimates.
h. Redemption Fees
Redemptions and exchanges of interests in an insurance company subaccount that invests in Class 3 shares of the Fund were subject to a 1.0% short term trading fee if the interest in the subaccount had been held for less than 60 days. Such fees were retained by the Fund and accounted for as an addition to paid-in capital, allocated to each class of shares based upon the relative proportion of net assets of each class.
i. Guarantees and Indemnifications
Under the Trust’s organizational documents, its officers and trustees are indemnified by the Trust against certain liabilities arising out of the performance of their duties to the Trust. Additionally, in the normal course of business, the Trust, on behalf of the Fund, enters into contracts with service providers that contain general indemnification clauses. The Trust’s maximum exposure under these arrangements is unknown as this would involve future claims that may be made against the Trust that have not yet occurred. Currently, the Trust expects the risk of loss to be remote.
FRANKLIN TEMPLETON VARIABLE INSURANCE PRODUCTS TRUST
NOTES TO FINANCIAL STATEMENTS
Templeton Developing Markets VIP Fund (continued)
2. Shares of Beneficial Interest
At December 31, 2014, there were an unlimited number of shares authorized (without par value). Transactions in the Fund’s shares were as follows:
| | | | | | | | | | | | | | | | | | |
| | | Year Ended December 31, | |
| | | 2014 | | | | | 2013 | |
| | | Shares | | | Amount | | | | | Shares | | | Amount | |
| | | | | |
| Class 1 Shares: | | | | | | | | | | | | | | | | | | |
Shares sold | | | 1,624,952 | | | $ | 16,226,245 | | | | | | 1,118,729 | | | $ | 11,636,774 | |
Shares issued in reinvestment of distributions | | | 229,681 | | | | 2,319,775 | | | | | | 392,673 | | | | 3,816,779 | |
Shares redeemed | | | (3,701,849 | ) | | | (37,106,215 | ) | | | | | (6,552,381 | ) | | | (67,528,597 | ) |
| | | | |
Net increase (decrease) | | | (1,847,216 | ) | | $ | (18,560,195 | ) | | | | | (5,040,979 | ) | | $ | (52,075,044 | ) |
| | | | |
| Class 2 Shares: | | | | | | | | | | | | | | | | | | |
Shares sold | | | 7,755,421 | | | $ | 76,467,757 | | | | | | 5,110,513 | | | $ | 51,867,557 | |
Shares issued in reinvestment of distributions | | | 434,143 | | | | 4,358,800 | | | | | | 564,125 | | | | 5,449,449 | |
Shares redeemed | | | (7,896,683 | ) | | | (78,546,164 | ) | | | | | (6,483,017 | ) | | | (66,184,649 | ) |
| | | | |
Net increase (decrease) | | | 292,881 | | | $ | 2,280,393 | | | | | | (808,379 | ) | | $ | (8,867,643 | ) |
| | | | |
| Class 3 Sharesa: | | | | | | | | | | | | | | | | | | |
Shares sold | | | 171,371 | | | $ | 1,697,483 | | | | | | 410,783 | | | $ | 4,328,836 | |
Shares issued in reinvestment of distributions | | | — | | | | — | | | | | | 81,005 | | | | 777,644 | |
Shares redeemed | | | (3,593,907 | ) | | | (35,371,525 | ) | | | | | (1,696,602 | ) | | | (17,346,564 | ) |
| | | | |
Net increase (decrease) | | | (3,422,536 | ) | | $ | (33,674,042 | ) | | | | | (1,204,814 | ) | | $ | (12,240,084 | ) |
| | | | |
| Class 4 Shares: | | | | | | | | | | | | | | | | | | |
Shares sold | | | 89,395 | | | $ | 875,146 | | | | | | 206,201 | | | $ | 2,099,934 | |
Shares issued on reinvestment of distributions | | | 17,219 | | | | 173,399 | | | | | | 38,661 | | | | 373,848 | |
Shares redeemed | | | (395,412 | ) | | | (3,957,884 | ) | | | | | (973,500 | ) | | | (9,761,509 | ) |
| | | | |
Net increase (decrease) | | | (288,798 | ) | | $ | (2,909,339 | ) | | | | | (728,638 | ) | | $ | (7,287,727 | ) |
| | | | |
aEffective May 1, 2014, all Class 3 shares were converted to Class 2.
3. Transactions With Affiliates
Franklin Resources, Inc. is the holding company for various subsidiaries that together are referred to as Franklin Templeton Investments. Certain officers and trustees of the Fund are also officers and/or trustees of the following subsidiaries:
| | |
| Subsidiary | | Affiliation |
Templeton Asset Management Ltd. (TAML) | | Investment manager |
Franklin Templeton Services, LLC (FT Services) | | Administrative manager |
Franklin Templeton Distributors, Inc. (Distributors) | | Principal underwriter |
Franklin Templeton Investor Services, LLC (Investor Services) | | Transfer agent |
FRANKLIN TEMPLETON VARIABLE INSURANCE PRODUCTS TRUST
NOTES TO FINANCIAL STATEMENTS
Templeton Developing Markets VIP Fund (continued)
a. Management Fees
The Fund pays an investment management fee to TAML based on the average daily net assets of the Fund as follows:
| | |
| Annualized Fee Rate | | Net Assets |
1.250% | | Up to and including $200 million |
1.235% | | Over $200 million, up to and including $700 million |
1.200% | | Over $700 million, up to and including $1 billion |
1.150% | | Over $1 billion, up to and including $1.2 billion |
1.125% | | Over $1.2 billion, up to and including $5 billion |
1.075% | | Over $5 billion, up to and including $10 billion |
1.025% | | Over $10 billion, up to and including $15 billion |
0.975% | | Over $15 billion, up to and including $20 billion |
0.925% | | In excess of $20 billion |
Effective May 1, 2014, the Fund combined its investment management and administration agreements as approved by the Board. The fees paid under the combined agreement do not exceed the aggregate fees that were paid under the separate agreements.
Prior to May 1, 2014, the Fund paid fees to TAML based on the average daily net assets of the Fund as follows:
| | |
| Annualized Fee Rate | | Net Assets |
1.100% | | Up to and including $1 billion |
1.050% | | Over $1 billion, up to and including $5 billion |
1.000% | | Over $5 billion, up to and including $10 billion |
0.950% | | Over $10 billion, up to and including $15 billion |
0.900% | | Over $15 billion, up to and including $20 billion |
0.850% | | In excess of $20 billion |
b. Administrative Fees
Effective May 1, 2014, under an agreement with TAML, FT Services provides administrative services to the Fund. The fee is paid by TAML based on the Fund’s average daily net assets, and is not an additional expense of the Fund.
Prior to May 1, 2014, the Fund paid administrative fees to FT Services based on the average daily net assets of the Fund as follows:
| | |
| Annualized Fee Rate | | Net Assets |
0.150% | | Up to and including $200 million |
0.135% | | Over $200 million, up to and including $700 million |
0.100% | | Over $700 million, up to and including $1.2 billion |
0.075% | | In excess of $1.2 billion |
c. Distribution Fees
The Board has adopted distribution plans for Class 2, Class 3, and Class 4 shares pursuant to Rule 12b-1 under the 1940 Act. Under the Fund’s compensation distribution plans, the Fund pays Distributors for costs incurred in connection with the servicing, sale and distribution of the Fund’s shares up to 0.25%, 0.35%, and 0.35% per year of its average daily net assets of Class 2, Class 3, and Class 4, respectively. Some distribution fees are not charged on shares held by affiliates. The Board has agreed to limit the current rate to 0.25% per year for Class 3. The plan year, for purposes of monitoring compliance with the maximum annual plan rates, is February 1 through January 31.
FRANKLIN TEMPLETON VARIABLE INSURANCE PRODUCTS TRUST
NOTES TO FINANCIAL STATEMENTS
Templeton Developing Markets VIP Fund (continued)
3. Transactions With Affiliates (continued)
d. Transfer Agent Fees
Investor Services, under terms of an agreement, performs shareholder servicing for the Fund and is not paid by the Fund for the services.
e. Investments in Institutional Fiduciary Trust Money Market Portfolio
The Fund invests in Institutional Fiduciary Trust Money Market Portfolio (Sweep Money Fund), an affiliated open-end management investment company. Management fees paid by the Fund are waived on assets invested in the Sweep Money Fund, as noted on the Statement of Operations, in an amount not to exceed the management and administrative fees paid directly or indirectly by the Sweep Money Fund. Prior to January 1, 2014, the waiver was accounted for as a reduction to management fees.
4. Expense Offset Arrangement
The Fund has entered into an arrangement with its custodian whereby credits realized as a result of uninvested cash balances are used to reduce a portion of the Fund’s custodian expenses. During the year ended December 31, 2014, there were no credits earned.
5. Income Taxes
For tax purposes, capital losses may be carried over to offset future capital gains. Capital loss carryforwards with no expiration, if any, must be fully utilized before those losses with expiration dates.
During the year ended December 31, 2014, the Fund utilized $21,512,788 of capital loss carryforwards.
The tax character of distributions paid during the years ended December 31, 2014 and 2013, was as follows:
| | | | | | | | |
| | | 2014 | | | 2013 | |
Distributions paid from ordinary income | | $ | 6,851,974 | | | $ | 10,417,720 | |
| | | | |
At December 31, 2014, the cost of investments, net unrealized appreciation (depreciation), undistributed ordinary income and undistributed long term capital gains for income tax purposes were as follows:
| | | | |
Cost of investments | | $ | 360,855,731 | |
| | | | |
Unrealized appreciation | | $ | 43,958,141 | |
Unrealized depreciation | | | (28,697,612 | ) |
| | | | |
Net unrealized appreciation (depreciation) | | $ | 15,260,529 | |
| | | | |
Undistributed ordinary income | | $ | 7,063,937 | |
Undistributed long term capital gains | | | 43,127,174 | |
| | | | |
Distributable earnings | | $ | 50,191,111 | |
| | | | |
Differences between income and/or capital gains as determined on a book basis and a tax basis are primarily due to differing treatments of foreign currency transactions, passive foreign investment company shares, corporate actions and wash sales.
6. Investment Transactions
Purchases and sales of investments (excluding short term securities) for the year ended December 31, 2014, aggregated $342,813,364 and $413,007,437, respectively.
FRANKLIN TEMPLETON VARIABLE INSURANCE PRODUCTS TRUST
NOTES TO FINANCIAL STATEMENTS
Templeton Developing Markets VIP Fund (continued)
7. Concentration of Risk
Investing in foreign securities may include certain risks and considerations not typically associated with investing in U.S. securities, such as fluctuating currency values and changing local and regional economic, political and social conditions, which may result in greater market volatility. In addition, certain foreign securities may not be as liquid as U.S. securities.
8. Credit Facility
The Fund, together with other U.S. registered and foreign investment funds (collectively, Borrowers), managed by Franklin Templeton Investments, are borrowers in a joint syndicated senior unsecured credit facility totaling $1.5 billion (Global Credit Facility) which matured on February 13, 2015. This Global Credit Facility provides a source of funds to the Borrowers for temporary and emergency purposes, including the ability to meet future unanticipated or unusually large redemption requests. The Borrowers expect to renew the Global Credit Facility for a total of $2 billion effective February 13, 2015, which matures on February 12, 2016.
Under the terms of the Global Credit Facility, the Fund shall, in addition to interest charged on any borrowings made by the Fund and other costs incurred by the Fund, pay its share of fees and expenses incurred in connection with the implementation and maintenance of the Global Credit Facility, based upon its relative share of the aggregate net assets of all of the Borrowers, including an annual commitment fee of 0.07% based upon the unused portion of the Global Credit Facility. These fees are reflected in other expenses on the Statement of Operations. During the year ended December 31, 2014, the Fund did not use the Global Credit Facility.
9. Fair Value Measurements
The Fund follows a fair value hierarchy that distinguishes between market data obtained from independent sources (observable inputs) and the Fund’s own market assumptions (unobservable inputs). These inputs are used in determining the value of the Fund’s financial instruments and are summarized in the following fair value hierarchy:
| | • | | Level 1 – quoted prices in active markets for identical financial instruments |
| | • | | Level 2 – other significant observable inputs (including quoted prices for similar financial instruments, interest rates, prepayment speed, credit risk, etc.) |
| | • | | Level 3 – significant unobservable inputs (including the Fund’s own assumptions in determining the fair value of financial instruments) |
The input levels are not necessarily an indication of the risk or liquidity associated with financial instruments at that level.
For movements between the levels within the fair value hierarchy, the Fund has adopted a policy of recognizing the transfers as of the date of the underlying event which caused the movement.
A summary of inputs used as of December 31, 2014, in valuing the Fund’s assets carried at fair value, is as follows:
| | | | | | | | | | | | | | | | |
| | | Level 1 | | | Level 2 | | | Level 3 | | | Total | |
| | | | |
| Assets: | | | | | | | | | | | | | | | | |
Investments in Securities: | | | | | | | | | | | | | | | | |
Equity Investmentsa,b | | $ | 342,795,473 | | | $ | — | | | $ | — | | | $ | 342,795,473 | |
Participatory Notes | | | — | | | | 4,302,389 | | | | — | | | | 4,302,389 | |
Short Term Investments | | | 29,018,398 | | | | — | | | | — | | | | 29,018,398 | |
| | | | |
Total Investments in Securities | | $ | 371,813,871 | | | $ | 4,302,389 | | | $ | — | | | $ | 376,116,260 | |
| | | | |
aIncludes common and preferred stocks.
bFor detailed categories, see the accompanying Statement of Investments.
FRANKLIN TEMPLETON VARIABLE INSURANCE PRODUCTS TRUST
NOTES TO FINANCIAL STATEMENTS
Templeton Developing Markets VIP Fund (continued)
10. New Accounting Pronouncements
In June 2014, the Financial Accounting Standards Board issued Accounting Standards Update (ASU) No. 2014-11, Transfers and Servicing (Topic 860), Repurchase-to-Maturity Transactions, Repurchase Financings, and Disclosures. The ASU changes the accounting for certain repurchase agreements and expands disclosure requirements related to repurchase agreements, securities lending, repurchase-to-maturity and similar transactions. The ASU is effective for interim and annual reporting periods beginning after December 15, 2014. Management has reviewed the requirements and believes the adoption of this ASU will not have a material impact on the financial statements.
11. Subsequent Events
The Fund has evaluated subsequent events through the issuance of the financial statements and determined that no events have occurred that require disclosure other than those already disclosed in the financial statements.
Abbreviations
| | |
| Selected Portfolio |
| |
| ADR | | American Depositary Receipt |
| |
| GDR | | Global Depositary Receipt |
FRANKLIN TEMPLETON VARIABLE INSURANCE PRODUCTS TRUST
Report of Independent Registered Public Accounting Firm
Templeton Developing Markets VIP Fund
To the Board of Trustees and Shareholders of Franklin Templeton Variable Insurance Products Trust
In our opinion, the accompanying statement of assets and liabilities, including the statement of investments, and the related statements of operations and of changes in net assets and the financial highlights present fairly, in all material respects, the financial position of Templeton Developing Markets VIP Fund (the “Fund”) at December 31, 2014, the results of its operations for the year then ended, the changes in its net assets for each of the two years in the period then ended and the financial highlights for each of the five years in the period then ended, in conformity with accounting principles generally accepted in the United States of America. These financial statements and financial highlights (hereafter referred to as “financial statements”) are the responsibility of the Fund’s management. Our responsibility is to express an opinion on these financial statements based on our audits. We conducted our audits of these financial statements in accordance with the standards of the Public Company Accounting Oversight Board (United States). Those standards require that we plan and perform the audit to obtain reasonable assurance about whether the financial statements are free of material misstatement. An audit includes examining, on a test basis, evidence supporting the amounts and disclosures in the financial statements, assessing the accounting principles used and significant estimates made by management, and evaluating the overall financial statement presentation. We believe that our audits, which included confirmation of securities at December 31, 2014 by correspondence with the custodian, transfer agent and brokers, provides a reasonable basis for our opinion.
PricewaterhouseCoopers LLP
San Francisco, California
February 13, 2015
FRANKLIN TEMPLETON VARIABLE INSURANCE PRODUCTS TRUST
Tax Information (unaudited)
Templeton Developing Markets VIP Fund
Under Section 854(b)(1)(A) of the Internal Revenue Code (Code), the Fund hereby reports 1.71% of the ordinary income dividends as income qualifying for the dividends received deduction for the fiscal year ended December 31, 2014.
At December 31, 2014, more than 50% of the Fund’s total assets were invested in securities of foreign issuers. In most instances, foreign taxes were withheld from income paid to the Fund on these investments. The Fund elects to treat foreign taxes paid as allowed under Section 853 of the Code. This election will allow shareholders of record as of the 2015 distribution date, to treat their proportionate share of foreign taxes paid by the Fund as having been paid directly by them. The shareholder shall consider these amounts as foreign taxes paid in the tax year in which they receive the Fund distribution.
Templeton Foreign VIP Fund
(Formerly, Templeton Foreign Securities Fund)
This annual report for Templeton Foreign VIP Fund covers the fiscal year ended December 31, 2014.
Class 2 Performance Summary as of December 31, 2014
Average annual total return of Class 2 shares* represents the average annual change in value, assuming reinvestment of dividends and capital gains. Average returns smooth out variations in returns, which can be significant; they are not the same as year-by-year results.
| | | | | | | | | | | | |
| Periods ended 12/31/14 | | 1-Year | | | 5-Year | | | 10-Year | |
Average Annual Total Return | | | -11.13% | | | | +4.59% | | | | +4.68% | |
*The Fund has a fee waiver associated with its investments in a Franklin Templeton money fund, contractually guaranteed through at least its current fiscal year-end. Fund investment results reflect the fee waiver, to the extent applicable; without this reduction, the results would have been lower.
Performance reflects the Fund’s Class 2 operating expenses, but does not include any contract fees, expenses or sales charges. If they had been included, performance would be lower. These charges and deductions, particularly for variable life policies, can have a significant effect on contract values and insurance benefits. See the contract prospectus for a complete description of these expenses, including sales charges.
Performance data represent past performance, which does not guarantee future results. Investment return and principal value will fluctuate, and you may have a gain or loss when you sell your shares. Current performance may differ from figures shown.
Total Return Index Comparison for a Hypothetical $10,000 Investment (1/1/05–12/31/14)
The graph below shows the change in value of a hypothetical $10,000 investment in the Fund over the indicated period and includes reinvestment of any income or distributions. The Fund’s performance* is compared to the performance of the MSCI Europe, Australasia, Far East (EAFE) Index. One cannot invest directly in an index, and an index is not representative of the Fund’s portfolio. Please see Important Notes to Performance Information preceding the Fund Summaries.
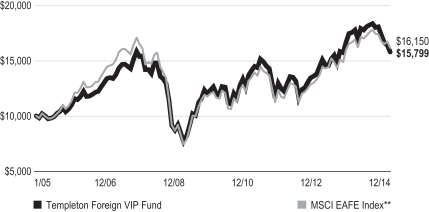
**Source: Morningstar. Please see Index Descriptions following the Fund Summaries.
TEMPLETON FOREIGN VIP FUND
Fund Goal and Main Investments
Templeton Foreign VIP Fund seeks long-term capital growth. Under normal market conditions, the Fund invests at least 80% of its net assets in investments of issuers located outside the U.S., including those in emerging markets.
Fund Risks
All investments involve risks, including possible loss of principal. Special risks are associated with foreign investing, including currency fluctuations, economic instability and political developments; investments in emerging markets involve heightened risks related to the same factors. In addition, smaller company stocks have historically experienced more price volatility than larger company stocks, especially over the short term. To the extent the Fund focuses on particular countries, regions, industries, sectors or types of investment from time to time, it may be subject to greater risks of adverse developments in such areas of focus than a fund that invests in a wider variety of countries, regions, industries, sectors or investments. The Fund is actively managed but there is no guarantee that the manager’s investment decisions will produce the desired results. The Fund’s prospectus also includes a description of the main investment risks.
Performance Overview
You can find the Fund’s one-year total return in the Performance Summary. In comparison, the Fund’s benchmark, the MSCI Europe, Australasia, Far East (EAFE) Index, had a -4.48% total return for the same period.1 Please note, index performance information is provided for reference and we do not attempt to track the index but rather undertake investments on the basis of fundamental research.
Economic and Market Overview
The global economy grew moderately during the 12 months under review as U.S. economic growth expanded while growth rates in much of the rest of the world declined. As measured by the MSCI World Index, stocks in global developed markets advanced overall during the 12-month period amid a generally accommodative monetary policy environment and continued strength in corporate earnings.2 Oil prices declined sharply during the 12-month period, resulting from weak global demand growth and strong world supply, and gold prices ended lower amid benign global inflation and a strong U.S. dollar.
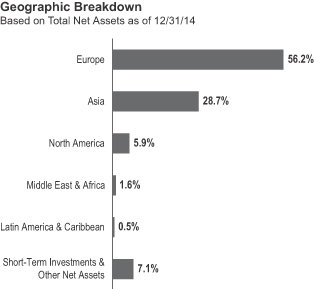
U.S. economic growth trends were generally encouraging during the period. Economic activity expanded for most of 2014, supported in some quarters by increased consumer spending, business investment and federal defense spending. The U.S. Federal Reserve Board (Fed) began reducing its large-scale bond purchases $10 billion a month in January and ended the buying program in October. But it continued its practice of maintaining holdings of longer term securities at sizable levels. The Fed believed underlying economic strength could support ongoing progress in labor market conditions. Toward period-end, the Fed stated that it could be patient with regard to raising interest rates and that the interest rate might not rise for at least a couple of meetings, possibly implying at least the first two meetings of 2015.
Outside the U.S., the U.K. economy grew relatively well, supported by the services and manufacturing sectors. In the eurozone, economic growth remained subdued, as concerns persisted about the potential negative impacts to growth from the crisis in Ukraine and China’s moderating growth rate. However, third-quarter economic growth, though meager, exceeded expectations, especially in the region’s major economies of Germany and France. In June, the European Central Bank (ECB) reduced its main interest rate and, for the first time, set a negative deposit rate; the ECB reduced both rates again in September. The ECB broadened its monetary easing stance by implementing an asset purchase program to prevent deflation and stimulate the economy. Toward period-end, the ECB cut its 2014 growth forecast for the eurozone and attributed the reduction to geopolitical risks dampening confidence and private investment.
1. Source: Morningstar.
One cannot invest directly in an index, and an index is not representative of the Fund’s portfolio. Please see Index Descriptions following the Fund Summaries.
2. Please see Index Descriptions following the Fund Summaries.
TEMPLETON FOREIGN VIP FUND
Japan’s second- and third-quarter economic contractions indicated the economy was in a recession. However, private consumption and exports improved in the third quarter. In October, the Bank of Japan expanded its stimulus measures amid weak domestic demand and as substantially lower crude oil prices exerted further downward pressure on inflation. Toward period-end, Japan’s ruling coalition was reelected in early parliamentary elections and subsequently announced a fresh stimulus package aimed at reviving economic growth.
In several emerging markets, economic growth generally moderated. However, Brazil exited recession as government spending prior to a presidential election drove third-quarter economic growth. Emerging market equities, as measured by the MSCI Emerging Markets Index, fell for the 12-month period, amid headwinds such as soft domestic demand and weak exports in several countries.2 Falling crude oil prices and geopolitical tensions in certain regions, as well as concerns about the timing of U.S. interest rate increases, also pressured emerging market equities. Many emerging market currencies depreciated against the U.S. dollar, leading central banks in several countries to raise interest rates in an effort to curb inflation and support their currencies. Several other central banks lowered interest rates to promote economic growth. After implementing monetary stimulus measures to support specific sectors, China’s central bank increased its efforts to bolster the economy by cutting its benchmark interest rates for the first time since July 2012. In contrast, Russia’s central bank raised its key interest rate sharply toward period-end to limit further devaluation of the Russian ruble and contain rising inflation.
Investment Strategy
Our investment philosophy is bottom up, value oriented and long term. In choosing investments, we generally focus on the market price of a company’s securities relative to our evaluation of the company’s potential long-term earnings, asset value and cash flow. Among factors we consider are a company’s historical value measures, including price/earnings ratio, profit margins and liquidation value. We do in-depth research to construct a bargain list from which we buy.
Manager’s Discussion
The Fund underperformed its benchmark, the MSCI EAFE Index, for the 12-month period, as several sectors detracted from relative returns. An overweighting and stock selection in
| | | | |
| Top 10 Holdings | |
| 12/31/14 | |
Company Sector/Industry, Country | | % of Total
Net Assets | |
Samsung Electronics Co. Ltd. Technology Hardware, Storage & Peripherals, South Korea | | | 3.4% | |
GlaxoSmithKline PLC Pharmaceuticals, U.K. | | | 2.5% | |
BNP Paribas SA Banks, France | | | 2.1% | |
Roche Holding AG Pharmaceuticals, Switzerland | | | 2.0% | |
Hana Financial Group Inc. Banks, South Korea | | | 2.0% | |
Credit Suisse Group AG Capital Markets, Switzerland | | | 2.0% | |
Sanofi Pharmaceuticals, France | | | 2.0% | |
Tesco PLC Food & Staples Retailing, U.K. | | | 1.8% | |
AXA SA Insurance, France | | | 1.6% | |
KB Financial Group Inc., ADR Banks, South Korea | | | 1.6% | |
The dollar value, number of shares or principal amount, and names of all portfolio holdings are listed in the Fund’s Statement of Investments (SOI).
energy hindered Fund performance, notably energy equipment and services companies Trican Well Service3 and Ensign Energy Services,3 both based in Canada,3 as well as Saipem (Italy), Petrofac (U.K.) and Technip (France).4 Energy stocks generally retreated as crude oil prices fell sharply in 2014 resulting from excess global supply and weak demand growth. Stock selection in consumer staples, mainly in food and staples retailing, also hurt performance.5 U.K. retailer Tesco’s shares fell as the company cut its 2014 profit forecast amid declining sales and loss of market share to discount rivals. Stock selection in financials, especially banks such as Hana Financial Group (South Korea)3 and BNP Paribas (France), hindered relative Fund performance.6 Hana Financial’s earnings suffered from lower interest margins, loan losses and an increase in loan loss provisioning. Stock selection in information technology further hampered relative performance, including solar photovoltaic company GCL-Poly Energy Holdings3 and laminate manufacturer Kingboard Chemical Holdings,3 both headquartered in Hong Kong.7
3. Not part of the index.
4. The energy sector comprises energy equipment and services; and oil, gas and consumable fuels in the SOI.
5. The consumer staples sector comprises beverages and food and staples retailing in the SOI.
6. The financials sector comprises banks, capital markets, diversified financial services, insurance, and real estate management and development in the SOI.
7. The information technology sector comprises electronic equipment, instruments and components; semiconductors and semiconductor equipment; software; and technology hardware, storage and peripherals in the SOI.
TEMPLETON FOREIGN VIP FUND
It is important to recognize the effect of currency movements on the Fund’s performance. In general, if the value of the U.S. dollar goes up compared with a foreign currency, an investment traded in that foreign currency will go down in value because it will be worth fewer U.S. dollars. This can have a negative effect on Fund performance. Conversely, when the U.S. dollar weakens in relation to a foreign currency, an investment traded in that foreign currency will increase in value, which can contribute to Fund performance. For the 12 months ended December 31, 2014, the U.S. dollar appreciated in value relative to many currencies in which the Fund’s investments were traded. As a result, the Fund’s performance was negatively affected by the portfolio’s investment predominantly in securities with non-U.S. currency exposure.
In contrast, stock selection in materials, particularly mining company Hudbay Minerals (Canada),3 contributed to relative performance.8 Stock selection in telecommunication services providers such as China Telecom (China)3 and China Mobile (China)3 also aided relative results.9 Both companies benefited after they partnered with China Unicom to establish a telecommunications tower company as a joint venture to reduce capital expenditures. China Mobile’s shares rose after the company cancelled a smartphone consumer subsidy. Additionally, an increased 4G mobile broadband subscriber base and a business deal with Deutsche Telekom helped the company’s stock. Select financials positions, especially insurers such as China Life Insurance (China),3 ACE (U.S.)3 and Aviva (U.K.) also supported relative returns. Aviva’s strong operating profits in the first half of 2014 resulted from stringent cost controls. Toward period-end, Aviva announced plans to acquire rival
insurer Friends Life, aimed at expansion within the U.K., and planned to control costs via mergers and job cuts. Other individual contributors included Teva Pharmaceuticals (Israel)3 and Flextronics International (Singapore).3
From a geographic perspective, stock selection in Europe detracted from Fund performance primarily from investments in the U.K., France and Italy. Stock selection in Asia, particularly Hong Kong, as well as off-benchmark holdings in South Korea, further hampered the Fund’s performance. An off-benchmark allocation in North America, especially in Canadian energy companies, also hurt relative performance. However, an overweighted exposure to Israel, and positioning in China,3 Singapore and Germany contributed to relative returns, as did the Fund’s off-benchmark U.S. investments.
Thank you for your participation in Templeton Foreign VIP Fund. We look forward to serving your future investment needs.
The foregoing information reflects our analysis, opinions and portfolio holdings as of December 31, 2014, the end of the reporting period. The way we implement our main investment strategies and the resulting portfolio holdings may change depending on factors such as market and economic conditions. These opinions may not be relied upon as investment advice or an offer for a particular security. The information is not a complete analysis of every aspect of any market, country, industry, security or the Fund. Statements of fact are from sources considered reliable, but the investment manager makes no representation or warranty as to their completeness or accuracy. Although historical performance is no guarantee of future results, these insights may help you understand our investment management philosophy.
8. The materials sector comprises chemicals, construction materials, and metals and mining in the SOI.
9. The telecommunication services sector comprises diversified telecommunication services and wireless telecommunication services in the SOI.
TEMPLETON FOREIGN VIP FUND
Class 2 Fund Expenses
As an investor in a variable insurance contract (Contract) that indirectly provides for investment in an underlying mutual fund, you can incur transaction and/or ongoing expenses at both the Fund level and the Contract level.
| • | | Transaction expenses can include sales charges (loads) on purchases, redemption fees, surrender fees, transfer fees and premium taxes. |
| • | | Ongoing expenses can include management fees, distribution and service (12b-1) fees, contract fees, annual maintenance fees, mortality and expense risk fees and other fees and expenses. All mutual funds and Contracts have some types of ongoing expenses. |
The expenses shown in the table are meant to highlight ongoing expenses at the Fund level only and do not include ongoing expenses at the Contract level, or transaction expenses at either the Fund or Contract level. While the Fund does not have transaction expenses, if the transaction and ongoing expenses at the Contract level were included, the expenses shown below would be higher. You should consult your Contract prospectus or disclosure document for more information.
The table shows Fund-level ongoing expenses and can help you understand these expenses and compare them with those of other mutual funds offered through the Contract. The table assumes a $1,000 investment held for the six months indicated. Please refer to the Fund prospectus for additional information on operating expenses.
Actual Fund Expenses
The first line (Actual) of the table provides actual account values and expenses. The “Ending Account Value” is derived from the Fund’s actual return, which includes the effect of ongoing Fund expenses, but does not include the effect of ongoing Contract expenses.
You can estimate the Fund-level expenses you incurred during the period by following these steps. Of course, your account value and expenses will differ from those in this illustration:
| 1. | Divide your account value by $1,000. |
If an account had an $8,600 value,
then $8,600 ÷ $1,000 = 8.6.
| 2. | Multiply the result by the number under the heading “Fund-Level Expenses Incurred During Period.” |
If Fund-Level Expenses Incurred During Period were $7.50, then 8.6 × $7.50 = $64.50.
In this illustration, the estimated expenses incurred this period at the Fund level are $64.50.
Hypothetical Example for Comparison with Other Mutual Funds
Information in the second line (Hypothetical) of the table can help you compare ongoing expenses of the Fund with those of other mutual funds offered through the Contract. This information may not be used to estimate the actual ending account balance or expenses you incurred during the period. The hypothetical “Ending Account Value” is based on the Fund’s actual expense ratio and an assumed 5% annual rate of return before expenses, which does not represent the Fund’s actual return. The figure under the heading “Fund-Level Expenses Incurred During Period” shows the hypothetical expenses your account would have incurred under this scenario. You can compare this figure with the 5% hypothetical examples that appear in shareholder reports of other funds offered through a Contract.
| | | | | | | | | | | | |
| Class 2 | | Beginning Account Value 7/1/14 | | | Ending Account Value 12/31/14 | | | Fund-Level Expenses
Incurred During Period* 7/1/14–12/31/14 | |
Actual | | | $1,000 | | | | $ 861.00 | | | | $4.78 | |
Hypothetical (5% return before expenses) | | | $1,000 | | | | $1,020.06 | | | | $5.19 | |
*Expenses are calculated using the most recent six-month annualized expense ratio, net of expense waivers, for the Fund’s Class 2 shares (1.02%), which does not include any ongoing expenses of the Contract for which the Fund is an investment option, multiplied by the average account value over the period, multiplied by 184/365 to reflect the one-half year period.
FRANKLIN TEMPLETON VARIABLE INSURANCE PRODUCTS TRUST
Financial Highlights
Templeton Foreign VIP Fund
| | | | | | | | | | | | | | | | | | | | |
| | | Year Ended December 31, | |
| | | 2014 | | | 2013 | | | 2012 | | | 2011 | | | 2010 | |
| Class 1 | | | | | | | | | | | | | | | | | | | | |
Per share operating performance (for a share outstanding throughout the year) | | | | | | | | | | | | | | | | | | | | |
| | | | | |
Net asset value, beginning of year | | | $17.56 | | | | $14.63 | | | | $12.78 | | | | $14.54 | | | | $13.68 | |
| | | | |
| | | | | |
| Income from investment operationsa: | | | | | | | | | | | | | | | | | | | | |
| | | | | |
Net investment incomeb | | | 0.53 | c | | | 0.34 | | | | 0.38 | | | | 0.42 | | | | 0.28 | |
| | | | | |
Net realized and unrealized gains (losses) | | | (2.39 | ) | | | 3.00 | | | | 1.91 | | | | (1.90 | ) | | | 0.86 | |
| | | | |
Total from investment operations | | | (1.86 | ) | | | 3.34 | | | | 2.29 | | | | (1.48 | ) | | | 1.14 | |
| | | | |
| | | | | |
Less distributions from net investment income | | | (0.36 | ) | | | (0.41 | ) | | | (0.44 | ) | | | (0.28 | ) | | | (0.28 | ) |
| | | | |
Redemption feesd | | | — | | | | — | | | | — | | | | — | | | | — | |
| | | | |
Net asset value, end of year | | | $15.34 | | | | $17.56 | | | | $14.63 | | | | $12.78 | | | | $14.54 | |
| | | | |
| | | | | |
Total returne | | | (10.89)% | | | | 23.27% | | | | 18.60% | | | | (10.44)% | | | | 8.67% | |
| | | | | |
| Ratios to average net assets | | | | | | | | | | | | | | | | | | | | |
| | | | | |
Expenses | | | 0.77% | f | | | 0.78% | | | | 0.79% | | | | 0.79% | g | | | 0.78% | g |
| | | | | |
Net investment income | | | 3.11% | c | | | 2.16% | | | | 2.84% | | | | 2.92% | | | | 2.10% | |
| | | | | |
| Supplemental data | | | | | | | | | | | | | | | | | | | | |
| | | | | |
Net assets, end of year (000’s) | | | $248,355 | | | | $298,468 | | | | $265,924 | | | | $254,292 | | | | $321,282 | |
| | | | | |
Portfolio turnover rate | | | 25.71% | | | | 23.61% | | | | 12.53% | | | | 21.09% | | | | 19.16% | |
aThe amount shown for a share outstanding throughout the period may not correlate with the Statement of Operations for the period due to the timing of sales and repurchases of the Fund shares in relation to income earned and/or fluctuating fair value of the investments of the Fund.
bBased on average daily shares outstanding.
cNet investment income per share includes approximately $0.16 per share received in the form of a special dividend paid in connection with certain Fund holdings. Excluding this amount, the ratio of net investment income to average net assets would have been 2.13%.
dAmount rounds to less than $0.01 per share.
eTotal return does not include fees, charges or expenses imposed by the variable annuity and life insurance contracts for which Franklin Templeton Variable Insurance Products Trust serves as an underlying investment vehicle.
fBenefit of waiver and payments by affiliates rounds to less than 0.01%.
gBenefit of expense reduction rounds to less than 0.01%.
| | | | |
| TF-6 | | Annual Report | The accompanying notes are an integral part of these financial statements. | | |
FRANKLIN TEMPLETON VARIABLE INSURANCE PRODUCTS TRUST
FINANCIAL HIGHLIGHTS
Templeton Foreign VIP Fund (continued)
| | | | | | | | | | | | | | | | | | | | |
| | | Year Ended December 31, | |
| | | 2014 | | | 2013 | | | 2012 | | | 2011 | | | 2010 | |
| Class 2 | | | | | | | | | | | | | | | | | | | | |
Per share operating performance
(for a share outstanding throughout the year) | | | | | | | | | | | | | | | | | | | | |
| | | | | |
Net asset value, beginning of year | | | $17.24 | | | | $14.37 | | | | $12.56 | | | | $14.29 | | | | $13.45 | |
| | | | |
| | | | | |
| Income from investment operationsa: | | | | | | | | | | | | | | | | | | | | |
| | | | | |
Net investment incomeb | | | 0.48 | c | | | 0.30 | | | | 0.34 | | | | 0.37 | | | | 0.25 | |
| | | | | |
Net realized and unrealized gains (losses) | | | (2.35 | ) | | | 2.94 | | | | 1.87 | | | | (1.86 | ) | | | 0.84 | |
| | | | |
Total from investment operations | | | (1.87 | ) | | | 3.24 | | | | 2.21 | | | | (1.49 | ) | | | 1.09 | |
| | | | |
| | | | | |
Less distributions from net investment income | | | (0.32 | ) | | | (0.37 | ) | | | (0.40 | ) | | | (0.24 | ) | | | (0.25 | ) |
| | | | |
Redemption feesd | | | — | | | | — | | | | — | | | | — | | | | — | |
| | | | |
Net asset value, end of year | | | $15.05 | | | | $17.24 | | | | $14.37 | | | | $12.56 | | | | $14.29 | |
| | | | |
| | | | | |
Total returne | | | (11.13)% | | | | 22.97% | | | | 18.23% | | | | (10.63)% | | | | 8.41% | |
| | | | | |
| Ratios to average net assets | | | | | | | | | | | | | | | | | | | | |
| | | | | |
Expenses | | | 1.02% | f | | | 1.03% | | | | 1.04% | | | | 1.04% | g | | | 1.03% | g |
| | | | | |
Net investment income | | | 2.86% | c | | | 1.91% | | | | 2.59% | | | | 2.67% | | | | 1.85% | |
| | | | | |
| Supplemental data | | | | | | | | | | | | | | | | | | | | |
| | | | | |
Net assets, end of year (000’s) | | | $1,645,571 | | | | $1,873,586 | | | | $1,744,231 | | | | $1,679,412 | | | | $2,090,757 | |
| | | | | |
Portfolio turnover rate | | | 25.71% | | | | 23.61% | | | | 12.53% | | | | 21.09% | | | | 19.16% | |
aThe amount shown for a share outstanding throughout the period may not correlate with the Statement of Operations for the period due to the timing of sales and repurchases of the Fund shares in relation to income earned and/or fluctuating fair value of the investments of the Fund.
bBased on average daily shares outstanding.
cNet investment income per share includes approximately $0.16 per share received in the form of a special dividend paid in connection with certain Fund holdings. Excluding this amount, the ratio of net investment income to average net assets would have been 1.88%.
dAmount rounds to less than $0.01 per share.
eTotal return does not include fees, charges or expenses imposed by the variable annuity and life insurance contracts for which Franklin Templeton Variable Insurance Products Trust serves as an underlying investment vehicle.
fBenefit of waiver and payments by affiliates rounds to less than 0.01%.
gBenefit of expense reduction rounds to less than 0.01%.
| | | | | | |
| | | The accompanying notes are an integral part of these financial statements. | Annual Report | | | TF-7 | |
FRANKLIN TEMPLETON VARIABLE INSURANCE PRODUCTS TRUST
FINANCIAL HIGHLIGHTS
Templeton Foreign VIP Fund (continued)
| | | | | | | | | | | | | | | | | | | | |
| | | Year Ended December 31, | |
| | | 2014 | | | 2013 | | | 2012 | | | 2011 | | | 2010 | |
| Class 4 | | | | | | | | | | | | | | | | | | | | |
Per share operating performance (for a share outstanding throughout the year) | | | | | | | | | | | | | | | | | | | | |
| | | | | |
Net asset value, beginning of year | | | $17.37 | | | | $14.48 | | | | $12.66 | | | | $14.43 | | | | $13.59 | |
| | | | |
| | | | | |
| Income from investment operationsa: | | | | | | | | | | | | | | | | | | | | |
| | | | | |
Net investment incomeb | | | 0.46 | c | | | 0.28 | | | | 0.33 | | | | 0.36 | | | | 0.17 | |
| | | | | |
Net realized and unrealized gains (losses) | | | (2.36 | ) | | | 2.97 | | | | 1.89 | | | | (1.88 | ) | | | 0.92 | |
| | | | |
Total from investment operations | | | (1.90 | ) | | | 3.25 | | | | 2.22 | | | | (1.52 | ) | | | 1.09 | |
| | | | |
| | | | | |
Less distributions from net investment income | | | (0.31 | ) | | | (0.36 | ) | | | (0.40 | ) | | | (0.25 | ) | | | (0.25 | ) |
| | | | |
Redemption feesd | | | — | | | | — | | | | — | | | | — | | | | — | |
| | | | |
Net asset value, end of year | | | $15.16 | | | | $17.37 | | | | $14.48 | | | | $12.66 | | | | $14.43 | |
| | | | |
| | | | | |
Total returne | | | (11.22)% | | | | 22.86% | | | | 18.14% | | | | (10.74)% | | | | 8.38% | |
| | | | | |
| Ratios to average net assets | | | | | | | | | | | | | | | | | | | | |
| | | | | |
Expenses | | | 1.12% | f | | | 1.13% | | | | 1.14% | | | | 1.14% | g | | | 1.13% | g |
| | | | | |
Net investment income | | | 2.76% | c | | | 1.81% | | | | 2.49% | | | | 2.57% | | | | 1.75% | |
| | | | | |
| Supplemental data | | | | | | | | | | | | | | | | | | | | |
| | | | | |
Net assets, end of year (000’s) | | | $503,143 | | | | $513,098 | | | | $416,277 | | | | $353,346 | | | | $305,505 | |
| | | | | |
Portfolio turnover rate | | | 25.71% | | | | 23.61% | | | | 12.53% | | | | 21.09% | | | | 19.16% | |
aThe amount shown for a share outstanding throughout the period may not correlate with the Statement of Operations for the period due to the timing of sales and repurchases of the Fund shares in relation to income earned and/or fluctuating fair value of the investments of the Fund.
bBased on average daily shares outstanding.
cNet investment income per share includes approximately $0.16 per share received in the form of a special dividend paid in connection with certain Fund holdings. Excluding this amount, the ratio of net investment income to average net assets would have been 1.78%.
dAmount rounds to less than $0.01 per share.
eTotal return does not include fees, charges or expenses imposed by the variable annuity and life insurance contracts for which Franklin Templeton Variable Insurance Products Trust serves as an underlying investment vehicle.
fBenefit of waiver and payments by affiliates rounds to less than 0.01%.
gBenefit of expense reduction rounds to less than 0.01%.
| | | | |
| TF-8 | | Annual Report | The accompanying notes are an integral part of these financial statements. | | |
FRANKLIN TEMPLETON VARIABLE INSURANCE PRODUCTS TRUST
Statement of Investments, December 31, 2014
| | | | | | | | | | | | | | |
| Templeton Foreign VIP Fund | | | | |
| | | | | Country | | | Shares | | | Value | |
| | | | | | | | | | | | | | |
| | Common Stocks 92.8% | | | | | | | | | | | | |
| | Aerospace & Defense 1.1% | | | | | | | | | | | | |
| | BAE Systems PLC | | | United Kingdom | | | | 3,443,320 | | | $ | 25,332,725 | |
| | | | | | | | | | | | | | |
| | Airlines 0.6% | | | | | | | | | | | | |
| | Deutsche Lufthansa AG | | | Germany | | | | 859,340 | | | | 14,380,453 | |
| | | | | | | | | | | | | | |
| | Auto Components 2.1% | | | | | | | | | | | | |
| | Cie Generale des Etablissements Michelin, B | | | France | | | | 274,970 | | | | 25,043,360 | |
| | Hyundai Mobis Co. Ltd. | | | South Korea | | | | 118,532 | | | | 25,575,585 | |
| | | | | | | | | | | | | | |
| | | | | | | | | | | | | 50,618,945 | |
| | | | | | | | | | | | | | |
| | Automobiles 3.4% | | | | | | | | | | | | |
| | Hyundai Motor Co. | | | South Korea | | | | 85,778 | | | | 13,253,805 | |
| | Nissan Motor Co. Ltd. | | | Japan | | | | 4,058,500 | | | | 35,800,830 | |
| a | | Toyota Motor Corp., ADR | | | Japan | | | | 262,491 | | | | 32,937,371 | |
| | | | | | | | | | | | | | |
| | | | | | | | | | | | | 81,992,006 | |
| | | | | | | | | | | | | | |
| | Banks 13.9% | | | | | | | | | | | | |
| | Bangkok Bank PCL, fgn. | | | Thailand | | | | 1,247,500 | | | | 7,436,436 | |
| | Barclays PLC | | | United Kingdom | | | | 4,800,520 | | | | 18,220,059 | |
| | BNP Paribas SA | | | France | | | | 854,430 | | | | 50,927,957 | |
| | DBS Group Holdings Ltd. | | | Singapore | | | | 929,520 | | | | 14,453,587 | |
| | Hana Financial Group Inc. | | | South Korea | | | | 1,636,205 | | | | 47,870,246 | |
| | HSBC Holdings PLC | | | United Kingdom | | | | 4,015,600 | | | | 38,297,077 | |
| b | | ING Groep NV, IDR | | | Netherlands | | | | 2,116,284 | | | | 27,732,420 | |
| | KB Financial Group Inc., ADR | | | South Korea | | | | 1,189,645 | | | | 38,806,220 | |
| | Societe Generale SA | | | France | | | | 391,870 | | | | 16,590,952 | |
| | Standard Chartered PLC | | | United Kingdom | | | | 1,388,570 | | | | 20,842,825 | |
| | UniCredit SpA | | | Italy | | | | 5,333,111 | | | | 34,427,097 | |
| | United Overseas Bank Ltd. | | | Singapore | | | | 985,000 | | | | 18,238,262 | |
| | | | | | | | | | | | | | |
| | | | | | | | | | | | | 333,843,138 | |
| | | | | | | | | | | | | | |
| | Beverages 0.5% | | | | | | | | | | | | |
| | Suntory Beverage & Food Ltd. | | | Japan | | | | 377,600 | | | | 13,140,764 | |
| | | | | | | | | | | | | | |
| | Building Products 0.8% | | | | | | | | | | | | |
| | Compagnie de Saint-Gobain | | | France | | | | 470,940 | | | | 20,075,371 | |
| | | | | | | | | | | | | | |
| | Capital Markets 2.4% | | | | | | | | | | | | |
| | Credit Suisse Group AG | | | Switzerland | | | | 1,874,638 | | | | 47,290,204 | |
| | GAM Holding Ltd. | | | Switzerland | | | | 505,110 | | | | 9,145,021 | |
| | | | | | | | | | | | | | |
| | | | | | | | | | | | | 56,435,225 | |
| | | | | | | | | | | | | | |
| | Chemicals 1.2% | | | | | | | | | | | | |
| | Akzo Nobel NV | | | Netherlands | | | | 407,380 | | | | 28,417,402 | |
| | | | | | | | | | | | | | |
| | Construction & Engineering 1.1% | | | | | | | | | | | | |
| | Carillion PLC | | | United Kingdom | | | | 3,750,730 | | | | 19,631,750 | |
| | Sinopec Engineering Group Co. Ltd. | | | China | | | | 11,830,500 | | | | 8,010,127 | |
| | | | | | | | | | | | | | |
| | | | | | | | | | | | | 27,641,877 | |
| | | | | | | | | | | | | | |
| | Construction Materials 0.7% | | | | | | | | | | | | |
| | CRH PLC | | | Ireland | | | | 659,820 | | | | 15,887,805 | |
| | | | | | | | | | | | | | |
| | Diversified Financial Services 1.5% | | | | | | | | | | | | |
| | BM&F BOVESPA SA | | | Brazil | | | | 2,189,700 | | | | 8,116,104 | |
| | Deutsche Boerse AG | | | Germany | | | | 387,190 | | | | 27,744,563 | |
| | | | | | | | | | | | | | |
| | | | | | | | | | | | | 35,860,667 | |
| | | | | | | | | | | | | | |
FRANKLIN TEMPLETON VARIABLE INSURANCE PRODUCTS TRUST
STATEMENT OF INVESTMENTS
Templeton Foreign VIP Fund (continued)
| | | | | | | | | | | | | | |
| | | | | Country | | | Shares | | | Value | |
| | | | | | | | | | | | | | |
| | Common Stocks (continued) | | | | | | | | | | | | |
| | Diversified Telecommunication Services 4.0% | | | | | | | | | | | | |
| | China Telecom Corp. Ltd., H | | | China | | | | 52,438,357 | | | $ | 30,432,568 | |
| | Singapore Telecommunications Ltd. | | | Singapore | | | | 4,671,000 | | | | 13,750,679 | |
| a | | Telefonica SA, ADR | | | Spain | | | | 2,270,951 | | | | 32,270,214 | |
| | Telenor ASA | | | Norway | | | | 928,054 | | | | 18,819,459 | |
| | | | | | | | | | | | | | |
| | | | | | | | | | | | | 95,272,920 | |
| | | | | | | | | | | | | | |
| | Electrical Equipment 0.7% | | | | | | | | | | | | |
| | ABB Ltd. | | | Switzerland | | | | 838,920 | | | | 17,838,231 | |
| | | | | | | | | | | | | | |
| | Electronic Equipment, Instruments & Components 1.7% | | | | | | | | | | | | |
| b | | Flextronics International Ltd. | | | Singapore | | | | 1,849,070 | | | | 20,672,602 | |
| | Kingboard Chemical Holdings Ltd. | | | Hong Kong | | | | 11,646,000 | | | | 19,675,469 | |
| | | | | | | | | | | | | | |
| | | | | | | | | | | | | 40,348,071 | |
| | | | | | | | | | | | | | |
| | Energy Equipment & Services 3.8% | | | | | | | | | | | | |
| | Ensign Energy Services Inc. | | | Canada | | | | 1,965,300 | | | | 17,262,485 | |
| | Petrofac Ltd. | | | United Kingdom | | | | 1,484,944 | | | | 16,271,512 | |
| b | | Saipem SpA | | | Italy | | | | 1,138,333 | | | | 12,072,761 | |
| | Technip SA | | | France | | | | 561,210 | | | | 33,555,952 | |
| | Trican Well Service Ltd. | | | Canada | | | | 2,373,000 | | | | 11,382,226 | |
| | | | | | | | | | | | | | |
| | | | | | | | | | | | | 90,544,936 | |
| | | | | | | | | | | | | | |
| | Food & Staples Retailing 2.4% | | | | | | | | | | | | |
| | Metro AG | | | Germany | | | | 489,650 | | | | 14,995,580 | |
| | Tesco PLC | | | United Kingdom | | | | 14,669,830 | | | | 43,216,481 | |
| | | | | | | | | | | | | | |
| | | | | | | | | | | | | 58,212,061 | |
| | | | | | | | | | | | | | |
| | Health Care Equipment & Supplies 0.7% | | | | | | | | | | | | |
| | Getinge AB, B | | | Sweden | | | | 737,270 | | | | 16,807,915 | |
| | | | | | | | | | | | | | |
| | Health Care Providers & Services 1.4% | | | | | | | | | | | | |
| | Shanghai Pharmaceuticals Holding Co. Ltd., H | | | China | | | | 6,434,800 | | | | 14,522,792 | |
| | Sinopharm Group Co. | | | China | | | | 5,059,200 | | | | 17,942,855 | |
| | | | | | | | | | | | | | |
| | | | | | | | | | | | | 32,465,647 | |
| | | | | | | | | | | | | | |
| | Industrial Conglomerates 1.6% | | | | | | | | | | | | |
| | Hutchison Whampoa Ltd. | | | Hong Kong | | | | 988,239 | | | | 11,387,635 | |
| | Siemens AG | | | Germany | | | | 233,124 | | | | 26,445,003 | |
| | | | | | | | | | | | | | |
| | | | | | | | | | | | | 37,832,638 | |
| | | | | | | | | | | | | | |
| | Insurance 8.1% | | | | | | | | | | | | |
| | ACE Ltd. | | | United States | | | | 307,649 | | | | 35,342,717 | |
| | Aegon NV | | | Netherlands | | | | 4,446,700 | | | | 33,676,593 | |
| | Aviva PLC | | | United Kingdom | | | | 3,200,110 | | | | 24,166,915 | |
| | AXA SA | | | France | | | | 1,685,708 | | | | 39,172,566 | |
| | China Life Insurance Co. Ltd., H | | | China | | | | 6,096,000 | | | | 23,821,252 | |
| | Muenchener Rueckversicherungs-Gesellschaft AG | | | Germany | | | | 68,060 | | | | 13,649,943 | |
| b,c | | NN Group NV, 144A | | | Netherlands | | | | 453,400 | | | | 13,630,315 | |
| | Swiss Re AG | | | Switzerland | | | | 130,190 | | | | 10,953,926 | |
| | | | | | | | | | | | | | |
| | | | | | | | | | | | | 194,414,227 | |
| | | | | | | | | | | | | | |
FRANKLIN TEMPLETON VARIABLE INSURANCE PRODUCTS TRUST
STATEMENT OF INVESTMENTS
Templeton Foreign VIP Fund (continued)
| | | | | | | | | | | | | | |
| | | | | Country | | | Shares | | | Value | |
| | | | | | | | | | | | | | |
| | Common Stocks (continued) | | | | | | | | | | | | |
| | Life Sciences Tools & Services 1.8% | | | | | | | | | | | | |
| | Lonza Group AG | | | Switzerland | | | | 121,930 | | | $ | 13,760,356 | |
| b | | MorphoSys AG | | | Germany | | | | 116,110 | | | | 10,765,986 | |
| b | | QIAGEN NV | | | Netherlands | | | | 807,901 | | | | 18,925,565 | |
| | | | | | | | | | | | | | |
| | | | | | | | | | | | | 43,451,907 | |
| | | | | | | | | | | | | | |
| | Metals & Mining 2.5% | | | | | | | | | | | | |
| | HudBay Minerals Inc. | | | Canada | | | | 2,891,000 | | | | 25,194,334 | |
| | POSCO | | | South Korea | | | | 136,907 | | | | 34,484,602 | |
| | | | | | | | | | | | | | |
| | | | | | | | | | | | | 59,678,936 | |
| | | | | | | | | | | | | | |
| | Multiline Retail 1.4% | | | | | | | | | | | | |
| | Marks & Spencer Group PLC | | | United Kingdom | | | | 4,429,680 | | | | 33,058,947 | |
| | | | | | | | | | | | | | |
| | Oil, Gas & Consumable Fuels 9.3% | | | | | | | | | | | | |
| | BP PLC | | | United Kingdom | | | | 5,463,315 | | | | 34,999,399 | |
| | Dragon Oil PLC | | | Turkmenistan | | | | 1,142,970 | | | | 9,575,816 | |
| | Eni SpA | | | Italy | | | | 1,319,747 | | | | 23,170,929 | |
| | Kunlun Energy Co. Ltd. | | | China | | | | 9,072,000 | | | | 8,611,085 | |
| | LUKOIL Holdings, ADR | | | Russia | | | | 160,535 | | | | 6,389,293 | |
| | Royal Dutch Shell PLC, A | | | United Kingdom | | | | 16,803 | | | | 564,020 | |
| | Royal Dutch Shell PLC, B | | | United Kingdom | | | | 1,094,263 | | | | 38,086,666 | |
| | Statoil ASA | | | Norway | | | | 697,230 | | | | 12,244,221 | |
| | Suncor Energy Inc. | | | Canada | | | | 901,700 | | | | 28,652,512 | |
| | Talisman Energy Inc. | | | Canada | | | | 2,957,400 | | | | 23,175,320 | |
| | Total SA, B | | | France | | | | 715,516 | | | | 36,812,725 | |
| | | | | | | | | | | | | | |
| | | | | | | | | | | | | 222,281,986 | |
| | | | | | | | | | | | | | |
| | Pharmaceuticals 11.9% | | | | | | | | | | | | |
| | Bayer AG | | | Germany | | | | 194,750 | | | | 26,628,167 | |
| | GlaxoSmithKline PLC | | | United Kingdom | | | | 2,772,585 | | | | 59,465,602 | |
| | Merck KGaA | | | Germany | | | | 233,460 | | | | 22,152,599 | |
| | Novartis AG | | | Switzerland | | | | 328,730 | | | | 30,535,320 | |
| | Roche Holding AG | | | Switzerland | | | | 179,480 | | | | 48,724,252 | |
| | Sanofi | | | France | | | | 513,135 | | | | 46,976,790 | |
| | Teva Pharmaceutical Industries Ltd., ADR | | | Israel | | | | 670,527 | | | | 38,562,008 | |
| | UCB SA | | | Belgium | | | | 160,740 | | | | 12,292,109 | |
| | | | | | | | | | | | | | |
| | | | | | | | | | | | | 285,336,847 | |
| | | | | | | | | | | | | | |
| | Real Estate Management & Development 0.0%† | | | | | | | | | | | | |
| | Cheung Kong (Holdings) Ltd. | | | Hong Kong | | | | 922 | | | | 15,517 | |
| | | | | | | | | | | | | | |
| | Semiconductors & Semiconductor Equipment 1.8% | | | | | | | | | | | | |
| b | | GCL-Poly Energy Holdings Ltd. | | | Hong Kong | | | | 138,306,000 | | | | 32,284,688 | |
| | Infineon Technologies AG | | | Germany | | | | 1,103,225 | | | | 11,807,210 | |
| | | | | | | | | | | | | | |
| | | | | | | | | | | | | 44,091,898 | |
| | | | | | | | | | | | | | |
| | Software 0.8% | | | | | | | | | | | | |
| | Capcom Co. Ltd. | | | Japan | | | | 1,211,400 | | | | 18,359,294 | |
| | | | | | | | | | | | | | |
| | Specialty Retail 1.1% | | | | | | | | | | | | |
| | Kingfisher PLC | | | United Kingdom | | | | 5,160,616 | | | | 27,389,316 | |
| | | | | | | | | | | | | | |
FRANKLIN TEMPLETON VARIABLE INSURANCE PRODUCTS TRUST
STATEMENT OF INVESTMENTS
Templeton Foreign VIP Fund (continued)
| | | | | | | | | | | | | | |
| | | | | Country | | | Shares | | | Value | |
| | | | | | | | | | | | | | |
| | Common Stocks (continued) | | | | | | | | | | | | |
| | Technology Hardware, Storage & Peripherals 4.5% | | | | | | | | | | | | |
| | CANON Inc. | | | Japan | | | | 521,800 | | | $ | 16,724,164 | |
| | Konica Minolta Inc. | | | Japan | | | | 864,300 | | | | 9,557,250 | |
| | Samsung Electronics Co. Ltd. | | | South Korea | | | | 66,679 | | | | 80,898,033 | |
| | | | | | | | | | | | | | |
| | | | | | | | | | | | | 107,179,447 | |
| | | | | | | | | | | | | | |
| | Trading Companies & Distributors 2.0% | | | | | | | | | | | | |
| | Daewoo International Corp. | | | South Korea | | | | 366,608 | | | | 10,541,455 | |
| | ITOCHU Corp. | | | Japan | | | | 3,441,000 | | | | 37,102,207 | |
| | | | | | | | | | | | | | |
| | | | | | | | | | | | | 47,643,662 | |
| | | | | | | | | | | | | | |
| | Wireless Telecommunication Services 2.0% | | | | | | | | | | | | |
| | China Mobile Ltd. | | | China | | | | 1,903,500 | | | | 22,265,742 | |
| | Mobile TeleSystems, ADR | | | Russia | | | | 369,312 | | | | 2,651,660 | |
| | Vodafone Group PLC, ADR | | | United Kingdom | | | | 671,535 | | | | 22,946,351 | |
| | | | | | | | | | | | | | |
| | | | | | | | | | | | | 47,863,753 | |
| | | | | | | | | | | | | | |
| | | | |
| | Total Common Stocks (Cost $2,063,303,883) | | | | | | | | | | | 2,223,714,534 | |
| | | | | | | | | | | | | | |
| | Preferred Stocks (Cost $11,136,802) 0.1% | | | | | | | | | | | | |
| | Oil, Gas & Consumable Fuels 0.1% | | | | | | | | | | | | |
| | Petroleo Brasileiro SA, ADR, pfd. | | | Brazil | | | | 517,880 | | | | 3,925,530 | |
| | | | | | | | | | | | | | |
| | | | |
| | Total Investments before Short Term Investments
(Cost $2,074,440,685) | | | | | | | | | | | 2,227,640,064 | |
| | | | | | | | | | | | | | |
| | Short Term Investments 6.6% | | | | | | | | | | | | |
| | Money Market Funds (Cost $135,800,137) 5.7% | | | | | | | | | | | | |
| b,d | | Institutional Fiduciary Trust Money Market Portfolio | | | United States | | | | 135,800,137 | | | | 135,800,137 | |
| | | | | | | | | | | | | | |
| e | | Investments from Cash Collateral Received for Loaned Securities
(Cost $22,777,025) 0.9% | | | | | | | | | |
| | Money Market Funds 0.9% | | | | | | | | | | | | |
| f | | BNY Mellon Overnight Government Fund, 0.072% | | | United States | | | | 22,777,025 | | | | 22,777,025 | |
| | | | | | | | | | | | | | |
| | Total Investments (Cost $2,233,017,847) 99.5% | | | | | | | | | | | 2,386,217,226 | |
| | Other Assets, less Liabilities 0.5% | | | | | | | | | | | 10,851,391 | |
| | | | | | | | | | | | | | |
| | Net Assets 100.0% | | | | | | | | | | $ | 2,397,068,617 | |
| | | | | | | | | | | | | | |
See Abbreviations on page TF-23.
†Rounds to less than 0.1% of net assets.
aA portion or all of the security is on loan at December 31, 2014. See Note 1(c).
bNon-income producing.
cSecurity was purchased pursuant to Rule 144A under the Securities Act of 1933 and may be sold in transactions exempt from registration only to qualified institutional buyers or in a public offering registered under the Securities Act of 1933. This security has been deemed liquid under guidelines approved by the Trust’s Board of Trustees. At December 31, 2014, the value of this security was $13,630,315, representing 0.57% of net assets.
dSee Note 3(e) regarding investments in Institutional Fiduciary Trust Money Market Portfolio.
eSee Note 1(c) regarding securities on loan.
fThe rate shown is the annualized seven-day yield at period end.
| | | | |
| TF-12 | | Annual Report | The accompanying notes are an integral part of these financial statements. | | |
FRANKLIN TEMPLETON VARIABLE INSURANCE PRODUCTS TRUST
Financial Statements
Statement of Assets and Liabilities
December 31, 2014
| | | | |
| | | Templeton
Foreign
VIP Fund | |
Assets: | | | | |
Investments in securities: | | | | |
Cost - Unaffiliated issuers | | $ | 2,097,217,710 | |
Cost - Sweep Money Fund (Note 3e) | | | 135,800,137 | |
| | | | |
Total cost of investments | | $ | 2,233,017,847 | |
| | | | |
Value - Unaffiliated issuers | | $ | 2,250,417,089 | |
Value - Sweep Money Fund (Note 3e) | | | 135,800,137 | |
| | | | |
Total value of investments (includes securities loaned in the amount $22,207,943) | | | 2,386,217,226 | |
Receivables: | | | | |
Capital shares sold | | | 47,937,396 | |
Dividends | | | 3,812,274 | |
Other assets | | | 233 | |
| | | | |
Total assets | | | 2,437,967,129 | |
| | | | |
Liabilities: | | | | |
Payables: | | | | |
Investment securities purchased | | | 14,064,634 | |
Capital shares redeemed | | | 1,041,637 | |
Management fees | | | 1,485,858 | |
Distribution fees | | | 973,078 | |
Payable upon return of securities loaned | | | 22,777,025 | |
Accrued expenses and other liabilities | | | 556,280 | |
| | | | |
Total liabilities | | | 40,898,512 | |
| | | | |
Net assets, at value | | $ | 2,397,068,617 | |
| | | | |
Net assets consist of: | | | | |
Paid-in capital | | $ | 2,096,424,724 | |
Undistributed net investment income | | | 75,444,548 | |
Net unrealized appreciation (depreciation) | | | 153,106,440 | |
Accumulated net realized gain (loss) | | | 72,092,905 | |
| | | | |
Net assets, at value | | $ | 2,397,068,617 | |
| | | | |
| |
| Class 1: | | | | |
Net assets, at value | | $ | 248,354,655 | |
| | | | |
Shares outstanding | | | 16,191,969 | |
| | | | |
Net asset value and maximum offering price per share | | $ | 15.34 | |
| | | | |
| |
| Class 2: | | | | |
Net assets, at value | | $ | 1,645,570,685 | |
| | | | |
Shares outstanding | | | 109,316,577 | |
| | | | |
Net asset value and maximum offering price per share | | $ | 15.05 | |
| | | | |
| |
| Class 4: | | | | |
Net assets, at value | | $ | 503,143,277 | |
| | | | |
Shares outstanding | | | 33,192,724 | |
| | | | |
Net asset value and maximum offering price per share | | $ | 15.16 | |
| | | | |
| | | | | | |
| | | The accompanying notes are an integral part of these financial statements. | Annual Report | | | TF-13 | |
FRANKLIN TEMPLETON VARIABLE INSURANCE PRODUCTS TRUST
FINANCIAL STATEMENTS
Statement of Operations
for the year ended December 31, 2014
| | | | |
| | | Templeton
Foreign
VIP Fund | |
Investment income: | | | | |
Dividends (net of foreign taxes of $7,313,287) | | $ | 100,346,608 | |
Income from securities loaned | | | 2,098,406 | |
| | | | |
Total investment income | | | 102,445,014 | |
| | | | |
Expenses: | | | | |
Management fees (Note 3a) | | | 18,665,399 | |
Administrative fees (Note 3b) | | | 859,943 | |
Distribution fees: (Note 3c) | | | | |
Class 2 | | | 4,543,745 | |
Class 3 | | | 75,571 | |
Class 4 | | | 1,780,731 | |
Custodian fees (Note 4) | | | 277,642 | |
Reports to shareholders | | | 447,762 | |
Registration and filing fees | | | 1,428 | |
Professional fees | | | 109,904 | |
Trustees’ fees and expenses | | | 10,731 | |
Other | | | 61,734 | |
| | | | |
Total expenses | | | 26,834,590 | |
Expenses waived/paid by affiliates (Note 3e) | | | (83,720 | ) |
| | | | |
Net expenses | | | 26,750,870 | |
| | | | |
Net investment income | | | 75,694,144 | |
| | | | |
Realized and unrealized gains (losses): | | | | |
Net realized gain (loss) from: | | | | |
Investments | | | 132,213,003 | |
Foreign currency transactions | | | (210,650 | ) |
| | | | |
Net realized gain (loss) | | | 132,002,353 | |
| | | | |
Net change in unrealized appreciation (depreciation) on: | | | | |
Investments | | | (498,653,455 | ) |
Translation of other assets and liabilities denominated in foreign currencies | | | (176,911 | ) |
| | | | |
Net change in unrealized appreciation (depreciation) | | | (498,830,366 | ) |
| | | | |
Net realized and unrealized gain (loss) | | | (366,828,013 | ) |
| | | | |
Net increase (decrease) in net assets resulting from operations | | $ | (291,133,869 | ) |
| | | | |
| | | | |
| TF-14 | | Annual Report | The accompanying notes are an integral part of these financial statements. | | |
FRANKLIN TEMPLETON VARIABLE INSURANCE PRODUCTS TRUST
FINANCIAL STATEMENTS
Statements of Changes in Net Assets
| | | | | | | | |
| | | Templeton Foreign VIP Fund | |
| | | Year Ended December 31, | |
| | | 2014 | | | 2013 | |
Increase (decrease) in net assets: | | | | | | | | |
Operations: | | | | | | | | |
Net investment income | | $ | 75,694,144 | | | $ | 50,200,298 | |
Net realized gain (loss) from investments and foreign currency transactions | | | 132,002,353 | | | | 40,523,982 | |
Net change in unrealized appreciation (depreciation) on investments and translation of other assets and liabilities denominated in foreign currencies | | | (498,830,366 | ) | | | 454,985,363 | |
| | | | |
Net increase (decrease) in net assets resulting from operations | | | (291,133,869 | ) | | | 545,709,643 | |
| | | | |
Distributions to shareholders from: | | | | | | | | |
Net investment income: | | | | | | | | |
Class 1 | | | (5,893,509 | ) | | | (7,042,374 | ) |
Class 2 | | | (34,594,703 | ) | | | (42,339,120 | ) |
Class 3 | | | — | | | | (2,189,476 | ) |
Class 4 | | | (9,091,879 | ) | | | (10,745,373 | ) |
| | | | |
Total distributions to shareholders | | | (49,580,091 | ) | | | (62,316,343 | ) |
| | | | |
Capital share transactions: (Note 2) | | | | | | | | |
Class 1 | | | (13,666,266 | ) | | | (18,682,478 | ) |
Class 2 | | | 10,314,563 | | | | (199,579,456 | ) |
Class 3 | | | (96,991,462 | ) | | | (13,135,502 | ) |
Class 4 | | | 57,564,581 | | | | 10,467,967 | |
| | | | |
Total capital share transactions | | | (42,778,584 | ) | | | (220,929,469 | ) |
| | | | |
Redemption fees | | | 3,115 | | | | 19,703 | |
| | | | |
Net increase (decrease) in net assets | | | (383,489,429 | ) | | | 262,483,534 | |
Net assets: | | | | | | | | |
Beginning of year | | | 2,780,558,046 | | | | 2,518,074,512 | |
| | | | |
End of year | | $ | 2,397,068,617 | | | $ | 2,780,558,046 | |
| | | | |
Undistributed net investment income included in net assets: | | | | | | | | |
End of year | | $ | 75,444,548 | | | $ | 49,005,172 | |
| | | | |
| | | | | | |
| | | The accompanying notes are an integral part of these financial statements. | Annual Report | | | TF-15 | |
FRANKLIN TEMPLETON VARIABLE INSURANCE PRODUCTS TRUST
Notes to Financial Statements
Templeton Foreign VIP Fund
1. Organization and Significant Accounting Policies
Franklin Templeton Variable Insurance Products Trust (Trust) is registered under the Investment Company Act of 1940, as amended, (1940 Act) as an open-end management investment company, consisting of nineteen separate funds and applies the specialized accounting and reporting guidance in U.S. Generally Accepted Accounting Principles (U.S. GAAP). Templeton Foreign VIP Fund (Fund) is included in this report. The financial statements of the remaining funds in the Trust are presented separately. Shares of the Fund are generally sold only to insurance company separate accounts to fund the benefits of variable life insurance policies or variable annuity contracts. The Fund offers three classes of shares: Class 1, Class 2, and Class 4. Effective May 1, 2014, all Class 3 shares were converted to Class 2. Each class of shares differs by its distribution fees, voting rights on matters affecting a single class and its exchange privilege.
Effective May 1, 2014, Templeton Foreign Securities Fund was renamed Templeton Foreign VIP Fund.
The following summarizes the Fund’s significant accounting policies.
a. Financial Instrument Valuation
The Fund’s investments in financial instruments are carried at fair value daily. Fair value is the price that would be received to sell an asset or paid to transfer a liability in an orderly transaction between market participants on the measurement date. The Fund calculates the net asset value (NAV) per share at the close of the New York Stock Exchange (NYSE), generally at 4 p.m. Eastern time (NYSE close) on each day the NYSE is open for trading. Under compliance policies and procedures approved by the Trust’s Board of Trustees (the Board), the Fund’s administrator has responsibility for oversight of valuation, including leading the cross-functional Valuation and Liquidity Oversight Committee (VLOC). The VLOC provides administration and oversight of the Fund’s valuation policies and procedures, which are approved annually by the Board. Among other things, these procedures allow the Fund to utilize independent pricing services, quotations from securities and financial instrument dealers, and other market sources to determine fair value.
Equity securities listed on an exchange or on the NASDAQ National Market System are valued at the last quoted sale price
or the official closing price of the day, respectively. Foreign equity securities are valued as of the close of trading on the foreign stock exchange on which the security is primarily traded or as of the NYSE close, whichever is earlier. The value is then converted into its U.S. dollar equivalent at the foreign exchange rate in effect at the NYSE close on the day that the value of the security is determined. Over-the-counter (OTC) securities are valued within the range of the most recent quoted bid and ask prices. Securities that trade in multiple markets or on multiple exchanges are valued according to the broadest and most representative market. Certain equity securities are valued based upon fundamental characteristics or relationships to similar securities. Investments in open-end mutual funds and non-registered money market funds are valued at the closing NAV.
The Fund has procedures to determine the fair value of financial instruments for which market prices are not reliable or readily available. Under these procedures, the VLOC convenes on a regular basis to review such financial instruments and considers a number of factors, including significant unobservable valuation inputs, when arriving at fair value. The VLOC primarily employs a market-based approach which may use related or comparable assets or liabilities, recent transactions, market multiples, book values, and other relevant information for the investment to determine the fair value of the investment. An income-based valuation approach may also be used in which the anticipated future cash flows of the investment are discounted to calculate fair value. Discounts may also be applied due to the nature or duration of any restrictions on the disposition of the investments. Due to the inherent uncertainty of valuations of such investments, the fair values may differ significantly from the values that would have been used had an active market existed. The VLOC employs various methods for calibrating these valuation approaches including a regular review of key inputs and assumptions, transactional back-testing or disposition analysis, and reviews of any related market activity.
Trading in securities on foreign securities stock exchanges and OTC markets may be completed before the daily NYSE close. In addition, trading in certain foreign markets may not take place on every NYSE business day. Occasionally, events occur between the time at which trading in a foreign security is completed and the close of the NYSE that might call into question the reliability of the value of a portfolio security held by the Fund. As a result, differences may arise between the value of the Fund’s portfolio securities as determined at the foreign
FRANKLIN TEMPLETON VARIABLE INSURANCE PRODUCTS TRUST
NOTES TO FINANCIAL STATEMENTS
Templeton Foreign VIP Fund (continued)
market close and the latest indications of value at the close of the NYSE. In order to minimize the potential for these differences, the VLOC monitors price movements following the close of trading in foreign stock markets through a series of country specific market proxies (such as baskets of American Depositary Receipts, futures contracts and exchange traded funds). These price movements are measured against established trigger thresholds for each specific market proxy to assist in determining if an event has occurred that may call into question the reliability of the values of the foreign securities held by the Fund. If such an event occurs, the securities may be valued using fair value procedures, which may include the use of independent pricing services.
Also, when the last day of the reporting period is a non-business day, certain foreign markets may be open on those days that the NYSE is closed, which could result in differences between the value of the Fund’s portfolio securities on the last business day and the last calendar day of the reporting period. Any significant security valuation changes due to an open foreign market are adjusted and reflected by the Fund for financial reporting purposes.
b. Foreign Currency Translation
Portfolio securities and other assets and liabilities denominated in foreign currencies are translated into U.S. dollars based on the exchange rate of such currencies against U.S. dollars on the date of valuation. The Fund may enter into foreign currency exchange contracts to facilitate transactions denominated in a foreign currency. Purchases and sales of securities, income and expense items denominated in foreign currencies are translated into U.S. dollars at the exchange rate in effect on the transaction date. Portfolio securities and assets and liabilities denominated in foreign currencies contain risks that those currencies will decline in value relative to the U.S. dollar. Occasionally, events may impact the availability or reliability of foreign exchange rates used to convert the U.S. dollar equivalent value. If such an event occurs, the foreign exchange rate will be valued at fair value using procedures established and approved by the Board.
The Fund does not separately report the effect of changes in foreign exchange rates from changes in market prices on securities held. Such changes are included in net realized and unrealized gain or loss from investments on the Statement of Operations.
Realized foreign exchange gains or losses arise from sales of foreign currencies, currency gains or losses realized between the trade and settlement dates on securities transactions and the difference between the recorded amounts of dividends, interest, and foreign withholding taxes and the U.S. dollar equivalent of the amounts actually received or paid. Net unrealized foreign exchange gains and losses arise from changes in foreign exchange rates on foreign denominated assets and liabilities other than investments in securities held at the end of the reporting period.
c. Securities Lending
The Fund participates in an agency based securities lending program. The Fund receives cash collateral against the loaned securities in an amount equal to at least 102% of the fair value of the loaned securities. Collateral is maintained over the life of the loan in an amount not less than 100% of the fair value of loaned securities, as determined at the close of fund business each day; any additional collateral required due to changes in security values is delivered to the Fund on the next business day. The collateral is invested in a non-registered money fund as indicated on the Statement of Investments. The Fund receives income from the investment of cash collateral, in addition to lending fees and rebates paid by the borrower. The Fund bears the market risk with respect to the collateral investment, securities loaned, and the risk that the agent may default on its obligations to the Fund. The securities lending agent has agreed to indemnify the Fund in the event of default by a third party borrower.
d. Income and Deferred Taxes
It is the Fund’s policy to qualify as a regulated investment company under the Internal Revenue Code. The Fund intends to distribute to shareholders substantially all of its taxable income and net realized gains to relieve it from federal income and if applicable, excise taxes. As a result, no provision for U.S. federal income taxes is required.
The Fund may be subject to foreign taxation related to income received, capital gains on the sale of securities and certain foreign currency transactions in the foreign jurisdictions in which it invests. Foreign taxes, if any, are recorded based on the tax regulations and rates that exist in the foreign markets in which the Fund invests. When a capital gain tax is determined to apply the Fund records an estimated deferred tax liability in an amount that would be payable if the securities were disposed of on the valuation date. As a result of several court cases, in certain
FRANKLIN TEMPLETON VARIABLE INSURANCE PRODUCTS TRUST
NOTES TO FINANCIAL STATEMENTS
Templeton Foreign VIP Fund (continued)
1. Organization and Significant Accounting Policies (continued)
d. Income and Deferred Taxes (continued)
countries across the European Union, the Fund has filed additional tax reclaims for previously withheld taxes on dividends earned in those countries. These additional filings are subject to various administrative proceedings by the local jurisdictions’ tax authorities within the European Union, as well as a number of related judicial proceedings. At this time, uncertainty exists as to the ultimate resolution of these proceedings, the likelihood of receipt of these reclaims, and the potential timing of payment, and accordingly, no amounts are reflected in the financial statements.
The Fund recognizes the tax benefits of uncertain tax positions only when the position is “more likely than not” to be sustained upon examination by the tax authorities based on the technical merits of the tax position. As of December 31, 2014, and for all open tax years, the Fund has determined that no liability for unrecognized tax benefits is required in the Fund’s financial statements related to uncertain tax positions taken on a tax return (or expected to be taken on future tax returns). Open tax years are those that remain subject to examination and are based on each tax jurisdiction statute of limitation.
e. Security Transactions, Investment Income, Expenses and Distributions
Security transactions are accounted for on trade date. Realized gains and losses on security transactions are determined on a specific identification basis. Estimated expenses are accrued daily. Dividend income is recorded on the ex-dividend date except for certain foreign securities where the dividend rate is not available. In such cases, the dividend is recorded as soon as the information is received by the Fund. Distributions to shareholders are recorded on the ex-dividend date and are determined according to income tax regulations (tax basis). Distributable earnings determined on a tax basis may differ from earnings recorded in accordance with U.S. GAAP. These differences may be permanent or temporary. Permanent differences are reclassified among capital accounts to reflect their tax character. These reclassifications have no impact on net assets or the
results of operations. Temporary differences are not reclassified, as they may reverse in subsequent periods.
Common expenses incurred by the Trust are allocated among the funds based on the ratio of net assets of each fund to the combined net assets of the Trust. Fund specific expenses are charged directly to the fund that incurred the expense.
Realized and unrealized gains and losses and net investment income, not including class specific expenses, are allocated daily to each class of shares based upon the relative proportion of net assets of each class. Differences in per share distributions, by class, are generally due to differences in class specific expenses.
f. Accounting Estimates
The preparation of financial statements in accordance with U.S. GAAP requires management to make estimates and assumptions that affect the reported amounts of assets and liabilities at the date of the financial statements and the amounts of income and expenses during the reporting period. Actual results could differ from those estimates.
g. Redemption Fees
Redemptions and exchanges of interests in an insurance company subaccount that invested in Class 3 shares of the Fund were subject to a 1.0% short term trading fee if the interest in the subaccount had been held for less than 60 days. Such fees were retained by the Fund and accounted for as an addition to paid-in capital, allocated to each class of shares based upon the relative proportion of net assets of each class.
h. Guarantees and Indemnifications
Under the Trust’s organizational documents, its officers and trustees are indemnified by the Trust against certain liabilities arising out of the performance of their duties to the Trust. Additionally, in the normal course of business, the Trust, on behalf of the Fund, enters into contracts with service providers that contain general indemnification clauses. The Trust’s maximum exposure under these arrangements is unknown as this would involve future claims that may be made against the Trust that have not yet occurred. Currently, the Trust expects the risk of loss to be remote.
FRANKLIN TEMPLETON VARIABLE INSURANCE PRODUCTS TRUST
NOTES TO FINANCIAL STATEMENTS
Templeton Foreign VIP Fund (continued)
2. Shares of Beneficial Interest
At December 31, 2014, there were an unlimited number of shares authorized (without par value). Transactions in the Fund’s shares were as follows:
| | | | | | | | | | | | | | | | | | |
| | | Year Ended December 31, | |
| | | 2014 | | | | | 2013 | |
| | | Shares | | | Amount | | | | | Shares | | | Amount | |
| | | | | |
| Class 1 Shares: | | | | | | | | | | | | | | | | | | |
Shares sold | | | 620,933 | | | $ | 10,378,692 | | | | | | 496,052 | | | $ | 7,884,222 | |
Shares issued in reinvestment of distributions | | | 329,615 | | | | 5,893,509 | | | | | | 468,554 | | | | 7,042,374 | |
Shares redeemed | | | (1,754,194 | ) | | | (29,938,467 | ) | | | | | (2,142,399 | ) | | | (33,609,074 | ) |
| | | | |
Net increase (decrease) | | | (803,646 | ) | | $ | (13,666,266 | ) | | | | | (1,177,793 | ) | | $ | (18,682,478 | ) |
| | | | |
| Class 2 Shares: | | | | | | | | | | | | | | | | | | |
Shares sold | | | 18,861,260 | | | $ | 315,063,591 | | | | | | 9,932,214 | | | $ | 152,564,880 | |
Shares issued in reinvestment of distributions | | | 1,967,844 | | | | 34,594,703 | | | | | | 2,864,622 | | | | 42,339,120 | |
Shares redeemed | | | (20,169,191 | ) | | | (339,343,731 | ) | | | | | (25,480,434 | ) | | | (394,483,456 | ) |
| | | | |
Net increase (decrease) | | | 659,913 | | | $ | 10,314,563 | | | | | | (12,683,598 | ) | | $ | (199,579,456 | ) |
| | | | |
| Class 3 Sharesa: | | | | | | | | | | | | | | | | | | |
Shares sold | | | 149,791 | | | $ | 2,553,688 | | | | | | 558,566 | | | $ | 8,455,794 | |
Shares issued in reinvestment of distributions | | | — | | | | — | | | | | | 148,742 | | | | 2,189,476 | |
Shares redeemed | | | (5,703,761 | ) | | | (99,545,150 | ) | | | | | (1,552,340 | ) | | | (23,780,772 | ) |
| | | | |
Net increase (decrease) | | | (5,553,970 | ) | | $ | (96,991,462 | ) | | | | | (845,032 | ) | | $ | (13,135,502 | ) |
| | | | |
| Class 4 Shares: | | | | | | | | | | | | | | | | | | |
Shares sold | | | 6,994,024 | | | $ | 113,655,992 | | | | | | 5,690,758 | | | $ | 88,119,947 | |
Shares issued on reinvestment of distributions | | | 513,375 | | | | 9,091,879 | | | | | | 721,650 | | | | 10,745,373 | |
Shares redeemed | | | (3,859,063 | ) | | | (65,183,290 | ) | | | | | (5,613,738 | ) | | | (88,397,353 | ) |
| | | | |
Net increase (decrease) | | | 3,648,336 | | | $ | 57,564,581 | | | | | | 798,670 | | | $ | 10,467,967 | |
| | | | |
aEffective May 1, 2014, all Class 3 Shares were converted to Class 2.
3. Transactions With Affiliates
Franklin Resources, Inc. is the holding company for various subsidiaries that together are referred to as Franklin Templeton Investments. Certain officers and trustees of the Fund are also officers and/or directors of the following subsidiaries:
| | |
| Subsidiary | | Affiliation |
Templeton Investment Counsel, LLC (TIC) | | Investment manager |
Franklin Templeton Services, LLC (FT Services) | | Administrative manager |
Franklin Templeton Distributors, Inc. (Distributors) | | Principal underwriter |
Franklin Templeton Investor Services, LLC (Investor Services) | | Transfer agent |
FRANKLIN TEMPLETON VARIABLE INSURANCE PRODUCTS TRUST
NOTES TO FINANCIAL STATEMENTS
Templeton Foreign VIP Fund (continued)
3. Transactions With Affiliates (continued)
a. Management Fees
The Fund pays an investment management fee to TIC based on the average daily net assets of the Fund as follows:
| | |
| Annualized Fee Rate | | Net Assets |
0.900% | | Up to and including $200 million |
0.810% | | Over $200 million, up to and including $700 million |
0.775% | | Over $700 million, up to and including $1.2 billion |
0.750% | | Over $1.2 billion, up to and including $1.3 billion |
0.675% | | Over $1.3 billion, up to and including $10 billion |
0.655% | | Over $10 billion, up to and including $15 billion |
0.635% | | Over $15 billion, up to and including $20 billion |
0.615% | | In excess of $20 billion |
Effective May 1, 2014 the Fund combined its investment management and administration agreements as approved by the Board. The fees paid under the combined agreement do not exceed the aggregate fees that were paid under the separate agreements.
Prior to May 1, 2014, the Fund paid fees to TIC based on the average daily net assets of the Fund as follows:
| | |
| Annualized Fee Rate | | Net Assets |
0.750% | | Up to and including $200 million |
0.675% | | Over $200 million, up to and including $1.3 billion |
0.600% | | Over $1.3 billion, up to and including $10 billion |
0.580% | | Over $10 billion, up to and including $15 billion |
0.560% | | Over $15 billion, up to and including $20 billion |
0.540% | | In excess of $20 billion |
b. Administrative Fees
Effective May 1, 2014, under an agreement with TIC, FT Services provides administrative services to the Fund. The fee is paid by TIC based on the Fund’s average daily net assets, and is not an additional expense of the Fund.
Prior to May 1, 2014, the Fund paid fees to FT Services based on the average daily net assets of the Fund as follows:
| | |
| Annualized Fee Rate | | Net Assets |
0.150% | | Up to and including $200 million |
0.135% | | Over $200 million, up to and including $700 million |
0.100% | | Over $700 million, up to and including $1.2 billion |
0.075% | | In excess of $1.2 billion |
c. Distribution Fees
The Board has adopted distribution plans for Class 2, Class 3, and Class 4 shares pursuant to Rule 12b-1 under the 1940 Act. Under the Fund’s compensation distribution plans, the Fund pays Distributors for costs incurred in connection with the servicing, sale and distribution of the Fund’s shares up to 0.25%, 0.35%, and 0.35% per year of its average daily net assets of Class 2, Class 3, and Class 4, respectively. Some distribution fees are not charged on shares held by affiliates. The Board has agreed to limit the current rate to 0.25% per year for Class 3. The plan year, for purposes of monitoring compliance with the maximum annual plan rates, is February 1 through January 31.
FRANKLIN TEMPLETON VARIABLE INSURANCE PRODUCTS TRUST
NOTES TO FINANCIAL STATEMENTS
Templeton Foreign VIP Fund (continued)
d. Transfer Agent Fees
Investor Services, under terms of an agreement, performs shareholder servicing for the Fund and is not paid by the Fund for the services.
e. Investments in Institutional Fiduciary Trust Money Market Portfolio
The Fund invests in Institutional Fiduciary Trust Money Market Portfolio (Sweep Money Fund), an affiliated open-end management investment company. Management fees paid by the Fund are waived on assets invested in the Sweep Money Fund, as noted on the Statement of Operations, in an amount not to exceed the management and administrative fees paid directly or indirectly by the Sweep Money Fund. Prior to January 1, 2014, the waiver was accounted for as a reduction to management fees.
4. Expense Offset Arrangement
The Fund has entered into an arrangement with its custodian whereby credits realized as a result of uninvested cash balances are used to reduce a portion of the Fund’s custodian expenses. During the year ended December 31, 2014, there were no credits earned.
5. Income Taxes
For tax purposes, capital losses may be carried over to offset future capital gains. Capital loss carryforwards with no expiration, if any, must be fully utilized before those losses with expiration dates. During the year ended December 31, 2014, the Fund utilized $55,459,546 of capital loss carryforwards.
The tax character of distributions paid during the years ended December 31, 2014 and 2013, was as follows:
| | | | | | | | |
| | | 2014 | | | 2013 | |
Distributions paid from ordinary income | | $ | 49,580,091 | | | $ | 62,316,343 | |
| | | | |
At December 31, 2014, the cost of investments, net unrealized appreciation (depreciation), undistributed ordinary income and undistributed long term capital gains for income tax purposes were as follows:
| | | | |
Cost of investments | | $ | 2,237,678,404 | |
| | | | |
Unrealized appreciation | | $ | 405,796,683 | |
Unrealized depreciation | | | (257,257,861 | ) |
| | | | |
Net unrealized appreciation (depreciation) | | $ | 148,538,822 | |
| | | | |
Undistributed ordinary income | | $ | 75,444,548 | |
Undistributed long term capital gains | | | 76,753,457 | |
| | | | |
Distributable earnings | | $ | 152,198,005 | |
| | | | |
Differences between income and/or capital gains as determined on a book basis and a tax basis are primarily due to differing treatment of foreign currency transactions.
6. Investment Transactions
Purchases and sales of investments (excluding short term securities) for the year ended December 31, 2014, aggregated $651,409,315 and $791,730,248, respectively.
7. Concentration of Risk
Investing in foreign securities may include certain risks and considerations not typically associated with investing in U.S. securities, such as fluctuating currency values and changing local and regional economic, political and social conditions, which may result in greater market volatility. In addition, certain foreign securities may not be as liquid as U.S. securities.
FRANKLIN TEMPLETON VARIABLE INSURANCE PRODUCTS TRUST
NOTES TO FINANCIAL STATEMENTS
Templeton Foreign VIP Fund (continued)
8. Credit Facility
The Fund, together with other U.S. registered and foreign investment funds (collectively, Borrowers), managed by Franklin Templeton Investments, are borrowers in a joint syndicated senior unsecured credit facility totaling $1.5 billion (Global Credit Facility) which matured on February 13, 2015. This Global Credit Facility provides a source of funds to the Borrowers for temporary and emergency purposes, including the ability to meet future unanticipated or unusually large redemption requests. The Borrowers expect to renew the Global Credit Facility for a total of $2 billion effective February 13, 2015, which matures on February 12, 2016.
Under the terms of the Global Credit Facility, the Fund shall, in addition to interest charged on any borrowings made by the Fund and other costs incurred by the Fund, pay its share of fees and expenses incurred in connection with the implementation and maintenance of the Global Credit Facility, based upon its relative share of the aggregate net assets of all of the Borrowers, including an annual commitment fee of 0.07% based upon the unused portion of the Global Credit Facility. These fees are reflected in other expenses on the Statement of Operations. During the year ended December 31, 2014, the Fund did not use the Global Credit Facility.
9. Fair Value Measurements
The Fund follows a fair value hierarchy that distinguishes between market data obtained from independent sources (observable inputs) and the Fund’s own market assumptions (unobservable inputs). These inputs are used in determining the value of the Fund’s financial instruments and are summarized in the following fair value hierarchy:
| | • | | Level 1 – quoted prices in active markets for identical financial instruments |
| | • | | Level 2 – other significant observable inputs (including quoted prices for similar financial instruments, interest rates, prepayment speed, credit risk, etc.) |
| | • | | Level 3 – significant unobservable inputs (including the Fund’s own assumptions in determining the fair value of financial instruments) |
The input levels are not necessarily an indication of the risk or liquidity associated with financial instruments at that level.
For movements between the levels within the fair value hierarchy, the Fund has adopted a policy of recognizing the transfers as of the date of the underlying event which caused the movement.
A summary of inputs used as of December 31, 2014, in valuing the Fund’s assets carried at fair value, is as follows:
| | | | | | | | | | | | | | | | |
| | | Level 1 | | | Level 2 | | | Level 3 | | | Total | |
| | | | |
| Assets: | | | | | | | | | | | | | | | | |
Investments in Securities: | | | | | | | | | | | | | | | | |
Equity Investmentsa,b | | $ | 2,227,640,064 | | | $ | — | | | $ | — | | | $ | 2,227,640,064 | |
Short Term Investments | | | 135,800,137 | | | | 22,777,025 | | | | | | | | 158,577,162 | |
| | | | |
Total Investments in Securities | | $ | 2,363,440,201 | | | $ | 22,777,025 | | | $ | — | | | $ | 2,386,217,226 | |
| | | | |
aIncludes common and preferred stocks.
bFor detailed categories, see the accompanying Statement of Investments.
10. New Accounting Pronouncements
In June 2014, the Financial Accounting Standards Board issued Accounting Standards Update (ASU) No. 2014-11, Transfers and Servicing (Topic 860), Repurchase-to-Maturity Transactions, Repurchase Financings, and Disclosures. The ASU changes the accounting for certain repurchase agreements and expands disclosure requirements related to repurchase agreements, securities lending, repurchase-to-maturity and similar transactions. The ASU is effective for interim and annual reporting periods beginning after December 15, 2014. Management has reviewed the requirements and believes the adoption of this ASU will not have a material impact on the financial statements.
FRANKLIN TEMPLETON VARIABLE INSURANCE PRODUCTS TRUST
NOTES TO FINANCIAL STATEMENTS
Templeton Foreign VIP Fund (continued)
11. Subsequent Events
The Fund has evaluated subsequent events through the issuance of the financial statements and determined that no events have occurred that require disclosure other than those already disclosed in the financial statements.
Abbreviations
| | |
| Selected Portfolio |
| |
| ADR | | American Depositary Receipt |
| |
| IDR | | International Depositary Receipt |
FRANKLIN TEMPLETON VARIABLE INSURANCE PRODUCTS TRUST
Report of Independent Registered Public Accounting Firm
Templeton Foreign VIP Fund
To the Board of Trustees and Shareholders of Franklin Templeton Variable Insurance Products Trust
In our opinion, the accompanying statement of assets and liabilities, including the statement of investments, and the related statements of operations and of changes in net assets and the financial highlights present fairly, in all material respects, the financial position of Templeton Foreign VIP Fund (the “Fund”) at December 31, 2014, the results of its operations for the year then ended, the changes in its net assets for each of the two years in the period then ended and the financial highlights for each of the five years in the period then ended, in conformity with accounting principles generally accepted in the United States of America. These financial statements and financial highlights (hereafter referred to as “financial statements”) are the responsibility of the Fund’s management. Our responsibility is to express an opinion on these financial statements based on our audits. We conducted our audits of these financial statements in accordance with the standards of the Public Company Accounting Oversight Board (United States). Those standards require that we plan and perform the audit to obtain reasonable assurance about whether the financial statements are free of material misstatement. An audit includes examining, on a test basis, evidence supporting the amounts and disclosures in the financial statements, assessing the accounting principles used and significant estimates made by management, and evaluating the overall financial statement presentation. We believe that our audits, which included confirmation of securities at December 31, 2014 by correspondence with the custodian, transfer agent and brokers, provide a reasonable basis for our opinion.
PricewaterhouseCoopers LLP
San Francisco, California
February 13, 2015
FRANKLIN TEMPLETON VARIABLE INSURANCE PRODUCTS TRUST
Tax Information (unaudited)
Templeton Foreign VIP Fund
At December 31, 2014, more than 50% of the Fund’s total assets were invested in securities of foreign issuers. In most instances, foreign taxes were withheld from income paid to the Fund on these investments. The Fund elects to treat foreign taxes paid as allowed under Section 853 of the Internal Revenue Code. This election will allow shareholders of record as of the 2015 distribution date, to treat their proportionate share of foreign taxes paid by the Fund as having been paid directly by them. The shareholder shall consider these amounts as foreign taxes paid in the tax year in which they receive the Fund distribution.
Templeton Global Bond VIP Fund
(Formerly, Templeton Global Bond Securities Fund)
We are pleased to bring you Templeton Global Bond VIP Fund’s annual report for the fiscal year ended December 31, 2014.
Class 2 Performance Summary as of December 31, 2014
Average annual total return of Class 2 shares represents the average annual change in value, assuming reinvestment of dividends and capital gains. Average returns smooth out variations in returns, which can be significant; they are not the same as year-by-year results.
| | | | | | | | | | | | |
| Periods ended 12/31/14 | | 1-Year | | | 5-Year | | | 10-Year | |
Average Annual Total Return | | | +1.83% | | | | +6.20% | | | | +7.53% | |
Performance reflects the Fund’s Class 2 operating expenses, but does not include any contract fees, expenses or sales charges. If they had been included, performance would be lower. These charges and deductions, particularly for variable life policies, can have a significant effect on contract values and insurance benefits. See the contract prospectus for a complete description of these expenses, including sales charges.
Performance data represent past performance, which does not guarantee future results. Investment return and principal value will fluctuate, and you may have a gain or loss when you sell your shares. Current performance may differ from figures shown.
Total Return Index Comparison for a Hypothetical $10,000 Investment (1/1/05–12/31/14)
The graph below shows the change in value of a hypothetical $10,000 investment in the Fund over the indicated period and includes reinvestment of any income or distributions. The Fund’s performance is compared to the performance of the J.P. Morgan (JPM) Global Government Bond Index (GGBI), the Citigroup World Government Bond Index (WGBI) and the Consumer Price Index (CPI). One cannot invest directly in an index, and an index is not representative of the Fund’s portfolio. Please see Important Notes to Performance Information preceding the Fund Summaries.
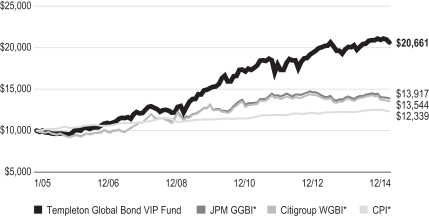
*Source: Morningstar. Please see Index Descriptions following the Fund Summaries.
TEMPLETON GLOBAL BOND VIP FUND
Fund Goal and Main Investments
Templeton Global Bond VIP Fund seeks high current income, consistent with preservation of capital, with capital appreciation as a secondary consideration. Under normal market conditions, the Fund invests at least 80% of its net assets in bonds, which include debt securities of any maturity, such as bonds, notes, bills and debentures.
Fund Risks
All investments involve risks, including possible loss of principal. Currency rates may fluctuate significantly over short periods of time, and can reduce returns. Derivatives, including currency management strategies, involve costs and can create economic leverage in the portfolio that may result in significant volatility and cause the Fund to participate in losses (as well as enable gains) on an amount that exceeds the Fund’s initial investment. The Fund may not achieve the anticipated benefits and may realize losses when a counterparty fails to perform as promised. Foreign securities involve special risks, including currency fluctuations and economic and political uncertainties. Investments in emerging markets involve heightened risks related to the same factors, in addition to those associated with these markets’ smaller size and lesser liquidity. Investments in lower rated bonds include higher risk of default and loss of principal. Changes in interest rates will affect the value of the Fund’s portfolio and its share price and yield. Bond prices generally move in the opposite direction of interest rates. As prices of bonds in the Fund adjust to a rise in interest rates, the Fund’s share price may decline. The Fund is also nondiversified, which involves the risk of greater price fluctuation than a more diversified portfolio. Changes in the financial strength of a bond issuer or in a bond’s credit rating may affect its value. The Fund is actively managed but there is no guarantee that the manager’s investment decisions will produce the desired results. The Fund’s prospectus also includes a description of the main investment risks.
Performance Overview
You can find the Fund’s one-year total return in the Performance Summary. For comparison, the JPM GGBI produced a +0.67% total return, and the Citigroup WGBI had a -0.48% total return for the same period.1
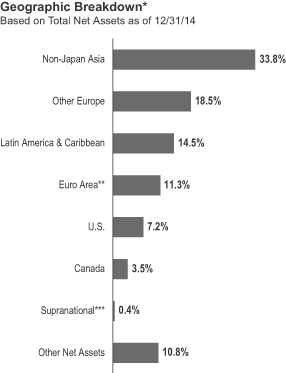
*Percentages reflect certain derivatives held in the portfolio (or their underlying reference assets) and may not total 100% or may be negative due to rounding, use of derivatives, unsettled trades or other factors.
**The Fund’s euro area investments were in Ireland, Slovenia and Portugal.
***The Fund’s supranational investment was denominated in the Mexican peso.
Economic and Market Overview
During the period, global financial markets were broadly influenced by the pickup in U.S. growth, China’s economic stabilization, and the abundance of global liquidity from the Bank of Japan (BOJ) and the European Central Bank (ECB). We continued to see differentiation among specific emerging market economies; some had healthy current account and fiscal balances with strong export-driven economies, while others struggled with deficits and economic imbalances.
The U.S. dollar broadly strengthened over the course of the year while oil prices weakened significantly, particularly in the final months. Global liquidity from the BOJ and the ECB helped dampen volatility in emerging markets, and it helped compensate for the withdrawal of liquidity from the ending of the U.S. Federal Reserve’s (Fed’s) bond-buying program in October. However, several emerging market currencies depreciated during the period.
1. Source: Morningstar.
One cannot invest directly in an index, and an index is not representative of the Fund’s portfolio. Please see Index Descriptions following the
Fund Summaries.
TEMPLETON GLOBAL BOND VIP FUND
In late October, the BOJ introduced a new round of quantitative easing (QE) with an indefinite time horizon. The annual level of asset purchasing was raised to 80 trillion yen, a level approximately equal to the U.S. Fed’s former QE program. This massive amount of liquidity had significant implications for global markets. Although Japan’s QE was positive for global risk assets, it contributed to further yen depreciation.
In Europe, economic data were mixed with a persistent lack of inflation. Eurozone bond yields remained around historical lows at the end of the period. The ECB’s renewed commitment to increase the size of its balance sheet will likely maintain weakening pressure on the euro, in our view. China’s growth moderated during the period, but the country’s economy did not face a “hard landing” and did not have a major impact on global aggregate demand.
Investment Strategy
We invest selectively in bonds around the world based upon our assessment of changing market, political and economic conditions. While seeking opportunities, we monitor various factors including changes in interest rates, currency exchange rates and credit risks. We seek to manage the Fund’s exposure to various currencies and may utilize currency forward contracts.
What is a currency forward contract?
A currency forward contract is an agreement between the Fund and a counterparty to buy or sell a foreign currency at a specific exchange rate on a future date.
Manager’s Discussion
The core of our strategy remained seeking to position ourselves to navigate a rising rate environment. Thus, we continued to maintain short portfolio duration while aiming at a negative correlation with U.S. Treasury rates. We also actively sought opportunities that could potentially offer positive real yields without taking undue interest rate risk. We favor countries that have solid underlying fundamentals and policymakers who have stayed ahead of the curve regarding fiscal, monetary and financial policy. We seek to augment this positioning with select opportunities in emerging markets and with a number of currency strategies.
We believe it is essential for investors to understand and differentiate between declines that are related to market noise and those that are caused by fundamental developments. Our approach also emphasizes having the right time frame. We
| | | | |
Currency Breakdown* | | | |
| 12/31/14 | | | |
| | | % of Total
Net Assets | |
| Americas | | | 90.7% | |
| U.S. Dollar | | | 66.0% | |
| Mexican Peso | | | 13.4% | |
| Brazilian Real | | | 4.7% | |
| Canadian Dollar | | | 3.5% | |
| Chilean Peso | | | 3.0% | |
| Peruvian Nuevo Sol | | | 0.1% | |
| Asia Pacific | | | 23.2% | |
| South Korean Won | | | 15.1% | |
| Malaysian Ringgit | | | 14.0% | |
| Singapore Dollar | | | 8.0% | |
| Indonesian Rupiah | | | 4.2% | |
| Indian Rupee | | | 2.4% | |
| Sri Lankan Rupee | | | 1.3% | |
| Philippine Peso | | | 1.1% | |
| Japanese Yen | | | -22.9% | |
| Europe | | | -13.9% | |
| Polish Zloty | | | 8.7% | |
| Hungarian Forint | | | 4.3% | |
| Swedish Krona | | | 1.7% | |
| Euro | | | -28.6% | |
*Percentages reflect certain derivatives held in the portfolio (or their underlying reference assets) and may not total 100% or may be negative due to rounding, use of derivatives, unsettled trades or other factors.
The dollar value, number of shares or principal amount, and names of all portfolio holdings are listed in the Fund’s Statement of Investments.
recognize that when investing globally, many opportunities take time to materialize, and we are willing to ride through short-term volatility.
During the period, the Fund’s absolute performance benefited from interest rate strategies, while sovereign credit exposures and currency positions had a largely neutral effect. The Fund maintained a defensive approach regarding interest rates in developed and emerging markets. Select duration exposures in Europe contributed to absolute return. Among currencies, the Fund’s net-negative positions in the Japanese yen and the euro contributed to absolute performance. Currency positions in the Americas and Asia ex-Japan detracted from absolute return, as did positions in peripheral European currencies against the euro.
TEMPLETON GLOBAL BOND VIP FUND
What is duration?
Duration is a measure of a bond’s price sensitivity to interest rate changes. In general, a portfolio of securities with a lower duration can be expected to be less sensitive to interest rate changes than a portfolio with a higher duration.
Relative to the JPM GGBI, currency positions contributed to performance, while interest rate strategies detracted, and sovereign credit exposures had a largely neutral effect. Underweighted positioning in the euro and the Japanese yen contributed to relative performance during the period. However, overweighted currency positions in the Americas and Asia ex-Japan detracted from relative return, as did overweighted positions in peripheral European currencies against the euro. The Fund maintained a shorter duration position relative to the JPM
GGBI. Select underweighted duration exposures in Europe and underweighted duration exposure in the U.S. detracted from relative performance.
Thank you for your participation in Templeton Global Bond VIP Fund. We look forward to serving your future investment needs.
The foregoing information reflects our analysis, opinions and portfolio holdings as of December 31, 2014, the end of the reporting period. The way we implement our main investment strategies and the resulting portfolio holdings may change depending on factors such as market and economic conditions. These opinions may not be relied upon as investment advice or an offer for a particular security. The information is not a complete analysis of every aspect of any market, country, industry, security or the Fund. Statements of fact are from sources considered reliable, but the investment manager makes no representation or warranty as to their completeness or accuracy. Although historical performance is no guarantee of future results, these insights may help you understand our investment management philosophy.
TEMPLETON GLOBAL BOND VIP FUND
Class 2 Fund Expenses
As an investor in a variable insurance contract (Contract) that indirectly provides for investment in an underlying mutual fund, you can incur transaction and/or ongoing expenses at both the Fund level and the Contract level.
| • | | Transaction expenses can include sales charges (loads) on purchases, redemption fees, surrender fees, transfer fees and premium taxes. |
| • | | Ongoing expenses can include management fees, distribution and service (12b-1) fees, contract fees, annual maintenance fees, mortality and expense risk fees and other fees and expenses. All mutual funds and Contracts have some types of ongoing expenses. |
The expenses shown in the table are meant to highlight ongoing expenses at the Fund level only and do not include ongoing expenses at the Contract level, or transaction expenses at either the Fund or Contract level. While the Fund does not have transaction expenses, if the transaction and ongoing expenses at the Contract level were included, the expenses shown below would be higher. You should consult your Contract prospectus or disclosure document for more information.
The table shows Fund-level ongoing expenses and can help you understand these expenses and compare them with those of other mutual funds offered through the Contract. The table assumes a $1,000 investment held for the six months indicated. Please refer to the Fund prospectus for additional information on operating expenses.
Actual Fund Expenses
The first line (Actual) of the table provides actual account values and expenses. The “Ending Account Value” is derived from the Fund’s actual return, which includes the effect of ongoing Fund expenses, but does not include the effect of ongoing Contract expenses.
You can estimate the Fund-level expenses you incurred during the period by following these steps. Of course, your account value and expenses will differ from those in this illustration:
| 1. | Divide your account value by $1,000. |
If an account had an $8,600 value,
then $8,600 ÷ $1,000 = 8.6.
| 2. | Multiply the result by the number under the heading “Fund-Level Expenses Incurred During Period.” |
If Fund-Level Expenses Incurred During Period were $7.50, then 8.6 × $7.50 = $64.50.
In this illustration, the estimated expenses incurred this period at the Fund level are $64.50.
Hypothetical Example for Comparison with Other Mutual Funds
Information in the second line (Hypothetical) of the table can help you compare ongoing expenses of the Fund with those of other mutual funds offered through the Contract. This information may not be used to estimate the actual ending account balance or expenses you incurred during the period. The hypothetical “Ending Account Value” is based on the Fund’s actual expense ratio for each class and an assumed 5% annual rate of return before expenses, which does not represent the Fund’s actual return. The figure under the heading “Fund-Level Expenses Incurred During Period” shows the hypothetical expenses your account would have incurred under this scenario. You can compare this figure with the 5% hypothetical examples that appear in shareholder reports of other funds offered through a Contract.
| | | | | | | | | | | | |
| Class 2 | | Beginning Account Value 7/1/14 | | | Ending Account Value 12/31/14 | | | Fund-Level Expenses
Incurred During Period* 7/1/14–12/31/14 | |
Actual | | | $1,000 | | | | $ 986.80 | | | | $3.86 | |
Hypothetical (5% return before expenses) | | | $1,000 | | | | $1,021.32 | | | | $3.92 | |
*Expenses are calculated using the most recent six-month annualized expense ratio for the Fund’s Class 2 shares (0.77%), which does not include any ongoing expenses of the Contract for which the Fund is an investment option, multiplied by the average account value over the period, multiplied by 184/365 to reflect the one-half year period.
FRANKLIN TEMPLETON VARIABLE INSURANCE PRODUCTS TRUST
Financial Highlights
Templeton Global Bond VIP Fund
| | | | | | | | | | | | | | | | | | | | |
| | | Year Ended December 31, | |
| | | 2014 | | | 2013 | | | 2012 | | | 2011 | | | 2010 | |
| Class 1 | | | | | | | | | | | | | | | | | | | | |
Per share operating performance
(for a share outstanding throughout the year) | | | | | | | | | | | | | | | | | | | | |
| | | | | |
Net asset value, beginning of year | | | $19.15 | | | | $20.01 | | | | $18.61 | | | | $19.94 | | | | $17.72 | |
| | | | |
| | | | | |
| Income from investment operationsa: | | | | | | | | | | | | | | | | | | | | |
| | | | | |
Net investment incomeb | | | 0.58 | | | | 0.64 | | | | 0.72 | | | | 0.87 | | | | 1.00 | |
| | | | | |
Net realized and unrealized gains (losses) | | | (0.16 | ) | | | (0.30 | ) | | | 1.99 | | | | (0.92 | ) | | | 1.58 | |
| | | | |
Total from investment operations | | | 0.42 | | | | 0.34 | | | | 2.71 | | | | (0.05 | ) | | | 2.58 | |
| | | | |
| | | | | |
| Less distributions from: | | | | | | | | | | | | | | | | | | | | |
| | | | | |
Net investment income and net foreign currency gains | | | (1.01 | ) | | | (0.96 | ) | | | (1.28 | ) | | | (1.15 | ) | | | (0.31 | ) |
| | | | | |
Net realized gains | | | — | | | | (0.24 | ) | | | (0.03 | ) | | | (0.13 | ) | | | (0.05 | ) |
| | | | |
Total distributions | | | (1.01 | ) | | | (1.20 | ) | | | (1.31 | ) | | | (1.28 | ) | | | (0.36 | ) |
| | | | |
Redemption feesc | | | — | | | | — | | | | — | | | | — | | | | — | |
| | | | |
Net asset value, end of year | | | $18.56 | | | | $19.15 | | | | $20.01 | | | | $18.61 | | | | $19.94 | |
| | | | |
| | | | | |
Total returnd | | | 2.12% | | | | 1.89% | | | | 15.31% | | | | (0.61)% | | | | 14.71% | |
| | | | | |
| Ratios to average net assets | | | | | | | | | | | | | | | | | | | | |
| | | | | |
Expensese | | | 0.51% | | | | 0.51% | | | | 0.55% | | | | 0.56% | | | | 0.55% | |
| | | | | |
Net investment income | | | 3.08% | | | | 3.26% | | | | 3.71% | | | | 4.40% | | | | 5.27% | |
| | | | | |
| Supplemental data | | | | | | | | | | | | | | | | | | | | |
| | | | | |
Net assets, end of year (000’s) | | | $323,491 | | | | $280,963 | | | | $307,142 | | | | $269,819 | | | | $272,232 | |
| | | | | |
Portfolio turnover rate | | | 39.14% | | | | 34.39% | | | | 43.26% | | | | 34.18% | | | | 8.77% | |
aThe amount shown for a share outstanding throughout the period may not correlate with the Statement of Operations for the period due to the timing of sales and repurchases of the Fund shares in relation to income earned and/or fluctuating fair value of the investments of the Fund.
bBased on average daily shares outstanding.
cAmount rounds to less than $0.01 per share.
dTotal return does not include fees, charges or expenses imposed by the variable annuity and life insurance contracts for which the Franklin Templeton Variable Insurance Products Trust serves as an underlying investment vehicle.
eBenefit of expense reduction rounds to less than 0.01%.
| | | | |
| TGB-6 | | Annual Report | The accompanying notes are an integral part of these financial statements. | | |
FRANKLIN TEMPLETON VARIABLE INSURANCE PRODUCTS TRUST
FINANCIAL HIGHLIGHTS
Templeton Global Bond VIP Fund (continued)
| | | | | | | | | | | | | | | | | | | | |
| | | Year Ended December 31, | |
| | | 2014 | | | 2013 | | | 2012 | | | 2011 | | | 2010 | |
| Class 2 | | | | | | | | | | | | | | | | | | | | |
Per share operating performance
(for a share outstanding throughout the year) | | | | | | | | | | | | | | | | | | | | |
| | | | | |
Net asset value, beginning of year | | | $18.60 | | | | $19.47 | | | | $18.15 | | | | $19.49 | | | | $17.34 | |
| | | | |
| | | | | |
| Income from investment operationsa: | | | | | | | | | | | | | | | | | | | | |
| | | | | |
Net investment incomeb | | | 0.52 | | | | 0.57 | | | | 0.65 | | | | 0.79 | | | | 0.93 | |
| | | | | |
Net realized and unrealized gains (losses) | | | (0.17 | ) | | | (0.27 | ) | | | 1.94 | | | | (0.89 | ) | | | 1.54 | |
| | | | |
Total from investment operations | | | 0.35 | | | | 0.30 | | | | 2.59 | | | | (0.10 | ) | | | 2.47 | |
| | | | |
| | | | | |
| Less distributions from: | | | | | | | | | | | | | | | | | | | | |
| | | | | |
Net investment income and net foreign currency gains | | | (0.96 | ) | | | (0.93 | ) | | | (1.24 | ) | | | (1.11 | ) | | | (0.27 | ) |
| | | | | |
Net realized gains | | | — | | | | (0.24 | ) | | | (0.03 | ) | | | (0.13 | ) | | | (0.05 | ) |
| | | | |
Total distributions | | | (0.96 | ) | | | (1.17 | ) | | | (1.27 | ) | | | (1.24 | ) | | | (0.32 | ) |
| | | | |
Redemption feesc | | | — | | | | — | | | | — | | | | — | | | | — | |
| | | | |
Net asset value, end of year | | | $17.99 | | | | $18.60 | | | | $19.47 | | | | $18.15 | | | | $19.49 | |
| | | | |
| | | | | |
Total returnd | | | 1.83% | | | | 1.63% | | | | 15.07% | | | | (0.87)% | | | | 14.45% | |
| | | | | |
| Ratios to average net assets | | | | | | | | | | | | | | | | | | | | |
| | | | | |
Expensese | | | 0.76% | | | | 0.76% | | | | 0.80% | | | | 0.81% | | | | 0.80% | |
| | | | | |
Net investment income | | | 2.83% | | | | 3.01% | | | | 3.46% | | | | 4.15% | | | | 5.02% | |
| | | | | |
| Supplemental data | | | | | | | | | | | | | | | | | | | | |
| | | | | |
Net assets, end of year (000’s) | | | $3,177,638 | | | | $2,826,039 | | | | $2,418,229 | | | | $1,812,814 | | | | $1,490,794 | |
| | | | | |
Portfolio turnover rate | | | 39.14% | | | | 34.39% | | | | 43.26% | | | | 34.18% | | | | 8.77% | |
aThe amount shown for a share outstanding throughout the period may not correlate with the Statement of Operations for the period due to the timing of sales and repurchases of the Fund shares in relation to income earned and/or fluctuating fair value of the investments of the Fund.
bBased on average daily shares outstanding.
cAmount rounds to less than $0.01 per share.
dTotal return does not include fees, charges or expenses imposed by the variable annuity and life insurance contracts for which the Franklin Templeton Variable Insurance Products Trust serves as an underlying investment vehicle.
eBenefit of expense reduction rounds to less than 0.01%.
| | | | | | |
| | | The accompanying notes are an integral part of these financial statements. | Annual Report | | | TGB-7 | |
FRANKLIN TEMPLETON VARIABLE INSURANCE PRODUCTS TRUST
FINANCIAL HIGHLIGHTS
Templeton Global Bond VIP Fund (continued)
| | | | | | | | | | | | | | | | | | | | |
| | | Year Ended December 31, | |
| | | 2014 | | | 2013 | | | 2012 | | | 2011 | | | 2010 | |
| Class 4 | | | | | | | | | | | | | | | | | | | | |
Per share operating performance
(for a share outstanding throughout the year) | | | | | | | | | | | | | | | | | | | | |
| | | | | |
Net asset value, beginning of year | | | $18.97 | | | | $19.82 | | | | $18.44 | | | | $19.78 | | | | $17.61 | |
| | | | |
| | | | | |
| Income from investment operationsa: | | | | | | | | | | | | | | | | | | | | |
| | | | | |
Net investment incomeb | | | 0.51 | | | | 0.56 | | | | 0.64 | | | | 0.79 | | | | 0.93 | |
| | | | | |
Net realized and unrealized gains (losses) | | | (0.18 | ) | | | (0.28 | ) | | | 1.98 | | | | (0.91 | ) | | | 1.56 | |
| | | | |
Total from investment operations | | | 0.33 | | | | 0.28 | | | | 2.62 | | | | (0.12 | ) | | | 2.49 | |
| | | | |
| | | | | |
| Less distributions from: | | | | | | | | | | | | | | | | | | | | |
| | | | | |
Net investment income and net foreign currency gains | | | (0.92 | ) | | | (0.89 | ) | | | (1.21 | ) | | | (1.09 | ) | | | (0.27 | ) |
| | | | | |
Net realized gains | | | — | | | | (0.24 | ) | | | (0.03 | ) | | | (0.13 | ) | | | (0.05 | ) |
| | | | |
Total distributions | | | (0.92 | ) | | | (1.13 | ) | | | (1.24 | ) | | | (1.22 | ) | | | (0.32 | ) |
| | | | |
Redemption feesc | | | — | | | | — | | | | — | | | | — | | | | — | |
| | | | |
Net asset value, end of year | | | $18.38 | | | | $18.97 | | | | $19.82 | | | | $18.44 | | | | $19.78 | |
| | | | |
| | | | | |
Total returnd | | | 1.69% | | | | 1.54% | | | | 14.97% | | | | (0.96)% | | | | 14.28% | |
| | | | | |
| Ratios to average net assets | | | | | | | | | | | | | | | | | | | | |
| | | | | |
Expensese | | | 0.86% | | | | 0.86% | | | | 0.90% | | | | 0.91% | | | | 0.90% | |
| | | | | |
Net investment income | | | 2.73% | | | | 2.91% | | | | 3.36% | | | | 4.05% | | | | 4.92% | |
| | | | | |
| Supplemental data | | | | | | | | | | | | | | | | | | | | |
| | | | | |
Net assets, end of year (000’s) | | | $111,199 | | | | $118,145 | | | | $163,241 | | | | $151,695 | | | | $150,891 | |
| | | | | |
Portfolio turnover rate | | | 39.14% | | | | 34.39% | | | | 43.26% | | | | 34.18% | | | | 8.77% | |
aThe amount shown for a share outstanding throughout the period may not correlate with the Statement of Operations for the period due to the timing of sales and repurchases of the Fund shares in relation to income earned and/or fluctuating fair value of the investments of the Fund.
bBased on average daily shares outstanding.
cAmount rounds to less than $0.01 per share.
dTotal return does not include fees, charges or expenses imposed by the variable annuity and life insurance contracts for which the Franklin Templeton Variable Insurance Products Trust serves as an underlying investment vehicle.
eBenefit of expense reduction rounds to less than 0.01%.
| | | | |
| TGB-8 | | Annual Report | The accompanying notes are an integral part of these financial statements. | | |
FRANKLIN TEMPLETON VARIABLE INSURANCE PRODUCTS TRUST
Statement of Investments, December 31, 2014
| | | | | | | | | | |
| Templeton Global Bond VIP Fund | | | | |
| | | | | Principal Amount* | | | Value | |
| | Corporate Bonds (Cost $1,940,489) 0.1% | | | | | | | | |
| | Ukraine 0.1% | | | | | | | | |
| a,b | | State Export-Import Bank of Ukraine, (Biz Finance PLC), loan participation, Reg S, 8.75%, 1/22/18 | | | 2,480,000 | | | $ | 1,447,700 | |
| | | | | | | | | | |
| | Foreign Government and Agency Securities 59.7% | | | | | | | | |
| | Brazil 4.6% | | | | | | | | |
| | Letra Tesouro Nacional, Strip, | | | | | | | | |
| | 1/01/15 | | | 3,971 | c BRL | | | 1,493,606 | |
| | 10/01/15 | | | 4,950 | c BRL | | | 1,702,255 | |
| | 1/01/16 | | | 38,490 | c BRL | | | 12,828,301 | |
| | 7/01/16 | | | 1,490 | c BRL | | | 467,136 | |
| | 10/01/16 | | | 4,700 | c BRL | | | 1,427,690 | |
| | 1/01/17 | | | 46,660 | c BRL | | | 13,777,675 | |
| | 1/01/18 | | | 28,770 | c BRL | | | 7,558,759 | |
| | Nota Do Tesouro Nacional, | | | | | | | | |
| | 10.00%, 1/01/17 | | | 22,490 | c BRL | | | 8,062,003 | |
| | 10.00%, 1/01/21 | | | 9,240 | c BRL | | | 3,137,713 | |
| | 10.00%, 1/01/23 | | | 26,700 | c BRL | | | 8,908,200 | |
| | d Index Linked, 6.00%, 5/15/15 | | | 30,226 | c BRL | | | 28,854,782 | |
| | d Index Linked, 6.00%, 8/15/16 | | | 14,388 | c BRL | | | 13,612,951 | |
| | d Index Linked, 6.00%, 5/15/17 | | | 202 | c BRL | | | 191,584 | |
| | d Index Linked, 6.00%, 8/15/18 | | | 15,665 | c BRL | | | 14,704,395 | |
| | d,e Index Linked, 6.00%, 5/15/19 | | | 6,790 | c BRL | | | 6,373,761 | |
| | d Index Linked, 6.00%, 8/15/20 | | | 1,090 | c BRL | | | 1,022,399 | |
| | d Index Linked, 6.00%, 8/15/22 | | | 18,770 | c BRL | | | 17,631,907 | |
| | d,e Index Linked, 6.00%, 5/15/23 | | | 3,330 | c BRL | | | 3,123,248 | |
| | d,e Index Linked, 6.00%, 8/15/24 | | | 3,110 | c BRL | | | 2,912,768 | |
| | d Index Linked, 6.00%, 5/15/45 | | | 10,825 | c BRL | | | 10,026,081 | |
| | senior note, 10.00%, 1/01/19 | | | 21,390 | c BRL | | | 7,412,643 | |
| | | | | | | | | | |
| | | | | | | | | 165,229,857 | |
| | | | | | | | | | |
| | Canada 1.2% | | | | | | | | |
| | Government of Canada, 1.00%, 2/01/15 | | | 48,972,000 | CAD | | | 42,171,798 | |
| | | | | | | | | | |
| | Hungary 4.4% | | | | | | | | |
| | Government of Hungary, | | | | | | | | |
| | 7.75%, 8/24/15 | | | 672,690,000 | HUF | | | 2,671,696 | |
| | 5.50%, 2/12/16 | | | 436,800,000 | HUF | | | 1,742,212 | |
| | 5.50%, 12/22/16 | | | 258,730,000 | HUF | | | 1,057,521 | |
| | 4.125%, 2/19/18 | | | 14,310,000 | | | | 14,864,155 | |
| | 4.00%, 4/25/18 | | | 629,920,000 | HUF | | | 2,503,100 | |
| | 6.50%, 6/24/19 | | | 1,445,130,000 | HUF | | | 6,287,652 | |
| | 7.50%, 11/12/20 | | | 317,540,000 | HUF | | | 1,478,810 | |
| | 5.375%, 2/21/23 | | | 26,430,000 | | | | 28,690,426 | |
| | A, 8.00%, 2/12/15 | | | 280,000,000 | HUF | | | 1,077,483 | |
| | A, 6.75%, 11/24/17 | | | 2,394,300,000 | HUF | | | 10,241,816 | |
| | A, 5.50%, 12/20/18 | | | 446,060,000 | HUF | | | 1,870,423 | |
| | A, 7.00%, 6/24/22 | | | 1,459,910,000 | HUF | | | 6,863,441 | |
| | A, 6.00%, 11/24/23 | | | 1,118,980,000 | HUF | | | 5,088,369 | |
| | B, 6.75%, 2/24/17 | | | 597,480,000 | HUF | | | 2,503,292 | |
| | B, 5.50%, 6/24/25 | | | 2,661,360,000 | HUF | | | 11,823,914 | |
| | senior note, 6.25%, 1/29/20 | | | 6,420,000 | | | | 7,228,150 | |
| | senior note, 6.375%, 3/29/21 | | | 14,820,000 | | | | 16,960,453 | |
| | a senior note, Reg S, 3.50%, 7/18/16 | | | 1,055,000 | EUR | | | 1,328,582 | |
| | a senior note, Reg S, 4.375%, 7/04/17 | | | 7,480,000 | EUR | | | 9,722,143 | |
FRANKLIN TEMPLETON VARIABLE INSURANCE PRODUCTS TRUST
STATEMENT OF INVESTMENTS
Templeton Global Bond VIP Fund (continued)
| | | | | | | | | | |
| | | | | Principal Amount* | | | Value | |
| | Foreign Government and Agency Securities (continued) | | | | | | | | |
| | Hungary (continued) | | | | | | | | |
| | a senior note, Reg S, 5.75%, 6/11/18 | | | 14,475,000 | EUR | | $ | 20,002,545 | |
| | a senior note, Reg S, 3.875%, 2/24/20 | | | 3,120,000 | EUR | | | 4,106,285 | |
| | | | | | | | | | |
| | | | | | | | | 158,112,468 | |
| | | | | | | | | | |
| | Iceland 0.2% | | | | | | | | |
| f | | Government of Iceland, 144A, 5.875%, 5/11/22 | | | 7,660,000 | | | | 8,605,359 | |
| | | | | | | | | | |
| | India 2.0% | | | | | | | | |
| | Government of India, | | | | | | | | |
| | senior bond, 7.80%, 5/03/20 | | | 720,800,000 | INR | | | 11,327,715 | |
| | senior bond, 8.28%, 9/21/27 | | | 217,800,000 | INR | | | 3,532,499 | |
| | senior bond, 8.60%, 6/02/28 | | | 747,500,000 | INR | | | 12,523,219 | |
| | senior note, 7.28%, 6/03/19 | | | 28,000,000 | INR | | | 432,964 | |
| | senior note, 8.12%, 12/10/20 | | | 541,300,000 | INR | | | 8,630,143 | |
| | senior note, 8.35%, 5/14/22 | | | 212,700,000 | INR | | | 3,439,643 | |
| | senior note, 7.16%, 5/20/23 | | | 133,700,000 | INR | | | 2,011,821 | |
| | senior note, 8.83%, 11/25/23 | | | 1,805,900,000 | INR | | | 30,156,539 | |
| | | | | | | | | | |
| | | | | | | | | 72,054,543 | |
| | | | | | | | | | |
| | Indonesia 2.4% | | | | | | | | |
| | Government of Indonesia, | | | | | | | | |
| | 7.875%, 4/15/19 | | | 50,477,000,000 | IDR | | | 4,126,601 | |
| | FR31, 11.00%, 11/15/20 | | | 170,808,000,000 | IDR | | | 15,831,425 | |
| | FR34, 12.80%, 6/15/21 | | | 208,649,000,000 | IDR | | | 20,984,518 | |
| | FR35, 12.90%, 6/15/22 | | | 67,421,000,000 | IDR | | | 7,004,759 | |
| | FR36, 11.50%, 9/15/19 | | | 31,754,000,000 | IDR | | | 2,942,624 | |
| | FR39, 11.75%, 8/15/23 | | | 5,491,000,000 | IDR | | | 551,317 | |
| | FR40, 11.00%, 9/15/25 | | | 46,856,000,000 | IDR | | | 4,573,994 | |
| | FR43, 10.25%, 7/15/22 | | | 69,179,000,000 | IDR | | | 6,363,520 | |
| | FR44, 10.00%, 9/15/24 | | | 4,454,000,000 | IDR | | | 407,639 | |
| | FR46, 9.50%, 7/15/23 | | | 226,780,000,000 | IDR | | | 20,201,449 | |
| | FR48, 9.00%, 9/15/18 | | | 16,920,000,000 | IDR | | | 1,424,512 | |
| | senior bond, FR53, 8.25%, 7/15/21 | | | 11,270,000,000 | IDR | | | 933,326 | |
| | senior note, 8.50%, 10/15/16 | | | 3,358,000,000 | IDR | | | 275,601 | |
| | | | | | | | | | |
| | | | | | | | | 85,621,285 | |
| | | | | | | | | | |
| | Ireland 4.3% | | | | | | | | |
| | Government of Ireland, | | | | | | | | |
| | 5.90%, 10/18/19 | | | 9,455,000 | EUR | | | 14,390,781 | |
| | 4.50%, 4/18/20 | | | 9,654,000 | EUR | | | 14,081,563 | |
| | 5.00%, 10/18/20 | | | 40,264,000 | EUR | | | 61,007,699 | |
| | senior bond, 5.40%, 3/13/25 | | | 40,422,910 | EUR | | | 67,443,882 | |
| | | | | | | | | | |
| | | | | | | | | 156,923,925 | |
| | | | | | | | | | |
| | Lithuania 1.1% | | | | | | | | |
| f | | Government of Lithuania, 144A, | | | | | | | | |
| | 6.75%, 1/15/15 | | | 19,480,000 | | | | 19,553,732 | |
| | 7.375%, 2/11/20 | | | 12,690,000 | | | | 15,329,647 | |
| | 6.125%, 3/09/21 | | | 3,240,000 | | | | 3,778,391 | |
| | | | | | | | | | |
| | | | | | | | | 38,661,770 | |
| | | | | | | | | | |
| | Malaysia 2.7% | | | | | | | | |
| | Government of Malaysia, | | | | | | | | |
| | 3.741%, 2/27/15 | | | 80,530,000 | MYR | | | 23,046,343 | |
| | 3.835%, 8/12/15 | | | 91,575,000 | MYR | | | 26,266,429 | |
FRANKLIN TEMPLETON VARIABLE INSURANCE PRODUCTS TRUST
STATEMENT OF INVESTMENTS
Templeton Global Bond VIP Fund (continued)
| | | | | | | | | | |
| | | | | Principal Amount* | | | Value | |
| | Foreign Government and Agency Securities (continued) | | | | | | | | |
| | Malaysia (continued) | | | | | | | | |
| | 4.72%, 9/30/15 | | | 42,200,000 | MYR | | $ | 12,186,766 | |
| | 3.197%, 10/15/15 | | | 64,330,000 | MYR | | | 18,370,617 | |
| | senior bond, 3.814%, 2/15/17 | | | 18,885,000 | MYR | | | 5,421,856 | |
| | senior bond, 4.24%, 2/07/18 | | | 44,360,000 | MYR | | | 12,886,792 | |
| | | | | | | | | | |
| | | | | | | | | 98,178,803 | |
| | | | | | | | | | |
| | Mexico 5.7% | | | | | | | | |
| | Government of Mexico, | | | | | | | | |
| | 6.00%, 6/18/15 | | | 10,022,500 | g MXN | | | 68,865,096 | |
| | 8.00%, 12/17/15 | | | 7,233,450 | g MXN | | | 51,243,396 | |
| | 6.25%, 6/16/16 | | | 5,020,310 | g MXN | | | 35,353,931 | |
| | 7.25%, 12/15/16 | | | 250,000 | g MXN | | | 1,810,805 | |
| | 7.75%, 12/14/17 | | | 4,473,000 | g MXN | | | 33,182,738 | |
| h | | Mexican Udibonos, Index Linked, | | | | | | | | |
| | 5.00%, 6/16/16 | | | 593,022 | i MXN | | | 4,274,615 | |
| | 3.50%, 12/14/17 | | | 594,550 | i MXN | | | 4,306,800 | |
| | 4.00%, 6/13/19 | | | 408,085 | i MXN | | | 3,023,745 | |
| | 2.50%, 12/10/20 | | | 321,387 | i MXN | | | 2,234,845 | |
| | | | | | | | | | |
| | | | | | | | | 204,295,971 | |
| | | | | | | | | | |
| | Peru 0.1% | | | | | | | | |
| | Government of Peru, senior bond, 7.84%, 8/12/20 | | | 11,090,000 | PEN | | | 4,253,461 | |
| | | | | | | | | | |
| | Philippines 0.4% | | | | | | | | |
| | Government of the Philippines, | | | | | | | | |
| | senior bond, 7.00%, 1/27/16 | | | 53,190,000 | PHP | | | 1,232,568 | |
| | senior bond, 9.125%, 9/04/16 | | | 31,840,000 | PHP | | | 770,514 | |
| | senior note, 1.625%, 4/25/16 | | | 548,000,000 | PHP | | | 12,118,872 | |
| | | | | | | | | | |
| | | | | | | | | 14,121,954 | |
| | | | | | | | | | |
| | Poland 6.3% | | | | | | | | |
| | Government of Poland, | | | | | | | | |
| | 6.25%, 10/24/15 | | | 34,630,000 | PLN | | | 10,132,070 | |
| | 5.00%, 4/25/16 | | | 61,000,000 | PLN | | | 17,939,869 | |
| | 4.75%, 10/25/16 | | | 340,685,000 | PLN | | | 101,287,890 | |
| | 5.75%, 9/23/22 | | | 48,750,000 | PLN | | | 17,050,657 | |
| | j FRN, 2.69%, 1/25/17 | | | 59,279,000 | PLN | | | 16,754,301 | |
| | j FRN, 2.69%, 1/25/21 | | | 60,135,000 | PLN | | | 16,732,431 | |
| | Strip, 1/25/16 | | | 177,077,000 | PLN | | | 49,098,463 | |
| | | | | | | | | | |
| | | | | | | | | 228,995,681 | |
| | | | | | | | | | |
| | Portugal 2.5% | | | | | | | | |
| | Government of Portugal, | | | | | | | | |
| | f 144A, 5.125%, 10/15/24 | | | 34,000,000 | | | | 35,849,600 | |
| | a Reg S, 3.875%, 2/15/30 | | | 41,530,000 | EUR | | | 52,811,853 | |
| | a senior bond, Reg S, 4.95%, 10/25/23 | | | 284,900 | EUR | | | 408,966 | |
| | a senior note, Reg S, 5.65%, 2/15/24 | | | 712,400 | EUR | | | 1,067,618 | |
| | | | | | | | | | |
| | | | | | | | | 90,138,037 | |
| | | | | | | | | | |
| | Russia 1.3% | | | | | | | | |
| f | | Government of Russia, senior bond, 144A, 7.50%, 3/31/30 | | | 46,398,235 | | | | 48,493,115 | |
| | | | | | | | | | |
FRANKLIN TEMPLETON VARIABLE INSURANCE PRODUCTS TRUST
STATEMENT OF INVESTMENTS
Templeton Global Bond VIP Fund (continued)
| | | | | | | | | | |
| | | | | Principal Amount* | | | Value | |
| | Foreign Government and Agency Securities (continued) | | | | | | | | |
| | Serbia 1.4% | | | | | | | | |
| f | | Government of Serbia, senior note, 144A, | | | | | | | | |
| | 5.25%, 11/21/17 | | | 4,590,000 | | | $ | 4,717,924 | |
| | 4.875%, 2/25/20 | | | 8,800,000 | | | | 8,832,604 | |
| | 7.25%, 9/28/21 | | | 32,130,000 | | | | 36,118,136 | |
| | | | | | | | | | |
| | | | | | | | | 49,668,664 | |
| | | | | | | | | | |
| | Singapore 0.2% | | | | | | | | |
| | Government of Singapore, senior note, 1.125%, 4/01/16 | | | 11,000,000 | SGD | | | 8,358,605 | |
| | | | | | | | | | |
| | Slovenia 0.4% | | | | | | | | |
| f | | Government of Slovenia, senior note, 144A, | | | | | | | | |
| | 5.50%, 10/26/22 | | | 8,140,000 | | | | 9,046,837 | |
| | 5.85%, 5/10/23 | | | 5,030,000 | | | | 5,748,586 | |
| | | | | | | | | | |
| | | | | | | | | 14,795,423 | |
| | | | | | | | | | |
| | South Korea 13.1% | | | | | | | | |
| | The Export-Import Bank of Korea, senior note, 4.625%, 2/20/17 | | | 230,000 | EUR | | | 302,274 | |
| | Korea Monetary Stabilization Bond, | | | | | | | | |
| | senior bond, 2.47%, 4/02/15 | | | 22,461,930,000 | KRW | | | 20,557,360 | |
| | senior bond, 2.80%, 8/02/15 | | | 68,737,030,000 | KRW | | | 63,107,777 | |
| | senior bond, 2.81%, 10/02/15 | | | 2,932,000,000 | KRW | | | 2,695,469 | |
| | senior note, 2.74%, 2/02/15 | | | 47,745,950,000 | KRW | | | 43,675,393 | |
| | senior note, 2.76%, 6/02/15 | | | 51,516,200,000 | KRW | | | 47,233,483 | |
| | senior note, 2.66%, 6/09/15 | | | 24,216,850,000 | KRW | | | 22,196,336 | |
| | senior note, 2.90%, 12/02/15 | | | 54,164,800,000 | KRW | | | 49,889,892 | |
| | senior note, 2.78%, 2/02/16 | | | 20,416,550,000 | KRW | | | 18,804,876 | |
| | senior note, 2.80%, 4/02/16 | | | 34,476,970,000 | KRW | | | 31,801,457 | |
| | senior note, 2.79%, 6/02/16 | | | 10,523,000,000 | KRW | | | 9,715,735 | |
| | senior note, 2.46%, 8/02/16 | | | 48,720,700,000 | KRW | | | 44,799,249 | |
| | senior note, 2.22%, 10/02/16 | | | 8,481,500,000 | KRW | | | 7,772,620 | |
| | senior note, 2.07%, 12/02/16 | | | 22,054,000,000 | KRW | | | 20,157,566 | |
| | Korea Treasury Bond, | | | | | | | | |
| | senior bond, 4.00%, 3/10/16 | | | 1,283,100,000 | KRW | | | 1,199,374 | |
| | senior bond, 5.00%, 9/10/16 | | | 2,806,000,000 | KRW | | | 2,689,010 | |
| | senior note, 4.50%, 3/10/15 | | | 641,500,000 | KRW | | | 589,003 | |
| | senior note, 3.25%, 6/10/15 | | | 4,668,800,000 | KRW | | | 4,290,143 | |
| | senior note, 4.00%, 9/10/15 | | | 3,390,100,000 | KRW | | | 3,139,686 | |
| | senior note, 2.75%, 12/10/15 | | | 32,942,000,000 | KRW | | | 30,308,412 | |
| | senior note, 2.75%, 6/10/16 | | | 19,419,900,000 | KRW | | | 17,919,872 | |
| | senior note, 3.00%, 12/10/16 | | | 33,345,900,000 | KRW | | | 31,011,207 | |
| | | | | | | | | | |
| | | | | | | | | 473,856,194 | |
| | | | | | | | | | |
| | Sri Lanka 1.3% | | | | | | | | |
| | Government of Sri Lanka, | | | | | | | | |
| | 8.25%, 3/01/17 | | | 41,710,000 | LKR | | | 326,908 | |
| | 10.60%, 7/01/19 | | | 413,650,000 | LKR | | | 3,554,694 | |
| | 10.60%, 9/15/19 | | | 615,240,000 | LKR | | | 5,310,501 | |
| | 11.20%, 7/01/22 | | | 69,990,000 | LKR | | | 634,023 | |
| | A, 11.75%, 3/15/15 | | | 8,520,000 | LKR | | | 65,693 | |
| | A, 6.50%, 7/15/15 | | | 239,920,000 | LKR | | | 1,834,913 | |
| | A, 11.00%, 8/01/15 | | | 1,349,700,000 | LKR | | | 10,583,006 | |
| | A, 8.50%, 11/01/15 | | | 144,870,000 | LKR | | | 1,124,509 | |
| | A, 6.40%, 8/01/16 | | | 109,200,000 | LKR | | | 831,680 | |
FRANKLIN TEMPLETON VARIABLE INSURANCE PRODUCTS TRUST
STATEMENT OF INVESTMENTS
Templeton Global Bond VIP Fund (continued)
| | | | | | | | | | |
| | | | | Principal Amount* | | | Value | |
| | Foreign Government and Agency Securities (continued) | | | | | | | | |
| | Sri Lanka (continued) | | | | | | | | |
| | A, 5.80%, 1/15/17 | | | 112,300,000 | LKR | | $ | 841,647 | |
| | A, 7.50%, 8/15/18 | | | 63,830,000 | LKR | | | 491,705 | |
| | A, 8.00%, 11/15/18 | | | 512,300,000 | LKR | | | 4,015,288 | |
| | A, 9.00%, 5/01/21 | | | 861,720,000 | LKR | | | 7,010,210 | |
| | B, 6.40%, 10/01/16 | | | 119,100,000 | LKR | | | 904,670 | |
| | B, 8.50%, 7/15/18 | | | 146,350,000 | LKR | | | 1,163,427 | |
| | C, 8.50%, 4/01/18 | | | 444,930,000 | LKR | | | 3,530,445 | |
| | D, 8.50%, 6/01/18 | | | 633,000,000 | LKR | | | 5,033,339 | |
| | | | | | | | | | |
| | | | | | | | | 47,256,658 | |
| | | | | | | | | | |
| k | | Supranational 0.4% | | | | | | | | |
| | Inter-American Development Bank, senior note, 7.50%, 12/05/24 | | | 200,000,000 | MXN | | | 15,827,682 | |
| | | | | | | | | | |
| | Sweden 1.3% | | | | | | | | |
| | Government of Sweden, 4.50%, 8/12/15 | | | 342,110,000 | SEK | | | 45,028,407 | |
| | | | | | | | | | |
| | Ukraine 2.4% | | | | | | | | |
| f | | Financing of Infrastructure Projects State Enterprise, 144A, | | | | | | | | |
| | 8.375%, 11/03/17 | | | 1,100,000 | | | | 663,861 | |
| | 7.40%, 4/20/18 | | | 840,000 | | | | 508,452 | |
| f | | Government of Ukraine, | | | | | | | | |
| | 144A, 9.25%, 7/24/17 | | | 57,230,000 | | | | 35,246,526 | |
| | 144A, 7.75%, 9/23/20 | | | 17,227,000 | | | | 10,496,066 | |
| | senior bond, 144A, 6.58%, 11/21/16 | | | 12,541,000 | | | | 8,115,532 | |
| | senior bond, 144A, 7.80%, 11/28/22 | | | 10,110,000 | | | | 6,041,888 | |
| | senior note, 144A, 4.95%, 10/13/15 | | | 290,000 | EUR | | | 238,514 | |
| | senior note, 144A, 6.25%, 6/17/16 | | | 8,760,000 | | | | 5,645,864 | |
| | senior note, 144A, 7.95%, 2/23/21 | | | 24,098,000 | | | | 14,662,187 | |
| | senior note, 144A, 7.50%, 4/17/23 | | | 8,160,000 | | | | 4,810,565 | |
| | | | | | | | | | |
| | | | | | | | | 86,429,455 | |
| | | | | | | | | | |
| | Vietnam 0.0%† | | | | | | | | |
| f | | Government of Vietnam, 144A, 6.75%, 1/29/20 | | | 215,000 | | | | 242,449 | |
| | | | | | | | | | |
| | | |
| | Total Foreign Government and Agency Securities (Cost $2,261,143,533) | | | | | | | 2,157,321,564 | |
| | | | | | | | | | |
| | | |
| | Total Investments before Short Term Investments (Cost $2,263,084,022) | | | | | | | 2,158,769,264 | |
| | | | | | | | | | |
| | Short Term Investments 29.4% | | | | | | | | |
| | Foreign Government and Agency Securities 18.1% | | | | | | | | |
| | Canada 2.3% | | | | | | | | |
| l | | Canada Treasury Bills, | | | | | | | | |
| | 2/12/15 | | | 57,919,000 | CAD | | | 49,825,552 | |
| | 3/12/15 - 4/23/15 | | | 31,818,000 | CAD | | | 27,348,092 | |
| | Government of Canada, 1.50%, 8/01/15 | | | 7,840,000 | CAD | | | 6,771,127 | |
| | | | | | | | | | |
| | | | | | | | | 83,944,771 | |
| | | | | | | | | | |
| | Malaysia 7.3% | | | | | | | | |
| l | | Bank of Negara Monetary Notes, 1/08/15 - 11/03/15 | | | 930,045,000 | MYR | | | 263,024,124 | |
| | | | | | | | | | |
FRANKLIN TEMPLETON VARIABLE INSURANCE PRODUCTS TRUST
STATEMENT OF INVESTMENTS
Templeton Global Bond VIP Fund (continued)
| | | | | | | | | | |
| | | | | Principal Amount* | | | Value | |
| | Short Term Investments (continued) | | | | | | | | |
| | Foreign Government and Agency Securities (continued) | | | | | | | | |
| | Mexico 4.1% | | | | | | | | |
| l | | Mexico Treasury Bills, | | | | | | | | |
| | 4/01/15 | | | 117,990,590 | m MXN | | $ | 79,435,209 | |
| | 3/19/15 - 12/10/15 | | | 101,387,010 | m MXN | | | 67,668,693 | |
| | | | | | | | | | |
| | | | | | | | | 147,103,902 | |
| | | | | | | | | | |
| | Philippines 0.3% | | | | | | | | |
| l | | Philippine Treasury Bills, 4/08/15 - 12/02/15 | | | 528,310,000 | PHP | | | 11,639,670 | |
| | | | | | | | | | |
| | Singapore 3.9% | | | | | | | | |
| l | | Monetary Authority of Singapore Treasury Bills, | | | | | | | | |
| | 1/30/15 | | | 56,381,000 | SGD | | | 42,537,056 | |
| | 1/02/15 - 3/27/15 | | | 130,580,000 | SGD | | | 98,500,258 | |
| | | | | | | | | | |
| | | | | | | | | 141,037,314 | |
| | | | | | | | | | |
| | South Korea 0.2% | | | | | | | | |
| | Korea Monetary Stabilization Bond, | | | | | | | | |
| | l 1/13/15 | | | 4,703,800,000 | KRW | | | 4,298,642 | |
| | senior note, 2.13%, 10/08/15 | | | 3,266,500,000 | KRW | | | 2,987,885 | |
| | | | | | | | | | |
| | | | | | | | | 7,286,527 | |
| | | | | | | | | | |
| | | |
| | Total Foreign Government and Agency Securities
(Cost $687,296,183) | | | | | | | 654,036,308 | |
| | | | | | | | | | |
| | U.S. Government and Agency Securities 7.1% | | | | | | | | |
| | United States 7.1% | | | | | | | | |
| l | | FHLB, | | | | | | | | |
| | 1/02/15 | | | 64,000,000 | | | | 64,000,000 | |
| | 1/07/15 | | | 192,255,000 | | | | 192,254,808 | |
| | | | | | | | | | |
| | | |
| | Total U.S. Government and Agency Securities
(Cost $256,253,762) | | | | | | | 256,254,808 | |
| | | | | | | | | | |
| | | |
| | Total Investments before Repurchase Agreements
(Cost $3,206,633,967) | | | | | | | 3,069,060,380 | |
| | | | | | | | | | |
| | Repurchase Agreements (Cost $153,266,107) 4.2% | | | | | | | | |
| | United States 4.2% | | | | | | | | |
| n | | Joint Repurchase Agreement, 0.057%, 1/02/15 (Maturity Value $153,266,592)
BNP Paribas Securities Corp. (Maturity Value $12,915,776)
HSBC Securities (USA) Inc. (Maturity Value $106,770,106)
Merrill Lynch, Pierce, Fenner & Smith Inc. (Maturity Value $33,580,710) Collateralized by U.S. Government Agency Securities, 0.00% - 1.50%, 1/20/15 - 10/09/19; U.S. Government Agency Securities, Strips, 6/01/17; and U.S. Treasury Notes, 1.625% - 4.50%, 11/15/15 - 11/30/20 (valued at $156,350,759) | | | 153,266,107 | | | | 153,266,107 | |
| | | | | | | | | | |
| | Total Investments (Cost $3,359,900,074) 89.2% | | | | | | | 3,222,326,487 | |
| | Other Assets, less Liabilities 10.8% | | | | | | | 390,002,096 | |
| | | | | | | | | | |
| | Net Assets 100.0% | | | | | | $ | 3,612,328,583 | |
| | | | | | | | | | |
See Abbreviations on page TGB-39.
FRANKLIN TEMPLETON VARIABLE INSURANCE PRODUCTS TRUST
STATEMENT OF INVESTMENTS
Templeton Global Bond VIP Fund (continued)
†Rounds to less than 0.1% of net assets.
*The principal amount is stated in U.S. dollars unless otherwise indicated.
aSecurity was purchased pursuant to Regulation S under the Securities Act of 1933, which exempts from registration securities offered and sold outside of the United States. Such a security cannot be sold in the United States without either an effective registration statement filed pursuant to the Securities Act of 1933, or pursuant to an exemption from registration. These securities have been deemed liquid under guidelines approved by the Trust’s Board of Trustees. At December 31, 2014, the aggregate value of these securities was $90,895,692, representing 2.52% of net assets.
bSee Note 1(g) regarding loan participation notes.
cPrincipal amount is stated in 1,000 Brazilian Real Units.
dRedemption price at maturity is adjusted for inflation. See Note 1(i).
eA portion or all of the security purchased on a delayed delivery basis. See Note 1(d).
fSecurity was purchased pursuant to Rule 144A under the Securities Act of 1933 and may be sold in transactions exempt from registration only to qualified institutional buyers or in a public offering registered under the Securities Act of 1933. These securities have been deemed liquid under guidelines approved by the Trust’s Board of Trustees. At December 31, 2014, the aggregate value of these securities was $282,745,834, representing 7.83% of net assets.
gPrincipal amount is stated in 100 Mexican Peso Units.
hPrincipal amount of security is adjusted for inflation. See Note 1(i).
iPrincipal amount is stated in Unidad de Inversion Units.
jThe coupon rate shown represents the rate at period end.
kA supranational organization is an entity formed by two or more central governments through international treaties.
lThe security is traded on a discount basis with no stated coupon rate.
mPrincipal amount is stated in 10 Mexican Peso Units.
nSee Note 1(c) regarding joint repurchase agreement.
| | | | | | |
| | | The accompanying notes are an integral part of these financial statements. | Annual Report | | | TGB-15 | |
FRANKLIN TEMPLETON VARIABLE INSURANCE PRODUCTS TRUST
STATEMENT OF INVESTMENTS
Templeton Global Bond VIP Fund (continued)
At December 31, 2014, the Fund had the following forward exchange contracts outstanding. See Note 1(e).
| | | | | | | | | | | | | | | | | | | | | | | | | | | | | | | | |
| Forward Exchange Contracts | |
| Currency | | Counterpartya | | | Type | | | Quantity | | | Contract
Amount* | | | | | | Settlement
Date | | | Unrealized
Appreciation | | | Unrealized
Depreciation | |
Euro | | | DBAB | | | | Sell | | | | 2,285,618 | | | | 3,117,423 | | | | | | | | 1/07/15 | | | $ | 351,611 | | | $ | — | |
Japanese Yen | | | DBAB | | | | Sell | | | | 770,370,000 | | | | 7,397,446 | | | | | | | | 1/07/15 | | | | 967,929 | | | | — | |
Japanese Yen | | | GSCO | | | | Sell | | | | 329,010,000 | | | | 3,172,373 | | | | | | | | 1/08/15 | | | | 426,428 | | | | — | |
Malaysian Ringgit | | | DBAB | | | | Buy | | | | 8,862,500 | | | | 2,641,344 | | | | | | | | 1/08/15 | | | | — | | | | (108,829 | ) |
Malaysian Ringgit | | | JPHQ | | | | Buy | | | | 5,661,200 | | | | 1,689,507 | | | | | | | | 1/08/15 | | | | — | | | | (71,784 | ) |
Chilean Peso | | | MSCO | | | | Buy | | | | 2,645,530,000 | | | | 4,305,525 | | | | | | | | 1/09/15 | | | | 48,827 | | | | — | |
Malaysian Ringgit | | | JPHQ | | | | Buy | | | | 3,044,000 | | | | 909,091 | | | | | | | | 1/09/15 | | | | — | | | | (39,342 | ) |
Chilean Peso | | | MSCO | | | | Buy | | | | 2,254,600,000 | | | | 4,087,753 | | | | | | | | 1/12/15 | | | | — | | | | (378,187 | ) |
Euro | | | CITI | | | | Sell | | | | 5,040,000 | | | | 6,851,628 | | | | | | | | 1/12/15 | | | | 752,418 | | | | — | |
Malaysian Ringgit | | | JPHQ | | | | Buy | | | | 912,000 | | | | 272,646 | | | | | | | | 1/12/15 | | | | — | | | | (12,147 | ) |
Mexican Peso | | | CITI | | | | Buy | | | | 109,357,558 | | | | 8,148,849 | | | | | | | | 1/12/15 | | | | — | | | | (738,405 | ) |
Euro | | | SCNY | | | | Sell | | | | 15,572,000 | | | | 21,162,504 | | | | | | | | 1/13/15 | | | | 2,317,672 | | | | — | |
Japanese Yen | | | CITI | | | | Sell | | | | 138,680,000 | | | | 1,325,939 | | | | | | | | 1/13/15 | | | | 168,454 | | | | — | |
Chilean Peso | | | DBAB | | | | Buy | | | | 1,330,940,000 | | | | 2,159,916 | | | | | | | | 1/14/15 | | | | 29,395 | | | | — | |
Euro | | | DBAB | | | | Sell | | | | 9,460,000 | | | | 12,915,265 | | | | | | | | 1/14/15 | | | | 1,466,891 | | | | — | |
Euro | | | JPHQ | | | | Sell | | | | 937,000 | | | | 1,280,879 | | | | | | | | 1/14/15 | | | | 146,933 | | | | — | |
Indian Rupee | | | JPHQ | | | | Buy | | | | 60,607,000 | | | | 977,556 | | | | | | | | 1/14/15 | | | | — | | | | (18,736 | ) |
Japanese Yen | | | SCNY | | | | Sell | | | | 415,980,000 | | | | 3,981,432 | | | | | | | | 1/14/15 | | | | 509,447 | | | | — | |
Chilean Peso | | | DBAB | | | | Buy | | | | 1,248,687,000 | | | | 2,019,875 | | | | | | | | 1/15/15 | | | | 33,886 | | | | — | |
Indian Rupee | | | DBAB | | | | Buy | | | | 239,338,000 | | | | 3,855,937 | | | | | | | | 1/15/15 | | | | — | | | | (70,291 | ) |
Japanese Yen | | | BZWS | | | | Sell | | | | 1,089,820,000 | | | | 10,508,959 | | | | | | | | 1/15/15 | | | | 1,412,676 | | | | — | |
Japanese Yen | | | HSBC | | | | Sell | | | | 536,380,000 | | | | 5,157,500 | | | | | | | | 1/15/15 | | | | 680,555 | | | | — | |
Japanese Yen | | | JPHQ | | | | Sell | | | | 708,450,000 | | | | 6,830,771 | | | | | | | | 1/15/15 | | | | 917,628 | | | | — | |
Malaysian Ringgit | | | JPHQ | | | | Buy | | | | 1,700,000 | | | | 509,975 | | | | | | | | 1/15/15 | | | | — | | | | (24,551 | ) |
Chilean Peso | | | DBAB | | | | Buy | | | | 1,351,533,000 | | | | 2,193,691 | | | | | | | | 1/16/15 | | | | 28,957 | | | | — | |
Euro | | | DBAB | | | | Sell | | | | 4,856,000 | | | | 6,643,979 | | | | | | | | 1/16/15 | | | | 767,178 | | | | — | |
Japanese Yen | | | DBAB | | | | Sell | | | | 858,140,000 | | | | 8,301,876 | | | | | | | | 1/16/15 | | | | 1,139,269 | | | | — | |
Japanese Yen | | | SCNY | | | | Sell | | | | 707,660,000 | | | | 6,849,041 | | | | | | | | 1/16/15 | | | | 942,440 | | | | — | |
Malaysian Ringgit | | | JPHQ | | | | Buy | | | | 1,856,000 | | | | 559,221 | | | | | | | | 1/16/15 | | | | — | | | | (29,310 | ) |
Chilean Peso | | | CITI | | | | Buy | | | | 2,420,966,000 | | | | 3,886,293 | | | | | | | | 1/20/15 | | | | 93,159 | | | | — | |
Indian Rupee | | | DBAB | | | | Buy | | | | 491,655,000 | | | | 7,917,727 | | | | | | | | 1/20/15 | | | | — | | | | (148,825 | ) |
Indian Rupee | | | JPHQ | | | | Buy | | | | 60,607,000 | | | | 974,820 | | | | | | | | 1/20/15 | | | | — | | | | (17,137 | ) |
Japanese Yen | | | JPHQ | | | | Sell | | | | 652,895,000 | | | | 6,288,781 | | | | | | | | 1/20/15 | | | | 839,096 | | | | — | |
Euro | | | BZWS | | | | Sell | | | | 2,638,000 | | | | 3,595,594 | | | | | | | | 1/21/15 | | | | 402,872 | | | | — | |
Indian Rupee | | | JPHQ | | | | Buy | | | | 226,092,000 | | | | 3,613,916 | | | | | | | | 1/21/15 | | | | — | | | | (42,021 | ) |
Euro | | | JPHQ | | | | Sell | | | | 300,000 | | | | 407,663 | | | | | | | | 1/22/15 | | | | 44,574 | | | | — | |
Indian Rupee | | | DBAB | | | | Buy | | | | 79,271,000 | | | | 1,274,919 | | | | | | | | 1/22/15 | | | | — | | | | (22,810 | ) |
Indian Rupee | | | JPHQ | | | | Buy | | | | 152,363,000 | | | | 2,434,886 | | | | | | | | 1/22/15 | | | | — | | | | (28,268 | ) |
Chilean Peso | | | DBAB | | | | Buy | | | | 2,227,910,000 | | | | 4,025,131 | | | | | | | | 1/23/15 | | | | — | | | | (364,338 | ) |
Chilean Peso | | | DBAB | | | | Buy | | | | 3,160,140,000 | | | | 5,597,626 | | | | | | | | 1/26/15 | | | | — | | | | (406,915 | ) |
Singapore Dollar | | | JPHQ | | | | Buy | | | | 5,740,000 | | | | 4,627,166 | | | | | | | | 1/26/15 | | | | — | | | | (297,270 | ) |
Indian Rupee | | | DBAB | | | | Buy | | | | 130,201,000 | | | | 2,078,228 | | | | | | | | 1/27/15 | | | | — | | | | (23,694 | ) |
Japanese Yen | | | GSCO | | | | Sell | | | | 944,420,000 | | | | 9,135,865 | | | | | | | | 1/27/15 | | | | 1,252,353 | | | | — | |
Japanese Yen | | | DBAB | | | | Sell | | | | 897,860,782 | | | | 8,793,935 | | | | | | | | 1/28/15 | | | | 1,299,010 | | | | — | |
Japanese Yen | | | HSBC | | | | Sell | | | | 1,162,462,488 | | | | 11,359,272 | | | | | | | | 1/28/15 | | | | 1,655,575 | | | | — | |
Euro | | | CITI | | | | Sell | | | | 4,998,400 | | | | 6,833,688 | | | | | | | | 1/29/15 | | | | 783,681 | | | | — | |
Swedish Krona | | | BZWS | | | | Buy | | | | 122,773,200 | | | | 13,272,161 | | | | EUR | | | | 1/29/15 | | | | — | | | | (320,941 | ) |
Swedish Krona | | | BZWS | | | | Sell | | | | 64,676,000 | | | | 6,861,153 | | | | EUR | | | | 1/29/15 | | | | 11,087 | | | | — | |
Chilean Peso | | | DBAB | | | | Buy | | | | 1,346,508,000 | | | | 2,235,091 | | | | | | | | 1/30/15 | | | | — | | | | (24,439 | ) |
Euro | | | DBAB | | | | Sell | | | | 71,313,000 | | | | 97,501,346 | | | | | | | | 1/30/15 | | | | 11,183,948 | | | | — | |
Indian Rupee | | | DBAB | | | | Buy | | | | 609,812,988 | | | | 9,803,728 | | | | | | | | 1/30/15 | | | | — | | | | (186,743 | ) |
Indian Rupee | | | HSBC | | | | Buy | | | | 679,529,000 | | | | 10,926,588 | | | | | | | | 1/30/15 | | | | — | | | | (210,155 | ) |
Chilean Peso | | | DBAB | | | | Buy | | | | 2,084,769,000 | | | | 3,473,918 | | | | | | | | 2/02/15 | | | | — | | | | (52,001 | ) |
Indian Rupee | | | DBAB | | | | Buy | | | | 246,043,494 | | | | 3,953,617 | | | | | | | | 2/02/15 | | | | — | | | | (75,313 | ) |
Chilean Peso | | | DBAB | | | | Buy | | | | 1,104,929,000 | | | | 1,844,007 | | | | | | | | 2/03/15 | | | | — | | | | (30,527 | ) |
FRANKLIN TEMPLETON VARIABLE INSURANCE PRODUCTS TRUST
STATEMENT OF INVESTMENTS
Templeton Global Bond VIP Fund (continued)
| | | | | | | | | | | | | | | | | | | | | | | | | | | | | | | | |
| Forward Exchange Contracts (continued) | |
| Currency | | Counterpartya | | | Type | | | Quantity | | | Contract
Amount* | | | | | | Settlement
Date | | | Unrealized
Appreciation | | | Unrealized
Depreciation | |
Indian Rupee | | | DBAB | | | | Buy | | | | 211,714,000 | | | | 3,397,421 | | | | | | | | 2/03/15 | | | $ | — | | | $ | (60,785 | ) |
Indian Rupee | | | HSBC | | | | Buy | | | | 120,016,750 | | | | 1,925,703 | | | | | | | | 2/03/15 | | | | — | | | | (34,226 | ) |
Chilean Peso | | | DBAB | | | | Buy | | | | 1,186,400,000 | | | | 2,093,155 | | | | | | | | 2/04/15 | | | | — | | | | (146,109 | ) |
Indian Rupee | | | JPHQ | | | | Buy | | | | 358,075,000 | | | | 5,747,408 | | | | | | | | 2/04/15 | | | | — | | | | (105,025 | ) |
Malaysian Ringgit | | | JPHQ | | | | Buy | | | | 9,715,000 | | | | 2,870,948 | | | | | | | | 2/04/15 | | | | — | | | | (102,576 | ) |
Japanese Yen | | | JPHQ | | | | Sell | | | | 1,719,500,000 | | | | 17,030,047 | | | | | | | | 2/06/15 | | | | 2,675,410 | | | | — | |
Japanese Yen | | | SCNY | | | | Sell | | | | 1,720,000,000 | | | | 17,030,125 | | | | | | | | 2/06/15 | | | | 2,671,313 | | | | — | |
Euro | | | DBAB | | | | Sell | | | | 1,738,000 | | | | 2,350,993 | | | | | | | | 2/09/15 | | | | 247,162 | | | | — | |
Euro | | | GSCO | | | | Sell | | | | 2,045,000 | | | | 2,850,198 | | | | | | | | 2/09/15 | | | | 374,747 | | | | — | |
Indian Rupee | | | CITI | | | | Buy | | | | 69,318,000 | | | | 1,108,332 | | | | | | | | 2/09/15 | | | | — | | | | (16,939 | ) |
Indian Rupee | | | DBAB | | | | Buy | | | | 217,594,000 | | | | 3,496,508 | | | | | | | | 2/09/15 | | | | — | | | | (70,550 | ) |
Indian Rupee | | | HSBC | | | | Buy | | | | 251,448,000 | | | | 4,039,533 | | | | | | | | 2/09/15 | | | | — | | | | (80,553 | ) |
Indian Rupee | | | JPHQ | | | | Buy | | | | 21,500,000 | | | | 345,538 | | | | | | | | 2/09/15 | | | | — | | | | (7,026 | ) |
Japanese Yen | | | BZWS | | | | Sell | | | | 1,720,220,000 | | | | 17,030,111 | | | | | | | | 2/09/15 | | | | 2,669,120 | | | | — | |
Japanese Yen | | | JPHQ | | | | Sell | | | | 1,723,960,000 | | | | 17,030,113 | | | | | | | | 2/09/15 | | | | 2,637,899 | | | | — | |
Malaysian Ringgit | | | HSBC | | | | Buy | | | | 1,320,000 | | | | 409,061 | | | | | | | | 2/09/15 | | | | — | | | | (33,086 | ) |
Singapore Dollar | | | HSBC | | | | Buy | | | | 6,206,000 | | | | 4,980,738 | | | | | | | | 2/09/15 | | | | — | | | | (299,791 | ) |
Chilean Peso | | | BZWS | | | | Buy | | | | 1,142,900,000 | | | | 1,966,110 | | | | | | | | 2/10/15 | | | | — | | | | (91,315 | ) |
Euro | | | BZWS | | | | Sell | | | | 4,929,000 | | | | 6,705,658 | | | | | | | | 2/10/15 | | | | 739,111 | | | | — | |
Euro | | | CITI | | | | Sell | | | | 6,572,000 | | | | 8,937,066 | | | | | | | | 2/10/15 | | | | 981,670 | | | | — | |
Euro | | | HSBC | | | | Sell | | | | 1,800,000 | | | | 2,448,198 | | | | | | | | 2/10/15 | | | | 269,301 | | | | — | |
Japanese Yen | | | CITI | | | | Sell | | | | 366,860,000 | | | | 3,613,387 | | | | | | | | 2/10/15 | | | | 550,689 | | | | — | |
Polish Zloty | | | DBAB | | | | Buy | | | | 17,528,000 | | | | 4,100,597 | | | | EUR | | | | 2/10/15 | | | | — | | | | (21,777 | ) |
South Korean Won | | | HSBC | | | | Buy | | | | 21,363,430,000 | | | | 19,556,417 | | | | | | | | 2/10/15 | | | | — | | | | (64,888 | ) |
Euro | | | BZWS | | | | Sell | | | | 1,412,000 | | | | 1,919,896 | | | | | | | | 2/11/15 | | | | 210,660 | | | | — | |
Polish Zloty | | | BZWS | | | | Buy | | | | 17,528,000 | | | | 4,098,200 | | | | EUR | | | | 2/11/15 | | | | — | | | | (19,112 | ) |
Chilean Peso | | | MSCO | | | | Buy | | | | 2,590,220,000 | | | | 4,500,035 | | | | | | | | 2/12/15 | | | | — | | | | (251,730 | ) |
Indian Rupee | | | DBAB | | | | Buy | | | | 39,609,000 | | | | 636,276 | | | | | | | | 2/12/15 | | | | — | | | | (12,947 | ) |
Indian Rupee | | | HSBC | | | | Buy | | | | 42,784,000 | | | | 687,196 | | | | | | | | 2/12/15 | | | | — | | | | (13,902 | ) |
Japanese Yen | | | GSCO | | | | Sell | | | | 394,373,000 | | | | 3,862,539 | | | | | | | | 2/12/15 | | | | 570,099 | | | | — | |
Japanese Yen | | | HSBC | | | | Sell | | | | 1,035,240,000 | | | | 10,157,129 | | | | | | | | 2/12/15 | | | | 1,514,382 | | | | — | |
Japanese Yen | | | JPHQ | | | | Sell | | | | 1,034,700,000 | | | | 10,163,748 | | | | | | | | 2/12/15 | | | | 1,525,509 | | | | — | |
Singapore Dollar | | | BZWS | | | | Buy | | | | 1,717,028 | | | | 1,370,990 | | | | | | | | 2/12/15 | | | | — | | | | (75,902 | ) |
Singapore Dollar | | | DBAB | | | | Buy | | | | 12,363,000 | | | | 9,858,852 | | | | | | | | 2/12/15 | | | | — | | | | (533,916 | ) |
Euro | | | SCNY | | | | Sell | | | | 657,000 | | | | 898,921 | | | | | | | | 2/13/15 | | | | 103,606 | | | | — | |
Indian Rupee | | | HSBC | | | | Buy | | | | 108,000,000 | | | | 1,731,602 | | | | | | | | 2/13/15 | | | | — | | | | (32,277 | ) |
Japanese Yen | | | CITI | | | | Sell | | | | 1,371,360,000 | | | | 13,455,259 | | | | | | | | 2/13/15 | | | | 2,006,308 | | | | — | |
Japanese Yen | | | JPHQ | | | | Sell | | | | 686,710,000 | | | | 6,722,960 | | | | | | | | 2/13/15 | | | | 989,885 | | | | — | |
Malaysian Ringgit | | | DBAB | | | | Buy | | | | 97,443,480 | | | | 28,620,284 | | | | | | | | 2/13/15 | | | | — | | | | (875,471 | ) |
Chilean Peso | | | CITI | | | | Buy | | | | 2,285,090,000 | | | | 3,997,009 | | | | | | | | 2/17/15 | | | | — | | | | (250,591 | ) |
Chilean Peso | | | DBAB | | | | Buy | | | | 964,250,000 | | | | 1,678,124 | | | | | | | | 2/17/15 | | | | — | | | | (97,231 | ) |
Japanese Yen | | | CITI | | | | Sell | | | | 684,870,000 | | | | 6,711,780 | | | | | | | | 2/17/15 | | | | 993,884 | | | | — | |
Polish Zloty | | | DBAB | | | | Buy | | | | 17,528,000 | | | | 4,116,487 | | | | EUR | | | | 2/17/15 | | | | — | | | | (42,665 | ) |
Singapore Dollar | | | BZWS | | | | Buy | | | | 4,886,000 | | | | 3,915,221 | | | | | | | | 2/17/15 | | | | — | | | | (229,899 | ) |
Singapore Dollar | | | HSBC | | | | Buy | | | | 3,667,000 | | | | 2,935,291 | | | | | | | | 2/17/15 | | | | — | | | | (169,414 | ) |
Chilean Peso | | | DBAB | | | | Buy | | | | 2,188,820,000 | | | | 3,745,735 | | | | | | | | 2/18/15 | | | | — | | | | (157,427 | ) |
Japanese Yen | | | GSCO | | | | Sell | | | | 810,877,280 | | | | 7,987,562 | | | | | | | | 2/18/15 | | | | 1,217,594 | | | | — | |
Japanese Yen | | | JPHQ | | | | Sell | | | | 831,970,000 | | | | 8,193,278 | | | | | | | | 2/18/15 | | | | 1,247,207 | | | | — | |
Singapore Dollar | | | HSBC | | | | Buy | | | | 3,667,000 | | | | 2,901,108 | | | | | | | | 2/18/15 | | | | — | | | | (135,230 | ) |
Euro | | | JPHQ | | | | Sell | | | | 3,942,000 | | | | 5,406,118 | | | | | | | | 2/19/15 | | | | 634,022 | | | | — | |
Malaysian Ringgit | | | HSBC | | | | Buy | | | | 4,899,000 | | | | 1,458,904 | | | | | | | | 2/19/15 | | | | — | | | | (64,780 | ) |
Chilean Peso | | | JPHQ | | | | Buy | | | | 527,750,000 | | | | 904,456 | | | | | | | | 2/20/15 | | | | — | | | | (39,405 | ) |
Euro | | | BZWS | | | | Sell | | | | 6,280,000 | | | | 8,629,160 | | | | | | | | 2/20/15 | | | | 1,026,679 | | | | — | |
Chilean Peso | | | MSCO | | | | Buy | | | | 1,273,240,000 | | | | 2,229,062 | | | | | | | | 2/23/15 | | | | — | | | | (142,535 | ) |
Euro | | | DBAB | | | | Sell | | | | 11,070,000 | | | | 15,216,822 | | | | | | | | 2/23/15 | | | | 1,815,342 | | | | — | |
Euro | | | GSCO | | | | Sell | | | | 2,038,000 | | | | 2,804,594 | | | | | | | | 2/23/15 | | | | 337,366 | | | | — | |
FRANKLIN TEMPLETON VARIABLE INSURANCE PRODUCTS TRUST
STATEMENT OF INVESTMENTS
Templeton Global Bond VIP Fund (continued)
| | | | | | | | | | | | | | | | | | | | | | | | | | | | | | | | |
| Forward Exchange Contracts (continued) | |
| Currency | | Counterpartya | | | Type | | | Quantity | | | Contract
Amount* | | | | | | Settlement
Date | | | Unrealized
Appreciation | | | Unrealized
Depreciation | |
Hungarian Forint | | | DBAB | | | | Buy | | | | 18,260,690,000 | | | | 57,055,741 | | | | EUR | | | | 2/23/15 | | | $ | 626,231 | | | $ | — | |
Indian Rupee | | | DBAB | | | | Buy | | | | 98,937,000 | | | | 1,579,000 | | | | | | | | 2/23/15 | | | | — | | | | (24,804 | ) |
Singapore Dollar | | | DBAB | | | | Buy | | | | 3,667,000 | | | | 2,936,360 | | | | | | | | 2/23/15 | | | | — | | | | (170,483 | ) |
Chilean Peso | | | JPHQ | | | | Buy | | | | 1,792,000,000 | | | | 3,139,453 | | | | | | | | 2/24/15 | | | | — | | | | (203,032 | ) |
Japanese Yen | | | HSBC | | | | Sell | | | | 385,460,000 | | | | 3,778,205 | | | | | | | | 2/24/15 | | | | 559,867 | | | | — | |
Chilean Peso | | | BZWS | | | | Buy | | | | 199,342,000 | | | | 332,292 | | | | | | | | 2/25/15 | | | | — | | | | (5,670 | ) |
Chilean Peso | | | MSCO | | | | Buy | | | | 1,559,200,000 | | | | 2,719,456 | | | | | | | | 2/25/15 | | | | — | | | | (164,703 | ) |
Euro | | | DBAB | | | | Sell | | | | 1,530,900 | | | | 2,104,222 | | | | | | | | 2/25/15 | | | | 250,869 | | | | — | |
Japanese Yen | | | BZWS | | | | Sell | | | | 343,460,000 | | | | 3,353,283 | | | | | | | | 2/25/15 | | | | 485,595 | | | | — | |
Japanese Yen | | | JPHQ | | | | Sell | | | | 385,700,000 | | | | 3,764,359 | | | | | | | | 2/25/15 | | | | 543,992 | | | | — | |
Chilean Peso | | | DBAB | | | | Buy | | | | 1,455,470,000 | | | | 2,533,896 | | | | | | | | 2/26/15 | | | | — | | | | (149,287 | ) |
Euro | | | BZWS | | | | Sell | | | | 13,673,773 | | | | 18,783,180 | | | | | | | | 2/26/15 | | | | 2,229,181 | | | | — | |
Euro | | | SCNY | | | | Sell | | | | 13,581,483 | | | | 18,651,450 | | | | | | | | 2/26/15 | | | | 2,209,181 | | | | — | |
Japanese Yen | | | BZWS | | | | Sell | | | | 1,576,550,000 | | | | 15,416,019 | | | | | | | | 2/26/15 | | | | 2,252,654 | | | | — | |
Japanese Yen | | | SCNY | | | | Sell | | | | 937,086,000 | | | | 9,171,113 | | | | | | | | 2/26/15 | | | | 1,346,937 | | | | — | |
Malaysian Ringgit | | | HSBC | | | | Buy | | | | 1,223,000 | | | | 382,774 | | | | | | | | 2/26/15 | | | | — | | | | (34,960 | ) |
Euro | | | BOFA | | | | Sell | | | | 2,694,506 | | | | 3,684,198 | | | | | | | | 2/27/15 | | | | 422,101 | | | | — | |
Euro | | | DBAB | | | | Sell | | | | 2,579,651 | | | | 3,535,928 | | | | | | | | 2/27/15 | | | | 412,880 | | | | — | |
Japanese Yen | | | DBAB | | | | Sell | | | | 229,660,000 | | | | 2,253,115 | | | | | | | | 2/27/15 | | | | 335,559 | | | | — | |
Malaysian Ringgit | | | HSBC | | | | Buy | | | | 2,087,700 | | | | 625,397 | | | | | | | | 2/27/15 | | | | — | | | | (31,721 | ) |
Singapore Dollar | | | DBAB | | | | Buy | | | | 15,499,000 | | | | 12,383,349 | | | | | | | | 2/27/15 | | | | — | | | | (693,049 | ) |
Chilean Peso | | | DBAB | | | | Buy | | | | 1,253,970,000 | | | | 2,164,256 | | | | | | | | 3/03/15 | | | | — | | | | (110,599 | ) |
Indian Rupee | | | HSBC | | | | Buy | | | | 120,016,750 | | | | 1,906,762 | | | | | | | | 3/03/15 | | | | — | | | | (23,989 | ) |
Japanese Yen | | | JPHQ | | | | Sell | | | | 848,300,000 | | | | 8,330,768 | | | | | | | | 3/03/15 | | | | 1,247,579 | | | | — | |
Japanese Yen | | | HSBC | | | | Sell | | | | 400,800,000 | | | | 3,927,487 | | | | | | | | 3/04/15 | | | | 580,824 | | | | — | |
Euro | | | DBAB | | | | Sell | | | | 1,536,000 | | | | 2,117,606 | | | | | | | | 3/05/15 | | | | 257,958 | | | | — | |
Euro | | | BZWS | | | | Sell | | | | 7,226,276 | | | | 9,927,286 | | | | | | | | 3/09/15 | | | | 1,178,056 | | | | — | |
Euro | | | GSCO | | | | Sell | | | | 21,480,000 | | | | 29,508,580 | | | | | | | | 3/09/15 | | | | 3,501,622 | | | | — | |
Euro | | | HSBC | | | | Sell | | | | 1,844,000 | | | | 2,535,057 | | | | | | | | 3/09/15 | | | | 302,430 | | | | — | |
Indian Rupee | | | DBAB | | | | Buy | | | | 40,529,000 | | | | 647,185 | | | | | | | | 3/09/15 | | | | — | | | | (12,120 | ) |
Japanese Yen | | | BZWS | | | | Sell | | | | 1,712,605,900 | | | | 16,747,810 | | | | | | | | 3/09/15 | | | | 2,446,815 | | | | — | |
Euro | | | CITI | | | | Sell | | | | 31,404,613 | | | | 43,464,770 | | | | | | | | 3/10/15 | | | | 5,441,223 | | | | — | |
Euro | | | MSCO | | | | Sell | | | | 5,225,000 | | | | 7,236,494 | | | | | | | | 3/10/15 | | | | 910,257 | | | | — | |
Mexican Peso | | | HSBC | | | | Buy | | | | 135,500,950 | | | | 10,232,665 | | | | | | | | 3/10/15 | | | | — | | | | (1,083,238 | ) |
Singapore Dollar | | | CITI | | | | Buy | | | | 21,075,381 | | | | 16,688,084 | | | | | | | | 3/11/15 | | | | — | | | | (796,528 | ) |
Chilean Peso | | | DBAB | | | | Buy | | | | 1,284,460,000 | | | | 2,183,008 | | | | | | | | 3/13/15 | | | | — | | | | (81,195 | ) |
Indian Rupee | | | JPHQ | | | | Buy | | | | 139,661,000 | | | | 2,223,547 | | | | | | | | 3/13/15 | | | | — | | | | (36,834 | ) |
Mexican Peso | | | CITI | | | | Buy | | | | 30,688,400 | | | | 2,312,964 | | | | | | | | 3/13/15 | | | | — | | | | (241,187 | ) |
Euro | | | JPHQ | | | | Sell | | | | 541,000 | | | | 749,734 | | | | | | | | 3/16/15 | | | | 94,676 | | | | — | |
Singapore Dollar | | | HSBC | | | | Buy | | | | 10,521,600 | | | | 8,328,531 | | | | | | | | 3/16/15 | | | | — | | | | (396,082 | ) |
Euro | | | BZWS | | | | Sell | | | | 1,161,439 | | | | 1,619,627 | | | | | | | | 3/17/15 | | | | 213,311 | | | | — | |
Euro | | | CITI | | | | Sell | | | | 861,168 | | | | 1,201,588 | | | | | | | | 3/17/15 | | | | 158,852 | | | | — | |
Japanese Yen | | | CITI | | | | Sell | | | | 286,112,008 | | | | 2,796,192 | | | | | | | | 3/17/15 | | | | 406,818 | | | | — | |
Mexican Peso | | | CITI | | | | Buy | | | | 25,894,900 | | | | 1,896,854 | | | | | | | | 3/17/15 | | | | — | | | | (149,131 | ) |
Hungarian Forint | | | DBAB | | | | Buy | | | | 2,348,675,000 | | | | 7,360,310 | | | | EUR | | | | 3/19/15 | | | | 46,927 | | | | — | |
Hungarian Forint | | | JPHQ | | | | Buy | | | | 703,907,450 | | | | 2,206,2614 | | | | EUR | | | | 3/19/15 | | | | 13,646 | | | | — | |
Japanese Yen | | | CITI | | | | Sell | | | | 1,866,452,000 | | | | 18,386,154 | | | | | | | | 3/19/15 | | | | 2,798,717 | | | | — | |
Japanese Yen | | | MSCO | | | | Sell | | | | 575,230,000 | | | | 5,697,039 | | | | | | | | 3/19/15 | | | | 893,078 | | | | — | |
Chilean Peso | | | JPHQ | | | | Buy | | | | 1,065,000,000 | | | | 1,806,616 | | | | | | | | 3/20/15 | | | | — | | | | (64,945 | ) |
Hungarian Forint | | | JPHQ | | | | Buy | | | | 2,348,992,000 | | | | 7,387,464 | | | | EUR | | | | 3/20/15 | | | | 14,956 | | | | — | |
Euro | | | BZWS | | | | Sell | | | | 744,197 | | | | 1,036,294 | | | | | | | | 3/23/15 | | | | 135,143 | | | | — | |
Japanese Yen | | | DBAB | | | | Sell | | | | 725,287,000 | | | | 7,102,579 | | | | | | | | 3/24/15 | | | | 1,045,095 | | | | — | |
Mexican Peso | | | CITI | | | | Buy | | | | 75,637,200 | | | | 5,533,080 | | | | | | | | 3/24/15 | | | | — | | | | (430,374 | ) |
Japanese Yen | | | BZWS | | | | Sell | | | | 983,714,840 | | | | 9,632,663 | | | | | | | | 3/25/15 | | | | 1,416,737 | | | | — | |
Euro | | | DBAB | | | | Sell | | | | 2,736,000 | | | | 3,767,882 | | | | | | | | 3/26/15 | | | | 454,757 | | | | — | |
Malaysian Ringgit | | | DBAB | | | | Buy | | | | 8,012,500 | | | | 2,379,008 | | | | | | | | 3/26/15 | | | | — | | | | (106,034 | ) |
FRANKLIN TEMPLETON VARIABLE INSURANCE PRODUCTS TRUST
STATEMENT OF INVESTMENTS
Templeton Global Bond VIP Fund (continued)
| | | | | | | | | | | | | | | | | | | | | | | | | | | | | | |
| Forward Exchange Contracts (continued) | |
| Currency | | Counterpartya | | | Type | | | Quantity | | | Contract
Amount* | | | | | Settlement
Date | | | Unrealized
Appreciation | | | Unrealized
Depreciation | |
Malaysian Ringgit | | | HSBC | | | | Buy | | | | 7,634,000 | | | | 2,265,685 | | | | | | 3/26/15 | | | $ | — | | | $ | (100,083 | ) |
Euro | | | BZWS | | | | Sell | | | | 6,085,000 | | | | 8,403,385 | | | | | | 3/27/15 | | | | 1,034,764 | | | | — | |
Euro | | | GSCO | | | | Sell | | | | 4,020,000 | | | | 5,124,093 | | | | | | 3/31/15 | | | | 255,905 | | | | — | |
Malaysian Ringgit | | | HSBC | | | | Buy | | | | 7,790,000 | | | | 2,319,971 | | | | | | 3/31/15 | | | | — | | | | (111,108 | ) |
Euro | | | DBAB | | | | Sell | | | | 6,200,000 | | | | 8,552,466 | | | | | | 4/07/15 | | | | 1,043,751 | | | | — | |
Euro | | | HSBC | | | | Sell | | | | 8,692,000 | | | | 11,983,443 | | | | | | 4/10/15 | | | | 1,456,369 | | | | — | |
Malaysian Ringgit | | | HSBC | | | | Buy | | | | 4,010,000 | | | | 1,204,023 | | | | | | 4/10/15 | | | | — | | | | (67,910 | ) |
Euro | | | DBAB | | | | Sell | | | | 7,243,000 | | | | 9,997,296 | | | | | | 4/13/15 | | | | 1,224,854 | | | | — | |
Euro | | | SCNY | | | | Sell | | | | 4,346,000 | | | | 6,007,172 | | | | | | 4/13/15 | | | | 743,465 | | | | — | |
Euro | | | JPHQ | | | | Sell | | | | 3,907,000 | | | | 5,415,297 | | | | | | 4/14/15 | | | | 683,239 | | | | — | |
Japanese Yen | | | CITI | | | | Sell | | | | 261,800,000 | | | | 2,586,279 | | | | | | 4/15/15 | | | | 399,193 | | | | — | |
Chilean Peso | | | MSCO | | | | Buy | | | | 2,370,410,000 | | | | 4,180,617 | | | | | | 4/16/15 | | | | — | | | | (312,883 | ) |
Euro | | | HSBC | | | | Sell | | | | 6,919,000 | | | | 9,607,793 | | | | | | 4/16/15 | | | | 1,227,497 | | | | — | |
Malaysian Ringgit | | | DBAB | | | | Buy | | | | 16,369,588 | | | | 4,942,508 | | | | | | 4/16/15 | | | | — | | | | (306,944 | ) |
Japanese Yen | | | BZWS | | | | Sell | | | | 700,840,000 | | | | 6,897,488 | | | | | | 4/17/15 | | | | 1,042,505 | | | | — | |
Japanese Yen | | | JPHQ | | | | Sell | | | | 421,090,000 | | | | 4,129,831 | | | | | | 4/21/15 | | | | 611,774 | | | | — | |
Malaysian Ringgit | | | JPHQ | | | | Buy | | | | 15,728,213 | | | | 4,756,756 | | | | | | 4/21/15 | | | | — | | | | (304,631 | ) |
Japanese Yen | | | JPHQ | | | | Sell | | | | 496,560,000 | | | | 4,870,981 | | | | | | 4/22/15 | | | | 722,348 | | | | — | |
Chilean Peso | | | JPHQ | | | | Buy | | | | 1,501,938,000 | | | | 2,597,385 | | | | | | 4/28/15 | | | | — | | | | (149,163 | ) |
Euro | | | BZWS | | | | Sell | | | | 6,575,679 | | | | 9,116,916 | | | | | | 4/30/15 | | | | 1,151,252 | | | | — | |
Euro | | | SCNY | | | | Sell | | | | 11,263,000 | | | | 15,586,415 | | | | | | 4/30/15 | | | | 1,942,611 | | | | — | |
Euro | | | BZWS | | | | Sell | | | | 7,026,829 | | | | 9,738,201 | | | | | | 5/05/15 | | | | 1,225,564 | | | | — | |
Euro | | | BZWS | | | | Sell | | | | 1,259,000 | | | | 1,747,228 | | | | | | 5/07/15 | | | | 221,982 | | | | — | |
Euro | | | GSCO | | | | Sell | | | | 2,990,000 | | | | 4,150,539 | | | | | | 5/07/15 | | | | 528,232 | �� | | | — | |
Chilean Peso | | | MSCO | | | | Buy | | | | 1,150,200,000 | | | | 1,963,134 | | | | | | 5/11/15 | | | | — | | | | (90,288 | ) |
Japanese Yen | | | CITI | | | | Sell | | | | 366,861,000 | | | | 3,622,531 | | | | | | 5/12/15 | | | | 556,753 | | | | — | |
Euro | | | CITI | | | | Sell | | | | 5,658,426 | | | | 7,795,614 | | | | | | 5/13/15 | | | | 940,135 | | | | — | |
Euro | | | GSCO | | | | Sell | | | | 2,279,000 | | | | 3,140,210 | | | | | | 5/13/15 | | | | 379,083 | | | | — | |
Euro | | | SCNY | | | | Sell | | | | 629,000 | | | | 865,237 | | | | | | 5/13/15 | | | | 103,170 | | | | — | |
Japanese Yen | | | GSCO | | | | Sell | | | | 490,555,000 | | | | 4,832,578 | | | | | | 5/13/15 | | | | 733,066 | | | | — | |
Japanese Yen | | | SCNY | | | | Sell | | | | 366,681,000 | | | | 3,615,470 | | | | | | 5/13/15 | | | | 551,159 | | | | — | |
Euro | | | GSCO | | | | Sell | | | | 3,095,000 | | | | 4,263,177 | | | | | | 5/14/15 | | | | 513,383 | | | | — | |
Japanese Yen | | | CITI | | | | Sell | | | | 366,680,000 | | | | 3,607,315 | | | | | | 5/14/15 | | | | 542,975 | | | | — | |
Euro | | | BZWS | | | | Sell | | | | 8,551,980 | | | | 11,739,474 | | | | | | 5/18/15 | | | | 1,377,747 | | | | — | |
Japanese Yen | | | BOFA | | | | Sell | | | | 1,105,661,700 | | | | 10,890,000 | | | | | | 5/18/15 | | | | 1,649,547 | | | | — | |
Japanese Yen | | | BOFA | | | | Sell | | | | 1,102,846,375 | | | | 10,895,000 | | | | | | 5/19/15 | | | | 1,677,964 | | | | — | |
Japanese Yen | | | BZWS | | | | Sell | | | | 1,105,842,500 | | | | 10,895,000 | | | | | | 5/19/15 | | | | 1,652,924 | | | | — | |
Japanese Yen | | | CITI | | | | Sell | | | | 1,104,534,000 | | | | 10,895,000 | | | | | | 5/19/15 | | | | 1,663,859 | | | | — | |
Japanese Yen | | | HSBC | | | | Sell | | | | 1,106,730,400 | | | | 10,895,000 | | | | | | 5/19/15 | | | | 1,645,503 | | | | — | |
Singapore Dollar | | | DBAB | | | | Buy | | | | 11,645,100 | | | | 9,320,927 | | | | | | 5/19/15 | | | | — | | | | (547,758 | ) |
Euro | | | JPHQ | | | | Sell | | | | 15,309,581 | | | | 19,214,979 | | | | | | 5/20/15 | | | | 665,226 | | | | — | |
Japanese Yen | | | JPHQ | | | | Sell | | | | 715,709,000 | | | | 6,099,706 | | | | | | 5/20/15 | | | | 118,097 | | | | — | |
Euro | | | DBAB | | | | Sell | | | | 3,887,000 | | | | 4,881,295 | | | | | | 5/21/15 | | | | 171,586 | | | | — | |
Euro | | | GSCO | | | | Sell | | | | 4,454,000 | | | | 6,114,496 | | | | | | 5/21/15 | | | | 717,778 | | | | — | |
Chilean Peso | | | MSCO | | | | Buy | | | | 420,740,000 | | | | 740,218 | | | | | | 5/22/15 | | | | — | | | | (55,763 | ) |
Euro | | | BZWS | | | | Sell | | | | 11,375,532 | | | | 15,597,276 | | | | | | 5/22/15 | | | | 1,813,892 | | | | — | |
Malaysian Ringgit | | | HSBC | | | | Buy | | | | 298,500 | | | | 90,870 | | | | | | 5/22/15 | | | | — | | | | (6,588 | ) |
Euro | | | JPHQ | | | | Sell | | | | 4,730,771 | | | | 6,467,059 | | | | | | 5/26/15 | | | | 734,681 | | | | — | |
Malaysian Ringgit | | | HSBC | | | | Buy | | | | 1,229,300 | | | | 374,615 | | | | | | 5/28/15 | | | | — | | | | (27,688 | ) |
Singapore Dollar | | | DBAB | | | | Buy | | | | 2,980,000 | | | | 2,296,459 | | | | | | 5/28/15 | | | | — | | | | (51,501 | ) |
Euro | | | BZWS | | | | Sell | | | | 2,836,669 | | | | 3,862,153 | | | | | | 5/29/15 | | | | 424,789 | | | | — | |
Singapore Dollar | | | BZWS | | | | Buy | | | | 21,427,761 | | | | 17,077,995 | | | | | | 5/29/15 | | | | — | | | | (935,657 | ) |
Singapore Dollar | | | DBAB | | | | Buy | | | | 2,980,000 | | | | 2,374,029 | | | | | | 5/29/15 | | | | — | | | | (129,083 | ) |
Euro | | | GSCO | | | | Sell | | | | 463,000 | | | | 629,997 | | | | | | 6/01/15 | | | | 68,934 | | | | — | |
Chilean Peso | | | BZWS | | | | Buy | | | | 3,010,700,000 | | | | 5,297,730 | | | | | | 6/04/15 | | | | — | | | | (405,244 | ) |
Chilean Peso | | | MSCO | | | | Buy | | | | 662,100,000 | | | | 1,160,053 | | | | | | 6/05/15 | | | | — | | | | (84,208 | ) |
FRANKLIN TEMPLETON VARIABLE INSURANCE PRODUCTS TRUST
STATEMENT OF INVESTMENTS
Templeton Global Bond VIP Fund (continued)
| | | | | | | | | | | | | | | | | | | | | | | | | | | | | | | | |
| Forward Exchange Contracts (continued) | |
| Currency | | Counterpartya | | | Type | | | Quantity | | | Contract
Amount* | | | | | | Settlement
Date | | | Unrealized
Appreciation | | | Unrealized
Depreciation | |
Euro | | | BZWS | | | | Sell | | | | 7,895,591 | | | | 10,753,400 | | | | | | | | 6/05/15 | | | $ | 1,185,113 | | | $ | — | |
Euro | | | HSBC | | | | Sell | | | | 20,544,891 | | | | 26,756,433 | | | | | | | | 6/08/15 | | | | 1,858,263 | | | | — | |
Mexican Peso | | | CITI | | | | Buy | | | | 78,317,430 | | | | 5,880,658 | | | | | | | | 6/08/15 | | | | — | | | | (622,645 | ) |
Euro | | | GSCO | | | | Sell | | | | 2,033,100 | | | | 2,772,843 | | | | | | | | 6/09/15 | | | | 308,921 | | | | — | |
Japanese Yen | | | CITI | | | | Sell | | | | 1,370,500,000 | | | | 13,418,909 | | | | | | | | 6/09/15 | | | | 1,962,023 | | | | — | |
Japanese Yen | | | HSBC | | | | Sell | | | | 2,052,400,000 | | | | 20,093,398 | | | | | | | | 6/09/15 | | | | 2,936,075 | | | | — | |
Mexican Peso | | | CITI | | | | Buy | | | | 78,230,000 | | | | 5,898,586 | | | | | | | | 6/09/15 | | | | — | | | | (646,776 | ) |
Japanese Yen | | | BZWS | | | | Sell | | | | 1,689,110,000 | | | | 16,542,468 | | | | | | | | 6/10/15 | | | | 2,421,945 | | | | — | |
Japanese Yen | | | CITI | | | | Sell | | | | 2,595,800,000 | | | | 25,383,818 | | | | | | | | 6/10/15 | | | | 3,683,602 | | | | — | |
Japanese Yen | | | HSBC | | | | Sell | | | | 1,798,900,000 | | | | 17,624,266 | | | | | | | | 6/10/15 | | | | 2,585,928 | | | | — | |
Japanese Yen | | | DBAB | | | | Sell | | | | 595,700,000 | | | | 5,832,191 | | | | | | | | 6/11/15 | | | | 852,233 | | | | — | |
Japanese Yen | | | JPHQ | | | | Sell | | | | 1,666,680,000 | | | | 16,314,089 | | | | | | | | 6/11/15 | | | | 2,380,906 | | | | — | |
Polish Zloty | | | CITI | | | | Buy | | | | 5,990,000 | | | | 1,431,781 | | | | EUR | | | | 6/11/15 | | | | — | | | | (53,932 | ) |
Euro | | | GSCO | | | | Sell | | | | 8,105,300 | | | | 10,996,461 | | | | | | | | 6/12/15 | | | | 1,173,297 | | | | — | |
Mexican Peso | | | CITI | | | | Buy | | | | 159,085,880 | | | | 11,896,940 | | | | | | | | 6/12/15 | | | | — | | | | (1,219,072 | ) |
Polish Zloty | | | DBAB | | | | Buy | | | | 30,704,000 | | | | 7,330,373 | | | | EUR | | | | 6/12/15 | | | | — | | | | (266,203 | ) |
Euro | | | DBAB | | | | Sell | | | | 8,383,000 | | | | 11,362,067 | | | | | | | | 6/15/15 | | | | 1,202,018 | | | | — | |
Mexican Peso | | | CITI | | | | Buy | | | | 68,370,400 | | | | 5,118,694 | | | | | | | | 6/15/15 | | | | — | | | | (530,538 | ) |
Singapore Dollar | | | JPHQ | | | | Buy | | | | 5,686,000 | | | | 4,333,841 | | | | | | | | 6/15/15 | | | | — | | | | (50,760 | ) |
Malaysian Ringgit | | | JPHQ | | | | Buy | | | | 13,361,013 | | | | 3,765,787 | | | | | | | | 6/16/15 | | | | — | | | | (911 | ) |
Japanese Yen | | | CITI | | | | Sell | | | | 310,702,000 | | | | 3,054,123 | | | | | | | | 6/17/15 | | | | 456,512 | | | | — | |
Japanese Yen | | | JPHQ | | | | Sell | | | | 702,800,000 | | | | 6,909,128 | | | | | | | | 6/17/15 | | | | 1,033,401 | | | | — | |
Malaysian Ringgit | | | JPHQ | | | | Buy | | | | 14,772,000 | | | | 4,165,821 | | | | | | �� | | 6/19/15 | | | | — | | | | (4,368 | ) |
Euro | | | BZWS | | | | Sell | | | | 1,124,367 | | | | 1,529,617 | | | | | | | | 6/22/15 | | | | 166,801 | | | | — | |
Japanese Yen | | | DBAB | | | | Sell | | | | 1,455,820,000 | | | | 14,296,573 | | | | | | | | 6/22/15 | | | | 2,124,512 | | | | — | |
Malaysian Ringgit | | | HSBC | | | | Buy | | | | 36,880,000 | | | | 11,168,312 | | | | | | | | 6/22/15 | | | | — | | | | (781,293 | ) |
Mexican Peso | | | CITI | | | | Buy | | | | 61,535,000 | | | | 4,596,280 | | | | | | | | 6/22/15 | | | | — | | | | (468,665 | ) |
Singapore Dollar | | | HSBC | | | | Buy | | | | 6,864,000 | | | | 5,224,142 | | | | | | | | 6/22/15 | | | | — | | | | (53,908 | ) |
Singapore Dollar | | | DBAB | | | | Buy | | | | 8,589,700 | | | | 6,553,021 | | | | | | | | 6/23/15 | | | | — | | | | (82,957 | ) |
Philippine Peso | | | JPHQ | | | | Buy | | | | 251,010,000 | | | | 5,697,263 | | | | | | | | 6/25/15 | | | | — | | | | (128,166 | ) |
Philippine Peso | | | JPHQ | | | | Buy | | | | 17,950,000 | | | | 398,978 | | | | | | | | 6/29/15 | | | | — | | | | (774 | ) |
South Korean Won | | | DBAB | | | | Buy | | | | 21,440,000,000 | | | | 20,706,973 | | | | | | | | 6/29/15 | | | | — | | | | (1,238,806 | ) |
Polish Zloty | | | CITI | | | | Buy | | | | 135,806,000 | | | | 43,573,652 | | | | | | | | 6/30/15 | | | | — | | | | (5,478,167 | ) |
Mexican Peso | | | CITI | | | | Buy | | | | 105,786,172 | | | | 7,946,081 | | | | | | | | 7/10/15 | | | | — | | | | (858,662 | ) |
Malaysian Ringgit | | | DBAB | | | | Buy | | | | 18,006,622 | | | | 5,557,599 | | | | | | | | 7/14/15 | | | | — | | | | (494,202 | ) |
Malaysian Ringgit | | | DBAB | | | | Buy | | | | 13,610,000 | | | | 4,200,617 | | | | | | | | 7/15/15 | | | | — | | | | (373,795 | ) |
Euro | | | BZWS | | | | Sell | | | | 2,243,000 | | | | 3,063,624 | | | | | | | | 7/16/15 | | | | 343,984 | | | | — | |
Euro | | | MSCO | | | | Sell | | | | 9,679,000 | | | | 13,215,319 | | | | | | | | 7/16/15 | | | | 1,479,523 | | | | — | |
Euro | | | DBAB | | | | Sell | | | | 17,930,000 | | | | 24,380,318 | | | | | | | | 7/17/15 | | | | 2,639,822 | | | | — | |
Euro | | | BZWS | | | | Sell | | | | 3,518,000 | | | | 4,769,458 | | | | | | | | 7/20/15 | | | | 503,602 | | | | — | |
Malaysian Ringgit | | | DBAB | | | | Buy | | | | 2,637,000 | | | | 807,781 | | | | | | | | 7/20/15 | | | | — | | | | (66,569 | ) |
Malaysian Ringgit | | | DBAB | | | | Buy | | | | 11,455,000 | | | | 2,581,641 | | | | EUR | | | | 7/20/15 | | | | 89,342 | | | | — | |
Euro | | | DBAB | | | | Sell | | | | 1,935,000 | | | | 2,623,667 | | | | | | | | 7/22/15 | | | | 277,248 | | | | — | |
Euro | | | MSCO | | | | Sell | | | | 12,182,000 | | | | 16,491,261 | | | | | | | | 7/22/15 | | | | 1,719,130 | | | | — | |
Malaysian Ringgit | | | DBAB | | | | Buy | | | | 4,160,000 | | | | 1,279,016 | | | | | | | | 7/22/15 | | | | — | | | | (109,876 | ) |
Malaysian Ringgit | | | DBAB | | | | Buy | | | | 12,933,000 | | | | 2,932,587 | | | | EUR | | | | 7/22/15 | | | | 78,621 | | | | — | |
Euro | | | DBAB | | | | Sell | | | | 1,759,000 | | | | 2,382,882 | | | | | | | | 7/23/15 | | | | 249,850 | | | | — | |
Japanese Yen | | | CITI | | | | Sell | | | | 913,412,000 | | | | 9,038,135 | | | | | | | | 7/24/15 | | | | 1,397,006 | | | | — | |
Japanese Yen | | | JPHQ | | | | Sell | | | | 1,407,000,000 | | | | 13,914,849 | | | | | | | | 7/24/15 | | | | 2,144,620 | | | | — | |
Euro | | | DBAB | | | | Sell | | | | 4,715,000 | | | | 6,358,460 | | | | | | | | 7/27/15 | | | | 640,493 | | | | — | |
Euro | | | GSCO | | | | Sell | | | | 4,711,000 | | | | 6,355,846 | | | | | | | | 7/27/15 | | | | 642,729 | | | | — | |
Japanese Yen | | | JPHQ | | | | Sell | | | | 490,100,000 | | | | 4,849,594 | | | | | | | | 7/27/15 | | | | 749,449 | | | | — | |
Malaysian Ringgit | | | DBAB | | | | Buy | | | | 5,058,000 | | | | 1,563,959 | | | | | | | | 7/27/15 | | | | — | | | | (142,926 | ) |
Malaysian Ringgit | | | DBAB | | | | Buy | | | | 16,628,000 | | | | 3,811,838 | | | | EUR | | | | 7/27/15 | | | | 48,911 | | | | — | |
Chilean Peso | | | DBAB | | | | Buy | | | | 1,967,720,000 | | | | 3,386,490 | | | | | | | | 7/28/15 | | | | — | | | | (203,075 | ) |
Chilean Peso | | | MSCO | | | | Buy | | | | 1,963,430,000 | | | | 3,378,293 | | | | | | | | 7/28/15 | | | | — | | | | (201,818 | ) |
FRANKLIN TEMPLETON VARIABLE INSURANCE PRODUCTS TRUST
STATEMENT OF INVESTMENTS
Templeton Global Bond VIP Fund (continued)
| | | | | | | | | | | | | | | | | | | | | | | | | | | | | | | | |
| Forward Exchange Contracts (continued) | |
| Currency | | Counterpartya | | | Type | | | Quantity | | | Contract
Amount* | | | | | | Settlement
Date | | | Unrealized
Appreciation | | | Unrealized
Depreciation | |
Euro | | | CITI | | | | Sell | | | | 1,935,410 | | | | 2,610,733 | | | | | | | | 7/28/15 | | | $ | 263,587 | | | $ | — | |
Euro | | | GSCO | | | | Sell | | | | 11,263,000 | | | | 15,199,644 | | | | | | | | 7/28/15 | | | | 1,540,574 | | | | — | |
Japanese Yen | | | BZWS | | | | Sell | | | | 1,079,470,000 | | | | 10,640,152 | | | | | | | | 7/29/15 | | | | 1,609,047 | | | | — | |
Chilean Peso | | | JPHQ | | | | Buy | | | | 675,370,000 | | | | 1,160,629 | | | | | | | | 7/30/15 | | | | — | | | | (68,181 | ) |
Malaysian Ringgit | | | JPHQ | | | | Buy | | | | 5,318,000 | | | | 1,644,403 | | | | | | | | 7/30/15 | | | | — | | | | (150,629 | ) |
Malaysian Ringgit | | | JPHQ | | | | Buy | | | | 16,628,000 | | | | 3,812,712 | | | | EUR | | | | 7/30/15 | | | | 46,671 | | | | — | |
Chilean Peso | | | DBAB | | | | Buy | | | | 635,690,000 | | | | 1,093,096 | | | | | | | | 7/31/15 | | | | — | | | | (64,917 | ) |
Euro | | | JPHQ | | | | Sell | | | | 11,263,000 | | | | 15,142,653 | | | | | | | | 7/31/15 | | | | 1,482,915 | | | | — | |
Malaysian Ringgit | | | HSBC | | | | Buy | | | | 3,005,000 | | | | 925,128 | | | | | | | | 7/31/15 | | | | — | | | | (81,110 | ) |
Malaysian Ringgit | | | JPHQ | | | | Buy | | | | 11,703,000 | | | | 3,604,028 | | | | | | | | 7/31/15 | | | | — | | | | (316,993 | ) |
Chilean Peso | | | DBAB | | | | Buy | | | | 1,271,380,000 | | | | 2,156,343 | | | | | | | | 8/04/15 | | | | — | | | | (100,657 | ) |
Euro | | | BZWS | | | | Sell | | | | 282,898 | | | | 379,461 | | | | | | | | 8/04/15 | | | | 36,341 | | | | — | |
Euro | | | HSBC | | | | Sell | | | | 11,263,000 | | | | 15,115,228 | | | | | | | | 8/04/15 | | | | 1,454,599 | | | | — | |
Euro | | | BZWS | | | | Sell | | | | 7,003,000 | | | | 9,413,958 | | | | | | | | 8/05/15 | | | | 920,045 | | | | — | |
Euro | | | JPHQ | | | | Sell | | | | 5,724,900 | | | | 7,696,327 | | | | | | | | 8/05/15 | | | | 752,616 | | | | — | |
Malaysian Ringgit | | | HSBC | | | | Buy | | | | 21,208,085 | | | | 6,488,828 | | | | | | | | 8/06/15 | | | | — | | | | (534,519 | ) |
Malaysian Ringgit | | | JPHQ | | | | Buy | | | | 1,100,000 | | | | 338,826 | | | | | | | | 8/06/15 | | | | — | | | | (29,994 | ) |
Singapore Dollar | | | DBAB | | | | Buy | | | | 6,207,000 | | | | 4,986,343 | | | | | | | | 8/07/15 | | | | — | | | | (310,860 | ) |
Euro | | | CITI | | | | Sell | | | | 7,698,954 | | | | 10,300,172 | | | | | | | | 8/10/15 | | | | 961,377 | | | | — | |
Euro | | | DBAB | | | | Sell | | | | 4,845,000 | | | | 6,492,082 | | | | | | | | 8/11/15 | | | | 615,024 | | | | — | |
Euro | | | JPHQ | | | | Sell | | | | 6,343,900 | | | | 8,496,861 | | | | | | | | 8/11/15 | | | | 801,615 | | | | — | |
Japanese Yen | | | CITI | | | | Sell | | | | 751,731,000 | | | | 7,378,955 | | | | | | | | 8/11/15 | | | | 1,088,307 | | | | — | |
Malaysian Ringgit | | | HSBC | | | | Buy | | | | 2,230,000 | | | | 680,895 | | | | | | | | 8/11/15 | | | | — | | | | (55,021 | ) |
Chilean Peso | | | DBAB | | | | Buy | | | | 1,145,000,000 | | | | 1,934,775 | | | | | | | | 8/12/15 | | | | — | | | | (84,642 | ) |
Euro | | | GSCO | | | | Sell | | | | 30,376,000 | | | | 40,787,070 | | | | | | | | 8/12/15 | | | | 3,939,925 | | | | — | |
Malaysian Ringgit | | | HSBC | | | | Buy | | | | 6,100,000 | | | | 1,857,321 | | | | | | | | 8/12/15 | | | | — | | | | (145,405 | ) |
South Korean Won | | | HSBC | | | | Buy | | | | 11,980,000,000 | | | | 1,157,868,285 | | | | JPY | | | | 8/12/15 | | | | 1,179,541 | | | | — | |
Euro | | | MSCO | | | | Sell | | | | 1,962,500 | | | | 2,451,084 | | | | | | | | 8/14/15 | | | | 70,426 | | | | — | |
Euro | | | MSCO | | | | Sell | | | | 1,962,500 | | | | 2,634,705 | | | | | | | | 8/17/15 | | | | 253,930 | | | | — | |
Chilean Peso | | | MSCO | | | | Buy | | | | 981,300,000 | | | | 1,653,551 | | | | | | | | 8/18/15 | | | | — | | | | (68,708 | ) |
Euro | | | BZWS | | | | Sell | | | | 7,066,000 | | | | 9,482,678 | | | | | | | | 8/18/15 | | | | 910,535 | | | | — | |
Japanese Yen | | | DBAB | | | | Sell | | | | 838,612,000 | | | | 8,222,613 | | | | | | | | 8/18/15 | | | | 1,204,033 | | | | — | |
Polish Zloty | | | DBAB | | | | Buy | | | | 59,155,000 | | | | 13,879,634 | | | | EUR | | | | 8/19/15 | | | | — | | | | (264,226 | ) |
Chilean Peso | | | JPHQ | | | | Buy | | | | 528,050,000 | | | | 890,097 | | | | | | | | 8/20/15 | | | | — | | | | (37,412 | ) |
Euro | | | DBAB | | | | Sell | | | | 3,964,000 | | | | 5,317,012 | | | | | | | | 8/20/15 | | | | 507,915 | | | | — | |
Euro | | | JPHQ | | | | Sell | | | | 7,851,000 | | | | 10,535,061 | | | | | | | | 8/20/15 | | | | 1,010,282 | | | | — | |
Japanese Yen | | | HSBC | | | | Sell | | | | 1,621,372,000 | | | | 15,864,697 | | | | | | | | 8/20/15 | | | | 2,294,483 | | | | — | |
Japanese Yen | | | JPHQ | | | | Sell | | | | 1,135,828,000 | | | | 11,119,108 | | | | | | | | 8/20/15 | | | | 1,612,697 | | | | — | |
Japanese Yen | | | BZWS | | | | Sell | | | | 376,247,000 | | | | 3,656,824 | | | | | | | | 8/24/15 | | | | 507,563 | | | | — | |
Japanese Yen | | | DBAB | | | | Sell | | | | 371,821,000 | | | | 3,595,670 | | | | | | | | 8/25/15 | | | | 483,399 | | | | — | |
Japanese Yen | | | HSBC | | | | Sell | | | | 746,218,000 | | | | 7,220,300 | | | | | | | | 8/25/15 | | | | 974,196 | | | | — | |
Euro | | | BZWS | | | | Sell | | | | 2,680,925 | | | | 3,567,306 | | | | | | | | 8/26/15 | | | | 314,508 | | | | — | |
Japanese Yen | | | BZWS | | | | Sell | | | | 1,085,075,000 | | | | 10,507,573 | | | | | | | | 8/26/15 | | | | 1,424,953 | | | | — | |
Japanese Yen | | | JPHQ | | | | Sell | | | | 750,133,000 | | | | 7,258,954 | | | | | | | | 8/26/15 | | | | 979,965 | | | | — | |
Chilean Peso | | | DBAB | | | | Buy | | | | 1,435,490,000 | | | | 2,395,278 | | | | | | | | 8/27/15 | | | | — | | | | (78,599 | ) |
Euro | | | HSBC | | | | Sell | | | | 18,537,726 | | | | 24,543,023 | | | | | | | | 8/27/15 | | | | 2,050,613 | | | | — | |
Euro | | | JPHQ | | | | Sell | | | | 14,996,625 | | | | 19,862,655 | | | | | | | | 8/27/15 | | | | 1,666,775 | | | | — | |
Japanese Yen | | | DBAB | | | | Sell | | | | 685,950,000 | | | | 6,621,746 | | | | | | | | 8/27/15 | | | | 879,897 | | | | — | |
Japanese Yen | | | HSBC | | | | Sell | | | | 1,247,125,000 | | | | 12,039,978 | | | | | | | | 8/27/15 | | | | 1,600,729 | | | | — | |
Japanese Yen | | | JPHQ | | | | Sell | | | | 751,903,000 | | | | 7,268,029 | | | | | | | | 8/27/15 | | | | 974,110 | | | | — | |
Malaysian Ringgit | | | JPHQ | | | | Buy | | | | 8,340,000 | | | | 2,577,734 | | | | | | | | 8/27/15 | | | | — | | | | (239,563 | ) |
Chilean Peso | | | JPHQ | | | | Buy | | | | 593,800,000 | | | | 990,988 | | | | | | | | 8/28/15 | | | | — | | | | (32,757 | ) |
Euro | | | DBAB | | | | Sell | | | | 1,058,312 | | | | 1,399,745 | | | | | | | | 8/31/15 | | | | 115,577 | | | | — | |
Japanese Yen | | | JPHQ | | | | Sell | | | | 372,662,000 | | | | 3,602,775 | | | | | | | | 8/31/15 | | | | 483,124 | | | | — | |
Euro | | | DBAB | | | | Sell | | | | 1,732,000 | | | | 2,288,803 | | | | | | | | 9/02/15 | | | | 187,107 | | | | — | |
Chilean Peso | | | DBAB | | | | Buy | | | | 2,582,200,000 | | | | 4,263,871 | | | | | | | | 9/08/15 | | | | — | | | | (100,640 | ) |
FRANKLIN TEMPLETON VARIABLE INSURANCE PRODUCTS TRUST
STATEMENT OF INVESTMENTS
Templeton Global Bond VIP Fund (continued)
| | | | | | | | | | | | | | | | | | | | | | | | | | | | | | | | |
| Forward Exchange Contracts (continued) | |
| Currency | | Counterpartya | | | Type | | | Quantity | | | Contract
Amount* | | | | | | Settlement
Date | | | Unrealized
Appreciation | | | Unrealized
Depreciation | |
Euro | | | DBAB | | | | Sell | | | | 8,105,300 | | | | 10,692,674 | | | | | | | | 9/08/15 | | | $ | 856,332 | | | $ | — | |
Euro | | | JPHQ | | | | Sell | | | | 20,765,000 | | | | 27,017,342 | | | | | | | | 9/08/15 | | | | 1,817,577 | | | | — | |
Chilean Peso | | | DBAB | | | | Buy | | | | 1,320,220,000 | | | | 2,165,360 | | | | | | | | 9/09/15 | | | | — | | | | (36,968 | ) |
Japanese Yen | | | BZWS | | | | Sell | | | | 285,057,504 | | | | 2,673,734 | | | | | | | | 9/18/15 | | | | 286,662 | | | | — | |
Euro | | | BZWS | | | | Sell | | | | 678,250 | | | | 882,658 | | | | | | | | 9/21/15 | | | | 59,380 | | | | — | |
Singapore Dollar | | | HSBC | | | | Buy | | | | 9,120,000 | | | | 7,226,624 | | | | | | | | 9/21/15 | | | | — | | | | (356,378 | ) |
Euro | | | DBAB | | | | Sell | | | | 8,070,000 | | | | 10,422,002 | | | | | | | | 9/23/15 | | | | 626,101 | | | | — | |
Hungarian Forint | | | JPHQ | | | | Buy | | | | 1,156,013,000 | | | | 3,674,198 | | | | EUR | | | | 9/23/15 | | | | — | | | | (72,107 | ) |
Euro | | | BZWS | | | | Sell | | | | 1,647,381 | | | | 2,124,100 | | | | | | | | 9/24/15 | | | | 124,367 | | | | — | |
Hungarian Forint | | | JPHQ | | | | Buy | | | | 925,405,000 | | | | 2,938,073 | | | | EUR | | | | 9/25/15 | | | | — | | | | (54,145 | ) |
Philippine Peso | | | JPHQ | | | | Buy | | | | 123,740,000 | | | | 2,754,062 | | | | | | | | 9/25/15 | | | | — | | | | (11,837 | ) |
Euro | | | CITI | | | | Sell | | | | 1,532,964 | | | | 1,977,064 | | | | | | | | 9/28/15 | | | | 116,085 | | | | — | |
Euro | | | DBAB | | | | Sell | | | | 3,753,000 | | | | 4,833,226 | | | | | | | | 9/28/15 | | | | 277,181 | | | | — | |
Malaysian Ringgit | | | DBAB | | | | Buy | | | | 11,080,500 | | | | 3,343,341 | | | | | | | | 9/28/15 | | | | — | | | | (243,587 | ) |
Malaysian Ringgit | | | HSBC | | | | Buy | | | | 11,490,000 | | | | 3,467,005 | | | | | | | | 9/28/15 | | | | — | | | | (252,694 | ) |
Euro | | | BZWS | | | | Sell | | | | 6,085,000 | | | | 7,769,358 | | | | | | | | 9/29/15 | | | | 382,152 | | | | — | |
Japanese Yen | | | JPHQ | | | | Sell | | | | 285,510,329 | | | | 2,628,065 | | | | | | | | 9/29/15 | | | | 236,679 | | | | — | |
Euro | | | HSBC | | | | Sell | | | | 5,430,000 | | | | 6,919,096 | | | | | | | | 9/30/15 | | | | 326,906 | | | | — | |
Japanese Yen | | | JPHQ | | | | Sell | | | | 172,207,000 | | | | 1,586,540 | | | | | | | | 9/30/15 | | | | 144,124 | | | | — | |
South Korean Won | | | HSBC | | | | Buy | | | | 9,530,000,000 | | | | 9,062,381 | | | | | | | | 9/30/15 | | | | — | | | | (424,182 | ) |
Euro | | | DBAB | | | | Sell | | | | 14,880,000 | | | | 18,981,226 | | | | | | | | 10/01/15 | | | | 916,015 | | | | — | |
Euro | | | JPHQ | | | | Sell | | | | 6,370,000 | | | | 8,073,147 | | | | | | | | 10/07/15 | | | | 338,493 | | | | — | |
Japanese Yen | | | JPHQ | | | | Sell | | | | 5,663,900,000 | | | | 52,286,176 | | | | | | | | 10/07/15 | | | | 4,835,985 | | | | — | |
Mexican Peso | | | HSBC | | | | Buy | | | | 377,048,070 | | | | 27,308,472 | | | | | | | | 10/07/15 | | | | — | | | | (2,199,628 | ) |
Euro | | | DBAB | | | | Sell | | | | 12,680,000 | | | | 16,085,214 | | | | | | | | 10/09/15 | | | | 688,035 | | | | — | |
Japanese Yen | | | HSBC | | | | Sell | | | | 2,816,800,000 | | | | 26,142,602 | | | | | | | | 10/09/15 | | | | 2,543,143 | | | | — | |
Japanese Yen | | | BZWS | | | | Sell | | | | 1,426,300,000 | | | | 13,246,191 | | | | | | | | 10/13/15 | | | | 1,295,192 | | | | — | |
Japanese Yen | | | DBAB | | | | Sell | | | | 1,406,600,000 | | | | 13,071,276 | | | | | | | | 10/13/15 | | | | 1,285,344 | | | | — | |
Mexican Peso | | | DBAB | | | | Buy | | | | 259,112,000 | | | | 18,946,476 | | | | | | | | 10/14/15 | | | | — | | | | (1,699,811 | ) |
Japanese Yen | | | JPHQ | | | | Sell | | | | 652,895,000 | | | | 6,177,044 | | | | | | | | 10/19/15 | | | | 705,529 | | | | — | |
Euro | | | HSBC | | | | Sell | | | | 12,569,000 | | | | 16,093,348 | | | | | | | | 10/20/15 | | | | 827,001 | | | | — | |
Japanese Yen | | | JPHQ | | | | Sell | | | | 1,233,160,000 | | | | 11,663,845 | | | | | | | | 10/20/15 | | | | 1,329,202 | | | | — | |
Malaysian Ringgit | | | JPHQ | | | | Buy | | | | 8,104,000 | | | | 2,421,490 | | | | | | | | 10/20/15 | | | | — | | | | (157,736 | ) |
Japanese Yen | | | BZWS | | | | Sell | | | | 735,200,000 | | | | 6,909,125 | | | | | | | | 10/22/15 | | | | 747,359 | | | | — | |
Malaysian Ringgit | | | HSBC | | | | Buy | | | | 14,613,000 | | | | 4,370,308 | | | | | | | | 10/23/15 | | | | — | | | | (289,161 | ) |
Euro | | | DBAB | | | | Sell | | | | 4,545,000 | | | | 5,769,196 | | | | | | | | 10/26/15 | | | | 248,044 | | | | — | �� |
Malaysian Ringgit | | | DBAB | | | | Buy | | | | 10,811,000 | | | | 3,244,306 | | | | | | | | 10/26/15 | | | | — | | | | (225,593 | ) |
Malaysian Ringgit | | | HSBC | | | | Buy | | | | 7,209,825 | | | | 2,163,813 | | | | | | | | 10/26/15 | | | | — | | | | (150,642 | ) |
Euro | | | BZWS | | | | Sell | | | | 5,604,306 | | | | 7,117,300 | | | | | | | | 10/27/15 | | | | 309,170 | | | | — | |
Euro | | | DBAB | | | | Sell | | | | 3,319,244 | | | | 4,238,509 | | | | | | | | 10/30/15 | | | | 205,995 | | | | — | |
Malaysian Ringgit | | | JPHQ | | | | Buy | | | | 7,468,000 | | | | 2,236,263 | | | | | | | | 10/30/15 | | | | — | | | | (151,559 | ) |
Euro | | | DBAB | | | | Sell | | | | 224,556 | | | | 284,400 | | | | | | | | 11/03/15 | | | | 11,564 | | | | — | |
Euro | | | UBSW | | | | Sell | | | | 32,701,000 | | | | 41,113,332 | | | | | | | | 11/04/15 | | | | 1,380,557 | | | | — | |
Euro | | | BZWS | | | | Sell | | | | 1,581,109 | | | | 1,986,252 | | | | | | | | 11/06/15 | | | | 65,063 | | | | — | |
Euro | | | DBAB | | | | Sell | | | | 15,875,000 | | | | 19,827,081 | | | | | | | | 11/10/15 | | | | 535,714 | | | | — | |
Japanese Yen | | | CITI | | | | Sell | | | | 341,992,119 | | | | 2,999,865 | | | | | | | | 11/10/15 | | | | 132,120 | | | | — | |
Euro | | | JPHQ | | | | Sell | | | | 8,969,211 | | | | 11,238,870 | | | | | | | | 11/12/15 | | | | 338,933 | | | | — | |
Euro | | | MSCO | | | | Sell | | | | 4,572,000 | | | | 5,715,937 | | | | | | | | 11/12/15 | | | | 159,762 | | | | — | |
Japanese Yen | | | CITI | | | | Sell | | | | 429,663,000 | | | | 3,781,047 | | | | | | | | 11/12/15 | | | | 177,949 | | | | — | |
Japanese Yen | | | HSBC | | | | Sell | | | | 413,563,000 | | | | 3,625,281 | | | | | | | | 11/12/15 | | | | 157,196 | | | | — | |
Japanese Yen | | | JPHQ | | | | Sell | | | | 335,950,000 | | | | 2,951,798 | | | | | | | | 11/12/15 | | | | 134,565 | | | | — | |
Euro | | | BZWS | | | | Sell | | | | 2,643,000 | | | | 3,298,966 | | | | | | | | 11/13/15 | | | | 86,954 | | | | — | |
Euro | | | DBAB | | | | Sell | | | | 10,778,730 | | | | 13,489,042 | | | | | | | | 11/16/15 | | | | 388,831 | | | | — | |
Euro | | | MSCO | | | | Sell | | | | 5,391,000 | | | | 6,746,028 | | | | | | | | 11/16/15 | | | | 193,935 | | | | — | |
Japanese Yen | | | MSCO | | | | Sell | | | | 300,000,000 | | | | 2,616,089 | | | | | | | | 11/16/15 | | | | 100,054 | | | | — | |
Japanese Yen | | | SCNY | | | | Sell | | | | 340,600,700 | | | | 2,975,146 | | | | | | | | 11/16/15 | | | | 118,602 | | | | — | |
FRANKLIN TEMPLETON VARIABLE INSURANCE PRODUCTS TRUST
STATEMENT OF INVESTMENTS
Templeton Global Bond VIP Fund (continued)
| | | | | | | | | | | | | | | | | | | | | | | | | | | | | | |
| Forward Exchange Contracts (continued) | |
| Currency | | Counterpartya | | | Type | | | Quantity | | | Contract
Amount* | | | | | Settlement
Date | | | Unrealized
Appreciation | | | Unrealized
Depreciation | |
Euro | | | DBAB | | | | Sell | | | | 2,240,000 | | | | 2,791,376 | | | | | | 11/18/15 | | | $ | 68,805 | | | $ | — | |
Euro | | | UBSW | | | | Sell | | | | 3,245,000 | | | | 4,046,191 | | | | | | 11/18/15 | | | | 102,109 | | | | — | |
Japanese Yen | | | DBAB | | | | Sell | | | | 796,770,000 | | | | 6,869,891 | | | | | | 11/18/15 | | | | 187,190 | | | | — | |
Euro | | | DBAB | | | | Sell | | | | 5,073,398 | | | | 6,346,537 | | | | | | 11/19/15 | | | | 180,015 | | | | — | |
Japanese Yen | | | CITI | | | | Sell | | | | 986,239,000 | | | | 8,516,377 | | | | | | 11/19/15 | | | | 244,328 | | | | — | |
Malaysian Ringgit | | | DBAB | | | | Buy | | | | 7,197,960 | | | | 2,106,145 | | | | | | 11/19/15 | | | | — | | | | (99,499 | ) |
Japanese Yen | | | CITI | | | | Sell | | | | 1,107,834,000 | | | | 9,558,533 | | | | | | 11/20/15 | | | | 266,358 | | | | — | |
Malaysian Ringgit | | | HSBC | | | | Buy | | | | 4,326,000 | | | | 1,262,365 | | | | | | 11/20/15 | | | | — | | | | (56,445 | ) |
Japanese Yen | | | HSBC | | | | Sell | | | | 207,909,000 | | | | 1,778,520 | | | | | | 11/24/15 | | | | 34,452 | | | | — | |
Euro | | | DBAB | | | | Sell | | | | 837,570 | | | | 1,044,140 | | | | | | 11/30/15 | | | | 25,841 | | | | — | |
Euro | | | DBAB | | | | Sell | | | | 5,440,000 | | | | 6,787,488 | | | | | | 12/04/15 | | | | 173,036 | | | | — | |
Euro | | | HSBC | | | | Sell | | | | 2,155,292 | | | | 2,655,061 | | | | | | 12/09/15 | | | | 34,150 | | | | — | |
Euro | | | SCNY | | | | Sell | | | | 2,400,751 | | | | 2,965,696 | | | | | | 12/09/15 | | | | 46,298 | | | | — | |
Euro | | | MSCO | | | | Sell | | | | 1,412,000 | | | | 1,769,808 | | | | | | 12/11/15 | | | | 52,685 | | | | — | |
Mexican Peso | | | CITI | | | | Buy | | | | 95,083,400 | | | | 6,461,665 | | | | | | 12/11/15 | | | | — | | | | (158,389 | ) |
Euro | | | BOFA | | | | Sell | | | | 17,769,000 | | | | 22,094,863 | | | | | | 12/15/15 | | | | 484,075 | | | | — | |
Euro | | | JPHQ | | | | Sell | | | | 5,095,000 | | | | 6,360,241 | | | | | | 12/15/15 | | | | 163,665 | | | | — | |
Mexican Peso | | | CITI | | | | Buy | | | | 45,585,080 | | | | 3,001,981 | | | | | | 12/18/15 | | | | 18,478 | | | | — | |
Japanese Yen | | | DBAB | | | | Sell | | | | 1,453,310,000 | | | | 12,440,592 | | | | | | 12/21/15 | | | | 240,365 | | | | — | |
Japanese Yen | | | HSBC | | | | Sell | | | | 1,455,540,000 | | | | 12,445,832 | | | | | | 12/21/15 | | | | 226,884 | | | | — | |
Japanese Yen | | | BZWS | | | | Sell | | | | 696,650,000 | | | | 5,891,731 | | | | | | 12/22/15 | | | | 43,343 | | | | — | |
Japanese Yen | | | CITI | | | | Sell | | | | 1,086,780,000 | | | | 9,203,760 | | | | | | 12/22/15 | | | | 80,225 | | | | — | |
Euro | | | BZWS | | | | Sell | | | | 6,863,000 | | | | 8,364,804 | | | | | | 1/05/16 | | | | 13,836 | | | | — | |
| | | | | | | | | | | | | | | | | | | | | | | | | | |
Unrealized appreciation (depreciation) | | | | 232,865,865 | | | | (40,202,582 | ) |
| | | | | | | | | | | | | | | | | | | | | | | | | | |
Net unrealized appreciation (depreciation) | | | $ | 192,663,283 | | | | | |
| | | | | | | | | | | | | | | | | | | | | | | | | | | | | | |
aMay be comprised of multiple contracts with the same counterparty, currency and settlement date.
*In U.S. dollars unless otherwise indicated.
At December 31, 2014, the Fund had the following interest rate swap contracts outstanding. See Note 3.
| | | | | | | | | | | | | | | | | | | | |
| Interest Rate Swap Contracts | | | | | | | | | | | | | | | |
| Description | | Counterparty /
Exchange | | | Expiration
Date | | | Notional
Amount | | | Unrealized
Appreciation | | | Unrealized
Depreciation | |
| Centrally Cleared Swaps | | | | | | | | | | | | | | | | | | | | |
Receive Floating rate 3-month USD BBA LIBOR
Pay Fixed rate 0.926% | | | LCH | | | | 10/17/17 | | | $ | 183,490,000 | | | $ | 1,214,733 | | | $ | — | |
Receive Floating rate 3-month USD BBA LIBOR
Pay Fixed rate 2.775% | | | CME | | | | 10/4/23 | | | | 13,090,000 | | | | — | | | | (678,272 | ) |
Receive Floating rate 3-month USD BBA LIBOR
Pay Fixed rate 2.795% | | | CME | | | | 10/4/23 | | | | 13,090,000 | | | | — | | | | (700,199 | ) |
Receive Floating rate 3-month USD BBA LIBOR
Pay Fixed rate 2.765% | | | CME | | | | 10/7/23 | | | | 13,090,000 | | | | — | | | | (666,043 | ) |
Receive Floating rate 3-month USD BBA LIBOR
Pay Fixed rate 2.731% | | | LCH | | | | 7/7/24 | | | | 34,000,000 | | | | — | | | | (1,814,644 | ) |
Receive Floating rate 3-month USD BBA LIBOR
Pay Fixed rate 3.668% | | | CME | | | | 10/4/43 | | | | 6,370,000 | | | | — | | | | (1,324,454 | ) |
Receive Floating rate 3-month USD BBA LIBOR
Pay Fixed rate 3.687% | | | CME | | | | 10/4/43 | | | | 6,370,000 | | | | — | | | | (1,349,459 | ) |
Receive Floating rate 3-month USD BBA LIBOR
Pay Fixed rate 3.675% | | | CME | | | | 10/7/43 | | | | 6,370,000 | | | | — | | | | (1,333,403 | ) |
| | | | | | | | | | | | | | | | |
Centrally Cleared Swaps unrealized appreciation (depreciation) | | | | 1,214,733 | | | | (7,866,474 | ) |
| | | | | | | | | | | | | | | | |
FRANKLIN TEMPLETON VARIABLE INSURANCE PRODUCTS TRUST
STATEMENT OF INVESTMENTS
Templeton Global Bond VIP Fund (continued)
| | | | | | | | | | | | | | | | | | | | |
| Interest Rate Swap Contracts (continued) | | | | | | | | | | | | | | | |
| Description | | Counterparty /
Exchange | | | Expiration
Date | | | Notional
Amount | | | Unrealized
Appreciation | | | Unrealized
Depreciation | |
| OTC Swaps | | | | | | | | | | | | | | | | | | | | |
Receive Floating rate 3-month USD BBA LIBOR
Pay Fixed rate 3.558% | | | JPHQ | | | | 3/4/21 | | | $ | 3,240,000 | | | $ | — | | | $ | (343,604 | ) |
Receive Floating rate 3-month USD BBA LIBOR
Pay Fixed rate 3.523% | | | DBAB | | | | 3/28/21 | | | | 14,630,000 | | | | — | | | | (1,493,633 | ) |
Receive Floating rate 3-month USD BBA LIBOR
Pay Fixed rate 4.347% | | | CITI | | | | 2/25/41 | | | | 7,460,000 | | | | — | | | | (2,523,788 | ) |
Receive Floating rate 3-month USD BBA LIBOR
Pay Fixed rate 4.349% | | | JPHQ | | | | 2/25/41 | | | | 7,460,000 | | | | — | | | | (2,527,738 | ) |
Receive Floating rate 3-month USD BBA LIBOR
Pay Fixed rate 4.320% | | | JPHQ | | | | 2/28/41 | | | | 5,600,000 | | | | — | | | | (1,873,170 | ) |
Receive Floating rate 3-month USD BBA LIBOR
Pay Fixed rate 4.299% | | | JPHQ | | | | 3/1/41 | | | | 1,870,000 | | | | — | | | | (613,749 | ) |
| | | | | | | | | | | | | | | | |
OTC Swaps unrealized appreciation (depreciation) | | | | — | | | | (9,375,682 | ) |
| | | | | | | | | | | | | | | | |
Total Interest Rate Swaps unrealized appreciation (depreciation) | | | | 1,214,733 | | | | (17,242,156 | ) |
| | | | | | | | | | | | | | | | |
Net unrealized appreciation (depreciation) | | | $ | (16,027,423 | ) |
| | | | | | | | | | | | | | | | | | | | |
FRANKLIN TEMPLETON VARIABLE INSURANCE PRODUCTS TRUST
Financial Statements
Statement of Assets and Liabilities
December 31, 2014
| | | | |
| | | Templeton Global
Bond VIP Fund | |
Assets: | | | | |
Investments in securities: | | | | |
Cost - Unaffiliated issuers | | $ | 3,206,633,967 | |
Cost - Repurchase agreements | | | 153,266,107 | |
| | | | |
Total cost of investments | | $ | 3,359,900,074 | |
| | | | |
Value - Unaffiliated issuers | | $ | 3,069,060,380 | |
Value - Repurchase agreements | | | 153,266,107 | |
| | | | |
Total value of investments | | | 3,222,326,487 | |
Cash | | | 131,086,267 | |
Restricted cash (Note 1f) | | | 102,776,600 | |
Foreign currency, at value (cost $54,881,187) | | | 54,797,576 | |
Receivables: | | | | |
Investment securities sold | | | 13,965,819 | |
Capital shares sold | | | 1,705,141 | |
Interest | | | 28,671,491 | |
Due from brokers | | | 6,920,502 | |
Unrealized appreciation on forward exchange contracts | | | 232,865,865 | |
Other assets | | | 292 | |
| | | | |
Total assets | | | 3,795,116,040 | |
| | | | |
Liabilities: | | | | |
Payables: | | | | |
Investment securities purchased | | | 21,427,668 | |
Capital shares redeemed | | | 2,520,710 | |
Management fees | | | 1,404,786 | |
Distribution fees | | | 1,406,445 | |
Variation margin | | | 131,913 | |
Due to Brokers | | | 102,776,600 | |
Unrealized depreciation on forward exchange contracts | | | 40,202,582 | |
Unrealized depreciation on OTC swap contracts | | | 9,375,682 | |
Deferred tax | | | 2,624,665 | |
Accrued expenses and other liabilities | | | 916,406 | |
| | | | |
Total liabilities | | | 182,787,457 | |
| | | | |
Net assets, at value | | $ | 3,612,328,583 | |
| | | | |
Net assets consist of: | | | | |
Paid-in capital | | $ | 3,519,976,589 | |
Undistributed net investment income | | | 39,205,955 | |
Net unrealized appreciation (depreciation) | | | 35,165,493 | |
Accumulated net realized gain (loss) | | | 17,980,546 | |
| | | | |
Net assets, at value | | $ | 3,612,328,583 | |
| | | | |
| | | | |
| | | The accompanying notes are an integral part of these financial statements. | Annual Report | | TGB-25 |
FRANKLIN TEMPLETON VARIABLE INSURANCE PRODUCTS TRUST
FINANCIAL STATEMENTS
Statement of Assets and Liabilities (continued)
December 31, 2014
| | | | |
| | | Templeton Global
Bond VIP Fund | |
| |
| Class 1: | | | | |
Net assets, at value | | $ | 323,491,431 | |
| | | | |
Shares outstanding | | | 17,432,471 | |
| | | | |
Net asset value and maximum offering price per share | | $ | 18.56 | |
| | | | |
| |
| Class 2: | | | | |
Net assets, at value | | $ | 3,177,638,316 | |
| | | | |
Shares outstanding | | | 176,652,246 | |
| | | | |
Net asset value and maximum offering price per share | | $ | 17.99 | |
| | | | |
| |
| Class 4: | | | | |
Net assets, at value | | $ | 111,198,836 | |
| | | | |
Shares outstanding | | | 6,049,384 | |
| | | | |
Net asset value and maximum offering price per share | | $ | 18.38 | |
| | | | |
| | | | |
| TGB-26 | | Annual Report | The accompanying notes are an integral part of these financial statements. | | |
FRANKLIN TEMPLETON VARIABLE INSURANCE PRODUCTS TRUST
FINANCIAL STATEMENTS
Statement of Operations
for the year ended December 31, 2014
| | | | |
| | | Templeton Global
Bond VIP Fund | |
Investment income: | | | | |
Interest (net of foreign taxes $2,852,069) | | $ | 127,015,935 | |
| | | | |
Expenses: | | | | |
Management fees (Note 3a) | | | 16,154,459 | |
Distribution fees: (Note 3c) | | | | |
Class 2 | | | 7,627,990 | |
Class 3 | | | 156,081 | |
Class 4 | | | 405,742 | |
Custodian fees (Note 4) | | | 1,316,806 | |
Reports to shareholders | | | 509,873 | |
Professional fees | | | 101,942 | |
Trustees’ fees and expenses | | | 13,603 | |
Other | | | 75,486 | |
| | | | |
Total expenses | | | 26,361,982 | |
Expense reductions (Note 4) | | | (7,009 | ) |
| | | | |
Net expenses | | | 26,354,973 | |
| | | | |
Net investment income | | | 100,660,962 | |
| | | | |
Realized and unrealized gains (losses): | | | | |
Net realized gain (loss) from: | | | | |
Investments | | | 11,756,370 | |
Foreign currency transactions | | | 25,573,926 | |
Swap contracts | | | (3,632,367 | ) |
| | | | |
Net realized gain (loss) | | | 33,697,929 | |
| | | | |
Net change in unrealized appreciation (depreciation) on: | | | | |
Investments | | | (242,033,071 | ) |
Translation of other assets and liabilities denominated in foreign currencies | | | 169,111,124 | |
Change in deferred taxes on unrealized appreciation | | | (964,346 | ) |
| | | | |
Net change in unrealized appreciation (depreciation) | | | (73,886,293 | ) |
| | | | |
Net realized and unrealized gain (loss) | | | (40,188,364 | ) |
| | | | |
Net increase (decrease) in net assets resulting from operations | | $ | 60,472,598 | |
| | | | |
| | | | |
| | | The accompanying notes are an integral part of these financial statements. | Annual Report | | TGB-27 |
FRANKLIN TEMPLETON VARIABLE INSURANCE PRODUCTS TRUST
FINANCIAL STATEMENTS
Statements of Changes in Net Assets
| | | | | | | | |
| | | Templeton Global Bond VIP Fund | |
| | | Year Ended December 31, | |
| | | 2014 | | | 2013 | |
Increase (decrease) in net assets: | | | | | | | | |
Operations: | | | | | | | | |
Net investment income | | $ | 100,660,962 | | | $ | 100,648,197 | |
Net realized gain (loss) from investments, foreign currency transactions and swap contracts | | | 33,697,929 | | | | 47,113,794 | |
Net change in unrealized appreciation (depreciation) on investments, translation of other assets and liabilities denominated in foreign currencies and deferred taxes | | | (73,886,293 | ) | | | (98,508,111 | ) |
| | | | |
Net increase (decrease) in net assets resulting from operations | | | 60,472,598 | | | | 49,253,880 | |
| | | | |
Distributions to shareholders from: | | | | | | | | |
Net investment income and net foreign currency gains: | | | | | | | | |
Class 1 | | | (15,858,865 | ) | | | (14,463,879 | ) |
Class 2 | | | (156,385,457 | ) | | | (128,696,606 | ) |
Class 3 | | | — | | | | (9,351,774 | ) |
Class 4 | | | (5,645,270 | ) | | | (7,129,387 | ) |
Net realized gains: | | | | | | | | |
Class 1 | | | — | | | | (3,587,066 | ) |
Class 2 | | | — | | | | (33,227,731 | ) |
Class 3 | | | — | | | | (2,438,218 | ) |
Class 4 | | | — | | | | (1,906,223 | ) |
| | | | |
Total distributions to shareholders | | | (177,889,592 | ) | | | (200,800,884 | ) |
| | | | |
Capital share transactions: (Note 2) | | | | | | | | |
Class 1 | | | 52,744,146 | | | | (13,273,114 | ) |
Class 2 | | | 457,068,596 | | | | 529,969,403 | |
Class 3 | | | (195,888,546 | ) | | | 4,794,164 | |
Class 4 | | | (3,448,828 | ) | | | (37,369,362 | ) |
| | | | |
Total capital share transactions | | | 310,475,368 | | | | 484,121,091 | |
| | | | |
Redemption fees | | | 1,163 | | | | 7,288 | |
| | | | |
Net increase (decrease) in net assets | | | 193,059,537 | | | | 332,581,375 | |
Net assets: | | | | | | | | |
Beginning of year | | | 3,419,269,046 | | | | 3,086,687,671 | |
| | | | |
End of year | | $ | 3,612,328,583 | | | $ | 3,419,269,046 | |
| | | | |
Undistributed net investment income included in net assets: | | | | | | | | |
End of year | | $ | 39,205,955 | | | $ | 104,975,944 | |
| | | | |
| | | | |
| TGB-28 | | Annual Report | The accompanying notes are an integral part of these financial statements. | | |
FRANKLIN TEMPLETON VARIABLE INSURANCE PRODUCTS TRUST
Notes to Financial Statements
Templeton Global Bond VIP Fund
1. Organization and Significant Accounting Policies
Franklin Templeton Variable Insurance Products Trust (Trust) is registered under the Investment Company Act of 1940, as amended, (1940 Act) as an open-end management investment company, consisting of nineteen separate funds and applies the specialized accounting and reporting guidance in U.S. Generally Accepted Accounting Principles (U.S. GAAP). Templeton Global Bond VIP Fund (Fund) is included in this report. The financial statements of the remaining funds in the Trust are presented separately. Shares of the Fund are generally sold only to insurance company separate accounts to fund the benefits of variable life insurance policies or variable annuity contracts. The Fund offers three classes of shares: Class 1, Class 2, and Class 4. Effective May 1, 2014, all Class 3 shares were converted to Class 2. Each class of shares differs by its distribution fees, voting rights on matters affecting a single class and its exchange privilege.
Effective May 1, 2014, Templeton Global Bond Securities Fund was renamed Templeton Global Bond VIP Fund.
The following summarizes the Fund’s significant accounting policies.
a. Financial Instrument Valuation
The Fund’s investments in financial instruments are carried at fair value daily. Fair value is the price that would be received to sell an asset or paid to transfer a liability in an orderly transaction between market participants on the measurement date. The Fund calculates the net asset value per share at the close of the New York Stock Exchange (NYSE), generally at 4 p.m. Eastern time (NYSE close) on each day the NYSE is open for trading. Under compliance policies and procedures approved by the Trust’s Board of Trustees (the Board), the Fund’s administrator has responsibility for oversight of valuation, including leading the cross-functional Valuation and Liquidity Oversight Committee (VLOC). The VLOC provides administration and oversight of the Fund’s valuation policies and procedures, which are approved annually by the Board. Among other things, these procedures allow the Fund to utilize independent pricing services, quotations from securities and financial instrument dealers, and other market sources to determine fair value.
Debt securities generally trade in the over-the-counter (OTC) market rather than on a securities exchange. The Fund’s pricing services use multiple valuation techniques to determine fair
value. In instances where sufficient market activity exists, the pricing services may utilize a market-based approach through which quotes from market makers are used to determine fair value. In instances where sufficient market activity may not exist or is limited, the pricing services also utilize proprietary valuation models which may consider market characteristics such as benchmark yield curves, credit spreads, estimated default rates, anticipated market interest rate volatility, coupon rates, anticipated timing of principal repayments, underlying collateral, and other unique security features in order to estimate the relevant cash flows, which are then discounted to calculate the fair value. Securities denominated in a foreign currency are converted into their U.S. dollar equivalent at the foreign exchange rate in effect at the NYSE close on the date that the values of the foreign debt securities are determined. Repurchase agreements are valued at cost, which approximates fair value.
Derivative financial instruments (derivatives) listed on an exchange are valued at the official closing price of the day. Certain derivatives trade in the OTC market. The Fund’s pricing services use various techniques including industry standard option pricing models and proprietary discounted cash flow models to determine the fair value of those instruments. The Fund’s net benefit or obligation under the derivative contract, as measured by the fair value of the contract, is included in net assets.
The Fund has procedures to determine the fair value of financial instruments for which market prices are not reliable or readily available. Under these procedures, the VLOC convenes on a regular basis to review such financial instruments and considers a number of factors, including significant unobservable valuation inputs, when arriving at fair value. The VLOC primarily employs a market-based approach which may use related or comparable assets or liabilities, recent transactions, market multiples, book values, and other relevant information for the investment to determine the fair value of the investment. An income-based valuation approach may also be used in which the anticipated future cash flows of the investment are discounted to calculate fair value. Discounts may also be applied due to the nature or duration of any restrictions on the disposition of the investments. Due to the inherent uncertainty of valuations of such investments, the fair values may differ significantly from the values that would have been used had an active market existed. The VLOC employs various methods for calibrating these valuation approaches including a regular review of key inputs and assumptions, transactional back-testing or disposition analysis, and reviews of any related market activity.
FRANKLIN TEMPLETON VARIABLE INSURANCE PRODUCTS TRUST
NOTES TO FINANCIAL STATEMENTS
Templeton Global Bond VIP Fund (continued)
1. Organization and Significant Accounting
Policies (continued)
b. Foreign Currency Translation
Portfolio securities and other assets and liabilities denominated in foreign currencies are translated into U.S. dollars based on the exchange rate of such currencies against U.S. dollars on the date of valuation. The Fund may enter into foreign currency exchange contracts to facilitate transactions denominated in a foreign currency. Purchases and sales of securities, income and expense items denominated in foreign currencies are translated into U.S. dollars at the exchange rate in effect on the transaction date. Portfolio securities and assets and liabilities denominated in foreign currencies contain risks that those currencies will decline in value relative to the U.S. dollar. Occasionally, events may impact the availability or reliability of foreign exchange rates used to convert the U.S. dollar equivalent value. If such an event occurs, the foreign exchange rate will be valued at fair value using procedures established and approved by the Board.
The Fund does not separately report the effect of changes in foreign exchange rates from changes in market prices on securities held. Such changes are included in net realized and unrealized gain or loss from investments on the Statement of Operations.
Realized foreign exchange gains or losses arise from sales of foreign currencies, currency gains or losses realized between the trade and settlement dates on securities transactions and the difference between the recorded amounts of dividends, interest, and foreign withholding taxes and the U.S. dollar equivalent of the amounts actually received or paid. Net unrealized foreign exchange gains and losses arise from changes in foreign exchange rates on foreign denominated assets and liabilities other than investments in securities held at the end of the reporting period.
c. Joint Repurchase Agreement
The Fund enters into a joint repurchase agreement whereby its uninvested cash balance is deposited into a joint cash account with other funds managed by the investment manager or an affiliate of the investment manager and is used to invest in one or more repurchase agreements. The value and face amount of the joint repurchase agreement are allocated to the funds based on their pro-rata interest. A repurchase agreement is accounted for as a loan by the Fund to the seller, collateralized by securities which are delivered to the Fund’s custodian. The fair
value, including accrued interest, of the initial collateralization is required to be at least 102% of the dollar amount invested by the funds, with the value of the underlying securities marked to market daily to maintain coverage of at least 100%. Repurchase agreements are subject to the terms of Master Repurchase Agreements (MRAs) with approved counterparties (sellers). The MRAs contain various provisions, including but not limited to events of default and maintenance of collateral for repurchase agreements. In the event of default by either the seller or the Fund, certain MRAs may permit the non-defaulting party to net and close-out all transactions, if any, traded under such agreements. The Fund may sell securities it holds as collateral and apply the proceeds towards the repurchase price and any other amounts owed by the seller to the Fund in the event of default by the seller. This could involve costs or delays in addition to a loss on the securities if their value falls below the repurchase price owed by the seller. The joint repurchase agreement held by the Fund at year end, as indicated in the Statement of Investments, had been entered into on December 31, 2014.
d. Securities Purchased on a Delayed Delivery Basis
The Fund purchases securities on a delayed delivery basis, with payment and delivery scheduled for a future date. These transactions are subject to market fluctuations and are subject to the risk that the value at delivery may be more or less than the trade date purchase price. Although the Fund will generally purchase these securities with the intention of holding the securities, it may sell the securities before the settlement date. Sufficient assets have been segregated for these securities.
e. Derivative Financial Instruments
The Fund invested in derivatives in order to manage risk or gain exposure to various other investments or markets. Derivatives are financial contracts based on an underlying or notional amount, require no initial investment or an initial net investment that is smaller than would normally be required to have a similar response to changes in market factors, and require or permit net settlement. Derivatives contain various risks including the potential inability of the counterparty to fulfill their obligations under the terms of the contract, the potential for an illiquid secondary market, and/or the potential for market movements which expose the Fund to gains or losses in excess of the amounts shown on the Statement of Assets and Liabilities. Realized gain and loss and unrealized appreciation and depreciation on these contracts for the period are included in the Statement of Operations.
FRANKLIN TEMPLETON VARIABLE INSURANCE PRODUCTS TRUST
NOTES TO FINANCIAL STATEMENTS
Templeton Global Bond VIP Fund (continued)
Derivative counterparty credit risk is managed through a formal evaluation of the creditworthiness of all potential counterparties. The Fund attempts to reduce its exposure to counterparty credit risk on OTC derivatives, whenever possible, by entering into International Swaps and Derivatives Association (ISDA) master agreements with certain counterparties. These agreements contain various provisions, including but not limited to collateral requirements, events of default, or early termination. Termination events applicable to the counterparty include certain deteriorations in the credit quality of the counterparty. Termination events applicable to the Fund include failure of the Fund to maintain certain net asset levels and/or limit the decline in net assets over various periods of time. In the event of default or early termination, the ISDA master agreement gives the non-defaulting party the right to net and close-out all transactions traded, whether or not arising under the ISDA agreement, to one net amount payable by one counterparty to the other. However, absent an event of default or early termination, OTC derivative assets and liabilities are presented gross and not offset in the Statement of Assets and Liabilities. Early termination by the counterparty may result in an immediate payment by the Fund of any net liability owed to that counterparty under the ISDA agreement.
Collateral requirements differ by type of derivative. Collateral or initial margin requirements are set by the broker or exchange clearing house for exchange traded and centrally cleared derivatives. Initial margin deposited is held at the exchange and can be in the form of cash and/or securities. For OTC derivatives traded under an ISDA master agreement, posting of collateral is required by either the fund or the applicable counterparty if the total net exposure of all OTC derivatives with the applicable counterparty exceeds the minimum transfer amount, which typically ranges from $100,000 to $250,000, and can vary depending on the counterparty and the type of the agreement. Generally, collateral is determined at the close of fund business each day and any additional collateral required due to changes in derivative values may be delivered by the fund or the counterparty within a few business days. Collateral pledged and/or received by the fund for OTC derivatives, if any, is held in segregated accounts with the fund’s custodian/counterparty broker and can be in the form of cash and/or securities. Unrestricted cash may be invested according to the Fund’s investment objectives.
The Fund entered into OTC forward exchange contracts primarily to manage and/or gain exposure to certain foreign currencies.
A forward exchange contract is an agreement between the Fund and a counterparty to buy or sell a foreign currency at a specific exchange rate on a future date.
The Fund entered into interest rate swap contracts primarily to manage interest rate risk. An interest rate swap is an agreement between the Fund and a counterparty to exchange cash flows based on the difference between two interest rates, applied to a notional amount. These agreements may be privately negotiated in the over-the-counter market (“OTC interest rate swaps”) or may be executed on a registered exchange (“centrally cleared interest rate swaps”). For centrally cleared interest rate swaps, required initial margins are pledged by the Fund, and the daily change in fair value is accounted for as a variation margin payable or receivable on the Statement of Assets and Liabilities. Over the term of the contract, contractually required payments to be paid and to be received are accrued daily and recorded as unrealized depreciation and appreciation until the payments are made, at which time they are realized.
See Note 9 regarding other derivative information.
f. Restricted Cash
At December 31, 2014, the Fund held restricted cash in connection with investments in certain derivative securities. Restricted cash is held in a segregated account with the Fund’s counterparty broker and is reflected in the Statement of Assets and Liabilities.
g. Loan Participation Notes
The Fund invests in loan participation notes (“Participations”). Participations are loans originally issued to a borrower by one or more financial institutions (the “Lender”) and subsequently sold to other investors, such as the Fund. Participations typically result in the Fund having a contractual relationship only with the Lender and not with the borrower. The Fund has the right to receive from the Lender any payments of principal, interest and fees which the Lender received from the borrower. The Fund generally has no rights to either enforce compliance by the borrower with the terms of the loan agreement or to any collateral relating to the original loan. As a result, the Fund assumes the credit risk of both the borrower and the Lender that is selling the Participation. The Participations may also involve interest rate risk and liquidity risk, including the potential default or insolvency of the borrower and/or the Lender.
FRANKLIN TEMPLETON VARIABLE INSURANCE PRODUCTS TRUST
NOTES TO FINANCIAL STATEMENTS
Templeton Global Bond VIP Fund (continued)
1. Organization and Significant Accounting
Policies (continued)
h. Income and Deferred Taxes
It is the Fund’s policy to qualify as a regulated investment company under the Internal Revenue Code. The Fund intends to distribute to shareholders substantially all of its taxable income and net realized gains to relieve it from federal income and if applicable, excise taxes. As a result, no provision for U.S. federal income taxes is required.
The Fund may be subject to foreign taxation related to income received, capital gains on the sale of securities and certain foreign currency transactions in the foreign jurisdictions in which it invests. Foreign taxes, if any, are recorded based on the tax regulations and rates that exist in the foreign markets in which the Fund invests. When a capital gain tax is determined to apply the Fund records an estimated deferred tax liability in an amount that would be payable if the securities were disposed of on the valuation date.
The Fund recognizes the tax benefits of uncertain tax positions only when the position is “more likely than not” to be sustained upon examination by the tax authorities based on the technical merits of the tax position. As of December 31, 2014, and for all open tax years, the Fund has determined that no liability for unrecognized tax benefits is required in the Fund’s financial statements related to uncertain tax positions taken on a tax return (or expected to be taken on future tax returns). Open tax years are those that remain subject to examination and are based on each tax jurisdiction statute of limitation.
i. Security Transactions, Investment Income, Expenses and Distributions
Security transactions are accounted for on trade date. Realized gains and losses on security transactions are determined on a specific identification basis. Interest income and estimated expenses are accrued daily. Amortization of premium and accretion of discount on debt securities are included in interest income. Distributions to shareholders are recorded on the ex-dividend date and are determined according to income tax regulations (tax basis). Distributable earnings determined on a tax basis may differ from earnings recorded in accordance with U.S. GAAP. These differences may be permanent or temporary. Permanent differences are reclassified among capital accounts to reflect their tax character. These reclassifications have no impact on net assets or the results of operations. Temporary
differences are not reclassified, as they may reverse in subsequent periods.
Common expenses incurred by the Trust are allocated among the funds based on the ratio of net assets of each fund to the combined net assets of the Trust. Fund specific expenses are charged directly to the fund that incurred the expense.
Realized and unrealized gains and losses and net investment income, not including class specific expenses, are allocated daily to each class of shares based upon the relative proportion of net assets of each class. Differences in per share distributions, by class, are generally due to differences in class specific expenses.
Inflation-indexed bonds are adjusted for inflation through periodic increases or decreases in the security’s interest accruals, face amount, or principal redemption value, by amounts corresponding to the rate of inflation as measured by an index. Any increase or decrease in the face amount or principal redemption value will be included as interest income on the Statement of Operations.
j. Accounting Estimates
The preparation of financial statements in accordance with U.S. GAAP requires management to make estimates and assumptions that affect the reported amounts of assets and liabilities at the date of the financial statements and the amounts of income and expenses during the reporting period. Actual results could differ from those estimates.
k. Redemption Fees
Redemptions and exchanges of interests in an insurance company subaccount that invested in Class 3 shares of the Fund were subject to a 1.0% short term trading fee if the interest in the subaccount had been held for less than 60 days. Such fees were retained by the Fund and accounted for as an addition to paid-in capital, allocated to each class of shares based upon the relative proportion of net assets of each class.
l. Guarantees and Indemnifications
Under the Trust’s organizational documents, its officers and trustees are indemnified by the Trust against certain liabilities arising out of the performance of their duties to the Trust. Additionally, in the normal course of business, the Trust, on behalf of the Fund, enters into contracts with service providers that contain general indemnification clauses. The Trust’s maximum exposure under these arrangements is unknown as this would involve future claims that may be made against the Trust that have not yet occurred. Currently, the Trust expects the risk of loss to be remote.
FRANKLIN TEMPLETON VARIABLE INSURANCE PRODUCTS TRUST
NOTES TO FINANCIAL STATEMENTS
Templeton Global Bond VIP Fund (continued)
2. Shares of Beneficial Interest
At December 31, 2014, there were an unlimited number of shares authorized (without par value). Transactions in the Fund’s shares were as follows:
| | | | | | | | | | | | | | | | | | |
| | | Year Ended December 31, | |
| | | 2014 | | | | | 2013 | |
| | | Shares | | | Amount | | | | | Shares | | | Amount | |
| | | | | |
| Class 1 Shares: | | | | | | | | | | | | | | | | | | |
Shares sold | | | 4,252,687 | | | $ | 81,034,541 | | | | | | 1,918,229 | | | $ | 37,822,305 | |
Shares issued in reinvestment of distributions | | | 844,006 | | | | 15,858,865 | | | | | | 962,717 | | | | 18,050,945 | |
Shares redeemed | | | (2,332,299 | ) | | | (44,149,260 | ) | | | | | (3,563,965 | ) | | | (69,146,364 | ) |
| | | | |
Net increase (decrease) | | | 2,764,394 | | | $ | 52,744,146 | | | | | | (683,019 | ) | | $ | (13,273,114 | ) |
| | | | |
| Class 2 Shares: | | | | | | | | | | | | | | | | | | |
Shares sold | | | 34,833,702 | | | $ | 645,437,884 | | | | | | 34,876,621 | | | $ | 667,964,958 | |
Shares issued in reinvestment of distributions | | | 8,573,764 | | | | 156,385,457 | | | | | | 8,877,431 | | | | 161,924,337 | |
Shares redeemed | | | (18,696,173 | ) | | | (344,754,745 | ) | | | | | (16,008,448 | ) | | | (299,919,892 | ) |
| | | | |
Net increase (decrease) | | | 24,711,293 | | | $ | 457,068,596 | | | | | | 27,745,604 | | | $ | 529,969,403 | |
| | | | |
| Class 3 Sharesa: | | | | | | | | | | | | | | | | | | |
Shares sold | | | 167,296 | | | $ | 3,090,319 | | | | | | 1,022,231 | | | $ | 19,570,327 | |
Shares issued in reinvestment of distributions | | | — | | | | — | | | | | | 646,027 | | | | 11,789,991 | |
Shares redeemed | | | (10,595,103 | ) | | | (198,978,865 | ) | | | | | (1,409,425 | ) | | | (26,566,154 | ) |
| | | | |
Net increase (decrease) | | | (10,427,807 | ) | | $ | (195,888,546 | ) | | | | | 258,833 | | | $ | 4,794,164 | |
| | | | |
| Class 4 Shares: | | | | | | | | | | | | | | | | | | |
Shares sold | | | 721,184 | | | $ | 13,510,739 | | | | | | 892,452 | | | $ | 17,199,730 | |
Shares issued on reinvestment of distributions | | | 302,695 | | | | 5,645,270 | | | | | | 485,524 | | | | 9,035,611 | |
Shares redeemed | | | (1,203,628 | ) | | | (22,604,837 | ) | | | | | (3,385,215 | ) | | | (63,604,703 | ) |
| | | | |
Net increase (decrease) | | | (179,749 | ) | | $ | (3,448,828 | ) | | | | | (2,007,239 | ) | | $ | (37,369,362 | ) |
| | | | |
aEffective May 1, 2014, all Class 3 shares were converted to Class 2.
3. Transactions With Affiliates
Franklin Resources, Inc. is the holding company for various subsidiaries that together are referred to as Franklin Templeton Investments. Certain officers and trustees of the Fund are also officers and/or directors of the following subsidiaries:
| | |
| Subsidiary | | Affiliation |
Franklin Advisers, Inc. (Advisers) | | Investment manager |
Franklin Templeton Services, LLC (FT Services) | | Administrative manager |
Franklin Templeton Distributors, Inc. (Distributors) | | Principal underwriter |
Franklin Templeton Investor Services, LLC (Investor Services) | | Transfer agent |
FRANKLIN TEMPLETON VARIABLE INSURANCE PRODUCTS TRUST
NOTES TO FINANCIAL STATEMENTS
Templeton Global Bond VIP Fund (continued)
3. Transactions With Affiliates (continued)
a. Management Fees
The Fund pays an investment management fee to Advisers based on the average daily net assets of the Fund as follows:
| | |
| Annualized Fee Rate | | Net Assets |
0.625% | | Up to and including $100 million |
0.500% | | Over $100 million, up to and including $250 million |
0.450% | | Over $250 million, up to and including $7.5 billion |
0.440% | | Over $7.5 billion, up to and including $10 billion |
0.430% | | Over $10 billion, up to and including $12.5 billion |
0.420% | | Over $12.5 billion, up to and including $15 billion |
0.400% | | In excess of $15 billion |
b. Administrative Fees
Under an agreement with Advisers, FT Services provides administrative services to the Fund. The fee is paid by Advisers based on the Fund’s average daily net assets, and is not an additional expense of the Fund.
c. Distribution Fees
The Board has adopted distribution plans for Class 2, Class 3, and Class 4 shares pursuant to Rule 12b-1 under the 1940 Act. Under the Fund’s compensation distribution plans, the Fund pays Distributors for costs incurred in connection with the servicing, sale and distribution of the Fund’s shares up to 0.25%, 0.35%, and 0.35% per year of its average daily net assets of Class 2, Class 3, and Class 4, respectively. Some distribution fees are not charged on shares held by affiliates. The Board has agreed to limit the current rate to 0.25% per year for Class 3. The plan year, for purposes of monitoring compliance with the maximum annual plan rates, is February 1 through January 31.
d. Transfer Agent Fees
Investor Services, under terms of an agreement, performs shareholder servicing for the Fund and is not paid by the Fund for the services.
4. Expense Offset Arrangement
The Fund has entered into an arrangement with its custodian whereby credits realized as a result of uninvested cash balances are used to reduce a portion of the Fund’s custodian expenses. During the year ended December 31, 2014, the custodian fees were reduced as noted in the Statement of Operations.
5. Income Taxes
For tax purposes, capital losses may be carried over to offset future capital gains. Capital loss carryforwards with no expiration, if any, must be fully utilized before those losses with expiration dates.
During the year ended December 31, 2014, the Fund utilized $4,268,308 of capital loss carryforwards.
The tax character of distributions paid during the years ended December 31, 2014 and 2013, was as follows:
| | | | |
| | | 2014 | | 2013 |
Distributions paid from: | | | | |
Ordinary income | | $177,889,592 | | $159,641,646 |
Long term capital gain | | — | | 41,159,238 |
| | |
| | $177,889,592 | | $200,800,884 |
| | |
FRANKLIN TEMPLETON VARIABLE INSURANCE PRODUCTS TRUST
NOTES TO FINANCIAL STATEMENTS
Templeton Global Bond VIP Fund (continued)
At December 31, 2014, the cost of investments, net unrealized appreciation (depreciation) and undistributed ordinary income for income tax purposes were as follows:
| | | | |
Cost of investments | | $ | 3,377,737,207 | |
| | | | |
Unrealized appreciation | | $ | 69,774,655 | |
Unrealized depreciation | | | (225,185,375 | ) |
| | | | |
Net unrealized appreciation (depreciation) | | $ | (155,410,720 | ) |
| | | | |
Distributable earnings - undistributed ordinary income | | $ | 296,662,724 | |
| | | | |
Differences between income and/or capital gains as determined on a book basis and a tax basis are primarily due to differing treatments of foreign currency transactions, bond discounts and premiums, and tax straddles.
6. Investment Transactions
Purchases and sales of investments (excluding short term securities) for the year ended December 31, 2014, aggregated $903,909,874 and $912,085,215, respectively.
7. Credit Risk
At December 31, 2014, the Fund had 12.49% of its portfolio invested in high yield or other securities rated below investment grade. These securities may be more sensitive to economic conditions causing greater price volatility and are potentially subject to a greater risk of loss due to default than higher rated securities.
8. Concentration of Risk
Investing in foreign securities may include certain risks and considerations not typically associated with investing in U.S. securities, such as fluctuating currency values and changing local and regional economic, political and social conditions, which may result in greater market volatility. In addition, certain foreign securities may not be as liquid as U.S. securities.
9. Other Derivative Information
At December 31, 2014, the Fund’s investments in derivative contracts are reflected on the Statement of Assets and Liabilities as follows:
| | | | | | | | | | | | |
| | | Asset Derivatives | | | Liability Derivatives | |
Derivative Contracts
Not Accounted for
as Hedging Instruments | | Statement of Assets and
Liabilities Location | | Fair Value | | | Statement of Assets and
Liabilities Location | | Fair Value | |
Interest rate contracts | | Net assets consist of: net unrealized appreciation (depreciation) | | $ | 1,214,733a | | | Unrealized depreciation on OTC swap contracts / Variation margin / Net assets consist of: net unrealized appreciation (depreciation) | | $ | 17,242,156a | |
| | | | |
Foreign exchange contracts | | Unrealized appreciation on forward exchange contracts | | | 232,865,865 | | | Unrealized depreciation on forward exchange contracts | | | 40,202,582 | |
aIncludes cumulative appreciation (depreciation) of centrally cleared swaps as reported in the Statement of Investments. Only current day’s variation margin is separately reported within the Statement of Assets and Liabilities.
FRANKLIN TEMPLETON VARIABLE INSURANCE PRODUCTS TRUST
NOTES TO FINANCIAL STATEMENTS
Templeton Global Bond VIP Fund (continued)
9. Other Derivative Information (continued)
For the year ended December 31, 2014, the effect of derivative contracts on the Fund’s Statement of Operations was as follows:
| | | | | | | | | | |
Derivative Contracts
Not Accounted for
as Hedging Instruments | | Statement of Operations Locations | | Realized
Gain (Loss)
for the Year | | | Change in
Unrealized
Appreciation
(Depreciation)
for the Year | |
Interest rate contracts | | Net realized gain (loss) from swap contracts / Net change in unrealized appreciation (depreciation) on investments | | $ | (3,632,367 | ) | | $ | (13,899,952 | ) |
| | | |
Foreign exchange contracts | | Net realized gain (loss) from foreign currency transactions / Net change in unrealized appreciation (depreciation) on translation of other assets and liabilities denominated in foreign currencies | | | 30,955,447 | | | | 170,892,729 | |
At December 31, 2014, the Fund’s OTC derivative assets and liabilities, are as follows:
| | | | | | | | |
| | | Gross and Net Amounts
of Assets and Liabilities
Presented in the
Statement of Assets and
Liabilities | |
| | | Assetsa | | | Liabilitiesa | |
| Derivatives | | | | | | | | |
Forward exchange contracts | | $ | 232,865,865 | | | $ | 40,202,582 | |
Swap Contracts | | | — | | | | 9,375,682 | |
| | | | |
Total | | $ | 232,865,865 | | | $ | 49,578,264 | |
| | | | |
aAbsent an event of default or early termination, OTC derivative assets and liabilities are presented gross and not offset in the Statement of Assets and Liabilities.
At December 31, 2014, the Fund’s OTC derivative assets which may be offset against the Fund’s OTC derivative liabilities and collateral received from the counterparty, is as follows:
| | | | | | | | | | | | | | | | | | | | |
| | | | | | Amounts Not Offset in the Statement of
Assets and Liabilities | | | | |
| | | Gross and Net
Amounts of Assets
Presented in the
Statement of
Assets and Liabilities | | | Financial
Instruments
Available for Offset | | | Financial
Instruments
Collateral
Receiveda,b | | | Cash Collateral
Receivedb | | | Net Amount (Not
less than zero) | |
| Counterparty | | | | | | | | | | | | | | | | | | | | |
BOFA | | $ | 4,233,687 | | | $ | — | | | $ | (4,233,687 | ) | | $ | — | | | $ | — | |
BZWS | | | 40,533,031 | | | | (2,083,740 | ) | | | — | | | | (38,449,291 | ) | | | — | |
CITI | | | 30,086,745 | | | | (15,183,789 | ) | | | (14,902,956 | ) | | | — | | | | — | |
DBAB | | | 44,311,455 | | | | (13,698,501 | ) | | | — | | | | (28,870,000 | ) | | | 1,742,954 | |
GSCO | | | 18,482,036 | | | | — | | | | — | | | | (18,100,000 | ) | | | 382,036 | |
HSBC | | | 30,976,462 | | | | (8,402,055 | ) | | | (22,574,407 | ) | | | — | | | | — | |
JPHQ | | | 43,272,275 | | | | (8,459,356 | ) | | | (34,812,919 | ) | | | — | | | | — | |
MSCO | | | 5,881,607 | | | | (1,750,823 | ) | | | — | | | | (3,729,600 | ) | | | 401,184 | |
FRANKLIN TEMPLETON VARIABLE INSURANCE PRODUCTS TRUST
NOTES TO FINANCIAL STATEMENTS
Templeton Global Bond VIP Fund (continued)
| | | | | | | | | | | | | | | | | | | | |
| | | | | | Amounts Not Offset in the Statement of
Assets and Liabilities | | | | |
| | | Gross and Net
Amounts of Assets
Presented in the
Statement of
Assets and Liabilities | | | Financial
Instruments
Available for Offset | | | Financial
Instruments
Collateral
Receiveda,b | | | Cash Collateral
Receivedb | | | Net Amount (Not
less than zero) | |
| Counterparty | | | | | | | | | | | | | | | | | | | | |
SCNY | | $ | 13,605,901 | | | $ | — | | | $ | — | | | $ | (13,500,000 | ) | | $ | 105,901 | |
UBSW | | | 1,482,666 | | | | — | | | | (1,333,708 | ) | | | — | | | | 148,958 | |
| | | | |
Total | | $ | 232,865,865 | | | $ | (49,578,264 | ) | | $ | (77,857,677 | ) | | $ | (102,648,891 | ) | | $ | 2,781,033 | |
| | | | |
aAt December 31, 2014, the Fund received United Kingdom Treasury Bonds and Notes, U.S. Government Agency Securities and U.S. Treasury Bonds, Notes and Bills as collateral for derivatives.
bIn some instances, the collateral amounts disclosed in the table above were adjusted due to the requirement to limit the collateral amounts to avoid the effect of overcollateralization. Actual collateral received and/or pledged may be more than the amounts disclosed herein.
At December 31, 2014, the Fund’s OTC derivative liabilities which may be offset against the Fund’s OTC derivative assets and collateral pledged to the counterparty, is as follows:
| | | | | | | | | | | | | | | | | | | | |
| | | | | | Amounts Not Offset in the Statement of
Assets and Liabilities | | | | |
| | | Gross and Net
Amounts of Liabilities
Presented in the
Statement of
Assets and Liabilities | | | Financial
Instruments
Available for Offset | | | Financial
Instruments
Collateral
Pledged | | | Cash Collateral
Pledged | | | Net Amount (Not
less than zero) | |
| Counterparty | | | | | | | | | | | | | | | | | | | | |
BOFA | | $ | — | | | $ | — | | | $ | — | | | $ | — | | | $ | — | |
BZWS | | | 2,083,740 | | | | (2,083,740 | ) | | | — | | | | — | | | | — | |
CITI | | | 15,183,789 | | | | (15,183,789 | ) | | | — | | | | — | | | | — | |
DBAB | | | 13,698,501 | | | | (13,698,501 | ) | | | — | | | | — | | | | — | |
GSCO | | | — | | | | — | | | | — | | | | — | | | | — | |
HSBC | | | 8,402,055 | | | | (8,402,055 | ) | | | — | | | | — | | | | — | |
JPHQ | | | 8,459,356 | | | | (8,459,356 | ) | | | — | | | | — | | | | — | |
MSCO | | | 1,750,823 | | | | (1,750,823 | ) | | | — | | | | — | | | | — | |
SCNY | | | — | | | | — | | | | — | | | | — | | | | — | |
UBSW | | | — | | | | — | | | | — | | | | — | | | | — | |
| | | | |
Total | | $ | 49,578,264 | | | $ | (49,578,264 | ) | | $ | — | | | $ | — | | | $ | — | |
| | | | |
For the year ended December 31, 2014, the average month end fair value of derivatives represented 3.82% of average month end net assets. The average month end number of open derivative contracts for the year was 478.
See Note 1(e) regarding derivative financial instruments.
See Abbreviations on page TGB - 39
10. Credit Facility
The Fund, together with other U.S. registered and foreign investment funds (collectively, Borrowers), managed by Franklin Templeton Investments, are borrowers in a joint syndicated senior unsecured credit facility totaling $1.5 billion (Global Credit Facility) which matured on February 13, 2015. This Global Credit Facility provides a source of funds to the Borrowers for temporary and emergency purposes, including the ability to meet future unanticipated or unusually large redemption requests. The Borrowers expect to renew the Global Credit Facility for a total of $2 billion effective February 13, 2015, which matures on February 12, 2016.
FRANKLIN TEMPLETON VARIABLE INSURANCE PRODUCTS TRUST
NOTES TO FINANCIAL STATEMENTS
Templeton Global Bond VIP Fund (continued)
10. Credit Facility (continued)
Under the terms of the Global Credit Facility, the Fund shall, in addition to interest charged on any borrowings made by the Fund and other costs incurred by the Fund, pay its share of fees and expenses incurred in connection with the implementation and maintenance of the Global Credit Facility, based upon its relative share of the aggregate net assets of all of the Borrowers, including an annual commitment fee of 0.07% based upon the unused portion of the Global Credit Facility. These fees are reflected in other expenses on the Statement of Operations. During the year ended December 31, 2014, the Fund did not use the Global Credit Facility.
11. Fair Value Measurements
The Fund follows a fair value hierarchy that distinguishes between market data obtained from independent sources (observable inputs) and the Fund’s own market assumptions (unobservable inputs). These inputs are used in determining the value of the Fund’s financial instruments and are summarized in the following fair value hierarchy:
| | • | | Level 1 – quoted prices in active markets for identical financial instruments |
| | • | | Level 2 – other significant observable inputs (including quoted prices for similar financial instruments, interest rates, prepayment speed, credit risk, etc.) |
| | • | | Level 3 – significant unobservable inputs (including the Fund’s own assumptions in determining the fair value of financial instruments) |
The input levels are not necessarily an indication of the risk or liquidity associated with financial instruments at that level.
For movements between the levels within the fair value hierarchy, the Fund has adopted a policy of recognizing the transfers as of the date of the underlying event which caused the movement.
At December 31, 2014, all of the Fund’s investments in financial instruments carried at fair value were valued using Level 2 inputs.
12. Subsequent Events
The Fund has evaluated subsequent events through the issuance of the financial statements and determined that no events have occurred that require disclosure other than those already disclosed in the financial statements.
FRANKLIN TEMPLETON VARIABLE INSURANCE PRODUCTS TRUST
NOTES TO FINANCIAL STATEMENTS
Templeton Global Bond VIP Fund (continued)
Abbreviations
| | | | | | | | | | |
| Counterparty/Exchange | | Currency | | Selected Portfolio |
| | | | | |
| BOFA | | Bank of America N.A. | | BRL | | Brazilian Real | | FHLB | | Federal Home Loan Bank |
| | | | | |
| BZWS | | Barclays Bank PLC | | CAD | | Canadian Dollar | | FRN | | Floating Rate Note |
| | | | | |
| CITI | | Citigroup, Inc. | | EUR | | Euro | | | | |
| | | | | |
| CME | | Chicago Mercantile Exchange | | HUF | | Hungarian Forint | | | | |
| | | | | |
| DBAB | | Deutsche Bank AG | | IDR | | Indonesian Rupiah | | | | |
| | | | | |
| GSCO | | Goldman Sachs Bank | | INR | | Indian Rupee | | | | |
| | | | | |
| HSBC | | HSBC Bank USA N.A. | | JPY | | Japanese Yen | | | | |
| | | | | |
| JPHQ | | JP Morgan Chase & Co. | | KRW | | South Korean Won | | | | |
| | | | | |
| LCH | | London Clearing House | | LKR | | Sri Lankan Rupee | | | | |
| | | | | |
| MSCO | | Morgan Stanley | | MXN | | Mexican Peso | | | | |
| | | | | |
| SCNY | | Standard Chartered Bank | | MYR | | Malaysian Ringgit | | | | |
| | | | | |
| UBSW | | UBS AG | | PEN | | Peruvian Nuevo Sol | | | | |
| | | | | |
| | | | PHP | | Philippine Peso | | | | |
| | | | | |
| | | | PLN | | Polish Zloty | | | | |
| | | | | |
| | | | SEK | | Swedish Krona | | | | |
| | | | | |
| | | | SGD | | Singapore Dollar | | | | |
FRANKLIN TEMPLETON VARIABLE INSURANCE PRODUCTS TRUST
Report of Independent Registered Public Accounting Firm
Templeton Global Bond VIP Fund
To the Board of Trustees and Shareholders of Franklin Templeton Variable Insurance Products Trust
In our opinion, the accompanying statement of assets and liabilities, including the statement of investments, and the related statements of operations and of changes in net assets and the financial highlights present fairly, in all material respects, the financial position of Templeton Global Bond VIP Fund (the “Fund”) at December 31, 2014, the results of its operations for the year then ended, the changes in its net assets for each of the two years in the period then ended and the financial highlights for each of the five years in the period then ended, in conformity with accounting principles generally accepted in the United States of America. These financial statements and financial highlights (hereafter referred to as “financial statements”) are the responsibility of the Fund’s management. Our responsibility is to express an opinion on these financial statements based on our audits. We conducted our audits of these financial statements in accordance with the standards of the Public Company Accounting Oversight Board (United States). Those standards require that we plan and perform the audit to obtain reasonable assurance about whether the financial statements are free of material misstatement. An audit includes examining, on a test basis, evidence supporting the amounts and disclosures in the financial statements, assessing the accounting principles used and significant estimates made by management, and evaluating the overall financial statement presentation. We believe that our audits, which included confirmation of securities at December 31, 2014 by correspondence with the custodian and brokers, provides a reasonable basis for our opinion.
PricewaterhouseCoopers LLP
San Francisco, California
February 13, 2015
FRANKLIN TEMPLETON VARIABLE INSURANCE PRODUCTS TRUST
Tax Information (unaudited)
Templeton Global Bond VIP Fund
At December 31, 2014, more than 50% of the Fund’s total assets were invested in securities of foreign issuers. In most instances, foreign taxes were withheld from income paid to the Fund on these investments. The Fund elects to treat foreign taxes paid as allowed under Section 853 of the Internal Revenue Code. This election will allow shareholders of record as of the 2015 distribution date, to treat their proportionate share of foreign taxes paid by the Fund as having been paid directly by them. The shareholder shall consider these amounts as foreign taxes paid in the tax year in which they receive the Fund distribution.
Templeton Growth VIP Fund
(Formerly, Templeton Growth Securities Fund)
This annual report for Templeton Growth VIP Fund covers the fiscal year ended December 31, 2014.
Class 2 Performance Summary as of December 31, 2014
Average annual total return of Class 2 shares represents the average annual change in value, assuming reinvestment of dividends and capital gains. Average returns smooth out variations in returns, which can be significant; they are not the same as year-by-year results.
| | | | | | | | | | | | |
| Periods ended 12/31/14 | | 1-Year | | | 5-Year | | | 10-Year | |
Average Annual Total Return | | | -2.81% | | | | +8.99% | | | | +4.67% | |
Performance reflects the Fund’s Class 2 operating expenses, but does not include any contract fees, expenses or sales charges. If they had been included, performance would be lower. These charges and deductions, particularly for variable life policies, can have a significant effect on contract values and insurance benefits. See the contract prospectus for a complete description of these expenses, including sales charges.
Performance data represent past performance, which does not guarantee future results. Investment return and principal value will fluctuate, and you may have a gain or loss when you sell your shares. Current performance may differ from figures shown.
Total Return Index Comparison for a Hypothetical $10,000 Investment (1/1/05–12/31/14)
The graph below shows the change in value of a hypothetical $10,000 investment in the Fund over the indicated period and includes reinvestment of any income or distributions. The Fund’s performance is compared to the performance of the MSCI World Index and the MSCI All Country World Index (ACWI). One cannot invest directly in an index, and an index is not representative of the Fund’s portfolio. Please see Important Notes to Performance Information preceding the Fund Summaries.
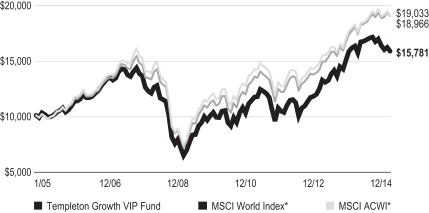
*Source: Morningstar. Please see Index Descriptions following the Fund Summaries.
TEMPLETON GROWTH VIP FUND
Fund Goal and Main Investments
Templeton Growth VIP Fund seeks long-term capital growth. Under normal market conditions, the Fund invests predominantly in equity securities of companies located anywhere in the world, including emerging markets.
Fund Risks
All investments involve risks, including possible loss of principal. Special risks are associated with foreign investing, including currency fluctuations, economic instability and political developments; investments in emerging markets involve heightened risks related to the same factors. To the extent the Fund focuses on particular countries, regions, industries, sectors or types of investments from time to time, it may be subject to greater risks of adverse developments in such areas of focus than a fund that invests in a wider variety of countries, regions, industries, sectors or investments. The Fund is actively managed but there is no guarantee that the manager’s investment decisions will produce the desired results. The Fund’s prospectus also includes a description of the main investment risks.
Performance Overview
You can find the Fund’s one-year total return in the Performance Summary. For comparison, the Fund’s benchmarks, the MSCI All Country World Index (ACWI) returned +4.71%, and the MSCI World Index returned +5.50% for the period under review.1
Economic and Market Overview
The global economy grew moderately during the 12 months under review as U.S. economic growth expanded while growth rates in much of the rest of the world declined. As measured by the MSCI World Index, stocks in global developed markets advanced overall during the 12-month period amid a generally accommodative monetary policy environment and continued strength in corporate earnings. Oil prices declined sharply during the 12-month period, resulting from weak global demand growth and strong world supply, and gold prices ended lower amid benign global inflation and a strong U.S. dollar.
U.S. economic growth trends were generally encouraging during the period. Economic activity expanded for most of 2014, supported in some quarters by increased consumer spending, business investment and federal defense spending. The U.S. Federal Reserve Board (Fed) began reducing its large-scale bond purchases $10 billion a month in January and ended the buying
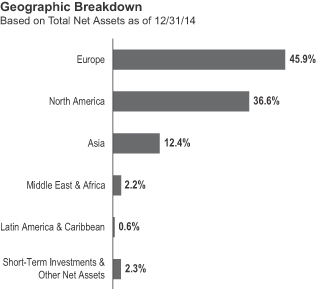
program in October. But it continued its practice of maintaining holdings of longer term securities at sizable levels. The Fed believed underlying economic strength could support ongoing progress in labor market conditions. Toward period-end, the Fed stated that it could be patient with regard to raising interest rates and that the interest rate might not rise for at least a couple of meetings, possibly implying at least the first two meetings of 2015.
Outside the U.S., the U.K. economy grew relatively well, supported by the services and manufacturing sectors. In the eurozone, economic growth remained subdued, as concerns persisted about the potential negative impacts to growth from the crisis in Ukraine and China’s moderating growth rate. However, third-quarter economic growth, though meager, exceeded expectations, especially in the region’s major economies of Germany and France. In June, the European Central Bank (ECB) reduced its main interest rate and, for the first time, set a negative deposit rate; the ECB reduced both rates again in September. The ECB broadened its monetary easing stance by implementing an asset purchase program to prevent deflation and stimulate the economy. Toward period-end, the ECB cut its 2014 growth forecast for the eurozone and attributed the reduction to geopolitical risks dampening confidence and private investment.
Japan’s second- and third-quarter economic contractions indicated the economy was in a recession. However, private consumption and exports improved in the third quarter. In October, the Bank of Japan expanded its stimulus measures amid weak domestic demand and as substantially lower crude oil prices exerted further
1. Source: Morningstar.
One cannot invest directly in an index, and an index is not representative of the Fund’s portfolio. Please see Index Descriptions following the Fund Summaries.
TEMPLETON GROWTH VIP FUND
downward pressure on inflation. Toward period-end, Japan’s ruling coalition was reelected in early parliamentary elections and subsequently announced a fresh stimulus package aimed at reviving economic growth.
In several emerging markets, economic growth generally moderated. However, Brazil exited recession as government spending prior to a presidential election drove third-quarter economic growth. Emerging market equities, as measured by the MSCI Emerging Markets Index, fell for the 12-month period, amid headwinds such as soft domestic demand and weak exports in several countries.2 Falling crude oil prices and geopolitical tensions in certain regions, as well as concerns about the timing of U.S. interest rate increases, also pressured emerging market equities. Many emerging market currencies depreciated against the U.S. dollar, leading central banks in several countries to raise interest rates in an effort to curb inflation and support their currencies. Several other central banks lowered interest rates to promote economic growth. After implementing monetary stimulus measures to support specific sectors, China’s central bank increased its efforts to bolster the economy by cutting its benchmark interest rates for the first time since July 2012. In contrast, Russia’s central bank raised its key interest rate sharply toward period-end to limit further devaluation of the Russian ruble and contain rising inflation.
Investment Strategy
Our investment philosophy is bottom up, value oriented and long term. In choosing investments, we will focus on the market price of a company’s securities relative to our evaluation of the company’s potential long-term earnings, asset value and cash flow. Among factors we may consider are a company’s historical value measures, including price/earnings ratio, profit margins and liquidation value. We do in-depth research to construct a bargain list from which we buy.
Manager’s Discussion
The year 2014 was a challenging one for global equity markets. Following a period of tentative optimism that corporate fundamentals would resume driving share prices, investor focus shifted back to broad-based economic and political factors in 2014. In our opinion, the most significant story in 2014 was the deepening divergence between the U.S., where growth rates accelerated for much of 2014, and the rest of the world, where growth rates generally moderated. Numerous factors contributed to the change in market conditions. In Europe, disinflationary pressures intensified and political discord resurfaced; in Japan, extraordinary monetary
policy failed to prevent a triple-dip recession; and in diverse emerging markets, economic growth generally cooled as commodities and currencies came under pressure. Two major events further deepened the divide between U.S. and international markets. The price of oil nearly halved, favoring the consumer-driven U.S. economy at the expense of oil-exporting nations abroad; and Russia invaded Ukraine, marring European business confidence and reminding investors of the risks sometimes associated with emerging market investing. In this environment of increasing economic and geopolitical uncertainty, the U.S. seemed to us to solidify its status as a destination for capital in troubled times.
However, in our opinion, the U.S.’s attractive mix of defensive and pro-cyclical characteristics came at a cost. The price-to-book multiple of U.S. stocks relative to global peers neared all-time highs at year-end, and measures of price-to-normalized earnings were also elevated. Yet, despite our detractive underweighting in the U.S., we continued to find selective bottom-up opportunities in this deep and diverse market, and stock selection in the U.S. contributed to relative performance.
We also found select opportunities we regarded as attractive in Asia. Although we found value relatively scarce in Japan, where we had yet to see the structural reforms required to deal with challenges caused by debt, demographics and corporate governance, we selectively discovered what we deemed as attractive opportunities elsewhere, including in Singapore and emerging Asia. Although our stock selection and underweighting in Japan contributed to relative returns in 2014, stock selection in China and an overweighted allocation in South Korea resulted in the Fund’s Asian stocks detracting from performance relative to the MSCI ACWI. In China, our focus was on finding companies with, in our opinion, balance sheet strength, capital discipline and the ability to sustainably generate strong free cash flow. We found what we considered attractive bottom-up opportunities in South Korea despite concerns about currency strength and cyclical exposure. Valuations looked reasonable to us for a competitive, commodity-importing emerging market with accommodative monetary policy, a comfortable current account surplus and good exposure to U.S. and Asian growth.
Stock selection and an overweighted allocation in Europe detracted from relative performance as the delicate progress made stabilizing the banking system, enacting necessary budget reforms, and preparing for further monetary stimulus failed to meaningfully restore corporate confidence or revive lending activity. Concerns about Europe, along with worries about a slowing China and destabilized Russia, made European equities cheap on nearly all normalized valuation metrics. In our analysis, European equities
2. Please see Index Descriptions following the Fund Summaries.
TEMPLETON GROWTH VIP FUND
also looked attractive relative to bonds. Cyclical stocks, in particular, looked attractively priced to us at the end of 2014, with the relative price, price-to-earnings ratio and price-to-book ratio of European cyclical sectors compared with defensive sectors all close to post-financial crisis lows. Overall, we consider such valuation levels depressed for a diverse corporate sector composed of many high-quality, globally relevant companies.
From a sector perspective, an overweighted energy position comprised several of the Fund’s biggest detractors, pressured primarily by European oil services stocks.3 Shares of Dutch oilfield surveyor Fugro was a major laggard as weaker oil and gas markets led to project delays and cancellations that could result in the company forgoing its dividend. Oil market weakness and reduced capital expenditure plans by energy producers, Fugro’s main clients, coincided with company-specific issues, resulting in our loss of confidence in Fugro’s management and the impairment of our original investment thesis. Thus, we liquidated the position toward the end of the reporting period seeking to limit losses and redirect the proceeds to what we considered more attractive opportunities. Despite challenging conditions in the energy sector more broadly, we remained favorable toward our sector holdings. Although we do not know when equilibrium will be restored to oil markets, we do expect that supply could incrementally decline and oil may eventually return to a level that promotes continued investment. In the meantime, we have focused on the long-term fundamental prospects of individual energy companies. Energy stocks were historically cheap following a period of sustained pressure on sector fundamentals and, most recently, a major oil price correction. As energy companies improved capital allocation and refocused on shareholder returns, we continued to find what we considered compelling long-term bargains in the sector, with a focus on companies with the balance sheet strength to weather a period of lower oil prices, in our opinion.
Consistent with the broad-based underperformance of cyclical sectors in 2014, stock selection in industrials also hurt relative performance, pressured by U.K. services firm Serco Group, whose share price declined as an investigation into alleged malpractice at a domestic business unit resulted in profit warnings and a need to raise capital.4 We remained encouraged by the company’s earnest efforts to address its issues and restore the faith of its clients and regulator, and felt that the stock’s
depressed valuation failed to reflect what we saw as new management’s sensible turnaround plan and Serco’s attractive position as a long-term beneficiary of public sector outsourcing growth. Underweighted consumer staples and overweighted telecommunications holdings also detracted from relative performance, pressured by stock-specific weakness.5
Conversely, stock selection in the consumer discretionary sector contributed to relative performance, led by our media holdings.6 We believe our long-term investment theses in U.S. media began to be validated as television and movie studios (such as Twenty-First Century Fox and Walt Disney) benefited from rising demand for quality content, and as content distributors (such as Comcast and Time Warner Cable, which was sold by period-end) gained from their control of the increasingly valuable broadband pipeline. Health care and information technology holdings delivered double-digit absolute gains and among them
| | | | |
| Top 10 Holdings | | | |
| 12/31/14 | | | |
Company
Sector/Industry, Country | | % of Total
Net Assets | |
Microsoft Corp. Software, U.S. | | | 3.0% | |
Samsung Electronics Co. Ltd. Technology Hardware, Storage & Peripherals, South Korea | | | 3.0% | |
Citigroup Inc. Banks, U.S. | | | 2.3% | |
Hewlett-Packard Co. Technology Hardware, Storage & Peripherals, U.S. | | | 2.3% | |
Comcast Corp., Special A Media, U.S. | | | 2.3% | |
Teva Pharmaceutical Industries Ltd., ADR Pharmaceuticals, Israel | | | 2.2% | |
Talisman Energy Inc. Oil, Gas & Consumable Fuels, Canada | | | 2.1% | |
Medtronic Inc. Health Care Equipment & Supplies, U.S. | | | 2.0% | |
Amgen Inc. Biotechnology, U.S. | | | 1.9% | |
Pfizer Inc. Pharmaceuticals, U.S. | | | 1.9% | |
The dollar value, number of shares or principal amount, and names of all portfolio holdings are listed in the Fund’s Statement of Investments (SOI).
3. The energy sector comprises energy equipment and services; and oil, gas and consumable fuels in the SOI.
4. The industrials sector comprises aerospace and defense, air freight and logistics, airlines, commercial services and supplies, construction and engineering, electrical equipment, industrial conglomerates, machinery and professional services in the SOI.
5. The consumer staples sector comprises food and staples retailing in the SOI. The telecommunication services sector comprises diversified telecommunication services and wireless telecommunication services in the SOI.
6. The consumer discretionary sector comprises auto components, automobiles, media, multiline retail and specialty retail in the SOI.
TEMPLETON GROWTH VIP FUND
were several of the Fund’s top contributors.7 From health care, shares of U.S. biotechnology giant Amgen rallied to a record after the firm beat earnings estimates and announced a dividend hike and share buyback. We were pleased to see Amgen use its prodigious cash flow to directly enhance shareholder value and were encouraged by the continued resilience of the firm’s base business and positive evolution of its new drug pipeline. We believe the market remained overly concerned about pressures to Amgen’s more mature business lines and failed to appreciate the company’s sustainable long-term earnings potential. More generally, in our analysis, our health care position offered a mix of longer term holdings among major pharmaceuticals firms that have restructured and rebased earnings in the aftermath of many expiring patents industry-wide, and newer bargains among medical technology, specialty pharmaceuticals and biotechnology stocks with what we considered undervalued cash-flow and profit growth potential. From the information technology sector, U.S. computer manufacturer Hewlett-Packard and U.S. software firm Microsoft, both long-term holdings, also finished the year among the Fund’s top contributors.
It is also important to recognize the effect of currency movements on the Fund’s performance. In general, if the value of the U.S. dollar goes up compared with a foreign currency, an investment traded in that foreign currency will go down in value because it will be worth fewer U.S. dollars. This can have a negative effect on Fund performance. Conversely, when the U.S. dollar weakens in relation to a foreign currency, an investment traded in that foreign currency will increase in value, which can contribute to Fund performance. For the 12 months ended December 31, 2014, the U.S. dollar rose in value relative to most currencies. As a result, the Fund’s performance was negatively affected by the portfolio’s substantial investment in securities with non-U.S. currency exposure.
In recent years, we felt stocks traded more on broad-based economic and policy expectations than on business fundamentals. This trend, in our view, resulted in an increasingly bifurcated market in which the leaders (U.S. stocks, consumer cyclicals and health care) kept surging farther ahead and the laggards (international stocks and industrial cyclicals) kept falling farther behind. Throughout this challenging period, we tried to use the market’s distraction to our advantage by focusing on what we determined to be overlooked value. In doing so, we sought to build a differentiated portfolio based on our long-term assumptions about company-level business fundamentals. We believe outperformance comes from value recognition, and our experience has been that price and value eventually do intersect over time. Going into 2015, we remained confident that our portfolio contained far more value than its prices seemed to reflect.
Thank you for your participation in Templeton Growth VIP Fund. We look forward to serving your future investment needs.
The foregoing information reflects our analysis, opinions and portfolio holdings as of December 31, 2014, the end of the reporting period. The way we implement our main investment strategies and the resulting portfolio holdings may change depending on factors such as market and economic conditions. These opinions may not be relied upon as investment advice or an offer for a particular security. The information is not a complete analysis of every aspect of any market, country, industry, security or the Fund. Statements of fact are from sources considered reliable, but the investment manager makes no representation or warranty as to their completeness or accuracy. Although historical performance is no guarantee of future results, these insights may help you understand our investment management philosophy.
7. The health care sector comprises biotechnology, life sciences tools and services, and pharmaceuticals in the SOI. The information technology sector comprises communications equipment; electronic equipment, instruments and components; semiconductors and semiconductor equipment; and software in the SOI.
TEMPLETON GROWTH VIP FUND
Class 2 Fund Expenses
As an investor in a variable insurance contract (Contract) that indirectly provides for investment in an underlying mutual fund, you can incur transaction and/or ongoing expenses at both the Fund level and the Contract level.
| • | | Transaction expenses can include sales charges (loads) on purchases, redemption fees, surrender fees, transfer fees and premium taxes. |
| • | | Ongoing expenses can include management fees, distribution and service (12b-1) fees, contract fees, annual maintenance fees, mortality and expense risk fees and other fees and expenses. All mutual funds and Contracts have some types of ongoing expenses. |
The expenses shown in the table are meant to highlight ongoing expenses at the Fund level only and do not include ongoing expenses at the Contract level, or transaction expenses at either the Fund or Contract level. While the Fund does not have transaction expenses, if the transaction and ongoing expenses at the Contract level were included, the expenses shown below would be higher. You should consult your Contract prospectus or disclosure document for more information.
The table shows Fund-level ongoing expenses and can help you understand these expenses and compare them with those of other mutual funds offered through the Contract. The table assumes a $1,000 investment held for the six months indicated. Please refer to the Fund prospectus for additional information on operating expenses.
Actual Fund Expenses
The first line (Actual) of the table provides actual account values and expenses. The “Ending Account Value” is derived from the Fund’s actual return, which includes the effect of ongoing Fund expenses, but does not include the effect of ongoing Contract expenses.
You can estimate the Fund-level expenses you incurred during the period by following these steps. Of course, your account value and expenses will differ from those in this illustration:
| 1. | Divide your account value by $1,000. |
If an account had an $8,600 value,
then $8,600 ÷ $1,000 = 8.6.
| 2. | Multiply the result by the number under the heading “Fund-Level Expenses Incurred During Period.” |
If Fund-Level Expenses Incurred During Period were $7.50, then 8.6 × $7.50 = $64.50.
In this illustration, the estimated expenses incurred this period at the Fund level are $64.50.
Hypothetical Example for Comparison with Other Mutual Funds
Information in the second line (Hypothetical) of the table can help you compare ongoing expenses of the Fund with those of other mutual funds offered through the Contract. This information may not be used to estimate the actual ending account balance or expenses you incurred during the period. The hypothetical “Ending Account Value” is based on the Fund’s actual expense ratio and an assumed 5% annual rate of return before expenses, which does not represent the Fund’s actual return. The figure under the heading “Fund-Level Expenses Incurred During Period” shows the hypothetical expenses your account would have incurred under this scenario. You can compare this figure with the 5% hypothetical examples that appear in shareholder reports of other funds offered through a Contract.
| | | | | | | | | | | | |
| Class 2 | | Beginning Account Value 7/1/14 | | | Ending Account Value 12/31/14 | | | Fund-Level Expenses
Incurred During Period* 7/1/14–12/31/14 | |
Actual | | | $1,000 | | | | $ 925.30 | | | | $5.00 | |
Hypothetical (5% return before expenses) | | | $1,000 | | | | $1,021.01 | | | | $5.24 | |
*Expenses are calculated using the most recent six-month annualized expense ratio for the Fund’s Class 2 shares (1.03%), which does not include any ongoing expenses of the Contract for which the Fund is an investment option, multiplied by the average account value over the period, multiplied by 184/365 to reflect the one-half year period.
FRANKLIN TEMPLETON VARIABLE INSURANCE PRODUCTS TRUST
Financial Highlights
Templeton Growth VIP Fund
| | | | | | | | | | | | | | | | | | | | |
| | | Year Ended December 31, | |
| | | 2014 | | | 2013 | | | 2012 | | | 2011 | | | 2010 | |
| Class 1 | | | | | | | | | | | | | | | | | | | | |
Per share operating performance
(for a share outstanding throughout the year) | | | | | | | | | | | | | | | | | | | | |
| | | | | |
Net asset value, beginning of year | | | $15.47 | | | | $12.16 | | | | $10.27 | | | | $11.19 | | | | $10.56 | |
| | | | |
| | | | | |
| Income from investment operationsa: | | | | | | | | | | | | | | | | | | | | |
| | | | | |
Net investment incomeb | | | 0.38 | c | | | 0.22 | | | | 0.27 | | | | 0.25 | | | | 0.17 | |
| | | | | |
Net realized and unrealized gains (losses) | | | (0.75 | ) | | | 3.49 | | | | 1.88 | | | | (0.99 | ) | | | 0.62 | |
| | | | |
Total from investment operations | | | (0.37 | ) | | | 3.71 | | | | 2.15 | | | | (0.74 | ) | | | 0.79 | |
| | | | |
Less distributions from net investment income | | | (0.25 | ) | | | (0.40 | ) | | | (0.26 | ) | | | (0.18 | ) | | | (0.16 | ) |
| | | | |
Net asset value, end of year | | | $14.85 | | | | $15.47 | | | | $12.16 | | | | $10.27 | | | | $11.19 | |
| | | | |
| | | | | |
Total returnd | | | (2.53)% | | | | 31.05% | | | | 21.40% | | | | (6.80)% | | | | 7.74% | |
| | | | | |
| Ratios to average net assets | | | | | | | | | | | | | | | | | | | | |
| | | | | |
Expenses | | | 0.78% | | | | 0.78% | e | | | 0.78% | e | | | 0.78% | e | | | 0.77% | e |
| | | | | |
Net investment income | | | 2.46% | c | | | 1.62% | | | | 2.31% | | | | 2.22% | | | | 1.71% | |
| | | | | |
| Supplemental data | | | | | | | | | | | | | | | | | | | | |
| | | | | |
Net assets, end of year (000’s) | | | $572,860 | | | | $588,409 | | | | $476,954 | | | | $1,200,682 | | | | $1,348,622 | |
| | | | | |
Portfolio turnover rate | | | 17.46% | | | | 11.60% | | | | 18.73% | f | | | 42.13% | f | | | 9.61% | |
aThe amount shown for a share outstanding throughout the period may not correlate with the Statement of Operations for the period due to the timing of sales and repurchases of the Fund shares in relation to income earned and/or fluctuating fair value of the investments of the Fund.
bBased on average daily shares outstanding.
cNet investment income per share includes approximately $0.09 per share received in the form of special dividends. Excluding these amounts, the ratio of net investment income to average net assets would have been 1.88%.
dTotal return does not include fees, charges or expenses imposed by the variable annuity and life insurance contracts for which Franklin Templeton Variable Insurance Products Trust serves as an underlying investment vehicle.
eBenefit of expense reduction rounds to less than 0.01%.
fExcludes the value of portfolio securities delivered as a result of redemption in-kind.
| | | | | | |
| | | The accompanying notes are an integral part of these financial statements. | Annual Report | | | TG-7 | |
FRANKLIN TEMPLETON VARIABLE INSURANCE PRODUCTS TRUST
FINANCIAL HIGHLIGHTS
Templeton Growth VIP Fund (continued)
| | | | | | | | | | | | | | | | | | | | |
| | | Year Ended December 31, | |
| | | 2014 | | | 2013 | | | 2012 | | | 2011 | | | 2010 | |
| Class 2 | | | | | | | | | | | | | | | | | | | | |
Per share operating performance (for a share outstanding throughout the year) | | | | | | | | | | | | | | | | | | | | |
| | | | | |
Net asset value, beginning of year | | | $15.23 | | | | $11.97 | | | | $10.11 | | | | $11.01 | | | | $10.40 | |
| | | | |
| | | | | |
| Income from investment operationsa: | | | | | | | | | | | | | | | | | | | | |
| | | | | |
Net investment incomeb | | | 0.34 | c | | | 0.19 | | | | 0.21 | | | | 0.21 | | | | 0.15 | |
| | | | | |
Net realized and unrealized gains (losses) | | | (0.75 | ) | | | 3.44 | | | | 1.88 | | | | (0.96 | ) | | | 0.60 | |
| | | | |
Total from investment operations | | | (0.41 | ) | | | 3.63 | | | | 2.09 | | | | (0.75 | ) | | | 0.75 | |
| | | | |
Less distributions from net investment income | | | (0.21 | ) | | | (0.37 | ) | | | (0.23 | ) | | | 0.15 | | | | (0.14 | ) |
| | | | |
Net asset value, end of year | | | $14.61 | | | | $15.23 | | | | $11.97 | | | | $10.11 | | | | $11.01 | |
| | | | |
| | | | | |
Total returnd | | | (2.81)% | | | | 30.82% | | | | 21.07% | | | | (6.97)% | | | | 7.39% | |
| | | | | |
| Ratios to average net assets | | | | | | | | | | | | | | | | | | | | |
| | | | | |
Expenses | | | 1.03% | | | | 1.03% | e | | | 1.03% | e | | | 1.03% | e | | | 1.02% | e |
| | | | | |
Net investment income | | | 2.21% | c | | | 1.37% | | | | 2.06% | | | | 1.97% | | | | 1.46% | |
| | | | | |
| Supplemental data | | | | | | | | | | | | | | | | | | | | |
| | | | | |
Net assets, end of year (000’s) | | | $1,171,896 | | | | $1,450,304 | | | | $1,352,554 | | | | $1,254,193 | | | | $1,626,885 | |
| | | | | |
Portfolio turnover rate | | | 17.46% | | | | 11.60% | | | | 18.73% | f | | | 42.13% | f | | | 9.61% | |
aThe amount shown for a share outstanding throughout the period may not correlate with the Statement of Operations for the period due to the timing of sales and repurchases of the Fund shares in relation to income earned and/or fluctuating fair value of the investments of the Fund.
bBased on average daily shares outstanding.
cNet investment income per share includes approximately $0.09 per share received in the form of special dividends. Excluding these amounts, the ratio of net investment income to average net assets would have been 1.63%.
dTotal return does not include fees, charges or expenses imposed by the variable annuity and life insurance contracts for which Franklin Templeton Variable Insurance Products Trust serves as an underlying investment vehicle.
eBenefit of expense reduction rounds to less than 0.01%.
fExcludes the value of portfolio securities delivered as a result of redemption in-kind.
| | | | |
| TG-8 | | Annual Report | The accompanying notes are an integral part of these financial statements. | | |
FRANKLIN TEMPLETON VARIABLE INSURANCE PRODUCTS TRUST
FINANCIAL HIGHLIGHTS
Templeton Growth VIP Fund (continued)
| | | | | | | | | | | | | | | | | | | | |
| | | Year Ended December 31, | |
| | | 2014 | | | 2013 | | | 2012 | | | 2011 | | | 2010 | |
| Class 4 | | | | | | | | | | | | | | | | | | | | |
Per share operating performance
(for a share outstanding throughout the year) | | | | | | | | | | | | | | | | | | | | |
| | | | | |
Net asset value, beginning of year | | | $15.35 | | | | $12.07 | | | | $10.19 | | | | $11.11 | | | | $10.50 | |
| | | | |
| | | | | |
| Income from investment operationsa: | | | | | | | | | | | | | | | | | | | | |
| | | | | |
Net investment incomeb | | | 0.33 | c | | | 0.17 | | | | 0.20 | | | | 0.20 | | | | 0.14 | |
| | | | | |
Net realized and unrealized gains (losses) | | | (0.76 | ) | | | 3.47 | | | | 1.90 | | | | (0.98 | ) | | | 0.61 | |
| | | | |
Total from investment operations | | | (0.43 | ) | | | 3.64 | | | | 2.10 | | | | (0.78 | ) | | | 0.75 | |
| | | | |
Less distributions from net investment income | | | (0.19 | ) | | | (0.36 | ) | | | (0.22 | ) | | | (0.14 | ) | | | (0.14 | ) |
| | | | |
Net asset value, end of year | | | $14.73 | | | | $15.35 | | | | $12.07 | | | | $10.19 | | | | $11.11 | |
| | | | |
| | | | | |
Total returnd | | | (2.88)% | | | | 30.64% | | | | 21.02% | | | | (7.14)% | | | | 7.31% | |
| | | | | |
| Ratios to average net assets | | | | | | | | | | | | | | | | | | | | |
| | | | | |
Expenses | | | 1.13% | | | | 1.13% | e | | | 1.13% | e | | | 1.13% | e | | | 1.12% | e |
| | | | | |
Net investment income | | | 2.11% | c | | | 1.27% | | | | 1.96% | | | | 1.87% | | | | 1.36% | |
| | | | | |
| Supplemental data | | | | | | | | | | | | | | | | | | | | |
| | | | | |
Net assets, end of year (000’s) | | | $59,989 | | | | $72,683 | | | | $67,158 | | | | $56,170 | | | | $60,569 | |
| | | | | |
Portfolio turnover rate | | | 17.46% | | | | 11.60% | | | | 18.73% | f | | | 42.13% | f | | | 9.61% | |
aThe amount shown for a share outstanding throughout the period may not correlate with the Statement of Operations for the period due to the timing of sales and repurchases of the Fund shares in relation to income earned and/or fluctuating fair value of the investments of the Fund.
bBased on average daily shares outstanding.
cNet investment income per share includes approximately $0.09 per share received in the form of special dividends. Excluding these amounts, the ratio of net investment income to average net assets would have been 1.53%.
dTotal return does not include fees, charges or expenses imposed by the variable annuity and life insurance contracts for which Franklin Templeton Variable Insurance Products Trust serves as an underlying investment vehicle.
eBenefit of expense reduction rounds to less than 0.01%.
fExcludes the value of portfolio securities delivered as a result of redemption in-kind.
| | | | | | |
| | | The accompanying notes are an integral part of these financial statements. | Annual Report | | | TG-9 | |
FRANKLIN TEMPLETON VARIABLE INSURANCE PRODUCTS TRUST
Statement of Investments, December 31, 2014
| | | | | | | | | | | | | | |
| Templeton Growth VIP Fund | |
| | | | | Country | | | Shares | | | Value | |
| | Common Stocks 97.1% | | | | | | | | | | | | |
| | Aerospace & Defense 0.7% | | | | | | | | | | | | |
| | BAE Systems PLC | | | United Kingdom | | | | 1,730,147 | | | $ | 12,728,802 | |
| | | | | | | | | | | | | | |
| | Air Freight & Logistics 1.4% | | | | | | | | | | | | |
| | TNT Express NV | | | Netherlands | | | | 646,272 | | | | 4,333,002 | |
| a | | TNT Express NV, 144A | | | Netherlands | | | | 441,000 | | | | 2,956,733 | |
| | United Parcel Service Inc., B | | | United States | | | | 160,030 | | | | 17,790,535 | |
| | | | | | | | | | | | | | |
| | | | | | | | | | | | | 25,080,270 | |
| | | | | | | | | | | | | | |
| | Airlines 2.7% | | | | | | | | | | | | |
| | Deutsche Lufthansa AG | | | Germany | | | | 1,735,414 | | | | 29,040,938 | |
| b | | International Consolidated Airlines Group SA | | | United Kingdom | | | | 2,633,247 | | | | 19,951,692 | |
| | | | | | | | | | | | | | |
| | | | | | | | | | | | | 48,992,630 | |
| | | | | | | | | | | | | | |
| | Auto Components 1.3% | | | | | | | | | | | | |
| | Cie Generale des Etablissements Michelin, B | | | France | | | | 259,469 | | | | 23,631,580 | |
| | | | | | | | | | | | | | |
| | Automobiles 2.2% | | | | | | | | | | | | |
| | Nissan Motor Co. Ltd. | | | Japan | | | | 2,342,720 | | | | 20,665,596 | |
| | Toyota Motor Corp. | | | Japan | | | | 312,490 | | | | 19,710,406 | |
| | | | | | | | | | | | | | |
| | | | | | | | | | | | | 40,376,002 | |
| | | | | | | | | | | | | | |
| | Banks 13.7% | | | | | | | | | | | | |
| | Bangkok Bank PCL, fgn. | | | Thailand | | | | 913,600 | | | | 5,390,462 | |
| | BNP Paribas SA | | | France | | | | 401,637 | | | | 23,939,412 | |
| | Citigroup Inc. | | | United States | | | | 770,990 | | | | 41,718,269 | |
| b | | Commerzbank AG | | | Germany | | | | 547,840 | | | | 7,278,493 | |
| | Credit Agricole SA | | | France | | | | 1,640,346 | | | | 21,356,648 | |
| | DBS Group Holdings Ltd. | | | Singapore | | | | 932,690 | | | | 14,502,879 | |
| | HSBC Holdings PLC | | | United Kingdom | | | | 2,567,864 | | | | 24,489,911 | |
| b | | ING Groep NV, IDR | | | Netherlands | | | | 1,482,966 | | | | 19,433,231 | |
| | JPMorgan Chase & Co. | | | United States | | | | 440,760 | | | | 27,582,761 | |
| | KB Financial Group Inc. | | | South Korea | | | | 657,984 | | | | 21,747,112 | |
| | SunTrust Banks Inc. | | | United States | | | | 478,520 | | | | 20,049,988 | |
| | UniCredit SpA | | | Italy | | | | 3,118,881 | | | | 20,133,468 | |
| | | | | | | | | | | | | | |
| | | | | | | | | | | | | 247,622,634 | |
| | | | | | | | | | | | | | |
| | Biotechnology 2.2% | | | | | | | | | | | | |
| | Amgen Inc. | | | United States | | | | 219,000 | | | | 34,884,510 | |
| b | | Gilead Sciences Inc. | | | United States | | | | 49,050 | | | | 4,623,453 | |
| | | | | | | | | | | | | | |
| | | | | | | | | | | | | 39,507,963 | |
| | | | | | | | | | | | | | |
| | Capital Markets 3.2% | | | | | | | | | | | | |
| | Credit Suisse Group AG | | | Switzerland | | | | 1,026,980 | | | | 25,906,919 | |
| | Morgan Stanley | | | United States | | | | 832,180 | | | | 32,288,584 | |
| | | | | | | | | | | | | | |
| | | | | | | | | | | | | 58,195,503 | |
| | | | | | | | | | | | | | |
| | Chemicals 1.5% | | | | | | | | | | | | |
| | Akzo Nobel NV | | | Netherlands | | | | 397,282 | | | | 27,713,001 | |
| | | | | | | | | | | | | | |
| | Commercial Services & Supplies 0.3% | | | | | | | | | | | | |
| | Serco Group PLC | | | United Kingdom | | | | 2,443,089 | | | | 6,119,525 | |
| | | | | | | | | | | | | | |
| | Communications Equipment 2.2% | | | | | | | | | | | | |
| | Cisco Systems Inc. | | | United States | | | | 836,770 | | | | 23,274,757 | |
| | Ericsson, B | | | Sweden | | | | 1,291,812 | | | | 15,627,760 | |
| | | | | | | | | | | | | | |
| | | | | | | | | | | | | 38,902,517 | |
| | | | | | | | | | | | | | |
FRANKLIN TEMPLETON VARIABLE INSURANCE PRODUCTS TRUST
STATEMENT OF INVESTMENTS
Templeton Growth VIP Fund (continued)
| | | | | | | | | | | | | | |
| | | | | Country | | | Shares | | | Value | |
| | Common Stocks (continued) | | | | | | | | | | | | |
| | Construction & Engineering 0.6% | | | | | | | | | | | | |
| c | | FLSmidth & Co. AS | | | Denmark | | | | 250,000 | | | $ | 11,060,293 | |
| | | | | | | | | | | | | | |
| | Construction Materials 1.7% | | | | | | | | | | | | |
| | CRH PLC | | | Ireland | | | | 1,290,661 | | | | 31,077,825 | |
| | | | | | | | | | | | | | |
| | Consumer Finance 0.3% | | | | | | | | | | | | |
| | Capital One Financial Corp. | | | United States | | | | 55,980 | | | | 4,621,149 | |
| | | | | | | | | | | | | | |
| | Diversified Telecommunication Services 3.7% | | | | | | | | | | | | |
| | China Telecom Corp. Ltd., ADR | | | China | | | | 179,195 | | | | 10,520,539 | |
| | Singapore Telecommunications Ltd. | | | Singapore | | | | 5,861,470 | | | | 17,255,233 | |
| | Telefonica SA | | | Spain | | | | 1,682,480 | | | | 24,266,745 | |
| | Verizon Communications Inc. | | | United States | | | | 158,750 | | | | 7,426,325 | |
| | Vivendi SA | | | France | | | | 286,004 | | | | 7,160,081 | |
| | | | | | | | | | | | | | |
| | | | | | | | | | | | | 66,628,923 | |
| | | | | | | | | | | | | | |
| | Electrical Equipment 0.2% | | | | | | | | | | | | |
| | Dongfang Electric Corp. Ltd., H | | | China | | | | 2,016,600 | | | | 3,708,654 | |
| | | | | | | | | | | | | | |
| | Electronic Equipment, Instruments & Components 0.4% | | | | | | | | | | | | |
| b | | Flextronics International Ltd. | | | Singapore | | | | 691,118 | | | | 7,726,699 | |
| | | | | | | | | | | | | | |
| | Energy Equipment & Services 1.6% | | | | | | | | | | | | |
| | Baker Hughes Inc. | | | United States | | | | 146,590 | | | | 8,219,302 | |
| | Noble Corp. PLC | | | United States | | | | 902,230 | | | | 14,949,951 | |
| | Paragon Offshore PLC | | | United States | | | | 232,730 | | | | 644,662 | |
| b | | Saipem SpA | | | Italy | | | | 158,570 | | | | 1,681,738 | |
| | Technip SA | | | France | | | | 60,350 | | | | 3,608,456 | |
| | | | | | | | | | | | | | |
| | | | | | | | | | | | | 29,104,109 | |
| | | | | | | | | | | | | | |
| | Food & Staples Retailing 2.8% | | | | | | | | | | | | |
| | CVS Health Corp. | | | United States | | | | 182,840 | | | | 17,609,320 | |
| b | | Metro AG | | | Germany | | | | 587,740 | | | | 17,999,596 | |
| | Tesco PLC | | | United Kingdom | | | | 4,757,618 | | | | 14,015,671 | |
| | | | | | | | | | | | | | |
| | | | | | | | | | | | | 49,624,587 | |
| | | | | | | | | | | | | | |
| | Health Care Equipment & Supplies 3.2% | | | | | | | | | | | | |
| | Getinge AB, B | | | Sweden | | | | 925,050 | | | | 21,088,829 | |
| | Medtronic Inc. | | | United States | | | | 497,540 | | | | 35,922,388 | |
| | | | | | | | | | | | | | |
| | | | | | | | | | | | | 57,011,217 | |
| | | | | | | | | | | | | | |
| | Industrial Conglomerates 2.0% | | | | | | | | | | | | |
| | Koninklijke Philips NV | | | Netherlands | | | | 459,718 | | | | 13,433,649 | |
| | Siemens AG | | | Germany | | | | 201,712 | | | | 22,881,705 | |
| | | | | | | | | | | | | | |
| | | | | | | | | | | | | 36,315,354 | |
| | | | | | | | | | | | | | |
| | Insurance 6.2% | | | | | | | | | | | | |
| | American International Group Inc. | | | United States | | | | 569,370 | | | | 31,890,414 | |
| | Aviva PLC | | | United Kingdom | | | | 2,366,920 | | | | 17,874,746 | |
| | AXA SA | | | France | | | | 1,091,068 | | | | 25,354,292 | |
| | Muenchener Rueckversicherungs-Gesellschaft AG | | | Germany | | | | 28,871 | | | | 5,790,295 | |
| a,b | | NN Group NV, 144A | | | Netherlands | | | | 276,400 | | | | 8,309,261 | |
| | Swiss Re AG | | | Switzerland | | | | 270,006 | | | | 22,717,765 | |
| | | | | | | | | | | | | | |
| | | | | | | | | | | | | 111,936,773 | |
| | | | | | | | | | | | | | |
FRANKLIN TEMPLETON VARIABLE INSURANCE PRODUCTS TRUST
STATEMENT OF INVESTMENTS
Templeton Growth VIP Fund (continued)
| | | | | | | | | | | | | | |
| | | | | Country | | | Shares | | | Value | |
| | Common Stocks (continued) | | | | | | | | | | | | |
| | Life Sciences Tools & Services 0.5% | | | | | | | | | | | | |
| b | | QIAGEN NV | | | Netherlands | | | | 385,000 | | | $ | 9,018,856 | |
| | | | | | | | | | | | | | |
| | Machinery 1.1% | | | | | | | | | | | | |
| b | | Navistar International Corp. | | | United States | | | | 598,440 | | | | 20,035,771 | |
| | | | | | | | | | | | | | |
| | Media 4.8% | | | | | | | | | | | | |
| | Comcast Corp., Special A | | | United States | | | | 710,142 | | | | 40,879,324 | |
| b | | News Corp., A | | | United States | | | | 319,435 | | | | 5,011,935 | |
| | Sky PLC | | | United Kingdom | | | | 721,063 | | | | 10,104,049 | |
| | Twenty-First Century Fox Inc., A | | | United States | | | | 641,182 | | | | 24,624,595 | |
| | The Walt Disney Co. | | | United States | | | | 64,060 | | | | 6,033,811 | |
| | | | | | | | | | | | | | |
| | | | | | | | | | | | | 86,653,714 | |
| | | | | | | | | | | | | | |
| | Metals & Mining 1.8% | | | | | | | | | | | | |
| | Mining and Metallurgical Co. Norilsk Nickel OJSC, ADR | | | Russia | | | | 1,040,760 | | | | 14,799,607 | |
| | POSCO | | | South Korea | | | | 63,730 | | | | 16,052,530 | |
| | POSCO, ADR | | | South Korea | | | | 27,740 | | | | 1,770,089 | |
| | | | | | | | | | | | | | |
| | | | | | | | | | | | | 32,622,226 | |
| | | | | | | | | | | | | | |
| | Multiline Retail 0.8% | | | | | | | | | | | | |
| | Target Corp. | | | United States | | | | 191,680 | | | | 14,550,429 | |
| | | | | | | | | | | | | | |
| | Oil, Gas & Consumable Fuels 9.6% | | | | | | | | | | | | |
| | BP PLC | | | United Kingdom | | | | 2,807,128 | | | | 17,983,183 | |
| | Chevron Corp. | | | United States | | | | 137,470 | | | | 15,421,384 | |
| | China Shenhua Energy Co. Ltd., H | | | China | | | | 5,271,520 | | | | 15,568,556 | |
| | Eni SpA | | | Italy | | | | 776,759 | | | | 13,637,635 | |
| | Galp Energia SGPS SA, B | | | Portugal | | | | 1,575,520 | | | | 16,072,683 | |
| | Kunlun Energy Co. Ltd. | | | China | | | | 15,089,830 | | | | 14,323,171 | |
| | Royal Dutch Shell PLC, B | | | United Kingdom | | | | 299,573 | | | | 10,426,869 | |
| | Talisman Energy Inc. | | | Canada | | | | 4,745,780 | | | | 37,189,751 | |
| | Total SA, B | | | France | | | | 618,659 | | | | 31,829,510 | |
| | | | | | | | | | | | | | |
| | | | | | | | | | | | | 172,452,742 | |
| | | | | | | | | | | | | | |
| | Pharmaceuticals 11.6% | | | | | | | | | | | | |
| b | | Actavis PLC | | | United States | | | | 56,124 | | | | 14,446,879 | |
| | GlaxoSmithKline PLC | | | United Kingdom | | | | 1,103,090 | | | | 23,658,756 | |
| | Merck & Co. Inc. | | | United States | | | | 304,971 | | | | 17,319,303 | |
| | Merck KGaA | | | Germany | | | | 229,554 | | | | 21,781,965 | |
| | Pfizer Inc. | | | United States | | | | 1,111,443 | | | | 34,621,450 | |
| | Roche Holding AG | | | Switzerland | | | | 115,383 | | | | 31,323,548 | |
| | Sanofi | | | France | | | | 290,857 | | | | 26,627,551 | |
| | Teva Pharmaceutical Industries Ltd., ADR | | | Israel | | | | 688,930 | | | | 39,620,364 | |
| | | | | | | | | | | | | | |
| | | | | | | | | | | | | 209,399,816 | |
| | | | | | | | | | | | | | |
| | Professional Services 0.0%† | | | | | | | | | | | | |
| | Hays PLC | | | United Kingdom | | | | 2,280 | | | | 5,174 | |
| | | | | | | | | | | | | | |
| | Software 3.4% | | | | | | | | | | | | |
| | Microsoft Corp. | | | United States | | | | 1,177,169 | | | | 54,679,500 | |
| | SAP SE | | | Germany | | | | 80,912 | | | | 5,703,859 | |
| | | | | | | | | | | | | | |
| | | | | | | | | | | | | 60,383,359 | |
| | | | | | | | | | | | | | |
| | Specialty Retail 2.0% | | | | | | | | | | | | |
| | Best Buy Co. Inc. | | | United States | | | | 277,560 | | | | 10,819,289 | |
| | Kingfisher PLC | | | United Kingdom | | | | 4,891,448 | | | | 25,960,740 | |
| | | | | | | | | | | | | | |
| | | | | | | | | | | | | 36,780,029 | |
| | | | | | | | | | | | | | |
FRANKLIN TEMPLETON VARIABLE INSURANCE PRODUCTS TRUST
STATEMENT OF INVESTMENTS
Templeton Growth VIP Fund (continued)
| | | | | | | | | | | | | | |
| | | | | Country | | | Shares | | | Value | |
| | Common Stocks (continued) | | | | | | | | | | | | |
| | Technology Hardware, Storage & Peripherals 5.3% | | | | | | | | | | | | |
| | Hewlett-Packard Co. | | | United States | | | | 1,036,700 | | | $ | 41,602,771 | |
| | Samsung Electronics Co. Ltd. | | | South Korea | | | | 45,020 | | | | 54,620,337 | |
| | | | | | | | | | | | | | |
| | | | | | | | | | | | | 96,223,108 | |
| | | | | | | | | | | | | | |
| | Wireless Telecommunication Services 2.1% | | | | | | | | | | | | |
| | Mobile TeleSystems, ADR | | | Russia | | | | 70,713 | | | | 507,719 | |
| b | | Turkcell Iletisim Hizmetleri AS, ADR | | | Turkey | | | | 1,647,543 | | | | 24,910,850 | |
| | Vodafone Group PLC | | | United Kingdom | | | | 3,292,417 | | | | 11,426,154 | |
| | | | | | | | | | | | | | |
| | | | | | | | | | | | | 36,844,723 | |
| | | | | | | | | | | | | | |
| | | | |
| | Total Common Stocks (Cost $1,395,816,925) | | | | | | | | | | | 1,752,655,957 | |
| | | | | | | | | | | | | | |
| | Preferred Stocks (Cost $18,040,759) 0.6% | | | | | | | | | | | | |
| | Oil, Gas & Consumable Fuels 0.6% | | | | | | | | | | | | |
| | Petroleo Brasileiro SA, ADR, pfd. | | | Brazil | | | | 1,317,392 | | | | 9,985,831 | |
| | | | | | | | | | | | | | |
| | | | |
| | Total Investments before Short Term Investments
(Cost $1,413,857,684) | | | | | | | | | | | 1,762,641,788 | |
| | | | | | | | | | | | | | |
| | | | |
| | | | | | | | Principal Amount* | | | | |
| | Short Term Investments 2.8% | | | | | | | | | | | | |
| | Time Deposits 2.2% | | | | | | | | | | | | |
| | Bank of Montreal, 0.03%, 1/02/15 | | | Canada | | | | 12,000,000 | | | | 12,000,000 | |
| | Bank of Nova Scotia, 0.04%, 1/02/15 | | | United States | | | | 14,000,000 | | | | 14,000,000 | |
| | Royal Bank of Canada, 0.03%, 1/02/15 | | | Canada | | | | 14,000,000 | | | | 14,000,000 | |
| | | | | | | | | | | | | | |
| | | | |
| | Total Time Deposits (Cost $40,000,000) | | | | | | | | | | | 40,000,000 | |
| | | | | | | | | | | | | | |
| | | | |
| | Total Investments before Money Market Funds
(Cost $1,453,857,684) | | | | | | | | | | | 1,802,641,788 | |
| | | | | | | | | | | | | | |
| | | | |
| | | | | | | | Shares | | | | |
| d | | Investments from Cash Collateral Received for Loaned Securities (Cost $11,687,500) 0.6% | | | | | | | | | | | | |
| | Money Market Funds 0.6% | | | | | | | | | | | | |
| e | | BNY Mellon Overnight Government Fund, 0.072% | | | United States | | | | 11,687,500 | | | | 11,687,500 | |
| | | | | | | | | | | | | | |
| | Total Investments (Cost $1,465,545,184) 100.5% | | | | | | | | | | | 1,814,329,288 | |
| | Other Assets, less Liabilities (0.5)% | | | | | | | | | | | (9,584,712 | ) |
| | | | | | | | | | | | | | |
| | Net Assets 100.0% | | | | | | | | | | $ | 1,804,744,576 | |
| | | | | | | | | | | | | | |
See Abbreviations on page TG-24.
†Rounds to less than 0.1% of net assets.
*The principal amount is stated in U.S. dollars unless otherwise indicated.
aSecurity was purchased pursuant to Rule 144A under the Securities Act of 1933 and may be sold in transactions exempt from registration only to qualified institutional buyers or in a public offering registered under the Securities Act of 1933. These securities have been deemed liquid under guidelines approved by the Trust’s Board of Trustees. At December 31, 2014, the aggregate value of these securities was $11,265,994, representing 0.62% of net assets.
bNon-income producing.
cA portion or all of the security is on loan at December 31, 2014. See Note 1(c).
dSee Note 1(c) regarding securities on loan.
eThe rate shown is the annualized seven-day yield at period end.
| | | | | | |
| | | The accompanying notes are an integral part of these financial statements. | Annual Report | | | TG-13 | |
FRANKLIN TEMPLETON VARIABLE INSURANCE PRODUCTS TRUST
Financial Statements
Statement of Assets and Liabilities
December 31, 2014
| | | | |
| | | Templeton Growth
VIP Fund | |
Assets: | | | | |
Investments in securities: | | | | |
Cost | | $ | 1,465,545,184 | |
| | | | |
Value (Includes securities loaned in the amount of $11,060,293) | | $ | 1,814,329,288 | |
Cash | | | 637,065 | |
Receivables: | | | | |
Investment securities sold | | | 893,948 | |
Capital shares sold | | | 56,949 | |
Dividends and interest | | | 3,527,056 | |
Other assets | | | 178 | |
| | | | |
Total assets | | | 1,819,444,484 | |
| | | | |
Liabilities: | | | | |
Payables: | | | | |
Investment securities purchased | | | 351,460 | |
Capital shares redeemed | | | 542,498 | |
Management fees | | | 1,174,814 | |
Distribution fees | | | 533,118 | |
Payable upon return of securities loaned | | | 11,687,500 | |
Accrued expenses and other liabilities | | | 410,518 | |
| | | | |
Total liabilities | | | 14,699,908 | |
| | | | |
Net assets, at value | | $ | 1,804,744,576 | |
| | | | |
Net assets consist of: | | | | |
Paid-in capital | | $ | 1,500,964,915 | |
Undistributed net investment income | | | 44,589,038 | |
Net unrealized appreciation (depreciation) | | | 348,736,638 | |
Accumulated net realized gain (loss) | | | (89,546,015 | ) |
| | | | |
Net assets, at value | | $ | 1,804,744,576 | |
| | | | |
| |
| Class 1: | | | | |
Net assets, at value | | $ | 572,859,920 | |
| | | | |
Shares outstanding | | | 38,575,054 | |
| | | | |
Net asset value and maximum offering price per share | | $ | 14.85 | |
| | | | |
| |
| Class 2: | | | | |
Net assets, at value | | $ | 1,171,895,526 | |
| | | | |
Shares outstanding | | | 80,202,282 | |
| | | | |
Net asset value and maximum offering price per share | | $ | 14.61 | |
| | | | |
| |
| Class 4: | | | | |
Net assets, at value | | $ | 59,989,130 | |
| | | | |
Shares outstanding | | | 4,072,480 | |
| | | | |
Net asset value and maximum offering price per share | | $ | 14.73 | |
| | | | |
| | | | |
| TG-14 | | Annual Report | The accompanying notes are an integral part of these financial statements. | | |
FRANKLIN TEMPLETON VARIABLE INSURANCE PRODUCTS TRUST
FINANCIAL STATEMENTS
Statement of Operations
for the year ended December 31, 2014
| | | | |
| | | Templeton Growth
VIP Fund | |
Investment income: | | | | |
Dividends (net of foreign taxes of $4,294,947) | | $ | 63,974,034 | |
Interest | | | 11,444 | |
Income from securities loaned | | | 1,115,554 | |
| | | | |
Total investment income | | | 65,101,032 | |
| | | | |
Expenses: | | | | |
Management fees (Note 3a) | | | 15,167,256 | |
Distribution fees: (Note 3c) | | | | |
Class 2 | | | 3,356,502 | |
Class 4 | | | 237,543 | |
Custodian fees (Note 4) | | | 143,548 | |
Reports to shareholders | | | 316,235 | |
Professional fees | | | 74,729 | |
Trustees’ fees and expenses | | | 8,173 | |
Other | | | 53,303 | |
| | | | |
Total expenses | | | 19,357,289 | |
| | | | |
Net investment income | | | 45,743,743 | |
| | | | |
Realized and unrealized gains (losses): | | | | |
Net realized gain (loss) from: | | | | |
Investments: | | | | |
Unaffiliated issuers | | | 104,727,236 | |
Non-controlled affiliated issuers (Note 8) | | | 773,990 | |
Foreign currency transactions | | | (6,005 | ) |
| | | | |
Net realized gain (loss) | | | 105,495,221 | |
| | | | |
Net change in unrealized appreciation (depreciation) on: | | | | |
Investments | | | (200,399,842 | ) |
Translation of other assets and liabilities denominated in foreign currencies | | | (94,980 | ) |
| | | | |
Net change in unrealized appreciation (depreciation) | | | (200,494,822 | ) |
| | | | |
Net realized and unrealized gain (loss) | | | (94,999,601 | ) |
| | | | |
Net increase (decrease) in net assets resulting from operations | | $ | (49,255,858 | ) |
| | | | |
| | | | | | |
| | | The accompanying notes are an integral part of these financial statements. | Annual Report | | | TG-15 | |
FRANKLIN TEMPLETON VARIABLE INSURANCE PRODUCTS TRUST
FINANCIAL STATEMENTS
Statements of Changes in Net Assets
| | | | | | | | |
| | | Templeton Growth VIP Fund | |
| | | Year Ended December 31, | |
| | | 2014 | | | 2013 | |
Increase (decrease) in net assets: | | | | | | | | |
Operations: | | | | | | | | |
Net investment income | | $ | 45,743,743 | | | $ | 28,850,993 | |
Net realized gain (loss) from investments and foreign currency transactions | | | 105,495,221 | | | | 98,725,339 | |
Net change in unrealized appreciation (depreciation) on investments and translation of other assets and liabilities denominated in foreign currencies | | | (200,494,822 | ) | | | 412,375,570 | |
| | | | |
Net increase (decrease) in net assets resulting from operations | | | (49,255,858 | ) | | | 539,951,902 | |
| | | | |
Distributions to shareholders from: | | | | | | | | |
Net investment income: | | | | | | | | |
Class 1 | | | (9,482,577 | ) | | | (15,214,157 | ) |
Class 2 | | | (18,300,865 | ) | | | (38,639,867 | ) |
Class 4 | | | (885,005 | ) | | | (1,946,523 | ) |
| | | | |
Total distributions to shareholders | | | (28,668,447 | ) | | | (55,800,547 | ) |
| | | | |
Capital share transactions: (Note 2) | | | | | | | | |
Class 1 | | | 9,471,206 | | | | (17,266,459 | ) |
Class 2 | | | (227,816,318 | ) | | | (240,507,877 | ) |
Class 4 | | | (10,381,665 | ) | | | (11,647,677 | ) |
| | | | |
Total capital share transactions | | | (228,726,777 | ) | | | (269,422,013 | ) |
| | | | |
Net increase (decrease) in net assets | | | (306,651,082 | ) | | | 214,729,342 | |
Net assets: | | | | | | | | |
Beginning of year | | | 2,111,395,658 | | | | 1,896,666,316 | |
| | | | |
End of year | | $ | 1,804,744,576 | | | $ | 2,111,395,658 | |
| | | | |
Undistributed net investment income included in net assets: | | | | | | | | |
End of year | | $ | 44,589,038 | | | $ | 26,566,772 | |
| | | | |
| | | | |
| TG-16 | | Annual Report | The accompanying notes are an integral part of these financial statements. | | |
FRANKLIN TEMPLETON VARIABLE INSURANCE PRODUCTS TRUST
Notes to Financial Statements
Templeton Growth VIP Fund
1. Organization and Significant Accounting Policies
Franklin Templeton Variable Insurance Products Trust (Trust) is registered under the Investment Company Act of 1940, as amended, (1940 Act) as an open-end management investment company, consisting of nineteen separate funds and applies the specialized accounting and reporting guidance in U.S. Generally Accepted Accounting Principles (U.S. GAAP). Templeton Growth VIP Fund (Fund) is included in this report. The financial statements of the remaining funds in the Trust are presented separately. Shares of the Fund are generally sold only to insurance company separate accounts to fund the benefits of variable life insurance policies or variable annuity contracts. The Fund offers three classes of shares: Class 1, Class 2, and Class 4. Each class of shares differs by its distribution fees, voting rights on matters affecting a single class and its exchange privilege.
Effective May 1, 2014, Templeton Growth Securities Fund was renamed Templeton Growth VIP Fund.
The following summarizes the Fund’s significant accounting policies.
a. Financial Instrument Valuation
The Fund’s investments in financial instruments are carried at fair value daily. Fair value is the price that would be received to sell an asset or paid to transfer a liability in an orderly transaction between market participants on the measurement date. The Fund calculates the net asset value (NAV) per share at the close of the New York Stock Exchange (NYSE), generally at 4 p.m. Eastern time (NYSE close) on each day the NYSE is open for trading. Under compliance policies and procedures approved by the Trust’s Board of Trustees (the Board), the Fund’s administrator has responsibility for oversight of valuation, including leading the cross-functional Valuation and Liquidity Oversight Committee (VLOC). The VLOC provides administration and oversight of the Fund’s valuation policies and procedures, which are approved annually by the Board. Among other things, these procedures allow the Fund to utilize independent pricing services, quotations from securities and financial instrument dealers, and other market sources to determine fair value.
Equity securities listed on an exchange or on the NASDAQ National Market System are valued at the last quoted sale price or the official closing price of the day, respectively. Foreign equity securities are valued as of the close of trading on the foreign stock exchange on which the security is primarily traded or as of the NYSE close, whichever is earlier. The value is then
converted into its U.S. dollar equivalent at the foreign exchange rate in effect at the NYSE close on the day that the value of the security is determined. Over-the-counter (OTC) securities are valued within the range of the most recent quoted bid and ask prices. Securities that trade in multiple markets or on multiple exchanges are valued according to the broadest and most representative market. Certain equity securities are valued based upon fundamental characteristics or relationships to similar securities. Investments in non-registered money market funds are valued at the closing NAV. Time deposits are valued at cost, which approximates fair value.
The Fund has procedures to determine the fair value of financial instruments for which market prices are not reliable or readily available. Under these procedures, the VLOC convenes on a regular basis to review such financial instruments and considers a number of factors, including significant unobservable valuation inputs, when arriving at fair value. The VLOC primarily employs a market-based approach which may use related or comparable assets or liabilities, recent transactions, market multiples, book values, and other relevant information for the investment to determine the fair value of the investment. An income-based valuation approach may also be used in which the anticipated future cash flows of the investment are discounted to calculate fair value. Discounts may also be applied due to the nature or duration of any restrictions on the disposition of the investments. Due to the inherent uncertainty of valuations of such investments, the fair values may differ significantly from the values that would have been used had an active market existed. The VLOC employs various methods for calibrating these valuation approaches including a regular review of key inputs and assumptions, transactional back-testing or disposition analysis, and reviews of any related market activity.
Trading in securities on foreign securities stock exchanges and OTC markets may be completed before the daily NYSE close. In addition, trading in certain foreign markets may not take place on every NYSE business day. Occasionally, events occur between the time at which trading in a foreign security is completed and the close of the NYSE that might call into question the reliability of the value of a portfolio security held by the Fund. As a result, differences may arise between the value of the Fund’s portfolio securities as determined at the foreign market close and the latest indications of value at the close of the NYSE. In order to minimize the potential for these differences, the VLOC monitors price movements following the close of trading in foreign stock markets through a series of country specific market proxies (such
FRANKLIN TEMPLETON VARIABLE INSURANCE PRODUCTS TRUST
NOTES TO FINANCIAL STATEMENTS
Templeton Growth VIP Fund (continued)
1. Organization and Significant Accounting
Policies (continued)
a. Financial Instrument Valuation (continued)
as baskets of American Depositary Receipts, futures contracts and exchange traded funds). These price movements are measured against established trigger thresholds for each specific market proxy to assist in determining if an event has occurred that may call into question the reliability of the values of the foreign securities held by the Fund. If such an event occurs, the securities may be valued using fair value procedures, which may include the use of independent pricing services.
Also, when the last day of the reporting period is a non-business day, certain foreign markets may be open on those days that the NYSE is closed, which could result in differences between the value of the Fund’s portfolio securities on the last business day and the last calendar day of the reporting period. Any significant security valuation changes due to an open foreign market are adjusted and reflected by the Fund for financial reporting purposes.
b. Foreign Currency Translation
Portfolio securities and other assets and liabilities denominated in foreign currencies are translated into U.S. dollars based on the exchange rate of such currencies against U.S. dollars on the date of valuation. The Fund may enter into foreign currency exchange contracts to facilitate transactions denominated in a foreign currency. Purchases and sales of securities, income and expense items denominated in foreign currencies are translated into U.S. dollars at the exchange rate in effect on the transaction date. Portfolio securities and assets and liabilities denominated in foreign currencies contain risks that those currencies will decline in value relative to the U.S. dollar. Occasionally, events may impact the availability or reliability of foreign exchange rates used to convert the U.S. dollar equivalent value. If such an event occurs, the foreign exchange rate will be valued at fair value using procedures established and approved by the Board.
The Fund does not separately report the effect of changes in foreign exchange rates from changes in market prices on securities held. Such changes are included in net realized and unrealized gain or loss from investments on the Statement of Operations.
Realized foreign exchange gains or losses arise from sales of foreign currencies, currency gains or losses realized between the trade and settlement dates on securities transactions and the
difference between the recorded amounts of dividends, interest, and foreign withholding taxes and the U.S. dollar equivalent of the amounts actually received or paid. Net unrealized foreign exchange gains and losses arise from changes in foreign exchange rates on foreign denominated assets and liabilities other than investments in securities held at the end of the reporting period.
c. Securities Lending
The Fund participates in an agency based securities lending program. The Fund receives cash collateral against the loaned securities in an amount equal to at least 102% of the fair value of the loaned securities. Collateral is maintained over the life of the loan in an amount not less than 100% of the fair value of loaned securities, as determined at the close of fund business each day; any additional collateral required due to changes in security values is delivered to the Fund on the next business day. The collateral is invested in a non-registered money fund as indicated on the Statement of Investments. The Fund receives income from the investment of cash collateral, in addition to lending fees and rebates paid by the borrower. The Fund bears the market risk with respect to the collateral investment, securities loaned, and the risk that the agent may default on its obligations to the Fund. The securities lending agent has agreed to indemnify the Fund in the event of default by a third party borrower.
d. Income and Deferred Taxes
It is the Fund’s policy to qualify as a regulated investment company under the Internal Revenue Code. The Fund intends to distribute to shareholders substantially all of its taxable income and net realized gains to relieve it from federal income and if applicable, excise taxes. As a result, no provision for U.S. federal income taxes is required.
The Fund may be subject to foreign taxation related to income received, capital gains on the sale of securities and certain foreign currency transactions in the foreign jurisdictions in which it invests. Foreign taxes, if any, are recorded based on the tax regulations and rates that exist in the foreign markets in which the Fund invests. When a capital gain tax is determined to apply the Fund records an estimated deferred tax liability in an amount that would be payable if the securities were disposed of on the valuation date. As a result of several court cases, in certain countries across the European Union, the Fund has filed additional tax reclaims for previously withheld taxes on dividends earned in those countries. These additional filings are subject to various administrative proceedings by the local jurisdictions’ tax authorities within the
FRANKLIN TEMPLETON VARIABLE INSURANCE PRODUCTS TRUST
NOTES TO FINANCIAL STATEMENTS
Templeton Growth VIP Fund (continued)
European Union, as well as a number of related judicial proceedings. At this time, uncertainty exists as to the ultimate resolution of these proceedings, the likelihood of receipt of these reclaims, and the potential timing of payment and accordingly, no amounts are reflected in the financial statements.
The Fund recognizes the tax benefits of uncertain tax positions only when the position is “more likely than not” to be sustained upon examination by the tax authorities based on the technical merits of the tax position. As of December 31, 2014, and for all open tax years, the Fund has determined that no liability for unrecognized tax benefits is required in the Fund’s financial statements related to uncertain tax positions taken on a tax return (or expected to be taken on future tax returns). Open tax years are those that remain subject to examination and are based on each tax jurisdiction statute of limitation.
e. Security Transactions, Investment Income, Expenses and Distributions
Security transactions are accounted for on trade date. Realized gains and losses on security transactions are determined on a
specific identification basis. Interest income and estimated expenses are accrued daily. Dividend income is recorded on the ex-dividend date except for certain foreign securities where the dividend rate is not available. In such cases the dividend is recorded as soon as the information is received by the fund. Distributions to shareholders are recorded on the ex-dividend date and are determined according to income tax regulations (tax basis). Distributable earnings determined on a tax basis may differ from earnings recorded in accordance with U.S. GAAP. These differences may be permanent or temporary. Permanent differences are reclassified among capital accounts to reflect their tax character. These reclassifications have no impact on net
assets or the results of operations. Temporary differences are not reclassified, as they may reverse in subsequent periods.
Common expenses incurred by the Trust are allocated among the funds based on the ratio of net assets of each fund to the combined net assets of the Trust. Fund specific expenses are charged directly to the fund that incurred the expense.
Realized and unrealized gains and losses and net investment income, not including class specific expenses, are allocated daily to each class of shares based upon the relative proportion of net assets of each class. Differences in per share distributions, by class, are generally due to differences in class specific expenses.
f. Accounting Estimates
The preparation of financial statements in accordance with U.S. GAAP requires management to make estimates and assumptions that affect the reported amounts of assets and liabilities at the date of the financial statements and the amounts of income and expenses during the reporting period. Actual results could differ from those estimates.
g. Guarantees and Indemnifications
Under the Trust’s organizational documents, its officers and trustees are indemnified by the Trust against certain liabilities arising out of the performance of their duties to the Trust. Additionally, in the normal course of business, the Trust, on behalf of the Fund, enters into contracts with service providers that contain general indemnification clauses. The Trust’s maximum exposure under these arrangements is unknown as this would involve future claims that may be made against the Trust that have not yet occurred. Currently, the Trust expects the risk of loss to be remote.
2. Shares of Beneficial Interest
At December 31, 2014, there were an unlimited number of shares authorized (without par value). Transactions in the Fund’s shares were as follows:
| | | | | | | | | | | | | | | | | | |
| | | Year Ended December 31, | |
| | | 2014 | | | | | 2013 | |
| | | Shares | | | Amount | | | | | Shares | | | Amount | |
| | | | | |
| Class 1 Shares: | | | | | | | | | | | | | | | | | | |
Shares sold | | | 2,100,767 | | | $ | 33,047,439 | | | | | | 896,927 | | | $ | 12,053,666 | |
Shares issued in reinvestment of distributions | | | 589,713 | | | | 9,482,577 | | | | | | 1,149,106 | | | | 15,214,157 | |
Shares redeemed | | | (2,142,457 | ) | | | (33,058,810 | ) | | | | | (3,250,296 | ) | | | (44,534,282 | ) |
| | | | |
Net increase (decrease) | | | 548,023 | | | $ | 9,471,206 | | | | | | (1,204,263 | ) | | $ | (17,266,459 | ) |
| | | | |
FRANKLIN TEMPLETON VARIABLE INSURANCE PRODUCTS TRUST
NOTES TO FINANCIAL STATEMENTS
Templeton Growth VIP Fund (continued)
2. Shares of Beneficial Interest (continued)
| | | | | | | | | | | | | | | | | | |
| | | Year Ended December 31, | |
| | | 2014 | | | | | 2013 | |
| | | Shares | | | Amount | | | | | Shares | | | Amount | |
| | | | | |
| Class 2 Shares: | | | | | | | | | | | | | | | | | | |
Shares sold | | | 2,721,083 | | | $ | 41,308,837 | | | | | | 7,540,783 | | | $ | 101,234,976 | |
Shares issued in reinvestment of distributions | | | 1,155,358 | | | | 18,300,865 | | | | | | 2,963,180 | | | | 38,639,867 | |
Shares redeemed | | | (18,911,727 | ) | | | (287,426,020 | ) | | | | | (28,236,625 | ) | | | (380,382,720 | ) |
| | | | |
Net increase (decrease) | | | (15,035,286 | ) | | $ | (227,816,318 | ) | | | | | (17,732,662 | ) | | $ | (240,507,877 | ) |
| | | | |
| Class 4 Shares: | | | | | | | | | | | | | | | | | | |
Shares sold | | | 416,620 | | | $ | 6,355,215 | | | | | | 683,745 | | | $ | 9,107,528 | |
Shares issued on reinvestment of distributions | | | 55,382 | | | | 885,005 | | | | | | 147,912 | | | | 1,946,523 | |
Shares redeemed | | | (1,134,025 | ) | | | (17,621,885 | ) | | | | | (1,660,931 | ) | | | (22,701,728 | ) |
| | | | |
Net increase (decrease) | | | (662,023 | ) | | $ | (10,381,665 | ) | | | | | (829,274 | ) | | $ | (11,647,677 | ) |
| | | | |
3. Transactions With Affiliates
Franklin Resources, Inc. is the holding company for various subsidiaries that together are referred to as Franklin Templeton Investments. Certain officers and trustees of the Fund are also officers and/or directors of the following subsidiaries:
| | |
| Subsidiary | | Affiliation |
Templeton Global Advisors Limited (TGAL) | | Investment manager |
Franklin Templeton Services, LLC (FT Services) | | Administrative manager |
Franklin Templeton Distributors, Inc. (Distributors) | | Principal underwriter |
Franklin Templeton Investor Services, LLC (Investor Services) | | Transfer agent |
a. Management Fees
The Fund pays an investment management fee to TGAL based on the average daily net assets of the Fund as follows:
| | |
| Annualized Fee Rate | | Net Assets |
1.000% | | Up to and including $100 million |
0.900% | | Over $100 million, up to and including $250 million |
0.800% | | Over $250 million, up to and including $500 million |
0.750% | | Over $500 million, up to and including $1 billion |
0.700% | | Over $1 billion, up to and including $5 billion |
0.675% | | Over $5 billion, up to and including $10 billion |
0.655% | | Over $10 billion, up to and including $15 billion |
0.635% | | Over $15 billion, up to and including $20 billion |
0.615% | | In excess of $20 billion |
b. Administrative Fees
Under an agreement with TGAL, FT Services provides administrative services to the Fund. The fee is paid by TGAL based on the Fund’s average daily net assets, and is not an additional expense of the Fund.
FRANKLIN TEMPLETON VARIABLE INSURANCE PRODUCTS TRUST
NOTES TO FINANCIAL STATEMENTS
Templeton Growth VIP Fund (continued)
c. Distribution Fees
The Board has adopted distribution plans for Class 2 and Class 4 shares pursuant to Rule 12b-1 under the 1940 Act. Under the Fund’s compensation distribution plans, the Fund pays Distributors for costs incurred in connection with the servicing, sale and distribution of the Fund’s shares up to 0.35% per year of its average daily net assets of each class. Some distribution fees are not charged on shares held by affiliates. The Board has agreed to limit the current rate to 0.25% per year for Class 2. The plan year, for purposes of monitoring compliance with the maximum annual plan rates, is February 1 through January 31.
d. Transfer Agent Fees
Investor Services, under terms of an agreement, performs shareholder servicing for the Fund and is not paid by the Fund for the services.
e. Other Affiliated Transactions
At December 31, 2014, Franklin Templeton Variable Insurance Products Trust – Franklin Founding Funds Allocation VIP Fund owned 22.87% of the Fund’s outstanding shares.
4. Expense Offset Arrangement
The Fund has entered into an arrangement with its custodian whereby credits realized as a result of uninvested cash balances are used to reduce a portion of the Fund’s custodian expenses. During the year ended December 31, 2014, there were no credits earned.
5. Income Taxes
For tax purposes, capital losses may be carried over to offset future capital gains. Capital loss carryforwards with no expiration, if any, must be fully utilized before those losses with expiration dates.
At December 31, 2014, capital loss carryforwards were as follows:
| | | | |
Capital loss carryforwards subject to expiration: | | | | |
2017 | | $ | 16,985,638 | |
2018 | | | 55,299,629 | |
| | | | |
Total capital loss carryforwards | | $ | 72,285,267 | |
| | | | |
During the year ended December 31, 2014, the Fund utilized $100,617,302 of capital loss carryforwards.
The tax character of distributions paid during the years ended December 31, 2014 and 2013, was as follows:
| | | | | | | | |
| | | 2014 | | | 2013 | |
Distributions paid from ordinary income | | $ | 28,668,447 | | | $ | 55,800,547 | |
| | | | |
FRANKLIN TEMPLETON VARIABLE INSURANCE PRODUCTS TRUST
NOTES TO FINANCIAL STATEMENTS
Templeton Growth VIP Fund (continued)
5. Income Taxes (continued)
At December 31, 2014, the cost of investments net unrealized appreciation (depreciation), and undistributed ordinary income for income tax purposes were as follows:
| | | | |
Cost of investments | | $ | 1,482,805,931 | |
| | | | |
Unrealized appreciation | | $ | 461,615,214 | |
Unrealized depreciation | | | (130,091,857 | ) |
| | | | |
Net unrealized appreciation (depreciation) | | $ | 331,523,357 | |
| | | | |
Distributable earnings – undistributed ordinary income | | $ | 44,589,039 | |
| | | | |
Differences between income and/or capital gains as determined on a book basis and a tax basis are primarily due to differing treatments of foreign currency transactions, passive foreign investment company shares and wash sales.
6. Investment Transactions
Purchases and sales of investments (excluding short term securities) for the year ended December 31, 2014, aggregated $345,290,172 and $558,996,224, respectively.
7. Concentration of Risk
Investing in foreign securities may include certain risks and considerations not typically associated with investing in U.S. securities, such as fluctuating currency values and changing local and regional economic, political and social conditions, which may result in greater market volatility. In addition, certain foreign securities may not be as liquid as U.S. securities.
8. Holdings of 5% Voting Securities of Portfolio Companies
The 1940 Act defines “affiliated companies” to include investments in portfolio companies in which a fund owns 5% or more of the outstanding voting securities. Investments in “affiliated companies” for the Fund for the year ended December 31, 2014, were as shown below.
| | | | | | | | | | | | | | | | | | | | | | | | | | | | |
| Name of Issuer | | Number of Shares
Held at Beginning
of Year | | | Gross
Additions | | | Gross
Reductions | | | Number of Shares
Held at End of Year | | | Value at
End of
Year | | | Investment
Income | | | Realized Capital
Gain (Loss) | |
| Non-Controlled Affiliates | | | | | | | | | | | | | | | | | | | | | | | | | | | | |
Templeton China Opportunities Fund Ltd., Reg D (Value is —% of Net Assets) | | | 1,195,196 | | | | — | | | | (1,195,196 | ) | | | — | | | $ | — | | | $ | — | | | $ | 773,990 | |
| | | | | | | | | | | | | | | | | | | | |
9. Credit Facility
The Fund, together with other U.S. registered and foreign investment funds (collectively, Borrowers), managed by Franklin Templeton Investments, are borrowers in a joint syndicated senior unsecured credit facility totaling $1.5 billion (Global Credit Facility) which matured on February 13, 2015. This Global Credit Facility provides a source of funds to the Borrowers for temporary and emergency purposes, including the ability to meet future unanticipated or unusually large redemption requests. The Borrowers expect to renew the Global Credit Facility for a total of $2 billion effective February 13, 2015, which matures on February 12, 2016.
Under the terms of the Global Credit Facility, the Fund shall, in addition to interest charged on any borrowings made by the Fund and other costs incurred by the Fund, pay its share of fees and expenses incurred in connection with the implementation and maintenance of the Global Credit Facility, based upon its relative share of the aggregate net assets of all of the Borrowers, including an
FRANKLIN TEMPLETON VARIABLE INSURANCE PRODUCTS TRUST
NOTES TO FINANCIAL STATEMENTS
Templeton Growth VIP Fund (continued)
annual commitment fee of 0.07% based upon the unused portion of the Global Credit Facility. These fees are reflected in other expenses on the Statement of Operations. During the year ended December 31, 2014, the Fund did not use the Global Credit Facility.
10. Fair Value Measurements
The Fund follows a fair value hierarchy that distinguishes between market data obtained from independent sources (observable inputs) and the Fund’s own market assumptions (unobservable inputs). These inputs are used in determining the value of the Fund’s financial instruments and are summarized in the following fair value hierarchy:
| | • | | Level 1 – quoted prices in active markets for identical financial instruments |
| | • | | Level 2 – other significant observable inputs (including quoted prices for similar financial instruments, interest rates, prepayment speed, credit risk, etc.) |
| | • | | Level 3 – significant unobservable inputs (including the Fund’s own assumptions in determining the fair value of financial instruments) |
The input levels are not necessarily an indication of the risk or liquidity associated with financial instruments at that level.
For movements between the levels within the fair value hierarchy, the Fund has adopted a policy of recognizing the transfers as of the date of the underlying event which caused the movement.
A summary of inputs used as of December 31, 2014, in valuing the Fund’s assets carried at fair value, is as follows:
| | | | | | | | | | | | | | | | |
| | | Level 1 | | | Level 2 | | | Level 3 | | | Total | |
| | | | |
| Assets: | | | | | | | | | | | | | | | | |
Investments in Securities: | | | | | | | | | | | | | | | | |
Equity Investmentsa,b | | $ | 1,762,641,788 | | | $ | — | | | $ | — | | | $ | 1,762,641,788 | |
Short Term Investments | | | — | | | | 51,687,500 | | | | — | | | | 51,687,500 | |
| | | | |
Total Investments in Securities | | $ | 1,762,641,788 | | | $ | 51,687,500 | | | $ | — | | | $ | 1,814,329,288 | |
| | | | |
aIncludes common and preferred stocks.
bFor detailed categories, see the accompanying Statement of Investments.
11. New Accounting Pronouncements
In June 2014, the Financial Accounting Standards Board issued Accounting Standards Update (ASU) No. 2014-11, Transfers and Servicing (Topic 860), Repurchase-to-Maturity Transactions, Repurchase Financings, and Disclosures. The ASU changes the accounting for certain repurchase agreements and expands disclosure requirements related to repurchase agreements, securities lending, repurchase-to-maturity and similar transactions. The ASU is effective for interim and annual reporting periods beginning after December 15, 2014. Management has reviewed the requirements and believes the adoption of this ASU will not have a material impact on the financial statements.
12. Subsequent Events
The Fund has evaluated subsequent events through the issuance of the financial statements and determined that no events have occurred that require disclosure other than those already disclosed in the financial statements.
FRANKLIN TEMPLETON VARIABLE INSURANCE PRODUCTS TRUST
NOTES TO FINANCIAL STATEMENTS
Templeton Growth VIP Fund (continued)
Abbreviations
| | |
| Selected Portfolio |
| |
| ADR | | American Depositary Receipt |
| |
| IDR | | International Depositary Receipt |
FRANKLIN TEMPLETON VARIABLE INSURANCE PRODUCTS TRUST
Report of Independent Registered Public Accounting Firm
Templeton Growth VIP Fund
To the Board of Trustees and Shareholders of Franklin Templeton Variable Insurance Products Trust
In our opinion, the accompanying statement of assets and liabilities, including the statement of investments, and the related statements of operations and of changes in net assets and the financial highlights present fairly, in all material respects, the financial position of Templeton Growth VIP Fund (the “Fund”) at December 31, 2014, the results of its operations for the year then ended, the changes in its net assets for each of the two years in the period then ended and the financial highlights for each of the five years in the period then ended, in conformity with accounting principles generally accepted in the United States of America. These financial statements and financial highlights (hereafter referred to as “financial statements”) are the responsibility of the Fund’s management. Our responsibility is to express an opinion on these financial statements based on our audits. We conducted our audits of these financial statements in accordance with the standards of the Public Company Accounting Oversight Board (United States). Those standards require that we plan and perform the audit to obtain reasonable assurance about whether the financial statements are free of material misstatement. An audit includes examining, on a test basis, evidence supporting the amounts and disclosures in the financial statements, assessing the accounting principles used and significant estimates made by management, and evaluating the overall financial statement presentation. We believe that our audits, which included confirmation of securities at December 31, 2014 by correspondence with the custodian, transfer agent and brokers, provide a reasonable basis for our opinion.
PricewaterhouseCoopers LLP
San Francisco, California
February 13, 2015
FRANKLIN TEMPLETON VARIABLE INSURANCE PRODUCTS TRUST
Tax Information (unaudited)
Templeton Growth VIP Fund
Under Section 854(b)(1)(A) of the Internal Revenue Code (Code), the Fund hereby reports 38.13% of the ordinary income dividends as income qualifying for the dividends received deduction for the fiscal year ended December 31, 2014.
At December 31, 2014, more than 50% of the Fund’s total assets were invested in securities of foreign issuers. In most instances, foreign taxes were withheld from income paid to the Fund on these investments. The Fund elects to treat foreign taxes paid as allowed under Section 853 of the Code. This election will allow shareholders of record as of the 2015 distribution date, to treat their proportionate share of foreign taxes paid by the Fund as having been paid directly by them. The shareholder shall consider these amounts as foreign taxes paid in the tax year in which they receive the Fund distribution.
FRANKLIN TEMPLETON VARIABLE INSURANCE PRODUCTS TRUST
FRANKLIN MANAGED VOLATILITY GLOBAL ALLOCATION VIP FUND ANNUAL REPORT
Important Notes to
Performance Information
Performance data is historical and cannot predict or guarantee future results. Principal value and investment return will fluctuate with market conditions, and you may have a gain or loss when you withdraw your money. Inception dates of the funds may have preceded the effective dates of the subaccounts, contracts or their availability in all states.
When reviewing the index comparisons, please keep in mind that indexes have a number of inherent performance differentials over the funds. First, unlike the funds, which must hold a minimum amount of cash to maintain liquidity, indexes do not have a cash component. Second, the funds are actively managed and, thus, are subject to management fees to cover salaries of securities analysts or portfolio managers in addition to other expenses. Indexes are unmanaged and do not include any commissions or other expenses typically associated with investing in securities. Third, indexes often contain a different mix of securities than the fund to which they are compared. Additionally, please remember that indexes are simply a measure of performance and cannot be invested in directly.
Franklin Managed Volatility Global Allocation VIP Fund
We are pleased to bring you Franklin Managed Volatility Global Allocation VIP Fund’s annual report for the fiscal year ended December 31, 2014.
Class 2 Performance Summary as of 12/31/14
Average annual total return of Class 2 shares* represents the average annual change in value, assuming reinvestment of dividends and capital gains. Average returns smooth out variations in returns, which can be significant; they are not the same as year-by-year results.
| | | | | | | | |
| Periods Ended 12/31/14 | | 1-Year | | | Since Inception (4/1/13) | |
Average Annual Total Return | | | +3.60% | | | | +3.53% | |
*The Fund has an expense reduction contractually guaranteed through at least 4/30/15, a fee waiver related to the management fee paid by a Fund subsidiary, and a fee waiver associated with its investments in a Franklin Templeton money fund, contractually guaranteed through at least its current fiscal year-end. Fund investment results reflect the expense reduction and fee waivers, to the extent applicable; without these reductions, the results would have been lower.
Performance reflects the Fund’s Class 2 operating expenses, but does not include any contract fees, expenses or sales charges. If they had been included, performance would be lower. These charges and deductions, particularly for variable life policies, can have a significant effect on contract values and insurance benefits. See the contract prospectus for a complete description of these expenses, including sales charges.
Performance data represent past performance, which does not guarantee future results. Investment return and principal value will fluctuate, and you may have a gain or loss when you sell your shares. Current performance may differ from figures shown.
Total Return Index Comparison for a Hypothetical $10,000 Investment (4/1/13–12/31/14)
The graph below shows the change in value of a hypothetical $10,000 investment in the Fund over the indicated period and includes reinvestment of any income or distributions. The Fund’s performance* is compared to the performance of the MSCI All Country World Index (ACWI), the Citigroup World Government Bond Index (WGBI) and the Bloomberg Commodity Index. One cannot invest directly in an index, and an index is not representative of the Fund’s portfolio. Please see Important Notes to Performance Information preceding the Fund Summaries.
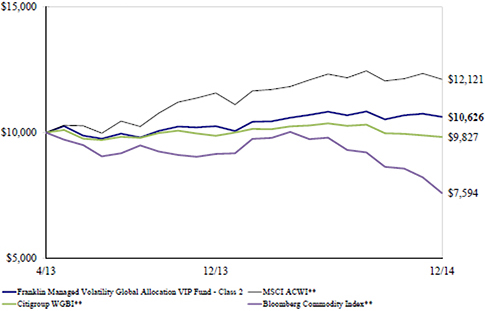
**Source: Morningstar. Please see Index Descriptions following the Fund Summaries.
FRANKLIN MANAGED VOLATILITY GLOBAL ALLOCATION VIP FUND
Class 2 Fund Expenses
As an investor in a variable insurance contract (Contract) that indirectly provides for investment in an underlying mutual fund, you can incur transaction and/or ongoing expenses at both the Fund level and the Contract level.
| • | | Transaction expenses can include sales charges (loads) on purchases, surrender fees, transfer fees and premium taxes. |
| • | | Ongoing expenses can include management fees, distribution and service (12b-1) fees, contract fees, annual maintenance fees, mortality and expense risk fees and other fees and expenses. All mutual funds and Contracts have some types of ongoing expenses. |
The expenses shown in the table are meant to highlight ongoing expenses at the Fund level only and do not include ongoing expenses at the Contract level, or transaction expenses at either the Fund or Contract levels. While the Fund does not have transaction expenses, if the transaction and ongoing expenses at the Contract level were included, the expenses shown below would be higher. You should consult your Contract prospectus or disclosure document for more information.
The table shows Fund-level ongoing expenses and can help you understand these expenses and compare them with those of other mutual funds offered through the Contract. The table assumes a $1,000 investment held for the six months indicated. Please refer to the Fund prospectus for additional information on operating expenses.
Actual Fund Expenses
The first line (Actual) of the table provides actual account values and expenses. The “Ending Account Value” is derived from the Fund’s actual return, which includes the effect of ongoing Fund expenses, but does not include the effect of ongoing Contract expenses.
You can estimate the Fund-level expenses you incurred during the period by following these steps. Of course, your account value and expenses will differ from those in this illustration:
| 1. | Divide your account value by $1,000. |
If an account had an $8,600 value,
then $8,600 ÷ $1,000 = 8.6.
| 2. | Multiply the result by the number under the heading “Fund-Level Expenses Incurred During Period.” |
If Fund-Level Expenses Incurred During Period were $7.50, then 8.6 × $7.50 = $64.50.
In this illustration, the estimated expenses incurred this period at the Fund level are $64.50.
FRANKLIN MANAGED VOLATILITY GLOBAL ALLOCATION VIP FUND
Hypothetical Example for Comparison with Other Mutual Funds
Information in the second line (Hypothetical) of the table can help you compare ongoing expenses of the Fund with those of other mutual funds offered through the Contract. This information may not be used to estimate the actual ending account balance or expenses you incurred during the period. The hypothetical “Ending Account Value” is based on the
Fund’s actual expense ratio and an assumed 5% annual rate of return before expenses, which does not represent the Fund’s actual return. The figure under the heading “Fund-Level Expenses Incurred During Period” shows the hypothetical expenses your account would have incurred under this scenario. You can compare this figure with the 5% hypothetical examples that appear in shareholder reports of other funds offered through a Contract.
| | | | | | | | | | | | |
| Class 2 | | Beginning Account
Value 7/1/14 | | | Ending Account
Value 12/31/14 | | | Expenses Paid During Period* 7/1/14–12/31/14 | |
Actual | | | $1,000 | | | | $ 980.90 | | | | $5.39 | |
Hypothetical (5% return before expenses) | | | $1,000 | | | | $1,019.76 | | | | $5.50 | |
*Expenses are calculated using the most recent six-month annualized expense ratio, net of expense waivers, for the Fund’s Class 2 shares (1.08%), which does not include any ongoing expenses of the Contract for which the Fund is an investment option, multiplied by the average account value over the period, multiplied by 184/365 to reflect the one-half year period.
Franklin Managed Volatility Global Allocation VIP Fund
We are pleased to bring you Franklin Managed Volatility Global Allocation VIP Fund’s annual report for the fiscal year ended December 31, 2014.
Class 5 Performance Summary as of 12/31/14
Average annual total return of Class 5 shares* represents the average annual change in value, assuming reinvestment of dividends and capital gains. Average returns smooth out variations in returns, which can be significant; they are not the same as year-by-year results.
| | | | | | | | |
| Periods ended 12/31/14 | | 1-Year | | | Since Inception (4/1/13) | |
Average Annual Total Return | | | +3.75% | | | | +3.68% | |
*The Fund has an expense reduction contractually guaranteed through at least 4/30/15, a fee waiver related to the management fee paid by a Fund subsidiary, and a fee waiver associated with its investments in a Franklin Templeton money fund, contractually guaranteed through at least its current fiscal year-end. Fund investment results reflect the expense reduction and fee waivers, to the extent applicable; without these reductions, the results would have been lower.
Performance reflects the Fund’s Class 5 operating expenses, but does not include any contract fees, expenses or sales charges. If they had been included, performance would be lower. These charges and deductions, particularly for variable life policies, can have a significant effect on contract values and insurance benefits. See the contract prospectus for a complete description of these expenses, including sales charges.
Performance data represent past performance, which does not guarantee future results. Investment return and principal value will fluctuate, and you may have a gain or loss when you sell your shares. Current performance may differ from figures shown.
Total Return Index Comparison for a Hypothetical $10,000 Investment (4/1/13–12/31/14)
The graph below shows the change in value of a hypothetical $10,000 investment in the Fund over the indicated period and includes reinvestment of any income or distributions. The Fund’s performance* is compared to the performance of the MSCI All Country World Index (ACWI), the Citigroup World Government Bond Index (WGBI) and the Bloomberg Commodity Index. One cannot invest directly in an index, and an index is not representative of the Fund’s portfolio. Please see Important Notes to Performance Information preceding the Fund Summaries.
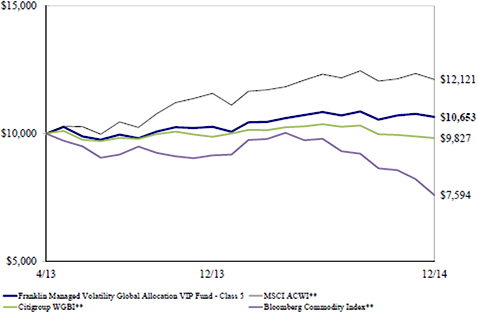
**Source: Morningstar. Please see Index Descriptions following the Fund Summaries.
FRANKLIN MANAGED VOLATILITY GLOBAL ALLOCATION VIP FUND
Class 5 Fund Expenses
As an investor in a variable insurance contract (Contract) that indirectly provides for investment in an underlying mutual fund, you can incur transaction and/or ongoing expenses at both the Fund level and the Contract level.
| • | | Transaction expenses can include sales charges (loads) on purchases, surrender fees, transfer fees and premium taxes. |
| • | | Ongoing expenses can include management fees, distribution and service (12b-1) fees, contract fees, annual maintenance fees, mortality and expense risk fees and other fees and expenses. All mutual funds and Contracts have some types of ongoing expenses. |
The expenses shown in the table are meant to highlight ongoing expenses at the Fund level only and do not include ongoing expenses at the Contract level, or transaction expenses at either the Fund or Contract levels. While the Fund does not have transaction expenses, if the transaction and ongoing expenses at the Contract level were included, the expenses shown below would be higher. You should consult your Contract prospectus or disclosure document for more information.
The table shows Fund-level ongoing expenses and can help you understand these expenses and compare them with those of other mutual funds offered through the Contract. The table assumes a $1,000 investment held for the six months indicated. Please refer to the Fund prospectus for additional information on operating expenses.
Actual Fund Expenses
The first line (Actual) of the table provides actual account values and expenses. The “Ending Account Value” is derived from the Fund’s actual return, which includes the effect of ongoing Fund expenses, but does not include the effect of ongoing Contract expenses.
You can estimate the Fund-level expenses you incurred during the period by following these steps. Of course, your account value and expenses will differ from those in this illustration:
| 1. | Divide your account value by $1,000. |
If an account had an $8,600 value, then
$8,600 ÷ $1,000 = 8.6.
| 2. | Multiply the result by the number under the heading “Fund-Level Expenses Incurred During Period.” |
If Fund-Level Expenses Incurred During Period were $7.50, then 8.6 × $7.50 = $64.50.
In this illustration, the estimated expenses incurred this period at the Fund level are $64.50.
FRANKLIN MANAGED VOLATILITY GLOBAL ALLOCATION VIP FUND
Hypothetical Example for Comparison with Other Mutual Funds
Information in the second line (Hypothetical) of the table can help you compare ongoing expenses of the Fund with those of other mutual funds offered through the Contract. This information may not be used to estimate the actual ending account balance or expenses you incurred during the period. The hypothetical “Ending Account Value” is based on the
Fund’s actual expense ratio and an assumed 5% annual rate of return before expenses, which does not represent the Fund’s actual return. The figure under the heading “Fund-Level Expenses Incurred During Period” shows the hypothetical expenses your account would have incurred under this scenario. You can compare this figure with the 5% hypothetical examples that appear in shareholder reports of other funds offered through a Contract.
| | | | | | | | | | | | |
| Class 5 | | Beginning Account
Value 7/1/14 | | | Ending Account
Value 12/31/14 | | | Expenses Paid During Period* 7/1/14–12/31/14 | |
Actual | | | $1,000 | | | | $ 982.40 | | | | $4.65 | |
Hypothetical (5% return before expenses) | | | $1,000 | | | | $1,020.52 | | | | $4.74 | |
*Expenses are calculated using the most recent six-month annualized expense ratio, net of expense waivers, for the Fund’s Class 5 shares (0.93%), which does not include any ongoing expenses of the Contract for which the Fund is an investment option, multiplied by the average account value over the period, multiplied by 184/365 to reflect the one-half year period.
FRANKLIN MANAGED VOLATILITY GLOBAL ALLOCATION VIP FUND
Fund Goals and Main Investments
The Fund seeks total return (including income and capital gains) while seeking to manage volatility.
Fund Risks
All investments involve risks, including possible loss of principal. There can be no guarantee that the Fund will achieve its target volatility. Also, the managed volatility strategy could negatively impact the Fund’s return and expose the Fund to additional costs. Generally, investors should be comfortable with fluctuation in the value of their investments, especially over the short term. Stock prices fluctuate, sometimes rapidly and dramatically, due to factors affecting individual companies, particular industries or sectors, or general market conditions. Bond prices generally move in the opposite direction of interest rates. Foreign investing carries additional risks such as currency and market volatility and political or social instability, which are heightened in developing countries. Derivatives, including currency management strategies, involve costs and can create economic leverage in the portfolio, which may result in significant volatility and cause the Fund to participate in losses on an amount that exceeds the Fund’s initial investment. The Fund may not achieve the anticipated benefits, and may realize losses when a counterparty fails to perform. Because the Fund allocates assets to a variety of investment strategies, ETFs and other mutual funds, which involve certain risks, it may be subject to those same risks. The Fund is actively managed but there is no guarantee that the manager’s investment decisions will produce the desired results. The Fund’s prospectus also includes a description of the main investment risks.
Performance Overview
You can find the Fund’s one-year total return in the Performance Summary. In comparison, the Fund’s benchmark generated a +1.53% total return for the same period.1 The benchmark is a combination of the MSCI ACWI, which measures stock performance in global developed and emerging markets; the Citigroup WGBI, which measures performance of investment-grade world government bonds; and the Bloomberg Commodity Index, which measures performance of exchange-traded futures contracts on physical commodities.2
Economic and Market Overview
The global economy grew moderately during the 12 months under review as U.S. economic growth expanded while growth rates in much of the rest of the world declined. As measured by the MSCI World Index, stocks in global developed markets advanced overall during the 12-month period amid a generally accommodative monetary policy environment and continued strength in corporate earnings.3 Oil prices declined sharply during the 12-month period, resulting from weak global demand growth and strong world supply, and gold prices ended lower amid benign global inflation and a strong U.S. dollar.
U.S. economic growth trends were generally encouraging during the period. Economic activity expanded for most of 2014, supported in some quarters by increased consumer spending, business investment and federal defense spending. The U.S. Federal Reserve Board (Fed) began
1. Source: Morningstar.
One cannot invest directly in an index, and an index is not representative of the Fund’s portfolio. Please see Index Descriptions following the Fund Summaries.
2. The Fund’s benchmark is currently weighted 55% for the MSCI ACWI, 40% for the Citigroup WGBI and 5% for the Bloomberg Commodity Index, rebalanced monthly. For the 12-month period ended 12/31/14, the MSCI ACWI had a +4.71% total return, the Citigroup WGBI had a -0.48% total return, and the Bloomberg Commodity Index had a -17.01% total return.
3. Please see Index Descriptions following the Fund Summaries.
FRANKLIN MANAGED VOLATILITY GLOBAL ALLOCATION VIP FUND
reducing its large-scale bond purchases $10 billion a month in January and ended the buying program in October. But it continued its practice of maintaining holdings of longer term securities at sizable levels. The Fed believed underlying economic strength could support ongoing progress in labor market conditions. Toward period-end, the Fed stated that it could be patient with regard to raising interest rates and that the interest rate might not rise for at least a couple of meetings, possibly implying at least the first two meetings of 2015.
Outside the U.S., the U.K. economy grew relatively well, supported by the services and manufacturing sectors. In the eurozone, economic growth remained subdued, as concerns persisted about the potential negative impacts to growth from the crisis in Ukraine and China’s moderating growth rate. However, third-quarter economic growth, though meager, exceeded expectations, especially in the region’s major economies of Germany and France. In June, the European Central Bank (ECB) reduced its main interest rate and, for the first time, set a negative deposit rate; the ECB reduced both rates again in September. The ECB broadened its monetary easing stance by implementing an asset purchase program to prevent deflation and stimulate the economy. Toward period-end, the ECB cut its 2014 growth forecast for the eurozone and attributed the reduction to geopolitical risks dampening confidence and private investment.
Japan’s second- and third-quarter economic contractions indicated the economy was in a recession. However, private consumption and exports improved in the third quarter. In October, the Bank of Japan expanded its stimulus measures amid weak domestic demand and as substantially lower crude oil prices exerted further downward pressure on inflation. Toward period-end, Japan’s ruling coalition was reelected in early parliamentary elections and subsequently announced a fresh stimulus package aimed at reviving economic growth.
In several emerging markets, economic growth generally moderated. However, Brazil exited recession as government spending prior to a presidential election drove third-quarter economic growth. Emerging market equities, as measured by the MSCI Emerging Markets Index, fell for the 12-month period, amid headwinds such as soft domestic demand and weak exports in several countries.3 Falling crude oil prices and geopolitical
tensions in certain regions, as well as concerns about the timing of U.S. interest rate increases, also pressured emerging market equities. Many emerging market currencies depreciated against the U.S. dollar, leading central banks in several countries to raise interest rates in an effort to curb inflation and support their currencies. Several other central banks lowered interest rates to promote economic growth. After implementing monetary stimulus measures to support specific sectors, China’s central bank increased its efforts to bolster the economy by cutting its benchmark interest rates for the first time since July 2012. In contrast, Russia’s central bank raised its key interest rate sharply toward period-end to limit further devaluation of the Russian ruble and contain rising inflation.
Investment Strategy
Under normal market conditions, the Fund seeks to achieve its investment goal by using an asset allocation strategy that seeks to diversify the Fund’s portfolio across global asset classes (principally global equity and global fixed income securities), regions and sectors while seeking to limit the expected volatility of the Fund’s returns to about 10% or less per year. Currently, the Fund intends to seek a target volatility of 9% or less per year (“Target Volatility”). This strategy may result in the Fund outperforming the general securities market during periods of flat or
FRANKLIN MANAGED VOLATILITY GLOBAL ALLOCATION VIP FUND
negative market performance, and underperforming the general securities market during periods of positive market performance. There is no guarantee that the Fund will achieve its Target Volatility.
Manager’s Discussion
Tactical Hedging
For much of the year, volatility remained relatively subdued. However, two events led volatility to surge in the fourth quarter, first in early October and again in mid-December. In both cases, driven by rising forward-looking risk estimates of expected volatility, we tactically hedged, seeking to reduce the Fund’s global equity exposure. Once our risk estimates reverted toward long-term levels in developed markets, we removed the hedges. Hedging effectively reduced the Fund’s expected risk estimates in both cases. Markets continued to weaken in October, and the decision to hedge contributed to performance relative to the benchmark index. However, in December, risk assets rallied, and the hedge detracted slightly from relative performance. Overall, tactical decisions regarding hedging effectively lowered volatility while also contributing to the Fund’s return.
Developed Low Volatility Equities
Gradual improvement in economic conditions and the Fed’s continued support in the form of holding longer term securities and maintaining a low benchmark interest rate helped U.S. stocks perform well over the period. Meanwhile, concerns about slowing growth and deflation weighed on European markets. The exposure to low volatility strategies, achieved through exchange-traded funds, effectively reduced Fund volatility, as indicated by the relatively low standard deviation of the Fund’s daily returns, a measure of volatility. Furthermore, for both the U.S. and European markets, the low volatility strategies outperformed the broad equity market. Please keep in mind that although the Fund has a passive exposure to certain low-volatility stocks through the Fund’s allocation process, stock investments are employed to gain country or sector exposure and are based on expectations of low volatility, not capital appreciation.
Emerging Equities
Our outlook for emerging market equities remained subdued for much of the year, based on expectations for slow global growth, weakness in commodity markets and a concern that any move by the Fed to reduce monetary support could spur outflows for many emerging markets. We maintained an underweighting in emerging market equities throughout much of the year, as we sought to limit what we viewed as a potential source of volatility. This decision added value as emerging market stocks struggled and finished the year in negative territory. Country allocations were slight detractors from Fund performance, including an overweighting in Russia and an underweighting in Taiwan.
Fixed Income
Country selection added to results, driven by an overweighting in Australia and underweightings in Germany and Japan. Security selection in many markets also benefited returns, notably Italy, Australia and Poland. Furthermore, the decision to hedge a significant portion of certain securities’ currency exposures, especially against the euro and Australian dollar, contributed to performance as the U.S. dollar strengthened relative to these currencies.
FRANKLIN MANAGED VOLATILITY GLOBAL ALLOCATION VIP FUND
Commodities
We maintained a small underweighting to commodities relative to the blended benchmark throughout the year. This was primarily due to our outlook for slower global growth, which we believed would weigh on demand in this sector, as well as our expectations for a stronger U.S. dollar. This contributed to results as commodity prices experienced significant weakness for much of the year.
| | | | |
| Portfolio Breakdown* | |
| 12/31/14 | |
| | | % of Total
Net Assets | |
| Exchange Traded Funds | | | 55.0 | % |
Domestic Equity | | | 32.4 | % |
Foreign Equity | | | 22.6 | % |
| Bonds | | | 35.5 | % |
Foreign Government & Agency Securities | | | 25.7 | % |
U.S. Government & Agency Securities | | | 9.8 | % |
Stocks** | | | 4.8 | % |
Banks | | | 0.9 | % |
Automobiles & Components | | | 0.6 | % |
Food, Beverage & Tobacco | | | 0.5 | % |
Software & Services | | | 0.5 | % |
Consumer Durables & Apparel | | | 0.4 | % |
Transportation | | | 0.4 | % |
Energy | | | 0.3 | % |
Materials | | | 0.2 | % |
Telecommunication Services | | | 0.2 | % |
Semiconductors & Semiconductor Equipment | | | 0.1 | % |
Household & Personal Products | | | 0.1 | % |
Food & Staples Retailing | | | 0.1 | % |
Insurance | | | 0.1 | % |
Media | | | 0.1 | % |
Consumer Services | | | 0.1 | % |
Real Estate | | | 0.1 | % |
Diversified Financials | | | 0.1 | % |
| Commodities | | | 3.5 | % |
Exchange Traded Notes | | | 3.5 | % |
| Short-Term Investments & Other Net Assets | | | 1.2 | % |
*Portfolio Breakdown figures are stated as a percentage of total and may not equal 100% or may be negative due to rounding, use of any derivatives, unsettled trades or other factors.
**Includes common and preferred shares.
The dollar value, number of shares or principal amount, and names of all portfolio holdings are listed in the Fund’s Consolidated Statement of Investments.
Thank you for your participation in Franklin Managed Volatility Global Allocation VIP Fund. We look forward to serving your future investment needs.
FRANKLIN MANAGED VOLATILITY GLOBAL ALLOCATION VIP FUND
The foregoing information reflects our analysis, opinions and portfolio holdings as of June 30, 2014, the end of the reporting period. The way we implement our main investment strategies and the resulting portfolio holdings may change depending on factors such as market and economic conditions. These opinions may not be relied upon as investment advice or an offer for a particular security. The information is not
a complete analysis of every aspect of any market, country, industry, security or the Fund. Statements of fact are from sources considered reliable, but the investment manager makes no representation or warranty as to their completeness or accuracy. Although historical performance is no guarantee of future results, these insights may help you understand our investment management philosophy.
Board Members and Officers
The name, year of birth and address of the officers and board members, as well as their affiliations, positions held with the Trust, principal occupation during at least the past five years and number of portfolios overseen in the Franklin Templeton Investments fund complex are shown below. Generally, each board member serves until that person’s successor is elected and qualified.
Independent Board Members
| | | | | | | | |
Name, Year of Birth
and Address | | Position | | Length of Time
Served | | Number of Portfolios in
Fund Complex Overseen
by Board Member* | | Other Directorships Held During
at Least the Past 5 Years |
| | | | |
Harris J. Ashton (1932)
One Franklin Parkway
San Mateo, CA 94403-1906 | | Trustee | | Since 1988 | | 137 | | Bar-S Foods (meat packing company) (1981-2010). |
|
| Principal Occupation During at Least the Past 5 Years: |
| Director of various companies; and formerly, Director, RBC Holdings, Inc. (bank holding company) (until 2002); and President, Chief Executive Officer and Chairman of the Board, General Host Corporation (nursery and craft centers) (until 1998). |
| | | | |
Mary C. Choksi (1950)
One Franklin Parkway
San Mateo, CA 94403-1906 | | Trustee | | Since October 2014 | | 111 | | Avis Budget Group Inc. (car rental), Omnicom Group Inc. (advertising and marketing communications services) and H.J. Heinz Company (processed foods and allied products) (1998-2006). |
|
Principal Occupation During at Least the Past 5 Years: |
Founding Partner and Senior Managing Director, Strategic Investment Group (investment management group) (1987-present); director of various companies; and formerly, Founding Partner and Managing Director, Emerging Markets Management LLC (investment management firm) (1987-2011); Loan Officer/Senior Loan Officer/Senior Pension Investment Officer, World Bank Group (international financial institution) (1977-1987). |
| | | | |
Sam Ginn (1937)
One Franklin Parkway
San Mateo, CA 94403-1906 | | Trustee | | Since 2007 | | 111 | | ICO Global Communications (Holdings) Limited (satellite company) (2006-2010), Chevron Corporation (global energy company) (1989-2009), Hewlett-Packard Company (technology company) (1996-2002), Safeway, Inc. (grocery retailer) (1991-1998) and TransAmerica Corporation (insurance company) (1989-1999). |
|
| Principal Occupation During at Least the Past 5 Years: |
| Private investor; and formerly, Chairman, First Responder Network Authority (FirstNet) (interoperable wireless broadband network) (2012-2014); Chairman of the Board, Vodafone AirTouch, PLC (wireless company) (1999-2000); Chairman of the Board and Chief Executive Officer, AirTouch Communications (cellular communications) (1993-1998) and Pacific Telesis Group (telephone holding company) (1988-1994). |
| | | | |
Edith E. Holiday (1952)
One Franklin Parkway
San Mateo, CA 94403-1906 | | Trustee | | Since 2005 | | 137 | | Hess Corporation (exploration and refining of oil and gas), H.J. Heinz Company (processed foods and allied products) (1994-2013), RTI International Metals, Inc. (manufacture and distribution of titanium), Canadian National Railway (railroad) and White Mountains Insurance Group, Ltd. (holding company). |
|
| Principal Occupation During at Least the Past 5 Years: |
| Director or Trustee of various companies and trusts; and formerly, Assistant to the President of the United States and Secretary of the Cabinet (1990-1993); General Counsel to the United States Treasury Department (1989-1990); and Counselor to the Secretary and Assistant Secretary for Public Affairs and Public Liaison-United States Treasury Department (1988-1989). |
Independent Board Members (continued)
| | | | | | | | |
Name, Year of Birth
and Address | | Position | | Length of
Time Served | | Number of Portfolios in
Fund Complex Overseen
by Board Member* | | Other Directorships Held During
at Least the Past 5 Years |
| | | | |
J. Michael Luttig (1954)
One Franklin Parkway
San Mateo, CA 94403-1906 | | Trustee | | Since 2009 | | 137 | | Boeing Capital Corporation (aircraft financing) (2006-2013). |
|
Principal Occupation During at Least the Past 5 Years: |
| Executive Vice President, General Counsel and member of the Executive Council, The Boeing Company (aerospace company); and formerly, Federal Appeals Court Judge, U.S. Court of Appeals for the Fourth Circuit (1991-2006). |
| | | | |
Frank A. Olson (1932)
One Franklin Parkway
San Mateo, CA 94403-1906 | | Trustee | | Since 2005 | | 137 | | Hess Corporation (exploration and refining of oil and gas) (1998-2013). |
|
| Principal Occupation During at Least the Past 5 Years: |
| Director of various companies; and formerly, Chairman of the Board, The Hertz Corporation (car rental) (1980-2000) and Chief Executive Officer (1977-1999); and Chairman of the Board, President and Chief Executive Officer, UAL Corporation (airlines) (June-December 1987). |
| | | | |
Larry D. Thompson (1945)
One Franklin Parkway
San Mateo, CA 94403-1906 | | Trustee | | Since 2007 | | 137 | | Cbeyond, Inc. (business communications provider) (2010-2012), The Southern Company (energy company) (December 2014; previously 2010-2012) and Graham Holdings Company (education and media organization) (2011-present). |
|
Principal Occupation During at Least the Past 5 Years: |
Executive Vice President – Government Affairs, General Counsel and Corporate Secretary, PepsiCo, Inc. (consumer products) (2012-present); and formerly, John A. Sibley Professor of Corporate and Business Law, University of Georgia School of Law (2011-2012); Senior Vice President – Government Affairs, General Counsel and Secretary, PepsiCo, Inc. (2004-2011); Senior Fellow of The Brookings Institution (2003-2004); Visiting Professor, University of Georgia School of Law (2004); and Deputy Attorney General, U.S. Department of Justice (2001-2003). |
| | | | |
John B. Wilson (1959)
One Franklin Parkway
San Mateo, CA 94403-1906 | | Lead Independent Trustee | | Trustee since 2007 and Lead Independent Trustee since 2008 | | 111 | | None |
|
| Principal Occupation During at Least the Past 5 Years: |
| President, Staples Europe (office supplies) (2012-present); President and Founder, Hyannis Port Capital, Inc. (real estate and private equity investing); serves on private and non-profit boards; and formerly, Chief Operating Officer and Executive Vice President, Gap, Inc. (retail) (1996-2000); Chief Financial Officer and Executive Vice President – Finance and Strategy, Staples, Inc. (1992-1996); Senior Vice President –Corporate Planning, Northwest Airlines, Inc. (airlines) (1990-1992); and Vice President and Partner, Bain & Company (consulting firm) (1986-1990). |
Interested Board Members and Officers
| | | | | | | | |
Name, Year of Birth
and Address | | Position | | Length of
Time Served | | Number of Portfolios in
Fund Complex Overseen
by Board Member* | | Other Directorships Held During
at Least the Past 5 Years |
| | | | |
**Gregory E. Johnson (1961)
One Franklin Parkway
San Mateo, CA 94403-1906 | | Trustee | | Since 2013 | | 147 | | None |
|
| Principal Occupation During at Least the Past 5 Years: |
| Chairman of the Board, Member – Office of the Chairman, Director, President and Chief Executive Officer, Franklin Resources, Inc.; officer and/or director or trustee, as the case may be, of some of the other subsidiaries of Franklin Resources, Inc. and of 44 of the investment companies in Franklin Templeton Investments; and Vice Chairman, Investment Company Institute. |
| | | | |
**Rupert H. Johnson, Jr. (1940)
One Franklin Parkway
San Mateo, CA 94403-1906 | | Chairman of the Board and Trustee | | Chairman of the Board since 2013 and Trustee since 1988 | | 137 | | None |
|
| Principal Occupation During at Least the Past 5 Years: |
| Vice Chairman, Member – Office of the Chairman and Director, Franklin Resources, Inc.; Director, Franklin Advisers, Inc.; Senior Vice President, Franklin Advisory Services, LLC; and officer and/or director or trustee, as the case may be, of some of the other subsidiaries of Franklin Resources, Inc. and of 41 of the investment companies in Franklin Templeton Investments. |
| | | | |
Alison E. Baur (1964)
One Franklin Parkway
San Mateo, CA 94403-1906 | | Vice President | | Since 2012 | | Not Applicable | | Not Applicable |
|
| Principal Occupation During at Least the Past 5 Years: |
| Deputy General Counsel, Franklin Templeton Investments; and officer of some of the other subsidiaries of Franklin Resources, Inc. and of 46 of the investment companies in Franklin Templeton Investments. |
| | | | |
Laura F. Fergerson (1962)
One Franklin Parkway
San Mateo, CA 94403-1906 | | Chief Executive Officer – Finance and Administration | | Since 2009 | | Not Applicable | | Not Applicable |
|
| Principal Occupation During at Least the Past 5 Years: |
| Senior Vice President, Franklin Templeton Services, LLC; and officer of 46 of the investment companies in Franklin Templeton Investments. |
| | | | |
Gaston Gardey (1967)
One Franklin Parkway
San Mateo, CA 94403-1906 | | Treasurer, Chief Financial Officer and Chief Accounting Officer | | Since 2009 | | Not Applicable | | Not Applicable |
|
| Principal Occupation During at Least the Past 5 Years: |
| Director, Fund Accounting, Franklin Templeton Investments; and officer of 27 of the investment companies in Franklin Templeton Investments. |
| | | | |
Aliya S. Gordon (1973)
One Franklin Parkway
San Mateo, CA 94403-1906 | | Vice President | | Since 2009 | | Not Applicable | | Not Applicable |
|
| Principal Occupation During at Least the Past 5 Years: |
| Senior Associate General Counsel, Franklin Templeton Investments; officer of 46 of the investment companies in Franklin Templeton Investments; and formerly, Litigation Associate, Steefel, Levitt & Weiss, LLP (2000-2004). |
Interested Board Members and Officers (continued)
| | | | | | | | |
Name, Year of Birth
and Address | | Position | | Length of Time
Served | | Number of Portfolios in
Fund Complex Overseen
by Board Member* | | Other Directorships Held During
at Least the Past 5 Years |
| | | | |
Steven J. Gray (1955)
One Franklin Parkway
San Mateo, CA 94403-1906 | | Vice President | | Since 2009 | | Not Applicable | | Not Applicable |
|
| Principal Occupation During at Least the Past 5 Years: |
| Senior Associate General Counsel, Franklin Templeton Investments; Vice President, Franklin Templeton Distributors, Inc. and Franklin Alternative Strategies Advisers, LLC; and officer of 46 of the investment companies in Franklin Templeton Investments. |
| | | | |
Selena L. Holmes (1965)
100 Fountain Parkway
St. Petersburg, FL 33716-1205 | | Vice President – AML Compliance | | Since 2012 | | Not Applicable | | Not Applicable |
|
| Principal Occupation During at Least the Past 5 Years: |
| Director, Global Compliance Monitoring; Chief Compliance Officer, Franklin Alternative Strategies Advisers, LLC; Vice President, Franklin Templeton Companies, LLC; and officer of 46 of the investment companies in Franklin Templeton Investments. |
| | | | |
Edward B. Jamieson (1948)
One Franklin Parkway
San Mateo, CA 94403-1906 | | President and Chief Executive Officer – Investment Management | | Since 2010 | | Not Applicable | | Not Applicable |
|
| Principal Occupation During at Least the Past 5 Years: |
| President, Chief Investment Officer and Director, Franklin Advisers, Inc.; Executive Vice President, Franklin Templeton Institutional, LLC; and officer and/or trustee, as the case may be, of some of the other subsidiaries of Franklin Resources, Inc. and of 10 of the investment companies in Franklin Templeton Investments. |
| | | | |
Kimberly H. Novotny (1972)
300 S.E. 2nd Street
Fort Lauderdale, FL 33301-1923 | | Vice President | | Since 2013 | | Not Applicable | | Not Applicable |
|
| Principal Occupation During at Least the Past 5 Years: |
| Associate General Counsel, Franklin Templeton Investments; Vice President and Secretary, Fiduciary Trust International of the South; Vice President, Templeton Investment Counsel, LLC; Assistant Secretary, Franklin Resources, Inc.; and officer of 46 of the investment companies in Franklin Templeton Investments. |
| | | | |
Robert C. Rosselot (1960)
300 S.E. 2nd Street
Fort Lauderdale, FL 33301-1923 | | Chief Compliance Officer | | Since 2013 | | Not Applicable | | Not Applicable |
|
| Principal Occupation During at Least the Past 5 Years: |
| Director, Global Compliance, Franklin Templeton Investments; Vice President, Franklin Templeton Companies, LLC; officer of 46 of the investment companies in Franklin Templeton Investments; and formerly, Senior Associate General Counsel, Franklin Templeton Investments (2007-2013); and Secretary and Vice President, Templeton Group of Funds (2004-2013). |
| | | | |
Karen L. Skidmore (1952)
One Franklin Parkway
San Mateo, CA 94403-1906 | | Vice President and Secretary | | Since 2006 | | Not Applicable | | Not Applicable |
|
| Principal Occupation During at Least the Past 5 Years: |
| Senior Associate General Counsel, Franklin Templeton Investments; and officer of 46 of the investment companies in Franklin Templeton Investments. |
Interested Board Members and Officers (continued)
| | | | | | | | |
Name, Year of Birth
and Address | | Position | | Length of
Time Served | | Number of Portfolios in
Fund Complex Overseen
by Board Member* | | Other Directorships Held During
at Least the Past 5 Years |
| | | | |
Craig S. Tyle (1960)
One Franklin Parkway
San Mateo, CA 94403-1906 | | Vice President | | Since 2005 | | Not Applicable | | Not Applicable |
|
| Principal Occupation During at Least the Past 5 Years: |
| General Counsel and Executive Vice President, Franklin Resources, Inc.; and officer of some of the other subsidiaries of Franklin Resources, Inc. and of 46 of the investment companies in Franklin Templeton Investments. |
| | | | |
Lori A. Weber (1964)
300 S.E. 2nd Street
Fort Lauderdale, FL 33301-1923 | | Vice President | | Since 2011 | | Not Applicable | | Not Applicable |
|
| Principal Occupation During at Least the Past 5 Years: |
| Senior Associate General Counsel, Franklin Templeton Investments; Assistant Secretary, Franklin Resources, Inc.; Vice President and Secretary, Templeton Investment Counsel, LLC; Vice President, Fiduciary Trust International of the South; and officer of 46 of the investment companies in Franklin Templeton Investments. |
*We base the number of portfolios on each separate series of the U.S. registered investment companies within the Franklin Templeton Investments fund complex. These portfolios have a common investment manager or affiliated investment managers.
**Gregory E. Johnson is considered to be an interested person of the Fund under the federal securities laws due to his position as an officer and director of Franklin Resources, Inc. (Resources), which is the parent company of the Fund’s investment manager and distributor. Rupert H. Johnson, Jr. is considered to be an interested person of the Fund under the federal securities laws due to his position as officer and director and major shareholder of Resources.
Note 1: Rupert H. Johnson, Jr. is the uncle of Gregory E. Johnson.
Note 2: Officer information is current as of the date of this report. It is possible that after this date, information about officers may change.
The Sarbanes-Oxley Act of 2002 and Rules adopted by the Securities and Exchange Commission require the Fund to disclose whether the Fund’s Audit Committee includes at least one member who is an audit committee financial expert within the meaning of such Act and Rules. The Fund’s Board has determined that there is at least one such financial expert on the Audit Committee and has designated John B. Wilson as its audit committee financial expert. The Board believes that Mr. Wilson qualifies as such an expert in view of his extensive business background and experience, including service as chief financial officer of Staples, Inc. from 1992 to 1996. Mr. Wilson has been a Member and Chairman of the Fund’s Audit Committee since 2007. As a result of such background and experience, the Board believes that Mr. Wilson has acquired an understanding of generally accepted accounting principles and financial statements, the general application of such principles in connection with the accounting estimates, accruals and reserves, and analyzing and evaluating financial statements that present a breadth and level of complexity of accounting issues generally comparable to those of the Fund, as well as an understanding of internal controls and procedures for financial reporting and an understanding of audit committee functions. Mr. Wilson is an independent Board member as that term is defined under the relevant Securities and Exchange Commission Rules and Releases.
The Statement of Additional Information (SAI) includes additional information about the board members and is available, without charge, upon request. Shareholders may call (800) 321-8563 or their insurance companies to request the SAI.
FRANKLIN TEMPLETON VARIABLE INSURANCE PRODUCTS TRUST
Index Descriptions
The indexes are unmanaged and include reinvested distributions.
See www.franklintempletondatasources.com for additional data provider information.
Bloomberg Commodity Index consists of exchanged-traded futures on physical commodities weighted to account for economic significance and market liquidity. Prior to 7/1/14, the index was known as the Dow-Jones UBS Commodity Index.
Citigroup World Government Bond Index is a market capitalization-weighted index consisting of investment-grade world government bond markets.
MSCI All Country World Index (ACWI) is a free float-adjusted, market capitalization-weighted index designed to measure equity market performance in global developed and emerging markets.
MSCI Emerging Markets (EM) Index is a free float-adjusted, market capitalization-weighted index designed to measure equity market performance in global emerging markets.
MSCI World Index is a free float-adjusted, market capitalization-weighted index designed to measure equity market performance in global developed markets.
FRANKLIN TEMPLETON VARIABLE INSURANCE PRODUCTS TRUST
Shareholder Information
Proxy Voting Policies and Procedures
The Trust’s investment manager has established Proxy Voting Policies and Procedures (Policies) that the Trust uses to determine how to vote proxies relating to portfolio securities. Shareholders may view the Trust’s complete Policies online at franklintempleton.com. Alternatively, shareholders may request copies of the Policies free of charge by calling the Proxy Group collect at (954) 527-7678 or by sending a written request to: Franklin Templeton Companies, LLC, 300 S.E. 2nd Street, Fort Lauderdale, FL 33301, Attention: Proxy Group. Copies of the Trust’s proxy voting records are also made available online at franklintempleton.com and posted on the U.S. Securities and Exchange Commission’s website at sec.gov and reflect the most recent 12-month period ended June 30.
Quarterly Statement of Investments
The Trust files a complete statement of investments with the U.S. Securities and Exchange Commission for the first and third quarters for each fiscal year on Form N-Q. Shareholders may view the filed Form N-Q by visiting the Commission’s website at sec.gov. The filed form may also be viewed and copied at the Commission’s Public Reference Room in Washington, DC. Information regarding the operations of the Public Reference Room may be obtained by calling (800) SEC-0330.
FMV P2 P5 01/15
SUPPLEMENT DATED JANUARY 30, 2015
TOTHE PROSPECTUS DATED MAY 1, 2014
OF
FRANKLIN MANAGED VOLATILITY GLOBAL ALLOCATION VIP FUND
(A series of Franklin Templeton Variable Insurance Products Trust)
The Prospectus is amended as follows:
I. The “Fund Details – Management – Manager of Managers Structure” section on page FMV-D13 of the prospectuses for Class 2 and Class 5 shares is replaced with the following:
Manager of Managers Structure
Alternative Strategies and the Trust have received an exemptive order from the SEC that allows the Fund to operate in a “manager of managers” structure whereby Alternative Strategies, as the Fund’s investment manager, can appoint and replace both wholly-owned and unaffiliated sub-advisors, and enter into, amend and terminate sub-advisory agreements with such sub-advisors, each subject to board approval but without obtaining prior shareholder approval (the “Manager of Managers Structure”). The Fund will, however, inform shareholders of the hiring of any new sub-advisor within 90 days after the hiring. The SEC exemptive order provides the Fund with greater efficiency and without incurring the expense and delays associated with obtaining shareholder approval of sub-advisory agreements with such sub-advisors.
The use of the Manager of Managers Structure with respect to the Fund is subject to certain conditions that are set forth in the SEC exemptive order. Under the Manager of Managers Structure, Alternative Strategies has the ultimate responsibility, subject to oversight by the Fund’s board of trustees, to oversee sub-advisors and recommend their hiring, termination and replacement. Alternative Strategies will also, subject to the review and approval of the Fund’s board of trustees: set the Fund’s overall investment strategy; evaluate, select and recommend sub-advisors to manage all or a portion of the Fund’s assets; and implement procedures reasonably designed to ensure that each sub-advisor complies with the Fund’s investment goal, policies and restrictions. Subject to review by the Fund’s board of trustees, Alternative Strategies will allocate and, when appropriate, reallocate the Fund’s assets among sub-advisors and monitor and evaluate the sub-advisors’ performance.
Please keep this supplement for future reference.
FRANKLIN TEMPLETON VARIABLE INSURANCE PRODUCTS TRUST
Consolidated Financial Highlights
Franklin Managed Volatility Global Allocation VIP Fund
| | | | | | | | |
| | | Year Ended December 31, | |
| | | 2014 | | | 2013a | |
| Class 2 | | | | | | | | |
Per share operating performance
(for a share outstanding throughout the year) | | | | | | | | |
| | |
Net asset value, beginning of year | | | $10.07 | | | | $10.00 | |
| | | | |
| | |
| Income from investment operationsb: | | | | | | | | |
| | |
Net investment incomec | | | 0.11 | | | | 0.09 | |
| | |
Net realized and unrealized gains (losses) | | | 0.25 | | | | 0.17 | |
| | | | |
Total from investment operations | | | 0.36 | | | | 0.26 | |
| | | | |
| | |
| Less distributions from: | | | | | | | | |
| | |
Net investment income and net foreign currency gains | | | (0.23 | ) | | | (0.19 | ) |
| | |
Net realized gains | | | (— | )d | | | — | |
| | | | |
Total distributions | | | (0.23 | ) | | | (0.19 | ) |
| | | | |
Net asset value, end of year | | | $10.20 | | | | $10.07 | |
| | | | |
| | |
Total returne | | | 3.60% | | | | 2.56% | |
| | |
| Ratios to average net assetsf | | | | | | | | |
| | |
Expenses before waiver and payments by affiliatesg | | | 1.97% | | | | 2.97% | |
| | |
Expenses net of waiver and payments by affiliatesg,h | | | 1.08% | | | | 1.08% | |
| | |
Net investment income | | | 1.07% | | | | 1.21% | |
| | |
| Supplemental data | | | | | | | | |
| | |
Net assets, end of year (000’s) | | | $10,201 | | | | $10,065 | |
| | |
Portfolio turnover rate | | | 22.04% | | | | 8.12% | |
aFor the period April 1, 2013 (commencement of operations) to December 31, 2013.
bThe amount shown for a share outstanding throughout the period may not correlate with the Statement of Operations for the period due to the timing of sales and repurchases of the Fund shares in relation to income earned and/or fluctuating fair value of the investments of the Fund.
cBased on average daily shares outstanding.
dAmount rounds to less than $0.01 per share.
eTotal return does not include fees, charges or expenses imposed by the variable annuity and life insurance contracts for which the Franklin Templeton Variable Insurance Products Trust serves as an underlying investment vehicle. Total return is not annualized for periods less than one year.
fRatios are annualized for periods less than one year.
gDoes not include expenses of the exchange traded funds in which the Fund invests. The weighted average indirect expenses of the exchange traded funds was 0.09% for the year ended December 31, 2014.
hBenefit of expense reduction rounds to less than 0.01%.
| | | | | | |
| | | The accompanying notes are an integral part of these financial statements. | Annual Report | | | FMV-21 | |
FRANKLIN TEMPLETON VARIABLE INSURANCE PRODUCTS TRUST
Franklin Managed Volatility Global Allocation VIP Fund (continued)
| | | | | | | | |
| | | Year Ended December 31, | |
| | | 2014 | | | 2013a | |
| Class 5 | | | | | | | | |
Per share operating performance
(for a share outstanding throughout the year) | | | | | | | | |
| | |
Net asset value, beginning of year | | | $10.07 | | | | $10.00 | |
| | | | |
| | |
| Income from investment operationsb : | | | | | | | | |
| | |
Net investment incomec | | | 0.13 | | | | 0.10 | |
| | |
Net realized and unrealized gains (losses) | | | 0.25 | | | | 0.17 | |
| | | | |
Total from investment operations | | | 0.38 | | | | 0.27 | |
| | | | |
| | |
| Less distributions from: | | | | | | | | |
| | |
Net investment income and net foreign currency gains | | | (0.25 | ) | | | (0.20 | ) |
| | |
Net realized gains | | | (— | )d | | | — | |
| | | | |
Total distributions | | | (0.25 | ) | | | (0.20 | ) |
| | | | |
Net asset value, end of year | | | $10.20 | | | | $10.07 | |
| | | | |
| | |
Total returne | | | 3.75% | | | | 2.68% | |
| | |
| Ratios to average net assetsf | | | | | | | | |
| | |
Expenses before waiver and payments by affiliatesg | | | 1.82% | | | | 2.82% | |
| | |
Expenses net of waiver and payments by affiliatesg,h | | | 0.93% | | | | 0.93% | |
| | |
Net investment income | | | 1.22% | | | | 1.36% | |
| | |
| Supplemental data | | | | | | | | |
| | |
Net assets, end of year (000’s) | | | $10,201 | | | | $10,065 | |
| | |
Portfolio turnover rate | | | 22.04% | | | | 8.12% | |
aFor the period April 1, 2013 (commencement of operations) to December 31, 2013.
bThe amount shown for a share outstanding throughout the period may not correlate with the Statement of Operations for the period due to the timing of sales and repurchases of the Fund shares in relation to income earned and/or fluctuating fair value of the investments of the Fund.
cBased on average daily shares outstanding.
dAmount rounds to less than $0.01 per share.
eTotal return does not include fees, charges or expenses imposed by the variable annuity and life insurance contracts for which the Franklin Templeton Variable Insurance Products Trust serves as an underlying investment vehicle. Total return is not annualized for periods less than one year.
fRatios are annualized for periods less than one year.
gDoes not include expenses of the exchange traded funds in which the Fund invests. The weighted average indirect expenses of the exchange traded funds was 0.09% for the year ended December 31, 2014.
hBenefit of expense reduction rounds to less than 0.01%.
| | | | | | |
| | FMV-22 | | | Annual Report | The accompanying notes are an integral part of these financial statements. | | |
FRANKLIN TEMPLETON VARIABLE INSURANCE PRODUCTS TRUST
Consolidated Statement of Investments, December 31, 2014
| | | | | | | | | | | | | | |
| Franklin Managed Volatility Global Allocation VIP Fund | | | | |
| | | | | Country | | | Shares/Units | | | Value | |
| | | | | | | | | | | | | | |
| | Common Stocks 4.4% | | | | | | | | | | | | |
| | Automobiles & Components 0.6% | | | | | | | | | | | | |
| | Astra International Tbk PT | | | Indonesia | | | | 74,000 | | | $ | 44,364 | |
| | Brilliance China Automotive Holdings Ltd. | | | China | | | | 52,000 | | | | 83,158 | |
| | | | | | | | | | | | | | |
| | | | | | | | | | | | | 127,522 | |
| | | | | | | | | | | | | | |
| | Banks 0.7% | | | | | | | | | | | | |
| | Akbank TAS | | | Turkey | | | | 2,000 | | | | 7,422 | |
| | Bank Danamon Indonesia Tbk PT | | | Indonesia | | | | 14,000 | | | | 5,115 | |
| | China Construction Bank Corp., H | | | China | | | | 24,000 | | | | 19,654 | |
| | ICICI Bank Ltd., ADR | | | India | | | | 7,500 | | | | 86,625 | |
| | Kasikornbank PCL, fgn. | | | Thailand | | | | 1,700 | | | | 11,840 | |
| a | | National Bank of Greece SA | | | Greece | | | | 1,940 | | | | 3,451 | |
| | | | | | | | | | | | | | |
| | | | | | | | | | | | | 134,107 | |
| | | | | | | | | | | | | | |
| | Capital Goods 0.0%† | | | | | | | | | | | | |
| | Hyundai Development Co. | | | South Korea | | | | 220 | | | | 7,784 | |
| | | | | | | | | | | | | | |
| | Consumer Durables & Apparel 0.4% | | | | | | | | | | | | |
| | Compagnie Financiere Richemont SA | | | Switzerland | | | | 55 | | | | 4,913 | |
| | Fila Korea Ltd. | | | South Korea | | | | 480 | | | | 48,932 | |
| | LF Corp. | | | South Korea | | | | 1,087 | | | | 29,715 | |
| | | | | | | | | | | | | | |
| | | | | | | | | | | | | 83,560 | |
| | | | | | | | | | | | | | |
| | Consumer Services 0.1% | | | | | | | | | | | | |
| a | | Bloomberry Resorts Corp. | | | Philippines | | | | 35,300 | | | | 9,774 | |
| | MGM China Holdings Ltd. | | | Hong Kong | | | | 1,200 | | | | 3,052 | |
| | | | | | | | | | | | | | |
| | | | | | | | | | | | | 12,826 | |
| | | | | | | | | | | | | | |
| | Diversified Financials 0.1% | | | | | | | | | | | | |
| | Ayala Corp. | | | Philippines | | | | 680 | | | | 10,537 | |
| | | | | | | | | | | | | | |
| | Energy 0.2% | | | | | | | | | | | | |
| | China Petroleum and Chemical Corp., H | | | China | | | | 20,000 | | | | 16,121 | |
| | PetroChina Co. Ltd., H | | | China | | | | 6,000 | | | | 6,639 | |
| | PTT Exploration and Production PCL, fgn. | | | Thailand | | | | 1,700 | | | | 5,791 | |
| | SK Innovation Co. Ltd. | | | South Korea | | | | 127 | | | | 9,881 | |
| | Yanzhou Coal Mining Co. Ltd., H | | | China | | | | 12,000 | | | | 10,183 | |
| | | | | | | | | | | | | | |
| | | | | | | | | | | | | 48,615 | |
| | | | | | | | | | | | | | |
| | Food & Staples Retailing 0.1% | | | | | | | | | | | | |
| | Bizim Toptan Satis Magazalari AS | | | Turkey | | | | 3,016 | | | | 24,684 | |
| | | | | | | | | | | | | | |
| | Food, Beverage & Tobacco 0.5% | | | | | | | | | | | | |
| | Eastern Tobacco | | | Egypt | | | | 2,100 | | | | 64,618 | |
| | Pinar Sut Mamulleri Sanayii AS | | | Turkey | | | | 1,051 | | | | 9,615 | |
| | Thai Beverage PCL, fgn. | | | Thailand | | | | 61,000 | | | | 31,771 | |
| | | | | | | | | | | | | | |
| | | | | | | | | | | | | 106,004 | |
| | | | | | | | | | | | | | |
| | Household & Personal Products 0.1% | | | | | | | | | | | | |
| | Avon Products Inc. | | | United States | | | | 2,927 | | | | 27,485 | |
| | | | | | | | | | | | | | |
| | Insurance 0.1% | | | | | | | | | | | | |
| | China Life Insurance Co. Ltd., H | | | China | | | | 5,000 | | | | 19,538 | |
| | | | | | | | | | | | | | |
| | Materials 0.1% | | | | | | | | | | | | |
| a | | Aluminum Corp. of China Ltd., H | | | China | | | | 12,000 | | | | 5,525 | |
| | Compania de Minas Buenaventura SA, ADR | | | Peru | | | | 1,200 | | | | 11,472 | |
| | Kumba Iron Ore Ltd. | | | South Africa | | | | 47 | | | | 975 | |
| | Semen Indonesia (Persero) Tbk PT | | | Indonesia | | | | 6,500 | | | | 8,502 | |
| | | | | | | | | | | | | | |
| | | | | | | | | | | | | 26,474 | |
| | | | | | | | | | | | | | |
| | Media 0.1% | | | | | | | | | | | | |
| | Naspers Ltd., N | | | South Africa | | | | 100 | | | | 13,102 | |
| | | | | | | | | | | | | | |
| | Real Estate 0.1% | | | | | | | | | | | | |
| | Land and Houses PCL, fgn. | | | Thailand | | | | 42,400 | | | | 11,670 | |
| | | | | | | | | | | | | | |
| | Retailing 0.0%† | | | | | | | | | | | | |
| | Truworths International Ltd. | | | South Africa | | | | 289 | | | | 1,931 | |
| | | | | | | | | | | | | | |
| | Semiconductors & Semiconductor Equipment 0.1% | | | | | | | | | | | | |
| | Taiwan Semiconductor Manufacturing Co. Ltd. | | | Taiwan | | | | 7,000 | | | | 31,184 | |
| | | | | | | | | | | | | | |
FRANKLIN TEMPLETON VARIABLE INSURANCE PRODUCTS TRUST
CONSOLIDATED STATEMENT OF INVESTMENTS
Franklin Managed Volatility Global Allocation VIP Fund (continued)
| | | | | | | | | | | | | | |
| | | | | Country | | | Shares/Units | | | Value | |
| | Common Stocks (continued) | | | | | | | | | | | | |
| | Software & Services 0.5% | | | | | | | | | | | | |
| | Travelsky Technology Ltd., H | | | China | | | | 90,000 | | | $ | 97,267 | |
| | | | | | | | | | | | | | |
| | Telecommunication Services 0.2% | | | | | | | | | | | | |
| | China Unicom (Hong Kong) Ltd. | | | China | | | | 12,000 | | | | 16,064 | |
| | MTN Group Ltd. | | | South Africa | | | | 898 | | | | 17,193 | |
| | | | | | | | | | | | | | |
| | | | | | | | | | | | | 33,257 | |
| | | | | | | | | | | | | | |
| | Transportation 0.4% | | | | | | | | | | | | |
| a | | China Shipping Development Co. Ltd., H | | | China | | | | 16,000 | | | | 10,957 | |
| | COSCO Pacific Ltd. | | | China | | | | 44,942 | | | | 63,988 | |
| | | | | | | | | | | | | | |
| | | | | | | | | | | | | 74,945 | |
| | | | | | | | | | | | | | |
| | | | |
| | Total Common Stocks (Cost $826,749) | | | | | | | | | | | 892,492 | |
| | | | | | | | | | | | | | |
| b | | Exchange Traded Funds 55.0% | | | | | | | | | | | | |
| | Domestic Equity 32.4% | | | | | | | | | | | | |
| | iShares MSCI USA Minimum Volatility ETF | | | United States | | | | 163,145 | | | | 6,604,110 | |
| | Foreign Equity 22.6% | | | | | | | | | | | | |
| | iShares MSCI EAFE Minimum Volatility ETF | | | United States | | | | 74,903 | | | | 4,621,515 | |
| | | | | | | | | | | | | | |
| | | | |
| | Total Exchange Traded Funds (Cost $9,941,297) | | | | | | | | | | | 11,225,625 | |
| | | | | | | | | | | | | | |
| c | | Exchange Traded Notes (Cost $927,123) 3.5% | | | | | | | | | | | | |
| | Energy 3.5% | | | | | | | | | | | | |
| a,d,e | | iPATH Dow Jones-UBS Commodity Index Total Return ETN, 6/12/36 | | | United States | | | | 23,800 | | | | 711,858 | |
| | | | | | | | | | | | | | |
| | Preferred Stocks 0.4% | | | | | | | | | | | | |
| | Banks 0.2% | | | | | | | | | | | | |
| | Banco Bradesco SA, ADR, pfd. | | | Brazil | | | | 3,500 | | | | 46,795 | |
| | | | | | | | | | | | | | |
| | Energy 0.1% | | | | | | | | | | | | |
| | Petroleo Brasileiro SA, ADR, pfd. | | | Brazil | | | | 1,440 | | | | 10,915 | |
| | | | | | | | | | | | | | |
| | Materials 0.1% | | | | | | | | | | | | |
| | Vale SA, ADR, pfd., A | | | Brazil | | | | 3,500 | | | | 25,410 | |
| | | | | | | | | | | | | | |
| | | | |
| | Total Preferred Stocks (Cost $138,773) | | | | | | | | | | | 83,120 | |
| | | | | | | | | | | | | | |
| | | | |
| | | | | | | | Principal Amount* | | | | |
| | Foreign Government and Agency Securities 25.7% | | | | | | | | | | | | |
| | Development Bank of Japan, | | | | | | | | | | | | |
| | 1.70%, 9/20/22 | | | Japan | | | | 10,000,000 | JPY | | | 93,132 | |
| | senior bond, 2.30%, 3/19/26 | | | Japan | | | | 10,000,000 | JPY | | | 101,680 | |
| | Government of Canada, 2.75%, 6/01/22 | | | Canada | | | | 160,000 | CAD | | | 148,787 | |
| f | | Government of Finland, senior bond, Reg S, 4.375%, 7/04/19 | | | Finland | | | | 350,000 | EUR | | | 505,617 | |
| | Government of France, | | | | | | | | | | | | |
| | 2.25%, 5/25/24 | | | France | | | | 150,000 | EUR | | | 206,537 | |
| | 1.75%, 11/25/24 | | | France | | | | 200,000 | EUR | | | 263,433 | |
| | Government of Germany, 1.50%, 2/15/23 | | | Germany | | | | 185,000 | EUR | | | 245,241 | |
| | Government of Ireland, 5.50%, 10/18/17 | | | Ireland | | | | 150,000 | EUR | | | 207,951 | |
| | Government of Japan, senior bond, | | | | | | | | | | | | |
| | 0.40%, 6/20/16 | | | Japan | | | | 35,000,000 | JPY | | | 293,926 | |
| | 1.20%, 6/20/21 | | | Japan | | | | 30,000,000 | JPY | | | 268,707 | |
| | 1.90%, 6/20/31 | | | Japan | | | | 15,000,000 | JPY | | | 146,468 | |
| | 34, 2.20%, 3/20/41 | | | Japan | | | | 15,000,000 | JPY | | | 152,813 | |
| | Government of Malaysia, 3.197%, 10/15/15 | | | Malaysia | | | | 500,000 | MYR | | | 142,784 | |
| | Government of Mexico, 8.00%, 12/07/23 | | | Mexico | | | | 15,000g | MXN | | | 117,387 | |
| | Government of Poland, | | | | | | | | | | | | |
| | 3.25%, 7/25/25 | | | Poland | | | | 360,000 | PLN | | | 108,622 | |
| | 5.75%, 4/25/29 | | | Poland | | | | 250,000 | PLN | | | 96,147 | |
| | Government of Spain, senior bond, 4.00%, 4/30/20 | | | Spain | | | | 250,000 | EUR | | | 351,069 | |
| f | | Government of the Netherlands, Reg S, 1.75%, 7/15/23 | | | Netherlands | | | | 300,000 | EUR | | | 399,837 | |
| | Italy Treasury Bond, | | | | | | | | | | | | |
| | f Reg S, 3.50%, 3/01/30 | | | Italy | | | | 150,000 | EUR | | | 202,962 | |
| | senior bond, 4.25%, 9/01/19 | | | Italy | | | | 150,000 | EUR | | | 209,175 | |
| | senior bond, 5.50%, 9/01/22 | | | Italy | | | | 150,000 | EUR | | | 233,042 | |
| f | | Queensland Treasury Corp., | | | | | | | | | | | | |
| | senior bond, Reg S, 5.75%, 7/22/24 | | | Australia | | | | 150,000 | AUD | | | 148,824 | |
| | senior note, Reg S, 6.00%, 7/21/22 | | | Australia | | | | 150,000 | AUD | | | 148,240 | |
FRANKLIN TEMPLETON VARIABLE INSURANCE PRODUCTS TRUST
CONSOLIDATED STATEMENT OF INVESTMENTS
Franklin Managed Volatility Global Allocation VIP Fund (continued)
| | | | | | | | | | | | | | |
| | | | | Country | | | Principal Amount* | | | Value | |
| | Foreign Government and Agency Securities (continued) | | | | | | | | | |
| f | | U.K. Treasury Note, Reg S, 4.00%, 3/07/22 | | | United Kingdom | | | | 250,000 | GBP | | | 457,069 | |
| | | | | | | | | | | | | | |
| | | | |
| | Total Foreign Government and Agency Securities
(Cost $5,656,375) | | | | | | | | | | | 5,249,450 | |
| | | | | | | | | | | | | | |
| | U.S. Government and Agency Securities 9.8% | | | | | | | | | | | | |
| | U.S. Treasury Bond, 4.25%, 5/15/39 | | | United States | | | | 100,000 | | | | 128,703 | |
| | U.S. Treasury Note, | | | | | | | | | | | | |
| | 0.25%, 1/15/15 | | | United States | | | | 400,000 | | | | 400,000 | |
| | 4.625%, 11/15/16 | | | United States | | | | 500,000 | | | | 537,168 | |
| | 4.00%, 8/15/18 | | | United States | | | | 300,000 | | | | 328,969 | |
| | 2.00%, 11/15/21 | | | United States | | | | 300,000 | | | | 301,043 | |
| | 1.75%, 5/15/22 | | | United States | | | | 300,000 | | | | 294,902 | |
| | | | | | | | | | | | | | |
| | | | |
| | Total U.S. Government and Agency Securities
(Cost $2,003,491) | | | | | | | | | | | 1,990,785 | |
| | | | | | | | | | | | | | |
| | | | |
| | Total Investments before Short Term Investments
(Cost $19,493,808) | | | | | | | | | | | 20,153,330 | |
| | | | | | | | | | | | | | |
| | | | |
| | | | | | | | Shares | | | | |
| | Short Term Investments (Cost $74,160) 0.3% | | | | | | | | | | | | |
| | Money Market Funds 0.3% | | | | | | | | | | | | |
| a,h | | Institutional Fiduciary Trust Money Market Portfolio | | | United States | | | | 74,160 | | | | 74,160 | |
| | | | | | | | | | | | | | |
| | Total Investments (Cost $19,567,968) 99.1% | | | | | | | | | | | 20,227,490 | |
| | Other Assets, less Liabilities 0.9% | | | | | | | | | | | 173,839 | |
| | | | | | | | | | | | | | |
| | Net Assets 100.0% | | | | | | | | | | $ | 20,401,329 | |
| | | | | | | | | | | | | | |
†Rounds to less than 0.1% of net assets.
*The principal amount is stated in U.S. dollars unless otherwise indicated.
aNon-income producing.
bSee Note 1(d) regarding exchange traded funds.
cSee Note 1(e) regarding exchange traded notes.
dThe security is owned by MVGAF Holdings Corp., a wholly-owned subsidiary of the Fund. See Note 1(f).
eSecurity does not guarantee any return of principal at maturity, upon redemption or otherwise. Cash payment at maturity or upon early redemption is based on the performance of the indicated index less an investor fee.
fSecurity was purchased pursuant to Regulation S under the Securities Act of 1933, which exempts from registration securities offered and sold outside of the United States. Such a security cannot be sold in the United States without either an effective registration statement filed pursuant to the Securities Act of 1933, or pursuant to an exemption from registration. These securities have been deemed liquid under guidelines approved by the Trust’s Board of Trustees. At December 31, 2014, the aggregate value of these securities was $1,862,549, representing 9.13% of consolidated net assets.
gPrincipal amount is stated in 100 Mexican Peso Units.
hSee Note 3(e) regarding investments in Institutional Fiduciary Trust Money Market Portfolio.
At December 31, 2014, the Fund had the following forward exchange contracts outstanding. See Note 1(c).
| | | | | | | | | | | | | | | | | | | | | | | | | | | | |
| Currency | | Counterpartya | | | Type | | | Quantity | | | Contract
Amount | | | Settlement
Date | | | Unrealized
Appreciation | | | Unrealized
Depreciation | |
Australian Dollar | | | BZWS | | | | Sell | | | | 330,000 | | | $ | 274,436 | | | | 3/10/15 | | | $ | 6,335 | | | $ | — | |
British Pound | | | BZWS | | | | Sell | | | | 20,000 | | | | 31,335 | | | | 3/10/15 | | | | 178 | | | | — | |
Euro | | | BZWS | | | | Sell | | | | 950,000 | | | | 1,175,084 | | | | 3/10/15 | | | | 24,859 | | | | — | |
Polish Zloty | | | BZWS | | | | Sell | | | | 350,000 | | | | 103,617 | | | | 3/10/15 | | | | 5,053 | | | | — | |
| | | | | | | | | | | | | | | | | | | | | | | | | | | | |
Net unrealized appreciation (depreciation) | | | | | | | | | | | | | | | $ | 36,425 | | | | | |
| | | | | | | | | | | | | | | | | | | | | | | | | | | | |
aMay be comprised of multiple contracts with the same counterparty, currency and settlement date.
See Abbreviations on page 39.
| | | | | | |
| | | The accompanying notes are an integral part of these consolidated financial statements. | Annual Report | | | FMV-25 | |
FRANKLIN TEMPLETON VARIABLE INSURANCE PRODUCTS TRUST
Consolidated Financial Statements
Consolidated Statement of Assets and Liabilities
December 31, 2014
| | | | |
| | | Franklin Managed
Volatility Global
Allocation VIP
Fund | |
Assets: | | | | |
Investments in securities: | | | | |
Cost - Unaffiliated issuers | | $ | 19,493,808 | |
Cost - Sweep Money Fund (Note 3e) | | | 74,160 | |
| | | | |
Total cost of investments | | $ | 19,567,968 | |
| | | | |
Value - Unaffiliated issuers | | $ | 20,153,330 | |
Value - Sweep Money Fund (Note 3e) | | | 74,160 | |
| | | | |
Total value of investments | | | 20,227,490 | |
Cash | | | 127,600 | |
Foreign currency, at value (Cost $3,533) | | | 3,517 | |
Receivables: | | | | |
Dividends and interest | | | 66,244 | |
Affiliates | | | 12,884 | |
Unrealized appreciation on forward exchange contracts | | | 36,425 | |
| | | | |
Total assets | | | 20,474,160 | |
| | | | |
Liabilities: | | | | |
Payables: | | | | |
Investment securities purchased | | | 1,618 | |
Management fees | | | 747 | |
Distribution fees | | | 6,126 | |
Professional fees | | | 62,021 | |
Accrued expenses and other liabilities | | | 2,319 | |
| | | | |
Total liabilities | | | 72,831 | |
| | | | |
Net assets, at value | | $ | 20,401,329 | |
| | | | |
Net assets consist of: | | | | |
Paid-in capital | | $ | 19,823,085 | |
Distributions in excess of net investment income | | | (69,150 | ) |
Net unrealized appreciation (depreciation) | | | 693,336 | |
Accumulated net realized gain (loss) | | | (45,942 | ) |
| | | | |
Net assets, at value | | $ | 20,401,329 | |
| | | | |
| |
| Class 2: | | | | |
Net assets, at value | | $ | 10,200,554 | |
| | | | |
Shares outstanding | | | 1,000,000 | |
| | | | |
Net asset value and maximum offering price per share | | $ | 10.20 | |
| | | | |
| |
| Class 5: | | | | |
Net assets, at value | | $ | 10,200,775 | |
| | | | |
Shares outstanding | | | 1,000,000 | |
| | | | |
Net asset value and maximum offering price per share | | $ | 10.20 | |
| | | | |
| | | | | | |
| | FMV-26 | | | Annual Report | The accompanying notes are an integral part of these financial statements. | | |
FRANKLIN TEMPLETON VARIABLE INSURANCE PRODUCTS TRUST
CONSOLIDATED FINANCIAL STATEMENTS
Consolidated Statement of Operations
for the year ended December 31, 2014
| | | | |
| | | Franklin Managed
Volatility Global
Allocation VIP
Fund | |
Investment income: | | | | |
Dividends | | $ | 21,934 | |
Dividends from exchange traded funds | | | 301,085 | |
Interest | | | 122,279 | |
| | | | |
Total investment income | | | 445,298 | |
| | | | |
Expenses: | | | | |
Management fees (Note 3a) | | | 207,464 | |
Distribution fees: (Note 3c) | | | | |
Class 2 | | | 25,922 | |
Class 5 | | | 10,377 | |
Custodian fees (Note 4) | | | 1,850 | |
Reports to shareholders | | | 5,011 | |
Registration and filing fees | | | 3,986 | |
Professional fees | | | 82,164 | |
Amortization of offering costs | | | 51,188 | |
Other | | | 4,770 | |
| | | | |
Total expenses | | | 392,732 | |
Expense reductions (Note 4) | | | (29 | ) |
Expenses waived/paid by affiliates (Note 3f) | | | (184,362 | ) |
| | | | |
Net expenses | | | 208,341 | |
| | | | |
Net investment income | | | 236,957 | |
| | | | |
Realized and unrealized gains (losses): | | | | |
Net realized gain (loss) from: | | | | |
Investments | | | 135,216 | |
Foreign currency transactions | | | 84,606 | |
Futures contracts | | | 3,497 | |
| | | | |
Net realized gain (loss) | | | 223,319 | |
| | | | |
Net change in unrealized appreciation (depreciation) on: | | | | |
Investments | | | 296,479 | |
Translation of other assets and liabilities denominated in foreign currencies | | | (3,185 | ) |
| | | | |
Net change in unrealized appreciation (depreciation) | | | 293,294 | |
| | | | |
Net realized and unrealized gain (loss) | | | 516,613 | |
| | | | |
Net increase (decrease) in net assets resulting from operations | | $ | 753,570 | |
| | | | |
| | | | | | |
| | | The accompanying notes are an integral part of these financial statements. | Annual Report | | | FMV-27 | |
FRANKLIN TEMPLETON VARIABLE INSURANCE PRODUCTS TRUST
CONSOLIDATED FINANCIAL STATEMENTS
Consolidated Statements of Changes in Net Assets
| | | | | | | | |
| | | Franklin Managed Volatility Global | |
| | | Allocation VIP Fund | |
| | | Year Ended December 31, | |
| | | 2014 | | | 2013a | |
Increase (decrease) in net assets: | | | | | | | | |
Operations: | | | | | | | | |
Net investment income | | $ | 236,957 | | | $ | 194,538 | |
Net realized gain (loss) from investments, foreign currency transactions and futures contracts | | | 223,319 | | | | (79,821 | ) |
Net change in unrealized appreciation (depreciation) on investments and translation of other assets and liabilities denominated in foreign currencies | | | 293,294 | | | | 400,042 | |
| | | | |
Net increase (decrease) in net assets resulting from operations | | | 753,570 | | | | 514,759 | |
| | | | |
Distributions to shareholders from: | | | | | | | | |
Net investment income and net foreign currency gains: | | | | | | | | |
Class 2 | | | (230,300 | ) | | | (186,300 | ) |
Class 5 | | | (245,900 | ) | | | (197,700 | ) |
Net realized gains: | | | | | | | | |
Class 2 | | | (3,400 | ) | | | — | |
Class 5 | | | (3,400 | ) | | | — | |
| | | | |
Total distributions to shareholders | | | (483,000 | ) | | | (384,000 | ) |
| | | | |
Capital share transactions:( Note 2) | | | | | | | | |
Class 2 | | | — | | | | 10,000,000 | |
Class 5 | | | — | | | | 10,000,000 | |
| | | | |
Total capital share transactions | | | — | | | | 20,000,000 | |
| | | | |
Net increase (decrease) in net assets | | | 270,570 | | | | 20,130,759 | |
Net assets: | | | | | | | | |
Beginning of year | | | 20,130,759 | | | | — | |
| | | | |
End of year | | $ | 20,401,329 | | | $ | 20,130,759 | |
| | | | |
Distributions in excess of net investment income included in net assets: | | | | | | | | |
End of year | | $ | (69,150 | ) | | $ | (41,209 | ) |
| | | | |
aFor the period April 1, 2013 (commencement of operations) to December 31, 2013.
| | | | | | |
| | FMV-28 | | | Annual Report | The accompanying notes are an integral part of these financial statements. | | |
FRANKLIN TEMPLETON VARIABLE INSURANCE PRODUCTS TRUST
Notes to Consolidated Financial Statements
Franklin Managed Volatility Global Allocation VIP Fund
1. Organization and Significant Accounting Policies
Franklin Templeton Variable Insurance Products Trust (Trust) is registered under the Investment Company Act of 1940, as amended, (1940 Act) as an open-end management investment company, consisting of nineteen separate funds and applies the specialized accounting and reporting guidance in U.S. Generally Accepted Accounting Principles (U.S. GAAP). The Franklin Managed Volatility Global Allocation VIP Fund (Fund) is included in this report. The financial statements of the remaining funds in the Trust are presented separately. Shares of the Fund are generally sold only to insurance company separate accounts to fund the benefits of variable life insurance policies or variable annuity contracts. The Fund offers two classes of shares: Class 2 and Class 5. Each class of shares differs by its distribution fees, voting rights on matters affecting a single class and its exchange privilege.
The Fund invests a significant portion of its assets in exchange traded funds (ETFs). The Fund relies on exemptive orders granted by the U.S. Securities and Exchange Commission (SEC) to the ETFs that permit the Fund to invest in certain ETFs beyond the 1940 Act’s limitations on a fund’s investment in other investment companies, subject to certain terms and conditions set forth in the exemptive orders. The accounting policies of the ETFs are outlined in their respective shareholder reports. A copy of each ETF’s shareholder report, in which the Fund invests, is available on the SEC website at sec.gov or at the SEC’s Public Reference Room in Washington, D.C. The ETFs’ shareholder reports are not covered by this report.
The following summarizes the Fund’s significant accounting policies.
a. Financial Instrument Valuation
The Fund’s investments in financial instruments are carried at fair value daily. Fair value is the price that would be received to sell an asset or paid to transfer a liability in an orderly transaction between market participants on the measurement date. The Fund calculates the net asset value (NAV) per share at the close of the New York Stock Exchange (NYSE), generally at 4 p.m. Eastern time (NYSE close) on each day the NYSE is open for trading. Under compliance policies and procedures approved by the Trust’s Board of Trustees (the Board), the Fund’s administrator has responsibility for oversight of valuation, including leading the cross-functional Valuation and Liquidity Oversight
Committee (VLOC). The VLOC provides administration and oversight of the Fund’s valuation policies and procedures, which are approved annually by the Board. Among other things, these procedures allow the Fund to utilize independent pricing services, quotations from securities and financial instrument dealers, and other market sources to determine fair value.
Equity securities, ETFs, and exchange traded notes listed on an exchange or on the NASDAQ National Market System are valued at the last quoted sale price or the official closing price of the day, respectively. Foreign equity securities are valued as of the close of trading on the foreign stock exchange on which the security is primarily traded or as of the NYSE close, whichever is earlier. The value is then converted into its U.S. dollar equivalent at the foreign exchange rate in effect at the NYSE close on the day that the value of the security is determined. Over-the-counter (OTC) securities are valued within the range of the most recent quoted bid and ask prices. Securities that trade in multiple markets or on multiple exchanges are valued according to the broadest and most representative market. Certain equity securities are valued based upon fundamental characteristics or relationships to similar securities. Investments in open-end mutual funds are valued at the closing net asset value.
FRANKLIN TEMPLETON VARIABLE INSURANCE PRODUCTS TRUST
NOTES TO CONSOLIDATED FINANCIAL STATEMENTS
Franklin Managed Volatility Global Allocation VIP Fund (continued)
1. Organization and Significant Accounting Policies (continued)
a. Financial Instrument Valuation (continued)
Debt securities generally trade in the OTC market rather than on a securities exchange. The Fund’s pricing services use multiple valuation techniques to determine fair value. In instances where sufficient market activity exists, the pricing services may utilize a market-based approach through which quotes from market makers are used to determine fair value. In instances where sufficient market activity may not exist or is limited, the pricing services also utilize proprietary valuation models which may consider market characteristics such as benchmark yield curves, credit spreads, estimated default rates, anticipated market interest rate volatility, coupon rates, anticipated timing of principal repayments, underlying collateral, and other unique security features in order to estimate the relevant cash flows, which are then discounted to calculate the fair value. Securities denominated in a foreign currency are converted into their U.S. dollar equivalent at the foreign exchange rate in effect at the NYSE close on the date that the values of the foreign debt securities are determined.
Certain derivative financial instruments (derivatives) trade in the OTC market. The Fund’s pricing services use various techniques including industry standard option pricing models and proprietary discounted cash flow models to determine the fair value of those instruments. The Fund’s net benefit or obligation under the derivative contract, as measured by the fair value of the contract, is included in net assets.
The Fund has procedures to determine the fair value of financial instruments for which market prices are not reliable or readily available. Under these procedures, the VLOC convenes on a regular basis to review such financial instruments and considers a number of factors, including significant unobservable valuation inputs, when arriving at fair value. The VLOC primarily employs a market-based approach which may use related or comparable assets or liabilities, recent transactions, market multiples, book values, and other relevant information for the investment to determine the fair value of the investment. An income-based valuation approach may also be used in which the anticipated future cash flows of the investment are discounted to calculate fair
value. Discounts may also be applied due to the nature or duration of any restrictions on the disposition of the investments. Due to the inherent uncertainty of valuations of such investments, the fair values may differ significantly from the values that would have been used had an active market existed. The VLOC employs various methods for calibrating these valuation approaches including a regular review of key inputs and assumptions, transactional back-testing or disposition analysis, and reviews of any related market activity.
Trading in securities on foreign securities stock exchanges and OTC markets may be completed before the daily NYSE close. In addition, trading in certain foreign markets may not take place on every NYSE business day. Occasionally, events occur between the time at which trading in a foreign security is completed and the close of the NYSE that might call into question the reliability of the value of a portfolio security held by the Fund. As a result, differences may arise between the value of the Fund’s portfolio securities as determined at the foreign market close and the latest indications of value at the close of the NYSE. In order to minimize the potential for these differences, the VLOC monitors price movements following the close of trading in foreign stock markets through a series of country specific market proxies (such as baskets of American Depositary Receipts, futures contracts and exchange traded funds). These price movements are measured against established trigger thresholds for each specific market proxy to assist in determining if an event has occurred that may call into question the reliability of the values of the foreign securities held by the Fund. If such an event occurs, the securities may be valued using fair value procedures, which may include the use of independent pricing services.
Also, when the last day of the reporting period is a non-business day, certain foreign markets may be open on those days that the NYSE is closed, which could result in differences between the value of the Fund’s portfolio securities on the last business day and the last calendar day of the reporting period. Any significant security valuation changes due to an open foreign market are adjusted and reflected by the Fund for financial reporting purposes.
FRANKLIN TEMPLETON VARIABLE INSURANCE PRODUCTS TRUST
NOTES TO CONSOLIDATED FINANCIAL STATEMENTS
Franklin Managed Volatility Global Allocation VIP Fund (continued)
b. Foreign Currency Translation
Portfolio securities and other assets and liabilities denominated in foreign currencies are translated into U.S. dollars based on the exchange rate of such currencies against U.S. dollars on the date of valuation. The Fund may enter into foreign currency exchange contracts to facilitate transactions denominated in a foreign currency. Purchases and sales of securities, income and expense items denominated in foreign currencies are translated into U.S. dollars at the exchange rate in effect on the transaction date. Portfolio securities and assets and liabilities denominated in foreign currencies contain risks that those currencies will decline in value relative to the U.S. dollar. Occasionally, events may impact the availability or reliability of foreign exchange rates used to convert the U.S. dollar equivalent value. If such an event occurs, the foreign exchange rate will be valued at fair value using procedures established and approved by the Board.
The Fund does not separately report the effect of changes in foreign exchange rates from changes in market prices on securities held. Such changes are included in net realized and unrealized gain or loss from investments on the Consolidated Statement of Operations.
Realized foreign exchange gains or losses arise from sales of foreign currencies, currency gains or losses realized between the trade and settlement dates on securities transactions and the difference between the recorded amounts of dividends, interest, and foreign withholding taxes and the U.S. dollar equivalent of the amounts actually received or paid. Net unrealized foreign exchange gains and losses arise from changes in foreign exchange rates on foreign denominated assets and liabilities other than investments in securities held at the end of the reporting period.
c. Derivative Financial Instruments
The Fund invested in derivatives in order to manage risk or gain exposure to various other investments or markets. Derivatives are financial contracts based on an underlying or notional amount, require no initial investment or an initial net investment that is smaller than would normally be required to have a similar response to changes in market factors, and require or permit net settlement. Derivatives contain various risks including the potential inability of the counterparty to fulfill their obligations under the terms of the contract, the potential for an illiquid secondary market, and/or the potential for market movements which expose the Fund to gains or losses in excess of the
amounts shown on the Consolidated Statement of Assets and Liabilities. Realized gain and loss and unrealized appreciation and depreciation on these contracts for the period are included in the Consolidated Statement of Operations.
Derivative counterparty credit risk is managed through a formal evaluation of the creditworthiness of all potential counterparties. The Fund attempts to reduce its exposure to counterparty credit risk on OTC derivatives, whenever possible, by entering into International Swaps and Derivatives Association (ISDA) master agreements with certain counterparties. These agreements contain various provisions, including but not limited to collateral requirements, events of default, or early termination. Termination events applicable to the counterparty include certain deteriorations in the credit quality of the counterparty. Termination events applicable to the Fund include failure of the Fund to maintain certain net asset levels and/or limit the decline in net assets over various periods of time. In the event of default or early termination, the ISDA master agreement gives the non-defaulting party the right to net and close-out all transactions traded, whether or not arising under the ISDA agreement, to one net amount payable by one counterparty to the other. However, absent an event of default or early termination, OTC derivative assets and liabilities are presented gross and not offset in the Consolidated Statement of Assets and Liabilities. Early termination by the counterparty may result in an immediate payment by the Fund of any net liability owed to that counterparty under the ISDA agreement. At December 31, 2014, the Fund had no OTC derivatives in a net liability position for such contracts.
FRANKLIN TEMPLETON VARIABLE INSURANCE PRODUCTS TRUST
NOTES TO CONSOLIDATED FINANCIAL STATEMENTS
Franklin Managed Volatility Global Allocation VIP Fund (continued)
1. Organization and Significant Accounting Policies (continued)
c. Derivative Financial Instruments (continued)
Collateral requirements differ by type of derivative. Collateral terms are contract specific for OTC derivatives. For OTC derivatives traded under an ISDA master agreement, posting of collateral is required by either the fund or the applicable counterparty if the total net exposure of all OTC derivatives with the applicable counterparty exceeds the minimum transfer amount, which typically ranges from $100,000 to $250,000, and can vary depending on the counterparty and the type of the agreement. Generally, collateral is determined at the close of fund business each day and any additional collateral required due to changes in derivative values may be delivered by the fund or the counterparty within a few business days. Collateral pledged and/or received by the fund, if any, is held in segregated accounts with the fund’s custodian/counterparty broker and can be in the form of cash and/or securities. Unrestricted cash may be invested according to the Fund’s investment objectives.
The Fund entered into exchange traded financial futures contracts primarily to manage and/or gain exposure to equity price risk. A futures contract is an agreement between the Fund and a counterparty to buy or sell an asset for a specified price on a future date. Required initial margins are pledged by the Fund, and the daily change in fair value is accounted for as a variation margin payable or receivable.
The Fund entered into OTC forward exchange contracts primarily to manage and/or gain exposure to certain foreign currencies. A forward exchange contract is an agreement between the Fund and a counterparty to buy or sell a foreign currency at a specific exchange rate on a future date.
See Note 8 regarding other derivative information.
d. Exchange Traded Funds
The Fund purchases ETFs. ETFs are registered investment companies under the 1940 Act and provide access to the returns of stock indices, bond indices, or a basket of assets and are intended to replicate the economic effects that would apply had the Fund directly purchased the underlying referenced asset or basket of assets.
e. Exchange Traded Notes
The Fund purchases exchange traded notes. Exchange traded notes are senior, unsecured, unsubordinated debt securities issued by an underwriting bank. Exchange traded notes are designed to provide investors access to the returns of various market benchmarks and intended to replicate the economic effects that would apply had the Fund directly purchased the underlying referenced asset or basket of assets. The risks of exchange traded notes include the credit risk of the issuer, counterparty risk, and the potential inability of the Fund to dispose of the exchange traded note in the normal course of business.
f. Investments in MVGAF Holdings Corp. (MVGAF Subsidiary)
The Fund invests in certain financial instruments through its investment in the MVGAF Subsidiary. The MVGAF Subsidiary is a Cayman Islands exempted company with limited liability, is a wholly-owned subsidiary of the Fund, and is able to invest in certain financial instruments consistent with the investment objective of the Fund. At December 31, 2014, the MVGAF Subsidiary’s investment, as well as any other assets and liabilities of the MVGAF Subsidiary are reflected in the Fund’s Consolidated Statement of Investments and Consolidated Statement of Assets and Liabilities. The financial statements have been consolidated and include the accounts of the Fund and the MVGAF Subsidiary. All intercompany transactions and balances have been eliminated. At December 31, 2014, the net assets of the MVGAF Subsidiary were $838,709, representing 4.11% of the Fund’s consolidated net assets. The Fund’s investment in the MVGAF Subsidiary is limited to 25% of consolidated assets.
g. Income and Deferred Taxes
It is the Fund’s policy to qualify as a regulated investment company under the Internal Revenue Code. The Fund intends to distribute to shareholders substantially all of its taxable income and net realized gains to relieve it from federal income and if applicable, excise taxes. As a result, no provision for U.S. federal income taxes is required.
FRANKLIN TEMPLETON VARIABLE INSURANCE PRODUCTS TRUST
NOTES TO CONSOLIDATED FINANCIAL STATEMENTS
Franklin Managed Volatility Global Allocation VIP Fund (continued)
The Fund may be subject to foreign taxation related to income received, capital gains on the sale of securities and certain foreign currency transactions in the foreign jurisdictions in which it invests. Foreign taxes, if any, are recorded based on the tax regulations and rates that exist in the foreign markets in which the Fund invests. When a capital gain tax is determined to apply the Fund records an estimated deferred tax liability in an amount that would be payable if the securities were disposed of on the valuation date.
The Fund recognizes the tax benefits of uncertain tax positions only when the position is “more likely than not” to be sustained upon examination by the tax authorities based on the technical merits of the tax position. As of December 31, 2014, and for all open tax years, the Fund has determined that no liability for unrecognized tax benefits is required in the Fund’s financial statements related to uncertain tax positions taken on a tax return (or expected to be taken on future tax returns). Open tax years are those that remain subject to examination and are based on each tax jurisdiction statute of limitation.
h. Security Transactions, Investment Income, Expenses and Distributions
Security transactions are accounted for on trade date. Realized gains and losses on security transactions are determined on a specific identification basis. Interest income and estimated expenses are accrued daily. Amortization of premium and accretion of discount on debt securities are included in interest income. Dividend income is recorded on the ex-dividend date except for certain foreign securities where the dividend rate is not available. In such cases, the dividend is recorded as soon as the information is received by the Fund. Distributions to shareholders are recorded on the ex-dividend date and are determined according to income tax regulations (tax basis). Distributable earnings determined on a tax basis may differ from earnings recorded in accordance with U.S. GAAP. These differences may be permanent or temporary. Permanent differences are reclassified among capital accounts to reflect their tax character. These reclassifications have no impact on net assets or the results of operations. Temporary differences are not reclassified, as they may reverse in subsequent periods.
Common expenses incurred by the Trust are allocated among the funds based on the ratio of net assets of each fund to the combined net assets of the Trust. Fund specific expenses are charged directly to the fund that incurred the expense.
The Fund indirectly bears its proportionate share of expenses from the ETFs. Since the ETFs have varied expense levels and the Fund may own different proportions of the ETFs at different times, the amount of expenses incurred indirectly by the Fund will vary.
Realized and unrealized gains and losses and net investment income, not including class specific expenses, are allocated daily to each class of shares based upon the relative proportion of net assets of each class. Differences in per share distributions, by class, are generally due to differences in class specific expenses.
i. Offering Costs
Offering costs are amortized on a straight line basis over twelve months.
j. Accounting Estimates
The preparation of financial statements in accordance with U.S. GAAP requires management to make estimates and assumptions that affect the reported amounts of assets and liabilities at the date of the financial statements and the amounts of income and expenses during the reporting period. Actual results could differ from those estimates.
FRANKLIN TEMPLETON VARIABLE INSURANCE PRODUCTS TRUST
NOTES TO CONSOLIDATED FINANCIAL STATEMENTS
Franklin Managed Volatility Global Allocation VIP Fund (continued)
1. Organization and Significant Accounting Policies (continued)
k. Guarantees and Indemnifications
Under the Trust’s organizational documents, its officers and trustees are indemnified by the Trust against certain liabilities
arising out of the performance of their duties to the Trust. Additionally, in the normal course of business, the Trust, on behalf of the Fund, enters into contracts with service providers that contain general indemnification clauses. The Trust’s maximum exposure under these arrangements is unknown as this would involve future claims that may be made against the Trust that have not yet occurred. Currently, the Trust expects the risk of loss to be remote.
2. Shares of Beneficial Interest
At December 31, 2014, there were an unlimited number of shares authorized (without par value). Transactions in the Fund’s shares were as follows:
| | | | | | | | | | | | | | | | | | |
| | | Year Ended December 31, | |
| | | 2014 | | | | | 2013a | |
| | | Shares | | | Amount | | | | | Shares | | | Amount | |
| | | | | |
| Class 2 Shares: | | | | | | | | | | | | | | | | | | |
Shares sold | | | — | | | $ | — | | | | | | 1,000,000 | | | $ | 10,000,000 | |
| | | | |
| Class 5 Shares: | | | | | | | | | | | | | | | | | | |
Shares sold | | | — | | | $ | — | | | | | | 1,000,000 | | | $ | 10,000,000 | |
| | | | |
aFor the period April 1, 2013 (commencement of operations) to December 31, 2013.
3. Transactions With Affiliates
Franklin Resources, Inc. is the holding company for various subsidiaries that together are referred to as Franklin Templeton Investments. Certain officers and trustees of the Fund are also officers and/or directors of the following subsidiaries:
| | |
| Subsidiary | | Affiliation |
Franklin Alternative Strategies Advisers, LLC (FASA) | | Investment manager |
Franklin Advisers, Inc. (Advisers) | | Investment manager |
Franklin Templeton Investment Management Limited (FTIML) | | Investment manager |
Templeton Asset Management Ltd. (TAML) | | Investment manager |
Franklin Templeton Services, LLC (FT Services) | | Administrative manager |
Franklin Templeton Distributors, Inc. (Distributors) | | Principal underwriter |
Franklin Templeton Investor Services, LLC (Investor Services) | | Transfer agent |
Effective April 1, 2014, the Fund’s investment manager is FASA. Prior to April 1, 2014, Advisers was the Fund’s investment manager.
FRANKLIN TEMPLETON VARIABLE INSURANCE PRODUCTS TRUST
NOTES TO CONSOLIDATED FINANCIAL STATEMENTS
Franklin Managed Volatility Global Allocation VIP Fund (continued)
a. Management Fees
Effective April 1, 2014, the Fund pays an investment management fee to FASA based on the average daily net assets of the Fund and the MVGAF Subsidiary as follows:
| | |
| Annualized Fee Rate | | Net Assets |
1.000% | | Up to and including $1 billion |
0.980% | | Over $1 billion, up to and including $5 billion |
0.960% | | Over $5 billion, up to and including $10 billion |
0.940% | | Over $10 billion, up to and including $15 billion |
0.920% | | Over $15 billion, up to and including $20 billion |
0.900% | | In excess of $20 billion |
Prior to April 1, 2014, the Fund and the MVGAF Subsidiary paid the investment management fee to Advisers.
Management fees paid by the Fund are reduced on assets invested in the MVGAF Subsidiary, in an amount not to exceed the management fees paid by MVGAF Subsidiary.
Under a subadvisory agreement, FTIML and TAML, affiliates of FASA, provide subadvisory services to the Fund. The subadvisory fee is paid by FASA based on the Fund’s average daily net assets, and is not an additional expense of the Fund.
b. Administrative Fees
Effective April 1, 2014, under an agreement with FASA, FT Services provides administrative services to the Fund and the MVGAF Subsidiary. The fee is paid by FASA based on the Fund’s average daily net assets, and is not an additional expense of the Fund and the MVGAF Subsidiary. Prior to April 1, 2014, the fees were paid by Advisers.
c. Distribution Fees
The Board has adopted distribution plans for Class 2 and Class 5 shares pursuant to Rule 12b-1 under the 1940 Act. Under the Fund’s compensation distribution plans, the Fund pays Distributors for costs incurred in connection with the servicing, sale and distribution of the Fund’s shares up to 0.35% and 0.10% per year of its average daily net assets of Class 2 and Class 5, respectively. Some distribution fees are not charged on shares held by affiliates. The Board has agreed to limit the current rate to 0.25% per year for Class 2. The plan year, for purposes of monitoring compliance with the maximum annual plan rates, is February 1 through January 31.
d. Transfer Agent Fees
Investor Services, under terms of an agreement, performs shareholder servicing for the Fund and is not paid by the Fund for the services.
e. Investments in Institutional Fiduciary Trust Money Market Portfolio
The Fund invests in Institutional Fiduciary Trust Money Market Portfolio (Sweep Money Fund), an affiliated open-end management investment company. Management fees paid by the Fund are waived on assets invested in the Sweep Money Fund, as noted on the Consolidated Statement of Operations, in an amount not to exceed the management and administrative fees paid directly or indirectly by the Sweep Money Fund. Prior to January 1, 2014, the waiver was accounted for as a reduction to management fees.
FRANKLIN TEMPLETON VARIABLE INSURANCE PRODUCTS TRUST
NOTES TO CONSOLIDATED FINANCIAL STATEMENTS
Franklin Managed Volatility Global Allocation VIP Fund (continued)
3. Transactions With Affiliates (continued)
f. Waiver and Expense Reimbursements
FASA has contractually agreed in advance to waive or limit its fees and to assume as its own expense certain expenses otherwise payable by the Fund so that the expenses (excluding distribution fees and acquired fund fees and expenses), for each class of the Fund do not exceed 0.83% based on the average net assets of each class (other than certain non-routine expenses or costs, including those relating to litigation, indemnification, reorganizations, and liquidations) until April 30, 2015.
g. Other Affiliated Transactions
At December 31, 2014, Advisers owned 100% of the Fund’s outstanding shares. Investment activities of this shareholder could have a material impact on the Fund.
4. Expense Offset Arrangement
The Fund and the MVGAF Subsidiary have entered into an arrangement with their custodian whereby credits realized as a result of uninvested cash balances are used to reduce a portion of the Fund’s and the MVGAF Subsidiary’s custodian expenses. During the year ended December 31, 2014, the custodian fees were reduced as noted in the Consolidated Statement of Operations.
5. Income Taxes
For tax purposes, capital losses may be carried over to offset future capital gains, if any. During the year ended December 31, 2014, the Fund utilized $115,380 of capital loss carryforwards.
For tax purposes, the Fund may elect to defer any portion of a post-October capital loss to the first day of the following fiscal year. At December 31, 2014, the Fund deferred post-October capital losses of $45,942.
The tax character of distributions paid during the years ended December 31, 2014 and 2013, was as follows:
| | | | | | | | |
| | | 2014 | | | 2013 | |
Distributions paid from: | | | | | | | | |
Ordinary income | | $ | 476,326 | | | $ | 384,000 | |
Long term capital gain | | | 6,674 | | | | — | |
| | | | | | | | |
| | $ | 483,000 | | | $ | 384,000 | |
| | | | | | | | |
At December 31, 2014, the cost of investments, net unrealized appreciation (depreciation) and undistributed ordinary income for income tax purposes were as follows:
| | | | |
Cost of investments | | $ | 19,663,630 | |
| | | | |
Unrealized appreciation | | $ | 1,490,582 | |
Unrealized depreciation | | | (926,722 | ) |
| | | | |
Net unrealized appreciation (depreciation) | | $ | 563,860 | |
| | | | |
Distributable earnings—undistributed ordinary income | | $ | 63,464 | |
| | | | |
FRANKLIN TEMPLETON VARIABLE INSURANCE PRODUCTS TRUST
NOTES TO CONSOLIDATED FINANCIAL STATEMENTS
Franklin Managed Volatility Global Allocation VIP Fund (continued)
Differences between income and/or capital gains as determined on a book basis and a tax basis are primarily due to differing treatments of foreign currency transactions, bond discounts and premiums and offering costs.
6. Investment Transactions
Purchases and sales of investments (excluding short term securities) for the year ended December 31, 2014, aggregated $4,785,815 and $4,407,717, respectively.
7. Concentration of Risk
Investing in foreign securities may include certain risks and considerations not typically associated with investing in U.S. securities, such as fluctuating currency values and changing local and regional economic, political and social conditions, which may result in greater market volatility. In addition, certain foreign securities may not be as liquid as U.S. securities.
8. Other Derivative Information
At December 31, 2014, the Fund’s investments in derivative contracts are reflected on the Consolidated Statement of Assets and Liabilities as follows:
| | | | | | | | | | | | |
| | | Asset Derivatives | | | Liability Derivatives | |
Derivative Contracts
Not Accounted for
as Hedging Instruments | | Consolidated
Statement of Assets and
Liabilities Location | | Fair Value
Amount | | | Consolidated
Statement of Assets and
Liabilities Location | | Fair Value
Amount | |
Foreign exchange contracts | | Unrealized appreciation on forward exchange contracts | | $ | 36,425 | | | Unrealized depreciation on forward exchange contracts | | $ | — | |
For the year ended December 31, 2014, the effect of derivative contracts on the Fund’s Consolidated Statement of Operations was as follows:
| | | | | | | | | | |
Derivative Contracts
Not Accounted for
as Hedging Instruments | | Consolidated Statement of Operations Locations | | Realized
Gain (Loss)
for the Year | | | Change in
Unrealized
Appreciation
(Depreciation)
for the Year | |
Foreign exchange contracts | | Net realized gain (loss) from foreign currency transactions / Net change in unrealized appreciation (depreciation) on translation of other assets and liabilities denominated in foreign currencies | | $ | 87,994 | | | $ | 33,876 | |
Equity contracts | | Net realized gain (loss) from futures contracts | | | 3,497 | | | | — | |
For the year ended December 31, 2014, the average month end fair value of derivatives represented 0.12% of average month end net assets. The average month end number of open derivative contracts for the year w as 3.
See Note 1(c) regarding derivative financial instruments.
FRANKLIN TEMPLETON VARIABLE INSURANCE PRODUCTS TRUST
NOTES TO CONSOLIDATED FINANCIAL STATEMENTS
Franklin Managed Volatility Global Allocation VIP Fund (continued)
9. Credit Facility
The Fund, together with other U.S. registered and foreign investment funds (collectively, Borrowers), managed by Franklin Templeton Investments, are borrowers in a joint syndicated senior unsecured credit facility totaling $1.5 billion (Global Credit Facility) which matured on February 13, 2015. This Global Credit Facility provides a source of funds to the Borrowers for temporary and emergency purposes, including the ability to meet future unanticipated or unusually large redemption requests. The Borrowers expect to renew the Global Credit Facility for a total of $2 billion effective February 13, 2015, which matures on February 12, 2016.
Under the terms of the Global Credit Facility, the Fund shall, in addition to interest charged on any borrowings made by the Fund and other costs incurred by the Fund, pay its share of fees and expenses incurred in connection with the implementation and maintenance of the Global Credit Facility, based upon its relative share of the aggregate net assets of all of the Borrowers, including an annual commitment fee of 0.07% based upon the unused portion of the Global Credit Facility. These fees are reflected in other expenses on the Statement of Operations. During the year ended December 31, 2014, the Fund did not use the Global Credit Facility.
10. Fair Value Measurements
The Fund follows a fair value hierarchy that distinguishes between market data obtained from independent sources (observable inputs) and the Fund’s own market assumptions (unobservable inputs). These inputs are used in determining the value of the Fund’s financial instruments and are summarized in the following fair value hierarchy:
| | • | | Level 1 – quoted prices in active markets for identical financial instruments |
| | • | | Level 2 – other significant observable inputs (including quoted prices for similar financial instruments, interest rates, prepayment speed, credit risk, etc.) |
| | • | | Level 3 – significant unobservable inputs (including the Fund’s own assumptions in determining the fair value of financial instruments) |
The input levels are not necessarily an indication of the risk or liquidity associated with financial instruments at that level.
For movements between the levels within the fair value hierarchy, the Fund has adopted a policy of recognizing the transfers as of the date of the underlying event which caused the movement.
FRANKLIN TEMPLETON VARIABLE INSURANCE PRODUCTS TRUST
NOTES TO CONSOLIDATED FINANCIAL STATEMENTS
Franklin Managed Volatility Global Allocation VIP Fund (continued)
A summary of inputs used as of December 31, 2014, in valuing the Fund’s assets and liabilities carried at fair value, is as follows:
| | | | | | | | | | | | | | | | |
| | | Level 1 | | | Level 2 | | | Level 3 | | | Total | |
| Assets: | | | | | | | | | | | | | | | | |
Investments in Securities: | | | | | | | | | | | | | | | | |
Equity Investments:a,b | | $ | 975,612 | | | $ | — | | | $ | — | | | $ | 975,612 | |
Exchange Traded Funds | | | 11,225,625 | | | | — | | | | — | | | | 11,225,625 | |
Exchange Traded Notes | | | 711,858 | | | | — | | | | — | | | | 711,858 | |
Foreign Government and Agency Securities | | | — | | | | 5,249,450 | | | | — | | | | 5,249,450 | |
U.S. Government and Agency Securities | | | — | | | | 1,990,785 | | | | — | | | | 1,990,785 | |
Short Term Investments | | | 74,160 | | | | — | | | | — | | | | 74,160 | |
| | | | |
Total Investments in Securities | | $ | 12,987,255 | | | $ | 7,240,235 | | | $ | — | | | $ | 20,227,490 | |
| | | | |
Other Financial Instruments | | | | | | | | | | | | | | | | |
Forward Exchange Contracts | | $ | — | | | $ | 36,425 | | | $ | — | | | $ | 36,425 | |
| | | | |
aIncludes common and preferred stocks as w ell as other equity investments.
bFor detailed categories, see the accompanying Consolidated Statement of Investments.
11. SUBSEQUENT EVENTS
The Fund has evaluated subsequent events through the issuance of the financial statements and determined that no events have occurred that require disclosure other than those already disclosed in the consolidated financial statements.
Abbreviations
| | | | | | | | | | |
| Counterparty | | Currency | | Selected Portfolio |
| | | | | |
| BZWS | | Barclays Bank PLC | | AUD | | Australian Dollar | | ADR | | American Depositary Receipt |
| | | | | |
| | | | CAD | | Canadian Dollar | | ETF | | Exchange Traded Fund |
| | | | | |
| | | | EUR | | Euro | | ETN | | Exchange Traded Note |
| | | | | |
| | | | GBP | | British Pound | | | | |
| | | | | |
| | | | JPY | | Japanese Yen | | | | |
| | | | | |
| | | | MXN | | Mexican Peso | | | | |
| | | | | |
| | | | MYR | | Malaysian Ringgit | | | | |
| | | | | |
| | | | PLN | | Polish Zloty | | | | |
FRANKLIN TEMPLETON VARIABLE INSURANCE PRODUCTS TRUST
Report of Independent Registered Public Accounting Firm
Franklin Managed Volatility Global Allocation VIP Fund
To the Board of Trustees and Shareholders of Franklin Templeton Variable Insurance Products Trust
In our opinion, the accompanying consolidated statement of assets and liabilities, including the consolidated statement of investments, and the related consolidated statements of operations and of changes in net assets and the consolidated financial highlights present fairly, in all material respects, the financial position of The Franklin Managed Volatility Global Allocation VIP Fund (the “Fund”) at December 31, 2014, the results of its operations for the year then ended, the consolidated changes in its net assets and the consolidated financial highlights for the periods presented, in conformity with accounting principles generally accepted in the United States of America. These consolidated financial statements and consolidated financial highlights (hereafter referred to as “financial statements”) are the responsibility of the Fund’s management. Our responsibility is to express an opinion on these financial statements based on our audits. We conducted our audits of these financial statements in accordance with the standards of the Public Company Accounting Oversight Board (United States). Those standards require that we plan and perform the audit to obtain reasonable assurance about whether the financial statements are free of material misstatement. An audit includes examining, on a test basis, evidence supporting the amounts and disclosures in the financial statements, assessing the accounting principles used and significant estimates made by management, and evaluating the overall financial statement presentation. We believe that our audits, which included confirmation of securities at December 31, 2014 by correspondence with the custodian, transfer agent and brokers, provide a reasonable basis for our opinion.
PricewaterhouseCoopers LLP
San Francisco, California
February 13, 2015
FRANKLIN TEMPLETON VARIABLE INSURANCE PRODUCTS TRUST
Tax Information (unaudited)
Franklin Managed Volatility Global Allocation VIP Fund
Under Section 852(b)(3)(C) of the Internal Revenue Code (Code), the Fund hereby reports the maximum amount allowable but no less than $6,674 as a long term capital gain dividend for the fiscal year ended December 31, 2014.
FMV P2 P5 01/15
SUPPLEMENT DATED JANUARY 30, 2015
TOTHE PROSPECTUS DATED MAY 1, 2014
OF
FRANKLIN MANAGED VOLATILITY GLOBAL ALLOCATION VIP FUND
(A series of Franklin Templeton Variable Insurance Products Trust)
The Prospectus is amended as follows:
I. The “Fund Details – Management – Manager of Managers Structure” section on page FMV-D13 of the prospectuses for Class 2 and Class 5 shares is replaced with the following:
Manager of Managers Structure
Alternative Strategies and the Trust have received an exemptive order from the SEC that allows the Fund to operate in a “manager of managers” structure whereby Alternative Strategies, as the Fund’s investment manager, can appoint and replace both wholly-owned and unaffiliated sub-advisors, and enter into, amend and terminate sub-advisory agreements with such sub-advisors, each subject to board approval but without obtaining prior shareholder approval (the “Manager of Managers Structure”). The Fund will, however, inform shareholders of the hiring of any new sub-advisor within 90 days after the hiring. The SEC exemptive order provides the Fund with greater efficiency and without incurring the expense and delays associated with obtaining shareholder approval of sub-advisory agreements with such sub-advisors.
The use of the Manager of Managers Structure with respect to the Fund is subject to certain conditions that are set forth in the SEC exemptive order. Under the Manager of Managers Structure, Alternative Strategies has the ultimate responsibility, subject to oversight by the Fund’s board of trustees, to oversee sub-advisors and recommend their hiring, termination and replacement. Alternative Strategies will also, subject to the review and approval of the Fund’s board of trustees: set the Fund’s overall investment strategy; evaluate, select and recommend sub-advisors to manage all or a portion of the Fund’s assets; and implement procedures reasonably designed to ensure that each sub-advisor complies with the Fund’s investment goal, policies and restrictions. Subject to review by the Fund’s board of trustees, Alternative Strategies will allocate and, when appropriate, reallocate the Fund’s assets among sub-advisors and monitor and evaluate the sub-advisors’ performance.
Please keep this supplement for future reference.
FRANKLIN TEMPLETON VARIABLE INSURANCE PRODUCTS TRUST
Index Descriptions
The indexes are unmanaged and include reinvested distributions.
For Russell Indexes: Russell Investment Group is the source and owner of the trademarks, service marks and copyrights related to the Russell Indexes. Russell® is a trademark of Russell Investment Group.
See www.franklintempletondatasources.com for additional data provider information.
Barclays U.S. Aggregate Index is a market capitalization-weighted index representing the U.S. investment-grade, fixed-rate, taxable bond market with index components for government and corporate, mortgage pass-through and asset-backed securities. All issues included are SEC registered, taxable, dollar denominated and nonconvertible, must have at least one year to final maturity and must be rated investment grade (Baa3/BBB-/BBB- or higher) using the middle rating of Moody’s, Standard & Poor’s and Fitch, respectively.
Barclays U.S. Government Index: Intermediate Component is the intermediate component of the Barclays U.S. Government Index, which includes public obligations of the U.S. Treasury with at least one year to final maturity and publicly issued debt of U.S. government agencies, quasi-federal corporations, and corporate or foreign debt guaranteed by the U.S. government.
Bloomberg Commodity Index consists of exchanged-traded futures on physical commodities weighted to account for economic significance and market liquidity. Prior to 7/1/14, the index was known as the Dow Jones-UBS Commodity Index.
Citigroup World Government Bond Index is a market capitalization-weighted index consisting of investment-grade world government bond markets.
Consumer Price Index (CPI) is a commonly used measure of the inflation rate.
Credit Suisse (CS) High Yield Index is designed to mirror the investable universe of the U.S. dollar-denominated high yield debt market.
Dow Jones Industrial Average is a price-weighted average of blue-chip stocks that are generally the leaders in their industry.
FTSE® EPRA®/NAREIT® Developed Index is a free float-adjusted index designed to measure the performance of publicly traded real estate securities in the North American, European and Asian real estate markets.
J.P. Morgan (JPM) Global Government Bond Index (GGBI) tracks total returns for liquid, fixed-rate, domestic government bonds with maturities greater than one year issued by developed countries globally.
Lipper Multi-Sector Income Funds Classification Average is calculated by averaging the total returns of all funds within the Lipper Multi-Sector Income Funds classification in the Lipper Open-End underlying funds universe. Lipper Multi-Sector Income Funds are defined as funds that seek current income by allocating assets among different fixed income securities sectors (not primarily in one sector except for defensive purposes), including U.S. and foreign governments, with a significant portion rated below investment grade. For the 12-month period ended 12/31/14, there were 246 funds in this category. Lipper calculations do not include contract fees, expenses or sales charges, and may have been different if such charges had been considered.
Lipper VIP Equity Income Funds Classification Average is an equally weighted average calculation of performance figures for all funds within the Lipper Equity Income Funds classification in the Lipper VIP underlying funds universe. Lipper Equity Income Funds seek relatively high current income and growth of income through investing 60% or more of their portfolios in equities. For the 12-month period ended 12/31/14, there were 64 funds in this category. Lipper calculations do not include contract fees, expenses or sales charges, and may have been different if such charges had been considered.
Lipper VIP General U.S. Government Funds Classification Average is an equally weighted average calculation of performance figures for all funds within the Lipper General U.S. Government Funds classification in the Lipper VIP underlying funds universe. Lipper General U.S. Government Funds invest primarily in U.S. government and agency issues. For the 12-month period ended 12/31/14, there were 50 funds in this category. Lipper calculations do not include contract fees, expenses or sales charges, and may have been different if such charges had been considered.
Lipper VIP High Yield Funds Classification Average is an equally weighted average calculation of performance figures for all funds within the Lipper High Yield Funds Classification in the Lipper VIP underlying funds universe. Lipper High Yield Funds aim at high (relative) current yield from fixed income securities, have no quality or maturity restrictions, and tend to invest in lower grade debt issues. For the 12-month period
FRANKLIN TEMPLETON VARIABLE INSURANCE PRODUCTS TRUST
INDEX DESCRIPTIONS
ended 12/31/14, there were 112 funds in this category. Lipper calculations do not include contract fees, expenses or sales charges, and may have been different if such charges had been considered.
MSCI All Country World Index (ACWI) is a free float-adjusted, market capitalization-weighted index designed to measure equity market performance in global developed and emerging markets.
MSCI Emerging Markets (EM) Index is a free float-adjusted, market capitalization-weighted index designed to measure equity market performance in global emerging markets.
MSCI Europe, Australasia, Far East (EAFE) Index is a free float-adjusted, market capitalization-weighted index designed to measure equity market performance in global developed markets excluding the U.S. and Canada.
MSCI World Index is a free float-adjusted, market capitalization-weighted index designed to measure equity market performance in global developed markets.
Russell 1000® Growth Index is market capitalization weighted and measures performance of those Russell 1000® Index companies with higher price-to-book ratios and higher forecasted growth values.
Russell 1000® Index is market capitalization weighted and measures performance of the largest companies in the Russell 3000® Index, which represents the majority of the U.S. market’s total capitalization.
Russell 2500™ Index is market capitalization weighted and measures performance of the smallest companies in the Russell 3000® Index, which represent a modest amount of the Russell 3000® Index’s total market capitalization.
Russell 2500™ Value Index is market capitalization weighted and measures performance of those Russell 2500 TM Index companies with lower price-to-book ratios and lower forecasted growth values.
Russell 3000® Growth Index is market capitalization weighted and measures performance of those Russell 3000® Index companies with higher price-to-book ratios and higher forecasted growth values.
Russell 3000® Index is market capitalization weighted and measures performance of the largest U.S. companies based on total market capitalization and represents the majority of the investable U.S. equity market.
Russell Midcap® Growth Index is market capitalization weighted and measures performance of those Russell Midcap® Index companies with higher price-to-book ratios and higher forecasted growth values.
Russell Midcap® Index is market capitalization weighted and measures performance of the smallest companies in the Russell 1000® Index, which represent a modest amount of the Russell 1000® Index’s total market capitalization.
Standard & Poor’s® 500 Index (S&P 500®) is a market capitalization-weighted index of 500 stocks designed to measure total U.S. equity market performance.
Standard & Poor’s®/International Finance Corporation Investable (S&P/IFCI) Composite Index is a free float-adjusted, market capitalization-weighted index designed to measure equity performance in global emerging markets.
Board Members and Officers
The name, year of birth and address of the officers and board members, as well as their affiliations, positions held with the Trust, principal occupation during at least the past five years and number of portfolios overseen in the Franklin Templeton Investments fund complex are shown below. Generally, each board member serves until that person’s successor is elected and qualified.
Independent Board Members
| | | | | | | | |
Name, Year of Birth
and Address | | Position | | Length of
Time Served | | Number of Portfolios in
Fund Complex Overseen
by Board Member* | | Other Directorships Held During
at Least the Past 5 Years |
| | | | |
Harris J. Ashton (1932) One Franklin Parkway San Mateo, CA 94403-1906 | | Trustee | | Since 1988 | | 137 | | Bar-S Foods (meat packing company) (1981-2010). |
|
| Principal Occupation During at Least the Past 5 Years: |
| Director of various companies; and formerly, Director, RBC Holdings, Inc. (bank holding company) (until 2002); and President, Chief Executive Officer and Chairman of the Board, General Host Corporation (nursery and craft centers) (until 1998). |
| | | | |
Mary C. Choksi (1950) One Franklin Parkway San Mateo, CA 94403-1906 | | Trustee | | Since October 2014 | | 111 | | Avis Budget Group Inc. (car rental), Omnicom Group Inc. (advertising and marketing communications services) and H.J. Heinz Company (processed foods and allied products) (1998-2006). |
|
| Principal Occupation During at Least the Past 5 Years: |
| Founding Partner and Senior Managing Director, Strategic Investment Group (investment management group) (1987-present); director of various companies; and formerly, Founding Partner and Managing Director, Emerging Markets Management LLC (investment management firm) (1987-2011); Loan Officer/Senior Loan Officer/Senior Pension Investment Officer, World Bank Group (international financial institution) (1977-1987). |
| | | | |
Sam Ginn (1937) One Franklin Parkway San Mateo, CA 94403-1906 | | Trustee | | Since 2007 | | 111 | | ICO Global Communications (Holdings) Limited (satellite company) (2006-2010), Chevron Corporation (global energy company) (1989-2009), Hewlett-Packard Company (technology company) (1996-2002), Safeway, Inc. (grocery retailer) (1991-1998) and TransAmerica Corporation (insurance company) (1989-1999). |
|
| Principal Occupation During at Least the Past 5 Years: |
| Private investor; and formerly, Chairman, First Responder Network Authority (FirstNet) (interoperable wireless broadband network) (2012-2014); Chairman of the Board, Vodafone AirTouch, PLC (wireless company) (1999-2000); Chairman of the Board and Chief Executive Officer, AirTouch Communications (cellular communications) (1993-1998) and Pacific Telesis Group (telephone holding company) (1988-1994). |
| | | | |
Edith E. Holiday (1952) One Franklin Parkway San Mateo, CA 94403-1906 | | Trustee | | Since 2005 | | 137 | | Hess Corporation (exploration and refining of oil and gas), H.J. Heinz Company (processed foods and allied products) (1994-2013), RTI International Metals, Inc. (manufacture and distribution of titanium), Canadian National Railway (railroad) and White Mountains Insurance Group, Ltd. (holding company). |
|
| Principal Occupation During at Least the Past 5 Years: |
| Director or Trustee of various companies and trusts; and formerly, Assistant to the President of the United States and Secretary of the Cabinet (1990-1993); General Counsel to the United States Treasury Department (1989-1990); and Counselor to the Secretary and Assistant Secretary for Public Affairs and Public Liaison-United States Treasury Department (1988-1989). |
Independent Board Members (continued)
| | | | | | | | |
Name, Year of Birth
and Address | | Position | | Length of
Time Served | | Number of Portfolios in
Fund Complex Overseen
by Board Member* | | Other Directorships Held During
at Least the Past 5 Years |
| | | | |
J. Michael Luttig (1954) One Franklin Parkway San Mateo, CA 94403-1906 | | Trustee | | Since 2009 | | 137 | | Boeing Capital Corporation (aircraft financing) (2006-2013). |
|
| Principal Occupation During at Least the Past 5 Years: |
| Executive Vice President, General Counsel and member of the Executive Council, The Boeing Company (aerospace company); and formerly, Federal Appeals Court Judge, U.S. Court of Appeals for the Fourth Circuit (1991-2006). |
| | | | |
Frank A. Olson (1932) One Franklin Parkway San Mateo, CA 94403-1906 | | Trustee | | Since 2005 | | 137 | | Hess Corporation (exploration and refining of oil and gas) (1998-2013). |
|
| Principal Occupation During at Least the Past 5 Years: |
| Director of various companies; and formerly, Chairman of the Board, The Hertz Corporation (car rental) (1980-2000) and Chief Executive Officer (1977-1999); and Chairman of the Board, President and Chief Executive Officer, UAL Corporation (airlines) (June-December 1987). |
| | | | |
Larry D. Thompson (1945) One Franklin Parkway San Mateo, CA 94403-1906 | | Trustee | | Since 2007 | | 137 | | Cbeyond, Inc. (business communications provider) (2010-2012), The Southern Company (energy company) (December 2014; previously 2010-2012) and Graham Holdings Company (education and media organization) (2011-present). |
|
| Principal Occupation During at Least the Past 5 Years: |
| Executive Vice President – Government Affairs, General Counsel and Corporate Secretary, PepsiCo, Inc. (consumer products) (2012-present); and formerly, John A. Sibley Professor of Corporate and Business Law, University of Georgia School of Law (2011-2012); Senior Vice President – Government Affairs, General Counsel and Secretary, PepsiCo, Inc. (2004-2011); Senior Fellow of The Brookings Institution (2003-2004); Visiting Professor, University of Georgia School of Law (2004); and Deputy Attorney General, U.S. Department of Justice (2001-2003). |
| | | | |
John B. Wilson (1959) One Franklin Parkway San Mateo, CA 94403-1906 | | Lead Independent Trustee | | Trustee since 2007 and Lead Independent Trustee since 2008 | | 111 | | None |
|
| Principal Occupation During at Least the Past 5 Years: |
| President, Staples Europe (office supplies) (2012-present); President and Founder, Hyannis Port Capital, Inc. (real estate and private equity investing); serves on private and non-profit boards; and formerly, Chief Operating Officer and Executive Vice President, Gap, Inc. (retail) (1996-2000); Chief Financial Officer and Executive Vice President – Finance and Strategy, Staples, Inc. (1992-1996); Senior Vice President – Corporate Planning, Northwest Airlines, Inc. (airlines) (1990-1992); and Vice President and Partner, Bain & Company (consulting firm) (1986-1990). |
Interested Board Members and Officers
| | | | | | | | |
Name, Year of Birth
and Address | | Position | | Length of
Time Served | | Number of Portfolios in
Fund Complex Overseen
by Board Member* | | Other Directorships Held During
at Least the Past 5 Years |
| | | | |
**Gregory E. Johnson (1961) One Franklin Parkway San Mateo, CA 94403-1906 | | Trustee | | Since 2013 | | 147 | | None |
|
| Principal Occupation During at Least the Past 5 Years: |
| Chairman of the Board, Member – Office of the Chairman, Director, President and Chief Executive Officer, Franklin Resources, Inc.; officer and/or director or trustee, as the case may be, of some of the other subsidiaries of Franklin Resources, Inc. and of 44 of the investment companies in Franklin Templeton Investments; and Vice Chairman, Investment Company Institute. |
| | | | |
**Rupert H. Johnson, Jr. (1940) One Franklin Parkway San Mateo, CA 94403-1906 | | Chairman of the Board and Trustee | | Chairman of the Board since 2013 and Trustee since 1988 | | 137 | | None |
|
| Principal Occupation During at Least the Past 5 Years: |
| Vice Chairman, Member – Office of the Chairman and Director, Franklin Resources, Inc.; Director, Franklin Advisers, Inc.; Senior Vice President, Franklin Advisory Services, LLC; and officer and/or director or trustee, as the case may be, of some of the other subsidiaries of Franklin Resources, Inc. and of 41 of the investment companies in Franklin Templeton Investments. |
| | | | |
Alison E. Baur (1964) One Franklin Parkway San Mateo, CA 94403-1906 | | Vice President | | Since 2012 | | Not Applicable | | Not Applicable |
|
| Principal Occupation During at Least the Past 5 Years: |
| Deputy General Counsel, Franklin Templeton Investments; and officer of some of the other subsidiaries of Franklin Resources, Inc. and of 46 of the investment companies in Franklin Templeton Investments. |
| | | | |
Laura F. Fergerson (1962) One Franklin Parkway San Mateo, CA 94403-1906 | | Chief Executive Officer – Finance and Administration | | Since 2009 | | Not Applicable | | Not Applicable |
|
| Principal Occupation During at Least the Past 5 Years: |
| Senior Vice President, Franklin Templeton Services, LLC; and officer of 46 of the investment companies in Franklin Templeton Investments. |
| | | | |
Gaston Gardey (1967) One Franklin Parkway San Mateo, CA 94403-1906 | | Treasurer, Chief Financial Officer and Chief Accounting Officer | | Since 2009 | | Not Applicable | | Not Applicable |
|
| Principal Occupation During at Least the Past 5 Years: |
| Director, Fund Accounting, Franklin Templeton Investments; and officer of 27 of the investment companies in Franklin Templeton Investments. |
| | | | |
Aliya S. Gordon (1973) One Franklin Parkway San Mateo, CA 94403-1906 | | Vice President | | Since 2009 | | Not Applicable | | Not Applicable |
|
| Principal Occupation During at Least the Past 5 Years: |
| Senior Associate General Counsel, Franklin Templeton Investments; officer of 46 of the investment companies in Franklin Templeton Investments; and formerly, Litigation Associate, Steefel, Levitt & Weiss, LLP (2000-2004). |
Interested Board Members and Officers (continued)
| | | | | | | | |
Name, Year of Birth
and Address | | Position | | Length of
Time Served | | Number of Portfolios in
Fund Complex Overseen
by Board Member* | | Other Directorships Held During
at Least the Past 5 Years |
| | | | |
Steven J. Gray (1955) One Franklin Parkway San Mateo, CA 94403-1906 | | Vice President | | Since 2009 | | Not Applicable | | Not Applicable |
|
| Principal Occupation During at Least the Past 5 Years: |
| Senior Associate General Counsel, Franklin Templeton Investments; Vice President, Franklin Templeton Distributors, Inc. and Franklin Alternative Strategies Advisers, LLC; and officer of 46 of the investment companies in Franklin Templeton Investments. |
| | | | |
Selena L. Holmes (1965) 100 Fountain Parkway St. Petersburg, FL 33716-1205 | | Vice President – AML Compliance | | Since 2012 | | Not Applicable | | Not Applicable |
|
| Principal Occupation During at Least the Past 5 Years: |
| Director, Global Compliance Monitoring; Chief Compliance Officer, Franklin Alternative Strategies Advisers, LLC; Vice President, Franklin Templeton Companies, LLC; and officer of 46 of the investment companies in Franklin Templeton Investments. |
| | | | |
Edward B. Jamieson (1948) One Franklin Parkway San Mateo, CA 94403-1906 | | President and Chief Executive Officer – Investment Management | | Since 2010 | | Not Applicable | | Not Applicable |
|
| Principal Occupation During at Least the Past 5 Years: |
| President, Chief Investment Officer and Director, Franklin Advisers, Inc.; Executive Vice President, Franklin Templeton Institutional, LLC; and officer and/or trustee, as the case may be, of some of the other subsidiaries of Franklin Resources, Inc. and of 10 of the investment companies in Franklin Templeton Investments. |
| | | | |
Kimberly H. Novotny (1972) 300 S.E. 2nd Street Fort Lauderdale, FL 33301-1923 | | Vice President | | Since 2013 | | Not Applicable | | Not Applicable |
|
| Principal Occupation During at Least the Past 5 Years: |
| Associate General Counsel, Franklin Templeton Investments; Vice President and Secretary, Fiduciary Trust International of the South; Vice President, Templeton Investment Counsel, LLC; Assistant Secretary, Franklin Resources, Inc.; and officer of 46 of the investment companies in Franklin Templeton Investments. |
| | | | |
Robert C. Rosselot (1960) 300 S.E. 2nd Street Fort Lauderdale, FL 33301-1923 | | Chief Compliance Officer | | Since 2013 | | Not Applicable | | Not Applicable |
|
| Principal Occupation During at Least the Past 5 Years: |
| Director, Global Compliance, Franklin Templeton Investments; Vice President, Franklin Templeton Companies, LLC; officer of 46 of the investment companies in Franklin Templeton Investments; and formerly, Senior Associate General Counsel, Franklin Templeton Investments (2007-2013); and Secretary and Vice President, Templeton Group of Funds (2004-2013). |
| | | | |
Karen L. Skidmore (1952) One Franklin Parkway San Mateo, CA 94403-1906 | | Vice President and Secretary | | Since 2006 | | Not Applicable | | Not Applicable |
|
| Principal Occupation During at Least the Past 5 Years: |
| Senior Associate General Counsel, Franklin Templeton Investments; and officer of 46 of the investment companies in Franklin Templeton Investments. |
Interested Board Members and Officers (continued)
| | | | | | | | |
Name, Year of Birth
and Address | | Position | | Length of
Time Served | | Number of Portfolios in
Fund Complex Overseen
by Board Member* | | Other Directorships Held During
at Least the Past 5 Years |
| | | | |
Craig S. Tyle (1960) One Franklin Parkway San Mateo, CA 94403-1906 | | Vice President | | Since 2005 | | Not Applicable | | Not Applicable |
|
| Principal Occupation During at Least the Past 5 Years: |
| General Counsel and Executive Vice President, Franklin Resources, Inc.; and officer of some of the other subsidiaries of Franklin Resources, Inc. and of 46 of the investment companies in Franklin Templeton Investments. |
| | | | |
Lori A. Weber (1964) 300 S.E. 2nd Street Fort Lauderdale, FL 33301-1923 | | Vice President | | Since 2011 | | Not Applicable | | Not Applicable |
|
| Principal Occupation During at Least the Past 5 Years: |
| Senior Associate General Counsel, Franklin Templeton Investments; Assistant Secretary, Franklin Resources, Inc.; Vice President and Secretary, Templeton Investment Counsel, LLC; Vice President, Fiduciary Trust International of the South; and officer of 46 of the investment companies in Franklin Templeton Investments. |
*We base the number of portfolios on each separate series of the U.S. registered investment companies within the Franklin Templeton Investments fund complex. These portfolios have a common investment manager or affiliated investment managers.
**Gregory E. Johnson is considered to be an interested person of the Fund under the federal securities laws due to his position as an officer and director of Franklin Resources, Inc. (Resources), which is the parent company of the Fund’s investment manager and distributor. Rupert H. Johnson, Jr. is considered to be an interested person of the Fund under the federal securities laws due to his position as officer and director and major shareholder of Resources.
Note 1: Rupert H. Johnson, Jr. is the uncle of Gregory E. Johnson.
Note 2: Officer information is current as of the date of this report. It is possible that after this date, information about officers may change.
The Sarbanes-Oxley Act of 2002 and Rules adopted by the Securities and Exchange Commission require the Fund to disclose whether the Fund’s Audit Committee includes at least one member who is an audit committee financial expert within the meaning of such Act and Rules. The Fund’s Board has determined that there is at least one such financial expert on the Audit Committee and has designated John B. Wilson as its audit committee financial expert. The Board believes that Mr. Wilson qualifies as such an expert in view of his extensive business background and experience, including service as chief financial officer of Staples, Inc. from 1992 to 1996. Mr. Wilson has been a Member and Chairman of the Fund’s Audit Committee since 2007. As a result of such background and experience, the Board believes that Mr. Wilson has acquired an understanding of generally accepted accounting principles and financial statements, the general application of such principles in connection with the accounting estimates, accruals and reserves, and analyzing and evaluating financial statements that present a breadth and level of complexity of accounting issues generally comparable to those of the Fund, as well as an understanding of internal controls and procedures for financial reporting and an understanding of audit committee functions. Mr. Wilson is an independent Board member as that term is defined under the relevant Securities and Exchange Commission Rules and Releases.
The Statement of Additional Information (SAI) includes additional information about the board members and is available, without charge, upon request. Shareholders may call (800) 321-8563 or their insurance companies to request the SAI.
FRANKLIN TEMPLETON VARIABLE INSURANCE PRODUCTS TRUST
Shareholder Information
Proxy Voting Policies and Procedures
The Trust’s investment manager has established Proxy Voting Policies and Procedures (Policies) that the Trust uses to determine how to vote proxies relating to portfolio securities. Shareholders may view the Trust’s complete Policies online at franklintempleton.com. Alternatively, shareholders may request copies of the Policies free of charge by calling the Proxy Group collect at (954) 527-7678 or by sending a written request to: Franklin Templeton Companies, LLC, 300 S.E. 2nd Street, Fort Lauderdale, FL 33301, Attention: Proxy Group. Copies of the Trust’s proxy voting records are also made available online at franklintempleton.com and posted on the U.S. Securities and Exchange Commission’s website at sec.gov and reflect the most recent 12-month period ended June 30.
Quarterly Statement of Investments
The Trust files a complete statement of investments with the U.S. Securities and Exchange Commission for the first and third quarters for each fiscal year on Form N-Q. Shareholders may view the filed Form N-Q by visiting the Commission’s website at sec.gov. The filed form may also be viewed and copied at the Commission’s Public Reference Room in Washington, DC. Information regarding the operations of the Public Reference Room may be obtained by calling (800) SEC-0330.
Annual Report
Franklin Templeton
Variable Insurance Products Trust
Investment Managers
Franklin Advisers, Inc.
Franklin Advisory Services, LLC
Franklin Mutual Advisers, LLC
Franklin Templeton Institutional, LLC
Templeton Asset Management Ltd.
Templeton Global Advisors Limited
Templeton Investment Counsel, LLC
Fund Administrator
Franklin Templeton Services, LLC
Distributor
Franklin Templeton Distributors, Inc.
Franklin Templeton Variable Insurance Products Trust (FTVIP) shares are not offered to the public; they are offered and sold only to:
(1) insurance company separate accounts (Separate Account) to serve as the underlying investment vehicle for variable contracts;
(2) certain qualified plans; and (3) other mutual funds (funds of funds).
Authorized for distribution to investors in Separate Accounts only when accompanied or preceded by the current prospectus for the applicable contract, which includes the Separate Account and the FTVIP prospectuses. Investors should carefully consider a fund’s investment goals, risks, charges and expenses before investing. The prospectus contains this and other information; please read it carefully before investing.
To help ensure we provide you with quality service, all calls to and from our service areas are monitored and/or recorded.
| | |
| ©2015 Franklin Templeton Investments. All rights reserved. | | VIP2 A 02/15 |
| (a) | The Registrant has adopted a code of ethics that applies to its principal executive officers and principal financial and accounting officer. |
| (f) | Pursuant to Item 12(a)(1), the Registrant is attaching as an exhibit a copy of its code of ethics that applies to its principal executive officers and principal financial and accounting officer. |
| Item 3. | Audit Committee Financial Expert. |
| (a) (1) | The Registrant has an audit committee financial expert serving on its audit committee. |
| (2) | The audit committee financial expert is John B. Wilson and he is “independent” as defined under the relevant Securities and Exchange Commission Rules and Releases. |
| Item 4. | Principal Accountant Fees and Services. |
(a) Audit Fees
The aggregate fees paid to the principal accountant for professional services rendered by the principal accountant for the audit of the registrant’s annual financial statements or for services that are normally provided by the principal accountant in connection with statutory and regulatory filings or engagements were $879,564 for the fiscal year ended December 31, 2014 and $914,590 for the fiscal year ended December 31, 2013.
(b) Audit-Related Fees
There were no fees paid to the principal accountant for assurance and related services rendered by the principal accountant to the registrant that are reasonably related to the performance of the audit of the registrant’s financial statements and are not reported under paragraph (a) of Item 4.
There were no fees paid to the principal accountant for assurance and related services rendered by the principal accountant to the registrant’s investment adviser and any entity controlling, controlled by or under common control with the investment adviser that provides ongoing services to the registrant that are reasonably related to the performance of the audit of their financial statements.
There were no fees paid to the principal accountant for professional services rendered by the principal accountant to the registrant for tax compliance, tax advice and tax planning.
The aggregate fees paid to the principal accountant for professional services rendered by the principal accountant to the registrant’s investment adviser and any entity controlling, controlled by or under common control with the investment adviser that provides ongoing services to the registrant for tax compliance, tax advice and tax planning were $0 for the fiscal year ended December 31, 2014 and $6,930 for the fiscal year ended December 31, 2013. The services for which these fees were paid included technical tax consultation for capital gain tax and withholding tax reporting for foreign governments and requirements on local country’s self-certification forms.
The aggregate fees paid to the principal accountant for products and services rendered by the principal accountant to the registrant not reported in paragraphs (a)-(c) of Item 4 were $9,566 for the fiscal year ended December 31, 2014 and $0 for the fiscal year ended December 31, 2013. The services for which these fees were paid include review of materials provided to the fund Board in connection with the investment management contract renewal process.
The aggregate fees paid to the principal accountant for products and services rendered by the principal accountant to the registrant’s investment adviser and any entity controlling, controlled by or under common control with the investment adviser that provides ongoing services to the registrant other than services reported in paragraphs (a)-(c) of Item 4 were $195,213 for the fiscal year ended December 31, 2014 and $59,809 for the fiscal year ended December 31, 2013. The services for which these fees were paid included preparation and review of materials provided to the fund Board in connection with the investment management contract renewal process, certifying asset under management, and XBRL tagging on financial statements. Other services include compliance examination for Investment Advisor Act rule 204-2 and 206-4(2).
(e) (1) The registrant’s audit committee is directly responsible for approving the services to be provided by the auditors, including:
(i) pre-approval of all audit and audit related services;
(ii) pre-approval of all non-audit related services to be provided to the Fund by the auditors;
(iii) pre-approval of all non-audit related services to be provided to the registrant by the auditors to the registrant’s investment adviser or to any entity that controls, is controlled by or is under common control with the registrant’s investment adviser and that provides ongoing services to the registrant where the non-audit services relate directly to the operations or financial reporting of the registrant; and
(iv) establishment by the audit committee, if deemed necessary or appropriate, as an alternative to committee pre-approval of services to be provided by the auditors, as required by paragraphs (ii) and (iii) above, of policies and procedures to permit such services to be pre-approved by other means, such as through establishment of guidelines or by action of a designated member or members of the committee; provided the policies and procedures are detailed as to the
particular service and the committee is informed of each service and such policies and procedures do not include delegation of audit committee responsibilities, as contemplated under the Securities Exchange Act of 1934, to management; subject, in the case of (ii) through (iv), to any waivers, exceptions or exemptions that may be available under applicable law or rules.
(e) (2) None of the services provided to the registrant described in paragraphs (b)-(d) of Item 4 were approved by the audit committee pursuant to paragraph (c)(7)(i)(C) of Rule 2-01 of regulation S-X.
| (f) | No disclosures are required by this Item 4(f). |
(g) The aggregate non-audit fees paid to the principal accountant for services rendered by the principal accountant to the registrant and the registrant’s investment adviser and any entity controlling, controlled by or under common control with the investment adviser that provides ongoing services to the registrant were $204,779 for the fiscal year ended December 31, 2014 and $66,739 for the fiscal year ended December 31, 2013.
(h) The registrant’s audit committee of the board has considered whether the provision of non-audit services that were rendered to the registrant’s investment adviser (not including any sub-adviser whose role is primarily portfolio management and is subcontracted with or overseen by another investment adviser), and any entity controlling, controlled by, or under common control with the investment adviser that provides ongoing services to the registrant that were not pre-approved pursuant to paragraph (c)(7)(ii) of Rule 2-01 of Regulation S-X is compatible with maintaining the principal accountant’s independence.
| Item 5. | Audit Committee of Listed Registrants. N/A |
| Item 6. | Schedule of Investments. N/A |
| Item 7. | Disclosure of Proxy Voting Policies and Procedures for Closed-End Management Investment Companies. N/A |
| Item 8. | Portfolio Managers of Closed-End Management Investment Companies. N/A |
| Item 9. | Purchases of Equity Securities by Closed-End Management Investment Company and Affiliated Purchasers. N/A |
| Item 10. | Submission of Matters to a Vote of Security Holders. |
There have been no changes to the procedures by which shareholders may recommend nominees to the Registrant’s Board of Trustees that would require disclosure herein.
| Item 11. | Controls and Procedures. |
(a) Evaluation of Disclosure Controls and Procedures. The Registrant maintains disclosure controls and procedures that are designed to ensure that information required to be disclosed in the Registrant’s filings under the Securities Exchange Act of 1934 and the Investment Company Act of 1940 is recorded, processed, summarized and reported within the periods specified in the rules and forms of the Securities and Exchange Commission. Such information is accumulated and communicated to the Registrant’s management, including its principal executive officer and principal financial officer, as appropriate, to allow timely decisions regarding required disclosure. The Registrant’s management, including the principal executive officer and the principal financial officer, recognizes that any set of controls and procedures, no matter how well designed and operated, can provide only reasonable assurance of achieving the desired control objectives.
Within 90 days prior to the filing date of this Shareholder Report on Form N-CSR, the Registrant had carried out an evaluation, under the supervision and with the participation of the Registrant’s management, including the Registrant’s principal executive officer and the Registrant’s principal financial officer, of the effectiveness of the design and operation of the Registrant’s disclosure controls and procedures. Based on such evaluation, the Registrant’s principal executive officer and principal financial officer concluded that the Registrant’s disclosure controls and procedures are effective.
(b) Changes in Internal Controls. There have been no changes in the Registrant’s internal controls or in other factors that could materially affect the internal controls over financial reporting subsequent to the date of their evaluation in connection with the preparation of this Shareholder Report on Form N-CSR.
(a)(1) Code of Ethics
(a)(2) Certifications pursuant to Section 302 of the Sarbanes-Oxley Act of 2002 of Laura F. Fergerson, Chief Executive Officer - Finance and Administration, and Gaston Gardey, Chief Financial Officer and Chief Accounting Officer
(b) Certifications pursuant to Section 906 of the Sarbanes-Oxley Act of 2002 of Laura F. Fergerson, Chief Executive Officer - Finance and Administration, and Gaston Gardey, Chief Financial Officer and Chief Accounting Officer
SIGNATURES
Pursuant to the requirements of the Securities Exchange Act of 1934 and the Investment Company Act of 1940, the registrant has duly caused this report to be signed on its behalf by the undersigned, thereunto duly authorized.
Franklin Templeton Variable Insurance Products Trust
| | |
| By | | /s/ LAURA F. FERGERSON |
| | Laura F. Fergerson |
| | Chief Executive Officer – |
| | Finance and Administration |
| Date March 19, 2015 |
Pursuant to the requirements of the Securities Exchange Act of 1934 and the Investment Company Act of 1940, this report has been signed below by the following persons on behalf of the registrant and in the capacities and on the dates indicated.
| | |
| By | | /s/ LAURA F. FERGERSON |
| | Laura F. Fergerson |
| | Chief Executive Officer – |
| | Finance and Administration |
| Date March 19, 2015 |
| |
| By | | /s/ GASTON GARDEY |
| | Gaston Gardey |
| | Chief Financial Officer and |
| | Chief Accounting Officer |
| Date March 19, 2015 |