UNITED STATES
SECURITIES AND EXCHANGE COMMISSION
Washington, DC 20549
FORM N-CSR
CERTIFIED SHAREHOLDER REPORT OF REGISTERED
MANAGEMENT INVESTMENT COMPANIES
Investment Company Act file number 811-05583
Franklin Templeton Variable Insurance Products Trust
(Exact name of registrant as specified in charter)
One Franklin Parkway, San Mateo, CA 94403-1906
(Address of principal executive offices) (Zip code)
Craig S. Tyle, One Franklin Parkway, San Mateo, CA 94403-1906
(Name and address of agent for service)
Registrant’s telephone number, including area code: (650) 312-2000
Date of fiscal year end: 12/31
Date of reporting period: 12/31/15
| Item 1. | Reports to Stockholders. |
| | |
 | | Annual Report December 31, 2015 |
Franklin Templeton
Variable Insurance Products Trust

Franklin Templeton Variable Insurance
Products Trust Annual Report
*Not part of the annual report. Retain for your records.
| | | | | | | | |
| Not FDIC Insured | | | | | May Lose Value | | | | | No Bank Guarantee |
MASTER CLASS – 4
FRANKLIN TEMPLETON VARIABLE INSURANCE PRODUCTS TRUST
Important Notes to
Performance Information
Performance data is historical and cannot predict or guarantee future results. Principal value and investment return will fluctuate with market conditions, and you may have a gain or loss when you withdraw your money. Inception dates of the funds may have preceded the effective dates of the subaccounts, contracts or their availability in all states.
When reviewing the index comparisons, please keep in mind that indexes have a number of inherent performance differentials over the funds. First, unlike the funds, which must hold a minimum amount of cash to maintain liquidity, indexes do
not have a cash component. Second, the funds are actively managed and, thus, are subject to management fees to cover salaries of securities analysts or portfolio managers in addition to other expenses. Indexes are unmanaged and do not include any commissions or other expenses typically associated with investing in securities. Third, indexes often contain a different mix of securities than the fund to which they are compared. Additionally, please remember that indexes are simply a measure of performance and cannot be invested in directly.
SUPPLEMENT DATED FEBRUARY 8, 2016
TO THE STATEMENT OF ADDITIONAL INFORMATION DATED MAY 1, 2015
OF
FRANKLIN TEMPLETON VARIABLE INSURANCE PRODUCTS TRUST
The statement of additional information (SAI) is amended as follows:
The section under the heading “Dealer Compensation” beginning on page 99 is replaced with the following:
In addition to the payments above, Distributors and/or its affiliates may make the following payments out of its own assets to certain dealers who sell shares of Franklin Templeton funds, or participate in the offering of variable insurance products that invest directly or indirectly in the Trust (VIP Qualifying Dealers):
Marketing support payments. Distributors may make payments to VIP Qualifying Dealers out of its own resources. A VIP Qualifying Dealer’s marketing support services may include business planning assistance, marketing and advertising, training and ongoing education and support for dealer personnel about the Franklin Templeton funds (including the Trust) and financial planning needs of shareholders of the Franklin Templeton funds or contract owners that allocate contract value indirectly to one or more Franklin Templeton funds, placement on the VIP Qualifying Dealer’s list of offered funds, access to sales meetings, sales representatives and management representatives of the dealer, and contract owner assistance in allocating contract value directly or indirectly to the Trust. Distributors compensates VIP Qualifying Dealers differently depending upon, among other factors, whether the VIP Qualifying Dealer is directly selling Franklin Templeton funds, or participating in the offering of variable insurance products that invest directly or indirectly in the Trust, sales and asset levels, redemption rates and the level and/or type of marketing and educational activities provided by the VIP Qualifying Dealer. Such compensation may include financial assistance to such dealers that enable Distributors to develop, manage or participate in and/or present at conferences or seminars, sales or training programs for invited registered representatives and other employees, client and investor events, and other dealer-sponsored events. These payments may vary depending upon the nature of the event. Distributors will, on an annual basis, determine whether to continue such payments. Currently, Distributors does not make marketing support payments in connection with the Trust except under limited circumstances for certain Funds of the Trust offered through a special product. Marketing support payments will not exceed 0.20% of the relevant Fund’s or Funds’ average daily net assets attributable to an insurance company, on an annual basis.
Other payments. From time to time, Distributors, at its expense, may provide additional compensation to VIP Qualifying Dealers which sell or arrange for the direct or indirect sale of shares of Franklin Templeton funds, including the Trust. Such compensation may include financial assistance to VIP Qualifying Dealers that enable Distributors to participate in and/or present at conferences or seminars, sales or training programs for invited registered representatives and other employees, client and investor events and other dealer-sponsored events. These payments may vary depending upon the nature of the event.
Distributors routinely sponsors due diligence meetings for registered representatives during which they receive updates on various Franklin Templeton funds and are afforded the
opportunity to speak with portfolio managers. Invitation to these meetings is not conditioned on selling a specific number of shares. Those who have shown an interest in Franklin Templeton funds, however, are more likely to be considered. To the extent permitted by their firm’s policies and procedures, registered representatives’ expenses in attending these meetings may be covered by Distributors.
Other compensation may be offered to the extent not prohibited by federal or state laws or any self-regulatory agency, such as FINRA. Distributors makes payments for events it deems appropriate, subject to Distributors’ guidelines and applicable law. Distributors and/or its affiliates may also reimburse VIP Qualifying Dealers and/or their affiliates for certain costs associated with obtaining voting instructions from contract owners and the solicitation process in connection with Trust-sponsored proxy statements.
You can ask your insurance company and VIP Qualifying Dealer for information about any payments they receive from Distributors and any services provided. Additional disclosure may be included in the insurance contract prospectus.
Please keep this supplement with your statement of additional information for future reference.
Franklin Flex Cap Growth VIP Fund
This annual report for Franklin Flex Cap Growth VIP Fund covers the fiscal year ended December 31, 2015.
Class 4 Performance Summary as of December 31, 2015
Average annual total return of Class 4 shares* represents the average annual change in value, assuming reinvestment of dividends and capital gains. Average returns smooth out variations in returns, which can be significant; they are not the same as year-by-year results.
| | | | | | | | | | | | |
| Periods ended 12/31/15 | | 1-Year | | | 5-Year | | | 10-Year | |
Average Annual Total Return | | | +4.32% | | | | +9.53% | | | | +6.57% | |
*For the period beginning 2/29/08, Class 4 performance reflects a 12b-1 fee expense of 0.35% per year, which affects future performance. Class 4 performance prior to 2/29/08 reflects historical Class 2 performance, which includes a 12b-1 fee expense of 0.25% per year. Since 2/29/08 (effective date), the average annual total return of Class 4 shares was +7.64%. The Fund has an expense reduction contractually guaranteed through at least 4/30/16, and a fee waiver associated with any investment in a Franklin Templeton money fund, contractually guaranteed through at least its current fiscal year-end. Fund investment results reflect the expense reduction and fee waiver, to the extent applicable; without these reductions, the results would have been lower.
Performance reflects the Fund’s Class 4 operating expenses, but does not include any contract fees, expenses or sales charges. If they had been included, performance would be lower. These charges and deductions, particularly for variable life policies, can have a significant effect on contract values and insurance benefits. See the contract prospectus for a complete description of these expenses, including sales charges.
Performance data represent past performance, which does not guarantee future results. Investment return and principal value will fluctuate, and you may have a gain or loss when you sell your shares. Current performance may differ from figures shown.
Total Return Index Comparison for a Hypothetical $10,000 Investment (1/1/06–12/31/15)
The graph below shows the change in value of a hypothetical $10,000 investment in the Fund over the indicated period and includes reinvestment of any income or distributions. The Fund’s performance* is compared to the performance of the Russell 1000® Growth Index, the Russell 3000® Growth Index and the Standard & Poors® 500 Index (S&P 500®). One cannot invest directly in an index, and an index is not representative of the Fund’s portfolio. Please see Important Notes to Performance Information preceding the Fund Summaries.
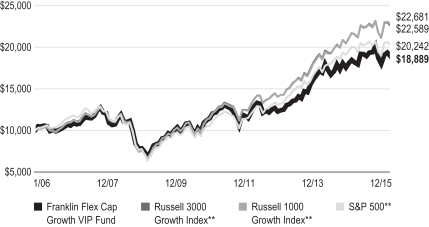
**Source: Morningstar. Please see Index Descriptions following the Fund Summaries.
FRANKLIN FLEX CAP GROWTH VIP FUND
Fund Goal and Main Investments
The Fund seeks capital appreciation. Under normal market conditions, the Fund invests predominantly in equity securities of companies that the investment manager believes have the potential for capital appreciation.
Fund Risks
All investments involve risks, including possible loss of principal. Growth stock prices reflect projections of future earnings or revenues, and can, therefore, fall dramatically if the company fails to meet those projections. Smaller, midsized and relatively new or unseasoned companies can be particularly sensitive to changing economic conditions, and their prospects for growth are less certain than those of larger, more established companies. Historically, these securities have experienced more price volatility than larger company stocks, especially over the short term. To the extent the Fund focuses on particular countries, regions, industries, sectors or types of investment from time to time, it may be subject to greater risk of adverse developments in such areas of focus than a fund that invests in a wider variety of countries, regions, industries, sectors or investments. Foreign securities involve special risks, including currency fluctuations and economic and political uncertainties. The Fund is actively managed but there is no guarantee that the manager’s investment decisions will produce the desired results. The Fund’s prospectus also includes a description of the main investment risks.
Performance Overview
You can find the Fund’s one-year total return in the Performance Summary. In comparison, the Russell 1000® Growth Index generated a +5.67% total return, the Russell 3000® Growth Index delivered a +5.09% total return, and the S&P 500 produced a +1.38% total return for the same period.1
Economic and Market Overview
The U.S. economy grew moderately during the 12 months under review amid healthy consumer spending. After starting 2015 with modest growth, the economy strengthened in the second quarter but moderated in the third and fourth quarters as exports slowed and state and local governments reduced their spending. Manufacturing activities expanded for most of the period but contracted toward period-end. Non-manufacturing activities, however, expanded throughout the 12-month period,
contributing to new jobs and helping drive down the unemployment rate to 5.0% from October through period-end, the lowest level in more than seven years.2 The housing market improved at period-end as existing and new home sales increased and home prices rose despite slightly higher mortgage rates. Retail sales grew modestly, led by automobile and auto component sales. Annual inflation, as measured by the Consumer Price Index, remained subdued largely due to low energy prices.
1. Source: Morningstar.
One cannot invest directly in an index, and an index is not representative of the Fund’s portfolio. Please see Index Descriptions following the Fund Summaries.
2. Source: Bureau of Labor Statistics.
FRANKLIN FLEX CAP GROWTH VIP FUND
After maintaining its target interest rate at a range of 0%–0.25% for seven years to support the U.S. economy’s recovery, the Federal Reserve (Fed) raised its target range for the federal funds rate to 0.25%–0.50% at its December meeting. Policymakers cited the labor market’s considerable improvement and were reasonably confident that inflation would move back to the Fed’s 2.0% medium-term objective. The Fed indicated that its process of normalizing interest rates would be data dependent and would likely be gradual. Furthermore, the Fed raised its 2016 U.S. economic growth forecast and lowered its unemployment rate projection.
U.S. stock markets experienced sell-offs at times during the year, resulting from investor concerns about the timing of the Fed’s interest rate increases, slower global economic growth, geopolitical tensions in certain regions and a plunge in crude oil prices. Investors generally remained confident, however, as the Fed maintained an accommodative monetary policy stance despite the rate increase, the eurozone economy improved and China implemented more stimulus measures to support its economy. Despite periods of volatility, the broad U.S. stock market, as measured by the S&P 500, generated a modest positive total return for 2015. The energy and materials sectors were among the worst performers, while consumer discretionary, health care, consumer staples and information technology outperformed.
Investment Strategy
We use fundamental, bottom-up research to seek companies meeting our criteria of growth potential, quality and valuation. In seeking sustainable growth characteristics, we look for companies we believe can produce sustainable earnings and cash flow growth, evaluating the long-term market opportunity and competitive structure of an industry to target leaders and emerging leaders. We define quality companies as those with strong and improving competitive positions in attractive markets. We also believe important attributes of quality are experienced and talented management teams as well as financial strength reflected in the capital structure, gross and operating margins, free cash flow generation and returns on capital employed. Our valuation analysis includes a range of potential outcomes based on an assessment of multiple scenarios. In assessing value, we consider whether security prices fully reflect the balance of the sustainable growth opportunities relative to business and financial risks.
| | | | |
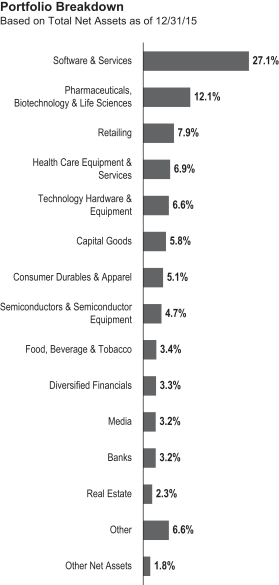
| Top 10 Holdings | | | |
| 12/31/15 | | | |
Company
Sector/Industry | | % of Total
Net Assets | |
Facebook Inc., A Software & Services | | | 4.4% | |
Alphabet Inc., C Software & Services | | | 3.7% | |
Celgene Corp. Pharmaceuticals, Biotechnology & Life Sciences | | | 3.4% | |
Amazon.com Inc. Retailing | | | 3.3% | |
MasterCard Inc., A Software & Services | | | 3.3% | |
Apple Inc. Technology Hardware & Equipment | | | 2.7% | |
ServiceNow Inc. Software & Services | | | 2.6% | |
NXP Semiconductors NV (Netherlands) Semiconductors & Semiconductor Equipment | | | 2.5% | |
Allergan PLC
Pharmaceuticals, Biotechnology & Life Sciences | | | 2.4% | |
Signature Bank Banks | | | 2.4% | |
The dollar value, number of shares or principal amount, and names of all portfolio holdings are listed in the Fund’s Statement of Investments (SOI).
Manager’s Discussion
During the year under review, many sectors represented in the Fund’s portfolio delivered positive returns and contributed to absolute performance. Relative to the Russell 3000® Growth Index, notable contributors included stock selection in materials, consumer discretionary and information technology (IT).3 An overweighting in IT, which performed well, also benefited Fund performance.
In the materials sector, our holding in specialty materials and chemicals company Cytec Industries contributed to relative returns.4,5 Cytec shares surged in July due to an announced acquisition by Belgium-based Solvay at a premium to Cytec’s share price. Solvay completed the acquisition in December.
Within consumer discretionary, top performers included online retail shopping service provider Amazon.com and footwear, apparel and equipment manufacturer NIKE. Amazon reported strong, sustained revenue growth in core domestic retail,
3. The consumer discretionary sector comprises automobiles and components, consumer durables and apparel, consumer services, media and retailing in the SOI. The IT sector comprises semiconductors and semiconductor equipment, software and services, and technology hardware and equipment in the SOI.
4. Not part of the index.
5. Not held at period-end.
FRANKLIN FLEX CAP GROWTH VIP FUND
including Amazon Prime customers, and better-than-expected profits for its new Amazon Web Services cloud computing business. Additionally, the company reportedly improved its fixed and variable costs through lower shipping expenses, better use of fulfillment centers and growing use of third-party sellers. We feel that NIKE is exposed to the best secular growth area in the apparel industry and is a leader in the growing athletic category. In our view, it has a proven category strategy driven by innovation and marketing that has shown success in the U.S. and is now being replicated across the globe.
In IT, video game company Electronic Arts and next generation network and computer security firm Palo Alto Networks enjoyed some of the largest gains. Under new management, Electronic Arts experienced improved game quality and expanded margins. The company also benefited from excitement about the release of its Star Wars game, which sought to capitalize on the new Star Wars movie. Palo Alto Networks benefited in fiscal year 2015 from growing market share and sales of its strong product portfolio and from a variety of high profile cyber attacks that helped to expand the overall cybersecurity market.
In contrast, key detractors from the Fund’s relative performance included stock selection in the health care and industrials sectors.6 An underweighting in the consumer staples sector, which performed well, also hurt relative results.7
In health care, our positions in multinational specialty pharmaceutical company Valeant Pharmaceuticals International4,5 and health care service provider Envision Healthcare Holdings hurt relative performance. Valeant’s aggressive business model has been challenged due to a high debt load from mergers and acquisitions, aggressive price increases and the use of alternative pharmacy distribution programs. Envision’s stock fell when the company missed its third-quarter earnings estimate resulting from underperforming contracts that led to lower revenue and higher labor costs, which pressured margins. We believed these were short-term, transient operational issues that can be fixed and the stock’s sharp decline was unwarranted.
In the industrials sector, Spirit Airlines hampered Fund performance when the company’s fares came under pressure as American Airlines and Southwest Airlines added capacity in some of their core markets. In our analysis, this pressure could
continue into 2016, but over the long term we expect Spirit’s low-cost advantage could lead to profitable growth for several years.
Within consumer staples, our position in Whole Foods Market hindered relative results.5 The natural and organic foods supermarket operator continued to experience slower sales volumes primarily due to increased competition from both conventional and specialty grocery retailers. The company has been working to further differentiate its offering and become more price competitive, but its results have been below expectations.
Another key individual detractor was asset management company Affiliated Managers Group. Its shares fell due to a drop in assets under management driven by lower global equity markets, slightly weaker quarterly flows, less optimism for performance fee accruals, and sector-wide price-earnings multiple compression (when stock prices move down despite higher earnings).
Thank you for your participation in Franklin Flex Cap Growth VIP Fund. We look forward to serving your future investment needs.
The foregoing information reflects our analysis, opinions and portfolio holdings as of December 31, 2015, the end of the reporting period. The way we implement our main investment strategies and the resulting portfolio holdings may change depending on factors such as market and economic conditions. These opinions may not be relied upon as investment advice or an offer for a particular security. The information is not a complete analysis of every aspect of any market, country, industry, security or the Fund. Statements of fact are from sources considered reliable, but the investment manager makes no representation or warranty as to their completeness or accuracy. Although historical performance is no guarantee of future results, these insights may help you understand our investment management philosophy.
6. The health care sector comprises health care equipment and services; and pharmaceuticals, biotechnology and life sciences in the SOI. The industrials sector comprises capital goods, commercial and professional services, and transportation in the SOI.
7. The consumer staples sector comprises food, beverage and tobacco in the SOI.
FRANKLIN FLEX CAP GROWTH VIP FUND
Class 4 Fund Expenses
As an investor in a variable insurance contract (Contract) that indirectly provides for investment in an underlying mutual fund, you can incur transaction and/or ongoing expenses at both the Fund level and the Contract level.
| • | | Transaction expenses can include sales charges (loads) on purchases, redemption fees, surrender fees, transfer fees and premium taxes. |
| • | | Ongoing expenses can include management fees, distribution and service (12b-1) fees, contract fees, annual maintenance fees, mortality and expense risk fees and other fees and expenses. All mutual funds and Contracts have some types of ongoing expenses. |
The expenses shown in the table are meant to highlight ongoing expenses at the Fund level only and do not include ongoing expenses at the Contract level, or transaction expenses at either the Fund or Contract level. While the Fund does not have transaction expenses, if the transaction and ongoing expenses at the Contract level were included, the expenses shown below would be higher. You should consult your Contract prospectus or disclosure document for more information.
The table shows Fund-level ongoing expenses and can help you understand these expenses and compare them with those of other mutual funds offered through the Contract. The table assumes a $1,000 investment held for the six months indicated. Please refer to the Fund prospectus for additional information on operating expenses.
Actual Fund Expenses
The first line (Actual) of the table provides actual account values and expenses. The “Ending Account Value” is derived from the Fund’s actual return, which includes the effect of ongoing Fund expenses, but does not include the effect of ongoing Contract expenses.
You can estimate the Fund-level expenses you incurred during the period by following these steps. Of course, your account value and expenses will differ from those in this illustration:
| 1. | Divide your account value by $1,000. |
If an account had an $8,600 value, then $8,600 ÷ $1,000 = 8.6.
| 2. | Multiply the result by the number under the heading “Fund-Level Expenses Incurred During Period.” |
If Fund-Level Expenses Incurred During Period were $7.50, then 8.6 × $7.50 = $64.50.
In this illustration, the estimated expenses incurred this period at the Fund level are $64.50.
Hypothetical Example for Comparison with Other Mutual Funds
Information in the second line (Hypothetical) of the table can help you compare ongoing expenses of the Fund with those of other mutual funds offered through the Contract. This information may not be used to estimate the actual ending account balance or expenses you incurred during the period. The hypothetical “Ending Account Value” is based on the Fund’s actual expense ratio and an assumed 5% annual rate of return before expenses, which does not represent the Fund’s actual return. The figure under the heading “Fund-Level Expenses Incurred During Period” shows the hypothetical expenses your account would have incurred under this scenario. You can compare this figure with the 5% hypothetical examples that appear in shareholder reports of other funds offered through a Contract.
| | | | | | | | | | | | |
| Class 4 | | Beginning Account Value 7/1/15 | | | Ending Account Value 12/31/15 | | | Fund-Level Expenses
Incurred During Period* 7/1/15–12/31/15 | |
Actual | | $ | 1,000 | | | $ | 976.00 | | | $ | 5.28 | |
Hypothetical (5% return before expenses) | | $ | 1,000 | | | $ | 1,019.86 | | | $ | 5.40 | |
*Expenses are calculated using the most recent six-month annualized expense ratio, net of expense waivers, for the Fund’s Class 4 shares (1.06%), which does not include any ongoing expenses of the Contract for which the Fund is an investment option, multiplied by the average account value over the period, multiplied by 184/365 to reflect the one-half year period.
FRANKLIN TEMPLETON VARIABLE INSURANCE PRODUCTS TRUST
Financial Highlights
Franklin Flex Cap Growth VIP Fund
| | | | | | | | | | | | | | | | | | | | |
| | | Year Ended December 31, | |
| | | 2015 | | | 2014 | | | 2013 | | | 2012 | | | 2011 | |
| Class 2 | | | | | | | | | | | | | | | | | | | | |
Per share operating performance
(for a share outstanding throughout the year) | | | | | | | | | | | | | | | | | | | | |
| | | | | |
Net asset value, beginning of year | | | $16.61 | | | | $18.11 | | | | $13.21 | | | | $12.09 | | | | $12.70 | |
| | | | |
| | | | | |
| Income from investment operationsa: | | | | | | | | | | | | | | | | | | | | |
| | | | | |
Net investment income (loss)b | | | (0.06 | ) | | | (0.08 | ) | | | (0.01 | ) | | | 0.01 | | | | (0.02 | ) |
| | | | | |
Net realized and unrealized gains (losses) | | | 1.00 | | | | 1.09 | | | | 4.95 | | | | 1.11 | | | | (0.59 | ) |
| | | | |
Total from investment operations | | | 0.94 | | | | 1.01 | | | | 4.94 | | | | 1.12 | | | | (0.61 | ) |
| | | | |
| | | | | |
| Less distributions from: | | | | | | | | | | | | | | | | | | | | |
| | | | | |
Net investment income | | | — | | | | — | | | | (— | )c | | | — | | | | — | |
| | | | | |
Net realized gains | | | (10.46 | ) | | | (2.51 | ) | | | (0.04 | ) | | | — | | | | — | |
| | | | |
Total distributions | | | (10.46 | ) | | | (2.51 | ) | | | (0.04 | ) | | | — | | | | — | |
| | | | |
Net asset value, end of year | | | $7.09 | | | | $16.61 | | | | $18.11 | | | | $13.21 | | | | $12.09 | |
| | | | |
| | | | | |
Total returnd | | | 4.37% | | | | 6.11% | | | | 37.48% | | | | 9.26% | | | | (4.80)% | |
| | | | | |
| Ratios to average net assets | | | | | | | | | | | | | | | | | | | | |
| | | | | |
Expenses before waiver and payments by affiliates | | | 1.33% | | | | 1.20% | | | | 1.18% | | | | 1.18% | | | | 1.16% | |
| | | | | |
Expenses net of waiver and payments by affiliates | | | 0.96% | | | | 0.95% | | | | 0.93% | | | | 0.93% | | | | 0.93% | |
| | | | | |
Net investment income (loss) | | | (0.62)% | | | | (0.46)% | | | | (0.09)% | | | | 0.09% | | | | (0.14)% | |
| | | | | |
| Supplemental data | | | | | | | | | | | | | | | | | | | | |
| | | | | |
Net assets, end of year (000’s) | | | $82,901 | | | | $93,354 | | | | $169,123 | | | | $159,122 | | | | $188,527 | |
| | | | | |
Portfolio turnover rate | | | 88.15% | | | | 52.83% | | | | 52.15% | | | | 43.50% | | | | 63.99% | |
aThe amount shown for a share outstanding throughout the period may not correlate with the Statement of Operations for the period due to the timing of sales and repurchases of the Fund’s shares in relation to income earned and/or fluctuating fair value of the investments of the Fund.
bBased on average daily shares outstanding.
cAmount rounds to less than $0.01 per share.
dTotal return does not include fees, charges or expenses imposed by the variable annuity and life insurance contracts for which Franklin Templeton Variable Insurance Products Trust serves as an underlying investment vehicle.
| | | | |
| FFC-6 | | Annual Report | The accompanying notes are an integral part of these financial statements. | | |
FRANKLIN TEMPLETON VARIABLE INSURANCE PRODUCTS TRUST
FINANCIAL HIGHLIGHTS
Franklin Flex Cap Growth VIP Fund (continued)
| | | | | | | | | | | | | | | | | | | | |
| | | Year Ended December 31, | |
| | | 2015 | | | 2014 | | | 2013 | | | 2012 | | | 2011 | |
| Class 4 | | | | | | | | | | | | | | | | | | | | |
Per share operating performance
(for a share outstanding throughout the year) | | | | | | | | | | | | | | | | | | | | |
| | | | | |
Net asset value, beginning of year | | | $16.44 | | | | $17.96 | | | | $13.12 | | | | $12.01 | | | | $12.63 | |
| | | | |
| | | | | |
| Income from investment operationsa: | | | | | | | | | | | | | | | | | | | | |
| | | | | |
Net investment income (loss)b | | | (0.07 | ) | | | (0.10 | ) | | | (0.03 | ) | | | (— | )c | | | (0.03 | ) |
| | | | | |
Net realized and unrealized gains (losses) | | | 0.99 | | | | 1.09 | | | | 4.91 | | | | 1.11 | | | | (0.59 | ) |
| | | | |
Total from investment operations | | | 0.92 | | | | 0.99 | | | | 4.88 | | | | 1.11 | | | | (0.62 | ) |
| | | | |
Less distributions from net realized gains | | | (10.46 | ) | | | (2.51 | ) | | | (0.04 | ) | | | — | | | | — | |
| | | | |
Net asset value, end of year | | | $6.90 | | | | $16.44 | | | | $17.96 | | | | $13.12 | | | | $12.01 | |
| | | | |
| | | | | |
Total returnd | | | 4.32% | | | | 5.98% | | | | 37.28% | | | | 9.24% | | | | (4.91)% | |
| | | | | |
| Ratios to average net assets | | | | | | | | | | | | | | | | | | | | |
| | | | | |
Expenses before waiver and payments by affiliates | | | 1.43% | | | | 1.30% | | | | 1.28% | | | | 1.28% | | | | 1.26% | |
| | | | | |
Expenses net of waiver and payments by affiliates | | | 1.06% | | | | 1.05% | | | | 1.03% | | | | 1.03% | | | | 1.03% | |
| | | | | |
Net investment income (loss) | | | (0.72)% | | | | (0.56)% | | | | (0.19)% | | | | (0.01)% | | | | (0.24)% | |
| | | | | |
| Supplemental data | | | | | | | | | | | | | | | | | | | | |
| | | | | |
Net assets, end of year (000’s) | | | $34,479 | | | | $31,355 | | | | $251,339 | | | | $216,607 | | | | $270,598 | |
| | | | | |
Portfolio turnover rate | | | 88.15% | | | | 52.83% | | | | 52.15% | | | | 43.50% | | | | 63.99% | |
aThe amount shown for a share outstanding throughout the period may not correlate with the Statement of Operations for the period due to the timing of sales and repurchases of the Fund’s shares in relation to income earned and/or fluctuating fair value of the investments of the Fund.
bBased on average daily shares outstanding.
cAmount rounds to less than $0.01 per share.
dTotal return does not include fees, charges or expenses imposed by the variable annuity and life insurance contracts for which Franklin Templeton Variable Insurance Products Trust serves as an underlying investment vehicle.
| | | | | | |
| | | The accompanying notes are an integral part of these financial statements. | Annual Report | | | FFC-7 | |
FRANKLIN TEMPLETON VARIABLE INSURANCE PRODUCTS TRUST
Statement of Investments, December 31, 2015
| | | | | | | | | | |
Franklin Flex Cap Growth VIP Fund | |
| | | | | Shares | | | Value | |
| | | | | | | | | | |
| | Common Stocks 98.2% | | | | | | | | |
| | Automobiles & Components 0.6% | | | | | | | | |
| a | | Tesla Motors Inc. | | | 3,100 | | | $ | 744,031 | |
| | | | | | | | | | |
| | Banks 3.2% | | | | | | | | |
| a | | Signature Bank | | | 18,000 | | | | 2,760,660 | |
| a | | SVB Financial Group | | | 8,600 | | | | 1,022,540 | |
| | | | | | | | | | |
| | | | | | | | | 3,783,200 | |
| | | | | | | | | | |
| | Capital Goods 5.8% | | | | | | | | |
| | Fortune Brands Home & Security Inc. | | | 45,000 | | | | 2,497,500 | |
| a | | HD Supply Holdings Inc. | | | 78,500 | | | | 2,357,355 | |
| | Honeywell International Inc. | | | 8,650 | | | | 895,881 | |
| | Roper Technologies Inc. | | | 5,750 | | | | 1,091,292 | |
| | | | | | | | | | |
| | | | | | | | | 6,842,028 | |
| | | | | | | | | | |
| | Commercial & Professional Services 1.6% | | | | | | | | |
| a | | IHS Inc., A | | | 10,000 | | | | 1,184,300 | |
| a | | Stericycle Inc. | | | 6,000 | | | | 723,600 | |
| | | | | | | | | | |
| | | | | | | | | 1,907,900 | |
| | | | | | | | | | |
| | Consumer Durables & Apparel 5.1% | | | | | | | | |
| | NIKE Inc., B | | | 42,500 | | | | 2,656,250 | |
| a | | TRI Pointe Group Inc. | | | 190,000 | | | | 2,407,300 | |
| a | | Under Armour Inc., A | | | 11,000 | | | | 886,710 | |
| | | | | | | | | | |
| | | | | | | | | 5,950,260 | |
| | | | | | | | | | |
| | Consumer Services 1.4% | | | | | | | | |
| | Starbucks Corp. | | | 27,000 | | | | 1,620,810 | |
| | | | | | | | | | |
| | Diversified Financials 3.3% | | | | | | | | |
| a | | Affiliated Managers Group Inc. | | | 10,800 | | | | 1,725,408 | |
| | Intercontinental Exchange Inc. | | | 4,800 | | | | 1,230,048 | |
| a | | PRA Group Inc. | | | 27,500 | | | | 953,975 | |
| | | | | | | | | | |
| | | | | | | | | 3,909,431 | |
| | | | | | | | | | |
| | Energy 1.2% | | | | | | | | |
| | Cabot Oil & Gas Corp., A | | | 59,000 | | | | 1,043,710 | |
| a | | RigNet Inc. | | | 16,500 | | | | 341,385 | |
| | | | | | | | | | |
| | | | | | | | | 1,385,095 | |
| | | | | | | | | | |
| | Food, Beverage & Tobacco 3.4% | | | | | | | | |
| | Constellation Brands Inc., A | | | 14,500 | | | | 2,065,380 | |
| a | | Monster Beverage Corp. | | | 13,300 | | | | 1,981,168 | |
| | | | | | | | | | |
| | | | | | | | | 4,046,548 | |
| | | | | | | | | | |
| | Health Care Equipment & Services 6.9% | | | | | | | | |
| a | | Cerner Corp. | | | 18,000 | | | | 1,083,060 | |
| a | | DexCom Inc. | | | 8,000 | | | | 655,200 | |
| a | | Edwards Lifesciences Corp. | | | 12,080 | | | | 954,078 | |
| a | | Envision Healthcare Holdings Inc. | | | 59,500 | | | | 1,545,215 | |
| | McKesson Corp. | | | 13,300 | | | | 2,623,159 | |
| | Medtronic PLC | | | 11,980 | | | | 921,502 | |
| a | | Nevro Corp. | | | 5,000 | | | | 337,550 | |
| | | | | | | | | | |
| | | | | | | | | 8,119,764 | |
| | | | | | | | | | |
FRANKLIN TEMPLETON VARIABLE INSURANCE PRODUCTS TRUST
STATEMENT OF INVESTMENTS
Franklin Flex Cap Growth VIP Fund (continued)
| | | | | | | | | | |
| | | | | Shares | | | Value | |
| | | | | | | | | | |
| | Common Stocks (continued) | | | | | | | | |
| | Materials 1.5% | | | | | | | | |
| | Ecolab Inc. | | | 15,000 | | | $ | 1,715,700 | |
| | | | | | | | | | |
| | Media 3.2% | | | | | | | | |
| a | | Charter Communications Inc., A | | | 6,500 | | | | 1,190,150 | |
| a | | Global Eagle Entertainment Inc. | | | 2,040 | | | | 20,135 | |
| a | | IMAX Corp. (Canada) | | | 16,500 | | | | 586,410 | |
| | The Walt Disney Co. | | | 19,000 | | | | 1,996,520 | |
| | | | | | | | | | |
| | | | | | | | | 3,793,215 | |
| | | | | | | | | | |
| | Pharmaceuticals, Biotechnology & Life Sciences 12.1% | | | | | | | | |
| a | | Allergan PLC | | | 8,850 | | | | 2,765,625 | |
| a | | Biogen Inc. | | | 4,900 | | | | 1,501,115 | |
| | Bristol-Myers Squibb Co. | | | 22,800 | | | | 1,568,412 | |
| a | | Celgene Corp. | | | 33,500 | | | | 4,011,960 | |
| a | | Celldex Therapeutics Inc. | | | 23,980 | | | | 376,006 | |
| | Gilead Sciences Inc. | | | 14,500 | | | | 1,467,255 | |
| a | | Illumina Inc. | | | 3,800 | | | | 729,391 | |
| a | | NantKwest Inc. | | | 9,340 | | | | 161,862 | |
| a,b | | NantKwest Inc. | | | 3,600 | | | | 56,149 | |
| a | | Regeneron Pharmaceuticals Inc. | | | 1,900 | | | | 1,031,453 | |
| a | | Revance Therapeutics Inc. | | | 16,060 | | | | 548,610 | |
| | | | | | | | | | |
| | | | | | | | | 14,217,838 | |
| | | | | | | | | | |
| | Real Estate 2.3% | | | | | | | | |
| | American Tower Corp. | | | 14,000 | | | | 1,357,300 | |
| | Equinix Inc. | | | 4,250 | | | | 1,285,200 | |
| | | | | | | | | | |
| | | | | | | | | 2,642,500 | |
| | | | | | | | | | |
| | Retailing 7.9% | | | | | | | | |
| | Advance Auto Parts Inc. | | | 7,800 | | | | 1,173,978 | |
| a | | Amazon.com Inc. | | | 5,800 | | | | 3,920,162 | |
| | Expedia Inc. | | | 10,500 | | | | 1,305,150 | |
| a | | The Priceline Group Inc. | | | 1,600 | | | | 2,039,920 | |
| | Tractor Supply Co. | | | 9,110 | | | | 778,905 | |
| | | | | | | | | | |
| | | | | | | | | 9,218,115 | |
| | | | | | | | | | |
| | Semiconductors & Semiconductor Equipment 4.7% | | | | | | | | |
| a | | Cavium Inc. | | | 23,000 | | | | 1,511,330 | |
| a | | Nanometrics Inc. | | | 18,000 | | | | 272,520 | |
| a | | NXP Semiconductors NV (Netherlands) | | | 35,000 | | | | 2,948,750 | |
| | Skyworks Solutions Inc. | | | 10,070 | | | | 773,678 | |
| | | | | | | | | | |
| | | | | | | | | 5,506,278 | |
| | | | | | | | | | |
| | Software & Services 27.1% | | | | | | | | |
| a | | Alphabet Inc., C | | | 5,800 | | | | 4,401,504 | |
| a | | CoStar Group Inc. | | | 5,750 | | | | 1,188,468 | |
| a | | Electronic Arts Inc. | | | 10,800 | | | | 742,176 | |
| a | | Ellie Mae Inc. | | | 6,500 | | | | 391,495 | |
| a | | EPAM Systems Inc. | | | 5,500 | | | | 432,410 | |
| a | | Facebook Inc., A | | | 49,000 | | | | 5,128,340 | |
| a | | FleetCor Technologies Inc. | | | 15,500 | | | | 2,215,415 | |
| a | | LinkedIn Corp., A | | | 6,250 | | | | 1,406,750 | |
| | MasterCard Inc., A | | | 40,250 | | | | 3,918,740 | |
FRANKLIN TEMPLETON VARIABLE INSURANCE PRODUCTS TRUST
STATEMENT OF INVESTMENTS
Franklin Flex Cap Growth VIP Fund (continued)
| | | | | | | | | | |
| | | | | Shares | | | Value | |
| | | | | | | | | | |
| | Common Stocks (continued) | | | | | | | | |
| | Software & Services (continued) | | | | | | | | |
| a | | Mobileye NV | | | 16,300 | | | $ | 689,164 | |
| a | | Paylocity Holding Corp. | | | 23,000 | | | | 932,650 | |
| a | | Salesforce.com Inc. | | | 29,000 | | | | 2,273,600 | |
| a | | ServiceNow Inc. | | | 35,500 | | | | 3,072,880 | |
| a | | Twitter Inc. | | | 27,500 | | | | 636,350 | |
| a | | Tyler Technologies Inc. | | | 9,250 | | | | 1,612,460 | |
| | Visa Inc., A | | | 31,000 | | | | 2,404,050 | |
| a | | Zendesk Inc. | | | 15,000 | | | | 396,600 | |
| | | | | | | | | | |
| | | | | | | | | 31,843,052 | |
| | | | | | | | | | |
| | Technology Hardware & Equipment 6.6% | | | | | | | | |
| | Apple Inc. | | | 30,500 | | | | 3,210,430 | |
| | Harris Corp. | | | 27,000 | | | | 2,346,300 | |
| a | | Palo Alto Networks Inc. | | | 12,250 | | | | 2,157,715 | |
| | | | | | | | | | |
| | | | | | | | | 7,714,445 | |
| | | | | | | | | | |
| | Transportation 0.3% | | | | | | | | |
| a | | Spirit Airlines Inc. | | | 8,000 | | | | 318,800 | |
| | | | | | | | | | |
| | Total Common Stocks (Cost $75,934,556) | | | | | | | 115,279,010 | |
| | Other Assets, less Liabilities 1.8% | | | | | | | 2,100,923 | |
| | | | | | | | | | |
| | Net Assets 100.0% | | | | | | $ | 117,379,933 | |
| | | | | | | | | | |
aNon-income producing.
bSecurity has been deemed illiquid because it may not be able to be sold within seven days. At December 31, 2015, the value of this security was $56,149, representing 0.05% of net assets.
| | | | |
| FFC-10 | | Annual Report | The accompanying notes are an integral part of these financial statements. | | |
FRANKLIN TEMPLETON VARIABLE INSURANCE PRODUCTS TRUST
Financial Statements
Statement of Assets and Liabilities
December 31, 2015
| | | | |
| | | Franklin Flex
Cap Growth
VIP Fund | |
Assets: | | | | |
Investments in securities: | | | | |
Cost - Unaffiliated Issuers | | $ | 75,934,556 | |
| | | | |
Value - Unaffiliated Issuers | | $ | 115,279,010 | |
Receivables: | | | | |
Investment securities sold | | | 3,434,671 | |
Capital shares sold | | | 40,205 | |
Dividends | | | 51,776 | |
Other assets | | | 9 | |
| | | | |
Total assets | | | 118,805,671 | |
| | | | |
Liabilities: | | | | |
Payables: | | | | |
Investment securities purchased | | | 375,515 | |
Capital shares redeemed | | | 441,150 | |
Management fees | | | 45,216 | |
Distribution fees | | | 56,233 | |
Funds advanced by custodian | | | 444,361 | |
Accrued expenses and other liabilities | | | 63,263 | |
| | | | |
Total liabilities | | | 1,425,738 | |
| | | | |
Net assets, at value | | $ | 117,379,933 | |
| | | | |
Net assets consist of: | | | | |
Paid-in capital | | $ | 64,071,817 | |
Net unrealized appreciation (depreciation) | | | 39,344,454 | |
Accumulated net realized gain (loss) | | | 13,963,662 | |
| | | | |
Net assets, at value | | $ | 117,379,933 | |
| | | | |
| |
| Class 2: | | | | |
Net assets, at value | | $ | 82,900,633 | |
| | | | |
Shares outstanding | | | 11,699,531 | |
| | | | |
Net asset value and maximum offering price per share | | $ | 7.09 | |
| | | | |
| |
| Class 4: | | | | |
Net assets, at value | | $ | 34,479,300 | |
| | | | |
Shares outstanding | | | 5,000,308 | |
| | | | |
Net asset value and maximum offering price per share | | $ | 6.90 | |
| | | | |
| | | | | | |
| | | The accompanying notes are an integral part of these financial statements. | Annual Report | | | FFC-11 | |
FRANKLIN TEMPLETON VARIABLE INSURANCE PRODUCTS TRUST
FINANCIAL STATEMENTS
Statement of Operations
for the year ended December 31, 2015
| | | | |
| | | Franklin Flex
Cap Growth
VIP Fund | |
Investment income: | | | | |
Dividends | | $ | 427,856 | |
| | | | |
Expenses: | | | | |
Management fees (Note 3a) | | | 1,218,011 | |
Distribution fees: (Note 3c) | | | | |
Class 2 | | | 228,119 | |
Class 4 | | | 115,420 | |
Custodian fees (Note 4) | | | 1,122 | |
Reports to shareholders | | | 76,969 | |
Professional fees | | | 36,814 | |
Trustees’ fees and expenses | | | 542 | |
Other | | | 7,607 | |
| | | | |
Total expenses | | | 1,684,604 | |
Expenses waived/paid by affiliates (Note 3e and 3f) | | | (458,962 | ) |
| | | | |
Net expenses | | | 1,225,642 | |
| | | | |
Net investment income (loss) | | | (797,786 | ) |
| | | | |
Realized and unrealized gains (losses): | | | | |
Net realized gain (loss) from investments | | | 14,700,445 | |
Net change in unrealized appreciation (depreciation) on investments | | | (9,006,175 | ) |
| | | | |
Net realized and unrealized gain (loss) | | | 5,694,270 | |
| | | | |
Net increase (decrease) in net assets resulting from operations | | $ | 4,896,484 | |
| | | | |
| | | | |
| FFC-12 | | Annual Report | The accompanying notes are an integral part of these financial statements. | | |
FRANKLIN TEMPLETON VARIABLE INSURANCE PRODUCTS TRUST
FINANCIAL STATEMENTS
Statements of Changes in Net Assets
| | | | | | | | |
| | | Franklin Flex Cap Growth VIP Fund | |
| | | Year Ended December 31, | |
| | | 2015 | | | 2014 | |
Increase (decrease) in net assets: | | | | | | | | |
Operations: | | | | | | | | |
Net investment income (loss) | | $ | (797,786 | ) | | $ | (1,796,043 | ) |
Net realized gain (loss) | | | 14,700,445 | | | | 136,983,635 | |
Net change in unrealized appreciation (depreciation) | | | (9,006,175 | ) | | | (121,113,931 | ) |
| | | | |
Net increase (decrease) in net assets resulting from operations | | | 4,896,484 | | | | 14,073,661 | |
| | | | |
Distributions to shareholders from: | | | | | | | | |
Net realized gains: | | | | | | | | |
Class 2 | | | (55,457,455 | ) | | | (23,244,460 | ) |
Class 4 | | | (20,021,151 | ) | | | (34,835,360 | ) |
| | | | |
Total distributions to shareholders | | | (75,478,606 | ) | | | (58,079,820 | ) |
| | | | |
Capital share transactions: (Note 2) | | | | | | | | |
Class 2 | | | 41,392,972 | | | | (59,517,033 | ) |
Class 4 | | | 21,859,783 | | | | (192,229,021 | ) |
| | | | |
Total capital share transactions | | | 63,252,755 | | | | (251,746,054 | ) |
| | | | |
Net increase (decrease) in net assets | | | (7,329,367 | ) | | | (295,752,213 | ) |
Net assets (there is no undistributed net investment income at beginning or end of year): | | | | | | | | |
Beginning of year | | | 124,709,300 | | | | 420,461,513 | |
| | | | |
End of year | | $ | 117,379,933 | | | $ | 124,709,300 | |
| | | | |
| | | | | | |
| | | The accompanying notes are an integral part of these financial statements. | Annual Report | | | FFC-13 | |
FRANKLIN TEMPLETON VARIABLE INSURANCE PRODUCTS TRUST
Notes to Financial Statements
Franklin Flex Cap Growth VIP Fund
1. Organization and Significant Accounting Policies
Franklin Templeton Variable Insurance Products Trust (Trust) is registered under the Investment Company Act of 1940 (1940 Act) as an open-end management investment company, consisting of nineteen separate funds and applies the specialized accounting and reporting guidance in U.S. Generally Accepted Accounting Principles (U.S. GAAP). Franklin Flex Cap Growth VIP Fund (Fund) is included in this report. The financial statements of the remaining funds in the Trust are presented separately. Shares of the Fund are generally sold only to insurance company separate accounts to fund the benefits of variable life insurance policies or variable annuity contracts. At December 31, 2015, 40.72% of the Fund’s shares were held through one insurance company. Investment activities of these insurance company separate accounts could have a material impact on the Fund. The Fund offers two classes of shares: Class 2 and Class 4. Each class of shares differs by its distribution fees, voting rights on matters affecting a single class and its exchange privilege.
The following summarizes the Fund’s significant accounting policies.
a. Financial Instrument Valuation
The Fund’s investments in financial instruments are carried at fair value daily. Fair value is the price that would be received to sell an asset or paid to transfer a liability in an orderly transaction between market participants on the measurement date. The Fund calculates the net asset value (NAV) per share as of 4 p.m. Eastern time each day the New York Stock Exchange (NYSE) is open for trading. Under compliance policies and procedures approved by the Trust’s Board of Trustees (the Board), the Fund’s administrator has responsibility for oversight of valuation, including leading the cross-functional Valuation and Liquidity Oversight Committee (VLOC). The VLOC provides administration and oversight of the Fund’s valuation policies and procedures, which are approved annually by the Board. Among other things, these procedures allow the Fund to utilize independent pricing services, quotations from securities and financial instrument dealers, and other market sources to determine fair value.
Equity securities listed on an exchange or on the NASDAQ National Market System are valued at the last quoted sale price or the official closing price of the day, respectively. Foreign equity securities are valued as of the close of trading on the
foreign stock exchange on which the security is primarily traded or as of 4 p.m. Eastern time whichever is earlier. The value is then converted into its U.S. dollar equivalent at the foreign exchange rate in effect at 4 p.m. Eastern time on the day that the value of the security is determined. Over-the-counter securities are valued within the range of the most recent quoted bid and ask prices. Securities that trade in multiple markets or on multiple exchanges are valued according to the broadest and most representative market. Certain equity securities are valued based upon fundamental characteristics or relationships to similar securities.
The Fund has procedures to determine the fair value of financial instruments for which market prices are not reliable or readily available. Under these procedures, the VLOC convenes on a regular basis to review such financial instruments and considers a number of factors, including significant unobservable valuation inputs, when arriving at fair value. The VLOC primarily employs a market-based approach which may use related or comparable assets or liabilities, recent transactions, market multiples, book values, and other relevant information for the investment to determine the fair value of the investment. An income-based valuation approach may also be used in which the anticipated future cash flows of the investment are discounted to calculate fair value. Discounts may also be applied due to the nature or duration of any restrictions on the disposition of the investments. Due to the inherent uncertainty of valuations of such investments, the fair values may differ significantly from the values that would have been used had an active market existed. The VLOC employs various methods for calibrating these valuation approaches including a regular review of key inputs and assumptions, transactional back-testing or disposition analysis, and reviews of any related market activity.
Trading in securities on foreign securities stock exchanges and OTC markets may be completed before 4 p.m. Eastern time. In addition, trading in certain foreign markets may not take place on every NYSE business day. Occasionally, events occur between the time at which trading in a foreign security is completed and the close of the NYSE that might call into question the reliability of the value of a portfolio security held by the Fund. As a result, differences may arise between the value of the Fund’s portfolio securities as determined at the foreign market close and the latest indications of value at the close of the NYSE. In order to minimize the potential for these differences, the VLOC monitors price movements following the close of trading in foreign stock markets through a series of country
FRANKLIN TEMPLETON VARIABLE INSURANCE PRODUCTS TRUST
NOTES TO FINANCIAL STATEMENTS
Franklin Flex Cap Growth VIP Fund (continued)
specific market proxies (such as baskets of American Depositary Receipts, futures contracts and exchange traded funds). These price movements are measured against established trigger thresholds for each specific market proxy to assist in determining if an event has occurred that may call into question the reliability of the values of the foreign securities held by the Fund. If such an event occurs, the securities may be valued using fair value procedures, which may include the use of independent pricing services.
When the last day of the reporting period is a non-business day, certain foreign markets may be open on those days that the NYSE is closed, which could result in differences between the value of the Fund’s portfolio securities on the last business day and the last calendar day of the reporting period. Any significant security valuation changes due to an open foreign market are adjusted and reflected by the Fund for financial reporting purposes.
b. Securities Lending
The Fund participates in an agency based securities lending program to earn additional income. The Fund receives cash collateral against the loaned securities in an amount equal to at least 102% of the fair value of the loaned securities. Collateral is maintained over the life of the loan in an amount not less than 100% of the fair value of loaned securities, as determined at the close of Fund business each day; any additional collateral required due to changes in security values is delivered to the Fund on the next business day. The collateral is deposited into a joint cash account with other funds and is used to invest in a money market fund managed by Franklin Advisers, Inc., an affiliate of the Fund. The Fund may receive income from the investment of cash collateral, in addition to lending fees and rebates paid by the borrower. Income from securities loaned is reported separately in the Statement of Operations. The Fund bears the market risk with respect to the collateral investment, securities loaned, and the risk that the agent may default on its obligations to the Fund. If the borrower defaults on its obligation to return the securities loaned, the Fund has the right to repurchase the securities in the open market using the collateral received. The securities lending agent has agreed to indemnify the Fund in the event of default by a third party borrower. At December 31, 2015, the Fund had no securities on loan.
c. Income and Deferred Taxes
It is the Fund’s policy to qualify as a regulated investment company under the Internal Revenue Code. The Fund intends to
distribute to shareholders substantially all of its taxable income and net realized gains to relieve it from federal income and if applicable, excise taxes. As a result, no provision for U.S. federal income taxes is required.
The Fund may be subject to foreign taxation related to income received, capital gains on the sale of securities and certain foreign currency transactions in the foreign jurisdictions in which it invests. Foreign taxes, if any, are recorded based on the tax regulations and rates that exist in the foreign markets in which the Fund invests. When a capital gain tax is determined to apply, the Fund records an estimated deferred tax liability in an amount that would be payable if the securities were disposed of on the valuation date.
The Fund may recognize an income tax liability related to its uncertain tax positions under U.S. GAAP when the uncertain tax position has less than 50% probability that it will be sustained by examination by the tax authorities based on its technical merits. As of December 31, 2015, the Fund has determined that no tax liability is required in the its financial statements related to uncertain tax positions taken on a tax return (or expected to be taken on future tax returns). Open tax years are those that remain subject to examination and are based on each tax jurisdiction’s statute of limitation.
d. Security Transactions, Investment Income, Expenses and Distributions
Security transactions are accounted for on trade date. Realized gains and losses on security transactions are determined on a specific identification basis. Estimated expenses are accrued daily. Dividend income is recorded on the ex-dividend date. Distributions to shareholders are recorded on the ex-dividend date and are determined according to income tax regulations (tax basis). Distributable earnings determined on a tax basis may differ from earnings recorded in accordance with U.S. GAAP. These differences may be permanent or temporary. Permanent differences are reclassified among capital accounts to reflect their tax character. These reclassifications have no impact on net assets or the results of operations. Temporary differences are not reclassified, as they may reverse in subsequent periods.
Common expenses incurred by the Trust are allocated among the Funds based on the ratio of net assets of each Fund to the combined net assets of the Trust. Fund specific expenses are charged directly to the fund that incurred the expense.
FRANKLIN TEMPLETON VARIABLE INSURANCE PRODUCTS TRUST
NOTES TO FINANCIAL STATEMENTS
Franklin Flex Cap Growth VIP Fund (continued)
1. Organization and Significant Accounting Policies (continued)
d. Security Transactions, Investment Income, Expenses and Distributions (continued)
Realized and unrealized gains and losses and net investment income, not including class specific expenses, are allocated daily to each class of shares based upon the relative proportion of net assets of each class. Differences in per share distributions, by class, are generally due to differences in class specific expenses.
e. Accounting Estimates
The preparation of financial statements in accordance with U.S. GAAP requires management to make estimates and assumptions that affect the reported amounts of assets and liabilities at the date of the financial statements and the amounts of income and expenses during the reporting period. Actual results could differ from those estimates.
f. Guarantees and Indemnifications
Under the Trust’s organizational documents, its officers and trustees are indemnified by the Trust against certain liabilities arising out of the performance of their duties to the Trust. Additionally, in the normal course of business, the Trust, on behalf of the Fund, enters into contracts with service providers that contain general indemnification clauses. The Trust’s maximum exposure under these arrangements is unknown as this would involve future claims that may be made against the Trust that have not yet occurred. Currently, the Trust expects the risk of loss to be remote.
2. Shares of Beneficial Interest
At December 31, 2015, there were an unlimited number of shares authorized (without par value). Transactions in the Fund’s shares were as follows:
| | | | | | | | | | | | | | | | | | |
| | | Year Ended December 31, | |
| | | 2015 | | | | | 2014 | |
| | | Shares | | | Amount | | | | | Shares | | | Amount | |
| | | | | |
| Class 2 Shares: | | | | | | | | | | | | | | | | | | |
Shares sold | | | 2,700,321 | | | $ | 22,329,959 | | | | | | 1,271,685 | | | $ | 22,546,625 | |
Shares issued in reinvestment of distributions | | | 7,659,869 | | | | 55,457,455 | | | | | | 1,454,597 | | | | 23,244,460 | |
Shares redeemed | | | (4,281,552 | ) | | | (36,394,442 | ) | | | | | (6,444,966 | ) | | | (105,308,118 | ) |
| | | | |
Net increase (decrease) | | | 6,078,638 | | | $ | 41,392,972 | | | | | | (3,718,684 | ) | | $ | (59,517,033 | ) |
| | | | |
| Class 4 Shares: | | | | | | | | | | | | | | | | | | |
Shares sold | | | 1,255,219 | | | $ | 10,687,379 | | | | | | 1,157,788 | | | $ | 20,021,648 | |
Shares issued in reinvestment of distributions | | | 2,839,880 | | | | 20,021,151 | | | | | | 2,201,982 | | | | 34,835,359 | |
Shares redeemed | | | (1,002,629 | ) | | | (8,848,747 | ) | | | | | (15,445,351 | ) | | | (247,086,028 | ) |
| | | | |
Net increase (decrease) | | | 3,092,470 | | | $ | 21,859,783 | | | | | | (12,085,581 | ) | | $ | (192,229,021 | ) |
| | | | |
FRANKLIN TEMPLETON VARIABLE INSURANCE PRODUCTS TRUST
NOTES TO FINANCIAL STATEMENTS
Franklin Flex Cap Growth VIP Fund (continued)
3. Transactions With Affiliates
Franklin Resources, Inc. is the holding company for various subsidiaries that together are referred to as Franklin Templeton Investments. Certain officers and trustees of the Fund are also officers and/or directors of the following subsidiaries:
| | |
| Subsidiary | | Affiliation |
Franklin Advisers, Inc. (Advisers) | | Investment manager |
Franklin Templeton Services, LLC (FT Services) | | Administrative manager |
Franklin Templeton Distributors, Inc. (Distributors) | | Principal underwriter |
Franklin Templeton Investor Services, LLC (Investor Services) | | Transfer agent |
a. Management Fees
The Fund pays an investment management fee to Advisers based on the average daily net assets of the Fund as follows:
| | |
| Annualized Fee Rate | | Net Assets |
1.000% | | Up to and including $100 million |
0.900% | | Over $100 million, up to and including $250 million |
0.850% | | Over $250 million, up to and including $10 billion |
0.800% | | Over $10 billion, up to and including $12.5 billion |
0.775% | | Over $12.5 billion, up to and including $15 billion |
0.750% | | In excess of $15 billion |
b. Administrative Fees
Under an agreement with Advisers, FT Services provides administrative services to the Fund. The fee is paid by Advisers based on the Fund’s average daily net assets, and is not an additional expense of the Fund.
c. Distribution Fees
The Board has adopted distribution plans for Class 2 and Class 4 shares pursuant to Rule 12b-1 under the 1940 Act. Under the Fund’s compensation distribution plans, the Fund pays Distributors for costs incurred in connection with the servicing, sale and distribution of the Fund’s shares up to 0.35% per year of its average daily net assets of each class. The Board has agreed to limit the current rate to 0.25% per year for Class 2. The plan year, for purposes of monitoring compliance with the maximum annual plan rates, is February 1 through January 31.
d. Transfer Agent Fees
Investor Services, under terms of an agreement, performs shareholder servicing for the Fund and is not paid by the Fund for the services.
e. Investments in Affiliated Management Investment Companies
The Fund invests in an affiliated management investment company for purposes other than exercising a controlling influence over the management or policies. Management fees paid by the Fund are waived on assets invested in the affiliated management investment company, as noted in the Statement of Operations, in an amount not to exceed the management and administrative fees paid directly or indirectly by each affiliate. Prior to January 1, 2014, the waiver was accounted for as a reduction to management fees.
FRANKLIN TEMPLETON VARIABLE INSURANCE PRODUCTS TRUST
NOTES TO FINANCIAL STATEMENTS
Franklin Flex Cap Growth VIP Fund (continued)
3. Transactions With Affiliates (continued)
e. Investments in Affiliated Management Investment Companies (continued)
| | | | | | | | | | | | | | | | | | | | | | | | | | | | | | |
| | | Number
of Shares
Held at
Beginning
of Year | | Gross
Additions | | | Gross
Reductions | | | Number
of Shares
Held at
End of
Year | | | Value at
End of
Year | | | Investment
Income | | | Realized
Gain
(Loss) | | | % of Affiliated
Fund Shares
Outstanding
Held at End
of Year | |
| Non-Controlled Affiliates | | | | | | | | | | | | | | | | | | | | | | | | | | | | | | |
Institutional Fiduciary Trust Money Market Portfolio | | 3,647,947 | | | 53,146,943 | | | | (56,794,890 | ) | | | — | | | $ | — | | | $ | — | | | $ | — | | | | —% | |
| | | | | | | | | | | | | | | | | | | | | | | | | | | | | | |
f. Waiver and Expense Reimbursements
Advisers has contractually agreed in advance to waive or limit its fees and to assume as its own expense certain expenses otherwise payable by the Fund so that the expenses (excluding distribution fees, and acquired fund fees and expenses) for Class 2 and Class 4 of the Fund do not exceed 0.71%, based on the average net assets of each class (other than certain non-routine expenses or costs, including those relating to litigation, indemnification, reorganizations, and liquidations) until April 30, 2016.
g. Interfund Transactions
The Fund engaged in purchases and sales of investments with funds or other accounts that have a common investment manager (or affiliated investment managers), directors, trustees, or officers. These transactions compiled with Rule 17a-7 under the 1940 Act. During the year ended December 31, 2015, the purchase and sale transactions aggregated $0 and $157,253, respectively.
4. Expense Offset Arrangement
The Fund has entered into an arrangement with its custodian whereby credits realized as a result of uninvested cash balances are used to reduce a portion of the Fund’s custodian expenses. During the year ended December 31, 2015, there were no credits earned.
5. Income Taxes
The tax character of distributions paid during the years ended December 31, 2015 and 2014, was as follows:
| | | | | | | | |
| | | 2015 | | | 2014 | |
Distributions paid from: | | | | | | | | |
Ordinary income | | $ | 1,341,946 | | | $ | 5,771,146 | |
Long term capital gain | | | 74,136,659 | | | | 52,308,674 | |
| | | | |
| | $ | 75,478,605 | | | $ | 58,079,820 | |
| | | | |
At December 31, 2015, the cost of investments, net unrealized appreciation (depreciation), undistributed ordinary income and undistributed long term capital gains for income tax purposes were as follows:
| | | | |
Cost of investments | | $ | 76,453,370 | |
| | | | |
Unrealized appreciation | | $ | 41,040,801 | |
Unrealized depreciation | | | (2,215,161 | ) |
| | | | |
Net unrealized appreciation (depreciation) | | $ | 38,825,640 | |
| | | | |
Distributable earnings - undistributed long term capital gains | | $ | 14,482,479 | |
| | | | |
Differences between income and/or capital gains as determined on a book basis and a tax basis are primarily due differing treatment of wash sales.
FRANKLIN TEMPLETON VARIABLE INSURANCE PRODUCTS TRUST
NOTES TO FINANCIAL STATEMENTS
Franklin Flex Cap Growth VIP Fund (continued)
6. Investment Transactions
Purchases and sales of investments (excluding short term securities) for the year ended December 31, 2015, aggregated $105,385,283 and $119,559,459, respectively.
7. Credit Facility
The Fund, together with other U.S. registered and foreign investment funds (collectively, Borrowers), managed by Franklin Templeton Investments, are borrowers in a joint syndicated senior unsecured credit facility totaling $2 billion (Global Credit Facility) which matured on February 12, 2016. This Global Credit Facility provides a source of funds to the Borrowers for temporary and emergency purposes, including the ability to meet future unanticipated or unusually large redemption requests. Effective February 12, 2016, the Borrowers renewed the Global Credit Facility for a one year term, maturing February 10, 2017, for a total of $2 billion.
Under the terms of the Global Credit Facility, the Fund shall, in addition to interest charged on any borrowings made by the Fund and other costs incurred by the Fund, pay its share of fees and expenses incurred in connection with the implementation and maintenance of the Global Credit Facility, based upon its relative share of the aggregate net assets of all of the Borrowers, including an annual commitment fee of 0.07% based upon the unused portion of the Global Credit Facility. Effective February 12, 2016, the annual commitment fee is 0.15%. These fees are reflected in other expenses in the Statement of Operations. During the year ended December 31, 2015, the Fund did not use the Global Credit Facility.
8. Fair Value Measurements
The Fund follows a fair value hierarchy that distinguishes between market data obtained from independent sources (observable inputs) and the Fund’s own market assumptions (unobservable inputs). These inputs are used in determining the value of the Fund’s financial instruments and are summarized in the following fair value hierarchy:
| | • | | Level 1 – quoted prices in active markets for identical financial instruments |
| | • | | Level 2 – other significant observable inputs (including quoted prices for similar financial instruments, interest rates, prepayment speed, credit risk, etc.) |
| | • | | Level 3 – significant unobservable inputs (including the Fund’s own assumptions in determining the fair value of financial instruments) |
The input levels are not necessarily an indication of the risk or liquidity associated with financial instruments at that level.
For movements between the levels within the fair value hierarchy, the Fund has adopted a policy of recognizing the transfers as of the date of the underlying event which caused the movement.
A summary of inputs used as of December 31, 2015, in valuing the Fund’s assets carried at fair value, is as follows:
| | | | | | | | | | | | | | | | |
| | | Level 1 | | | Level 2 | | | Level 3 | | | Total | |
| | | | |
| Assets: | | | | | | | | | | | | | | | | |
Investments in Securities: | | | | | | | | | | | | | | | | |
Equity Investments:a | | | | | | | | | | | | | | | | |
Pharmaceuticals, Biotechnology & Life Sciences | | $ | 14,161,689 | | | $ | — | | | $ | 56,149 | | | $ | 14,217,838 | |
All Other Equity Investmentsb | | | 101,061,172 | | | | — | | | | — | | | | 101,061,172 | |
| | | | |
Total Investments in Securities | | $ | 115,222,861 | | | $ | — | | | $ | 56,149 | | | $ | 115,279,010 | |
| | | | |
aIncludes common stocks.
bFor detailed categories, see the accompanying Statement of Investments.
FRANKLIN TEMPLETON VARIABLE INSURANCE PRODUCTS TRUST
NOTES TO FINANCIAL STATEMENTS
Franklin Flex Cap Growth VIP Fund (continued)
8. Fair Value Measurements (continued)
A reconciliation of assets in which Level 3 inputs are used in determining fair value is presented when there are significant Level 3 financial instruments at the end of the year.
9. Subsequent Events
The Fund has evaluated subsequent events through the issuance of the financial statements and determined that no events have occurred that require disclosure other than those already disclosed in the financial statements.
FRANKLIN TEMPLETON VARIABLE INSURANCE PRODUCTS TRUST
Report of Independent Registered Public Accounting Firm
Franklin Flex Cap Growth VIP Fund
To the Board of Trustees and Shareholders of Franklin Templeton Variable Insurance Products Trust
In our opinion, the accompanying statement of assets and liabilities, including the statement of investments, and the related statements of operations and of changes in net assets and the financial highlights present fairly, in all material respects, the financial position of Franklin Flex Cap Growth VIP Fund (the “Fund”) at December 31, 2015, the results of its operations for the year then ended, the changes in its net assets for each of the two years in the period then ended and the financial highlights for each of the periods presented, in conformity with accounting principles generally accepted in the United States of America. These financial statements and financial highlights (hereafter referred to as “financial statements”) are the responsibility of the Fund’s management. Our responsibility is to express an opinion on these financial statements based on our audit. We conducted our audit of these financial statements in accordance with the standards of the Public Company Accounting Oversight Board (United States). Those standards require that we plan and perform the audit to obtain reasonable assurance about whether the financial statements are free of material misstatement. An audit includes examining, on a test basis, evidence supporting the amounts and disclosures in the financial statements, assessing the accounting principles used and significant estimates made by management, and evaluating the overall financial statement presentation. We believe that our audit, which included confirmation of securities at December 31, 2015 by correspondence with the custodian and brokers, provides a reasonable basis for our opinion.
PricewaterhouseCoopers LLP
San Francisco, California
February 16, 2016
FRANKLIN TEMPLETON VARIABLE INSURANCE PRODUCTS TRUST
Tax Information (unaudited)
Franklin Flex Cap Growth VIP Fund
Under Section 852(b)(3)(C) of the Internal Revenue Code (Code), the Fund hereby reports the maximum amount allowable but no less than $74,136,659 as a long term capital gain dividend for the fiscal year ended December 31, 2015.
Under Section 854(b)(1)(A) of the Code, the Fund hereby reports 25.26% of the ordinary income dividends as income qualifying for the dividends received deduction for the fiscal year ended December 31, 2015.
Franklin Founding Funds Allocation VIP Fund
This annual report for Franklin Founding Funds Allocation VIP Fund covers the fiscal year ended December 31, 2015.
Class 4 Performance Summary as of December 31, 2015
Average annual total return of Class 4 shares* represents the average annual change in value, assuming reinvestment of dividends and capital gains. Average returns smooth out variations in returns, which can be significant; they are not the same as year-by-year results.
| | | | | | | | | | | | |
| Periods ended 12/31/15 | | 1-Year | | | 5-Year | | | Since Inception (7/2/07) | |
Average Annual Total Return | | | -6.24% | | | | +6.18% | | | | +1.74% | |
*For the period beginning 2/29/08, Class 4 performance reflects a 12b-1 fee expense of 0.35% per year, which affects future performance. Class 4 performance prior to 2/29/08 reflects historical Class 1 performance, which does not have a 12b-1 fee expense. Since 2/29/08 (effective date), the average annual total return of Class 4 shares was +3.79%. The Fund has an expense reduction contractually guaranteed through at least 4/30/16. Fund investment results reflect the expense reduction, to the extent applicable; without this reduction, the results would have been lower.
Performance reflects the Fund’s Class 4 operating expenses, but does not include any contract fees, expenses or sales charges. If they had been included, performance would be lower. These charges and deductions, particularly for variable life policies, can have a significant effect on contract values and insurance benefits. See the contract prospectus for a complete description of these expenses, including sales charges.
Performance data represent past performance, which does not guarantee future results. Investment return and principal value will fluctuate, and you may have a gain or loss when you sell your shares. Current performance may differ from figures shown.
Total Return Index Comparison for a Hypothetical $10,000 Investment (7/2/07–12/31/15)
The graph below shows the change in value of a hypothetical $10,000 investment in the Fund over the indicated period and includes reinvestment of any income or distributions. The Fund’s performance* is compared to the performance of the Standard & Poor’s® 500 Index (S&P 500®) and the MSCI World Index. One cannot invest directly in an index, and an index is not representative of the Fund’s portfolio. Please see Important Notes to Performance Information preceding the Fund Summaries.
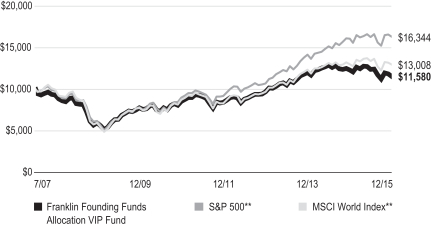
**Source: Morningstar. Please see Index Descriptions following the Fund Summaries.
FRANKLIN FOUNDING FUNDS ALLOCATION VIP FUND
Fund Goals and Main Investments
The Fund seeks capital appreciation, with income as a secondary goal. Under normal market conditions, the Fund invests equal portions in Class 1 shares of Franklin Income VIP Fund, Franklin Mutual Shares VIP Fund and Templeton Growth VIP Fund.
Fund Risks
All investments involve risks, including possible loss of principal. Because the Fund invests in underlying funds that may engage in a variety of investment strategies involving certain risks, the Fund may be subject to these same risks. Stock prices fluctuate, sometimes rapidly and dramatically, due to factors affecting individual companies, particular industries or sectors, or general market conditions. Bonds are affected by changes in interest rates and the creditworthiness of their issuers. Bond prices generally move in the opposite direction of interest rates. Thus, as prices of bonds adjust to a rise in interest rates, the Fund’s share price may decline. Higher yielding, lower rated corporate bonds entail a greater degree of credit risk compared to investment-grade securities. Foreign investing carries additional risks such as currency and market volatility and political or social instability, risks that are heightened in developing countries. Value securities may not increase in price as anticipated or may decline further in value. The Fund’s prospectus also includes a description of the main investment risks.
Performance Overview
You can find the Fund’s one-year total return in the Performance Summary. In comparison, the S&P 500 generated a +1.38% total return and the MSCI World Index had a -0.32% total return for the same period.1
Economic and Market Overview
U.S. economic growth slowed in 2015’s first quarter but strengthened in 2015’s second quarter amid healthy consumer spending. The third and fourth quarters were less robust as exports slowed and state and local governments reduced their spending. At its December meeting, the U.S. Federal Reserve (Fed) increased its target range for the federal funds rate to 0.25%–0.50%, as policymakers cited the labor market’s considerable improvement and were reasonably confident that inflation would move back to the Fed’s 2% medium-term objective. Furthermore, the Fed raised its forecast for 2016 U.S. economic growth and lowered its unemployment projection. Despite periods of volatility, the broad U.S. stock market, as
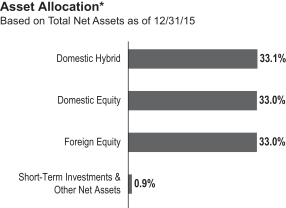
*The asset allocation is based on the Statement of Investments (SOI), which classifies each underlying fund into a broad asset class.
The dollar value, number of shares or principal amount, and names of all portfolio holdings are listed in the Fund’s SOI.
measured by the S&P 500, generated a modest positive total return for 2015.
The global economy expanded moderately during the 12 months under review. As measured by the MSCI World Index, stocks in global developed markets overall were nearly unchanged for the year amid some positive developments. Weighing on global stocks at times were worries about China’s slowing economy and tumbling stock market, declining commodity prices, geopolitical tensions between Russia and Turkey, and ongoing uncertainty over the Fed’s timing for raising interest rates. Toward period-end, equity markets recovered somewhat as the Fed increased its federal funds target range, alleviating some uncertainty about a change in the U.S. monetary policy. During the year, oil prices declined sharply largely due to increased global supply that exceeded demand. Gold and other commodity prices also fell. The U.S. dollar appreciated against most currencies during the period, which reduced returns of many foreign assets in U.S. dollar terms.
In Europe, U.K. economic growth gained momentum from the services sector, but the economy slowed in 2015 compared with 2014. The eurozone grew moderately and generally benefited during the period from lower oil prices, a weaker euro that supported exports, the European Central Bank’s (ECB’s) accommodative policy and expectations of further ECB stimulus. Although the eurozone’s annual inflation rate declined early in the period, it rose slightly during the rest of the period. The ECB maintained its benchmark interest rates although it reduced its bank deposit rate in December, seeking to boost the region’s slowing growth.
1. Source: Morningstar.
One cannot invest directly in an index, and an index is not representative of the Fund’s portfolio. Please see Index Descriptions following the Fund Summaries.
FRANKLIN FOUNDING FUNDS ALLOCATION VIP FUND
Japan’s economy continued to grow in 2015’s first quarter. After a decline in the second quarter of 2015, it expanded in the third quarter as capital expenditures improved. The Bank of Japan took several actions during the reporting period, including maintaining its monetary policy, lowering its economic growth and inflation forecasts, and reorganizing its stimulus program to increase exposure to long-term government bonds and exchange-traded funds.
Investment Strategy
The Fund normally invests its assets in an equally weighted combination of Class 1 shares of Franklin Income VIP Fund, Franklin Mutual Shares VIP Fund and Templeton Growth VIP Fund. These underlying funds, in turn, invest in a variety of U.S. and foreign equity securities and, to a lesser extent, fixed income and money market securities. As market conditions affect the underlying funds, we rebalance the Fund’s allocations seeking to maintain equal weightings of approximately 33 1⁄3% of total net assets in each underlying fund whenever the actual allocations exceed plus or minus 3% of the fixed allocation percentages.
Manager’s Discussion
The Fund’s performance can be attributed largely to its allocation among the underlying funds and their investments in domestic and foreign equities, fixed income securities, and short-term investments and other net assets.
During the 12 months under review, Franklin Income VIP Fund – Class 1 and Franklin Mutual Shares VIP Fund – Class 1 underperformed the S&P 500. Templeton Growth VIP Fund –Class 1 underperformed the MSCI World Index.
Thank you for your participation in Franklin Founding Funds Allocation VIP Fund. We look forward to serving your future investment needs.
The foregoing information reflects our analysis, opinions and portfolio holdings as of December 31, 2015, the end of the reporting period. The way we implement our main investment strategies and the resulting portfolio holdings may change depending on factors such as market and economic conditions. These opinions may not be relied upon as investment advice or an offer for a particular security. The information is not a complete analysis of every aspect of any market, country, industry, security or the Fund. Statements of fact are from sources considered reliable, but the investment manager makes no representation or warranty as to their completeness or accuracy. Although historical performance is no guarantee of future results, these insights may help you understand our investment management philosophy.
FRANKLIN FOUNDING FUNDS ALLOCATION VIP FUND
Class 4 Fund Expenses
As an investor in a variable insurance contract (Contract) that indirectly provides for investment in an underlying mutual fund, you can incur transaction and/or ongoing expenses at both the Fund level and the Contract level.
| • | | Transaction expenses can include sales charges (loads) on purchases, redemption fees, surrender fees, transfer fees and premium taxes. |
| • | | Ongoing expenses can include management fees, distribution and service (12b-1) fees, contract fees, annual maintenance fees, mortality and expense risk fees and other fees and expenses. All mutual funds and Contracts have some types of ongoing expenses. |
The expenses shown in the table are meant to highlight ongoing expenses at the Fund level only and do not include ongoing expenses at the Contract level, or transaction expenses at either the Fund or Contract levels. While the Fund does not have transaction expenses, if the transaction and ongoing expenses at the Contract level were included, the expenses shown below would be higher. You should consult your Contract prospectus or disclosure document for more information.
The table shows Fund-level ongoing expenses and can help you understand these expenses and compare them with those of other mutual funds offered through the Contract. The table assumes a $1,000 investment held for the six months indicated. Please refer to the Fund prospectus for additional information on operating expenses.
Actual Fund Expenses
The first line (Actual) of the table provides actual account values and expenses. The “Ending Account Value” is derived from the Fund’s actual return, which includes the effect of ongoing Fund expenses, but does not include the effect of ongoing Contract expenses.
You can estimate the Fund-level expenses you incurred during the period by following these steps. Of course, your account value and expenses will differ from those in this illustration:
| 1. | Divide your account value by $1,000. |
If an account had an $8,600 value, then $8,600 ÷ $1,000 = 8.6.
| 2. | Multiply the result by the number under the heading “Fund-Level Expenses Incurred During Period.” |
If Fund-Level Expenses Incurred During Period were $7.50, then 8.6 × $7.50 = $64.50.
In this illustration, the estimated expenses incurred this period at the Fund level are $64.50.
Hypothetical Example for Comparison with Other Mutual Funds
Information in the second line (Hypothetical) of the table can help you compare ongoing expenses of the Fund with those of other mutual funds offered through the Contract. This information may not be used to estimate the actual ending account balance or expenses you incurred during the period. The hypothetical “Ending Account Value” is based on the Fund’s actual expense ratio and an assumed 5% annual rate of return before expenses, which does not represent the Fund’s actual return. The figure under the heading “Fund-Level Expenses Incurred During Period” shows the hypothetical expenses your account would have incurred under this scenario. You can compare this figure with the 5% hypothetical examples that appear in shareholder reports of other funds offered through a Contract.
| | | | | | | | | | | | | | | | |
| Class 4 | | Beginning Account
Value 7/1/15 | | | Ending Account
Value 12/31/15 | | | Expenses Paid
During Period* 7/1/15–12/31/15 | | | Expenses Paid
During Period** 7/1/15–12/31/15 | |
Actual | | | $1,000 | | | | $ 933.40 | | | | $2.19 | | | | $5.46 | |
Hypothetical (5% return before expenses) | | | $1,000 | | | | $1,022.94 | | | | $2.29 | | | | $5.70 | |
*Expenses are calculated using the most recent six-month annualized expense ratio excluding expenses of the underlying funds, net of expense waivers, for the Fund’s Class 4 shares (0.45%), which does not include any ongoing expenses of the Contract for which the Fund is an investment option, multiplied by the average account value over the period, multiplied by 184/365 to reflect the one-half year period.
**Expenses are calculated using the most recent six-month annualized expense ratio including expenses of the underlying funds, net of expense waivers, for the Fund’s Class 4 shares (1.12%), which does not include any ongoing expenses of the Contract for which the Fund is an investment option, multiplied by the average account value over the period, multiplied by 184/365 to reflect the one-half year period.
FRANKLIN TEMPLETON VARIABLE INSURANCE PRODUCTS TRUST
Financial Highlights
Franklin Founding Funds Allocation VIP Fund
| | | | | | | | | | | | | | | | | | | | |
| | | Year Ended December 31, | |
| | | 2015 | | | 2014 | | | 2013 | | | 2012 | | | 2011 | |
| Class 1 | | | | | | | | | | | | | | | | | | | | |
Per share operating performance
(for a share outstanding throughout the year) | | | | | | | | | | | | | | | | | | | | |
| | | | | |
Net asset value, beginning of year | | | $7.47 | | | | $7.47 | | | | $8.55 | | | | $7.63 | | | | $7.73 | |
| | | | |
| | | | | |
| Income from investment operationsa: | | | | | | | | | | | | | | | | | | | | |
| | | | | |
Net investment incomeb,c | | | 0.26 | | | | 0.22 | | | | 0.30 | | | | 0.26 | | | | 0.25 | |
| | | | | |
Net realized and unrealized gains (losses) | | | (0.68 | ) | | | 0.02 | | | | 1.42 | | | | 0.90 | | | | (0.35 | ) |
| | | | |
Total from investment operations | | | (0.42 | ) | | | 0.24 | | | | 1.72 | | | | 1.16 | | | | (0.10 | ) |
| | | | |
| | | | | |
| Less distributions from: | | | | | | | | | | | | | | | | | | | | |
| | | | | |
Net investment income | | | (0.24 | ) | | | (0.23 | ) | | | (1.15 | ) | | | (0.24 | ) | | | (— | )d |
| | | | | |
Net realized gains | | | (0.01 | ) | | | (0.01 | ) | | | (1.65 | ) | | | — | | | | — | |
| | | | |
Total distributions | | | (0.25 | ) | | | (0.24 | ) | | | (2.80 | ) | | | (0.24 | ) | | | (— | )d |
| | | | |
Net asset value, end of year | | | $6.80 | | | | $7.47 | | | | $7.47 | | | | $8.55 | | | | $7.63 | |
| | | | |
| | | | | |
Total returne | | | (5.93)% | | | | 3.05% | | | | 24.14% | | | | 15.56% | | | | (1.28)% | |
| | | | | |
| Ratios to average net assets | | | | | | | | | | | | | | | | | | | | |
| | | | | |
Expenses before waiver and payments by affiliatesf | | | 0.11% | | | | 0.11% | | | | 0.11% | | | | 0.11% | | | | 0.11% | |
| | | | | |
Expenses net of waiver and payments by affiliatesf | | | 0.10% | | | | 0.10% | | | | 0.10% | | | | 0.10% | | | | 0.10% | |
| | | | | |
Net investment incomec | | | 3.51% | | | | 2.88% | | | | 3.67% | | | | 4.06% | | | | 3.44% | |
| | | | | |
| Supplemental data | | | | | | | | | | | | | | | | | | | | |
| | | | | |
Net assets, end of year (000’s) | | | $1,083 | | | | $1,114 | | | | $952 | | | | $767 | | | | $470 | |
| | | | | |
Portfolio turnover rate | | | 0.26% | | | | 4.80% | | | | 3.91% | | | | 28.46% | g | | | 58.42% | |
aThe amount shown for a share outstanding throughout the period may not correlate with the Statement of Operations for the period due to the timing of sales and repurchases of the Fund’s shares in relation to income earned and/or fluctuating fair value of the investments of the Fund.
bBased on average daily shares outstanding.
cRecognition of net investment income by the Fund is affected by the timing of declaration of dividends by the Underlying Funds in which the Fund invests.
dAmount rounds to less than $0.01 per share.
eTotal return does not include fees, charges or expenses imposed by the variable annuity and life insurance contracts for which Franklin Templeton Variable Insurance Products Trust serves as an underlying investment vehicle.
fDoes not include expenses of the Underlying Funds in which the Fund invests. The weighted average indirect expenses of the Underlying Funds was 0.67% for the year ended December 31, 2015.
gExcludes the value of portfolio securities delivered as a result of a redemption in-kind.
| | | | | | |
| | | The accompanying notes are an integral part of these financial statements. | Annual Report | | | FFA-5 | |
FRANKLIN TEMPLETON VARIABLE INSURANCE PRODUCTS TRUST
FINANCIAL HIGHLIGHTS
Franklin Founding Funds Allocation VIP Fund (continued)
| | | | | | | | | | | | | | | | | | | | |
| | | Year Ended December 31, | |
| | | 2015 | | | 2014 | | | 2013 | | | 2012 | | | 2011 | |
| Class 2 | | | | | | | | | | | | | | | | | | | | |
Per share operating performance
(for a share outstanding throughout the year) | | | | | | | | | | | | | | | | | | | | |
| | | | | |
Net asset value, beginning of year | | | $7.42 | | | | $7.42 | | | | $8.51 | | | | $7.59 | | | | $7.71 | |
| | | | |
| | | | | |
| Income from investment operationsa: | | | | | | | | | | | | | | | | | | | | |
| | | | | |
Net investment incomeb,c | | | 0.24 | | | | 0.20 | | | | 0.27 | | | | 0.25 | | | | 0.23 | |
| | | | | |
Net realized and unrealized gains (losses) | | | (0.68 | ) | | | 0.02 | | | | 1.42 | | | | 0.89 | | | | (0.35 | ) |
| | | | |
Total from investment operations | | | (0.44 | ) | | | 0.22 | | | | 1.69 | | | | 1.14 | | | | (0.12 | ) |
| | | | |
| | | | | |
| Less distributions from: | | | | | | | | | | | | | | | | | | | | |
| | | | | |
Net investment income | | | (0.22 | ) | | | (0.21 | ) | | | (1.13 | ) | | | (0.22 | ) | | | (— | )d |
| | | | | |
Net realized gains | | | (0.01 | ) | | | (0.01 | ) | | | (1.65 | ) | | | — | | | | — | |
| | | | |
Total distributions | | | (0.23 | ) | | | (0.22 | ) | | | (2.78 | ) | | | (0.22 | ) | | | (— | )d |
| | | | |
Net asset value, end of year | | | $6.75 | | | | $7.42 | | | | $7.42 | | | | $8.51 | | | | $7.59 | |
| | | | |
| | | | | |
Total returne | | | (6.21)% | | | | 2.85% | | | | 23.77% | | | | 15.33% | | | | (1.54)% | |
| | | | | |
| Ratios to average net assets | | | | | | | | | | | | | | | | | | | | |
| | | | | |
Expenses before waiver and payments by affiliatesf | | | 0.36% | | | | 0.36% | | | | 0.36% | | | | 0.36% | | | | 0.36% | |
| | | | | |
Expenses net of waiver and payments by affiliatesf | | | 0.35% | | | | 0.35% | | | | 0.35% | | | | 0.35% | | | | 0.35% | |
| | | | | |
Net investment incomec | | | 3.26% | | | | 2.63% | | | | 3.42% | | | | 3.81% | | | | 3.19% | |
| | | | | |
| Supplemental data | | | | | | | | | | | | | | | | | | | | |
| | | | | |
Net assets, end of year (000’s) | | | $480,715 | | | | $557,704 | | | | $547,506 | | | | $472,686 | | | | $448,101 | |
| | | | | |
Portfolio turnover rate | | | 0.26% | | | | 4.80% | | | | 3.91% | | | | 28.46% | g | | | 58.42% | |
aThe amount shown for a share outstanding throughout the period may not correlate with the Statement of Operations for the period due to the timing of sales and repurchases of the Fund’s shares in relation to income earned and/or fluctuating fair value of the investments of the Fund.
bBased on average daily shares outstanding.
cRecognition of net investment income by the Fund is affected by the timing of declaration of dividends by the Underlying Funds in which the Fund invests.
dAmount rounds to less than $0.01 per share.
eTotal return does not include fees, charges or expenses imposed by the variable annuity and life insurance contracts for which Franklin Templeton Variable Insurance Products Trust serves as an underlying investment vehicle.
fDoes not include expenses of the Underlying Funds in which the Fund invests. The weighted average indirect expenses of the Underlying Funds was 0.67% for the year ended December 31, 2015.
gExcludes the value of portfolio securities delivered as a result of a redemption in-kind.
| | | | |
| FFA-6 | | Annual Report | The accompanying notes are an integral part of these financial statements. | | |
FRANKLIN TEMPLETON VARIABLE INSURANCE PRODUCTS TRUST
FINANCIAL HIGHLIGHTS
Franklin Founding Funds Allocation VIP Fund (continued)
| | | | | | | | | | | | | | | | | | | | |
| | | Year Ended December 31, | |
| | | 2015 | | | 2014 | | | 2013 | | | 2012 | | | 2011 | |
| Class 4 | | | | | | | | | | | | | | | | | | | | |
Per share operating performance
(for a share outstanding throughout the year) | | | | | | | | | | | | | | | | | | | | |
| | | | | |
Net asset value, beginning of year | | | $7.54 | | | | $7.54 | | | | $8.49 | | | | $7.58 | | | | $7.71 | |
| | | | |
| | | | | |
| Income from investment operationsa: | | | | | | | | | | | | | | | | | | | | |
| | | | | |
Net investment incomeb,c | | | 0.23 | | | | 0.20 | | | | 0.26 | | | | 0.30 | | | | 0.24 | |
| | | | | |
Net realized and unrealized gains (losses) | | | (0.68 | ) | | | 0.02 | | | | 1.43 | | | | 0.83 | | | | (0.37 | ) |
| | | | |
Total from investment operations | | | (0.45 | ) | | | 0.22 | | | | 1.69 | | | | 1.13 | | | | (0.13 | ) |
| | | | |
| | | | | |
| Less distributions from: | | | | | | | | | | | | | | | | | | | | |
| | | | | |
Net investment income | | | (0.21 | ) | | | (0.21 | ) | | | (0.99 | ) | | | (0.22 | ) | | | (— | )d |
| | | | | |
Net realized gains | | | (0.01 | ) | | | (0.01 | ) | | | (1.65 | ) | | | — | | | | — | |
| | | | |
Total distributions | | | (0.22 | ) | | | (0.22 | ) | | | (2.64 | ) | | | (0.22 | ) | | | (— | )d |
| | | | |
Net asset value, end of year | | | $6.87 | | | | $7.54 | | | | $7.54 | | | | $8.49 | | | | $7.58 | |
| | | | |
| | | | | |
Total returne | | | (6.24)% | | | | 2.75% | | | | 23.68% | | | | 15.17% | | | | (1.67)% | |
| | | | | |
| Ratios to average net assets | | | | | | | | | | | | | | | | | | | | |
| | | | | |
Expenses before waiver and payments by affiliatesf | | | 0.46% | | | | 0.46% | | | | 0.46% | | | | 0.46% | | | | 0.46% | |
| | | | | |
Expenses net of waiver and payments by affiliatesf | | | 0.45% | | | | 0.45% | | | | 0.45% | | | | 0.45% | | | | 0.45% | |
| | | | | |
Net investment incomec | | | 3.16% | | | | 2.53% | | | | 3.32% | | | | 3.71% | | | | 3.09% | |
| | | | | |
| Supplemental data | | | | | | | | | | | | | | | | | | | | |
| | | | | |
Net assets, end of year (000’s) | | | $550,825 | | | | $702,324 | | | | $676,781 | | | | $493,813 | | | | $2,860,928 | |
| | | | | |
Portfolio turnover rate | | | 0.26% | | | | 4.80% | | | | 3.91% | | | | 28.46% | g | | | 58.42% | |
aThe amount shown for a share outstanding throughout the period may not correlate with the Statement of Operations for the period due to the timing of sales and repurchases of the Fund’s shares in relation to income earned and/or fluctuating fair value of the investments of the Fund.
bBased on average daily shares outstanding.
cRecognition of net investment income by the Fund is affected by the timing of declaration of dividends by the Underlying Funds in which the Fund invests.
dAmount rounds to less than $0.01 per share.
eTotal return does not include fees, charges or expenses imposed by the variable annuity and life insurance contracts for which Franklin Templeton Variable Insurance Products Trust serves as an underlying investment vehicle.
fDoes not include expenses of the Underlying Funds in which the Fund invests. The weighted average indirect expenses of the Underlying Funds was 0.67% for the year ended December 31, 2015.
gExcludes the value of portfolio securities delivered as a result of a redemption in-kind.
| | | | | | |
| | | The accompanying notes are an integral part of these financial statements. | Annual Report | | | FFA-7 | |
FRANKLIN TEMPLETON VARIABLE INSURANCE PRODUCTS TRUST
Statement of Investments, December 31, 2015
| | | | | | | | | | |
| Franklin Founding Funds Allocation VIP Fund | |
| | | | | Shares | | | Value | |
| | | | | | | | | | |
| | Investments in Underlying Fundsa | | | | | | | | |
| | Domestic Equity 33.0% | | | | | | | | |
| | Franklin Mutual Shares VIP Fund, Class 1 | | | 17,510,038 | | | $ | 341,095,541 | |
| | | | | | | | | | |
| | Domestic Hybrid 33.1% | | | | | | | | |
| | Franklin Income VIP Fund, Class 1 | | | 23,343,030 | | | | 341,741,958 | |
| | | | | | | | | | |
| | Foreign Equity 33.0% | | | | | | | | |
| | Templeton Growth VIP Fund, Class 1 | | | 25,118,084 | | | | 340,098,855 | |
| | | | | | | | | | |
| | Total Investments in Underlying Funds (Cost $816,509,979) 99.1% | | | | | | | 1,022,936,354 | |
| | Other Assets, less Liabilities 0.9% | | | | | | | 9,686,602 | |
| | | | | | | | | | |
| | Net Assets 100.0% | | | | | | $ | 1,032,622,956 | |
| | | | | | | | | | |
aSee Note 3(d) regarding investments in Underlying Funds.
| | | | |
| FFA-8 | | Annual Report | The accompanying notes are an integral part of these financial statements. | | |
FRANKLIN TEMPLETON VARIABLE INSURANCE PRODUCTS TRUST
Financial Statements
Statement of Assets and Liabilities
December 31, 2015
| | | | |
| | | Franklin Founding
Funds Allocation
VIP Fund | |
Assets: | | | | |
Investments in Underlying Funds: (Note 3d) | | | | |
Cost | | $ | 816,509,979 | |
| | | | |
Value | | $ | 1,022,936,354 | |
Cash | | | 10,419,572 | |
Receivables from capital shares sold | | | 470,113 | |
Other assets | | | 97 | |
| | | | |
Total assets | | | 1,033,826,136 | |
| | | | |
Liabilities: | | | | |
Payables: | | | | |
Capital shares redeemed | | | 511,026 | |
Administrative fees | | | 68,315 | |
Distribution fees | | | 538,728 | |
Accrued expenses and other liabilities | | | 85,111 | |
| | | | |
Total liabilities | | | 1,203,180 | |
| | | | |
Net assets, at value | | $ | 1,032,622,956 | |
| | | | |
Net assets consist of: | | | | |
Paid-in capital | | $ | 810,201,014 | |
Undistributed net investment income | | | 35,824,134 | |
Net unrealized appreciation (depreciation) | | | 206,426,375 | |
Accumulated net realized gain (loss) | | | (19,828,567 | ) |
| | | | |
Net assets, at value | | $ | 1,032,622,956 | |
| | | | |
| |
| Class 1: | | | | |
Net assets, at value | | $ | 1,082,902 | |
| | | | |
Shares outstanding | | | 159,230 | |
| | | | |
Net asset value and maximum offering price per share | | $ | 6.80 | |
| | | | |
| |
| Class 2: | | | | |
Net assets, at value | | $ | 480,714,874 | |
| | | | |
Shares outstanding | | | 71,179,047 | |
| | | | |
Net asset value and maximum offering price per share | | $ | 6.75 | |
| | | | |
| |
| Class 4: | | | | |
Net assets, at value | | $ | 550,825,180 | |
| | | | |
Shares outstanding | | | 80,231,570 | |
| | | | |
Net asset value and maximum offering price per share | | $ | 6.87 | |
| | | | |
| | | | |
| | | The accompanying notes are an integral part of these financial statements. | Annual Report | | FFA-9 |
FRANKLIN TEMPLETON VARIABLE INSURANCE PRODUCTS TRUST
FINANCIAL STATEMENTS
Statement of Operations
for the year ended December 31, 2015
| | | | |
| | | Franklin Founding
Funds Allocation
VIP Fund | |
Investment income: | | | | |
Dividends from Underlying Funds (Note 3d) | | $ | 42,133,323 | |
| | | | |
Expenses: | | | | |
Administrative fees (Note 3a) | | | 1,167,886 | |
Distribution fees: (Note 3b) | | | | |
Class 2 | | | 1,322,682 | |
Class 4 | | | 2,228,850 | |
Reports to shareholders | | | 93,286 | |
Professional fees | | | 38,539 | |
Trustees’ fees and expenses | | | 5,206 | |
Other | | | 12,960 | |
| | | | |
Total expenses | | | 4,869,409 | |
Expenses waived/paid by affiliates (Note 3e) | | | (149,965 | ) |
| | | | |
Net expenses | | | 4,719,444 | |
| | | | |
Net investment income | | | 37,413,879 | |
| | | | |
Realized and unrealized gains (losses): | | | | |
Net realized gain (loss) from: | | | | |
Sale of investments in Underlying Funds (Note 3d) | | | 10,101,462 | |
Realized gain distribution by Underlying Funds (Note 3d) | | | 25,299,143 | |
| | | | |
Net realized gain (loss) | | | 35,400,605 | |
| | | | |
Net change in unrealized appreciation (depreciation) on investments in Underlying Funds | | | (142,745,103 | ) |
| | | | |
Net realized and unrealized gain (loss) | | | (107,344,498 | ) |
| | | | |
Net increase (decrease) in net assets resulting from operations | | $ | (69,930,619 | ) |
| | | | |
| | | | |
| FFA-10 | | Annual Report | The accompanying notes are an integral part of these financial statements. | | |
FRANKLIN TEMPLETON VARIABLE INSURANCE PRODUCTS TRUST
FINANCIAL STATEMENTS
Statements of Changes in Net Assets
| | | | | | | | |
| | | Franklin Founding Funds Allocation VIP Fund | |
| | | Year Ended December 31, | |
| | | 2015 | | | 2014 | |
Increase (decrease) in net assets: | | | | | | | | |
Operations: | | | | | | | | |
Net investment income | | $ | 37,413,879 | | | $ | 33,255,768 | |
Net realized gain (loss) | | | 35,400,605 | | | | 1,584,965 | |
Net change in unrealized appreciation (depreciation) | | | (142,745,103 | ) | | | (1,653,471 | ) |
| | | | |
Net increase (decrease) in net assets resulting from operations | | | (69,930,619 | ) | | | 33,187,262 | |
| | | | |
Distributions to shareholders from: | | | | | | | | |
Net investment income: | | | | | | | | |
Class 1 | | | (36,795 | ) | | | (32,764 | ) |
Class 2 | | | (15,525,526 | ) | | | (15,578,364 | ) |
Class 4 | | | (17,645,320 | ) | | | (19,895,877 | ) |
Net realized gains: | | | | | | | | |
Class 1 | | | (1,845 | ) | | | (924 | ) |
Class 2 | | | (848,940 | ) | | | (475,173 | ) |
Class 4 | | | (1,013,211 | ) | | | (618,180 | ) |
| | | | |
Total distributions to shareholders | | | (35,071,637 | ) | | | (36,601,282 | ) |
| | | | |
Capital share transactions: (Note 2) | | | | | | | | |
Class 1 | | | 76,918 | | | | 164,958 | |
Class 2 | | | (28,851,107 | ) | | | 11,105,994 | |
Class 4 | | | (94,741,812 | ) | | | 28,046,285 | |
| | | | |
Total capital share transactions | | | (123,516,001 | ) | | | 39,317,237 | |
| | | | |
Net increase (decrease) in net assets | | | (228,518,257 | ) | | | 35,903,217 | |
Net assets: | | | | | | | | |
Beginning of year | | | 1,261,141,213 | | | | 1,225,237,996 | |
| | | | |
End of year | | $ | 1,032,622,956 | | | $ | 1,261,141,213 | |
| | | | |
Undistributed net investment income included in net assets: | | | | | | | | |
End of year | | $ | 35,824,134 | | | $ | 31,617,896 | |
| | | | |
| | | | |
| | | The accompanying notes are an integral part of these financial statements. | Annual Report | | FFA-11 |
FRANKLIN TEMPLETON VARIABLE INSURANCE PRODUCTS TRUST
Notes to Financial Statements
Franklin Founding Funds Allocation VIP Fund
1. Organization and Significant Accounting Policies
Franklin Templeton Variable Insurance Products Trust (Trust) is registered under the Investment Company Act of 1940 (1940 Act) as an open-end management investment company, consisting of nineteen separate funds and applies the specialized accounting and reporting guidance in U.S. Generally Accepted Accounting Principles (U.S. GAAP). Franklin Founding Funds Allocation VIP Fund (Fund) is included in this report. The financial statements of the remaining funds in the Trust are presented separately. The Fund invests primarily in other funds of the Trust (Underlying Funds). Shares of the Fund are generally sold only to insurance company separate accounts to fund the benefits of variable life insurance policies or variable annuity contracts. The Fund offers three classes of shares: Class 1, Class 2, and Class 4. Each class of shares differs by its distribution fees, voting rights on matters affecting a single class and its exchange privilege.
The accounting policies of the Underlying Funds are outlined in their respective shareholder reports. A copy of the Underlying Funds’ shareholder reports is available on the U.S. Securities and Exchange Commission (SEC) website at sec.gov or at the SEC’s Public Reference Room in Washington, D.C. The Underlying Funds’ shareholder reports are not covered by this report.
The following summarizes the Fund’s significant accounting policies.
a. Financial Instrument Valuation
The Fund’s investments in financial instruments are carried at fair value daily. Fair value is the price that would be received to sell an asset or paid to transfer a liability in an orderly transaction between market participants on the measurement date. The Fund calculates the net asset value (NAV) per share as of 4 p.m. Eastern time each day the New York Stock Exchange (NYSE) is open for trading. Under compliance policies and procedures approved by the Trust’s Board of Trustees (the Board), the Fund’s administrator has responsibility for oversight of valuation, including leading the cross-functional Valuation and Liquidity Oversight Committee (VLOC). The VLOC provides administration and oversight of the Fund’s valuation policies and procedures, which are approved annually by the Board. Among other things, these procedures allow the Fund to utilize independent pricing services, quotations from securities and financial instrument dealers, and other market sources to determine fair value.
Investments in the Underlying Funds are valued at their closing NAV each trading day.
b. Income Taxes
It is the Fund’s policy to qualify as a regulated investment company under the Internal Revenue Code. The Fund intends to distribute to shareholders substantially all of its taxable income and net realized gains to relieve it from federal income and if applicable, excise taxes. As a result, no provision for U.S. federal income taxes is required.
The Fund may recognize an income tax liability related to its uncertain tax positions under U.S. GAAP when the uncertain tax position has a less than 50% probability that it will be sustained upon examination by the tax authorities based on its technical merits. As of December 31, 2015, the Fund has determined that no tax liability is required in its financial statements related to uncertain tax positions for any open tax years (or expected to be taken on future tax returns). Open tax years are those that remain subject to examination and are based on each tax jurisdiction’s statute of limitation.
c. Security Transactions, Investment Income, Expenses and Distributions
Security transactions are accounted for on trade date. Realized gains and losses on security transactions are determined on a specific identification basis. Estimated expenses are accrued daily. Dividend income and realized gain distributions are recorded on the ex-dividend date. Distributions to shareholders are recorded on the ex-dividend date and are determined according to income tax regulations (tax basis). Distributable earnings determined on a tax basis may differ from earnings recorded in accordance with U.S. GAAP. These differences may be permanent or temporary. Permanent differences are reclassified among capital accounts to reflect their tax character. These reclassifications have no impact on net assets or the results of operations. Temporary differences are not reclassified, as they may reverse in subsequent periods.
Common expenses incurred by the Trust are allocated among the Funds based on the ratio of net assets of each Fund to the combined net assets of the Trust. Fund specific expenses are charged directly to the fund that incurred the expense.
The Fund indirectly bears its proportionate share of expenses from the Underlying Funds. Since the Underlying Funds have
FRANKLIN TEMPLETON VARIABLE INSURANCE PRODUCTS TRUST
NOTES TO FINANCIAL STATEMENTS
Franklin Founding Funds Allocation VIP Fund (continued)
varied expense levels and the Fund may own different proportions of the Underlying Funds at different times, the amount of expenses incurred indirectly by the Fund will vary.
Realized and unrealized gains and losses and net investment income, not including class specific expenses, are allocated daily to each class of shares based upon the relative proportion of net assets of each class. Differences in per share distributions, by class, are generally due to differences in class specific expenses.
d. Accounting Estimates
The preparation of financial statements in accordance with U.S. GAAP requires management to make estimates and assumptions that affect the reported amounts of assets and liabilities at the date of the financial statements and the amounts of income and expenses during the reporting period. Actual results could differ from those estimates.
e. Guarantees and Indemnifications
Under the Trust’s organizational documents, its officers and trustees are indemnified by the Trust against certain liabilities arising out of the performance of their duties to the Trust. Additionally, in the normal course of business, the Trust, on behalf of the Fund, enters into contracts with service providers that contain general indemnification clauses. The Trust’s maximum exposure under these arrangements is unknown as this would involve future claims that may be made against the Trust that have not yet occurred. Currently, the Trust expects the risk of loss to be remote.
2. Shares of Beneficial Interest
At December 31, 2015, there were an unlimited number of shares authorized (without par value). Transactions in the Fund’s shares were as follows:
| | | | | | | | | | | | | | | | | | |
| | | Year Ended December 31, | |
| | | 2015 | | | | | 2014 | |
| | | Shares | | | Amount | | | | | Shares | | | Amount | |
| | | | | |
| Class 1 Shares: | | | | | | | | | | | | | | | | | | |
Shares sold | | | 19,319 | | | $ | 143,699 | | | | | | 37,779 | | | $ | 289,740 | |
Shares issued in reinvestment of distributions | | | 5,229 | | | | 38,640 | | | | | | 4,341 | | | | 33,688 | |
Shares redeemed | | | (14,405 | ) | | | (105,421 | ) | | | | | (20,435 | ) | | | (158,470 | ) |
| | | | |
Net increase (decrease) | | | 10,143 | | | $ | 76,918 | | | | | | 21,685 | | | $ | 164,958 | |
| | | | |
| Class 2 Shares: | | | | | | | | | | | | | | | | | | |
Shares sold | | | 6,246,409 | | | $ | 45,291,801 | | | | | | 11,044,608 | | | $ | 83,657,513 | |
Shares issued in reinvestment of distributions | | | 2,227,819 | | | | 16,374,466 | | | | | | 2,082,171 | | | | 16,053,537 | |
Shares redeemed | | | (12,470,063 | ) | | | (90,517,374 | ) | | | | | (11,722,596 | ) | | | (88,605,056 | ) |
| | | | |
Net increase (decrease) | | | (3,995,835 | ) | | $ | (28,851,107 | ) | | | | | 1,404,183 | | | $ | 11,105,994 | |
| | | | |
| Class 4 Shares: | | | | | | | | | | | | | | | | | | |
Shares sold | | | 2,856,721 | | | $ | 21,294,894 | | | | | | 13,809,688 | | | $ | 106,773,129 | |
Shares issued in reinvestment of distributions | | | 2,494,456 | | | | 18,658,531 | | | | | | 2,616,589 | | | | 20,514,057 | |
Shares redeemed | | | (18,324,962 | ) | | | (134,695,237 | ) | | | | | (12,995,650 | ) | | | (99,240,901 | ) |
| | | | |
Net increase (decrease) | | | (12,973,785 | ) | | $ | (94,741,812 | ) | | | | | 3,430,627 | | | $ | 28,046,285 | |
| | | | |
FRANKLIN TEMPLETON VARIABLE INSURANCE PRODUCTS TRUST
NOTES TO FINANCIAL STATEMENTS
Franklin Founding Funds Allocation VIP Fund (continued)
3. Transactions With Affiliates
Franklin Resources, Inc. is the holding company for various subsidiaries that together are referred to as Franklin Templeton Investments. Certain officers and trustees of the Fund are also officers and/or directors/trustees of certain of the Underlying Funds and of the following subsidiaries:
| | |
| Subsidiary | | Affiliation |
Franklin Templeton Services, LLC (FT Services) | | Administrative manager |
Franklin Templeton Distributors, Inc. (Distributors) | | Principal underwriter |
Franklin Templeton Investor Services, LLC (Investor Services) | | Transfer agent |
a. Administrative Fees
The Fund pays an administrative fee to FT Services of 0.10% per year of the average daily net assets of the Fund for administrative services including monitoring and rebalancing the percentage of the Fund’s investments in the Underlying Funds.
b. Distribution Fees
The Board has adopted distribution plans for Class 2 and Class 4 shares pursuant to Rule 12b-1 under the 1940 Act. Under the Fund’s compensation distribution plans, the Fund pays Distributors for costs incurred in connection with the servicing, sale and distribution of the Fund’s shares up to 0.35% per year of its average daily net assets of each class. The Board has agreed to limit the current rate to 0.25% per year for Class 2. The plan year, for purposes of monitoring compliance with the maximum annual plan rates, is February 1 through January 31.
c. Transfer Agent Fees
Investor Services, under terms of an agreement, performs shareholder servicing for the Fund and is not paid by the Fund for the services.
d. Investments in Underlying Funds
The Fund invests primarily in the Underlying Funds which are managed by affiliates of the Fund’s administrative manager, FT Services. The Fund does not invest in the Underlying Funds for the purpose of exercising a controlling influence over the management or policies. Investments in Underlying Funds for the year ended December 31, 2015, were as follows:
| | | | | | | | | | | | | | | | | | | | | | | | | | | | | | | | |
| Underlying Funds | | Number
of Shares
Held at
Beginning
of Year | | | Gross
Additions | | | Gross
Reductions | | | Number
of Shares
Held at
End of
Year | | | Value at
End of
Year | | | Investment
Income | | | Realized
Gain
(Loss) | | | % of
Underlying
Fund Shares
Outstanding
Held at End
of Year | |
| | | | | | | | |
| | | | | | | | |
Franklin Income VIP Fund, Class 1 | | | 25,395,586 | | | | 1,249,587 | | | | (3,302,143 | ) | | | 23,343,030 | | | $ | 341,741,958 | | | $ | 18,633,204 | | | $ | (2,749,240 | ) | | | 5.72% | |
Franklin Mutual Shares VIP Fund, Class 1 | | | 18,222,604 | | | | 1,964,845 | | | | (2,677,411 | ) | | | 17,510,038 | | | | 341,095,541 | | | | 12,563,420 | | | | 36,055,660 | a | | | 8.16% | |
Templeton Growth VIP Fund, Class 1 | | | 28,094,843 | | | | 873,588 | | | | (3,850,347 | ) | | | 25,118,084 | | | | 340,098,855 | | | | 10,936,699 | | | | 2,094,185 | | | | 23.40% | |
| | | | | | | | | | | | | | | | | | | | | | | | |
Total | | | | | | | | | | | | | | | | | | $ | 1,022,936,354 | | | $ | 42,133,323 | | | $ | 35,400,605 | | | | | |
| | | | | | | | | | | | | | | | | | | | | | | | |
aIncludes realized gain distributions received.
e. Waiver and Expense Reimbursements
FT Services contractually agreed in advance to waive or limit its fees and to assume as its own expense certain expenses otherwise payable by the Fund so that the expenses (excluding distribution fees, and acquired fund fees and expenses) for each class of the Fund do not exceed 0.10% based on the average net assets of each class (other than certain non-routine expenses or costs, including those relating to litigation, indemnification, reorganizations, and liquidations) until April 30, 2016.
FRANKLIN TEMPLETON VARIABLE INSURANCE PRODUCTS TRUST
NOTES TO FINANCIAL STATEMENTS
Franklin Founding Funds Allocation VIP Fund (continued)
4. Expense Offset Arrangement
The Fund has entered into an arrangement with its custodian whereby credits realized as a result of uninvested cash balances are used to reduce a portion of the Fund’s custodian expenses. During the year ended December 31, 2015, there were no credits earned.
5. Income Taxes
The tax character of distributions paid during the years ended December 31, 2015 and 2014, was as follows:
| | | | | | | | |
| | | 2015 | | | 2014 | |
Distributions paid from: | | | | | | | | |
Ordinary income | | $ | 33,207,641 | | | $ | 36,432,932 | |
Long term capital gain | | | 1,863,996 | | | | 168,350 | |
| | | | |
| | $ | 35,071,637 | | | $ | 36,601,282 | |
| | | | |
At December 31, 2015, the cost of investments, net unrealized appreciation (depreciation), undistributed ordinary income and undistributed long term capital gains for income tax purposes were as follows:
| | | | |
Cost of investments | | $ | 868,808,259 | |
| | | | |
Unrealized appreciation | | $ | 206,426,375 | |
Unrealized depreciation | | | (52,298,280 | ) |
| | | | |
Net unrealized appreciation (depreciation) | | $ | 154,128,095 | |
| | | | |
Undistributed ordinary income | | $ | 35,824,134 | |
Undistributed long term capital gains | | | 32,469,704 | |
| | | | |
Distributable earnings | | $ | 68,293,838 | |
| | | | |
Differences between income and/or capital gains as determined on a book basis and a tax basis are primarily due to differing treatment of wash sales.
6. Investment Transactions
Purchases and sales of Underlying Funds (excluding short term securities) for the year ended December 31, 2015, aggregated $3,040,000 and $168,100,000, respectively.
7. Credit Facility
The Fund, together with other U.S. registered and foreign investment funds (collectively, Borrowers), managed by Franklin Templeton Investments, are borrowers in a joint syndicated senior unsecured credit facility totaling $2 billion (Global Credit Facility) which matured on February 12, 2016. This Global Credit Facility provides a source of funds to the Borrowers for temporary and emergency purposes, including the ability to meet future unanticipated or unusually large redemption requests. Effective February 12, 2016, the Borrowers renewed the Global Credit Facility for a one year term, maturing February 10, 2017, for a total of $2 billion.
Under the terms of the Global Credit Facility, the Fund shall, in addition to interest charged on any borrowings made by the Fund and other costs incurred by the Fund, pay its share of fees and expenses incurred in connection with the implementation and maintenance of the Global Credit Facility, based upon its relative share of the aggregate net assets of all of the Borrowers, including an annual commitment fee of 0.07% based upon the unused portion of the Global Credit Facility. Effective February 12, 2016, the annual commitment fee is 0.15%. These fees are reflected in other expenses in the Statement of Operations. During the year ended December 31, 2015, the Fund did not use the Global Credit Facility.
FRANKLIN TEMPLETON VARIABLE INSURANCE PRODUCTS TRUST
NOTES TO FINANCIAL STATEMENTS
Franklin Founding Funds Allocation VIP Fund (continued)
8. Fair Value Measurements
The Fund follows a fair value hierarchy that distinguishes between market data obtained from independent sources (observable inputs) and the Fund’s own market assumptions (unobservable inputs). These inputs are used in determining the value of the Fund’s financial instruments and are summarized in the following fair value hierarchy:
| | • | | Level 1 – quoted prices in active markets for identical financial instruments |
| | • | | Level 2 – other significant observable inputs (including quoted prices for similar financial instruments, interest rates, prepayment speed, credit risk, etc.) |
| | • | | Level 3 – significant unobservable inputs (including the Fund’s own assumptions in determining the fair value of financial instruments) |
The input levels are not necessarily an indication of the risk or liquidity associated with financial instruments at that level.
For movements between the levels within the fair value hierarchy, the Fund has adopted a policy of recognizing the transfers as of the date of the underlying event which caused the movement.
At December 31, 2015, all of the Fund’s investments in financial instruments carried at fair value were valued using Level 1 inputs. For detailed categories, see the accompanying Statement of Investments.
9. Subsequent Events
The Fund has evaluated subsequent events through the issuance of the financial statements and determined that no events have occurred that require disclosure other than those already disclosed in the financial statements.
FRANKLIN TEMPLETON VARIABLE INSURANCE PRODUCTS TRUST
Report of Independent Registered Public Accounting Firm
Franklin Founding Funds Allocation VIP Fund
To the Board of Trustees and Shareholders of Franklin Templeton Variable Insurance Products Trust
In our opinion, the accompanying statement of assets and liabilities, including the statement of investments, and the related statements of operations and of changes in net assets and the financial highlights present fairly, in all material respects, the financial position of Franklin Founding Funds Allocation VIP Fund (the “Fund”) at December 31, 2015, the results of its operations for the year then ended, the changes in its net assets for each of the two years in the period then ended and the financial highlights for each of the periods presented, in conformity with accounting principles generally accepted in the United States of America. These financial statements and financial highlights (hereafter referred to as “financial statements”) are the responsibility of the Fund’s management. Our responsibility is to express an opinion on these financial statements based on our audit. We conducted our audit of these financial statements in accordance with the standards of the Public Company Accounting Oversight Board (United States). Those standards require that we plan and perform the audit to obtain reasonable assurance about whether the financial statements are free of material misstatement. An audit includes examining, on a test basis, evidence supporting the amounts and disclosures in the financial statements, assessing the accounting principles used and significant estimates made by management, and evaluating the overall financial statement presentation. We believe that our audit, which included confirmation of securities at December 31, 2015 by correspondence with the transfer agent and brokers, provides a reasonable basis for our opinion.
PricewaterhouseCoopers LLP
San Francisco, California
February 16, 2016
FRANKLIN TEMPLETON VARIABLE INSURANCE PRODUCTS TRUST
Tax Information (unaudited)
Franklin Founding Funds Allocation VIP Fund
Under Section 852(b)(3)(C) of the Internal Revenue Code (Code), the Fund hereby reports the maximum amount allowable but no less than $1,863,996 as a long term capital gain dividend for the fiscal year ended December 31, 2015.
Under Section 854(b)(1)(A) of the Code, the Fund hereby reports 40.20% of the ordinary income dividends as income qualifying for the dividends received deduction for the fiscal year ended December 31, 2015.
At December 31, 2015, the Fund, a qualified fund of funds under Section 852(g)(2) of the Code, received an allocation of foreign taxes paid from one or more of its underlying funds. The Fund elects to treat foreign taxes paid as allowed under Section 853 of the Code. This election will allow shareholders of record as of the 2016 distribution date, to treat their proportionate share of foreign taxes paid by the underlying funds as having been paid directly by them. The shareholder shall consider these amounts as foreign taxes paid in the tax year in which they receive the Fund distribution.
Franklin High Income VIP Fund
This annual report for Franklin High Income VIP Fund covers the fiscal year ended December 31, 2015.
Class 4 Performance Summary as of December 31, 2015
Average annual total return of Class 4 shares* represents the average annual change in value, assuming reinvestment of dividends and capital gains. Average returns smooth out variations in returns, which can be significant; they are not the same as year-by-year results.
| | | | | | | | | | | | |
| Periods ended 12/31/15 | | 1-Year | | | 5-Year | | | 10-Year | |
Average Annual Total Return | | | -9.20% | | | | +3.32% | | | | +5.09% | |
*For the period beginning 2/29/08, Class 4 performance reflects a 12b-1 fee expense of 0.35% per year, which affects future performance. Class 4 performance prior to 2/29/08 reflects historical Class 1 performance, which does not have a 12b-1 fee expense. Since 2/29/08 (effective date), the average annual total return of Class 4 shares was +5.26%.
Performance reflects the Fund’s Class 4 operating expenses, but does not include any contract fees, expenses or sales charges. If they had been included, performance would be lower. These charges and deductions, particularly for variable life policies, can have a significant effect on contract values and insurance benefits. See the contract prospectus for a complete description of these expenses, including sales charges.
Performance data represent past performance, which does not guarantee future results. Investment return and principal value will fluctuate, and you may have a gain or loss when you sell your shares. Current performance may differ from figures shown.
Total Return Index Comparison for a Hypothetical $10,000 Investment (1/1/06–12/31/15)
The graph below shows the change in value of a hypothetical $10,000 investment in the Fund over the indicated period and includes reinvestment of any income or distributions. The Fund’s performance* is compared to the performance of the Credit Suisse (CS) High Yield Index and the Lipper VIP High Yield Funds Classification Average. One cannot invest directly in an index, and an index is not representative of the Fund’s portfolio. Please see Important Notes to Performance Information preceding the Fund Summaries.
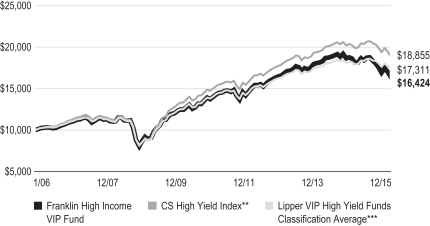
**Source: Credit Suisse Group. Please see Index Descriptions following the Fund Summaries.
***Source: Lipper, a Thomson Reuters Company. Please see Index Descriptions following the Fund Summaries.
FRANKLIN HIGH INCOME VIP FUND
Fund Goals and Main Investments
The Fund seeks a high level of current income with capital appreciation as a secondary goal. Under normal market conditions, the Fund invests predominantly in high yield, lower rated debt securities and preferred stocks.
Fund Risks
All investments involve risks, including possible loss of principal. The risks associated with higher yielding, lower rated securities include higher risk of default and loss of principal. Changes in the financial strength of a bond issuer or in a bond’s credit rating may affect its value. In addition, interest rate movements will affect the Fund’s share price and yield. Bond prices generally move in the opposite direction of interest rates. Thus, as prices of bonds in the Fund adjust to a rise in interest rates, the Fund’s share price may decline. Investment in foreign securities also involves special risks, including currency fluctuations, and political and economic uncertainty. The Fund is actively managed but there is no guarantee that the manager’s investment decisions will produce the desired results. The Fund’s prospectus also includes a description of the main investment risks.
Performance Overview
You can find the Fund’s one-year total return in the Performance Summary. In comparison, the Fund’s benchmark, the CS High Yield Index, had a -4.93% total return for the period under review.1 The Fund’s peers, as measured by the Lipper VIP High Yield Funds Classification Average, had a -3.29% total return.2
Economic and Market Overview
The U.S. economy grew moderately during the 12 months under review amid healthy consumer spending. After starting 2015 with modest growth, the economy strengthened in the second quarter but moderated in the third and fourth quarters as exports slowed and state and local governments reduced their spending. Manufacturing activities expanded for most of the period but contracted toward period-end. Non-manufacturing activities, however, expanded throughout the 12-month period, contributing to new jobs and helping drive down the unemployment rate to 5.0% from October through period-end, the lowest level in more than seven years.3 The housing market improved at period-end as new and existing home sales
increased and home prices rose despite slightly higher mortgage rates. Retail sales grew modestly, led by automobile and auto component sales. Annual inflation, as measured by the Consumer Price Index, remained subdued largely due to low energy prices.
After maintaining a near-zero interest rate for seven years to support the U.S. economy’s recovery, the Federal Reserve (Fed) raised its target range for the federal funds rate to 0.25%–0.50% at its December meeting. Policymakers cited the labor market’s considerable improvement and were reasonably confident that inflation would move back to the Fed’s 2% medium-term objective. The Fed indicated that its process of normalizing interest rates would be data dependent and would likely be gradual. Furthermore, the Fed raised its 2016 U.S. economic growth forecast and lowered its unemployment rate projection.
The 10-year Treasury yield, which moves inversely to price, fluctuated throughout the period. It began the period at 2.17%, declined to a period low of 1.68% in late January 2015 and ended the period at 2.27%. For much of the year, the yield movements appeared to reflect investor uncertainty given concerns about domestic data, geopolitical tensions, the Fed’s timing for raising interest rates and events in China. However, near period-end, decreasing concerns over China’s economy and the Fed’s decision to increase interest rates supported Treasury yields.
Investment Strategy
We are research-driven, fundamental investors who rely on a team of analysts to provide in-depth industry expertise and use
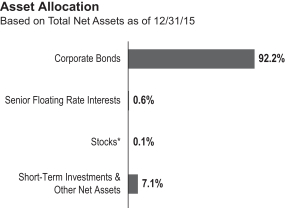
*Includes common and convertible preferred shares.
1. Source: Credit Suisse Group.
2. Source: Lipper, a Thomson Reuters Company.
One cannot invest directly in an index, and an index is not representative of the Fund’s portfolio. Please see Index Descriptions following the Fund Summaries.
3. Source: Bureau of Labor Statistics.
FRANKLIN HIGH INCOME VIP FUND
qualitative and quantitative analyses to evaluate companies. As bottom-up investors, we focus primarily on individual securities. We also consider sectors when choosing investments. In selecting securities for the Fund’s investment portfolio, we do not rely principally on ratings assigned by rating agencies but perform our own independent analysis to evaluate an issuer’s creditworthiness. We consider a variety of factors, including an issuer’s experience and managerial strength, its sensitivity to economic conditions and its current financial condition.
Manager’s Discussion
After a mixed first half of 2015, the high yield corporate bond market experienced mostly negative trends and sentiment during the second half of the year. Although oil prices recovered somewhat early in the year, spurring optimism for that large sector of the high yield market, by mid-summer the trend reversed and oil prices continued to slide through year-end, reaching more than six-year lows. An economic slowdown in China negatively impacted other commodities, driving the prices of certain metals and coal notably lower. Correspondingly, operating results for companies in the metals and mining industry suffered, and we expect continued weak results going into 2016. Because these commodity sectors are large constituents in the high yield corporate market, broader risk aversion among investors in the asset class rose, spilling over into other industries and issuers. Weakness in global equity markets also pressured high yield corporate bond pricing. In addition, certain large issuers in non-commodity-related industries faced company-specific negative events, which caused notable price declines for their outstanding debt issues. Finally, investor outflows from dedicated high yield mutual funds further pressured secondary trading levels, even with a new-issue calendar that was less active than in 2014. The combination of these factors led to the first negative return for the high yield market in six years. In terms of relative Fund performance, the Fund’s overweighted position in certain commodity-related sectors as well as a higher risk positioning within the energy sector caused the Fund to underperform its high yield benchmark.
Consistent with our investment approach, we drew on our fundamental research process to make individual investments and to overweight and underweight certain industries relative to our benchmark in an effort to potentially outperform. Although certain of the Fund’s positionings enhanced relative performance versus its benchmark, overall our industry exposures had a negative impact on relative returns for the year. As stated
| | | | |
| Top 10 Sectors/Industries | | | |
| 12/31/15 | | | |
| | | % of Total
Net Assets | |
| Materials | | | 13.2% | |
| Energy | | | 12.2% | |
| Media | | | 10.1% | |
| Telecommunication Services | | | 9.5% | |
| Health Care Equipment & Services | | | 6.6% | |
| Banks | | | 5.4% | |
| Consumer Services | | | 4.1% | |
| Pharmaceuticals, Biotechnology & Life Sciences | | | 3.3% | |
| Utilities | | | 3.0% | |
| Consumer Durables & Apparel | | | 3.0% | |
The dollar value, number of shares or principal amount, and names of all portfolio holdings are listed in the Fund’s Statement of Investments (SOI).
earlier, the Fund’s exposure to the energy sector was one such detractor. Although our overweighting only detracted slightly from performance, our holdings in select higher risk, longer dated energy companies negatively impacted relative results. We believe certain energy issues provided attractive investment opportunities. The Fund also had a slightly overweighted metals and mining exposure based on our bottom-up analysis of opportunities within the industry.4 However, weakening demand from China for commodities and tepid global growth in the face of ongoing oversupply negatively affected pricing across the sector and resulted in declining operating results. Correspondingly, investors avoided the industry, and bond values declined notably. In contrast, we maintained an underweighting in the retailing sector given historically high instances of financial distress with little asset protection for investors. Although some retailers’ security prices declined due to weak results, the sector is rather diversified and a few companies drove it to outperform. Thus, our positioning dragged on relative returns. Similarly, we continued to underweight the consumer sector for much of the period, and this also hurt performance.5 Given the defensive nature of many of this sector’s constituents, it outperformed an otherwise weak high yield market.
Although some of the Fund’s positioning detracted from relative performance versus the benchmark, certain weightings contributed to results. For instance, our overweighting in the health care sector benefited the Fund.6 While health care reform caused some volatility in the sector and a high-profile
4. Metals and mining is part of materials in the SOI.
5. The consumer sector comprises consumer durables and apparel; consumer services and food, beverage and tobacco in the SOI.
6. The health care sector comprises health care equipment and services and pharmaceuticals, biotechnology and life sciences in the SOI.
FRANKLIN HIGH INCOME VIP FUND
pharmaceutical company came under severe pressure over drug pricing practices, the sector provided some defensive characteristics against a backdrop of a weaker high yield market. Similarly, we were overweighted in the wireless industry, which experienced improved operating results for certain industry participants and where consolidation further supported bond prices.7 For instance, the bonds of large-capitalization issuer Wind Acquisition gained due to acquisition news. Finally, we were also overweighted in the packaging industry.8 Continuing the prior year’s trend, industry consolidation led to secure, long-term customer contracts with what we considered attractive margins and solid financial results. Additionally, it is a typically defensive industry relative to other more cyclical, higher risk sectors.
Thank you for your participation in Franklin High Income VIP Fund. We look forward to serving your future investment needs.
The foregoing information reflects our analysis, opinions and portfolio holdings as of December 31, 2015, the end of the reporting period. The way we implement our main investment strategies and the resulting portfolio holdings may change depending on factors such as market and economic conditions. These opinions may not be relied upon as investment advice or an offer for a particular security. The information is not a complete analysis of every aspect of any market, country, industry, security or the Fund. Statements of fact are from sources considered reliable, but the investment manager makes no representation or warranty as to their completeness or accuracy. Although historical performance is no guarantee of future results, these insights may help you understand our investment management philosophy.
7. Wireless is part of telecommunication services in the SOI.
8. Packaging is part of materials in the SOI.
FRANKLIN HIGH INCOME VIP FUND
Class 4 Fund Expenses
As an investor in a variable insurance contract (Contract) that indirectly provides for investment in an underlying mutual fund, you can incur transaction and/or ongoing expenses at both the Fund level and the Contract level.
| • | | Transaction expenses can include sales charges (loads) on purchases, redemption fees, surrender fees, transfer fees and premium taxes. |
| • | | Ongoing expenses can include management fees, distribution and service (12b-1) fees, contract fees, annual maintenance fees, mortality and expense risk fees and other fees and expenses. All mutual funds and Contracts have some types of ongoing expenses. |
The expenses shown in the table are meant to highlight ongoing expenses at the Fund level only and do not include ongoing expenses at the Contract level, or transaction expenses at either the Fund or Contract level. While the Fund does not have transaction expenses, if the transaction and ongoing expenses at the Contract level were included, the expenses shown would be higher. You should consult your Contract prospectus or disclosure document for more information.
The table shows Fund-level ongoing expenses and can help you understand these expenses and compare them with those of other mutual funds offered through the Contract. The table assumes a $1,000 investment held for the six months indicated. Please refer to the Fund prospectus for additional information on operating expenses.
Actual Fund Expenses
The first line (Actual) of the table provides actual account values and expenses. The “Ending Account Value” is derived from the Fund’s actual return, which includes the effect of ongoing Fund expenses, but does not include the effect of ongoing Contract expenses.
You can estimate the Fund-level expenses you incurred during the period by following these steps. Of course, your account value and expenses will differ from those in this illustration:
| 1. | Divide your account value by $1,000. |
If an account had an $8,600 value, then $8,600 ÷ $1,000 = 8.6.
| 2. | Multiply the result by the number under the heading “Fund-Level Expenses Incurred During Period.” |
If Fund-Level Expenses Incurred During Period were $7.50, then 8.6 x $7.50 = $64.50.
In this illustration, the estimated expenses incurred this period at the Fund level are $64.50.
Hypothetical Example for Comparison with Other Mutual Funds
Information in the second line (Hypothetical) of the table can help you compare ongoing expenses of the Fund with those of other mutual funds offered through the Contract. This information may not be used to estimate the actual ending account balance or expenses you incurred during the period. The hypothetical “Ending Account Value” is based on the Fund’s actual expense ratio and an assumed 5% annual rate of return before expenses, which does not represent the Fund’s actual return. The figure under the heading “Fund-Level Expenses Incurred During Period” shows the hypothetical expenses your account would have incurred under this scenario. You can compare this figure with the 5% hypothetical examples that appear in shareholder reports of other funds offered through a Contract.
| | | | | | | | | | | | |
| Class 4 | | Beginning Account Value 7/1/15 | | | Ending Account
Value 12/31/15 | | | Fund-Level Expenses
Incurred During Period* 7/1/15–12/31/15 | |
Actual | | | $1,000 | | | | $ 896.80 | | | | $4.54 | |
Hypothetical (5% return before expenses) | | | $1,000 | | | | $1,020.42 | | | | $4.84 | |
*Expenses are calculated using the most recent six-month annualized expense ratio for the Fund’s Class 4 shares (0.95%), which does not include any ongoing expenses of the Contract for which the Fund is an investment option, multiplied by the average account value over the period, multiplied by 184/365 to reflect the one-half year period.
SUPPLEMENT DATED JANUARY 20, 2016
TOTHE PROSPECTUSES DATED MAY 1, 2015
OF
FRANKLIN HIGH INCOME VIP FUND
(A series of Franklin Templeton Variable Insurance Products Trust)
Effective February 1, 2016, the Prospectus is amended as follows:
I. The section in the Fund Summary under the heading “Portfolio Managers” on page FH-S4 is replaced with the following:
Portfolio Managers
Patricia O’Connor, CFA Vice President of Advisers and portfolio manager of the Fund since 2002.
Glenn Voyles, CFA Vice President of Advisers and portfolio manager of the Fund since 2015.
II. In the Fund Details, under the heading “Management,” the portfolio manager information beginning on page FH-D9 is replaced with the following:
The Fund is managed by a team of dedicated professionals focused on high yield debt investments. The portfolio managers of the team are as follows:
| | |
Patricia O’Connor, CFA Vice President of Advisers | | Ms. O’Connor has been the lead portfolio manager of the Fund since 2002. She has primary responsibility for the investments of the Fund. She has final authority over all aspects of the Fund’s investment portfolio, including but not limited to, purchases and sales of individual securities, portfolio risk assessment, and the management of daily cash balances in accordance with anticipated investment management requirements. The degree to which she may perform these functions, and the nature of these functions, may change from time to time. She joined Franklin Templeton Investments in 1997. |
| |
Glenn Voyles, CFA Vice President of Advisers | | Mr. Voyles has been a portfolio manager of the Fund since 2015, providing research and advice on the purchase and sales of individual securities and portfolio risk assessment. He joined Franklin Templeton Investments in 1993. |
CFA® and Chartered Financial Analyst® are trademarks owned by CFA Institute.
Please keep this supplement with your prospectus for future reference.
FRANKLIN TEMPLETON VARIABLE INSURANCE PRODUCTS TRUST
Financial Highlights
Franklin High Income VIP Fund
| | | | | | | | | | | | | | | | | | | | |
| | | Year Ended December 31, | |
| | | 2015 | | | 2014 | | | 2013 | | | 2012 | | | 2011 | |
| Class 1 | | | | | | | | | | | | | | | | | | | | |
Per share operating performance
(for a share outstanding throughout the year) | | | | | | | | | | | | | | | | | | | | |
| | | | | |
Net asset value, beginning of year | | | $6.62 | | | | $7.02 | | | | $7.01 | | | | $6.52 | | | | $6.63 | |
| | | | |
| | | | | |
| Income from investment operationsa: | | | | | | | | | | | | | | | | | | | | |
| | | | | |
Net investment incomeb | | | 0.39 | | | | 0.42 | | | | 0.46 | | | | 0.48 | | | | 0.50 | |
| | | | | |
Net realized and unrealized gains (losses) | | | (0.93 | ) | | | (0.38 | ) | | | 0.09 | | | | 0.51 | | | | (0.19 | ) |
| | | | |
Total from investment operations | | | (0.54 | ) | | | 0.04 | | | | 0.55 | | | | 0.99 | | | | 0.31 | |
| | | | |
Less distributions from net investment income | | | (0.45 | ) | | | (0.44 | ) | | | (0.54 | ) | | | (0.50 | ) | | | (0.42 | ) |
| | | | |
Net asset value, end of year | | | $5.63 | | | | $6.62 | | | | $7.02 | | | | $7.01 | | | | $6.52 | |
| | | | |
| | | | | |
Total returnc | | | (8.88)% | | | | 0.21% | | | | 8.17% | | | | 15.94% | | | | 4.63% | |
| | | | | |
| Ratios to average net assets | | | | | | | | | | | | | | | | | | | | |
| | | | | |
Expenses | | | 0.59% | d | | | 0.57% | d | | | 0.58% | d | | | 0.58% | | | | 0.58% | |
| | | | | |
Net investment income | | | 6.20% | | | | 6.00% | | | | 6.63% | | | | 7.15% | | | | 7.52% | |
| | | | | |
| Supplemental data | | | | | | | | | | | | | | | | | | | | |
| | | | | |
Net assets, end of year (000’s) | | | $26,835 | | | | $34,552 | | | | $39,300 | | | | $42,166 | | | | $41,971 | |
| | | | | |
Portfolio turnover rate | | | 28.56% | | | | 39.46% | | | | 30.78% | | | | 37.03% | | | | 45.11% | |
aThe amount shown for a share outstanding throughout the period may not correlate with the Statement of Operations for the period due to the timing of sales and repurchases of the Fund’s shares in relation to income earned and/or fluctuating fair value of the investments of the Fund.
bBased on average daily shares outstanding.
cTotal return does not include fees, charges or expenses imposed by the variable annuity and life insurance contracts for which Franklin Templeton Variable Insurance Products Trust serves as an underlying investment vehicle.
dBenefit of expense reduction rounds to less than 0.01%.
| | | | | | |
| | | The accompanying notes are an integral part of these financial statements. | Annual Report | | | FH-7 | |
FRANKLIN TEMPLETON VARIABLE INSURANCE PRODUCTS TRUST
FINANCIAL HIGHLIGHTS
Franklin High Income VIP Fund (continued)
| | | | | | | | | | | | | | | | | | | | |
| | | Year Ended December 31, | |
| | | 2015 | | | 2014 | | | 2013 | | | 2012 | | | 2011 | |
| Class 2 | | | | | | | | | | | | | | | | | | | | |
Per share operating performance
(for a share outstanding throughout the year) | | | | | | | | | | | | | | | | | | | | |
| | | | | |
Net asset value, beginning of year | | | $6.41 | | | | $6.81 | | | | $6.82 | | | | $6.36 | | | | $6.47 | |
| | | | |
| | | | | |
| Income from investment operationsa: | | | | | | | | | | | | | | | | | | | | |
| | | | | |
Net investment incomeb | | | 0.36 | | | | 0.39 | | | | 0.43 | | | | 0.46 | | | | 0.47 | |
| | | | | |
Net realized and unrealized gains (losses) | | | (0.90 | ) | | | (0.37 | ) | | | 0.08 | | | | 0.48 | | | | (0.18 | ) |
| | | | |
Total from investment operations | | | (0.54 | ) | | | 0.02 | | | | 0.51 | | | | 0.94 | | | | 0.29 | |
| | | | |
Less distributions from net investment income | | | (0.43 | ) | | | (0.42 | ) | | | (0.52 | ) | | | (0.48 | ) | | | (0.40 | ) |
| | | | |
Net asset value, end of year | | | $5.44 | | | | $6.41 | | | | $6.81 | | | | $6.82 | | | | $6.36 | |
| | | | |
| | | | | |
Total returnc | | | (9.12)% | | | | (0.02)% | | | | 7.83% | | | | 15.56% | | | | 4.56% | |
| | | | | |
| Ratios to average net assets | | | | | | | | | | | | | | | | | | | | |
| | | | | |
Expenses | | | 0.84% | d | | | 0.82% | d | | | 0.83% | d | | | 0.83% | | | | 0.83% | |
| | | | | |
Net investment income | | | 5.95% | | | | 5.75% | | | | 6.38% | | | | 6.90% | | | | 7.27% | |
| | | | | |
| Supplemental data | | | | | | | | | | | | | | | | | | | | |
| | | | | |
Net assets, end of year (000’s) | | | $205,339 | | | | $261,944 | | | | $291,826 | | | | $281,851 | | | | $249,452 | |
| | | | | |
Portfolio turnover rate | | | 28.56% | | | | 39.46% | | | | 30.78% | | | | 37.03% | | | | 45.11% | |
aThe amount shown for a share outstanding throughout the period may not correlate with the Statement of Operations for the period due to the timing of sales and repurchases of the Fund’s shares in relation to income earned and/or fluctuating fair value of the investments of the Fund.
bBased on average daily shares outstanding.
cTotal return does not include fees, charges or expenses imposed by the variable annuity and life insurance contracts for which Franklin Templeton Variable Insurance Products Trust serves as an underlying investment vehicle.
dBenefit of expense reduction rounds to less than 0.01%.
| | | | | | |
| | FH-8 | | | Annual Report | The accompanying notes are an integral part of these financial statements. | | |
FRANKLIN TEMPLETON VARIABLE INSURANCE PRODUCTS TRUST
FINANCIAL HIGHLIGHTS
Franklin High Income VIP Fund (continued)
| | | | | | | | | | | | | | | | | | | | |
| | | Year Ended December 31, | |
| | | 2015 | | | 2014 | | | 2013 | | | 2012 | | | 2011 | |
| Class 4 | | | | | | | | | | | | | | | | | | | | |
Per share operating performance
(for a share outstanding throughout the year) | | | | | | | | | | | | | | | | | | | | |
| | | | | |
Net asset value, beginning of year | | | $6.54 | | | | $6.94 | | | | $6.94 | | | | $6.46 | | | | $6.57 | |
| | | | |
| | | | | |
| Income from investment operationsa: | | | | | | | | | | | | | | | | | | | | |
| | | | | |
Net investment incomeb | | | 0.37 | | | | 0.39 | | | | 0.43 | | | | 0.46 | | | | 0.47 | |
| | | | | |
Net realized and unrealized gains (losses) | | | (0.92 | ) | | | (0.38 | ) | | | 0.08 | | | | 0.49 | | | | (0.18 | ) |
| | | | |
Total from investment operations | | | (0.55 | ) | | | 0.01 | | | | 0.51 | | | | 0.95 | | | | 0.29 | |
| | | | |
Less distributions from net investment income | | | (0.43 | ) | | | (0.41 | ) | | | (0.51 | ) | | | (0.47 | ) | | | (0.40 | ) |
| | | | |
Net asset value, end of year | | | $5.56 | | | | $6.54 | | | | $6.94 | | | | $6.94 | | | | $6.46 | |
| | | | |
| | | | | |
Total returnc | | | (9.20)% | | | | (0.15)% | | | | 7.72% | | | | 15.50% | | | | 4.39% | |
| | | | | |
| Ratios to average net assets | | | | | | | | | | | | | | | | | | | | |
| | | | | |
Expenses | | | 0.94% | d | | | 0.92% | d | | | 0.93% | d | | | 0.93% | | | | 0.93% | |
| | | | | |
Net investment income | | | 5.85% | | | | 5.65% | | | | 6.28% | | | | 6.80% | | | | 7.17% | |
| | | | | |
| Supplemental data | | | | | | | | | | | | | | | | | | | | |
| | | | | |
Net assets, end of year (000’s) | | | $21,708 | | | | $25,740 | | | | $27,789 | | | | $27,664 | | | | $27,055 | |
| | | | | |
Portfolio turnover rate | | | 28.56% | | | | 39.46% | | | | 30.78% | | | | 37.03% | | | | 45.11% | |
aThe amount shown for a share outstanding throughout the period may not correlate with the Statement of Operations for the period due to the timing of sales and repurchases of the Fund’s shares in relation to income earned and/or fluctuating fair value of the investments of the Fund.
bBased on average daily shares outstanding.
cTotal return does not include fees, charges or expenses imposed by the variable annuity and life insurance contracts for which Franklin Templeton Variable Insurance Products Trust serves as an underlying investment vehicle.
dBenefit of expense reduction rounds to less than 0.01%.
| | | | | | |
| | | The accompanying notes are an integral part of these financial statements. | Annual Report | | | FH-9 | |
FRANKLIN TEMPLETON VARIABLE INSURANCE PRODUCTS TRUST
Statement of Investments, December 31, 2015
| | | | | | | | | | | | | | |
Franklin High Income VIP Fund | |
| | | | | Country | | | Shares | | | Value | |
| | Common Stocks (Cost $334,368) 0.0%† | | | | | | | | | | | | |
| | Transportation 0.0%† | | | | | | | | | | | | |
| a | | CEVA Holdings LLC | | | United Kingdom | | | | 224 | | | $ | 100,926 | |
| | | | | | | | | | | | | | |
| | Convertible Preferred Stocks 0.1% | | | | | | | | | | | | |
| | Transportation 0.1% | | | | | | | | | | | | |
| a | | CEVA Holdings LLC, cvt. pfd., A-1 | | | United Kingdom | | | | 6 | | | | 3,750 | |
| a | | CEVA Holdings LLC, cvt. pfd., A-2 | | | United Kingdom | | | | 486 | | | | 218,479 | |
| | | | | | | | | | | | | | |
| | | | |
| | Total Convertible Preferred Stocks
(Cost $731,855) | | | | | | | | | | | 222,229 | |
| | | | | | | | | | | | | | |
| | | | |
| | | | | | | | Principal Amount* | | | | |
| | Corporate Bonds 92.2% | | | | | | | | | | | | |
| | Automobiles & Components 2.2% | | | | | | | | | | | | |
| | Fiat Chrysler Automobiles NV, senior note, 5.25%, 4/15/23 | | | United Kingdom | | | | 3,000,000 | | | | 2,973,750 | |
| | The Goodyear Tire & Rubber Co., senior note, | | | | | | | | | | | | |
| | 6.50%, 3/01/21 | | | United States | | | | 2,200,000 | | | | 2,321,000 | |
| | 5.125%, 11/15/23 | | | United States | | | | 300,000 | | | | 309,000 | |
| | | | | | | | | | | | | | |
| | | | | | | | | | | | | 5,603,750 | |
| | | | | | | | | | | | | | |
| | Banks 5.4% | | | | | | | | | | | | |
| b | | Bank of America Corp., junior sub. bond, M, 8.125% to 5/15/18, FRN thereafter, Perpetual | | | United States | | | | 2,500,000 | | | | 2,546,874 | |
| | CIT Group Inc., senior note, | | | | | | | | | | | | |
| | 5.375%, 5/15/20 | | | United States | | | | 1,000,000 | | | | 1,050,000 | |
| | 5.00%, 8/15/22 | | | United States | | | | 2,700,000 | | | | 2,779,326 | |
| b | | Citigroup Inc., junior sub. bond, M, 6.30% to 5/15/24, FRN thereafter, Perpetual | | | United States | | | | 2,800,000 | | | | 2,733,500 | |
| b | | JPMorgan Chase & Co., junior sub. bond, R, 6.00% to 8/01/23, FRN thereafter, Perpetual | | | United States | | | | 2,500,000 | | | | 2,502,760 | |
| | Royal Bank of Scotland Group PLC, sub. note, 6.125%, 12/15/22 | | | United Kingdom | | | | 2,000,000 | | | | 2,178,750 | |
| | | | | | | | | | | | | | |
| | | | | | | | | | | | | 13,791,210 | |
| | | | | | | | | | | | | | |
| | Capital Goods 2.4% | | | | | | | | | | | | |
| c | | Bombardier Inc., senior bond, 144A, 7.50%, 3/15/25 | | | Canada | | | | 3,500,000 | | | | 2,467,500 | |
| | Navistar International Corp., senior bond, 8.25%, 11/01/21 | | | United States | | | | 1,400,000 | | | | 938,000 | |
| | TransDigm Inc., | | | | | | | | | | | | |
| | senior sub. bond, 6.50%, 7/15/24 | | | United States | | | | 1,000,000 | | | | 999,500 | |
| | csenior sub. bond, 144A, 6.50%, 5/15/25 | | | United States | | | | 200,000 | | | | 194,500 | |
| | senior sub. note, 6.00%, 7/15/22 | | | United States | | | | 500,000 | | | | 491,250 | |
| c | | Zachry Holdings Inc., senior note, 144A, 7.50%, 2/01/20 | | | United States | | | | 1,100,000 | | | | 1,083,500 | |
| | | | | | | | | | | | | | |
| | | | | | | | | | | | | 6,174,250 | |
| | | | | | | | | | | | | | |
| | Commercial & Professional Services 1.9% | | | | | | | | | | | | |
| c | | Acosta Inc., senior note, 144A, 7.75%, 10/01/22 | | | United States | | | | 2,000,000 | | | | 1,770,000 | |
| d,e | | Goss Graphic Systems Inc., senior sub. note, 12.25%, 11/19/05 | | | United States | | | | 1,912,374 | | | | 191 | |
| | IHS Inc., senior note, 5.00%, 11/01/22 | | | United States | | | | 600,000 | | | | 609,750 | |
| | United Rentals North America Inc., senior bond, 5.75%, 11/15/24 | | | United States | | | | 2,500,000 | | | | 2,487,500 | |
| | | | | | | | | | | | | | |
| | | | | | | | | | | | | 4,867,441 | |
| | | | | | | | | | | | | | |
| | Consumer Durables & Apparel 3.0% | | | | | | | | | | | | |
| c | | Jarden Corp., senior note, 144A, 5.00%, 11/15/23 | | | United States | | | | 1,200,000 | | | | 1,233,000 | |
FRANKLIN TEMPLETON VARIABLE INSURANCE PRODUCTS TRUST
STATEMENT OF INVESTMENTS
Franklin High Income VIP Fund (continued)
| | | | | | | | | | | | | | |
| | | | | Country | | | Principal Amount* | | | Value | |
| | Corporate Bonds (continued) | | | | | | | | | | | | |
| | Consumer Durables & Apparel (continued) | | | | | | | | | | | | |
| | KB Home, | | | | | | | | | | | | |
| | senior bond, 7.50%, 9/15/22 | | | United States | | | | 2,100,000 | | | $ | 2,100,000 | |
| | senior note, 4.75%, 5/15/19 | | | United States | | | | 600,000 | | | | 585,000 | |
| | senior note, 7.00%, 12/15/21 | | | United States | | | | 700,000 | | | | 693,875 | |
| c | | Taylor Morrison Communities Inc./Monarch Communities Inc., senior note, 144A, | | | | | | | | | | | | |
| | 5.25%, 4/15/21 | | | United States | | | | 900,000 | | | | 904,500 | |
| | 5.875%, 4/15/23 | | | United States | | | | 600,000 | | | | 595,500 | |
| | 5.625%, 3/01/24 | | | United States | | | | 1,500,000 | | | | 1,447,500 | |
| | | | | | | | | | | | | | |
| | | | | | | | | | | | | 7,559,375 | |
| | | | | | | | | | | | | | |
| | Consumer Services 4.1% | | | | | | | | | | | | |
| c | | 1011778 BC ULC/New Red Finance Inc., | | | | | | | | | | | | |
| | secured note, second lien, 144A, 6.00%, 4/01/22 | | | Canada | | | | 2,000,000 | | | | 2,065,000 | |
| | senior secured note, first lien, 144A, 4.625%, 1/15/22 | | | Canada | | | | 900,000 | | | | 904,500 | |
| c | | 24 Hour Holdings III LLC, senior note, 144A, 8.00%, 6/01/22 | | | United States | | | | 2,500,000 | | | | 2,043,750 | |
| d | | Caesars Entertainment Operating Co. Inc., senior secured note, first lien, 11.25%, 6/01/17 | | | United States | | | | 1,000,000 | | | | 755,000 | |
| c,d | | Fontainebleau Las Vegas, senior secured bond, first lien, 144A, 11.00%, 6/15/15 | | | United States | | | | 1,700,000 | | | | 3,358 | |
| c | | International Game Technology PLC, senior secured bond, 144A, 6.50%, 2/15/25 | | | United States | | | | 3,000,000 | | | | 2,655,000 | |
| c | | Wynn Las Vegas LLC/Wynn Las Vegas Capital Corp., senior bond, 144A, 5.50%, 3/01/25 | | | United States | | | | 1,100,000 | | | | 984,500 | |
| c | | Wynn Macau Ltd., senior note, 144A, 5.25%, 10/15/21 | | | Macau | | | | 1,200,000 | | | | 1,059,000 | |
| | | | | | | | | | | | | | |
| | | | | | | | | | | | | 10,470,108 | |
| | | | | | | | | | | | | | |
| | Diversified Financials 2.9% | | | | | | | | | | | | |
| | AerCap Ireland Capital Ltd./AerCap Global Aviation Trust, senior note, 4.625%, 10/30/20 | | | Netherlands | | | | 1,700,000 | | | | 1,741,438 | |
| | Deutsche Bank AG, sub. bond, 4.296% to 5/24/23, FRN thereafter, 5/24/28 | | | Germany | | | | 1,300,000 | | | | 1,193,270 | |
| | Navient Corp., senior note, 5.50%, 1/15/19 | | | United States | | | | 3,500,000 | | | | 3,281,250 | |
| c | | OneMain Financial Holdings Inc., senior note, 144A, 7.25%, 12/15/21 | | | United States | | | | 1,100,000 | | | | 1,105,500 | |
| | | | | | | | | | | | | | |
| | | | | | | | | | | | | 7,321,458 | |
| | | | | | | | | | | | | | |
| | Energy 12.2% | | | | | | | | | | | | |
| | California Resources Corp., | | | | | | | | | | | | |
| | csecond lien, 144A, 8.00%, 12/15/22 | | | United States | | | | 2,155,000 | | | | 1,139,456 | |
| | senior bond, 6.00%, 11/15/24 | | | United States | | | | 621,000 | | | | 190,958 | |
| | senior note, 5.50%, 9/15/21 | | | United States | | | | 184,000 | | | | 58,880 | |
| c | | Calumet Specialty Products Partners LP/Calumet Finance Corp., senior note, 144A, 7.75%, 4/15/23 | | | United States | | | | 1,500,000 | | | | 1,282,500 | |
| | CGG SA, senior note, 6.875%, 1/15/22 | | | France | | | | 2,300,000 | | | | 1,033,562 | |
| | CHC Helicopter SA, | | | | | | | | | | | | |
| | senior note, 9.375%, 6/01/21 | | | Canada | | | | 260,000 | | | | 66,300 | |
| | senior secured note, first lien, 9.25%, 10/15/20 | | | Canada | | | | 2,700,000 | | | | 1,309,500 | |
| c | | Chesapeake Energy Corp., secured note, second lien, 144A, 8.00%, 12/15/22 | | | United States | | | | 1,830,000 | | | | 905,850 | |
| | Compressco Partners LP/Finance Corp., senior note, 7.25%, 8/15/22 | | | United States | | | | 700,000 | | | | 521,500 | |
FRANKLIN TEMPLETON VARIABLE INSURANCE PRODUCTS TRUST
STATEMENT OF INVESTMENTS
Franklin High Income VIP Fund (continued)
| | | | | | | | | | | | | | |
| | | | | Country | | | Principal Amount* | | | Value | |
| | Corporate Bonds (continued) | | | | | | | | | | | | |
| | Energy (continued) | | | | | | | | | | | | |
| | CONSOL Energy Inc., senior note, | | | | | | | | | | | | |
| | 5.875%, 4/15/22 | | | United States | | | | 1,100,000 | | | $ | 687,500 | |
| | c144A, 8.00%, 4/01/23 | | | United States | | | | 1,800,000 | | | | 1,206,000 | |
| c | | Drill Rigs Holdings Inc., secured note, 144A, 6.50%, 10/01/17 | | | United States | | | | 2,000,000 | | | | 1,185,000 | |
| | Energy Transfer Equity LP, | | | | | | | | | | | | |
| | senior note, first lien, 7.50%, 10/15/20 | | | United States | | | | 2,600,000 | | | | 2,418,000 | |
| | senior secured bond, first lien, 5.875%, 1/15/24 | | | United States | | | | 400,000 | | | | 328,000 | |
| | senior secured bond, first lien, 5.50%, 6/01/27 | | | United States | | | | 500,000 | | | | 382,500 | |
| | Energy XXI Gulf Coast Inc., senior note, | | | | | | | | | | | | |
| | 7.50%, 12/15/21 | | | United States | | | | 1,000,000 | | | | 113,750 | |
| | 6.875%, 3/15/24 | | | United States | | | | 500,000 | | | | 57,500 | |
| c | | EnQuest PLC, senior note, 144A, 7.00%, 4/15/22 | | | United Kingdom | | | | 2,500,000 | | | | 884,375 | |
| | EPL Oil & Gas Inc., senior note, 8.25%, 2/15/18 | | | United States | | | | 1,400,000 | | | | 378,000 | |
| c | | Ferrellgas LP/Ferrellgas Finance Corp., senior note, 144A, 6.75%, 6/15/23 | | | United States | | | | 2,400,000 | | | | 1,968,000 | |
| c | | Goodrich Petroleum Corp., secured note, second lien, 144A, 8.875%, 3/15/18 | | | United States | | | | 1,250 | f | | | 387,500 | |
| | Halcon Resources Corp., | | | | | | | | | | | | |
| | senior note, 8.875%, 5/15/21 | | | United States | | | | 1,800,000 | | | | 531,000 | |
| | csenior secured note, third lien, 144A, 13.00%, 2/15/22 | | | United States | | | | 1,170,000 | | | | 403,650 | |
| c | | Linn Energy LLC/Finance Corp., senior secured note, second lien, 144A, 12.00%, 12/15/20 | | | United States | | | | 1,600,000 | | | | 816,000 | |
| | Martin Midstream Partners LP/Martin Midstream Finance Corp., senior note, 7.25%, 2/15/21 | | | United States | | | | 1,100,000 | | | | 973,500 | |
| | Memorial Resource Development Corp., senior note, 5.875%, 7/01/22 | | | United States | | | | 1,100,000 | | | | 968,000 | |
| | Midstates Petroleum Co. Inc./LLC, senior note, 9.25%, 6/01/21 | | | United States | | | | 1,500,000 | | | | 180,000 | |
| c | | Murray Energy Corp., secured note, second lien, 144A, 11.25%, 4/15/21 | | | United States | | | | 1,200,000 | | | | 228,000 | |
| c | | Ocean Rig UDW Inc., senior note, 144A, 7.25%, 4/01/19 | | | United States | | | | 2,700,000 | | | | 1,181,250 | |
| c | | Peabody Energy Corp., second lien, 144A, 10.00%, 3/15/22 | | | United States | | | | 2,700,000 | | | | 526,500 | |
| | Penn Virginia Corp., senior note, 8.50%, 5/01/20 | | | United States | | | | 1,200,000 | | | | 195,000 | |
| | QEP Resources Inc., senior bond, | | | | | | | | | | | | |
| | 5.375%, 10/01/22 | | | United States | | | | 1,500,000 | | | | 1,087,500 | |
| | 5.25%, 5/01/23 | | | United States | | | | 1,500,000 | | | | 1,072,500 | |
| | Sabine Pass Liquefaction LLC, | | | | | | | | | | | | |
| | first lien, 5.625%, 2/01/21 | | | United States | | | | 2,400,000 | | | | 2,220,000 | |
| | first lien, 5.625%, 4/15/23 | | | United States | | | | 900,000 | | | | 794,250 | |
| | senior secured note, first lien, 5.75%, 5/15/24 | | | United States | | | | 200,000 | | | | 175,000 | |
| | Sanchez Energy Corp., senior note, | | | | | | | | | | | | |
| | 7.75%, 6/15/21 | | | United States | | | | 1,800,000 | | | | 1,107,000 | |
| | 6.125%, 1/15/23 | | | United States | | | | 1,000,000 | | | | 545,000 | |
| c | | Ultra Petroleum Corp., senior bond, 144A, 6.125%, 10/01/24 | | | United States | | | | 2,600,000 | | | | 604,500 | |
| | WPX Energy Inc., senior note, 8.25%, 8/01/23 | | | United States | | | | 1,000,000 | | | | 802,500 | |
| | | | | | | | | | | | | | |
| | | | | | | | | | | | | 30,915,781 | |
| | | | | | | | | | | | | | |
| | Food, Beverage & Tobacco 2.6% | | | | | | | | | | | | |
| | Constellation Brands Inc., senior note, 4.75%, 12/01/25 | | | United States | | | | 300,000 | | | | 306,375 | |
| | Cott Beverages Inc., senior note, 6.75%, 1/01/20 | | | United States | | | | 1,100,000 | | | | 1,138,500 | |
| c | | Dole Food Co. Inc., senior secured note, 144A, 7.25%, 5/01/19 | | | United States | | | | 500,000 | | | | 496,250 | |
FRANKLIN TEMPLETON VARIABLE INSURANCE PRODUCTS TRUST
STATEMENT OF INVESTMENTS
Franklin High Income VIP Fund (continued)
| | | | | | | | | | | | | | |
| | | | | Country | | | Principal Amount* | | | Value | |
| | Corporate Bonds (continued) | | | | | | | | | | | | |
| | Food, Beverage & Tobacco (continued) | | | | | | | | | | | | |
| c | | JBS USA LLC/Finance Inc., | | | | | | | | | | | | |
| | senior bond, 144A, 5.875%, 7/15/24 | | | United States | | | | 600,000 | | | $ | 546,000 | |
| | senior note, 144A, 8.25%, 2/01/20 | | | United States | | | | 1,000,000 | | | | 1,005,000 | |
| | Post Holdings Inc., senior note, | | | | | | | | | | | | |
| | 7.375%, 2/15/22 | | | United States | | | | 1,600,000 | | | | 1,674,000 | |
| | c144A, 6.75%, 12/01/21 | | | United States | | | | 1,100,000 | | | | 1,124,750 | |
| | c144A, 6.00%, 12/15/22 | | | United States | | | | 300,000 | | | | 295,125 | |
| | | | | | | | | | | | | | |
| | | | | | | | | | | | | 6,586,000 | |
| | | | | | | | | | | | | | |
| | Health Care Equipment & Services 6.6% | | | | | | | | | | | | |
| | Alere Inc., | | | | | | | | | | | | |
| | senior note, 7.25%, 7/01/18 | | | United States | | | | 2,200,000 | | | | 2,257,750 | |
| | senior sub. note, 6.50%, 6/15/20 | | | United States | | | | 300,000 | | | | 289,500 | |
| | CHS/Community Health Systems Inc., senior note, | | | | | | | | | | | | |
| | 7.125%, 7/15/20 | | | United States | | | | 700,000 | | | | 700,875 | |
| | 6.875%, 2/01/22 | | | United States | | | | 2,300,000 | | | | 2,193,625 | |
| | DaVita HealthCare Partners Inc., senior bond, 5.125%, 7/15/24 | | | United States | | | | 2,000,000 | | | | 2,003,750 | |
| | HCA Inc., | | | | | | | | | | | | |
| | senior bond, 5.875%, 5/01/23 | | | United States | | | | 1,000,000 | | | | 1,030,000 | |
| | senior bond, 5.375%, 2/01/25 | | | United States | | | | 1,500,000 | | | | 1,483,125 | |
| | senior secured note, first lien, 5.00%, 3/15/24 | | | United States | | | | 2,300,000 | | | | 2,300,000 | |
| c | | Hologic Inc., senior note, 144A, 5.25%, 7/15/22 | | | United States | | | | 900,000 | | | | 921,375 | |
| | Tenet Healthcare Corp., senior note, | | | | | | | | | | | | |
| | 5.00%, 3/01/19 | | | United States | | | | 200,000 | | | | 185,500 | |
| | 8.125%, 4/01/22 | | | United States | | | | 3,000,000 | | | | 3,007,500 | |
| | 6.75%, 6/15/23 | | | United States | | | | 300,000 | | | | 278,812 | |
| | | | | | | | | | | | | | |
| | | | | | | | | | | | | 16,651,812 | |
| | | | | | | | | | | | | | |
| | Materials 13.2% | | | | | | | | | | | | |
| | ArcelorMittal, senior note, | | | | | | | | | | | | |
| | 6.50%, 3/01/21 | | | Luxembourg | | | | 1,900,000 | | | | 1,538,791 | |
| | 6.125%, 6/01/25 | | | Luxembourg | | | | 700,000 | | | | 512,750 | |
| c | | Ardagh Packaging Finance PLC/Ardagh MP Holdings USA Inc., senior note, 144A, | | | | | | | | | | | | |
| | 7.00%, 11/15/20 | | | Luxembourg | | | | 176,471 | | | | 174,265 | |
| | 6.75%, 1/31/21 | | | Luxembourg | | | | 300,000 | | | | 291,000 | |
| | 6.00%, 6/30/21 | | | Luxembourg | | | | 1,900,000 | | | | 1,781,250 | |
| c | | Barminco Finance Pty. Ltd., senior note, 144A, 9.00%, 6/01/18 | | | Australia | | | | 1,600,000 | | | | 1,280,800 | |
| c | | Blue Cube Spinco Inc., senior bond, 144A, 10.00%, 10/15/25 | | | United States | | | | 1,200,000 | | | | 1,326,000 | |
| c | | BlueScope Steel Ltd./BlueScope Steel Finance, senior note, 144A, 7.125%, 5/01/18 | | | Australia | | | | 2,000,000 | | | | 1,930,000 | |
| c | | Cemex Finance LLC, senior secured note, first lien, 144A, 6.00%, 4/01/24 | | | Mexico | | | | 1,700,000 | | | | 1,465,188 | |
| c | | Cemex SAB de CV, senior secured bond, first lien, 144A, 6.125%, 5/05/25 | | | Mexico | | | | 1,400,000 | | | | 1,203,125 | |
| c | | The Chemours Co., | | | | | | | | | | | | |
| | senior bond, 144A, 7.00%, 5/15/25 | | | United States | | | | 500,000 | | | | 342,500 | |
| | senior note, 144A, 6.625%, 5/15/23 | | | United States | | | | 1,800,000 | | | | 1,269,000 | |
| c | | Eldorado Gold Corp., senior note, 144A, 6.125%, 12/15/20 | | | Canada | | | | 3,100,000 | | | | 2,728,000 | |
| c | | First Quantum Minerals Ltd., senior note, 144A, | | | | | | | | | | | | |
| | 6.75%, 2/15/20 | | | Canada | | | | 2,000,000 | | | | 1,300,000 | |
| | 7.00%, 2/15/21 | | | Canada | | | | 1,836,000 | | | | 1,161,270 | |
FRANKLIN TEMPLETON VARIABLE INSURANCE PRODUCTS TRUST
STATEMENT OF INVESTMENTS
Franklin High Income VIP Fund (continued)
| | | | | | | | | | | | | | |
| | | | | Country | | | Principal Amount* | | | Value | |
| | Corporate Bonds (continued) | | | | | | | | | | | | |
| | Materials (continued) | | | | | | | | | | | | |
| c | | FMG Resources (August 2006) Pty. Ltd., senior secured note, 144A, 9.75%, 3/01/22 | | | Australia | | | | 3,500,000 | | | $ | 3,156,562 | |
| c | | NOVA Chemicals Corp., senior bond, 144A, 5.00%, 5/01/25 | | | Canada | | | | 2,000,000 | | | | 1,950,000 | |
| c | | Owens-Brockway Glass Container Inc., senior note, 144A, | | | | | | | | | | | | |
| | 5.00%, 1/15/22 | | | United States | | | | 1,400,000 | | | | 1,373,750 | |
| | 5.875%, 8/15/23 | | | United States | | | | 600,000 | | | | 610,125 | |
| c | | Platform Specialty Products Corp., senior note, 144A, | | | | | | | | | | | | |
| | 10.375%, 5/01/21 | | | United States | | | | 300,000 | | | | 300,000 | |
| | 6.50%, 2/01/22 | | | United States | | | | 1,500,000 | | | | 1,305,000 | |
| c | | Rain CII Carbon LLC/CII Carbon Corp., second lien, 144A, 8.25%, 1/15/21 | | | United States | | | | 1,200,000 | | | | 942,000 | |
| | Reynolds Group Issuer Inc./LLC/SA, senior note, | | | | | | | | | | | | |
| | 8.50%, 5/15/18 | | | United States | | | | 2,800,000 | | | | 2,772,000 | |
| | 9.00%, 4/15/19 | | | United States | | | | 1,200,000 | | | | 1,185,000 | |
| | Steel Dynamics Inc., | | | | | | | | | | | | |
| | senior bond, 5.50%, 10/01/24 | | | United States | | | | 800,000 | | | | 732,000 | |
| | senior note, 5.125%, 10/01/21 | | | United States | | | | 800,000 | | | | 744,000 | |
| | Verso Paper Holdings LLC/Inc., senior secured note, first lien, 11.75%, 1/15/19 | | | United States | | | | 451,000 | | | | 67,650 | |
| | | | | | | | | | | | | | |
| | | | | | | | | | | | | 33,442,026 | |
| | | | | | | | | | | | | | |
| | Media 10.1% | | | | | | | | | | | | |
| | CCO Holdings LLC/CCO Holdings Capital Corp., | | | | | | | | | | | | |
| | senior bond, 5.25%, 9/30/22 | | | United States | | | | 1,000,000 | | | | 1,012,500 | |
| | csenior bond, 144A, 5.375%, 5/01/25 | | | United States | | | | 800,000 | | | | 798,000 | |
| | senior note, 6.50%, 4/30/21 | | | United States | | | | 1,500,000 | | | | 1,562,812 | |
| c | | CCOH Safari LLC, senior bond, 144A, 5.75%, 2/15/26 | | | United States | | | | 500,000 | | | | 502,500 | |
| | Clear Channel Worldwide Holdings Inc., | | | | | | | | | | | | |
| | senior note, 6.50%, 11/15/22 | | | United States | | | | 1,000,000 | | | | 978,750 | |
| | senior sub. note, 7.625%, 3/15/20 | | | United States | | | | 1,100,000 | | | | 1,020,250 | |
| | CSC Holdings LLC, senior note, | | | | | | | | | | | | |
| | 6.75%, 11/15/21 | | | United States | | | | 1,500,000 | | | | 1,477,500 | |
| | 5.25%, 6/01/24 | | | United States | | | | 1,000,000 | | | | 880,000 | |
| | DISH DBS Corp., senior note, 5.875%, 11/15/24 | | | United States | | | | 3,500,000 | | | | 3,123,750 | |
| | Gannett Co. Inc., | | | | | | | | | | | | |
| | senior bond, 6.375%, 10/15/23 | | | United States | | | | 2,000,000 | | | | 2,115,000 | |
| | senior note, 5.125%, 7/15/20 | | | United States | | | | 1,400,000 | | | | 1,456,000 | |
| | iHeartCommunications Inc., | | | | | | | | | | | | |
| | senior secured bond, first lien, 9.00%, 3/01/21 | | | United States | | | | 2,500,000 | | | | 1,753,125 | |
| | senior secured note, first lien, 9.00%, 9/15/22 | | | United States | | | | 700,000 | | | | 485,625 | |
| c | | Radio One Inc., senior sub. note, 144A, 9.25%, 2/15/20 | | | United States | | | | 800,000 | | | | 636,000 | |
| c | | Sirius XM Radio Inc., senior bond, 144A, 6.00%, 7/15/24 | | | United States | | | | 2,500,000 | | | | 2,618,750 | |
| c | | Virgin Media Finance PLC, senior bond, 144A, 6.375%, 4/15/23 | | | United Kingdom | | | | 1,700,000 | | | | 1,731,875 | |
| c | | Virgin Media Secured Finance PLC, senior secured bond, first lien, 144A, 5.50%, 1/15/25 | | | United Kingdom | | | | 1,100,000 | | | | 1,101,375 | |
| c | | WMG Acquisition Corp., senior note, 144A, 5.625%, 4/15/22 | | | United States | | | | 2,500,000 | | | | 2,418,750 | |
| | | | | | | | | | | | | | |
| | | | | | | | | | | | | 25,672,562 | |
| | | | | | | | | | | | | | |
| | Pharmaceuticals, Biotechnology & Life Sciences 3.3% | | | | | | | | | | | | |
| c | | Concordia Healthcare Corp., senior note, 144A, 7.00%, 4/15/23 | | | Canada | | | | 1,300,000 | | | | 1,134,250 | |
| c | | Endo Finance LLC/Endo Ltd./Endo Finco Inc., | | | | | | | | | | | | |
| | senior bond, 144A, 6.00%, 2/01/25 | | | United States | | | | 1,000,000 | | | | 990,000 | |
| | senior note, 144A, 6.00%, 7/15/23 | | | United States | | | | 700,000 | | | | 700,000 | |
FRANKLIN TEMPLETON VARIABLE INSURANCE PRODUCTS TRUST
STATEMENT OF INVESTMENTS
Franklin High Income VIP Fund (continued)
| | | | | | | | | | | | | | |
| | | | | Country | | | Principal Amount* | | | Value | |
| | Corporate Bonds (continued) | | | | | | | | | | | | |
| | Pharmaceuticals, Biotechnology & Life Sciences (continued) | | | | | | | | | | | | |
| c | | Horizon Pharma Financing Inc., senior note, 144A, 6.625%, 5/01/23 | | | United States | | | | 900,000 | | | $ | 805,500 | |
| c | | Jaguar Holding Co. II/Pharmaceutical Product Development LLC, senior note, 144A, 6.375%, 8/01/23 | | | United States | | | | 900,000 | | | | 879,750 | |
| c | | Valeant Pharmaceuticals International, senior note, 144A, 6.375%, 10/15/20 | | | United States | | | | 3,000,000 | | | | 2,910,000 | |
| c | | Valeant Pharmaceuticals International Inc., | | | | | | | | | | | | |
| | senior bond, 144A, 6.125%, 4/15/25 | | | United States | | | | 700,000 | | | | 626,500 | |
| | senior note, 144A, 5.625%, 12/01/21 | | | United States | | | | 300,000 | | | | 277,500 | |
| | | | | | | | | | | | | | |
| | | | | | | | | | | | | 8,323,500 | |
| | | | | | | | | | | | | | |
| | Real Estate 1.3% | | | | | | | | | | | | |
| | Equinix Inc., senior bond, 5.375%, 4/01/23 | | | United States | | | | 3,300,000 | | | | 3,382,500 | |
| | | | | | | | | | | | | | |
| | Retailing 2.6% | | | | | | | | | | | | |
| c | | American Builders & Contractors Supply Co. Inc., senior note, 144A, 5.625%, 4/15/21 | | | United States | | | | 2,100,000 | | | | 2,136,750 | |
| c | | Argos Merger Sub Inc., senior note, 144A, 7.125%, 3/15/23 | | | United States | | | | 1,600,000 | | | | 1,590,400 | |
| c | | Dollar Tree Inc., senior note, 144A, 5.75%, 3/01/23 | | | United States | | | | 800,000 | | | | 838,000 | |
| c | | Netflix Inc., senior bond, 144A, 5.875%, 2/15/25 | | | United States | | | | 1,900,000 | | | | 1,957,000 | |
| | | | | | | | | | | | | | |
| | | | | | | | | | | | | 6,522,150 | |
| | | | | | | | | | | | | | |
| | Semiconductors & Semiconductor Equipment 0.5% | | | | | | | | | | | | |
| c | | Qorvo Inc., senior bond, 144A, 7.00%, 12/01/25 | | | United States | | | | 1,200,000 | | | | 1,239,000 | |
| | | | | | | | | | | | | | |
| | Software & Services 2.9% | | | | | | | | | | | | |
| c | | BMC Software Finance Inc., senior note, 144A, 8.125%, 7/15/21 | | | United States | | | | 3,000,000 | | | | 2,006,250 | |
| c | | First Data Corp., | | | | | | | | | | | | |
| | second lien, 144A, 5.75%, 1/15/24 | | | United States | | | | 2,900,000 | | | | 2,863,750 | |
| | senior note, 144A, 7.00%, 12/01/23 | | | United States | | | | 700,000 | | | | 701,750 | |
| c | | Infor (U.S.) Inc., senior note, 144A, 6.50%, 5/15/22 | | | United States | | | | 2,000,000 | | | | 1,695,000 | |
| | | | | | | | | | | | | | |
| | | | | | | | | | | | | 7,266,750 | |
| | | | | | | | | | | | | | |
| | Technology Hardware & Equipment 1.3% | | | | | | | | | | | | |
| c | | Blackboard Inc., senior note, 144A, 7.75%, 11/15/19 | | | United States | | | | 2,000,000 | | | | 1,740,000 | |
| c | | CommScope Technologies Finance LLC, senior bond, 144A, 6.00%, 6/15/25 | | | United States | | | | 1,600,000 | | | | 1,544,000 | |
| | | | | | | | | | | | | | |
| | | | | | | | | | | | | 3,284,000 | |
| | | | | | | | | | | | | | |
| | Telecommunication Services 9.5% | | | | | | | | | | | | |
| | CenturyLink Inc., | | | | | | | | | | | | |
| | senior bond, 6.75%, 12/01/23 | | | United States | | | | 100,000 | | | | 94,125 | |
| | senior note, 6.45%, 6/15/21 | | | United States | | | | 400,000 | | | | 392,000 | |
| | senior note, 5.80%, 3/15/22 | | | United States | | | | 2,500,000 | | | | 2,300,625 | |
| c | | Digicel Group Ltd., senior note, 144A, 8.25%, 9/30/20 | | | Bermuda | | | | 1,500,000 | | | | 1,237,500 | |
| c | | Digicel Ltd., senior note, 144A, 6.00%, 4/15/21 | | | Bermuda | | | | 2,200,000 | | | | 1,871,375 | |
| | Frontier Communications Corp., senior bond, 7.875%, 1/15/27 | | | United States | | | | 100,000 | | | | 82,500 | |
| | Intelsat Jackson Holdings SA, | | | | | | | | | | | | |
| | senior bond, 5.50%, 8/01/23 | | | Luxembourg | | | | 1,500,000 | | | | 1,181,250 | |
| | senior note, 7.50%, 4/01/21 | | | Luxembourg | | | | 3,800,000 | | | | 3,325,000 | |
| | Sprint Communications Inc., senior note, | | | | | | | | | | | | |
| | 8.375%, 8/15/17 | | | United States | | | | 1,500,000 | | | | 1,485,000 | |
| | c144A, 9.00%, 11/15/18 | | | United States | | | | 3,000,000 | | | | 3,165,000 | |
| | Sprint Corp., senior bond, | | | | | | | | | | | | |
| | 7.875%, 9/15/23 | | | United States | | | | 500,000 | | | | 376,750 | |
| | 7.125%, 6/15/24 | | | United States | | | | 500,000 | | | | 366,250 | |
FRANKLIN TEMPLETON VARIABLE INSURANCE PRODUCTS TRUST
STATEMENT OF INVESTMENTS
Franklin High Income VIP Fund (continued)
| | | | | | | | | | | | | | |
| | | | | Country | | | Principal Amount* | | | Value | |
| | Corporate Bonds (continued) | | | | | | | | | | | | |
| | Telecommunication Services (continued) | | | | | | | | | | | | |
| | T-Mobile USA Inc., | | | | | | | | | | | | |
| | senior bond, 6.50%, 1/15/24 | | | United States | | | | 900,000 | | | $ | 920,250 | |
| | senior bond, 6.375%, 3/01/25 | | | United States | | | | 1,600,000 | | | | 1,624,000 | |
| | senior note, 6.542%, 4/28/20 | | | United States | | | | 1,600,000 | | | | 1,672,000 | |
| | senior note, 6.125%, 1/15/22 | | | United States | | | | 200,000 | | | | 206,000 | |
| c | | Wind Acquisition Finance SA, | | | | | | | | | | | | |
| | senior note, 144A, 7.375%, 4/23/21 | | | Italy | | | | 3,500,000 | | | | 3,309,687 | |
| | senior secured note, first lien, 144A, 4.75%, 7/15/20 | | | Italy | | | | 500,000 | | | | 493,438 | |
| | | | | | | | | | | | | | |
| | | | | | | | | | | | | 24,102,750 | |
| | | | | | | | | | | | | | |
| | Transportation 1.2% | | | | | | | | | | | | |
| c | | Florida East Coast Holdings Corp., | | | | | | | | | | | | |
| | secured note, first lien, 144A, 6.75%, 5/01/19 | | | United States | | | | 900,000 | | | | 825,750 | |
| | senior note, 144A, 9.75%, 5/01/20 | | | United States | | | | 500,000 | | | | 342,500 | |
| c | | Stena AB, senior bond, 144A, 7.00%, 2/01/24 | | | Sweden | | | | 800,000 | | | | 684,000 | |
| c | | Stena International SA, secured bond, 144A, 5.75%, 3/01/24 | | | Sweden | | | | 1,500,000 | | | | 1,270,313 | |
| | | | | | | | | | | | | | |
| | | | | | | | | | | | | 3,122,563 | |
| | | | | | | | | | | | | | |
| | Utilities 3.0% | | | | | | | | | | | | |
| | Calpine Corp., | | | | | | | | | | | | |
| | senior bond, 5.75%, 1/15/25 | | | United States | | | | 1,200,000 | | | | 1,063,500 | |
| | senior note, 5.375%, 1/15/23 | | | United States | | | | 1,300,000 | | | | 1,173,250 | |
| | csenior secured bond, first lien, 144A, 5.875%, 1/15/24 | | | United States | | | | 400,000 | | | | 412,000 | |
| c | | InterGen NV, secured bond, 144A, 7.00%, 6/30/23 | | | Netherlands | | | | 2,500,000 | | | | 1,993,750 | |
| | NGL Energy Partners LP/NGL Energy Finance Corp., senior note, 5.125%, 7/15/19 | | | United States | | | | 100,000 | | | | 79,500 | |
| | NRG Yield Operating LLC, senior bond, 5.375%, 8/15/24 | | | United States | | | | 2,000,000 | | | | 1,667,500 | |
| c | | PPL Energy Supply LLC, senior bond, 144A, 6.50%, 6/01/25 | | | United States | | | | 700,000 | | | | 465,500 | |
| c,d | | Texas Competitive Electric Holdings Co. LLC/Texas Competitive Electric Holdings Finance Inc., senior secured note, first lien, 144A, 11.50%, 10/01/20 | | | United States | | | | 2,500,000 | | | | 837,500 | |
| | | | | | | | | | | | | | |
| | | | | | | | | | | | | 7,692,500 | |
| | | | | | | | | | | | | | |
| | | | |
| | Total Corporate Bonds (Cost $280,415,117) | | | | | | | | | | | 233,991,486 | |
| | | | | | | | | | | | | | |
| g,h | | Senior Floating Rate Interests (Cost $1,519,552) 0.6% | | | | | | | | | | | | |
| | Household & Personal Products 0.6% | | | | | | | | | | | | |
| | Sun Products Corp., Tranche B Term Loan, 5.50%, 3/23/20 | | | United States | | | | 1,529,592 | | | | 1,437,817 | |
| | | | | | | | | | | | | | |
| | | | |
| | | | | | | | Shares | | | | |
| | Escrows and Litigation Trusts (Cost $ —) 0.0% | | | | | | | | | | | | |
| a,e | | NewPage Corp., Litigation Trust | | | United States | | | | 2,500,000 | | | | — | |
| | | | | | | | | | | | | | |
| | | | |
| | Total Investments before Short Term Investments
(Cost $283,000,892) | | | | | | | | | | | 235,752,458 | |
| | | | | | | | | | | | | | |
FRANKLIN TEMPLETON VARIABLE INSURANCE PRODUCTS TRUST
STATEMENT OF INVESTMENTS
Franklin High Income VIP Fund (continued)
| | | | | | | | | | | | | | |
| | | | | Country | | | Principal Amount* | | | Value | |
| | Short Term Investments (Cost $14,023,480) 5.5% | | | | | | | | | | | | |
| | Repurchase Agreements 5.5% | | | | | | | | | | | | |
| i | | Joint Repurchase Agreement, 0.279%, 1/04/16
(Maturity Value $14,023,915) | | | United States | | | | 14,023,480 | | | $ | 14,023,480 | |
| | BNP Paribas Securities Corp. (Maturity Value $4,067,496)
HSBC Securities (USA) Inc. (Maturity Value $8,541,967)
Merrill Lynch, Pierce, Fenner & Smith Inc. (Maturity Value $1,414,452) | | | | | | | | | | | | |
| | Collateralized by U.S. Government Agency Securities,
0.184% - 0.289%, 5/08/17 - 4/09/18; jU.S. Treasury Bill, 3/03/16 - 5/26/16; and U.S. Treasury Note, 1.375% - 2.625%, 2/29/20 - 11/15/20 (valued at $14,312,868) | | | | | | | | | | | | |
| | | | | | | | | | | | | | |
| | Total Investments (Cost $297,024,372) 98.4% | | | | | | | | | | | 249,775,938 | |
| | Other Assets, less Liabilities 1.6% | | | | | | | | | | | 4,106,139 | |
| | | | | | | | | | | | | | |
| | Net Assets 100.0% | | | | | | | | | | $ | 253,882,077 | |
| | | | | | | | | | | | | | |
See Abbreviations on page FH-27.
†Rounds to less than 0.1% of net assets.
*The principal amount is stated in U.S. dollars unless otherwise indicated.
aNon-income producing.
bPerpetual security with no stated maturity date.
cSecurity was purchased pursuant to Rule 144A under the Securities Act of 1933 and may be sold in transactions exempt from registration only to qualified institutional buyers or in a public offering registered under the Securities Act of 1933. These securities have been deemed liquid under guidelines approved by the Trust’s Board of Trustees. At December 31, 2015, the aggregate value of these securities was $116,864,487, representing 46.03% of net assets.
dSee Note 7 regarding defaulted securities.
eSecurity has been deemed illiquid because it may not be able to be sold within seven days. At December 31, 2015, the aggregate value of these securities was $191, representing less than 0.01% of net assets.
fPrincipal amount is stated in 1,000 Units.
gSee Note 1(d) regarding senior floating rate interests.
hThe coupon rate shown represents the rate at period end.
iSee Note 1(c) regarding joint repurchase agreement.
jThe security is traded on a discount basis with no stated coupon rate.
| | | | | | |
| | | The accompanying notes are an integral part of these financial statements. | Annual Report | | | FH-17 | |
FRANKLIN TEMPLETON VARIABLE INSURANCE PRODUCTS TRUST
Financial Statements
Statement of Assets and Liabilities
December 31, 2015
| | | | |
| | | Franklin High
Income VIP
Fund | |
Assets: | | | | |
Investments in securities: | | | | |
Cost - Unaffiliated issuers | | $ | 283,000,892 | |
Cost - Repurchase agreements | | | 14,023,480 | |
| | | | |
Total cost of investments | | $ | 297,024,372 | |
| | | | |
Value - Unaffiliated issuers | | $ | 235,752,458 | |
Value - Repurchase agreements | | | 14,023,480 | |
| | | | |
Total value of investments | | | 249,775,938 | |
Receivables: | | | | |
Capital shares sold | | | 39,998 | |
Interest | | | 4,506,738 | |
Other assets | | | 24 | |
| | | | |
Total assets | | | 254,322,698 | |
| | | | |
Liabilities: | | | | |
Payables: | | | | |
Capital shares redeemed | | | 137,435 | |
Management fees | | | 118,376 | |
Distribution fees | | | 100,765 | |
Reports to shareholders | | | 35,304 | |
Professional fees | | | 45,176 | |
Accrued expenses and other liabilities | | | 3,565 | |
| | | | |
Total liabilities | | | 440,621 | |
| | | | |
Net assets, at value | | $ | 253,882,077 | |
| | | | |
Net assets consist of: | | | | |
Paid-in capital | | $ | 309,879,842 | |
Undistributed net investment income | | | 16,279,338 | |
Net unrealized appreciation (depreciation) | | | (47,248,434 | ) |
Accumulated net realized gain (loss) | | | (25,028,669 | ) |
| | | | |
Net assets, at value | | $ | 253,882,077 | |
| | | | |
| |
| Class 1: | | | | |
Net assets, at value | | $ | 26,835,149 | |
| | | | |
Shares outstanding | | | 4,765,576 | |
| | | | |
Net asset value and maximum offering price per share | | $ | 5.63 | |
| | | | |
| |
| Class 2: | | | | |
Net assets, at value | | $ | 205,338,621 | |
| | | | |
Shares outstanding | | | 37,716,619 | |
| | | | |
Net asset value and maximum offering price per share | | $ | 5.44 | |
| | | | |
| |
| Class 4: | | | | |
Net assets, at value | | $ | 21,708,307 | |
| | | | |
Shares outstanding | | | 3,901,059 | |
| | | | |
Net asset value and maximum offering price per share | | $ | 5.56 | |
| | | | |
| | | | | | |
| | FH-18 | | | Annual Report | The accompanying notes are an integral part of these financial statements. | | |
FRANKLIN TEMPLETON VARIABLE INSURANCE PRODUCTS TRUST
FINANCIAL STATEMENTS
Statement of Operations
for the year ended December 31, 2015
| | | | |
| | | Franklin High
Income VIP
Fund | |
Investment income: | | | | |
Interest | | $ | 20,272,679 | |
| | | | |
Expenses: | | | | |
Management fees (Note 3a) | | | 1,594,086 | |
Distribution fees: (Note 3c) | | | | |
Class 2 | | | 606,174 | |
Class 4 | | | 85,517 | |
Custodian fees (Note 4) | | | 2,672 | |
Reports to shareholders | | | 86,029 | |
Professional fees | | | 49,997 | |
Trustees’ fees and expenses | | | 1,346 | |
Other | | | 23,262 | |
| | | | |
Total expenses | | | 2,449,083 | |
Expense reductions (Note 4) | | | (6 | ) |
| | | | |
Net expenses | | | 2,449,077 | |
| | | | |
Net investment income | | | 17,823,602 | |
| | | | |
Realized and unrealized gains (losses): | | | | |
Net realized gain (loss) from investments | | | (8,895,014 | ) |
Net change in unrealized appreciation (depreciation) on investments | | | (34,561,954 | ) |
| | | | |
Net realized and unrealized gain (loss) | | | (43,456,968 | ) |
| | | | |
Net increase (decrease) in net assets resulting from operations | | $ | (25,633,366 | ) |
| | | | |
| | | | | | |
| | | The accompanying notes are an integral part of these financial statements. | Annual Report | | | FH-19 | |
FRANKLIN TEMPLETON VARIABLE INSURANCE PRODUCTS TRUST
FINANCIAL STATEMENTS
Statements of Changes in Net Assets
| | | | | | | | |
| | | Franklin High Income VIP Fund | |
| | | Year Ended December 31, | |
| | | 2015 | | | 2014 | |
Increase (decrease) in net assets: | | | | | | | | |
Operations: | | | | | | | | |
Net investment income | | $ | 17,823,602 | | | $ | 20,625,453 | |
Net realized gain (loss) | | | (8,895,014 | ) | | | 7,929,816 | |
Net change in unrealized appreciation (depreciation) | | | (34,561,954 | ) | | | (26,631,956 | ) |
| | | | |
Net increase (decrease) in net assets resulting from operations | | | (25,633,366 | ) | | | 1,923,313 | |
| | | | |
Distributions to shareholders from: | | | | | | | | |
Net investment income: | | | | | | | | |
Class 1 | | | (2,177,640 | ) | | | (2,292,485 | ) |
Class 2 | | | (17,219,440 | ) | | | (18,595,621 | ) |
Class 4 | | | (1,604,998 | ) | | | (1,613,962 | ) |
| | | | |
Total distributions to shareholders | | | (21,002,078 | ) | | | (22,502,068 | ) |
| | | | |
Capital share transactions: (Note 2) | | | | | | | | |
Class 1 | | | (2,896,859 | ) | | | (2,696,242 | ) |
Class 2 | | | (18,609,864 | ) | | | (12,927,786 | ) |
Class 4 | | | (212,162 | ) | | | (475,860 | ) |
| | | | |
Total capital share transactions | | | (21,718,885 | ) | | | (16,099,888 | ) |
| | | | |
Net increase (decrease) in net assets | | | (68,354,329 | ) | | | (36,678,643 | ) |
Net assets: | | | | | | | | |
Beginning of year | | | 322,236,406 | | | | 358,915,049 | |
| | | | |
End of year | | $ | 253,882,077 | | | $ | 322,236,406 | |
| | | | |
Undistributed net investment income included in net assets: | | | | | | | | |
End of year | | $ | 16,279,338 | | | $ | 19,094,317 | |
| | | | |
| | | | | | |
| | FH-20 | | | Annual Report | The accompanying notes are an integral part of these financial statements. | | |
FRANKLIN TEMPLETON VARIABLE INSURANCE PRODUCTS TRUST
Notes to Financial Statements
Franklin High Income VIP Fund
1. Organization and Significant Accounting Policies
Franklin Templeton Variable Insurance Products Trust (Trust) is registered under the Investment Company Act of 1940 (1940 Act) as an open-end management investment company, consisting of nineteen separate funds and applies the specialized accounting and reporting guidance in U.S. Generally Accepted Accounting Principles (U.S. GAAP). Franklin High Income VIP Fund (Fund) is included in this report. The financial statements of the remaining funds in the Trust are presented separately. Shares of the Fund are generally sold only to insurance company separate accounts to fund the benefits of variable life insurance policies or variable annuity contracts. At December 31, 2015, 86.30% of the Fund’s shares were held through one insurance company. Investment activities of these insurance company separate accounts could have a material impact on the Fund. The Fund offers three classes of shares: Class 1, Class 2 and Class 4. Each class of shares differs by its distribution fees, voting rights on matters affecting a single class and its exchange privilege.
The following summarizes the Fund’s significant accounting policies.
a. Financial Instrument Valuation
The Fund’s investments in financial instruments are carried at fair value daily. Fair value is the price that would be received to sell an asset or paid to transfer a liability in an orderly transaction between market participants on the measurement date. The Fund calculates the net asset value (NAV) per share as of 4 p.m. Eastern time each day the New York Stock Exchange (NYSE) is open for trading. Under compliance policies and procedures approved by the Trust’s Board of Trustees (the Board), the Fund’s administrator has responsibility for oversight of valuation, including leading the cross-functional Valuation and Liquidity Oversight Committee (VLOC). The VLOC provides administration and oversight of the Fund’s valuation policies and procedures, which are approved annually by the Board. Among other things, these procedures allow the Fund to utilize independent pricing services, quotations from securities and financial instrument dealers, and other market sources to determine fair value.
Equity securities listed on an exchange or on the NASDAQ National Market System are valued at the last quoted sale price or the official closing price of the day, respectively. Foreign equity securities are valued as of the close of trading on the
foreign stock exchange on which the security is primarily traded or as of 4 p.m. Eastern time whichever is earlier. The value is then converted into its U.S. dollar equivalent at the foreign exchange rate in effect at 4 p.m. Eastern time on the day that the value of the security is determined. Over-the-counter (OTC) securities are valued within the range of the most recent quoted bid and ask prices. Securities that trade in multiple markets or on multiple exchanges are valued according to the broadest and most representative market. Certain equity securities are valued based upon fundamental characteristics or relationships to similar securities.
Debt securities generally trade in the OTC market rather than on a securities exchange. The Fund’s pricing services use multiple valuation techniques to determine fair value. In instances where sufficient market activity exists, the pricing services may utilize a market-based approach through which quotes from market makers are used to determine fair value. In instances where sufficient market activity may not exist or is limited, the pricing services also utilize proprietary valuation models which may consider market characteristics such as benchmark yield curves, credit spreads, estimated default rates, anticipated market interest rate volatility, coupon rates, anticipated timing of principal repayments, underlying collateral, and other unique security features in order to estimate the relevant cash flows, which are then discounted to calculate the fair value. Securities denominated in a foreign currency are converted into their U.S. dollar equivalent at the foreign exchange rate in effect at 4 p.m. Eastern time on the date that the values of the foreign debt securities are determined.
Repurchase agreements are valued at cost, which approximates fair value.
The Fund has procedures to determine the fair value of financial instruments for which market prices are not reliable or readily available. Under these procedures, the VLOC convenes on a regular basis to review such financial instruments and considers a number of factors, including significant unobservable valuation inputs, when arriving at fair value. The VLOC primarily employs a market-based approach which may use related or comparable assets or liabilities, recent transactions, market multiples, book values, and other relevant information for the investment to determine the fair value of the investment. An income-based valuation approach may also be used in which the anticipated future cash flows of the investment are discounted to calculate fair value. Discounts may also be applied due to the
FRANKLIN TEMPLETON VARIABLE INSURANCE PRODUCTS TRUST
NOTES TO FINANCIAL STATEMENTS
Franklin High Income VIP Fund (continued)
1. Organization and Significant Accounting Policies (continued)
a. Financial Instrument Valuation (continued)
nature or duration of any restrictions on the disposition of the investments. Due to the inherent uncertainty of valuations of such investments, the fair values may differ significantly from the values that would have been used had an active market existed. The VLOC employs various methods for calibrating these valuation approaches including a regular review of key inputs and assumptions, transactional back-testing or disposition analysis, and reviews of any related market activity.
Trading in securities on foreign securities stock exchanges and OTC markets may be completed before 4 p.m. Eastern time. In addition, trading in certain foreign markets may not take place on every NYSE business day. Occasionally, events occur between the time at which trading in a foreign security is completed and the close of the NYSE that might call into question the reliability of the value of a portfolio security held by the Fund. As a result, differences may arise between the value of the Fund’s portfolio securities as determined at the foreign market close and the latest indications of value at the close of the NYSE. In order to minimize the potential for these differences, the VLOC monitors price movements following the close of trading in foreign stock markets through a series of country specific market proxies (such as baskets of American Depositary Receipts, futures contracts and exchange traded funds). These price movements are measured against established trigger thresholds for each specific market proxy to assist in determining if an event has occurred that may call into question the reliability of the values of the foreign securities held by the Fund. If such an event occurs, the securities may be valued using fair value procedures, which may include the use of independent pricing services.
When the last day of the reporting period is a non-business day, certain foreign markets may be open on those days that the NYSE is closed, which could result in differences between the value of the Fund’s portfolio securities on the last business day and the last calendar day of the reporting period. Any significant security valuation changes due to an open foreign market are adjusted and reflected by the Fund for financial reporting purposes.
b. Foreign Currency Translation
Portfolio securities and other assets and liabilities denominated in foreign currencies are translated into U.S. dollars based on
the exchange rate of such currencies against U.S. dollars on the date of valuation. The Fund may enter into foreign currency exchange contracts to facilitate transactions denominated in a foreign currency. Purchases and sales of securities, income and expense items denominated in foreign currencies are translated into U.S. dollars at the exchange rate in effect on the transaction date. Portfolio securities and assets and liabilities denominated in foreign currencies contain risks that those currencies will decline in value relative to the U.S. dollar. Occasionally, events may impact the availability or reliability of foreign exchange rates used to convert the U.S. dollar equivalent value. If such an event occurs, the foreign exchange rate will be valued at fair value using procedures established and approved by the Board.
The Fund does not separately report the effect of changes in foreign exchange rates from changes in market prices on securities held. Such changes are included in net realized and unrealized gain or loss from investments in the Statement of Operations.
Realized foreign exchange gains or losses arise from sales of foreign currencies, currency gains or losses realized between the trade and settlement dates on securities transactions and the difference between the recorded amounts of dividends, interest, and foreign withholding taxes and the U.S. dollar equivalent of the amounts actually received or paid. Net unrealized foreign exchange gains and losses arise from changes in foreign exchange rates on foreign denominated assets and liabilities other than investments in securities held at the end of the reporting period.
c. Joint Repurchase Agreement
The Fund enters into a joint repurchase agreement whereby its uninvested cash balance is deposited into a joint cash account with other funds managed by the investment manager or an affiliate of the investment manager and is used to invest in one or more repurchase agreements. The value and face amount of the joint repurchase agreement are allocated to the funds based on their pro-rata interest. A repurchase agreement is accounted for as a loan by the Fund to the seller, collateralized by securities which are delivered to the Fund’s custodian. The fair value, including accrued interest, of the initial collateralization is required to be at least 102% of the dollar amount invested by the funds, with the value of the underlying securities marked to market daily to maintain coverage of at least 100%. Repurchase agreements are subject to the terms of Master Repurchase
FRANKLIN TEMPLETON VARIABLE INSURANCE PRODUCTS TRUST
NOTES TO FINANCIAL STATEMENTS
Franklin High Income VIP Fund (continued)
Agreements (MRAs) with approved counterparties (sellers). The MRAs contain various provisions, including but not limited to events of default and maintenance of collateral for repurchase agreements. In the event of default by either the seller or the Fund, certain MRAs may permit the non-defaulting party to net and close-out all transactions, if any, traded under such agreements. The Fund may sell securities it holds as collateral and apply the proceeds towards the repurchase price and any other amounts owed by the seller to the Fund in the event of default by the seller. This could involve costs or delays in addition to a loss on the securities if their value falls below the repurchase price owed by the seller. The joint repurchase agreement held by the Fund at year end, as indicated in the Statement of Investments, had been entered into on December 31, 2015.
d. Senior Floating Rate Interests
The Fund invests in senior secured corporate loans that pay interest at rates which are periodically reset by reference to a base lending rate plus a spread. These base lending rates are generally the prime rate offered by a designated U.S. bank or the London InterBank Offered Rate (LIBOR). Senior secured corporate loans often require prepayment of principal from excess cash flows or at the discretion of the borrower. As a result, actual maturity may be substantially less than the stated maturity. Senior secured corporate loans in which the Fund invests are generally readily marketable, but may be subject to certain restrictions on resale.
e. Income and Deferred Taxes
It is the Fund’s policy to qualify as a regulated investment company under the Internal Revenue Code. The Fund intends to distribute to shareholders substantially all of its taxable income and net realized gains to relieve it from federal income and if applicable, excise taxes. As a result, no provision for U.S. federal income taxes is required.
The Fund may be subject to foreign taxation related to income received, capital gains on the sale of securities and certain foreign currency transactions in the foreign jurisdictions in which it invests. Foreign taxes, if any, are recorded based on the tax regulations and rates that exist in the foreign markets in which the Fund invests. When a capital gain tax is determined to apply, the Fund records an estimated deferred tax liability in an amount that would be payable if the securities were disposed of on the valuation date.
The Fund may recognize an income tax liability related to its uncertain tax positions under U.S. GAAP when the uncertain
tax position has a less than 50% probability that it will be sustained upon examination by the tax authorities based on its technical merits. As of December 31, 2015, the Fund has determined that no tax liability is required in its financial statements related to uncertain tax positions for any open tax years (or expected to be taken on future tax returns). Open tax years are those that remain subject to examination and are based on each tax jurisdiction’s statute of limitation.
f. Security Transactions, Investment Income, Expenses and Distributions
Security transactions are accounted for on trade date. Realized gains and losses on security transactions are determined on a specific identification basis. Interest income and estimated expenses are accrued daily. Amortization of premium and accretion of discount on debt securities are included in interest income. Facility fees are recognized as income over the expected term of the loan. Distributions to shareholders are recorded on the ex-dividend date and are determined according to income tax regulations (tax basis). Distributable earnings determined on a tax basis may differ from earnings recorded in accordance with U.S. GAAP. These differences may be permanent or temporary. Permanent differences are reclassified among capital accounts to reflect their tax character. These reclassifications have no impact on net assets or the results of operations. Temporary differences are not reclassified, as they may reverse in subsequent periods.
Common expenses incurred by the Trust are allocated among the Funds based on the ratio of net assets of each Fund to the combined net assets of the Trust. Fund specific expenses are charged directly to the fund that incurred the expense.
Realized and unrealized gains and losses and net investment income, not including class specific expenses, are allocated daily to each class of shares based upon the relative proportion of net assets of each class. Differences in per share distributions, by class, are generally due to differences in class specific expenses.
g. Accounting Estimates
The preparation of financial statements in accordance with U.S. GAAP requires management to make estimates and assumptions that affect the reported amounts of assets and liabilities at the date of the financial statements and the amounts of income and expenses during the reporting period. Actual results could differ from those estimates.
FRANKLIN TEMPLETON VARIABLE INSURANCE PRODUCTS TRUST
NOTES TO FINANCIAL STATEMENTS
Franklin High Income VIP Fund (continued)
1. Organization and Significant Accounting Policies (continued)
h. Guarantees and Indemnifications
Under the Trust’s organizational documents, its officers and trustees are indemnified by the Trust against certain liabilities arising out of the performance of their duties to the Trust. Additionally,
in the normal course of business, the Trust, on behalf of the Fund, enters into contracts with service providers that contain general indemnification clauses. The Trust’s maximum exposure under these arrangements is unknown as this would involve future claims that may be made against the Trust that have not yet occurred. Currently, the Trust expects the risk of loss to be remote.
2. Shares of Beneficial Interest
At December 31, 2015, there were an unlimited number of shares authorized (without par value). Transactions in the Fund’s shares were as follows:
| | | | | | | | | | | | | | | | | | |
| | | Year Ended December 31, | |
| | | 2015 | | | | | 2014 | |
| | | Shares | | | Amount | | | | | Shares | | | Amount | |
| | | | | |
| Class 1 Shares: | | | | | | | | | | | | | | | | | | |
Shares sold | | | 75,416 | | | $ | 488,620 | | | | | | 120,684 | | | $ | 836,723 | |
Shares issued in reinvestment of distributions | | | 345,109 | | | | 2,177,640 | | | | | | 329,854 | | | | 2,292,485 | |
Shares redeemed | | | (874,142 | ) | | | (5,563,119 | ) | | | | | (832,231 | ) | | | (5,825,450 | ) |
| | | | |
Net increase (decrease) | | | (453,617 | ) | | $ | (2,896,859 | ) | | | | | (381,693 | ) | | $ | (2,696,242 | ) |
| | | | |
| Class 2 Shares: | | | | | | | | | | | | | | | | | | |
Shares sold | | | 8,301,712 | | | $ | 51,141,411 | | | | | | 13,791,290 | | | $ | 93,795,388 | |
Shares issued in reinvestment of distributions | | | 2,818,239 | | | | 17,219,440 | | | | | | 2,754,907 | | | | 18,595,621 | |
Shares redeemed | | | (14,249,319 | ) | | | (86,970,715 | ) | | | | | (18,545,301 | ) | | | (125,318,795 | ) |
| | | | |
Net increase (decrease) | | | (3,129,368 | ) | | $ | (18,609,864 | ) | | | | | (1,999,104 | ) | | $ | (12,927,786 | ) |
| | | | |
| Class 4 Shares: | | | | | | | | | | | | | | | | | | |
Shares sold | | | 185,105 | | | $ | 1,139,732 | | | | | | 276,687 | | | $ | 1,933,896 | |
Shares issued in reinvestment of distributions | | | 256,800 | | | | 1,604,998 | | | | | | 234,247 | | | | 1,613,962 | |
Shares redeemed | | | (474,184 | ) | | | (2,956,892 | ) | | | | | (581,606 | ) | | | (4,023,718 | ) |
| | | | |
Net increase (decrease) | | | (32,279 | ) | | $ | (212,162 | ) | | | | | (70,672 | ) | | $ | (475,860 | ) |
| | | | |
3. Transactions With Affiliates
Franklin Resources, Inc. is the holding company for various subsidiaries that together are referred to as Franklin Templeton Investments. Certain officers and trustees of the Fund are also officers and/or directors of the following subsidiaries:
| | |
| Subsidiary | | Affiliation |
Franklin Advisers, Inc. (Advisers) | | Investment manager |
Franklin Templeton Services, LLC (FT Services) | | Administrative manager |
Franklin Templeton Distributors, Inc. (Distributors) | | Principal underwriter |
Franklin Templeton Investor Services, LLC (Investor Services) | | Transfer agent |
FRANKLIN TEMPLETON VARIABLE INSURANCE PRODUCTS TRUST
NOTES TO FINANCIAL STATEMENTS
Franklin High Income VIP Fund (continued)
a. Management Fees
The Fund pays an investment management fee to Advisers based on the average daily net assets of the Fund as follows:
| | |
| Annualized Fee Rate | | Net Assets |
0.625% | | Up to and including $100 million |
0.500% | | Over $100 million, up to and including $250 million |
0.450% | | Over $250 million, up to and including $7.5 billion |
0.440% | | Over $7.5 billion, up to and including $10 billion |
0.430% | | Over $10 billion, up to and including $12.5 billion |
0.420% | | Over $12.5 billion, up to and including $15 billion |
0.400% | | In excess of $15 billion |
b. Administrative Fees
Under an agreement with Advisers, FT Services provides administrative services to the Fund. The fee is paid by Advisers based on the Fund’s average daily net assets, and is not an additional expense of the Fund.
c. Distribution Fees
The Board has adopted distribution plans for Class 2 and Class 4 shares pursuant to Rule 12b-1 under the 1940 Act. Under the Fund’s compensation distribution plans, the Fund pays Distributors for costs incurred in connection with the servicing, sale and distribution of the Fund’s shares up to 0.35% per year of its average daily net assets of each class. The Board has agreed to limit the current rate to 0.25% per year for Class 2. The plan year, for purposes of monitoring compliance with the maximum annual plan rates, is February 1 through January 31.
d. Transfer Agent Fees
Investor Services, under terms of an agreement, performs shareholder servicing for the Fund and is not paid by the Fund for the services.
4. Expense Offset Arrangement
The Fund has entered into an arrangement with its custodian whereby credits realized as a result of uninvested cash balances are used to reduce a portion of the Fund’s custodian expenses. During the year ended December 31, 2015, the custodian fees were reduced as noted in the Statement of Operations.
5. Income Taxes
For tax purposes, capital losses may be carried over to offset future capital gains. Capital loss carryforwards with no expiration, if any, must be fully utilized before those losses with expiration dates.
At December 31, 2015, capital loss carryforwards were as follows:
| | | | |
Capital loss carryforwards subject to expiration: | | | | |
2016 | | $ | 5,148,804 | |
2017 | | | 10,621,353 | |
| |
Capital loss carryforwards not subject to expiration: | | | | |
Short term | | | 79,444 | |
Long term | | | 9,179,067 | |
| | | | |
Total capital loss carryforwards | | $ | 25,028,668 | |
| | | | |
FRANKLIN TEMPLETON VARIABLE INSURANCE PRODUCTS TRUST
NOTES TO FINANCIAL STATEMENTS
Franklin High Income VIP Fund (continued)
5. Income Taxes (continued)
The tax character of distributions paid during the years ended December 31, 2015 and 2014, was as follows:
| | | | | | | | |
| | | 2015 | | | 2014 | |
Distributions paid from ordinary income | | $ | 21,002,078 | | | $ | 22,502,068 | |
| | | | |
At December 31, 2015, the cost of investments, net unrealized appreciation (depreciation) and undistributed ordinary income for income tax purposes were as follows:
| | | | |
Cost of investments | | $ | 298,094,454 | |
| | | | |
Unrealized appreciation | | $ | 1,935,563 | |
Unrealized depreciation | | | (50,254,079 | ) |
| | | | |
Net unrealized appreciation (depreciation) | | $ | (48,318,516 | ) |
| | | | |
Distributable earnings - undistributed ordinary income | | $ | 17,443,182 | |
| | | | |
Differences between income and/or capital gains as determined on a book basis and a tax basis are primarily due to differing treatments of defaulted securities, bond discounts and premiums, and wash sales.
6. Investment Transactions
Purchases and sales of investments (excluding short term securities) for the year ended December 31, 2015, aggregated $81,065,110 and $102,413,057, respectively.
7. Credit Risk and Defaulted Securities
At December 31, 2015, the Fund had 93.34% of its portfolio invested in high yield securities, senior secured floating rate notes, or other securities rated below investment grade. These securities may be more sensitive to economic conditions causing greater price volatility and are potentially subject to a greater risk of loss due to default than higher rated securities.
The Fund held defaulted securities and/or other securities for which the income has been deemed uncollectible. At December 31, 2015, the aggregate value of these securities was $1,596,049, representing 0.63% of the Fund’s net assets. The Fund discontinues accruing income on securities for which income has been deemed uncollectible and provides an estimate for losses on interest receivable. The securities have been identified in the accompanying Statement of Investments.
8. Credit Facility
The Fund, together with other U.S. registered and foreign investment funds (collectively, Borrowers), managed by Franklin Templeton Investments, are borrowers in a joint syndicated senior unsecured credit facility totaling $2 billion (Global Credit Facility) which matured on February 12, 2016. This Global Credit Facility provides a source of funds to the Borrowers for temporary and emergency purposes, including the ability to meet future unanticipated or unusually large redemption requests. Effective February 12, 2016, the Borrowers renewed the Global Credit Facility for a one year term, maturing February 10, 2017, for a total of $2 billion.
Under the terms of the Global Credit Facility, the Fund shall, in addition to interest charged on any borrowings made by the Fund and other costs incurred by the Fund, pay its share of fees and expenses incurred in connection with the implementation and maintenance of the Global Credit Facility, based upon its relative share of the aggregate net assets of all of the Borrowers, including an annual commitment fee of 0.07% based upon the unused portion of the Global Credit Facility. Effective February 12, 2016, the annual commitment fee is 0.15%. These fees are reflected in other expenses in the Statement of Operations. During the year ended December 31, 2015, the Fund did not use the Global Credit Facility.
FRANKLIN TEMPLETON VARIABLE INSURANCE PRODUCTS TRUST
NOTES TO FINANCIAL STATEMENTS
Franklin High Income VIP Fund (continued)
9. Fair Value Measurements
The Fund follows a fair value hierarchy that distinguishes between market data obtained from independent sources (observable inputs) and the Fund’s own market assumptions (unobservable inputs). These inputs are used in determining the value of the Fund’s financial instruments and are summarized in the following fair value hierarchy:
| | • | | Level 1 – quoted prices in active markets for identical financial instruments |
| | • | | Level 2 – other significant observable inputs (including quoted prices for similar financial instruments, interest rates, prepayment speed, credit risk, etc.) |
| | • | | Level 3 – significant unobservable inputs (including the Fund’s own assumptions in determining the fair value of financial instruments) |
The input levels are not necessarily an indication of the risk or liquidity associated with financial instruments at that level.
For movements between the levels within the fair value hierarchy, the Fund has adopted a policy of recognizing the transfers as of the date of the underlying event which caused the movement.
A summary of inputs used as of December 31, 2015, in valuing the Fund’s assets carried at fair value, is as follows:
| | | | | | | | | | | | | | | | |
| | | Level 1 | | | Level 2 | | | Level 3 | | | Total | |
| | | | |
| Assets: | | | | | | | | | | | | | | | | |
Investments in Securities: | | | | | | | | | | | | | | | | |
Equity Investmentsa,b | | $ | — | | | $ | 323,155 | | | $ | — | | | $ | 323,155 | |
Corporate Bonds | | | — | | | | 233,537,495 | | | | 453,991 | | | | 233,991,486 | |
Senior Floating Rate Interests | | | — | | | | 1,437,817 | | | | — | | | | 1,437,817 | |
Escrows and Litigation Trusts | | | — | | | | — | | | | — | c | | | — | |
Short Term Investments | | | — | | | | 14,023,480 | | | | — | | | | 14,023,480 | |
| | | | |
Total Investments in Securities | | $ | — | | | $ | 249,321,947 | | | $ | 453,991 | | | $ | 249,775,938 | |
| | | | |
aIncludes common and convertible preferred stocks.
bFor detailed categories, see the accompanying Statement of Investments.
cIncludes securities determined to have no value at December 31, 2015.
A reconciliation of assets in which Level 3 inputs are used in determining fair value is presented when there are significant Level 3 financial instruments at the end of the year.
10. Subsequent Events
The Fund has evaluated subsequent events through the issuance of the financial statements and determined that no events have occurred that require disclosure other than those already disclosed in the financial statements.
Abbreviations
| | |
| Selected Portfolio |
| |
| FRN | | Floating Rate Note |
FRANKLIN TEMPLETON VARIABLE INSURANCE PRODUCTS TRUST
Report of Independent Registered Public Accounting Firm
Franklin High Income VIP Fund
To the Board of Trustees and Shareholders of Franklin Templeton Variable Insurance Products Trust
In our opinion, the accompanying statement of assets and liabilities, including the statement of investments, and the related statements of operations and of changes in net assets and the financial highlights present fairly, in all material respects, the financial position of Franklin High Income VIP Fund (the “Fund”) at December 31, 2015, the results of its operations for the year then ended, the changes in its net assets for each of the two years in the period then ended and the financial highlights for each of the periods presented, in conformity with accounting principles generally accepted in the United States of America. These financial statements and financial highlights (hereafter referred to as “financial statements”) are the responsibility of the Fund’s management. Our responsibility is to express an opinion on these financial statements based on our audit. We conducted our audit of these financial statements in accordance with the standards of the Public Company Accounting Oversight Board (United States). Those standards require that we plan and perform the audit to obtain reasonable assurance about whether the financial statements are free of material misstatement. An audit includes examining, on a test basis, evidence supporting the amounts and disclosures in the financial statements, assessing the accounting principles used and significant estimates made by management, and evaluating the overall financial statement presentation. We believe that our audits, which included confirmation of securities at December 31, 2015 by correspondence with the custodian and brokers, provides a reasonable basis for our opinion.
PricewaterhouseCoopers LLP
San Francisco, California
February 16, 2016
Franklin Income VIP Fund
This annual report for Franklin Income VIP Fund covers the fiscal year ended December 31, 2015.
Class 4 Performance Summary as of December 31, 2015
Average annual total return of Class 4 shares* represents the average annual change in value, assuming reinvestment of dividends and capital gains. Average returns smooth out variations in returns, which can be significant; they are not the same as year-by-year results.
| | | | | | | | | | | | |
| Periods ended 12/31/15 | | 1-Year | | | 5-Year | | | 10-Year | |
Average Annual Total Return | | | -7.15% | | | | +4.93% | | | | +5.33% | |
*For the period beginning 2/29/08, Class 4 performance reflects a 12b-1 fee expense of 0.35% per year, which affects future performance. Class 4 performance prior to 2/29/08 reflects historical Class 1 performance, which does not have a 12b-1 fee expense. Since 2/29/08 (effective date), the average annual total return of Class 4 shares was +4.60%. The Fund has a fee waiver associated with any investment in a Franklin Templeton money fund, contractually guaranteed through at least its current fiscal year-end. Fund investment results reflect the fee waiver, to the extent applicable; without this reduction, the results would have been lower.
Performance reflects the Fund’s Class 4 operating expenses, but does not include any contract fees, expenses or sales charges. If they had been included, performance would be lower. These charges and deductions, particularly for variable life policies, can have a significant effect on contract values and insurance benefits. See the contract prospectus for a complete description of these expenses, including sales charges.
Performance data represent past performance, which does not guarantee future results. Investment return and principal value will fluctuate, and you may have a gain or loss when you sell your shares. Current performance may differ from figures shown.
Total Return Index Comparison for a Hypothetical $10,000 Investment (1/1/06–12/31/15)
The graph below shows the change in value of a hypothetical $10,000 investment in the Fund over the indicated period and includes reinvestment of any income or distributions. The Fund’s performance* is compared to the performance of the Standard & Poor’s® 500 Index (S&P 500®) and the Barclays U.S. Aggregate Bond Index. One cannot invest directly in an index, and an index is not representative of the Fund’s portfolio. Please see Important Notes to Performance Information preceding the Fund Summaries.
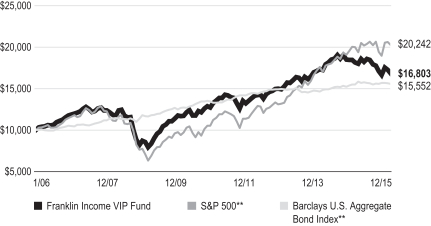
**Source: Morningstar. Please see Index Descriptions following the Fund Summaries.
FRANKLIN INCOME VIP FUND
Fund Goal and Main Investments
The Fund seeks to maximize income while maintaining prospects for capital appreciation. Under normal market conditions, the Fund invests in both equity and debt securities.
Fund Risks
All investments involve risks, including possible loss of principal. Stock prices fluctuate, sometimes rapidly and dramatically, due to factors affecting individual companies, particular industries or sectors, or general market conditions. The Fund’s share price and yield will be affected by interest rate movements. Bond prices generally move in the opposite direction of interest rates. Thus, as prices of bonds in the Fund adjust to a rise in interest rates, the Fund’s share price may decline. Changes in the financial strength of a bond issuer or in a bond’s credit rating may affect its value. The Fund’s portfolio includes a substantial portion of higher yielding, lower rated corporate bonds because of the relatively higher yields they offer. Floating rate loans are lower rated, higher yielding instruments, which are subject to increased risk of default and can potentially result in loss of principal. These securities carry a greater degree of credit risk relative to investment-grade securities. The Fund is actively managed but there is no guarantee that the manager’s investment decisions will produce the desired results. The Fund’s prospectus also includes a description of the main investment risks.
Performance Overview
You can find the Fund’s one-year total return in the Performance Summary. For comparison, the Fund’s equity benchmark, the S&P 500, posted a +1.38% total return, and its fixed income benchmark, the Barclays U.S. Aggregate Bond Index, produced a +0.55% total return for the same period.1
Economic and Market Overview
The U.S. economy grew moderately during the 12 months under review amid healthy consumer spending. After starting 2015 with modest growth, the economy strengthened in the second quarter but moderated in the third and fourth quarters as exports slowed and state and local governments reduced their spending. Manufacturing activities expanded for most of the period but contracted toward period-end. Non-manufacturing activities, however, expanded throughout the 12-month period,
contributing to new jobs and helping drive down the unemployment rate to 5.0% from October through period-end, the lowest level in more than seven years.2 The housing market improved at period-end as existing and new home sales increased and home prices rose despite slightly higher mortgage rates. Retail sales grew modestly, led by automobile and auto component sales. Annual inflation, as measured by the Consumer Price Index, remained subdued largely due to low energy prices.
After maintaining its target interest rate at a range of 0%–0.25% for seven years to support the U.S. economy’s recovery, the Federal Reserve (Fed) raised its target range for the federal funds rate to 0.25%–0.50% at its December meeting. Policymakers cited the labor market’s considerable improvement and were reasonably confident that inflation would move back to the Fed’s 2.0% medium-term objective. The Fed indicated that its process of normalizing interest rates would be data dependent and would likely be gradual. Furthermore, the Fed raised its 2016 U.S. economic growth forecast and lowered its unemployment rate projection.
U.S. stock markets experienced sell-offs at times during the year, resulting from investor concerns about the timing of the Fed’s interest rate increases, slower global economic growth, geopolitical tensions in certain regions and a plunge in crude oil prices. Investors generally remained confident, however, as the Fed maintained an accommodative monetary policy stance despite the rate increase, the eurozone economy improved and China implemented more stimulus measures to support its economy. Despite periods of volatility, the broad U.S. stock market, as measured by the S&P 500, generated a modest positive total return for 2015. The energy and materials sectors were among the worst performers, while consumer discretionary, health care, consumer staples and information technology outperformed.
The 10-year Treasury yield, which moves inversely to price, fluctuated throughout the period. It began the period at 2.17%, declined to a period low of 1.68% in late January 2015 and ended the period at 2.27%. For much of the year, the yield movements appeared to reflect investor uncertainty given concerns about domestic data, geopolitical tensions, the Fed’s timing for raising interest rates and events in China. However, near period-end, decreasing concerns over China’s economy and the Fed’s decision to increase interest rates supported Treasury yields.
1. Source: Morningstar.
One cannot invest directly in an index, and an index is not representative of the Fund’s portfolio. Please see Index Descriptions following the Fund Summaries.
2. Source: Bureau of Labor Statistics.
FRANKLIN INCOME VIP FUND
Investment Strategy
We search for undervalued or out-of-favor securities we believe offer opportunities for income today and growth tomorrow. We generally perform independent analysis of the debt securities being considered for the Fund’s portfolio, rather than relying principally on ratings assigned by rating agencies. In analyzing debt and equity securities, we consider a variety of factors, including: a security’s relative value based on such factors as anticipated cash flow, interest or dividend coverage, asset coverage, and earnings prospects; the experience and strength of a company’s management; a company’s sensitivity to changes in interest rates and business conditions; a company’s debt maturity schedules and borrowing requirements; and a company’s changing financial condition and market recognition of the change.
Manager’s Discussion
During the 12 months under review, we continued to strategically shift the Fund’s asset mix seeking to manage risks. We increased our equity holdings and decreased our fixed income holdings as we found more opportunities in equities than in fixed income. The Fund’s equity weighting rose from 57.4% to 62.7% of total net assets and its fixed income weighting fell from 34.5% to 24.2%. Our cash position rose from 8.1% to 13.1% of total net assets.
The Fund’s equity holdings underperformed the S&P 500 during the period, largely because of weak performance in the Fund’s energy, materials and utilities sector positions. During the period, crude oil prices declined precipitously by about one-third, influenced by the Organization of the Petroleum Exporting Countries’ drive for greater market share along with uncertain demand in late 2014 and early 2015 as global economies slowed. This environment took a severe toll on the share prices of large, international, integrated oil companies including Royal Dutch Shell, Chevron, Total and BP, which were among the Fund’s leading energy sector decliners. Our positions in upstream-focused oil and gas producers including Anadarko Petroleum also lost value as crude oil and natural gas prices fell. Additionally, with reduced revenues and cash flows expected in a lower commodity price environment, capital expenditure budgets for upstream activities declined, dimming the outlook for oilfield services and equipment companies including Schlumberger3 and Halliburton. On a more positive note, the industry’s supply and demand balance began to improve somewhat as low prices stimulated consumption and as reduced investment weighed on the forward supply outlook.
| | | | |
| Portfolio Breakdown | | | |
| 12/31/15 | | | |
| | | % of Total
Net Assets | |
| Equity* | | | 62.7% | |
| Utilities | | | 9.9% | |
| Energy | | | 9.1% | |
| Industrials | | | 8.7% | |
| Health Care | | | 7.3% | |
| Information Technology | | | 6.8% | |
| Materials | | | 6.2% | |
| Financials | | | 5.7% | |
| Consumer Discretionary | | | 4.8% | |
| Telecommunication Services | | | 2.5% | |
| Consumer Staples | | | 1.7% | |
| Fixed Income | | | 24.2% | |
| Financials | | | 4.2% | |
| Consumer Discretionary | | | 3.8% | |
| Energy | | | 3.6% | |
| Telecommunication Services | | | 3.4% | |
| Health Care | | | 2.1% | |
| Industrials | | | 2.0% | |
| Other | | | 5.1% | |
| Short-Term Investments & Other Net Assets | | | 13.1% | |
*Includes convertible bonds.
A majority of holdings in the materials sector detracted from Fund performance, with Rio Tinto, BHP Billiton and Freeport-McMoRan3 among the largest decliners. These well-positioned operators with relatively stronger balance sheets than those of their peers have lowered their cost structures, but their recent results reflected dramatically lower commodity prices and lighter volumes. Large global chemical company E.I. du Pont de Nemours and Co. also negatively affected performance. Du Pont’s results have been disappointing and the company recently lowered annual guidance following declining demand, unfavorable currency exchange rates and a lack of progress reducing costs.
The utilities sector experienced large declines early in the reporting period that led to the sector’s negative one-year performance. Our positions in Exelon, Duke Energy and Entergy3 were notable detractors. The market generally viewed utilities less favorably earlier in the year as the prospect for interest rate increases appeared high, but utility stocks rebounded somewhat
3. Not held at period-end.
FRANKLIN INCOME VIP FUND
as the Fed elected not to raise rates until December. Although the potential for future rate hikes may likely continue to dampen investor sentiment toward utility sector stocks, we feel our focus on individual utility companies with meaningful earnings-per-share growth potential somewhat mitigated this interest rate sensitivity. Within the Fund’s utilities sector, we sought investments we viewed as having growth potential with liquefied natural gas export projects, capital investment and rate-base growth aimed at enhancing our nation’s electricity transmission and natural gas pipeline infrastructure, and certain states where the regulatory environment has been welcoming to needed capital investments and renewable energy projects. At period-end, the Fund’s overall weighting in utilities remained toward the low end of its historical range.
In contrast, the Fund’s equity industrials sector holdings contributed positively to performance, particularly investments in aerospace and defense. Raytheon and Lockheed Martin are examples of companies that fit well with our overall investment framework as we believe they operate strong businesses with underappreciated growth and improving margins and cash flows. Given new product development and healthy government defense spending levels, we believe the opportunity for defense contractors should be attractive for the next several years. We believe our position in General Electric delivered strong results mainly because of the company’s efforts to restructure its business, which could allow the company to become even more focused around its leading industrial segments. Although the Fund’s industrials sector exposure benefited overall results, a position in multi-industry conglomerate United Technologies hindered sector performance. Our industrials weighting grew as the year progressed due to strong performance and the addition of several new investments made later in the Fund’s fiscal year as fears of slower global economic activity created opportunities we considered compelling.
In health care, pharmaceutical giants Eli Lilly & Co. and Pfizer continued to benefit from new drug development prospects, and their results aided Fund performance. Conversely, Merck & Co. and Sanofi had disappointing results.
Within fixed income, high yield corporate bonds had negative returns as yield spreads over Treasuries widened during the period. This widening was most pronounced in the energy and materials sectors, but growing investor concerns about corporate credit quality in general was evident across most sectors. Despite the negative impact on returns during the reporting period, in our view, the spread widening created opportunities
| | | | |
| Top Five Equity Holdings | | | |
| 12/31/15 | | | |
Company
Sector/Industry | | % of Total
Net Assets | |
Royal Dutch Shell PLC, A, ADR (U.K.) Energy | | | 2.4% | |
General Electric Co. Industrials | | | 2.1% | |
Bank of America Corp. Financials | | | 1.8% | |
Target Corp. Consumer Discretionary | | | 1.7% | |
Chevron Corp. Energy | | | 1.6% | |
The dollar value, number of shares or principal amount, and names of all portfolio holdings are listed in the Fund’s Statement of Investments (SOI).
for us to selectively increase our exposure to certain high yield bond issuers at attractive valuations.
Energy was a primary detractor among fixed income sectors driven largely by declines in the securities of independent exploration and production companies. Notable laggards included SandRidge Energy, Energy XXI Gulf Coast, Halcon Resources, Linn Energy and Chesapeake Energy, all of which are North American producers of oil and gas. Commodity price declines raised investor concerns over these companies’ ability to manage cash flows and ultimately meet debt obligations as they become due. During the period we consolidated positions, eliminating several holdings that we believed remained challenged in favor of others that, in our view, appeared to have a clearer path to navigating the industry downturn and restructuring balance sheets through effective capital structure management. The debt securities of oilfield services and equipment companies, particularly offshore drilling contractors, including Ocean Rig UDW,3 Hercules Offshore3 and Vantage Drilling (Offshore Group Investment),3 also lost value as upstream spending expectations fell and industry supply expanded.
The communications sector also suppressed our fixed income returns during the period.4 iHeartCommunications detracted from Fund performance due to investor concerns over its currently high level of debt and the company’s ability to deleverage over time. The company continued to deliver solid operational results and took advantage of its large platform to gain market share from the competition. Hurting our Sprint position were investor concerns regarding the company’s ability to maintain its share of new subscribers and manage its balance
4. Communications holdings are in consumer discretionary and telecommunication services in the fixed income section of the SOI.
FRANKLIN INCOME VIP FUND
sheet during a period of slowing industry growth.5 We continue to monitor the progress of Sprint’s new management team as they work closely with Softbank to improve operations and seek to position the company for future growth.
Another major fixed income detractor during the period was the basic industry sector.6 Despite being a relatively small allocation within the Fund, our holdings in coal mining companies substantially weighed on performance due to a confluence of factors including falling prices, lower volumes and concerns regarding the continuing decline of coal as a fuel source. The coal industry’s cash flow generation was far below expectations and led to financial distress for many of the top producers. We significantly reduced our overall exposure to the coal industry, and eliminated our positions in notable detractors including Peabody Energy,3 Arch Coal secured bonds,3 Alpha Natural Resources3 and Walter Energy.3
In contrast, our holdings in fixed income securities of large banks such as Citigroup, JPMorgan Chase & Co. and Wells Fargo & Co. contributed to Fund performance.7 These firms continued to drive down costs, improve their capital bases and were widely viewed to be beneficiaries of rising interest rates.
The information technology sector also helped the Fund during the period with solid performance from some of our largest holdings. First Data shares rose as the company completed an initial public offering and continued to strengthen its balance sheet. Freescale Semiconductor3 also made gains as it continued to improve its cash flow and strengthen its balance sheet. Both companies greatly benefited from refinancing higher cost debt with new debt at much lower interest rates, which had a significant positive impact on cash flow.
| | | | |
Top Five Fixed Income and
Senior Floating Rate Interests Holdings* | | | |
| 12/31/15 | | | |
Issuer
Sector/Industry | | % of Total
Net Assets | |
Citigroup Inc. Financials | | | 1.3% | |
iHeartCommunications Inc. Consumer Discretionary | | | 1.2% | |
JPMorgan Chase & Co. Financials | | | 1.1% | |
HCA Inc. Health Care | | | 0.9% | |
First Data Corp. Information Technology | | | 0.8% | |
*Does not include convertible bonds.
The dollar value, number of shares or principal amount, and names of all portfolio holdings are listed in the Fund’s Statement of Investments (SOI).
Thank you for your participation in Franklin Income VIP Fund. We look forward to serving your future investment needs.
The foregoing information reflects our analysis, opinions and portfolio holdings as of December 31, 2015, the end of the reporting period. The way we implement our main investment strategies and the resulting portfolio holdings may change depending on factors such as market and economic conditions. These opinions may not be relied upon as investment advice or an offer for a particular security. The information is not a complete analysis of every aspect of any market, country, industry, security or the Fund. Statements of fact are from sources considered reliable, but the investment manager makes no representation or warranty as to their completeness or accuracy. Although historical performance is no guarantee of future results, these insights may help you understand our investment management philosophy.
5. Includes Sprint Communications and Sprint Corp. bonds.
6. Basic industry holdings are in materials in the fixed income section of the SOI.
7. Banking holdings are in financials in the fixed income section of the SOI.
FRANKLIN INCOME VIP FUND
Class 4 Fund Expenses
As an investor in a variable insurance contract (Contract) that indirectly provides for investment in an underlying mutual fund, you can incur transaction and/or ongoing expenses at both the Fund level and the Contract level.
| • | | Transaction expenses can include sales charges (loads) on purchases, redemption fees, surrender fees, transfer fees and premium taxes. |
| • | | Ongoing expenses can include management fees, distribution and service (12b-1) fees, contract fees, annual maintenance fees, mortality and expense risk fees and other fees and expenses. All mutual funds and Contracts have some types of ongoing expenses. |
The expenses shown in the table are meant to highlight ongoing expenses at the Fund level only and do not include ongoing expenses at the Contract level, or transaction expenses at either the Fund or Contract level. While the Fund does not have transaction expenses, if the transaction and ongoing expenses at the Contract level were included, the expenses shown would be higher. You should consult your Contract prospectus or disclosure document for more information.
The table shows Fund-level ongoing expenses and can help you understand these expenses and compare them with those of other mutual funds offered through the Contract. The table assumes a $1,000 investment held for the six months indicated. Please refer to the Fund prospectus for additional information on operating expenses.
Actual Fund Expenses
The first line (Actual) of the table provides actual account values and expenses. The “Ending Account Value” is derived from the Fund’s actual return, which includes the effect of ongoing Fund expenses, but does not include the effect of ongoing Contract expenses.
You can estimate the Fund-level expenses you incurred during the period by following these steps. Of course, your account value and expenses will differ from those in this illustration:
| 1. | Divide your account value by $1,000. |
If an account had an $8,600 value, then $8,600 ÷ $1,000 = 8.6.
| 2. | Multiply the result by the number under the heading “Fund-Level Expenses Incurred During Period.” |
If Fund-Level Expenses Incurred During Period were $7.50, then 8.6 × $7.50 = $64.50.
In this illustration, the estimated expenses incurred this period at the Fund level are $64.50.
Hypothetical Example for Comparison with Other Mutual Funds
Information in the second line (Hypothetical) of the table can help you compare ongoing expenses of the Fund with those of other mutual funds offered through the Contract. This information may not be used to estimate the actual ending account balance or expenses you incurred during the period. The hypothetical “Ending Account Value” is based on the Fund’s actual expense ratio and an assumed 5% annual rate of return before expenses, which does not represent the Fund’s actual return. The figure under the heading “Fund-Level Expenses Incurred During Period” shows the hypothetical expenses your account would have incurred under this scenario. You can compare this figure with the 5% hypothetical examples that appear in shareholder reports of other funds offered through a Contract.
| | | | | | | | | | | | |
| Class 4 | | Beginning Account Value 7/1/15 | | | Ending Account
Value 12/31/15 | | | Fund-Level Expenses
Incurred During Period* 7/1/15–12/31/15 | |
Actual | | $ | 1,000 | | | $ | 939.70 | | | $ | 3.96 | |
Hypothetical (5% return before expenses) | | $ | 1,000 | | | $ | 1,021.12 | | | $ | 4.13 | |
*Expenses are calculated using the most recent six-month annualized expense ratio, net of expense waivers, for the Fund’s Class 4 shares (0.81%), which does not include any ongoing expenses of the Contract for which the Fund is an investment option, multiplied by the average account value over the period, multiplied by 184/365 to reflect the one-half year period.
FRANKLIN TEMPLETON VARIABLE INSURANCE PRODUCTS TRUST
Financial Highlights
Franklin Income VIP Fund
| | | | | | | | | | | | | | | | | | | | |
| | | Year Ended December 31, | |
| | | 2015 | | | 2014 | | | 2013 | | | 2012 | | | 2011 | |
| Class 1 | | | | | | | | | | | | | | | | | | | | |
Per share operating performance
(for a share outstanding throughout the year) | | | | | | | | | | | | | | | | | | | | |
| | | | | |
Net asset value, beginning of year | | | $16.48 | | | | $16.53 | | | | $15.47 | | | | $14.68 | | | | $15.16 | |
| | | | |
| | | | | |
| Income from investment operationsa: | | | | | | | | | | | | | | | | | | | | |
| | | | | |
Net investment incomeb | | | 0.71 | | | | 0.72 | | | | 0.81 | | | | 0.91 | | | | 0.96 | |
| | | | | |
Net realized and unrealized gains (losses) | | | (1.78 | ) | | | 0.11 | | | | 1.31 | | | | 0.90 | | | | (0.54 | ) |
| | | | |
Total from investment operations | | | (1.07 | ) | | | 0.83 | | | | 2.12 | | | | 1.81 | | | | 0.42 | |
| | | | |
Less distributions from net investment income | | | (0.77 | ) | | | (0.88 | ) | | | (1.06 | ) | | | (1.02 | ) | | | (0.90 | ) |
| | | | |
Net asset value, end of year | | | $14.64 | | | | $16.48 | | | | $16.53 | | | | $15.47 | | | | $14.68 | |
| | | | |
| | | | | |
Total returnc | | | (6.84)% | | | | 4.92% | | | | 14.18% | | | | 12.91% | | | | 2.71% | |
| | | | | |
| Ratios to average net assets | | | | | | | | | | | | | | | | | | | | |
| | | | | |
Expenses | | | 0.46% | d,e | | | 0.47% | d | | | 0.47% | d | | | 0.47% | | | | 0.47% | d |
| | | | | |
Net investment income | | | 4.47% | | | | 4.26% | | | | 5.07% | | | | 6.03% | | | | 6.35% | |
| | | | | |
| Supplemental data | | | | | | | | | | | | | | | | | | | | |
| | | | | |
Net assets, end of year (000’s) | | | $604,228 | | | | $714,664 | | | | $695,004 | | | | $584,391 | | | | $1,300,935 | |
| | | | | |
Portfolio turnover rate | | | 31.53% | | | | 24.77% | | | | 21.71% | | | | 26.66% | f | | | 28.65% | |
aThe amount shown for a share outstanding throughout the period may not correlate with the Statement of Operations for the period due to the timing of sales and repurchases of the Fund’s shares in relation to income earned and/or fluctuating fair value of the investments of the Fund.
bBased on average daily shares outstanding.
cTotal return does not include fees, charges or expenses imposed by the variable annuity and life insurance contracts for which Franklin Templeton Variable Insurance Products Trust serves as an underlying investment vehicle.
dBenefit of expense reduction rounds to less than 0.01%.
eBenefit of waiver and payments by affiliates rounds to less than 0.01%.
fExcludes the value of portfolio securities delivered as a result of a redemption in-kind.
| | | | | | |
| | | The accompanying notes are an integral part of these financial statements. | Annual Report | | | FI-7 | |
FRANKLIN TEMPLETON VARIABLE INSURANCE PRODUCTS TRUST
FINANCIAL HIGHLIGHTS
Franklin Income VIP Fund (continued)
| | | | | | | | | | | | | | | | | | | | |
| | | Year Ended December 31, | |
| | | 2015 | | | 2014 | | | 2013 | | | 2012 | | | 2011 | |
| Class 2 | | | | | | | | | | | | | | | | | | | | |
Per share operating performance (for a share outstanding throughout the year) | | | | | | | | | | | | | | | | | | | | |
| | | | | |
Net asset value, beginning of year | | | $16.00 | | | | $16.07 | | | | $15.07 | | | | $14.32 | | | | $14.82 | |
| | | | |
| | | | | |
| Income from investment operationsa: | | | | | | | | | | | | | | | | | | | | |
| | | | | |
Net investment incomeb | | | 0.65 | | | | 0.66 | | | | 0.75 | | | | 0.85 | | | | 0.90 | |
| | | | | |
Net realized and unrealized gains (losses) | | | (1.73 | ) | | | 0.11 | | | | 1.27 | | | | 0.88 | | | | (0.53 | ) |
| | | | |
Total from investment operations | | | (1.08 | ) | | | 0.77 | | | | 2.02 | | | | 1.73 | | | | 0.37 | |
| | | | |
Less distributions from net investment income | | | (0.72 | ) | | | (0.84 | ) | | | (1.02 | ) | | | (0.98 | ) | | | (0.87 | ) |
| | | | |
Net asset value, end of year | | | $14.20 | | | | $16.00 | | | | $16.07 | | | | $15.07 | | | | $14.32 | |
| | | | |
| | | | | |
Total returnc | | | (7.05)% | | | | 4.62% | | | | 13.94% | | | | 12.65% | | | | 2.38% | |
| | | | | |
| Ratios to average net assets | | | | | | | | | | | | | | | | | | | | |
| | | | | |
Expenses | | | 0.71% | d,e | | | 0.72% | d | | | 0.72% | d | | | 0.72% | | | | 0.72% | d |
| | | | | |
Net investment income | | | 4.22% | | | | 4.01% | | | | 4.82% | | | | 5.78% | | | | 6.10% | |
| | | | | |
| Supplemental data | | | | | | | | | | | | | | | | | | | | |
| | | | | |
Net assets, end of year (000’s) | | | $4,907,599 | | | | $6,022,804 | | | | $6,188,045 | | | | $6,182,997 | | | | $5,915,637 | |
| | | | | |
Portfolio turnover rate | | | 31.53% | | | | 24.77% | | | | 21.71% | | | | 26.66% | f | | | 28.65% | |
aThe amount shown for a share outstanding throughout the period may not correlate with the Statement of Operations for the period due to the timing of sales and repurchases of the Fund’s shares in relation to income earned and/or fluctuating fair value of the investments of the Fund.
bBased on average daily shares outstanding.
cTotal return does not include fees, charges or expenses imposed by the variable annuity and life insurance contracts for which Franklin Templeton Variable Insurance Products Trust serves as an underlying investment vehicle.
dBenefit of expense reduction rounds to less than 0.01%.
eBenefit of waiver and payments by affiliates rounds to less than 0.01%.
fExcludes the value of portfolio securities delivered as a result of a redemption in-kind.
| | | | | | |
| | FI-8 | | | Annual Report | The accompanying notes are an integral part of these financial statements. | | |
FRANKLIN TEMPLETON VARIABLE INSURANCE PRODUCTS TRUST
FINANCIAL HIGHLIGHTS
Franklin Income VIP Fund (continued)
| | | | | | | | | | | | | | | | | | | | |
| | | Year Ended December 31, | |
| | | 2015 | | | 2014 | | | 2013 | | | 2012 | | | 2011 | |
| Class 4 | | | | | | | | | | | | | | | | | | | | |
Per share operating performance
(for a share outstanding throughout the year) | | | | | | | | | | | | | | | | | | | | |
| | | | | |
Net asset value, beginning of year | | | $16.31 | | | | $16.36 | | | | $15.32 | | | | $14.54 | | | | $15.04 | |
| | | | |
| | | | | |
| Income from investment operationsa: | | | | | | | | | | | | | | | | | | | | |
| | | | | |
Net investment incomeb | | | 0.65 | | | | 0.66 | | | | 0.75 | | | | 0.85 | | | | 0.90 | |
| | | | | |
Net realized and unrealized gains (losses) | | | (1.76 | ) | | | 0.11 | | | | 1.30 | | | | 0.90 | | | | (0.54 | ) |
| | | | |
Total from investment operations | | | (1.11 | ) | | | 0.77 | | | | 2.05 | | | | 1.75 | | | | 0.36 | |
| | | | |
Less distributions from net investment income | | | (0.71 | ) | | | (0.82 | ) | | | (1.01 | ) | | | (0.97 | ) | | | (0.86 | ) |
| | | | |
Net asset value, end of year | | | $14.49 | | | | $16.31 | | | | $16.36 | | | | $15.32 | | | | $14.54 | |
| | | | |
| | | | | |
Total returnc | | | (7.15)% | | | | 4.52% | | | | 13.85% | | | | 12.56% | | | | 2.29% | |
| | | | | |
| Ratios to average net assets | | | | | | | | | | | | | | | | | | | | |
| | | | | |
Expenses | | | 0.81% | d,e | | | 0.82% | d | | | 0.82% | d | | | 0.82% | | | | 0.82% | d |
| | | | | |
Net investment income | | | 4.12% | | | | 3.91% | | | | 4.72% | | | | 5.68% | | | | 6.00% | |
| | | | | |
| Supplemental data | | | | | | | | | | | | | | | | | | | | |
| | | | | |
Net assets, end of year (000’s) | | | $306,023 | | | | $378,545 | | | | $397,652 | | | | $436,405 | | | | $431,435 | |
| | | | | |
Portfolio turnover rate | | | 31.53% | | | | 24.77% | | | | 21.71% | | | | 26.66% | f | | | 28.65% | |
aThe amount shown for a share outstanding throughout the period may not correlate with the Statement of Operations for the period due to the timing of sales and repurchases of the Fund’s shares in relation to income earned and/or fluctuating fair value of the investments of the Fund.
bBased on average daily shares outstanding.
cTotal return does not include fees, charges or expenses imposed by the variable annuity and life insurance contracts for which Franklin Templeton Variable Insurance Products Trust serves as an underlying investment vehicle.
dBenefit of expense reduction rounds to less than 0.01%.
eBenefit of waiver and payments by affiliates rounds to less than 0.01%.
fExcludes the value of portfolio securities delivered as a result of a redemption in-kind.
| | | | | | |
| | | The accompanying notes are an integral part of these financial statements. | Annual Report | | | FI-9 | |
FRANKLIN TEMPLETON VARIABLE INSURANCE PRODUCTS TRUST
Statement of Investments, December 31, 2015
| | | | | | | | | | | | | | |
| Franklin Income VIP Fund | |
| | | | | Country | | | Shares/Warrants | | | Value | |
| | Common Stocks and Other Equity Interests 56.8% | | | | | | | | | | | | |
| | Consumer Discretionary 3.6% | | | | | | | | | | | | |
| | Ford Motor Co. | | | United States | | | | 4,450,000 | | | $ | 62,700,500 | |
| | General Motors Co. | | | United States | | | | 1,224,100 | | | | 41,631,641 | |
| | Nordstrom Inc. | | | United States | | | | 200,000 | | | | 9,962,000 | |
| | Target Corp. | | | United States | | | | 1,336,100 | | | | 97,014,221 | |
| | | | | | | | | | | | | | |
| | | | | | | | | | | | | 211,308,362 | |
| | | | | | | | | | | | | | |
| | Consumer Staples 1.7% | | | | | | | | | | | | |
| | The Coca-Cola Co. | | | United States | | | | 550,000 | | | | 23,628,000 | |
| | PepsiCo Inc. | | | United States | | | | 584,000 | | | | 58,353,280 | |
| | Whole Foods Market Inc. | | | United States | | | | 484,069 | | | | 16,216,311 | |
| | | | | | | | | | | | | | |
| | | | | | | | | | | | | 98,197,591 | |
| | | | | | | | | | | | | | |
| | Energy 9.0% | | | | | | | | | | | | |
| | Anadarko Petroleum Corp. | | | United States | | | | 470,000 | | | | 22,832,600 | |
| | BP PLC, ADR | | | United Kingdom | | | | 1,800,000 | | | | 56,268,000 | |
| | Chevron Corp. | | | United States | | | | 1,055,000 | | | | 94,907,800 | |
| | Devon Energy Corp. | | | United States | | | | 650,000 | | | | 20,800,000 | |
| a | | Energy XXI Ltd. | | | United States | | | | 1,000,000 | | | | 1,010,000 | |
| | Exxon Mobil Corp. | | | United States | | | | 848,000 | | | | 66,101,600 | |
| | Halliburton Co. | | | United States | | | | 750,000 | | | | 25,530,000 | |
| | Occidental Petroleum Corp. | | | United States | | | | 436,000 | | | | 29,477,960 | |
| | Royal Dutch Shell PLC, A, ADR | | | United Kingdom | | | | 3,021,748 | | | | 138,365,841 | |
| | Spectra Energy Corp. | | | United States | | | | 600,000 | | | | 14,364,000 | |
| b | | Total SA, B, ADR | | | France | | | | 1,192,900 | | | | 53,620,855 | |
| | | | | | | | | | | | | | |
| | | | | | | | | | | | | 523,278,656 | |
| | | | | | | | | | | | | | |
| | Financials 3.8% | | | | | | | | | | | | |
| | Bank of America Corp. | | | United States | | | | 2,150,000 | | | | 36,184,500 | |
| | JPMorgan Chase & Co. | | | United States | | | | 485,100 | | | | 32,031,153 | |
| | MetLife Inc. | | | United States | | | | 1,145,108 | | | | 55,205,657 | |
| | The Toronto-Dominion Bank | | | Canada | | | | 240,000 | | | | 9,410,540 | |
| | U.S. Bancorp | | | United States | | | | 750,000 | | | | 32,002,500 | |
| | Wells Fargo & Co. | | | United States | | | | 1,000,000 | | | | 54,360,000 | |
| | | | | | | | | | | | | | |
| | | | | | | | | | | | | 219,194,350 | |
| | | | | | | | | | | | | | |
| | Health Care 7.2% | | | | | | | | | | | | |
| | AstraZeneca PLC | | | United Kingdom | | | | 524,400 | | | | 35,682,745 | |
| | Bristol-Myers Squibb Co. | | | United States | | | | 344,396 | | | | 23,691,001 | |
| | Eli Lilly & Co. | | | United States | | | | 764,800 | | | | 64,442,048 | |
| | Johnson & Johnson | | | United States | | | | 712,800 | | | | 73,218,816 | |
| | Merck & Co. Inc. | | | United States | | | | 1,100,000 | | | | 58,102,000 | |
| | Pfizer Inc. | | | United States | | | | 2,638,975 | | | | 85,186,113 | |
| | Roche Holding AG | | | Switzerland | | | | 116,500 | | | | 32,136,327 | |
| | Sanofi, ADR | | | France | | | | 1,108,292 | | | | 47,268,654 | |
| | | | | | | | | | | | | | |
| | | | | | | | | | | | | 419,727,704 | |
| | | | | | | | | | | | | | |
| | Industrials 8.1% | | | | | | | | | | | | |
| | The Boeing Co. | | | United States | | | | 231,800 | | | | 33,515,962 | |
| a | | CEVA Holdings LLC | | | United Kingdom | | | | 13,012 | | | | 5,855,517 | |
| | Deere & Co. | | | United States | | | | 350,000 | | | | 26,694,500 | |
| | General Electric Co. | | | United States | | | | 3,976,200 | | | | 123,858,630 | |
| | Illinois Tool Works Inc. | | | United States | | | | 100,000 | | | | 9,268,000 | |
| | Lockheed Martin Corp. | | | United States | | | | 253,200 | | | | 54,982,380 | |
FRANKLIN TEMPLETON VARIABLE INSURANCE PRODUCTS TRUST
STATEMENT OF INVESTMENTS
Franklin Income VIP Fund (continued)
| | | | | | | | | | | | | | |
| | | | | Country | | | Shares/Warrants | | | Value | |
| | Common Stocks and Other Equity Interests (continued) | | | | | | | | | | | | |
| | Industrials (continued) | | | | | | | | | | | | |
| | Raytheon Co. | | | United States | | | | 480,000 | | | $ | 59,774,400 | |
| | Republic Services Inc. | | | United States | | | | 527,300 | | | | 23,195,927 | |
| | Union Pacific Corp. | | | United States | | | | 375,000 | | | | 29,325,000 | |
| | United Technologies Corp. | | | United States | | | | 550,000 | | | | 52,838,500 | |
| | Waste Management Inc. | | | United States | | | | 928,200 | | | | 49,538,034 | |
| | | | | | | | | | | | | | |
| | | | | | | | | | | | | 468,846,850 | |
| | | | | | | | | | | | | | |
| | Information Technology 6.0% | | | | | | | | | | | | |
| | Apple Inc. | | | United States | | | | 500,000 | | | | 52,630,000 | |
| | Cisco Systems Inc. | | | United States | | | | 1,400,000 | | | | 38,017,000 | |
| a,c | | First Data Holdings Inc., B | | | United States | | | | 1,559,551 | | | | 22,485,605 | |
| | Intel Corp. | | | United States | | | | 2,545,000 | | | | 87,675,250 | |
| | Microsoft Corp. | | | United States | | | | 1,033,500 | | | | 57,338,580 | |
| | Oracle Corp. | | | United States | | | | 400,000 | | | | 14,612,000 | |
| | QUALCOMM Inc. | | | United States | | | | 550,000 | | | | 27,491,750 | |
| | Texas Instruments Inc. | | | United States | | | | 924,800 | | | | 50,688,288 | |
| | | | | | | | | | | | | | |
| | | | | | | | | | | | | 350,938,473 | |
| | | | | | | | | | | | | | |
| | Materials 5.9% | | | | | | | | | | | | |
| | Agrium Inc. | | | Canada | | | | 500,000 | | | | 44,670,000 | |
| | BASF SE | | | Germany | | | | 387,500 | | | | 29,767,595 | |
| | BHP Billiton PLC | | | Australia | | | | 2,784,192 | | | | 31,188,573 | |
| | The Dow Chemical Co. | | | United States | | | | 1,525,700 | | | | 78,543,036 | |
| | E. I. du Pont de Nemours and Co. | | | United States | | | | 1,000,000 | | | | 66,600,000 | |
| | The Mosaic Co. | | | United States | | | | 1,000,000 | | | | 27,590,000 | |
| | Praxair Inc. | | | United States | | | | 110,000 | | | | 11,264,000 | |
| | Rio Tinto PLC, ADR | | | United Kingdom | | | | 1,845,100 | | | | 53,729,312 | |
| | | | | | | | | | | | | | |
| | | | | | | | | | | | | 343,352,516 | |
| | | | | | | | | | | | | | |
| | Telecommunication Services 2.5% | | | | | | | | | | | | |
| | AT&T Inc. | | | United States | | | | 1,121,000 | | | | 38,573,610 | |
| | BCE Inc. | | | Canada | | | | 466,000 | | | | 18,009,369 | |
| | Telstra Corp. Ltd. | | | Australia | | | | 3,446,331 | | | | 14,084,758 | |
| | Verizon Communications Inc. | | | United States | | | | 1,400,000 | | | | 64,708,000 | |
| | Vodafone Group PLC | | | United Kingdom | | | | 2,115,279 | | | | 6,890,372 | |
| | | | | | | | | | | | | | |
| | | | | | | | | | | | | 142,266,109 | |
| | | | | | | | | | | | | | |
| | Utilities 9.0% | | | | | | | | | | | | |
| | American Electric Power Co. Inc. | | | United States | | | | 400,000 | | | | 23,308,000 | |
| | Dominion Resources Inc. | | | United States | | | | 750,000 | | | | 50,730,000 | |
| | Duke Energy Corp. | | | United States | | | | 802,500 | | | | 57,290,475 | |
| a | | Dynegy Inc., wts., 10/02/17 | | | United States | | | | 242,666 | | | | 114,053 | |
| | Exelon Corp. | | | United States | | | | 1,377,200 | | | | 38,244,844 | |
| | NextEra Energy Inc. | | | United States | | | | 303,544 | | | | 31,535,186 | |
| | PG&E Corp. | | | United States | | | | 1,435,300 | | | | 76,343,607 | |
| | Pinnacle West Capital Corp. | | | United States | | | | 260,500 | | | | 16,797,040 | |
| | PPL Corp. | | | United States | | | | 935,700 | | | | 31,935,441 | |
| | Public Service Enterprise Group Inc. | | | United States | | | | 923,500 | | | | 35,730,215 | |
| | Sempra Energy | | | United States | | | | 368,300 | | | | 34,623,883 | |
| | The Southern Co. | | | United States | | | | 1,746,800 | | | | 81,732,772 | |
FRANKLIN TEMPLETON VARIABLE INSURANCE PRODUCTS TRUST
STATEMENT OF INVESTMENTS
Franklin Income VIP Fund (continued)
| | | | | | | | | | | | | | |
| | | | | Country | | | Shares/Warrants | | | Value | |
| | Common Stocks and Other Equity Interests (continued) | | | | | | | | | | | | |
| | Utilities (continued) | | | | | | | | | | | | |
| | Xcel Energy Inc. | | | United States | | | | 1,310,964 | | | $ | 47,076,717 | |
| | | | | | | | | | | | | | |
| | | | | | | | | | | | | 525,462,233 | |
| | | | | | | | | | | | | | |
| | | | |
| | Total Common Stocks and Other Equity Interests (Cost $2,939,021,326) | | | | | | | | | | | 3,302,572,844 | |
| | | | | | | | | | | | | | |
| d | | Equity-Linked Securities 2.3% | | | | | | | | | | | | |
| | Consumer Discretionary 1.0% | | | | | | | | | | | | |
| e | | Citigroup Global Markets Inc. into Ford Motor Co., 7.00%, 144A | | | United States | | | | 1,700,000 | | | | 24,421,180 | |
| e | | Deutsche Bank AG/London into General Motors Co., 8.00%, 144A | | | United States | | | | 500,000 | | | | 17,172,400 | |
| e | | The Goldman Sachs Group Inc. into General Motors Co., 6.50%, 144A | | | United States | | | | 500,000 | | | | 17,199,300 | |
| | | | | | | | | | | | | | |
| | | | | | | | | | | | | 58,792,880 | |
| | | | | | | | | | | | | | |
| | Industrials 0.5% | | | | | | | | | | | | |
| e | | The Goldman Sachs Group Inc. into General Electric Co., 5.50%, 144A | | | United States | | | | 1,000,000 | | | | 29,531,600 | |
| | | | | | | | | | | | | | |
| | Information Technology 0.8% | | | | | | | | | | | | |
| e | | Citigroup Inc. into Apple Inc., 7.00%, 144A | | | United States | | | | 415,000 | | | | 44,325,942 | |
| | | | | | | | | | | | | | |
| | | | |
| | Total Equity-Linked Securities (Cost $141,933,987) | | | | | | | | | | | 132,650,422 | |
| | | | | | | | | | | | | | |
| | Convertible Preferred Stocks 3.4% | | | | | | | | | | | | |
| | Consumer Discretionary 0.2% | | | | | | | | | | | | |
| | Fiat Chrysler Automobiles NV, 7.875%, cvt. pfd. | | | United Kingdom | | | | 85,000 | | | | 10,034,675 | |
| | | | | | | | | | | | | | |
| | Energy 0.0%† | | | | | | | | | | | | |
| | Sanchez Energy Corp., 6.50%, cvt. pfd., B | | | United States | | | | 200,000 | | | | 2,114,000 | |
| | | | | | | | | | | | | | |
| | Financials 1.8% | | | | | | | | | | | | |
| | Bank of America Corp., 7.25%, cvt. pfd., L | | | United States | | | | 64,600 | | | | 70,625,242 | |
| | FelCor Lodging Trust Inc., 7.80%, cvt. pfd., A | | | United States | | | | 167,325 | | | | 4,208,224 | |
| a | | FNMA, 5.375%, cvt. pfd. | | | United States | | | | 475 | | | | 4,987,500 | |
| | Wells Fargo & Co., 7.50%, cvt. pfd., A | | | United States | | | | 20,000 | | | | 23,259,700 | |
| | | | | | | | | | | | | | |
| | | | | | | | | | | | | 103,080,666 | |
| | | | | | | | | | | | | | |
| | Health Care 0.1% | | | | | | | | | | | | |
| | Allergan PLC, 5.50%, cvt. pfd. | | | United States | | | | 7,500 | | | | 7,726,350 | |
| | | | | | | | | | | | | | |
| | Industrials 0.1% | | | | | | | | | | | | |
| a | | CEVA Holdings LLC, cvt. pfd., A-1 | | | United Kingdom | | | | 397 | | | | 248,125 | |
| a | | CEVA Holdings LLC, cvt. pfd., A-2 | | | United Kingdom | | | | 14,711 | | | | 6,619,905 | |
| | | | | | | | | | | | | | |
| | | | | | | | | | | | | 6,868,030 | |
| | | | | | | | | | | | | | |
| | Materials 0.3% | | | | | | | | | | | | |
| | Alcoa Inc., 5.375%, cvt. pfd. | | | United States | | | | 500,000 | | | | 16,655,000 | |
| | | | | | | | | | | | | | |
| | Utilities 0.9% | | | | | | | | | | | | |
| | Dominion Resources Inc., 6.125%, cvt. pfd., A | | | United States | | | | 145,000 | | | | 7,696,600 | |
| | Dominion Resources Inc., 6.375%, cvt. pfd., A | | | United States | | | | 162,000 | | | | 7,788,960 | |
| | Dominion Resources Inc., 6.00%, cvt. pfd., B | | | United States | | | | 145,000 | | | | 7,782,150 | |
| | NextEra Energy Inc., 6.371%, cvt. pfd. | | | United States | | | | 500,000 | | | | 26,415,000 | |
| | | | | | | | | | | | | | |
| | | | | | | | | | | | | 49,682,710 | |
| | | | | | | | | | | | | | |
| | | | |
| | Total Convertible Preferred Stocks (Cost $230,969,053) | | | | | | | | | | | 196,161,431 | |
| | | | | | | | | | | | | | |
FRANKLIN TEMPLETON VARIABLE INSURANCE PRODUCTS TRUST
STATEMENT OF INVESTMENTS
Franklin Income VIP Fund (continued)
| | | | | | | | | | | | | | |
| | | | | Country | | | Shares/Warrants | | | Value | |
| | Preferred Stocks (Cost $8,750,000) 0.1% | | | | | | | | | | | | |
| | Financials 0.1% | | | | | | | | | | | | |
| | Morgan Stanley, 6.375%, pfd., I | | | United States | | | | 350,000 | | | $ | 9,289,000 | |
| | | | | | | | | | | | | | |
| | | | |
| | | | | | | | Principal Amount* | | | | |
| | Convertible Bonds (Cost $15,000,000) 0.1% | | | | | | | | | | | | |
| | Energy 0.1% | | | | | | | | | | | | |
| | Cobalt International Energy Inc., cvt., senior bond, 3.125%, 5/15/24 | | | United States | | | | 15,000,000 | | | | 7,987,500 | |
| | | | | | | | | | | | | | |
| | Corporate Bonds 21.3% | | | | | | | | | | | | |
| | Consumer Discretionary 2.8% | | | | | | | | | | | | |
| e | | Altice Luxembourg SA, senior secured note, 144A, 7.75%, 5/15/22 | | | Luxembourg | | | | 3,000,000 | | | | 2,705,625 | |
| e | | Argos Merger Sub Inc., senior note, 144A, 7.125%, 3/15/23 | | | United States | | | | 3,000,000 | | | | 2,982,000 | |
| | CCO Holdings LLC/CCO Holdings Capital Corp., senior bond, | | | | | | | | | | | | |
| | 5.25%, 9/30/22 | | | United States | | | | 2,700,000 | | | | 2,733,750 | |
| | 5.125%, 2/15/23 | | | United States | | | | 10,000,000 | | | | 10,037,500 | |
| b | | Cumulus Media Holdings Inc., senior note, 7.75%, 5/01/19 | | | United States | | | | 10,000,000 | | | | 3,425,000 | |
| | DISH DBS Corp., | | | | | | | | | | | | |
| | senior bond, 5.00%, 3/15/23 | | | United States | | | | 20,000,000 | | | | 17,400,000 | |
| | senior note, 5.875%, 7/15/22 | | | United States | | | | 2,000,000 | | | | 1,870,000 | |
| | senior note, 5.875%, 11/15/24 | | | United States | | | | 8,300,000 | | | | 7,407,750 | |
| | Dollar General Corp., senior bond, 3.25%, 4/15/23 | | | United States | | | | 5,000,000 | | | | 4,769,630 | |
| | Fiat Chrysler Automobiles NV, senior note, 5.25%, 4/15/23 | | | United Kingdom | | | | 11,300,000 | | | | 11,201,125 | |
| | iHeartCommunications Inc., | | | | | | | | | | | | |
| | senior secured bond, first lien, 9.00%, 3/01/21 | | | United States | | | | 19,400,000 | | | | 13,604,250 | |
| | senior secured note, first lien, 9.00%, 12/15/19 | | | United States | | | | 18,000,000 | | | | 13,387,500 | |
| | senior secured note, first lien, 9.00%, 9/15/22 | | | United States | | | | 14,600,000 | | | | 10,128,750 | |
| e | | International Game Technology PLC, | | | | | | | | | | | | |
| | senior secured bond, 144A, 6.50%, 2/15/25 | | | United States | | | | 8,500,000 | | | | 7,522,500 | |
| | senior secured note, 144A, 6.25%, 2/15/22 | | | United States | | | | 8,500,000 | | | | 8,016,563 | |
| | KB Home, senior bond, 7.50%, 9/15/22 | | | United States | | | | 6,500,000 | | | | 6,500,000 | |
| | MGM Resorts International, senior note, 6.75%, 10/01/20 | | | United States | | | | 5,500,000 | | | | 5,678,750 | |
| e | | Sirius XM Radio Inc., senior bond, 144A, 6.00%, 7/15/24 | | | United States | | | | 10,000,000 | | | | 10,475,000 | |
| e | | Univision Communications Inc., senior secured note, first lien, 144A, 5.125%, | | | | | | | | | | | | |
| | 5/15/23 | | | United States | | | | 10,000,000 | | | | 9,675,000 | |
| | 2/15/25 | | | United States | | | | 7,140,000 | | | | 6,800,850 | |
| e | | Virgin Media Secured Finance PLC, senior secured bond, first lien, 144A, 5.50%, 1/15/25 | | | United Kingdom | | | | 7,000,000 | | | | 7,008,750 | |
| | | | | | | | | | | | | | |
| | | | | | | | | | | | | 163,330,293 | |
| | | | | | | | | | | | | | |
| | Consumer Staples 0.4% | | | | | | | | | | | | |
| | Cott Beverages Inc., senior note, 5.375%, 7/01/22 | | | United States | | | | 2,500,000 | | | | 2,456,250 | |
| e | | JBS USA LLC/Finance Inc., senior note, 144A, 7.25%, 6/01/21 | | | United States | | | | 12,500,000 | | | | 12,468,750 | |
| | U.S. Foods Inc., 8.50%, 6/30/19 | | | United States | | | | 10,000,000 | | | | 10,325,000 | |
| | | | | | | | | | | | | | |
| | | | | | | | | | | | | 25,250,000 | |
| | | | | | | | | | | | | | |
| | Energy 3.4% | | | | | | | | | | | | |
| e,f | | American Energy-Woodford LLC/AEW Finance Corp., senior secured note, second lien, 144A, PIK, 12.00%, 12/30/20 | | | United States | | | | 3,710,000 | | | | 575,050 | |
| | Antero Resources Corp., senior note, 5.375%, 11/01/21 | | | United States | | | | 2,200,000 | | | | 1,771,000 | |
| | Bill Barrett Corp., senior note, | | | | | | | | | | | | |
| | 7.625%, 10/01/19 | | | United States | | | | 13,798,000 | | | | 9,727,590 | |
| | 7.00%, 10/15/22 | | | United States | | | | 14,646,000 | | | | 9,886,050 | |
FRANKLIN TEMPLETON VARIABLE INSURANCE PRODUCTS TRUST
STATEMENT OF INVESTMENTS
Franklin Income VIP Fund (continued)
| | | | | | | | | | | | | | |
| | | | | Country | | | Principal Amount* | | | Value | |
| | Corporate Bonds (continued) | | | | | | | | | | | | |
| | Energy (continued) | | | | | | | | | | | | |
| | California Resources Corp., | | | | | | | | | | | | |
| | e secured note, second lien, 144A, 8.00%, 12/15/22 | | | United States | | | | 12,938,000 | | | $ | 6,840,967 | |
| | senior bond, 6.00%, 11/15/24 | | | United States | | | | 1,264,000 | | | | 388,680 | |
| | senior note, 5.00%, 1/15/20 | | | United States | | | | 690,000 | | | | 249,263 | |
| | senior note, 5.50%, 9/15/21 | | | United States | | | | 2,872,000 | | | | 919,040 | |
| | CGG SA, senior note, 6.50%, 6/01/21 | | | France | | | | 11,100,000 | | | | 4,995,000 | |
| | CHC Helicopter SA, senior secured note, first lien, 9.25%, 10/15/20 | | | Canada | | | | 14,400,000 | | | | 6,984,000 | |
| | Chesapeake Energy Corp., | | | | | | | | | | | | |
| | e secured note, second lien, 144A, 8.00%, 12/15/22 | | | United States | | | | 8,550,000 | | | | 4,232,250 | |
| | senior note, 7.25%, 12/15/18 | | | United States | | | | 4,000,000 | | | | 1,600,000 | |
| | Denbury Resources Inc., senior note, 5.50%, 5/01/22 | | | United States | | | | 17,000,000 | | | | 5,728,660 | |
| | Energy XXI Gulf Coast Inc., | | | | | | | | | | | | |
| | senior note, 9.25%, 12/15/17 | | | United States | | | | 52,308,000 | | | | 14,907,780 | |
| | e senior secured note, second lien, 144A, 11.00%, 3/15/20 | | | United States | | | | 35,116,000 | | | | 12,378,390 | |
| e | | EnQuest PLC, senior note, 144A, 7.00%, 4/15/22 | | | United Kingdom | | | | 15,000,000 | | | | 5,306,250 | |
| | EPL Oil & Gas Inc., senior note, 8.25%, 2/15/18 | | | United States | | | | 21,067,000 | | | | 5,688,090 | |
| | Halcon Resources Corp., | | | | | | | | | | | | |
| | e secured note, second lien, 144A, 8.625%, 2/01/20 | | | United States | | | | 10,000,000 | | | | 6,937,500 | |
| | senior note, 9.75%, 7/15/20 | | | United States | | | | 5,000,000 | | | | 1,475,000 | |
| | e senior secured note, third lien, 144A, 13.00%, 2/15/22 | | | United States | | | | 35,000,000 | | | | 12,075,000 | |
| | Kinder Morgan Inc., | | | | | | | | | | | | |
| | senior note, MTN, 7.75%, 1/15/32 | | | United States | | | | 22,000,000 | | | | 20,969,938 | |
| | e senior secured bond, first lien, 144A, 5.625%, 11/15/23 | | | United States | | | | 7,000,000 | | | | 6,412,938 | |
| e | | Linn Energy LLC/Finance Corp., senior secured note, second lien, 144A, 12.00%, 12/15/20 | | | United States | | | | 21,493,000 | | | | 10,961,430 | |
| e | | NGPL PipeCo LLC, secured note, 144A, 7.119%, 12/15/17 | | | United States | | | | 3,750,000 | | | | 3,506,250 | |
| | Rex Energy Corp., senior note, 8.875%, 12/01/20 | | | United States | | | | 5,000,000 | | | | 1,125,000 | |
| | Sanchez Energy Corp., senior note, 7.75%, 6/15/21 | | | United States | | | | 20,000,000 | | | | 12,300,000 | |
| | SandRidge Energy Inc., | | | | | | | | | | | | |
| | e second lien, 144A, 8.75%, 6/01/20 | | | United States | | | | 15,000,000 | | | | 4,575,000 | |
| | senior note, 8.75%, 1/15/20 | | | United States | | | | 20,000,000 | | | | 2,025,000 | |
| | senior note, 7.50%, 3/15/21 | | | United States | | | | 1,497,000 | | | | 164,670 | |
| | senior note, 8.125%, 10/15/22 | | | United States | | | | 10,000,000 | | | | 1,150,000 | |
| | senior note, 7.50%, 2/15/23 | | | United States | | | | 6,600,000 | | | | 750,750 | |
| | Stone Energy Corp., senior bond, 7.50%, 11/15/22 | | | United States | | | | 20,000,000 | | | | 6,700,000 | |
| | W&T Offshore Inc., senior note, 8.50%, 6/15/19 | | | United States | | | | 45,000,000 | | | | 15,975,000 | |
| | | | | | | | | | | | | | |
| | | | | | | | | | | | | 199,281,536 | |
| | | | | | | | | | | | | | |
| | Financials 3.5% | | | | | | | | | | | | |
| g | | Bank of America Corp., junior sub. bond, | | | | | | | | | | | | |
| | AA, 6.10% to 3/17/25, FRN thereafter, Perpetual | | | United States | | | | 8,000,000 | | | | 8,120,000 | |
| | M, 8.125% to 5/15/18, FRN thereafter, Perpetual | | | United States | | | | 5,000,000 | | | | 5,093,750 | |
| g | | Citigroup Inc., junior sub. bond, | | | | | | | | | | | | |
| | 5.35% to 5/15/23, FRN thereafter, Perpetual | | | United States | | | | 10,000,000 | | | | 9,487,500 | |
| | 5.90% to 2/15/23, FRN thereafter, Perpetual | | | United States | | | | 12,500,000 | | | | 12,312,500 | |
| | 5.95% to 1/30/23, FRN thereafter, Perpetual | | | United States | | | | 4,500,000 | | | | 4,408,875 | |
| | M, 6.30% to 5/15/24, FRN thereafter, Perpetual | | | United States | | | | 16,800,000 | | | | 16,401,000 | |
| | O, 5.875% to 3/27/20, FRN thereafter, Perpetual | | | United States | | | | 25,000,000 | | | | 24,843,750 | |
| | Q, 5.95% to 8/15/20, FRN thereafter, Perpetual | | | United States | | | | 10,000,000 | | | | 9,978,470 | |
| | International Lease Finance Corp., senior note, 8.75%, 3/15/17 | | | United States | | | | 10,000,000 | | | | 10,675,000 | |
| | Iron Mountain Inc., senior sub. bond, 5.75%, 8/15/24 | | | United States | | | | 3,000,000 | | | | 2,906,250 | |
FRANKLIN TEMPLETON VARIABLE INSURANCE PRODUCTS TRUST
STATEMENT OF INVESTMENTS
Franklin Income VIP Fund (continued)
| | | | | | | | | | | | | | |
| | | | | Country | | | Principal Amount* | | | Value | |
| | Corporate Bonds (continued) | | | | | | | | | | | | |
| | Financials (continued) | | | | | | | | | | | | |
| g | | JPMorgan Chase & Co., junior sub. bond, | | | | | | | | | | | | |
| | I, 7.90% to 4/30/19, FRN thereafter, Perpetual | | | United States | | | | 50,000,000 | | | $ | 50,962,500 | |
| | R, 6.00% to 8/01/23, FRN thereafter, Perpetual | | | United States | | | | 3,200,000 | | | | 3,203,533 | |
| | V, 5.00% to 7/30/19, FRN thereafter, Perpetual | | | United States | | | | 10,000,000 | | | | 9,512,500 | |
| g | | Morgan Stanley, junior sub. bond, 5.55% to 7/15/20, FRN thereafter, Perpetual | | | United States | | | | 7,300,000 | | | | 7,309,125 | |
| | Navient Corp., senior note, 6.125%, 3/25/24 | | | United States | | | | 5,000,000 | | | | 4,093,750 | |
| e | | OneMain Financial Holdings Inc., senior note, 144A, | | | | | | | | | | | | |
| | 6.75%, 12/15/19 | | | United States | | | | 10,000,000 | | | | 10,162,500 | |
| | 7.25%, 12/15/21 | | | United States | | | | 5,000,000 | | | | 5,025,000 | |
| g | | Wells Fargo & Co., junior sub. bond, S, 5.90% to 6/15/24, FRN thereafter, Perpetual | | | United States | | | | 7,900,000 | | | | 7,988,875 | |
| | | | | | | | | | | | | | |
| | | | | | | | | | | | | 202,484,878 | |
| | | | | | | | | | | | | | |
| | Health Care 2.1% | | | | | | | | | | | | |
| | CHS/Community Health Systems Inc., senior note, | | | | | | | | | | | | |
| | 8.00%, 11/15/19 | | | United States | | | | 5,000,000 | | | | 5,062,500 | |
| | 6.875%, 2/01/22 | | | United States | | | | 10,900,000 | | | | 10,395,875 | |
| | DaVita HealthCare Partners Inc., senior bond, 5.125%, 7/15/24 | | | United States | | | | 5,000,000 | | | | 5,009,375 | |
| | HCA Inc., | | | | | | | | | | | | |
| | senior bond, 5.875%, 5/01/23 | | | United States | | | | 7,500,000 | | | | 7,725,000 | |
| | senior note, 7.50%, 2/15/22 | | | United States | | | | 25,000,000 | | | | 27,812,500 | |
| | senior secured bond, first lien, 5.25%, 4/15/25 | | | United States | | | | 5,000,000 | | | | 5,050,000 | |
| | senior secured note, first lien, 5.00%, 3/15/24 | | | United States | | | | 10,400,000 | | | | 10,400,000 | |
| | Tenet Healthcare Corp., senior note, | | | | | | | | | | | | |
| | 8.125%, 4/01/22 | | | United States | | | | 22,500,000 | | | | 22,556,250 | |
| | 6.75%, 6/15/23 | | | United States | | | | 8,200,000 | | | | 7,620,875 | |
| e | | Valeant Pharmaceuticals International Inc., | | | | | | | | | | | | |
| | senior bond, 144A, 6.125%, 4/15/25 | | | United States | | | | 9,400,000 | | | | 8,413,000 | |
| | senior note, 144A, 5.875%, 5/15/23 | | | United States | | | | 12,500,000 | | | | 11,218,750 | |
| | | | | | | | | | | | | | |
| | | | | | | | | | | | | 121,264,125 | |
| | | | | | | | | | | | | | |
| | Industrials 1.2% | | | | | | | | | | | | |
| e | | Algeco Scotsman Global Finance PLC, | | | | | | | | | | | | |
| | senior note, 144A, 10.75%, 10/15/19 | | | United Kingdom | | | | 5,000,000 | | | | 1,975,000 | |
| | senior secured note, first lien, 144A, 8.50%, 10/15/18 | | | United Kingdom | | | | 9,900,000 | | | | 8,278,875 | |
| e | | Bombardier Inc., senior bond, 144A, | | | | | | | | | | | | |
| | 6.125%, 1/15/23 | | | Canada | | | | 5,000,000 | | | | 3,475,000 | |
| | 7.50%, 3/15/25 | | | Canada | | | | 11,000,000 | | | | 7,755,000 | |
| e | | CEVA Group PLC, senior note, first lien, 144A, 4.00%, 5/01/18 | | | United Kingdom | | | | 12,691,882 | | | | 10,756,370 | |
| | Hertz Corp., senior note, 6.75%, 4/15/19 | | | United States | | | | 9,500,000 | | | | 9,728,000 | |
| | Navistar International Corp., senior bond, 8.25%, 11/01/21 | | | United States | | | | 5,675,000 | | | | 3,802,250 | |
| e | | Stena AB, senior bond, 144A, 7.00%, 2/01/24 | | | Sweden | | | | 4,800,000 | | | | 4,104,000 | |
| | TransDigm Inc., | | | | | | | | | | | | |
| | senior sub. bond, 6.50%, 7/15/24 | | | United States | | | | 2,700,000 | | | | 2,698,650 | |
| | senior sub. note, 6.00%, 7/15/22 | | | United States | | | | 2,700,000 | | | | 2,652,750 | |
| e | | XPO Logistics Inc., senior note, 144A, 6.50%, 6/15/22 | | | United States | | | | 15,000,000 | | | | 13,931,250 | |
| | | | | | | | | | | | | | |
| | | | | | | | | | | | | 69,157,145 | |
| | | | | | | | | | | | | | |
| | Information Technology 1.3% | | | | | | | | | | | | |
| e | | BMC Software Finance Inc., senior note, 144A, 8.125%, 7/15/21 | | | United States | | | | 16,500,000 | | | | 11,034,375 | |
| e | | CommScope Inc., senior note, 144A, 5.00%, 6/15/21 | | | United States | | | | 8,422,000 | | | | 8,106,175 | |
FRANKLIN TEMPLETON VARIABLE INSURANCE PRODUCTS TRUST
STATEMENT OF INVESTMENTS
Franklin Income VIP Fund (continued)
| | | | | | | | | | | | | | |
| | | | | Country | | | Principal Amount* | | | Value | |
| | Corporate Bonds (continued) | | | | | | | | | | | | |
| | Information Technology (continued) | | | | | | | | | | | | |
| e | | First Data Corp., | | | | | | | | | | | | |
| | senior note, 144A, 7.00%, 12/01/23 | | | United States | | | | 22,000,000 | | | $ | 22,055,000 | |
| | f senior secured note, 144A, PIK, 8.75%, 1/15/22 | | | United States | | | | 24,726,000 | | | | 25,865,869 | |
| | NCR Corp., senior note, | | | | | | | | | | | | |
| | 5.00%, 7/15/22 | | | United States | | | | 4,500,000 | | | | 4,381,875 | |
| | 6.375%, 12/15/23 | | | United States | | | | 7,000,000 | | | | 6,921,250 | |
| | | | | | | | | | | | | | |
| | | | | | | | | | | | | 78,364,544 | |
| | | | | | | | | | | | | | |
| | Materials 1.8% | | | | | | | | | | | | |
| e | | Ardagh Packaging Finance PLC/Ardagh MP Holdings USA Inc., senior note, 144A, 6.25%, 1/31/19 | | | Luxembourg | | | | 2,500,000 | | | | 2,412,500 | |
| e | | Cemex Finance LLC, senior secured note, first lien, 144A, 6.00%, 4/01/24 | | | Mexico | | | | 14,700,000 | | | | 12,669,563 | |
| e | | Consolidated Minerals Ltd., senior secured note, 144A, 8.00%, 5/15/20 | | | Jersey Islands | | | | 5,000,000 | | | | 2,487,500 | |
| e | | First Quantum Minerals Ltd., senior note, 144A, | | | | | | | | | | | | |
| | 6.75%, 2/15/20 | | | Canada | | | | 2,300,000 | | | | 1,495,000 | |
| | 7.00%, 2/15/21 | | | Canada | | | | 2,300,000 | | | | 1,454,750 | |
| e | | FMG Resources (August 2006) Pty. Ltd., | | | | | | | | | | | | |
| | senior note, 144A, 8.25%, 11/01/19 | | | Australia | | | | 4,500,000 | | | | 3,588,750 | |
| | senior secured note, 144A, 9.75%, 3/01/22 | | | Australia | | | | 25,500,000 | | | | 22,997,812 | |
| e | | Kerling PLC, senior secured note, 144A, 10.625%, 2/01/17 | | | United Kingdom | | | | 9,400,000 | EUR | | | 10,242,658 | |
| e | | Platform Specialty Products Corp., senior note, 144A, 6.50%, 2/01/22 | | | United States | | | | 3,000,000 | | | | 2,610,000 | |
| | Reynolds Group Issuer Inc./LLC/SA, | | | | | | | | | | | | |
| | first lien, 5.75%, 10/15/20 | | | United States | | | | 12,500,000 | | | | 12,746,125 | |
| | senior note, 9.00%, 4/15/19 | | | United States | | | | 5,000,000 | | | | 4,937,500 | |
| | senior note, 9.875%, 8/15/19 | | | United States | | | | 16,800,000 | | | | 16,947,000 | |
| | senior secured note, first lien, 6.875%, 2/15/21 | | | United States | | | | 7,900,000 | | | | 8,156,750 | |
| | | | | | | | | | | | | | |
| | | | | | | | | | | | | 102,745,908 | |
| | | | | | | | | | | | | | |
| | Telecommunication Services 3.4% | | | | | | | | | | | | |
| | Consolidated Communications Inc., senior note, 6.50%, 10/01/22 | | | United States | | | | 15,000,000 | | | | 12,675,000 | |
| | Frontier Communications Corp., senior note, | | | | | | | | | | | | |
| | 9.25%, 7/01/21 | | | United States | | | | 7,400,000 | | | | 7,298,250 | |
| | 7.125%, 1/15/23 | | | United States | | | | 7,800,000 | | | | 6,766,500 | |
| | e 144A, 10.50%, 9/15/22 | | | United States | | | | 10,000,000 | | | | 9,962,500 | |
| | Intelsat Jackson Holdings SA, senior bond, 5.50%, 8/01/23 | | | Luxembourg | | | | 13,400,000 | | | | 10,552,500 | |
| e | | Neptune Finco Corp., senior bond, 144A, 10.875%, 10/15/25 | | | United States | | | | 13,000,000 | | | | 13,658,125 | |
| | Sprint Communications Inc., | | | | | | | | | | | | |
| | 11.50%, 11/15/21 | | | United States | | | | 30,000,000 | | | | 27,750,000 | |
| | senior note, 7.00%, 8/15/20 | | | United States | | | | 7,500,000 | | | | 5,812,500 | |
| | e senior note, 144A, 9.00%, 11/15/18 | | | United States | | | | 11,900,000 | | | | 12,554,500 | |
| | Sprint Corp., | | | | | | | | | | | | |
| | senior bond, 7.875%, 9/15/23 | | | United States | | | | 37,500,000 | | | | 28,256,250 | |
| | senior bond, 7.125%, 6/15/24 | | | United States | | | | 8,200,000 | | | | 6,006,500 | |
| | senior note, 7.625%, 2/15/25 | | | United States | | | | 15,000,000 | | | | 11,025,000 | |
| | T-Mobile USA Inc., | | | | | | | | | | | | |
| | senior bond, 6.625%, 4/01/23 | | | United States | | | | 15,000,000 | | | | 15,337,500 | |
| | senior note, 6.633%, 4/28/21 | | | United States | | | | 7,500,000 | | | | 7,856,250 | |
| | senior note, 6.731%, 4/28/22 | | | United States | | | | 5,000,000 | | | | 5,225,000 | |
| e | | Telecom Italia SpA, senior note, 144A, 5.303%, 5/30/24 | | | Italy | | | | 5,000,000 | | | | 4,965,625 | |
| e | | Wind Acquisition Finance SA, senior note, 144A, 7.375%, 4/23/21 | | | Italy | | | | 11,500,000 | | | | 10,874,687 | |
| | | | | | | | | | | | | | |
| | | | | | | | | | | | | 196,576,687 | |
| | | | | | | | | | | | | | |
FRANKLIN TEMPLETON VARIABLE INSURANCE PRODUCTS TRUST
STATEMENT OF INVESTMENTS
Franklin Income VIP Fund (continued)
| | | | | | | | | | | | | | |
| | | | | Country | | | Principal Amount* | | | Value | |
| | Corporate Bonds (continued) | | | | | | | | | | | | |
| | Utilities 1.4% | | | | | | | | | | | | |
| | Calpine Corp., | | | | | | | | | | | | |
| | senior bond, 5.75%, 1/15/25 | | | United States | | | | 10,000,000 | | | $ | 8,862,500 | |
| | senior note, 5.375%, 1/15/23 | | | United States | | | | 14,500,000 | | | | 13,086,250 | |
| | Dynegy Inc., senior note, | | | | | | | | | | | | |
| | 6.75%, 11/01/19 | | | United States | | | | 25,000,000 | | | | 23,625,000 | |
| | 7.375%, 11/01/22 | | | United States | | | | 18,300,000 | | | | 16,012,500 | |
| e | | InterGen NV, secured bond, 144A, 7.00%, 6/30/23 | | | Netherlands | | | | 25,000,000 | | | | 19,937,500 | |
| | | | | | | | | | | | | | |
| | | | | | | | | | | | | 81,523,750 | |
| | | | | | | | | | | | | | |
| | | | |
| | Total Corporate Bonds (Cost $1,513,172,826) | | | | | | | | | | | 1,239,978,866 | |
| | | | | | | | | | | | | | |
| h,i | | Senior Floating Rate Interests 2.9% | | | | | | | | | | | | |
| | Consumer Discretionary 1.0% | | | | | | | | | | | | |
| | Belk Inc., Closing Date Term Loan, 5.75%, 12/10/22 | | | United States | | | | 25,000,000 | | | | 22,354,175 | |
| | iHeartCommunications Inc., | | | | | | | | | | | | |
| | Tranche D Term Loan, 7.174%, 1/30/19 | | | United States | | | | 35,864,664 | | | | 25,284,588 | |
| | Tranche E Term Loan, 7.924%, 7/30/19 | | | United States | | | | 13,142,769 | | | | 9,276,599 | |
| | | | | | | | | | | | | | |
| | | | | | | | | | | | | 56,915,362 | |
| | | | | | | | | | | | | | |
| | Consumer Staples 0.2% | | | | | | | | | | | | |
| | U.S. Foods Inc., Term Loan, 4.50%, 3/31/19 | | | United States | | | | 14,625,000 | | | | 14,506,172 | |
| | | | | | | | | | | | | | |
| | Energy 0.2% | | | | | | | | | | | | |
| | Fieldwood Energy LLC, Loans (Second Lien), 8.375%, 9/30/20 | | | United States | | | | 10,000,000 | | | | 1,575,000 | |
| | W&T Offshore Inc., Second Lien Term Loan, 9.00%, 5/15/20 | | | United States | | | | 11,000,000 | | | | 9,149,580 | |
| | | | | | | | | | | | | | |
| | | | | | | | | | | | | 10,724,580 | |
| | | | | | | | | | | | | | |
| | Financials 0.7% | | | | | | | | | | | | |
| | First Eagle Investment Management, Initial Term Loans, 4.75%, 12/01/22 | | | United States | | | | 40,000,000 | | | | 39,533,320 | |
| | | | | | | | | | | | | | |
| | Industrials 0.8% | | | | | | | | | | | | |
| | CEVA Group PLC, Pre-Funded L/C, 6.50%, 3/19/21 | | | United States | | | | 5,418,719 | | | | 4,533,664 | |
| | CEVA Intercompany BV, Dutch BV Term Loan, 6.50%, 3/19/21 | | | Netherlands | | | | 5,614,286 | | | | 4,697,288 | |
| | CEVA Logistics Canada ULC, Canadian Term Loan, 6.50%, 3/19/21 | | | Canada | | | | 967,980 | | | | 809,877 | |
| | CEVA Logistics U.S. Holdings Inc., U.S. Term Loan, 6.50%, 3/19/21 | | | United States | | | | 7,743,842 | | | | 6,479,017 | |
| | Commercial Barge Line Co., Initial Term Loan, 9.75%, 11/12/20 | | | United States | | | | 10,000,000 | | | | 9,300,000 | |
| | Navistar Inc., Tranche B Term Loans, 6.50%, 8/07/20 | | | United States | | | | 6,081,022 | | | | 5,381,704 | |
| | XPO Logistics Inc., First Lien Term Loan, 5.50%, 10/29/21 | | | United States | | | | 15,000,000 | | | | 14,959,380 | |
| | | | | | | | | | | | | | |
| | | | | | | | | | | | | 46,160,930 | |
| | | | | | | | | | | | | | |
| | | | |
| | Total Senior Floating Rate Interests
(Cost $190,286,887) | | | | | | | | | | | 167,840,364 | |
| | | | | | | | | | | | | | |
| | | | |
| | | | | | | | Shares | | | | |
| | Escrows and Litigation Trusts (Cost $62,603) 0.0% | | | | | | | | | | | | |
| a,j | | Motors Liquidation Co., Escrow Account, cvt. pfd., C | | | United States | | | | 1,400,000 | | | | — | |
| | | | | | | | | | | | | | |
| | | | |
| | Total Investments before Short Term Investments
(Cost $5,039,196,682) | | | | | | | | | | | 5,056,480,427 | |
| | | | | | | | | | | | | | |
FRANKLIN TEMPLETON VARIABLE INSURANCE PRODUCTS TRUST
STATEMENT OF INVESTMENTS
Franklin Income VIP Fund (continued)
| | | | | | | | | | | | | | |
| | | | | Country | | | Principal Amount* | | | Value | |
| | Short Term Investments 14.0% | | | | | | | | | | | | |
| | Corporate Bonds (Cost $9,780,136) 0.2% | | | | | | | | | | | | |
| | Sabine Pass LNG LP, senior secured note, first lien, 7.50%, 11/30/16 | | | United States | | | | 10,000,000 | | | $ | 10,000,000 | |
| | | | | | | | | | | | | | |
| | U.S. Government and Agency Securities (Cost $49,999,833) 0.8% | | | | | | | | | | | | |
| k | | FHLB, 1/04/16 | | | United States | | | | 50,000,000 | | | | 50,000,000 | |
| | | | | | | | | | | | | | |
| | | | |
| | Total Investments before Money Market Funds and Repurchase Agreements (Cost $5,098,976,651) | | | | | | | | | | | 5,116,480,427 | |
| | | | | | | | | | | | | | |
| | | | |
| | | | | | | | Shares | | | | |
| | Money Market Funds (Cost $585,303,827) 10.1% | | | | | | | | | | | | |
| a,l | | Institutional Fiduciary Trust Money Market Portfolio | | | United States | | | | 585,303,827 | | | | 585,303,827 | |
| | | | | | | | | | | | | | |
| | | | |
| | | | | | | | Principal Amount* | | | | |
| | Repurchase Agreements (Cost $141,520,064) 2.4% | | | | | | | | | | | | |
| m | | Joint Repurchase Agreement, 0.279%, 1/04/16
(Maturity Value $141,524,450) | | | United States | | | | 141,520,064 | | | | 141,520,064 | |
| | BNP Paribas Securities Corp. (Maturity Value $41,047,751)
HSBC Securities (USA) Inc. (Maturity Value $86,202,543)
Merrill Lynch, Pierce, Fenner & Smith Inc.
(Maturity Value $14,274,156) | | | | | | | | | | | | |
| | Collateralized by U.S. Government Agency Securities,
0.184% - 0.289%, 5/08/17 - 4/09/18; kU.S. Treasury Bill,
3/03/16 - 5/26/16; and U.S. Treasury Note, 1.375% - 2.625%, 2/29/20 - 11/15/20 (valued at $144,440,460) | | | | | | | | | | | | |
| | | | | | | | | | | | | | |
| | | | |
| | | | | | | | Shares | | | | |
| n | | Investments from Cash Collateral Received for Loaned Securities 0.5% | | | | | | | | | | | | |
| | Money Market Funds (Cost $3,750,000) 0.1% | | | | | | | | | | | | |
| a,l | | Institutional Fiduciary Trust Money Market Portfolio | | | United States | | | | 3,750,000 | | | | 3,750,000 | |
| | | | | | | | | | | | | | |
| | | | |
| | | | | | | | Principal Amount* | | | | |
| | Repurchase Agreements 0.4% | | | | | | | | | | | | |
| m | | Joint Repurchase Agreement, 0.27%, 1/04/16
(Maturity Value $6,213,171) | | | United States | | | | 6,212,985 | | | | 6,212,985 | |
| | HSBC Securities (USA) Inc. | | | | | | | | | | | | |
| | Collateralized by U.S. Treasury Strips, 2/15/16 - 8/15/40
(valued at $6,337,251) | | | | | | | | | | | | |
| m | | Joint Repurchase Agreement, 0.30%, 1/04/16
(Maturity Value $6,213,192) | | | United States | | | | 6,212,985 | | | | 6,212,985 | |
| | RBS Securities Inc. | | | | | | | | | | | | |
| | Collateralized by U.S. Treasury Note, 0.289% - 3.25%,
7/31/16 - 11/15/23 (valued at $6,337,276) | | | | | | | | | | | | |
| m | | Joint Repurchase Agreement, 0.32%, 1/04/16
(Maturity Value $6,213,206) | | | United States | | | | 6,212,985 | | | | 6,212,985 | |
| | Citigroup Global Markets Inc. | | | | | | | | | | | | |
| | Collateralized by U.S. Treasury Note, 0.299% - 3.375%,
1/31/17 - 4/30/22 (valued at $6,337,245) | | | | | | | | | | | | |
FRANKLIN TEMPLETON VARIABLE INSURANCE PRODUCTS TRUST
STATEMENT OF INVESTMENTS
Franklin Income VIP Fund (continued)
| | | | | | | | | | | | | | |
| | | | | Country | | | Principal Amount* | | | Value | |
| | Repurchase Agreements (continued) | | | | | | | | | | | | |
| m | | Joint Repurchase Agreement, 0.32%, 1/04/16
(Maturity Value $3,770,933) | | | United States | | | | 3,770,799 | | | $ | 3,770,799 | |
| | J.P. Morgan Securities LLC | | | | | | | | | | | | |
| | Collateralized by kU.S. Treasury Bill, 4/28/16; and U.S. Treasury Note, 1.375% - 2.00%, 4/30/20 - 2/15/25 (valued at $3,846,255) | | | | | | | | | | | | |
| | | | | | | | | | | | | | |
| | | | |
| | Total Repurchase Agreements (Cost $22,409,754) | | | | | | | | | | | 22,409,754 | |
| | | | | | | | | | | | | | |
| | | | |
| | Total Investments from Cash Collateral Received for Loaned Securities (Cost $26,159,754) | | | | | | | | | | | 26,159,754 | |
| | | | | | | | | | | | | | |
| | Total Investments (Cost $5,851,960,296) 100.9% | | | | | | | | | | | 5,869,464,072 | |
| | Other Assets, less Liabilities (0.9)% | | | | | | | | | | | (51,613,263 | ) |
| | | | | | | | | | | | | | |
| | Net Assets 100.0% | | | | | | | | | | $ | 5,817,850,809 | |
| | | | | | | | | | | | | | |
See Abbreviations on page FI-32.
† Rounds to less than 0.1% of net assets.
* The principal amount is stated in U.S. dollars unless otherwise indicated.
a Non-income producing.
b A portion or all of the security is on loan at December 31, 2015. See Note 1(e).
c See Note 8 regarding restricted securities.
d See Note 1(d) regarding equity-linked securities.
e Security was purchased pursuant to Rule 144A under the Securities Act of 1933 and may be sold in transactions exempt from registration only to qualified institutional buyers or in a public offering registered under the Securities Act of 1933. These securities have been deemed liquid under guidelines approved by the Trust’s Board of Trustees. At December 31, 2015, the aggregate value of these securities was $558,174,119, representing 9.59% of net assets.
f Income may be received in additional securities and/or cash.
g Perpetual security with no stated maturity date.
h See Note 1(f) regarding senior floating rate interests.
i The coupon rate shown represents the rate at period end.
j Security has been deemed illiquid because it may not be able to be sold within seven days.
k The security is traded on a discount basis with no stated coupon rate.
l See Note 3(e) regarding investments in affiliated management investment companies.
m See Note 1(c) regarding joint repurchase agreement.
n See Note 1(e) regarding securities on loan.
| | | | | | |
| | | The accompanying notes are an integral part of these financial statements. | Annual Report | | | FI-19 | |
FRANKLIN TEMPLETON VARIABLE INSURANCE PRODUCTS TRUST
Financial Statements
Statement of Assets and Liabilities
December 31, 2015
| | | | |
| | | Franklin Income
VIP Fund | |
Assets: | | | | |
Investments in securities: | | | | |
Cost - Unaffiliated issuers | | $ | 5,098,976,651 | |
Cost - Non-controlled affiliates (Note 3e) | | | 589,053,827 | |
Cost - Repurchase agreements | | | 163,929,818 | |
| | | | |
Total cost of investments | | $ | 5,851,960,296 | |
| | | | |
Value - Unaffiliated issuers | | $ | 5,116,480,427 | |
Value - Non-controlled affiliates (Note 3e) | | | 589,053,827 | |
Value - Repurchase agreements | | | 163,929,818 | |
| | | | |
Total value of investments (includes securities loaned in the amount of $24,907,173) | | | 5,869,464,072 | |
Cash | | | 355,524 | |
Receivables: | | | | |
Investment securities sold | | | 55,217,443 | |
Capital shares sold | | | 2,525,142 | |
Dividends and interest | | | 38,518,954 | |
Other assets | | | 563 | |
| | | | |
Total assets | | | 5,966,081,698 | |
| | | | |
Liabilities: | | | | |
Payables: | | | | |
Investment securities purchased | | | 113,121,822 | |
Capital shares redeemed | | | 3,857,945 | |
Management fees | | | 2,220,441 | |
Distribution fees | | | 2,298,140 | |
Payable upon return of securities loaned | | | 26,159,754 | |
Accrued expenses and other liabilities | | | 572,787 | |
| | | | |
Total liabilities | | | 148,230,889 | |
| | | | |
Net assets, at value | | $ | 5,817,850,809 | |
| | | | |
Net assets consist of: | | | | |
Paid-in capital | | $ | 6,470,028,166 | |
Undistributed net investment income | | | 284,418,214 | |
Net unrealized appreciation (depreciation) | | | 17,493,830 | |
Accumulated net realized gain (loss) | | | (954,089,401 | ) |
| | | | |
Net assets, at value | | $ | 5,817,850,809 | |
| | | | |
| | | | | | |
| | FI-20 | | | Annual Report | The accompanying notes are an integral part of these financial statements. | | |
FRANKLIN TEMPLETON VARIABLE INSURANCE PRODUCTS TRUST
FINANCIAL STATEMENTS
Statement of Assets and Liabilities (continued)
December 31, 2015
| | | | |
| | | Franklin Income
VIP Fund | |
| |
| Class 1: | | | | |
Net assets, at value | | $ | 604,228,405 | |
| | | | |
Shares outstanding | | | 41,272,285 | |
| | | | |
Net asset value and maximum offering price per share | | $ | 14.64 | |
| | | | |
| |
| Class 2: | | | | |
Net assets, at value | | $ | 4,907,598,923 | |
| | | | |
Shares outstanding | | | 345,644,586 | |
| | | | |
Net asset value and maximum offering price per share | | $ | 14.20 | |
| | | | |
| |
| Class 4: | | | | |
Net assets, at value | | $ | 306,023,481 | |
| | | | |
Shares outstanding | | | 21,125,606 | |
| | | | |
Net asset value and maximum offering price per share | | $ | 14.49 | |
| | | | |
| | | | | | |
| | | The accompanying notes are an integral part of these financial statements. | Annual Report | | | FI-21 | |
FRANKLIN TEMPLETON VARIABLE INSURANCE PRODUCTS TRUST
FINANCIAL STATEMENTS
Statement of Operations
for the year ended December 31, 2015
| | | | |
| | | Franklin Income
VIP Fund | |
Investment income: | | | | |
Dividends | | $ | 139,393,586 | |
Interest | | | 185,556,463 | |
Income from securities loaned | | | 1,191,868 | |
| | | | |
Total investment income | | | 326,141,917 | |
| | | | |
Expenses: | | | | |
Management fees (Note 3a) | | | 30,028,252 | |
Distribution fees: (Note 3c) | | | | |
Class 2 | | | 13,974,874 | |
Class 4 | | | 1,233,866 | |
Custodian fees (Note 4) | | | 68,362 | |
Reports to shareholders | | | 345,392 | |
Professional fees | | | 146,325 | |
Trustees’ fees and expenses | | | 29,560 | |
Other | | | 118,374 | |
| | | | |
Total expenses | | | 45,945,005 | |
Expense reductions (Note 4) | | | (1,687 | ) |
Expenses waived/paid by affiliates (Note 3e) | | | (64,561 | ) |
| | | | |
Net expenses | | | 45,878,757 | |
| | | | |
Net investment income | | | 280,263,160 | |
| | | | |
Realized and unrealized gains (losses): | | | | |
Net realized gain (loss) from: | | | | |
Investments | | | (198,163,622 | ) |
Foreign currency transactions | | | (21,870 | ) |
| | | | |
Net realized gain (loss) | | | (198,185,492 | ) |
| | | | |
Net change in unrealized appreciation (depreciation) on: | | | | |
Investments | | | (544,627,619 | ) |
Translation of other assets and liabilities denominated in foreign currencies | | | 229,788 | |
| | | | |
Net change in unrealized appreciation (depreciation) | | | (544,397,831 | ) |
| | | | |
Net realized and unrealized gain (loss) | | | (742,583,323 | ) |
| | | | |
Net increase (decrease) in net assets resulting from operations | | $ | (462,320,163 | ) |
| | | | |
| | | | | | |
| | FI-22 | | | Annual Report | The accompanying notes are an integral part of these financial statements. | | |
FRANKLIN TEMPLETON VARIABLE INSURANCE PRODUCTS TRUST
FINANCIAL STATEMENTS
Statements of Changes in Net Assets
| | | | | | | | |
| | | Franklin Income VIP Fund | |
| | | Year Ended December 31, | |
| | | 2015 | | | 2014 | |
Increase (decrease) in net assets: | | | | | | | | |
Operations: | | | | | | | | |
Net investment income | | $ | 280,263,160 | | | $ | 300,049,149 | |
Net realized gain (loss) | | | (198,185,492 | ) | | | 327,875,766 | |
Net change in unrealized appreciation (depreciation) | | | (544,397,831 | ) | | | (288,670,010 | ) |
| | | | |
Net increase (decrease) in net assets resulting from operations | | | (462,320,163 | ) | | | 339,254,905 | |
| | | | |
Distributions to shareholders from: | | | | | | | | |
Net investment income: | | | | | | | | |
Class 1 | | | (32,196,540 | ) | | | (37,211,436 | ) |
Class 2 | | | (260,631,132 | ) | | | (314,580,044 | ) |
Class 4 | | | (15,803,892 | ) | | | (19,237,312 | ) |
| | | | |
Total distributions to shareholders | | | (308,631,564 | ) | | | (371,028,792 | ) |
| | | | |
Capital share transactions: (Note 2) | | | | | | | | |
Class 1 | | | (31,781,112 | ) | | | 23,158,016 | |
Class 2 | | | (463,715,750 | ) | | | (137,432,835 | ) |
Class 4 | | | (31,713,868 | ) | | | (18,639,257 | ) |
| | | | |
Total capital share transactions | | | (527,210,730 | ) | | | (132,914,076 | ) |
| | | | |
Net increase (decrease) in net assets | | | (1,298,162,457 | ) | | | (164,687,963 | ) |
Net assets: | | | | | | | | |
Beginning of year | | | 7,116,013,266 | | | | 7,280,701,229 | |
| | | | |
End of year | | $ | 5,817,850,809 | | | $ | 7,116,013,266 | |
| | | | |
Undistributed net investment income included in net assets: | | | | | | | | |
End of year | | $ | 284,418,214 | | | $ | 285,827,668 | |
| | | | |
| | | | | | |
| | | The accompanying notes are an integral part of these financial statements. | Annual Report | | | FI-23 | |
FRANKLIN TEMPLETON VARIABLE INSURANCE PRODUCTS TRUST
Notes to Financial Statements
Franklin Income VIP Fund
1. Organization and Significant Accounting Policies
Franklin Templeton Variable Insurance Products Trust (Trust) is registered under the Investment Company Act of 1940 (1940 Act) as an open-end management investment company, consisting of nineteen separate funds and applies the specialized accounting and reporting guidance in U.S. Generally Accepted Accounting Principles (U.S. GAAP). Franklin Income VIP Fund (Fund) is included in this report. The financial statements of the remaining funds in the Trust are presented separately. Shares of the Fund are generally sold only to insurance company separate accounts to fund the benefits of variable life insurance policies or variable annuity contracts. The Fund offers three classes of shares: Class 1, Class 2 and Class 4. Each class of shares differs by its distribution fees, voting rights on matters affecting a single class and its exchange privilege.
The following summarizes the Fund’s significant accounting policies.
a. Financial Instrument Valuation
The Fund’s investments in financial instruments are carried at fair value daily. Fair value is the price that would be received to sell an asset or paid to transfer a liability in an orderly transaction between market participants on the measurement date. The Fund calculates the net asset value (NAV) per share as of 4 p.m. Eastern time each day the New York Stock Exchange (NYSE) is open for trading. Under compliance policies and procedures approved by the Trust’s Board of Trustees (the Board), the Fund’s administrator has responsibility for oversight of valuation, including leading the cross-functional Valuation and Liquidity Oversight Committee (VLOC). The VLOC provides administration and oversight of the Fund’s valuation policies and procedures, which are approved annually by the Board. Among other things, these procedures allow the Fund to utilize independent pricing services, quotations from securities and financial instrument dealers, and other market sources to determine fair value.
Equity securities listed on an exchange or on the NASDAQ National Market System are valued at the last quoted sale price or the official closing price of the day, respectively. Foreign equity securities are valued as of the close of trading on the foreign stock exchange on which the security is primarily traded or as of 4 p.m. Eastern time whichever is earlier. The value is then converted into its U.S. dollar equivalent at the foreign exchange rate in effect at 4 p.m. Eastern time on the day that the value of the security is determined. Over-the-counter (OTC) securities are
valued within the range of the most recent quoted bid and ask prices. Securities that trade in multiple markets or on multiple exchanges are valued according to the broadest and most representative market. Certain equity securities are valued based upon fundamental characteristics or relationships to similar securities.
Debt securities generally trade in the OTC market rather than on a securities exchange. The Fund’s pricing services use multiple valuation techniques to determine fair value. In instances where sufficient market activity exists, the pricing services may utilize a market-based approach through which quotes from market makers are used to determine fair value. In instances where sufficient market activity may not exist or is limited, the pricing services also utilize proprietary valuation models which may consider market characteristics such as benchmark yield curves, credit spreads, estimated default rates, anticipated market interest rate volatility, coupon rates, anticipated timing of principal repayments, underlying collateral, and other unique security features in order to estimate the relevant cash flows, which are then discounted to calculate the fair value. Securities denominated in a foreign currency are converted into their U.S. dollar equivalent at the foreign exchange rate in effect at 4 p.m. Eastern time on the date that the values of the foreign debt securities are determined.
Investments in open-end mutual funds are valued at the closing NAV. Repurchase agreements are valued at cost, which approximates fair value.
The Fund has procedures to determine the fair value of financial instruments for which market prices are not reliable or readily available. Under these procedures, the VLOC convenes on a regular basis to review such financial instruments and considers a number of factors, including significant unobservable valuation inputs, when arriving at fair value. The VLOC primarily employs a market-based approach which may use related or comparable assets or liabilities, recent transactions, market multiples, book values, and other relevant information for the investment to determine the fair value of the investment. An income-based valuation approach may also be used in which the anticipated future cash flows of the investment are discounted to calculate fair value. Discounts may also be applied due to the nature or duration of any restrictions on the disposition of the investments. Due to the inherent uncertainty of valuations of such investments, the fair values may differ significantly from the values that would have been used had an active market existed. The VLOC employs various methods for calibrating
FRANKLIN TEMPLETON VARIABLE INSURANCE PRODUCTS TRUST
NOTES TO FINANCIAL STATEMENTS
Franklin Income VIP Fund (continued)
these valuation approaches including a regular review of key inputs and assumptions, transactional back-testing or disposition analysis, and reviews of any related market activity.
Trading in securities on foreign securities stock exchanges and OTC markets may be completed before 4 p.m. Eastern time. In addition, trading in certain foreign markets may not take place on every NYSE business day. Occasionally, events occur between the time at which trading in a foreign security is completed and the close of the NYSE that might call into question the reliability of the value of a portfolio security held by the Fund. As a result, differences may arise between the value of the Fund’s portfolio securities as determined at the foreign market close and the latest indications of value at the close of the NYSE. In order to minimize the potential for these differences, the VLOC monitors price movements following the close of trading in foreign stock markets through a series of country specific market proxies (such as baskets of American Depositary Receipts, futures contracts and exchange traded funds). These price movements are measured against established trigger thresholds for each specific market proxy to assist in determining if an event has occurred that may call into question the reliability of the values of the foreign securities held by the Fund. If such an event occurs, the securities may be valued using fair value procedures, which may include the use of independent pricing services.
When the last day of the reporting period is a non-business day, certain foreign markets may be open on those days that the NYSE is closed, which could result in differences between the value of the Fund’s portfolio securities on the last business day and the last calendar day of the reporting period. Any significant security valuation changes due to an open foreign market are adjusted and reflected by the Fund for financial reporting purposes.
b. Foreign Currency Translation
Portfolio securities and other assets and liabilities denominated in foreign currencies are translated into U.S. dollars based on the exchange rate of such currencies against U.S. dollars on the date of valuation. The Fund may enter into foreign currency exchange contracts to facilitate transactions denominated in a foreign currency. Purchases and sales of securities, income and expense items denominated in foreign currencies are translated into U.S. dollars at the exchange rate in effect on the transaction date. Portfolio securities and assets and liabilities denominated in foreign currencies contain risks that those currencies will decline in value relative to the U.S. dollar. Occasionally, events
may impact the availability or reliability of foreign exchange rates used to convert the U.S. dollar equivalent value. If such an event occurs, the foreign exchange rate will be valued at fair value using procedures established and approved by the Board.
The Fund does not separately report the effect of changes in foreign exchange rates from changes in market prices on securities held. Such changes are included in net realized and unrealized gain or loss from investments in the Statement of Operations.
Realized foreign exchange gains or losses arise from sales of foreign currencies, currency gains or losses realized between the trade and settlement dates on securities transactions and the difference between the recorded amounts of dividends, interest, and foreign withholding taxes and the U.S. dollar equivalent of the amounts actually received or paid. Net unrealized foreign exchange gains and losses arise from changes in foreign exchange rates on foreign denominated assets and liabilities other than investments in securities held at the end of the reporting period.
c. Joint Repurchase Agreement
The Fund enters into a joint repurchase agreement whereby its uninvested cash balance is deposited into a joint cash account with other funds managed by the investment manager or an affiliate of the investment manager and is used to invest in one or more repurchase agreements. The value and face amount of the joint repurchase agreement are allocated to the funds based on their pro-rata interest. A repurchase agreement is accounted for as a loan by the Fund to the seller, collateralized by securities which are delivered to the Fund’s custodian. The fair value, including accrued interest, of the initial collateralization is required to be at least 102% of the dollar amount invested by the funds, with the value of the underlying securities marked to market daily to maintain coverage of at least 100%. Repurchase agreements are subject to the terms of Master Repurchase Agreements (MRAs) with approved counterparties (sellers). The MRAs contain various provisions, including but not limited to events of default and maintenance of collateral for repurchase agreements. In the event of default by either the seller or the Fund, certain MRAs may permit the non-defaulting party to net and close-out all transactions, if any, traded under such agreements. The Fund may sell securities it holds as collateral and apply the proceeds towards the repurchase price and any other amounts owed by the seller to the Fund in the event of default by the seller. This could involve costs or delays in addition to a loss on the securities if their value falls below the repurchase
FRANKLIN TEMPLETON VARIABLE INSURANCE PRODUCTS TRUST
NOTES TO FINANCIAL STATEMENTS
Franklin Income VIP Fund (continued)
1. Organization and Significant Accounting Policies (continued)
price owed by the seller. The joint repurchase agreement held by the Fund at year end, as indicated in the Statement of Investments, had been entered into on December 31, 2015.
d. Equity-Linked Securities
The Fund invests in equity-linked securities. Equity-linked securities are hybrid financial instruments that generally combine both debt and equity characteristics into a single note form. Income received from equity-linked securities is recorded as realized gains in the Statement of Operations and may be based on the performance of an underlying equity security, an equity index, or an option position. The risks of investing in equity-linked securities include unfavorable price movements in the underlying security and the credit risk of the issuing financial institution. There may be no guarantee of a return of principal with equity-linked securities and the appreciation potential may be limited. Equity-linked securities may be more volatile and less liquid than other investments held by the Fund.
e. Securities Lending
The Fund participates in an agency based securities lending program to earn additional income. The Fund receives cash collateral against the loaned securities in an amount equal to at least 102% of the fair value of the loaned securities. Collateral is maintained over the life of the loan in an amount not less than 100% of the fair value of loaned securities, as determined at the close of Fund business each day; any additional collateral required due to changes in security values is delivered to the Fund on the next business day. The collateral is deposited into a joint cash account with other funds and is used to invest in a money market fund managed by Franklin Advisers, Inc., an affiliate of the Fund, and/or a joint repurchase agreement. The Fund may receive income from the investment of cash collateral, in addition to lending fees and rebates paid by the borrower. Income from securities loaned is reported separately in the Statement of Operations. The Fund bears the market risk with respect to the collateral investment, securities loaned, and the risk that the agent may default on its obligations to the Fund. If the borrower defaults on its obligation to return the securities loaned, the Fund has the right to repurchase the securities in the open market using the collateral received. The securities lending agent has agreed to indemnify the Fund in the event of default by a third party borrower.
Securities lending transactions are accounted for as secured borrowing transactions. The securities out on loan represent the collateral pledged by the Fund, and the cash collateral received for the loaned securities represents the amount borrowed by the Fund. At December 31, 2015, the Fund‘s secured borrowing transactions were as follows:
| | | | |
Securities lending transactionsa: | | | | |
Corporate bonds | | $ | 534,874 | |
Equity investments | | | 25,624,880 | |
| | | | |
Total borrowingsb | | $ | 26,159,754 | |
| | | | |
aThe agreements open at year end can be terminated at any time.
bGross amount of recognized liabilities for securities lending transactions is included in payable upon return of securities loaned in the Statement of Assets and Liabilities.
f. Senior Floating Rate Interests
The Fund invests in senior secured corporate loans that pay interest at rates which are periodically reset by reference to a base lending rate plus a spread. These base lending rates are generally the prime rate offered by a designated U.S. bank or the London InterBank Offered Rate (LIBOR). Senior secured corporate loans often require prepayment of principal from excess cash flows or at the discretion of the borrower. As a result, actual maturity may be substantially less than the stated maturity. Senior secured corporate loans in which the Fund invests are generally readily marketable, but may be subject to certain restrictions on resale.
g. Income and Deferred Taxes
It is the Fund’s policy to qualify as a regulated investment company under the Internal Revenue Code. The Fund intends to distribute to shareholders substantially all of its taxable income and net realized gains to relieve it from federal income and if applicable, excise taxes. As a result, no provision for U.S. federal income taxes is required.
The Fund may be subject to foreign taxation related to income received, capital gains on the sale of securities and certain foreign currency transactions in the foreign jurisdictions in which it invests. Foreign taxes, if any, are recorded based on the tax regulations and rates that exist in the foreign markets in which the Fund invests. When a capital gain tax is determined to apply, the Fund records an estimated deferred tax liability in an amount that would be payable if the securities were disposed of on the valuation date. As a result of several court cases, in certain countries across the European Union, the Fund has filed
FRANKLIN TEMPLETON VARIABLE INSURANCE PRODUCTS TRUST
NOTES TO FINANCIAL STATEMENTS
Franklin Income VIP Fund (continued)
additional tax reclaims for previously withheld taxes on dividends earned in those countries. These additional filings are subject to various administrative proceedings by the local jurisdictions’ tax authorities within the European Union, as well as a number of related judicial proceedings. At this time, uncertainty exists as to the ultimate resolution of these proceedings, the likelihood of receipt of these reclaims, and the potential timing of payment, and accordingly, no amounts are reflected in the financial statements.
The Fund may recognize an income tax liability related to its uncertain tax positions under U.S. GAAP when the uncertain tax position has a less than 50% probability that it will be sustained upon examination by the tax authorities based on its technical merits. As of December 31, 2015, the Fund has determined that no tax liability is required in its financial statements related to uncertain tax positions for any open tax years (or expected to be taken on future tax returns). Open tax years are those that remain subject to examination and are based on each tax jurisdiction’s statute of limitation.
h. Security Transactions, Investment Income, Expenses and Distributions
Security transactions are accounted for on trade date. Realized gains and losses on security transactions are determined on a specific identification basis. Interest income and estimated expenses are accrued daily. Amortization of premium and accretion of discount on debt securities are included in interest income. Facility fees are recognized as income over the expected term of the loan. Dividend income is recorded on the ex-dividend date except for certain dividends from foreign securities where the dividend rate is not available. In such cases, the dividend is recorded as soon as the information is received by the Fund. Distributions to shareholders are recorded on the ex-dividend date and are determined according to income tax regulations (tax basis). Distributable earnings determined on a tax basis may differ from earnings recorded in accordance with U.S. GAAP. These differences may be permanent or temporary. Permanent differences are reclassified among capital accounts to reflect their tax character. These reclassifications have no impact on net assets or the results of operations. Temporary differences are not reclassified, as they may reverse in subsequent periods.
Common expenses incurred by the Trust are allocated among the Funds based on the ratio of net assets of each Fund to the combined net assets of the Trust. Fund specific expenses are charged directly to the fund that incurred the expense.
Realized and unrealized gains and losses and net investment income, not including class specific expenses, are allocated daily to each class of shares based upon the relative proportion of net assets of each class. Differences in per share distributions, by class, are generally due to differences in class specific expenses.
i. Accounting Estimates
The preparation of financial statements in accordance with U.S. GAAP requires management to make estimates and assumptions that affect the reported amounts of assets and liabilities at the date of the financial statements and the amounts of income and expenses during the reporting period. Actual results could differ from those estimates.
j. Guarantees and Indemnifications
Under the Trust’s organizational documents, its officers and trustees are indemnified by the Trust against certain liabilities arising out of the performance of their duties to the Trust. Additionally, in the normal course of business, the Trust, on behalf of the Fund, enters into contracts with service providers that contain general indemnification clauses. The Trust’s maximum exposure under these arrangements is unknown as this would involve future claims that may be made against the Trust that have not yet occurred. Currently, the Trust expects the risk of loss to be remote.
FRANKLIN TEMPLETON VARIABLE INSURANCE PRODUCTS TRUST
NOTES TO FINANCIAL STATEMENTS
Franklin Income VIP Fund (continued)
2. Shares of Beneficial Interest
At December 31, 2015, there were an unlimited number of shares authorized (without par value). Transactions in the Fund’s shares were as follows:
| | | | | | | | | | | | | | | | | | |
| | | Year Ended December 31, | |
| | | 2015 | | | | | 2014 | |
| | | Shares | | | Amount | | | | | Shares | | | Amount | |
| | | | | |
| Class 1 Shares: | | | | | | | | | | | | | | | | | | |
Shares sold | | | 1,738,174 | | | $ | 27,618,019 | | | | | | 2,465,196 | | | $ | 42,146,383 | |
Shares issued in reinvestment of distributions | | | 2,040,338 | | | | 32,196,540 | | | | | | 2,182,489 | | | | 37,211,436 | |
Shares redeemed | | | (5,869,235 | ) | | | (91,595,671 | ) | | | | | (3,341,982 | ) | | | (56,199,803 | ) |
| | | | |
Net increase (decrease) | | | (2,090,723 | ) | | $ | (31,781,112 | ) | | | | | 1,305,703 | | | $ | 23,158,016 | |
| | | | |
| Class 2 Shares: | | | | | | | | | | | | | | | | | | |
Shares sold | | | 21,413,080 | | | $ | 334,630,165 | | | | | | 37,540,981 | | | $ | 619,277,066 | |
Shares issued in reinvestment of distributions | | | 17,001,378 | | | | 260,631,132 | | | | | | 18,973,465 | | | | 314,580,044 | |
Shares redeemed | | | (69,202,126 | ) | | | (1,058,977,047 | ) | | | | | (65,224,564 | ) | | | (1,071,289,945 | ) |
| | | | |
Net increase (decrease) | | | (30,787,668 | ) | | $ | (463,715,750 | ) | | | | | (8,710,118 | ) | | $ | (137,432,835 | ) |
| | | | |
| Class 4 Shares: | | | | | | | | | | | | | | | | | | |
Shares sold | | | 2,745,531 | | | $ | 43,147,056 | | | | | | 3,949,673 | | | $ | 66,366,931 | |
Shares issued in reinvestment of distributions | | | 1,010,479 | | | | 15,803,892 | | | | | | 1,137,629 | | | | 19,237,312 | |
Shares redeemed | | | (5,843,737 | ) | | | (90,664,816 | ) | | | | | (6,186,364 | ) | | | (104,243,500 | ) |
| | | | |
Net increase (decrease) | | | (2,087,727 | ) | | $ | (31,713,868 | ) | | | | | (1,099,062 | ) | | $ | (18,639,257 | ) |
| | | | |
3. Transactions With Affiliates
Franklin Resources, Inc. is the holding company for various subsidiaries that together are referred to as Franklin Templeton Investments. Certain officers and trustees of the Fund are also officers and/or directors of the following subsidiaries:
| | |
| Subsidiary | | Affiliation |
Franklin Advisers, Inc. (Advisers) | | Investment manager |
Franklin Templeton Services, LLC (FT Services) | | Administrative manager |
Franklin Templeton Distributors, Inc. (Distributors) | | Principal underwriter |
Franklin Templeton Investor Services, LLC (Investor Services) | | Transfer agent |
a. Management Fees
The Fund pays an investment management fee to Advisers based on the average daily net assets of the Fund as follows:
| | |
| Annualized Fee Rate | | Net Assets |
0.625% | | Up to and including $100 million |
0.500% | | Over $100 million, up to and including $250 million |
0.450% | | Over $250 million, up to and including $7.5 billion |
0.440% | | Over $7.5 billion, up to and including $10 billion |
0.430% | | Over $10 billion, up to and including $12.5 billion |
0.420% | | Over $12.5 billion, up to and including $15 billion |
0.400% | | In excess of $15 billion |
FRANKLIN TEMPLETON VARIABLE INSURANCE PRODUCTS TRUST
NOTES TO FINANCIAL STATEMENTS
Franklin Income VIP Fund (continued)
b. Administrative Fees
Under an agreement with Advisers, FT Services provides administrative services to the Fund. The fee is paid by Advisers based on the Fund’s average daily net assets, and is not an additional expense of the Fund.
c. Distribution Fees
The Board has adopted distribution plans for Class 2 and Class 4 shares pursuant to Rule 12b-1 under the 1940 Act. Under the Fund’s compensation distribution plans, the Fund pays Distributors for costs incurred in connection with the servicing, sale and distribution of the Fund’s shares up to 0.35% per year of its average daily net assets of each class. The Board has agreed to limit the current rate to 0.25% per year for Class 2. The plan year, for purposes of monitoring compliance with the maximum annual plan rates, is February 1 through January 31.
d. Transfer Agent Fees
Investor Services, under terms of an agreement, performs shareholder servicing for the Fund and is not paid by the Fund for the services.
e. Investments in Affiliated Management Investment Companies
The Fund invests in an affiliated management investment company for purposes other than exercising a controlling influence over the management or policies. Management fees paid by the Fund are waived on assets invested in the affiliated management investment company, as noted in the Statement of Operations, in an amount not to exceed the management and administrative fees paid directly or indirectly by each affiliate.
| | | | | | | | | | | | | | | | | | | | | | | | | | | | | | | | |
| | | Number
of Shares
Held at
Beginning
of Year | | | Gross
Additions | | | Gross
Reductions | | | Number
of Shares
Held at
End of
Year | | | Value at
End of
Year | | | Investment
Income | | | Realized
Gain
(Loss) | | | % of
Affiliated
Fund Shares
Outstanding
Held at End
of Year | |
Institutional Fiduciary Trust Money Market Portfolio | | | — | | | | 664,470,634 | | | | (75,416,807 | ) | | | 589,053,827 | | | $ | 589,053,827 | | | $ | — | | | $ | — | | | | 3.01% | |
| | | | | | | | | | | | | | | | | | | | | | | | |
f. Other Affiliated Transactions
At December 31, 2015, Franklin Templeton Variable Insurance Products Trust – Franklin Founding Funds Allocation VIP Fund owned 5.72% of the Fund’s outstanding shares.
g. Interfund Transactions
The Fund engaged in purchases and sales of investments with funds or other accounts that have a common investment manager (or affiliated investment managers), directors, trustees, or officers. These transactions complied with Rule 17a-7 under the 1940 Act. During the year ended December 31, 2015, the purchase and sale transactions aggregated $0 and $7,568,450, respectively.
4. Expense Offset Arrangement
The Fund has entered into an arrangement with its custodian whereby credits realized as a result of uninvested cash balances are used to reduce a portion of the Fund’s custodian expenses. During the year ended December 31, 2015, the custodian fees were reduced as noted in the Statement of Operations.
FRANKLIN TEMPLETON VARIABLE INSURANCE PRODUCTS TRUST
NOTES TO FINANCIAL STATEMENTS
Franklin Income VIP Fund (continued)
5. Income Taxes
For tax purposes, capital losses may be carried over to offset future capital gains. Capital loss carryforwards with no expiration, if any, must be fully utilized before those losses with expiration dates.
At December 31, 2015, capital loss carryforwards were as follows:
| | | | |
Capital loss carryforwards subject to expiration: | | | | |
2016 | | $ | 51,901,081 | |
2017 | | | 521,405,875 | |
2018 | | | 157,561,044 | |
| |
Capital loss carryforwards not subject to expiration: | | | | |
Short term | | | 73,992,456 | |
Long term | | | 144,130,633 | |
| | | | |
Total capital loss carryforwards | | $ | 948,991,089 | |
| | | | |
The tax character of distributions paid during the years ended December 31, 2015 and 2014, was as follows:
| | | | | | | | |
| | | 2015 | | | 2014 | |
Distributions paid from ordinary income | | $ | 308,631,564 | | | $ | 371,028,792 | |
| | | | |
At December 31, 2015, the cost of investments, net unrealized appreciation (depreciation) and undistributed ordinary income for income tax purposes were as follows:
| | | | |
Cost of investments | | $ | 5,852,077,100 | |
| | | | |
Unrealized appreciation | | $ | 734,570,443 | |
Unrealized depreciation | | | (717,183,471 | ) |
| | | | |
Net unrealized appreciation (depreciation) | | $ | 17,386,972 | |
| | | | |
Distributable earnings - undistributed ordinary income | | $ | 277,675,625 | |
| | | | |
Differences between income and/or capital gains as determined on a book basis and a tax basis are primarily due to differing treatments of bond discounts and premiums and equity-linked securities.
6. Investment Transactions
Purchases and sales of investments (excluding short term securities) for the year ended December 31, 2015, aggregated $1,852,907,115 and $2,574,974,930, respectively.
7. Credit Risk
At December 31, 2015, the Fund had 22.49% of its portfolio invested in high yield, senior secured floating rate notes, or other securities rated below investment grade. These securities may be more sensitive to economic conditions causing greater price volatility and are potentially subject to a greater risk of loss due to default than higher rated securities.
8. Restricted Securities
The Fund invests in securities that are restricted under the Securities Act of 1933 (1933 Act) or which are subject to legal, contractual, or other agreed upon restrictions on resale. Restricted securities are often purchased in private placement transactions, and cannot be sold without prior registration unless the sale is pursuant to an exemption under the 1933 Act. Disposal of these securities may require greater effort and expense, and prompt sale at an acceptable price may be difficult. The Fund may have registration rights for restricted securities. The issuer generally incurs all registration costs.
FRANKLIN TEMPLETON VARIABLE INSURANCE PRODUCTS TRUST
NOTES TO FINANCIAL STATEMENTS
Franklin Income VIP Fund (continued)
At December 31, 2015, the Fund held investments in restricted securities, excluding certain securities exempt from registration under the 1933 Act deemed to be liquid, as follows:
| | | | | | | | | | | | | | |
| Shares | | Issuer | | Acquisition
Date | | | Cost | | | Value | |
| 1,559,551 | | First Data Holdings Inc., B (Value is 0.39% of Net Assets) | | | 6/26/14 | | | $ | 19,718,400 | | | $ | 22,485,605 | |
| | | | | | | | | | |
9. Credit Facility
The Fund, together with other U.S. registered and foreign investment funds (collectively, Borrowers), managed by Franklin Templeton Investments, are borrowers in a joint syndicated senior unsecured credit facility totaling $2 billion (Global Credit Facility) which matured on February 12, 2016. This Global Credit Facility provides a source of funds to the Borrowers for temporary and emergency purposes, including the ability to meet future unanticipated or unusually large redemption requests. Effective February 12, 2016, the Borrowers renewed the Global Credit Facility for a one year term, maturing February 10, 2017, for a total of $2 billion.
Under the terms of the Global Credit Facility, the Fund shall, in addition to interest charged on any borrowings made by the Fund and other costs incurred by the Fund, pay its share of fees and expenses incurred in connection with the implementation and maintenance of the Global Credit Facility, based upon its relative share of the aggregate net assets of all of the Borrowers, including an annual commitment fee of 0.07% based upon the unused portion of the Global Credit Facility. Effective February 12, 2016, the annual commitment fee is 0.15%. These fees are reflected in other expenses in the Statement of Operations. During the year ended December 31, 2015, the Fund did not use the Global Credit Facility.
10. Fair Value Measurements
The Fund follows a fair value hierarchy that distinguishes between market data obtained from independent sources (observable inputs) and the Fund’s own market assumptions (unobservable inputs). These inputs are used in determining the value of the Fund’s financial instruments and are summarized in the following fair value hierarchy:
| | • | | Level 1 – quoted prices in active markets for identical financial instruments |
| | • | | Level 2 – other significant observable inputs (including quoted prices for similar financial instruments, interest rates, prepayment speed, credit risk, etc.) |
| | • | | Level 3 – significant unobservable inputs (including the Fund’s own assumptions in determining the fair value of financial instruments) |
The input levels are not necessarily an indication of the risk or liquidity associated with financial instruments at that level.
For movements between the levels within the fair value hierarchy, the Fund has adopted a policy of recognizing the transfers as of the date of the underlying event which caused the movement.
FRANKLIN TEMPLETON VARIABLE INSURANCE PRODUCTS TRUST
NOTES TO FINANCIAL STATEMENTS
Franklin Income VIP Fund (continued)
10. Fair Value Measurements (continued)
A summary of inputs used as of December 31, 2015, in valuing the Fund’s asset carried at fair value, is as follows:
| | | | | | | | | | | | | | | | |
| | | Level 1 | | | Level 2 | | | Level 3 | | | Total | |
| Assets: | | | | | | | | | | | | | | | | |
Investments in Securities: | | | | | | | | | | | | | | | | |
Equity Investments:a | | | | | | | | | | | | | | | | |
Energy | | $ | 523,278,656 | | | $ | 2,114,000 | | | $ | — | | | $ | 525,392,656 | |
Financials | | | 326,576,516 | | | | 4,987,500 | | | | — | | | | 331,564,016 | |
Industrials | | | 462,991,333 | | | | 12,723,547 | | | | — | | | | 475,714,880 | |
Information Technology | | | 328,452,868 | | | | — | | | | 22,485,605 | | | | 350,938,473 | |
All Other Equity Investmentsb | | | 1,824,413,250 | | | | — | | | | — | | | | 1,824,413,250 | |
Equity-Linked Securities | | | — | | | | 132,650,422 | | | | — | | | | 132,650,422 | |
Convertible Bonds | | | — | | | | 7,987,500 | | | | — | | | | 7,987,500 | |
Corporate Bonds | | | — | | | | 1,239,978,866 | | | | — | | | | 1,239,978,866 | |
Senior Floating Rate Interests | | | — | | | | 167,840,364 | | | | — | | | | 167,840,364 | |
Escrows and Litigation Trusts | | | — | | | | — | | | | — | c | | | — | |
Short Term Investments | | | 589,053,827 | | | | 223,929,818 | | | | — | | | | 812,983,645 | |
| | | | |
Total Investments in Securities | | $ | 4,054,766,450 | | | $ | 1,792,212,017 | | | $ | 22,485,605 | | | $ | 5,869,464,072 | |
| | | | |
aIncludes common, preferred, and convertible preferred stocks as well as other equity investments.
bFor detailed categories, see the accompanying Statement of Investments.
cIncludes securities determined to have no value at December 31 ,2015.
A reconciliation of assets in which Level 3 inputs are used in determining fair value is presented when there are significant Level 3 financial instruments at the end of the year.
11. Subsequent Events
The Fund has evaluated subsequent events through the issuance of the financial statements and determined that no events have occurred that require disclosure other than those already disclosed in the financial statements.
Abbreviations
| | | | | | |
| Currency | | Selected Portfolio |
| | | |
| EUR | | Euro | | ADR | | American Depositary Receipt |
| | | |
| | | | FHLB | | Federal Home Loan Bank |
| | | |
| | | | FNMA | | Federal National Mortgage Association |
| | | |
| | | | FRN | | Floating Rate Note |
| | | |
| | | | L/C | | Letter of Credit |
| | | |
| | | | MTN | | Medium Term Note |
| | | |
| | | | PIK | | Payment-In-Kind |
FRANKLIN TEMPLETON VARIABLE INSURANCE PRODUCTS TRUST
Report of Independent Registered Public Accounting Firm
Franklin Income VIP Fund
To the Board of Trustees and Shareholders of Franklin Templeton Variable Insurance Products Trust
In our opinion, the accompanying statement of assets and liabilities, including the statement of investments, and the related statements of operations and of changes in net assets and the financial highlights present fairly, in all material respects, the financial position of Franklin Income VIP Fund (the “Fund”) at December 31, 2015, the results of its operations for the year then ended, the changes in its net assets for each of the two years in the period then ended and the financial highlights for each of the periods presented, in conformity with accounting principles generally accepted in the United States of America. These financial statements and financial highlights (hereafter referred to as “financial statements”) are the responsibility of the Fund’s management. Our responsibility is to express an opinion on these financial statements based on our audit. We conducted our audit of these financial statements in accordance with the standards of the Public Company Accounting Oversight Board (United States). Those standards require that we plan and perform the audit to obtain reasonable assurance about whether the financial statements are free of material misstatement. An audit includes examining, on a test basis, evidence supporting the amounts and disclosures in the financial statements, assessing the accounting principles used and significant estimates made by management, and evaluating the overall financial statement presentation. We believe that our audit, which included confirmation of securities at December 31, 2015 by correspondence with the custodian, transfer agent and brokers, provides a reasonable basis for our opinion.
PricewaterhouseCoopers LLP
San Francisco, California
February 16, 2016
FRANKLIN TEMPLETON VARIABLE INSURANCE PRODUCTS TRUST
Tax Information (unaudited)
Franklin Income VIP Fund
Under Section 854(b)(1)(A) of the Internal Revenue Code, the Fund hereby reports 29.03% of the ordinary income dividends as income qualifying for the dividends received deduction for the fiscal year ended December 31, 2015.
Franklin Mutual Global Discovery VIP Fund
This annual report for Franklin Mutual Global Discovery VIP Fund covers the fiscal year ended December 31, 2015.
Class 4 Performance Summary as of December 31, 2015
Average annual total return of Class 4 shares* represents the average annual change in value, assuming reinvestment of dividends and capital gains. Average returns smooth out variations in returns, which can be significant; they are not the same as year-by-year results.
| | | | | | | | | | | | |
| Periods ended 12/31/15 | | 1-Year | | | 5-Year | | | 10-Year | |
Average Annual Total Return | | | -3.74% | | | | +7.31% | | | | +6.85% | |
*For the period beginning 2/29/08, Class 4 performance reflects a 12b-1 fee expense of 0.35% per year, which affects future performance. Class 4 performance prior to 2/29/08 reflects historical Class 1 performance, which does not have a 12b-1 fee expense. Since 2/29/08 (effective date), the average annual total return of Class 4 shares was +5.31%. The Fund has a fee waiver associated with any investment in a Franklin Templeton money fund, contractually guaranteed through at least its current fiscal year-end. Fund investment results reflect the fee waiver, to the extent applicable; without this reduction, the results would have been lower.
Performance reflects the Fund’s Class 4 operating expenses, but does not include any contract fees, expenses or sales charges. If they had been included, performance would be lower. These charges and deductions, particularly for variable life policies, can have a significant effect on contract values and insurance benefits. See the contract prospectus for a complete description of these expenses, including sales charges.
Performance data represent past performance, which does not guarantee future results. Investment return and principal value will fluctuate, and you may have a gain or loss when you sell your shares. Current performance may differ from figures shown.
Total Return Index Comparison for a Hypothetical $10,000 Investment (1/1/06–12/31/15)
The graph below shows the change in value of a hypothetical $10,000 investment in the Fund over the indicated period and includes reinvestment of any income or distributions. The Fund’s performance* is compared to the performance of the MSCI World Index and the Standard & Poor’s® 500 Index (S&P 500®). One cannot invest directly in an index, and an index is not representative of the Fund’s portfolio. Please see Important Notes to Performance Information preceding the Fund Summaries.
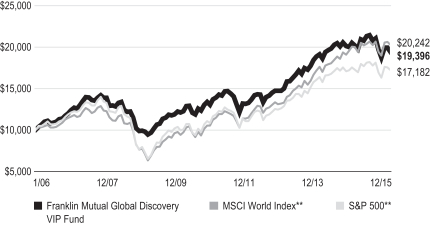
**Source: Morningstar. Please see Index Descriptions following the Fund Summaries.
FRANKLIN MUTUAL GLOBAL DISCOVERY VIP FUND
Fund Goal and Main Investments
The Fund seeks capital appreciation. Under normal market conditions, the Fund invests primarily in U.S. and foreign equity securities that the investment manager believes are undervalued.
Fund Risks
All investments involve risks, including possible loss of principal. Value securities may not increase in price as anticipated, or may decline further in value. The Fund’s investments in foreign securities involve certain risks including currency fluctuations, and economic and political uncertainties. Smaller company stocks have exhibited greater price volatility than larger company stocks, particularly over the short term. The Fund’s investments in companies engaged in mergers, reorganizations or liquidations also involve special risks as pending deals may not be completed on time or on favorable terms. The Fund may invest in lower rated bonds, which entail higher credit risk. The Fund is actively managed but there is no guarantee that the manager’s investment decisions will produce the desired results. The Fund’s prospectus also includes a description of the main investment risks.
Performance Overview
You can find the Fund’s one-year total return in the Performance Summary. In comparison, the Fund’s benchmark, the MSCI World Index, had a -0.32% total return and the S&P 500 posted a +1.38% total return for the same period.1
Economic and Market Overview
The global economy expanded moderately during the 12 months under review. As measured by the MSCI World Index, stocks in global developed markets overall were down slightly for the year despite some positive developments. Weighing on global stocks at times were worries about China’s slowing economy and tumbling stock market, declining commodity prices, geopolitical tensions between Russia and Turkey, and ongoing uncertainty over the U.S. Federal Reserve’s (Fed’s) timing for raising interest rates. Toward period-end, equity markets recovered somewhat as the Fed increased its federal funds target range for the first time in nine years, alleviating some uncertainty about a change in the U.S. monetary policy. During the year, oil prices declined sharply largely due to increased global supply that exceeded demand. Gold and other commodity prices also fell. The U.S. dollar appreciated against most currencies during the period, which reduced returns of many foreign assets in U.S. dollar terms.
U.S. economic growth slowed in 2015’s first quarter but strengthened in 2015’s second quarter amid healthy consumer spending. The third and fourth quarters were less robust as exports slowed and state and local governments reduced their spending. At its December meeting, the Fed increased its target range for the federal funds rate to 0.25%–0.50%, as policymakers cited the labor market’s considerable improvement and were reasonably confident that inflation would move back to the Fed’s 2% medium-term objective. Furthermore, the Fed raised its forecast for 2016 U.S. economic growth and lowered its unemployment projections.
In Europe, U.K. economic growth gained momentum from the services sector, but the economy slowed in 2015 compared with 2014. The eurozone grew moderately and generally benefited during the period from lower oil prices, a weaker euro that supported exports, the European Central Bank’s (ECB’s) accommodative policy and expectations of further ECB stimulus. Although the eurozone’s annual inflation rate declined early in the period, it rose slightly during the rest of the period. The ECB maintained its benchmark interest rates although it reduced its bank deposit rate in December, seeking to boost the region’s slowing growth
Japan’s economy continued to grow in 2015’s first quarter. After a decline in the second quarter of 2015, it expanded in the third quarter as capital expenditures improved. The Bank of Japan took several actions during the reporting period, including maintaining its monetary policy, lowering its economic growth and inflation forecasts, and reorganizing its stimulus program to increase exposure to long-term government bonds and exchange-traded funds.
In emerging markets, economic growth generally moderated. In China, the government’s intervention to cool domestic stock market speculation and its effective currency devaluation led to a severe slump in emerging market stocks from June through August. In October, emerging market equities gained after China expanded its monetary and fiscal stimulus to support its economy. In Brazil, falling prices for energy and other commodities coincided with an economic recession, rising unemployment and political uncertainty, leading to equity weakness and currency depreciation. Emerging equity markets recovered some of their losses after the Fed increased its target interest rate in December. Central bank actions varied across emerging markets during the 12 months under review, as some banks raised interest rates in response to rising inflation and weakening currencies, while others lowered interest rates to
1. Source: Morningstar.
One cannot invest directly in an index, and an index is not representative of the Fund’s portfolio. Please see Index Descriptions following the Fund Summaries.
FRANKLIN MUTUAL GLOBAL DISCOVERY VIP FUND
promote economic growth. In the recent global environment, emerging market stocks overall, as measured by the MSCI Emerging Markets Index, fell for the 12-month period.2
Investment Strategy
At Franklin Mutual Series, we are committed to our distinctive value approach to investing. Our major investment strategy is investing in undervalued stocks. When selecting undervalued equities, we are attracted to what we believe are fundamentally strong companies with healthy balance sheets, high-quality assets, substantial free cash flow and shareholder-oriented management teams and whose stocks are trading at discounts to our assessment of the companies’ intrinsic or business value. We also look for asset-rich companies whose shares may be trading at depressed levels due to concerns over short-term earnings disappointments, litigation, management strategy or other perceived negatives. While the vast majority of our undervalued equity investments are made in publicly traded companies globally, we may invest occasionally in privately held companies as well.
We complement this more traditional investment strategy with two others. One is distressed investing, which is complex and can take many forms. The most common distressed investment the Fund undertakes is the purchase of financially troubled or bankrupt companies’ debt at a substantial discount to face value. After the financially distressed company is reorganized, often in bankruptcy court, the old debt is typically replaced with new securities issued by the financially stronger company.
The other piece of our investment strategy is participating in arbitrage situations, another highly specialized field. When companies announce proposed mergers or takeovers, commonly referred to as “deals,” the target company may trade at a discount to the bid it ultimately accepts. One form of arbitrage involves purchasing the target company’s stock when it is trading below the value we believe it would receive in a deal. In keeping with our commitment to a relatively conservative investment approach, we typically focus our arbitrage efforts on announced deals, and eschew rumored deals or other situations we consider relatively risky.
In addition, it is our practice to hedge the Fund’s currency exposure when we deem it advantageous for our shareholders.
What is meant by “hedge”?
To hedge an investment is to take a position intended to offset potential losses/gains that may be incurred by a companion financial instrument.
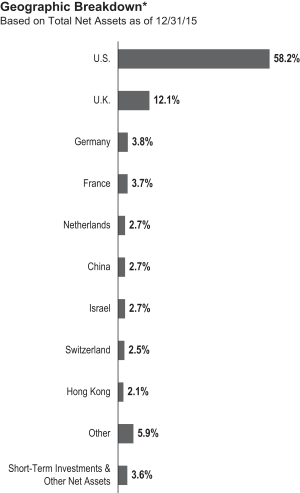
*Figures are stated as a percentage of total and may not equal 100% or may be negative due to rounding, use of any derivatives, unsettled trades or other factors.
Manager’s Discussion
During the 12 months under review, stocks in most global markets declined after a three-year ascent. Globally, several major central banks became more accommodative while fiscal authorities focused on budgetary discipline. Large companies also remained disciplined about operating costs, with margins at historically high levels in many industries and countries. To drive further growth, an increasing number of companies looked to acquisitions, taking advantage of low interest rates to finance deals. In this environment, we saw a number of opportunities.
Equity prices are typically forward looking, reflecting investors’ beliefs about how various factors and events will play out in the
2. Please see Index Descriptions following the Fund Summaries.
FRANKLIN MUTUAL GLOBAL DISCOVERY VIP FUND
future. Global equity prices at period-end were down from mid-2015 highs, reflecting increased uncertainty among global investors regarding China and other emerging markets, global commodity prices, U.S. monetary policy divergence and geopolitical events. However, with the support of global quantitative easing, many corporations have been able to build strong balance sheets, focus intensely on improving efficiency, maintain historically high margins and return a significant amount of capital to shareholders.
Merger and acquisition (M&A) activity accelerated in the past 12 months, helping to support valuations. Deal volumes reached historical highs and regulators globally increased their scrutiny of potential negative effects of high concentration. Such an environment — active M&A combined with regulatory uncertainty, greater complexity and market volatility — may provide attractive investment opportunities. We seek to use a mixture of merger arbitrage positions — positions constructed solely to benefit from deal completion — and investments in one or both of the companies involved in a deal to benefit from deal spread and from possible value creation once the deal is completed.
Distressed debt remained a difficult market for us to find compelling new opportunities. Low interest rates have kept credit widely available, and we saw few actual bankruptcies. Increased stress in high yield markets, particularly in energy credit, has expanded the potential opportunity set for us. For non-energy firms, costs of issuing debt are climbing and these debt securities are starting to look attractive to us. Within energy, declining commodity prices increased financial pressures for a growing number of issuers. At year-end, a record level of crude oil inventories and insistence by Saudi Arabia that it will not reduce production provide little reason to expect a quick recovery in crude oil prices, implying to us an increased likelihood of new investment opportunities in energy sector debt.
Turning to Fund performance, top contributors included multinational software company Microsoft, insurer NN Group and pharmaceutical company Eli Lilly & Co.
Shares of Microsoft rose as earnings improved and the company’s cloud computing services gained momentum. In April and October, Microsoft’s quarterly earnings exceeded consensus estimates despite a challenging environment for personal computer sales. Revenue outperformance and cost controls helped drive the solid results, highlighted by the strong performance of Microsoft’s cloud computing operations, which include Azure and Office365. We believe Microsoft’s cloud computing business
| | | | |
| Top 10 Sectors/Industries | | | |
| 12/31/15 | | | |
| | | % of Total
Net Assets | |
| Banks | | | 17.6% | |
| Insurance | | | 11.0% | |
| Pharmaceuticals | | | 8.0% | |
| Software | | | 6.6% | |
| Oil, Gas & Consumable Fuels | | | 5.7% | |
| Tobacco | | | 5.4% | |
| Media | | | 4.4% | |
| Food & Staples Retailing | | | 3.6% | |
| Health Care Equipment & Supplies | | | 3.2% | |
| Communications Equipment | | | 2.6% | |
has the potential to grow and become increasingly profitable as technology users become more comfortable relying on cloud infrastructure and applications. Supporting this belief were the company’s assertions that the growth in Office365 subscriptions began to fully offset the decline in transactional, one-time license purchases. October’s quarterly results also showed strength in the adoption of Microsoft’s new Windows 10 operating system.
NN Group is a Dutch insurer spun out of ING Groep. The company followed through successfully on its efforts to reduce expenses and improve return on equity, a measure of the amount earned on a company’s common stock investment. Results for several quarters were positive, and the company stated in November that it had reached its expense savings target a year early but would continue to push for further efficiencies. The company also periodically repurchased shares from ING Groep to help meet ING’s goal to fully divest its insurance and investment management holdings by the end of 2016, as required under ING’s restructuring agreement with the European Commission.
U.S.-based Eli Lilly & Co. performed well in 2015 as the market, in our view, gained more appreciation for the company’s strong research and development capabilities and deep pipeline. Driving the increased appreciation was Eli Lilly’s substantial progress during the year on several new product approvals including an oncology compound, regulatory submissions including for a psoriasis treatment and positive late-stage data disclosures including a drug for rheumatoid arthritis. Also, in September, Eli Lilly and drug maker Boehringer Ingelheim (a private company) announced that their jointly owned diabetes
FRANKLIN MUTUAL GLOBAL DISCOVERY VIP FUND
drug significantly reduced cardiovascular risk. Eli Lilly’s 2015 operating performance was also strong as the company raised its earnings guidance in July and reported solid sales performance and profit margin progress in October. We believe Eli Lilly has many attractive assets targeting end markets with high unmet medical needs that, in our assessment, position its business to generate strong long-term revenues and free cash flows.
During the period under review, Fund investments that negatively affected performance included electricity producer NRG Energy, utility Texas Competitive Electric Holdings (TCEH) and oil and gas exploration and production company Marathon Oil.
NRG Energy is a U.S.-based integrated wholesale power generation and retail electricity company that includes solar and renewable energy businesses. The stock price declined in 2015 as natural gas and coal prices fell, resulting in lower revenues for NRG’s wholesale power operation, which sells electricity at market rates that move in line with fuel costs. In mid-December, the price of natural gas retreated to its lowest level since 2002. Investors also became increasingly unhappy with the short-term lack of return on investment from the company’s solar power business. As a result, NRG announced in September that it would package its solar power, electric vehicle charging and renewable energy operations into a new company.
The value of our TCEH debt holdings declined in 2015 due to lower natural gas and coal prices that reduced the market rates for the company’s electricity sales. Notably, in early December, natural gas retreated to its lowest price in over a decade. TCEH is a unit of Energy Future Holdings, the largest power company in Texas, which filed for bankruptcy in 2014 after defaulting on debt associated with a $45 billion leveraged buyout of the company in 2007, just as energy prices began to decline. The company intends to emerge from bankruptcy in 2016 with less leverage on its balance sheet.
Marathon Oil’s stock price closely followed the decline in crude oil. In October, Marathon Oil announced a dividend cut, a move that preserves capital and puts the company’s capital allocation policies more in line with its exploration and production peer group, in our analysis. We believed this move could allow for a smaller reduction in capital spending and a corresponding improvement in its production profile, which we welcomed given the returns available from the company’s resource base. The company also announced a significant reduction in its deepwater exploration program, an action we viewed favorably given the program’s lackluster returns in recent years. We continued to believe that Marathon Oil’s relatively low-cost assets would enable it to weather the current downturn with the potential to generate strong returns if the environment improves.
| | | | |
| Top 10 Equity Holdings | | | |
| 12/31/15 | | | |
Company Sector/Industry, Country | | % of Total
Net Assets | |
Microsoft Corp.
Software, U.S. | | | 3.7% | |
Merck & Co. Inc.
Pharmaceuticals, U.S. | | | 2.7% | |
Wells Fargo & Co.
Banks, U.S. | | | 2.5% | |
American International Group Inc.
Insurance, U.S. | | | 2.2% | |
ACE Ltd.
Insurance, U.S. | | | 2.1% | |
Medtronic PLC
Health Care Equipment & Supplies, U.S. | | | 2.0% | |
British American Tobacco PLC
Tobacco, U.K. | | | 1.8% | |
NN Group NV
Insurance, Netherlands | | | 1.8% | |
Citigroup Inc.
Banks, U.S. | | | 1.7% | |
Vodafone Group PLC
Wireless Telecommunication Services, U.K. | | | 1.7% | |
The dollar value, number of shares or principal amount, and names of all portfolio holdings are listed in the Fund’s Statement of Investments.
During the period, the Fund held currency forwards and futures to somewhat hedge the currency risk of the portfolio’s non-U.S. dollar investments. The currency forwards had a positive impact on the Fund’s performance during the period, and currency futures had a negligible impact.
What is a currency forward contract?
A currency forward contract, or a currency forward, is an agreement between the Fund and a counterparty to buy or sell a foreign currency at a specific exchange rate on a future date.
What is a futures contract?
A futures contract, or a future, is an agreement between the Fund and a counterparty made through a U.S. or foreign futures exchange to buy or sell an underlying instrument or asset at a specific price on a future date.
FRANKLIN MUTUAL GLOBAL DISCOVERY VIP FUND
Thank you for your participation in Franklin Mutual Global Discovery VIP Fund. We look forward to serving your future investment needs.
The foregoing information reflects our analysis, opinions and portfolio holdings as of December 31, 2015, the end of the reporting period. The way we implement our main investment strategies and the resulting portfolio holdings may change depending on factors such as market and economic conditions. These opinions may not be relied upon as investment advice or an offer for a particular security. The information is not a complete analysis of every aspect of any market, country, industry, security or the Fund. Statements of fact are from sources considered reliable, but the investment manager makes no representation or warranty as to their completeness or accuracy. Although historical performance is no guarantee of future results, these insights may help you understand our investment management philosophy.
FRANKLIN MUTUAL GLOBAL DISCOVERY VIP FUND
Class 4 Fund Expenses
As an investor in a variable insurance contract (Contract) that indirectly provides for investment in an underlying mutual fund, you can incur transaction and/or ongoing expenses at both the Fund level and the Contract level.
| • | | Transaction expenses can include sales charges (loads) on purchases, redemption fees, surrender fees, transfer fees and premium taxes. |
| • | | Ongoing expenses can include management fees, distribution and service (12b-1) fees, contract fees, annual maintenance fees, mortality and expense risk fees and other fees and expenses. All mutual funds and Contracts have some types of ongoing expenses. |
The expenses shown in the table are meant to highlight ongoing expenses at the Fund level only and do not include ongoing expenses at the Contract level, or transaction expenses at either the Fund or Contract level. While the Fund does not have transaction expenses, if the transaction and ongoing expenses at the Contract level were included, the expenses shown below would be higher. You should consult your Contract prospectus or disclosure document for more information.
The table shows Fund-level ongoing expenses and can help you understand these expenses and compare them with those of other mutual funds offered through the Contract. The table assumes a $1,000 investment held for the six months indicated. Please refer to the Fund prospectus for additional information on operating expenses.
Actual Fund Expenses
The first line (Actual) of the table provides actual account values and expenses. The “Ending Account Value” is derived from the Fund’s actual return, which includes the effect of ongoing Fund expenses, but does not include the effect of ongoing Contract expenses.
You can estimate the Fund-level expenses you incurred during the period by following these steps. Of course, your account value and expenses will differ from those in this illustration:
| 1. | Divide your account value by $1,000. |
If an account had an $8,600 value, then $8,600 ÷ $1,000 = 8.6.
| 2. | Multiply the result by the number under the heading “Fund-Level Expenses Incurred During Period.” |
If Fund-Level Expenses Incurred During Period were $7.50, then 8.6 × $7.50 = $64.50.
In this illustration, the estimated expenses incurred this period at the Fund level are $64.50.
Hypothetical Example for Comparison
with Other Mutual Funds
Information in the second line (Hypothetical) of the table can help you compare ongoing expenses of the Fund with those of other mutual funds offered through the Contract. This information may not be used to estimate the actual ending account balance or expenses you incurred during the period. The hypothetical “Ending Account Value” is based on the Fund’s actual expense ratio and an assumed 5% annual rate of return before expenses, which does not represent the Fund’s actual return. The figure under the heading “Fund-Level Expenses Incurred During Period” shows the hypothetical expenses your account would have incurred under this scenario. You can compare this figure with the 5% hypothetical examples that appear in shareholder reports of other funds offered through a Contract.
| | | | | | | | | | | | |
| Class 4 | | Beginning Account Value 7/1/15 | | | Ending Account Value 12/31/15 | | | Fund-Level Expenses
Incurred During Period* 7/1/15–12/31/15 | |
Actual | | | $1,000 | | | | $ 934.60 | | | | $6.68 | |
Hypothetical (5% return before expenses) | | | $1,000 | | | | $1,018.30 | | | | $6.97 | |
*Expenses are calculated using the most recent six-month annualized expense ratio, net of expense waivers, for the Fund’s Class 4 shares (1.37%), which does not include any ongoing expenses of the Contract for which the Fund is an investment option, multiplied by the average account value over the period, multiplied by 184/365 to reflect the one-half year period.
FRANKLIN TEMPLETON VARIABLE INSURANCE PRODUCTS TRUST
Financial Highlights
Franklin Mutual Global Discovery VIP Fund
| | | | | | | | | | | | | | | | | | | | |
| | | Year Ended December 31, | |
| | | 2015 | | | 2014 | | | 2013 | | | 2012 | | | 2011 | |
| Class 1 | | | | | | | | | | | | | | | | | | | | |
Per share operating performance
(for a share outstanding throughout the year) | | | | | | | | | | | | | | | | | | | | |
| | | | | |
Net asset value, beginning of year | | | $22.61 | | | | $23.31 | | | | $20.55 | | | | $19.66 | | | | $21.16 | |
| | | | |
| | | | | |
| Income from investment operationsa: | | | | | | | | | | | | | | | | | | | | |
| | | | | |
Net investment incomeb | | | 0.37 | | | | 0.68 | c | | | 0.46 | | | | 0.43 | | | | 0.52 | |
| | | | | |
Net realized and unrealized gains (losses) | | | (1.17 | ) | | | 0.76 | | | | 5.03 | | | | 2.21 | | | | (1.09 | ) |
| | | | |
Total from investment operations | | | (0.80 | ) | | | 1.44 | | | | 5.49 | | | | 2.64 | | | | (0.57 | ) |
| | | | |
| | | | | |
| Less distributions from: | | | | | | | | | | | | | | | | | | | | |
| | | | | |
Net investment income | | | (0.69 | ) | | | (0.57 | ) | | | (0.58 | ) | | | (0.64 | ) | | | (0.50 | ) |
| | | | | |
Net realized gains | | | (1.27 | ) | | | (1.57 | ) | | | (2.15 | ) | | | (1.11 | ) | | | (0.43 | ) |
| | | | |
Total distributions | | | (1.96 | ) | | | (2.14 | ) | | | (2.73 | ) | | | (1.75 | ) | | | (0.93 | ) |
| | | | |
Net asset value, end of year | | | $19.85 | | | | $22.61 | | | | $23.31 | | | | $20.55 | | | | $19.66 | |
| | | | |
| | | | | |
Total returnd | | | (3.39)% | | | | 5.98% | | | | 27.95% | | | | 13.63% | | | | (2.73)% | |
| | | | | |
| Ratios to average net assets | | | | | | | | | | | | | | | | | | | | |
| | | | | |
Expensese | | | 1.02% | f,g | | | 1.00% | f | | | 0.97% | f | | | 0.99% | | | | 0.97% | f |
| | | | | |
Expenses incurred in connection with securities sold short | | | 0.02% | | | | 0.03% | | | | —% | h | | | —% | h | | | —% | h |
| | | | | |
Net investment income | | | 1.71% | | | | 2.85% | c | | | 2.13% | | | | 2.12% | | | | 2.34% | |
| | | | | |
| Supplemental data | | | | | | | | | | | | | | | | | | | | |
| | | | | |
Net assets, end of year (000’s) | | | $2,632 | | | | $2,313 | | | | $2,465 | | | | $1,136 | | | | $974 | |
| | | | | |
Portfolio turnover rate | | | 21.88% | | | | 22.18% | | | | 15.58% | | | | 25.63% | | | | 26.17% | i |
aThe amount shown for a share outstanding throughout the period may not correlate with the Statement of Operations for the period due to the timing of sales and repurchases of the Fund’s shares in relation to income earned and/or fluctuating fair value of the investments of the Fund.
bBased on average daily shares outstanding.
cNet investment income per share includes approximately $0.34 per share related to income received in the form of special dividends in connection with certain Fund’s holdings. Excluding these amounts, the ratio of net investment income to average net assets would have been 1.40%.
dTotal return does not include fees, charges or expenses imposed by the variable annuity and life insurance contracts for which the Franklin Templeton Variable Insurance Products Trust serves as an underlying investment vehicle.
eIncludes dividend and/or interest expense on securities sold short and security borrowing fees, if any. See below for the ratios of such expenses to average net assets for the periods presented. See Note 1(f).
fBenefit of expense reduction rounds to less than 0.01%.
gBenefit of waiver and payments by affiliates rounds to less than 0.01%.
hRounds to less than 0.01%.
iExcludes the value of portfolio securities delivered as a result of a redemption in-kind.
| | | | |
| MGD-8 | | Annual Report | The accompanying notes are an integral part of these financial statements. | | |
FRANKLIN TEMPLETON VARIABLE INSURANCE PRODUCTS TRUST
FINANCIAL HIGHLIGHTS
Franklin Mutual Global Discovery VIP Fund (continued)
| | | | | | | | | | | | | | | | | | | | |
| | | Year Ended December 31, | |
| | | 2015 | | | 2014 | | | 2013 | | | 2012 | | | 2011 | |
| Class 2 | | | | | | | | | | | | | | | | | | | | |
Per share operating performance
(for a share outstanding throughout the year) | | | | | | | | | | | | | | | | | | | | |
| | | | | |
Net asset value, beginning of year | | | $22.11 | | | | $22.84 | | | | $20.17 | | | | $19.30 | | | | $20.80 | |
| | | | |
| | | | | |
| Income from investment operationsa: | | | | | | | | | | | | | | | | | | | | |
| | | | | |
Net investment incomeb | | | 0.32 | | | | 0.60 | c | | | 0.42 | | | | 0.38 | | | | 0.43 | |
| | | | | |
Net realized and unrealized gains (losses) | | | (1.16 | ) | | | 0.75 | | | | 4.92 | | | | 2.15 | | | | (1.04 | ) |
| | | | |
Total from investment operations | | | (0.84 | ) | | | 1.35 | | | | 5.34 | | | | 2.53 | | | | (0.61 | ) |
| | | | |
| | | | | |
| Less distributions from: | | | | | | | | | | | | | | | | | | | | |
| | | | | |
Net investment income | | | (0.63 | ) | | | (0.51 | ) | | | (0.52 | ) | | | (0.55 | ) | | | (0.46 | ) |
| | | | | |
Net realized gains | | | (1.27 | ) | | | (1.57 | ) | | | (2.15 | ) | | | (1.11 | ) | | | (0.43 | ) |
| | | | |
Total distributions | | | (1.90 | ) | | | (2.08 | ) | | | (2.67 | ) | | | (1.66 | ) | | | (0.89 | ) |
| | | | |
Net asset value, end of year | | | $19.37 | | | | $22.11 | | | | $22.84 | | | | $20.17 | | | | $19.30 | |
| | | | |
| | | | | |
Total returnd | | | (3.65)% | | | | 5.71% | | | | 27.61% | | | | 13.36% | | | | (2.96)% | |
| | | | | |
| Ratios to average net assets | | | | | | | | | | | | | | | | | | | | |
| | | | | |
Expensese | | | 1.27% | f,g | | | 1.25% | f | | | 1.22% | f | | | 1.24% | | | | 1.22% | f |
| | | | | |
Expenses incurred in connection with securities sold short | | | 0.02% | | | | 0.03% | | | | —% | h | | | —% | h | | | —% | h |
| | | | | |
Net investment income | | | 1.46% | | | | 2.60% | c | | | 1.88% | | | | 1.87% | | | | 2.09% | |
| | | | | |
| Supplemental data | | | | | | | | | | | | | | | | | | | | |
| | | | | |
Net assets, end of year (000’s) | | | $629,366 | | | | $685,711 | | | | $684,780 | | | | $660,465 | | | | $712,161 | |
| | | | | |
Portfolio turnover rate | | | 21.88% | | | | 22.18% | | | | 15.58% | | | | 25.63% | | | | 26.17% | i |
aThe amount shown for a share outstanding throughout the period may not correlate with the Statement of Operations for the period due to the timing of sales and repurchases of the Fund’s shares in relation to income earned and/or fluctuating fair value of the investments of the Fund.
bBased on average daily shares outstanding.
cNet investment income per share includes approximately $0.34 per share related to income received in the form of special dividends in connection with certain Fund’s holdings. Excluding these amounts, the ratio of net investment income to average net assets would have been 1.15%.
dTotal return does not include fees, charges or expenses imposed by the variable annuity and life insurance contracts for which the Franklin Templeton Variable Insurance Products Trust serves as an underlying investment vehicle.
eIncludes dividend and/or interest expense on securities sold short and security borrowing fees, if any. See below for the ratios of such expenses to average net assets for the periods presented. See Note 1(f).
fBenefit of expense reduction rounds to less than 0.01%.
gBenefit of waiver and payments by affiliates rounds to less than 0.01%.
hRounds to less than 0.01%.
iExcludes the value of portfolio securities delivered as a result of a redemption in-kind.
| | | | | | |
| | | The accompanying notes are an integral part of these financial statements. | Annual Report | | | MGD-9 | |
FRANKLIN TEMPLETON VARIABLE INSURANCE PRODUCTS TRUST
FINANCIAL HIGHLIGHTS
Franklin Mutual Global Discovery VIP Fund (continued)
| | | | | | | | | | | | | | | | | | | | |
| | | Year Ended December 31, | |
| | | 2015 | | | 2014 | | | 2013 | | | 2012 | | | 2011 | |
| Class 4 | | | | | | | | | | | | | | | | | | | | |
Per share operating performance
(for a share outstanding throughout the year) | | | | | | | | | | | | | | | | | | | | |
| | | | | |
Net asset value, beginning of year | | | $22.39 | | | | $23.10 | | | | $20.38 | | | | $19.50 | | | | $21.02 | |
| | | | |
| | | | | |
| Income from investment operationsa: | | | | | | | | | | | | | | | | | | | | |
| | | | | |
Net investment incomeb | | | 0.30 | | | | 0.61 | c | | | 0.40 | | | | 0.36 | | | | 0.40 | |
| | | | | |
Net realized and unrealized gains (losses) | | | (1.17 | ) | | | 0.73 | | | | 4.97 | | | | 2.19 | | | | (1.05 | ) |
| | | | |
Total from investment operations | | | (0.87 | ) | | | 1.34 | | | | 5.37 | | | | 2.55 | | | | (0.65 | ) |
| | | | |
| | | | | |
| Less distributions from: | | | | | | | | | | | | | | | | | | | | |
| | | | | |
Net investment income | | | (0.59 | ) | | | (0.48 | ) | | | (0.50 | ) | | | (0.56 | ) | | | (0.44 | ) |
| | | | | |
Net realized gains | | | (1.27 | ) | | | (1.57 | ) | | | (2.15 | ) | | | (1.11 | ) | | | (0.43 | ) |
| | | | |
Total distributions | | | (1.86 | ) | | | (2.05 | ) | | | (2.65 | ) | | | (1.67 | ) | | | (0.87 | ) |
| | | | |
Net asset value, end of year | | | $19.66 | | | | $22.39 | | | | $23.10 | | | | $20.38 | | | | $19.50 | |
| | | | |
| | | | | |
Total returnd | | | (3.74)% | | | | 5.60% | | | | 27.52% | | | | 13.27% | | | | (3.08)% | |
| | | | | |
| Ratios to average net assets | | | | | | | | | | | | | | | | | | | | |
| | | | | |
Expensese | | | 1.37% | f,g | | | 1.35% | f | | | 1.32% | f | | | 1.34% | | | | 1.32% | f |
| | | | | |
Expenses incurred in connection with securities sold short | | | 0.02% | | | | 0.03% | | | | —% | h | | | —% | h | | | —% | h |
| | | | | |
Net investment income | | | 1.36% | | | | 2.50% | c | | | 1.78% | | | | 1.77% | | | | 1.99% | |
| | | | | |
| Supplemental data | | | | | | | | | | | | | | | | | | | | |
| | | | | |
Net assets, end of year (000’s) | | | $49,054 | | | | $59,961 | | | | $70,354 | | | | $62,346 | | | | $66,695 | |
| | | | | |
Portfolio turnover rate | | | 21.88% | | | | 22.18% | | | | 15.58% | | | | 25.63% | | | | 26.17% | i |
aThe amount shown for a share outstanding throughout the period may not correlate with the Statement of Operations for the period due to the timing of sales and repurchases of the Fund’s shares in relation to income earned and/or fluctuating fair value of the investments of the Fund.
bBased on average daily shares outstanding.
cNet investment income per share includes approximately $0.34 per share related to income received in the form of special dividends in connection with certain Fund’s holdings. Excluding these amounts, the ratio of net investment income to average net assets would have been 1.05%.
dTotal return does not include fees, charges or expenses imposed by the variable annuity and life insurance contracts for which the Franklin Templeton Variable Insurance Products Trust serves as an underlying investment vehicle.
eIncludes dividend and/or interest expense on securities sold short and security borrowing fees, if any. See below for the ratios of such expenses to average net assets for the periods presented. See Note 1(f).
fBenefit of expense reduction rounds to less than 0.01%.
gBenefit of waiver and payments by affiliates rounds to less than 0.01%.
hRounds to less than 0.01%.
iExcludes the value of portfolio securities delivered as a result of a redemption in-kind.
| | | | |
| MGD-10 | | Annual Report | The accompanying notes are an integral part of these financial statements. | | |
FRANKLIN TEMPLETON VARIABLE INSURANCE PRODUCTS TRUST
Statement of Investments, December 31, 2015
| | | | | | | | | | | | | | |
Franklin Mutual Global Discovery VIP Fund | | | | |
| | | | | Country | | | Shares/Units | | | Value | |
| | Common Stocks and Other Equity Interests 91.8% | | | | | | | | | | | | |
| | Aerospace & Defense 0.6% | | | | | | | | | | | | |
| | B/E Aerospace Inc. | | | United States | | | | 65,840 | | | $ | 2,789,641 | |
| a | | KLX Inc. | | | United States | | | | 32,920 | | | | 1,013,607 | |
| | | | | | | | | | | | | | |
| | | | | | | | | | | | | 3,803,248 | |
| | | | | | | | | | | | | | |
| | Auto Components 0.7% | | | | | | | | | | | | |
| | Cie Generale des Etablissements Michelin, B | | | France | | | | 30,800 | | | | 2,940,826 | |
| a,b | | International Automotive Components Group Brazil LLC | | | Brazil | | | | 424,073 | | | | 4,361 | |
| a,b,c | | International Automotive Components Group North America LLC | | | United States | | | | 4,052,916 | | | | 2,188,027 | |
| | | | | | | | | | | | | | |
| | | | | | | | | | | | | 5,133,214 | |
| | | | | | | | | | | | | | |
| | Automobiles 1.5% | | | | | | | | | | | | |
| | General Motors Co. | | | United States | | | | 214,110 | | | | 7,281,881 | |
| | Hyundai Motor Co. | | | South Korea | | | | 20,953 | | | | 2,656,318 | |
| | | | | | | | | | | | | | |
| | | | | | | | | | | | | 9,938,199 | |
| | | | | | | | | | | | | | |
| | Banks 17.6% | | | | | | | | | | | | |
| | Barclays PLC | | | United Kingdom | | | | 2,052,511 | | | | 6,622,378 | |
| | BNP Paribas SA | | | France | | | | 117,870 | | | | 6,687,335 | |
| | Capital Bank Financial Corp., A | | | United States | | | | 78,494 | | | | 2,510,238 | |
| d | | Capital Bank Financial Corp., B, 144A, non-voting | | | United States | | | | 269,922 | | | | 8,632,106 | |
| | CIT Group Inc. | | | United States | | | | 174,912 | | | | 6,944,007 | |
| | Citigroup Inc. | | | United States | | | | 229,050 | | | | 11,853,338 | |
| | Citizens Financial Group Inc. | | | United States | | | | 310,923 | | | | 8,143,073 | |
| a | | Commerzbank AG | | | Germany | | | | 655,995 | | | | 6,820,764 | |
| | HSBC Holdings PLC | | | United Kingdom | | | | 586,355 | | | | 4,634,151 | |
| | JPMorgan Chase & Co. | | | United States | | | | 131,280 | | | | 8,668,418 | |
| | KB Financial Group Inc. | | | South Korea | | | | 56,047 | | | | 1,580,824 | |
| | PNC Financial Services Group Inc. | | | United States | | | | 112,821 | | | | 10,752,970 | |
| a | | Royal Bank of Scotland Group PLC | | | United Kingdom | | | | 1,372,969 | | | | 6,111,536 | |
| | Societe Generale SA | | | France | | | | 118,614 | | | | 5,484,909 | |
| | Standard Chartered PLC | | | United Kingdom | | | | 374,211 | | | | 3,109,190 | |
| | SunTrust Banks Inc. | | | United States | | | | 111,578 | | | | 4,780,002 | |
| | Wells Fargo & Co. | | | United States | | | | 307,140 | | | | 16,696,130 | |
| | | | | | | | | | | | | | |
| | | | | | | | | | | | | 120,031,369 | |
| | | | | | | | | | | | | | |
| | Beverages 1.9% | | | | | | | | | | | | |
| | PepsiCo Inc. | | | United States | | | | 90,367 | | | | 9,029,470 | |
| | SABMiller PLC | | | United Kingdom | | | | 61,920 | | | | 3,714,110 | |
| | | | | | | | | | | | | | |
| | | | | | | | | | | | | 12,743,580 | |
| | | | | | | | | | | | | | |
| | Capital Markets 0.6% | | | | | | | | | | | | |
| | UBS Group AG | | | Switzerland | | | | 208,825 | | | | 4,068,128 | |
| | | | | | | | | | | | | | |
| | Communications Equipment 2.6% | | | | | | | | | | | | |
| | Cisco Systems Inc. | | | United States | | | | 359,180 | | | | 9,753,533 | |
| | Nokia Corp., ADR | | | Finland | | | | 519,486 | | | | 3,646,792 | |
| | Nokia OYJ, A | | | Finland | | | | 611,269 | | | | 4,379,020 | |
| | | | | | | | | | | | | | |
| | | | | | | | | | | | | 17,779,345 | |
| | | | | | | | | | | | | | |
| | Construction Materials 0.6% | | | | | | | | | | | | |
| a | | LafargeHolcim Ltd., B | | | Switzerland | | | | 78,676 | | | | 3,949,504 | |
| | | | | | | | | | | | | | |
| | Consumer Finance 0.4% | | | | | | | | | | | | |
| a | | Ally Financial Inc. | | | United States | | | | 151,600 | | | | 2,825,824 | |
| | | | | | | | | | | | | | |
FRANKLIN TEMPLETON VARIABLE INSURANCE PRODUCTS TRUST
STATEMENT OF INVESTMENTS
Franklin Mutual Global Discovery VIP Fund (continued)
| | | | | | | | | | | | | | |
| | | | | Country | | | Shares/Units | | | Value | |
| | Common Stocks and Other Equity Interests (continued) | | | | | | | | | | | | |
| | Diversified Consumer Services 0.1% | | | | | | | | | | | | |
| a | | Cengage Learning Holdings II LP | | | United States | | | | 22,762 | | | $ | 523,526 | |
| | | | | | | | | | | | | | |
| | Diversified Telecommunication Services 0.9% | | | | | | | | | | | | |
| | China Telecom Corp. Ltd., H | | | China | | | | 13,642,104 | | | | 6,407,264 | |
| a,e,f | | Global Crossing Holdings Ltd., Contingent Distribution | | | United States | | | | 2,236,777 | | | | — | |
| | | | | | | | | | | | | | |
| | | | | | | | | | | | | 6,407,264 | |
| | | | | | | | | | | | | | |
| | Energy Equipment & Services 1.2% | | | | | | | | | | | | |
| | Baker Hughes Inc. | | | United States | | | | 178,964 | | | | 8,259,189 | |
| | | | | | | | | | | | | | |
| | Food & Staples Retailing 3.6% | | | | | | | | | | | | |
| | CVS Health Corp. | | | United States | | | | 46,236 | | | | 4,520,494 | |
| | Empire Co. Ltd., A | | | Canada | | | | 216,579 | | | | 4,030,032 | |
| | Metro AG | | | Germany | | | | 226,924 | | | | 7,286,427 | |
| | Walgreens Boots Alliance Inc. | | | United States | | | | 102,904 | | | | 8,762,790 | |
| | | | | | | | | | | | | | |
| | | | | | | | | | | | | 24,599,743 | |
| | | | | | | | | | | | | | |
| | Health Care Equipment & Supplies 3.2% | | | | | | | | | | | | |
| | Medtronic PLC | | | United States | | | | 181,080 | | | | 13,928,674 | |
| | Stryker Corp. | | | United States | | | | 83,662 | | | | 7,775,546 | |
| | | | | | | | | | | | | | |
| | | | | | | | | | | | | 21,704,220 | |
| | | | | | | | | | | | | | |
| | Health Care Providers & Services 0.4% | | | | | | | | | | | | |
| | Cigna Corp. | | | United States | | | | 20,116 | | | | 2,943,574 | |
| | | | | | | | | | | | | | |
| | Hotels, Restaurants & Leisure 1.8% | | | | | | | | | | | | |
| | Accor SA | | | France | | | | 233,913 | | | | 10,164,790 | |
| | Sands China Ltd. | | | Hong Kong | | | | 648,800 | | | | 2,214,249 | |
| | | | | | | | | | | | | | |
| | | | | | | | | | | | | 12,379,039 | |
| | | | | | | | | | | | | | |
| | Independent Power & Renewable Electricity Producers 0.5% | | | | | | | | | | | | |
| | NRG Energy Inc. | | | United States | | | | 299,277 | | | | 3,522,490 | |
| | | | | | | | | | | | | | |
| | Industrial Conglomerates 2.5% | | | | | | | | | | | | |
| | Jardine Strategic Holdings Ltd. | | | Hong Kong | | | | 371,698 | | | | 10,158,506 | |
| | Koninklijke Philips NV | | | Netherlands | | | | 262,064 | | | | 6,706,755 | |
| | | | | | | | | | | | | | |
| | | | | | | | | | | | | 16,865,261 | |
| | | | | | | | | | | | | | |
| | Insurance 11.0% | | | | | | | | | | | | |
| | ACE Ltd. | | | United States | | | | 122,380 | | | | 14,300,103 | |
| a | | Alleghany Corp. | | | United States | | | | 2,730 | | | | 1,304,749 | |
| | The Allstate Corp. | | | United States | | | | 116,387 | | | | 7,226,469 | |
| | American International Group Inc. | | | United States | | | | 243,553 | | | | 15,092,979 | |
| | China Pacific Insurance (Group) Co. Ltd., H | | | China | | | | 845,908 | | | | 3,476,342 | |
| | MetLife Inc. | | | United States | | | | 100,526 | | | | 4,846,359 | |
| | NN Group NV | | | Netherlands | | | | 342,362 | | | | 12,105,043 | |
| | PartnerRe Ltd. | | | United States | | | | 48,733 | | | | 6,809,949 | |
| | PICC Property and Casualty Co. Ltd., H | | | China | | | | 159,273 | | | | 316,074 | |
| | XL Group PLC | | | Ireland | | | | 235,290 | | | | 9,218,662 | |
| | | | | | | | | | | | | | |
| | | | | | | | | | | | | 74,696,729 | |
| | | | | | | | | | | | | | |
| | IT Services 1.0% | | | | | | | | | | | | |
| | Xerox Corp. | | | United States | | | | 612,817 | | | | 6,514,245 | |
| | | | | | | | | | | | | | |
| | Machinery 0.6% | | | | | | | | | | | | |
| | Caterpillar Inc. | | | United States | | | | 58,695 | | | | 3,988,912 | |
| | | | | | | | | | | | | | |
FRANKLIN TEMPLETON VARIABLE INSURANCE PRODUCTS TRUST
STATEMENT OF INVESTMENTS
Franklin Mutual Global Discovery VIP Fund (continued)
| | | | | | | | | | | | | | |
| | | | | Country | | | Shares/Units | | | Value | |
| | Common Stocks and Other Equity Interests (continued) | | | | | | | | | | | | |
| | Marine 1.3% | | | | | | | | | | | | |
| | A.P. Moeller-Maersk AS, B | | | Denmark | | | | 6,595 | | | $ | 8,617,495 | |
| | | | | | | | | | | | | | |
| | Media 4.4% | | | | | | | | | | | | |
| | Cablevision Systems Corp., A | | | United States | | | | 61,562 | | | | 1,963,828 | |
| | CBS Corp., B | | | United States | | | | 91,632 | | | | 4,318,616 | |
| a | | Liberty Global PLC, C | | | United Kingdom | | | | 86,040 | | | | 3,507,851 | |
| | Time Warner Cable Inc. | | | United States | | | | 62,129 | | | | 11,530,521 | |
| | Time Warner Inc. | | | United States | | | | 66,132 | | | | 4,276,756 | |
| | Twenty-First Century Fox Inc., B | | | United States | | | | 170,160 | | | | 4,633,457 | |
| | | | | | | | | | | | | | |
| | | | | | | | | | | | | 30,231,029 | |
| | | | | | | | | | | | | | |
| | Metals & Mining 1.0% | | | | | | | | | | | | |
| | Freeport-McMoRan Inc., B | | | United States | | | | 186,260 | | | | 1,260,980 | |
| | ThyssenKrupp AG | | | Germany | | | | 295,953 | | | | 5,895,924 | |
| | | | | | | | | | | | | | |
| | | | | | | | | | | | | 7,156,904 | |
| | | | | | | | | | | | | | |
| | Multiline Retail 0.3% | | | | | | | | | | | | |
| | Macy’s Inc. | | | United States | | | | 58,280 | | | | 2,038,634 | |
| | | | | | | | | | | | | | |
| | Oil, Gas & Consumable Fuels 5.7% | | | | | | | | | | | | |
| | Anadarko Petroleum Corp. | | | United States | | | | 29,831 | | | | 1,449,190 | |
| | Apache Corp. | | | United States | | | | 70,011 | | | | 3,113,389 | |
| | BG Group PLC | | | United Kingdom | | | | 402,808 | | | | 5,848,130 | |
| | BP PLC | | | United Kingdom | | | | 1,028,014 | | | | 5,363,954 | |
| | China Shenhua Energy Co. Ltd., H | | | China | | | | 2,009,534 | | | | 3,163,334 | |
| | CONSOL Energy Inc. | | | United States | | | | 219,381 | | | | 1,733,110 | |
| | Kinder Morgan Inc. | | | United States | | | | 296,590 | | | | 4,425,123 | |
| | Marathon Oil Corp. | | | United States | | | | 362,135 | | | | 4,559,280 | |
| | Royal Dutch Shell PLC, A | | | United Kingdom | | | | 327,191 | | | | 7,497,400 | |
| a | | Whiting Petroleum Corp. | | | United States | | | | 143,866 | | | | 1,358,095 | |
| | | | | | | | | | | | | | |
| | | | | | | | | | | | | 38,511,005 | |
| | | | | | | | | | | | | | |
| | Paper & Forest Products 0.0%† | | | | | | | | | | | | |
| a | | Verso Corp. | | | United States | | | | 36,624 | | | | 729 | |
| | | | | | | | | | | | | | |
| | Pharmaceuticals 8.0% | | | | | | | | | | | | |
| | Eli Lilly & Co. | | | United States | | | | 125,310 | | | | 10,558,621 | |
| | GlaxoSmithKline PLC | | | United Kingdom | | | | 262,323 | | | | 5,308,718 | |
| | Merck & Co. Inc. | | | United States | | | | 346,558 | | | | 18,305,193 | |
| | Novartis AG, ADR | | | Switzerland | | | | 110,552 | | | | 9,511,894 | |
| | Teva Pharmaceutical Industries Ltd., ADR | | | Israel | | | | 160,683 | | | | 10,547,232 | |
| | | | | | | | | | | | | | |
| | | | | | | | | | | | | 54,231,658 | |
| | | | | | | | | | | | | | |
| | Real Estate Management & Development 0.3% | | | | | | | | | | | | |
| | Hang Lung Properties Ltd. | | | Hong Kong | | | | 892,000 | | | | 2,030,268 | |
| | | | | | | | | | | | | | |
| | Road & Rail 0.4% | | | | | | | | | | | | |
| a,g | | CAR Inc. | | | China | | | | 1,623,080 | | | | 2,689,025 | |
| | | | | | | | | | | | | | |
| | Semiconductors & Semiconductor Equipment 0.2% | | | | | | | | | | | | |
| | SK Hynix Inc. | | | South Korea | | | | 53,632 | | | | 1,403,191 | |
| | | | | | | | | | | | | | |
| | Software 6.6% | | | | | | | | | | | | |
| a | | Check Point Software Technologies Ltd. | | | Israel | | | | 95,512 | | | | 7,772,767 | |
| | Microsoft Corp. | | | United States | | | | 452,522 | | | | 25,105,920 | |
| | Open Text Corp. | | | Canada | | | | 93,780 | | | | 4,494,875 | |
FRANKLIN TEMPLETON VARIABLE INSURANCE PRODUCTS TRUST
STATEMENT OF INVESTMENTS
Franklin Mutual Global Discovery VIP Fund (continued)
| | | | | | | | | | | | | | |
| | | | | Country | | | Shares/Units | | | Value | |
| | Common Stocks and Other Equity Interests (continued) | | | | | | | | | | | | |
| | Software (continued) | | | | | | | | | | | | |
| | Symantec Corp. | | | United States | | | | 364,800 | | | $ | 7,660,800 | |
| | | | | | | | | | | | | | |
| | | | | | | | | | | | | 45,034,362 | |
| | | | | | | | | | | | | | |
| | Specialty Retail 1.0% | | | | | | | | | | | | |
| | Kingfisher PLC | | | United Kingdom | | | | 1,354,320 | | | | 6,577,479 | |
| | | | | | | | | | | | | | |
| | Technology Hardware, Storage & Peripherals 2.2% | | | | | | | | | | | | |
| | EMC Corp. | | | United States | | | | 299,800 | | | | 7,698,864 | |
| | Hewlett Packard Enterprise Co. | | | United States | | | | 190,760 | | | | 2,899,552 | |
| | HP Inc. | | | United States | | | | 190,760 | | | | 2,258,598 | |
| | Lenovo Group Ltd. | | | China | | | | 2,297,675 | | | | 2,333,207 | |
| | | | | | | | | | | | | | |
| | | | | | | | | | | | | 15,190,221 | |
| | | | | | | | | | | | | | |
| | Tobacco 5.4% | | | | | | | | | | | | |
| | Altria Group Inc. | | | United States | | | | 168,969 | | | | 9,835,685 | |
| | British American Tobacco PLC | | | United Kingdom | | | | 220,778 | | | | 12,271,427 | |
| | Philip Morris International Inc. | | | United States | | | | 75,124 | | | | 6,604,151 | |
| | Reynolds American Inc. | | | United States | | | | 177,410 | | | | 8,187,471 | |
| | | | | | | | | | | | | | |
| | | | | | | | | | | | | 36,898,734 | |
| | | | | | | | | | | | | | |
| | Wireless Telecommunication Services 1.7% | | | | | | | | | | | | |
| | Vodafone Group PLC | | | United Kingdom | | | | 3,618,505 | | | | 11,787,024 | |
| | | | | | | | | | | | | | |
| | | | |
| | Total Common Stocks and Other Equity Interests
(Cost $526,241,005) | | | | | | | | | | | 625,074,361 | |
| | | | | | | | | | | | | | |
| | Preferred Stocks 1.6% | | | | | | | | | | | | |
| | Automobiles 0.9% | | | | | | | | | | | | |
| | Volkswagen AG, pfd. | | | Germany | | | | 40,296 | | | | 5,854,442 | |
| | | | | | | | | | | | | | |
| | Diversified Financial Services 0.7% | | | | | | | | | | | | |
| a,b | | Hightower Holding LLC, pfd., A, Series 2 | | | United States | | | | 2,172,000 | | | | 5,157,849 | |
| | | | | | | | | | | | | | |
| | | | |
| | Total Preferred Stocks (Cost $12,871,859) | | | | | | | | | | | 11,012,291 | |
| | | | | | | | | | | | | | |
| | | | |
| | | | | | | | Principal Amount* | | | | |
| | Corporate Notes and Senior Floating Rate Interests 2.1% | | | | | | | | | | | | |
| d | | Avaya Inc., senior note, 144A, 10.50%, 3/01/21 | | | United States | | | | 1,270,000 | | | | 438,150 | |
| h,i | | Belk Inc., Closing Date Term Loan, 5.75%, 12/10/22 | | | United States | | | | 1,428,000 | | | | 1,276,871 | |
| h,i | | Cengage Learning Acquisitions Inc., Original Term Loans, 7.00%, 3/31/20 | | | United States | | | | 142,374 | | | | 138,458 | |
| | iHeartCommunications Inc., | | | | | | | | | | | | |
| | senior secured note, first lien, 9.00%, 12/15/19 | | | United States | | | | 5,184,000 | | | | 3,855,600 | |
| | h,i Tranche D Term Loan, 7.174%, 1/30/19 | | | United States | | | | 6,889,154 | | | | 4,856,853 | |
| | h,i Tranche E Term Loan, 7.924%, 7/30/19 | | | United States | | | | 2,213,881 | | | | 1,562,630 | |
| h,i | | JC Penney Corp. Inc., Term Loan, 6.00%, 5/22/18 | | | United States | | | | 117,071 | | | | 115,205 | |
| d | | NGPL PipeCo LLC, senior secured note, 144A, 9.625%, 6/01/19 | | | United States | | | | 2,369,000 | | | | 2,226,860 | |
| | | | | | | | | | | | | | |
| | Total Corporate Notes and Senior Floating Rate Interests (Cost $18,483,013) | | | | | | | | | | | 14,470,627 | |
| | | | | | | | | | | | | | |
FRANKLIN TEMPLETON VARIABLE INSURANCE PRODUCTS TRUST
STATEMENT OF INVESTMENTS
Franklin Mutual Global Discovery VIP Fund (continued)
| | | | | | | | | | | | | | |
| | | | | Country | | | Principal Amount* | | | Value | |
| | Corporate Bonds, Notes and Senior Floating Rate Interests in Reorganization 0.8% | | | | | | | | | | | | |
| b,j | | Broadband Ventures III LLC, secured promissory note, 5.00%, 2/01/12 | | | United States | | | | 595 | | | $ | — | |
| h,i,j | | Caesars Entertainment Operating Co. Inc., Term B-7 Loans, 1.50%, 3/01/17 | | | United States | | | | 1,176,090 | | | | 983,505 | |
| h,i,j | | Texas Competitive Electric Holdings Co. LLC, Term Loans, 4.908%, 10/10/17 | | | United States | | | | 5,912,264 | | | | 1,816,176 | |
| d,j | | Texas Competitive Electric Holdings Co. LLC/Texas Competitive Electric Holdings Finance Inc., senior secured note, first lien, 144A, 4.726%, 10/01/20 | | | United States | | | | 5,895,000 | | | | 1,974,825 | |
| j | | Walter Energy Inc., | | | | | | | | | | | | |
| | h,i B Term Loan, 5.80%, 4/02/18 | | | United States | | | | 1,651,867 | | | | 462,523 | |
| | d first lien, 144A, 6.33%, 10/15/19 | | | United States | | | | 966,000 | | | | 251,160 | |
| | d,k second lien, 144A, PIK, 11.50%, 4/01/20 | | | United States | | | | 801,340 | | | | 2,053 | |
| | | | | | | | | | | | | | |
| | | | |
| | Total Corporate Bonds, Notes and Senior Floating Rate Interests in Reorganization (Cost $14,447,973) | | | | | | | | | | | 5,490,242 | |
| | | | | | | | | | | | | | |
| | | | |
| | | | | | | | Shares | | | | |
| | Companies in Liquidation 0.1% | | | | | | | | | | | | |
| a | | Adelphia Recovery Trust | | | United States | | | | 5,379,562 | | | | 21,518 | |
| a,e | | Adelphia Recovery Trust, Arahova Contingent Value Vehicle, Contingent Distribution | | | United States | | | | 386,774 | | | | 773 | |
| a,e,f | | Century Communications Corp., Contingent Distribution | | | United States | | | | 1,074,000 | | | | — | |
| a,b | | FIM Coinvestor Holdings I, LLC | | | United States | | | | 2,077,368 | | | | — | |
| a,l | | Lehman Brothers Holdings Inc., Bankruptcy Claim | | | United States | | | | 17,348,669 | | | | 975,863 | |
| a,f | | NewPage Corp., Litigation Trust | | | United States | | | | 4,854,000 | | | | — | |
| a,e,f | | Tribune Media Litigation Trust, Contingent Distribution | | | United States | | | | 56,925 | | | | — | |
| | | | | | | | | | | | | | |
| | | | |
| | Total Companies in Liquidation (Cost $2,152,946) | | | | | | | | | | | 998,154 | |
| | | | | | | | | | | | | | |
| | | | |
| | | | | | | | Principal Amount* | | | | |
| | Municipal Bonds (Cost $2,113,962) 0.2% | | | | | | | | | | | | |
| | Puerto Rico Commonwealth GO, Refunding, Series A, 8.00%, 7/01/35 | | | United States | | | | 2,261,000 | | | | 1,644,878 | |
| | | | | | | | | | | | | | |
| | | | |
| | Total Investments before Short Term Investments (Cost $576,310,758) | | | | | | | | | | | 658,690,553 | |
| | | | | | | | | | | | | | |
| | Short Term Investments 3.1% | | | | | | | | | | | | |
| | U.S. Government and Agency Securities 2.8% | | | | | | | | | | | | |
| m | | FHLB, 1/05/16 | | | United States | | | | 1,000,000 | | | | 999,996 | |
| m,n | | U.S. Treasury Bill, 1/07/16 - 6/09/16 | | | United States | | | | 17,950,000 | | | | 17,930,312 | |
| | | | | | | | | | | | | | |
| | | | |
| | Total U.S. Government and Agency Securities (Cost $18,930,748) | | | | | | | | | | | 18,930,308 | |
| | | | | | | | | | | | | | |
| | | | |
| | Total Investments before Repurchase Agreements (Cost $595,241,506) | | | | | | | | | | | 677,620,861 | |
| | | | | | | | | | | | | | |
FRANKLIN TEMPLETON VARIABLE INSURANCE PRODUCTS TRUST
STATEMENT OF INVESTMENTS
Franklin Mutual Global Discovery VIP Fund (continued)
| | | | | | | | | | | | | | |
| | | | | Country | | | Principal Amount* | | | Value | |
| o | | Investments from Cash Collateral Received for Loaned Securities 0.3% | | | | | | | | | | | | |
| | Repurchase Agreements 0.3% | | | | | | | | | | | | |
| p | | Joint Repurchase Agreement, 0.27%, 1/04/16
(Maturity Value $321,243) | |
|
United States |
| |
|
321,233 |
| | $ | 321,233 | |
| | HSBC Securities (USA) Inc.
| | | | | | | | | | | | |
| | Collateralized by U.S. Treasury Strip, 2/15/16 - 8/15/40 (valued at $327,658) | | | | | | | | | | | | |
| p | | Joint Repurchase Agreement, 0.28%, 1/04/16
(Maturity Value $411,550) | | | United States | | | | 411,537 | | | | 411,537 | |
| | HSBC Securities (USA) Inc. | | | | | | | | | | | | |
| | Collateralized by U.S. Government and Agency Securities, 0.00%, 3/23/16 - 7/15/32; U.S. Government Agency Strip, 1/15/16 - 7/15/37; U.S. Treasury Bond, 3.75%, 11/15/43; and U.S. Treasury Note, 1.375% - 1.75%, 9/30/18 - 9/30/22
(valued at $419,769) | | | | | | | | | | | | |
| p | | Joint Repurchase Agreement, 0.30%, 1/04/16
(Maturity Value $1,000,033) | | | United States | | | | 1,000,000 | | | | 1,000,000 | |
| | RBS Securities Inc. | | | | | | | | | | | | |
| | Collateralized by U.S. Treasury Note, 0.289% - 3.25% 7/31/16 - 11/15/23 (valued at $1,020,005) | | | | | | | | | | | | |
| | | | | | | | | | | | | | |
| | Total Investments from Cash Collateral Received for Loaned Securities (Cost $1,732,770) | | | | | | | | | | | 1,732,770 | |
| | | | | | | | | | | | | | |
| | Total Investments (Cost $596,974,276) 99.7% | | | | | | | | | | | 679,353,631 | |
| | Securities Sold Short (0.2)% | | | | | | | | | | | (1,417,732 | ) |
| | Other Assets, less Liabilities 0.5% | | | | | | | | | | | 3,116,724 | |
| | | | | | | | | | | | | | |
| | Net Assets 100.0% | | | | | | | | | | $ | 681,052,623 | |
| | | | | | | | | | | | | | |
| | | | |
| | | | | | | | Shares | | | | |
| q | | Securities Sold Short (Proceeds $1,741,616) (0.2)% | | | | | | | | | | | | |
| | Common Stocks (0.2)% | | | | | | | | | | | | |
| | Energy Equipment & Services (0.2)% | | | | | | | | | | | | |
| | Halliburton Co. | | | United States | | | | 41,649 | | | $ | (1,417,732 | ) |
| | | | | | | | | | | | | | |
FRANKLIN TEMPLETON VARIABLE INSURANCE PRODUCTS TRUST
STATEMENT OF INVESTMENTS
Franklin Mutual Global Discovery VIP Fund (continued)
†Rounds to less than 0.1% of net assets.
*The principal amount is stated in U.S. dollars unless otherwise indicated.
aNon-income producing.
bSee Note 8 regarding restricted securities.
cAt December 31, 2015, pursuant to the Fund’s policies and the requirements of applicable securities law, the Fund is restricted from trading this security at year end.
dSecurity was purchased pursuant to Rule 144A under the Securities Act of 1933 and may be sold in transactions exempt from registration only to qualified institutional buyers or in a public offering registered under the Securities Act of 1933. These securities have been deemed liquid under guidelines approved by the Trust’s Board of Trustees. At December 31, 2015, the aggregate value of these securities was $13,525,154, representing 1.99% of net assets.
eContingent distributions represent the right to receive additional distributions, if any, during the reorganization of the underlying company. Shares represent total underlying principal of debt securities.
fSecurity has been deemed illiquid because it may not be able to be sold within seven days. At December 31, 2015, the aggregate value of these securities was $—.
gA portion or all of the security is on loan at December 31, 2015. See Note 1(g).
hSee Note 1(h) regarding senior floating rate interests.
iThe coupon rate shown represents the rate at period end.
jSee Note 7 regarding credit risk and defaulted securities.
kIncome may be received in additional securities and/or cash.
lBankruptcy claims represent the right to receive distributions, if any, during the liquidation of the underlying pool of assets. Shares represent amount of allowed unsecured claims.
mThe security is traded on a discount basis with no stated coupon rate.
nA portion or all of the security has been segregated as collateral for securities sold short and open forward contracts. At December 31, 2015, the aggregate value of these securities and/or cash pledged amounted to $4,495,294, representing 0.66% of net assets.
oSee Note 1(g) regarding securities on loan.
pSee Note 1(c) regarding joint repurchase agreement.
qSee Note 1(f) regarding securities sold short.
FRANKLIN TEMPLETON VARIABLE INSURANCE PRODUCTS TRUST
STATEMENT OF INVESTMENTS
Franklin Mutual Global Discovery VIP Fund (continued)
At December 31, 2015, the Fund had the following futures contracts outstanding. See Note 1(d).
| | | | | | | | | | | | | | | | | | | | | | | | |
| Futures Contracts | | | | | | | | | | | | | | | | | | |
| Description | | Type | | | Number of
Contracts | | | Notional
Value | | | Expiration
Date | | | Unrealized
Appreciation | | | Unrealized
Depreciation | |
| Currency Contracts | | | | | | | | | | | | | | | | | | | | | | | | |
CHF/USD | | | Short | | | | 2 | | | $ | 250,800 | | | | 3/14/16 | | | $ | 3,274 | | | $ | — | |
EUR/USD | | | Short | | | | 250 | | | | 34,018,750 | | | | 3/14/16 | | | | 17,292 | | | | — | |
GBP/USD | | | Short | | | | 219 | | | | 20,167,163 | | | | 3/14/16 | | | | 522,782 | | | | — | |
| | | | | | | | | | | | | | | | | | | | |
Total Futures Contracts | | | $ | 543,348 | | | $ | — | |
| | | | | | | | | | | | | | | | | | | | |
Net unrealized appreciation (depreciation) | | | $ | 543,348 | | | | | |
| | | | | | | | | | | | | | | | | | | | | | | | |
At December 31, 2015, the Fund had the following forward exchange contracts outstanding. See Note 1(d).
| | | | | | | | | | | | | | | | | | | | | | | | | | | | |
| Forward Exchange Contracts | |
| Currency | | Counterpartya | | | Type | | | Quantity | | | Contract
Amount | | | Settlement
Date | | | Unrealized
Appreciation | | | Unrealized
Appreciation | |
| OTC Forward Exchange Contracts | | | | | | | | | | | | | |
South Korean Won | | | BOFA | | | | Buy | | | | 92,556,189 | | | $ | 80,470 | | | | 1/12/16 | | | $ | — | | | $ | (1,747 | ) |
South Korean Won | | | BOFA | | | | Sell | | | | 2,558,268,049 | | | | 2,260,214 | | | | 1/12/16 | | | | 84,316 | | | | — | |
South Korean Won | | | FBCO | | | | Sell | | | | 2,203,432,650 | | | | 1,929,644 | | | | 1/12/16 | | | | 55,546 | | | | — | |
South Korean Won | | | HSBC | | | | Buy | | | | 438,474,211 | | | | 373,917 | | | | 1/12/16 | | | | 1,141 | | | | (2,119 | ) |
South Korean Won | | | HSBC | | | | Sell | | | | 2,398,468,751 | | | | 2,119,163 | | | | 1/12/16 | | | | 79,180 | | | | — | |
Swiss Franc | | | BONY | | | | Buy | | | | 61,555 | | | | 61,429 | | | | 1/12/16 | | | | 568 | | | | (531 | ) |
Swiss Franc | | | FBCO | | | | Buy | | | | 53,225 | | | | 54,213 | | | | 1/12/16 | | | | — | | | | (1,065 | ) |
Swiss Franc | | | FBCO | | | | Sell | | | | 1,025,410 | | | | 1,024,193 | | | | 1/12/16 | | | | 276 | | | | — | |
Swiss Franc | | | HSBC | | | | Buy | | | | 16,193 | | | | 16,300 | | | | 1/12/16 | | | | — | | | | (131 | ) |
Swiss Franc | | | SSBT | | | | Buy | | | | 3,000 | | | | 3,012 | | | | 1/12/16 | | | | — | | | | (16 | ) |
Swiss Franc | | | SSBT | | | | Sell | | | | 45,370 | | | | 45,955 | | | | 1/12/16 | | | | 651 | | | | — | |
Canadian Dollar | | | DBAB | | | | Buy | | | | 3,841,875 | | | | 2,833,052 | | | | 1/19/16 | | | | 614 | | | | (56,213 | ) |
Canadian Dollar | | | DBAB | | | | Sell | | | | 9,451,547 | | | | 7,098,634 | | | | 1/19/16 | | | | 265,742 | | | | (30 | ) |
Canadian Dollar | | | HSBC | | | | Buy | | | | 80,049 | | | | 59,777 | | | | 1/19/16 | | | | — | | | | (1,907 | ) |
Euro | | | BOFA | | | | Buy | | | | 814,028 | | | | 892,397 | | | | 1/20/16 | | | | — | | | | (7,712 | ) |
Euro | | | BOFA | | | | Sell | | | | 44,834,786 | | | | 48,066,027 | | | | 1/20/16 | | | | 4,895 | | | | (665,277 | ) |
Euro | | | BONY | | | | Buy | | | | 224,658 | | | | 247,938 | | | | 1/20/16 | | | | — | | | | (3,780 | ) |
Euro | | | DBAB | | | | Buy | | | | 1,089,582 | | | | 1,195,969 | | | | 1/20/16 | | | | — | | | | (11,812 | ) |
Euro | | | DBAB | | | | Sell | | | | 587,755 | | | | 629,989 | | | | 1/20/16 | | | | 409 | | | | (9,192 | ) |
Euro | | | FBCO | | | | Buy | | | | 814,026 | | | | 892,297 | | | | 1/20/16 | | | | — | | | | (7,615 | ) |
Euro | | | FBCO | | | | Sell | | | | 926,995 | | | | 995,188 | | | | 1/20/16 | | | | 989 | | | | (13,258 | ) |
Euro | | | HSBC | | | | Buy | | | | 840,702 | | | | 920,632 | | | | 1/20/16 | | | | — | | | | (6,958 | ) |
Euro | | | HSBC | | | | Sell | | | | 1,433,319 | | | | 1,554,281 | | | | 1/20/16 | | | | 7,870 | | | | (11,319 | ) |
Euro | | | SSBT | | | | Buy | | | | 1,177,581 | | | | 1,290,650 | | | | 1/20/16 | | | | 41 | | | | (10,897 | ) |
Euro | | | SSBT | | | | Sell | | | | 529,584 | | | | 571,669 | | | | 1/20/16 | | | | 619 | | | | (4,501 | ) |
British Pound | | | BOFA | | | | Sell | | | | 3,488,699 | | | | 5,390,658 | | | | 1/21/16 | | | | 248,198 | | | | — | |
British Pound | | | BZWS | | | | Buy | | | | 169,664 | | | | 265,897 | | | | 1/21/16 | | | | — | | | | (15,806 | ) |
British Pound | | | DBAB | | | | Sell | | | | 486,808 | | | | 722,959 | | | | 1/21/16 | | | | 5,387 | | | | — | |
British Pound | | | FBCO | | | | Buy | | | | 1,335,268 | | | | 2,073,261 | | | | 1/21/16 | | | | — | | | | (105,031 | ) |
British Pound | | | FBCO | | | | Sell | | | | 569,437 | | | | 857,450 | | | | 1/21/16 | | | | 18,080 | | | | — | |
British Pound | | | HSBC | | | | Buy | | | | 590,611 | | | | 930,684 | | | | 1/21/16 | | | | — | | | | (60,103 | ) |
British Pound | | | HSBC | | | | Sell | | | | 398,890 | | | | 593,731 | | | | 1/21/16 | | | | 5,753 | | | | — | |
British Pound | | | SSBT | | | | Buy | | | | 1,232,106 | | | | 1,935,690 | | | | 1/21/16 | | | | — | | | | (119,523 | ) |
British Pound | | | SSBT | | | | Sell | | | | 19,594,604 | | | | 30,045,878 | | | | 1/21/16 | | | | 1,162,768 | | | | — | |
| | | | | | | | | | | | | | | | | | | | | | | | |
Total Forward Exchange Contracts | | | $ | 1,943,043 | | | $ | (1,116,543 | ) |
| | | | | | | | | | | | | | | | | | | | | | | | |
Net unrealized appreciation (depreciation) | | | $ | 826,500 | | | | | |
| | | | | | | | | | | | | | | | | | | | | | | | | | | | |
aMay be comprised of multiple contracts with the same counterparty, currency and settlement date.
See Abbreviations on MGD-34.
| | | | |
| MGD-18 | | Annual Report | The accompanying notes are an integral part of these financial statements. | | |
FRANKLIN TEMPLETON VARIABLE INSURANCE PRODUCTS TRUST
Financial Statements
Statement of Assets and Liabilities
December 31, 2015
| | | | |
| | | Franklin Mutual
Global Discovery
VIP Fund | |
Assets: | | | | |
Investments in securities: | | | | |
Cost - Unaffiliated issuers | | $ | 595,241,506 | |
Cost - Repurchase agreements | | | 1,732,770 | |
| | | | |
Total cost of investments | | $ | 596,974,276 | |
| | | | |
Value - Unaffiliated issuers | | $ | 677,620,861 | |
Value - Repurchase agreements | | | 1,732,770 | |
| | | | |
Total value of investments (includes securities loaned in the amount of $1,640,175) | | | 679,353,631 | |
Cash | | | 103,346 | |
Restricted cash (Note 1e) | | | 160,000 | |
Foreign currency, at value (cost $490,029) | | | 488,592 | |
Receivables: | | | | |
Investment securities sold | | | 330,074 | |
Capital shares sold | | | 38,838 | |
Dividends and interest | | | 1,680,123 | |
Due from brokers | | | 2,916,594 | |
Variation margin | | | 318,538 | |
Unrealized appreciation on OTC forward exchange contracts | | | 1,943,043 | |
Other assets | | | 402,140 | |
| | | | |
Total assets | | | 687,734,919 | |
| | | | |
Liabilities: | | | | |
Payables: | | | | |
Investment securities purchased | | | 966,564 | |
Capital shares redeemed | | | 231,270 | |
Management fees | | | 547,494 | |
Distribution fees | | | 296,279 | |
Securities sold short, at value (proceeds $1,741,616) | | | 1,417,732 | |
Payable upon return of securities loaned | | | 1,732,770 | |
Due to brokers | | | 160,000 | |
Unrealized depreciation on OTC forward exchange contracts | | | 1,116,543 | |
Accrued expenses and other liabilities | | | 213,644 | |
| | | | |
Total liabilities | | | 6,682,296 | |
| | | | |
Net assets, at value | | $ | 681,052,623 | |
| | | | |
Net assets consist of: | | | | |
Paid-in capital | | $ | 538,949,886 | |
Undistributed net investment income | | | 10,161,933 | |
Net unrealized appreciation (depreciation) | | | 84,041,911 | |
Accumulated net realized gain (loss) | | | 47,898,893 | |
| | | | |
Net assets, at value | | $ | 681,052,623 | |
| | | | |
FRANKLIN TEMPLETON VARIABLE INSURANCE PRODUCTS TRUST
FINANCIAL STATEMENTS
Statement of Assets and Liabilities (continued)
December 31, 2015
| | | | |
| | | Franklin Mutual
Global Discovery
VIP Fund | |
| |
| Class 1: | | | | |
Net assets, at value | | $ | 2,631,985 | |
| | | | |
Shares outstanding | | | 132,600 | |
| | | | |
Net asset value and maximum offering price per share | | $ | 19.85 | |
| | | | |
| |
| Class 2: | | | | |
Net assets, at value | | $ | 629,366,480 | |
| | | | |
Shares outstanding | | | 32,488,562 | |
| | | | |
Net asset value and maximum offering price per share | | $ | 19.37 | |
| | | | |
| |
| Class 4: | | | | |
Net assets, at value | | $ | 49,054,158 | |
| | | | |
Shares outstanding | | | 2,495,628 | |
| | | | |
Net asset value and maximum offering price per share | | $ | 19.66 | |
| | | | |
| | | | |
| MGD-20 | | Annual Report | The accompanying notes are an integral part of these financial statements. | | |
FRANKLIN TEMPLETON VARIABLE INSURANCE PRODUCTS TRUST
FINANCIAL STATEMENTS
Statement of Operations
for the year ended December 31, 2015
| | | | |
| | | Franklin Mutual
Global Discovery
VIP Fund | |
Investment income: | | | | |
Dividends | | $ | 17,321,798 | |
Interest | | | 2,317,642 | |
Income from securities loaned | | | 134,859 | |
Other income (Note 1i) | | | 292,536 | |
| | | | |
Total investment income | | | 20,066,835 | |
| | | | |
Expenses: | | | | |
Management fees (Note 3a) | | | 6,907,118 | |
Distribution fees: (Note 3c) | | | | |
Class 2 | | | 1,696,169 | |
Class 4 | | | 195,364 | |
Custodian fees (Note 4) | | | 36,385 | |
Reports to shareholders | | | 103,056 | |
Professional fees | | | 173,611 | |
Trustees’ fees and expenses | | | 3,200 | |
Dividends on securities sold short | | | 167,413 | |
Other | | | 90,546 | |
| | | | |
Total expenses | | | 9,372,862 | |
Expense reductions (Note 4) | | | (222 | ) |
Expenses waived/paid by affiliates (Note 3e) | | | (321 | ) |
| | | | |
Net expenses | | | 9,372,319 | |
| | | | |
Net investment income | | | 10,694,516 | |
| | | | |
Realized and unrealized gains (losses): | | | | |
Net realized gain (loss) from: | | | | |
Investments | | | 40,426,207 | |
Foreign currency transactions | | | 11,059,494 | |
Futures contracts | | | 5,471,972 | |
Securities sold short | | | 46,516 | |
| | | | |
Net realized gain (loss) | | | 57,004,189 | |
| | | | |
Net change in unrealized appreciation (depreciation) on: | | | | |
Investments | | | (88,865,007 | ) |
Translation of other assets and liabilities denominated in foreign currencies | | | (3,814,259 | ) |
Futures contracts | | | (471,877 | ) |
| | | | |
Net change in unrealized appreciation (depreciation) | | | (93,151,143 | ) |
| | | | |
Net realized and unrealized gain (loss) | | | (36,146,954 | ) |
| | | | |
Net increase (decrease) in net assets resulting from operations | | $ | (25,452,438 | ) |
| | | | |
| | | | | | |
| | | The accompanying notes are an integral part of these financial statements. | Annual Report | | | MGD-21 | |
FRANKLIN TEMPLETON VARIABLE INSURANCE PRODUCTS TRUST
FINANCIAL STATEMENTS
Statements of Changes in Net Assets
| | | | | | | | |
| | | Franklin Mutual Global Discovery VIP Fund | |
| | | Year Ended December 31, | |
| | | 2015 | | | 2014 | |
Increase (decrease) in net assets: | | | | | | | | |
Operations: | | | | | | | | |
Net investment income | | $ | 10,694,516 | | | $ | 19,755,011 | |
Net realized gain (loss) | | | 57,004,189 | | | | 33,134,405 | |
Net change in unrealized appreciation (depreciation) | | | (93,151,143 | ) | | | (10,653,774 | ) |
| | | | |
Net increase (decrease) in net assets resulting from operations | | | (25,452,438 | ) | | | 42,235,642 | |
| | | | |
Distributions to shareholders from: | | | | | | | | |
Net investment income: | | | | | | | | |
Class 1 | | | (79,470 | ) | | | (43,196 | ) |
Class 2 | | | (18,967,567 | ) | | | (14,775,740 | ) |
Class 4 | | | (1,406,194 | ) | | | (1,243,714 | ) |
Net realized gains: | | | | | | | | |
Class 1 | | | (146,560 | ) | | | (119,891 | ) |
Class 2 | | | (38,175,344 | ) | | | (45,727,518 | ) |
Class 4 | | | (3,020,502 | ) | | | (4,102,276 | ) |
| | | | |
Total distributions to shareholders | | | (61,795,637 | ) | | | (66,012,335 | ) |
| | | | |
Capital share transactions: (Note 2) | | | | | | | | |
Class 1 | | | 643,019 | | | | (105,551 | ) |
Class 2 | | | 24,374,278 | | | | 23,195,730 | |
Class 4 | | | (4,702,254 | ) | | | (8,926,689 | ) |
| | | | |
Total capital share transactions | | | 20,315,043 | | | | 14,163,490 | |
| | | | |
Net increase (decrease) in net assets | | | (66,933,032 | ) | | | (9,613,203 | ) |
Net assets: | | | | | | | | |
Beginning of year | | | 747,985,655 | | | | 757,598,858 | |
| | | | |
End of year | | $ | 681,052,623 | | | $ | 747,985,655 | |
| | | | |
Undistributed net investment income included in net assets: | | | | | | | | |
End of year | | $ | 10,161,933 | | | $ | 20,534,780 | |
| | | | |
| | | | |
| MGD-22 | | Annual Report | The accompanying notes are an integral part of these financial statements. | | |
FRANKLIN TEMPLETON VARIABLE INSURANCE PRODUCTS TRUST
Notes to Financial Statements
Franklin Mutual Global Discovery VIP Fund
1. Organization and Significant Accounting Policies
Franklin Templeton Variable Insurance Products Trust (Trust) is registered under the Investment Company Act of 1940 (1940 Act) as an open-end management investment company, consisting of nineteen separate funds and applies the specialized accounting and reporting guidance in U.S. Generally Accepted Accounting Principles (U.S. GAAP). Franklin Mutual Global Discovery VIP Fund (Fund) is included in this report. The financial statements of the remaining funds in the Trust are presented separately. Shares of the Fund are generally sold only to insurance company separate accounts to fund the benefits of variable life insurance policies or variable annuity contracts. At December 31, 2015, 53.85% of the Fund’s shares were held through one insurance company. Investment activities of these insurance company separate accounts could have a material impact on the Fund. The Fund offers three classes of shares: Class 1, Class 2 and Class 4. Each class of shares differs by its distribution fees, voting rights on matters affecting a single class and its exchange privilege.
The following summarizes the Fund’s significant accounting policies.
a. Financial Instrument Valuation
The Fund’s investments in financial instruments are carried at fair value daily. Fair value is the price that would be received to sell an asset or paid to transfer a liability in an orderly transaction between market participants on the measurement date. The Fund calculates the net asset value (NAV) per share as of 4 p.m. Eastern time each day the New York Stock Exchange (NYSE) is open for trading. Under compliance policies and procedures approved by the Trust’s Board of Trustees (the Board), the Fund’s administrator has responsibility for oversight of valuation, including leading the cross-functional Valuation and Liquidity Oversight Committee (VLOC). The VLOC provides administration and oversight of the Fund’s valuation policies and procedures, which are approved annually by the Board. Among other things, these procedures allow the Fund to utilize independent pricing services, quotations from securities and financial instrument dealers, and other market sources to determine fair value.
Equity securities and derivative financial instruments (derivatives) listed on an exchange or on the NASDAQ National Market System are valued at the last quoted sale price or the official closing price of the day, respectively. Foreign equity
securities are valued as of the close of trading on the foreign stock exchange on which the security is primarily traded or as of 4 p.m. Eastern time whichever is earlier. The value is then converted into its U.S. dollar equivalent at the foreign exchange rate in effect at 4 p.m. Eastern time on the day that the value of the security is determined. Over-the-counter (OTC) securities are valued within the range of the most recent quoted bid and ask prices. Securities that trade in multiple markets or on multiple exchanges are valued according to the broadest and most representative market. Certain equity securities are valued based upon fundamental characteristics or relationships to similar securities.
Debt securities generally trade in the OTC market rather than on a securities exchange. The Fund’s pricing services use multiple valuation techniques to determine fair value. In instances where sufficient market activity exists, the pricing services may utilize a market-based approach through which quotes from market makers are used to determine fair value. In instances where sufficient market activity may not exist or is limited, the pricing services also utilize proprietary valuation models which may consider market characteristics such as benchmark yield curves, credit spreads, estimated default rates, anticipated market interest rate volatility, coupon rates, anticipated timing of principal repayments, underlying collateral, and other unique security features in order to estimate the relevant cash flows, which are then discounted to calculate the fair value. Securities denominated in a foreign currency are converted into their U.S. dollar equivalent at the foreign exchange rate in effect at 4 p.m. Eastern time on the date that the values of the foreign debt securities are determined.
Repurchase agreements are valued at cost, which approximates fair value.
Certain derivatives trade in the OTC market. The Fund’s pricing services use various techniques including industry standard option pricing models and proprietary discounted cash flow models to determine the fair value of those instruments. The Fund’s net benefit or obligation under the derivative contract, as measured by the fair value of the contract, is included in net assets.
The Fund has procedures to determine the fair value of financial instruments for which market prices are not reliable or readily available. Under these procedures, the VLOC convenes on a regular basis to review such financial instruments and considers a number of factors, including significant unobservable valuation
FRANKLIN TEMPLETON VARIABLE INSURANCE PRODUCTS TRUST
NOTES TO FINANCIAL STATEMENTS
Franklin Mutual Global Discovery VIP Fund (continued)
1. Organization and Significant Accounting Policies (continued)
a. Financial Instrument Valuation (continued)
inputs, when arriving at fair value. The VLOC primarily employs a market-based approach which may use related or comparable assets or liabilities, recent transactions, market multiples, book values, and other relevant information for the investment to determine the fair value of the investment. An income-based valuation approach may also be used in which the anticipated future cash flows of the investment are discounted to calculate fair value. Discounts may also be applied due to the nature or duration of any restrictions on the disposition of the investments. Due to the inherent uncertainty of valuations of such investments, the fair values may differ significantly from the values that would have been used had an active market existed. The VLOC employs various methods for calibrating these valuation approaches including a regular review of key inputs and assumptions, transactional back-testing or disposition analysis, and reviews of any related market activity.
Trading in securities on foreign securities stock exchanges and OTC markets may be completed before 4 p.m. Eastern time. In addition, trading in certain foreign markets may not take place on every NYSE business day. Occasionally, events occur between the time at which trading in a foreign security is completed and the close of the NYSE that might call into question the reliability of the value of a portfolio security held by the Fund. As a result, differences may arise between the value of the Fund’s portfolio securities as determined at the foreign market close and the latest indications of value at the close of the NYSE. In order to minimize the potential for these differences, the VLOC monitors price movements following the close of trading in foreign stock markets through a series of country specific market proxies (such as baskets of American Depositary Receipts, futures contracts and exchange traded funds). These price movements are measured against established trigger thresholds for each specific market proxy to assist in determining if an event has occurred that may call into question the reliability of the values of the foreign securities held by the Fund. If such an event occurs, the securities may be valued using fair value procedures, which may include the use of independent pricing services.
When the last day of the reporting period is a non-business day, certain foreign markets may be open on those days that the NYSE is closed, which could result in differences between the value of
the Fund’s portfolio securities on the last business day and the last calendar day of the reporting period. Any significant security valuation changes due to an open foreign market are adjusted and reflected by the Fund for financial reporting purposes.
b. Foreign Currency Translation
Portfolio securities and other assets and liabilities denominated in foreign currencies are translated into U.S. dollars based on the exchange rate of such currencies against U.S. dollars on the date of valuation. The Fund may enter into foreign currency exchange contracts to facilitate transactions denominated in a foreign currency. Purchases and sales of securities, income and expense items denominated in foreign currencies are translated into U.S. dollars at the exchange rate in effect on the transaction date. Portfolio securities and assets and liabilities denominated in foreign currencies contain risks that those currencies will decline in value relative to the U.S. dollar. Occasionally, events may impact the availability or reliability of foreign exchange rates used to convert the U.S. dollar equivalent value. If such an event occurs, the foreign exchange rate will be valued at fair value using procedures established and approved by the Board.
The Fund does not separately report the effect of changes in foreign exchange rates from changes in market prices on securities held. Such changes are included in net realized and unrealized gain or loss from investments in the Statement of Operations.
Realized foreign exchange gains or losses arise from sales of foreign currencies, currency gains or losses realized between the trade and settlement dates on securities transactions and the difference between the recorded amounts of dividends, interest, and foreign withholding taxes and the U.S. dollar equivalent of the amounts actually received or paid. Net unrealized foreign exchange gains and losses arise from changes in foreign exchange rates on foreign denominated assets and liabilities other than investments in securities held at the end of the reporting period.
c. Joint Repurchase Agreement
The Fund enters into a joint repurchase agreement whereby its uninvested cash balance is deposited into a joint cash account with other funds managed by the investment manager or an affiliate of the investment manager and is used to invest in one or more repurchase agreements. The value and face amount of the joint repurchase agreement are allocated to the funds based
FRANKLIN TEMPLETON VARIABLE INSURANCE PRODUCTS TRUST
NOTES TO FINANCIAL STATEMENTS
Franklin Mutual Global Discovery VIP Fund (continued)
on their pro-rata interest. A repurchase agreement is accounted for as a loan by the Fund to the seller, collateralized by securities which are delivered to the Fund’s custodian. The fair value, including accrued interest, of the initial collateralization is required to be at least 102% of the dollar amount invested by the funds, with the value of the underlying securities marked to market daily to maintain coverage of at least 100%. Repurchase agreements are subject to the terms of Master Repurchase Agreements (MRAs) with approved counterparties (sellers). The MRAs contain various provisions, including but not limited to events of default and maintenance of collateral for repurchase agreements. In the event of default by either the seller or the Fund, certain MRAs may permit the non-defaulting party to net and close-out all transactions, if any, traded under such agreements. The Fund may sell securities it holds as collateral and apply the proceeds towards the repurchase price and any other amounts owed by the seller to the Fund in the event of default by the seller. This could involve costs or delays in addition to a loss on the securities if their value falls below the repurchase price owed by the seller. The joint repurchase agreement held by the Fund at year end, as indicated in the Statement of Investments, had been entered into on December 31, 2015.
d. Derivative Financial Instruments
The Fund invested in derivatives in order to manage risk or gain exposure to various other investments or markets. Derivatives are financial contracts based on an underlying or notional amount, require no initial investment or an initial net investment that is smaller than would normally be required to have a similar response to changes in market factors, and require or permit net settlement. Derivatives contain various risks including the potential inability of the counterparty to fulfill their obligations under the terms of the contract, the potential for an illiquid secondary market, and/or the potential for market movements which expose the Fund to gains or losses in excess of the amounts shown in the Statement of Assets and Liabilities. Realized gain and loss and unrealized appreciation and depreciation on these contracts for the period are included in the Statement of Operations.
Derivative counterparty credit risk is managed through a formal evaluation of the creditworthiness of all potential counterparties. The Fund attempts to reduce its exposure to counterparty credit risk on OTC derivatives, whenever possible, by entering into International Swaps and Derivatives Association (ISDA) master agreements with certain counterparties. These agreements contain
various provisions, including but not limited to collateral requirements, events of default, or early termination. Termination events applicable to the counterparty include certain deteriorations in the credit quality of the counterparty. Termination events applicable to the Fund include failure of the Fund to maintain certain net asset levels and/or limit the decline in net assets over various periods of time. In the event of default or early termination, the ISDA master agreement gives the non-defaulting party the right to net and close-out all transactions traded, whether or not arising under the ISDA agreement, to one net amount payable by one counterparty to the other. However, absent an event of default or early termination, OTC derivative assets and liabilities are presented gross and not offset in the Statement of Assets and Liabilities. Early termination by the counterparty may result in an immediate payment by the Fund of any net liability owed to that counterparty under the ISDA agreement. At December 31, 2015, the Fund had OTC derivatives in a net liability position of $408,954 and the aggregate value of collateral pledged for such contracts was $709,431.
Collateral requirements differ by type of derivative. Collateral or initial margin requirements are set by the broker or exchange clearing house for exchange traded and centrally cleared derivatives. Initial margin deposited is held at the exchange and can be in the form of cash and/or securities. For OTC derivatives traded under an ISDA master agreement, posting of collateral is required by either the Fund or the applicable counterparty if the total net exposure of all OTC derivatives with the applicable counterparty exceeds the minimum transfer amount, which typically ranges from $100,000 to $250,000, and can vary depending on the counterparty and the type of the agreement. Generally, collateral is determined at the close of Fund business each day and any additional collateral required due to changes in derivative values may be delivered by the Fund or the counterparty within a few business days. Collateral pledged and/or received by the Fund for OTC derivatives, if any, is held in segregated accounts with the Fund’s custodian/counterparty broker and can be in the form of cash and/or securities. Unrestricted cash may be invested according to the Fund’s investment objectives. To the extent that the amounts due to the Fund from its counterparties are not subject to collateralization or are not fully collateralized, the Fund bears the risk of loss from counterparty non-performance.
At December 31, 2015, the Fund received $816,148 in Italy Treasury Bonds and U.S. Treasury Bonds as collateral for derivatives.
FRANKLIN TEMPLETON VARIABLE INSURANCE PRODUCTS TRUST
NOTES TO FINANCIAL STATEMENTS
Franklin Mutual Global Discovery VIP Fund (continued)
1. Organization and Significant Accounting Policies (continued)
d. Derivative Financial Instruments (continued)
The Fund entered into exchange traded futures contracts primarily to manage exposure to certain foreign currencies. A futures contract is an agreement between the Fund and a counterparty to buy or sell an asset for a specified price on a future date. Required initial margins are pledged by the Fund, and the daily change in fair value is accounted for as a variation margin payable or receivable in the Statement of Assets and Liabilities.
The Fund entered into OTC forward exchange contracts primarily to manage exposure to certain foreign currencies. A forward exchange contract is an agreement between the Fund and a counterparty to buy or sell a foreign currency at a specific exchange rate on a future date.
See Note 9 regarding other derivative information.
e. Restricted Cash
At December 31, 2015, the Fund held restricted cash in connection with investments in certain derivative securities. Restricted cash is held in a segregated account with the Fund’s custodian and is reflected in the Statement of Assets and Liabilities.
f. Securities Sold Short
The Fund is engaged in selling securities short, which obligates the Fund to replace a borrowed security with the same security at current fair value. The Fund incurs a loss if the price of the security increases between the date of the short sale and the date on which the Fund replaces the borrowed security. The Fund realizes a gain if the price of the security declines between those dates. Gains are limited to the price at which the Fund sold the security short, while losses are potentially unlimited in size.
The Fund is required to establish a margin account with the broker lending the security sold short. While the short sale is outstanding, the broker retains the proceeds of the short sale to the extent necessary to meet margin requirements until the short position is closed out. A deposit must also be maintained with the Fund’s custodian/counterparty broker consisting of cash and/or securities having a value equal to a specified percentage of the value of the securities sold short. The Fund is obligated to pay fees for borrowing the securities sold short and is required to pay the counterparty any dividends and/or interest due on
securities sold short. Such dividends and/or interest and any security borrowing fees are recorded as an expense to the Fund.
g. Securities Lending
The Fund participates in an agency based securities lending program to earn additional income. The Fund receives cash collateral against the loaned securities in an amount equal to at least 102% of the fair value of the loaned securities. Collateral is maintained over the life of the loan in an amount not less than 100% of the fair value of loaned securities, as determined at the close of Fund business each day; any additional collateral required due to changes in security values is delivered to the Fund on the next business day. The collateral is deposited into a joint cash account with other funds and is used to invest in a money market fund managed by Franklin Advisers, Inc., an affiliate of the Fund, and/or a joint repurchase agreement. The Fund may receive income from the investment of cash collateral, in addition to lending fees and rebates paid by the borrower. Income from securities loaned is reported separately in the Statement of Operations. The Fund bears the market risk with respect to the collateral investment, securities loaned, and the risk that the agent may default on its obligations to the Fund. If the borrower defaults on its obligation to return the securities loaned, the Fund has the right to repurchase the securities in the open market using the collateral received. The securities lending agent has agreed to indemnify the Fund in the event of default by a third party borrower.
Securities lending transactions are accounted for as secured borrowing transactions. The securities out on loan represent the collateral pledged by the Fund, and the cash collateral received for the loaned securities represents the amount borrowed by the Fund. At December 31, 2015, the Fund’s secured borrowing transactions were as follows:
| | | | |
Securities lending transactionsa: | | | | |
Equity investmentsb | | $ | 1,732,770 | |
| | | | |
aThe agreements open at year end can be terminated at any time.
bGross amount of recognized liabilities for securities lending transactions is included in payable upon return of securities loaned in the Statement of Assets and Liabilities.
h. Senior Floating Rate Interests
The Fund invests in senior secured corporate loans that pay interest at rates which are periodically reset by reference to a base lending rate plus a spread. These base lending rates are generally the prime rate offered by a designated U.S. bank or the London
FRANKLIN TEMPLETON VARIABLE INSURANCE PRODUCTS TRUST
NOTES TO FINANCIAL STATEMENTS
Franklin Mutual Global Discovery VIP Fund (continued)
InterBank Offered Rate (LIBOR). Senior secured corporate loans often require prepayment of principal from excess cash flows or at the discretion of the borrower. As a result, actual maturity may be substantially less than the stated maturity. Senior secured corporate loans in which the Fund invests are generally readily marketable, but may be subject to certain restrictions on resale.
i. Income and Deferred Taxes
It is the Fund’s policy to qualify as a regulated investment company under the Internal Revenue Code. The Fund intends to distribute to shareholders substantially all of its taxable income and net realized gains to relieve it from federal income and if applicable, excise taxes. As a result, no provision for U.S. federal income taxes is required.
The Fund may be subject to foreign taxation related to income received, capital gains on the sale of securities and certain foreign currency transactions in the foreign jurisdictions in which it invests. Foreign taxes, if any, are recorded based on the tax regulations and rates that exist in the foreign markets in which the Fund invests. When a capital gain tax is determined to apply, the Fund records an estimated deferred tax liability in an amount that would be payable if the securities were disposed of on the valuation date. As a result of several court cases, in certain countries across the European Union, the Fund has filed additional tax reclaims for previously withheld taxes on dividends earned in those countries. These additional filings are subject to various administrative proceedings by the local jurisdictions’ tax authorities within the European Union, as well as a number of related judicial proceedings. During the year ended December 31, 2015, the Fund recognized $295,461 from Sweden for previously withheld foreign taxes and interest on such taxes. These amounts are reflected as other income and interest in the Statement of Operations. In regards to filings in other European Union countries, uncertainty exists as to the ultimate resolution of these proceedings, the likelihood of receipt of these reclaims, and the potential timing of payment, and accordingly, no amounts are reflected in the financial statements.
The Fund may recognize an income tax liability related to its uncertain tax positions under U.S. GAAP when the uncertain tax position has a less than 50% probability that it will be sustained upon examination by the tax authorities based on its technical merits. As of December 31, 2015, the Fund has determined that no tax liability is required in its financial
statements related to uncertain tax positions for any open tax years (or expected to be taken on future tax returns). Open tax years are those that remain subject to examination and are based on each tax jurisdiction’s statute of limitation.
j. Security Transactions, Investment Income, Expenses and Distributions
Security transactions are accounted for on trade date. Realized gains and losses on security transactions are determined on a specific identification basis. Interest income and estimated expenses are accrued daily. Amortization of premium and accretion of discount on debt securities are included in interest income. Dividend income and dividends declared on securities sold short are recorded on the ex-dividend date except for certain dividends from foreign securities where the dividend rate is not available. In such cases, the dividend is recorded as soon as the information is received by the Fund. Distributions to shareholders are recorded on the ex-dividend date and are determined according to income tax regulations (tax basis). Distributable earnings determined on a tax basis may differ from earnings recorded in accordance with U.S. GAAP. These differences may be permanent or temporary. Permanent differences are reclassified among capital accounts to reflect their tax character. These reclassifications have no impact on net assets or the results of operations. Temporary differences are not reclassified, as they may reverse in subsequent periods.
Common expenses incurred by the Trust are allocated among the Funds based on the ratio of net assets of each Fund to the combined net assets of the Trust. Fund specific expenses are charged directly to the fund that incurred the expense.
Realized and unrealized gains and losses and net investment income, not including class specific expenses, are allocated daily to each class of shares based upon the relative proportion of net assets of each class. Differences in per share distributions, by class, are generally due to differences in class specific expenses.
k. Accounting Estimates
The preparation of financial statements in accordance with U.S. GAAP requires management to make estimates and assumptions that affect the reported amounts of assets and liabilities at the date of the financial statements and the amounts of income and expenses during the reporting period. Actual results could differ from those estimates.
FRANKLIN TEMPLETON VARIABLE INSURANCE PRODUCTS TRUST
NOTES TO FINANCIAL STATEMENTS
Franklin Mutual Global Discovery VIP Fund (continued)
1. Organization and Significant Accounting Policies (continued)
l. Guarantees and Indemnifications
Under the Trust’s organizational documents, its officers and trustees are indemnified by the Trust against certain liabilities arising out of the performance of their duties to the Trust.
Additionally, in the normal course of business, the Trust, on behalf of the Fund, enters into contracts with service providers that contain general indemnification clauses. The Trust’s maximum exposure under these arrangements is unknown as this would involve future claims that may be made against the Trust that have not yet occurred. Currently, the Trust expects the risk of loss to be remote.
2. Shares of Beneficial Interest
At December 31, 2015, there were an unlimited number of shares authorized (without par value). Transactions in the Fund’s shares were as follows:
| | | | | | | | | | | | | | | | | | |
| | | Year Ended December 31, | |
| | | 2015 | | | | | 2014 | |
| | | Shares | | | Amount | | | | | Shares | | | Amount | |
| | | | | |
| Class 1 Shares: | | | | | | | | | | | | | | | | | | |
Shares sold | | | 29,371 | | | $ | 659,819 | | | | | | 31,917 | | | $ | 725,026 | |
Shares issued in reinvestment of distributions | | | 11,573 | | | | 226,030 | | | | | | 7,051 | | | | 163,086 | |
Shares redeemed | | | (10,639 | ) | | | (242,830 | ) | | | | | (42,408 | ) | | | (993,663 | ) |
| | | | |
Net increase (decrease) | | | 30,305 | | | $ | 643,019 | | | | | | (3,440 | ) | | $ | (105,551 | ) |
| | | | |
| Class 2 Shares: | | | | | | | | | | | | | | | | | | |
Shares sold | | | 2,941,446 | | | $ | 64,431,215 | | | | | | 4,023,757 | | | $ | 92,853,300 | |
Shares issued in reinvestment of distributions | | | 2,996,482 | | | | 57,142,910 | | | | | | 2,672,405 | | | | 60,503,258 | |
Shares redeemed | | | (4,457,652 | ) | | | (97,199,847 | ) | | | | | (5,665,511 | ) | | | (130,160,828 | ) |
| | | | |
Net increase (decrease) | | | 1,480,276 | | | $ | 24,374,278 | | | | | | 1,030,651 | | | $ | 23,195,730 | |
| | | | |
| Class 4 Shares: | | | | | | | | | | | | | | | | | | |
Shares sold | | | 121,580 | | | $ | 2,592,251 | | | | | | 84,657 | | | $ | 1,961,531 | |
Shares issued in reinvestment of distributions | | | 228,652 | | | | 4,426,697 | | | | | | 233,144 | | | | 5,345,990 | |
Shares redeemed | | | (532,685 | ) | | | (11,721,202 | ) | | | | | (685,719 | ) | | | (16,234,210 | ) |
| | | | |
Net increase (decrease) | | | (182,453 | ) | | $ | (4,702,254 | ) | | | | | (367,918 | ) | | $ | (8,926,689 | ) |
| | | | |
3. Transactions With Affiliates
Franklin Resources, Inc. is the holding company for various subsidiaries that together are referred to as Franklin Templeton Investments. Certain officers and trustees of the Fund are also officers and/or directors of the following subsidiaries:
| | |
| Subsidiary | | Affiliation |
Franklin Mutual Advisers, LLC (Franklin Mutual) | | Investment manager |
Franklin Templeton Services, LLC (FT Services) | | Administrative manager |
Franklin Templeton Distributors, Inc. (Distributors) | | Principal underwriter |
Franklin Templeton Investor Services, LLC (Investor Services) | | Transfer agent |
FRANKLIN TEMPLETON VARIABLE INSURANCE PRODUCTS TRUST
NOTES TO FINANCIAL STATEMENTS
Franklin Mutual Global Discovery VIP Fund (continued)
a. Management Fees
The Fund pays an investment management fee to Franklin Mutual based on the average daily net assets of the Fund as follows:
| | |
| Annualized Fee Rate | | Net Assets |
0.950% | | Up to and including $200 million |
0.935% | | Over $200 million, up to and including $700 million |
0.900% | | Over $700 million, up to and including $1.2 billion |
0.875% | | Over $1.2 billion, up to and including $4 billion |
0.845% | | Over $4 billion, up to and including $7 billion |
0.825% | | Over $7 billion, up to and including $10 billion |
0.805% | | In excess of $10 billion |
b. Administrative Fees
Under an agreement with Franklin Mutual, FT Services provides administrative services to the Fund. The fee is paid by Franklin Mutual based on the Fund’s average daily net assets, and is not an additional expense of the Fund.
c. Distribution Fees
The Board has adopted distribution plans for Class 2 and Class 4 shares pursuant to Rule 12b-1 under the 1940 Act. Under the Fund’s compensation distribution plans, the Fund pays Distributors for costs incurred in connection with the servicing, sale and distribution of the Fund’s shares up to 0.35% per year of its average daily net assets of each class. The Board has agreed to limit the current rate to 0.25% per year for Class 2. The plan year, for purposes of monitoring compliance with the maximum annual plan rates, is February 1 through January 31.
d. Transfer Agent Fees
Investor Services, under terms of an agreement, performs shareholder servicing for the Fund and is not paid by the Fund for the services.
e. Investments in Affiliated Management Investment Companies
The Fund invests in an affiliated management investment company for purposes other than exercising a controlling influence over the management or policies. Management fees paid by the Fund are waived on assets invested in the affiliated management investment company, as noted in the Statement of Operations, in an amount not to exceed the management and administrative fees paid directly or indirectly by each affiliate.
| | | | | | | | | | | | | | | | | | | | | | | | | | | | | | | | |
| | | Number
of Shares
Held at
Beginning
of Year | | | Gross
Additions | | | Gross
Reductions | | | Number
of Shares
Held at
End of
Year | | | Value at
End of
Year | | | Investment
Income | | | Realized
Gain
(Loss) | | | % of
Affiliated
Fund Shares
Outstanding
Held at End
of Year | |
| Non-Controlled Affiliates | | | | | | | | | | | | | | | | | | | | | | | | | | | | | | | | |
Institutional Fiduciary Trust Money Market Portfolio | | | — | | | | 1,000,000 | | | | (1,000,000 | ) | | | — | | | $ | — | | | $ | — | | | $ | — | | | | —% | |
| | | | | | | | | | | | | | | | | | | | | | | | |
4. Expense Offset Arrangement
The Fund has entered into an arrangement with its custodian whereby credits realized as a result of uninvested cash balances are used to reduce a portion of the Fund’s custodian expenses. During the year ended December 31, 2015, the custodian fees were reduced as noted in the Statement of Operations.
FRANKLIN TEMPLETON VARIABLE INSURANCE PRODUCTS TRUST
NOTES TO FINANCIAL STATEMENTS
Franklin Mutual Global Discovery VIP Fund (continued)
5. Income Taxes
The tax character of distributions paid during the years ended December 31, 2015 and 2014, was as follows:
| | | | | | | | |
| | | 2015 | | | 2014 | |
Distributions paid from: | | | | | | | | |
Ordinary income | | $ | 20,453,231 | | | $ | 23,269,495 | |
Long term capital gain | | | 41,342,406 | | | | 42,742,840 | |
| | | | |
| | $ | 61,795,637 | | | $ | 66,012,335 | |
| | | | |
At December 31, 2015, the cost of investments, net unrealized appreciation (depreciation), undistributed ordinary income and undistributed long term capital gains for income tax purposes were as follows:
| | | | |
Cost of investments | | $ | 597,002,710 | |
| | | | |
Unrealized appreciation | | $ | 158,258,816 | |
Unrealized depreciation | | | (75,907,895 | ) |
| | | | |
Net unrealized appreciation (depreciation) | | $ | 82,350,921 | |
| | | | |
Undistributed ordinary income | | $ | 16,674,179 | |
Undistributed long term capital gains | | | 45,535,450 | |
| | | | |
Distributable earnings | | $ | 62,209,629 | |
| | | | |
Differences between income and/or capital gains as determined on a book basis and a tax basis are primarily due to differing treatments of foreign currency transactions.
6. Investment Transactions
Purchases and sales of investments (excluding short term securities and securities sold short) for the year ended December 31, 2015, aggregated $153,524,973 and $168,695,088, respectively.
7. Credit Risk and Defaulted Securities
The Fund may purchase the pre-default or defaulted debt of distressed companies. Distressed companies are financially troubled and are about to be or are already involved in financial restructuring or bankruptcy. Risks associated with purchasing these securities include the possibility that the bankruptcy or other restructuring process takes longer than expected, or that distributions in restructuring are less than anticipated, either or both of which may result in unfavorable consequences to the Fund. If it becomes probable that the income on debt securities, including those of distressed companies, will not be collected, the Fund discontinues accruing income and recognizes an adjustment for uncollectible interest.
At December 31, 2015, the aggregate long value of distressed company securities for which interest recognition has been discontinued was $5,490,242, representing 0.81% of the Fund’s net assets. For information as to specific securities, see the accompanying Statement of Investments.
8. Restricted Securities
The Fund invests in securities that are restricted under the Securities Act of 1933 (1933 Act) or which are subject to legal, contractual, or other agreed upon restrictions on resale. Restricted securities are often purchased in private placement transactions, and cannot be sold without prior registration unless the sale is pursuant to an exemption under the 1933 Act. Disposal of these securities may require greater effort and expense, and prompt sale at an acceptable price may be difficult. The Fund may have registration rights for restricted securities. The issuer generally incurs all registration costs.
FRANKLIN TEMPLETON VARIABLE INSURANCE PRODUCTS TRUST
NOTES TO FINANCIAL STATEMENTS
Franklin Mutual Global Discovery VIP Fund (continued)
At December 31, 2015, the Fund held investments in restricted securities, excluding certain securities exempt from registration under the 1933 Act deemed to be liquid, as follows:
| | | | | | | | | | | | | | |
Principal
Amount/
Shares/
Units | | Issuer | | Acquisition
Dates | | | Cost | | | Value | |
| 595 | | Broadband Ventures III LLC, secured promissory note, 5.00%, 2/01/12 | �� | | 7/01/10 - 11/30/12 | | | $ | 595 | | | $ | — | |
| 2,077,368 | | FIM Coinvestor Holdings I, LLC | | | 11/20/06 - 6/02/09 | | | | — | | | | — | |
| 2,172,000 | | Hightower Holding LLC, pfd., A, Series 2 | | | 6/10/10 - 5/10/12 | | | | 5,430,000 | | | | 5,157,849 | |
| 424,073 | | International Automotive Components Group Brazil LLC | | | 4/13/06 - 12/26/08 | | | | 281,629 | | | | 4,361 | |
| 4,052,916 | | International Automotive Components Group North America LLC | | | 1/12/06 - 3/18/13 | | | | 3,247,714 | | | | 2,188,027 | |
| | | | | | | | | | |
| | Total Restricted Securities (Value is 1.08% of Net Assets) | | | | | | $ | 8,959,938 | | | $ | 7,350,237 | |
| | | | | | | | | | |
9. Other Derivative Information
At December 31, 2015, the Fund’s investments in derivative contracts are reflected in the Statement of Assets and Liabilities as follows:
| | | | | | | | | | | | |
| | | Asset Derivatives | | | Liability Derivatives | |
Derivative Contracts Not
Accounted for as Hedging
Instruments | | Statement of Assets and
Liabilities Location | | Fair Value | | | Statement of Assets and
Liabilities Location | | Fair Value | |
Foreign exchange contracts | | Variation margin | | $ | 543,348a | | | Variation margin | | $ | — | |
| | Unrealized appreciation on OTC forward exchange contracts | | | 1,943,043 | | | Unrealized depreciation on OTC forward exchange contracts | | | 1,116,543 | |
| | | | | | | | | | | | |
Totals | | | | $ | 2,486,391 | | | | | $ | 1,116,543 | |
| | | | | | | | | | | | |
aThis amount reflects the cumulative appreciation (depreciation) of future contracts as reported in the Statement of Investments. Only the variation margin receivable/payable at year end is separately reported within the Statement of Assets and Liabilities. Prior variation margin movements were recorded to cash upon receipt or payment.
For the year ended December 31, 2015, the effect of derivative contracts in the Fund’s Statement of Operations was as follows:
| | | | | | | | | | | | |
Derivative Contracts Not
Accounted for as Hedging
Instruments | | Statement of Operations
Locations | | Net Realized Gain
(Loss) for the
Year | | | Statement of Operations
Locations | | Net Change in
Unrealized
Appreciation
(Depreciation)
for the Year | |
| | Net realized gain (loss) from: | | | | | | Net change in unrealized
appreciation (depreciation) on: | | | | |
Foreign exchange contracts | | Foreign currency transactions | | $ | 11,144,830 | a | | Translation of other assets and liabilities denominated in foreign currencies | | $ | (3,789,959 | )a |
| | Futures contracts | | | 5,471,972 | | | Futures contracts | | | (471,877 | ) |
| | | | | | | | | | | | |
Totals | | | | $ | 16,616,802 | | | | | $ | (4,261,836 | ) |
| | | | | | | | | | | | |
aForward exchange contracts are included in net realized gain (loss) from foreign currency transactions and net change in unrealized appreciation (depreciation) on translation of other assets and liabilities denominated in foreign currencies in the Statement of Operations.
For the year ended December 31, 2015, the average month end fair value of derivatives represented 0.76% of average month end net assets. The average month end number of open derivative contracts for the year was 193.
See Note 1(d) regarding derivative financial instruments.
FRANKLIN TEMPLETON VARIABLE INSURANCE PRODUCTS TRUST
NOTES TO FINANCIAL STATEMENTS
Franklin Mutual Global Discovery VIP Fund (continued)
10. Credit Facility
The Fund, together with other U.S. registered and foreign investment funds (collectively, Borrowers), managed by Franklin Templeton Investments, are borrowers in a joint syndicated senior unsecured credit facility totaling $2 billion (Global Credit Facility) which matured on February 12, 2016. This Global Credit Facility provides a source of funds to the Borrowers for temporary and emergency purposes, including the ability to meet future unanticipated or unusually large redemption requests. Effective February 12, 2016, the Borrowers renewed the Global Credit Facility for a one year term, maturing February 10, 2017, for a total of $2 billion.
Under the terms of the Global Credit Facility, the Fund shall, in addition to interest charged on any borrowings made by the Fund and other costs incurred by the Fund, pay its share of fees and expenses incurred in connection with the implementation and maintenance of the Global Credit Facility, based upon its relative share of the aggregate net assets of all of the Borrowers, including an annual commitment fee of 0.07% based upon the unused portion of the Global Credit Facility. Effective February 12, 2016, the annual commitment fee is 0.15%. These fees are reflected in other expenses in the Statement of Operations. During the year ended December 31, 2015, the Fund did not use the Global Credit Facility.
11. Fair Value Measurements
The Fund follows a fair value hierarchy that distinguishes between market data obtained from independent sources (observable inputs) and the Fund’s own market assumptions (unobservable inputs). These inputs are used in determining the value of the Fund’s financial instruments and are summarized in the following fair value hierarchy:
| | • | | Level 1 – quoted prices in active markets for identical financial instruments |
| | • | | Level 2 – other significant observable inputs (including quoted prices for similar financial instruments, interest rates, prepayment speed, credit risk, etc.) |
| | • | | Level 3 – significant unobservable inputs (including the Fund’s own assumptions in determining the fair value of financial instruments) |
The input levels are not necessarily an indication of the risk or liquidity associated with financial instruments at that level.
For movements between the levels within the fair value hierarchy, the Fund has adopted a policy of recognizing the transfers as of the date of the underlying event which caused the movement.
A summary of inputs used as of December 31, 2015, in valuing the Fund’s assets and liabilities carried at fair value, is as follows:
| | | | | | | | | | | | | | | | |
| | | Level 1 | | | Level 2 | | | Level 3 | | | Total | |
| | | | |
| Assets: | | | | | | | | | | | | | | | | |
Investments in Securities: | | | | | | | | | | | | | | | | |
Equity Investments:a | | | | | | | | | | | | | | | | |
Auto Components | | $ | 2,940,826 | | | $ | — | | | $ | 2,192,388 | | | $ | 5,133,214 | |
Banks | | | 111,399,263 | | | | 8,632,106 | | | | — | | | | 120,031,369 | |
Diversified Financial Services | | | — | | | | — | | | | 5,157,849 | | | | 5,157,849 | |
All Other Equity Investmentsb | | | 505,764,220 | | | | — | | | | — | c | | | 505,764,220 | |
Corporate Notes and Senior Floating Rate Interests | | | — | | | | 14,470,627 | | | | — | | | | 14,470,627 | |
Corporate Bonds, Notes and Senior Floating Rate Interests in Reorganization | | | — | | | | 5,488,189 | | | | 2,053 | c | | | 5,490,242 | |
Companies in Liquidation | | | 21,518 | | | | 976,636 | | | | — | c | | | 998,154 | |
Municipal Bonds | | | — | | | | 1,644,878 | | | | — | | | | 1,644,878 | |
Short Term Investments | | | 17,930,312 | | | | 2,732,766 | | | | — | | | | 20,663,078 | |
| | | | |
Total Investments in Securities | | $ | 638,056,139 | | | $ | 33,945,202 | | | $ | 7,352,290 | | | $ | 679,353,631 | |
| | | | |
Other Financial Instruments | | | | | | | | | | | | | | | | |
Futures Contracts | | $ | 543,348 | | | $ | — | | | $ | — | | | $ | 543,348 | |
Forward Exchange Contracts | | | — | | | | 1,943,043 | | | | — | | | | 1,943,043 | |
| | | | |
Total Other Financial Instruments | | $ | 543,348 | | | $ | 1,943,043 | | | $ | — | | | $ | 2,486,391 | |
| | | | |
FRANKLIN TEMPLETON VARIABLE INSURANCE PRODUCTS TRUST
NOTES TO FINANCIAL STATEMENTS
Franklin Mutual Global Discovery VIP Fund (continued)
| | | | | | | | | | | | | | | | |
| | | Level 1 | | | Level 2 | | | Level 3 | | | Total | |
| Liabilities: | | | | | | | | | | | | | | | | |
Other Financial Instruments | | | | | | | | | | | | | | | | |
Securities Sold Short | | $ | 1,417,732 | | | $ | — | | | $ | — | | | $ | 1,417,732 | |
Forward Exchange Contracts | | | — | | | | 1,116,543 | | | | — | | | | 1,116,543 | |
| | | | |
Total Other Financial Instruments | | $ | 1,417,732 | | | $ | 1,116,543 | | | $ | — | | | $ | 2,534,275 | |
| | | | |
aIncludes common and preferred stocks as well as other equity investments.
bFor detailed categories, see the accompanying Statement of Investments.
cIncludes securities determined to have no value at December 31, 2015.
A reconciliation of assets in which Level 3 inputs are used in determining fair value is presented when there are significant Level 3 financial instruments at the end of the year. At December 31, 2015, the reconciliation of assets is as follows:
| | | | | | | | | | | | | | | | | | | | | | | | | | | | | | | | | | | | | | | | |
| | | Balance
at
Begin
ning
of
Year | | | Purchases | | | Sales | | | Transfers
Into
Level 3a | | | Transfers
Out of
Level 3 | | | Cost Basis
Adjust
mentsb | | | Net
Realized
Gain
(Loss) | | | Net
Unrealized
Appre
ciation
(Depre
ciation) | | | Balance
at
End of
Year | | | Net
Change in
Unrealized
Appre
ciation
(Depre
ciation)
on Assets
Held at
Year End | |
| Assets: | | | | | | | | | | | | | | | | | | | | | | | | | | | | | | | | | | | | | | | | |
Investments in Securities: | | | | | | | | | | | | | | | | | | | | | | | | | | | | | | | | | | | | | | | | |
Equity Investments:c | | | | | | | | | | | | | | | | | | | | | | | | | | | | | | | | | | | | | | | | |
Auto Components | | $ | 3,108,896 | | | $ | — | | | $ | — | | | $ | — | | | $ | — | | | $ | — | | | $ | — | | | $ | (916,508 | ) | | $ | 2,192,388 | | | $ | (916,508 | ) |
Diversified Financial Services | | | 5,052,941 | | | | — | | | | — | | | | — | | | | — | | | | — | | | | — | | | | 104,908 | | | | 5,157,849 | | | | 104,908 | |
Insurance | | | — | d | | | — | | | | — | | | | — | | | | — | | | | (834 | ) | | | (199,086 | ) | | | 199,920 | | | | — | | | | — | |
Real Estate Management & Development | | | 4,108,670 | | | | — | | | | (4,881,451 | ) | | | — | | | | — | | | | — | | | | 2,540,917 | | | | (1,768,136 | ) | | | — | | | | — | |
Corporate Bonds, Notes and Senior Floating Rate Interests in Reorganization | | | — | d | | | — | | | | — | | | | 11,672 | | | | — | | | | — | | | | — | | | | (9,619 | ) | | | 2,053 | d | | | (9,619 | ) |
| | | | |
Total Investments in Securities | | $ | 12,270,507 | | | $ | — | | | $ | (4,881,451 | ) | | $ | 11,672 | | | $ | — | | | $ | (834 | ) | | $ | 2,341,831 | | | $ | (2,389,435 | ) | | $ | 7,352,290 | | | $ | (821,219 | ) |
| | | | |
aThe investments were transferred into Level 3 as a result of the unavailability of other significant observable inputs.
bMay include accretion, amortization, partnership adjustments, and/or other cost basis adjustments.
cIncludes common and preferred stocks as well as other equity investments.
dIncludes securities determined to have no value.
FRANKLIN TEMPLETON VARIABLE INSURANCE PRODUCTS TRUST
NOTES TO FINANCIAL STATEMENTS
Franklin Mutual Global Discovery VIP Fund (continued)
11. Fair Value Measurements (continued)
Significant unobservable valuation inputs developed by the VLOC for material Level 3 financial instruments and impact to fair value as a result of changes in unobservable valuation inputs as of December 31, 2015, are as follows:
| | | | | | | | | | | | | | | | |
| Description | | Fair Value at
End of Year | | | Valuation
Technique | | Unobservable Input | | Amount/
Range | | | Impact to Fair
Value if Input
Increasesa | |
| Assets: | | | | | | | | | | | | | | | | |
| | | | | |
| Investments in Securities: | | | | | | | | | | | | | | | | |
| | | | | |
Equity Investments:b | | | | | | | | | | | | | | | | |
| | | | | |
Auto Components | | $ | 2,188,027 | | | Market comparables | | Discount for lack of marketability EV / EBITDA multiple | |
| 10%
3.8x |
| |
| Decreasec
Increased |
|
Diversified Financial Services | | | 5,157,849 | | | Discounted Cash Flow Model | | Cost of Equity Revenue growth rate Adjusted EBITDA margin | |
| 15%
6.2% - 20.2% 4.1% - 21.1% |
| |
| Decreased
Increased
Increased |
|
All Other Investmentse | | | 6,414 | | | | | | | | | | | | | |
Total | | $ | 7,352,290 | | | | | | | | | | | | | |
aRepresents the directional change in the fair value of the Level 3 financial instruments that would result from a significant and reasonable increase in the corresponding input. A significant and reasonable decrease in input would have the opposite effect. Significant impacts, if any, to fair value and/or net assets have been indicated.
bIncludes common and preferred stocks.
cRepresents a significant impact to fair value but not net assets.
dRepresents a significant impact to fair value and net assets.
eIncludes fair value of immaterial financial instruments developed using various valuation techniques and unobservable inputs. May also include financial instruments with values derived using prior transaction prices or third party pricing information without adjustment for which such inputs are also unobservable.
Abbreviations List
| | |
| |
| EBITDA | | Earnings before interest, taxes, depreciation and amortization |
| |
| EV | | Enterprise value |
12. Subsequent Events
The Fund has evaluated subsequent events through the issuance of the financial statements and determined that no events have occurred that require disclosure other than those already disclosed in the financial statements.
Abbreviations
| | | | | | | | | | |
| Counterparty | | Currency | | Selected Portfolio |
| | | | | |
| BOFA | | Bank of America N.A. | | CHF | | Swiss Franc | | ADR | | American Depositary Receipt |
| | | | | |
| BONY | | Bank of New York Mellon | | EUR | | Euro | | FHLB | | Federal Home Loan Bank |
| | | | | |
| BZWS | | Barclays Bank PLC | | GBP | | British Pound | | GO | | General Obligation |
| | | | | |
| DBAB | | Deutsche Bank AG | | USD | | United States Dollar | | PIK | | Payment-In-Kind |
| | | | | |
| FBCO | | Credit Suisse Group AG | | | | | | | | |
| | | | | |
| HSBC | | HSBC Bank USA, N.A. | | | | | | | | |
| | | | | |
| SSBT | | State Street Bank and Trust Co. | | | | | | | | |
FRANKLIN TEMPLETON VARIABLE INSURANCE PRODUCTS TRUST
Report of Independent Registered Public Accounting Firm
Franklin Mutual Global Discovery VIP Fund
To the Board of Trustees and Shareholders of Franklin Templeton Variable Insurance Products Trust
In our opinion, the accompanying statement of assets and liabilities, including the statement of investments, and the related statements of operations and of changes in net assets and the financial highlights present fairly, in all material respects, the financial position of Franklin Mutual Global Discovery VIP Fund (the “Fund”) at December 31, 2015, the results of its operations for the year then ended, the changes in its net assets for each of the two years in the period then ended and the financial highlights for each of the periods presented, in conformity with accounting principles generally accepted in the United States of America. These financial statements and financial highlights (hereafter referred to as “financial statements”) are the responsibility of the Fund’s management. Our responsibility is to express an opinion on these financial statements based on our audit. We conducted our audit of these financial statements in accordance with the standards of the Public Company Accounting Oversight Board (United States). Those standards require that we plan and perform the audit to obtain reasonable assurance about whether the financial statements are free of material misstatement. An audit includes examining, on a test basis, evidence supporting the amounts and disclosures in the financial statements, assessing the accounting principles used and significant estimates made by management, and evaluating the overall financial statement presentation. We believe that our audit, which included confirmation of securities at December 31, 2015 by correspondence with the custodian and brokers, provides a reasonable basis for our opinion.
PricewaterhouseCoopers LLP
San Francisco, California
February 16, 2016
FRANKLIN TEMPLETON VARIABLE INSURANCE PRODUCTS TRUST
Tax Information (unaudited)
Franklin Mutual Global Discovery VIP Fund
Under Section 852(b)(3)(C) of the Internal Revenue Code (Code), the Fund hereby reports the maximum amount allowable but no less than $41,342,406 as a long term capital gain dividend for the fiscal year ended December 31, 2015.
Under Section 854(b)(1)(A) of the Code, the Fund hereby reports 38.86% of the ordinary income dividends as income qualifying for the dividends received deduction for the fiscal year ended December 31, 2015.
Franklin Mutual Shares VIP Fund
This annual report for Franklin Mutual Shares VIP Fund covers the fiscal year ended December 31, 2015.
Class 4 Performance Summary as of December 31, 2015
Average annual total return of Class 4 shares* represents the average annual change in value, assuming reinvestment of dividends and capital gains. Average returns smooth out variations in returns, which can be significant; they are not the same as year-by-year results.
| | | | | | | | | | | | |
| Periods ended 12/31/15 | | 1-Year | | | 5-Year | | | 10-Year | |
Average Annual Total Return | | | -5.05% | | | | +8.00% | | | | +4.75% | |
*For the period beginning 2/29/08, Class 4 performance reflects a 12b-1 fee expense of 0.35% per year, which affects future performance. Class 4 performance prior to 2/29/08 reflects historical Class 1 performance, which does not have a 12b-1 fee expense. Since 2/29/08 (effective date), the average annual total return of Class 4 shares was +4.34%. The Fund has a fee waiver associated with any investment in a Franklin Templeton money fund, contractually guaranteed through at least its current fiscal year-end. Fund investment results reflect the fee waiver, to the extent applicable; without this reduction, the results would have been lower.
Performance reflects the Fund’s Class 4 operating expenses, but does not include any contract fees, expenses or sales charges. If they had been included, performance would be lower. These charges and deductions, particularly for variable life policies, can have a significant effect on contract values and insurance benefits. See the contract prospectus for a complete description of these expenses, including sales charges.
Performance data represent past performance, which does not guarantee future results. Investment return and principal value will fluctuate, and you may have a gain or loss when you sell your shares. Current performance may differ from figures shown.
Total Return Index Comparison for a Hypothetical $10,000 Investment (1/1/06–12/31/15)
The graph below shows the change in value of a hypothetical $10,000 investment in the Fund over the indicated period and includes reinvestment of any income and distributions. The Fund’s performance* is compared to the performance of the Standard & Poor’s® 500 Index (S&P 500®). One cannot invest directly in an index, and an index is not representative of the Fund’s portfolio. Please see Important Notes to Performance Information preceding the Fund Summaries.
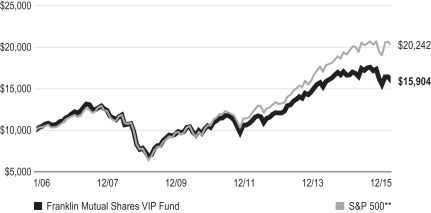
**Source: Morningstar. Please see Index Descriptions following the Fund Summaries.
FRANKLIN MUTUAL SHARES VIP FUND
Fund Goals and Main Investments
The Fund seeks capital appreciation, with income as a secondary goal, by investing primarily in equity securities of companies the Fund’s managers believe are at prices below their intrinsic value. The Fund may invest up to 35% of its assets in foreign securities.
Fund Risks
All investments involve risks, including possible loss of principal. Value securities may not increase in price as anticipated or may decline further in value. The Fund’s investments in foreign securities involve special risks including currency fluctuations, and economic and political uncertainties. The Fund may also invest in companies engaged in mergers, reorganizations or liquidations, which involve special risks as pending deals may not be completed on time or on favorable terms, as well as lower rated bonds, which entail higher credit risk. The Fund is actively managed but there is no guarantee that the manager’s investment decisions will produce the desired results. The Fund’s prospectus also includes a description of the main investment risks.
Performance Overview
You can find the Fund’s one-year total return in the Performance Summary. In comparison, the Fund’s benchmark, the S&P 500, generated a +1.38% total return for the period under review.1
Economic and Market Overview
U.S. economic growth slowed in 2015’s first quarter but strengthened in 2015’s second quarter amid healthy consumer spending. The third and fourth quarters were less robust as exports slowed and state and local governments reduced their spending. At its December meeting, the U.S. Federal Reserve (Fed) increased its target range for the federal funds rate to 0.25%–0.50%, as policymakers cited the labor market’s considerable improvement and were reasonably confident that inflation would move back to the Fed’s 2% medium-term objective. Furthermore, the Fed raised its forecast for 2016 U.S. economic growth and lowered its unemployment projection. Despite periods of volatility, the broad U.S. stock market, as measured by the Standard & Poor’s 500 Index, generated a modest positive total return for 2015.
The global economy expanded moderately during the 12 months under review. As measured by the MSCI World Index,
stocks in global developed markets overall were down slightly for the year despite some positive developments.2 Weighing on global stocks at times were worries about China’s slowing economy and tumbling stock market, declining commodity prices, geopolitical tensions between Russia and Turkey, and ongoing uncertainty over the Fed’s timing for raising interest rates. Toward period-end, equity markets recovered somewhat as the Fed increased its federal funds target range, alleviating some uncertainty about a change in the U.S. monetary policy. During the year, oil prices declined sharply largely due to increased global supply that exceeded demand. Gold and other commodity prices also fell. The U.S. dollar appreciated against most currencies during the period, which reduced returns of many foreign assets in U.S. dollar terms.
In Europe, U.K. economic growth gained momentum from the services sector, but the economy slowed in 2015 compared with 2014. The eurozone grew moderately and generally benefited during the period from lower oil prices, a weaker euro that supported exports, the European Central Bank’s (ECB’s) accommodative policy and expectations of further ECB stimulus. Although the eurozone’s annual inflation rate declined early in the period, it rose slightly during the rest of the period. The ECB maintained its benchmark interest rates although it reduced its bank deposit rate in December, seeking to boost the region’s slowing growth.
Investment Strategy
At Franklin Mutual Series, we are committed to our distinctive value approach to investing. Our major investment strategy is investing in undervalued stocks. When selecting undervalued equities, we are attracted to what we believe are fundamentally strong companies with healthy balance sheets, high-quality assets, substantial free cash flow and shareholder-oriented management teams and whose stocks are trading at discounts to our assessment of the companies’ intrinsic or business value. We also look for asset-rich companies whose shares may be trading at depressed levels due to concerns over short-term earnings disappointments, litigation, management strategy or other perceived negatives. While the vast majority of our undervalued equity investments are made in publicly traded companies globally, we may invest occasionally in privately held companies as well.
We complement this more traditional investment strategy with two others. One is distressed investing, which is complex and can take many forms. The most common distressed investment
1. Source: Morningstar. One cannot invest directly in an index, and an index is not representative of the Fund’s portfolio. Please see Index Descriptions following the Fund Summaries.
2. Please see Index Descriptions following the Fund Summaries.
FRANKLIN MUTUAL SHARES VIP FUND
the Fund undertakes is the purchase of financially troubled or bankrupt companies’ debt at a substantial discount to face value. After the financially distressed company is reorganized, often in bankruptcy court, the old debt is typically replaced with new securities issued by the financially stronger company.
The other piece of our investment strategy is participating in arbitrage situations, another highly specialized field. When companies announce proposed mergers or takeovers, commonly referred to as “deals,” the target company may trade at a discount to the bid it ultimately accepts. One form of arbitrage involves purchasing the target company’s stock when it is trading below the value we believe it would receive in a deal. In keeping with our commitment to a relatively conservative investment approach, we typically focus our arbitrage efforts on announced deals, and eschew rumored deals or other situations we consider relatively risky.
In addition, it is our practice to hedge the Fund’s currency exposure when we deem it advantageous for our shareholders.
What is meant by “hedge”?
To hedge an investment is to take a position intended to offset potential losses/gains that may be incurred by a companion financial instrument.
Manager’s Discussion
During the 12 months under review, stocks in most global markets declined after a three-year ascent. Globally, several major central banks became more accommodative while fiscal authorities focused on budgetary discipline. Large companies also remained disciplined about operating costs, with margins at historically high levels in many industries and countries. To drive further growth, an increasing number of companies looked to acquisitions, taking advantage of low interest rates to finance deals. In this environment, we saw a number of opportunities.
Equity prices are typically forward looking, reflecting investors’ beliefs about how various factors and events will play out in the future. Global equity prices at period-end were down from mid-2015 highs, reflecting increased uncertainty among global investors regarding China and other emerging markets, global commodity prices, U.S. monetary policy divergence and geopolitical events. However, with the support of global quantitative easing, many corporations have been able to build strong balance sheets, focus intensely on improving efficiency, maintain historically high margins and return a significant amount of capital to shareholders.
| | | | |
| Top 10 Sectors/Industries | | | |
| Based on Equity Securities | | | |
| 12/31/15 | | | |
| | | % of Total
Net Assets | |
| Insurance | | | 10.9% | |
| Banks | | | 10.5% | |
| Pharmaceuticals | | | 8.3% | |
| Media | | | 6.6% | |
| Tobacco | | | 6.2% | |
| Software | | | 6.1% | |
| Oil, Gas & Consumable Fuels | | | 5.5% | |
| Health Care Equipment & Supplies | | | 4.5% | |
| Food & Staples Retailing | | | 3.5% | |
| Technology Hardware, Storage & Peripherals | | | 3.1% | |
Merger and acquisition (M&A) activity accelerated in the past 12 months, helping to support valuations. Deal volumes reached historical highs and regulators globally increased their scrutiny of potential negative effects of high concentration. Such an environment — active M&A combined with regulatory uncertainty, greater complexity and market volatility — may provide attractive investment opportunities. We seek to use a mixture of merger arbitrage positions — positions constructed solely to benefit from deal completion — and investments in one or both of the companies involved in a deal to benefit from deal spread and from possible value creation once the deal is completed.
Distressed debt remained a difficult market for us to find compelling new opportunities. Low interest rates have kept credit widely available, and we saw few actual bankruptcies. Increased stress in high yield markets, particularly in energy credit, has expanded the potential opportunity set for us. For non-energy firms, costs of issuing debt are climbing and these debt securities are starting to look attractive to us. Within energy, declining commodity prices increased financial pressures for a growing number of issuers. At year-end, a record level of crude oil inventories and insistence by Saudi Arabia that it will not reduce production provide little reason to expect a quick recovery in crude oil prices, implying to us an increased likelihood of new investment opportunities in energy sector debt.
Turning to Fund performance, top contributors included multinational software company Microsoft and pharmaceutical companies Hospira3 and Eli Lilly & Co.
Shares of Microsoft rose as earnings improved and the company’s cloud computing services gained momentum. In April and
3. Not held at period-end.
FRANKLIN MUTUAL SHARES VIP FUND
October, Microsoft’s quarterly earnings exceeded consensus estimates despite a challenging environment for personal computer sales. Revenue outperformance and cost controls helped drive the solid results, highlighted by the strong performance of Microsoft’s cloud computing operations, which include Azure and Office365. We believe Microsoft’s cloud computing business has the potential to grow and become increasingly profitable as technology users become more comfortable relying on cloud infrastructure and applications. Supporting this belief were the company’s assertions that the growth in Office365 subscriptions began to fully offset the decline in transactional, one-time license purchases. October’s quarterly results also showed strength in the adoption of Microsoft’s new Windows 10 operating system.
Hospira is a global pharmaceutical and medical device company specializing in injectable generic drugs and biosimilars — drugs highly similar to medications licensed by other firms. Shares rose sharply in early February following the announcement that Pfizer had reached an agreement to acquire Hospira. We believed the deal, which closed in early September, made sense as Hospira offered Pfizer a strong leadership position in injectables and an attractive high-growth generics market, and the deal positioned Pfizer as a top-tier biosimilars company with a strong pipeline. This acquisition news was in line with our views on industry consolidation and more specifically on Hospira as a highly attractive asset in the generics industry.
U.S.-based Eli Lilly & Co. performed well in 2015 as the market, in our view, gained more appreciation for the company’s strong research and development capabilities and deep pipeline. Driving the increased appreciation was Eli Lilly’s substantial progress during the year on several new product approvals including an oncology compound, regulatory submissions including for a psoriasis treatment and positive late-stage data disclosures including a drug for rheumatoid arthritis. Also, in September, Eli Lilly and drug maker Boehringer Ingelheim (a private company) announced that their jointly owned diabetes drug significantly reduced cardiovascular risk. Eli Lilly’s 2015 operating performance was also strong as the company raised its earnings guidance in July and reported solid sales performance and profit margin progress in October. We believe Eli Lilly has many attractive assets targeting end markets with high unmet medical needs that, in our assessment, position its business to generate strong long-term revenues and free cash flows.
During the period under review, Fund investments that negatively affected performance included utility Texas Competitive Electric Holdings (TCEH), oil and gas exploration and production company Marathon Oil and natural resources company Freeport-McMoRan.
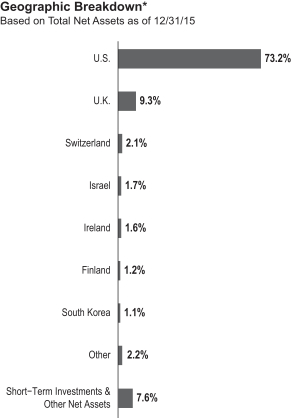
*Figures are stated as a percentage of total and may not equal 100% or may be negative due to rounding, use of any derivatives, unsettled trades or other factors.
The value of our TCEH debt holdings declined in 2015 due to lower natural gas and coal prices that reduced the market rates for the company’s electricity sales. Notably, in early December, natural gas retreated to its lowest price in over a decade. TCEH is a unit of Energy Future Holdings, the largest power company in Texas, which filed for bankruptcy in 2014 after defaulting on debt associated with a $45 billion leveraged buyout of the company in 2007, just as energy prices began to decline. The company intends to emerge from bankruptcy in 2016 with less leverage on its balance sheet.
Marathon Oil’s stock price closely followed the decline in crude oil. In October, Marathon Oil announced a dividend cut, a move that preserves capital and puts the company’s capital allocation policies more in line with its exploration and production peer group, in our analysis. We believed this move could allow for a smaller reduction in capital spending and a corresponding improvement in its production profile, which we welcomed given the returns available from the company’s resource base. The company also announced a significant reduction in its deepwater exploration program, an action we viewed favorably
FRANKLIN MUTUAL SHARES VIP FUND
given the program’s lackluster returns in recent years. We continued to believe that Marathon Oil’s relatively low-cost assets would enable it to weather the current downturn with the potential to generate strong returns if the environment improves.
Shares of Freeport-McMoRan were primarily affected by steeply falling commodity prices in 2015, such as for copper, crude oil and natural gas. Investor uncertainty regarding the company’s negotiations with Indonesia’s government also hurt the stock price. The two sides agreed to a six-month export permit extension in late July, but other important matters remained outstanding at year-end, including every-other-year negotiations of a labor contract and the long-term operating rights and investment plans of the company’s Indonesia unit. The company took steps to strengthen its financial position, including a significant cut in its 2016–2017 capital investment budget, the suspension of its dividend and an agreement with creditors to ease covenants on a $4 billon term loan, announced in December.
During the period, the Fund held currency forwards and futures to somewhat hedge the currency risk of the portfolio’s non-U.S. dollar investments. The currency forwards had a positive impact on the Fund’s performance during the period, and currency futures had a negligible impact.
What is a currency forward contract?
A currency forward contract, or a “currency forward,” is an agreement between the Fund and a counterparty to buy or sell a foreign currency at a specific exchange rate on a future date.
What is a futures contract?
A futures contract, or a future, is an agreement between the Fund and a counterparty made through a U.S. or foreign futures exchange to buy or sell an underlying instrument or asset at a specific price on a future date.
Thank you for your participation in Franklin Mutual Shares VIP Fund. We look forward to serving your future investment needs.
| | | | |
| Top 10 Equity Holdings | | | |
| 12/31/15 | | | |
Company
Sector/Industry, Country | | % of Total
Net Assets | |
Microsoft Corp. Software, U.S. | | | 3.6% | |
Medtronic PLC Health Care Equipment & Supplies, U.S. | | | 3.2% | |
Merck & Co. Inc. Pharmaceuticals, U.S. | | | 2.8% | |
Eli Lilly & Co. Pharmaceuticals, U.S. | | | 2.4% | |
Time Warner Cable Inc. Media, U.S. | | | 2.2% | |
PNC Financial Services Group Inc. Banks, U.S. | | | 2.2% | |
American International Group Inc. Insurance, U.S. | | | 2.1% | |
White Mountains Insurance Group Ltd. Insurance, U.S. | | | 2.0% | |
British American Tobacco PLC Tobacco, U.K. | | | 1.8% | |
ACE Ltd. Insurance, U.S. | | | 1.7% | |
The dollar value, number of shares or principal amount, and names of all portfolio holdings are listed in the Fund’s Statement of Investments.
The foregoing information reflects our analysis, opinions and portfolio holdings as of December 31, 2015, the end of the reporting period. The way we implement our main investment strategies and the resulting portfolio holdings may change depending on factors such as market and economic conditions. These opinions may not be relied upon as investment advice or an offer for a particular security. The information is not a complete analysis of every aspect of any market, country, industry, security or the Fund. Statements of fact are from sources considered reliable, but the investment manager makes no representation or warranty as to their completeness or accuracy. Although historical performance is no guarantee of future results, these insights may help you understand our investment management philosophy.
FRANKLIN MUTUAL SHARES VIP FUND
Class 4 Fund Expenses
As an investor in a variable insurance contract (Contract) that indirectly provides for investment in an underlying mutual fund, you can incur transaction and/or ongoing expenses at both the Fund level and the Contract level.
| • | | Transaction expenses can include sales charges (loads) on purchases, redemption fees, surrender fees, transfer fees and premium taxes. |
| • | | Ongoing expenses can include management fees, distribution and service (12b-1) fees, contract fees, annual maintenance fees, mortality and expense risk fees and other fees and expenses. All mutual funds and Contracts have some types of ongoing expenses. |
The expenses shown in the table are meant to highlight ongoing expenses at the Fund level only and do not include ongoing expenses at the Contract level, or transaction expenses at either the Fund or Contract level. While the Fund does not have transaction expenses, if the transaction and ongoing expenses at the Contract level were included, the expenses shown below would be higher. You should consult your Contract prospectus or disclosure document for more information.
The table shows Fund-level ongoing expenses and can help you understand these expenses and compare them with those of other mutual funds offered through the Contract. The table assumes a $1,000 investment held for the six months indicated. Please refer to the Fund prospectus for additional information on operating expenses.
Actual Fund Expenses
The first line (Actual) of the table provides actual account values and expenses. The “Ending Account Value” is derived from the Fund’s actual return, which includes the effect of ongoing Fund expenses, but does not include the effect of ongoing Contract expenses.
You can estimate the Fund-level expenses you incurred during the period by following these steps. Of course, your account value and expenses will differ from those in this illustration:
| 1. | Divide your account value by $1,000. |
If an account had an $8,600 value, then $8,600 ÷ $1,000 = 8.6.
| 2. | Multiply the result by the number under the heading “Fund-Level Expenses Incurred During Period.” |
If Fund-Level Expenses Incurred During Period were $7.50, then 8.6 × $7.50 = $64.50.
In this illustration, the estimated expenses incurred this period at the Fund level are $64.50.
Hypothetical Example for Comparison with Other Mutual Funds
Information in the second line (Hypothetical) of the table can help you compare ongoing expenses of the Fund with those of other mutual funds offered through the Contract. This information may not be used to estimate the actual ending account balance or expenses you incurred during the period. The hypothetical “Ending Account Value” is based on the Fund’s actual expense ratio and an assumed 5% annual rate of return before expenses, which does not represent the Fund’s actual return. The figure under the heading “Fund-Level Expenses Incurred During Period” shows the hypothetical expenses your account would have incurred under this scenario. You can compare this figure with the 5% hypothetical examples that appear in shareholder reports of other funds offered through a Contract.
| | | | | | | | | | | | |
| Class 4 | | Beginning Account Value 7/1/15 | | | Ending Account Value 12/31/15 | | | Fund-Level Expenses
Incurred During Period* 7/1/15–12/31/15 | |
Actual | | | $1,000 | | | | $ 931.10 | | | | $5.16 | |
Hypothetical (5% return before expenses) | | | $1,000 | | | | $1,019.86 | | | | $5.40 | |
*Expenses are calculated using the most recent six-month annualized expense ratio, net of expense waivers, for the Fund’s Class 4 shares (1.06%), which does not include any ongoing expenses of the Contract for which the Fund is an investment option, multiplied by the average account value over the period, multiplied by 184/365 to reflect the one-half year period.
FRANKLIN TEMPLETON VARIABLE INSURANCE PRODUCTS TRUST
Financial Highlights
Franklin Mutual Shares VIP Fund
| | | | | | | | | | | | | | | | | | | | |
| | | Year Ended December 31, | |
| | | 2015 | | | 2014 | | | 2013 | | | 2012 | | | 2011 | |
| Class 1 | | | | | | | | | | | | | | | | | | | | |
Per share operating performance
(for a share outstanding throughout the year) | | | | | | | | | | | | | | | | | | | | |
| | | | | |
Net asset value, beginning of year | | | $22.91 | | | | $21.92 | | | | $17.45 | | | | $15.57 | | | | $16.14 | |
| | | | |
| | | | | |
| Income from investment operationsa: | | | | | | | | | | | | | | | | | | | | |
| | | | | |
Net investment incomeb | | | 0.44 | | | | 0.62 | c | | | 0.42 | | | | 0.35 | | | | 0.38 | d |
| | | | | |
Net realized and unrealized gains (losses) | | | (1.54 | ) | | | 1.01 | | | | 4.52 | | | | 1.92 | | | | (0.53 | ) |
| | | | |
Total from investment operations | | | (1.10 | ) | | | 1.63 | | | | 4.94 | | | | 2.27 | | | | (0.15 | ) |
| | | | |
| | | | | |
| Less distributions from: | | | | | | | | | | | | | | | | | | | | |
| | | | | |
Net investment income | | | (0.77 | ) | | | (0.52 | ) | | | (0.47 | ) | | | (0.39 | ) | | | (0.42 | ) |
| | | | | |
Net realized gains | | | (1.56 | ) | | | (0.12 | ) | | | — | | | | — | | | | — | |
| | | | |
Total distributions | | | (2.33 | ) | | | (0.64 | ) | | | (0.47 | ) | | | (0.39 | ) | | | (0.42 | ) |
| | | | |
Net asset value, end of year | | | $19.48 | | | | $22.91 | | | | $21.92 | | | | $17.45 | | | | $15.57 | |
| | | | |
| | | | | |
Total returne | | | (4.69)% | | | | 7.38% | | | | 28.53% | | | | 14.61% | | | | (0.79)% | |
| | | | | |
| Ratios to average net assets | | | | | | | | | | | | | | | | | | | | |
| | | | | |
Expensesf | | | 0.73% | g,h | | | 0.73% | g | | | 0.71% | g | | | 0.71% | | | | 0.73% | g |
| | | | | |
Expenses incurred in connection with securities sold short | | | 0.02% | | | | 0.03% | | | | —%i | | | | —% | i | | | —% | i |
| | | | | |
Net investment income | | | 2.00% | | | | 2.83% | c | | | 2.08% | | | | 2.06% | | | | 2.28% | d |
| | | | | |
| Supplemental data | | | | | | | | | | | | | | | | | | | | |
| | | | | |
Net assets, end of year (000’s) | | | $643,438 | | | | $656,463 | | | | $552,163 | | | | $449,343 | | | | $1,170,781 | |
| | | | | |
Portfolio turnover rate | | | 19.88% | | | | 21.33% | | | | 24.05% | | | | 34.07% | j | | | 41.02% | |
aThe amount shown for a share outstanding throughout the period may not correlate with the Statement of Operations for the period due to the timing of sales and repurchases of the Fund’s shares in relation to income earned and/or fluctuating fair value of the investments of the Fund.
bBased on average daily shares outstanding.
cNet investment income per share includes approximately $0.23 per share related to income received in the form of special dividends in connection with certain Fund holdings. Excluding this amount, the ratio of net investment income to average net assets would have been 1.79%.
dNet investment income per share includes approximately $0.02 per share related to interest income received that had previously been deemed uncollectible. Excluding this amount, the ratio of net investment income to average net assets would have been 2.14%.
eTotal return does not include fees, charges or expenses imposed by the variable annuity and life insurance contracts for which Franklin Templeton Variable Insurance Products Trust serves as an underlying investment vehicle.
fIncludes dividend and/or interest expense on securities sold short and security borrowing fees, if any. See below for the ratios of such expenses to average net assets for the periods presented. See Note 1(e).
gBenefit of expense reduction rounds to less than 0.01%.
hBenefit of waiver and payments by affiliates rounds to less than 0.01%.
iRounds to less than 0.01%.
jExcludes the value of portfolio securities delivered as a result of redemption in-kind.
| | | | | | |
| | | The accompanying notes are an integral part of these financial statements. | Annual Report | | | MS-7 | |
FRANKLIN TEMPLETON VARIABLE INSURANCE PRODUCTS TRUST
FINANCIAL HIGHLIGHTS
Franklin Mutual Shares VIP Fund (continued)
| | | | | | | | | | | | | | | | | | | | |
| | | Year Ended December 31, | |
| | | 2015 | | | 2014 | | | 2013 | | | 2012 | | | 2011 | |
| Class 2 | | | | | | | | | | | | | | | | | | | | |
Per share operating performance
(for a share outstanding throughout the year) | | | | | | | | | | | | | | | | | | | | |
| | | | | |
Net asset value, beginning of year | | | $22.60 | | | | $21.63 | | | | $17.23 | | | | $15.38 | | | | $15.95 | |
| | | | |
| | | | | |
| Income from investment operationsa: | | | | | | | | | | | | | | | | | | | | |
| | | | | |
Net investment incomeb | | | 0.38 | | | | 0.58 | c | | | 0.36 | | | | 0.30 | | | | 0.32 | d |
| | | | | |
Net realized and unrealized gains (losses) | | | (1.51 | ) | | | 0.97 | | | | 4.46 | | | | 1.90 | | | | (0.51 | ) |
| | | | |
Total from investment operations | | | (1.13 | ) | | | 1.55 | | | | 4.82 | | | | 2.20 | | | | (0.19 | ) |
| | | | |
| | | | | |
| Less distributions from: | | | | | | | | | | | | | | | | | | | | |
| | | | | |
Net investment income | | | (0.71 | ) | | | (0.46 | ) | | | (0.42 | ) | | | (0.35 | ) | | | (0.38 | ) |
| | | | | |
Net realized gains | | | (1.56 | ) | | | (0.12 | ) | | | — | | | | — | | | | — | |
| | | | |
Total distributions | | | (2.27 | ) | | | (0.58 | ) | | | (0.42 | ) | | | (0.35 | ) | | | (0.38 | ) |
| | | | |
Net asset value, end of year | | | $19.20 | | | | $22.60 | | | | $21.63 | | | | $17.23 | | | | $15.38 | |
| | | | |
| | | | | |
Total returne | | | (4.94)% | | | | 7.12% | | | | 28.26% | | | | 14.24% | | | | (1.04)% | |
| | | | | |
| Ratios to average net assets | | | | | | | | | | | | | | | | | | | | |
| | | | | |
Expensesf | | | 0.98% | g,h | | | 0.98% | g | | | 0.96% | g | | | 0.96% | | | | 0.98% | g |
| | | | | |
Expenses incurred in connection with securities sold short | | | 0.02% | | | | 0.03% | | | | —% | i | | | —% | i | | | —% | i |
| | | | | |
Net investment income | | | 1.75% | | | | 2.58% | c | | | 1.83% | | | | 1.81% | | | | 2.03% | d |
| | | | | |
| Supplemental data | | | | | | | | | | | | | | | | | | | | |
| | | | | |
Net assets, end of year (000’s) | | | $3,353,505 | | | | $4,218,342 | | | | $4,558,547 | | | | $4,069,803 | | | | $3,913,220 | |
| | | | | |
Portfolio turnover rate | | | 19.88% | | | | 21.33% | | | | 24.05% | | | | 34.07% | j | | | 41.02% | |
aThe amount shown for a share outstanding throughout the period may not correlate with the Statement of Operations for the period due to the timing of sales and repurchases of the Fund’s shares in relation to income earned and/or fluctuating fair value of the investments of the Fund.
bBased on average daily shares outstanding.
cNet investment income per share includes approximately $0.23 per share related to income received in the form of special dividends in connection with certain Fund holdings. Excluding this amount, the ratio of net investment income to average net assets would have been 1.54%.
dNet investment income per share includes approximately $0.02 per share related to interest income received that had previously been deemed uncollectible. Excluding this amount, the ratio of net investment income to average net assets would have been 1.89%.
eTotal return does not include fees, charges or expenses imposed by the variable annuity and life insurance contracts for which Franklin Templeton Variable Insurance Products Trust serves as an underlying investment vehicle.
fIncludes dividend and/or interest expense on securities sold short and security borrowing fees, if any. See below for the ratios of such expenses to average net assets for the periods presented. See Note 1(e).
gBenefit of expense reduction rounds to less than 0.01%.
hBenefit of waiver and payments by affiliates rounds to less than 0.01%.
iRounds to less than 0.01%.
jExcludes the value of portfolio securities delivered as a result of redemption in-kind.
| | | | | | |
| | MS-8 | | | Annual Report | The accompanying notes are an integral part of these financial statements. | | |
FRANKLIN TEMPLETON VARIABLE INSURANCE PRODUCTS TRUST
FINANCIAL HIGHLIGHTS
Franklin Mutual Shares VIP Fund (continued)
| | | | | | | | | | | | | | | | | | | | |
| | | Year Ended December 31, | |
| | | 2015 | | | 2014 | | | 2013 | | | 2012 | | | 2011 | |
| Class 4 | | | | | | | | | | | | | | | | | | | | |
Per share operating performance
(for a share outstanding throughout the year) | | | | | | | | | | | | | | | | | | | | |
| | | | | |
Net asset value, beginning of year | | | $22.72 | | | | $21.74 | | | | $17.31 | | | | $15.45 | | | | $16.03 | |
| | | | |
| | | | | |
| Income from investment operationsa: | | | | | | | | | | | | | | | | | | | | |
| | | | | |
Net investment incomeb | | | 0.36 | | | | 0.57 | c | | | 0.34 | | | | 0.28 | | | | 0.30 | d |
| | | | | |
Net realized and unrealized gains (losses) | | | (1.52 | ) | | | 0.96 | | | | 4.49 | | | | 1.91 | | | | (0.51 | ) |
| | | | |
Total from investment operations | | | (1.16 | ) | | | 1.53 | | | | 4.83 | | | | 2.19 | | | | (0.21 | ) |
| | | | |
| | | | | |
| Less distributions from: | | | | | | | | | | | | | | | | | | | | |
| | | | | |
Net investment income | | | (0.68 | ) | | | (0.43 | ) | | | (0.40 | ) | | | (0.33 | ) | | | (0.37 | ) |
| | | | | |
Net realized gains | | | (1.56 | ) | | | (0.12 | ) | | | — | | | | — | | | | — | |
| | | | |
Total distributions | | | (2.24 | ) | | | (0.55 | ) | | | (0.40 | ) | | | (0.33 | ) | | | (0.37 | ) |
| | | | |
Net asset value, end of year | | | $19.32 | | | | $22.72 | | | | $21.74 | | | | $17.31 | | | | $15.45 | |
| | | | |
| | | | | |
Total returne | | | (5.05)% | | | | 7.04% | | | | 28.05% | | | | 14.20% | | | | (1.12)% | |
| | | | | |
| Ratios to average net assets | | | | | | | | | | | | | | | | | | | | |
| | | | | |
Expensesf | | | 1.08% | g,h | | | 1.08% | g | | | 1.06% | g | | | 1.06% | | | | 1.08% | g |
| | | | | |
Expenses incurred in connection with securities sold short | | | 0.02% | | | | 0.03% | | | | —% | i | | | —% | i | | | —% | i |
| | | | | |
Net investment income | | | 1.65% | | | | 2.48% | c | | | 1.73% | | | | 1.71% | | | | 1.93% | d |
| | | | | |
| Supplemental data | | | | | | | | | | | | | | | | | | | | |
| | | | | |
Net assets, end of year (000’s) | | | $130,978 | | | | $158,020 | | | | $188,153 | | | | $165,015 | | | | $162,049 | |
| | | | | |
Portfolio turnover rate | | | 19.88% | | | | 21.33% | | | | 24.05% | | | | 34.07% | j | | | 41.02% | |
aThe amount shown for a share outstanding throughout the period may not correlate with the Statement of Operations for the period due to the timing of sales and repurchases of the Fund’s shares in relation to income earned and/or fluctuating fair value of the investments of the Fund.
bBased on average daily shares outstanding.
cNet investment income per share includes approximately $0.23 per share related to income received in the form of special dividends in connection with certain Fund holdings. Excluding this amount, the ratio of net investment income to average net assets would have been 1.44%.
dNet investment income per share includes approximately $0.02 per share related to interest income received that had previously been deemed uncollectible. Excluding this amount, the ratio of net investment income to average net assets would have been 1.79%.
eTotal return does not include fees, charges or expenses imposed by the variable annuity and life insurance contracts for which Franklin Templeton Variable Insurance Products Trust serves as an underlying investment vehicle.
fIncludes dividend and/or interest expense on securities sold short and security borrowing fees, if any. See below for the ratios of such expenses to average net assets for the periods presented. See Note 1(e).
gBenefit of expense reduction rounds to less than 0.01%.
hBenefit of waiver and payments by affiliates rounds to less than 0.01%.
iRounds to less than 0.01%.
jExcludes the value of portfolio securities delivered as a result of redemption in-kind.
| | | | | | |
| | | The accompanying notes are an integral part of these financial statements. | Annual Report | | | MS-9 | |
FRANKLIN TEMPLETON VARIABLE INSURANCE PRODUCTS TRUST
Statement of Investments, December 31, 2015
| | | | | | | | | | | | | | |
| Franklin Mutual Shares VIP Fund | |
| | | | | Country | | | Shares | | | Value | |
| | Common Stocks and Other Equity Interests 86.9% | | | | | | | | | | | | |
| | Aerospace & Defense 1.5% | | | | | | | | | | | | |
| | B/E Aerospace Inc. | | | United States | | | | 403,812 | | | $ | 17,109,514 | |
| | Huntington Ingalls Industries Inc. | | | United States | | | | 305,068 | | | | 38,697,876 | |
| a | | KLX Inc. | | | United States | | | | 224,586 | | | | 6,915,003 | |
| | | | | | | | | | | | | | |
| | | | | | | | | | | | | 62,722,393 | |
| | | | | | | | | | | | | | |
| | Auto Components 0.2% | | | | | | | | | | | | |
| a,b | | International Automotive Components Group Brazil LLC | | | Brazil | | | | 1,730,515 | | | | 17,795 | |
| a,b,c | | International Automotive Components Group North America LLC | | | United States | | | | 15,382,424 | | | | 8,304,432 | |
| | | | | | | | | | | | | | |
| | | | | | | | | | | | | 8,322,227 | |
| | | | | | | | | | | | | | |
| | Automobiles 1.4% | | | | | | | | | | | | |
| | General Motors Co. | | | United States | | | | 1,701,730 | | | | 57,875,837 | |
| | | | | | | | | | | | | | |
| | Banks 10.5% | | | | | | | | | | | | |
| | Barclays PLC | | | United Kingdom | | | | 10,534,300 | | | | 33,988,670 | |
| | CIT Group Inc. | | | United States | | | | 965,673 | | | | 38,337,218 | |
| | Citigroup Inc. | | | United States | | | | 922,969 | | | | 47,763,646 | |
| | Citizens Financial Group Inc. | | | United States | | | | 1,944,366 | | | | 50,922,945 | |
| | Columbia Banking System Inc. | | | United States | | | | 88,768 | | | | 2,885,848 | |
| a | | FCB Financial Holdings Inc., A | | | United States | | | | 493,723 | | | | 17,670,346 | |
| | Guaranty Bancorp | | | United States | | | | 209,583 | | | | 3,466,503 | |
| | JPMorgan Chase & Co. | | | United States | | | | 1,008,560 | | | | 66,595,217 | |
| | PNC Financial Services Group Inc. | | | United States | | | | 961,009 | | | | 91,593,768 | |
| | State Bank Financial Corp. | | | United States | | | | 352,200 | | | | 7,406,766 | |
| | SunTrust Banks Inc. | | | United States | | | | 820,282 | | | | 35,140,881 | |
| | Wells Fargo & Co. | | | United States | | | | 690,950 | | | | 37,560,042 | |
| | | | | | | | | | | | | | |
| | | | | | | | | | | | | 433,331,850 | |
| | | | | | | | | | | | | | |
| | Beverages 1.9% | | | | | | | | | | | | |
| | Molson Coors Brewing Co., B | | | United States | | | | 258,830 | | | | 24,309,313 | |
| | PepsiCo Inc. | | | United States | | | | 541,442 | | | | 54,100,885 | |
| | | | | | | | | | | | | | |
| | | | | | | | | | | | | 78,410,198 | |
| | | | | | | | | | | | | | |
| | Chemicals 0.1% | | | | | | | | | | | | |
| a,d,e | | Dow Corning Corp., Contingent Distribution | | | United States | | | | 100,000 | | | | — | |
| | FMC Corp. | | | United States | | | | 71,154 | | | | 2,784,256 | |
| | | | | | | | | | | | | | |
| | | | | | | | | | | | | 2,784,256 | |
| | | | | | | | | | | | | | |
| | Communications Equipment 2.7% | | | | | | | | | | | | |
| | Cisco Systems Inc. | | | United States | | | | 2,307,850 | | | | 62,669,667 | |
| | Nokia Corp., ADR | | | Finland | | | | 3,299,845 | | | | 23,164,912 | |
| | Nokia OYJ, A | | | Finland | | | | 3,691,548 | | | | 26,445,580 | |
| | | | | | | | | | | | | | |
| | | | | | | | | | | | | 112,280,159 | |
| | | | | | | | | | | | | | |
| | Construction Materials 0.7% | | | | | | | | | | | | |
| a | | LafargeHolcim Ltd., B | | | Switzerland | | | | 547,060 | | | | 27,462,194 | |
| | | | | | | | | | | | | | |
| | Consumer Finance 0.4% | | | | | | | | | | | | |
| a | | Ally Financial Inc. | | | United States | | | | 943,970 | | | | 17,595,601 | |
| | | | | | | | | | | | | | |
| | Containers & Packaging 0.8% | | | | | | | | | | | | |
| | WestRock Co. | | | United States | | | | 742,632 | | | | 33,878,872 | |
| | | | | | | | | | | | | | |
| | Diversified Consumer Services 0.1% | | | | | | | | | | | | |
| a | | Cengage Learning Holdings II LP | | | United States | | | | 289,744 | | | | 6,664,112 | |
| | | | | | | | | | | | | | |
FRANKLIN TEMPLETON VARIABLE INSURANCE PRODUCTS TRUST
STATEMENT OF INVESTMENTS
Franklin Mutual Shares VIP Fund (continued)
| | | | | | | | | | | | | | |
| | | | | Country | | | Shares | | | Value | |
| | Common Stocks and Other Equity Interests (continued) | | | | | |
| | Diversified Telecommunication Services 0.8% | | | | | | | | | | | | |
| a,d,e | | Global Crossing Holdings Ltd., Contingent Distribution | | | United States | | | | 9,005,048 | | | $ | — | |
| | Koninklijke KPN NV | | | Netherlands | | | | 8,378,890 | | | | 31,782,679 | |
| | | | | | | | | | | | | | |
| | | | | | | | | | | | | 31,782,679 | |
| | | | | | | | | | | | | | |
| | Energy Equipment & Services 1.2% | | | | | | | | | | | | |
| | Baker Hughes Inc. | | | United States | | | | 1,088,065 | | | | 50,214,200 | |
| | | | | | | | | | | | | | |
| | Food & Staples Retailing 3.5% | | | | | | | | | | | | |
| | CVS Health Corp. | | | United States | | | | 425,453 | | | | 41,596,540 | |
| | The Kroger Co. | | | United States | | | | 1,181,030 | | | | 49,402,485 | |
| | Walgreens Boots Alliance Inc. | | | United States | | | | 631,008 | | | | 53,733,486 | |
| | | | | | | | | | | | | | |
| | | | | | | | | | | | | 144,732,511 | |
| | | | | | | | | | | | | | |
| | Health Care Equipment & Supplies 4.5% | | | | | | | | | | | | |
| | Medtronic PLC | | | United States | | | | 1,704,252 | | | | 131,091,064 | |
| | Stryker Corp. | | | United States | | | | 575,661 | | | | 53,501,933 | |
| | | | | | | | | | | | | | |
| | | | | | | | | | | | | 184,592,997 | |
| | | | | | | | | | | | | | |
| | Health Care Providers & Services 0.5% | | | | | | | | | | | | |
| | Cigna Corp. | | | United States | | | | 142,154 | | | | 20,801,395 | |
| | | | | | | | | | | | | | |
| | Household Products 0.2% | | | | | | | | | | | | |
| | Energizer Holdings Inc. | | | United States | | | | 196,162 | | | | 6,681,278 | |
| | | | | | | | | | | | | | |
| | Independent Power & Renewable Electricity Producers 0.4% | | | | | | | | | | | | |
| | NRG Energy Inc. | | | United States | | | | 1,304,154 | | | | 15,349,893 | |
| | | | | | | | | | | | | | |
| | Insurance 10.9% | | | | | | | | | | | | |
| | ACE Ltd. | | | United States | | | | 595,675 | | | | 69,604,624 | |
| a | | Alleghany Corp. | | | United States | | | | 107,318 | | | | 51,290,492 | |
| | The Allstate Corp. | | | United States | | | | 714,230 | | | | 44,346,541 | |
| | American International Group Inc. | | | United States | | | | 1,402,726 | | | | 86,926,930 | |
| | MetLife Inc. | | | United States | | | | 975,283 | | | | 47,018,393 | |
| | White Mountains Insurance Group Ltd. | | | United States | | | | 114,635 | | | | 83,317,864 | |
| | XL Group PLC | | | Ireland | | | | 1,699,790 | | | | 66,597,772 | |
| | | | | | | | | | | | | | |
| | | | | | | | | | | | | 449,102,616 | |
| | | | | | | | | | | | | | |
| | IT Services 1.1% | | | | | | | | | | | | |
| | Xerox Corp. | | | United States | | | | 4,418,674 | | | | 46,970,505 | |
| | | | | | | | | | | | | | |
| | Machinery 1.8% | | | | | | | | | | | | |
| | Caterpillar Inc. | | | United States | | | | 620,576 | | | | 42,174,345 | |
| | CNH Industrial NV (EUR Traded) | | | United Kingdom | | | | 888,427 | | | | 6,118,441 | |
| | CNH Industrial NV, special voting (EUR Traded) | | | United Kingdom | | | | 1,844,814 | | | | 12,704,911 | |
| | Federal Signal Corp. | | | United States | | | | 757,221 | | | | 12,001,953 | |
| | | | | | | | | | | | | | |
| | | | | | | | | | | | | 72,999,650 | |
| | | | | | | | | | | | | | |
| | Marine 0.9% | | | | | | | | | | | | |
| | A.P. Moeller-Maersk AS, B | | | Denmark | | | | 27,780 | | | | 36,299,319 | |
| | | | | | | | | | | | | | |
| | Media 6.6% | | | | | | | | | | | | |
| | Cablevision Systems Corp., A | | | United States | | | | 365,841 | | | | 11,670,328 | |
| | CBS Corp., B | | | United States | | | | 930,167 | | | | 43,838,771 | |
| | Relx PLC | | | United Kingdom | | | | 2,730,750 | | | | 48,179,115 | |
| | Time Warner Cable Inc. | | | United States | | | | 494,846 | | | | 91,838,469 | |
| | Time Warner Inc. | | | United States | | | | 396,698 | | | | 25,654,459 | |
| | Twenty-First Century Fox Inc., B | | | United States | | | | 1,897,616 | | | | 51,672,084 | |
| | | | | | | | | | | | | | |
| | | | | | | | | | | | | 272,853,226 | |
| | | | | | | | | | | | | | |
FRANKLIN TEMPLETON VARIABLE INSURANCE PRODUCTS TRUST
STATEMENT OF INVESTMENTS
Franklin Mutual Shares VIP Fund (continued)
| | | | | | | | | | | | | | |
| | | | | Country | | | Shares | | | Value | |
| | Common Stocks and Other Equity Interests (continued) | | | | | |
| | Metals & Mining 0.8% | | | | | | | | | | | | |
| | Freeport-McMoRan Inc., B | | | United States | | | | 1,660,406 | | | $ | 11,240,949 | |
| | ThyssenKrupp AG | | | Germany | | | | 1,147,037 | | | | 22,851,070 | |
| | | | | | | | | | | | | | |
| | | | | | | | | | | | | 34,092,019 | |
| | | | | | | | | | | | | | |
| | Multiline Retail 0.6% | | | | | | | | | | | | |
| | Macy’s Inc. | | | United States | | | | 677,570 | | | | 23,701,399 | |
| | | | | | | | | | | | | | |
| | Oil, Gas & Consumable Fuels 5.5% | | | | | | | | | | | | |
| | Anadarko Petroleum Corp. | | | United States | | | | 175,487 | | | | 8,525,158 | |
| | Apache Corp. | | | United States | | | | 399,520 | | | | 17,766,654 | |
| | BG Group PLC | | | United Kingdom | | | | 2,353,190 | | | | 34,164,570 | |
| | BP PLC | | | United Kingdom | | | | 4,322,322 | | | | 22,552,937 | |
| | CONSOL Energy Inc. | | | United States | | | | 1,389,095 | | | | 10,973,851 | |
| | Kinder Morgan Inc. | | | United States | | | | 2,594,640 | | | | 38,712,029 | |
| | Marathon Oil Corp. | | | United States | | | | 2,580,688 | | | | 32,490,862 | |
| | Murphy Oil Corp. | | | United States | | | | 502,750 | | | | 11,286,737 | |
| | Royal Dutch Shell PLC, A | | | United Kingdom | | | | 1,774,046 | | | | 40,651,277 | |
| a | | Whiting Petroleum Corp. | | | United States | | | | 928,787 | | | | 8,767,749 | |
| | | | | | | | | | | | | | |
| | | | | | | | | | | | | 225,891,824 | |
| | | | | | | | | | | | | | |
| | Paper & Forest Products 1.0% | | | | | | | | | | | | |
| | International Paper Co. | | | United States | | | | 1,150,455 | | | | 43,372,153 | |
| | | | | | | | | | | | | | |
| | Personal Products 0.4% | | | | | | | | | | | | |
| | Edgewell Personal Care Co. | | | United States | | | | 196,162 | | | | 15,373,216 | |
| | | | | | | | | | | | | | |
| | Pharmaceuticals 8.3% | | | | | | | | | | | | |
| | Eli Lilly & Co. | | | United States | | | | 1,171,445 | | | | 98,705,956 | |
| | Merck & Co. Inc. | | | United States | | | | 2,178,438 | | | | 115,065,095 | |
| | Novartis AG, ADR | | | Switzerland | | | | 690,494 | | | | 59,410,104 | |
| | Teva Pharmaceutical Industries Ltd., ADR | | | Israel | | | | 1,053,362 | | | | 69,142,681 | |
| | | | | | | | | | | | | | |
| | | | | | | | | | | | | 342,323,836 | |
| | | | | | | | | | | | | | |
| | Real Estate Investment Trusts (REITs) 0.4% | | | | | | | | | | | | |
| | Alexander’s Inc. | | | United States | | | | 40,126 | | | | 15,412,798 | |
| | | | | | | | | | | | | | |
| | Real Estate Management & Development 0.0%† | | | | | | | | | | | | |
| a | | Forestar Group Inc. | | | United States | | | | 161,671 | | | | 1,768,681 | |
| | | | | | | | | | | | | | |
| | Software 6.1% | | | | | | | | | | | | |
| | CA Inc. | | | United States | | | | 1,570,889 | | | | 44,864,590 | |
| | Microsoft Corp. | | | United States | | | | 2,676,797 | | | | 148,508,697 | |
| | Symantec Corp. | | | United States | | | | 2,832,445 | | | | 59,481,344 | |
| | | | | | | | | | | | | | |
| | | | | | | | | | | | | 252,854,631 | |
| | | | | | | | | | | | | | |
| | Specialty Retail 0.5% | | | | | | | | | | | | |
| a | | Office Depot Inc. | | | United States | | | | 3,432,180 | | | | 19,357,495 | |
| | | | | | | | | | | | | | |
| | Technology Hardware, Storage & Peripherals 3.1% | | | | | | | | | | | | |
| | EMC Corp. | | | United States | | | | 1,787,190 | | | | 45,895,039 | |
| | Hewlett Packard Enterprise Co. | | | United States | | | | 1,418,347 | | | | 21,558,874 | |
| | HP Inc. | | | United States | | | | 1,418,347 | | | | 16,793,229 | |
| | Samsung Electronics Co. Ltd. | | | South Korea | | | | 41,741 | | | | 44,748,756 | |
| | | | | | | | | | | | | | |
| | | | | | | | | | | | | 128,995,898 | |
| | | | | | | | | | | | | | |
| | Tobacco 6.2% | | | | | | | | | | | | |
| | Altria Group Inc. | | | United States | | | | 909,441 | | | | 52,938,561 | |
FRANKLIN TEMPLETON VARIABLE INSURANCE PRODUCTS TRUST
STATEMENT OF INVESTMENTS
Franklin Mutual Shares VIP Fund (continued)
| | | | | | | | | | | | | | |
| | | | | Country | | | Shares | | | Value | |
| | Common Stocks and Other Equity Interests (continued) | | | | | |
| | Tobacco (continued) | | | | | | | | | | | | |
| | British American Tobacco PLC | | | United Kingdom | | | | 1,366,817 | | | $ | 75,971,313 | |
| | Imperial Tobacco Group PLC | | | United Kingdom | | | | 1,052,977 | | | | 55,663,749 | |
| | Philip Morris International Inc. | | | United States | | | | 282,010 | | | | 24,791,499 | |
| | Reynolds American Inc. | | | United States | | | | 1,001,534 | | | | 46,220,794 | |
| | | | | | | | | | | | | | |
| | | | | | | | | | | | | 255,585,916 | |
| | | | | | | | | | | | | | |
| | Wireless Telecommunication Services 1.3% | | | | | | | | | | | | |
| | Vodafone Group PLC | | | United Kingdom | | | | 16,557,404 | | | | 53,934,573 | |
| | | | | | | | | | | | | | |
| | | | |
| | Total Common Stocks and Other Equity Interests
(Cost $2,878,652,003) | | | | | | | | | | | 3,586,372,407 | |
| | | | | | | | | | | | | | |
| | | | |
| | | | | | | | Principal Amount* | | | | |
| | Corporate Notes and Senior Floating Rate Interests 3.4% | | | | | | | | | | | | |
| | Avaya Inc., | | | | | | | | | | | | |
| | f senior note, 144A, 10.50%, 3/01/21 | | | United States | | | | 22,449,000 | | | | 7,744,905 | |
| | f senior secured note, 144A, 7.00%, 4/01/19 | | | United States | | | | 12,923,000 | | | | 9,692,250 | |
| | g,h Term B-3 Loan, 4.823%, 10/26/17 | | | United States | | | | 12,791,927 | | | | 9,988,359 | |
| | g,h Term B-6 Loan, 6.50%, 3/30/18 | | | United States | | | | 6,741,721 | | | | 5,137,751 | |
| | g,h Term B-7 Loan, 6.25%, 5/29/20 | | | United States | | | | 5,600,530 | | | | 3,939,037 | |
| g,h | | Belk Inc., Closing Date Term Loan, 5.75%, 12/10/22 | | | United States | | | | 8,702,000 | | | | 7,781,041 | |
| g,h | | Cengage Learning Acquisitions Inc., Original Term Loans, 7.00%, 3/31/20 | | | United States | | | | 1,769,087 | | | | 1,720,437 | |
| | iHeartCommunications Inc., | | | | | | | | | | | | |
| | senior secured note, first lien, 9.00%, 12/15/19 | | | United States | | | | 26,449,000 | | | | 19,671,444 | |
| | g,h Tranche D Term Loan, 7.174%, 1/30/19 | | | United States | | | | 34,746,619 | | | | 24,496,367 | |
| | g,h Tranche E Term Loan, 7.924%, 7/30/19 | | | United States | | | | 11,168,253 | | | | 7,882,922 | |
| g,h | | JC Penney Corp. Inc., Term Loan, 6.00%, 5/22/18 | | | United States | | | | 11,253,151 | | | | 11,073,809 | |
| | NGPL PipeCo LLC, | | | | | | | | | | | | |
| | f senior secured note, 144A, 9.625%, 6/01/19 | | | United States | | | | 14,481,000 | | | | 13,612,140 | |
| | g,h Term Loan, 6.75%, 9/15/17 | | | United States | | | | 726,123 | | | | 688,001 | |
| g,h | | Toys R Us-Delaware Inc., | | | | | | | | | | | | |
| | FILO Loans, 8.25%, 10/24/19 | | | United States | | | | 2,560,000 | | | | 2,526,413 | |
| | Term B-4 Loan, 9.75%, 4/24/20 | | | United States | | | | 21,458,591 | | | | 15,772,064 | |
| | | | | | | | | | | | | | |
| | | | |
| | Total Corporate Notes and Senior Floating Rate Interests (Cost $181,031,638) | | | | | | | | | | | 141,726,940 | |
| | | | | | | | | | | | | | |
| | Corporate Bonds, Notes and Senior Floating Rate Interests in Reorganization 1.7% | | | | | | | | | | | | |
| b,i | | Broadband Ventures III LLC, secured promissory note, 5.00%, 2/01/12 | | | United States | | | | 1,754 | | | | — | |
| g,h,i | | Caesars Entertainment Operating Co. Inc., | | | | | | | | | | | | |
| | Term B-5-B Loans, 1.50%, 3/01/17 | | | United States | | | | 3,251,752 | | | | 2,829,024 | |
| | Term B-6-B Loans, 1.50%, 3/01/17 | | | United States | | | | 15,503,483 | | | | 13,643,065 | |
| | Term B-7 Loans, 1.50%, 3/01/17 | | | United States | | | | 9,850,500 | | | | 8,237,481 | |
| i | | Samson Investment Co., senior note, 9.75%, 2/15/20 | | | United States | | | | 16,690,000 | | | | 37,552 | |
| g,h,i | | Texas Competitive Electric Holdings Co. LLC, Term Loans, 4.908%, 10/10/17 | | | United States | | | | 90,618,405 | | | | 27,836,887 | |
FRANKLIN TEMPLETON VARIABLE INSURANCE PRODUCTS TRUST
STATEMENT OF INVESTMENTS
Franklin Mutual Shares VIP Fund (continued)
| | | | | | | | | | | | | | |
| | | | | Country | | | Principal Amount* | | | Value | |
| | Corporate Bonds, Notes and Senior Floating Rate
Interests in Reorganization (continued) | | | | | | | | | | | | |
| f,i | | Texas Competitive Electric Holdings Co. LLC/Texas Competitive Electric Holdings Finance Inc., senior secured note, first lien, 144A, 4.726%, 10/01/20 | | | United States | | | | 39,308,000 | | | $ | 13,168,180 | |
| i | | Walter Energy Inc., | | | | | | | | | | | | |
| | g,h B Term Loan, 5.80%, 4/02/18 | | | United States | | | | 11,218,193 | | | | 3,141,094 | |
| | f first lien, 144A, 6.33%, 10/15/19 | | | United States | | | | 6,301,000 | | | | 1,638,260 | |
| | f,j second lien, 144A, PIK, 11.50%, 4/01/20 | | | United States | | | | 5,419,860 | | | | 13,883 | |
| | | | | | | | | | | | | | |
| | | | |
| | Total Corporate Bonds, Notes and Senior Floating Rate Interests in Reorganization (Cost $167,525,096) | | | | | | | | | | | 70,545,426 | |
| | | | | | | | | | | | | | |
| | | | |
| | | | | | | | Shares | | | | |
| | Companies in Liquidation 0.2% | | | | | | | | | | | | |
| a | | Adelphia Recovery Trust | | | United States | | | | 29,283,354 | | | | 117,133 | |
| a,d | | Adelphia Recovery Trust, Arahova Contingent Value Vehicle, Contingent Distribution | | | United States | | | | 1,955,453 | | | | 3,911 | |
| a,b,c,k | | CB FIM Coinvestors LLC | | | United States | | | | 6,400,507 | | | | — | |
| a,d,e | | Century Communications Corp., Contingent Distribution | | | United States | | | | 5,487,000 | | | | — | |
| a,b | | FIM Coinvestor Holdings I, LLC | | | United States | | | | 8,006,950 | | | | — | |
| a,l | | Lehman Brothers Holdings Inc., Bankruptcy Claim | | | United States | | | | 144,058,799 | | | | 8,103,308 | |
| a,d,e | | Tribune Media Litigation Trust, Contingent Distribution | | | United States | | | | 394,052 | | | | — | |
| a,d,e | | Tropicana Litigation Trust, Contingent Distribution | | | United States | | | | 18,305,000 | | | | — | |
| | | | | | | | | | | | | | |
| | | | |
| | Total Companies in Liquidation
(Cost $15,869,065) | | | | | | | | | | | 8,224,352 | |
| | | | | | | | | | | | | | |
| | | | |
| | | | | | | | Principal Amount* | | | | |
| | Municipal Bonds (Cost $17,914,752) 0.4% | | | | | | | | | | | | |
| | Puerto Rico Commonwealth GO, Refunding, Series A, 8.00%, 7/01/35 | | | United States | | | | 20,409,000 | | | | 14,847,547 | |
| | | | | | | | | | | | | | |
| | | | |
| | Total Investments before Short Term Investments
(Cost $3,260,992,554) | | | | | | | | | | | 3,821,716,672 | |
| | | | | | | | | | | | | | |
| | Short Term Investments 6.9% | | | | | | | | | | | | |
| | U.S. Government and Agency Securities 6.9% | | | | | | | | | | | | |
| m | | FHLB, 1/04/16 - 1/05/16 | | | United States | | | | 13,800,000 | | | | 13,799,960 | |
| m,n | | U.S. Treasury Bill, 1/07/16 - 6/09/16 | | | United States | | | | 274,000,000 | | | | 273,771,765 | |
| | | | | | | | | | | | | | |
| | | | |
| | Total U.S. Government and Agency Securities
(Cost $287,566,832) | | | | | | | | | | | 287,571,725 | |
| | | | | | | | | | | | | | |
| | Total Investments (Cost $3,548,559,386) 99.5% | | | | | | | | | | | 4,109,288,397 | |
| | Securities Sold Short (0.2)% | | | | | | | | | | | (9,084,697 | ) |
| | Other Assets, less Liabilities 0.7% | | | | | | | | | | | 27,717,590 | |
| | | | | | | | | | | | | | |
| | Net Assets 100.0% | | | | | | | | | | $ | 4,127,921,290 | |
| | | | | | | | | | | | | | |
FRANKLIN TEMPLETON VARIABLE INSURANCE PRODUCTS TRUST
STATEMENT OF INVESTMENTS
Franklin Mutual Shares VIP Fund (continued)
| | | | | | | | | | | | | | |
| | | | | Country | | | Shares | | | Value | |
| o | | Securities Sold Short (Proceeds $11,160,099) (0.2)% | | | | | | | | | | | | |
| | Common Stocks (0.2)% | | | | | | | | | | | | |
| | Energy Equipment & Services (0.2)% | | | | | | | | | | | | |
| | Halliburton Co. | | | United States | | | | 266,883 | | | $ | (9,084,697 | ) |
| | | | | | | | | | | | | | |
†Rounds to less than 0.1% of net assets.
*The principal amount is stated in U.S. dollars unless otherwise indicated.
aNon-income producing.
bSee Note 8 regarding restricted securities.
cAt December 31, 2015, pursuant to the Fund’s policies and the requirements of applicable securities law, the Fund is restricted from trading these securities at year end.
dContingent distributions represent the right to receive additional distributions, if any, during the reorganization of the underlying company. Shares represent total underlying principal of debt securities.
eSecurity has been deemed illiquid because it may not be able to be sold within seven days. At December 31, 2015, the aggregate value of these securities was $-.
fSecurity was purchased pursuant to Rule 144A under the Securities Act of 1933 and may be sold in transactions exempt from registration only to qualified institutional buyers or in a public offering registered under the Securities Act of 1933. These securities have been deemed liquid under guidelines approved by the Trust’s Board of Trustees. At December 31, 2015, the aggregate value of these securities was $45,869,618, representing 1.11% of net assets.
gSee Note 1(g) regarding senior floating rate interests.
hThe coupon rate shown represents the rate at period end.
iSee Note 7 regarding credit risk and defaulted securities.
jIncome may be received in additional securities and/or cash.
kSee Note 10 regarding holdings of 5% voting securities.
lBankruptcy claims represent the right to receive distributions, if any, during the liquidation of the underlying pool of assets. Shares represent amount of allowed unsecured claims.
mThe security is traded on a discount basis with no stated coupon rate.
nA portion or all of the security has been segregated as collateral for securities sold short and open forward contracts. At December 31, 2015, the value of these securities and/or cash pledged amounted to $19,591,661, representing 0.47% of net assets.
oSee Note 1(e) regarding securities sold short.
FRANKLIN TEMPLETON VARIABLE INSURANCE PRODUCTS TRUST
STATEMENT OF INVESTMENTS
Franklin Mutual Shares VIP Fund (continued)
At December 31, 2015, the Fund had the following futures contracts outstanding. See Note 1(c).
| | | | | | | | | | | | | | | | | | | | | | | | |
| Futures Contracts | | | | | | | | | | | | | | | | | | |
| Description | | Type | | | Number of
Contracts | | | Notional
Value | | | Expiration
Date | | | Unrealized
Appreciation | | | Unrealized
Depreciation | |
| Currency Contracts | | | | | | | | | | | | | | | | | | | | | | | | |
EUR/USD | | | Short | | | | 598 | | | $ | 81,372,850 | | | | 3/14/16 | | | $ | 40,772 | | | $ | — | |
GBP/USD | | | Short | | | | 1,349 | | | | 124,226,038 | | | | 3/14/16 | | | | 3,221,467 | | | | — | |
| | | | | | | | | | | | | | | | | | | | |
Total Futures Contracts | | | $ | 3,262,239 | | | $ | — | |
| | | | | | | | | | | | | | | | | | | | |
Net unrealized appreciation (depreciation) | | | $ | 3,262,239 | | | | | |
| | | | | | | | | | | | | | | | | | | | | | | | |
At December 31, 2015, the Fund had the following forward exchange contracts outstanding. See Note 1(c).
| | | | | | | | | | | | | | | | | | | | | | | | | | | | |
| Forward Exchange Contracts | | | | | | | | | | |
| Currency | | Counterpartya | | | Type | | | Quantity | | | Contract
Amount | | | Settlement
Date | | | Unrealized
Appreciation | | | Unrealized
Depreciation | |
| OTC Forward Exchange Contracts | | | | | | | | | | | | | | | | | | | | | | | | | | | | |
South Korean Won | | | BOFA | | | | Sell | | | | 9,129,232,206 | | | $ | 8,065,619 | | | | 1/12/16 | | | $ | 300,884 | | | $ | — | |
South Korean Won | | | FBCO | | | | Buy | | | | 1,454,532,887 | | | | 1,258,246 | | | | 1/12/16 | | | | — | | | | (21,115 | ) |
South Korean Won | | | FBCO | | | | Sell | | | | 11,190,589,765 | | | | 9,813,294 | | | | 1/12/16 | | | | 295,301 | | | | — | |
South Korean Won | | | HSBC | | | | Buy | | | | 3,255,798,000 | | | | 2,775,842 | | | | 1/12/16 | | | | 3,490 | | | | (10,160 | ) |
South Korean Won | | | HSBC | | | | Sell | | | | 36,984,168,916 | | | | 32,677,301 | | | | 1/12/16 | | | | 1,220,955 | | | | — | |
Euro | | | BOFA | | | | Buy | | | | 1,536,430 | | | | 1,683,540 | | | | 1/20/16 | | | | — | | | | (13,749 | ) |
Euro | | | BOFA | | | | Sell | | | | 77,577,573 | | | | 83,141,147 | | | | 1/20/16 | | | | — | | | | (1,170,095 | ) |
Euro | | | BONY | | | | Buy | | | | 437,021 | | | | 482,306 | | | | 1/20/16 | | | | — | | | | (7,352 | ) |
Euro | | | DBAB | | | | Buy | | | | 2,120,585 | | | | 2,326,687 | | | | 1/20/16 | | | | — | | | | (22,037 | ) |
Euro | | | DBAB | | | | Sell | | | | 967,508 | | | | 1,034,151 | | | | 1/20/16 | | | | 569 | | | | (17,904 | ) |
Euro | | | FBCO | | | | Buy | | | | 1,536,428 | | | | 1,683,824 | | | | 1/20/16 | | | | — | | | | (14,035 | ) |
Euro | | | FBCO | | | | Sell | | | | 904,738 | | | | 967,131 | | | | 1/20/16 | | | | 876 | | | | (17,013 | ) |
Euro | | | HSBC | | | | Buy | | | | 1,511,767 | | | | 1,654,769 | | | | 1/20/16 | | | | — | | | | (11,782 | ) |
Euro | | | HSBC | | | | Sell | | | | 1,126,076 | | | | 1,216,763 | | | | 1/20/16 | | | | 4,630 | | | | (11,685 | ) |
Euro | | | SSBT | | | | Buy | | | | 4,241,879 | | | | 4,649,894 | | | | 1/20/16 | | | | 80 | | | | (39,902 | ) |
Euro | | | SSBT | | | | Sell | | | | 561,492 | | | | 598,562 | | | | 1/20/16 | | | | 600 | | | | (12,267 | ) |
British Pound | | | BOFA | | | | Buy | | | | 687,308 | | | | 1,046,404 | | | | 1/21/16 | | | | — | | | | (33,288 | ) |
British Pound | | | BOFA | | | | Sell | | | | 15,403,441 | | | | 23,820,401 | | | | 1/21/16 | | | | 1,115,207 | | | | — | |
British Pound | | | BZWS | | | | Buy | | | | 1,279,742 | | | | 2,005,608 | | | | 1/21/16 | | | | — | | | | (119,225 | ) |
British Pound | | | FBCO | | | | Buy | | | | 7,305,458 | | | | 11,424,718 | | | | 1/21/16 | | | | — | | | | (656,225 | ) |
British Pound | | | HSBC | | | | Buy | | | | 3,131,068 | | | | 4,933,934 | | | | 1/21/16 | | | | — | | | | (318,635 | ) |
British Pound | | | SSBT | | | | Buy | | | | 16,498,726 | | | | 25,539,890 | | | | 1/21/16 | | | | — | | | | (1,220,209 | ) |
British Pound | | | SSBT | | | | Sell | | | | 98,428,040 | | | | 151,008,180 | | | | 1/21/16 | | | | 5,921,914 | | | | — | |
| | | | | | | | | | | | | | | | | | | | | | | | |
Total Forward Exchange Contracts | | | $ | 8,864,506 | | | $ | (3,716,678 | ) |
| | | | | | | | | | | | | | | | | | | | | | | | |
Net unrealized appreciation (depreciation) | | | $ | 5,147,828 | | | | | |
| | | | | | | | | | | | | | | | | | | | | | | | | | | | |
aMay be comprised of multiple contracts with the same counterparty, currency and settlement date.
See Abbreviations on page MS-31.
| | | | | | |
| | MS-16 | | | Annual Report | The accompanying notes are an integral part of these financial statements. | | |
FRANKLIN TEMPLETON VARIABLE INSURANCE PRODUCTS TRUST
Financial Statements
Statement of Assets and Liabilities
December 31, 2015
| | | | |
| | | Franklin
Mutual Shares
VIP Fund | |
Assets: | | | | |
Investments in securities: | | | | |
Cost | | $ | 3,548,559,386 | |
| | | | |
Value | | $ | 4,109,288,397 | |
Cash | | | 404,650 | |
Restricted cash (Note 1d) | | | 10,000 | |
Foreign currency, at value (cost $5,903,115) | | | 5,863,665 | |
Receivables: | | | | |
Investment securities sold | | | 2,892,619 | |
Capital shares sold | | | 247,762 | |
Dividends and interest | | | 10,254,963 | |
Due from brokers | | | 14,286,091 | |
Variation margin | | | 1,259,813 | |
Unrealized appreciation on OTC forward exchange contracts | | | 8,864,506 | |
Other assets | | | 1,212,935 | |
| | | | |
Total assets | | | 4,154,585,401 | |
| | | | |
Liabilities: | | | | |
Payables: | | | | |
Investment securities purchased | | | 7,347,215 | |
Capital shares redeemed | | | 1,868,767 | |
Management fees | | | 2,437,248 | |
Distribution fees | | | 1,505,387 | |
Securities sold short, at value (proceeds $11,160,099) | | | 9,084,697 | |
Due to brokers | | | 10,000 | |
Unrealized depreciation on OTC forward exchange contracts | | | 3,716,678 | |
Accrued expenses and other liabilities | | | 694,119 | |
| | | | |
Total liabilities | | | 26,664,111 | |
| | | | |
Net assets, at value | | $ | 4,127,921,290 | |
| | | | |
Net assets consist of: | | | | |
Paid-in capital | | $ | 3,164,548,643 | |
Undistributed net investment income | | | 76,933,954 | |
Net unrealized appreciation (depreciation) | | | 571,133,534 | |
Accumulated net realized gain (loss) | | | 315,305,159 | |
| | | | |
Net assets, at value | | $ | 4,127,921,290 | |
| | | | |
| | | | | | |
| | | The accompanying notes are an integral part of these financial statements. | Annual Report | | | MS-17 | |
FRANKLIN TEMPLETON VARIABLE INSURANCE PRODUCTS TRUST
FINANCIAL STATEMENTS
Statement of Assets and Liabilities (continued)
December 31, 2015
| | | | |
| | | Franklin
Mutual Shares
VIP Fund | |
| |
| Class 1: | | | | |
Net assets, at value | | $ | 643,437,949 | |
| | | | |
Shares outstanding | | | 33,034,336 | |
| | | | |
Net asset value and maximum offering price per share | | $ | 19.48 | |
| | | | |
| |
| Class 2: | | | | |
Net assets, at value | | $ | 3,353,505,465 | |
| | | | |
Shares outstanding | | | 174,675,605 | |
| | | | |
Net asset value and maximum offering price per share | | $ | 19.20 | |
| | | | |
| |
| Class 4: | | | | |
Net assets, at value | | $ | 130,977,876 | |
| | | | |
Shares outstanding | | | 6,779,478 | |
| | | | |
Net asset value and maximum offering price per share | | $ | 19.32 | |
| | | | |
| | | | | | |
| | MS-18 | | | Annual Report | The accompanying notes are an integral part of these financial statements. | | |
FRANKLIN TEMPLETON VARIABLE INSURANCE PRODUCTS TRUST
FINANCIAL STATEMENTS
Statement of Operations
for the year ended December 31, 2015
| | | | |
| | | Franklin Mutual
Shares VIP Fund | |
Investment income: | | | | |
Dividends | | $ | 104,980,076 | |
Interest | | | 21,985,513 | |
Income from securities loaned | | | 651,940 | |
Other income (Note 1h) | | | 1,164,888 | |
| | | | |
Total investment income | | | 128,782,417 | |
| | | | |
Expenses: | | | | |
Management fees (Note 3a) | | | 32,388,419 | |
Distribution fees: (Note 3c) | | | | |
Class 2 | | | 9,758,001 | |
Class 4 | | | 517,455 | |
Custodian fees (Note 4) | | | 116,907 | |
Reports to shareholders | | | 525,882 | |
Professional fees | | | 162,648 | |
Trustees’ fees and expenses | | | 20,970 | |
Dividends on securities sold short | | | 1,131,594 | |
Other | | | 138,090 | |
| | | | |
Total expenses | | | 44,759,966 | |
Expense reductions (Note 4) | | | (805 | ) |
Expenses waived/paid by affiliates (Note 3e) | | | (3,744 | ) |
| | | | |
Net expenses | | | 44,755,417 | |
| | | | |
Net investment income | | | 84,027,000 | |
| | | | |
Realized and unrealized gains (losses): | | | | |
Net realized gain (loss) from: | | | | |
Investments | | | 317,057,473 | |
Foreign currency transactions | | | 31,616,938 | |
Futures contracts | | | 13,095,194 | |
Securities sold short | | | (532,436 | ) |
| | | | |
Net realized gain (loss) | | | 361,237,169 | |
| | | | |
Net change in unrealized appreciation (depreciation) on: | | | | |
Investments | | | (650,056,415 | ) |
Translation of other assets and liabilities denominated in foreign currencies | | | (13,908,134 | ) |
Futures contracts | | | 758,215 | |
| | | | |
Net change in unrealized appreciation (depreciation) | | | (663,206,334 | ) |
| | | | |
Net realized and unrealized gain (loss) | | | (301,969,165 | ) |
| | | | |
Net increase (decrease) in net assets resulting from operations | | $ | (217,942,165 | ) |
| | | | |
| | | | | | |
| | | The accompanying notes are an integral part of these financial statements. | Annual Report | | | MS-19 | |
FRANKLIN TEMPLETON VARIABLE INSURANCE PRODUCTS TRUST
FINANCIAL STATEMENTS
Statements of Changes in Net Assets
| | | | | | | | |
| | | Franklin Mutual Shares VIP Fund | |
| | | Year Ended December 31, | |
| | | 2015 | | | 2014 | |
Increase (decrease) in net assets: | | | | | | | | |
Operations: | | | | | | | | |
Net investment income | | $ | 84,027,000 | | | $ | 136,029,133 | |
Net realized gain (loss) | | | 361,237,169 | | | | 280,369,418 | |
Net change in unrealized appreciation (depreciation) | | | (663,206,334 | ) | | | (60,935,280 | ) |
| | | | |
Net increase (decrease) in net assets resulting from operations | | | (217,942,165 | ) | | | 355,463,271 | |
| | | | |
Distributions to shareholders from: | | | | | | | | |
Net investment income: | | | | | | | | |
Class 1 | | | (22,253,593 | ) | | | (14,458,134 | ) |
Class 2 | | | (115,505,343 | ) | | | (87,785,708 | ) |
Class 4 | | | (4,240,573 | ) | | | (3,061,827 | ) |
Net realized gains: | | | | | | | | |
Class 1 | | | (44,812,385 | ) | | | (3,341,870 | ) |
Class 2 | | | (254,851,880 | ) | | | (22,825,048 | ) |
Class 4 | | | (9,773,474 | ) | | | (853,086 | ) |
| | | | |
Total distributions to shareholders | | | (451,437,248 | ) | | | (132,325,673 | ) |
| | | | |
Capital share transactions: (Note 2) | | | | | | | | |
Class 1 | | | 85,321,567 | | | | 79,247,758 | |
Class 2 | | | (314,542,720 | ) | | | (529,398,101 | ) |
Class 4 | | | (6,302,871 | ) | | | (39,025,210 | ) |
| | | | |
Total capital share transactions | | | (235,524,024 | ) | | | (489,175,553 | ) |
| | | | |
Net increase (decrease) in net assets | | | (904,903,437 | ) | | | (266,037,955 | ) |
Net assets: | | | | | | | | |
Beginning of year | | | 5,032,824,727 | | | | 5,298,862,682 | |
| | | | |
End of year | | $ | 4,127,921,290 | | | $ | 5,032,824,727 | |
| | | | |
Undistributed net investment income included in net assets: | | | | | | | | |
End of year | | $ | 76,933,954 | | | $ | 135,335,888 | |
| | | | |
| | | | | | |
| | MS-20 | | | Annual Report | The accompanying notes are an integral part of these financial statements. | | |
FRANKLIN TEMPLETON VARIABLE INSURANCE PRODUCTS TRUST
Notes to Financial Statements
Franklin Mutual Shares VIP Fund
1. Organization and Significant Accounting Policies
Franklin Templeton Variable Insurance Products Trust (Trust) is registered under the Investment Company Act of 1940 (1940 Act) as an open-end management investment company, consisting of nineteen separate funds and applies the specialized accounting and reporting guidance in U.S. Generally Accepted Accounting Principles (U.S. GAAP). Franklin Mutual Shares VIP Fund (Fund) is included in this report. The financial statements of the remaining funds in the Trust are presented separately. Shares of the Fund are generally sold only to insurance company separate accounts to fund the benefits of variable life insurance policies or variable annuity contracts. The Fund offers three classes of shares: Class 1, Class 2 and Class 4. Each class of shares differs by its distribution fees, voting rights on matters affecting a single class and its exchange privilege.
The following summarizes the Fund’s significant accounting policies.
a. Financial Instrument Valuation
The Fund’s investments in financial instruments are carried at fair value daily. Fair value is the price that would be received to sell an asset or paid to transfer a liability in an orderly transaction between market participants on the measurement date. The Fund calculates the net asset value (NAV) per share as of 4 p.m. Eastern time each day the New York Stock Exchange (NYSE) is open for trading. Under compliance policies and procedures approved by the Trust’s Board of Trustees (the Board), the Fund’s administrator has responsibility for oversight of valuation, including leading the cross-functional Valuation and Liquidity Oversight Committee (VLOC). The VLOC provides administration and oversight of the Fund’s valuation policies and procedures, which are approved annually by the Board. Among other things, these procedures allow the Fund to utilize independent pricing services, quotations from securities and financial instrument dealers, and other market sources to determine fair value.
Equity securities and derivative financial instruments (derivatives) listed on an exchange or on the NASDAQ National Market System are valued at the last quoted sale price or the official closing price of the day, respectively. Foreign equity securities are valued as of the close of trading on the foreign stock exchange on which the security is primarily traded or as of 4 p.m. Eastern time whichever is earlier. The value is then converted into its U.S. dollar equivalent at the foreign exchange rate
in effect at 4 p.m. Eastern time on the day that the value of the security is determined. Over-the-counter (OTC) securities are valued within the range of the most recent quoted bid and ask prices. Securities that trade in multiple markets or on multiple exchanges are valued according to the broadest and most representative market. Certain equity securities are valued based upon fundamental characteristics or relationships to similar securities.
Debt securities generally trade in the OTC market rather than on a securities exchange. The Fund’s pricing services use multiple valuation techniques to determine fair value. In instances where sufficient market activity exists, the pricing services may utilize a market-based approach through which quotes from market makers are used to determine fair value. In instances where sufficient market activity may not exist or is limited, the pricing services also utilize proprietary valuation models which may consider market characteristics such as benchmark yield curves, credit spreads, estimated default rates, anticipated market interest rate volatility, coupon rates, anticipated timing of principal repayments, underlying collateral, and other unique security features in order to estimate the relevant cash flows, which are then discounted to calculate the fair value. Securities denominated in a foreign currency are converted into their U.S. dollar equivalent at the foreign exchange rate in effect at 4 p.m. Eastern time on the date that the values of the foreign debt securities are determined.
Certain derivatives trade in the OTC market. The Fund’s pricing services use various techniques including industry standard option pricing models and proprietary discounted cash flow models to determine the fair value of those instruments. The Fund’s net benefit or obligation under the derivative contract, as measured by the fair value of the contract, is included in net assets.
The Fund has procedures to determine the fair value of financial instruments for which market prices are not reliable or readily available. Under these procedures, the VLOC convenes on a regular basis to review such financial instruments and considers a number of factors, including significant unobservable valuation inputs, when arriving at fair value. The VLOC primarily employs a market-based approach which may use related or comparable assets or liabilities, recent transactions, market multiples, book values, and other relevant information for the investment to determine the fair value of the investment. An income-based valuation approach may also be used in which the anticipated future cash flows of the investment are discounted to
FRANKLIN TEMPLETON VARIABLE INSURANCE PRODUCTS TRUST
NOTES TO FINANCIAL STATEMENTS
Franklin Mutual Shares VIP Fund (continued)
1. Organization and Significant Accounting Policies (continued)
a. Financial Instrument Valuation (continued)
calculate fair value. Discounts may also be applied due to the nature or duration of any restrictions on the disposition of the investments. Due to the inherent uncertainty of valuations of such investments, the fair values may differ significantly from the values that would have been used had an active market existed. The VLOC employs various methods for calibrating these valuation approaches including a regular review of key inputs and assumptions, transactional back-testing or disposition analysis, and reviews of any related market activity.
Trading in securities on foreign securities stock exchanges and OTC markets may be completed before 4 p.m. Eastern time. In addition, trading in certain foreign markets may not take place on every NYSE business day. Occasionally, events occur between the time at which trading in a foreign security is completed and the close of the NYSE that might call into question the reliability of the value of a portfolio security held by the Fund. As a result, differences may arise between the value of the Fund’s portfolio securities as determined at the foreign market close and the latest indications of value at the close of the NYSE. In order to minimize the potential for these differences, the VLOC monitors price movements following the close of trading in foreign stock markets through a series of country specific market proxies (such as baskets of American Depositary Receipts, futures contracts and exchange traded funds). These price movements are measured against established trigger thresholds for each specific market proxy to assist in determining if an event has occurred that may call into question the reliability of the values of the foreign securities held by the Fund. If such an event occurs, the securities may be valued using fair value procedures, which may include the use of independent pricing services.
When the last day of the reporting period is a non-business day, certain foreign markets may be open on those days that the NYSE is closed, which could result in differences between the value of the Fund’s portfolio securities on the last business day and the last calendar day of the reporting period. Any significant security valuation changes due to an open foreign market are adjusted and reflected by the Fund for financial reporting purposes.
b. Foreign Currency Translation
Portfolio securities and other assets and liabilities denominated in foreign currencies are translated into U.S. dollars based on the exchange rate of such currencies against U.S. dollars on the date of valuation. The Fund may enter into foreign currency exchange contracts to facilitate transactions denominated in a foreign currency. Purchases and sales of securities, income and expense items denominated in foreign currencies are translated into U.S. dollars at the exchange rate in effect on the transaction date. Portfolio securities and assets and liabilities denominated in foreign currencies contain risks that those currencies will decline in value relative to the U.S. dollar. Occasionally, events may impact the availability or reliability of foreign exchange rates used to convert the U.S. dollar equivalent value. If such an event occurs, the foreign exchange rate will be valued at fair value using procedures established and approved by the Board.
The Fund does not separately report the effect of changes in foreign exchange rates from changes in market prices on securities held. Such changes are included in net realized and unrealized gain or loss from investments in the Statement of Operations.
Realized foreign exchange gains or losses arise from sales of foreign currencies, currency gains or losses realized between the trade and settlement dates on securities transactions and the difference between the recorded amounts of dividends, interest, and foreign withholding taxes and the U.S. dollar equivalent of the amounts actually received or paid. Net unrealized foreign exchange gains and losses arise from changes in foreign exchange rates on foreign denominated assets and liabilities other than investments in securities held at the end of the reporting period.
c. Derivative Financial Instruments
The Fund invested in derivatives in order to manage risk or gain exposure to various other investments or markets. Derivatives are financial contracts based on an underlying or notional amount, require no initial investment or an initial net investment that is smaller than would normally be required to have a similar response to changes in market factors, and require or permit net settlement. Derivatives contain various risks including the potential inability of the counterparty to fulfill their obligations under the terms of the contract, the potential for an illiquid secondary market, and/or the potential for market movements which expose the Fund to gains or losses in excess of the
FRANKLIN TEMPLETON VARIABLE INSURANCE PRODUCTS TRUST
NOTES TO FINANCIAL STATEMENTS
Franklin Mutual Shares VIP Fund (continued)
amounts shown in the Statement of Assets and Liabilities. Realized gain and loss and unrealized appreciation and depreciation on these contracts for the period are included in the Statement of Operations.
Derivative counterparty credit risk is managed through a formal evaluation of the creditworthiness of all potential counterparties. The Fund attempts to reduce its exposure to counterparty credit risk on OTC derivatives, whenever possible, by entering into International Swaps and Derivatives Association (ISDA) master agreements with certain counterparties. These agreements contain various provisions, including but not limited to collateral requirements, events of default, or early termination. Termination events applicable to the counterparty include certain deteriorations in the credit quality of the counterparty. Termination events applicable to the Fund include failure of the Fund to maintain certain net asset levels and/or limit the decline in net assets over various periods of time. In the event of default or early termination, the ISDA master agreement gives the non-defaulting party the right to net and close-out all transactions traded, whether or not arising under the ISDA agreement, to one net amount payable by one counterparty to the other. However, absent an event of default or early termination, OTC derivative assets and liabilities are presented gross and not offset in the Statement of Assets and Liabilities. Early termination by the counterparty may result in an immediate payment by the Fund of any net liability owed to that counterparty under the ISDA agreement. At December 31, 2015, the Fund had OTC derivatives in a net liability position of $578,160 and the aggregate value of collateral pledged for such contracts was $249,800.
Collateral requirements differ by type of derivative. Collateral or initial margin requirements are set by the broker or exchange clearing house for exchange traded and centrally cleared derivatives. Initial margin deposited is held at the exchange and can be in the form of cash and/or securities. For OTC derivatives traded under an ISDA master agreement, posting of collateral is required by either the Fund or the applicable counterparty if the total net exposure of all OTC derivatives with the applicable counterparty exceeds the minimum transfer amount, which typically ranges from $100,000 to $250,000, and can vary depending on the counterparty and the type of the agreement. Generally, collateral is determined at the close of Fund business each day and any additional collateral required due to changes in derivative values may be delivered by the Fund or the counterparty within a few business days. Collateral pledged
and/or received by the Fund for OTC derivatives, if any, is held in segregated accounts with the Fund’s custodian/counterparty broker and can be in the form of cash and/or securities. Unrestricted cash may be invested according to the Fund’s investment objectives. To the extent that the amounts due to the Fund from its counterparties are not subject to collateralization or are not fully collateralized, the Fund bears the risk of loss from counterparty non-performance.
At December 31, 2015, the Fund received $4,811,813 in Italy Treasury Bonds, United Kingdom Treasury Bonds and U.S. Treasury Notes as collateral for derivatives.
The Fund entered into exchange traded futures contracts primarily to manage exposure to certain foreign currencies. A futures contract is an agreement between the Fund and a counterparty to buy or sell an asset for a specified price on a future date. Required initial margins are pledged by the Fund, and the daily change in fair value is accounted for as a variation margin payable or receivable in the Statement of Assets and Liabilities.
The Fund entered into OTC forward exchange contracts primarily to manage exposure to certain foreign currencies. A forward exchange contract is an agreement between the Fund and a counterparty to buy or sell a foreign currency at a specific exchange rate on a future date.
See Note 9 regarding other derivative information.
d. Restricted Cash
At December 31, 2015, the Fund held restricted cash in connection with investments in certain derivative securities. Restricted cash is held in a segregated account with the Fund’s custodian and is reflected in the Statement of Assets and Liabilities.
e. Securities Sold Short
The Fund is engaged in selling securities short, which obligates the Fund to replace a borrowed security with the same security at current fair value. The Fund incurs a loss if the price of the security increases between the date of the short sale and the date on which the Fund replaces the borrowed security. The Fund realizes a gain if the price of the security declines between those dates. Gains are limited to the price at which the Fund sold the security short, while losses are potentially unlimited in size.
The Fund is required to establish a margin account with the broker lending the security sold short. While the short sale is
FRANKLIN TEMPLETON VARIABLE INSURANCE PRODUCTS TRUST
NOTES TO FINANCIAL STATEMENTS
Franklin Mutual Shares VIP Fund (continued)
1. Organization and Significant Accounting Policies (continued)
e. Securities Sold Short (continued)
outstanding, the broker retains the proceeds of the short sale to the extent necessary to meet margin requirements until the short position is closed out. A deposit must also be maintained with the Fund’s custodian/counterparty broker consisting of cash and/or securities having a value equal to a specified percentage of the value of the securities sold short. The Fund is obligated to pay fees for borrowing the securities sold short and is required to pay the counterparty any dividends and/or interest due on securities sold short. Such dividends and/or interest and any security borrowing fees are recorded as an expense to the Fund.
f. Securities Lending
The Fund participates in an agency based securities lending program to earn additional income. The Fund receives cash collateral against the loaned securities in an amount equal to at least 102% of the fair value of the loaned securities. Collateral is maintained over the life of the loan in an amount not less than 100% of the fair value of loaned securities, as determined at the close of Fund business each day; any additional collateral required due to changes in security values is delivered to the Fund on the next business day. The collateral is deposited into a joint cash account with other funds and is used to invest in a money market fund managed by Franklin Advisers, Inc., an affiliate of the Fund, and/or a joint repurchase agreement. The Fund may receive income from the investment of cash collateral, in addition to lending fees and rebates paid by the borrower. Income from securities loaned is reported separately in the Statement of Operations. The Fund bears the market risk with respect to the collateral investment, securities loaned, and the risk that the agent may default on its obligations to the Fund. If the borrower defaults on its obligation to return the securities loaned, the Fund has the right to repurchase the securities in the open market using the collateral received. The securities lending agent has agreed to indemnify the Fund in the event of default by a third party borrower. At December 31, 2015, the Fund had no securities on loan.
g. Senior Floating Rate Interests
The Fund invests in senior secured corporate loans that pay interest at rates which are periodically reset by reference to a base lending rate plus a spread. These base lending rates are generally the prime rate offered by a designated U.S. bank or the
London InterBank Offered Rate (LIBOR). Senior secured corporate loans often require prepayment of principal from excess cash flows or at the discretion of the borrower. As a result, actual maturity may be substantially less than the stated maturity. Senior secured corporate loans in which the Fund invests are generally readily marketable, but may be subject to certain restrictions on resale.
h. Income and Deferred Taxes
It is the Fund’s policy to qualify as a regulated investment company under the Internal Revenue Code. The Fund intends to distribute to shareholders substantially all of its taxable income and net realized gains to relieve it from federal income and excise taxes. As a result, no provision for U.S. federal income taxes is required.
The Fund may be subject to foreign taxation related to income received, capital gains on the sale of securities and certain foreign currency transactions in the foreign jurisdictions in which it invests. Foreign taxes, if any, are recorded based on the tax regulations and rates that exist in the foreign markets in which the Fund invests. When a capital gain tax is determined to apply, the Fund records an estimated deferred tax liability in an amount that would be payable if the securities were disposed of on the valuation date. As a result of several court cases, in certain countries across the European Union, the Fund has filed additional tax reclaims for previously withheld taxes on dividends earned in those countries. These additional filings are subject to various administrative proceedings by the local jurisdictions’ tax authorities within the European Union, as well as a number of related judicial proceedings. During the year ended December 31, 2015, the Fund recognized $1,176,537 from Sweden for previously withheld foreign taxes and interest on such taxes. These amounts are reflected as other income and interest in the Statement of Operations. In regards to filings in other European Union countries, uncertainty exists as to the ultimate resolution of these proceedings, the likelihood of receipt of these reclaims, and the potential timing of payment, and accordingly, no amounts are reflected in the financial statements.
The Fund may recognize an income tax liability related to its uncertain tax positions under U.S. GAAP when the uncertain tax position has a less than 50% probability that it will be sustained upon examination by the tax authorities based on its technical merits. As of December 31, 2015, and for all open tax years, the Fund has determined that no liability for unrecognized tax benefits is required in the Fund’s financial statements related
FRANKLIN TEMPLETON VARIABLE INSURANCE PRODUCTS TRUST
NOTES TO FINANCIAL STATEMENTS
Franklin Mutual Shares VIP Fund (continued)
to uncertain tax positions taken on a tax return (or expected to be taken on future tax returns). Open tax years are those that remain subject to examination and are based on each tax jurisdiction’s statute of limitation.
i. Security Transactions, Investment Income, Expenses and Distributions
Security transactions are accounted for on trade date. Realized gains and losses on security transactions are determined on a specific identification basis. Interest income and estimated expenses are accrued daily. Amortization of premium and accretion of discount on debt securities are included in interest income. Dividend income and dividends declared on securities sold short are recorded on the ex-dividend date except for certain dividends from foreign securities where the dividend rate is not available. In such cases, the dividend is recorded as soon as the information is received by the Fund. Distributions to shareholders are recorded on the ex-dividend date and are determined according to income tax regulations (tax basis). Distributable earnings determined on a tax basis may differ from earnings recorded in accordance with U.S. GAAP. These differences may be permanent or temporary. Permanent differences are reclassified among capital accounts to reflect their tax character. These reclassifications have no impact on net assets or the results of operations. Temporary differences are not reclassified, as they may reverse in subsequent periods.
Common expenses incurred by the Trust are allocated among the Funds based on the ratio of net assets of each Fund to the
combined net assets of the Trust. Fund specific expenses are charged directly to the fund that incurred the expense.
Realized and unrealized gains and losses and net investment income, not including class specific expenses, are allocated daily to each class of shares based upon the relative proportion of net assets of each class. Differences in per share distributions, by class, are generally due to differences in class specific expenses.
j. Accounting Estimates
The preparation of financial statements in accordance with U.S. GAAP requires management to make estimates and assumptions that affect the reported amounts of assets and liabilities at the date of the financial statements and the amounts of income and expenses during the reporting period. Actual results could differ from those estimates.
k. Guarantees and Indemnifications
Under the Trust’s organizational documents, its officers and trustees are indemnified by the Trust against certain liabilities arising out of the performance of their duties to the Trust. Additionally, in the normal course of business, the Trust, on behalf of the Fund, enters into contracts with service providers that contain general indemnification clauses. The Trust’s maximum exposure under these arrangements is unknown as this would involve future claims that may be made against the Trust that have not yet occurred. Currently, the Trust expects the risk of loss to be remote.
2. Shares of Beneficial Interest
At December 31, 2015, there were an unlimited number of shares authorized (without par value). Transactions in the Fund’s shares were as follows:
| | | | | | | | | | | | | | | | | | |
| | | Year Ended December 31, | |
| | | 2015 | | | | | 2014 | |
| | | Shares | | | Amount | | | | | Shares | | | Amount | |
| | | | | |
| Class 1 Shares: | | | | | | | | | | | | | | | | | | |
Shares sold | | | 5,200,808 | | | $ | 114,565,674 | | | | | | 5,610,891 | | | $ | 127,714,907 | |
Shares issued in reinvestment of distributions | | | 3,480,331 | | | | 67,065,978 | | | | | | 766,251 | | | | 17,800,004 | |
Shares redeemed | | | (4,296,684 | ) | | | (96,310,085 | ) | | | | | (2,917,184 | ) | | | (66,267,153 | ) |
| | | | |
Net increase (decrease) | | | 4,384,455 | | | $ | 85,321,567 | | | | | | 3,459,958 | | | $ | 79,247,758 | |
| | | | |
| Class 2 Shares: | | | | | | | | | | | | | | | | | | |
Shares sold | | | 8,995,477 | | | $ | 199,602,688 | | | | | | 9,492,120 | | | $ | 213,958,738 | |
Shares issued in reinvestment of distributions | | | 19,482,232 | | | | 370,357,223 | | | | | | 4,821,742 | | | | 110,610,757 | |
Shares redeemed | | | (40,426,538 | ) | | | (884,502,631 | ) | | | | | (38,420,623 | ) | | | (853,967,596 | ) |
| | | | |
Net increase (decrease) | | | (11,948,829 | ) | | $ | (314,542,720 | ) | | | | | (24,106,761 | ) | | $ | (529,398,101 | ) |
| | | | |
FRANKLIN TEMPLETON VARIABLE INSURANCE PRODUCTS TRUST
NOTES TO FINANCIAL STATEMENTS
Franklin Mutual Shares VIP Fund (continued)
2. Shares of Beneficial Interest (continued)
| | | | | | | | | | | | | | | | | | |
| | | Year Ended December 31, | |
| | | 2015 | | | | | 2014 | |
| | | Shares | | | Amount | | | | | Shares | | | Amount | |
| Class 4 Shares: | | | | | | | | | | | | | | | | | | |
Shares sold | | | 465,090 | | | $ | 9,850,242 | | | | | | 237,284 | | | $ | 5,313,846 | |
Shares issued in reinvestment of distributions | | | 732,186 | | | | 14,014,047 | | | | | | 169,771 | | | | 3,914,913 | |
Shares redeemed | | | (1,372,567 | ) | | | (30,167,160 | ) | | | | | (2,108,780 | ) | | | (48,253,969 | ) |
| | | | |
Net increase (decrease) | | | (175,291 | ) | | $ | (6,302,871 | ) | | | | | (1,701,725 | ) | | $ | (39,025,210 | ) |
| | | | |
3. Transactions With Affiliates
Franklin Resources, Inc. is the holding company for various subsidiaries that together are referred to as Franklin Templeton Investments. Certain officers and trustees of the Fund are also officers and/or directors of the following subsidiaries:
| | |
| Subsidiary | | Affiliation |
Franklin Mutual Advisers, LLC (Franklin Mutual) | | Investment manager |
Franklin Templeton Services, LLC (FT Services) | | Administrative manager |
Franklin Templeton Distributors, Inc. (Distributors) | | Principal underwriter |
Franklin Templeton Investor Services, LLC (Investor Services) | | Transfer agent |
a. Management Fees
The Fund pays an investment management fee to Franklin Mutual based on the average daily net assets of the Fund as follows:
| | |
| Annualized Fee Rate | | Net Assets |
0.750% | | Up to and including $200 million |
0.735% | | Over $200 million, up to and including $700 million |
0.700% | | Over $700 million, up to and including $1.2 billion |
0.675% | | Over $1.2 billion, up to and including $5 billion |
0.645% | | Over $5 billion, up to and including $10 billion |
0.625% | | Over $10 billion, up to and including $15 billion |
0.605% | | Over $15 billion, up to and including $20 billion |
0.585% | | In excess of $20 billion |
b. Administrative Fees
Under an agreement with Franklin Mutual, FT Services provides administrative services to the Fund. The fee is paid by Franklin Mutual based on the Fund’s average daily net assets, and is not an additional expense of the Fund.
c. Distribution Fees
The Board has adopted distribution plans for Class 2 and Class 4 shares pursuant to Rule 12b-1 under the 1940 Act. Under the Fund’s compensation distribution plans, the Fund pays Distributors for costs incurred in connection with the servicing, sale and distribution of the Fund’s shares up to 0.35% per year of its average daily net assets of each Class. The Board has agreed to limit the current rate to 0.25% per year for Class 2. The plan year, for purposes of monitoring compliance with the maximum annual plan rates, is February 1 through January 31.
FRANKLIN TEMPLETON VARIABLE INSURANCE PRODUCTS TRUST
NOTES TO FINANCIAL STATEMENTS
Franklin Mutual Shares VIP Fund (continued)
d. Transfer Agent Fees
Investor Services, under terms of an agreement, performs shareholder servicing for the Fund and is not paid by the Fund for the services.
e. Investments in Affiliated Management Investment Companies
The Fund invests in an affiliated management investment company for purposes other than exercising a controlling influence over the management or policies. Management fees paid by the Fund are waived on assets invested in the affiliated management investment company, as noted in the Statement of Operations, in an amount not to exceed the management and administrative fees paid directly or indirectly by each affiliate.
| | | | | | | | | | | | | | | | | | | | | | | | | | | | | | | | |
| | | Number
of Shares
Held at
Beginning
of Year | | | Gross
Additions | | | Gross
Reductions | | | Number
of Shares
Held at
End of
Year | | | Value at
End of
Year | | | Investment
Income | | | Realized
Gain
(Loss) | | | % of
Affiliated
Fund Shares
Outstanding
Held at End
of Year | |
| Non-Controlled Affiliates | | | | | | | | | | | | | | | | | | | | | | | | | | | | | | | | |
Institutional Fiduciary Trust Money Market Portfolio | | | — | | | | 21,750,000 | | | | (21,750,000 | ) | | | — | | | $ | — | | | $ | — | | | $ | — | | | | —% | |
| | | | | | | | | | | | | | | | | | | | | | | | |
f. Other Affiliated Transactions
At December 31, 2015, Franklin Templeton Variable Insurance Products Trust – Franklin Founding Funds Allocation VIP Fund owned 8.16% of the Fund’s outstanding shares.
4. Expense Offset Arrangement
The Fund has entered into an arrangement with its custodian whereby credits realized as a result of uninvested cash balances are used to reduce a portion of the Fund’s custodian expenses. During the year ended December 31, 2015, the custodian fees were reduced as noted in the Statement of Operations.
5. Income Taxes
The tax character of distributions paid during the years ended December 31, 2015 and 2014, was as follows:
| | | | | | | | |
| | | 2015 | | | 2014 | |
| | |
Distributions paid from: | | | | | | | | |
Ordinary income | | $ | 141,999,509 | | | $ | 105,305,669 | |
Long term capital gain | | | 309,437,739 | | | | 27,020,004 | |
| | | | |
| | $ | 451,437,248 | | | $ | 132,325,673 | |
| | | | |
At December 31, 2015, the cost of investments, net unrealized appreciation (depreciation), undistributed ordinary income and undistributed long term capital gains for income tax purposes were as follows:
| | | | |
Cost of investments | | $ | 3,573,848,191 | |
| | | | |
Unrealized appreciation | | $ | 1,069,903,015 | |
Unrealized depreciation | | | (534,462,809 | ) |
| | | | |
Net unrealized appreciation (depreciation) | | $ | 535,440,206 | |
| | | | |
| |
Undistributed ordinary income | | $ | 96,597,833 | |
Undistributed long term capital gains | | | 332,800,069 | |
| | | | |
Distributable earnings | | $ | 429,397,902 | |
| | | | |
FRANKLIN TEMPLETON VARIABLE INSURANCE PRODUCTS TRUST
NOTES TO FINANCIAL STATEMENTS
Franklin Mutual Shares VIP Fund (continued)
5. Income Taxes (continued)
Differences between income and/or capital gains as determined on a book basis and a tax basis are primarily due to differing treatments of foreign currency transactions.
6. Investment Transactions
Purchases and sales of investments (excluding short term securities and securities sold short) for the year ended December 31, 2015, aggregated $865,145,481 and $1,369,724,656, respectively.
7. Credit Risk and Defaulted Securities
The Fund may purchase the pre-default or defaulted debt of distressed companies. Distressed companies are financially troubled and are about to be or are already involved in financial restructuring or bankruptcy. Risks associated with purchasing these securities include the possibility that the bankruptcy or other restructuring process takes longer than expected, or that distributions in restructuring are less than anticipated, either or both of which may result in unfavorable consequences to the Fund. If it becomes probable that the income on debt securities, including those of distressed companies, will not be collected, the Fund discontinues accruing income and recognizes an adjustment for uncollectible interest.
At December 31, 2015, the aggregate long value of distressed company securities for which interest recognition has been discontinued was $70,545,426, representing 1.71% of the Fund’s net assets. For information as to specific securities, see the accompanying Statement of Investments.
8. Restricted Securities
The Fund invests in securities that are restricted under the Securities Act of 1933 (1933 Act) or which are subject to legal, contractual, or other agreed upon restrictions on resale. Restricted securities are often purchased in private placement transactions, and cannot be sold without prior registration unless the sale is pursuant to an exemption under the 1933 Act. Disposal of these securities may require greater effort and expense, and prompt sale at an acceptable price may be difficult. The Fund may have registration rights for restricted securities. The issuer generally incurs all registration costs.
At December 31, 2015, the Fund held investments in restricted securities, excluding certain securities exempt from registration under the 1933 Act deemed to be liquid, as follows:
| | | | | | | | | | | | | | |
Principal
Amount/
Shares | | Issuer | | Acquisition
Dates | | | Cost | | | Value | |
| 1,754 | | Broadband Ventures III LLC, secured promissory note, 5.00%, 2/01/12 | | | 7/01/10 - 11/30/12 | | | $ | 1,754 | | | $ | — | |
| 6,400,507 | | CB FIM Coinvestors LLC | | | 1/15/09 - 6/02/09 | | | | — | | | | — | |
| 8,006,950 | | FIM Coinvestor Holdings I, LLC | | | 11/20/06 - 6/02/09 | | | | — | | | | — | |
| 1,730,515 | | International Automotive Components Group Brazil LLC | | | 4/13/06 - 12/26/08 | | | | 1,149,241 | | | | 17,795 | |
| 15,382,424 | | International Automotive Components Group North America LLC | | | 1/12/06 - 3/18/13 | | | | 12,591,586 | | | | 8,304,432 | |
| | | | | | | | | | |
| | Total Restricted Securities (Value is 0.20% of Net Assets) | | | | | | $ | 13,742,581 | | | $ | 8,322,227 | |
| | | | | | | | | | |
FRANKLIN TEMPLETON VARIABLE INSURANCE PRODUCTS TRUST
NOTES TO FINANCIAL STATEMENTS
Franklin Mutual Shares VIP Fund (continued)
9. Other Derivative Information
At December 31, 2015, the Fund’s investments in derivative contracts are reflected in the Statement of Assets and Liabilities as follows:
| | | | | | | | | | | | |
| | | Asset Derivatives | | | Liability Derivatives | |
Derivative Contracts
Not Accounted for
as Hedging Instruments | | Statement of Assets and
Liabilities Location | | Fair Value | | | Statement of Assets and
Liabilities Location | | Fair Value | |
Foreign exchange contracts | | Variation margin | | $ | 3,262,239 | a | | Variation margin | | $ | — | |
| | Unrealized appreciation on OTC forward exchange contracts | | | 8,864,506 | | | Unrealized depreciation on OTC forward exchange contracts | | | 3,716,678 | |
| | | | | | | | | | | | |
Totals | | | | $ | 12,126,745 | | | | | $ | 3,716,678 | |
| | | | | | | | | | | | |
aThis amount reflects the cumulative appreciation (depreciation) of futures contracts as reported in the Statement of Investments. Only the variation margin receivable/payable at year end is separately reported within the Statement of Assets and Liabilities. Prior variation margin movements were recorded to cash upon receipt or payment.
For the year ended December 31, 2015, the effect of derivative contracts in the Fund’s Statement of Operations was as follows:
| | | | | | | | | | | | |
Derivative Contracts
Not Accounted for
as Hedging Instruments | | Statement of Operations Locations | | Net Realized
Gain (Loss)
for the Year | | | Statement of Operations Locations | | Net Change in
Unrealized
Appreciation
(Depreciation)
for the Year | |
| | Net realized gain (loss) from: | | | | | | Net change in unrealized appreciation (depreciation) on: | | | | |
Foreign exchange contracts | | Foreign currency transactions | | $ | 33,132,376 | a | | Translation of other assets and liabilities denominated in foreign currencies | | $ | (13,820,013 | )a |
| | Futures contracts | | | 13,095,194 | | | Futures contracts | | | 758,215 | |
| | | | | | | | | | | | |
Totals | | | | $ | 46,227,570 | | | | | $ | (13,061,798 | ) |
| | | | | | | | | | | | |
aForward exchange contracts are included in net realized gain (loss) from foreign currency transactions and net change in unrealized appreciation (depreciation) on translation of other assets and liabilities denominated in foreign currencies in the Statement of Operations.
For the year ended December 31, 2015, the average month end fair value of derivatives represented 0.42% of average month end net assets. The average month end number of open derivative contracts for the year was 179.
See Note 1(c) regarding derivative financial instruments.
10. Holdings of 5% Voting Securities of Portfolio Companies
The 1940 Act defines “affiliated companies” to include investments in portfolio companies in which a fund owns 5% or more of the outstanding voting securities. Investments in “affiliated companies” for the Fund for the year ended December 31, 2015, were as shown below.
| | | | | | | | | | | | | | | | | | | | | | | | | | | | |
| Name of Issuer | | Number of Shares
Held at Beginning
of Year | | | Gross
Additions | | | Gross
Reductions | | | Number of Shares
Held at End
of Year | | | Value at
End of
Year | | | Investment
Income | | | Realized
Gain (Loss) | |
| Non-Controlled Affiliates | | | | | | | | | | | | | | | | | | | | | | | | | | | | |
CB FIM Coinvestors LLC (Value is 0.00% of Net Assets) | | | 6,400,507 | | | | — | | | | — | | | | 6,400,507 | | | $ | — | | | $ | — | | | $ | — | |
| | | | | | | | | | | | | | | | | | | | |
FRANKLIN TEMPLETON VARIABLE INSURANCE PRODUCTS TRUST
NOTES TO FINANCIAL STATEMENTS
Franklin Mutual Shares VIP Fund (continued)
11. Credit Facility
The Fund, together with other U.S. registered and foreign investment funds (collectively, Borrowers), managed by Franklin Templeton Investments, are borrowers in a joint syndicated senior unsecured credit facility totaling $2 billion (Global Credit Facility) which matured on February 12, 2016. This Global Credit Facility provides a source of funds to the Borrowers for temporary and emergency purposes, including the ability to meet future unanticipated or unusually large redemption requests. Effective February 12, 2016, the Fund renewed the Global Credit Facility for a one year term, maturing February 10, 2017, for a total of $2 billion.
Under the terms of the Global Credit Facility, the Fund shall, in addition to interest charged on any borrowings made by the Fund and other costs incurred by the Fund, pay its share of fees and expenses incurred in connection with the implementation and maintenance of the Global Credit Facility, based upon its relative share of the aggregate net assets of all of the Borrowers, including an annual commitment fee of 0.07% based upon the unused portion of the Global Credit Facility. Effective February 12, 2016, the annual commitment fee is 0.15%. These fees are reflected in other expenses in the Statement of Operations. During the year ended December 31, 2015, the Fund did not use the Global Credit Facility.
12. Fair Value Measurements
The Fund follows a fair value hierarchy that distinguishes between market data obtained from independent sources (observable inputs) and the Fund’s own market assumptions (unobservable inputs). These inputs are used in determining the value of the Fund’s financial instruments and are summarized in the following fair value hierarchy:
| | • | | Level 1 – quoted prices in active markets for identical financial instruments |
| | • | | Level 2 – other significant observable inputs (including quoted prices for similar financial instruments, interest rates, prepayment speed, credit risk, etc.) |
| | • | | Level 3 – significant unobservable inputs (including the Fund’s own assumptions in determining the fair value of financial instruments) |
The input levels are not necessarily an indication of the risk or liquidity associated with financial instruments at that level.
For movements between the levels within the fair value hierarchy, the Fund has adopted a policy of recognizing the transfers as of the date of the underlying event which caused the movement.
A summary of inputs used as of December 31, 2015, in valuing the Fund’s assets and liabilities carried at fair value, is as follows:
| | | | | | | | | | | | | | | | |
| | | Level 1 | | | Level 2 | | | Level 3 | | | Total | |
| Assets: | | | | | | | | | | | | | | | | |
Investments in Securities: | | | | | | | | | | | | | | | | |
Equity Investments:a | | | | | | | | | | | | | | | | |
Auto Components | | $ | — | | | $ | — | | | $ | 8,322,227 | | | $ | 8,322,227 | |
Machinery | | | 60,294,739 | | | | 12,704,911 | | | | — | | | | 72,999,650 | |
All Other Equity Investmentsb | | | 3,505,050,530 | | | | — | | | | — | c | | | 3,505,050,530 | |
Corporate Bonds, Notes and Senior Floating Rate Interests | | | — | | | | 141,726,940 | | | | — | | | | 141,726,940 | |
Corporate Notes and Senior Floating Rate Interests in Reorganization | | | — | | | | 70,531,543 | | | | 13,883 | c | | | 70,545,426 | |
Companies in Liquidation | | | 117,133 | | | | 8,107,219 | | | | — | c | | | 8,224,352 | |
Municipal Bonds | | | — | | | | 14,847,547 | | | | — | | | | 14,847,547 | |
Short Term Investments | | | 273,771,765 | | | | 13,799,960 | | | | — | | | | 287,571,725 | |
| | | | |
Total Investments in Securities | | $ | 3,839,234,167 | | | $ | 261,718,120 | | | $ | 8,336,110 | | | $ | 4,109,288,397 | |
| | | | |
FRANKLIN TEMPLETON VARIABLE INSURANCE PRODUCTS TRUST
NOTES TO FINANCIAL STATEMENTS
Franklin Mutual Shares VIP Fund (continued)
| | | | | | | | | | | | | | | | |
| | | Level 1 | | | Level 2 | | | Level 3 | | | Total | |
Other Financial Instruments | | | | | | | | | | | | | | | | |
Futures Contracts | | $ | 3,262,239 | | | $ | — | | | $ | — | | | $ | 3,262,239 | |
Forward Exchange Contracts | | | — | | | | 8,864,506 | | | | — | | | | 8,864,506 | |
| | | | |
Total Other Financial Instruments | | $ | 3,262,239 | | | $ | 8,864,506 | | | $ | — | | | $ | 12,126,745 | |
| | | | |
| | | | |
| Liabilities: | | | | | | | | | | | | | | | | |
Other Financial Instruments | | | | | | | | | | | | | | | | |
Securities Sold Short | | $ | 9,084,697 | | | $ | — | | | $ | — | | | $ | 9,084,697 | |
Forward Exchange Contracts | | | — | | | | 3,716,678 | | | | — | | | | 3,716,678 | |
| | | | |
Total Other Financial Instruments | | $ | 9,084,697 | | | $ | 3,716,678 | | | $ | — | | | $ | 12,801,375 | |
| | | | |
aIncludes common stocks as well as other equity investments.
bFor detailed categories, see the accompanying Statement of Investments.
cIncludes securities determined to have no value at December 31, 2015.
A reconciliation of assets in which Level 3 inputs are used in determining fair value is presented when there are significant Level 3 financial instruments at the end of the year.
13. Subsequent Events
The Fund has evaluated subsequent events through the issuance of the financial statements and determined that no events have occurred that require disclosure other than those already disclosed in the financial statements.
Abbreviations
| | | | | | | | | | |
| Counterparty | | Currency | | Selected Portfolio |
| | | | | |
| BOFA | | Bank of America Corp. | | EUR | | Euro | | ADR | | American Depositary Receipt |
| | | | | |
| BONY | | Bank of New York Mellon | | GBP | | British Pound | | FHLB | | Federal Home Loan Bank |
| | | | | |
| BZWS | | Barclays Bank PLC | | USD | | United States Dollar | | GO | | General Obligation |
| | | | | |
| DBAB | | Deutsche Bank AG | | | | | | PIK | | Payment-In-Kind |
| | | | | |
| FBCO | | Credit Suisse Group AG | | | | | | | | |
| | | | | |
| HSBC | | HSBC Bank USA, N.A. | | | | | | | | |
| | | | | |
| SSBT | | State Street Bank and Trust Co. | | | | | | | | |
FRANKLIN TEMPLETON VARIABLE INSURANCE PRODUCTS TRUST
Report of Independent Registered Public Accounting Firm
Franklin Mutual Shares VIP Fund
To the Board of Trustees and Shareholders of Franklin Templeton Variable Insurance Products Trust
In our opinion, the accompanying statement of assets and liabilities, including the statement of investments, and the related statements of operations and of changes in net assets and the financial highlights present fairly, in all material respects, the financial position of Franklin Mutual Shares VIP Fund (the “Fund”) at December 31, 2015, the results of its operations for the year then ended, the changes in its net assets for each of the two years in the period then ended and the financial highlights for each of the periods presented, in conformity with accounting principles generally accepted in the United States of America. These financial statements and financial highlights (hereafter referred to as “financial statements”) are the responsibility of the Fund’s management. Our responsibility is to express an opinion on these financial statements based on our audit. We conducted our audit of these financial statements in accordance with the standards of the Public Company Accounting Oversight Board (United States). Those standards require that we plan and perform the audit to obtain reasonable assurance about whether the financial statements are free of material misstatement. An audit includes examining, on a test basis, evidence supporting the amounts and disclosures in the financial statements, assessing the accounting principles used and significant estimates made by management, and evaluating the overall financial statement presentation. We believe that our audit, which included confirmation of securities at December 31, 2015 by correspondence with the custodian and brokers, provides a reasonable basis for our opinion.
PricewaterhouseCoopers LLP
San Francisco, California
February 16, 2016
FRANKLIN TEMPLETON VARIABLE INSURANCE PRODUCTS TRUST
Tax Information (unaudited)
Franklin Mutual Shares VIP Fund
Under Section 852(b)(3)(C) of the Internal Revenue Code (Code), the Fund hereby reports the maximum amount allowable but no less than $309,437,739 as a long term capital gain dividend for the fiscal year ended December 31, 2015.
Under Section 854(b)(1)(A) of the Code, the Fund hereby reports 43.13% of the ordinary income dividends as income qualifying for the dividends received deduction for the fiscal year ended December 31, 2015.
Franklin Rising Dividends VIP Fund
This annual report for Franklin Rising Dividends VIP Fund covers the fiscal year ended December 31, 2015.
Class 4 Performance Summary as of December 31, 2015
Average annual total return of Class 4 shares* represents the average annual change in value, assuming reinvestment of dividends and capital gains. Average returns smooth out variations in returns, which can be significant; they are not the same as year-by-year results.
| | | | | | | | | | | | |
| Periods ended 12/31/15 | | 1-Year | | | 5-Year | | | 10-Year | |
Average Annual Total Return | | | -3.75% | | | | +9.90% | | | | +6.59% | |
*For the period beginning 2/29/08, Class 4 performance reflects a 12b-1 fee expense of 0.35% per year, which affects future performance. Class 4 performance prior to 2/29/08 reflects historical Class 1 performance, which does not have a 12b-1 fee expense. Since 2/29/08 (effective date), the average annual total return of Class 4 shares was +7.40%. The Fund has a fee waiver associated with any investment in a Franklin Templeton money fund, contractually guaranteed through at least its current fiscal year-end. Fund investment results reflect the fee waiver, to the extent applicable; without this reduction, the results would have been lower.
Performance reflects the Fund’s Class 4 operating expenses, but does not include any contract fees, expenses or sales charges. If they had been included, performance would be lower. These charges and deductions, particularly for variable life policies, can have a significant effect on contract values and insurance benefits. See the contract prospectus for a complete description of these expenses, including sales charges.
Performance data represent past performance, which does not guarantee future results. Investment return and principal value will fluctuate, and you may have a gain or loss when you sell your shares. Current performance may differ from figures shown.
Total Return Index Comparison for a Hypothetical $10,000 Investment (1/1/06–12/31/15)
The graph below shows the change in value of a hypothetical $10,000 investment in the Fund over the indicated period and includes reinvestment of any income or distributions. The Fund’s performance* is compared to the performance of the Standard & Poor’s® 500 Index (S&P 500®). One cannot invest directly in an index, and an index is not representative of the Fund’s portfolio. Please see Important Notes to Performance Information preceding the Fund Summaries.
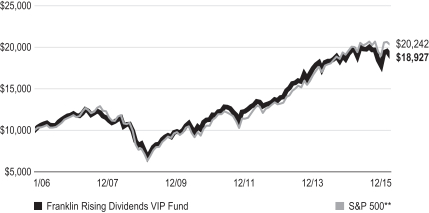
**Source: Morningstar. Please see Index Descriptions following the Fund Summaries.
FRANKLIN RISING DIVIDENDS VIP FUND
Fund Goal and Main Investments
The Fund seeks long-term capital appreciation, with preservation of capital as an important consideration. Under normal market conditions, the Fund invests at least 80% of its net assets in equity securities of companies that have paid rising dividends.
Fund Risks
All investments involve risks, including possible loss of principal. Value securities may not increase in price as anticipated or may decline further in value. While smaller and midsized companies may offer substantial opportunities for capital growth, they also involve heightened risks and should be considered speculative. Historically, smaller- and midsized-company securities have been more volatile in price than larger company securities, especially over the short term. The Fund is actively managed but there is no guarantee that the manager’s investment decisions will produce the desired results. The Fund’s prospectus also includes a description of the main investment risks.
Performance Overview
You can find the Fund’s one-year total return in the Performance Summary. In comparison, the S&P 500 rose 1.38% for the same period.1 Please note the Fund employs a bottom-up stock selection process, and the managers invest in securities without regard to benchmark comparisons.
Economic and Market Overview
The U.S. economy grew moderately during the 12 months under review amid healthy consumer spending. After starting 2015 with modest growth, the economy strengthened in the second quarter but moderated in the third and fourth quarters as exports slowed and state and local governments reduced their spending. Manufacturing activities expanded for most of the period but contracted toward period-end. Non-manufacturing activities, however, expanded throughout the 12-month period, contributing to new jobs and helping drive down the unemployment rate to 5.0% from October through period-end, the lowest level in more than seven years.2 The housing market improved at period-end as existing and new home sales increased and home prices rose despite slightly higher mortgage rates. Retail sales grew modestly, led by automobile and auto
component sales. Annual inflation, as measured by the Consumer Price Index, remained subdued largely due to low energy prices.
After maintaining its target interest rate at a range of 0%–0.25% for seven years to support the U.S. economy’s recovery, the Federal Reserve (Fed) raised its target range for the federal funds rate to 0.25%–0.50% at its December meeting. Policymakers cited the labor market’s considerable improvement and were reasonably confident that inflation would move back to the Fed’s 2.0% medium-term objective. The Fed indicated that its process of normalizing interest rates would be data dependent and would likely be gradual. Furthermore, the Fed raised its 2016 U.S. economic growth forecast and lowered its unemployment rate projection.
U.S. stock markets experienced sell-offs at times during the year, resulting from investor concerns about the timing of the Fed’s interest rate increases, slower global economic growth, geopolitical tensions in certain regions and a plunge in crude oil prices. Investors generally remained confident, however, as the Fed maintained an accommodative monetary policy stance despite the rate increase, the eurozone economy improved and China implemented more stimulus measures to support its economy. Despite periods of volatility, the broad U.S. stock market, as measured by the S&P 500, generated a modest positive total return for 2015. The energy and materials sectors were among the worst performers, while consumer discretionary, health care, consumer staples and information technology outperformed.
Investment Strategy
We are a research-driven, fundamental investment adviser, pursuing a disciplined value-oriented strategy. As bottom-up investors concentrating primarily on individual securities, we seek fundamentally sound companies that we believe meet our screening criteria, which include consistent, substantial dividend increases; reinvested earnings; and strong balance sheets. We attempt to acquire such stocks at attractive prices, often when they are out of favor with other investors. In following these criteria, we do not necessarily focus on companies whose securities pay a high dividend but rather on companies that consistently raise their dividends.
1. Source: Morningstar.
One cannot invest directly in an index, and an index is not representative of the Fund’s portfolio. Please see Index Descriptions following the Fund Summaries.
2. Source: Bureau of Labor Statistics.
3. Please see Index Descriptions following the Fund Summaries.
FRANKLIN RISING DIVIDENDS VIP FUND
Manager’s Discussion
During the 12-month period, contributors to absolute performance included Roper Technologies, NIKE and McDonald’s. Shares of Roper Technologies, a diversified technology company, delivered strong performance over the period, as solid earnings results largely offset headwinds from exposure to weak energy markets. Roper’s non-energy-related end markets continue to generate solid performance and overall company profitability continued to improve. The company has 23 consecutive years of dividend increases. NIKE, an athletic footwear and apparel manufacturer, experienced an increased share price due to consistently strong performance throughout the year, as the company reported solid constant currency revenue growth and strong estimates of future sales. We believe increased automation of its supplier factory base should drive margin expansion. NIKE has raised its dividend for 14 consecutive years. Shares of McDonald’s, a fast food restaurant operator, rose in response to a series of initiatives being implemented by the new Chief Executive Officer to reinvigorate growth. These included rationalizing and increasing the localization of menu items, improving brand perception and the announcement of an all-day breakfast offering. McDonald’s has raised its dividend for 39 consecutive years.
Detractors from absolute performance included Wal-Mart, Praxair and Pentair. Shares of Wal-Mart, a large discount retailer, fell as a result of weaker profitability caused by wage hikes and increased e-commerce investments. We believe that the company’s investments in e-commerce and in its associates should, over time, reinforce its strong competitive position in an increasingly challenging environment. Wal-Mart has raised its dividend for the past 42 years. Shares of Praxair, an industrial gas supplier, experienced a decline as weakness in key growth areas, including energy-related end markets and emerging markets broadly, along with intense foreign exchange-related pressure, negatively impacted the company’s financial performance. The company, which is widely considered reliable and conservatively managed, downwardly revised its 2015 guidance repeatedly as challenges intensified throughout the year. Praxair has raised its dividend for the past 22 years. Shares of Pentair, a diversified industrial manufacturer, declined over the period as weak energy activity continued to negatively impact financial performance, causing management to revise down its 2015 full-year financial guidance. Initial enthusiasm over an announcement that activist investor Nelson Peltz had taken a large stake in the company waned, as energy and industrial end-market headwinds strengthened. Pentair has raised its dividend for 40 consecutive years.
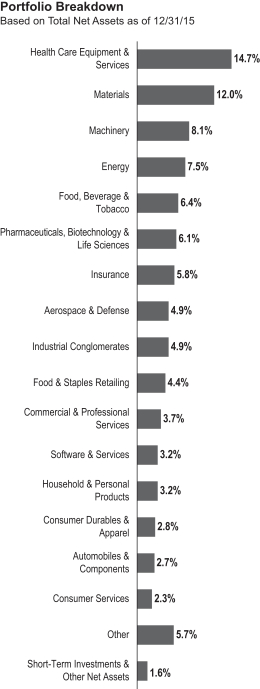
FRANKLIN RISING DIVIDENDS VIP FUND
New positions initiated during the period included The Gap, a clothing retailer with 9 years of dividend increases; Linear Technology, a manufacturer and distributor of analog integrated circuits (23 years); and Tiffany & Co, a jewelry retailer (13 years). We added to our existing holdings in Texas Instruments, a semiconductor designer and manufacturer (12 years); Bunge, an agribusiness and food distributor (15 years); W.W. Grainger, a distributor of maintenance, repair and operating products (44 years); and Microsoft, a developer and manufacturer of system software (11 years); among several others. Positions we exited included Chubb, IBM and California Resources, the latter of which we received as a spin-off of Occidental Petroleum. We also reduced our holdings in the aforementioned NIKE, Teleflex, and West Pharmaceutical Services, among several others.
Our 10 largest positions on December 31, 2015, represented 32.5% of the Fund’s total net assets. It is interesting to note how these 10 companies would respond, in aggregate, to the Fund’s screening criteria based on a simple average of statistical measures. On average, these 10 companies have raised their dividends 32 years in a row and by 332% over the past 10 years. Their most recent year-over-year dividend increases averaged 11.2% with a yield of 2.3% on December 31, 2015, and a dividend payout ratio of 38.5%, based on estimates of calendar year 2015 operating earnings. The average price/earnings ratio was 18.2 times calendar year 2015 estimates versus 18.3 for that of the unmanaged S&P 500.
Thank you for your participation in Franklin Rising Dividends VIP Fund. We look forward to serving your future investment needs.
| | | | |
| Top 10 Holdings | |
| 12/31/15 | |
Company Sector/Industry | | % of Total
Net Assets | |
Roper Technologies Inc. Industrial Conglomerates | | | 4.3% | |
Praxair Inc. Materials | | | 3.5% | |
Air Products and Chemicals Inc. Materials | | | 3.3% | |
Dover Corp. Machinery | | | 3.3% | |
Becton, Dickinson and Co. Health Care Equipment & Services | | | 3.2% | |
Medtronic PLC Health Care Equipment & Services | | | 3.2% | |
Johnson & Johnson Pharmaceuticals, Biotechnology & Life Sciences | | | 3.0% | |
Stryker Corp. Health Care Equipment & Services | | | 3.0% | |
United Technologies Corp. Aerospace & Defense | | | 3.0% | |
Johnson Controls Inc. Automobiles & Components | | | 2.7% | |
The dollar value, number of shares or principal amount, and names of all portfolio holdings are listed in the Fund’s Statement of Investments.
The foregoing information reflects our analysis, opinions and portfolio holdings as of December 31, 2015, the end of the reporting period. The way we implement our main investment strategies and the resulting portfolio holdings may change depending on factors such as market and economic conditions. These opinions may not be relied upon as investment advice or an offer for a particular security. The information is not a complete analysis of every aspect of any market, country, industry, security or the Fund. Statements of fact are from sources considered reliable, but the investment manager makes no representation or warranty as to their completeness or accuracy. Although historical performance is no guarantee of future results, these insights may help you understand our investment management philosophy.
FRANKLIN RISING DIVIDENDS VIP FUND
Class 4 Fund Expenses
As an investor in a variable insurance contract (Contract) that indirectly provides for investment in an underlying mutual fund, you can incur transaction and/or ongoing expenses at both the Fund level and the Contract level.
| • | | Transaction expenses can include sales charges (loads) on purchases, redemption fees, surrender fees, transfer fees and premium taxes. |
| • | | Ongoing expenses can include management fees, distribution and service (12b-1) fees, contract fees, annual maintenance fees, mortality and expense risk fees and other fees and expenses. All mutual funds and Contracts have some types of ongoing expenses. |
The expenses shown in the table are meant to highlight ongoing expenses at the Fund level only and do not include ongoing expenses at the Contract level, or transaction expenses at either the Fund or Contract level. While the Fund does not have transaction expenses, if the transaction and ongoing expenses at the Contract level were included, the expenses shown would be higher. You should consult your Contract prospectus or disclosure document for more information.
The table shows Fund-level ongoing expenses and can help you understand these expenses and compare them with those of other mutual funds offered through the Contract. The table assumes a $1,000 investment held for the six months indicated. Please refer to the Fund prospectus for additional information on operating expenses.
Actual Fund Expenses
The first line (Actual) of the table provides actual account values and expenses. The “Ending Account Value” is derived from the Fund’s actual return, which includes the effect of ongoing Fund expenses, but does not include the effect of ongoing Contract expenses.
You can estimate the Fund-level expenses you incurred during the period by following these steps. Of course, your account value and expenses will differ from those in this illustration:
| 1. | Divide your account value by $1,000. |
If an account had an $8,600 value, then $8,600 ÷ $1,000 = 8.6.
| 2. | Multiply the result by the number under the heading “Fund-Level Expenses Incurred During Period.” |
If Fund-Level Expenses Incurred During Period were $7.50, then 8.6 × $7.50 = $64.50.
In this illustration, the estimated expenses incurred this period at the Fund level are $64.50.
Hypothetical Example for Comparison with Other Mutual Funds
Information in the second line (Hypothetical) of the table can help you compare ongoing expenses of the Fund with those of other mutual funds offered through the Contract. This information may not be used to estimate the actual ending account balance or expenses you incurred during the period. The hypothetical “Ending Account Value” is based on the Fund’s actual expense ratio and an assumed 5% annual rate of return before expenses, which does not represent the Fund’s actual return. The figure under the heading “Fund-Level Expenses Incurred During Period” shows the hypothetical expenses your account would have incurred under this scenario. You can compare this figure with the 5% hypothetical examples that appear in shareholder reports of other funds offered through a Contract.
| | | | | | | | | | | | |
| Class 4 | | Beginning Account Value 7/1/15 | | | Ending Account Value 12/31/15 | | | Fund-Level Expenses
Incurred During Period* 7/1/15–12/31/15 | |
Actual | | | $1,000 | | | | $ 965.00 | | | | $4.85 | |
Hypothetical (5% return before expenses) | | | $1,000 | | | | $1,020.27 | | | | $4.99 | |
*Expenses are calculated using the most recent six-month annualized expense ratio, net of expense waivers, for the Fund’s Class 4 shares (0.98%), which does not include any ongoing expenses of the Contract for which the Fund is an investment option, multiplied by the average account value over the period, multiplied by 184/365 to reflect the one-half year period.
FRANKLIN TEMPLETON VARIABLE INSURANCE PRODUCTS TRUST
Financial Highlights
Franklin Rising Dividends VIP Fund
| | | | | | | | | | | | | | | | | | | | |
| | | Year Ended December 31, | |
| | | 2015 | | | 2014 | | | 2013 | | | 2012 | | | 2011 | |
| Class 1 | | | | | | | | | | | | | | | | | | | | |
Per share operating performance
(for a share outstanding throughout the year) | | | | | | | | | | | | | | | | | | | | |
| | | | | |
Net asset value, beginning of year | | | $29.63 | | | | $28.14 | | | | $22.03 | | | | $20.01 | | | | $19.15 | |
| | | | |
| | | | | |
| Income from investment operationsa: | | | | | | | | | | | | | | | | | | | | |
| | | | | |
Net investment incomeb | | | 0.45 | | | | 0.45 | | | | 0.40 | | | | 0.41 | | | | 0.36 | |
| | | | | |
Net realized and unrealized gains (losses) | | | (1.33 | ) | | | 2.03 | | | | 6.16 | | | | 2.00 | | | | 0.83 | |
| | | | |
Total from investment operations | | | (0.88 | ) | | | 2.48 | | | | 6.56 | | | | 2.41 | | | | 1.19 | |
| | | | |
| | | | | |
| Less distributions from: | | | | | | | | | | | | | | | | | | | | |
| | | | | |
Net investment income | | | (0.48 | ) | | | (0.44 | ) | | | (0.45 | ) | | | (0.39 | ) | | | (0.33 | ) |
| | | | | |
Net realized gains | | | (3.01 | ) | | | (0.55 | ) | | | — | | | | — | | | | — | |
| | | | |
Total distributions | | | (3.49 | ) | | | (0.99 | ) | | | (0.45 | ) | | | (0.39 | ) | | | (0.33 | ) |
| | | | |
Net asset value, end of year | | | $25.26 | | | | $29.63 | | | | $28.14 | | | | $22.03 | | | | $20.01 | |
| | | | |
| | | | | |
Total returnc | | | (3.42)% | | | | 9.01% | | | | 30.05% | | | | 12.18% | | | | 6.29% | |
| | | | | |
| Ratios to average net assets | | | | | | | | | | | | | | | | | | | | |
| | | | | |
Expenses | | | 0.63% | d | | | 0.62% | d | | | 0.61% | | | | 0.63% | | | | 0.63% | |
| | | | | |
Net investment income | | | 1.65% | | | | 1.58% | | | | 1.59% | | | | 1.96% | | | | 1.87% | |
| | | | | |
| Supplemental data | | | | | | | | | | | | | | | | | | | | |
| | | | | |
Net assets, end of year (000’s) | | | $143,376 | | | | $160,480 | | | | $168,380 | | | | $141,455 | | | | $140,297 | |
| | | | | |
Portfolio turnover rate | | | 4.74% | | | | 8.61% | | | | 0.07% | | | | 11.19% | | | | 12.76% | |
aThe amount shown for a share outstanding throughout the period may not correlate with the Statement of Operations for the period due to the timing of sales and repurchases of the Fund’s shares in relation to income earned and/or fluctuating fair value of the investments of the Fund.
bBased on average daily shares outstanding.
cTotal return does not include fees, charges or expenses imposed by the variable annuity and life insurance contracts for which Franklin Templeton Variable Insurance Products Trust serves as an underlying investment vehicle.
dBenefit of waiver and payments by affiliates rounds to less than 0.01%.
| | | | |
| FRD-6 | | Annual Report | The accompanying notes are an integral part of these financial statements. | | |
FRANKLIN TEMPLETON VARIABLE INSURANCE PRODUCTS TRUST
FINANCIAL HIGHLIGHTS
Franklin Rising Dividends VIP Fund (continued)
| | | | | | | | | | | | | | | | | | | | |
| | | Year Ended December 31, | |
| | | 2015 | | | 2014 | | | 2013 | | | 2012 | | | 2011 | |
| Class 2 | | | | | | | | | | | | | | | | | | | | |
Per share operating performance
(for a share outstanding throughout the year) | | | | | | | | | | | | | | | | | | | | |
| | | | | |
Net asset value, beginning of year | | | $29.06 | | | | $27.62 | | | | $21.64 | | | | $19.65 | | | | $18.82 | |
| | | | |
| | | | | |
| Income from investment operationsa: | | | | | | | | | | | | | | | | | | | | |
| | | | | |
Net investment incomeb | | | 0.37 | | | | 0.37 | | | | 0.33 | | | | 0.35 | | | | 0.31 | |
| | | | | |
Net realized and unrealized gains (losses) | | | (1.29 | ) | | | 1.99 | | | | 6.04 | | | | 1.98 | | | | 0.81 | |
| | | | |
Total from investment operations | | | (0.92 | ) | | | 2.36 | | | | 6.37 | | | | 2.33 | | | | 1.12 | |
| | | | |
| | | | | |
| Less distributions from: | | | | | | | | | | | | | | | | | | | | |
| | | | | |
Net investment income | | | (0.41 | ) | | | (0.37 | ) | | | (0.39 | ) | | | (0.34 | ) | | | (0.29 | ) |
| | | | | |
Net realized gains | | | (3.01 | ) | | | (0.55 | ) | | | — | | | | — | | | | — | |
| | | | |
Total distributions | | | (3.42 | ) | | | (0.92 | ) | | | (0.39 | ) | | | (0.34 | ) | | | (0.29 | ) |
| | | | |
Net asset value, end of year | | | $24.72 | | | | $29.06 | | | | $27.62 | | | | $21.64 | | | | $19.65 | |
| | | | |
| | | | | |
Total returnc | | | (3.65)% | | | | 8.72% | | | | 29.69% | | | | 11.96% | | | | 6.00% | |
| | | | | |
| Ratios to average net assets | | | | | | | | | | | | | | | | | | | | |
| | | | | |
Expenses | | | 0.88% | d | | | 0.87% | d | | | 0.86% | | | | 0.88% | | | | 0.88% | |
| | | | | |
Net investment income | | | 1.40% | | | | 1.33% | | | | 1.34% | | | | 1.71% | | | | 1.62% | |
| | | | | |
| Supplemental data | | | | | | | | | | | | | | | | | | | | |
| | | | | |
Net assets, end of year (000’s) | | | $1,310,783 | | | | $1,667,816 | | | | $1,752,012 | | | | $1,550,084 | | | | $1,523,396 | |
| | | | | |
Portfolio turnover rate | | | 4.74% | | | | 8.61% | | | | 0.07% | | | | 11.19% | | | | 12.76% | |
aThe amount shown for a share outstanding throughout the period may not correlate with the Statement of Operations for the period due to the timing of sales and repurchases of the Fund’s shares in relation to income earned and/or fluctuating fair value of the investments of the Fund.
bBased on average daily shares outstanding.
cTotal return does not include fees, charges or expenses imposed by the variable annuity and life insurance contracts for which Franklin Templeton Variable Insurance Products Trust serves as an underlying investment vehicle.
dBenefit of waiver and payments by affiliates rounds to less than 0.01%.
| | | | | | |
| | | The accompanying notes are an integral part of these financial statements. | Annual Report | | | FRD-7 | |
FRANKLIN TEMPLETON VARIABLE INSURANCE PRODUCTS TRUST
FINANCIAL HIGHLIGHTS
Franklin Rising Dividends VIP Fund (continued)
| | | | | | | | | | | | | | | | | | | | |
| | | Year Ended December 31, | |
| | | 2015 | | | 2014 | | | 2013 | | | 2012 | | | 2011 | |
| Class 4 | | | | | | | | | | | | | | | | | | | | |
Per share operating performance
(for a share outstanding throughout the year) | | | | | | | | | | | | | | | | | | | | |
| | | | | |
Net asset value, beginning of year | | | $29.19 | | | | $27.76 | | | | $21.78 | | | | $19.83 | | | | $19.04 | |
| | | | |
| | | | | |
| Income from investment operationsa: | | | | | | | | | | | | | | | | | | | | |
| | | | | |
Net investment incomeb | | | 0.35 | | | | 0.35 | | | | 0.32 | | | | 0.35 | | | | 0.31 | |
| | | | | |
Net realized and unrealized gains (losses) | | | (1.31 | ) | | | 2.00 | | | | 6.07 | | | | 1.96 | | | | 0.80 | |
| | | | |
Total from investment operations | | | (0.96 | ) | | | 2.35 | | | | 6.39 | | | | 2.31 | | | | 1.11 | |
| | | | |
| | | | | |
| Less distributions from: | | | | | | | | | | | | | | | | | | | | |
| | | | | |
Net investment income | | | (0.41 | ) | | | (0.37 | ) | | | (0.41 | ) | | | (0.36 | ) | | | (0.32 | ) |
| | | | | |
Net realized gains | | | (3.01 | ) | | | (0.55 | ) | | | — | | | | — | | | | — | |
| | | | |
Total distributions | | | (3.42 | ) | | | (0.92 | ) | | | (0.41 | ) | | | (0.36 | ) | | | (0.32 | ) |
| | | | |
Net asset value, end of year | | | $24.81 | | | | $29.19 | | | | $27.76 | | | | $21.78 | | | | $19.83 | |
| | | | |
| | | | | |
Total returnc | | | (3.75)% | | | | 8.62% | | | | 29.57% | | | | 11.78% | | | | 5.89% | |
| | | | | |
| Ratios to average net assets | | | | | | | | | | | | | | | | | | | | |
| | | | | |
Expenses | | | 0.98% | d | | | 0.97% | d | | | 0.96% | | | | 0.98% | | | | 0.98% | |
| | | | | |
Net investment income | | | 1.30% | | | | 1.23% | | | | 1.24% | | | | 1.61% | | | | 1.52% | |
| | | | | |
| Supplemental data | | | | | | | | | | | | | | | | | | | | |
| | | | | |
Net assets, end of year (000’s) | | | $20,453 | | | | $15,503 | | | | $12,028 | | | | $6,432 | | | | $3,020 | |
| | | | | |
Portfolio turnover rate | | | 4.74% | | | | 8.61% | | | | 0.07% | | | | 11.19% | | | | 12.76% | |
aThe amount shown for a share outstanding throughout the period may not correlate with the Statement of Operations for the period due to the timing of sales and repurchases of the Fund’s shares in relation to income earned and/or fluctuating fair value of the investments of the Fund.
bBased on average daily shares outstanding.
cTotal return does not include fees, charges or expenses imposed by the variable annuity and life insurance contracts for which Franklin Templeton Variable Insurance Products Trust serves as an underlying investment vehicle.
dBenefit of waiver and payments by affiliates rounds to less than 0.01%.
| | | | |
| FRD-8 | | Annual Report | The accompanying notes are an integral part of these financial statements. | | |
FRANKLIN TEMPLETON VARIABLE INSURANCE PRODUCTS TRUST
Statement of Investments, December 31, 2015
| | | | | | | | | | |
Franklin Rising Dividends VIP Fund | |
| | | | | Shares | | | Value | |
| | Common Stocks 98.4% | | | | | | | | |
| | Aerospace & Defense 4.9% | | | | | | | | |
| | General Dynamics Corp. | | | 73,500 | | | $ | 10,095,960 | |
| | Honeywell International Inc. | | | 180,100 | | | | 18,652,957 | |
| | United Technologies Corp. | | | 455,111 | | | | 43,722,514 | |
| | | | | | | | | | |
| | | | | | | | | 72,471,431 | |
| | | | | | | | | | |
| | Automobiles & Components 2.7% | | | | | | | | |
| | Johnson Controls Inc. | | | 1,015,500 | | | | 40,102,095 | |
| | | | | | | | | | |
| | Commercial & Professional Services 3.7% | | | | | | | | |
| | ABM Industries Inc. | | | 779,288 | | | | 22,186,329 | |
| | Brady Corp., A | | | 331,579 | | | | 7,619,685 | |
| | Cintas Corp. | | | 194,675 | | | | 17,725,159 | |
| | Matthews International Corp., A | | �� | 139,942 | | | | 7,479,900 | |
| | | | | | | | | | |
| | | | | | | | | 55,011,073 | |
| | | | | | | | | | |
| | Consumer Durables & Apparel 2.8% | | | | | | | | |
| | Leggett & Platt Inc. | | | 332,800 | | | | 13,984,256 | |
| | NIKE Inc., B | | | 440,600 | | | | 27,537,500 | |
| | | | | | | | | | |
| | | | | | | | | 41,521,756 | |
| | | | | | | | | | |
| | Consumer Services 2.3% | | | | | | | | |
| | McDonald’s Corp. | | | 247,645 | | | | 29,256,780 | |
| | Yum! Brands Inc. | | | 55,400 | | | | 4,046,970 | |
| | | | | | | | | | |
| | | | | | | | | 33,303,750 | |
| | | | | | | | | | |
| | Diversified Financials 0.5% | | | | | | | | |
| | State Street Corp. | | | 110,500 | | | | 7,332,780 | |
| | | | | | | | | | |
| | Energy 7.5% | | | | | | | | |
| | Chevron Corp. | | | 308,800 | | | | 27,779,648 | |
| | EOG Resources Inc. | | | 33,600 | | | | 2,378,544 | |
| | Exxon Mobil Corp. | | | 358,500 | | | | 27,945,075 | |
| | Occidental Petroleum Corp. | | | 370,790 | | | | 25,069,112 | |
| | Schlumberger Ltd. | | | 398,000 | | | | 27,760,500 | |
| | | | | | | | | | |
| | | | | | | | | 110,932,879 | |
| | | | | | | | | | |
| | Food & Staples Retailing 4.4% | | | | | | | | |
| | CVS Health Corp. | | | 92,600 | | | | 9,053,502 | |
| | Wal-Mart Stores Inc. | | | 463,000 | | | | 28,381,900 | |
| | Walgreens Boots Alliance Inc. | | | 326,000 | | | | 27,760,530 | |
| | | | | | | | | | |
| | | | | | | | | 65,195,932 | |
| | | | | | | | | | |
| | Food, Beverage & Tobacco 6.4% | | | | | | | | |
| | Archer-Daniels-Midland Co. | | | 713,000 | | | | 26,152,840 | |
| | Bunge Ltd. | | | 272,400 | | | | 18,599,472 | |
| | McCormick & Co. Inc. | | | 208,900 | | | | 17,873,484 | |
| | PepsiCo Inc. | | | 314,600 | | | | 31,434,832 | |
| | | | | | | | | | |
| | | | | | | | | 94,060,628 | |
| | | | | | | | | | |
| | Health Care Equipment & Services 14.7% | | | | | | | | |
| | Abbott Laboratories | | | 641,800 | | | | 28,823,238 | |
| | Becton, Dickinson and Co. | | | 310,600 | | | | 47,860,354 | |
| | DENTSPLY International Inc. | | | 4,000 | | | | 243,400 | |
| | Medtronic PLC | | | 617,300 | | | | 47,482,716 | |
| | Stryker Corp. | | | 470,914 | | | | 43,766,747 | |
FRANKLIN TEMPLETON VARIABLE INSURANCE PRODUCTS TRUST
STATEMENT OF INVESTMENTS
Franklin Rising Dividends VIP Fund (continued)
| | | | | | | | | | |
| | | | | Shares | | | Value | |
| | Common Stocks (continued) | | | | | | | | |
| | Health Care Equipment & Services (continued) | | | | | | | | |
| | Teleflex Inc. | | | 69,633 | | | $ | 9,153,258 | |
| | West Pharmaceutical Services Inc. | | | 663,514 | | | | 39,956,813 | |
| | | | | | | | | | |
| | | | | | | | | 217,286,526 | |
| | | | | | | | | | |
| | Household & Personal Products 3.2% | | | | | | | | |
| | Colgate-Palmolive Co. | | | 191,000 | | | | 12,724,420 | |
| | The Procter & Gamble Co. | | | 424,500 | | | | 33,709,545 | |
| | | | | | | | | | |
| | | | | | | | | 46,433,965 | |
| | | | | | | | | | |
| | Industrial Conglomerates 4.9% | | | | | | | | |
| | Carlisle Cos. Inc. | | | 96,261 | | | | 8,537,388 | |
| | Roper Technologies Inc. | | | 333,043 | | | | 63,208,231 | |
| | | | | | | | | | |
| | | | | | | | | 71,745,619 | |
| | | | | | | | | | |
| | Insurance 5.8% | | | | | | | | |
| | Aflac Inc. | | | 276,200 | | | | 16,544,380 | |
| | Arthur J. Gallagher & Co. | | | 660,000 | | | | 27,020,400 | |
| | Erie Indemnity Co., A | | | 300,064 | | | | 28,698,121 | |
| | Old Republic International Corp. | | | 449,208 | | | | 8,368,745 | |
| | RLI Corp. | | | 71,800 | | | | 4,433,650 | |
| | | | | | | | | | |
| | | | | | | | | 85,065,296 | |
| | | | | | | | | | |
| | Machinery 8.1% | | | | | | | | |
| | Donaldson Co. Inc. | | | 350,068 | | | | 10,032,949 | |
| | Dover Corp. | | | 786,576 | | | | 48,224,975 | |
| | Hillenbrand Inc. | | | 888,300 | | | | 26,320,329 | |
| | Pentair PLC (United Kingdom) | | | 704,800 | | | | 34,908,744 | |
| | | | | | | | | | |
| | | | | | | | | 119,486,997 | |
| | | | | | | | | | |
| | Materials 12.0% | | | | | | | | |
| | Air Products and Chemicals Inc. | | | 370,900 | | | | 48,257,799 | |
| | Albemarle Corp. | | | 706,700 | | | | 39,582,267 | |
| | Bemis Co. Inc. | | | 147,499 | | | | 6,591,730 | |
| | Ecolab Inc. | | | 107,000 | | | | 12,238,660 | |
| | Nucor Corp. | | | 447,055 | | | | 18,016,317 | |
| | Praxair Inc. | | | 506,460 | | | | 51,861,504 | |
| | | | | | | | | | |
| | | | | | | | | 176,548,277 | |
| | | | | | | | | | |
| | Media 0.9% | | | | | | | | |
| | John Wiley & Sons Inc., A | | | 279,100 | | | | 12,567,873 | |
| | | | | | | | | | |
| | Pharmaceuticals, Biotechnology & Life Sciences 6.1% | | | | | | | | |
| | AbbVie Inc. | | | 300,800 | | | | 17,819,392 | |
| | Johnson & Johnson | | | 431,000 | | | | 44,272,320 | |
| | Perrigo Co. PLC | | | 36,500 | | | | 5,281,550 | |
| | Pfizer Inc. | | | 669,700 | | | | 21,617,916 | |
| | Roche Holding AG, ADR (Switzerland) | | | 25,000 | | | | 861,750 | |
| | | | | | | | | | |
| | | | | | | | | 89,852,928 | |
| | | | | | | | | | |
| | Retailing 1.5% | | | | | | | | |
| | The Gap Inc. | | | 345,800 | | | | 8,541,260 | |
| | Ross Stores Inc. | | | 58,000 | | | | 3,120,980 | |
| | Target Corp. | | | 100,800 | | | | 7,319,088 | |
FRANKLIN TEMPLETON VARIABLE INSURANCE PRODUCTS TRUST
STATEMENT OF INVESTMENTS
Franklin Rising Dividends VIP Fund (continued)
| | | | | | | | | | |
| | | | | Shares | | | Value | |
| | Common Stocks (continued) | | | | | | | | |
| | Retailing (continued) | | | | | | | | |
| | Tiffany & Co. | | | 39,600 | | | $ | 3,021,084 | |
| | | | | | | | | | |
| | | | | | | | | 22,002,412 | |
| | | | | | | | | | |
| | Semiconductors & Semiconductor Equipment 1.6% | | | | | | | | |
| | Linear Technology Corp. | | | 160,100 | | | | 6,799,447 | |
| | Texas Instruments Inc. | | | 315,800 | | | | 17,308,998 | |
| | | | | | | | | | |
| | | | | | | | | 24,108,445 | |
| | | | | | | | | | |
| | Software & Services 3.2% | | | | | | | | |
| | Accenture PLC, A | | | 158,500 | | | | 16,563,250 | |
| | Microsoft Corp. | | | 563,900 | | | | 31,285,172 | |
| | | | | | | | | | |
| | | | | | | | | 47,848,422 | |
| | | | | | | | | | |
| | Technology Hardware & Equipment 0.6% | | | | | | | | |
| a | | Knowles Corp. | | | 256,828 | | | | 3,423,517 | |
| | QUALCOMM Inc. | | | 114,500 | | | | 5,723,283 | |
| | | | | | | | | | |
| | | | | | | | | 9,146,800 | |
| | | | | | | | | | |
| | Trading Companies & Distributors 0.4% | | | | | | | | |
| | W.W. Grainger Inc. | | | 28,100 | | | | 5,692,779 | |
| | | | | | | | | | |
| | Transportation 0.2% | | | | | | | | |
| | United Parcel Service Inc., B | | | 28,500 | | | | 2,742,555 | |
| | | | | | | | | | |
| | | |
| | Total Common Stocks (Cost $890,175,544) | | | | | | | 1,450,461,218 | |
| | | | | | | | | | |
| | Short Term Investments (Cost $292,061) 0.0%† | | | | | | | | |
| | Money Market Funds 0.0%† | | | | | | | | |
| a,b | | Institutional Fiduciary Trust Money Market Portfolio | | | 292,061 | | | | 292,061 | |
| | | | | | | | | | |
| | Total Investments (Cost $890,467,605) 98.4% | | | | | | | 1,450,753,279 | |
| | Other Assets, less Liabilities 1.6% | | | | | | | 23,858,371 | |
| | | | | | | | | | |
| | Net Assets 100.0% | | | | | | $ | 1,474,611,650 | |
| | | | | | | | | | |
See Abbreviations on page FRD-20.
†Rounds to less than 0.1% of net assets.
aNon-income producing.
bSee Note 3(e) regarding investments in affiliated management investment companies.
| | | | | | |
| | | The accompanying notes are an integral part of these financial statements. | Annual Report | | | FRD-11 | |
FRANKLIN TEMPLETON VARIABLE INSURANCE PRODUCTS TRUST
Financial Statements
Statement of Assets and Liabilities
December 31, 2015
| | | | |
| | | Franklin Rising
Dividends VIP
Fund | |
Assets: | | | | |
Investments in securities: | | | | |
Cost - Unaffiliated issuers | | $ | 890,175,544 | |
Cost - Non-controlled affiliates (Note 3e) | | | 292,061 | |
| | | | |
Total cost of investments | | $ | 890,467,605 | |
| | | | |
Value - Unaffiliated issuers | | $ | 1,450,461,218 | |
Value - Non-controlled affiliates (Note 3e) | | | 292,061 | |
| | | | |
Total value of investments | | | 1,450,753,279 | |
Receivables: | | | | |
Investment securities sold | | | 22,864,325 | |
Capital shares sold | | | 148,479 | |
Dividends | | | 3,014,242 | |
Other assets | | | 141 | |
| | | | |
Total assets | | | 1,476,780,466 | |
| | | | |
Liabilities: | | | | |
Payables: | | | | |
Capital shares redeemed | | | 633,505 | |
Management fees | | | 799,653 | |
Distribution fees | | | 584,100 | |
Accrued expenses and other liabilities | | | 151,558 | |
| | | | |
Total liabilities | | | 2,168,816 | |
| | | | |
Net assets, at value | | $ | 1,474,611,650 | |
| | | | |
Net assets consist of: | | | | |
Paid-in capital | | $ | 690,361,854 | |
Undistributed net investment income | | | 23,857,334 | |
Net unrealized appreciation (depreciation) | | | 560,285,674 | |
Accumulated net realized gain (loss) | | | 200,106,788 | |
| | | | |
Net assets, at value | | $ | 1,474,611,650 | |
| | | | |
| |
| Class 1: | | | | |
Net assets, at value | | $ | 143,375,832 | |
| | | | |
Shares outstanding | | | 5,676,451 | |
| | | | |
Net asset value and maximum offering price per share | | $ | 25.26 | |
| | | | |
| |
| Class 2: | | | | |
Net assets, at value | | $ | 1,310,782,671 | |
| | | | |
Shares outstanding | | | 53,024,359 | |
| | | | |
Net asset value and maximum offering price per share | | $ | 24.72 | |
| | | | |
| |
| Class 4: | | | | |
Net assets, at value | | $ | 20,453,147 | |
| | | | |
Shares outstanding | | | 824,346 | |
| | | | |
Net asset value and maximum offering price per share | | $ | 24.81 | |
| | | | |
| | | | |
| FRD-12 | | Annual Report | The accompanying notes are an integral part of these financial statements. | | |
FRANKLIN TEMPLETON VARIABLE INSURANCE PRODUCTS TRUST
FINANCIAL STATEMENTS
Statement of Operations
for the year ended December 31, 2015
| | | | |
| | | Franklin Rising
Dividends VIP
Fund | |
Investment income: | | | | |
Dividends | | $ | 38,267,288 | |
| | | | |
Expenses: | | | | |
Management fees (Note 3a) | | | 10,302,075 | |
Distribution fees: (Note 3c) | | | | |
Class 2 | | | 3,784,885 | |
Class 4 | | | 66,302 | |
Custodian fees (Note 4) | | | 15,648 | |
Reports to shareholders | | | 135,269 | |
Professional fees | | | 82,365 | |
Trustees’ fees and expenses | | | 7,509 | |
Other | | | 27,890 | |
| | | | |
Total expenses | | | 14,421,943 | |
Expenses waived/paid by affiliates (Note 3e) | | | (20,550 | ) |
| | | | |
Net expenses | | | 14,401,393 | |
| | | | |
Net investment income | | | 23,865,895 | |
| | | | |
Realized and unrealized gains (losses): | | | | |
Net realized gain (loss) from: | | | | |
Investments | | | 200,233,026 | |
Foreign currency transactions | | | (1,710 | ) |
| | | | |
Net realized gain (loss) | | | 200,231,316 | |
| | | | |
Net change in unrealized appreciation (depreciation) on investments | | | (288,246,073 | ) |
| | | | |
Net realized and unrealized gain (loss) | | | (88,014,757 | ) |
| | | | |
Net increase (decrease) in net assets resulting from operations | | $ | (64,148,862 | ) |
| | | | |
| | | | | | |
| | | The accompanying notes are an integral part of these financial statements. | Annual Report | | | FRD-13 | |
FRANKLIN TEMPLETON VARIABLE INSURANCE PRODUCTS TRUST
FINANCIAL STATEMENTS
Statements of Changes in Net Assets
| | | | | | | | |
| | | Franklin Rising Dividends VIP Fund | |
| | | Year Ended December 31, | |
| | | 2015 | | | 2014 | |
Increase (decrease) in net assets: | | | | | | | | |
Operations: | | | | | | | | |
Net investment income | | $ | 23,865,895 | | | $ | 24,971,534 | |
Net realized gain (loss) | | | 200,231,316 | | | | 183,292,710 | |
Net change in unrealized appreciation (depreciation) | | | (288,246,073 | ) | | | (59,038,904 | ) |
| | | | |
Net increase (decrease) in net assets resulting from operations | | | (64,148,862 | ) | | | 149,225,340 | |
| | | | |
Distributions to shareholders from: | | | | | | | | |
Net investment income: | | | | | | | | |
Class 1 | | | (2,507,451 | ) | | | (2,478,710 | ) |
Class 2 | | | (22,189,853 | ) | | | (22,406,447 | ) |
Class 4 | | | (275,517 | ) | | | (165,391 | ) |
Net realized gains: | | | | | | | | |
Class 1 | | | (15,606,236 | ) | | | (3,072,165 | ) |
Class 2 | | | (164,222,373 | ) | | | (32,971,551 | ) |
Class 4 | | | (2,002,122 | ) | | | (247,432 | ) |
| | | | |
Total distributions to shareholders | | | (206,803,552 | ) | | | (61,341,696 | ) |
| | | | |
Capital share transactions: (Note 2) | | | | | | | | |
Class 1 | | | 6,114,953 | | | | (16,079,195 | ) |
Class 2 | | | (112,317,852 | ) | | | (163,125,563 | ) |
Class 4 | | | 7,967,834 | | | | 2,701,123 | |
| | | | |
Total capital share transactions | | | (98,235,065 | ) | | | (176,503,635 | ) |
| | | | |
Net increase (decrease) in net assets | | | (369,187,479 | ) | | | (88,619,991 | ) |
Net assets: | | | | | | | | |
Beginning of year | | | 1,843,799,129 | | | | 1,932,419,120 | |
| | | | |
End of year | | $ | 1,474,611,650 | | | $ | 1,843,799,129 | |
| | | | |
Undistributed net investment income included in net assets: | | | | | | | | |
End of year | | $ | 23,857,334 | | | $ | 24,965,968 | |
| | | | |
| | | | |
| FRD-14 | | Annual Report | The accompanying notes are an integral part of these financial statements. | | |
FRANKLIN TEMPLETON VARIABLE INSURANCE PRODUCTS TRUST
Notes to Financial Statements
Franklin Rising Dividends VIP Fund
1. Organization and Significant Accounting Policies
Franklin Templeton Variable Insurance Products Trust (Trust) is registered under the Investment Company Act of 1940 (1940 Act) as an open-end management investment company, consisting of nineteen separate funds and applies the specialized accounting and reporting guidance in U.S. Generally Accepted Accounting Principles (U.S. GAAP). Franklin Rising Dividends VIP Fund (Fund) is included in this report. The financial statements of the remaining funds in the Trust are presented separately. Shares of the Fund are generally sold only to insurance company separate accounts to fund the benefits of variable life insurance policies or variable annuity contracts. The Fund offers three classes of shares: Class 1, Class 2 and Class 4. Each class of shares differs by its distribution fees, voting rights on matters affecting a single class and its exchange privilege.
The following summarizes the Fund’s significant accounting policies.
a. Financial Instrument Valuation
The Fund’s investments in financial instruments are carried at fair value daily. Fair value is the price that would be received to sell an asset or paid to transfer a liability in an orderly transaction between market participants on the measurement date. The Fund calculates the net asset value (NAV) per share as of 4 p.m. Eastern time each day the New York Stock Exchange (NYSE) is open for trading. Under compliance policies and procedures approved by the Trust’s Board of Trustees (the Board), the Fund’s administrator has responsibility for oversight of valuation, including leading the cross-functional Valuation and Liquidity Oversight Committee (VLOC). The VLOC provides administration and oversight of the Fund’s valuation policies and procedures, which are approved annually by the Board. Among other things, these procedures allow the Fund to utilize independent pricing services, quotations from securities and financial instrument dealers, and other market sources to determine fair value.
Equity securities listed on an exchange or on the NASDAQ National Market System are valued at the last quoted sale price or the official closing price of the day, respectively. Foreign equity securities are valued as of the close of trading on the foreign stock exchange on which the security is primarily traded or as of 4 p.m. Eastern time whichever is earlier. The value is then converted into its U.S. dollar equivalent at the foreign exchange rate in effect at 4 p.m. Eastern time on the day that the value of
the security is determined. Over-the-counter (OTC) securities are valued within the range of the most recent quoted bid and ask prices. Securities that trade in multiple markets or on multiple exchanges are valued according to the broadest and most representative market. Certain equity securities are valued based upon fundamental characteristics or relationships to similar securities.
Investments in open-end mutual funds are valued at the closing NAV.
The Fund has procedures to determine the fair value of financial instruments for which market prices are not reliable or readily available. Under these procedures, the VLOC convenes on a regular basis to review such financial instruments and considers a number of factors, including significant unobservable valuation inputs, when arriving at fair value. The VLOC primarily employs a market-based approach which may use related or comparable assets or liabilities, recent transactions, market multiples, book values, and other relevant information for the investment to determine the fair value of the investment. An income-based valuation approach may also be used in which the anticipated future cash flows of the investment are discounted to calculate fair value. Discounts may also be applied due to the nature or duration of any restrictions on the disposition of the investments. Due to the inherent uncertainty of valuations of such investments, the fair values may differ significantly from the values that would have been used had an active market existed. The VLOC employs various methods for calibrating these valuation approaches including a regular review of key inputs and assumptions, transactional back-testing or disposition analysis, and reviews of any related market activity.
Trading in securities on foreign securities stock exchanges and OTC markets may be completed before 4 p.m. Eastern time. In addition, trading in certain foreign markets may not take place on every NYSE business day. Occasionally, events occur between the time at which trading in a foreign security is completed and the close of the NYSE that might call into question the reliability of the value of a portfolio security held by the Fund. As a result, differences may arise between the value of the Fund’s portfolio securities as determined at the foreign market close and the latest indications of value at the close of the NYSE. In order to minimize the potential for these differences, the VLOC monitors price movements following the close of trading in foreign stock markets through a series of country specific market proxies (such as baskets of American
FRANKLIN TEMPLETON VARIABLE INSURANCE PRODUCTS TRUST
NOTES TO FINANCIAL STATEMENTS
Franklin Rising Dividends VIP Fund (continued)
1. Organization and Significant Accounting Policies (continued)
a. Financial Instrument Valuation (continued)
Depositary Receipts, futures contracts and exchange traded funds). These price movements are measured against established trigger thresholds for each specific market proxy to assist in determining if an event has occurred that may call into question the reliability of the values of the foreign securities held by the Fund. If such an event occurs, the securities may be valued using fair value procedures, which may include the use of independent pricing services.
When the last day of the reporting period is a non-business day, certain foreign markets may be open on those days that the NYSE is closed, which could result in differences between the value of the Fund’s portfolio securities on the last business day and the last calendar day of the reporting period. Any significant security valuation changes due to an open foreign market are adjusted and reflected by the Fund for financial reporting purposes.
b. Foreign Currency Translation
Portfolio securities and other assets and liabilities denominated in foreign currencies are translated into U.S. dollars based on the exchange rate of such currencies against U.S. dollars on the date of valuation. The Fund may enter into foreign currency exchange contracts to facilitate transactions denominated in a foreign currency. Purchases and sales of securities, income and expense items denominated in foreign currencies are translated into U.S. dollars at the exchange rate in effect on the transaction date. Portfolio securities and assets and liabilities denominated in foreign currencies contain risks that those currencies will decline in value relative to the U.S. dollar. Occasionally, events may impact the availability or reliability of foreign exchange rates used to convert the U.S. dollar equivalent value. If such an event occurs, the foreign exchange rate will be valued at fair value using procedures established and approved by the Board.
The Fund does not separately report the effect of changes in foreign exchange rates from changes in market prices on securities held. Such changes are included in net realized and unrealized gain or loss from investments in the Statement of Operations.
Realized foreign exchange gains or losses arise from sales of foreign currencies, currency gains or losses realized between the
trade and settlement dates on securities transactions and the difference between the recorded amounts of dividends, interest, and foreign withholding taxes and the U.S. dollar equivalent of the amounts actually received or paid. Net unrealized foreign exchange gains and losses arise from changes in foreign exchange rates on foreign denominated assets and liabilities other than investments in securities held at the end of the reporting period.
c. Income and Deferred Taxes
It is the Fund’s policy to qualify as a regulated investment company under the Internal Revenue Code. The Fund intends to distribute to shareholders substantially all of its taxable income and net realized gains to relieve it from federal income and if applicable, excise taxes. As a result, no provision for U.S. federal income taxes is required.
The Fund may be subject to foreign taxation related to income received, capital gains on the sale of securities and certain foreign currency transactions in the foreign jurisdictions in which it invests. Foreign taxes, if any, are recorded based on the tax regulations and rates that exist in the foreign markets in which the Fund invests. When a capital gain tax is determined to apply, the Fund records an estimated deferred tax liability in an amount that would be payable if the securities were disposed of on the valuation date.
The Fund may recognize an income tax liability related to its uncertain tax positions under U.S. GAAP when the uncertain tax position has a less than 50% probability that it will be sustained upon examination by the tax authorities based on its technical merits. As of December 31, 2015, the Fund has determined that no tax liability is required in its financial statements related to uncertain tax positions for any open tax years (or expected to be taken on future tax returns). Open tax years are those that remain subject to examination and are based on each tax jurisdiction’s statute of limitation.
d. Security Transactions, Investment Income, Expenses and Distributions
Security transactions are accounted for on trade date. Realized gains and losses on security transactions are determined on a specific identification basis. Estimated expenses are accrued daily. Dividend income is recorded on the ex-dividend date except for certain dividends from foreign securities where the dividend rate is not available. In such cases, the dividend is
FRANKLIN TEMPLETON VARIABLE INSURANCE PRODUCTS TRUST
NOTES TO FINANCIAL STATEMENTS
Franklin Rising Dividends VIP Fund (continued)
recorded as soon as the information is received by the Fund. Distributions to shareholders are recorded on the ex-dividend date and are determined according to income tax regulations (tax basis). Distributable earnings determined on a tax basis may differ from earnings recorded in accordance with U.S. GAAP. These differences may be permanent or temporary. Permanent differences are reclassified among capital accounts to reflect their tax character. These reclassifications have no impact on net assets or the results of operations. Temporary differences are not reclassified, as they may reverse in subsequent periods.
Common expenses incurred by the Trust are allocated among the Funds based on the ratio of net assets of each Fund to the combined net assets of the Trust. Fund specific expenses are charged directly to the fund that incurred the expense.
Realized and unrealized gains and losses and net investment income, not including class specific expenses, are allocated daily to each class of shares based upon the relative proportion of net assets of each class. Differences in per share distributions, by class, are generally due to differences in class specific expenses.
e. Accounting Estimates
The preparation of financial statements in accordance with U.S. GAAP requires management to make estimates and assumptions that affect the reported amounts of assets and liabilities at the date of the financial statements and the amounts of income and expenses during the reporting period. Actual results could differ from those estimates.
f. Guarantees and Indemnifications
Under the Trust’s organizational documents, its officers and trustees are indemnified by the Trust against certain liabilities arising out of the performance of their duties to the Trust. Additionally, in the normal course of business, the Trust, on behalf of the Fund, enters into contracts with service providers that contain general indemnification clauses. The Trust’s maximum exposure under these arrangements is unknown as this would involve future claims that may be made against the Trust that have not yet occurred. Currently, the Trust expects the risk of loss to be remote.
2. Shares of Beneficial Interest
At December 31, 2015, there were an unlimited number of shares authorized (without par value). Transactions in the Fund’s shares were as follows:
| | | | | | | | | | | | | | | | | | |
| | | Year Ended December 31, | |
| | | 2015 | | | | | 2014 | |
| | | Shares | | | Amount | | | | | Shares | | | Amount | |
| | | | | |
| Class 1 Shares: | | | | | | | | | | | | | | | | | | |
Shares sold | | | 379,085 | | | $ | 9,885,431 | | | | | | 159,314 | | | $ | 4,468,085 | |
Shares issued in reinvestment of distributions | | | 689,257 | | | | 18,113,687 | | | | | | 197,681 | | | | 5,550,875 | |
Shares redeemed | | | (808,697 | ) | | | (21,884,165 | ) | | | | | (923,627 | ) | | | (26,098,155 | ) |
| | | | |
Net increase (decrease) | | | 259,645 | | | $ | 6,114,953 | | | | | | (566,632 | ) | | $ | (16,079,195 | ) |
| | | | |
| Class 2 Shares: | | | | | | | | | | | | | | | | | | |
Shares sold | | | 4,959,597 | | | $ | 130,929,237 | | | | | | 5,801,510 | | | $ | 162,781,330 | |
Shares issued in reinvestment of distributions | | | 7,239,310 | | | | 186,412,226 | | | | | | 2,007,904 | | | | 55,377,998 | |
Shares redeemed | | | (16,563,559 | ) | | | (429,659,315 | ) | | | | | (13,846,241 | ) | | | (381,284,891 | ) |
| | | | |
Net increase (decrease) | | | (4,364,652 | ) | | $ | (112,317,852 | ) | | | | | (6,036,827 | ) | | $ | (163,125,563 | ) |
| | | | |
| Class 4 Shares: | | | | | | | | | | | | | | | | | | |
Shares sold | | | 322,291 | | | $ | 8,758,972 | | | | | | 178,786 | | | $ | 4,991,418 | |
Shares issued in reinvestment of distributions | | | 88,076 | | | | 2,277,639 | | | | | | 14,893 | | | | 412,823 | |
Shares redeemed | | | (117,097 | ) | | | (3,068,777 | ) | | | | | (95,832 | ) | | | (2,703,118 | ) |
| | | | |
Net increase (decrease) | | | 293,270 | | | $ | 7,967,834 | | | | | | 97,847 | | | $ | 2,701,123 | |
| | | | |
FRANKLIN TEMPLETON VARIABLE INSURANCE PRODUCTS TRUST
NOTES TO FINANCIAL STATEMENTS
Franklin Rising Dividends VIP Fund (continued)
3. Transactions With Affiliates
Franklin Resources, Inc. is the holding company for various subsidiaries that together are referred to as Franklin Templeton Investments. Certain officers and trustees of the Fund are also officers and/or directors of the following subsidiaries:
| | |
| Subsidiary | | Affiliation |
Franklin Advisory Services, LLC (Advisory Services) | | Investment manager |
Franklin Templeton Services, LLC (FT Services) | | Administrative manager |
Franklin Templeton Distributors, Inc. (Distributors) | | Principal underwriter |
Franklin Templeton Investor Services, LLC (Investor Services) | | Transfer agent |
a. Management Fees
The Fund pays an investment management fee to Advisory Services based on the average daily net assets of the Fund as follows:
| | |
| Annualized Fee Rate | | Net Assets |
0.750% | | Up to and including $500 million |
0.625% | | Over $500 million, up to and including $1 billion |
0.500% | | In excess of $1 billion |
b. Administrative Fees
Under an agreement with Advisory Services, FT Services provides administrative services to the Fund. The fee is paid by Advisory Services based on the Fund’s average daily net assets, and is not an additional expense of the Fund.
c. Distribution Fees
The Board has adopted distribution plans for Class 2 and Class 4 shares pursuant to Rule 12b-1 under the 1940 Act. Under the Fund’s compensation distribution plans, the Fund pays Distributors for costs incurred in connection with the servicing, sale and distribution of the Fund’s shares up to 0.35% per year of its average daily net assets of each class. The Board has agreed to limit the current rate to 0.25% per year for Class 2. The plan year, for purposes of monitoring compliance with the maximum annual plan rates, is February 1 through January 31.
d. Transfer Agent Fees
Investor Services, under terms of an agreement, performs shareholder servicing for the Fund and is not paid by the Fund for the services.
e. Investments in Affiliated Management Investment Companies
The Fund invests in an affiliated management Investment Company for purposes other than exercising a controlling influence over the management or policies. Management fees paid by the Fund are waived on assets invested in the affiliated management investment company, as noted in the Statement of Operations, in an amount not to exceed the management and administrative fees paid directly or indirectly by each affiliate. Prior to January 1, 2014, the waiver was accounted for as a reduction to management fees.
| | | | | | | | | | | | | | | | | | | | | | | | | | | | | | | | |
| | | Number
of Shares
Held at
Beginning
of Year | | | Gross
Additions | | | Gross
Reductions | | | Number
of Shares
Held at
End of
Year | | | Value at
End of
Year | | | Investment
Income | | | Realized
Gain
(Loss) | | | % of
Affiliated
Fund Shares
Outstanding
Held at End
of Year | |
| Non-Controlled Affiliates | | | | | | | | | | | | | | | | | | | | | | | | | | | | | | | | |
Institutional Fiduciary Trust Money Market Portfolio | | | 20,601,446 | | | | 225,079,000 | | | | (245,388,385 | ) | | | 292,061 | | | $ | 292,061 | | | $ | — | | | $ | — | | | | — | a |
| | | | | | | | | | | | | | | | | | | | | | | | |
aRounds to less than 0.01%.
FRANKLIN TEMPLETON VARIABLE INSURANCE PRODUCTS TRUST
NOTES TO FINANCIAL STATEMENTS
Franklin Rising Dividends VIP Fund (continued)
4. Expense Offset Arrangement
The Fund has entered into an arrangement with its custodian whereby credits realized as a result of uninvested cash balances are used to reduce a portion of the Fund’s custodian expenses. During the year ended December 31, 2015, there were no credits earned.
5. Income Taxes
The tax character of distributions paid during the years ended December 31, 2015 and 2014, was as follows:
| | | | | | | | |
| | | 2015 | | | 2014 | |
Distributions paid from: | | | | | | | | |
Ordinary income | | $ | 25,129,889 | | | $ | 25,050,548 | |
Long term capital gain | | | 181,673,663 | | | | 36,291,148 | |
| | | | |
| | $ | 206,803,552 | | | $ | 61,341,696 | |
| | | | |
At December 31, 2015, the cost of investments, net unrealized appreciation (depreciation), undistributed ordinary income and undistributed long term capital gains for income tax purposes were as follows:
| | | | |
Cost of investments | | $
|
890,552,512 |
|
| | | | |
Unrealized appreciation | | $ | 595,110,088 | |
Unrealized depreciation | | | (34,909,321 | ) |
| | | | |
Net unrealized appreciation (depreciation) | | $ | 560,200,767 | |
| | | | |
Undistributed ordinary income | | $ | 23,882,905 | |
Undistributed long term capital gains | | | 200,166,123 | |
| | | | |
Distributable earnings | | $ | 224,049,028 | |
| | | | |
Differences between income and/or capital gains as determined on a book basis and a tax basis are primarily due to differing treatment of wash sales.
6. Investment Transactions
Purchases and sales of investments (excluding short term securities) for the year ended December 31, 2015, aggregated $78,469,295 and $354,608,526, respectively.
7. Credit Facility
The Fund, together with other U.S. registered and foreign investment funds (collectively, Borrowers), managed by Franklin Templeton Investments, are borrowers in a joint syndicated senior unsecured credit facility totaling $2 billion (Global Credit Facility) which matured on February 12, 2016. This Global Credit Facility provides a source of funds to the Borrowers for temporary and emergency purposes, including the ability to meet future unanticipated or unusually large redemption requests. Effective February 12, 2016, the Borrowers renewed the Global Credit Facility for a one year term, maturing February 10, 2017, for a total of $2 billion.
Under the terms of the Global Credit Facility, the Fund shall, in addition to interest charged on any borrowings made by the Fund and other costs incurred by the Fund, pay its share of fees and expenses incurred in connection with the implementation and maintenance of the Global Credit Facility, based upon its relative share of the aggregate net assets of all of the Borrowers, including an annual commitment fee of 0.07% based upon the unused portion of the Global Credit Facility. Effective February 12, 2016, the annual commitment fee is 0.15%. These fees are reflected in other expenses in the Statement of Operations. During the year ended December 31, 2015, the Fund did not use the Global Credit Facility.
FRANKLIN TEMPLETON VARIABLE INSURANCE PRODUCTS TRUST
NOTES TO FINANCIAL STATEMENTS
Franklin Rising Dividends VIP Fund (continued)
8. Fair Value Measurements
The Fund follows a fair value hierarchy that distinguishes between market data obtained from independent sources (observable inputs) and the Fund’s own market assumptions (unobservable inputs). These inputs are used in determining the value of the Fund’s financial instruments and are summarized in the following fair value hierarchy:
| | • | | Level 1 – quoted prices in active markets for identical financial instruments |
| | • | | Level 2 – other significant observable inputs (including quoted prices for similar financial instruments, interest rates, prepayment speed, credit risk, etc.) |
| | • | | Level 3 – significant unobservable inputs (including the Fund’s own assumptions in determining the fair value of financial instruments) |
The input levels are not necessarily an indication of the risk or liquidity associated with financial instruments at that level.
For movements between the levels within the fair value hierarchy, the Fund has adopted a policy of recognizing the transfers as of the date of the underlying event which caused the movement.
At December 31, 2015, all of the Fund’s investments in financial instruments carried at fair value were valued using Level 1 inputs. For detailed categories, see the accompanying Statement of Investments.
9. Subsequent Events
The Fund has evaluated subsequent events through the issuance of the financial statements and determined that no events have occurred other than those already disclosed in the financial statements that require disclosure.
Abbreviations
| | |
| Selected Portfolio |
| |
| ADR | | American Depositary Receipt |
FRANKLIN TEMPLETON VARIABLE INSURANCE PRODUCTS TRUST
Report of Independent Registered Public Accounting Firm
Franklin Rising Dividends VIP Fund
To the Board of Trustees and Shareholders of Franklin Templeton Variable Insurance Products Trust
In our opinion, the accompanying statement of assets and liabilities, including the statement of investments, and the related statements of operations and of changes in net assets and the financial highlights present fairly, in all material respects, the financial position of Franklin Rising Dividends VIP Fund (the “Fund”) at December 31, 2015, the results of its operations for the year then ended, the changes in its net assets for each of the two years in the period then ended and the financial highlights for each of the periods presented, in conformity with accounting principles generally accepted in the United States of America. These financial statements and financial highlights (hereafter referred to as “financial statements”) are the responsibility of the Fund’s management. Our responsibility is to express an opinion on these financial statements based on our audit. We conducted our audit of these financial statements in accordance with the standards of the Public Company Accounting Oversight Board (United States). Those standards require that we plan and perform the audit to obtain reasonable assurance about whether the financial statements are free of material misstatement. An audit includes examining, on a test basis, evidence supporting the amounts and disclosures in the financial statements, assessing the accounting principles used and significant estimates made by management, and evaluating the overall financial statement presentation. We believe that our audit, which included confirmation of securities at December 31, 2015 by correspondence with the custodian, transfer agent and brokers, provides a reasonable basis for our opinion.
PricewaterhouseCoopers LLP
San Francisco, California
February 16, 2016
FRANKLIN TEMPLETON VARIABLE INSURANCE PRODUCTS TRUST
Tax Information (unaudited)
Franklin Rising Dividends VIP Fund
Under Section 852(b)(3)(C) of the Internal Revenue Code (Code), the Fund hereby reports the maximum amount allowable but no less than $181,673,663 as a long term capital gain dividend for the fiscal year ended December 31, 2015.
Under Section 854(b)(1)(A) of the Code, the Fund hereby reports 100% of the ordinary income dividends as income qualifying for the dividends received deduction for the fiscal year ended December 31, 2015.
Franklin Small Cap Value VIP Fund
This annual report for Franklin Small Cap Value VIP Fund covers the fiscal year ended December 31, 2015.
Class 4 Performance Summary as of December 31, 2015
Average annual total return of Class 4 shares* represents the average annual change in value, assuming reinvestment of dividends and capital gains. Average returns smooth out variations in returns, which can be significant; they are not the same as year-by-year results.
| | | | | | | | | | | | |
| Periods ended 12/31/15 | | 1-Year | | | 5-Year | | | 10-Year | |
Average Annual Total Return | | | -7.52% | | | | +7.54% | | | | +6.21% | |
*For the period beginning 2/29/08, Class 4 performance reflects a 12b-1 fee expense of 0.35% per year, which affects future performance. Class 4 performance prior to 2/29/08 reflects historical Class 1 performance, which does not have a 12b-1 fee expense. Since 2/29/08 (effective date), the average annual total return of Class 4 shares was +6.88%. The Fund has a fee waiver associated with any investment in a Franklin Templeton money fund, contractually guaranteed through at least its current fiscal year-end. Fund investment results reflect the fee waiver, to the extent applicable; without this reduction, the results would have been lower.
Performance reflects the Fund’s Class 4 operating expenses, but does not include any contract fees, expenses or sales charges. If they had been included, performance would be lower. These charges and deductions, particularly for variable life policies, can have a significant effect on contract values and insurance benefits. See the contract prospectus for a complete description of these expenses, including sales charges.
Performance data represent past performance, which does not guarantee future results. Investment return and principal value will fluctuate, and you may have a gain or loss when you sell your shares. Current performance may differ from figures shown.
Total Return Index Comparison for a Hypothetical $10,000 Investment (1/1/06–12/31/15)
The graph below shows the change in value of a hypothetical $10,000 investment in the Fund over the indicated period and includes reinvestment of any income or distributions. The Fund’s performance* is compared to the performance of the Russell 2500™ Value Index. One cannot invest directly in an index, and an index is not representative of the Fund’s portfolio. Please see Important Notes to Performance Information preceding the Fund Summaries.
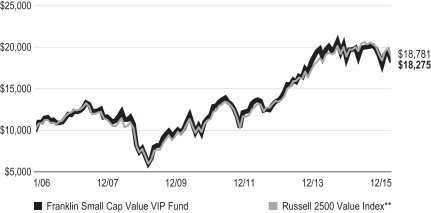
**Source: Morningstar. Please see Index Descriptions following the Fund Summaries.
FRANKLIN SMALL CAP VALUE VIP FUND
Fund Goal and Main Investments
The Fund seeks long-term total return. Under normal market conditions, the Fund invests at least 80% of its net assets in investments of small capitalization companies. For this Fund, small capitalization companies are those with market capitalizations under $3.5 billion at the time of purchase. The Fund generally invests in equity securities of companies that the manager believes are undervalued and have the potential for capital appreciation.
Fund Risks
All investments involve risks, including possible loss of principal. The Fund’s investments in smaller company stocks carry special risks as such stocks have historically exhibited greater price volatility than large-company stocks, particularly over the short term. Additionally, smaller companies often have relatively small revenues, limited product lines and a small market share. In addition, the Fund may invest up to 25% of its total assets in foreign securities, which involve special risks, including currency fluctuations and economic and political uncertainty. The Fund is actively managed but there is no guarantee that the manager’s investment decisions will produce the desired results. The Fund’s prospectus also includes a description of the main investment risks.
Performance Overview
You can find the Fund’s one-year total return in the Performance Summary. For comparison, the Fund’s benchmark, the Russell 2500TM Value Index, had a -5.49% total return for the same period.1 Please note the Fund employs a bottom-up stock selection process, and the managers invest in securities without regard to benchmark comparisons.
Economic and Market Overview
The U.S. economy grew moderately during the 12 months under review amid healthy consumer spending. After starting 2015 with modest growth, the economy strengthened in the second quarter but moderated in the third and fourth quarters as exports slowed and state and local governments reduced their spending. Manufacturing activities expanded for most of the period but contracted toward period-end. Non-manufacturing activities, however, expanded throughout the 12-month period, contributing to new jobs and helping drive down the unemployment rate to 5.0% from October through period-end,
the lowest level in more than seven years.2 The housing market improved at period-end as existing and new home sales increased and home prices rose despite slightly higher mortgage rates. Retail sales grew modestly, led by automobile and auto component sales. Annual inflation, as measured by the Consumer Price Index, remained subdued largely due to low energy prices.
After maintaining its target interest rate at a range of 0%–0.25% for seven years to support the U.S. economy’s recovery, the Federal Reserve (Fed) raised its target range for the federal funds rate to 0.25%–0.50% at its December meeting. Policymakers cited the labor market’s considerable improvement and were reasonably confident that inflation would move back to the Fed’s 2.0% medium-term objective. The Fed indicated that its process of normalizing interest rates would be data dependent and would likely be gradual. Furthermore, the Fed raised its 2016 U.S. economic growth forecast and lowered its unemployment rate projection.
U.S. stock markets experienced sell-offs at times during the year, resulting from investor concerns about the timing of the Fed’s interest rate increases, slower global economic growth, geopolitical tensions in certain regions and a plunge in crude oil prices. Investors generally remained confident, however, as the Fed maintained an accommodative monetary policy stance despite the rate increase, the eurozone economy improved and China implemented more stimulus measures to support its economy. Despite periods of volatility, the broad U.S. stock market, as measured by the Standard & Poor’s® 500 Index, generated a modest positive total return for 2015.3 The energy and materials sectors were among the worst performers, while consumer discretionary, health care, consumer staples and information technology outperformed.
Investment Strategy
We generally invest in stocks that we believe are undervalued and have the potential for capital appreciation. We consider a stock price a “value” when it trades at less than the price at which we believe it would trade if the market reflected all factors relating to the company’s worth. Accordingly, we invest in companies that we believe have, for example, stock prices that are low relative to current or historical or future earnings, book value, cash flow or sales; recent sharp price declines but the potential for good long-term earnings prospects; and valuable
1. Source: Morningstar.
One cannot invest directly in an index, and an index is not representative of the Fund’s portfolio. Please see Index Descriptions following the Fund Summaries.
2. Source: Bureau of Labor Statistics.
3. Please see Index Descriptions following the Fund Summaries.
FRANKLIN SMALL CAP VALUE VIP FUND
intangibles not reflected in the stock price. Companies in which we may invest include those that may be considered out of favor, such as companies attempting to recover from bankruptcy, business setbacks, adverse events or cyclical downturns, or that may be considered potential takeover targets.
Manager’s Discussion
During the reporting period, contributors to absolute Fund performance included StanCorp Financial Group, The Pep Boys – Manny, Moe & Jack and Gerresheimer. StanCorp Financial Group, an insurance provider and asset manager, received a cash takeover offer from Meiji Yasuda Life Insurance at a premium. The Pep Boys, an automobile sales and services provider, received cash takeover offers from Bridgestone and investor, Carl Icahn, which helped increase the company’s share price. We liquidated the position by the end of the period. Gerresheimer, a health-care-focused glass and plastics products manufacturer, benefited from strategic moves intended to improve the company’s long-term return profile. Specifically, the company sold its low-margin glass tubing business and acquired Centor, a leading, high-margin, U.S.-based manufacturer of plastic vials.
Detractors from absolute Fund performance included Axiall, Unit Corp. and The Men’s Wearhouse. Axiall, a chemical and building products manufacturer, was negatively affected by weaker-than expected end-market pricing due to industry-wide chlor-alkali capacity expansions and still relatively weak demand. The company replaced its chief executive officer and is implementing cost-cutting measures to offset weakness while simultaneously exploring alternatives for its building products business. Shares of Unit Corp., an onshore provider of drilling rigs, experienced a negative impact from a sharp drop in oil prices that began in mid-2014, resulting in lower demand for its equipment. The Men’s Wearhouse, a men’s clothing retailer, reported weaker-than-expected results from its recently acquired Jos. A. Bank business, as a change to a less promotional-driven model disrupted sales. We exited the position during the period.
During the period, we initiated several positions including LTC Properties, a real estate investment trust; The Laclede Group, a natural gas service provider; IDACORP, an energy operator and provider; Crocs, a footwear designer; and BRP Inc., a manufacturer of personal watercraft and all-terrain vehicles; among others. We also added to existing holdings including Everbank Financial, a provider of commercial and retail banking services; Drew Industries, a manufacturer and supplier of home and recreational vehicle components; and the aforementioned Gerresheimer; among others.
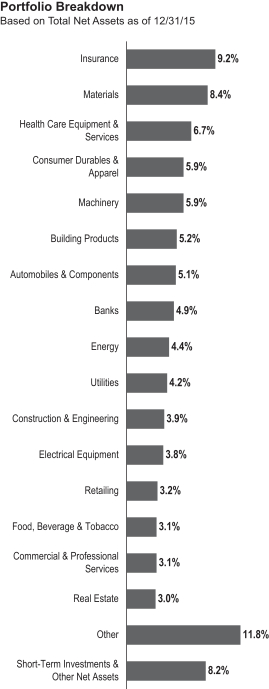
FRANKLIN SMALL CAP VALUE VIP FUND
We eliminated several positions including Group 1 Automotive, Cabot., Apogee Enterprises, Lincoln Electric Holdings and Rowan Companies, among others. We reduced our positions in StanCorp Financial, Thor Industries and RPM International, among others.
Thank you for your participation in Franklin Small Cap Value VIP Fund. We look forward to serving your future investment needs.
The foregoing information reflects our analysis, opinions and portfolio holdings as of December 31, 2015, the end of the reporting period. The way we implement our main investment strategies and the resulting portfolio holdings may change depending on factors such as market and economic conditions. These opinions may not be relied upon as investment advice or an offer for a particular security. The information is not a complete analysis of every aspect of any market, country, industry, security or the Fund. Statements of fact are from sources considered reliable, but the investment manager makes no representation or warranty as to their completeness or accuracy. Although historical performance is no guarantee of future results, these insights may help you understand our investment management philosophy.
| | | | |
| Top 10 Holdings | | | |
| 12/31/15 | | | |
Company
Sector/Industry | | % of Total
Net Assets | |
AAR Corp.
Aerospace & Defense | | | 2.6% | |
Maple Leaf Foods Inc. (Canada) Food, Beverage & Tobacco | | | 2.6% | |
LTC Properties Inc. Real Estate | | | 2.5% | |
STERIS PLC Health Care Equipment & Services | | | 2.5% | |
The Laclede Group Inc. Utilities | | | 2.2% | |
Teleflex Inc. Health Care Equipment & Services | | | 2.2% | |
Carlisle Cos. Inc. Industrial Conglomerates | | | 2.2% | |
Universal Forest Products Inc. Building Products | | | 2.2% | |
Gerresheimer AG (Germany) Pharmaceuticals, Biotechnology & Life Sciences | | | 2.1% | |
Aspen Insurance Holdings Ltd. Insurance | | | 2.1% | |
The dollar value, number of shares or principal amount, and names of all portfolio holdings are listed in the Fund’s Statement of Investments.
FRANKLIN SMALL CAP VALUE VIP FUND
Class 4 Fund Expenses
As an investor in a variable insurance contract (Contract) that indirectly provides for investment in an underlying mutual fund, you can incur transaction and/or ongoing expenses at both the Fund level and the Contract level.
| • | | Transaction expenses can include sales charges (loads) on purchases, redemption fees, surrender fees, transfer fees and premium taxes. |
| • | | Ongoing expenses can include management fees, distribution and service (12b-1) fees, contract fees, annual maintenance fees, mortality and expense risk fees and other fees and expenses. All mutual funds and Contracts have some types of ongoing expenses. |
The expenses shown in the table are meant to highlight ongoing expenses at the Fund level only and do not include ongoing expenses at the Contract level, or transaction expenses at either the Fund or Contract level. While the Fund does not have transaction expenses, if the transaction and ongoing expenses at the Contract level were included, the expenses shown below would be higher. You should consult your Contract prospectus or disclosure document for more information.
The table shows Fund-level ongoing expenses and can help you understand these expenses and compare them with those of other mutual funds offered through the Contract. The table assumes a $1,000 investment held for the six months indicated. Please refer to the Fund prospectus for additional information on operating expenses.
Actual Fund Expenses
The first line (Actual) of the table provides actual account values and expenses. The “Ending Account Value” is derived from the Fund’s actual return, which includes the effect of ongoing Fund expenses, but does not include the effect of ongoing Contract expenses.
You can estimate the Fund-level expenses you incurred during the period by following these steps. Of course, your account value and expenses will differ from those in this illustration:
| 1. | Divide your account value by $1,000. |
If an account had an $8,600 value, then $8,600 ÷ $1,000 = 8.6.
| 2. | Multiply the result by the number under the heading “Fund-Level Expenses Incurred During Period.” |
If Fund-Level Expenses Incurred During Period were $7.50, then 8.6 × $7.50 = $64.50.
In this illustration, the estimated expenses incurred this period at the Fund level are $64.50.
Hypothetical Example for Comparison with Other Mutual Funds
Information in the second line (Hypothetical) of the table can help you compare ongoing expenses of the Fund with those of other mutual funds offered through the Contract. This information may not be used to estimate the actual ending account balance or expenses you incurred during the period. The hypothetical “Ending Account Value” is based on the Fund’s actual expense ratio and an assumed 5% annual rate of return before expenses, which does not represent the Fund’s actual return. The figure under the heading “Fund-Level Expenses Incurred During Period” shows the hypothetical expenses your account would have incurred under this scenario. You can compare this figure with the 5% hypothetical examples that appear in shareholder reports of other funds offered through a Contract.
| | | | | | | | | | | | |
| Class 4 | | Beginning Account Value 7/1/15 | | | Ending Account
Value 12/31/15 | | | Fund-Level Expenses
Incurred During Period* 7/1/15–12/31/15 | |
Actual | | | $1,000 | | | | $ 911.70 | | | | $4.77 | |
Hypothetical (5% return before expenses) | | | $1,000 | | | | $1,020.21 | | | | $5.04 | |
*Expenses are calculated using the most recent six-month annualized expense ratio, net of expense waivers, for the Fund’s Class 4 shares (0.99%), which does not include any ongoing expenses of the Contract for which the Fund is an investment option, multiplied by the average account value over the period, multiplied by 184/365 to reflect the one-half year period.
FRANKLIN TEMPLETON VARIABLE INSURANCE PRODUCTS TRUST
Financial Highlights
Franklin Small Cap Value VIP Fund
| | | | | | | | | | | | | | | | | | | | |
| | | Year Ended December 31, | |
| | | 2015 | | | 2014 | | | 2013 | | | 2012 | | | 2011 | |
| Class 1 | | | | | | | | | | | | | | | | | | | | |
Per share operating performance
(for a share outstanding throughout the year) | | | | | | | | | | | | | | | | | | | | |
| | | | | |
Net asset value, beginning of year | | | $22.81 | | | | $24.54 | | | | $18.58 | | | | $15.82 | | | | $16.55 | |
| | | | |
| | | | | |
| Income from investment operationsa: | | | | | | | | | | | | | | | | | | | | |
| | | | | |
Net investment incomeb | | | 0.21 | | | | 0.19 | | | | 0.19 | | | | 0.29 | c | | | 0.16 | |
| | | | | |
Net realized and unrealized gains (losses) | | | (1.53 | ) | | | 0.06 | | | | 6.45 | | | | 2.64 | | | | (0.74 | ) |
| | | | |
Total from investment operations | | | (1.32 | ) | | | 0.25 | | | | 6.64 | | | | 2.93 | | | | (0.58 | ) |
| | | | |
| | | | | |
| Less distributions from: | | | | | | | | | | | | | | | | | | | | |
| | | | | |
Net investment income | | | (0.20 | ) | | | (0.20 | ) | | | (0.32 | ) | | | (0.17 | ) | | | (0.15 | ) |
| | | | | |
Net realized gains | | | (3.17 | ) | | | (1.78 | ) | | | (0.36 | ) | | | — | | | | — | |
| | | | |
Total distributions | | | (3.37 | ) | | | (1.98 | ) | | | (0.68 | ) | | | (0.17 | ) | | | (0.15 | ) |
| | | | |
Net asset value, end of year | | | $18.12 | | | | $22.81 | | | | $24.54 | | | | $18.58 | | | | $15.82 | |
| | | | |
| | | | | |
Total returnd | | | (7.18)% | | | | 0.88% | | | | 36.50% | | | | 18.75% | | | | (3.53)% | |
| | | | | |
| Ratios to average net assets | | | | | | | | | | | | | | | | | | | | |
| | | | | |
Expenses before waiver and payments by affiliates | | | 0.65% | | | | 0.63% | | | | 0.63% | | | | 0.67% | | | | 0.66% | |
| | | | | |
Expenses net of waiver and payments by affiliates | | | 0.64% | e | | | 0.63% | e,f | | | 0.63% | | | | 0.67% | | | | 0.66% | |
| | | | | |
Net investment income | | | 1.04% | | | | 0.82% | | | | 0.90% | | | | 1.70% | c | | | 1.02% | |
| | | | | |
| Supplemental data | | | | | | | | | | | | | | | | | | | | |
| | | | | |
Net assets, end of year (000’s) | | | $45,897 | | | | $57,843 | | | | $62,408 | | | | $40,133 | | | | $39,374 | |
| | | | | |
Portfolio turnover rate | | | 27.05% | | | | 19.45% | | | | 10.44% | | | | 5.84% | | | | 14.39% | |
aThe amount shown for a share outstanding throughout the period may not correlate with the Statement of Operations for the period due to the timing of sales and repurchases of the Fund’s shares in relation to income earned and/or fluctuating fair value of the investments of the Fund.
bBased on average daily shares outstanding.
cNet investment income per share includes approximately $0.10 per share related to income received in the form of special dividends in connection with certain fund holdings. Excluding this amount, the ratio of net investment income to average net assets would have been 1.10%.
dTotal return does not include fees, charges or expenses imposed by the variable annuity and life insurance contracts for which Franklin Templeton Variable Insurance Products Trust serves as an underlying investment vehicle.
eBenefit of expense reduction rounds to less than 0.01%.
fBenefit of waiver and payments by affiliates and expense reduction rounds to less than 0.01%.
| | | | |
| FSV-6 | | Annual Report | The accompanying notes are an integral part of these financial statements. | | |
FRANKLIN TEMPLETON VARIABLE INSURANCE PRODUCTS TRUST
FINANCIAL HIGHLIGHTS
Franklin Small Cap Value VIP Fund (continued)
| | | | | | | | | | | | | | | | | | | | |
| | | Year Ended December 31, | |
| | | 2015 | | | 2014 | | | 2013 | | | 2012 | | | 2011 | |
| Class 2 | | | | | | | | | | | | | | | | | | | | |
Per share operating performance
(for a share outstanding throughout the year) | | | | | | | | | | | | | | | | | | | | |
| | | | | |
Net asset value, beginning of year | | | $22.32 | | | | $24.07 | | | | $18.23 | | | | $15.53 | | | | $16.25 | |
| | | | |
| | | | | |
| Income from investment operationsa: | | | | | | | | | | | | | | | | | | | | |
| | | | | |
Net investment incomeb | | | 0.16 | | | | 0.13 | | | | 0.14 | | | | 0.24 | c | | | 0.12 | |
| | | | | |
Net realized and unrealized gains (losses) | | | (1.49 | ) | | | 0.05 | | | | 6.34 | | | | 2.59 | | | | (0.73 | ) |
| | | | |
Total from investment operations | | | (1.33 | ) | | | 0.18 | | | | 6.48 | | | | 2.83 | | | | (0.61 | ) |
| | | | |
| | | | | |
| Less distributions from: | | | | | | | | | | | | | | | | | | | | |
| | | | | |
Net investment income | | | (0.14 | ) | | | (0.15 | ) | | | (0.28 | ) | | | (0.13 | ) | | | (0.11 | ) |
| | | | | |
Net realized gains | | | (3.17 | ) | | | (1.78 | ) | | | (0.36 | ) | | | — | | | | — | |
| | | | |
Total distributions | | | (3.31 | ) | | | (1.93 | ) | | | (0.64 | ) | | | (0.13 | ) | | | (0.11 | ) |
| | | | |
Net asset value, end of year | | | $17.68 | | | | $22.32 | | | | $24.07 | | | | $18.23 | | | | $15.53 | |
| | | | |
| | | | | |
Total returnd | | | (7.39)% | | | | 0.57% | | | | 36.24% | | | | 18.39% | | | | (3.76)% | |
| | | | | |
| Ratios to average net assets | | | | | | | | | | | | | | | | | | | | |
| | | | | |
Expenses before waiver and payments by affiliates | | | 0.90% | | | | 0.88% | | | | 0.88% | | | | 0.92% | | | | 0.91% | |
| | | | | |
Expenses net of waiver and payments by affiliates | | | 0.89% | e | | | 0.88% | e,f | | | 0.88% | | | | 0.92% | | | | 0.91% | |
| | | | | |
Net investment income | | | 0.79% | | | | 0.57% | | | | 0.65% | | | | 1.45% | c | | | 0.77% | |
| | | | | |
| Supplemental data | | | | | | | | | | | | | | | | | | | | |
| | | | | |
Net assets, end of year (000’s) | | | $1,172,173 | | | | $1,445,325 | | | | $1,606,802 | | | | $1,286,573 | | | | $1,211,168 | |
| | | | | |
Portfolio turnover rate | | | 27.05% | | | | 19.45% | | | | 10.44% | | | | 5.84% | | | | 14.39% | |
aThe amount shown for a share outstanding throughout the period may not correlate with the Statement of Operations for the period due to the timing of sales and repurchases of the Fund’s shares in relation to income earned and/or fluctuating fair value of the investments of the Fund.
bBased on average daily shares outstanding.
cNet investment income per share includes approximately $0.10 per share related to income received in the form of special dividends in connection with certain fund holdings. Excluding this amount, the ratio of net investment income to average net assets would have been 0.85%.
dTotal return does not include fees, charges or expenses imposed by the variable annuity and life insurance contracts for which Franklin Templeton Variable Insurance Products Trust serves as an underlying investment vehicle.
eBenefit of expense reduction rounds to less than 0.01%.
fBenefit of waiver and payments by affiliates and expense reduction rounds to less than 0.01%.
| | | | | | |
| | | The accompanying notes are an integral part of these financial statements. | Annual Report | | | FSV-7 | |
FRANKLIN TEMPLETON VARIABLE INSURANCE PRODUCTS TRUST
FINANCIAL HIGHLIGHTS
Franklin Small Cap Value VIP Fund (continued)
| | | | | | | | | | | | | | | | | | | | |
| | | Year Ended December 31, | |
| | | 2015 | | | 2014 | | | 2013 | | | 2012 | | | 2011 | |
| Class 4 | | | | | | | | | | | | | | | | | | | | |
Per share operating performance
(for a share outstanding throughout the year) | | | | | | | | | | | | | | | | | | | | |
| | | | | |
Net asset value, beginning of year | | | $22.63 | | | | $24.37 | | | | $18.44 | | | | $15.71 | | | | $16.44 | |
| | | | |
| | | | | |
| Income from investment operationsa: | | | | | | | | | | | | | | | | | | | | |
| | | | | |
Net investment incomeb | | | 0.14 | | | | 0.11 | | | | 0.12 | | | | 0.22 | c | | | 0.11 | |
| | | | | |
Net realized and unrealized gains (losses) | | | (1.52 | ) | | | 0.05 | | | | 6.42 | | | | 2.63 | | | | (0.75 | ) |
| | | | |
Total from investment operations | | | (1.38 | ) | | | 0.16 | | | | 6.54 | | | | 2.85 | | | | (0.64 | ) |
| | | | |
| | | | | |
| Less distributions from: | | | | | | | | | | | | | | | | | | | | |
| | | | | |
Net investment income | | | (0.12 | ) | | | (0.12 | ) | | | (0.25 | ) | | | (0.12 | ) | | | (0.09 | ) |
| | | | | |
Net realized gains | | | (3.17 | ) | | | (1.78 | ) | | | (0.36 | ) | | | — | | | | — | |
| | | | |
Total distributions | | | (3.29 | ) | | | (1.90 | ) | | | (0.61 | ) | | | (0.12 | ) | | | (0.09 | ) |
| | | | |
Net asset value, end of year | | | $17.96 | | | | $22.63 | | | | $24.37 | | | | $18.44 | | | | $15.71 | |
| | | | |
| | | | | |
Total returnd | | | (7.52)% | | | | 0.48% | | | | 36.12% | | | | 18.27% | | | | (3.87)% | |
| | | | | |
| Ratios to average net assets | | | | | | | | | | | | | | | | | | | | |
| | | | | |
Expenses before waiver and payments by affiliates | | | 1.00% | | | | 0.98% | | | | 0.98% | | | | 1.02% | | | | 1.01% | |
| | | | | |
Expenses net of waiver and payments by affiliates | | | 0.99% | e | | | 0.98% | e,f | | | 0.98% | | | | 1.02% | | | | 1.01% | |
| | | | | |
Net investment income | | | 0.69% | | | | 0.47% | | | | 0.55% | | | | 1.35% | c | | | 0.67% | |
| | | | | |
| Supplemental data | | | | | | | | | | | | | | | | | | | | |
| | | | | |
Net assets, end of year (000’s) | | | $26,128 | | | | $30,452 | | | | $35,936 | | | | $32,424 | | | | $34,284 | |
| | | | | |
Portfolio turnover rate | | | 27.05% | | | | 19.45% | | | | 10.44% | | | | 5.84% | | | | 14.39% | |
aThe amount shown for a share outstanding throughout the period may not correlate with the Statement of Operations for the period due to the timing of sales and repurchases of the Fund’s shares in relation to income earned and/or fluctuating fair value of the investments of the Fund.
bBased on average daily shares outstanding.
cNet investment income per share includes approximately $0.10 per share related to income received in the form of special dividends in connection with certain fund holdings. Excluding this amount, the ratio of net investment income to average net assets would have been 0.75%.
dTotal return does not include fees, charges or expenses imposed by the variable annuity and life insurance contracts for which Franklin Templeton Variable Insurance Products Trust serves as an underlying investment vehicle.
eBenefit of expense reduction rounds to less than 0.01%.
fBenefit of waiver and payments by affiliates and expense reduction rounds to less than 0.01%.
| | | | |
| FSV-8 | | Annual Report | The accompanying notes are an integral part of these financial statements. | | |
FRANKLIN TEMPLETON VARIABLE INSURANCE PRODUCTS TRUST
Statement of Investments, December 31, 2015
| | | | | | | | | | |
| Franklin Small Cap Value VIP Fund | |
| | | | | Shares | | | Value | |
| | Common Stocks 91.2% | | | | | | | | |
| | Aerospace & Defense 2.9% | | | | | | | | |
| | AAR Corp. | | | 1,235,700 | | | $ | 32,486,553 | |
| a | | Esterline Technologies Corp. | | | 43,200 | | | | 3,499,200 | |
| | | | | | | | | | |
| | | | | | | | | 35,985,753 | |
| | | | | | | | | | |
| | Automobiles & Components 5.1% | | | | | | | | |
| | Drew Industries Inc. | | | 375,400 | | | | 22,858,106 | |
| | Gentex Corp. | | | 889,900 | | | | 14,247,299 | |
| | Thor Industries Inc. | | | 280,800 | | | | 15,766,920 | |
| | Winnebago Industries Inc. | | | 525,300 | | | | 10,453,470 | |
| | | | | | | | | | |
| | | | | | | | | 63,325,795 | |
| | | | | | | | | | |
| | Banks 4.9% | | | | | | | | |
| | Chemical Financial Corp. | | | 427,554 | | | | 14,652,276 | |
| | Columbia Banking System Inc. | | | 189,200 | | | | 6,150,892 | |
| | EverBank Financial Corp. | | | 1,514,700 | | | | 24,204,906 | |
| | Lakeland Financial Corp. | | | 160,400 | | | | 7,477,848 | |
| | Peoples Bancorp Inc. | | | 257,000 | | | | 4,841,880 | |
| | TrustCo Bank Corp. NY | | | 684,300 | | | | 4,201,602 | |
| | | | | | | | | | |
| | | | | | | | | 61,529,404 | |
| | | | | | | | | | |
| | Building Products 5.2% | | | | | | | | |
| a | | Gibraltar Industries Inc. | | | 707,300 | | | | 17,993,712 | |
| | Griffon Corp. | | | 251,100 | | | | 4,469,580 | |
| | Simpson Manufacturing Co. Inc. | | | 433,400 | | | | 14,800,610 | |
| | Universal Forest Products Inc. | | | 399,800 | | | | 27,334,326 | |
| | | | | | | | | | |
| | | | | | | | | 64,598,228 | |
| | | | | | | | | | |
| | Commercial & Professional Services 3.1% | | | | | | | | |
| a | | Huron Consulting Group Inc. | | | 171,300 | | | | 10,175,220 | |
| | McGrath RentCorp | | | 615,018 | | �� | | 15,492,303 | |
| | MSA Safety Inc. | | | 284,113 | | | | 12,350,392 | |
| | | | | | | | | | |
| | | | | | | | | 38,017,915 | |
| | | | | | | | | | |
| | Construction & Engineering 3.9% | | | | | | | | |
| | EMCOR Group Inc. | | | 479,300 | | | | 23,025,572 | |
| | Granite Construction Inc. | | | 593,200 | | | | 25,454,212 | |
| | | | | | | | | | |
| | | | | | | | | 48,479,784 | |
| | | | | | | | | | |
| | Consumer Durables & Apparel 5.9% | | | | | | | | |
| a | | BRP Inc. (Canada) | | | 824,200 | | | | 11,844,933 | |
| | Brunswick Corp. | | | 120,200 | | | | 6,071,302 | |
| a | | Crocs Inc. | | | 1,362,100 | | | | 13,947,904 | |
| a | | Helen of Troy Ltd. | | | 21,800 | | | | 2,054,650 | |
| | Hooker Furniture Corp. | | | 445,000 | | | | 11,231,800 | |
| | La-Z-Boy Inc. | | | 757,900 | | | | 18,507,918 | |
| a | | M/I Homes Inc. | | | 435,900 | | | | 9,554,928 | |
| | | | | | | | | | |
| | | | | | | | | 73,213,435 | |
| | | | | | | | | | |
| | Electrical Equipment 3.8% | | | | | | | | |
| | EnerSys | | | 254,210 | | | | 14,217,965 | |
| | Franklin Electric Co. Inc. | | | 286,164 | | | | 7,735,013 | |
| | Regal Beloit Corp. | | | 432,700 | | | | 25,321,604 | |
| | | | | | | | | | |
| | | | | | | | | 47,274,582 | |
| | | | | | | | | | |
FRANKLIN TEMPLETON VARIABLE INSURANCE PRODUCTS TRUST
STATEMENT OF INVESTMENTS
Franklin Small Cap Value VIP Fund (continued)
| | | | | | | | | | |
| | | | | Shares | | | Value | |
| | Common Stocks (continued) | | | | | | | | |
| | Energy 3.8% | | | | | | | | |
| | Bristow Group Inc. | | | 413,000 | | | $ | 10,696,700 | |
| | Energen Corp. | | | 220,000 | | | | 9,017,800 | |
| a | | Helix Energy Solutions Group Inc. | | | 495,600 | | | | 2,606,856 | |
| | Hunting PLC (United Kingdom) | | | 1,669,700 | | | | 7,518,521 | |
| a | | Oil States International Inc. | | | 301,800 | | | | 8,224,050 | |
| a | | Unit Corp. | | | 808,800 | | | | 9,867,360 | |
| | | | | | | | | | |
| | | | | | | | | 47,931,287 | |
| | | | | | | | | | |
| | Food, Beverage & Tobacco 3.1% | | | | | | | | |
| | AGT Food and Ingredients Inc. (Canada) | | | 37,800 | | | | 928,809 | |
| | GrainCorp Ltd. (Australia) | | | 408,300 | | | | 2,566,964 | |
| a | | Landec Corp. | | | 269,100 | | | | 3,183,453 | |
| | Maple Leaf Foods Inc. (Canada) | | | 1,861,000 | | | | 31,965,127 | |
| | | | | | | | | | |
| | | | | | | | | 38,644,353 | |
| | | | | | | | | | |
| | Health Care Equipment & Services 6.7% | | | | | | | | |
| | Hill-Rom Holdings Inc. | | | 344,000 | | | | 16,532,640 | |
| | Invacare Corp. | | | 487,200 | | | | 8,472,408 | |
| | STERIS PLC | | | 410,900 | | | | 30,957,206 | |
| | Teleflex Inc. | | | 211,800 | | | | 27,841,110 | |
| | | | | | | | | | |
| | | | | | | | | 83,803,364 | |
| | | | | | | | | | |
| | Industrial Conglomerates 2.2% | | | | | | | | |
| | Carlisle Cos. Inc. | | | 308,900 | | | | 27,396,341 | |
| | | | | | | | | | |
| | Insurance 9.2% | | | | | | | | |
| | Arthur J. Gallagher & Co. | | | 168,200 | | | | 6,886,108 | |
| | Aspen Insurance Holdings Ltd. | | | 538,700 | | | | 26,019,210 | |
| | Endurance Specialty Holdings Ltd. | | | 116,300 | | | | 7,442,037 | |
| | The Hanover Insurance Group Inc. | | | 207,247 | | | | 16,857,471 | |
| | Old Republic International Corp. | | | 1,075,900 | | | | 20,044,017 | |
| | StanCorp Financial Group Inc. | | | 194,500 | | | | 22,149,660 | |
| | Validus Holdings Ltd. | | | 317,800 | | | | 14,710,962 | |
| | | | | | | | | | |
| | | | | | | | | 114,109,465 | |
| | | | | | | | | | |
| | Machinery 5.9% | | | | | | | | |
| | Astec Industries Inc. | | | 566,600 | | | | 23,060,620 | |
| | Hillenbrand Inc. | | | 365,500 | | | | 10,829,765 | |
| | Kennametal Inc. | | | 35,300 | | | | 677,760 | |
| b | | Lindsay Corp. | | | 132,800 | | | | 9,614,720 | |
| | Mueller Industries Inc. | | | 712,200 | | | | 19,300,620 | |
| a | | Wabash National Corp. | | | 581,700 | | | | 6,881,511 | |
| | Watts Water Technologies Inc., A | | | 55,000 | | | | 2,731,850 | |
| | | | | | | | | | |
| | | | | | | | | 73,096,846 | |
| | | | | | | | | | |
| | Materials 8.4% | | | | | | | | |
| | A. Schulman Inc. | | | 394,866 | | | | 12,098,694 | |
| | Allegheny Technologies Inc. | | | 10,500 | | | | 118,125 | |
| | AptarGroup Inc. | | | 65,000 | | | | 4,722,250 | |
| | Axiall Corp. | | | 1,225,400 | | | | 18,871,160 | |
| | Carpenter Technology Corp. | | | 236,200 | | | | 7,149,774 | |
| | H.B. Fuller Co. | | | 494,940 | | | | 18,050,462 | |
| | Minerals Technologies Inc. | | | 148,700 | | | | 6,819,382 | |
FRANKLIN TEMPLETON VARIABLE INSURANCE PRODUCTS TRUST
STATEMENT OF INVESTMENTS
Franklin Small Cap Value VIP Fund (continued)
| | | | | | | | | | |
| | | | | Shares | | | Value | |
| | Common Stocks (continued) | | | | | | | | |
| | Materials (continued) | | | | | | | | |
| | RPM International Inc. | | | 147,900 | | | $ | 6,516,474 | |
| | Sensient Technologies Corp. | | | 377,500 | | | | 23,714,550 | |
| | Stepan Co. | | | 126,700 | | | | 6,295,723 | |
| | | | | | | | | | |
| | | | | | | | | 104,356,594 | |
| | | | | | | | | | |
| | Pharmaceuticals, Biotechnology & Life Sciences 2.1% | | | | | | | | |
| | Gerresheimer AG (Germany) | | | 336,000 | | | | 26,347,906 | |
| | | | | | | | | | |
| | Real Estate 3.0% | | | | | | | | |
| | Brandywine Realty Trust | | | 480,900 | | | | 6,569,094 | |
| | LTC Properties Inc. | | | 722,000 | | | | 31,147,080 | |
| | | | | | | | | | |
| | | | | | | | | 37,716,174 | |
| | | | | | | | | | |
| | Retailing 3.2% | | | | | | | | |
| | Caleres Inc. | | | 378,500 | | | | 10,151,370 | |
| | The Cato Corp., A | | | 366,200 | | | | 13,483,484 | |
| a | | Genesco Inc. | | | 188,408 | | | | 10,707,227 | |
| a | | West Marine Inc. | | | 610,700 | | | | 5,184,843 | |
| | | | | | | | | | |
| | | | | | | | | 39,526,924 | |
| | | | | | | | | | |
| | Semiconductors & Semiconductor Equipment 2.0% | | | | | | | | |
| | Cohu Inc. | | | 736,000 | | | | 8,883,520 | |
| | MKS Instruments Inc. | | | 369,600 | | | | 13,305,600 | |
| a | | Photronics Inc. | | | 207,900 | | | | 2,588,355 | |
| | | | | | | | | | |
| | | | | | | | | 24,777,475 | |
| | | | | | | | | | |
| | Software & Services 0.5% | | | | | | | | |
| | Mentor Graphics Corp. | | | 341,300 | | | | 6,286,746 | |
| | | | | | | | | | |
| | Technology Hardware & Equipment 2.1% | | | | | | | | |
| | Ingram Micro Inc., A | | | 507,100 | | | | 15,405,698 | |
| a | | Rofin-Sinar Technologies Inc. | | | 388,900 | | | | 10,414,742 | |
| | | | | | | | | | |
| | | | | | | | | 25,820,440 | |
| | | | | | | | | | |
| | Utilities 4.2% | | | | | | | | |
| | Connecticut Water Service Inc. | | | 15,400 | | | | 585,354 | |
| | IDACORP Inc. | | | 353,589 | | | | 24,044,052 | |
| | The Laclede Group Inc. | | | 469,100 | | | | 27,869,230 | |
| | | | | | | | | | |
| | | | | | | | | 52,498,636 | |
| | | | | | | | | | |
| | | |
| | Total Common Stocks (Cost $935,236,525) | | | | | | | 1,134,737,447 | |
| | | | | | | | | | |
| | | |
| | | | | Principal Amount | | | | |
| | Corporate Bonds (Cost $9,065,344) 0.6% | | | | | | | | |
| | Energy 0.6% | | | | | | | | |
| | Unit Corp., senior sub. note, 6.625%, 5/15/21 | | $ | 9,632,000 | | | | 6,983,200 | |
| | | | | | | | | | |
| | | |
| | Total Investments before Short Term Investments
(Cost $944,301,869) | | | | | | | 1,141,720,647 | |
| | | | | | | | | | |
FRANKLIN TEMPLETON VARIABLE INSURANCE PRODUCTS TRUST
STATEMENT OF INVESTMENTS
Franklin Small Cap Value VIP Fund (continued)
| | | | | | | | | | |
| | | | | Shares | | | Value | |
| | | | | | | | | | |
| | Short Term Investments 8.7% | | | | | | | | |
| | Money Market Funds (Cost $103,357,618) 8.3% | | | | | | | | |
| a,c | | Institutional Fiduciary Trust Money Market Portfolio | | | 103,357,618 | | | $ | 103,357,618 | |
| | | | | | | | | | |
| | | |
| | | | | Principal Amount | | | | |
| d | | Investments from Cash Collateral Received for Loaned Securities 0.4% | | | | | |
| | Repurchase Agreements 0.4% | | | | | | | | |
| e | | Joint Repurchase Agreement, 0.34%, 1/04/16 (Maturity Value $1,154,177) | | $ | 1,154,133 | | | | 1,154,133 | |
| | Daiwa Capital Markets America Inc. | | | | | | | | |
| | Collateralized by fU.S. Treasury Bill, 2/18/16 - 8/18/16; U.S. Treasury Bond,
3.125% - 7.50%, 11/15/16 - 8/15/44; U.S. Treasury Bond, Index Linked, 0.75% - 3.875%, 1/15/26 - 2/15/45; U.S. Treasury Note, 0.875% - 4.875%, 8/15/16 - 12/31/21; and U.S. Treasury Note, Index Linked, 0.125% - 0.25%, 4/15/20 - 1/15/25
(valued at $1,177,216) | | | | | | | | |
| e | | Joint Repurchase Agreement, 0.28%, 1/04/16 (Maturity Value $1,154,169) | | | 1,154,133 | | | | 1,154,133 | |
| | HSBC Securities (USA) Inc. | | | | | | | | |
| | Collateralized by fU.S. Government Agency Securities, 3/23/16 - 7/15/32;
U.S. Government Agency Securities, Strips, 1/15/16 - 7/15/37; U.S. Treasury Bond, 3.75%, 11/15/43; and U.S. Treasury Note, 1.375% - 1.75%, 9/30/18 - 9/30/22
(valued at $1,177,219) | | | | | | | | |
| e | | Joint Repurchase Agreement, 0.32%, 1/04/16 (Maturity Value $242,942) | | | 242,933 | | | | 242,933 | |
| | J.P. Morgan Securities LLC | | | | | | | | |
| | Collateralized by fU.S. Treasury Bill, 4/28/16; and U.S. Treasury Note,
1.375% - 2.00%, 4/30/20 - 2/15/25 (valued at $247,794) | | | | | | | | |
| e | | Joint Repurchase Agreement, 0.31%, 1/04/16 (Maturity Value $1,154,173) | | | 1,154,133 | | | | 1,154,133 | |
| | Nomura Securities International Inc. | | | | | | | | |
| | Collateralized by fU.S. Treasury Bill, 2/25/16; U.S. Treasury Note,
0.268% - 0.875%, 10/31/16 - 10/15/18; and U.S. Treasury Strips, 2/15/16 - 5/15/27 (valued at $1,177,216) | | | | | | | | |
| e | | Joint Repurchase Agreement, 0.30%, 1/04/16 (Maturity Value $1,154,171) | | | 1,154,133 | | | | 1,154,133 | |
| | RBS Securities Inc. | | | | | | | | |
| | Collateralized by U.S. Treasury Bond, 2.75%, 11/15/23; and U.S. Treasury Note,
0.289% - 3.25%, 7/31/16 - 4/30/17 (valued at $1,177,221) | | | | | | | | |
| | | | | | | | | | |
| | Total Investments from Cash Collateral Received for Loaned Securities (Cost $4,859,465) | | | | | | | 4,859,465 | |
| | | | | | | | | | |
| | Total Investments (Cost $1,052,518,952) 100.5% | | | | | | | 1,249,937,730 | |
| | Other Assets, less Liabilities (0.5)% | | | | | | | (5,739,963 | ) |
| | | | | | | | | | |
| | Net Assets 100.0% | | | | | | $ | 1,244,197,767 | |
| | | | | | | | | | |
aNon-income producing.
bA portion or all of the security is on loan at December 31, 2015. See Note 1(d).
cSee Note 3(e) regarding investments in affiliated management investment companies.
dSee Note 1(d) regarding securities on loan.
eSee Note 1(c) regarding joint repurchase agreement.
fThe security is traded on a discount basis with no stated coupon rate.
| | | | |
| FSV-12 | | Annual Report | The accompanying notes are an integral part of these financial statements. | | |
FRANKLIN TEMPLETON VARIABLE INSURANCE PRODUCTS TRUST
Financial Statements
Statement of Assets and Liabilities
December 31, 2015
| | | | |
| | | Franklin Small
Cap Value
VIP Fund | |
Assets: | | | | |
Investments in securities: | | | | |
Cost - Unaffiliated issuers | | $ | 944,301,869 | |
Cost - Non-controlled affiliates (Note 3e) | | | 103,357,618 | |
Cost - Repurchase agreements | | | 4,859,465 | |
| | | | |
Total cost of investments | | $ | 1,052,518,952 | |
| | | | |
Value - Unaffiliated issuers | | $ | 1,141,720,647 | |
Value - Non-controlled affiliates (Note 3e) | | | 103,357,618 | |
Value - Repurchase agreements | | | 4,859,465 | |
| | | | |
Total value of investments (Includes securities loaned in the amount of $4,706,000) | | | 1,249,937,730 | |
Receivables: | | | | |
Investment securities sold | | | 1,414,007 | |
Capital shares sold | | | 575,232 | |
Dividends and interest | | | 1,045,332 | |
Other assets | | | 116 | |
| | | | |
Total assets | | | 1,252,972,417 | |
| | | | |
Liabilities: | | | | |
Payables: | | | | |
Investment securities purchased | | | 193,804 | |
Capital shares redeemed | | | 2,299,000 | |
Management fees | | | 674,439 | |
Distribution fees | | | 524,269 | |
Payable upon return of securities loaned | | | 4,859,465 | |
Accrued expenses and other liabilities | | | 223,673 | |
| | | | |
Total liabilities | | | 8,774,650 | |
| | | | |
Net assets, at value | | $ | 1,244,197,767 | |
| | | | |
Net assets consist of: | | | | |
Paid-in capital | | $ | 840,278,287 | |
Undistributed net investment income | | | 11,124,717 | |
Net unrealized appreciation (depreciation) | | | 197,418,395 | |
Accumulated net realized gain (loss) | | | 195,376,368 | |
| | | | |
Net assets, at value | | $ | 1,244,197,767 | |
| | | | |
| | | | | | |
| | | The accompanying notes are an integral part of these financial statements. | Annual Report | | | FSV-13 | |
FRANKLIN TEMPLETON VARIABLE INSURANCE PRODUCTS TRUST
FINANCIAL STATEMENTS
Statement of Assets and Liabilities (continued)
December 31, 2015
| | | | |
| | | Franklin Small
Cap Value
VIP Fund | |
| |
| Class 1: | | | | |
Net assets, at value | | $ | 45,896,801 | |
| | | | |
Shares outstanding | | | 2,533,427 | |
| | | | |
Net asset value and maximum offering price per share | | $ | 18.12 | |
| | | | |
| |
| Class 2: | | | | |
Net assets, at value | | $ | 1,172,172,706 | |
| | | | |
Shares outstanding | | | 66,311,554 | |
| | | | |
Net asset value and maximum offering price per share | | $ | 17.68 | |
| | | | |
| |
| Class 4: | | | | |
Net assets, at value | | $ | 26,128,260 | |
| | | | |
Shares outstanding | | | 1,454,470 | |
| | | | |
Net asset value and maximum offering price per share | | $ | 17.96 | |
| | | | |
| | | | |
| FSV-14 | | Annual Report | The accompanying notes are an integral part of these financial statements. | | |
FRANKLIN TEMPLETON VARIABLE INSURANCE PRODUCTS TRUST
FINANCIAL STATEMENTS
Statement of Operations
for the year ended December 31, 2015
| | | | |
| | | Franklin Small
Cap Value
VIP Fund | |
Investment income: | | | | |
Dividends | | $ | 22,339,947 | |
Interest | | | 582,465 | |
Income from securities loaned | | | 650,973 | |
| | | | |
Total investment income | | | 23,573,385 | |
| | | | |
Expenses: | | | | |
Management fees (Note 3a) | | | 8,738,085 | |
Distribution fees: (Note 3c) | | | | |
Class 2 | | | 3,304,321 | |
Class 4 | | | 100,745 | |
Custodian fees (Note 4) | | | 19,595 | |
Reports to shareholders | | | 223,911 | |
Professional fees | | | 54,678 | |
Trustees’ fees and expenses | | | 6,236 | |
Other | | | 23,570 | |
| | | | |
Total expenses | | | 12,471,141 | |
Expense reductions (Note 4) | | | (20 | ) |
Expenses waived/paid by affiliates (Note 3e) | | | (94,235 | ) |
| | | | |
Net expenses | | | 12,376,886 | |
| | | | |
Net investment income | | | 11,196,499 | |
| | | | |
Realized and unrealized gains (losses): | | | | |
Net realized gain (loss) from: | | | | |
Investments | | | 196,023,885 | |
Foreign currency transactions | | | (65,349 | ) |
| | | | |
Net realized gain (loss) | | | 195,958,536 | |
| | | | |
Net change in unrealized appreciation (depreciation) on: | | | | |
Investments | | | (310,285,399 | ) |
Translation of other assets and liabilities denominated in foreign currencies | | | (383 | ) |
| | | | |
Net change in unrealized appreciation (depreciation) | | | (310,285,782 | ) |
| | | | |
Net realized and unrealized gain (loss) | | | (114,327,246 | ) |
| | | | |
Net increase (decrease) in net assets resulting from operations | | $ | (103,130,747 | ) |
| | | | |
| | | | | | |
| | | The accompanying notes are an integral part of these financial statements. | Annual Report | | | FSV-15 | |
FRANKLIN TEMPLETON VARIABLE INSURANCE PRODUCTS TRUST
FINANCIAL STATEMENTS
Statements of Changes in Net Assets
| | | | | | | | |
| | | Franklin Small Cap Value VIP Fund | |
| | | Year Ended December 31, | |
| | | 2015 | | | 2014 | |
Increase (decrease) in net assets: | | | | | | | | |
Operations: | | | | | | | | |
Net investment income | | $ | 11,196,499 | | | $ | 9,166,921 | |
Net realized gain (loss) | | | 195,958,536 | | | | 204,970,194 | |
Net change in unrealized appreciation (depreciation) | | | (310,285,782 | ) | | | (206,772,254 | ) |
| | | | |
Net increase (decrease) in net assets resulting from operations | | | (103,130,747 | ) | | | 7,364,861 | |
| | | | |
Distributions to shareholders from: | | | | | | | | |
Net investment income: | | | | | | | | |
Class 1 | | | (483,179 | ) | | | (493,372 | ) |
Class 2 | | | (8,399,662 | ) | | | (9,349,846 | ) |
Class 4 | | | (155,331 | ) | | | (160,210 | ) |
Net realized gains: | | | | | | | | |
Class 1 | | | (7,665,840 | ) | | | (4,292,308 | ) |
Class 2 | | | (193,180,034 | ) | | | (112,743,662 | ) |
Class 4 | | | (4,250,502 | ) | | | (2,435,910 | ) |
| | | | |
Total distributions to shareholders | | | (214,134,548 | ) | | | (129,475,308 | ) |
| | | | |
Capital share transactions: (Note 2) | | | | | | | | |
Class 1 | | | (165,713 | ) | | | (206,770 | ) |
Class 2 | | | 25,699,762 | | | | (46,032,420 | ) |
Class 4 | | | 2,309,001 | | | | (3,176,134 | ) |
| | | | |
Total capital share transactions | | | 27,843,050 | | | | (49,415,324 | ) |
| | | | |
Net increase (decrease) in net assets | | | (289,422,245 | ) | | | (171,525,771 | ) |
Net assets: | | | | | | | | |
Beginning of year | | | 1,533,620,012 | | | | 1,705,145,783 | |
| | | | |
End of year | | $ | 1,244,197,767 | | | $ | 1,533,620,012 | |
| | | | |
Undistributed net investment income included in net assets: | | | | | | | | |
End of year | | $ | 11,124,717 | | | $ | 8,474,380 | |
| | | | |
| | | | |
| FSV-16 | | Annual Report | The accompanying notes are an integral part of these financial statements. | | |
FRANKLIN TEMPLETON VARIABLE INSURANCE PRODUCTS TRUST
Notes to Financial Statements
Franklin Small Cap Value VIP Fund
1. Organization and Significant Accounting Policies
Franklin Templeton Variable Insurance Products Trust (Trust) is registered under the Investment Company Act of 1940 (1940 Act) as an open-end management investment company, consisting of nineteen separate funds and applies the specialized accounting and reporting guidance in U.S. Generally Accepted Accounting Principles (U.S. GAAP). Franklin Small Cap Value VIP Fund (Fund) is included in this report. The financial statements of the remaining funds in the Trust are presented separately. Shares of the Fund are generally sold only to insurance company separate accounts to fund the benefits of variable life insurance policies or variable annuity contracts. The Fund offers three classes of shares: Class 1, Class 2 and Class 4. Each class of shares differs by its distribution fees, voting rights on matters affecting a single class and its exchange privilege.
The following summarizes the Fund’s significant accounting policies.
a. Financial Instrument Valuation
The Fund’s investments in financial instruments are carried at fair value daily. Fair value is the price that would be received to sell an asset or paid to transfer a liability in an orderly transaction between market participants on the measurement date. The Fund calculates the net asset value (NAV) per share as of 4 p.m. Eastern time each day the New York Stock Exchange (NYSE) is open for trading. Under compliance policies and procedures approved by the Trust’s Board of Trustees (the Board), the Fund’s administrator has responsibility for oversight of valuation, including leading the cross-functional Valuation and Liquidity Oversight Committee (VLOC). The VLOC provides administration and oversight of the Fund’s valuation policies and procedures, which are approved annually by the Board. Among other things, these procedures allow the Fund to utilize independent pricing services, quotations from securities and financial instrument dealers, and other market sources to determine fair value.
Equity securities listed on an exchange or on the NASDAQ National Market System are valued at the last quoted sale price or the official closing price of the day, respectively. Foreign equity securities are valued as of the close of trading on the foreign stock exchange on which the security is primarily traded or as of 4 p.m. Eastern time whichever is earlier. The value is then converted into its U.S. dollar equivalent at the foreign exchange rate in effect at 4 p.m. Eastern time on the day that the value of
the security is determined. Over-the-counter (OTC) securities are valued within the range of the most recent quoted bid and ask prices. Securities that trade in multiple markets or on multiple exchanges are valued according to the broadest and most representative market. Certain equity securities are valued based upon fundamental characteristics or relationships to similar securities.
Debt securities generally trade in the OTC market rather than on a securities exchange. The Fund’s pricing services use multiple valuation techniques to determine fair value. In instances where sufficient market activity exists, the pricing services may utilize a market-based approach through which quotes from market makers are used to determine fair value. In instances where sufficient market activity may not exist or is limited, the pricing services also utilize proprietary valuation models which may consider market characteristics such as benchmark yield curves, credit spreads, estimated default rates, anticipated market interest rate volatility, coupon rates, anticipated timing of principal repayments, underlying collateral, and other unique security features in order to estimate the relevant cash flows, which are then discounted to calculate the fair value.
Investments in open-end mutual funds are valued at the closing NAV. Repurchase agreements are valued at cost, which approximates fair value.
The Fund has procedures to determine the fair value of financial instruments for which market prices are not reliable or readily available. Under these procedures, the VLOC convenes on a regular basis to review such financial instruments and considers a number of factors, including significant unobservable valuation inputs, when arriving at fair value. The VLOC primarily employs a market-based approach which may use related or comparable assets or liabilities, recent transactions, market multiples, book values, and other relevant information for the investment to determine the fair value of the investment. An income-based valuation approach may also be used in which the anticipated future cash flows of the investment are discounted to calculate fair value. Discounts may also be applied due to the nature or duration of any restrictions on the disposition of the investments. Due to the inherent uncertainty of valuations of such investments, the fair values may differ significantly from the values that would have been used had an active market existed. The VLOC employs various methods for calibrating these valuation approaches including a regular review of key inputs and assumptions, transactional back-testing or disposition analysis, and reviews of any related market activity.
FRANKLIN TEMPLETON VARIABLE INSURANCE PRODUCTS TRUST
NOTES TO FINANCIAL STATEMENTS
Franklin Small Cap Value VIP Fund (continued)
1. Organization and Significant Accounting Policies (continued)
a. Financial Instrument Valuation (continued)
Trading in securities on foreign securities stock exchanges and OTC markets may be completed before 4 p.m. Eastern time. In addition, trading in certain foreign markets may not take place on every NYSE business day. Occasionally, events occur between the time at which trading in a foreign security is completed and the close of the NYSE that might call into question the reliability of the value of a portfolio security held by the Fund. As a result, differences may arise between the value of the Fund’s portfolio securities as determined at the foreign market close and the latest indications of value at the close of the NYSE. In order to minimize the potential for these differences, the VLOC monitors price movements following the close of trading in foreign stock markets through a series of country specific market proxies (such as baskets of American Depositary Receipts, futures contracts and exchange traded funds). These price movements are measured against established trigger thresholds for each specific market proxy to assist in determining if an event has occurred that may call into question the reliability of the values of the foreign securities held by the Fund. If such an event occurs, the securities may be valued using fair value procedures, which may include the use of independent pricing services.
When the last day of the reporting period is a non-business day, certain foreign markets may be open on those days that the NYSE is closed, which could result in differences between the value of the Fund’s portfolio securities on the last business day and the last calendar day of the reporting period. Any significant security valuation changes due to an open foreign market are adjusted and reflected by the Fund for financial reporting purposes.
b. Foreign Currency Translation
Portfolio securities and other assets and liabilities denominated in foreign currencies are translated into U.S. dollars based on the exchange rate of such currencies against U.S. dollars on the date of valuation. The Fund may enter into foreign currency exchange contracts to facilitate transactions denominated in a foreign currency. Purchases and sales of securities, income and expense items denominated in foreign currencies are translated into U.S. dollars at the exchange rate in effect on the transaction date. Portfolio securities and assets and liabilities denominated
in foreign currencies contain risks that those currencies will decline in value relative to the U.S. dollar. Occasionally, events may impact the availability or reliability of foreign exchange rates used to convert the U.S. dollar equivalent value. If such an event occurs, the foreign exchange rate will be valued at fair value using procedures established and approved by the Board.
The Fund does not separately report the effect of changes in foreign exchange rates from changes in market prices on securities held. Such changes are included in net realized and unrealized gain or loss from investments in the Statement of Operations.
Realized foreign exchange gains or losses arise from sales of foreign currencies, currency gains or losses realized between the trade and settlement dates on securities transactions and the difference between the recorded amounts of dividends, interest, and foreign withholding taxes and the U.S. dollar equivalent of the amounts actually received or paid. Net unrealized foreign exchange gains and losses arise from changes in foreign exchange rates on foreign denominated assets and liabilities other than investments in securities held at the end of the reporting period.
c. Joint Repurchase Agreement
The Fund enters into a joint repurchase agreement whereby its uninvested cash balance is deposited into a joint cash account with other funds managed by the investment manager or an affiliate of the investment manager and is used to invest in one or more repurchase agreements. The value and face amount of the joint repurchase agreement are allocated to the funds based on their pro-rata interest. A repurchase agreement is accounted for as a loan by the Fund to the seller, collateralized by securities which are delivered to the Fund’s custodian. The fair value, including accrued interest, of the initial collateralization is required to be at least 102% of the dollar amount invested by the funds, with the value of the underlying securities marked to market daily to maintain coverage of at least 100%. Repurchase agreements are subject to the terms of Master Repurchase Agreements (MRAs) with approved counterparties (sellers). The MRAs contain various provisions, including but not limited to events of default and maintenance of collateral for repurchase agreements. In the event of default by either the seller or the Fund, certain MRAs may permit the non-defaulting party to net and close-out all transactions, if any, traded under such agreements. The Fund may sell securities it holds as collateral and
FRANKLIN TEMPLETON VARIABLE INSURANCE PRODUCTS TRUST
NOTES TO FINANCIAL STATEMENTS
Franklin Small Cap Value VIP Fund (continued)
apply the proceeds towards the repurchase price and any other amounts owed by the seller to the Fund in the event of default by the seller. This could involve costs or delays in addition to a loss on the securities if their value falls below the repurchase price owed by the seller. The joint repurchase agreement held by the Fund at year end, as indicated in the Statement of Investments, had been entered into on December 31, 2015.
d. Securities Lending
The Fund participates in an agency based securities lending program to earn additional income. The Fund receives cash collateral against the loaned securities in an amount equal to at least 102% of the fair value of the loaned securities. Collateral is maintained over the life of the loan in an amount not less than 100% of the fair value of loaned securities, as determined at the close of Fund business each day; any additional collateral required due to changes in security values is delivered to the Fund on the next business day. The collateral is deposited into a joint cash account with other funds and is used to invest in a money market fund managed by Franklin Advisers, Inc., an affiliate of the Fund and/or a joint repurchase agreement. The Fund may receive income from the investment of cash collateral, in addition to lending fees and rebates paid by the borrower. Income from securities loaned is reported separately in the Statement of Operations. The Fund bears the market risk with respect to the collateral investment, securities loaned, and the risk that the agent may default on its obligations to the Fund. If the borrower defaults on its obligation to return the securities loaned, the Fund has the right to repurchase the securities in the open market using the collateral received. The securities lending agent has agreed to indemnify the Fund in the event of default by a third party borrower.
Securities lending transactions are accounted for as secured borrowing transactions. The securities out on loan represent the collateral pledged by the Fund, and the cash collateral received for the loaned securities represents the amount borrowed by the Fund. At December 31, 2015, the Fund’s secured borrowing transactions were as follows:
| | | | |
Securities lending transactionsa: | | | | |
Equity Investmentsb | | $ | 4,859,465 | |
| | | | |
aThe agreements open at period end can be terminated at any time.
bGross amount of recognized liabilities for securities lending transactions is included in payable upon return of securities loaned in the Statement of Assets and Liabilities.
e. Income and Deferred Taxes
It is the Fund’s policy to qualify as a regulated investment company under the Internal Revenue Code. The Fund intends to distribute to shareholders substantially all of its taxable income and net realized gains to relieve it from federal income and if applicable, excise taxes. As a result, no provision for U.S. federal income taxes is required.
The Fund may be subject to foreign taxation related to income received, capital gains on the sale of securities and certain foreign currency transactions in the foreign jurisdictions in which it invests. Foreign taxes, if any, are recorded based on the tax regulations and rates that exist in the foreign markets in which the Fund invests. When a capital gain tax is determined to apply, the Fund records an estimated deferred tax liability in an amount that would be payable if the securities were disposed of on the valuation date.
The Fund may recognize an income tax liability related to its uncertain tax positions under U.S. GAAP when the uncertain tax position has a less than 50% probability that it will be sustained upon examination by the tax authorities based on its technical merits. As of December 31, 2015, the Fund has determined that no tax liability is required in its financial statements related to uncertain tax positions for any open tax years (or expected to be taken on future tax returns). Open tax years are those that remain subject to examination and are based on each tax jurisdiction’s statute of limitation.
f. Security Transactions, Investment Income, Expenses and Distributions
Security transactions are accounted for on trade date. Realized gains and losses on security transactions are determined on a specific identification basis. Interest income and estimated expenses are accrued daily. Amortization of premium and accretion of discount on debt securities are included in interest income. Dividend income recorded on the ex-dividend date except for certain dividends from foreign securities where the dividend rate is not available. In such cases, the dividend is recorded as soon as the information is received by the Fund. Distributions to shareholders are recorded on the ex-dividend date and are determined according to income tax regulations (tax basis). Distributable earnings determined on a tax basis may differ from earnings recorded in accordance with U.S. GAAP. These differences may be permanent or temporary. Permanent differences are reclassified among capital accounts to reflect
FRANKLIN TEMPLETON VARIABLE INSURANCE PRODUCTS TRUST
NOTES TO FINANCIAL STATEMENTS
Franklin Small Cap Value VIP Fund (continued)
1. Organization and Significant Accounting Policies (continued)
f. Security Transactions, Investment Income, Expenses and Distributions (continued)
their tax character. These reclassifications have no impact on net assets or the results of operations. Temporary differences are not reclassified, as they may reverse in subsequent periods.
Common expenses incurred by the Trust are allocated among the Funds based on the ratio of net assets of each Fund to the combined net assets of the Trust. Fund specific expenses are charged directly to the fund that incurred the expense.
Realized and unrealized gains and losses and net investment income, not including class specific expenses, are allocated daily to each class of shares based upon the relative proportion of net assets of each class. Differences in per share distributions, by class, are generally due to differences in class specific expenses.
g. Accounting Estimates
The preparation of financial statements in accordance with U.S. GAAP requires management to make estimates and assumptions that affect the reported amounts of assets and liabilities at the date of the financial statements and the amounts of income and expenses during the reporting period. Actual results could differ from those estimates.
h. Guarantees and Indemnifications
Under the Trust’s organizational documents, its officers and trustees are indemnified by the Trust against certain liabilities arising out of the performance of their duties to the Trust. Additionally, in the normal course of business, the Trust, on behalf of the Fund, enters into contracts with service providers that contain general indemnification clauses. The Trust’s maximum exposure under these arrangements is unknown as this would involve future claims that may be made against the Trust that have not yet occurred. Currently, the Trust expects the risk of loss to be remote.
2. Shares of Beneficial Interest
At December 31, 2015, there were an unlimited number of shares authorized (without par value). Transactions in the Fund’s shares were as follows:
| | | | | | | | | | | | | | | | | | |
| | | Year Ended December 31, | |
| | | 2015 | | | | | 2014 | |
| | | Shares | | | Amount | | | | | Shares | | | Amount | |
| | | | | |
| Class 1 Shares: | | | | | | | | | | | | | | | | | | |
Shares sold | | | 97,924 | | | $ | 2,017,340 | | | | | | 175,851 | | | $ | 4,068,553 | |
Shares issued in reinvestment of distributions | | | 407,044 | | | | 8,149,019 | | | | | | 206,102 | | | | 4,785,680 | |
Shares redeemed | | | (507,751 | ) | | | (10,332,072 | ) | | | | | (388,575 | ) | | | (9,061,003 | ) |
| | | | |
Net increase (decrease) | | | (2,783 | ) | | $ | (165,713 | ) | | | | | (6,622 | ) | | $ | (206,770 | ) |
| | | | |
| | | | | |
| Class 2 Shares: | | | | | | | | | | | | | | | | | | |
Shares sold | | | 3,551,318 | | | $ | 71,764,155 | | | | | | 5,020,152 | | | $ | 113,569,546 | |
Shares issued in reinvestment of distributions | | | 10,305,710 | | | | 201,579,696 | | | | | | 5,364,390 | | | | 122,093,507 | |
Shares redeemed | | | (12,288,306 | ) | | | (247,644,089 | ) | | | | | (12,408,353 | ) | | | (281,695,473 | ) |
| | | | |
Net increase (decrease) | | | 1,568,722 | | | $ | 25,699,762 | | | | | | (2,023,811 | ) | | $ | (46,032,420 | ) |
| | | | |
| | | | | |
| Class 4 Shares: | | | | | | | | | | | | | | | | | | |
Shares sold | | | 220,435 | | | $ | 4,535,105 | | | | | | 176,245 | | | $ | 3,946,345 | |
Shares issued in reinvestment of distributions | | | 221,510 | | | | 4,405,833 | | | | | | 112,435 | | | | 2,596,120 | |
Shares redeemed | | | (332,844 | ) | | | (6,631,937 | ) | | | | | (418,040 | ) | | | (9,718,599 | ) |
| | | | |
Net increase (decrease) | | | 109,101 | | | $ | 2,309,001 | | | | | | (129,360 | ) | | $ | (3,176,134 | ) |
| | | | |
FRANKLIN TEMPLETON VARIABLE INSURANCE PRODUCTS TRUST
NOTES TO FINANCIAL STATEMENTS
Franklin Small Cap Value VIP Fund (continued)
3. Transactions With Affiliates
Franklin Resources, Inc. is the holding company for various subsidiaries that together are referred to as Franklin Templeton Investments. Certain officers and trustees of the Fund are also officers and/or directors of the following subsidiaries:
| | |
| Subsidiary | | Affiliation |
Franklin Advisory Services, LLC (Advisory Services) | | Investment manager |
Franklin Templeton Services, LLC (FT Services) | | Administrative manager |
Franklin Templeton Distributors, Inc. (Distributors) | | Principal underwriter |
Franklin Templeton Investor Services, LLC (Investor Services) | | Transfer agent |
a. Management Fees
The Fund pays an investment management fee to Advisory Services based on the average daily net assets of the Fund as follows:
| | |
| Annualized Fee Rate | | Net Assets |
0.750% | | Up to and including $200 million |
0.635% | | Over $200 million, up to and including $700 million |
0.600% | | Over $700 million, up to and including $1.2 billion |
0.575% | | Over $1.2 billion, up to and including $1.3 billion |
0.475% | | In excess of $1.3 billion |
b. Administrative Fees
Under an agreement with Advisory Services, FT Services provides administrative services to the Fund. The fee is paid by Advisory Services based on the Fund’s average daily net assets, and is not an additional expense of the Fund.
c. Distribution Fees
The Board has adopted distribution plans for Class 2 and Class 4 shares pursuant to Rule 12b-1 under the 1940 Act. Under the Fund’s compensation distribution plans, the Fund pays Distributors for costs incurred in connection with the servicing, sale and distribution of the Fund’s shares up to 0.35% per year of its average daily net assets of each class. The Board has agreed to limit the current rate to 0.25% per year for Class 2. The plan year, for purposes of monitoring compliance with the maximum annual plan rates, is February 1 through January 31.
d. Transfer Agent Fees
Investor Services, under terms of an agreement, performs shareholder servicing for the Fund and is not paid by the Fund for the services.
e. Investments in Affiliated Management Investment Companies
The Fund invests in an affiliated management investment company for purposes other than exercising a controlling influence over the management or policies. Management fees paid by the Fund are waived on assets invested in the affiliated management investment company, as noted in the Statement of Operations, in an amount not to exceed the management and administrative fees paid directly or indirectly by each affiliate. Prior to January 1, 2014, the waiver was accounted for as a reduction to management fees.
FRANKLIN TEMPLETON VARIABLE INSURANCE PRODUCTS TRUST
NOTES TO FINANCIAL STATEMENTS
Franklin Small Cap Value VIP Fund (continued)
3. Transactions With Affiliates (continued)
e. Investments in Affiliated Management Investment Companies (continued)
| | | | | | | | | | | | | | | | | | | | | | | | | | | | | | | | |
| | | Number
of Shares
Held at
Beginning
of Year | | | Gross
Additions | | | Gross
Reductions | | | Number
of Shares
Held at
End of
Year | | | Value at
End of
Year | | | Investment
Income | | | Realized
Gain
(Loss) | | | % of
Affiliated
Fund Shares
Outstanding
Held at End
of Year | |
| Non-Controlled Affiliates | | | | | | | | | | | | | | | | | | | | | | | | | | | | | | | | |
Institutional Fiduciary Trust Money Market Portfolio | | | 43,920,522 | | | | 326,265,559 | | | | (266,828,463 | ) | | | 103,357,618 | | | $ | 103,357,618 | | | $ | — | | | $ | — | | | | 0.53% | |
| | | | | | | | | | | | | | | | | | | | | | | | |
f. Interfund Transactions
The Fund engaged in purchases and sales of investments with funds or other accounts that have a common investment manager (or affiliated investment managers), directors, trustees, or officers. These transactions complied with Rule 17a-7 under the 1940 Act. During the year ended December 31, 2015, the purchase and sale transactions aggregated $7,083,143 and $0, respectively.
4. Expense Offset Arrangement
The Fund has entered into an arrangement with its custodian whereby credits realized as a result of uninvested cash balances are used to reduce a portion of the Fund’s custodian expenses. During the year ended December 31, 2015, the custodian fees were reduced as noted in the Statement of Operations.
5. Income Taxes
The tax character of distributions paid during the years ended December 31, 2015 and 2014, was as follows:
| | | | | | | | |
| | | 2015 | | | 2014 | |
Distributions paid from: | | | | | | | | |
Ordinary income | | $ | 11,870,655 | | | $ | 16,187,412 | |
Long term capital gain | | | 202,263,893 | | | | 113,287,896 | |
| | | | |
| | $ | 214,134,548 | | | $ | 129,475,308 | |
| | | | |
At December 31, 2015, the cost of investments, net unrealized appreciation (depreciation), undistributed ordinary income and undistributed long term capital gains for income tax purposes were as follows:
| | | | |
Cost of investments | | $ | 1,053,781,552 | |
| | | | |
Unrealized appreciation | | $ | 301,451,689 | |
Unrealized depreciation | | | (105,295,511 | ) |
| | | | |
Net unrealized appreciation (depreciation) | | $ | 196,156,178 | |
| | | | |
Undistributed ordinary income | | $ | 11,124,878 | |
Undistributed long term capital gains | | | 196,638,969 | |
| | | | |
Distributable earnings | | $ | 207,763,847 | |
| | | | |
Differences between income and/or capital gains as determined on a book basis and a tax basis are primarily due to differing treatment of passive foreign investment company shares and wash sales.
FRANKLIN TEMPLETON VARIABLE INSURANCE PRODUCTS TRUST
NOTES TO FINANCIAL STATEMENTS
Franklin Small Cap Value VIP Fund (continued)
6. Investment Transactions
Purchases and sales of investments (excluding short term securities) for the year ended December 31, 2015, aggregated $357,243,332 and $590,985,549, respectively.
7. Credit Facility
The Fund, together with other U.S. registered and foreign investment funds (collectively, Borrowers), managed by Franklin Templeton Investments, are borrowers in a joint syndicated senior unsecured credit facility totaling $2 billion (Global Credit Facility) which matured on February 12, 2016. This Global Credit Facility provides a source of funds to the Borrowers for temporary and emergency purposes, including the ability to meet future unanticipated or unusually large redemption requests. Effective February 12, 2016, the Borrowers renewed the Global Credit Facility for a one year term, maturing February 10, 2017, for a total of $2 billion.
Under the terms of the Global Credit Facility, the Fund shall, in addition to interest charged on any borrowings made by the Fund and other costs incurred by the Fund, pay its share of fees and expenses incurred in connection with the implementation and maintenance of the Global Credit Facility, based upon its relative share of the aggregate net assets of all of the Borrowers, including an annual commitment fee of 0.07% based upon the unused portion of the Global Credit Facility. Effective February 12, 2016, the annual commitment fee is 0.15%. These fees are reflected in other expenses in the Statement of Operations. During the year ended December 31, 2015, the Fund did not use the Global Credit Facility.
8. Fair Value Measurements
The Fund follows a fair value hierarchy that distinguishes between market data obtained from independent sources (observable inputs) and the Fund’s own market assumptions (unobservable inputs). These inputs are used in determining the value of the Fund’s financial instruments and are summarized in the following fair value hierarchy:
| | • | | Level 1 – quoted prices in active markets for identical financial instruments |
| | • | | Level 2 – other significant observable inputs (including quoted prices for similar financial instruments, interest rates, prepayment speed, credit risk, etc.) |
| | • | | Level 3 – significant unobservable inputs (including the Fund’s own assumptions in determining the fair value of financial instruments) |
The input levels are not necessarily an indication of the risk or liquidity associated with financial instruments at that level.
For movements between the levels within the fair value hierarchy, the Fund has adopted a policy of recognizing the transfers as of the date of the underlying event which caused the movement.
A summary of inputs used as of December 31, 2015, in valuing the Fund’s assets carried at fair value, is as follows:
| | | | | | | | | | | | | | | | |
| | | Level 1 | | | Level 2 | | | Level 3 | | | Total | |
| | | | |
| Assets: | | | | | | | | | | | | | | | | |
Investments in Securities: | | | | | | | | | | | | | | | | |
Equity Investmentsa | | $ | 1,134,737,447 | | | $ | — | | | $ | — | | | $ | 1,134,737,447 | |
Corporate Bonds | | | — | | | | 6,983,200 | | | | — | | | | 6,983,200 | |
Short Term Investments | | | 103,357,618 | | | | 4,859,465 | | | | — | | | | 108,217,083 | |
| | | | |
Total Investments in Securities | | $ | 1,238,095,065 | | | $ | 11,842,665 | | | $ | — | | | $ | 1,249,937,730 | |
| | | | |
aFor detailed categories, see the accompanying Statement of Investments.
FRANKLIN TEMPLETON VARIABLE INSURANCE PRODUCTS TRUST
NOTES TO FINANCIAL STATEMENTS
Franklin Small Cap Value VIP Fund (continued)
9. Subsequent Events
The Fund has evaluated subsequent events through the issuance of the financial statements and determined that no events have occurred that require disclosure other than those already disclosed in the financial statements.
FRANKLIN TEMPLETON VARIABLE INSURANCE PRODUCTS TRUST
Report of Independent Registered Public Accounting Firm
Franklin Small Cap Value VIP Fund
To the Board of Trustees and Shareholders of Franklin Templeton Variable Insurance Products Trust
In our opinion, the accompanying statement of assets and liabilities, including the statement of investments, and the related statements of operations and of changes in net assets and the financial highlights present fairly, in all material respects, the financial position of Franklin Small Cap Value VIP Fund (the “Fund”) at December 31, 2015, the results of its operations for the year then ended, the changes in its net assets for each of the two years in the period then ended and the financial highlights for each of the periods presented, in conformity with accounting principles generally accepted in the United States of America. These financial statements and financial highlights (hereafter referred to as “financial statements”) are the responsibility of the Fund’s management. Our responsibility is to express an opinion on these financial statements based on our audit. We conducted our audit of these financial statements in accordance with the standards of the Public Company Accounting Oversight Board (United States). Those standards require that we plan and perform the audit to obtain reasonable assurance about whether the financial statements are free of material misstatement. An audit includes examining, on a test basis, evidence supporting the amounts and disclosures in the financial statements, assessing the accounting principles used and significant estimates made by management, and evaluating the overall financial statement presentation. We believe that our audit, which included confirmation of securities at December 31, 2015 by correspondence with the custodian, transfer agent and brokers, provides a reasonable basis for our opinion.
PricewaterhouseCoopers LLP
San Francisco, California
February 16, 2016
FRANKLIN TEMPLETON VARIABLE INSURANCE PRODUCTS TRUST
Tax Information (unaudited)
Franklin Small Cap Value VIP Fund
Under Section 852(b)(3)(C) of the Internal Revenue Code (Code), the Fund hereby reports the maximum amount allowable but no less than $202,263,893 as a long term capital gain dividend for the fiscal year ended December 31, 2015.
Under Section 854(b)(1)(A) of the Code, the Fund hereby reports 100% of the ordinary income dividends as income qualifying for the dividends received deduction for the fiscal year ended December 31, 2015.
Franklin Small-Mid Cap Growth VIP Fund
This annual report for Franklin Small-Mid Cap Growth VIP Fund covers the fiscal year ended December 31, 2015.
Class 4 Performance Summary as of December 31, 2015
Average annual total return of Class 4 shares* represents the average annual change in value, assuming reinvestment of dividends and capital gains. Average returns smooth out variations in returns, which can be significant; they are not the same as year-by-year results.
| | | | | | | | | | | | |
| Periods ended 12/31/15 | | 1-Year | | | 5-Year | | | 10-Year | |
Average Annual Total Return | | | -2.77% | | | | +8.69% | | | | +6.84% | |
*For the period beginning 2/29/08, Class 4 performance reflects a 12b-1 fee expense of 0.35% per year, which affects future performance. Class 4 performance prior to 2/29/08 reflects historical Class 1 performance, which does not have a 12b-1 fee expense. Since 2/29/08 (effective date), the average annual total return of Class 4 shares was +7.87%. The Fund has a fee waiver associated with any investment in a Franklin Templeton money fund, contractually guaranteed through at least its current fiscal year-end. Fund investment results reflect the fee waiver, to the extent applicable; without this reduction, the results would have been lower.
Performance reflects the Fund’s Class 4 operating expenses, but does not include any contract fees, expenses or sales charges. If they had been included, performance would be lower. These charges and deductions, particularly for variable life policies, can have a significant effect on contract values and insurance benefits. See the contract prospectus for a complete description of these expenses, including sales charges.
Performance data represent past performance, which does not guarantee future results. Investment return and principal value will fluctuate, and you may have a gain or loss when you sell your shares. Current performance may differ from figures shown.
Total Return Index Comparison for a Hypothetical $10,000 Investment (1/1/06–12/31/15)
The graph below shows the change in value of a hypothetical $10,000 investment in the Fund over the indicated period and includes reinvestment of any income or distributions. The Fund’s performance* is compared to the performance of the Russell Midcap® Growth Index and the Standard & Poor’s® 500 Index (S&P 500®). One cannot invest directly in an index, and an index is not representative of the Fund’s portfolio. Please see Important Notes to Performance Information preceding the Fund Summaries.
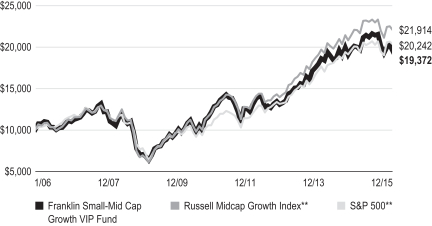
**Source: Morningstar. Please see Index Descriptions following the Fund Summaries.
FRANKLIN SMALL-MID CAP GROWTH VIP FUND
Fund Goal and Main Investments
The Fund seeks long-term capital growth. Under normal market conditions, the Fund invests at least 80% of its net assets in equity securities of small-capitalization and mid-capitalization companies. For this Fund, small cap companies are those within the market capitalization range of companies in the Russell 2500TM Index at the time of purchase, and midcap companies are those within the market capitalization range of companies in the Russell Midcap® Index at the time of purchase.1
Fund Risks
All investments involve risks, including possible loss of principal. Growth stock prices reflect projections of future earnings or revenues, and can, therefore, fall dramatically if the company fails to meet those projections. Smaller, midsized and relatively new or unseasoned companies can be particularly sensitive to changing economic conditions, and their prospects for growth are less certain than those of larger, more established companies. Historically, these securities have experienced more price volatility than larger company stocks, especially over the short term. To the extent the Fund focuses on particular countries, regions, industries, sectors or types of investment from time to time, it may be subject to greater risks of adverse developments in such areas of focus than a fund that invests in a wider variety of countries, regions, industries, sectors or investments. From time to time, the trading market for a particular security or type of security in which the Fund invests may become less liquid or even illiquid. The Fund is actively managed but there is no guarantee that the manager’s investment decisions will produce the desired results. The Fund’s prospectus also includes a description of the main investment risks.
Performance Overview
You can find the Fund’s one-year total return in the Performance Summary. In comparison, the Fund’s narrow benchmark, the Russell Midcap® Growth Index, had a -0.20% total return, and its broad benchmark, the S&P 500, produced a +1.38% total return for the same period.2
Economic and Market Overview
The U.S. economy grew moderately during the 12 months under review amid healthy consumer spending. After starting
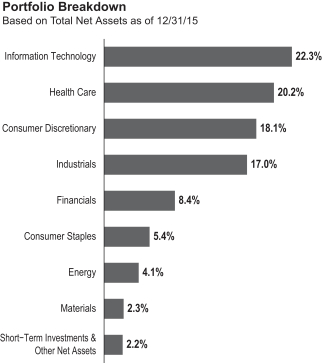
2015 with modest growth, the economy strengthened in the second quarter but moderated in the third and fourth quarters as exports slowed and state and local governments reduced their spending. Manufacturing activities expanded for most of the period but contracted toward period-end. Non-manufacturing activities, however, expanded throughout the 12-month period, contributing to new jobs and helping drive down the unemployment rate to 5.0% from October through period-end, the lowest level in more than seven years.3 The housing market improved at period-end as existing and new home sales increased and home prices rose despite slightly higher mortgage rates. Retail sales grew modestly, led by automobile and auto component sales. Annual inflation, as measured by the Consumer Price Index, remained subdued largely due to low energy prices.
After maintaining its target interest rate at a range of 0%–0.25% for seven years to support the U.S. economy’s recovery, the Federal Reserve (Fed) raised its target range for the federal funds rate to 0.25%–0.50% at its December meeting. Policymakers cited the labor market’s considerable improvement and were reasonably confident that inflation would move back to
1. Please see Index Descriptions following the Fund Summaries.
2. Source: Morningstar. One cannot invest directly in an index, and an index is not representative of the Fund’s portfolio. Please see Index Descriptions following the Fund Summaries.
3. Source: Bureau of Labor Statistics.
FRANKLIN SMALL-MID CAP GROWTH VIP FUND
the Fed’s 2.0% medium-term objective. The Fed indicated that its process of normalizing interest rates would be data dependent and would likely be gradual. Furthermore, the Fed raised its 2016 U.S. economic growth forecast and lowered its unemployment rate projection.
U.S. stock markets experienced sell-offs at times during the year, resulting from investor concerns about the timing of the Fed’s interest rate increases, slower global economic growth, geopolitical tensions in certain regions and a plunge in crude oil prices. Investors generally remained confident, however, as the Fed maintained an accommodative monetary policy stance despite the rate increase, the eurozone economy improved and China implemented more stimulus measures to support its economy. Despite periods of volatility, the broad U.S. stock market, as measured by the S&P 500, generated a modest positive total return for 2015. The energy and materials sectors were among the worst performers, while consumer discretionary, health care, consumer staples and information technology outperformed.
Investment Strategy
We use fundamental, bottom-up research to seek companies meeting our criteria of growth potential, quality and valuation. In seeking sustainable growth characteristics, we look for companies we believe can produce sustainable earnings and cash flow growth, evaluating the long-term market opportunity and competitive structure of an industry to target leaders and emerging leaders. We define quality companies as those with strong and improving competitive positions in attractive markets. We also believe important attributes of quality are experienced and talented management teams as well as financial strength reflected in the capital structure, gross and operating margins, free cash flow generation and returns on capital employed. Our valuation analysis includes a range of potential outcomes based on an assessment of multiple scenarios. In assessing value, we consider whether security prices fully reflect the balance of the sustainable growth opportunities relative to business and financial risks.
Manager’s Discussion
During the period under review, several sectors represented in the Fund’s portfolio delivered positive returns and contributed to absolute performance. Relative to the Russell Midcap Growth® Index, key contributors included stock selection in materials and information technology (IT).
| | | | |
| Top 10 Holdings | | | |
| 12/31/15 | | | |
Company
Sector/Industry | | % of Total
Net Assets | |
NXP Semiconductors NV (Netherlands)
Information Technology | | | 2.4% | |
Roper Technologies Inc.
Industrials | | | 1.9% | |
Constellation Brands Inc., A
Consumer Staples | | | 1.8% | |
Intercontinental Exchange Inc.
Financials | | | 1.8% | |
Electronic Arts Inc.
Information Technology | | | 1.7% | |
AMETEK Inc.
Industrials | | | 1.7% | |
Monster Beverage Corp.
Consumer Staples | | | 1.7% | |
Signature Bank
Financials | | | 1.7% | |
L Brands Inc.
Consumer Discretionary | | | 1.5% | |
Towers Watson & Co., A
Industrials | | | 1.5% | |
The dollar value, number of shares or principal amount, and names of all portfolio holdings are listed in the Fund’s Statement of Investments.
In the materials sector, our holding in specialty materials and chemicals company Cytec Industries contributed to relative returns.4 Cytec shares surged in July due to an announced acquisition by Belgium-based Solvay at a premium to Cytec’s share price. Solvay completed the acquisition in December.
Within IT, video game company Electronic Arts enjoyed some of the largest gains. Under new management, the company experienced improved game quality and expanded margins. It also benefited from excitement about the release of its Star Wars game, which sought to capitalize on the new Star Wars movie.
Other notable contributors included our investments in technology-based specialty pharmaceutical firm Impax Laboratories,5 clinical-stage specialty biopharmaceutical company Revance Therapeutics,5 and engineered products and solutions provider Roper Technologies. Impax resolved its manufacturing issues, successfully launched its new Parkinson’s disease drug Rytarry and quickly integrated a recent acquisition. Revance announced positive phase II data comparing its injectable botulinum toxin to a placebo and
4. Not held at period-end.
5. Not part of the index.
FRANKLIN SMALL-MID CAP GROWTH VIP FUND
Allergan’s Botox, giving investors a reason to believe its product will have regulatory and commercial success. Roper continued execution on its stated merger and acquisition strategy while generating steady organic revenue and earnings growth, bolstering share performance for the year.
In contrast, key detractors from the Fund’s relative performance included stock selection in the consumer discretionary, consumer staples and industrials sectors.
Our position in Dick’s Sporting Goods hurt relative performance in the consumer discretionary sector. The sporting goods retailer reported disappointing third-quarter earnings results and lowered its fourth-quarter outlook as in-store traffic slowed and sales of cold-weather apparel and gear were negatively affected by warmer fall temperatures. The company indicated that lower sales levels will impact near-term profit margins and necessitate more promotional selling.
Within consumer staples, our holding in fresh and refrigerated pet food manufacturer and distributor Freshpet was a major dectractor.4,5 Management’s underappreciation of the slower-than-forecast growth in company-owned refrigerated display units derailed our original thesis regarding the sustainability of a robust, long-term growth rate.
In the industrials sector, our positions in ultra-low-cost carrier Spirit Airlines,4 geospatial information product and service provider DigitalGlobe5 and global freight railroad operator Genesee & Wyoming hindered performance. Spirit Airlines
shares declined when the company’s fares came under pressure as American Airlines and Southwest Airlines added capacity in some of their core markets. The commercial side of DigitalGlobe’s business has been struggling recently, while the defense side has been experiencing stable growth. The commercial side has been trying to expand into the most troubled markets and sectors, such as Russia, energy and agriculture. We remained confident that the company’s new, higher resolution capabilities can drive acceleration in growth later in 2016. Low natural gas and iron ore prices affected Genesee & Wyoming’s shipment volume.
Thank you for your participation in Franklin Small-Mid Cap Growth VIP Fund. We look forward to serving your future investment needs.
The foregoing information reflects our analysis, opinions and portfolio holdings as of December 31, 2015, the end of the reporting period. The way we implement our main investment strategies and the resulting portfolio holdings may change depending on factors such as market and economic conditions. These opinions may not be relied upon as investment advice or an offer for a particular security. The information is not a complete analysis of every aspect of any market, country, industry, security or the Fund. Statements of fact are from sources considered reliable, but the investment manager makes no representation or warranty as to their completeness or accuracy. Although historical performance is no guarantee of future results, these insights may help you understand our investment management philosophy.
FRANKLIN SMALL-MID CAP GROWTH VIP FUND
Class 4 Fund Expenses
As an investor in a variable insurance contract (Contract) that indirectly provides for investment in an underlying mutual fund, you can incur transaction and/or ongoing expenses at both the Fund level and the Contract level.
| • | | Transaction expenses can include sales charges (loads) on purchases, redemption fees, surrender fees, transfer fees and premium taxes. |
| • | | Ongoing expenses can include management fees, distribution and service (12b-1) fees, contract fees, annual maintenance fees, mortality and expense risk fees and other fees and expenses. All mutual funds and Contracts have some types of ongoing expenses. |
The expenses shown in the table are meant to highlight ongoing expenses at the Fund level only and do not include ongoing expenses at the Contract level, or transaction expenses at either the Fund or Contract level. While the Fund does not have transaction expenses, if the transaction and ongoing expenses at the Contract level were included, the expenses shown below would be higher. You should consult your Contract prospectus or disclosure document for more information.
The table shows Fund-level ongoing expenses and can help you understand these expenses and compare them with those of other mutual funds offered through the Contract. The table assumes a $1,000 investment held for the six months indicated. Please refer to the Fund prospectus for additional information on operating expenses.
Actual Fund Expenses
The first line (Actual) of the table provides actual account values and expenses. The “Ending Account Value” is derived from the Fund’s actual return, which includes the effect of ongoing Fund expenses, but does not include the effect of ongoing Contract expenses.
You can estimate the Fund-level expenses you incurred during the period by following these steps. Of course, your account value and expenses will differ from those in this illustration:
| 1. | Divide your account value by $1,000. |
If an account had an $8,600 value, then $8,600 ÷ $1,000 = 8.6.
| 2. | Multiply the result by the number under the heading “Fund-Level Expenses Incurred During Period.” |
If Fund-Level Expenses Incurred During Period were $7.50, then 8.6 × $7.50 = $64.50.
In this illustration, the estimated expenses incurred this period at the Fund level are $64.50.
Hypothetical Example for Comparison with Other Mutual Funds
Information in the second line (Hypothetical) of the table can help you compare ongoing expenses of the Fund with those of other mutual funds offered through the Contract. This information may not be used to estimate the actual ending account balance or expenses you incurred during the period. The hypothetical “Ending Account Value” is based on the Fund’s actual expense ratio and an assumed 5% annual rate of return before expenses, which does not represent the Fund’s actual return. The figure under the heading “Fund-Level Expenses Incurred During Period” shows the hypothetical expenses your account would have incurred under this scenario. You can compare this figure with the 5% hypothetical examples that appear in shareholder reports of other funds offered through a Contract.
| | | | | | | | | | | | |
| Class 4 | | Beginning Account Value 7/1/15 | | | Ending Account Value 12/31/15 | | | Fund-Level Expenses
Incurred During Period* 7/1/15–12/31/15 | |
Actual | | | $1,000 | | | | $ 907.00 | | | | $5.62 | |
Hypothetical (5% return before expenses) | | | $1,000 | | | | $1,019.31 | | | | $5.96 | |
*Expenses are calculated using the most recent six-month annualized expense ratio, net of expense waivers, for the Funds Class 4 shares (1.17%), which does not include any ongoing expenses of the Contract for which the Fund is an investment option, multiplied by the average account value over the period, multiplied by 184/365 to reflect the one-half year period.
FRANKLIN TEMPLETON VARIABLE INSURANCE PRODUCTS TRUST
Financial Highlights
Franklin Small-Mid Cap Growth VIP Fund
| | | | | | | | | | | | | | | | | | | | |
| | | Year Ended December 31, | |
| | | 2015 | | | 2014 | | | 2013 | | | 2012 | | | 2011 | |
| Class 1 | | | | | | | | | | | | | | | | | | | | |
Per share operating performance
(for a share outstanding throughout the year) | | | | | | | | | | | | | | | | | | | | |
| | | | | |
Net asset value, beginning of year | | | $24.95 | | | | $28.38 | | | | $21.87 | | | | $21.19 | | | | $22.21 | |
| | | | |
| | | | | |
| Income from investment operationsa: | | | | | | | | | | | | | | | | | | | | |
| | | | | |
Net investment income (loss)b | | | — | c,d | | | (0.07 | ) | | | (0.09 | ) | | | (0.01 | )e | | | (0.05 | ) |
| | | | | |
Net realized and unrealized gains (losses) | | | (0.03 | ) | | | 2.04 | | | | 8.19 | | | | 2.27 | | | | (0.97 | ) |
| | | | |
Total from investment operations | | | (0.03 | ) | | | 1.97 | | | | 8.10 | | | | 2.26 | | | | (1.02 | ) |
| | | | |
Less distributions from net realized gains | | | (5.83 | ) | | | (5.40 | ) | | | (1.59 | ) | | | (1.58 | ) | | | — | |
| | | | |
Net asset value, end of year | | | $19.09 | | | | $24.95 | | | | $28.38 | | | | $21.87 | | | | $21.19 | |
| | | | |
| | | | | |
Total returnf | | | (2.44)% | | | | 7.78% | | | | 38.50% | | | | 11.12% | | | | (4.59)% | |
| | | | | |
| Ratios to average net assets | | | | | | | | | | | | | | | | | | | | |
| | | | | |
Expenses | | | 0.81% | g | | | 0.80% | g | | | 0.80% | h | | | 0.80% | | | | 0.79% | |
| | | | | |
Net investment income (loss) | | | 0.01% | d | | | (0.29)% | | | | (0.35)% | | | | (0.03)% | e | | | (0.21)% | |
| | | | | |
| Supplemental data | | | | | | | | | | | | | | | | | | | | |
| | | | | |
Net assets, end of year (000’s) | | | $87,866 | | | | $99,803 | | | | $98,020 | | | | $75,977 | | | | $76,384 | |
| | | | | |
Portfolio turnover rate | | | 37.85% | | | | 48.73% | | | | 42.77% | | | | 41.44% | | | | 45.00% | |
aThe amount shown for a share outstanding throughout the period may not correlate with the Statement of Operations for the period due to the timing of sales and repurchases of the Fund’s shares in relation to income earned and/or fluctuating fair value of the investments of the Fund.
bBased on average daily shares outstanding.
cAmount rounds to less than $0.01 per share.
dNet investment income per share includes approximately $0.05 per share related to income received in the form of special dividends in connection with certain Fund holdings. Excluding this amount, the ratio of net investment income to average net assets would have been (0.24)%.
eNet investment income per share includes approximately $0.03 per share related to income received in the form of special dividends in connection with certain Fund holdings. Excluding this amount, the ratio of net investment income to average net assets would have been (0.16)%.
fTotal return does not include fees, charges or expenses imposed by the variable annuity and life insurance contracts for which Franklin Templeton Variable Insurance Products Trust serves as an underlying investment vehicle.
gBenefit of waiver and payments by affiliates rounds to less than 0.01%.
hBenefit of expense reduction rounds to less than 0.01%.
| | | | |
| FSC-6 | | Annual Report | The accompanying notes are an integral part of these financial statements. | | |
FRANKLIN TEMPLETON VARIABLE INSURANCE PRODUCTS TRUST
FINANCIAL HIGHLIGHTS
Franklin Small-Mid Cap Growth VIP Fund (continued)
| | | | | | | | | | | | | | | | | | | | |
| | | Year Ended December 31, | |
| | | 2015 | | | 2014 | | | 2013 | | | 2012 | | | 2011 | |
| Class 2 | | | | | | | | | | | | | | | | | | | | |
Per share operating performance
(for a share outstanding throughout the year) | | | | | | | | | | | | | | | | | | | | |
| | | | | |
Net asset value, beginning of year | | | $23.56 | | | | $27.16 | | | | $21.04 | | | | $20.49 | | | | $21.54 | |
| | | | |
| | | | | |
| Income from investment operationsa: | | | | | | | | | | | | | | | | | | | | |
| | | | | |
Net investment income (loss)b | | | (0.05 | )c | | | (0.13 | ) | | | (0.14 | ) | | | (0.06 | )d | | | (0.10 | ) |
| | | | | |
Net realized and unrealized gains (losses) | | | 0.01 | | | | 1.93 | | | | 7.85 | | | | 2.19 | | | | (0.95 | ) |
| | | | |
Total from investment operations | | | (0.04 | ) | | | 1.80 | | | | 7.71 | | | | 2.13 | | | | (1.05 | ) |
| | | | |
Less distributions from net realized gains | | | (5.83 | ) | | | (5.40 | ) | | | (1.59 | ) | | | (1.58 | ) | | | — | |
| | | | |
Net asset value, end of year | | | $17.69 | | | | $23.56 | | | | $27.16 | | | | $21.04 | | | | $20.49 | |
| | | | |
| | | | | |
Total returne | | | (2.66)% | | | | 7.47% | | | | 38.15% | | | | 10.85% | | | | (4.87)% | |
| | | | | |
| Ratios to average net assets | | | | | | | | | | | | | | | | | | | | |
| | | | | |
Expenses | | | 1.06% | f | | | 1.05% | f | | | 1.05% | g | | | 1.05% | | | | 1.04% | |
| | | | | |
Net investment income (loss) | | | (0.24)% | c | | | (0.54)% | | | | (0.60)% | | | | (0.28)% | d | | | (0.46)% | |
| | | | | |
| Supplemental data | | | | | | | | | | | | | | | | | | | | |
| | | | | |
Net assets, end of year (000’s) | | | $478,649 | | | | $582,772 | | | | $660,806 | | | | $670,193 | | | | $717,086 | |
| | | | | |
Portfolio turnover rate | | | 37.85% | | | | 48.73% | | | | 42.77% | | | | 41.44% | | | | 45.00% | |
aThe amount shown for a share outstanding throughout the period may not correlate with the Statement of Operations for the period due to the timing of sales and repurchases of the Fund’s shares in relation to income earned and/or fluctuating fair value of the investments of the Fund.
bBased on average daily shares outstanding.
cNet investment income per share includes approximately $0.05 per share related to income received in the form of special dividends in connection with certain Fund holdings. Excluding this amount, the ratio of net investment income to average net assets would have been (0.49)%.
dNet investment income per share includes approximately $0.03 per share related to income received in the form of special dividends in connection with certain Fund holdings. Excluding this amount, the ratio of net investment income to average net assets would have been (0.41)%.
eTotal return does not include fees, charges or expenses imposed by the variable annuity and life insurance contracts for which Franklin Templeton Variable Insurance Products Trust serves as an underlying investment vehicle.
fBenefit of waiver and payments by affiliates rounds to less than 0.01%.
gBenefit of expense reduction rounds to less than 0.01%.
| | | | | | |
| | | The accompanying notes are an integral part of these financial statements. | Annual Report | | | FSC-7 | |
FRANKLIN TEMPLETON VARIABLE INSURANCE PRODUCTS TRUST
FINANCIAL HIGHLIGHTS
Franklin Small-Mid Cap Growth VIP Fund (continued)
| | | | | | | | | | | | | | | | | | | | |
| | | Year Ended December 31, | |
| | | 2015 | | | 2014 | | | 2013 | | | 2012 | | | 2011 | |
| Class 4 | | | | | | | | | | | | | | | | | | | | |
Per share operating performance
(for a share outstanding throughout the year) | | | | | | | | | | | | | | | | | | | | |
| | | | | |
Net asset value, beginning of year | | | $24.14 | | | | $27.72 | | | | $21.47 | | | | $20.90 | | | | $21.98 | |
| | | | |
| | | | | |
| Income from investment operationsa: | | | | | | | | | | | | | | | | | | | | |
| | | | | |
Net investment income (loss)b | | | (0.07 | )c | | | (0.16 | ) | | | (0.17 | ) | | | (0.09 | )d | | | (0.12 | ) |
| | | | | |
Net realized and unrealized gains (losses) | | | (0.01 | ) | | | 1.98 | | | | 8.01 | | | | 2.24 | | | | (0.96 | ) |
| | | | |
Total from investment operations | | | (0.08 | ) | | | 1.82 | | | | 7.84 | | | | 2.15 | | | | (1.08 | ) |
| | | | |
Less distributions from net realized gains | | | (5.83 | ) | | | (5.40 | ) | | | (1.59 | ) | | | (1.58 | ) | | | — | |
| | | | |
Net asset value, end of year | | | $18.23 | | | | $24.14 | | | | $27.72 | | | | $21.47 | | | | $20.90 | |
| | | | |
| | | | | |
Total returne | | | (2.77)% | | | | 7.39% | | | | 37.99% | | | | 10.79% | | | | (4.91)% | |
| | | | | |
| Ratios to average net assets | | | | | | | | | | | | | | | | | | | | |
| | | | | |
Expenses | | | 1.16% | f | | | 1.15% | f | | | 1.15% | g | | | 1.15% | | | | 1.14% | |
| | | | | |
Net investment income (loss) | | | (0.34)% | c | | | (0.64)% | | | | (0.70)% | | | | (0.38)% | d | | | (0.56)% | |
| | | | | |
| Supplemental data | | | | | | | | | | | | | | | | | | | | |
| | | | | |
Net assets, end of year (000’s) | | | $15,105 | | | | $16,384 | | | | $19,132 | | | | $12,000 | | | | $12,664 | |
| | | | | |
Portfolio turnover rate | | | 37.85% | | | | 48.73% | | | | 42.77% | | | | 41.44% | | | | 45.00% | |
aThe amount shown for a share outstanding throughout the period may not correlate with the Statement of Operations for the period due to the timing of sales and repurchases of the Fund’s shares in relation to income earned and/or fluctuating fair value of the investments of the Fund.
bBased on average daily shares outstanding.
cNet investment income per share includes approximately $0.05 per share related to income received in the form of special dividends in connection with certain Fund holdings. Excluding this amount, the ratio of net investment income to average net assets would have been (0.59)%.
dNet investment income per share includes approximately $0.03 per share related to income received in the form of special dividends in connection with certain Fund holdings. Excluding this amount, the ratio of net investment income to average net assets would have been (0.51)%.
eTotal return does not include fees, charges or expenses imposed by the variable annuity and life insurance contracts for which Franklin Templeton Variable Insurance Products Trust serves as an underlying investment vehicle.
fBenefit of waiver and payments by affiliates rounds to less than 0.01%.
gBenefit of expense reduction rounds to less than 0.01%.
| | | | |
| FSC-8 | | Annual Report | The accompanying notes are an integral part of these financial statements. | | |
FRANKLIN TEMPLETON VARIABLE INSURANCE PRODUCTS TRUST
Statement of Investments, December 31, 2015
| | | | | | | | | | |
Franklin Small-Mid Cap Growth VIP Fund | |
| | | | | Shares | | | Value | |
| | | | | | | | | | |
| | Common Stocks 97.6% | | | | | | | | |
| | Consumer Discretionary 17.9% | | | | | | | | |
| a,b | | 2U Inc. | | | 170,700 | | | $ | 4,776,186 | |
| | Advance Auto Parts Inc. | | | 21,200 | | | | 3,190,811 | |
| | BorgWarner Inc. | | | 98,900 | | | | 4,275,447 | |
| a | | Buffalo Wild Wings Inc. | | | 27,100 | | | | 4,326,515 | |
| a,b | | Charter Communications Inc., A | | | 29,900 | | | | 5,474,690 | |
| a | | Chipotle Mexican Grill Inc. | | | 4,500 | | | | 2,159,325 | |
| | Dick’s Sporting Goods Inc. | | | 142,600 | | | | 5,040,910 | |
| a | | Dollar Tree Inc. | | | 87,700 | | | | 6,772,194 | |
| | Expedia Inc. | | | 29,116 | | | | 3,619,119 | |
| a | | Global Eagle Entertainment Inc. | | | 299,100 | | | | 2,952,117 | |
| a | | Grand Canyon Education Inc. | | | 110,500 | | | | 4,433,260 | |
| | Hanesbrands Inc. | | | 224,000 | | | | 6,592,320 | |
| | Harman International Industries Inc. | | | 52,000 | | | | 4,898,920 | |
| a | | IMAX Corp. (Canada) | | | 100,400 | | | | 3,568,216 | |
| a | | Jarden Corp. | | | 109,950 | | | | 6,280,344 | |
| | L Brands Inc. | | | 91,300 | | | | 8,748,366 | |
| | Marriott International Inc., A | | | 62,800 | | | | 4,210,112 | |
| b | | Nordstrom Inc. | | | 102,200 | | | | 5,090,582 | |
| | Polaris Industries Inc. | | | 40,300 | | | | 3,463,785 | |
| | Tractor Supply Co. | | | 60,100 | | | | 5,138,550 | |
| a | | Under Armour Inc., A | | | 72,176 | | | | 5,818,107 | |
| a,b | | Zoe’s Kitchen Inc. | | | 105,300 | | | | 2,946,294 | |
| | | | | | | | | | |
| | | | | | | | | 103,776,170 | |
| | | | | | | | | | |
| | Consumer Staples 5.4% | | | | | | | | |
| | Constellation Brands Inc., A | | | 73,200 | | | | 10,426,608 | |
| a | | Monster Beverage Corp. | | | 66,200 | | | | 9,861,152 | |
| a | | TreeHouse Foods Inc. | | | 65,600 | | | | 5,146,976 | |
| a | | WhiteWave Foods Co., A | | | 150,200 | | | | 5,844,282 | |
| | | | | | | | | | |
| | | | | | | | | 31,279,018 | |
| | | | | | | | | | |
| | Energy 4.1% | | | | | | | | |
| | Cabot Oil & Gas Corp., A | | | 277,800 | | | | 4,914,282 | |
| a | | Concho Resources Inc. | | | 62,200 | | | | 5,775,892 | |
| a | | Diamondback Energy Inc. | | | 41,000 | | | | 2,742,900 | |
| | EQT Corp. | | | 69,700 | | | | 3,633,461 | |
| a | | Matador Resources Co. | | | 140,900 | | | | 2,785,593 | |
| | Superior Energy Services Inc. | | | 301,100 | | | | 4,055,817 | |
| | | | | | | | | | |
| | | | | | | | | 23,907,945 | |
| | | | | | | | | | |
| | Financials 8.4% | | | | | | | | |
| a | | Affiliated Managers Group Inc. | | | 42,800 | | | | 6,837,728 | |
| | Arthur J. Gallagher & Co. | | | 105,200 | | | | 4,306,888 | |
| a | | CBRE Group Inc. | | | 100,000 | | | | 3,458,000 | |
| | Equinix Inc. | | | 26,325 | | | | 7,960,680 | |
| | Intercontinental Exchange Inc. | | | 40,408 | | | | 10,354,954 | |
| | Lazard Ltd., A | | | 143,400 | | | | 6,454,434 | |
| a | | Signature Bank | | | 63,300 | | | | 9,708,321 | |
| | | | | | | | | | |
| | | | | | | | | 49,081,005 | |
| | | | | | | | | | |
| | Health Care 20.2% | | | | | | | | |
| a | | Akorn Inc. | | | 154,400 | | | | 5,760,664 | |
FRANKLIN TEMPLETON VARIABLE INSURANCE PRODUCTS TRUST
STATEMENT OF INVESTMENTS
Franklin Small-Mid Cap Growth VIP Fund (continued)
| | | | | | | | | | |
| | | | | Shares | | | Value | |
| | | | | | | | | | |
| | Common Stocks (continued) | | | | | | | | |
| | Health Care (continued) | | | | | | | | |
| a | | Anacor Pharmaceuticals Inc. | | | 12,911 | | | $ | 1,458,556 | |
| a | | BioMarin Pharmaceutical Inc. | | | 28,200 | | | | 2,954,232 | |
| a | | Bluebird Bio Inc. | | | 8,253 | | | | 530,007 | |
| a | | Celldex Therapeutics Inc. | | | 137,000 | | | | 2,148,160 | |
| a | | Cerner Corp. | | | 71,200 | | | | 4,284,104 | |
| a,b | | Chiasma Inc. | | | 52,200 | | | | 1,021,554 | |
| | The Cooper Cos. Inc. | | | 48,200 | | | | 6,468,440 | |
| a | | DaVita HealthCare Partners Inc. | | | 79,400 | | | | 5,534,974 | |
| | DENTSPLY International Inc. | | | 75,100 | | | | 4,569,835 | |
| a | | DexCom Inc. | | | 50,200 | | | | 4,111,380 | |
| a | | Edwards Lifesciences Corp. | | | 94,200 | | | | 7,439,916 | |
| a | | Envision Healthcare Holdings Inc. | | | 181,400 | | | | 4,710,958 | |
| a,b | | Heron Therapeutics Inc. | | | 83,742 | | | | 2,235,911 | |
| a | | Hologic Inc. | | | 195,600 | | | | 7,567,764 | |
| a | | Impax Laboratories Inc. | | | 114,100 | | | | 4,878,916 | |
| a | | Incyte Corp. | | | 35,800 | | | | 3,882,510 | |
| a | | Insulet Corp. | | | 60,985 | | | | 2,305,843 | |
| a | | Mallinckrodt PLC | | | 79,000 | | | | 5,895,770 | |
| a | | Mettler-Toledo International Inc. | | | 18,600 | | | | 6,307,818 | |
| a,b,c | | NantKwest Inc. | | | 19,100 | | | | 297,903 | |
| a | | Nevro Corp. | | | 71,900 | | | | 4,853,969 | |
| a,b | | Penumbra Inc. | | | 19,400 | | | | 1,043,914 | |
| | Perrigo Co. PLC | | | 57,485 | | | | 8,318,080 | |
| a | | Pfenex Inc. | | | 159,200 | | | | 1,970,896 | |
| a | | Quintiles Transnational Holdings Inc. | | | 124,200 | | | | 8,527,572 | |
| a | | Revance Therapeutics Inc. | | | 109,200 | | | | 3,730,272 | |
| | St. Jude Medical Inc. | | | 76,200 | | | | 4,706,874 | |
| | | | | | | | | | |
| | | | | | | | | 117,516,792 | |
| | | | | | | | | | |
| | Industrials 17.0% | | | | | | | | |
| | Acuity Brands Inc. | | | 16,600 | | | | 3,881,080 | |
| a | | The Advisory Board Co. | | | 108,600 | | | | 5,387,646 | |
| | Allegiant Travel Co. | | | 12,492 | | | | 2,096,533 | |
| | AMETEK Inc. | | | 186,100 | | | | 9,973,099 | |
| | B/E Aerospace Inc. | | | 118,600 | | | | 5,025,082 | |
| a | | DigitalGlobe Inc. | | | 357,800 | | | | 5,603,148 | |
| | Dun & Bradstreet Corp. | | | 44,500 | | | | 4,624,885 | |
| a | | Genesee & Wyoming Inc. | | | 112,200 | | | | 6,024,018 | |
| a | | HD Supply Holdings Inc. | | | 208,700 | | | | 6,267,261 | |
| | Hexcel Corp. | | | 133,200 | | | | 6,187,140 | |
| a | | IHS Inc., A | | | 60,500 | | | | 7,165,015 | |
| | J.B. Hunt Transport Services Inc. | | | 46,000 | | | | 3,374,560 | |
| | Robert Half International Inc. | | | 153,500 | | | | 7,235,990 | |
| | Roper Technologies Inc. | | | 59,370 | | | | 11,267,832 | |
| a | | Sensata Technologies Holding NV | | | 68,400 | | | | 3,150,504 | |
| | Towers Watson & Co., A | | | 66,400 | | | | 8,529,744 | |
| a | | Verisk Analytics Inc. | | | 40,000 | | | | 3,075,200 | |
| | | | | | | | | | |
| | | | | | | | | 98,868,737 | |
| | | | | | | | | | |
| | Information Technology 22.3% | | | | | | | | |
| a | | Alliance Data Systems Corp. | | | 9,900 | | | | 2,738,043 | |
| a | | ANSYS Inc. | | | 41,300 | | | | 3,820,250 | |
FRANKLIN TEMPLETON VARIABLE INSURANCE PRODUCTS TRUST
STATEMENT OF INVESTMENTS
Franklin Small-Mid Cap Growth VIP Fund (continued)
| | | | | | | | | | |
| | | | | Shares | | | Value | |
| | | | | | | | | | |
| | Common Stocks (continued) | | | | | | | | |
| | Information Technology (continued) | | | | | | | | |
| a | | Bottomline Technologies Inc. | | | 103,900 | | | $ | 3,088,947 | |
| | Cognex Corp. | | | 176,900 | | | | 5,973,913 | |
| a | | CoStar Group Inc. | | | 39,100 | | | | 8,081,579 | |
| | CSRA Inc. | | | 202,400 | | | | 6,072,000 | |
| a | | Demandware Inc. | | | 48,500 | | | | 2,617,545 | |
| a | | Electronic Arts Inc. | | | 146,300 | | | | 10,053,736 | |
| | Fidelity National Information Services Inc. | | | 77,200 | | | | 4,678,320 | |
| a | | FleetCor Technologies Inc. | | | 43,400 | | | | 6,203,162 | |
| a | | GoDaddy Inc., A | | | 118,300 | | | | 3,792,698 | |
| | Intersil Corp., A | | | 383,800 | | | | 4,897,288 | |
| | Lam Research Corp. | | | 41,300 | | | | 3,280,046 | |
| a | | LinkedIn Corp., A | | | 30,100 | | | | 6,774,908 | |
| a | | Lumentum Holdings Inc. | | | 154,180 | | | | 3,395,044 | |
| a | | NXP Semiconductors NV (Netherlands) | | | 166,968 | | | | 14,067,054 | |
| a | | Palo Alto Networks Inc. | | | 31,700 | | | | 5,583,638 | |
| a | | Pandora Media Inc. | | | 129,200 | | | | 1,732,572 | |
| a | | Red Hat Inc. | | | 78,700 | | | | 6,517,147 | |
| a | | ServiceNow Inc. | | | 65,500 | | | | 5,669,680 | |
| a | | Twitter Inc. | | | 87,400 | | | | 2,022,436 | |
| a | | Vantiv Inc., A | | | 117,500 | | | | 5,571,850 | |
| a | | VeriFone Systems Inc. | | | 146,700 | | | | 4,110,534 | |
| a | | ViaSat Inc. | | | 103,000 | | | | 6,284,030 | |
| a | | Workday Inc. | | | 34,100 | | | | 2,717,088 | |
| | | | | | | | | | |
| | | | | | | | | 129,743,508 | |
| | | | | | | | | | |
| | Materials 2.3% | | | | | | | | |
| a | | Axalta Coating Systems Ltd. | | | 271,200 | | | | 7,227,480 | |
| | Martin Marietta Materials Inc. | | | 44,600 | | | | 6,091,468 | |
| | | | | | | | | | |
| | | | | | | | | 13,318,948 | |
| | | | | | | | | | |
| | | |
| | Total Common Stocks (Cost $429,293,238) | | | | | | | 567,492,123 | |
| | | | | | | | | | |
| | Preferred Stocks 0.2% | | | | | | | | |
| | Consumer Discretionary 0.2% | | | | | | | | |
| a,d | | DraftKings Inc., pfd., D | | | 115,528 | | | | 311,110 | |
| a,d | | DraftKings Inc., pfd., D-1 | | | 284,105 | | | | 1,088,891 | |
| | | | | | | �� | | | |
| | | |
| | Total Preferred Stocks (Cost $2,800,003) | | | | | | | 1,400,001 | |
| | | | | | | | | | |
| | | |
| | Total Investments before Short Term Investments (Cost $432,093,241) | | | | | | | 568,892,124 | |
| | | | | | | | | | |
| | Short Term Investments 5.7% | | | | | | | | |
| | Money Market Funds (Cost $13,251,918) 2.3% | | | | | | | | |
| a,e | | Institutional Fiduciary Trust Money Market Portfolio | | | 13,251,918 | | | | 13,251,918 | |
| | | | | | | | | | |
| f | | Investments from Cash Collateral Received for Loaned Securities (Cost $19,891,250) 3.4% | | | | | | | | |
| | Money Market Funds 3.4% | | | | | | | | |
| a,e | | Institutional Fiduciary Trust Money Market Portfolio | | | 19,891,250 | | | | 19,891,250 | |
| | | | | | | | | | |
| | Total Investments (Cost $465,236,409) 103.5% | | | | | | | 602,035,292 | |
| | Other Assets, less Liabilities (3.5)% | | | | | | | (20,414,947 | ) |
| | | | | | | | | | |
| | Net Assets 100.0% | | | | | | $ | 581,620,345 | |
| | | | | | | | | | |
FRANKLIN TEMPLETON VARIABLE INSURANCE PRODUCTS TRUST
STATEMENT OF INVESTMENTS
Franklin Small-Mid Cap Growth VIP Fund (continued)
aNon-income producing.
bA portion or all of the security is on loan at December 31, 2015. See Note 1(c).
cSecurity has been deemed illiquid because it may not be able to be sold within seven days. At December 31, 2015, the aggregate value of this security was $297,903, representing 0.05% of net assets.
dSee Note 7 regarding restricted securities.
eSee Note 3(e) regarding investments in affiliated management investment companies.
fSee Note 1(c) regarding securities on loan.
| | | | |
| FSC-12 | | Annual Report | The accompanying notes are an integral part of these financial statements. | | |
FRANKLIN TEMPLETON VARIABLE INSURANCE PRODUCTS TRUST
Financial Statements
Statement of Assets and Liabilities
December 31, 2015
| | | | |
| | | Franklin Small-Mid
Cap Growth
VIP Fund | |
Assets: | | | | |
Investments in securities: | | | | |
Cost - Unaffiliated issuers | | $ | 432,093,241 | |
Cost - Non-controlled affiliates (Note 3e) | | | 33,143,168 | |
| | | | |
Total cost of investments | | $ | 465,236,409 | |
| | | | |
Value - Unaffiliated issuers | | $ | 568,892,124 | |
Value - Non-controlled affiliates (Note 3e) | | | 33,143,168 | |
| | | | |
Total value of investments (includes securities loaned in the amount of $19,166,493) | | | 602,035,292 | |
Receivables: | | | | |
Investment securities sold | | | 949,570 | |
Capital shares sold | | | 14,331 | |
Dividends and interest | | | 126,968 | |
Other assets | | | 54 | |
| | | | |
Total assets | | | 603,126,215 | |
| | | | |
Liabilities: | | | | |
Payables: | | | | |
Investment securities purchased | | | 516,731 | |
Capital shares redeemed | | | 324,566 | |
Management fees | | | 390,031 | |
Distribution fees | | | 215,053 | |
Payable upon return of securities loaned | | | 19,891,250 | |
Accrued expenses and other liabilities | | | 168,239 | |
| | | | |
Total liabilities | | | 21,505,870 | |
| | | | |
Net assets, at value | | $ | 581,620,345 | |
| | | | |
Net assets consist of: | | | | |
Paid-in capital | | $ | 382,821,806 | |
Undistributed net investment income (loss) | | | — | |
Net unrealized appreciation (depreciation) | | | 136,798,883 | |
Accumulated net realized gain (loss) | | | 61,999,656 | |
| | | | |
Net assets, at value | | $ | 581,620,345 | |
| | | | |
| |
| Class 1: | | | | |
Net assets, at value | | $ | 87,866,270 | |
| | | | |
Shares outstanding | | | 4,602,577 | |
| | | | |
Net asset value and maximum offering price per share | | $ | 19.09 | |
| | | | |
| |
| Class 2: | | | | |
Net assets, at value | | $ | 478,648,974 | |
| | | | |
Shares outstanding | | | 27,059,947 | |
| | | | |
Net asset value and maximum offering price per share | | $ | 17.69 | |
| | | | |
| |
| Class 4: | | | | |
Net assets, at value | | $ | 15,105,101 | |
| | | | |
Shares outstanding | | | 828,728 | |
| | | | |
Net asset value and maximum offering price per share | | $ | 18.23 | |
| | | | |
| | | | |
| | | The accompanying notes are an integral part of these financial statements. | Annual Report | | FSC-13 |
FRANKLIN TEMPLETON VARIABLE INSURANCE PRODUCTS TRUST
FINANCIAL STATEMENTS
Statement of Operations
for the year ended December 31, 2015
| | | | |
| | | Franklin Small-Mid
Cap Growth
VIP Fund | |
Investment income: | | | | |
Dividends | | $ | 4,883,373 | |
Income from securities loaned | | | 629,765 | |
| | | | |
Total investment income | | | 5,513,138 | |
| | | | |
Expenses: | | | | |
Management fees (Note 3a) | | | 5,225,416 | |
Distribution fees: (Note 3c) | | | | |
Class 2 | | | 1,396,406 | |
Class 4 | | | 58,556 | |
Custodian fees (Note 4) | | | 6,354 | |
Reports to shareholders | | | 199,032 | |
Professional fees | | | 42,722 | |
Trustees’ fees and expenses | | | 2,979 | |
Other | | | 12,848 | |
| | | | |
Total expenses | | | 6,944,313 | |
Expenses waived/paid by affiliates (Note 3e) | | | (27,332 | ) |
| | | | |
Net expenses | | | 6,916,981 | |
| | | | |
Net investment income (loss) | | | (1,403,843 | ) |
| | | | |
Realized and unrealized gains (losses): | | | | |
Net realized gain (loss) from Investments | | | 63,022,161 | |
Net change in unrealized appreciation (depreciation) on investments | | | (74,279,798 | ) |
| | | | |
Net realized and unrealized gain (loss) | | | (11,257,637 | ) |
| | | | |
Net increase (decrease) in net assets resulting from operations | | $ | (12,661,480 | ) |
| | | | |
| | | | |
| FSC-14 | | Annual Report | The accompanying notes are an integral part of these financial statements. | | |
FRANKLIN TEMPLETON VARIABLE INSURANCE PRODUCTS TRUST
FINANCIAL STATEMENTS
Statements of Changes in Net Assets
| | | | | | | | |
| | | Franklin Small-Mid Cap Growth VIP Fund | |
| | | Year Ended December 31, | |
| | | 2015 | | | 2014 | |
Increase (decrease) in net assets: | | | | | | | | |
Operations: | | | | | | | | |
Net investment income (loss) | | $ | (1,403,843 | ) | | $ | (3,724,526 | ) |
Net realized gain (loss) | | | 63,022,161 | | | | 165,568,522 | |
Net change in unrealized appreciation (depreciation) | | | (74,279,798 | ) | | | (110,422,791 | ) |
| | | | |
Net increase (decrease) in net assets resulting from operations | | | (12,661,480 | ) | | | 51,421,205 | |
| | | | |
Distributions to shareholders from: | | | | | | | | |
Net realized gains: | | | | | | | | |
Class 1 | | | (22,509,343 | ) | | | (18,164,400 | ) |
Class 2 | | | (135,758,632 | ) | | | (120,447,127 | ) |
Class 4 | | | (4,098,814 | ) | | | (3,536,394 | ) |
| | | | |
Total distributions to shareholders | | | (162,366,789 | ) | | | (142,147,921 | ) |
| | | | |
Capital share transactions: (Note 2) | | | | | | | | |
Class 1 | | | 12,480,207 | | | | 12,658,981 | |
Class 2 | | | 41,958,103 | | | | (469,072 | ) |
Class 4 | | | 3,251,391 | | | | (462,764 | ) |
| | | | |
Total capital share transactions | | | 57,689,701 | | | | 11,727,145 | |
| | | | |
Net increase (decrease) in net assets | | | (117,338,568 | ) | | | (78,999,571 | ) |
Net assets: | | | | | | | | |
Beginning of year | | | 698,958,913 | | | | 777,958,484 | |
| | | | |
End of year | | $ | 581,620,345 | | | $ | 698,958,913 | |
| | | | |
Undistributed net investment income (loss) included in net assets: | | | | | | | | |
End of year | | $ | — | | | $ | 3,992 | |
| | | | |
| | | | |
| | | The accompanying notes are an integral part of these financial statements. | Annual Report | | FSC-15 |
FRANKLIN TEMPLETON VARIABLE INSURANCE PRODUCTS TRUST
Notes to Financial Statements
Franklin Small-Mid Cap Growth VIP Fund
1. Organization and Significant Accounting Policies
Franklin Templeton Variable Insurance Products Trust (Trust) is registered under the Investment Company Act of 1940 (1940 Act) as an open-end management investment company, consisting of nineteen separate funds and applies the specialized accounting and reporting guidance in U.S. Generally Accepted Accounting Principles (U.S. GAAP). Franklin Small-Mid Cap Growth VIP Fund (Fund) is included in this report. The financial statements of the remaining funds in the Trust are presented separately. Shares of the Fund are generally sold only to insurance company separate accounts to fund the benefits of variable life insurance policies or variable annuity contracts. At December 31, 2015, 40.40% of the Fund’s shares were held through one insurance company. Investment activities of these insurance company separate accounts could have a material impact on the Fund. The Fund offers three classes of shares: Class 1, Class 2 and Class 4. Each class of shares differs by its distribution fees, voting rights on matters affecting a single class and its exchange privilege.
The following summarizes the Fund’s significant accounting policies.
a. Financial Instrument Valuation
The Fund’s investments in financial instruments are carried at fair value daily. Fair value is the price that would be received to sell an asset or paid to transfer a liability in an orderly transaction between market participants on the measurement date. The Fund calculates the net asset value (NAV) per share as of 4 p.m. Eastern time each day the New York Stock Exchange (NYSE) is open for trading. Under compliance policies and procedures approved by the Trust’s Board of Trustees (the Board), the Fund’s administrator has responsibility for oversight of valuation, including leading the cross-functional Valuation and Liquidity Oversight Committee (VLOC). The VLOC provides administration and oversight of the Fund’s valuation policies and procedures, which are approved annually by the Board. Among other things, these procedures allow the Fund to utilize independent pricing services, quotations from securities and financial instrument dealers, and other market sources to determine fair value.
Equity securities listed on an exchange or on the NASDAQ National Market System are valued at the last quoted sale price or the official closing price of the day, respectively. Foreign equity securities are valued as of the close of trading on the
foreign stock exchange on which the security is primarily traded or as of 4 p.m. Eastern time whichever is earlier. The value is then converted into its U.S. dollar equivalent at the foreign exchange rate in effect at 4 p.m. Eastern time on the day that the value of the security is determined. Over-the-counter (OTC) securities are valued within the range of the most recent quoted bid and ask prices. Securities that trade in multiple markets or on multiple exchanges are valued according to the broadest and most representative market. Certain equity securities are valued based upon fundamental characteristics or relationships to similar securities.
Investments in open-end mutual funds are valued at the closing NAV.
The Fund has procedures to determine the fair value of financial instruments for which market prices are not reliable or readily available. Under these procedures, the VLOC convenes on a regular basis to review such financial instruments and considers a number of factors, including significant unobservable valuation inputs, when arriving at fair value. The VLOC primarily employs a market-based approach which may use related or comparable assets or liabilities, recent transactions, market multiples, book values, and other relevant information for the investment to determine the fair value of the investment. An income-based valuation approach may also be used in which the anticipated future cash flows of the investment are discounted to calculate fair value. Discounts may also be applied due to the nature or duration of any restrictions on the disposition of the investments. Due to the inherent uncertainty of valuations of such investments, the fair values may differ significantly from the values that would have been used had an active market existed. The VLOC employs various methods for calibrating these valuation approaches including a regular review of key inputs and assumptions, transactional back-testing or disposition analysis, and reviews of any related market activity.
Trading in securities on foreign securities stock exchanges and OTC markets may be completed before 4 p.m. Eastern time. In addition, trading in certain foreign markets may not take place on every NYSE business day. Occasionally, events occur between the time at which trading in a foreign security is completed and the close of the NYSE that might call into question the reliability of the value of a portfolio security held by the Fund. As a result, differences may arise between the value of the Fund’s portfolio securities as determined at the foreign market close and the latest indications of value at the close of
FRANKLIN TEMPLETON VARIABLE INSURANCE PRODUCTS TRUST
NOTES TO FINANCIAL STATEMENTS
Franklin Small-Mid Cap Growth VIP Fund (continued)
the NYSE. In order to minimize the potential for these differences, the VLOC monitors price movements following the close of trading in foreign stock markets through a series of country specific market proxies (such as baskets of American Depositary Receipts, futures contracts and exchange traded funds). These price movements are measured against established trigger thresholds for each specific market proxy to assist in determining if an event has occurred that may call into question the reliability of the values of the foreign securities held by the Fund. If such an event occurs, the securities may be valued using fair value procedures, which may include the use of independent pricing services.
When the last day of the reporting period is a non-business day, certain foreign markets may be open on those days that the NYSE is closed, which could result in differences between the value of the Fund’s portfolio securities on the last business day and the last calendar day of the reporting period. Any significant security valuation changes due to an open foreign market are adjusted and reflected by the Fund for financial reporting purposes.
b. Foreign Currency Translation
Portfolio securities and other assets and liabilities denominated in foreign currencies are translated into U.S. dollars based on the exchange rate of such currencies against U.S. dollars on the date of valuation. The Fund may enter into foreign currency exchange contracts to facilitate transactions denominated in a foreign currency. Purchases and sales of securities, income and expense items denominated in foreign currencies are translated into U.S. dollars at the exchange rate in effect on the transaction date. Portfolio securities and assets and liabilities denominated in foreign currencies contain risks that those currencies will decline in value relative to the U.S. dollar. Occasionally, events may impact the availability or reliability of foreign exchange rates used to convert the U.S. dollar equivalent value. If such an event occurs, the foreign exchange rate will be valued at fair value using procedures established and approved by the Board.
The Fund does not separately report the effect of changes in foreign exchange rates from changes in market prices on securities held. Such changes are included in net realized and unrealized gain or loss from investments in the Statement of Operations.
Realized foreign exchange gains or losses arise from sales of foreign currencies, currency gains or losses realized between the trade and settlement dates on securities transactions and the
difference between the recorded amounts of dividends, interest, and foreign withholding taxes and the U.S. dollar equivalent of the amounts actually received or paid. Net unrealized foreign exchange gains and losses arise from changes in foreign exchange rates on foreign denominated assets and liabilities other than investments in securities held at the end of the reporting period.
c. Securities Lending
The Fund participates in an agency based securities lending program to earn additional income. The Fund receives cash collateral against the loaned securities in an amount equal to at least 102% of the fair value of the loaned securities. Collateral is maintained over the life of the loan in an amount not less than 100% of the fair value of loaned securities, as determined at the close of Fund business each day; any additional collateral required due to changes in security values is delivered to the Fund on the next business day. The collateral is deposited into a joint cash account with other funds and is used to invest in a money market fund managed by Franklin Advisers, Inc., an affiliate of the Fund. The Fund may receive income from the investment of cash collateral, in addition to lending fees and rebates paid by the borrower. Income from securities loaned is reported separately in the Statement of Operations. The Fund bears the market risk with respect to the collateral investment, securities loaned, and the risk that the agent may default on its obligations to the Fund. If the borrower defaults on its obligation to return the securities loaned, the Fund has the right to repurchase the securities in the open market using the collateral received. The securities lending agent has agreed to indemnify the Fund in the event of default by a third party borrower.
Securities lending transactions are accounted for as secured borrowing transactions. The securities out on loan represent the collateral pledged by the Fund, and the cash collateral received for the loaned securities represents the amount borrowed by the Fund. At December 31, 2015, the Fund’s secured borrowing transactions were as follows:
| | | | |
Securities lending transactionsa | | | | |
Equity investmentsb | | $ | 19,891,250 | |
| | | | |
aThe agreements open at year end can be terminated at any time.
bGross amount of recognized liabilities for securities lending transactions is included in payable upon return of securities loaned in the Statement of Assets and Liabilities.
FRANKLIN TEMPLETON VARIABLE INSURANCE PRODUCTS TRUST
NOTES TO FINANCIAL STATEMENTS
Franklin Small-Mid Cap Growth VIP Fund (continued)
1. Organization and Significant Accounting Policies (continued)
d. Income and Deferred Taxes
It is the Fund’s policy to qualify as a regulated investment company under the Internal Revenue Code. The Fund intends to distribute to shareholders substantially all of its taxable income and net realized gains to relieve it from federal income and if applicable, excise taxes. As a result, no provision for U.S. federal income taxes is required.
The Fund may be subject to foreign taxation related to income received, capital gains on the sale of securities and certain foreign currency transactions in the foreign jurisdictions in which it invests. Foreign taxes, if any, are recorded based on the tax regulations and rates that exist in the foreign markets in which the Fund invests. When a capital gain tax is determined to apply, the Fund records an estimated deferred tax liability in an amount that would be payable if the securities were disposed of on the valuation date.
The Fund may recognize an income tax liability related to its uncertain tax positions under U.S. GAAP when the uncertain tax position has a less than 50% probability that it will be sustained upon examination by the tax authorities based on its technical merits. As of December 31, 2015, the Fund has determined that no tax liability is required in its financial statements related to uncertain tax positions for any open tax years (or expected to be taken on future tax returns). Open tax years are those that remain subject to examination and are based on each tax jurisdiction’s statute of limitation.
e. Security Transactions, Investment Income, Expenses and Distributions
Security transactions are accounted for on trade date. Realized gains and losses on security transactions are determined on a specific identification basis. Estimated expenses are accrued daily. Dividend income is recorded on the ex-dividend date except for certain dividends from foreign securities where the dividend rate is not available. In such cases, the dividend is recorded as soon as the information is received by the Fund.
Distributions to shareholders are recorded on the ex-dividend date and are determined according to income tax regulations (tax basis). Distributable earnings determined on a tax basis may differ from earnings recorded in accordance with U.S. GAAP. These differences may be permanent or temporary. Permanent differences are reclassified among capital accounts to reflect their tax character. These reclassifications have no impact on net assets or the results of operations. Temporary differences are not reclassified, as they may reverse in subsequent periods.
Common expenses incurred by the Trust are allocated among the Funds based on the ratio of net assets of each Fund to the combined net assets of the Trust. Fund specific expenses are charged directly to the fund that incurred the expense.
Realized and unrealized gains and losses and net investment income, not including class specific expenses, are allocated daily to each class of shares based upon the relative proportion of net assets of each class. Differences in per share distributions, by class, are generally due to differences in class specific expenses.
f. Accounting Estimates
The preparation of financial statements in accordance with U.S. GAAP requires management to make estimates and assumptions that affect the reported amounts of assets and liabilities at the date of the financial statements and the amounts of income and expenses during the reporting period. Actual results could differ from those estimates.
g. Guarantees and Indemnifications
Under the Trust’s organizational documents, its officers and trustees are indemnified by the Trust against certain liabilities arising out of the performance of their duties to the Trust. Additionally, in the normal course of business, the Trust, on behalf of the Fund, enters into contracts with service providers that contain general indemnification clauses. The Trust’s maximum exposure under these arrangements is unknown as this would involve future claims that may be made against the Trust that have not yet occurred. Currently, the Trust expects the risk of loss to be remote.
FRANKLIN TEMPLETON VARIABLE INSURANCE PRODUCTS TRUST
NOTES TO FINANCIAL STATEMENTS
Franklin Small-Mid Cap Growth VIP Fund (continued)
2. Shares of Beneficial Interest
At December 31, 2015, there were an unlimited number of shares authorized (without par value). Transactions in the Fund’s shares were as follows:
| | | | | | | | | | | | | | | | | | |
| | | Year Ended December 31, | |
| | | 2015 | | | | | 2014 | |
| | | Shares | | | Amount | | | | | Shares | | | Amount | |
| | | | | |
| Class 1 Shares: | | | | | | | | | | | | | | | | | | |
Shares sold | | | 195,710 | | | $ | 4,581,670 | | | | | | 274,487 | | | $ | 7,229,775 | |
Shares issued in reinvestment of distributions | | | 1,062,262 | | | | 22,509,343 | | | | | | 759,699 | | | | 18,164,400 | |
Shares redeemed | | | (655,587 | ) | | | (14,610,806 | ) | | | | | (487,310 | ) | | | (12,735,194 | ) |
| | | | |
Net increase (decrease) | | | 602,385 | | | $ | 12,480,207 | | | | | | 546,876 | | | $ | 12,658,981 | |
| | | | |
| Class 2 Shares: | | | | | | | | | | | | | | | | | | |
Shares sold | | | 1,198,268 | | | $ | 26,202,656 | | | | | | 897,666 | | | $ | 22,309,519 | |
Shares issued in reinvestment of distributions | | | 6,905,322 | | | | 135,758,632 | | | | | | 5,327,162 | | | | 120,447,127 | |
Shares redeemed | | | (5,776,970 | ) | | | (120,003,185 | ) | | | | | (5,821,755 | ) | | | (143,225,718 | ) |
| | | | |
Net increase (decrease) | | | 2,326,620 | | | $ | 41,958,103 | | | | | | 403,073 | | | $ | (469,072 | ) |
| | | | |
| Class 4 Shares: | | | | | | | | | | | | | | | | | | |
Shares sold | | | 239,982 | | | $ | 5,202,958 | | | | | | 67,020 | | | $ | 1,726,663 | |
Shares issued in reinvestment of distributions | | | 202,211 | | | | 4,098,814 | | | | | | 152,628 | | | | 3,536,394 | |
Shares redeemed | | | (292,263 | ) | | | (6,050,381 | ) | | | | | (231,062 | ) | | | (5,725,821 | ) |
| | | | |
Net increase (decrease) | | | 149,930 | | | $ | 3,251,391 | | | | | | (11,414 | ) | | $ | (462,764 | ) |
| | | | |
3. Transactions With Affiliates
Franklin Resources, Inc. is the holding company for various subsidiaries that together are referred to as Franklin Templeton Investments. Certain officers and trustees of the Fund are also officers and/or directors of the following subsidiaries:
| | |
| Subsidiary | | Affiliation |
Franklin Advisers, Inc. (Advisers) | | Investment manager |
Franklin Templeton Services, LLC (FT Services) | | Administrative manager |
Franklin Templeton Distributors, Inc. (Distributors) | | Principal underwriter |
Franklin Templeton Investor Services, LLC (Investor Services) | | Transfer agent |
FRANKLIN TEMPLETON VARIABLE INSURANCE PRODUCTS TRUST
NOTES TO FINANCIAL STATEMENTS
Franklin Small-Mid Cap Growth VIP Fund (continued)
3. Transactions With Affiliates (continued)
a. Management Fees
The Fund pays an investment management fee to Advisers based on the average daily net assets of the Fund as follows:
| | |
| Annualized Fee Rate | | Net Assets |
0.800% | | Up to and including $500 million |
0.700% | | Over $500 million, up to and including $1 billion |
0.650% | | Over $1 billion, up to and including $1.5 billion |
0.600% | | Over $1.5 billion, up to and including $6.5 billion |
0.575% | | Over $6.5 billion, up to and including $11.5 billion |
0.550% | | Over $11.5 billion, up to and including $16.5 billion |
0.540% | | Over $16.5 billion, up to and including $19 billion |
0.530% | | Over $19 billion, up to and including $21.5 billion |
0.520% | | In excess of $21.5 billion |
b. Administrative Fees
Under an agreement with Advisers, FT Services provides administrative services to the Fund. The fee is paid by Advisers based on the Fund’s average daily net assets, and is not an additional expense of the Fund.
c. Distribution Fees
The Board has adopted distribution plans for Class 2 and Class 4 shares pursuant to Rule 12b-1 under the 1940 Act. Under the Fund’s compensation distribution plans, the Fund pays Distributors for costs incurred in connection with the servicing, sale and distribution of the Fund’s shares up to 0.35%, per year of its average daily net assets of each class. The Board has agreed to limit the current rate to 0.25% per year for Class 2. The plan year, for purposes of monitoring compliance with the maximum annual plan rates, is February 1 through January 31.
d. Transfer Agent Fees
Investor Services, under terms of an agreement, performs shareholder servicing for the Fund and is not paid by the Fund for the services.
e. Investments in Affiliated Management Investment Companies
The Fund invests in an affiliated management investment company for purposes other than exercising a controlling influence over the management or policies. Management fees paid by the Fund are waived on assets invested in the affiliated management investment company, as noted in the Statement of Operations, in an amount not to exceed the management and administrative fees paid directly or indirectly by each affiliate. Prior to January 1, 2014, the waiver was accounted for as a reduction to management fees.
| | | | | | | | | | | | | | | | | | | | | | | | | | | | | | | | |
| | | Number
of Shares
Held at
Beginning
of Year | | | Gross
Additions | | | Gross
Reductions | | | Number
of Shares
Held at
End of
Year | | | Value at
End of
Year | | | Investment
Income | | | Realized
Gain
(Loss) | | | % of
Affiliated
Fund Shares
Outstanding
Held at End
of Year | |
| Non-Controlled Affiliates | | | | | | | | | | | | | | | | | | | | | | | | | | | | | | | | |
Institutional Fiduciary Trust Money Market Portfolio | | | 12,577,150 | | | | 309,811,290 | | | | (289,245,272 | ) | | | 33,143,168 | | | $ | 33,143,168 | | | $ | — | | | $ | — | | | | 0.17% | |
| | | | | | | | | | | | | | | | | | | | | | | | |
FRANKLIN TEMPLETON VARIABLE INSURANCE PRODUCTS TRUST
NOTES TO FINANCIAL STATEMENTS
Franklin Small-Mid Cap Growth VIP Fund (continued)
f. Interfund Transactions
The Fund engaged in purchases and sales of investments with funds or other accounts that have a common investment manager (or affiliated investment managers), directors, trustees, or officers. These transactions complied with Rule 17a-7 under the 1940 Act. During the year ended December 31, 2015, the purchase and sale transactions aggregated $516,731 and $1,690,052, respectively.
4. Expense Offset Arrangement
The Fund has entered into an arrangement with its custodian whereby credits realized as a result of uninvested cash balances are used to reduce a portion of the Fund’s custodian expenses. During the year ended December 31, 2015, there were no credits earned.
5. Income Taxes
The tax character of distributions paid during the years ended December 31, 2015 and 2014, was as follows:
| | | | | | | | |
| | | 2015 | | | 2014 | |
Distributions paid from: | | | | | | | | |
Ordinary income | | $ | 11,955,020 | | | $ | 16,670,971 | |
Long term capital gain | | | 150,411,769 | | | | 125,476,950 | |
| | | | |
| | $ | 162,366,789 | | | $ | 142,147,921 | |
| | | | |
At December 31, 2015, the cost of investments, net unrealized appreciation (depreciation) and undistributed long term capital gains for income tax purposes were as follows:
| | | | |
Cost of investments | | $ | 466,000,210 | |
| | | | |
Unrealized appreciation | | $ | 169,237,961 | |
Unrealized depreciation | | | (33,202,879 | ) |
| | | | |
Net unrealized appreciation (depreciation) | | $ | 136,035,082 | |
| | | | |
Distributable earnings – undistributed long term capital gains | | $ | 62,763,457 | |
| | | | |
Differences between income and/or capital gains as determined on a book basis and a tax basis are primarily due to differing treatments of wash sales.
6. Investment Transactions
Purchases and sales of investments (excluding short term securities) for the year ended December 31, 2015, aggregated $249,107,439 and $361,218,142, respectively.
7. Restricted Securities
The Fund invests in securities that are restricted under the Securities Act of 1933 (1933 Act) or which are subject to legal, contractual, or other agreed upon restrictions on resale. Restricted securities are often purchased in private placement transactions, and cannot be sold without prior registration unless the sale is pursuant to an exemption under the 1933 Act. Disposal of these securities may require greater effort and expense, and prompt sale at an acceptable price may be difficult. The Fund may have registration rights for restricted securities. The issuer generally incurs all registration costs.
FRANKLIN TEMPLETON VARIABLE INSURANCE PRODUCTS TRUST
NOTES TO FINANCIAL STATEMENTS
Franklin Small-Mid Cap Growth VIP Fund (continued)
7. Restricted Securities (continued)
At December 31, 2015, the Fund held investments in restricted securities, excluding certain securities exempt from registration under the 1933 Act deemed to be liquid, as follows:
| | | | | | | | | | | | | | |
| Shares | | Issuer | | Acquisition
Date | | | Cost | | | Value | |
| 115,528 | | DraftKings Inc., pfd., D | | | 8/07/15 | | | $ | 622,222 | | | $ | 311,110 | |
| 284,105 | | DraftKings Inc., pfd., D-1 | | | 8/07/15 | | | | 2,177,781 | | | | 1,088,891 | |
| | | | | | | | | | |
| | Total Restricted Securities (Value is 0.24% of Net Assets) | | | | | | $ | 2,800,003 | | | $ | 1,400,001 | |
| | | | | | | | | | |
8. Credit Facility
The Fund, together with other U.S. registered and foreign investment funds (collectively, Borrowers), managed by Franklin Templeton Investments, are borrowers in a joint syndicated senior unsecured credit facility totaling $2 billion (Global Credit Facility) which matured on February 12, 2016. This Global Credit Facility provides a source of funds to the Borrowers for temporary and emergency purposes, including the ability to meet future unanticipated or unusually large redemption requests. Effective February 12, 2016, the Borrowers renewed the Global Credit Facility for a one year term, maturing February 10, 2017, for a total of $2 billion.
Under the terms of the Global Credit Facility, the Fund shall, in addition to interest charged on any borrowings made by the Fund and other costs incurred by the Fund, pay its share of fees and expenses incurred in connection with the implementation and maintenance of the Global Credit Facility, based upon its relative share of the aggregate net assets of all of the Borrowers, including an annual commitment fee of 0.07% based upon the unused portion of the Global Credit Facility. Effective February 12, 2016, the annual commitment fee is 0.15%. These fees are reflected in other expenses in the Statement of Operations. During the year ended December 31, 2015, the Fund did not use the Global Credit Facility.
9. Fair Value Measurements
The Fund follows a fair value hierarchy that distinguishes between market data obtained from independent sources (observable inputs) and the Fund’s own market assumptions (unobservable inputs). These inputs are used in determining the value of the Fund’s financial instruments and are summarized in the following fair value hierarchy:
| | • | | Level 1 – quoted prices in active markets for identical financial instruments |
| | • | | Level 2 – other significant observable inputs (including quoted prices for similar financial instruments, interest rates, prepayment speed, credit risk, etc.) |
| | • | | Level 3 – significant unobservable inputs (including the Fund’s own assumptions in determining the fair value of financial instruments) |
The input levels are not necessarily an indication of the risk or liquidity associated with financial instruments at that level.
For movements between the levels within the fair value hierarchy, the Fund has adopted a policy of recognizing the transfers as of the date of the underlying event which caused the movement.
FRANKLIN TEMPLETON VARIABLE INSURANCE PRODUCTS TRUST
NOTES TO FINANCIAL STATEMENTS
Franklin Small-Mid Cap Growth VIP Fund (continued)
A summary of inputs used as of December 31, 2015, in valuing the Fund’s assets carried at fair value, is as follows:
| | | | | | | | | | | | | | | | |
| | | Level 1 | | | Level 2 | | | Level 3 | | | Total | |
| | | | |
| Assets: | | | | | | | | | | | | | | | | |
Investments in Securities: | | | | | | | | | | | | | | | | |
Equity Investments:a | | | | | | | | | | | | | | | | |
Consumer Discretionary | | $ | 103,776,170 | | | $ | — | | | $ | 1,400,001 | | | $ | 105,176,171 | |
Health Care | | | 117,218,889 | | | | — | | | | 297,903 | | | | 117,516,792 | |
Other Equity Investmentsb | | | 346,199,161 | | | | — | | | | — | | | | 346,199,161 | |
Short Term Investments | | | 33,143,168 | | | | — | | | | — | | | | 33,143,168 | |
| | | | |
Total Investments in Securities | | $ | 600,337,388 | | | $ | — | | | $ | 1,697,904 | | | $ | 602,035,292 | |
| | | | |
a Includes common and preferred stocks as well as other equity investments.
b For detailed categories, see the accompanying Statement of Investments.
A reconciliation of assets in which Level 3 inputs are used in determining fair value is presented when there are significant Level 3 financial instruments at the end of the year.
10. Subsequent Events
The Fund has evaluated subsequent events through the issuance of the financial statements and determined that no events have occurred that require disclosure other than those already disclosed in the financial statements.
FRANKLIN TEMPLETON VARIABLE INSURANCE PRODUCTS TRUST
Report of Independent Registered Public Accounting Firm
Franklin Small-Mid Cap Growth VIP Fund
To the Board of Trustees and Shareholders of Franklin Templeton Variable Insurance Products Trust
In our opinion, the accompanying statement of assets and liabilities, including the statement of investments, and the related statements of operations and of changes in net assets and the financial highlights present fairly, in all material respects, the financial position of Franklin Small-Mid Cap Growth VIP Fund (the “Fund”) at December 31, 2015, the results of its operations for the year then ended, the changes in its net assets for each of the two years in the period then ended and the financial highlights for each of the periods presented, in conformity with accounting principles generally accepted in the United States of America. These financial statements and financial highlights (hereafter referred to as “financial statements”) are the responsibility of the Fund’s management. Our responsibility is to express an opinion on these financial statements based on our audit. We conducted our audit of these financial statements in accordance with the standards of the Public Company Accounting Oversight Board (United States). Those standards require that we plan and perform the audit to obtain reasonable assurance about whether the financial statements are free of material misstatement. An audit includes examining, on a test basis, evidence supporting the amounts and disclosures in the financial statements, assessing the accounting principles used and significant estimates made by management, and evaluating the overall financial statement presentation. We believe that our audit, which included confirmation of securities at December 31, 2015 by correspondence with the custodian, transfer agent and brokers, provides a reasonable basis for our opinion.
PricewaterhouseCoopers LLP
San Francisco, California
February 16, 2016
FRANKLIN TEMPLETON VARIABLE INSURANCE PRODUCTS TRUST
Tax Information (unaudited)
Franklin Small-Mid Cap Growth VIP Fund
Under Section 852(b)(3)(C) of the Internal Revenue Code (Code), the Fund hereby reports the maximum amount allowable but no less than $150,411,769 as a long term capital gain dividend for the fiscal year ended December 31, 2015.
Under Section 854(b)(1)(A) of the Code, the Fund hereby reports 33.54% of the ordinary income dividends as income qualifying for the dividends received deduction for the fiscal year ended December 31, 2015.
Franklin Strategic Income VIP Fund
This annual report for Franklin Strategic Income VIP Fund covers the fiscal year ended December 31, 2015.
Class 4 Performance Summary as of December 31, 2015
Average annual total return of Class 4 shares* represents the average annual change in value, assuming reinvestment of dividends and capital gains. Average returns smooth out variations in returns, which can be significant; they are not the same as year-by-year results.
| | | | | | | | | | | | |
| Periods ended 12/31/15 | | 1-Year | | | 5-Year | | | 10-Year | |
Average Annual Total Return | | | -3.98% | | | | +3.08% | | | | +5.17% | |
*For the period beginning 2/29/08, Class 4 performance reflects a 12b-1 fee expense of 0.35% per year, which affects future performance. Class 4 performance prior to 2/29/08 reflects historical Class 1 performance, which does not have a 12b-1 fee expense. Since 2/29/08 (effective date), the average annual total return of Class 4 shares was +4.67%. The Fund has a fee waiver associated with any investment in a Franklin Templeton money fund, contractually guaranteed through at least its current fiscal year-end. Fund investment results reflect the fee waiver, to the extent applicable; without this reduction, the results would have been lower.
Performance reflects the Fund’s Class 4 operating expenses, but does not include any contract fees, expenses or sales charges. If they had been included, performance would be lower. These charges and deductions, particularly for variable life policies, can have a significant effect on contract values and insurance benefits. See the contract prospectus for a complete description of these expenses, including sales charges.
Performance data represent past performance, which does not guarantee future results. Investment return and principal value will fluctuate, and you may have a gain or loss when you sell your shares. Current performance may differ from figures shown.
Total Return Index Comparison for a Hypothetical $10,000 Investment (1/1/06–12/31/15)
The graph below shows the change in value of a hypothetical $10,000 investment in the Fund over the indicated period and includes reinvestment of any income or distributions. The Fund’s performance* is compared to the performance of the Barclays U.S. Aggregate Bond Index and the Lipper Multi-Sector Income Funds Classification Average. One cannot invest directly in an index, and an index is not representative of the Fund’s portfolio. Please see Important Notes to Performance Information preceding the Fund Summaries.
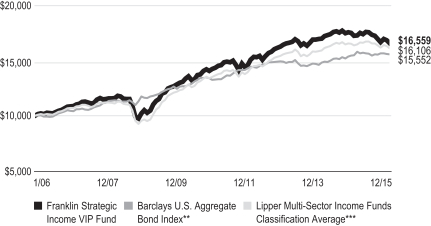
**Source: Morningstar. Please see Index Descriptions following the Fund Summaries.
***Source: Lipper, a Thomson Reuters Company. Please see Index Descriptions following the Fund Summaries.
FRANKLIN STRATEGIC INCOME VIP FUND
Fund Goals and Main Investments
The Fund seeks a high level of current income, with capital appreciation over the long term as a secondary goal. Under normal market conditions, the Fund invests primarily to predominantly in U.S. and foreign debt securities, including those in emerging markets.
Fund Risks
All investments involve risks, including possible loss of principal. Bond prices generally move in the opposite direction of interest rates. Thus, as prices of bonds in the Fund adjust to a rise in interest rates, the Fund’s share price may decline. Changes in the financial strength of a bond issuer or in a bond’s credit rating may affect its value. High yields reflect the higher credit risks associated with certain lower rated securities held in the portfolio. Floating rate loans and high yield corporate bonds are rated below investment grade and are subject to greater risk of default, which could result in loss of principal — a risk that may be heightened in a slowing economy. The risks of foreign securities include currency fluctuations and political uncertainty. Investments in developing markets involve heightened risks related to the same factors, in addition to those associated with their relatively small size and lesser liquidity. Investing in derivative securities and the use of foreign currency techniques involve special risks as such may not achieve the anticipated benefits and/or may result in losses to the Fund. The Fund is actively managed but there is no guarantee that the manager’s investment decisions will produce the desired results. The Fund’s prospectus also includes a description of the main investment risks.
Performance Overview
You can find the Fund’s one-year total return in the Performance Summary. For comparison, the Fund’s benchmark, the Barclays U.S. Aggregate Bond Index, posted a +0.55% total return for the period under review.1 The Fund’s peers, as measured by the Lipper Multi-Sector Income Funds Classification Average, had a -1.68% return.2
Economic and Market Overview
The U.S. economy grew moderately during the 12 months under review amid healthy consumer spending. After starting 2015 with modest growth, the economy strengthened in the second
quarter but moderated in the third and fourth quarters as exports slowed and state and local governments reduced their spending. Manufacturing activities expanded for most of the period but contracted toward period-end. Non-manufacturing activities, however, expanded throughout the 12-month period, contributing to new jobs and helping drive down the unemployment rate to 5.0% from October through period-end, the lowest level in more than seven years.3 The housing market improved at period-end as new and existing home sales increased and home prices rose despite slightly higher mortgage rates. Retail sales grew modestly, led by automobile and auto component sales. Annual inflation, as measured by the Consumer Price Index, remained subdued largely due to low energy prices.
After maintaining a near-zero interest rate for seven years to support the U.S. economy’s recovery, the Federal Reserve (Fed) raised its target range for the federal funds rate to 0.25%–0.50% at its December meeting. Policymakers cited the labor market’s considerable improvement and were reasonably confident that inflation would move back to the Fed’s 2% medium-term objective. The Fed indicated that its process of normalizing interest rates would be data dependent and would likely be gradual. Furthermore, the Fed raised its 2016 U.S. economic growth forecast and lowered its unemployment rate projection.
The 10-year Treasury yield, which moves inversely to price, fluctuated throughout the period. It began the period at 2.17%, declined to a period low of 1.68% in late January 2015 and ended the period at 2.27%. For much of the year, the yield movements appeared to reflect investor uncertainty given concerns about domestic data, geopolitical tensions, the Fed’s timing for raising interest rates and events in China. However, near period-end, decreasing concerns over China’s economy and the Fed’s decision to increase interest rates supported Treasury yields.
After volatility early in 2015, global markets began to stabilize in February as oil prices halted their decline and leveled off to a more stable range. Credit spreads tightened while bond yields increased across much of the globe. However, global volatility returned at the end of June as economic concerns over China spread across global financial markets. Several emerging market currencies depreciated sharply against the U.S. dollar based on heightened risk aversion, while the euro and Japanese yen appreciated at times, acting as perceived safe havens. Several emerging market currencies rebounded and appreciated against the U.S. dollar in October while the euro and yen depreciated.
1. Source: Morningstar.
2. Source: Lipper, a Thomson Reuters Company.
One cannot invest directly in an index, and an index is not representative of the Fund’s portfolio. Please see Index Descriptions following the Fund Summaries.
3. Source: Bureau of Labor Statistics.
FRANKLIN STRATEGIC INCOME VIP FUND
Similar stabilizing trends continued through November until global risk aversion returned in December.
On the whole, the U.S. dollar broadly strengthened against developed and emerging market currencies during the 12-month period. Global bond yields and spread levels fluctuated, with an overall trend toward higher yields across the Americas and eurozone but lower yields in specific peripheral European markets. Across much of East Asia and in Japan yields declined during the period; however, yields increased across a number of countries in South and Southeast Asia. Credit spreads widened across a vast majority of global credit markets during the period.
Investment Strategy
We allocate our investments among the various types of debt available based on our assessment of changing economic, global market, industry and issuer conditions. We use a top-down analysis of macroeconomic trends, combined with a bottom-up fundamental analysis of market sectors, industries and issuers, seeking to take advantage of varying sector reactions to economic events. For example, we may evaluate business cycles, yield curves, country risk, and the relative interest rates among currencies, and values between and within markets. In selecting debt securities, we generally conduct our own analysis of the security’s intrinsic value rather than simply relying on the coupon rate or rating. We may also enter into various transactions involving certain currency-, interest rate- or credit-related derivative instruments.
What is the yield curve?
The yield curve is a line that plots the interest rates, at a set point in time, of bonds having equal credit quality but differing maturity rates. The most frequently reported yield curve compares three-month, two-year and 30-year U.S. Treasury debt.
Manager’s Discussion
Over the past year, financial market volatility rose due to several driving forces. Although U.S. economic growth showed underlying strength and Europe continued to show signs of recovery, the outlook across many emerging markets became cloudier, reflected by market concerns of a potentially more significant slowdown in Chinese economic growth. In addition, continued supply increases in production from the Organization of the Petroleum Exporting Countries weighed on oil prices, and other commodities also weakened, further dampening the economic outlook for countries with significant commodity exports. In terms of government financial policy, while Europe and Japan continued to support their quantitative easing programs, during September the Fed surprised the financial
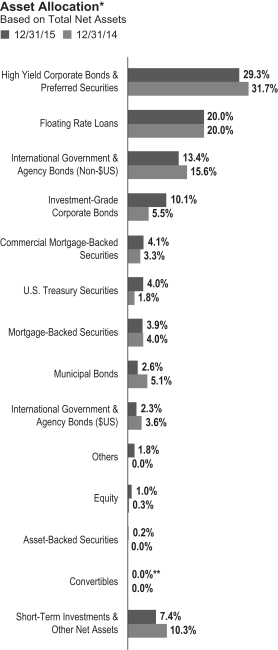
*Figures reflect certain derivatives held in the portfolio (or their underlying reference assets) and may not total 100% or may be negative due to rounding, use of any derivatives, unsettled trades or other factors. The breakdown may not match the Statement of Investments (SOI).
**Rounds to less than 0.1%.
The dollar value, number of shares or principal amount, and names of all portfolio holdings are listed in the Fund’s SOI.
markets by not increasing interest rates as it alluded to concerns over global economic growth and heightened financial market volatility. Although in December the Fed ultimately initiated its first short-term rate increase since 2006, financial markets
FRANKLIN STRATEGIC INCOME VIP FUND
nonetheless ended 2015 with a risk-averse tone. In this environment, developed market government bond yields generally remained at nominally low levels, although longer U.S. rates rose slightly following a Treasury sell-off in October and early November. At the same time, equity markets came under significant pressure during the third quarter but rebounded by year-end, allowing the Standard & Poor’s® 500 Index to deliver a slightly positive total return for 2015.4 With the prospect for U.S. growth and the potential for domestic short-term rate increases, the U.S. dollar strengthened during the reporting period versus certain developed and developing market currencies.
The Fund posted a negative total return for the review period, underperforming its peers in the Lipper Multi-Sector Income Funds Classification Average as well as the more Treasury-sensitive Barclays U.S. Aggregate Bond Index. Although a flat to somewhat higher U.S. Treasury yield curve constrained performance from the more interest-rate sensitive fixed income sectors, the corporate sectors such as high yield, investment grade and leveraged loans generally experienced spread widening over the course of the year. Additionally, certain non-U.S. dollar government bond sectors, particularly in more commodity-oriented developing markets, underperformed due to a stronger U.S. dollar. Consequently, relative to the Fund’s benchmarks, the Fund’s heavier weighting in high yield, senior secured floating rate debt and global bonds detracted from performance, as did the Fund’s lower U.S. interest-rate duration exposure. Conversely, certain currency positions and foreign government bonds aided returns.
What is duration?
Duration is a measure of a bond’s price sensitivity to interest rate changes. In general, a portfolio of securities with a lower duration can be expected to be less sensitive to interest rate changes than a portfolio with a higher duration.
In the corporate bond sector, 2015 earnings continued to be negatively impacted by the strength of the U.S. dollar combined with significant weakness in commodity-oriented sectors. Although high yield default rates increased slightly from their cycle lows, overall trailing defaults remained below historical averages. Merger and acquisition activity remained active, although many acquisitions were proposed by strategic buyers rather than through private-equity led leveraged buyouts. From a technical trading standpoint, investor redemptions from high yield and senior secured floating rate debt retail funds placed additional pressure on price levels in those sectors, while a
heavy 2015 supply calendar weighed on the investment-grade corporate market. As a result of these factors, yield spreads across the corporate sectors generally widened during the period. We expect stress on commodity-related issuers to lead to rising defaults rates going into 2016. However, at period-end we saw what we considered attractive longer term value in the high yield sector, which represented the Fund’s largest sector weighting. In our analysis, with spreads for investment-grade corporates cheap compared to their longer term averages, we added to this sector during the period. Finally, although we reduced our senior secured floating rate debt exposure modestly over the past year given the relative outperformance of the sector compared with high yield, at current valuations and considering that sector’s typically lower sensitivity to increases in interest rates, we maintained significant exposure to these securities.
Internationally, the U.S. dollar continued to generally strengthen during the period, negatively impacting our non-U.S. dollar global bond positions. However, certain currencies traded near historical lows relative to the U.S. dollar, which in our view created attractive long-term value. Consequently, while we reduced overall exposure to global bonds over the course of the year, we added to select positions in non-U.S. dollar government bonds during the latter half of the period. Weakness in the yen and euro benefited the Fund given our short positions in these currencies, which we maintained using currency forwards. Although the Fund held a fairly modest exposure to hard currency emerging market bonds, our position in Ukrainian debt securities contributed to Fund performance as bondholders negotiated a favorable exchange settlement with the Ukrainian government during the period.
What is a currency forward?
A currency forward is an agreement between the Fund and a counterparty to buy or sell a foreign currency at a specific exchange rate on a future date.
With relatively flat longer term U.S. rates, the more interest rate-sensitive fixed income sectors such as Treasuries, agencies and mortgage-backed securities generally posted modestly positive returns during the period. The Fund maintained a lower exposure to these sectors, but reduced its exposure to agency mortgage-backed securities and increased its weighting in Treasuries, commercial mortgage-backed securities and non-agency residential mortgage-backed securities. Similarly, municipal bonds provided relatively neutral returns for the Fund during the period and the Fund reduced its exposure to that
4. Please see Index Descriptions following the Fund Summaries.
FRANKLIN STRATEGIC INCOME VIP FUND
sector. Although headlines regarding the expected restructuring of Puerto Rico debt continued, the Fund’s Puerto Rico bonds provided mixed returns.
The portfolio utilized derivatives, including currency forwards and credit derivatives. Currency forwards are typically used to take long and short positions in currencies and as a tool to hedge currency risk. Credit derivatives can be used to hedge against credit risk or to otherwise enhance Fund returns by taking long or short positions in individual credits or baskets of credits in various sectors including in the corporate, municipal, sovereign and securitized markets.
Thank you for your participation in Franklin Strategic Income VIP Fund. We look forward to serving your future investment needs.
The foregoing information reflects our analysis, opinions and portfolio holdings as of December 31, 2015, the end of the reporting period. The way we implement our main investment strategies and the resulting portfolio holdings may change depending on factors such as market and economic conditions. These opinions may not be relied upon as investment advice or an offer for a particular security. The information is not a complete analysis of every aspect of any market, country, industry, security or the Fund. Statements of fact are from sources considered reliable, but the investment manager makes no representation or warranty as to their completeness or accuracy. Although historical performance is no guarantee of future results, these insights may help you understand our investment management philosophy.
FRANKLIN STRATEGIC INCOME VIP FUND
Class 4 Fund Expenses
As an investor in a variable insurance contract (Contract) that indirectly provides for investment in an underlying mutual fund, you can incur transaction and/or ongoing expenses at both the Fund level and the Contract level.
| • | | Transaction expenses can include sales charges (loads) on purchases, redemption fees, surrender fees, transfer fees and premium taxes. |
| • | | Ongoing expenses can include management fees, distribution and service (12b-1) fees, contract fees, annual maintenance fees, mortality and expense risk fees and other fees and expenses. All mutual funds and Contracts have some types of ongoing expenses. |
The expenses shown in the table are meant to highlight ongoing expenses at the Fund level only and do not include ongoing expenses at the Contract level, or transaction expenses at either the Fund or Contract level. While the Fund does not have transaction expenses, if the transaction and ongoing expenses at the Contract level were included, the expenses shown below would be higher. You should consult your Contract prospectus or disclosure document for more information.
The table shows Fund-level ongoing expenses and can help you understand these expenses and compare them with those of other mutual funds offered through the Contract. The table assumes a $1,000 investment held for the six months indicated. Please refer to the Fund prospectus for additional information on operating expenses.
Actual Fund Expenses
The first line (Actual) of the table provides actual account values and expenses. The “Ending Account Value” is derived from the Fund’s actual return, which includes the effect of ongoing Fund expenses, but does not include the effect of ongoing Contract expenses.
You can estimate the Fund-level expenses you incurred during the period by following these steps. Of course, your account value and expenses will differ from those in this illustration:
| 1. | Divide your account value by $1,000. |
If an account had an $8,600 value, then $8,600 ÷ $1,000 = 8.6.
| 2. | Multiply the result by the number under the heading “Fund-Level Expenses Incurred During Period.” |
If Fund-Level Expenses Incurred During Period were $7.50, then 8.6 × $7.50 = $64.50.
In this illustration, the estimated expenses incurred this period at the Fund level are $64.50.
Hypothetical Example for Comparison with Other Mutual Funds
Information in the second line (Hypothetical) of the table can help you compare ongoing expenses of the Fund with those of other mutual funds offered through the Contract. This information may not be used to estimate the actual ending account balance or expenses you incurred during the period. The hypothetical “Ending Account Value” is based on the Fund’s actual expense ratio and an assumed 5% annual rate of return before expenses, which does not represent the Fund’s actual return. The figure under the heading “Fund-Level Expenses Incurred During Period” shows the hypothetical expenses your account would have incurred under this scenario. You can compare this figure with the 5% hypothetical examples that appear in shareholder reports of other funds offered through a Contract.
| | | | | | | | | | | | |
| Class 4 | | Beginning Account Value 7/1/15 | | | Ending Account
Value 12/31/15 | | | Fund-Level Expenses
Incurred During Period* 7/1/15–12/31/15 | |
Actual | | | $1,000 | | | | $ 956.00 | | | | $4.78 | |
Hypothetical (5% return before expenses) | | | $1,000 | | | | $1,020.32 | | | | $4.94 | |
*Expenses are calculated using the most recent six-month annualized expense ratio, net of expense waivers, for the Fund’s Class 4 shares (0.97%), which does not include any ongoing expenses of the Contract for which the Fund is an investment option, multiplied by the average account value over the period, multiplied by 184/365 to reflect the one-half year period.
SUPPLEMENT DATED NOVEMBER 20, 2015
TOTHE CLASS 1, CLASS 2AND CLASS 4 PROSPECTUSES DATED MAY 1, 2015
OF
FRANKLIN STRATEGIC INCOME VIP FUND
(A series of Franklin Templeton Variable Insurance Products Trust)
The Class 1, Class 2 and Class 4 prospectuses are amended as follows:
I. The “Fund Details – Principal Investment Policies and Practices” section on page FSI-D1 of the prospectuses for Class 1, Class 2 and Class 4 shares is revised to add the following:
The Fund may invest in collateralized debt obligations (CDOs), which are generally types of asset-backed securities. Collateralized bond obligations (CBOs) and collateralized loan obligations (CLOs) are generally considered two types of CDOs. CBOs represent interests in a special purpose, bankruptcy-remote vehicle, typically a trust, collateralized by a pool of fixed income securities, some of which may be below investment grade, including commercial mortgage-backed securities, residential mortgage-backed securities, corporate bonds and emerging market debt securities. CLOs are similar to CBOs except that the underlying pool for a CLO is generally comprised of corporate and/or sovereign loans, which may include, among others, senior secured loans, senior unsecured loans, and subordinate corporate loans made to domestic and foreign borrowers, including loans that may be rated below investment grade or equivalent unrated loans. For the broader category of CDOs, the pool of debt instruments held by a trust may include debt instruments of any type, including mortgage-backed or other asset-backed securities issued in securitization transactions. In all types of CDOs, the interests in the trust are split into two or more portions, called tranches, varying in risk, maturity, payment priority and yield. The riskiest portion is the “equity” tranche, which is the first loss position to observe defaults from the collateral in the trust. Because they are partially protected from defaults, senior tranches of a CDO trust typically have higher ratings and lower yields than the underlying collateral securities held by the trust and can be rated investment grade. The Fund may invest in any tranche of a CDO excluding the “equity” tranche.
II. The “Fund Details – Principal Risks” section on page FSI-D6 of the prospectuses for Class 1, Class 2 and Class 4 shares is revised to add the following:
Collateralized Debt Obligations (CDOs)
The risks of an investment in a CDO depend largely on the type of collateral held by the special purpose entity (SPE) and the tranche of the CDO in which the Fund invests. Investment risk may also be affected by the performance of a CDO’s collateral manager (the entity responsible for selecting and managing the pool of collateral securities held by the SPE trust), especially during a period of market volatility. CDOs may be deemed to be illiquid securities and subject to the Fund’s restrictions on investments in illiquid securities. The Fund’s investment in CDOs will not receive the same investor protection as an investment in registered securities.
In addition, prices of CDO tranches can decline considerably. In addition to the normal risks associated with debt securities and asset backed securities (e.g., interest rate risk, credit risk and default risk), CDOs carry additional risks including, but not limited to: (i) the possibility
that distributions from collateral securities will not be adequate to make interest or other payments; (ii) the quality of the collateral may decline in value or quality or go into default or be downgraded; (iii) the Fund may invest in tranches of a CDO that are subordinate to other classes; and (iv) the complex structure of the security may not be fully understood at the time of investment and may produce disputes with the issuer, difficulty in valuing the security or unexpected investment results.
Please keep this supplement with your prospectus for future reference.
SUPPLEMENT DATED JANUARY 20, 2016
TOTHE PROSPECTUSES DATED MAY 1, 2015
OF
FRANKLIN STRATEGIC INCOME VIP FUND
(A series of Franklin Templeton Variable Insurance Products Trust)
Effective February 1, 2016, the Prospectus is amended as follows:
I. The section in the Fund Summary under the heading “Portfolio Managers” on page FSI-S6 is replaced with the following:
Portfolio Managers
Christopher J. Molumphy, CFA Executive Vice President and Director of Advisers and portfolio manager of the Fund since inception (1999).
Roger Bayston, CFA Senior Vice President of Advisers and portfolio manager of the Fund since 2015.
Patricia O’Connor, CFA Vice President of Advisers and portfolio manager of the Fund since February 2016.
II. In the Fund Details, under the heading “Management,” the portfolio manager information beginning on page FSI-D14 is replaced with the following:
The Fund is managed by a team of dedicated professionals focused on investments in U.S. and foreign debt securities. The portfolio managers of the team are as follows:
| | |
Christopher J. Molumphy, CFA Executive Vice President and Director of Advisers | | Mr. Molumphy has been a portfolio manager of the Fund since inception (1999). He joined Franklin Templeton Investments in 1988. |
| |
Roger Bayston, CFA Senior Vice President of Advisers | | Mr. Bayston has been a portfolio manager of the Fund since 2015. He joined Franklin Templeton Investments in 1991. |
| |
Patricia O’Connor, CFA Vice President of Advisers | | Ms. O’Connor has been a portfolio manager of the Fund since February 2016. She joined Franklin Templeton Investments in 1997. |
As co-lead portfolio managers, Messrs. Molumphy and Bayston are jointly and primarily responsible for the day-to-day management of the Fund’s portfolio. They have equal authority over all aspects of the Fund’s investment portfolio, including but not limited to, purchases and sales of individual securities, portfolio risk assessment, and the management of daily cash balances in accordance with anticipated investment management requirements. The degree to which each portfolio manager may perform these functions, and the nature of these functions,
may change from time to time. Ms. O’Connor provides the Fund with research and advice on the purchases and sales of individual securities, and portfolio risk assessment.
CFA® and Chartered Financial Analyst® are trademarks owned by CFA Institute.
Please keep this supplement with your prospectus for future reference.
FRANKLIN TEMPLETON VARIABLE INSURANCE PRODUCTS TRUST
Financial Highlights
Franklin Strategic Income VIP Fund
| | | | | | | | | | | | | | | | | | | | |
| | | Year Ended December 31, | |
| | | 2015 | | | 2014 | | | 2013 | | | 2012 | | | 2011 | |
| Class 1 | | | | | | | | | | | | | | | | | | | | |
Per share operating performance
(for a share outstanding throughout the year) | | | | | | | | | | | | | | | | | | | | |
| | | | | |
Net asset value, beginning of year | | | $11.90 | | | | $12.64 | | | | $13.17 | | | | $12.55 | | | | $12.99 | |
| | | | |
| | | | | |
| Income from investment operationsa: | | | | | | | | | | | | | | | | | | | | |
| | | | | |
Net investment incomeb | | | 0.53 | | | | 0.54 | | | | 0.59 | | | | 0.65 | | | | 0.69 | |
| | | | | |
Net realized and unrealized gains (losses) | | | (0.91 | ) | | | (0.25 | ) | | | (0.15 | ) | | | 0.92 | | | | (0.32 | ) |
| | | | |
Total from investment operations | | | (0.38 | ) | | | 0.29 | | | | 0.44 | | | | 1.57 | | | | 0.37 | |
| | | | |
| | | | | |
| Less distributions from: | | | | | | | | | | | | | | | | | | | | |
| | | | | |
Net investment income and net foreign currency gains | | | (0.77 | ) | | | (0.78 | ) | | | (0.80 | ) | | | (0.93 | ) | | | (0.81 | ) |
| | | | | |
Net realized gains | | | (0.20 | ) | | | (0.25 | ) | | | (0.17 | ) | | | (0.02 | ) | | | — | |
| | | | |
Total distributions | | | (0.97 | ) | | | (1.03 | ) | | | (0.97 | ) | | | (0.95 | ) | | | (0.81 | ) |
| | | | |
Net asset value, end of year | | | $10.55 | | | | $11.90 | | | | $12.64 | | | | $13.17 | | | | $12.55 | |
| | | | |
| | | | | |
Total returnc | | | (3.62)% | | | | 2.12% | | | | 3.52% | | | | 13.12% | | | | 2.78% | |
| | | | | |
| Ratios to average net assets | | | | | | | | | | | | | | | | | | | | |
| | | | | |
Expenses before waiver and payments by affiliates | | | 0.63% | | | | 0.63% | | | | 0.60% | | | | 0.58% | | | | 0.60% | |
| | | | | |
Expenses net of waiver and payments by affiliates | | | 0.62% | d | | | 0.62% | d | | | 0.60% | d | | | 0.58% | | | | 0.60% | d |
| | | | | |
Net investment income | | | 4.71% | | | | 4.34% | | | | 4.58% | | | | 5.04% | | | | 5.36% | |
| | | | | |
| Supplemental data | | | | | | | | | | | | | | | | | | | | |
| | | | | |
Net assets, end of year (000’s) | | | $441,658 | | | | $574,850 | | | | $705,493 | | | | $1,019,537 | | | | $1,043,690 | |
| | | | | |
Portfolio turnover rate | | | 85.85% | | | | 55.64% | | | | 48.06% | | | | 49.98% | | | | 55.65% | |
| | | | | |
Portfolio turnover rate excluding mortgage dollar rollse | | | 51.47% | | | | 48.86% | | | | 47.01% | | | | 48.75% | | | | 55.65% | |
aThe amount shown for a share outstanding throughout the period may not correlate with the Statement of Operations for the period due to the timing of sales and repurchases of the Fund’s shares in relation to income earned and/or fluctuating fair value of the investments of the Fund.
bBased on average daily shares outstanding.
cTotal return does not include fees, charges or expenses imposed by the variable annuity and life insurance contracts for which Franklin Templeton Variable Insurance Products Trust serves as an underlying investment vehicle.
dBenefit of expense reduction rounds to less than 0.01%.
eSee Note 1(h) regarding mortgage dollar rolls.
| | | | |
| | | The accompanying notes are an integral part of these financial statements. | Annual Report | | FSI-11 |
FRANKLIN TEMPLETON VARIABLE INSURANCE PRODUCTS TRUST
FINANCIAL HIGHLIGHTS
Franklin Strategic Income VIP Fund (continued)
| | | | | | | | | | | | | | | | | | | | |
| | | Year Ended December 31, | |
| | | 2015 | | | 2014 | | | 2013 | | | 2012 | | | 2011 | |
| Class 2 | | | | | | | | | | | | | | | | | | | | |
Per share operating performance
(for a share outstanding throughout the year) | | | | | | | | | | | | | | | | | | | | |
| | | | | |
Net asset value, beginning of year | | | $11.55 | | | | $12.30 | | | | $12.84 | | | | $12.27 | | | | $12.72 | |
| | | | |
| | | | | |
| Income from investment operationsa: | | | | | | | | | | | | | | | | | | | | |
| | | | | |
Net investment incomeb | | | 0.49 | | | | 0.49 | | | | 0.54 | | | | 0.60 | | | | 0.64 | |
| | | | | |
Net realized and unrealized gains (losses) | | | (0.89 | ) | | | (0.24 | ) | | | (0.13 | ) | | | 0.89 | | | | (0.30 | ) |
| | | | |
Total from investment operations | | | (0.40 | ) | | | 0.25 | | | | 0.41 | | | | 1.49 | | | | 0.34 | |
| | | | |
| | | | | |
| Less distributions from: | | | | | | | | | | | | | | | | | | | | |
| | | | | |
Net investment income and net foreign currency gains | | | (0.74 | ) | | | (0.75 | ) | | | (0.78 | ) | | | (0.90 | ) | | | (0.79 | ) |
| | | | | |
Net realized gains | | | (0.20 | ) | | | (0.25 | ) | | | (0.17 | ) | | | (0.02 | ) | | | — | |
| | | | |
Total distributions | | | (0.94 | ) | | | (1.00 | ) | | | (0.95 | ) | | | (0.92 | ) | | | (0.79 | ) |
| | | | |
Net asset value, end of year | | | $10.21 | | | | $11.55 | | | | $12.30 | | | | $12.84 | | | | $12.27 | |
| | | | |
| | | | | |
Total returnc | | | (3.87)% | | | | 1.86% | | | | 3.32% | | | | 12.75% | | | | 2.57% | |
| | | | | |
| Ratios to average net assets | | | | | | | | | | | | | | | | | | | | |
| | | | | |
Expenses before waiver and payments by affiliates | | | 0.88% | | | | 0.88% | | | | 0.85% | | | | 0.83% | | | | 0.85% | |
| | | | | |
Expenses net of waiver and payments by affiliates | | | 0.87% | d | | | 0.87% | d | | | 0.85% | d | | | 0.83% | | | | 0.85% | d |
| | | | | |
Net investment income | | | 4.46% | | | | 4.09% | | | | 4.33% | | | | 4.79% | | | | 5.11% | |
| | | | | |
| Supplemental data | | | | | | | | | | | | | | | | | | | | |
| | | | | |
Net assets, end of year (000’s) | | | $202,192 | | | | $206,571 | | | | $175,307 | | | | $158,451 | | | | $123,749 | |
| | | | | |
Portfolio turnover rate | | | 85.85% | | | | 55.64% | | | | 48.06% | | | | 49.98% | | | | 55.65% | |
| | | | | |
Portfolio turnover rate excluding mortgage dollar rollse | | | 51.47% | | | | 48.86% | | | | 47.01% | | | | 48.75% | | | | 55.65% | |
aThe amount shown for a share outstanding throughout the period may not correlate with the Statement of Operations for the period due to the timing of sales and repurchases of the Fund’s shares in relation to income earned and/or fluctuating fair value of the investments of the Fund.
bBased on average daily shares outstanding.
cTotal return does not include fees, charges or expenses imposed by the variable annuity and life insurance contracts for which Franklin Templeton Variable Insurance Products Trust serves as an underlying investment vehicle.
dBenefit of expense reduction rounds to less than 0.01%.
eSee Note 1(h) regarding mortgage dollar rolls.
| | | | |
| FSI-12 | | Annual Report | The accompanying notes are an integral part of these financial statements. | | |
FRANKLIN TEMPLETON VARIABLE INSURANCE PRODUCTS TRUST
FINANCIAL HIGHLIGHTS
Franklin Strategic Income VIP Fund (continued)
| | | | | | | | | | | | | | | | | | | | |
| | | Year Ended December 31, | |
| | | 2015 | | | 2014 | | | 2013 | | | 2012 | | | 2011 | |
| Class 4 | | | | | | | | | | | | | | | | | | | | |
Per share operating performance
(for a share outstanding throughout the year) | | | | | | | | | | | | | | | | | | | | |
| | | | | |
Net asset value, beginning of year | | | $11.78 | | | | $12.51 | | | | $13.04 | | | | $12.44 | | | | $12.88 | |
| | | | |
| | | | | |
| Income from investment operationsa: | | | | | | | | | | | | | | | | | | | | |
| | | | | |
Net investment incomeb | | | 0.49 | | | | 0.49 | | | | 0.54 | | | | 0.60 | | | | 0.64 | |
| | | | | |
Net realized and unrealized gains (losses) | | | (0.91 | ) | | | (0.25 | ) | | | (0.14 | ) | | | 0.91 | | | | (0.31 | ) |
| | | | |
Total from investment operations | | | (0.42 | ) | | | 0.24 | | | | 0.40 | | | | 1.51 | | | | 0.33 | |
| | | | |
| | | | | |
| Less distributions from: | | | | | | | | | | | | | | | | | | | | |
| | | | | |
Net investment income and net foreign currency gains | | | (0.72 | ) | | | (0.72 | ) | | | (0.76 | ) | | | (0.89 | ) | | | (0.77 | ) |
| | | | | |
Net realized gains | | | (0.20 | ) | | | (0.25 | ) | | | (0.17 | ) | | | (0.02 | ) | | | — | |
| | | | |
Total distributions | | | (0.92 | ) | | | (0.97 | ) | | | (0.93 | ) | | | (0.91 | ) | | | (0.77 | ) |
| | | | |
Net asset value, end of year | | | $10.44 | | | | $11.78 | | | | $12.51 | | | | $13.04 | | | | $12.44 | |
| | | | |
| | | | | |
Total returnc | | | (3.98)% | | | | 1.75% | | | | 3.17% | | | | 12.67% | | | | 2.46% | |
| | | | | |
| Ratios to average net assets | | | | | | | | | | | | | | | | | | | | |
| | | | | |
Expenses before waiver and payments by affiliates | | | 0.98% | | | | 0.98% | | | | 0.95% | | | | 0.93% | | | | 0.95% | |
| | | | | |
Expenses net of waiver and payments by affiliates | | | 0.97% | d | | | 0.97% | d | | | 0.95% | d | | | 0.93% | | | | 0.95% | d |
| | | | | |
Net investment income | | | 4.36% | | | | 3.99% | | | | 4.23% | | | | 4.69% | | | | 5.01% | |
| | | | | |
| Supplemental data | | | | | | | | | | | | | | | | | | | | |
| | | | | |
Net assets, end of year (000’s) | | | $92,965 | | | | $113,986 | | | | $134,970 | | | | $196,479 | | | | $188,786 | |
| | | | | |
Portfolio turnover rate | | | 85.85% | | | | 55.64% | | | | 48.06% | | | | 49.98% | | | | 55.65% | |
| | | | | |
Portfolio turnover rate excluding mortgage dollar rollse | | | 51.47% | | | | 48.86% | | | | 47.01% | | | | 48.75% | | | | 55.65% | |
aThe amount shown for a share outstanding throughout the period may not correlate with the Statement of Operations for the period due to the timing of sales and repurchases of the Fund’s shares in relation to income earned and/or fluctuating fair value of the investments of the Fund.
bBased on average daily shares outstanding.
cTotal return does not include fees, charges or expenses imposed by the variable annuity and life insurance contracts for which Franklin Templeton Variable Insurance Products Trust serves as an underlying investment vehicle.
dBenefit of expense reduction rounds to less than 0.01%.
eSee Note 1(h) regarding mortgage dollar rolls.
| | | | |
| | | The accompanying notes are an integral part of these financial statements. | Annual Report | | FSI-13 |
FRANKLIN TEMPLETON VARIABLE INSURANCE PRODUCTS TRUST
Statement of Investments, December 31, 2015
| | | | | | | | | | | | | | |
Franklin Strategic Income VIP Fund | | | | |
| | | | | Country | | | Shares | | | Value | |
| | Common Stocks 1.0% | | | | | | | | | | | | |
| | Consumer Services 1.0% | | | | | | | | | | | | |
| a,b,c | | Turtle Bay Resort | | | United States | | | | 1,901,449 | | | $ | 7,082,896 | |
| | | | | | | | | | | | | | |
| | Transportation 0.0%† | | | | | | | | | | | | |
| a | | CEVA Holdings LLC | | | United Kingdom | | | | 224 | | | | 100,926 | |
| | | | | | | | | | | | | | |
| | | | |
| | Total Common Stocks (Cost $2,500,685) | | | | | | | | | | | 7,183,822 | |
| | | | | | | | | | | | | | |
| | Management Investment Companies 9.2% | | | | | | | | | | | | |
| | Diversified Financials 9.2% | | | | | | | | | | | | |
| | iShares iBoxx High Yield Corporate Bond ETF | | | United States | | | | 150,000 | | | | 12,087,000 | |
| d | | Franklin Lower Tier Floating Rate Fund | | | United States | | | | 3,135,765 | | | | 29,507,549 | |
| d | | Franklin Middle Tier Floating Rate Fund | | | United States | | | | 2,704,835 | | | | 25,912,320 | |
| | | | | | | | | | | | | | |
| | | | |
| | Total Management Investment Companies
(Cost $70,697,659) | | | | | | | | | | | 67,506,869 | |
| | | | | | | | | | | | | | |
| | Convertible Preferred Stocks 0.0%† | | | | | | | | | | | | |
| | Transportation 0.0%† | | | | | | | | | | | | |
| a | | CEVA Holdings LLC, cvt. pfd., A-1 | | | United Kingdom | | | | 6 | | | | 3,750 | |
| a | | CEVA Holdings LLC, cvt. pfd., A-2 | | | United Kingdom | | | | 486 | | | | 218,480 | |
| | | | | | | | | | | | | | |
| | | | |
| | Total Convertible Preferred Stocks
(Cost $731,856) | | | | | | | | | | | 222,230 | |
| | | | | | | | | | | | | | |
| | | | |
| | | | | | | | Principal Amount* | | | | |
| | Corporate Bonds 39.3% | | | | | | | | | | | | |
| | Automobiles & Components 1.0% | | | | | | | | | | | | |
| e | | Avis Budget Finance PLC, senior note, 144A, 6.00%, 3/01/21 | | | United States | | | | 1,000,000 | EUR | | | 1,124,948 | |
| | Fiat Chrysler Automobiles NV, senior note, 5.25%, 4/15/23 | | | United Kingdom | | | | 3,500,000 | | | | 3,469,374 | |
| | The Goodyear Tire & Rubber Co., senior note, | | | | | | | | | | | | |
| | 6.50%, 3/01/21 | | | United States | | | | 2,000,000 | | | | 2,110,000 | |
| | 5.125%, 11/15/23 | | | United States | | | | 400,000 | | | | 412,000 | |
| | | | | | | | | | | | | | |
| | | | | | | | | | | | | 7,116,322 | |
| | | | | | | | | | | | | | |
| | Banks 3.6% | | | | | | | | | | | | |
| | Bank of America Corp., | | | | | | | | | | | | |
| | fjunior sub. bond, AA, 6.10% to 3/17/25, FRN thereafter, Perpetual | | | United States | | | | 800,000 | | | | 812,000 | |
| | fjunior sub. bond, M, 8.125% to 5/15/18, FRN thereafter, Perpetual | | | United States | | | | 2,000,000 | | | | 2,037,500 | |
| | senior note, 5.65%, 5/01/18 | | | United States | | | | 1,500,000 | | | | 1,613,815 | |
| | CIT Group Inc., senior note, | | | | | | | | | | | | |
| | 5.375%, 5/15/20 | | | United States | | | | 1,000,000 | | | | 1,050,000 | |
| | 5.00%, 8/15/22 | | | United States | | | | 2,500,000 | | | | 2,573,450 | |
| | Citigroup Inc., | | | | | | | | | | | | |
| | fjunior sub. bond, M, 6.30% to 5/15/24, FRN thereafter, Perpetual | | | United States | | | | 700,000 | | | | 683,375 | |
| | fjunior sub. bond, O, 5.875% to 3/27/20, FRN thereafter, Perpetual | | | United States | | | | 1,000,000 | | | | 993,750 | |
| | senior note, 3.875%, 10/25/23 | | | United States | | | | 3,000,000 | | | | 3,105,813 | |
| | sub. bond, 5.50%, 9/13/25 | | | United States | | | | 500,000 | | | | 544,136 | |
| | sub. note, 4.05%, 7/30/22 | | | United States | | | | 300,000 | | | | 306,919 | |
| | JPMorgan Chase & Co., | | | | | | | | | | | | |
| | fjunior sub. bond, R, 6.00% to 8/01/23, FRN thereafter, Perpetual | | | United States | | | | 1,500,000 | | | | 1,501,656 | |
| | fjunior sub. bond, V, 5.00% to 7/30/19, FRN thereafter, Perpetual | | | United States | | | | 200,000 | | | | 190,250 | |
| | fjunior sub. bond, X, 6.10% to 10/01/24, FRN thereafter, Perpetual | | | United States | | | | 500,000 | | | | 503,175 | |
FRANKLIN TEMPLETON VARIABLE INSURANCE PRODUCTS TRUST
STATEMENT OF INVESTMENTS
Franklin Strategic Income VIP Fund (continued)
| | | | | | | | | | | | | | |
| | | | | Country | | | Principal Amount* | | | Value | |
| | Corporate Bonds (continued) | | | | | | | | | | | | |
| | Banks (continued) | | | | | | | | | | | | |
| | JP Morgan Chase & Co., (continued) | | | | | | | | | | | | |
| | senior note, 4.25%, 10/15/20 | | | United States | | | | 1,000,000 | | | $ | 1,061,992 | |
| | sub. note, 3.375%, 5/01/23 | | | United States | | | | 1,000,000 | | | | 984,951 | |
| | sub. note, 3.875%, 9/10/24 | | | United States | | | | 1,000,000 | | | | 997,072 | |
| | Royal Bank of Scotland Group PLC, sub. note, 6.125%, 12/15/22 | | | United Kingdom | | | | 700,000 | | | | 762,563 | |
| | The Royal Bank of Scotland PLC, sub. note, 6.934%, 4/09/18 | | | United Kingdom | | | | 1,500,000 | EUR | | | 1,827,955 | |
| | Wells Fargo & Co., | | | | | | | | | | | | |
| | fjunior sub. bond, 5.875% to 6/15/25, FRN thereafter, Perpetual | | | United States | | | | 2,500,000 | | | | 2,634,375 | |
| | fjunior sub. bond, S, 5.90% to 6/15/24, FRN thereafter, Perpetual | | | United States | | | | 1,500,000 | | | | 1,516,875 | |
| | senior note, 2.60%, 7/22/20 | | | United States | | | | 700,000 | | | | 698,950 | |
| | | | | | | | | | | | | | |
| | | | | | | | | | | | | 26,400,572 | |
| | | | | | | | | | | | | | |
| | Capital Goods 0.7% | | | | | | | | | | | | |
| e | | Bombardier Inc., senior bond, 144A, 7.50%, 3/15/25 | | | Canada | | | | 3,400,000 | | | | 2,397,000 | |
| g | | Erickson Air-Crane Inc., Purchase Price Notes, 6.00%, 11/02/20 | | | United States | | | | 157,765 | | | | 124,628 | |
| e | | KM Germany Holdings GmbH, senior secured note, first lien, 144A, 8.75%, 12/15/20 | | | Germany | | | | 800,000 | EUR | | | 940,692 | |
| | Navistar International Corp., senior bond, 8.25%, 11/01/21 | | | United States | | | | 1,400,000 | | | | 938,000 | |
| | TransDigm Inc., | | | | | | | | | | | | |
| | senior sub. bond, 6.50%, 7/15/24 | | | United States | | | | 500,000 | | | | 499,750 | |
| | esenior sub. bond, 144A, 6.50%, 5/15/25 | | | United States | | | | 200,000 | | | | 194,500 | |
| | senior sub. note, 6.00%, 7/15/22 | | | United States | | | | 400,000 | | | | 393,000 | |
| | | | | | | | | | | | | | |
| | | | | | | | | | | | | 5,487,570 | |
| | | | | | | | | | | | | | |
| | Consumer Durables & Apparel 0.5% | | | | | | | | | | | | |
| | KB Home, senior note, | | | | | | | | | | | | |
| | 4.75%, 5/15/19 | | | United States | | | | 1,000,000 | | | | 975,000 | |
| | 7.00%, 12/15/21 | | | United States | | | | 1,200,000 | | | | 1,189,500 | |
| | Toll Brothers Finance Corp., senior bond, 5.625%, 1/15/24 | | | United States | | | | 1,100,000 | | | | 1,144,000 | |
| | | | | | | | | | | | | | |
| | | | | | | | | | | | | 3,308,500 | |
| | | | | | | | | | | | | | |
| | Consumer Services 1.7% | | | | | | | | | | | | |
| e | | 1011778 BC ULC/New Red Finance Inc., | | | | | | | | | | | | |
| | secured note, second lien, 144A, 6.00%, 4/01/22 | | | Canada | | | | 2,000,000 | | | | 2,065,000 | |
| | senior secured note, first lien, 144A, 4.625%, 1/15/22 | | | Canada | | | | 1,100,000 | | | | 1,105,500 | |
| h | | Caesars Entertainment Operating Co. Inc., senior secured note, first lien, 11.25%, 6/01/17 | | | United States | | | | 1,300,000 | | | | 981,500 | |
| e,h | | Fontainebleau Las Vegas, senior secured bond, first lien, 144A, 11.00%, 6/15/15 | | | United States | | | | 2,500,000 | | | | 4,937 | |
| e | | International Game Technology PLC, senior secured bond, 144A, 6.50%, 2/15/25 | | | United States | | | | 3,500,000 | | | | 3,097,500 | |
| | Marriott International Inc., senior bond, 3.75%, 10/01/25 | | | United States | | | | 3,000,000 | | | | 2,957,034 | |
| | MGM Resorts International, senior note, | | | | | | | | | | | | |
| | 6.75%, 10/01/20 | | | United States | | | | 200,000 | | | | 206,500 | |
| | 6.625%, 12/15/21 | | | United States | | | | 500,000 | | | | 514,375 | |
| e | | Wynn Las Vegas LLC/Wynn Las Vegas Capital Corp., senior bond, 144A, 5.50%, 3/01/25 | | | United States | | | | 700,000 | | | | 626,500 | |
| e | | Wynn Macau Ltd., senior note, 144A, 5.25%, 10/15/21 | | | Macau | | | | 1,300,000 | | | | 1,147,250 | |
| | | | | | | | | | | | | | |
| | | | | | | | | | | | | 12,706,096 | |
| | | | | | | | | | | | | | |
| | Diversified Financials 2.5% | | | | | | | | | | | | |
| | AerCap Ireland Capital Ltd./AerCap Global Aviation Trust, senior note, | | | | | | | | | | | | |
| | 4.25%, 7/01/20 | | | Netherlands | | | | 1,300,000 | | | | 1,312,187 | |
| | 4.625%, 10/30/20 | | | Netherlands | | | | 500,000 | | | | 512,188 | |
FRANKLIN TEMPLETON VARIABLE INSURANCE PRODUCTS TRUST
STATEMENT OF INVESTMENTS
Franklin Strategic Income VIP Fund (continued)
| | | | | | | | | | | | | | |
| | | | | Country | | | Principal Amount* | | | Value | |
| | Corporate Bonds (continued) | | | | | | | | | | | | |
| | Diversified Financials (continued) | | | | | | | | | | | | |
| | AerCap Ireland Capital Ltd./AerCap Global Aviation Trust, senior note, (continued) | | | | | | | | | |
| | 5.00%, 10/01/21 | | | Netherlands | | | | 1,100,000 | | | $ | 1,139,187 | |
| | Deutsche Bank AG, sub. bond, 4.296% to 5/24/23, FRN thereafter, 5/24/28 | | | Germany | | | | 3,500,000 | | | | 3,212,650 | |
| | E*TRADE Financial Corp., senior note, | | | | | | | | | | | | |
| | 5.375%, 11/15/22 | | | United States | | | | 700,000 | | | | 735,000 | |
| | 4.625%, 9/15/23 | | | United States | | | | 800,000 | | | | 815,000 | |
| f | | The Goldman Sachs Group Inc., junior sub. bond, M, 5.375% to 5/10/20, FRN thereafter, Perpetual | | | United States | | | | 3,000,000 | | | | 2,985,000 | |
| | Morgan Stanley, | | | | | | | | | | | | |
| | fjunior sub. bond, 5.55% to 7/15/20, FRN thereafter, Perpetual | | | United States | | | | 2,500,000 | | | | 2,503,125 | |
| | sub. bond, 3.95%, 4/23/27 | | | United States | | | | 1,000,000 | | | | 973,181 | |
| | Navient Corp., senior note, | | | | | | | | | | | | |
| | 8.45%, 6/15/18 | | | United States | | | | 1,000,000 | | | | 1,055,000 | |
| | 5.50%, 1/15/19 | | | United States | | | | 1,500,000 | | | | 1,406,250 | |
| | 5.875%, 3/25/21 | | | United States | | | | 700,000 | | | | 625,625 | |
| | 6.125%, 3/25/24 | | | United States | | | | 500,000 | | | | 409,375 | |
| e | | Neuberger Berman Group LLC/Finance Corp., senior note, 144A, 5.875%, 3/15/22 | | | United States | | | | 1,000,000 | | | | 1,041,250 | |
| | | | | | | | | | | | | | |
| | | | | | | | | | | | | 18,725,018 | |
| | | | | | | | | | | | | | |
| | Energy 4.8% | | | | | | | | | | | | |
| | Access Midstream Partner LP/ACMP Finance Corp., senior note, 6.125%, 7/15/22 | | | United States | | | | 600,000 | | | | 568,496 | |
| | Apache Corp., senior bond, 2.625%, 1/15/23 | | | United States | | | | 1,900,000 | | | | 1,724,949 | |
| | BreitBurn Energy Partners LP/BreitBurn Finance Corp., senior bond, 7.875%, 4/15/22 | | | United States | | | | 2,300,000 | | | | 425,500 | |
| | California Resources Corp., | | | | | | | | | | | | |
| | esecond lien, 144A, 8.00%, 12/15/22 | | | United States | | | | 1,416,000 | | | | 748,710 | |
| | senior bond, 6.00%, 11/15/24 | | | United States | | | | 345,000 | | | | 106,088 | |
| | senior note, 5.50%, 9/15/21 | | | United States | | | | 184,000 | | | | 58,880 | |
| | CGG SA, senior note, | | | | | | | | | | | | |
| | 6.50%, 6/01/21 | | | France | | | | 1,800,000 | | | | 810,000 | |
| | 6.875%, 1/15/22 | | | France | | | | 200,000 | | | | 89,875 | |
| | CHC Helicopter SA, | | | | | | | | | | | | |
| | senior note, 9.375%, 6/01/21 | | | Canada | | | | 260,000 | | | | 66,300 | |
| | senior secured note, first lien, 9.25%, 10/15/20 | | | Canada | | | | 2,205,000 | | | | 1,069,425 | |
| e | | Chesapeake Energy Corp., secured note, second lien, 144A, 8.00%, 12/15/22 | | | United States | | | | 1,555,000 | | | | 769,725 | |
| | Clayton Williams Energy Inc., senior note, 7.75%, 4/01/19 | | | United States | | | | 1,300,000 | | | | 1,009,125 | |
| | CONSOL Energy Inc., senior note, | | | | | | | | | | | | |
| | 5.875%, 4/15/22 | | | United States | | | | 2,500,000 | | | | 1,562,500 | |
| | e144A, 8.00%, 4/01/23 | | | United States | | | | 500,000 | | | | 335,000 | |
| | Energy Transfer Equity LP, senior note, first lien, 7.50%, 10/15/20 | | | United States | | | | 2,500,000 | | | | 2,325,000 | |
| | Energy Transfer Partners LP, senior note, 5.20%, 2/01/22 | | | United States | | | | 1,000,000 | | | | 935,585 | |
| | Energy XXI Gulf Coast Inc., | | | | | | | | | | | | |
| | senior note, 9.25%, 12/15/17 | | | United States | | | | 1,500,000 | | | | 427,500 | |
| | senior note, 6.875%, 3/15/24 | | | United States | | | | 800,000 | | | | 92,000 | |
| | esenior secured note, second lien, 144A, 11.00%, 3/15/20 | | | United States | | | | 700,000 | | | | 246,750 | |
| e | | EnQuest PLC, senior note, 144A, 7.00%, 4/15/22 | | | United Kingdom | | | | 1,500,000 | | | | 530,625 | |
| | Freeport-McMoRan Oil & Gas LLC/FCX Oil & Gas Inc., senior note, 6.875%, 2/15/23 | | | United States | | | | 672,000 | | | | 425,040 | |
FRANKLIN TEMPLETON VARIABLE INSURANCE PRODUCTS TRUST
STATEMENT OF INVESTMENTS
Franklin Strategic Income VIP Fund (continued)
| | | | | | | | | | | | | | |
| | | | | Country | | | Principal Amount* | | | Value | |
| | Corporate Bonds (continued) | | | | | | | | | | | | |
| | Energy (continued) | | | | | | | | | | | | |
| e,i | | Gaz Capital SA, (OJSC Gazprom), loan participation, senior note, 144A, 3.85%, 2/06/20 | | | Russia | | | | 1,500,000 | | | $ | 1,396,875 | |
| | Halcon Resources Corp., | | | | | | | | | | | | |
| | senior note, 8.875%, 5/15/21 | | | United States | | | | 1,400,000 | | | | 413,000 | |
| | esenior secured note, third lien, 144A, 13.00%, 2/15/22 | | | United States | | | | 1,000,000 | | | | 345,000 | |
| e | | Kinder Morgan Finance Co. LLC, senior secured note, 144A, 6.00%, 1/15/18 | | | United States | | | | 2,000,000 | | | | 2,017,652 | |
| | Kinder Morgan Inc., | | | | | | | | | | | | |
| | senior bond, 4.30%, 6/01/25 | | | United States | | | | 100,000 | | | | 86,607 | |
| | senior note, 6.50%, 9/15/20 | | | United States | | | | 1,500,000 | | | | 1,495,494 | |
| e | | Linn Energy LLC/Finance Corp., senior secured note, second lien, 144A, 12.00%, 12/15/20 | | | United States | | | | 1,800,000 | | | | 918,000 | |
| e | | LUKOIL International Finance BV, senior note, 144A, 4.563%, 4/24/23 | | | Russia | | | | 2,500,000 | | | | 2,251,562 | |
| | Martin Midstream Partners LP/Martin Midstream Finance Corp., senior note, 7.25%, 2/15/21 | | | United States | | | | 2,000,000 | | | | 1,770,000 | |
| | Midstates Petroleum Co. Inc./LLC, senior note, 9.25%, 6/01/21 | | | United States | | | | 1,500,000 | | | | 180,000 | |
| | Oasis Petroleum Inc., senior note, 6.875%, 3/15/22 | | | United States | | | | 1,300,000 | | | | 838,500 | |
| | PBF Holding Co. LLC, first lien, 8.25%, 2/15/20 | | | United States | | | | 1,000,000 | | | | 1,040,000 | |
| e | | Peabody Energy Corp., second lien, 144A, 10.00%, 3/15/22 | | | United States | | | | 3,000,000 | | | | 585,000 | |
| | Penn Virginia Corp., senior note, 8.50%, 5/01/20 | | | United States | | | | 1,500,000 | | | | 243,750 | |
| | Regency Energy Partners LP/Regency Energy Finance Corp., senior note, | | | | | | | | | | | | |
| | 5.875%, 3/01/22 | | | United States | | | | 200,000 | | | | 188,766 | |
| | 5.00%, 10/01/22 | | | United States | | | | 500,000 | | | | 443,746 | |
| | Sabine Pass Liquefaction LLC, | | | | | | | | | | | | |
| | first lien, 5.625%, 2/01/21 | | | United States | | | | 2,000,000 | | | | 1,850,000 | |
| | first lien, 5.625%, 4/15/23 | | | United States | | | | 900,000 | | | | 794,250 | |
| | senior secured note, first lien, 5.75%, 5/15/24 | | | United States | | | | 300,000 | | | | 262,500 | |
| | Sanchez Energy Corp., senior note, | | | | | | | | | | | | |
| | 7.75%, 6/15/21 | | | United States | | | | 1,700,000 | | | | 1,045,500 | |
| | 6.125%, 1/15/23 | | | United States | | | | 600,000 | | | | 327,000 | |
| | W&T Offshore Inc., senior note, 8.50%, 6/15/19 | | | United States | | | | 2,000,000 | | | | 710,000 | |
| | Williams Partners LP, senior bond, 4.00%, 9/15/25 | | | United States | | | | 1,500,000 | | | | 1,125,363 | |
| | WPX Energy Inc., senior note, 8.25%, 8/01/23 | | | United States | | | | 1,000,000 | | | | 802,500 | |
| | | | | | | | | | | | | | |
| | | | | | | | | | | | | 35,458,138 | |
| | | | | | | | | | | | | | |
| | Food & Staples Retailing 0.7% | | | | | | | | | | | | |
| e | | Cencosud SA, senior note, 144A, | | | | | | | | | | | | |
| | 4.875%, 1/20/23 | | | Chile | | | | 1,500,000 | | | | 1,419,720 | |
| | 5.15%, 2/12/25 | | | Chile | | | | 1,500,000 | | | | 1,411,448 | |
| | Walgreens Boots Alliance Inc., senior note, 3.80%, 11/18/24 | | | United States | | | | 2,500,000 | | | | 2,431,837 | |
| | | | | | | | | | | | | | |
| | | | | | | | | | | | | 5,263,005 | |
| | | | | | | | | | | | | | |
| | Food, Beverage & Tobacco 1.1% | | | | | | | | | | | | |
| | Constellation Brands Inc., senior note, | | | | | | | | | | | | |
| | 4.25%, 5/01/23 | | | United States | | | | 1,000,000 | | | | 1,002,500 | |
| | 4.75%, 12/01/25 | | | United States | | | | 200,000 | | | | 204,250 | |
| e | | JBS USA LLC/Finance Inc., senior note, 144A, | | | | | | | | | | | | |
| | 8.25%, 2/01/20 | | | United States | | | | 2,500,000 | | | | 2,512,500 | |
| | 7.25%, 6/01/21 | | | United States | | | | 300,000 | | | | 299,250 | |
| | 5.75%, 6/15/25 | | | United States | | | | 500,000 | | | | 437,500 | |
FRANKLIN TEMPLETON VARIABLE INSURANCE PRODUCTS TRUST
STATEMENT OF INVESTMENTS
Franklin Strategic Income VIP Fund (continued)
| | | | | | | | | | | | | | |
| | | | | Country | | | Principal Amount* | | | Value | |
| | Corporate Bonds (continued) | | | | | | | | | | | | |
| | Food, Beverage & Tobacco (continued) | | | | | | | | | | | | |
| e | | Post Holdings Inc., senior note, 144A, | | | | | | | | | | | | |
| | 6.75%, 12/01/21 | | | United States | | | | 1,700,000 | | | $ | 1,738,250 | |
| | 6.00%, 12/15/22 | | | United States | | | | 500,000 | | | | 491,875 | |
| | 7.75%, 3/15/24 | | | United States | | | | 1,000,000 | | | | 1,050,000 | |
| | | | | | | | | | | | | | |
| | | | | | | | | | | | | 7,736,125 | |
| | | | | | | | | | | | | | |
| | Health Care Equipment & Services 2.0% | | | | | | | | | | | | |
| | Alere Inc., senior sub. note, 6.50%, 6/15/20 | | | United States | | | | 1,400,000 | | | | 1,351,000 | |
| | CHS/Community Health Systems Inc., | | | | | | | | | | | | |
| | senior note, 8.00%, 11/15/19 | | | United States | | | | 1,500,000 | | | | 1,518,750 | |
| | senior note, 6.875%, 2/01/22 | | | United States | | | | 400,000 | | | | 381,500 | |
| | senior secured note, first lien, 5.125%, 8/15/18 | | | United States | | | | 600,000 | | | | 606,000 | |
| | DaVita HealthCare Partners Inc., | | | | | | | | | | | | |
| | senior bond, 5.125%, 7/15/24 | | | United States | | | | 500,000 | | | | 500,938 | |
| | senior bond, 5.00%, 5/01/25 | | | United States | | | | 900,000 | | | | 870,750 | |
| | senior note, 5.75%, 8/15/22 | | | United States | | | | 1,500,000 | | | | 1,550,625 | |
| | HCA Inc., | | | | | | | | | | | | |
| | senior bond, 5.875%, 5/01/23 | | | United States | | | | 1,500,000 | | | | 1,545,000 | |
| | senior note, 7.50%, 2/15/22 | | | United States | | | | 700,000 | | | | 778,750 | |
| | senior secured bond, first lien, 5.875%, 3/15/22 | | | United States | | | | 1,000,000 | | | | 1,057,500 | |
| | senior secured bond, first lien, 5.25%, 4/15/25 | | | United States | | | | 600,000 | | | | 606,000 | |
| e | | Hologic Inc., senior note, 144A, 5.25%, 7/15/22 | | | United States | | | | 1,000,000 | | | | 1,023,750 | |
| | Tenet Healthcare Corp., senior note, | | | | | | | | | | | | |
| | 5.00%, 3/01/19 | | | United States | | | | 500,000 | | | | 463,750 | |
| | 5.50%, 3/01/19 | | | United States | | | | 1,200,000 | | | | 1,137,000 | |
| | 8.125%, 4/01/22 | | | United States | | | | 1,000,000 | | | | 1,002,500 | |
| | 6.75%, 6/15/23 | | | United States | | | | 300,000 | | | | 278,812 | |
| | | | | | | | | | | | | | |
| | | | | | | | | | | | | 14,672,625 | |
| | | | | | | | | | | | | | |
| | Insurance 1.0% | | | | | | | | | | | | |
| | MetLife Inc., junior sub. note, | | | | | | | | | | | | |
| | f5.25% to 6/15/20, FRN thereafter, Perpetual | | | United States | | | | 1,200,000 | | | | 1,224,000 | |
| | 6.40% to 12/15/36, FRN thereafter, 12/15/66 | | | United States | | | | 1,500,000 | | | | 1,642,500 | |
| e | | Nippon Life Insurance Co., sub. bond, 144A, 5.10% to 10/16/24, FRN thereafter, 10/16/44 | | | Japan | | | | 3,500,000 | | | | 3,678,990 | |
| | Prudential Financial Inc., 3.50%, 5/15/24 | | | United States | | | | 800,000 | | | | 805,408 | |
| | | | | | | | | | | | | | |
| | | | | | | | | | | | | 7,350,898 | |
| | | | | | | | | | | | | | |
| | Materials 5.1% | | | | | | | | | | | | |
| | ArcelorMittal, senior note, | | | | | | | | | | | | |
| | 6.50%, 3/01/21 | | | Luxembourg | | | | 3,000,000 | | | | 2,429,670 | |
| | 6.125%, 6/01/25 | | | Luxembourg | | | | 300,000 | | | | 219,750 | |
| e | | Ardagh Packaging Finance PLC/Ardagh MP Holdings USA Inc., senior note, 144A, | | | | | | | | | | | | |
| | 7.00%, 11/15/20 | | | Luxembourg | | | | 105,882 | | | | 104,559 | |
| | 6.75%, 1/31/21 | | | Luxembourg | | | | 200,000 | | | | 194,000 | |
| | 6.00%, 6/30/21 | | | Luxembourg | | | | 1,300,000 | | | | 1,218,750 | |
| e | | Barminco Finance Pty. Ltd., senior note, 144A, 9.00%, 6/01/18 | | | Australia | | | | 1,500,000 | | | | 1,200,750 | |
| e | | Blue Cube Spinco Inc., senior bond, 144A, 10.00%, 10/15/25 | | | United States | | | | 1,200,000 | | | | 1,326,000 | |
| e | | Cemex Finance LLC, senior secured note, first lien, 144A, 6.00%, 4/01/24 | | | Mexico | | | | 1,000,000 | | | | 861,875 | |
FRANKLIN TEMPLETON VARIABLE INSURANCE PRODUCTS TRUST
STATEMENT OF INVESTMENTS
Franklin Strategic Income VIP Fund (continued)
| | | | | | | | | | | | | | |
| | | | | Country | | | Principal Amount* | | | Value | |
| | Corporate Bonds (continued) | | | | | | | | | | | | |
| | Materials (continued) | | | | | | | | | | | | |
| e | | Cemex SAB de CV, | | | | | | | | | | | | |
| | first lien, 144A, 5.70%, 1/11/25 | | | Mexico | | | | 1,500,000 | | | $ | 1,254,375 | |
| | secured note, 144A, 5.875%, 3/25/19 | | | Mexico | | | | 1,000,000 | | | | 953,750 | |
| e | | Ceramtec Group GmbH, senior note, 144A, 8.25%, 8/15/21 | | | Germany | | | | 1,200,000 | EUR | | | 1,412,668 | |
| e | | The Chemours Co., | | | | | | | | | | | | |
| | senior bond, 144A, 7.00%, 5/15/25 | | | United States | | | | 500,000 | | | | 342,500 | |
| | senior note, 144A, 6.625%, 5/15/23 | | | United States | | | | 2,000,000 | | | | 1,410,000 | |
| e | | First Quantum Minerals Ltd., senior note, 144A, | | | | | | | | | | | | |
| | 6.75%, 2/15/20 | | | Canada | | | | 1,400,000 | | | | 910,000 | |
| | 7.00%, 2/15/21 | | | Canada | | | | 1,725,000 | | | | 1,091,062 | |
| e | | FMG Resources (August 2006) Pty. Ltd., senior secured note, 144A, 9.75%, 3/01/22 | | | Australia | | | | 3,200,000 | | | | 2,886,000 | |
| | Freeport-McMoRan Inc., senior note, 4.55%, 11/14/24 | | | United States | | | | 2,500,000 | | | | 1,443,750 | |
| e | | Glencore Finance Canada Ltd., senior bond, 144A, 4.95%, 11/15/21 | | | Switzerland | | | | 1,500,000 | | | | 1,208,961 | |
| e | | Glencore Funding LLC, senior note, 144A, | | | | | | | | | | | | |
| | 4.125%, 5/30/23 | | | Switzerland | | | | 1,300,000 | | | | 960,199 | |
| | 4.625%, 4/29/24 | | | Switzerland | | | | 500,000 | | | | 365,592 | |
| e | | INVISTA Finance LLC, senior secured note, 144A, 4.25%, 10/15/19 | | | United States | | | | 3,000,000 | | | | 2,925,000 | |
| | Novelis Inc., senior note, 8.75%, 12/15/20 | | | Canada | | | | 1,600,000 | | | | 1,476,000 | |
| e | | Owens-Brockway Glass Container Inc., senior note, 144A, | | | | | | | | | | | | |
| | 5.00%, 1/15/22 | | | United States | | | | 1,400,000 | | | | 1,373,750 | |
| | 5.875%, 8/15/23 | | | United States | | | | 700,000 | | | | 711,813 | |
| | Reynolds Group Issuer Inc./LLC/SA, | | | | | | | | | | | | |
| | first lien, 5.75%, 10/15/20 | | | United States | | | | 700,000 | | | | 713,783 | |
| | senior note, 8.50%, 5/15/18 | | | United States | | | | 1,000,000 | | | | 990,000 | |
| | senior note, 8.25%, 2/15/21 | | | United States | | | | 1,000,000 | | | | 967,500 | |
| | senior secured note, first lien, 7.125%, 4/15/19 | | | United States | | | | 800,000 | | | | 816,000 | |
| e | | Sealed Air Corp., | | | | | | | | | | | | |
| | senior bond, 144A, 5.125%, 12/01/24 | | | United States | | | | 1,000,000 | | | | 1,005,000 | |
| | senior bond, 144A, 5.50%, 9/15/25 | | | United States | | | | 400,000 | | | | 409,000 | |
| | senior note, 144A, 4.875%, 12/01/22 | | | United States | | | | 1,000,000 | | | | 1,006,250 | |
| | Steel Dynamics Inc., | | | | | | | | | | | | |
| | senior bond, 5.50%, 10/01/24 | | | United States | | | | 1,000,000 | | | | 915,000 | |
| | senior note, 5.125%, 10/01/21 | | | United States | | | | 1,000,000 | | | | 930,000 | |
| e | | U.S. Coatings Acquisition Inc./Flash Dutch 2 BV, 144A, 5.75%, 2/01/21 | | | United States | | | | 1,000,000 | EUR | | | 1,130,379 | |
| | Verso Paper Holdings LLC/Inc., senior secured note, first lien, 11.75%, 1/15/19 | | | United States | | | | 451,000 | | | | 67,650 | |
| | | | | | | | | | | | | | |
| | | | | | | | | | | | | 37,231,336 | |
| | | | | | | | | | | | | | |
| | Media 3.9% | | | | | | | | | | | | |
| | 21st Century Fox America Inc., senior note, 3.00%, 9/15/22 | | | United States | | | | 500,000 | | | | 493,488 | |
| | CCO Holdings LLC/CCO Holdings Capital Corp., senior bond, | | | | | | | | | | | | |
| | 5.25%, 9/30/22 | | | United States | | | | 2,700,000 | | | | 2,733,750 | |
| | e 144A, 5.375%, 5/01/25 | | | United States | | | | 900,000 | | | | 897,750 | |
| | Clear Channel Worldwide Holdings Inc., | | | | | | | | | | | | |
| | senior note, 6.50%, 11/15/22 | | | United States | | | | 1,000,000 | | | | 978,750 | |
| | senior sub. note, 7.625%, 3/15/20 | | | United States | | | | 500,000 | | | | 463,750 | |
| | senior sub. note, 7.625%, 3/15/20 | | | United States | | | | 200,000 | | | | 182,750 | |
| | CSC Holdings LLC, senior note, | | | | | | | | | | | | |
| | 6.75%, 11/15/21 | | | United States | | | | 2,500,000 | | | | 2,462,500 | |
| | 5.25%, 6/01/24 | | | United States | | | | 200,000 | | | | 176,000 | |
FRANKLIN TEMPLETON VARIABLE INSURANCE PRODUCTS TRUST
STATEMENT OF INVESTMENTS
Franklin Strategic Income VIP Fund (continued)
| | | | | | | | | | | | | | |
| | | | | Country | | | Principal Amount* | | | Value | |
| | Corporate Bonds (continued) | | | | | | | | | | | | |
| | Media (continued) | | | | | | | | | | | | |
| | DISH DBS Corp., senior note, | | | | | | | | | | | | |
| | 7.125%, 2/01/16 | | | United States | | | | 2,000,000 | | | $ | 2,007,500 | |
| | 6.75%, 6/01/21 | | | United States | | | | 500,000 | | | | 505,000 | |
| | 5.875%, 7/15/22 | | | United States | | | | 500,000 | | | | 467,500 | |
| | 5.875%, 11/15/24 | | | United States | | | | 500,000 | | | | 446,250 | |
| | Gannett Co. Inc., | | | | | | | | | | | | |
| | senior bond, 6.375%, 10/15/23 | | | United States | | | | 1,000,000 | | | | 1,057,500 | |
| | e senior bond, 144A, 5.50%, 9/15/24 | | | United States | | | | 300,000 | | | | 300,750 | |
| | senior note, 5.125%, 7/15/20 | | | United States | | | | 1,000,000 | | | | 1,040,000 | |
| | iHeartCommunications Inc., | | | | | | | | | | | | |
| | senior secured bond, first lien, 9.00%, 3/01/21 | | | United States | | | | 2,400,000 | | | | 1,683,000 | |
| | senior secured note, first lien, 9.00%, 9/15/22 | | | United States | | | | 700,000 | | | | 485,625 | |
| e | | Sirius XM Radio Inc., senior bond, 144A, | | | | | | | | | | | | |
| | 6.00%, 7/15/24 | | | United States | | | | 1,700,000 | | | | 1,780,750 | |
| | 5.375%, 4/15/25 | | | United States | | | | 800,000 | | | | 807,000 | |
| | Time Warner Cable Inc., senior note, 4.00%, 9/01/21 | | | United States | | | | 1,300,000 | | | | 1,314,208 | |
| e | | Unitymedia Hessen GmbH & Co. KG/Unitymedia NRW GmbH, senior secured note, first lien, 144A, 5.625%, 4/15/23 | | | Germany | | | | 640,000 | EUR | | | 737,346 | |
| e | | Unitymedia KabelBW GmbH, senior bond, 144A, 6.125%, 1/15/25 | | | Germany | | | | 1,700,000 | | | | 1,688,312 | |
| e | | Univision Communications Inc., senior secured note, first lien, 144A, 5.125%, 2/15/25 | | | United States | | | | 3,000,000 | | | | 2,857,500 | |
| e | | Virgin Media Finance PLC, senior bond, 144A, 6.375%, 10/15/24 | | | United Kingdom | | | | 900,000 | GBP | | | 1,348,941 | |
| e | | Virgin Media Secured Finance PLC, senior secured bond, first lien, 144A, 5.50%, 1/15/25 | | | United Kingdom | | | | 1,900,000 | | | | 1,902,375 | |
| | | | | | | | | | | | | | |
| | | | | | | | | | | | | 28,818,295 | |
| | | | | | | | | | | | | | |
| | Pharmaceuticals, Biotechnology & Life Sciences 2.9% | | | | | | | | | | | | |
| | AbbVie Inc., senior note, 3.60%, 5/14/25 | | | United States | | | | 2,500,000 | | | | 2,472,515 | |
| | Actavis Funding SCS, senior bond, 3.80%, 3/15/25 | | | United States | | | | 2,200,000 | | | | 2,193,180 | |
| e | | Baxalta Inc., senior note, 144A, 4.00%, 6/23/25 | | | United States | | | | 2,500,000 | | | | 2,480,200 | |
| | Biogen Inc., senior note, 3.625%, 9/15/22 | | | United States | | | | 1,500,000 | | | | 1,519,035 | |
| e | | Endo Finance LLC/Endo Ltd./Endo Finco Inc., | | | | | | | | | | | | |
| | senior bond, 144A, 6.00%, 2/01/25 | | | United States | | | | 1,200,000 | | | | 1,188,000 | |
| | senior note, 144A, 6.00%, 7/15/23 | | | United States | | | | 700,000 | | | | 700,000 | |
| | Gilead Sciences Inc., senior bond, 3.65%, 3/01/26 | | | United States | | | | 3,000,000 | | | | 3,030,414 | |
| | Grifols Worldwide Operations Ltd., senior note, 5.25%, 4/01/22 | | | United States | | | | 1,400,000 | | | | 1,410,500 | |
| e | | Jaguar Holding Co. II/Pharmaceutical Product Development LLC, senior note, 144A, 6.375%, 8/01/23 | | | United States | | | | 1,400,000 | | | | 1,368,500 | |
| e | | Valeant Pharmaceuticals International, senior note, 144A, 6.375%, 10/15/20 | | | United States | | | | 2,400,000 | | | | 2,328,000 | |
| e | | Valeant Pharmaceuticals International Inc., | | | | | | | | | | | | |
| | senior bond, 144A, 6.125%, 4/15/25 | | | United States | | | | 300,000 | | | | 268,500 | |
| | senior note, 144A, 5.50%, 3/01/23 | | | United States | | | | 400,000 | | | | 354,000 | |
| | Zoetis Inc., senior bond, 3.25%, 2/01/23 | | | United States | | | | 2,500,000 | | | | 2,391,280 | |
| | | | | | | | | | | | | | |
| | | | | | | | | | | | | 21,704,124 | |
| | | | | | | | | | | | | | |
| | Real Estate 0.4% | | | | | | | | | | | | |
| | Equinix Inc., senior bond, | | | | | | | | | | | | |
| | 5.375%, 4/01/23 | | | United States | | | | 2,500,000 | | | | 2,562,500 | |
| | 5.875%, 1/15/26 | | | United States | | | | 200,000 | | | | 206,500 | |
| | | | | | | | | | | | | | |
| | | | | | | | | | | | | 2,769,000 | |
| | | | | | | | | | | | | | |
FRANKLIN TEMPLETON VARIABLE INSURANCE PRODUCTS TRUST
STATEMENT OF INVESTMENTS
Franklin Strategic Income VIP Fund (continued)
| | | | | | | | | | | | | | |
| | | | | Country | | | Principal Amount* | | | Value | |
| | Corporate Bonds (continued) | | | | | | | | | | | | |
| | Retailing 0.7% | | | | | | | | | | | | |
| e | | Argos Merger Sub Inc., senior note, 144A, 7.125%, 3/15/23 | | | United States | | | | 700,000 | | | $ | 695,800 | |
| e | | Dollar Tree Inc., senior note, 144A, 5.75%, 3/01/23 | | | United States | | | | 900,000 | | | | 942,750 | |
| e | | Edcon Ltd., secured note, 144A, 9.50%, 3/01/18 | | | South Africa | | | | 1,800,000 | EUR | | | 1,197,591 | |
| e | | Netflix Inc., senior bond, 144A, 5.875%, 2/15/25 | | | United States | | | | 2,300,000 | | | | 2,369,000 | |
| | | | | | | | | | | | | | |
| | | | | | | | | | | | | 5,205,141 | |
| | | | | | | | | | | | | | |
| | Software & Services 0.6% | | | | | | | | | | | | |
| e | | BMC Software Finance Inc., senior note, 144A, 8.125%, 7/15/21 | | | United States | | | | 2,600,000 | | | | 1,738,750 | |
| e | | First Data Corp., | | | | | | | | | | | | |
| | second lien, 144A, 5.75%, 1/15/24 | | | United States | | | | 2,100,000 | | | | 2,073,750 | |
| | senior note, 144A, 7.00%, 12/01/23 | | | United States | | | | 700,000 | | | | 701,750 | |
| | | | | | | | | | | | | | |
| | | | | | | | | | | | | 4,514,250 | |
| | | | | | | | | | | | | | |
| | Technology Hardware & Equipment 0.3% | | | | | | | | | | | | |
| e | | Alcatel-Lucent USA Inc., senior note, 144A, 6.75%, 11/15/20 | | | France | | | | 913,000 | | | | 965,498 | |
| e,j | | CommScope Holdings Co. Inc., senior note, 144A, PIK, 6.625%, 6/01/20 | | | United States | | | | 200,000 | | | | 203,000 | |
| e | | CommScope Technologies Finance LLC, senior bond, 144A, 6.00%, 6/15/25 | | | United States | | | | 1,000,000 | | | | 965,000 | |
| | | | | | | | | | | | | | |
| | | | | | | | | | | | | 2,133,498 | |
| | | | | | | | | | | | | | |
| | Telecommunication Services 3.3% | | | | | | | | | | | | |
| | AT&T Inc., senior bond, 3.40%, 5/15/25 | | | United States | | | | 1,900,000 | | | | 1,829,924 | |
| | CenturyLink Inc., | | | | | | | | | | | | |
| | senior bond, 6.75%, 12/01/23 | | | United States | | | | 700,000 | | | | 658,875 | |
| | senior bond, 5.625%, 4/01/25 | | | United States | | | | 900,000 | | | | 763,875 | |
| | senior note, 6.00%, 4/01/17 | | | United States | | | | 500,000 | | | | 519,375 | |
| | senior note, 6.45%, 6/15/21 | | | United States | | | | 500,000 | | | | 490,000 | |
| e | | Digicel Group Ltd., senior note, 144A, 8.25%, 9/30/20 | | | Bermuda | | | | 1,200,000 | | | | 990,000 | |
| e | | Digicel Ltd., senior note, 144A, | | | | | | | | | | | | |
| | 6.00%, 4/15/21 | | | Bermuda | | | | 1,000,000 | | | | 850,625 | |
| | 6.75%, 3/01/23 | | | Bermuda | | | | 300,000 | | | | 252,459 | |
| | Frontier Communications Corp., senior bond, | | | | | | | | | | | | |
| | 7.625%, 4/15/24 | | | United States | | | | 200,000 | | | | 169,000 | |
| | 7.875%, 1/15/27 | | | United States | | | | 300,000 | | | | 247,500 | |
| | Intelsat Jackson Holdings SA, | | | | | | | | | | | | |
| | senior bond, 6.625%, 12/15/22 | | | Luxembourg | | | | 1,600,000 | | | | 1,028,000 | |
| | senior note, 7.25%, 10/15/20 | | | Luxembourg | | | | 1,000,000 | | | | 875,000 | |
| | senior note, 7.50%, 4/01/21 | | | Luxembourg | | | | 1,000,000 | | | | 875,000 | |
| e | | Millicom International Cellular SA, senior note, 144A, 6.625%, 10/15/21 | | | Luxembourg | | | | 2,200,000 | | | | 2,052,875 | |
| | Sprint Communications Inc., senior note, | | | | | | | | | | | | |
| | 8.375%, 8/15/17 | | | United States | | | | 1,200,000 | | | | 1,188,000 | |
| | 6.00%, 11/15/22 | | | United States | | | | 500,000 | | | | 360,000 | |
| | e 144A, 9.00%, 11/15/18 | | | United States | | | | 1,500,000 | | | | 1,582,500 | |
| | e 144A, 7.00%, 3/01/20 | | | United States | | | | 800,000 | | | | 804,000 | |
| | Sprint Corp., senior bond, 7.875%, 9/15/23 | | | United States | | | | 500,000 | | | | 376,750 | |
| | T-Mobile USA Inc., | | | | | | | | | | | | |
| | senior bond, 6.50%, 1/15/24 | | | United States | | | | 500,000 | | | | 511,250 | |
| | senior bond, 6.375%, 3/01/25 | | | United States | | | | 1,300,000 | | | | 1,319,500 | |
| | senior note, 6.542%, 4/28/20 | | | United States | | | | 1,400,000 | | | | 1,463,000 | |
| | senior note, 6.125%, 1/15/22 | | | United States | | | | 200,000 | | | | 206,000 | |
| | Verizon Communications Inc., senior note, 5.15%, 9/15/23 | | | United States | | | | 2,000,000 | | | | 2,202,406 | |
FRANKLIN TEMPLETON VARIABLE INSURANCE PRODUCTS TRUST
STATEMENT OF INVESTMENTS
Franklin Strategic Income VIP Fund (continued)
| | | | | | | | | | | | | | |
| | | | | Country | | | Principal Amount* | | | Value | |
| | Corporate Bonds (continued) | | | | | | | | | | | | |
| | Telecommunication Services (continued) | | | | | | | | | | | | |
| e | | Wind Acquisition Finance SA, senior secured note, 144A, | | | | | | | | | | | | |
| | 4.00%, 7/15/20 | | | Italy | | | | 1,200,000 | EUR | | $ | 1,304,315 | |
| | 7.00%, 4/23/21 | | | Italy | | | | 1,500,000 | EUR | | | 1,620,242 | |
| | | | | | | | | | | | | | |
| | | | | | | | | | | | | 24,540,471 | |
| | | | | | | | | | | | | | |
| | Transportation 0.7% | | | | | | | | | | | | |
| e | | Florida East Coast Holdings Corp., | | | | | | | | | | | | |
| | secured note, first lien, 144A, 6.75%, 5/01/19 | | | United States | | | | 900,000 | | | | 825,750 | |
| | senior note, 144A, 9.75%, 5/01/20 | | | United States | | | | 400,000 | | | | 274,000 | |
| | Hertz Corp., senior note, | | | | | | | | | | | | |
| | 6.75%, 4/15/19 | | | United States | | | | 1,000,000 | | | | 1,024,000 | |
| | 6.25%, 10/15/22 | | | United States | | | | 1,700,000 | | | | 1,768,000 | |
| e | | Stena AB, senior bond, 144A, 7.00%, 2/01/24 | | | Sweden | | | | 700,000 | | | | 598,500 | |
| e | | Stena International SA, secured bond, 144A, 5.75%, 3/01/24 | | | Sweden | | | | 1,100,000 | | | | 931,563 | |
| | | | | | | | | | | | | | |
| | | | | | | | | | | | | 5,421,813 | |
| | | | | | | | | | | | | | |
| | Utilities 1.6% | | | | | | | | | | | | |
| | Calpine Corp., | | | | | | | | | | | | |
| | senior bond, 5.75%, 1/15/25 | | | United States | | | | 1,200,000 | | | | 1,063,500 | |
| | senior note, 5.375%, 1/15/23 | | | United States | | | | 1,300,000 | | | | 1,173,250 | |
| e,f | | EDF SA, sub. note, 144A, 5.25% to 1/29/23, FRN thereafter, Perpetual | | | France | | | | 3,000,000 | | | | 2,842,500 | |
| e | | Exelon Corp., senior bond, 144A, 3.95%, 6/15/25 | | | United States | | | | 1,800,000 | | | | 1,802,171 | |
| e | | InterGen NV, secured bond, 144A, 7.00%, 6/30/23 | | | Netherlands | | | | 2,500,000 | | | | 1,993,750 | |
| | Sempra Energy, | | | | | | | | | | | | |
| | senior bond, 3.55%, 6/15/24 | | | United States | | | | 700,000 | | | | 697,459 | |
| | senior note, 3.75%, 11/15/25 | | | United States | | | | 1,100,000 | | | | 1,100,212 | |
| e,h | | Texas Competitive Electric Holdings Co. LLC/Texas Competitive Electric Holdings Finance Inc., senior secured note, first lien, 144A, 11.50%, 10/01/16 | | | United States | | | | 3,000,000 | | | | 1,005,000 | |
| | | | | | | | | | | | | | |
| | | | | | | | | | | | | 11,677,842 | |
| | | | | | | | | | | | | | |
| | Semiconductors & Semiconductor Equipment 0.2% | | | | | | | | | | | | |
| e | | Qorvo Inc., senior bond, 144A, 7.00%, 12/01/25 | | | United States | | | | 1,400,000 | | | | 1,445,500 | |
| | | | | | | | | | | | | | |
| | | | |
| | Total Corporate Bonds (Cost $329,078,707) | | | | | | | | | | | 289,686,139 | |
| | | | | | | | | | | | | | |
| k,l | | Senior Floating Rate Interests 10.8% | | | | | | | | | | | | |
| | Automobiles & Components 0.3% | | | | | | | | | | | | |
| | Crowne Group LLC, Term Loan, 6.00%, 9/30/20 | | | United States | | | | 930,707 | | | | 907,439 | |
| m | | TI Group Automotive Systems LLC, Initial U.S. Term Loan, 4.50%, 6/25/22 | | | United States | | | | 1,142,295 | | | | 1,119,449 | |
| | | | | | | | | | | | | | |
| | | | | | | | | | | | | 2,026,888 | |
| | | | | | | | | | | | | | |
| | Capital Goods 0.6% | | | | | | | | | | | | |
| | Doncasters U.S. Finance LLC, Second Lien Term Loan, 9.50%, 10/09/20 | | | United States | | | | 76,701 | | | | 74,016 | |
| | Sensus USA Inc., | | | | | | | | | | | | |
| | First Lien Term Loan, 4.50%, 5/09/17 | | | United States | | | | 1,304,445 | | | | 1,275,095 | |
| | Second Lien Term Loan, 8.50%, 5/09/18 | | | United States | | | | 3,032,186 | | | | 2,979,123 | |
| | Ventia Pty. Ltd., Term B Loans, 5.50%, 5/21/22 | | | Australia | | | | 42,394 | | | | 42,076 | |
| | | | | | | | | | | | | | |
| | | | | | | | | | | | | 4,370,310 | |
| | | | | | | | | | | | | | |
FRANKLIN TEMPLETON VARIABLE INSURANCE PRODUCTS TRUST
STATEMENT OF INVESTMENTS
Franklin Strategic Income VIP Fund (continued)
| | | | | | | | | | | | | | |
| | | | | Country | | | Principal Amount* | | | Value | |
| k,l | | Senior Floating Rate Interests (continued) | | | | | | | | | | | | |
| | Consumer Services 0.7% | | | | | | | | | | | | |
| | Aristocrat Technologies Inc., First Lien Initial Term Loan, 4.75%, 10/20/21 | | | United States | | | | 122,934 | | | $ | 122,660 | |
| | Fitness International LLC, Term B Loan, 5.50%, 7/01/20 | | | United States | | | | 4,005,225 | | | | 3,769,918 | |
| c,j | | Turtle Bay Holdings LLC, Term Loan B, PIK, 3.00%, 6/30/16 | | | United States | | | | 1,413,015 | | | | 1,395,353 | |
| | | | | | | | | | | | | | |
| | | | | | | | | | | | | 5,287,931 | |
| | | | | | | | | | | | | | |
| | Diversified Financials 0.3% | | | | | | | | | | | | |
| | First Eagle Investment Management, Initial Term Loans, 4.75%, 12/01/22 | | | United States | | | | 1,191,944 | | | | 1,178,038 | |
| | Guggenheim Partners Investment Management Holdings LLC, Initial Term Loan, 4.25%, 7/22/20 | | | United States | | | | 922,595 | | | | 918,750 | |
| | | | | | | | | | | | | | |
| | | | | | | | | | | | | 2,096,788 | |
| | | | | | | | | | | | | | |
| | Energy 1.5% | | | | | | | | | | | | |
| | Bowie Resource Holdings LLC, | | | | | | | | | | | | |
| | m First Lien Initial Term Loan, 6.75%, 8/16/20 | | | United States | | | | 3,030,949 | | | | 2,955,175 | |
| | Second Lien Initial Term Loan, 11.75%, 2/16/21 | | | United States | | | | 1,248,332 | | | | 1,221,805 | |
| | Fieldwood Energy LLC, Loans, 3.875%, 10/01/18 | | | United States | | | | 3,550,049 | | | | 2,431,784 | |
| | Foresight Energy LLC, Term Loans, 5.50%, 8/21/20 | | | United States | | | | 1,372,000 | | | | 1,097,600 | |
| | McDermott Finance LLC, Term Loan, 5.25%, 4/16/19 | | | United States | | | | 200,379 | | | | 195,369 | |
| | OSG Bulk Ships Inc., Initial Term Loan, 5.25%, 8/05/19 | | | United States | | | | 1,232,927 | | | | 1,186,692 | |
| | OSG International Inc., Initial Term Loan, 5.75%, 8/05/19 | | | United States | | | | 2,002,014 | | | | 1,946,958 | |
| | | | | | | | | | | | | | |
| | | | | | | | | | | | | 11,035,383 | |
| | | | | | | | | | | | | | |
| | Food, Beverage & Tobacco 0.0%† | | | | | | | | | | | | |
| | Post Holdings Inc., Series A Incremental Term Loan, 3.75%, 6/02/21 | | | United States | | | | 253,882 | | | | 253,775 | |
| | | | | | | | | | | | | | |
| | Health Care Equipment & Services 0.9% | | | | | | | | | | | | |
| | Community Health Systems Inc., 2018 Term F Loans, 3.657%, 12/31/18 | | | United States | | | | 1,974,131 | | | | 1,949,101 | |
| | Cotiviti Corp., | | | | | | | | | | | | |
| | Initial Term Loan, 4.50%, 5/14/21 | | | United States | | | | 1,839,360 | | | | 1,791,843 | |
| | Second Lien Initial Term Loan, 8.00%, 5/13/22 | | | United States | | | | 253,793 | | | | 250,938 | |
| | Kinetic Concepts Inc., Dollar Term E-1 Loan, 4.50%, 5/04/18 | | | United States | | | | 1,001,579 | | | | 965,689 | |
| h | | Millennium Health LLC, Tranche B Term Loan, 6.50%, 4/16/21 | | | United States | | | | 950,432 | | | | 409,874 | |
| | Truven Health Analytics Inc., New Tranche B Term Loan, 4.50%, 6/06/19 | | | United States | | | | 1,637,530 | | | | 1,572,029 | |
| | | | | | | | | | | | | | |
| | | | | | | | | | | | | 6,939,474 | |
| | | | | | | | | | | | | | |
| | Materials 1.4% | | | | | | | | | | | | |
| | The Chemours Co. LLC, Tranche B Term Loan, 3.75%, 5/12/22 | | | United States | | | | 3,599,853 | | | | 3,311,864 | |
| | Coveris Holdings SA, Term B-1 Loans, 4.50%, 5/08/19 | | | Luxembourg | | | | 956,988 | | | | 933,063 | |
| | FMG America Finance Inc. (Fortescue Metals Group), Loans, 4.25%, 6/30/19 | | | Australia | | | | 2,361,452 | | | | 1,772,728 | |
| | Huntsman International LLC, Extended Term Loan B, 3.318%, 4/19/19 | | | United States | | | | 378,485 | | | | 374,069 | |
| | Ineos U.S. Finance LLC, | | | | | | | | | | | | |
| | 2018 Dollar Term Loans, 3.75%, 5/04/18 | | | United States | | | | 69,766 | | | | 68,109 | |
| | Dollar Term Loan, 4.25%, 3/31/22 | | | United States | | | | 346,062 | | | | 334,938 | |
| | Novelis Inc., Initial Term Loan, 4.00%, 6/02/22 | | | Canada | | | | 798,049 | | | | 763,883 | |
| | OCI Beaumont LLC, Term B-3 Loan, 6.50%, 8/20/19 | | | United States | | | | 1,749,920 | | | | 1,767,419 | |
| h | | Walter Energy Inc., B Term Loan, 8.50%, 4/02/18 | | | United States | | | | 3,083,004 | | | | 863,241 | |
| | | | | | | | | | | | | | |
| | | | | | | | | | | | | 10,189,314 | |
| | | | | | | | | | | | | | |
FRANKLIN TEMPLETON VARIABLE INSURANCE PRODUCTS TRUST
STATEMENT OF INVESTMENTS
Franklin Strategic Income VIP Fund (continued)
| | | | | | | | | | | | | | |
| | | | | Country | | | Principal Amount* | | | Value | |
| k,l | | Senior Floating Rate Interests (continued) | | | | | | | | | | | | |
| | Media 1.2% | | | | | | | | | | | | |
| | CSC Holdings Inc. (Cablevision), Initial Term Loans, 5.00%, 10/09/22 | | | United States | | | | 1,143,785 | | | $ | 1,143,683 | |
| | Media General Inc., Term B Loan, 4.00%, 7/31/20 | | | United States | | | | 225,939 | | | | 223,510 | |
| | Radio One Inc., Term Loan B, 5.11%, 12/31/18 | | | United States | | | | 6,833,503 | | | | 6,957,361 | |
| | Virgin Media Bristol LLC, F Facility, 3.50%, 6/30/23 | | | United States | | | | 571,213 | | | | 560,027 | |
| | | | | | | | | | | | | | |
| | | | | | | | | | | | | 8,884,581 | |
| | | | | | | | | | | | | | |
| | Pharmaceuticals, Biotechnology & Life Sciences 1.3% | | | | | | | | | | | | |
| | Endo Luxembourg Finance Co. I S.A.R.L. and Endo LLC, 2015 Incremental Term B Loans, 3.75%, 9/25/22 | | | United States | | | | 2,370,799 | | | | 2,343,635 | |
| | Grifols Worldwide Operations USA Inc., US Tranche B Term Loan, 3.424%, 2/27/21 | | | United States | | | | 2,752,831 | | | | 2,730,808 | |
| | Valeant Pharmaceuticals International Inc., | | | | | | | | | | | | |
| | Series C-2 Tranche B Term Loan, 3.75%, 12/11/19 | | | United States | | | | 150,000 | | | | 144,797 | |
| | Series D-2 Tranche B Term Loan, 3.50%, 2/13/19 | | | United States | | | | 1,340,000 | | | | 1,293,818 | |
| | Series F-1 Tranche B Term Loan, 4.00%, 4/01/22 | | | United States | | | | 3,455,318 | | | | 3,337,983 | |
| | | | | | | | | | | | | | |
| | | | | | | | | | | | | 9,851,041 | |
| | | | | | | | | | | | | | |
| | Retailing 0.6% | | | | | | | | | | | | |
| | Ascena Retail Group Inc., Tranche B Term Loan, 5.25%, 8/21/22 | | | United States | | | | 3,719,855 | | | | 3,496,664 | |
| | The Men’s Wearhouse Inc., Tranche B Term Loan, 4.50%, 6/18/21 | | | United States | | | | 743,288 | | | | 662,145 | |
| | | | | | | | | | | | | | |
| | | | | | | | | | | | | 4,158,809 | |
| | | | | | | | | | | | | | |
| | Semiconductors & Semiconductor Equipment 0.1% | | | | | | | | | | | | |
| | M/A-COM Technology Solutions Holdings Inc., Initial Term Loan, 4.50%, 5/07/21 | | | United States | | | | 515,746 | | | | 514,457 | |
| | NXP BV/NXP Funding LLC, Tranche B Loan, 3.75%, 12/07/20 | | | United States | | | | 394,999 | | | | 393,765 | |
| | | | | | | | | | | | | | |
| | | | | | | | | | | | | 908,222 | |
| | | | | | | | | | | | | | |
| | Software & Services 1.0% | | | | | | | | | | | | |
| | Match Group Inc., Term B-1 Loans, 5.50%, 11/16/22 | | | United States | | | | 1,178,049 | | | | 1,169,213 | |
| | MoneyGram International Inc., Term Loan, 4.25%, 3/27/20 | | | United States | | | | 5,113,703 | | | | 4,691,822 | |
| | Vertafore Inc., Second Lien Term Loan, 9.75%, 10/27/17 | | | United States | | | | 1,173,616 | | | | 1,172,736 | |
| | | | | | | | | | | | | | |
| | | | | | | | | | | | | 7,033,771 | |
| | | | | | | | | | | | | | |
| | Technology Hardware & Equipment 0.2% | | | | | | | | | | | | |
| | CIENA Corp., Term Loan, 3.75%, 7/15/19 | | | United States | | | | 227,527 | | | | 225,678 | |
| | Dell International LLC, Term B-2 Loan, 4.00%, 4/29/20 | | | United States | | | | 1,340,980 | | | | 1,334,554 | |
| | | | | | | | | | | | | | |
| | | | | | | | | | | | | 1,560,232 | |
| | | | | | | | | | | | | | |
| | Telecommunication Services 0.4% | | | | | | | | | | | | |
| | Intelsat Jackson Holdings SA, Tranche B-2 Term Loan, 3.75%, 6/30/19 | | | Luxembourg | | | | 1,328,748 | | | | 1,260,317 | |
| | Windstream Corp., Term Loan B-5, 3.50%, 8/08/19 | | | United States | | | | 566,822 | | | | 550,290 | |
| | Zayo Group LLC, 2021 Term Loans, 3.75%, 5/06/21 | | | United States | | | | 1,126,914 | | | | 1,111,621 | |
| | | | | | | | | | | | | | |
| | | | | | | | | | | | | 2,922,228 | |
| | | | | | | | | | | | | | |
| | Transportation 0.2% | | | | | | | | | | | | |
| | Navios Maritime Midstream Partners LP, Initial Term Loan, 5.50%, 6/18/20 | | | Marshall Islands | | | | 1,298,610 | | | | 1,285,624 | |
| | Navios Maritime Partners LP, Initial Term Loan, 5.25%, 6/27/18 | | | Marshall Islands | | | | 65,000 | | | | 63,700 | |
| | | | | | | | | | | | | | |
| | | | | | | | | | | | | 1,349,324 | |
| | | | | | | | | | | | | | |
FRANKLIN TEMPLETON VARIABLE INSURANCE PRODUCTS TRUST
STATEMENT OF INVESTMENTS
Franklin Strategic Income VIP Fund (continued)
| | | | | | | | | | | | | | |
| | | | | Country | | | Principal Amount* | | | Value | |
| k,l | | Senior Floating Rate Interests (continued) | | | | | | | | | | | | |
| | Utilities 0.1% | | | | | | | | | | | | |
| m | | Calpine Corp., Term Loan (B6), 5.25%, 1/15/23 | | | United States | | | | 635,294 | | | $ | 610,942 | |
| | | | | | | | | | | | | | |
| | | | |
| | Total Senior Floating Rate Interests
(Cost $84,942,523) | | | | | | | | | | | 79,479,013 | |
| | | | | | | | | | | | | | |
| | Foreign Government and Agency Securities 14.4% | | | | | | | | | | | | |
| | Government of Hungary, senior note, 6.25%, 1/29/20 | | | Hungary | | | | 1,500,000 | | | | 1,678,800 | |
| | Government of Indonesia, | | | | | | | | | | | | |
| | 6.125%, 5/15/28 | | | Indonesia | | | | 34,000,000,000 | IDR | | | 1,943,073 | |
| | FR34, 12.80%, 6/15/21 | | | Indonesia | | | | 17,235,000,000 | IDR | | | 1,460,240 | |
| | senior bond, FR53, 8.25%, 7/15/21 | | | Indonesia | | | | 46,000,000,000 | IDR | | | 3,264,441 | |
| | senior bond, FR70, 8.375%, 3/15/24 | | | Indonesia | | | | 26,500,000,000 | IDR | | | 1,873,979 | |
| | Government of Malaysia, | | | | | | | | | | | | |
| | senior bond, 3.814%, 2/15/17 | | | Malaysia | | | | 2,500,000 | MYR | | | 589,752 | |
| | senior bond, 4.24%, 2/07/18 | | | Malaysia | | | | 600,000 | MYR | | | 143,417 | |
| | senior note, 3.172%, 7/15/16 | | | Malaysia | | | | 32,500,000 | MYR | | | 7,594,637 | |
| | senior note, 3.394%, 3/15/17 | | | Malaysia | | | | 16,000,000 | MYR | | | 3,758,686 | |
| | senior note, 4.012%, 9/15/17 | | | Malaysia | | | | 23,400,000 | MYR | | | 5,558,774 | |
| | Government of Mexico, | | | | | | | | | | | | |
| | 6.25%, 6/16/16 | | | Mexico | | | | 1,524,310n | MXN | | | 8,952,657 | |
| | 7.25%, 12/15/16 | | | Mexico | | | | 930,330n | MXN | | | 5,580,172 | |
| | 7.75%, 12/14/17 | | | Mexico | | | | 285,000n | MXN | | | 1,769,216 | |
| | senior note, M, 5.00%, 6/15/17 | | | Mexico | | | | 750,000n | MXN | | | 4,416,841 | |
| | Government of Poland, | | | | | | | | | | | | |
| | 4.75%, 10/25/16 | | | Poland | | | | 18,800,000 | PLN | | | 4,917,666 | |
| | Strip, 1/25/16 | | | Poland | | | | 1,066,000 | PLN | | | 271,580 | |
| e | | Government of Portugal, 144A, 5.125%, 10/15/24 | | | Portugal | | | | 500,000 | | | | 513,677 | |
| e | | Government of Serbia, senior note, 144A, | | | | | | | | | | | | |
| | 4.875%, 2/25/20 | | | Serbia | | | | 4,000,000 | | | | 4,105,140 | |
| | 7.25%, 9/28/21 | | | Serbia | | | | 200,000 | | | | 226,983 | |
| | Government of Sri Lanka, | | | | | | | | | | | | |
| | A, 6.40%, 8/01/16 | | | Sri Lanka | | | | 19,500,000 | LKR | | | 134,816 | |
| | B, 6.40%, 10/01/16 | | | Sri Lanka | | | | 16,000,000 | LKR | | | 110,283 | |
| | B, 8.50%, 7/15/18 | | | Sri Lanka | | | | 15,280,000 | LKR | | | 105,429 | |
| | C, 8.50%, 4/01/18 | | | Sri Lanka | | | | 8,070,000 | LKR | | | 55,726 | |
| | D, 8.50%, 6/01/18 | | | Sri Lanka | | | | 54,050,000 | LKR | | | 372,111 | |
| | Government of the Philippines, senior note, | | | | | | | | | | | | |
| | 7.00%, 1/27/16 | | | Philippines | | | | 80,000,000 | PHP | | | 1,708,104 | |
| | 1.625%, 4/25/16 | | | Philippines | | | | 155,000,000 | PHP | | | 3,294,232 | |
| e | | Government of Ukraine, 144A, | | | | | | | | | | | | |
| | 7.75%, 9/01/22 | | | Ukraine | | | | 869,000 | | | | 790,564 | |
| | 7.75%, 9/01/23 | | | Ukraine | | | | 969,000 | | | | 868,151 | |
| | 7.75%, 9/01/24 | | | Ukraine | | | | 969,000 | | | | 862,148 | |
| | 7.75%, 9/01/25 | | | Ukraine | | | | 969,000 | | | | 856,853 | |
| | 7.75%, 9/01/26 | | | Ukraine | | | | 969,000 | | | | 847,725 | |
| | 7.75%, 9/01/27 | | | Ukraine | | | | 969,000 | | | | 846,504 | |
| | o GDP Linked Securities, 5/31/40 | | | Ukraine | | | | 1,952,000 | | | | 788,120 | |
| p | | Government of Uruguay, senior bond, Index Linked, 4.375%, 12/15/28 | | | Uruguay | | | | 182,458,483 | UYU | | | 5,535,052 | |
| | Korea Monetary Stabilization Bond, senior note, | | | | | | | | | | | | |
| | 2.07%, 12/02/16 | | | South Korea | | | | 3,750,000,000 | KRW | | | 3,203,866 | |
| | 1.96%, 2/02/17 | | | South Korea | | | | 5,000,000,000 | KRW | | | 4,269,882 | |
FRANKLIN TEMPLETON VARIABLE INSURANCE PRODUCTS TRUST
STATEMENT OF INVESTMENTS
Franklin Strategic Income VIP Fund (continued)
| | | | | | | | | | | | | | |
| | | | | Country | | | Principal Amount* | | | Value | |
| | Foreign Government and Agency Securities (continued) | | | | | | | | | | | | |
| | 1.56%, 10/02/17 | | | South Korea | | | | 4,000,000,000 | KRW | | $ | 3,399,464 | |
| | Korea Treasury Bond, senior note, 3.00%, 12/10/16 | | | South Korea | | | | 5,500,000,000 | KRW | | | 4,739,497 | |
| | Nota Do Tesouro Nacional, | | | | | | | | | | | | |
| | 10.00%, 1/01/17 | | | Brazil | | | | 7,500q | BRL | | | 1,802,261 | |
| | m 10.00%, 1/01/21 | | | Brazil | | | | 5,000q | BRL | | | 1,004,627 | |
| | 10.00%, 1/01/23 | | | Brazil | | | | 4,000q | BRL | | | 757,255 | |
| | r Index Linked, 6.00%, 8/15/16 | | | Brazil | | | | 1,604q | BRL | | | 1,122,965 | |
| | r Index Linked, 6.00%, 8/15/18 | | | Brazil | | | | 5,525q | BRL | | | 3,787,913 | |
| | r Index Linked, 6.00%, 5/15/23 | | | Brazil | | | | 3,350q | BRL | | | 2,172,940 | |
| | Uruguay Notas del Tesoro, | | | | | | | | | | | | |
| | 9.50%, 1/27/16 | | | Uruguay | | | | 9,220,000 | UYU | | | 307,051 | |
| | 07, 13.25%, 4/08/18 | | | Uruguay | | | | 87,300,000 | UYU | | | 2,794,417 | |
| | p 18, Index Linked, 2.25%, 8/23/17 | | | Uruguay | | | | 28,632,158 | UYU | | | 918,397 | |
| | | | | | | | | | | | | | |
| | | | |
| | Total Foreign Government and Agency Securities
(Cost $125,533,310) | | | | | | | | | | | 106,076,084 | |
| | | | | | | | | | | | | | |
| | U.S. Government and Agency Securities 4.0% | | | | | | | | | | | | |
| | U.S. Treasury Bond, | | | | | | | | | | | | |
| | 7.875%, 2/15/21 | | | United States | | | | 900,000 | | | | 1,166,596 | |
| | 6.50%, 11/15/26 | | | United States | | | | 2,400,000 | | | | 3,360,125 | |
| | U.S. Treasury Note, | | | | | | | | | | | | |
| | 4.625%, 2/15/17 | | | United States | | | | 600,000 | | | | 625,139 | |
| | 3.75%, 11/15/18 | | | United States | | | | 7,000,000 | | | | 7,494,256 | |
| | 2.75%, 2/15/24 | | | United States | | | | 4,000,000 | | | | 4,166,920 | |
| | 2.50%, 5/15/24 | | | United States | | | | 6,000,000 | | | | 6,131,568 | |
| | 2.375%, 8/15/24 | | | United States | | | | 3,500,000 | | | | 3,536,792 | |
| | p Index Linked, 2.125%, 1/15/19 | | | United States | | | | 775,451 | | | | 820,474 | |
| | p Index Linked, 0.625%, 7/15/21 | | | United States | | | | 1,688,437 | | | | 1,699,339 | |
| | | | | | | | | | | | | | |
| | | | |
| | Total U.S. Government and Agency Securities
(Cost $29,010,755) | | | | | | | | | | | 29,001,209 | |
| | | | | | | | | | | | | | |
| | Asset-Backed Securities and Commercial Mortgage-Backed Securities 7.6% | | | | | | | | | | | | |
| | Banks 3.8% | | | | | | | | | | | | |
| | Banc of America Commercial Mortgage Trust, 2006-4, AJ, 5.695%, 7/10/46 | | | United States | | | | 1,807,000 | | | | 1,804,396 | |
| k | | Bear Stearns Adjustable Rate Mortgage Trust, 2004-4, A6, FRN, 2.756%, 6/25/34 | | | United States | | | | 1,812,544 | | | | 1,840,416 | |
| | Bear Stearns Commercial Mortgage Securities Inc., | | | | | | | | | | | | |
| | k 2006-PW11, AJ, FRN, 5.638%, 3/11/39 | | | United States | | | | 1,000,000 | | | | 1,002,120 | |
| | k 2006-PW12, AJ, FRN, 5.952%, 9/11/38 | | | United States | | | | 1,440,000 | | | | 1,442,666 | |
| | 2006-PW13, AJ, 5.611%, 9/11/41 | | | United States | | | | 5,100,000 | | | | 5,159,007 | |
| | Citigroup Commercial Mortgage Trust, | | | | | | | | | | | | |
| | 2006-C5, AJ, 5.482%, 10/15/49 | | | United States | | | | 1,667,000 | | | | 1,633,527 | |
| | k 2007-C6, AM, FRN, 5.898%, 6/10/17 | | | United States | | | | 2,500,000 | | | | 2,557,765 | |
| | 2015-GC27, A5, 3.137%, 2/10/48 | | | United States | | | | 610,000 | | | | 598,007 | |
| k | | Citigroup/Deutsche Bank Commercial Mortgage Trust, 2006-CD3, AJ, FRN, 5.688%, 10/15/48 | | | United States | | | | 2,700,000 | | | | 2,208,060 | |
| | Countrywide Asset-Backed Certificates, 2005-11, AF4, 5.21%, 3/25/34 | | | United States | | | | 1,275,000 | | | | 1,244,258 | |
| | CSAIL Commercial Mortgage Trust, 2015-C1, A4, 3.505%, 4/15/50 | | | United States | | | | 915,000 | | | | 924,502 | |
FRANKLIN TEMPLETON VARIABLE INSURANCE PRODUCTS TRUST
STATEMENT OF INVESTMENTS
Franklin Strategic Income VIP Fund (continued)
| | | | | | | | | | | | | | |
| | | | | Country | | | Principal Amount* | | | Value | |
| | Asset-Backed Securities and Commercial Mortgage-Backed Securities (continued) | | | | | | | | | | | | |
| | Banks (continued) | | | | | | | | | | | | |
| | Greenwich Capital Commercial Funding Corp., | | | | | | | | | | | | |
| | k 2006-GG7, AJ, FRN, 5.622%, 7/10/38 | | | United States | | | | 2,560,000 | | | $ | 2,478,095 | |
| | 2007-GG9, AM, 5.475%, 3/10/39 | | | United States | | | | 1,030,000 | | | | 1,054,604 | |
| | JP Morgan Chase Commercial Mortgage Securities Trust, | | | | | | | | | | | | |
| | 2006-CB17, AM, 5.464%, 12/12/43 | | | United States | | | | 760,000 | | | | 765,188 | |
| | k 2006-LDP7, AJ, FRN, 5.909%, 4/15/45 | | | United States | | | | 1,245,000 | | | | 1,149,934 | |
| | JPMBB Commercial Mortgage Securities Trust, 2015 C-28, A4, 3.227%, 10/15/48 | | | United States | | | | 550,000 | | | | 541,510 | |
| k | | Merrill Lynch Mortgage Investors Trust, 2005-A6, 2A3, FRN, 0.802%, 8/25/35 | | | United States | | | | 292,260 | | | | 267,180 | |
| k | | Morgan Stanley Capital I Trust, 2006-HQ8, AJ, FRN, 5.623%, 3/12/44 | | | United States | | | | 200,000 | | | | 199,744 | |
| | Wells Fargo Commercial Mortgage Trust, 2014-LC16, A4, 3.548%, 8/15/50 | | | United States | | | | 220,000 | | | | 224,239 | |
| | Wells Fargo Mortgage Backed Securities Trust, | | | | | | | | | | | | |
| | k 2004-W, A9, FRN, 2.754%, 11/25/34 | | | United States | | | | 963,889 | | | | 982,562 | |
| | 2007-3, 3A1, 5.50%, 4/25/37 | | | United States | | | | 258,606 | | | | 263,574 | |
| | | | | | | | | | | | | | |
| | | | | | | | | | | | | 28,341,354 | |
| | | | | | | | | | | | | | |
| | Diversified Financials 3.8% | | | | | | | | | | | | |
| e,k | | ARES CLO XII Ltd., 2007-12A, B, 144A, FRN, 1.393%, 11/25/20 | | | United States | | | | 1,380,000 | | | | 1,365,165 | |
| e,k | | Atrium CDO Corp., 10A, C, 144A, FRN, 2.917%, 7/16/25 | | | United States | | | | 1,400,000 | | | | 1,354,220 | |
| e,k | | Atrium XI, 11A, C, 144A, FRN, 2.917%, 10/23/25 | | | Cayman Islands | | | | 1,820,000 | | | | 1,789,442 | |
| | Banc of America Commercial Mortgage Trust, 2015-UBS7, | | | | | | | | | | | | |
| | A3, 3.441%, 9/15/48 | | | United States | | | | 1,050,000 | | | | 1,052,092 | |
| | A4, 3.705%, 9/15/48 | | | United States | | | | 1,170,000 | | | | 1,200,841 | |
| e,k | | BCAP LLC Trust, 2009-RR1, 2A2, 144A, FRN, 2.738%, 5/26/35 | | | United States | | | | 440,000 | | | | 418,213 | |
| e,k | | Catamaran CLO Ltd., 2013-1A, C, 144A, FRN, 2.923%, 1/27/25 | | | Cayman Islands | | | | 1,130,000 | | | | 1,072,472 | |
| e,k | | Cent CDO Ltd., 2007-15A, A2B, 144A, FRN, 0.832%, 3/11/21 | | | United States | | | | 1,251,000 | | | | 1,196,369 | |
| e,k | | Cent CLO LP, 2013-17A, D, 144A, FRN, 3.322%, 1/30/25 | | | United States | | | | 784,314 | | | | 758,283 | |
| e,k | | CIFC Funding Ltd., 2007-3A, A1J, 144A, FRN, 0.72%, 7/26/21 | | | United States | | | | 960,000 | | | | 942,922 | |
| e,k | | ColumbusNova CLO Ltd., 2007-2A, A2, 144A, FRN, 1.321%, 10/15/21 | | | United States | | | | 860,000 | | | | 847,341 | |
| e | | Core Industrial Trust, 2015-CALW, A, 144A, 3.04%, 2/10/34 | | | United States | | | | 2,410,000 | | | | 2,402,564 | |
| e,k | | CT CDO IV Ltd., 2006-4A, A1, 144A, FRN, 0.712%, 10/20/43 | | | United States | | | | 302,561 | | | | 301,958 | |
| e,k | | Cumberland Park CDO Ltd., 2015-2A, B, 144A, FRN, 2.372%, 7/20/26 | | | Cayman Islands | | | | 1,080,000 | | | | 1,070,204 | |
| e,k | | Cumberland Park CLO Ltd., 2015-2A, C, 144A, FRN, 3.122%, 7/20/26 | | | United States | | | | 190,000 | | | | 184,587 | |
| e,k | | Eaton Vance CDO Ltd., 2014-1A, | | | | | | | | | | | | |
| | B, 144A, FRN, 2.371%, 7/15/26 | | | United States | | | | 426,000 | | | | 419,917 | |
| | C, 144A, FRN, 3.321%, 7/15/26 | | | United States | | | | 167,100 | | | | 164,047 | |
| e,k | | Eleven Madison Trust Mortgage Trust, 2015-11MD, A, 144A, FRN, 3.673%, 9/10/35 | | | United States | | | | 1,350,000 | | | | 1,364,148 | |
| k | | FHLMC Structured Agency Credit Risk Debt Notes, | | | | | | | | | | | | |
| | 2014-DN1, M2, FRN, 2.622%, 2/25/24 | | | United States | | | | 1,500,000 | | | | 1,496,087 | |
| | 2014-HQ2, M2, FRN, 2.622%, 9/25/24 | | | United States | | | | 1,000,000 | | | | 990,273 | |
| | 2015-HQ1, M2, FRN, 2.622%, 3/25/25 | | | United States | | | | 1,000,000 | | | | 997,915 | |
| e | | G-Force LLC, 2005-RRA, C, 144A, 5.20%, 8/22/36 | | | United States | | | | 2,000,000 | | | | 1,946,870 | |
| k | | Impac Secured Assets Trust, 2007-2, FRN, 0.672%, 4/25/37 | | | United States | | | | 278,311 | | | | 258,860 | |
FRANKLIN TEMPLETON VARIABLE INSURANCE PRODUCTS TRUST
STATEMENT OF INVESTMENTS
Franklin Strategic Income VIP Fund (continued)
| | | | | | | | | | | | | | |
| | | | | Country | | | Principal Amount* | | | Value | |
| | Asset-Backed Securities and Commercial Mortgage-Backed Securities (continued) | | | | | | | | | | | | |
| | Diversified Financials (continued) | | | | | | | | | | | | |
| e,k | | Invitation Homes Trust, 2015-SFR1, A, 144A, FRN, 1.801%, 3/17/32 | | | United States | | | | 1,471,496 | | | $ | 1,458,339 | |
| k | | MortgageIT Trust, 2004-1, A2, FRN, 1.322%, 11/25/34 | | | United States | | | | 346,663 | | | | 332,502 | |
| e,k | | Newcastle CDO Ltd., 2004-5A, 1, 144A, FRN, 0.934%, 12/24/39 | | | United States | | | | 33,975 | | | | 33,820 | |
| k | | Opteum Mortgage Acceptance Corp. Trust, 2005-4, 1APT, FRN, 0.732%, 11/25/35 | | | United States | | | | 575,353 | | | | 545,240 | |
| | Residential Asset Securities Corp., 2004-KS1, AI4, 4.213%, 4/25/32 | | | United States | | | | 3,974 | | | | 3,972 | |
| k | | Structured Asset Securities Corp., 2005-2XS, 2A2, FRN, 1.744%, 2/25/35 | | | United States | | | | 320,295 | | | | 309,633 | |
k,s | | Talisman 6 Finance, Reg S, FRN, 0.127%, 10/22/16 | | | Germany | | | | 43,398 | EUR | | | 46,609 | |
| k | | Thornburg Mortgage Securities Trust, 2005-1, A3, FRN, 2.269%, 4/25/45 | | | United States | | | | 286,648 | | | | 287,084 | |
| e,k | | Voya CLO Ltd., | | | | | | | | | | | | |
| | 2013-1A, B, 144A, FRN, 3.221%, 4/15/24 | | | Cayman Islands | | | | 270,000 | | | | 265,869 | |
| | 2013-2A, B, 144A, FRN, 3.00%, 4/25/25 | | | United States | | | | 1,080,000 | | | | 1,043,075 | |
| | | | | | | | | | | | | | |
| | | | | | | | | | | | | 27,920,933 | |
| | | | | | | | | | | | | | |
| | | | |
| | Total Asset-Backed Securities and Commercial Mortgage-Backed Securities (Cost $55,271,615) | | | | | | | | | | | 56,262,287 | |
| | | | | | | | | | | | | | |
| | Mortgage-Backed Securities 2.3% | | | | | | | | | | | | |
| k | | Federal Home Loan Mortgage Corp. (FHLMC) Adjustable Rate 0.0%† | | | | | | | | | | | | |
| | FHLMC, 2.348%, 1/01/33 | | | United States | | | | 49,475 | | | | 51,628 | |
| | | | | | | | | | | | | | |
| | Federal Home Loan Mortgage Corp. (FHLMC) Fixed Rate 0.5% | | | | | | | | | | | | |
| | FHLMC Gold 15 Year, 5.50%, 7/01/17 - 7/01/19 | | | United States | | | | 56,551 | | | | 59,009 | |
| | FHLMC Gold 15 Year, 6.00%, 5/01/17 | | | United States | | | | 1,993 | | | | 2,031 | |
| | FHLMC Gold 15 Year, 6.50%, 5/01/16 | | | United States | | | | 37 | | | | 37 | |
| m | | FHLMC Gold 30 Year, 3.50%, 1/01/45 | | | United States | | | | 1,348,000 | | | | 1,387,281 | |
| m | | FHLMC Gold 30 Year, 4.00%, 1/01/45 | | | United States | | | | 735,000 | | | | 776,311 | |
| | FHLMC Gold 30 Year, 5.00%, 4/01/34 - 8/01/35 | | | United States | | | | 344,455 | | | | 378,433 | |
| | FHLMC Gold 30 Year, 5.50%, 3/01/33 - 1/01/35 | | | United States | | | | 282,263 | | | | 313,157 | |
| | FHLMC Gold 30 Year, 6.00%, 4/01/33 - 2/01/36 | | | United States | | | | 270,346 | | | | 306,960 | |
| | FHLMC Gold 30 Year, 6.50%, 12/01/23 - 6/01/36 | | | United States | | | | 60,151 | | | | 68,808 | |
| | FHLMC Gold 30 Year, 7.00%, 9/01/21 - 4/01/30 | | | United States | | | | 26,657 | | | | 29,849 | |
| | FHLMC Gold 30 Year, 7.50%, 8/01/30 - 7/01/31 | | | United States | | | | 1,145 | | | | 1,237 | |
| | | | | | | | | | | | | | |
| | | | | | | | | | | | | 3,323,113 | |
| | | | | | | | | | | | | | |
| k | | Federal National Mortgage Association (FNMA) Adjustable Rate 0.0%† | | | | | | | | | | | | |
| | FNMA, 2.455% - 2.519%, 4/01/20 - 12/01/34 | | | United States | | | | 179,056 | | | | 188,286 | |
| | | | | | | | | | | | | | |
| | Federal National Mortgage Association (FNMA) Fixed Rate 1.5% | | | | | | | | | | | | |
| | FNMA 15 Year, 4.50%, 6/01/19 - 3/01/20 | | | United States | | | | 84,361 | | | | 87,299 | |
| | FNMA 15 Year, 5.00%, 10/01/17 - 6/01/18 | | | United States | | | | 50,397 | | | | 52,228 | |
| | FNMA 15 Year, 5.50%, 3/01/16 - 11/01/18 | | | United States | | | | 263,842 | | | | 271,057 | |
| | FNMA 15 Year, 6.00%, 4/01/16 - 7/01/16 | | | United States | | | | 275 | | | | 275 | |
| | FNMA 15 Year, 2.50%, 7/01/22 - 6/01/27 | | | United States | | | | 508,174 | | | | 516,511 | |
| m | | FNMA 30 Year, 3.50%, 1/01/45 | | | United States | | | | 3,427,000 | | | | 3,534,863 | |
| m | | FNMA 30 Year, 4.00%, 1/01/45 | | | United States | | | | 3,500,000 | | | | 3,702,960 | |
| m | | FNMA 30 Year, 4.50%, 1/01/45 | | | United States | | | | 2,120,000 | | | | 2,289,277 | |
| | FNMA 30 Year, 5.00%, 4/01/30 | | | United States | | | | 102,083 | | | | 112,331 | |
FRANKLIN TEMPLETON VARIABLE INSURANCE PRODUCTS TRUST
STATEMENT OF INVESTMENTS
Franklin Strategic Income VIP Fund (continued)
| | | | | | | | | | | | | | |
| | | | | Country | | | Principal Amount* | | | Value | |
| | Mortgage-Backed Securities (continued) | | | | | | | | | | | | |
| | Federal National Mortgage Association (FNMA) Fixed Rate (continued) | | | | | | | | | | | | |
| | FNMA 30 Year, 6.50%, 6/01/28 - 10/01/37 | | | United States | | | | 276,630 | | | $ | 316,648 | |
| | | | | | | | | | | | | | |
| | | | | | | | | | | | | 10,883,449 | |
| | | | | | | | | | | | | | |
| | Government National Mortgage Association (GNMA) Fixed Rate 0.3% | | | | | | | | | | | | |
| | GNMA I SF 30 Year, 5.00%, 11/15/33 - 7/15/34 | | | United States | | | | 360,981 | | | | 401,368 | |
| | GNMA I SF 30 Year, 6.50%, 2/15/32 | | | United States | | | | 2,088 | | | | 2,391 | |
| | GNMA I SF 30 Year, 7.00%, 10/15/28 - 6/15/32 | | | United States | | | | 18,858 | | | | 19,395 | |
| | GNMA I SF 30 Year, 7.50%, 9/15/30 | | | United States | | | | 1,471 | | | | 1,732 | |
| m | | GNMA II SF 30 Year, 3.50%, 1/01/45 | | | United States | | | | 1,570,000 | | | | 1,636,242 | |
| | GNMA II SF 30 Year, 5.00%, 9/20/33 - 11/20/33 | | | United States | | | | 106,662 | | | | 118,175 | |
| | GNMA II SF 30 Year, 6.00%, 11/20/34 | | | United States | | | | 123,368 | | | | 138,103 | |
| | GNMA II SF 30 Year, 6.50%, 4/20/31 - 2/20/34 | | | United States | | | | 57,947 | | | | 67,611 | |
| | GNMA II SF 30 Year, 7.50%, 1/20/28 - 4/20/32 | | | United States | | | | 13,203 | | | | 14,813 | |
| | | | | | | | | | | | | | |
| | | | | | | | | | | | | 2,399,830 | |
| | | | | | | | | | | | | | |
| | | | |
| | Total Mortgage-Backed Securities
(Cost $16,593,318) | | | | | | | | | | | 16,846,306 | |
| | | | | | | | | | | | | | |
| | Municipal Bonds 2.5% | | | | | | | | | | | | |
| | Florida State Hurricane Catastrophe Fund Finance Corp. Revenue, Series A, 2.995%, 7/01/20 | | | United States | | | | 2,500,000 | | | | 2,536,300 | |
| | Illinois State GO, Build America Bonds, 7.35%, 7/01/35 | | | United States | | | | 1,000,000 | | | | 1,097,040 | |
| | Massachusetts State GO, Consolidated Loan of 2014, Series A, 4.50%, 12/01/43 | | | United States | | | | 2,000,000 | | | | 2,143,240 | |
| | Nassau County GO, General Improvement Bonds, Series B, 5.00%, | | | | | | | | | | | | |
| | 4/01/39 | | | United States | | | | 500,000 | | | | 556,335 | |
| | 4/01/43 | | | United States | | | | 1,600,000 | | | | 1,766,160 | |
| | New York City HDC Revenue, Series B1, 5.00%, 7/01/33 | | | United States | | | | 500,000 | | | | 562,320 | |
| | New York City Municipal Water Finance Authority Water and Sewer | | | | | | | | | | | | |
| | System Revenue, Second General Resolution, Fiscal 2014, Refunding, Series BB, 5.00%, 6/15/46 | | | United States | | | | 2,430,000 | | | | 2,755,401 | |
| | Port Authority of New York and New Jersey Revenue, Consolidated, One Hundred Ninety-First Series, 4.823%, 6/01/45 | | | United States | | | | 3,500,000 | | | | 3,588,445 | |
| | Puerto Rico Electric Power Authority Power Revenue, | | | | | | | | | | | | |
| | Series A, 6.75%, 7/01/36 | | | United States | | | | 3,465,000 | | | | 2,247,919 | |
| | Series XX, 5.25%, 7/01/40 | | | United States | | | | 165,000 | | | | 106,013 | |
| | Puerto Rico Sales Tax FICO Sales Tax Revenue, first subordinate, Series A, | | | | | | | | | | | | |
| | 5.75%, 8/01/37 | | | United States | | | | 500,000 | | | | 205,000 | |
| | 6.50%, 8/01/44 | | | United States | | | | 2,375,000 | | | | 1,009,375 | |
| | | | | | | | | | | | | | |
| | | | |
| | Total Municipal Bonds (Cost $20,046,735) | | | | | | | | | | | 18,573,548 | |
| | | | | | | | | | | | | | |
| | | | |
| | | | | | | | Shares | | | | |
| | Escrows and Litigation Trusts 0.0% | | | | | | | | | | | | |
| a,g | | Comfort Co. Inc., Escrow Account | | | United States | | | | 13,427 | | | | — | |
FRANKLIN TEMPLETON VARIABLE INSURANCE PRODUCTS TRUST
STATEMENT OF INVESTMENTS
Franklin Strategic Income VIP Fund (continued)
| | | | | | | | | | | | | | |
| | | | | Country | | | Shares | | | Value | |
| | Escrows and Litigation Trusts (continued) | | | | | | | | | | | | |
| a,g | | NewPage Corp., Litigation Trust | | | United States | | | | 2,500,000 | | | $ | — | |
| | | | | | | | | | | | | | |
| | | | |
| | Total Escrows and Litigation Trusts (Cost $—) | | | | | | | | | | | — | |
| | | | | | | | | | | | | | |
| | | | |
| | Total Investments before Short Term Investments
(Cost $734,407,163) | | | | | | | | | | | 670,837,507 | |
| | | | | | | | | | | | | | |
| | | | |
| | | | | | | | Principal Amount* | | | | |
| | Short Term Investments 9.1% | | | | | | | | | | | | |
| | Foreign Government and Agency Securities (Cost $4,448,028) 0.5% | | | | | | | | | | | | |
| | Korea Monetary Stabilization Bond, senior note, 2.79%, 6/02/16 | | | South Korea | | | | 4,980,000,000 | KRW | | | 4,258,447 | |
| | | | | | | | | | | | | | |
| | | | |
| | Total Investments before Money Market Funds
(Cost $738,855,191) | | | | | | | | | | | 675,095,954 | |
| | | | | | | | | | | | | | |
| | | | |
| | | | | | | | Shares | | | | |
| | Money Market Funds (Cost $63,296,131) 8.6% | | | | | | | | | | | | |
| a,d | | Institutional Fiduciary Trust Money Market Portfolio | | | United States | | | | 63,296,131 | | | | 63,296,131 | |
| | | | | | | | | | | | | | |
| | Total Investments (Cost $802,151,322) 100.2% | | | | | | | | | | | 738,392,085 | |
| | Other Assets, less Liabilities (0.2)% | | | | | | | | | | | (1,576,415 | ) |
| | | | | | | | | | | | | | |
| | Net Assets 100.0% | | | | | | | | | | $ | 736,815,670 | |
| | | | | | | | | | | | | | |
†Rounds to less than 0.1% of net assets.
*The principal amount is stated in U.S. dollars unless otherwise indicated.
aNon-income producing.
bThe security is owned by FT Holdings Corporation III, a wholly-owned subsidiary of the Fund. See Note 1(g).
cAt December 31, 2015, pursuant to the Fund’s policies and the requirements of applicable securities law, the Fund is restricted from trading these securities at year end.
dSee Note 3(e) regarding investments in affiliated management investment companies.
eSecurity was purchased pursuant to Rule 144A under the Securities Act of 1933 and may be sold in transactions exempt from registration only to qualified institutional buyers or in a public offering registered under the Securities Act of 1933. These securities have been deemed liquid under guidelines approved by the Trust’s Board of Trustees. At December 31, 2015, the aggregate value of these securities was $149,357,745, representing 20.27% of net assets.
fPerpetual security with no stated maturity date.
gSecurity has been deemed illiquid because it may not be able to be sold within seven days. At December 31, 2015, the aggregate value of these securities was $124,628, representing 0.02% of net assets.
hSee Note 7 regarding defaulted securities.
iSee Note 1(f) regarding loan participation notes.
jIncome may be received in additional securities and/or cash.
kThe coupon rate shown represents the rate at period end.
lSee Note 1(i) regarding senior floating rate interests.
mA portion or all of the security purchased on a delayed delivery or to-be-announced (TBA) basis. See Note 1(c).
nPrincipal amount is stated in 100 Mexican Peso Units
oSecurity is linked to the Ukrainian GDP and does not pay principal over the life of the security or at expiration. The holder is entitled to receive only variable payments, subject to certain conditions, which are based on the growth of the Ukrainian GDP and principal of “notional” value of this GDP linked security.
pPrincipal amount of security is adjusted for inflation. See Note 1(k).
qPrincipal amount is stated in 1,000 Brazilian Real Units.
rRedemption price at maturity is adjusted for inflation. See Note 1(k).
sSecurity was purchased pursuant to Regulation S under the Securities Act of 1933, which exempts from registration securities offered and sold outside of the United States. Such a security cannot be sold in the United States without either an effective registration statement filed pursuant to the Securities Act of 1933, or pursuant to an exemption from registration. This security has been deemed liquid under guidelines approved by the Trust’s Board of Trustees. At December 31, 2015, the value of this security was $46,609, representing 0.01% of net assets.
FRANKLIN TEMPLETON VARIABLE INSURANCE PRODUCTS TRUST
STATEMENT OF INVESTMENTS
Franklin Strategic Income VIP Fund (continued)
At December 31, 2015, the Fund had the following forward exchange contracts outstanding. See Note 1(d).
| | | | | | | | | | | | | | | | | | | | | | | | | | | | |
| Forward Exchange Contracts | | | | | | | | | | | | | | | | |
| Currency | | Counterpartya | | | Type | | | Quantity | | | Contract
Amount | | | Settlement
Date | | | Unrealized
Appreciation | | | Unrealized
Depreciation | |
| OTC Forward Exchange Contracts | | | | | | | | | | | | | | | | | | | | | |
Australian Dollar | | | DBAB | | | | Sell | | | | 5,434,782 | | | $ | 3,994,402 | | | | 1/14/16 | | | $ | 37,953 | | | $ | — | |
Chilean Peso | | | BZWS | | | | Buy | | | | 477,650,000 | | | | 724,151 | | | | 1/14/16 | | | | — | | | | (51,190 | ) |
Chilean Peso | | | DBAB | | | | Buy | | | | 140,000,000 | | | | 213,577 | | | | 1/14/16 | | | | — | | | | (16,331 | ) |
Euro | | | BZWS | | | | Sell | | | | 167,374 | | | | 181,934 | | | | 1/14/16 | | | | 60 | | | | — | |
Euro | | | DBAB | | | | Buy | | | | 70,945 | | | | 77,010 | | | | 1/14/16 | | | | 80 | | | | — | |
Euro | | | DBAB | | | | Sell | | | | 70,945 | | | | 77,195 | | | | 1/14/16 | | | | 104 | | | | — | |
Euro | | | JPHQ | | | | Sell | | | | 4,984,544 | | | | 5,422,760 | | | | 1/14/16 | | | | 6,383 | | | | — | |
Indian Rupee | | | CITI | | | | Buy | | | | 4,537,000 | | | | 69,325 | | | | 1/14/16 | | | | — | | | | (908 | ) |
Indian Rupee | | | DBAB | | | | Buy | | | | 301,181,000 | | | | 4,591,423 | | | | 1/14/16 | | | | 9,786 | | | | (59,457 | ) |
Indian Rupee | | | HSBC | | | | Buy | | | | 144,338,000 | | | | 2,205,823 | | | | 1/14/16 | | | | — | | | | (29,233 | ) |
Japanese Yen | | | BZWS | | | | Sell | | | | 136,513,000 | | | | 1,102,304 | | | | 1/14/16 | | | | — | | | | (33,814 | ) |
Japanese Yen | | | CITI | | | | Sell | | | | 127,820,000 | | | | 1,032,177 | | | | 1/14/16 | | | | — | | | | (31,595 | ) |
Japanese Yen | | | DBAB | | | | Sell | | | | 661,679,000 | | | | 5,409,435 | | | | 1/14/16 | | | | — | | | | (97,334 | ) |
Japanese Yen | | | GSCO | | | | Sell | | | | 42,760,000 | | | | 345,307 | | | | 1/14/16 | | | | — | | | | (10,560 | ) |
Japanese Yen | | | HSBC | | | | Sell | | | | 247,910,000 | | | | 2,001,534 | | | | 1/14/16 | | | | — | | | | (61,677 | ) |
Japanese Yen | | | JPHQ | | | | Sell | | | | 149,719,000 | | | | 1,208,864 | | | | 1/14/16 | | | | — | | | | (37,160 | ) |
Singapore Dollar | | | DBAB | | | | Buy | | | | 617,400 | | | | 449,149 | | | | 1/14/16 | | | | — | | | | (13,935 | ) |
Singapore Dollar | | | DBAB | | | | Sell | | | | 617,400 | | | | 439,399 | | | | 1/14/16 | | | | 4,185 | | | | — | |
Singapore Dollar | | | JPHQ | | | | Buy | | | | 694,000 | | | | 504,617 | | | | 1/14/16 | | | | — | | | | (15,406 | ) |
Singapore Dollar | | | JPHQ | | | | Sell | | | | 694,000 | | | | 495,989 | | | | 1/14/16 | | | | 6,778 | | | | — | |
Australian Dollar | | | DBAB | | | | Sell | | | | 2,873,563 | | | | 1,999,281 | | | | 2/22/16 | | | | — | | | | (88,456 | ) |
Chilean Peso | | | DBAB | | | | Buy | | | | 314,000,000 | | | | 449,535 | | | | 2/22/16 | | | | — | | | | (9,166 | ) |
Chilean Peso | | | JPHQ | | | | Buy | | | | 234,301,000 | | | | 335,314 | | | | 2/22/16 | | | | — | | | | (6,719 | ) |
Chilean Peso | | | MSCO | | | | Buy | | | | 220,380,000 | | | | 314,806 | | | | 2/22/16 | | | | — | | | | (5,734 | ) |
Euro | | | BZWS | | | | Sell | | | | 132,570 | | | | 150,374 | | | | 2/22/16 | | | | 6,175 | | | | — | |
Euro | | | DBAB | | | | Buy | | | | 2,192,691 | | | | 2,394,713 | | | | 2/22/16 | | | | 552 | | | | (10,234 | ) |
Euro | | | DBAB | | | | Sell | | | | 5,724,675 | | | | 6,452,445 | | | | 2/22/16 | | | | 225,609 | | | | — | |
Euro | | | HSBC | | | | Sell | | | | 142,717 | | | | 161,958 | | | | 2/22/16 | | | | 6,722 | | | | — | |
Euro | | | JPHQ | | | | Sell | | | | 2,103,260 | | | | 2,370,012 | | | | 2/22/16 | | | | 82,257 | | | | — | |
Japanese Yen | | | DBAB | | | | Sell | | | | 1,397,612,000 | | | | 11,616,203 | | | | 2/22/16 | | | | 39,014 | | | | (63,879 | ) |
Japanese Yen | | | HSBC | | | | Sell | | | | 166,070,000 | | | | 1,365,711 | | | | 2/22/16 | | | | 3,216 | | | | (20,745 | ) |
Japanese Yen | | | JPHQ | | | | Sell | | | | 417,080,000 | | | | 3,440,064 | | | | 2/22/16 | | | | 9,488 | | | | (43,391 | ) |
Singapore Dollar | | | DBAB | | | | Buy | | | | 4,665,140 | | | | 3,299,950 | | | | 2/22/16 | | | | — | | | | (15,926 | ) |
Singapore Dollar | | | DBAB | | | | Sell | | | | 4,665,140 | | | | 3,316,607 | | | | 2/22/16 | | | | 32,583 | | | | — | |
Singapore Dollar | | | HSBC | | | | Buy | | | | 837,000 | | | | 591,791 | | | | 2/22/16 | | | | — | | | | (2,585 | ) |
Singapore Dollar | | | HSBC | | | | Sell | | | | 837,000 | | | | 595,942 | | | | 2/22/16 | | | | 6,736 | | | | — | |
Singapore Dollar | | | JPHQ | | | | Buy | | | | 4,945,200 | | | | 3,513,713 | | | | 2/22/16 | | | | — | | | | (32,541 | ) |
Singapore Dollar | | | JPHQ | | | | Sell | | | | 4,945,200 | | | | 3,531,529 | | | | 2/22/16 | | | | 50,356 | | | | — | |
British Pound | | | DBAB | | | | Sell | | | | 687,472 | | | | 1,061,732 | | | | 4/28/16 | | | | 48,140 | | | | — | |
Chilean Peso | | | CITI | | | | Buy | | | | 377,668,000 | | | | 544,975 | | | | 4/28/16 | | | | — | | | | (19,023 | ) |
Chilean Peso | | | JPHQ | | | | Buy | | | | 1,598,650,000 | | | | 2,308,020 | | | | 4/28/16 | | | | — | | | | (81,691 | ) |
Euro | | | BZWS | | | | Sell | | | | 4,318,741 | | | | 4,959,426 | | | | 4/28/16 | | | | 252,647 | | | | — | |
Euro | | | CITI | | | | Sell | | | | 1,058,200 | | | | 1,214,297 | | | | 4/28/16 | | | | 61,018 | | | | — | |
Euro | | | DBAB | | | | Sell | | | | 2,642,570 | | | | 3,034,992 | | | | 4/28/16 | | | | 154,987 | | | | — | |
Euro | | | GSCO | | | | Sell | | | | 369,000 | | | | 423,557 | | | | 4/28/16 | | | | 21,402 | | | | — | |
Euro | | | JPHQ | | | | Sell | | | | 6,561,135 | | | | 7,535,070 | | | | 4/28/16 | | | | 384,418 | | | | — | |
Japanese Yen | | | BZWS | | | | Sell | | | | 60,047,000 | | | | 505,531 | | | | 4/28/16 | | | | 4,215 | | | | — | |
Japanese Yen | | | CITI | | | | Sell | | | | 31,757,000 | | | | 267,211 | | | | 4/28/16 | | | | 2,081 | | | | — | |
Japanese Yen | | | DBAB | | | | Sell | | | | 27,184,000 | | | | 228,802 | | | | 4/28/16 | | | | 1,851 | | | | — | |
Japanese Yen | | | HSBC | | | | Sell | | | | 147,626,000 | | | | 1,242,884 | | | | 4/28/16 | | | | 10,395 | | | | — | |
Japanese Yen | | | JPHQ | | | | Sell | | | | 366,653,000 | | | | 3,086,435 | | | | 4/28/16 | | | | 25,349 | | | | — | |
Euro | | | CITI | | | | Sell | | | | 1,073,000 | | | | 1,182,317 | | | | 6/16/16 | | | | 11,027 | | | | — | |
Euro | | | JPHQ | | | | Sell | | | | 1,861,591 | | | | 2,051,334 | | | | 6/16/16 | | | | 19,217 | | | | — | |
Indian Rupee | | | DBAB | | | | Buy | | | | 96,375,000 | | | | 1,402,226 | | | | 6/16/16 | | | | 16,073 | | | | — | |
FRANKLIN TEMPLETON VARIABLE INSURANCE PRODUCTS TRUST
STATEMENT OF INVESTMENTS
Franklin Strategic Income VIP Fund (continued)
| | | | | | | | | | | | | | | | | | | | | | | | | | | | |
| Forward Exchange Contracts (continued) | | | | | | | | | | | | | | | | |
| Currency | | Counterpartya | | | Type | | | Quantity | | | Contract
Amount | | | Settlement
Date | | | Unrealized
Appreciation | | | Unrealized
Depreciation | |
| OTC Forward Exchange Contracts (continued) | | | | | | | | | | | | | | | | | | | | | |
Japanese Yen | | | DBAB | | | | Sell | | | | 1,175,702,500 | | | $ | 9,731,025 | | | | 6/16/16 | | | $ | — | | | $ | (100,725 | ) |
Japanese Yen | | | JPHQ | | | | Sell | | | | 425,150,000 | | | | 3,518,434 | | | | 6/16/16 | | | | — | | | | (36,860 | ) |
Japanese Yen | | | MSCO | | | | Sell | | | | 12,500,000 | | | | 103,448 | | | | 6/16/16 | | | | — | | | | (1,083 | ) |
Australian Dollar | | | DBAB | | | | Sell | | | | 1,950,000 | | | | 1,403,025 | | | | 10/20/16 | | | | 341 | | | | — | |
| | | | | | | | | | | | | | | | | | | | | | | | |
Total Forward Exchange Contracts | | | $ | 1,541,198 | | | $ | (997,358 | ) |
| | | | | | | | | | | | | | | | | | | | | | | | |
Net unrealized appreciation (depreciation) | | | $ | 543,840 | | | | | |
| | | | | | | | | | | | | | | | | | | | | | | | | | | | |
aMay be comprised of multiple contracts with the same counterparty, currency and settlement date.
At December 31, 2015, the Fund had the following credit default swap contracts outstanding. See Note 1(d).
Credit Default Swap Contracts
| | | | | | | | | | | | | | | | | | | | | | | | | | | | | | | | | | |
| Description | | Periodic
Payment
Rate | | | Counterparty /
Exchange | | | Notional
Amounta | | | Expiration
Date | | | Unamortized
Upfront
Payments
(Receipts) | | | Unrealized
Appreciation | | | Unrealized
Depreciation | | | Value | | | Ratingb |
| OTC Swap Contracts | | | | | | | | | | | | | | | | | | | | | | | | | | | | | | | | | | |
| | | | | | | | |
| Contracts to Sell Protectionc | | | | | | | | | | | | | | | | | | | | | | | | | | | | | | | |
| | | | | | | | | |
| Traded Index | | | | | | | | | | | | | | | | | | | | | | | | | | | | | | | | | | |
MCDX.NA.25 | | | 1.00 | % | | | GSCO | | | $ | 10,000,000 | | | | 12/20/20 | | | $ | (22,018 | ) | | $ | 42,608 | | | $ | — | | | $ | 20,590 | | | Non
Investment
Grade |
| | | | | | | | | | | | | | | | | | | | | | |
Net unrealized appreciation (depreciation) | | | | | | | $ | 42,608 | | | | | | | | | | | |
| | | | | | | | | | | | | | | | | | | | | | | | | | | | | | | | | | |
aFor contracts to sell protection, the notional amount is equal to the maximum potential amount of the future payments and no recourse provisions have been entered into in association with the contracts.
bBased on internal ratings for index swaps. Internal ratings based on mapping into equivalent ratings from external vendors.
cThe fund enters contracts to sell protection to create a long credit position. Performance triggers include failure to pay or bankruptcy of the underlying securities for traded index swaps.
See Note 8 regarding other derivative information.
See Abbreviations on page FSI-49.
| | | | |
| FSI-32 | | Annual Report | The accompanying notes are an integral part of these financial statements. | | |
FRANKLIN TEMPLETON VARIABLE INSURANCE PRODUCTS TRUST
Financial Statements
Statement of Assets and Liabilities
December 31, 2015
| | | | |
| | | Franklin Strategic
Income VIP Fund | |
Assets: | | | | |
Investments in securities: | | | | |
Cost - Unaffiliated issuers | | $ | 675,186,457 | |
Cost - Non-controlled affiliates (Note 3e) | | | 126,964,865 | |
| | | | |
Total cost of investments | | $ | 802,151,322 | |
| | | | |
Value - Unaffiliated issuers | | $ | 619,676,085 | |
Value - Non-controlled affiliates (Note 3e) | | | 118,716,000 | |
| | | | |
Total value of investments | | | 738,392,085 | |
Cash | | | 357,481 | |
Restricted Cash (Note 1e) | | | 496,000 | |
Foreign currency, at value (cost $6,474,808) | | | 6,524,237 | |
Receivables: | | | | |
Investment securities sold | | | 7,313,913 | |
Capital shares sold | | | 91,957 | |
Interest | | | 7,319,831 | |
Unrealized appreciation on OTC forward exchange contracts | | | 1,541,198 | |
Unrealized appreciation on OTC swap contracts | | | 42,608 | |
Other assets | | | 70 | |
| | | | |
Total assets | | | 762,079,380 | |
| | | | |
Liabilities: | | | | |
Payables: | | | | |
Investment securities purchased | | | 22,453,975 | |
Capital shares redeemed | | | 578,648 | |
Management fees | | | 343,026 | |
Distribution fees | | | 141,586 | |
OTC swap contracts (upfront receipts $23,061) | | | 22,018 | |
Due to brokers | | | 496,000 | |
Unrealized depreciation on OTC forward exchange contracts | | | 997,358 | |
Deferred tax | | | 6,186 | |
Accrued expenses and other liabilities | | | 224,913 | |
| | | | |
Total liabilities | | | 25,263,710 | |
| | | | |
Net assets, at value | | $ | 736,815,670 | |
| | | | |
Net assets consist of: | | | | |
Paid-in capital | | $ | 793,473,987 | |
Undistributed net investment income | | | 22,545,872 | |
Net unrealized appreciation (depreciation) | | | (63,159,552 | ) |
Accumulated net realized gain (loss) | | | (16,044,637 | ) |
| | | | |
Net assets, at value | | $ | 736,815,670 | |
| | | | |
| | | | | | |
| | | The accompanying notes are an integral part of these financial statements. | Annual Report | | | FSI-33 | |
FRANKLIN TEMPLETON VARIABLE INSURANCE PRODUCTS TRUST
FINANCIAL STATEMENTS
| | | | |
| | | Franklin Strategic
Income VIP Fund | |
| |
| Class 1: | | | | |
Net assets, at value | | $ | 441,658,440 | |
| | | | |
Shares outstanding | | | 41,872,540 | |
| | | | |
Net asset value and maximum offering price per share | | $ | 10.55 | |
| | | | |
| |
| Class 2: | | | | |
Net assets, at value | | $ | 202,192,242 | |
| | | | |
Shares outstanding | | | 19,808,658 | |
| | | | |
Net asset value and maximum offering price per share | | $ | 10.21 | |
| | | | |
| |
| Class 4: | | | | |
Net assets, at value | | $ | 92,964,988 | |
| | | | |
Shares outstanding | | | 8,903,129 | |
| | | | |
Net asset value and maximum offering price per share | | $ | 10.44 | |
| | | | |
| | | | | | |
| | FSI-34 | | | Annual Report | The accompanying notes are an integral part of these financial statements. | | |
FRANKLIN TEMPLETON VARIABLE INSURANCE PRODUCTS TRUST
FINANCIAL STATEMENTS
Statement of Operations
for the year ended December 31, 2015
| | | | |
| | | Franklin Strategic
Income VIP Fund | |
Investment income: | | | | |
Dividends: | | | | |
Unaffiliated issuers | | $ | 402,918 | |
Non-controlled affiliates (Note 3e) | | | 397,511 | |
Interest | | | 43,518,352 | |
| | | | |
Total investment income | | | 44,318,781 | |
| | | | |
Expenses: | | | | |
Management fees (Note 3a) | | | 4,867,671 | |
Distribution fees: (Note 3c) | | | | |
Class 2 | | | 530,251 | |
Class 4 | | | 376,483 | |
Custodian fees (Note 4) | | | 88,638 | |
Reports to shareholders | | | 176,036 | |
Professional fees | | | 95,238 | |
Trustees’ fees and expenses | | | 3,712 | |
Other | | | 70,343 | |
| | | | |
Total expenses | �� | | 6,208,372 | |
Expense reductions (Note 4) | | | (857 | ) |
Expenses waived/paid by affiliates (Note 3e) | | | (120,692 | ) |
| | | | |
Net expenses | | | 6,086,823 | |
| | | | |
Net investment income | | | 38,231,958 | |
| | | | |
Realized and unrealized gains (losses): | | | | |
Net realized gain (loss) from: | | | | |
Investments | | | (32,766,379 | ) |
Foreign currency transactions | | | 15,384,043 | |
Swap contracts | | | 165,572 | |
| | | | |
Net realized gain (loss) | | | (17,216,764 | ) |
| | | | |
Net change in unrealized appreciation (depreciation) on: | | | | |
Investments | | | (39,830,402 | ) |
Translation of other assets and liabilities denominated in foreign currencies | | | (10,109,432 | ) |
Swap contracts | | | (133,009 | ) |
Change in deferred taxes on unrealized appreciation | | | 4,913 | |
| | | | |
Net change in unrealized appreciation (depreciation) | | | (50,067,930 | ) |
| | | | |
Net realized and unrealized gain (loss) | | | (67,284,694 | ) |
| | | | |
Net increase (decrease) in net assets resulting from operations | | $ | (29,052,736 | ) |
| | | | |
| | | | | | |
| | | The accompanying notes are an integral part of these financial statements. | Annual Report | | | FSI-35 | |
FRANKLIN TEMPLETON VARIABLE INSURANCE PRODUCTS TRUST
FINANCIAL STATEMENTS
Statements of Changes in Net Assets
| | | | | | | | |
| | | Franklin Strategic Income VIP Fund | |
| | | Year Ended December 31, | |
| | | 2015 | | | 2014 | |
Increase (decrease) in net assets: | | | | | | | | |
Operations: | | | | | | | | |
Net investment income | | $ | 38,231,958 | | | $ | 41,174,450 | |
Net realized gain (loss) | | | (17,216,764 | ) | | | 21,895,839 | |
Net change in unrealized appreciation (depreciation) | | | (50,067,930 | ) | | | (41,564,436 | ) |
| | | | |
Net increase (decrease) in net assets resulting from operations | | | (29,052,736 | ) | | | 21,505,853 | |
| | | | |
Distributions to shareholders from: | | | | | | | | |
Net investment income and net foreign currency gains: | | | | | | | | |
Class 1 | | | (33,228,366 | ) | | | (39,220,893 | ) |
Class 2 | | | (13,693,486 | ) | | | (11,269,863 | ) |
Class 4 | | | (6,782,412 | ) | | | (7,512,342 | ) |
Net realized gains: | | | | | | | | |
Class 1 | | | (8,524,986 | ) | | | (12,517,628 | ) |
Class 2 | | | (3,636,551 | ) | | | (3,732,579 | ) |
Class 4 | | | (1,855,841 | ) | | | (2,588,163 | ) |
| | | | |
Total distributions to shareholders | | | (67,721,642 | ) | | | (76,841,468 | ) |
| | | | |
Capital share transactions: (Note 2) | | | | | | | | |
Class 1 | | | (74,671,750 | ) | | | (94,647,397 | ) |
Class 2 | | | 21,200,703 | | | | 43,236,033 | |
Class 4 | | | (8,346,246 | ) | | | (13,615,799 | ) |
| | | | |
Total capital share transactions | | | (61,817,293 | ) | | | (65,027,163 | ) |
| | | | |
Net increase (decrease) in net assets | | | (158,591,671 | ) | | | (120,362,778 | ) |
Net assets: | | | | | | | | |
Beginning of year | | | 895,407,341 | | | | 1,015,770,119 | |
| | | | |
End of year | | $ | 736,815,670 | | | $ | 895,407,341 | |
| | | | |
Undistributed net investment income included in net assets: | | | | | | | | |
End of year | | $ | 22,545,872 | | | $ | 39,238,788 | |
| | | | |
| | | | | | |
| | FSI-36 | | | Annual Report | The accompanying notes are an integral part of these financial statements. | | |
FRANKLIN TEMPLETON VARIABLE INSURANCE PRODUCTS TRUST
Notes to Financial Statements
Franklin Strategic Income VIP Fund
1. Organization and Significant Accounting Policies
Franklin Templeton Variable Insurance Products Trust (Trust) is registered under the Investment Company Act of 1940 (1940 Act) as an open-end management investment company, consisting of nineteen separate funds and applies the specialized accounting and reporting guidance in U.S. Generally Accepted Accounting Principles (U.S. GAAP). Franklin Strategic Income VIP Fund (Fund) is included in this report. The financial statements of the remaining funds in the Trust are presented separately. Shares of the Fund are generally sold only to insurance company separate accounts to fund the benefits of variable life insurance policies or variable annuity contracts. At December 31, 2015, 73.31% of the Fund’s shares were held through one insurance company. Investment activities of these insurance company separate accounts could have a material impact on the Fund. The Fund offers three classes of shares: Class 1, Class 2 and Class 4. Each class of shares differs by its distribution fees, voting rights on matters affecting a single class and its exchange privilege.
The following summarizes the Fund’s significant accounting policies.
a. Financial Instrument Valuation
The Fund’s investments in financial instruments are carried at fair value daily. Fair value is the price that would be received to sell an asset or paid to transfer a liability in an orderly transaction between market participants on the measurement date. The Fund calculates the net asset value (NAV) per share as of 4 p.m. Eastern time each day the New York Stock Exchange (NYSE) is open for trading. Under compliance policies and procedures approved by the Trust’s Board of Trustees (the Board), the Fund’s administrator has responsibility for oversight of valuation, including leading the cross-functional Valuation and Liquidity Oversight Committee (VLOC). The VLOC provides administration and oversight of the Fund’s valuation policies and procedures, which are approved annually by the Board. Among other things, these procedures allow the Fund to utilize independent pricing services, quotations from securities and financial instrument dealers, and other market sources to determine fair value.
Equity securities and exchange traded funds listed on an exchange or on the NASDAQ National Market System are valued at the last quoted sale price or the official closing price of the day, respectively. Foreign equity securities are valued as of the close of trading on the foreign stock exchange on which the security is primarily traded
or as of 4 p.m. Eastern time whichever is earlier. The value is then converted into its U.S. dollar equivalent at the foreign exchange rate in effect at 4 p.m. Eastern time on the day that the value of the security is determined. Over-the-counter (OTC) securities are valued within the range of the most recent quoted bid and ask prices. Securities that trade in multiple markets or on multiple exchanges are valued according to the broadest and most representative market. Certain equity securities are valued based upon fundamental characteristics or relationships to similar securities.
Debt securities generally trade in the OTC market rather than on a securities exchange. The Fund’s pricing services use multiple valuation techniques to determine fair value. In instances where sufficient market activity exists, the pricing services may utilize a market-based approach through which quotes from market makers are used to determine fair value. In instances where sufficient market activity may not exist or is limited, the pricing services also utilize proprietary valuation models which may consider market characteristics such as benchmark yield curves, credit spreads, estimated default rates, anticipated market interest rate volatility, coupon rates, anticipated timing of principal repayments, underlying collateral, and other unique security features in order to estimate the relevant cash flows, which are then discounted to calculate the fair value. Securities denominated in a foreign currency are converted into their U.S. dollar equivalent at the foreign exchange rate in effect at 4 p.m. Eastern time on the date that the values of the foreign debt securities are determined.
Investments in open-end mutual funds are valued at the closing NAV.
Certain derivative financial instruments (derivatives) trade in the OTC market. The Fund’s pricing services use various techniques including industry standard option pricing models and proprietary discounted cash flow models to determine the fair value of those instruments. The Fund’s net benefit or obligation under the derivative contract, as measured by the fair value of the contract, is included in net assets.
The Fund has procedures to determine the fair value of financial instruments for which market prices are not reliable or readily available. Under these procedures, the VLOC convenes on a regular basis to review such financial instruments and considers a number of factors, including significant unobservable valuation inputs, when arriving at fair value. The VLOC primarily
FRANKLIN TEMPLETON VARIABLE INSURANCE PRODUCTS TRUST
NOTES TO FINANCIAL STATEMENTS
Franklin Strategic Income VIP Fund (continued)
1. Organization and Significant Accounting Policies (continued)
a. Financial Instrument Valuation (continued)
employs a market-based approach which may use related or comparable assets or liabilities, recent transactions, market multiples, book values, and other relevant information for the investment to determine the fair value of the investment. An income-based valuation approach may also be used in which the anticipated future cash flows of the investment are discounted to calculate fair value. Discounts may also be applied due to the nature or duration of any restrictions on the disposition of the investments. Due to the inherent uncertainty of valuations of such investments, the fair values may differ significantly from the values that would have been used had an active market existed. The VLOC employs various methods for calibrating these valuation approaches including a regular review of key inputs and assumptions, transactional back-testing or disposition analysis, and reviews of any related market activity.
Trading in securities on foreign securities stock exchanges and OTC markets may be completed before 4 p.m. Eastern time. In addition, trading in certain foreign markets may not take place on every NYSE business day. Occasionally, events occur between the time at which trading in a foreign security is completed and the close of the NYSE that might call into question the reliability of the value of a portfolio security held by the Fund. As a result, differences may arise between the value of the Fund’s portfolio securities as determined at the foreign market close and the latest indications of value at the close of the NYSE. In order to minimize the potential for these differences, the VLOC monitors price movements following the close of trading in foreign stock markets through a series of country specific market proxies (such as baskets of American Depositary Receipts, futures contracts and exchange traded funds). These price movements are measured against established trigger thresholds for each specific market proxy to assist in determining if an event has occurred that may call into question the reliability of the values of the foreign securities held by the Fund. If such an event occurs, the securities may be valued using fair value procedures, which may include the use of independent pricing services.
When the last day of the reporting period is a non-business day, certain foreign markets may be open on those days that the NYSE is closed, which could result in differences between the value of the Fund’s portfolio securities on the last business
day and the last calendar day of the reporting period. Any significant security valuation changes due to an open foreign market are adjusted and reflected by the Fund for financial reporting purposes.
b. Foreign Currency Translation
Portfolio securities and other assets and liabilities denominated in foreign currencies are translated into U.S. dollars based on the exchange rate of such currencies against U.S. dollars on the date of valuation. The Fund may enter into foreign currency exchange contracts to facilitate transactions denominated in a foreign currency. Purchases and sales of securities, income and expense items denominated in foreign currencies are translated into U.S. dollars at the exchange rate in effect on the transaction date. Portfolio securities and assets and liabilities denominated in foreign currencies contain risks that those currencies will decline in value relative to the U.S. dollar. Occasionally, events may impact the availability or reliability of foreign exchange rates used to convert the U.S. dollar equivalent value. If such an event occurs, the foreign exchange rate will be valued at fair value using procedures established and approved by the Board.
The Fund does not separately report the effect of changes in foreign exchange rates from changes in market prices on securities held. Such changes are included in net realized and unrealized gain or loss from investments in the Statement of Operations.
Realized foreign exchange gains or losses arise from sales of foreign currencies, currency gains or losses realized between the trade and settlement dates on securities transactions and the difference between the recorded amounts of dividends, interest, and foreign withholding taxes and the U.S. dollar equivalent of the amounts actually received or paid. Net unrealized foreign exchange gains and losses arise from changes in foreign exchange rates on foreign denominated assets and liabilities other than investments in securities held at the end of the reporting period.
c. Securities Purchased on a When-Issued and TBA Basis
The Fund purchases securities on a when-issued and to-be-announced (TBA) basis, with payment and delivery scheduled for a future date. These transactions are subject to market fluctuations and are subject to the risk that the value at delivery may be more or less than the trade date purchase price. Although the Fund will generally purchase these securities with
FRANKLIN TEMPLETON VARIABLE INSURANCE PRODUCTS TRUST
NOTES TO FINANCIAL STATEMENTS
Franklin Strategic Income VIP Fund (continued)
the intention of holding the securities, it may sell the securities before the settlement date. Sufficient assets have been segregated for these securities.
d. Derivative Financial Instruments
The Fund invested in derivatives in order to manage risk or gain exposure to various other investments or markets. Derivatives are financial contracts based on an underlying or notional amount, require no initial investment or an initial net investment that is smaller than would normally be required to have a similar response to changes in market factors, and require or permit net settlement. Derivatives contain various risks including the potential inability of the counterparty to fulfill their obligations under the terms of the contract, the potential for an illiquid secondary market, and/or the potential for market movements which expose the Fund to gains or losses in excess of the amounts shown in the Statement of Assets and Liabilities. Realized gain and loss and unrealized appreciation and depreciation on these contracts for the period are included in the Statement of Operations.
Derivative counterparty credit risk is managed through a formal evaluation of the creditworthiness of all potential counterparties. The Fund attempts to reduce its exposure to counterparty credit risk on OTC derivatives, whenever possible, by entering into International Swaps and Derivatives Association (ISDA) master agreements with certain counterparties. These agreements contain various provisions, including but not limited to collateral requirements, events of default, or early termination. Termination events applicable to the counterparty include certain deteriorations in the credit quality of the counterparty. Termination events applicable to the Fund include failure of the Fund to maintain certain net asset levels and/or limit the decline in net assets over various periods of time. In the event of default or early termination, the ISDA master agreement gives the non-defaulting party the right to net and close-out all transactions traded, whether or not arising under the ISDA agreement, to one net amount payable by one counterparty to the other. However, absent an event of default or early termination, OTC derivative assets and liabilities are presented gross and not offset in the Statement of Assets and Liabilities. Early termination by the counterparty may result in an immediate payment by the Fund of any net liability owed to that counterparty under the ISDA agreement.
Collateral requirements differ by type of derivative. Collateral terms are contract specific for OTC derivatives. For OTC
derivatives traded under an ISDA master agreement, posting of collateral is required by either the Fund or the applicable counterparty if the total net exposure of all OTC derivatives with the applicable counterparty exceeds the minimum transfer amount, which typically ranges from $100,000 to $250,000, and can vary depending on the counterparty and the type of the agreement. Generally, collateral is determined at the close of Fund business each day and any additional collateral required due to changes in derivative values may be delivered by the Fund or the counterparty within a few business days. Collateral pledged and/or received by the Fund, if any, is held in segregated accounts with the Fund’s custodian/counterparty broker and can be in the form of cash and/or securities. Unrestricted cash may be invested according to the Fund’s investment objectives. To the extent that the amounts due to the Fund from its counterparties are not subject to collateralization or are not fully collateralized, the Fund bears the risk of loss from counterparty non-performance.
The Fund entered into OTC forward exchange contracts primarily to manage and/or gain exposure to certain foreign currencies. A forward exchange contract is an agreement between the Fund and a counterparty to buy or sell a foreign currency at a specific exchange rate on a future date.
The Fund entered into credit default swap contracts primarily to manage exposure to credit risk. A credit default swap is an agreement between the Fund and a counterparty whereby the buyer of the contract receives credit protection and the seller of the contract guarantees the credit worthiness of a referenced debt obligation. These agreements may be privately negotiated in the over-the-counter market (OTC credit default swaps) or may be executed in a multilateral trade facility platform, such as a registered exchange (centrally cleared credit default swaps). The underlying referenced debt obligation may be a single issuer of corporate or sovereign debt, a credit index, a basket of issuers or indices, or a tranche of a credit index or basket of issuers or indices. In the event of a default of the underlying referenced debt obligation, the buyer is entitled to receive the notional amount of the credit default swap contract from the seller in exchange for the referenced debt obligation, a net settlement amount equal to the notional amount of the credit default swap less the recovery value of the referenced debt obligation, or other agreed upon amount. For centrally cleared credit default swaps, required initial margins are pledged by the Fund, and the daily change in fair value is accounted for as a variation margin payable or receivable in the Statement of Assets and
FRANKLIN TEMPLETON VARIABLE INSURANCE PRODUCTS TRUST
NOTES TO FINANCIAL STATEMENTS
Franklin Strategic Income VIP Fund (continued)
1. Organization and Significant Accounting Policies (continued)
d. Derivative Financial Instruments (continued)
Liabilities. Over the term of the contract, the buyer pays the seller a periodic stream of payments, provided that no event of default has occurred. Such periodic payments are accrued daily as an unrealized appreciation or depreciation until the payments are made, at which time they are realized. Upfront payments and receipts are reflected in the Statement of Assets and Liabilities and represent compensating factors between stated terms of the credit default swap agreement and prevailing market conditions (credit spreads and other relevant factors). These upfront payments and receipts are amortized over the term of the contract as a realized gain or loss in the Statement of Operations.
See Note 8 regarding other derivative information.
e. Restricted Cash
At December 31, 2015, the Fund held restricted cash in connection with investments in certain derivative securities. Restricted cash is held in a segregated account with the Fund’s custodian and is reflected in the Statement of Assets and Liabilities.
f. Loan Participation Notes
The Fund invests in loan participation notes (Participations). Participations are loans originally issued to a borrower by one or more financial institutions (the Lender) and subsequently sold to other investors, such as the Fund. Participations typically result in the Fund having a contractual relationship only with the Lender and not with the borrower. The Fund has the right to receive from the Lender any payments of principal, interest and fees which the Lender received from the borrower. The Fund generally has no rights to either enforce compliance by the borrower with the terms of the loan agreement or to any collateral relating to the original loan. As a result, the Fund assumes the credit risk of both the borrower and the Lender that is selling the Participation. The Participations may also involve interest rate risk and liquidity risk, including the potential default or insolvency of the borrower and/or the Lender.
g. Investments in FT Holdings Corporation III (FT Subsidiary)
The Fund invests in certain financial instruments through its investment in FT Subsidiary. FT Subsidiary is a Delaware
Corporation, is a wholly-owned subsidiary of the Fund, and is able to invest in certain financial instruments consistent with the investment objective of the Fund. At December 31, 2015, FT Subsidiary’s investment, Turtle Bay Resort, as well as any other assets and liabilities of FT Subsidiary are reflected in the Fund’s Statement of Investments and Statement of Assets and Liabilities. The financial statements have been consolidated and include the accounts of the Fund and FT Subsidiary. All intercompany transactions and balances have been eliminated.
h. Mortgage Dollar Rolls
The Fund enters into mortgage dollar rolls, typically on a TBA basis. Mortgage dollar rolls are agreements between the Fund and a financial institution to simultaneously sell and repurchase mortgage-backed securities at a future date. Gains or losses are realized on the initial sale, and the difference between the repurchase price and the sale price is recorded as an unrealized gain or loss to the Fund upon entering into the mortgage dollar roll. In addition, the Fund may invest the cash proceeds that are received from the initial sale. During the period between the sale and repurchase, the Fund is not entitled to principal and interest paid on the mortgage backed securities. The risks of mortgage dollar roll transactions include the potential inability of the counterparty to fulfill its obligations.
i. Senior Floating Rate Interests
The Fund invests in senior secured corporate loans that pay interest at rates which are periodically reset by reference to a base lending rate plus a spread. These base lending rates are generally the prime rate offered by a designated U.S. bank or the London InterBank Offered Rate (LIBOR). Senior secured corporate loans often require prepayment of principal from excess cash flows or at the discretion of the borrower. As a result, actual maturity may be substantially less than the stated maturity. Senior secured corporate loans in which the Fund invests are generally readily marketable, but may be subject to certain restrictions on resale.
j. Income and Deferred Taxes
It is the Fund’s policy to qualify as a regulated investment company under the Internal Revenue Code. The Fund intends to distribute to shareholders substantially all of its taxable income and net realized gains to relieve it from federal income and if applicable, excise taxes. As a result, no provision for U.S. federal income taxes is required.
FRANKLIN TEMPLETON VARIABLE INSURANCE PRODUCTS TRUST
NOTES TO FINANCIAL STATEMENTS
Franklin Strategic Income VIP Fund (continued)
The Fund may be subject to foreign taxation related to income received, capital gains on the sale of securities and certain foreign currency transactions in the foreign jurisdictions in which it invests. Foreign taxes, if any, are recorded based on the tax regulations and rates that exist in the foreign markets in which the Fund invests. When a capital gain tax is determined to apply, the Fund records an estimated deferred tax liability in an amount that would be payable if the securities were disposed of on the valuation date.
The Fund may recognize an income tax liability related to its uncertain tax positions under U.S. GAAP when the uncertain tax position has a less than 50% probability that it will be sustained upon examination by the tax authorities based on its technical merits. As of December 31, 2015, the Fund has determined that no tax liability is required in its financial statements related to uncertain tax positions for any open tax years (or expected to be taken on future tax returns). Open tax years are those that remain subject to examination and are based on each tax jurisdiction’s statute of limitation.
k. Security Transactions, Investment Income, Expenses and Distributions
Security transactions are accounted for on trade date. Realized gains and losses on security transactions are determined on a specific identification basis. Interest income and estimated expenses are accrued daily. Amortization of premium and accretion of discount on debt securities are included in interest income. Paydown gains and losses are recorded as an adjustment to interest income. Facility fees are recognized as income over the expected term of the loan. Dividend income is recorded on the ex-dividend date. Distributions to shareholders are recorded on the ex-dividend date and are determined according to income tax regulations (tax basis). Distributable earnings determined on a tax basis may differ from earnings recorded in accordance with U.S. GAAP. These differences may be permanent or temporary. Permanent differences are reclassified among capital accounts to reflect their tax character. These reclassifications have no impact on net assets or the results of operations. Temporary differences are not reclassified, as they may reverse in subsequent periods.
Common expenses incurred by the Trust are allocated among the Funds based on the ratio of net assets of each Fund to the combined net assets of the Trust. Fund specific expenses are charged directly to the fund that incurred the expense.
Realized and unrealized gains and losses and net investment income, not including class specific expenses, are allocated daily to each class of shares based upon the relative proportion of net assets of each class. Differences in per share distributions, by class, are generally due to differences in class specific expenses.
Inflation-indexed bonds are adjusted for inflation through periodic increases or decreases in the security’s interest accruals, face amount, or principal redemption value, by amounts corresponding to the rate of inflation as measured by an index. Any increase or decrease in the face amount or principal redemption value will be included as interest income in the Statement of Operations.
l. Accounting Estimates
The preparation of financial statements in accordance with U.S. GAAP requires management to make estimates and assumptions that affect the reported amounts of assets and liabilities at the date of the financial statements and the amounts of income and expenses during the reporting period. Actual results could differ from those estimates.
m. Guarantees and Indemnifications
Under the Trust’s organizational documents, its officers and trustees are indemnified by the Trust against certain liabilities arising out of the performance of their duties to the Trust. Additionally, in the normal course of business, the Trust, on behalf of the Fund, enters into contracts with service providers that contain general indemnification clauses. The Trust’s maximum exposure under these arrangements is unknown as this would involve future claims that may be made against the Trust that have not yet occurred. Currently, the Trust expects the risk of loss to be remote.
FRANKLIN TEMPLETON VARIABLE INSURANCE PRODUCTS TRUST
NOTES TO FINANCIAL STATEMENTS
Franklin Strategic Income VIP Fund (continued)
2. Shares of Beneficial Interest
At December 31, 2015, there were an unlimited number of shares authorized (without par value). Transactions in the Fund’s shares were as follows:
| | | | | | | | | | | | | | | | | | |
| | | Year Ended December 31, | |
| | | 2015 | | | | | 2014 | |
| | | Shares | | | Amount | | | | | Shares | | | Amount | |
| | | | | |
| Class 1 Shares: | | | | | | | | | | | | | | | | | | |
Shares sold | | | 342,063 | | | $ | 3,944,392 | | | | | | 702,662 | | | $ | 8,745,867 | |
Shares issued in reinvestment of distributions | | | 3,778,584 | | | | 41,753,352 | | | | | | 4,268,855 | | | | 51,738,520 | |
Shares redeemed | | | (10,556,150 | ) | | | (120,369,494 | ) | | | | | (12,467,167 | ) | | | (155,131,784 | ) |
| | | | |
Net increase (decrease) | | | (6,435,503 | ) | | $ | (74,671,750 | ) | | | | | (7,495,650 | ) | | $ | (94,647,397 | ) |
| | | | |
| | | | | |
| Class 2 Shares: | | | | | | | | | | | | | | | | | | |
Shares sold | | | 4,486,606 | | | $ | 49,551,393 | | | | | | 6,058,039 | | | $ | 72,800,016 | |
Shares issued in reinvestment of distributions | | | 1,618,117 | | | | 17,330,037 | | | | | | 1,273,552 | | | | 15,002,442 | |
Shares redeemed | | | (4,183,880 | ) | | | (45,680,727 | ) | | | | | (3,696,063 | ) | | | (44,566,425 | ) |
| | | | |
Net increase (decrease) | | | 1,920,843 | | | $ | 21,200,703 | | | | | | 3,635,528 | | | $ | 43,236,033 | |
| | | | |
| | | | | |
| Class 4 Shares: | | | | | | | | | | | | | | | | | | |
Shares sold | | | 512,101 | | | $ | 6,000,051 | | | | | | 732,854 | | | $ | 9,004,820 | |
Shares issued In reinvestment of distributions | | | 788,162 | | | | 8,638,253 | | | | | | 839,610 | | | | 10,100,506 | |
Shares redeemed | | | (2,071,680 | ) | | | (22,984,550 | ) | | | | | (2,683,922 | ) | | | (32,721,125 | ) |
| | | | |
Net increase (decrease) | | | (771,417 | ) | | $ | (8,346,246 | ) | | | | | (1,111,458 | ) | | $ | (13,615,799 | ) |
| | | | |
3. Transactions with Affiliates
Franklin Resources, Inc. is the holding company for various subsidiaries that together are referred to as Franklin Templeton Investments. Certain officers and trustees of the Fund are also officers and/or directors of the following subsidiaries:
| | |
| Subsidiary | | Affiliation |
Franklin Advisers, Inc. (Advisers) | | Investment manager |
Franklin Templeton Services, LLC (FT Services) | | Administrative manager |
Franklin Templeton Distributors, Inc. (Distributors) | | Principal underwriter |
Franklin Templeton Investor Services, LLC (Investor Services) | | Transfer agent |
FRANKLIN TEMPLETON VARIABLE INSURANCE PRODUCTS TRUST
NOTES TO FINANCIAL STATEMENTS
Franklin Strategic Income VIP Fund (continued)
a. Management Fees
The Fund pays an investment management fee to Advisers based on the average daily net assets of the Fund as follows:
| | |
| Annualized Fee Rate | | Net Assets |
0.625% | | Up to and including $500 million |
0.525% | | Over $500 million, up to and including $1 billion |
0.480% | | Over $1 billion, up to and including $1.5 billion |
0.435% | | Over $1.5 billion, up to and including $6.5 billion |
0.415% | | Over $6.5 billion, up to and including $11.5 billion |
0.400% | | Over $11.5 billion, up to and including $16.5 billion |
0.390% | | Over $16.5 billion, up to and including $19 billion |
0.380% | | Over $19 billion, up to and including $21.5 billion |
0.370% | | In excess of $21.5 billion |
b. Administrative Fees
Under an agreement with Advisers, FT Services provides administrative services to the Fund. The fee is paid by Advisers based on the Fund’s average daily net assets, and is not an additional expense of the Fund.
c. Distribution Fees
The Board has adopted distribution plans for Class 2 and Class 4 shares pursuant to Rule 12b-1 under the 1940 Act. Under the Fund’s compensation distribution plans, the Fund pays Distributors for costs incurred in connection with the servicing, sale and distribution of the Fund’s shares up to 0.25%, and 0.35% per year of its average daily net assets of Class 2 and Class 4, respectively. The plan year, for purposes of monitoring compliance with the maximum annual plan rates, is February 1 through January 31.
d. Transfer Agent Fees
Investor Services, under terms of an agreement, performs shareholder servicing for the Fund and is not paid by the Fund for the services.
e. Investments in Affiliated Management Investment Companies
The Fund invests in affiliated management investment companies for purposes other than exercising a controlling influence over the management or policies. Management fees paid by the Fund are waived on assets invested in the affiliated management investment companies, as noted in the Statement of Operations, in an amount not to exceed the management and administrative fees paid directly or indirectly by each affiliate. Prior to January 1, 2014, the waiver was accounted for as a reduction to management fees.
FRANKLIN TEMPLETON VARIABLE INSURANCE PRODUCTS TRUST
NOTES TO FINANCIAL STATEMENTS
Franklin Strategic Income VIP Fund (continued)
3. Transactions with Affiliates (continued)
e. Investments in Affiliated Management Investment Companies (continued)
| | | | | | | | | | | | | | | | | | | | | | | | | | | | | | | | |
| | | Number
of Shares
Held at
Beginning
of Year | | | Gross
Additions | | | Gross
Reductions | | | Number
of Shares
Held at
End of
Year | | | Value at
End of
Year | | | Investment
Income | | | Realized
Gain
(Loss) | | | % of
Affiliated
Fund Shares
Outstanding
Held at End
of Year | |
| Non-Controlled Affiliates | | | | | | | | | | | | | | | | | | | | | | | | | | | | | | | | |
Institutional Fiduciary Trust Money Market Portfolio | | | 96,065,603 | | | | 183,638,197 | | | | (216,407,669 | ) | | | 63,296,131 | | | $ | 63,296,131 | | | $ | — | | | $ | — | | | | 0.32% | |
Franklin Lower Tier Floating Rate Fund | | | — | | | | 3,135,765 | a | | | — | | | | 3,135,765 | | | | 29,507,549 | | | | 269,395 | | | | — | | | | 7.18% | |
Franklin Middle Tier Floating Rate Fund | | | — | | | | 2,704,835 | b | | | — | | | | 2,704,835 | | | | 25,912,320 | | | | 128,116 | | | | — | | | | 7.51% | |
| | | | | | | | | | | | | | | | | | | | | | | | |
Total | | | | | | | | | | | | | | | | | | $ | 118,716,000 | | | $ | 397,511 | | | $ | — | | | | | |
| | | | | | | | | | | | | | | | | | | | | | | | |
aThe Fund purchased shares of the affiliate through a taxable in-kind transfer of securities. The securities transferred had a market value of $30,730,098 and a cost basis of $34,840,696 on the date of the transfer.
bThe Fund purchased shares of the affiliate through a taxable in-kind transfer of securities. The securities transferred had a market value of $26,672,554 and a cost basis of $28,430,526 on the date of the transfer.
f. Interfund Transactions
The Fund engaged in purchases and sales of investments with funds or other accounts that have a common investment manager (or affiliated investment managers), directors, trustees, or officers. These transactions complied with Rule 17a-7 under the 1940 Act. During the year ended December 31, 2015, the purchase and sale transactions aggregated $0 and $1,086,051, respectively.
4. Expense Offset Arrangement
The Fund has entered into an arrangement with its custodian whereby credits realized as a result of uninvested cash balances are used to reduce a portion of the Fund’s custodian expenses. During the year ended December 31, 2015, the custodian fees were reduced as noted in the Statement of Operations.
5. Income Taxes
For tax purposes, capital losses may be carried over to offset future capital gains, if any. At December 31, 2015, the Fund had long-term capital loss carryforwards of $16,552,969.
The tax character of distributions paid during the years ended December 31, 2015 and 2014, was as follows:
| | | | | | | | |
| | | 2015 | | | 2014 | |
Distributions paid from: | | | | | | | | |
Ordinary income | | $ | 55,458,219 | | | $ | 59,337,862 | |
Long term capital gain | | | 12,263,423 | | | | 19,503,245 | |
| | | | |
| | $ | 67,721,642 | | | $ | 78,841,107 | |
| | | | |
At December 31, 2015, the cost of investments, net unrealized appreciation (depreciation) and undistributed ordinary income for income tax purposes were as follows:
| | | | |
Cost of investments | | $ | 803,811,290 | |
| | | | |
Unrealized appreciation | | $ | 18,369,856 | |
Unrealized depreciation | | | (83,789,061 | ) |
| | | | |
Net unrealized appreciation (depreciation) | | $ | (65,419,205 | ) |
| | | | |
Distributable earnings - undistributed ordinary income | | $ | 24,756,636 | |
| | | | |
FRANKLIN TEMPLETON VARIABLE INSURANCE PRODUCTS TRUST
NOTES TO FINANCIAL STATEMENTS
Franklin Strategic Income VIP Fund (continued)
Differences between income and/or capital gains as determined on a book basis and a tax basis are primarily due to differing treatment of foreign currency transactions and bond discounts and premiums.
6. Investment Transactions
Purchases and sales of investments (excluding short term securities) for the year ended December 31, 2015, aggregated $653,515,415 and $700,510,771, respectively.
7. Credit Risk and Defaulted Securities
At December 31, 2015, the Fund had 54.45% of its portfolio invested in high yield, senior secured floating rate notes, or other securities rated below investment grade. These securities may be more sensitive to economic conditions causing greater price volatility and are potentially subject to a greater risk of loss due to default than higher rated securities.
The Fund held defaulted securities and/or other securities for which the income has been deemed uncollectible. At December 31, 2015, the aggregate value of these securities was $3,264,552, representing 0.44% of the Fund’s net assets. The Fund discontinues accruing income on securities for which income has been deemed uncollectible and provides an estimate for losses on interest receivable. The securities have been identified in the accompanying Statement of Investments.
8. Other Derivative Information
At December 31, 2015, the Fund’s investments in derivative contracts are reflected in the Statement of Assets and Liabilities as follows:
| | | | | | | | | | | | |
| | | Asset Derivatives | | | Liability Derivatives | |
Derivative Contracts
Not Accounted for
as Hedging Instruments | | Statement of Assets and
Liabilities Location | | Fair Value | | | Statement of Assets and
Liabilities Location | | Fair Value | |
Foreign exchange contracts | | Unrealized appreciation on OTC forward exchange contracts | | $ | 1,541,198 | | | Unrealized depreciation on OTC forward exchange contracts | | $ | 997,358 | |
Credit contracts | | OTC swap contracts (premiums paid) | | | — | | | OTC swap contracts (premiums received) | | | 22,018 | |
| | Unrealized appreciation on OTC swap contracts | | | 42,608 | | | Unrealized depreciation on OTC swap contracts | | | — | |
| | | | | | | | | | | | |
Totals | | | | $ | 1,583,806 | | | | | $ | 1,019,376 | |
| | | | | | | | | | | | |
For the year ended December 31, 2015, the effect of derivative contracts in the Fund’s Statement of Operations was as follows:
| | | | | | | | | | | | |
Derivative Contracts
Not Accounted for
as Hedging Instruments | | Statement of Operations
Locations | | Net Realized
Gain (Loss)
for the Year | | | Statement of Operations
Locations | | Net Change
in Unrealized
Appreciation
(Depreciation)
for the Year | |
| | Net realized gain (loss) from: | | | | | | Net change in unrealized appreciation (depreciation) on: | | | | |
Foreign exchange contracts | | Foreign currency transactions | | $ | 16,095,049 | a | | Translation of other assets and liabilities denominated in foreign currencies | | $ | (10,301,848 | )a |
Credit contracts | | Swap contracts | | | 165,572 | | | Swap contracts | | | (133,009 | ) |
| | | | | | | | | | | | |
Totals | | | | $ | 16,260,621 | | | | | $ | (10,434,857 | ) |
| | | | | | | | | | | | |
aForward exchange contracts are included in net realized gain (loss) from foreign currency transactions and net change in unrealized appreciation (depreciation) on translation of other assets and liabilities denominated in foreign currencies in the Statement of Operations.
FRANKLIN TEMPLETON VARIABLE INSURANCE PRODUCTS TRUST
NOTES TO FINANCIAL STATEMENTS
Franklin Strategic Income VIP Fund (continued)
8. Other Derivative Information (continued)
At December 31, 2015, the Fund’s OTC derivative assets and liabilities are as follows:
| | | | | | | | |
| | | Gross and Net Amounts
of Assets and Liabilities
Presented in the
Statement of Assets and
Liabilities | |
| | | Assetsa | | | Liabilitiesa | |
| Derivatives | | | | | | | | |
Forward exchange contracts | | $ | 1,541,198 | | | $ | 997,358 | |
Swap Contracts | | | 42,608 | | | | 22,018 | |
| | | | |
Total | | $ | 1,583,806 | | | $ | 1,019,376 | |
| | | | |
aAbsent an event of default or early termination, OTC derivative assets and liabilities are presented gross and not offset in the Statement of Assets and Liabilities.
At December 31, 2015, the Fund’s OTC derivative assets, which may be offset against the Fund’s OTC derivative liabilities and collateral received from the counterparty, are as follows:
| | | | | | | | | | | | | | | | | | | | |
| | | | | | Amounts Not Offset in the Statement
of Assets and Liabilities | | | | |
| | | Gross and Net
Amounts of Assets
Presented in the
Statement of
Assets and Liabilities | | | Financial
Instruments
Available for Offset | | | Financial
Instruments
Collateral
Receiveda,b | | | Cash Collateral
Receivedb | | | Net Amount (Not
less than zero) | |
| Counterparty | | | | | | | | | | | | | | | | | | | | |
BZWS | | $ | 263,097 | | | $ | (85,004 | ) | | $ | — | | | $ | (178,093 | ) | | $ | — | |
CITI | | | 74,126 | | | | (51,526 | ) | | | (22,600 | ) | | | — | | | | — | |
DBAB | | | 571,258 | | | | (475,443 | ) | | | — | | | | (95,815 | ) | | | — | |
GSCO | | | 64,010 | | | | (32,578 | ) | | | — | | | | — | | | | 31,432 | |
HSBC | | | 27,069 | | | | (27,069 | ) | | | — | | | | — | | | | — | |
JPHQ | | | 584,246 | | | | (253,768 | ) | | | (184,234 | ) | | | — | | | | 146,244 | |
MSCO | | | — | | | | — | | | | — | | | | — | | | | — | |
| | | | |
Total | | $ | 1,583,806 | | | $ | (925,388 | ) | | $ | (206,834 | ) | | $ | (273,908 | ) | | $ | 177,676 | |
| | | | |
aAt December 31, 2015, the Fund received U.S. Government Agency Securities and U.S. Treasury Bonds and Notes as collateral for derivatives.
bIn some instances, the collateral amounts disclosed in the table above were adjusted due to the requirement to limit collateral amounts to avoid the effect of overcollateralization. Actual collateral received and/or pledged may be more than the amounts disclosed herein.
FRANKLIN TEMPLETON VARIABLE INSURANCE PRODUCTS TRUST
NOTES TO FINANCIAL STATEMENTS
Franklin Strategic Income VIP Fund (continued)
At December 31, 2015, the Fund’s OTC derivative liabilities, which may be offset against the Fund’s OTC derivative assets and collateral pledged to the counterparty, are as follows:
| | | | | | | | | | | | | | | | | | | | |
| | | | | | Amounts Not Offset in the Statement
of Assets and Liabilities | | | | |
| | | Gross and Net
Amounts of Liabilities
Presented in the
Statement of
Assets and Liabilities | | | Financial
Instruments
Available for
Offset | | | Financial
Instruments
Collateral
Pledged | | | Cash Collateral
Pledged | | | Net Amount (Not
less than zero) | |
| Counterparty | | | | | | | | | | | | | | | | | | | | |
BZWS | | $ | 85,004 | | | $ | (85,004 | ) | | $ | — | | | $ | — | | | $ | — | |
CITI | | | 51,526 | | | | (51,526 | ) | | | — | | | | — | | | | — | |
DBAB | | | 475,443 | | | | (475,443 | ) | | | — | | | | — | | | | — | |
GSCO | | | 32,578 | | | | (32,578 | ) | | | — | | | | — | | | | — | |
HSBC | | | 114,240 | | | | (27,069 | ) | | | — | | | | — | | | | 87,171 | |
JPHQ | | | 253,768 | | | | (253,768 | ) | | | — | | | | — | | | | — | |
MSCO | | | 6,817 | | | | — | | | | — | | | | — | | | | 6,817 | |
| | | | |
Total | | $ | 1,019,376 | | | $ | (925,388 | ) | | $ | — | | | $ | — | | | $ | 93,988 | |
| | | | |
For the year ended December 31, 2015, the average month end fair value of derivatives represented 0.88% of average month end net assets. The average month end number of open derivative contracts for the year was 98.
See Note 1(d) regarding derivative financial instruments.
See Abbreviations on page FSI-49
9. Credit Facility
The Fund, together with other U.S. registered and foreign investment funds (collectively, Borrowers), managed by Franklin Templeton Investments, are borrowers in a joint syndicated senior unsecured credit facility totaling $2 billion (Global Credit Facility) which matured on February 12, 2016. This Global Credit Facility provides a source of funds to the Borrowers for temporary and emergency purposes, including the ability to meet future unanticipated or unusually large redemption requests. Effective February 12, 2016, the Borrowers renewed the Global Credit Facility for a one year term, maturing February 10, 2017, for a total of $2 billion.
Under the terms of the Global Credit Facility, the Fund shall, in addition to interest charged on any borrowings made by the Fund and other costs incurred by the Fund, pay its share of fees and expenses incurred in connection with the implementation and maintenance of the Global Credit Facility, based upon its relative share of the aggregate net assets of all of the Borrowers, including an annual commitment fee of 0.07% based upon the unused portion of the Global Credit Facility. Effective February 12, 2016, the annual commitment fee is 0.15%. These fees are reflected in other expenses in the Statement of Operations. During the year ended December 31, 2015, the Fund did not use the Global Credit Facility.
10. Fair Value Measurements
The Fund follows a fair value hierarchy that distinguishes between market data obtained from independent sources (observable inputs) and the Fund’s own market assumptions (unobservable inputs). These inputs are used in determining the value of the Fund’s financial instruments and are summarized in the following fair value hierarchy:
| | • | | Level 1 – quoted prices in active markets for identical financial instruments |
| | • | | Level 2 – other significant observable inputs (including quoted prices for similar financial instruments, interest rates, prepayment speed, credit risk, etc.) |
FRANKLIN TEMPLETON VARIABLE INSURANCE PRODUCTS TRUST
NOTES TO FINANCIAL STATEMENTS
Franklin Strategic Income VIP Fund (continued)
10. Fair Value Measurements (continued)
| | • | | Level 3 – significant unobservable inputs (including the Fund’s own assumptions in determining the fair value of financial instruments) |
The input levels are not necessarily an indication of the risk or liquidity associated with financial instruments at that level.
For movements between the levels within the fair value hierarchy, the Fund has adopted a policy of recognizing the transfers as of the date of the underlying event which caused the movement.
A summary of inputs used as of December 31, 2015, in valuing the Fund’s assets and liabilities carried at fair value, is as follows:
| | | | | | | | | | | | | | | | |
| | | Level 1 | | | Level 2 | | | Level 3 | | | Total | |
| Assets: | | | | | | | | | | | | | | | | |
Investments in Securities: | | | | | | | | | | | | | | | | |
Equity Investments:a | | | | | | | | | | | | | | | | |
Consumer Services | | $ | — | | | $ | 7,082,896 | | | $ | — | | | $ | 7,082,896 | |
Transportation | | | — | | | | 323,156 | | | | — | | | | 323,156 | |
All Other Equity Investmentsb | | | 67,506,869 | | | | — | | | | — | | | | 67,506,869 | |
Corporate Bonds | | | — | | | | 289,495,211 | | | | 190,928 | | | | 289,686,139 | |
Senior Floating Rate Interests | | | — | | | | 79,479,013 | | | | — | | | | 79,479,013 | |
Foreign Government and Agency Securities | | | — | | | | 106,076,084 | | | | — | | | | 106,076,084 | |
U.S. Government and Agency Securities | | | — | | | | 29,001,209 | | | | — | | | | 29,001,209 | |
Asset-Backed Securities and Commercial Mortgage-Backed Securities | | | — | | | | 56,262,287 | | | | — | | | | 56,262,287 | |
Mortgage-Backed Securities | | | — | | | | 16,846,306 | | | | — | | | | 16,846,306 | |
Municipal Bonds | | | — | | | | 18,573,548 | | | | — | | | | 18,573,548 | |
Escrows and Litigation Trusts | | | — | | | | — | | | | —c | | | | — | |
Short Term Investments | | $ | 63,296,131 | | | $ | 4,258,447 | | | $ | — | | | $ | 67,554,578 | |
| | | | |
Total Investments in Securities | | $ | 130,803,000 | | | $ | 607,398,157 | | | $ | 190,928 | | | $ | 738,392,085 | |
| | | | |
Other Financial Instruments | | | | | | | | | | | | | | | | |
Forward Exchange Contracts | | $ | — | | | $ | 1,541,198 | | | $ | — | | | $ | 1,541,198 | |
Swap Contracts | | | — | | | | 42,608 | | | | — | | | | 42,608 | |
| | | | |
Total Other Financial Instruments | | $ | — | | | $ | 1,583,806 | | | $ | — | | | $ | 1,583,806 | |
| | | | |
| | | | |
| Liabilities: | | | | | | | | | | | | | | | | |
Other Financial Instruments | | | | | | | | | | | | | | | | |
Forward Exchange Contracts | | $ | — | | | $ | 997,358 | | | $ | — | | | $ | 997,358 | |
| | | | |
aIncludes common and convertible preferred stocks and management investment companies.
bFor detailed categories, see accompanying Statement of Investments.
cIncludes securities determined to have no value at December 31, 2015.
A reconciliation of assets in which Level 3 inputs are used in determining fair value is presented when there are significant Level 3 financial instruments at the end of the year.
11. Subsequent Events
The Fund has evaluated subsequent events through the issuance of the financial statements and determined that no events have occurred that require disclosure other than those already disclosed in the financial statements.
FRANKLIN TEMPLETON VARIABLE INSURANCE PRODUCTS TRUST
NOTES TO FINANCIAL STATEMENTS
Franklin Strategic Income VIP Fund (continued)
Abbreviations
| | | | | | | | | | |
| Counterparty | | Currency | | Selected Portfolio |
| | | | | |
| BZWS | | Barclays Bank PLC | | BRL | | Brazilian Real | | CDO | | Collateralized Debt Obligation |
| | | | | |
| CITI | | Citigroup, Inc. | | EUR | | Euro | | CLO | | Collateralized Loan Obligation |
| | | | | |
| DBAB | | Deutsche Bank AG | | GBP | | British Pound | | ETF | | Exchange Traded Fund |
| | | | | |
| GSCO | | The Goldman Sachs Group, Inc. | | IDR | | Indonesian Rupiah | | FICO | | Financing Corp. |
| | | | | |
| HSBC | | HSBC Bank USA, N.A. | | KRW | | South Korean Won | | FRN | | Floating Rate Note |
| | | | | |
| JPHQ | | JP Morgan Chase & Co. | | LKR | | Sri Lankan Rupee | | GO | | General Obligation |
| | | | | |
| MSCO | | Morgan Stanley | | MXN | | Mexican Peso | | HDC | | Housing Development Corp. |
| | | | | |
| | | | MYR | | Malaysian Ringgit | | PIK | | Payment-In-Kind |
| | | | | |
| | | | PHP | | Philippine Peso | | SF | | Single Family |
| | | | | |
| | | | PLN | | Polish Zloty | | | | |
| | | | | |
| | | | UYU | | Uruguayan Peso | | | | |
FRANKLIN TEMPLETON VARIABLE INSURANCE PRODUCTS TRUST
Report of Independent Registered Public Accounting Firm
Franklin Strategic Income VIP Fund
To the Board of Trustees and Shareholders of Franklin Templeton Variable Insurance Products Trust
In our opinion, the accompanying statement of assets and liabilities, including the statement of investments, and the related statements of operations and of changes in net assets and the financial highlights present fairly, in all material respects, the financial position of Franklin Strategic Income VIP Fund (the “Fund”) at December 31, 2015, the results of its operations for the year then ended, the changes in its net assets for each of the two years in the period then ended and the financial highlights for each of the periods presented, in conformity with accounting principles generally accepted in the United States of America. These financial statements and financial highlights (hereafter referred to as “financial statements”) are the responsibility of the Fund’s management. Our responsibility is to express an opinion on these financial statements based on our audit. We conducted our audit of these financial statements in accordance with the standards of the Public Company Accounting Oversight Board (United States). Those standards require that we plan and perform the audit to obtain reasonable assurance about whether the financial statements are free of material misstatement. An audit includes examining, on a test basis, evidence supporting the amounts and disclosures in the financial statements, assessing the accounting principles used and significant estimates made by management, and evaluating the overall financial statement presentation. We believe that our audit, which included confirmation of securities at December 31, 2015 by correspondence with the custodian, transfer agent and brokers, provides a reasonable basis for our opinion.
PricewaterhouseCoopers LLP
San Francisco, California
February 16, 2016
FRANKLIN TEMPLETON VARIABLE INSURANCE PRODUCTS TRUST
Tax Information (unaudited)
Franklin Strategic Income VIP Fund
Under Section 852(b)(3)(C) of the Internal Revenue Code, the Fund hereby reports the maximum amount allowable but no less than $12,263,425 as a long term capital gain dividend for the fiscal year ended December 31, 2015.
Templeton Developing Markets VIP Fund
This annual report for Templeton Developing Markets VIP Fund covers the fiscal year ended December 31, 2015.
Class 4 Performance Summary as of December 31, 2015
Average annual total return of Class 4 shares* represents the average annual change in value, assuming reinvestment of dividends and capital gains. Average returns smooth out variations in returns, which can be significant; they are not the same as year-by-year results.
| | | | | | | | | | | | |
| Periods ended 12/31/15 | | 1-Year | | | 5-Year | | | 10-Year | |
Average Annual Total Return | | | -19.70% | | | | -7.11% | | | | +0.92% | |
*For the period beginning 2/29/08, Class 4 performance reflects a 12b-1 fee expense of 0.35% per year, which affects future performance. Class 4 performance prior to 2/29/08 reflects historical Class 1 performance, which does not have a 12b-1 fee expense. Since 2/29/08 (effective date), the average annual total return of Class 4 shares was -4.13%. The Fund has a fee waiver associated with any investment in a Franklin Templeton money fund, contractually guaranteed through at least its current fiscal year-end. Fund investment results reflect the fee waiver, to the extent applicable; without this reduction, the results would have been lower.
Performance reflects the Fund’s Class 4 operating expenses, but does not include any contract fees, expenses or sales charges. If they had been included, performance would be lower. These charges and deductions, particularly for variable life policies, can have a significant effect on contract values and insurance benefits. See the contract prospectus for a complete description of these expenses, including sales charges.
Performance data represent past performance, which does not guarantee future results. Investment return and principal value will fluctuate, and you may have a gain or loss when you sell your shares. Current performance may differ from figures shown.
Total Return Index Comparison for a Hypothetical $10,000 Investment (1/1/06–12/31/15)
The graph below shows the change in value of a hypothetical $10,000 investment in the Fund over the indicated period and includes reinvestment of any income or distributions. The Fund’s performance* is compared to the performance of the MSCI Emerging Markets (EM) Index and the Standard & Poor’s®/International Finance Corporation Investable (S&P®/IFCI) Composite Index. One cannot invest directly in an index, and an index is not representative of the Fund’s portfolio. Please see Important Notes to Performance Information preceding the Fund Summaries.
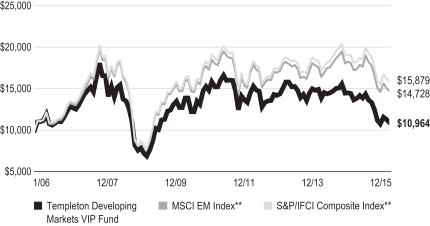
**Source: Morningstar. Please see Index Descriptions following the Fund Summaries.
TEMPLETON DEVELOPING MARKETS VIP FUND
Fund Goal and Main Investments
The Fund seeks long-term capital appreciation. Under normal market conditions, the Fund invests at least 80% of its net assets in emerging market investments.
Fund Risks
All investments involve risks, including possible loss of principal. Special risks are associated with foreign investing, including currency fluctuations, economic instability and political developments. Investments in developing markets, of which frontier markets are a subset, involve heightened risks related to the same factors, in addition to those associated with these markets’ smaller size, lesser liquidity and lack of established legal, political, business and social frameworks to support securities markets. Because these frameworks are typically even less developed in frontier markets, as well as various factors including the increased potential for extreme price volatility, illiquidity, trade barriers and exchange controls, the risks associated with developing markets are magnified in frontier markets. The Fund is designed for the aggressive portion of a well-diversified portfolio. The Fund is actively managed but there is no guarantee that the manager’s investment decisions will produce the desired results. The Fund’s prospectus also includes a description of the main investment risks.
Performance Overview
You can find the Fund’s one-year total return in the Performance Summary. In comparison, the MSCI EM Index had a -14.60% total return, and the S&P/IFCI Composite Index had a -12.38% total return for the same period.1 Please note index performance numbers are for reference and we do not attempt to track an index but rather undertake investments on the basis of fundamental research.
Economic and Market Overview
The global economy expanded moderately during the 12 months under review. Although some emerging market countries faced headwinds such as soft domestic demand, weak exports and geopolitical crises, emerging market economies overall continued to grow faster than developed market economies. China’s economy grew at a less robust pace in 2015 than in 2014, as strength in services and consumption was offset by weakness in fixed-asset investment, imports and exports, and manufacturing. Domestic demand continued to account for a
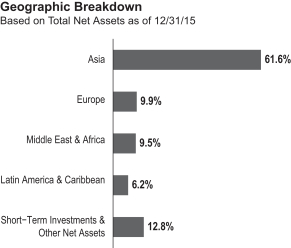
greater portion of China’s gross domestic product (GDP), as per-capita income rose, supported by the government’s market-friendly policies for sustainable growth. In the third quarter, Brazil’s and Russia’s quarterly GDPs continued to contract but at slower rates compared with the second quarter. Despite moderating growth in some emerging market countries, India, the Czech Republic and Mexico showed signs of improvement.
Many emerging market central banks, including those of Russia and India, lowered benchmark interest rates to promote economic growth. The People’s Bank of China (PBOC) cut its benchmark interest rate and reduced the bank’s cash reserve requirement several times. Toward period-end, the PBOC lowered short-term borrowing costs for smaller banks as part of its efforts to establish an interest rate corridor intended to help banks access funds in times of a liquidity crunch and to avoid heightened volatility in money market rates. In contrast, Brazil’s central bank raised its benchmark interest rate despite an economic downturn, in an effort to control inflation and support the country’s currency.
Events in China significantly affected stock performance in all regions during the year. The Chinese government’s efforts to promote stable growth supported China’s domestic stock market in 2015’s first half. However, tight liquidity conditions and uncertainties about the PBOC’s monetary policy led China’s domestic market to correct from June through August, contributing to a global stock market correction. The PBOC’s effective devaluation of the yuan to support export growth led to investor anxiety about China’s economy and the possibility of a regional currency war, further pressuring emerging market stocks.
1. Source: Morningstar.
One cannot invest directly in an index, and an index is not representative of the Fund’s portfolio. Please see Index Descriptions following the Fund Summaries.
TEMPLETON DEVELOPING MARKETS VIP FUND
Investor concerns about moderating global economic growth, the future course of U.S. monetary policy, geopolitical tensions in certain regions and the depreciation of many currencies against the U.S. dollar also contributed to stock market volatility. Price declines of many commodities, particularly crude oil, negatively affected certain commodity-producing countries’ economies, financial positions and currencies, weighing further on investor sentiment.
However, accommodative monetary policies of many major central banks provided investors with some optimism. China’s additional monetary and fiscal stimulus measures to support economic growth aided emerging market stocks in October, but weak commodity prices and terrorist attacks in Beirut and Paris hindered stocks toward period-end. Markets recovered somewhat after the U.S. Federal Reserve increased its federal funds target rate in December, alleviating some uncertainty about the direction of U.S. monetary policy.
For the 12 months ended December 31, 2015, emerging market stocks, as measured by the MSCI EM Index, had a -14.60% total return, as weak emerging market currencies led all major regions to post negative returns in U.S. dollar terms.1
Investment Strategy
We employ a fundamental research, value-oriented, long-term investment approach. We focus on the market price of a company’s securities relative to our evaluation of its long-term earnings, asset value and cash flow potential. We also consider a company’s profit and loss outlook, balance sheet strength, cash flow trends and asset value in relation to the current price. Our analysis considers the company’s corporate governance behavior as well as its position in its sector, the economic framework and political environment. We invest in securities without regard to benchmark comparisons.
Manager’s Discussion
During the year under review, the Fund remained diversified among different emerging market countries. Consistent with our long-term investment strategy, we viewed market corrections in China and other emerging markets in the context of a long-term uptrend. We continued to monitor global economic and market developments while seeking to minimize risk and to establish long-term positions in quality companies at share prices we considered more attractive.
Key detractors from the Fund’s absolute performance during the 12-month reporting period included positions in Itau Unibanco Holding, MTN Group and MGM China Holdings.
| | | | |
Top 10 Countries | | | |
| 12/31/15 | | | |
| | | % of Total
Net Assets | |
| China | | | 19.8% | |
| India | | | 10.8% | |
| South Africa | | | 9.2% | |
| South Korea | | | 8.9% | |
| Taiwan | | | 8.7% | |
| Brazil | | | 5.6% | |
| U.K. | | | 5.0% | |
| Thailand | | | 4.4% | |
| Hong Kong | | | 3.5% | |
| Belgium | | | 3.4% | |
Itau Unibanco, one of Brazil’s largest financial conglomerates, continued to produce solid operating performance despite the country’s difficult economic environment. However, investor concerns about the potential for deteriorating asset quality and higher loan-loss provisions weighed on share price performance. The Brazilian financial market as a whole came under pressure during the reporting period, further hurting Itau Unibanco’s shares. Falling prices for energy and other commodities coincided with an economic recession, rising unemployment and political uncertainty, leading to equity weakness and currency depreciation. Standard & Poor’s downgrade of the country’s long-term foreign currency sovereign credit rating to below investment grade in September heightened market anxiety.
MTN Group is Africa’s largest cellular network in subscriber terms. The South Africa-based company’s share price declined following an announcement that the Nigerian Communications Commission imposed a US$5.2 billion fine, which was subsequently reduced to US$3.4 billion. MTN allegedly failed to meet a deadline for disconnecting subscribers identified as unregistered. Disappointing first-half 2015 earnings results amid a weak regional economic backdrop and depreciation of regional currencies also hurt share price performance. Although third-quarter corporate results showed some improvement in the company’s operations in South Africa, issues in the Nigerian market continued to weigh on overall operations. The resignation of the company’s chief executive officer and concerns about potential challenges in the company’s cash repatriation from Nigeria further pressured investor sentiment.
MGM China Holdings is a Hong Kong-listed casino gaming and entertainment business based in Macau. Shares of casino gaming companies, including MGM China’s, fell during the reporting period due to investor concerns about declining
TEMPLETON DEVELOPING MARKETS VIP FUND
numbers of high-spending customers, a result of China’s anti-corruption campaign. Reduced dividend distributions also hurt overall sentiment in the casino gaming sector. However, despite weak revenue trends, MGM China reported slightly better-than-expected second- and third-quarter earnings results as the company achieved greater operating efficiencies.
Amid a challenging market environment, several Fund holdings performed well. Key contributors to absolute performance during the reporting period included NetEase, Tencent Holdings and Anheuser-Busch InBev.
China’s Internet sector has been growing rapidly and could benefit further from the government’s “Internet Plus” strategy, which is designed to integrate the Internet with traditional businesses to support the country’s economic growth. NetEase is one of the largest companies in China’s online gaming market. It also has presence in online advertising, email and e-commerce. The company’s strong corporate results in 2015, driven by its mobile gaming operations, and plans to release new games in 2016 boosted the company’s share price to a record high in December.
Tencent is one of the world’s largest and most widely used Internet service portals. Founded in 1998 to provide instant messenger services, the company rapidly grew into a provider of mass media, entertainment, and Internet and mobile phone value-added services in China and internationally. Tencent reported solid earnings in 2015, supported by strong mobile gaming and advertising revenues.
Anheuser-Busch InBev is the world’s largest brewer by volume, with operations in 25 countries globally. The Belgium-listed company produces, markets, distributes and sells over 200 beer and other malt beverage brands, as well as produces and distributes soft drinks, notably in Latin America. In November, Anheuser-Busch InBev reached an agreement to acquire SABMiller, the second-largest global brewer, which would substantially extend the group’s global footprint. The transaction is expected to be completed in 2016’s second half and was positively received by the market, bolstering the company’s share price.
It is important to recognize the effect of currency movements on the Fund’s performance. In general, if the value of the U.S. dollar goes up compared with a foreign currency, an investment
| | | | |
| Top 10 Holdings | | | |
| 12/31/15 | | | |
Company
Sector/Industry, Country | | % of Total
Net Assets | |
Naspers Ltd., N
Media, South Africa | | | 5.4% | |
Unilever PLC
Personal Products, U.K. | | | 5.0% | |
TSMC (Taiwan Semiconductor Manufacturing Co.) Ltd.
Semiconductors & Semiconductor Equipment, Taiwan | | | 4.9% | |
Brilliance China Automotive Holdings Ltd.
Automobiles, China | | | 4.0% | |
Tencent Holdings Ltd.
Internet Software & Services, China | | | 3.7% | |
Anheuser-Busch InBev NV
Beverages, Belgium | | | 3.4% | |
Tata Consultancy Services Ltd.
IT Services, India | | | 3.0% | |
Baidu Inc., ADR
Internet Software & Services, China | | | 2.5% | |
Samsung Electronics Co. Ltd.
Technology Hardware, Storage & Peripherals, South Korea | | | 2.5% | |
Itau Unibanco Holding SA, ADR, pfd.
Banks, Brazil | | | 2.3% | |
The dollar value, number of shares or principal amount, and names of all portfolio holdings are listed in the Fund’s Statement of Investments (SOI).
traded in that foreign currency will go down in value because it will be worth fewer U.S. dollars. This can have a negative effect on Fund performance. Conversely, when the U.S. dollar weakens in relation to a foreign currency, an investment traded in that foreign currency will increase in value, which can contribute to Fund performance. The U.S. dollar appreciated against most foreign currencies during the period, and the portfolio benefited from underweighted positions in markets with especially weak currencies, such as Russia, Brazil and Colombia, as well as positions in relatively stable currency markets such as Saudi Arabia and Hong Kong.
In the past 12 months, we increased the Fund’s holdings in South Korea, Taiwan and Hong Kong as we sought to invest in opportunities we considered attractive. Additionally, we initiated investments in certain countries, notably Mexico and Cambodia, and made some purchases in Russia. In sector terms, we increased investments in information technology, consumer discretionary and health care.2 Key purchases included new positions in Baidu, China’s leading Internet search engine; Hon
2. The information technology sector comprises electronic equipment, instruments and components; Internet software and services; IT services; semiconductors and semiconductor equipment; software; and technology hardware, storage and peripherals in the SOI. The consumer discretionary sector comprises auto components; automobiles; distributors; hotels, restaurants and leisure; Internet and catalog retail; media; and textiles, apparel and luxury goods in the SOI. The health care sector comprises biotechnology and pharmaceuticals in the SOI.
TEMPLETON DEVELOPING MARKETS VIP FUND
Hai Precision Industry, a leading Taiwanese electronics manufacturing services provider; and SK Hynix, one of the world’s largest DRAM (dynamic random access memory) makers.
Conversely, we reduced the Fund’s investments in Thailand, South Africa, India and China primarily through China H shares to focus on companies we considered to be more attractively valued within our investment universe and to raise funds for share redemptions.3 We also eliminated exposures to certain countries, notably Turkey. In sector terms, we reduced holdings largely in financials, energy, materials and industrials.4 Key sales included trimming the Fund’s positions in Siam Commercial Bank, a Thai bank; Remgro, a South African conglomerate with interests in finance, health care, food and industrials; and Tata Motors, an Indian automobile manufacturer.
Thank you for your participation in Templeton Developing Markets VIP Fund. We look forward to serving your future investment needs.
The foregoing information reflects our analysis, opinions and portfolio holdings as of December 31, 2015, the end of the reporting period. The way we implement our main investment strategies and the resulting portfolio holdings may change depending on factors such as market and economic conditions. These opinions may not be relied upon as investment advice or an offer for a particular security. The information is not a complete analysis of every aspect of any market, country, industry, security or the Fund. Statements of fact are from sources considered reliable, but the investment manager makes no representation or warranty as to their completeness or accuracy. Although historical performance is no guarantee of future results, these insights may help you understand our investment management philosophy.
3. “China H” denotes shares of China-incorporated, Hong Kong Stock Exchange-listed companies with most businesses in China.
4. The financials sector comprises banks, capital markets, diversified financial services, insurance, and real estate management and development in the SOI. The energy sector comprises oil, gas and consumable fuels in the SOI. The materials sector comprises chemicals and construction materials in the SOI. The industrials sector comprises construction and engineering, trading companies and distributors, and transportation infrastructure in the SOI.
TEMPLETON DEVELOPING MARKETS VIP FUND
Class 4 Fund Expenses
As an investor in a variable insurance contract (Contract) that indirectly provides for investment in an underlying mutual fund, you can incur transaction and/or ongoing expenses at both the Fund level and the Contract level.
| • | | Transaction expenses can include sales charges (loads) on purchases, redemption fees, surrender fees, transfer fees and premium taxes. |
| • | | Ongoing expenses can include management fees, distribution and service (12b-1) fees, contract fees, annual maintenance fees, mortality and expense risk fees and other fees and expenses. All mutual funds and Contracts have some types of ongoing expenses. |
The expenses shown in the table are meant to highlight ongoing expenses at the Fund level only and do not include ongoing expenses at the Contract level, or transaction expenses at either the Fund or Contract level. While the Fund does not have transaction expenses, if the transaction and ongoing expenses at the Contract level were included, the expenses shown below would be higher. You should consult your Contract prospectus or disclosure document for more information.
The table shows Fund-level ongoing expenses and can help you understand these expenses and compare them with those of other mutual funds offered through the Contract. The table assumes a $1,000 investment held for the six months indicated. Please refer to the Fund prospectus for additional information on operating expenses.
Actual Fund Expenses
The first line (Actual) of the table provides actual account values and expenses. The “Ending Account Value” is derived from the Fund’s actual return, which includes the effect of ongoing Fund expenses, but does not include the effect of ongoing Contract expenses.
You can estimate the Fund-level expenses you incurred during the period by following these steps. Of course, your account value and expenses will differ from those in this illustration:
| 1. | Divide your account value by $1,000. |
If an account had an $8,600 value, then $8,600 ÷ $1,000 = 8.6.
| 2. | Multiply the result by the number under the heading “Fund-Level Expenses Incurred During Period.” |
If Fund-Level Expenses Incurred During Period were $7.50, then 8.6 × $7.50 = $64.50.
In this illustration, the estimated expenses incurred this period at the Fund level are $64.50.
Hypothetical Example for Comparison with Other Mutual Funds
Information in the second line (Hypothetical) of the table can help you compare ongoing expenses of the Fund with those of other mutual funds offered through the Contract. This information may not be used to estimate the actual ending account balance or expenses you incurred during the period. The hypothetical “Ending Account Value” is based on the Fund’s actual expense ratio and an assumed 5% annual rate of return before expenses, which does not represent the Fund’s actual return. The figure under the heading “Fund-Level Expenses Incurred During Period” shows the hypothetical expenses your account would have incurred under this scenario. You can compare this figure with the 5% hypothetical examples that appear in shareholder reports of other funds offered through a Contract.
| | | | | | | | | | | | |
| Class 4 | | Beginning Account Value 7/1/15 | | | Ending Account Value 12/31/15 | | | Fund-Level Expenses
Incurred During Period* 7/1/15–12/31/15 | |
Actual | | | $1,000 | | | | $ 821.80 | | | | $7.48 | |
Hypothetical (5% return before expenses) | | | $1,000 | | | | $1,016.99 | | | | $8.29 | |
*Expenses are calculated using the most recent six-month annualized expense ratio, net of expense waivers, for the Fund’s Class 4 shares (1.63%), which does not include any ongoing expenses of the Contract for which the Fund is an investment option, multiplied by the average account value over the period, multiplied by 184/365 to reflect the one-half year period.
FRANKLIN TEMPLETON VARIABLE INSURANCE PRODUCTS TRUST
Financial Highlights
Templeton Developing Markets VIP Fund
| | | | | | | | | | | | | | | | | | | | |
| | | Year Ended December 31, | |
| | | 2015 | | | 2014 | | | 2013 | | | 2012 | | | 2011 | |
| Class 1 | | | | | | | | | | | | | | | | | | | | |
Per share operating performance
(for a share outstanding throughout the year) | | | | | | | | | | | | | | | | | | | | |
| | | | | |
Net asset value, beginning of year | | | $9.27 | | | | $10.26 | | | | $10.58 | | | | $9.50 | | | | $11.40 | |
| | | | |
| | | | | |
| Income from investment operationsa: | | | | | | | | | | | | | | | | | | | | |
| | | | | |
Net investment incomeb | | | 0.06 | | | | 0.15 | c | | | 0.13 | | | | 0.19 | | | | 0.17 | |
| | | | | |
Net realized and unrealized gains (losses) | | | (1.63 | ) | | | (0.97 | ) | | | (0.22 | ) | | | 1.06 | | | | (1.94 | ) |
| | | | |
Total from investment operations | | | (1.57 | ) | | | (0.82 | ) | | | (0.09 | ) | | | 1.25 | | | | (1.77 | ) |
| | | | |
| | | | | |
| Less distributions from: | | | | | | | | | | | | | | | | | | | | |
| | | | | |
Net investment income | | | (0.20 | ) | | | (0.17 | ) | | | (0.23 | ) | | | (0.17 | ) | | | (0.13 | ) |
| | | | | |
Net realized gains | | | (1.13 | ) | | | — | | | | — | | | | — | | | | — | |
| | | | |
Total distributions | | | (1.33 | ) | | | (0.17 | ) | | | (0.23 | ) | | | (0.17 | ) | | | (0.13 | ) |
| | | | |
Redemption fees | | | — | | | | — | d | | | — | d | | | — | d | | | — | d |
| | | | |
Net asset value, end of year | | | $6.37 | | | | $9.27 | | | | $10.26 | | | | $10.58 | | | | $9.50 | |
| | | | |
| | | | | |
Total returne | | | (19.42)% | | | | (8.09)% | | | | (0.73)% | | | | 13.40% | | | | (15.67)% | |
| | | | | |
| Ratios to average net assets | | | | | | | | | | | | | | | | | | | | |
| | | | | |
Expenses before waiver and payments by affiliates | | | 1.33% | | | | 1.36% | | | | 1.35% | | | | 1.35% | | | | 1.40% | |
| | | | | |
Expenses net of waiver and payments by affiliates | | | 1.32% | | | | 1.36% | f | | | 1.35% | | | | 1.35% | | | | 1.40% | |
| | | | | |
Net investment income | | | 0.74% | | | | 1.51% | c | | | 1.25% | | | | 1.93% | | | | 1.57% | |
| | | | | |
| Supplemental data | | | | | | | | | | | | | | | | | | | | |
| | | | | |
Net assets, end of year (000’s) | | | $77,000 | | | | $114,487 | | | | $145,707 | | | | $203,568 | | | | $232,544 | |
| | | | | |
Portfolio turnover rate | | | 71.69% | | | | 82.87% | | | | 44.59% | | | | 24.45% | | | | 14.90% | |
aThe amount shown for a share outstanding throughout the period may not correlate with the Statement of Operations for the period due to the timing of sales and repurchases of the Fund’s shares in relation to income earned and/or fluctuating fair value of the investments of the Fund.
bBased on average daily shares outstanding.
cNet investment income per share includes approximately $0.04 per share related to income received in the form of special dividends in connection with certain fund holdings. Excluding this amount, the ratio of net investment income to average net assets would have been 1.11%.
dAmount rounds to less than $0.01 per share.
eTotal return does not include fees, charges or expenses imposed by the variable annuity and life insurance contracts for which Franklin Templeton Variable Insurance Products Trust serves as an underlying investment vehicle.
fBenefit of waiver and payments by affiliates rounds to less than 0.01%.
| | | | | | |
| | | The accompanying notes are an integral part of these financial statements. | Annual Report | | | TD-7 | |
FRANKLIN TEMPLETON VARIABLE INSURANCE PRODUCTS TRUST
FINANCIAL HIGHLIGHTS
Templeton Developing Markets VIP Fund (continued)
| | | | | | | | | | | | | | | | | | | | |
| | | Year Ended December 31, | |
| | | 2015 | | | 2014 | | | 2013 | | | 2012 | | | 2011 | |
| Class 2 | | | | | | | | | | | | | | | | | | | | |
Per share operating performance
(for a share outstanding throughout the year) | | | | | | | | | | | | | | | | | | | | |
| | | | | |
Net asset value, beginning of year | | | $9.20 | | | | $10.19 | | | | $10.50 | | | | $9.42 | | | | $11.30 | |
| | | | |
| | | | | |
| Income from investment operationsa: | | | | | | | | | | | | | | | | | | | | |
| | | | | |
Net investment incomeb | | | 0.04 | | | | 0.12 | c | | | 0.10 | | | | 0.17 | | | | 0.14 | |
| | | | | |
Net realized and unrealized gains (losses) | | | (1.61 | ) | | | (0.96 | ) | | | (0.21 | ) | | | 1.05 | | | | (1.92 | ) |
| | | | |
Total from investment operations | | | (1.57 | ) | | | (0.84 | ) | | | (0.11 | ) | | | 1.22 | | | | (1.78 | ) |
| | | | |
| | | | | |
| Less distributions from: | | | | | | | | | | | | | | | | | | | | |
| | | | | |
Net investment income | | | (0.18 | ) | | | (0.15 | ) | | | (0.20 | ) | | | (0.14 | ) | | | (0.10 | ) |
| | | | | |
Net realized gains | | | (1.13 | ) | | | — | | | | — | | | | — | | | | — | |
| | | | |
Total distributions | | | (1.31 | ) | | | (0.15 | ) | | | (0.20 | ) | | | (0.14 | ) | | | (0.10 | ) |
| | | | |
Redemption fees | | | — | | | | — | d | | | — | d | | | — | d | | | — | d |
| | | | |
Net asset value, end of year | | | $6.32 | | | | $9.20 | | | | $10.19 | | | | $10.50 | | | | $9.42 | |
| | | | |
| | | | | |
Total returne | | | (19.60)% | | | | (8.39)% | | | | (0.92)% | | | | 13.16% | | | | (15.86)% | |
| | | | | |
| Ratios to average net assets | | | | | | | | | | | | | | | | | | | | |
| | | | | |
Expenses before waiver and payments by affiliates | | | 1.58% | | | | 1.61% | | | | 1.60% | | | | 1.60% | | | | 1.65% | |
| | | | | |
Expenses net of waiver and payments by affiliates | | | 1.57% | | | | 1.61% | f | | | 1.60% | | | | 1.60% | | | | 1.65% | |
| | | | | |
Net investment income | | | 0.49% | | | | 1.26% | c | | | 1.00% | | | | 1.68% | | | | 1.32% | |
| | | | | |
| Supplemental data | | | | | | | | | | | | | | | | | | | | |
| | | | | |
Net assets, end of year (000’s) | | | $192,120 | | | | $250,813 | | | | $274,683 | | | | $291,638 | | | | $295,223 | |
| | | | | |
Portfolio turnover rate | | | 71.69% | | | | 82.87% | | | | 44.59% | | | | 24.45% | | | | 14.90% | |
aThe amount shown for a share outstanding throughout the period may not correlate with the Statement of Operations for the period due to the timing of sales and repurchases of the Fund’s shares in relation to income earned and/or fluctuating fair value of the investments of the Fund.
bBased on average daily shares outstanding.
cNet investment income per share includes approximately $0.04 per share related to income received in the form of special dividends in connection with certain fund holdings. Excluding this amount, the ratio of net investment income to average net assets would have been 0.86%.
dAmount rounds to less than $0.01 per share.
eTotal return does not include fees, charges or expenses imposed by the variable annuity and life insurance contracts for which Franklin Templeton Variable Insurance Products Trust serves as an underlying investment vehicle.
fBenefit of waiver and payments by affiliates rounds to less than 0.01%.
| | | | | | |
| | TD-8 | | | Annual Report | The accompanying notes are an integral part of these financial statements. | | |
FRANKLIN TEMPLETON VARIABLE INSURANCE PRODUCTS TRUST
FINANCIAL HIGHLIGHTS
Templeton Developing Markets VIP Fund (continued)
| | | | | | | | | | | | | | | | | | | | |
| | | Year Ended December 31, | |
| | | 2015 | | | 2014 | | | 2013 | | | 2012 | | | 2011 | |
| Class 4 | | | | | | | | | | | | | | | | | | | | |
Per share operating performance
(for a share outstanding throughout the year) | | | | | | | | | | | | | | | | | | | | |
| | | | | |
Net asset value, beginning of year | | | $9.22 | | | | $10.20 | | | | $10.50 | | | | $9.42 | | | | $11.30 | |
| | | | |
| | | | | |
| Income from investment operationsa: | | | | | | | | | | | | | | | | | | | | |
| | | | | |
Net investment incomeb | | | 0.03 | | | | 0.12 | c | | | 0.10 | | | | 0.16 | | | | 0.13 | |
| | | | | |
Net realized and unrealized gains (losses) | | | (1.62 | ) | | | (0.97 | ) | | | (0.21 | ) | | | 1.04 | | | | (1.91 | ) |
| | | | |
Total from investment operations | | | (1.59 | ) | | | (0.85 | ) | | | (0.11 | ) | | | 1.20 | | | | (1.78 | ) |
| | | | |
| | | | | |
| Less distributions from: | | | | | | | | | | | | | | | | | | | | |
| | | | | |
Net investment income | | | (0.16 | ) | | | (0.13 | ) | | | (0.19 | ) | | | (0.12 | ) | | | (0.10 | ) |
| | | | | |
Net realized gains | | | (1.13 | ) | | | — | | | | — | | | | — | | | | — | |
| | | | |
Total distributions | | | (1.29 | ) | | | (0.13 | ) | | | (0.19 | ) | | | (0.12 | ) | | | (0.10 | ) |
| | | | |
Redemption fees | | | — | | | | — | d | | | — | d | | | — | d | | | — | d |
| | | | |
Net asset value, end of year | | | $6.34 | | | | $9.22 | | | | $10.20 | | | | $10.50 | | | | $9.42 | |
| | | | |
| | | | | |
Total returne | | | (19.70)% | | | | (8.48)% | | | | (1.07)% | | | | 13.06% | | | | (15.88)% | |
| | | | | |
| Ratios to average net assets | | | | | | | | | | | | | | | | | | | | |
| | | | | |
Expenses before waiver and payments by affiliates | | | 1.68% | | | | 1.71% | | | | 1.70% | | | | 1.70% | | | | 1.75% | |
| | | | | |
Expenses net of waiver and payments by affiliates | | | 1.67% | | | | 1.71% | f | | | 1.70% | | | | 1.70% | | | | 1.75% | |
| | | | | |
Net investment income | | | 0.39% | | | | 1.16% | c | | | 0.90% | | | | 1.58% | | | | 1.22% | |
| | | | | |
| Supplemental data | | | | | | | | | | | | | | | | | | | | |
| | | | | |
Net assets, end of year (000’s) | | | $7,109 | | | | $11,106 | | | | $15,225 | | | | $23,341 | | | | $24,380 | |
| | | | | |
Portfolio turnover rate | | | 71.69% | | | | 82.87% | | | | 44.59% | | | | 24.45% | | | | 14.90% | |
aThe amount shown for a share outstanding throughout the period may not correlate with the Statement of Operations for the period due to the timing of sales and repurchases of the Fund’s shares in relation to income earned and/or fluctuating fair value of the investments of the Fund.
bBased on average daily shares outstanding.
cNet investment income per share includes approximately $0.04 per share related to income received in the form of special dividends in connection with certain fund holdings. Excluding this amount, the ratio of net investment income to average net assets would have been 0.76%.
dAmount rounds to less than $0.01 per share.
eTotal return does not include fees, charges or expenses imposed by the variable annuity and life insurance contracts for which Franklin Templeton Variable Insurance Products Trust serves as an underlying investment vehicle.
fBenefit of waiver and payments by affiliates rounds to less than 0.01%.
| | | | | | |
| | | The accompanying notes are an integral part of these financial statements. | Annual Report | | | TD-9 | |
FRANKLIN TEMPLETON VARIABLE INSURANCE PRODUCTS TRUST
Statement of Investments, December 31, 2015
| | | | | | | | | | | | | | |
Templeton Developing Markets VIP Fund | | | | |
| | | | | Industry | | | Shares | | | Value | |
| | Common Stocks 82.3% | | | | | | | | | | | | |
| | Argentina 0.1% | | | | | | | | | | | | |
| a | | Grupo Clarin SA, B, GDR, Reg S | | | Media | | | | 9,190 | | | $ | 165,420 | |
| | | | | | | | | | | | | | |
| | Belgium 3.4% | | | | | | | | | | | | |
| | Anheuser-Busch InBev NV | | | Beverages | | | | 76,142 | | | | 9,461,938 | |
| | | | | | | | | | | | | | |
| | Brazil 1.0% | | | | | | | | | | | | |
| | BM&F BOVESPA SA | | | Diversified Financial Services | | | | 116,800 | | | | 321,135 | |
| | CETIP SA Mercados Organizados | | | Capital Markets | | | | 36,000 | | | | 340,840 | |
| | M Dias Branco SA | | | Food Products | | | | 82,100 | | | | 1,378,421 | |
| | Mahle-Metal Leve SA Industria e Comercio | | | Auto Components | | | | 8,100 | | | | 50,615 | |
| | Totvs SA | | | Software | | | | 74,900 | | | | 586,787 | |
| | | | | | | | | | | | | | |
| | | | | | | | | | | | | 2,677,798 | |
| | | | | | | | | | | | | | |
| | Cambodia 1.1% | | | | | | | | | | | | |
| | NagaCorp Ltd. | | | Hotels, Restaurants & Leisure | | | | 4,824,000 | | | | 3,049,954 | |
| | | | | | | | | | | | | | |
| | China 19.8% | | | | | | | | | | | | |
| b | | Baidu Inc., ADR | | | Internet Software & Services | | | | 36,735 | | | | 6,944,384 | |
| | Brilliance China Automotive Holdings Ltd. | | | Automobiles | | | | 8,901,300 | | | | 11,186,708 | |
| | China Construction Bank Corp., H | | | Banks | | | | 6,167,300 | | | | 4,225,513 | |
| | China Life Insurance Co. Ltd., H | | | Insurance | | | | 855,000 | | | | 2,769,043 | |
| | China Mobile Ltd. | | | Wireless Telecommunication Services | | | | 550,500 | | | | 6,215,202 | |
| | China Petroleum and Chemical Corp., H | | | Oil, Gas & Consumable Fuels | | | | 5,924,000 | | | | 3,569,619 | |
| | COSCO Pacific Ltd. | | | Transportation Infrastructure | | | | 517,500 | | | | 570,241 | |
| | Dah Chong Hong Holdings Ltd. | | | Distributors | | | | 1,746,100 | | | | 878,666 | |
| c | | Inner Mongolia Yitai Coal Co. Ltd., B | | | Oil, Gas & Consumable Fuels | | | | 243,400 | | | | 222,224 | |
| | NetEase Inc., ADR | | | Internet Software & Services | | | | 12,903 | | | | 2,338,540 | |
| | PetroChina Co. Ltd., H | | | Oil, Gas & Consumable Fuels | | | | 3,407,600 | | | | 2,237,980 | |
| | Poly Culture Group Corp. Ltd., H | | | Media | | | | 229,200 | | | | 626,961 | |
| | Tencent Holdings Ltd. | | | Internet Software & Services | | | | 522,100 | | | | 10,286,855 | |
| | Uni-President China Holdings Ltd. | | | Food Products | | | | 3,479,300 | | | | 2,675,642 | |
| | | | | | | | | | | | | | |
| | | | | | | | | | | | | 54,747,578 | |
| | | | | | | | | | | | | | |
| | Hong Kong 3.5% | | | | | | | | | | | | |
| | Dairy Farm International Holdings Ltd. | | | Food & Staples Retailing | | | | 454,133 | | | | 2,761,128 | |
| | MGM China Holdings Ltd. | | | Hotels, Restaurants & Leisure | | | | 2,612,800 | | | | 3,270,151 | |
| | Sands China Ltd. | | | Hotels, Restaurants & Leisure | | | | 1,049,200 | | | | 3,580,749 | |
| | | | | | | | | | | | | | |
| | | | | | | | | | | | | 9,612,028 | |
| | | | | | | | | | | | | | |
| | Hungary 0.4% | | | | | | | | | | | | |
| | Richter Gedeon Nyrt | | | Pharmaceuticals | | | | 59,790 | | | | 1,132,248 | |
| | | | | | | | | | | | | | |
| | India 10.8% | | | | | | | | | | | | |
| | Biocon Ltd. | | | Biotechnology | | | | 545,046 | | | | 4,265,266 | |
| | Dr. Reddy’s Laboratories Ltd. | | | Pharmaceuticals | | | | 84,890 | | | | 3,985,848 | |
| | ICICI Bank Ltd. | | | Banks | | | | 1,027,140 | | | | 4,054,633 | |
| | Infosys Ltd. | | | IT Services | | | | 183,099 | | | | 3,057,066 | |
| | Oil & Natural Gas Corp. Ltd. | | | Oil, Gas & Consumable Fuels | | | | 297,100 | | | | 1,084,847 | |
| | Reliance Industries Ltd. | | | Oil, Gas & Consumable Fuels | | | | 206,000 | | | | 3,156,905 | |
| | Tata Chemicals Ltd. | | | Chemicals | | | | 184,000 | | | | 1,115,703 | |
| | Tata Consultancy Services Ltd. | | | IT Services | | | | 226,350 | | | | 8,331,221 | |
| b | | Tata Motors Ltd., A | | | Automobiles | | | | 166,000 | | | | 725,489 | |
| | | | | | | | | | | | | | |
| | | | | | | | | | | | | 29,776,978 | |
| | | | | | | | | | | | | | |
FRANKLIN TEMPLETON VARIABLE INSURANCE PRODUCTS TRUST
STATEMENT OF INVESTMENTS
Templeton Developing Markets VIP Fund (continued)
| | | | | | | | | | | | | | |
| | | | | Industry | | | Shares | | | Value | |
| | Common Stocks (continued) | | | | | | | | | | | | |
| | Indonesia 2.9% | | | | | | | | | | | | |
| | Astra International Tbk PT | | | Automobiles | | | | 10,115,100 | | | $ | 4,401,857 | |
| | Bank Danamon Indonesia Tbk PT | | | Banks | | | | 5,707,000 | | | | 1,324,562 | |
| | Semen Indonesia (Persero) Tbk PT | | | Construction Materials | | | | 2,764,700 | | | | 2,285,953 | |
| | | | | | | | | | | | | | |
| | | | | | | | | | | | | 8,012,372 | |
| | | | | | | | | | | | | | |
| | Mexico 0.5% | | | | | | | | | | | | |
| | America Movil SAB de CV, L, ADR | | | Wireless Telecommunication Services | | | | 82,000 | | | | 1,152,920 | |
| | Nemak SAB de CV | | | Auto Components | | | | 169,100 | | | | 228,704 | |
| | | | | | | | | | | | | | |
| | | | | | | | | | | | | 1,381,624 | |
| | | | | | | | | | | | | | |
| | Pakistan 1.1% | | | | | | | | | | | | |
| | Habib Bank Ltd. | | | Banks | | | | 1,550,000 | | | | 2,956,605 | |
| | | | | | | | | | | | | | |
| | Philippines 0.3% | | | | | | | | | | | | |
| | Bloomberry Resorts Corp. | | | Hotels, Restaurants & Leisure | | | | 9,073,300 | | | | 877,843 | |
| | | | | | | | | | | | | | |
| | Russia 1.1% | | | | | | | | | | | | |
| a,b | | Mail.ru Group Ltd., GDR, Reg S | | | Internet Software & Services | | | | 62,377 | | | | 1,406,601 | |
| b | | Yandex NV, A | | | Internet Software & Services | | | | 98,600 | | | | 1,549,992 | |
| | | | | | | | | | | | | | |
| | | | | | | | | | | | | 2,956,593 | |
| | | | | | | | | | | | | | |
| | Singapore 0.1% | | | | | | | | | | | | |
| | DBS Group Holdings Ltd. | | | Banks | | | | 24,700 | | | | 290,742 | |
| | | | | | | | | | | | | | |
| | South Africa 9.2% | | | | | | | | | | | | |
| | Massmart Holdings Ltd. | | | Food & Staples Retailing | | | | 126,006 | | | | 814,787 | |
| | MTN Group Ltd. | | | Wireless Telecommunication Services | | | | 400,483 | | | | 3,441,353 | |
| | Naspers Ltd., N | | | Media | | | | 108,742 | | | | 14,906,856 | |
| | Remgro Ltd. | | | Diversified Financial Services | | | | 390,843 | | | | 6,197,170 | |
| | | | | | | | | | | | | | |
| | | | | | | | | | | | | 25,360,166 | |
| | | | | | | | | | | | | | |
| | South Korea 8.9% | | | | | | | | | | | | |
| | Bukwang Pharmaceutical Co. Ltd. | | | Pharmaceuticals | | | | 2,831 | | | | 61,311 | |
| | Daelim Industrial Co. Ltd. | | | Construction & Engineering | | | | 38,193 | | | | 2,180,489 | |
| | Fila Korea Ltd. | | | Textiles, Apparel & Luxury Goods | | | | 33,470 | | | | 2,688,285 | |
| | Hankook Tire Co. Ltd. | | | Auto Components | | | | 21,600 | | | | 864,691 | |
| | Hyundai Development Co. | | | Construction & Engineering | | | | 98,910 | | | | 3,265,273 | |
| b | | iMarketkorea Inc. | | | Trading Companies & Distributors | | | | 54,300 | | | | 1,168,875 | |
| | Interpark Corp. | | | Internet & Catalog Retail | | | | 4,200 | | | | 39,487 | |
| | KT Skylife Co. Ltd. | | | Media | | | | 176,060 | | | | 2,591,519 | |
| | Samsung Electronics Co. Ltd. | | | Technology Hardware, Storage & Peripherals | | | | 6,448 | | | | 6,912,627 | |
| | SK Hynix Inc. | | | Semiconductors & Semiconductor Equipment | | | | 185,090 | | | | 4,842,567 | |
| | | | | | | | | | | | | | |
| | | | | | | | | | | | | 24,615,124 | |
| | | | | | | | | | | | | | |
| | Taiwan 8.7% | | | | | | | | | | | | |
| | Catcher Technology Co. Ltd. | | | Technology Hardware, Storage & Peripherals | | | | 164,000 | | | | 1,375,137 | |
| | Hon Hai Precision Industry Co. Ltd. | | | Electronic Equipment, Instruments & Components | | | | 2,455,000 | | | | 6,026,370 | |
| | Largan Precision Co. Ltd. | | | Electronic Equipment, Instruments & Components | | | | 14,000 | | | | 965,488 | |
| | Pegatron Corp. | | | Technology Hardware, Storage & Peripherals | | | | 973,800 | | | | 2,130,077 | |
| | Taiwan Semiconductor Manufacturing Co. Ltd. | | | Semiconductors & Semiconductor Equipment | | | | 3,143,000 | | | | 13,654,423 | |
| | | | | | | | | | | | | | |
| | | | | | | | | | | | | 24,151,495 | |
| | | | | | | | | | | | | | |
| | Thailand 4.4% | | | | | | | | | | | | |
| | Kasikornbank PCL, fgn. | | | Banks | | | | 604,100 | | | | 2,506,604 | |
FRANKLIN TEMPLETON VARIABLE INSURANCE PRODUCTS TRUST
STATEMENT OF INVESTMENTS
Templeton Developing Markets VIP Fund (continued)
| | | | | | | | | | | | | | |
| | | | | Industry | | | Shares | | | Value | |
| | Common Stocks (continued) | | | | | | | | | | | | |
| | Thailand (continued) | | | | | | | | | | | | |
| | Kiatnakin Bank PCL, fgn. | | | Banks | | | | 1,009,800 | | | $ | 1,015,966 | |
| | Land and Houses PCL, fgn. | | | Real Estate Management & Development | | | | 4,997,000 | | | | 1,310,620 | |
| | PTT Exploration and Production PCL, fgn. | | | Oil, Gas & Consumable Fuels | | | | 584,500 | | | | 928,743 | |
| | PTT PCL, fgn. | | | Oil, Gas & Consumable Fuels | | | | 113,200 | | | | 766,606 | |
| | Siam Commercial Bank PCL, fgn. | | | Banks | | | | 306,400 | | | | 1,016,231 | |
| | Thai Beverage PCL, fgn. | | | Beverages | | | | 9,695,900 | | | | 4,718,366 | |
| | | | | | | | | | | | | | |
| | | | | | | | | | | | | 12,263,136 | |
| | | | | | | | | | | | | | |
| | United Kingdom 5.0% | | | | | | | | | | | | |
| | Unilever PLC | | | Personal Products | | | | 318,597 | | | | 13,742,728 | |
| | | | | | | | | | | | | | |
| | | | |
| | Total Common Stocks
(Cost $225,877,777) | | | | | | | | | | | 227,232,370 | |
| | | | | | | | | | | | | | |
| d | | Participatory Notes (Cost $968,712) 0.3% | | | | | | | | | |
| | Saudi Arabia 0.3% | | | | | | | | | | | | |
| e | | Deutsche Bank AG/London, Samba Financial Group, 144A, 9/27/16 | | | Banks | | | | 143,055 | | | | 890,174 | |
| | | | | | | | | | | | | | |
| | Preferred Stocks 4.6% | | | | | | | | | | | | |
| | Brazil 4.6% | | | | | | | | | | | | |
| | Banco Bradesco SA, ADR, pfd. | | | Banks | | | | 1,300,900 | | | | 6,257,329 | |
| | Itau Unibanco Holding SA, ADR, pfd. | | | Banks | | | | 978,211 | | | | 6,368,154 | |
| | | | | | | | | | | | | | |
| | | | |
| | Total Preferred Stocks
(Cost $15,752,130) | | | | | | | | | | | 12,625,483 | |
| | | | | | | | | | | | | | |
| | | | |
| | Total Investments before Short Term Investments (Cost $242,598,619) | | | | | | | | | | | 240,748,027 | |
| | | | | | | | | | | | | | |
| | Short Term Investments
(Cost $36,108,301) 13.0% | | | | | | | | | | | | |
| | Money Market Funds 13.0% | | | | | | | | | | | | |
| | United States 13.0% | | | | | | | | | | | | |
| b,f | | Institutional Fiduciary Trust Money Market Portfolio | | | | | | | 36,108,301 | | | | 36,108,301 | |
| | | | | | | | | | | | | | |
| | Total Investments
(Cost $278,706,920) 100.2% | | | | | | | | | | | 276,856,328 | |
| | Other Assets, less Liabilities (0.2)% | | | | | | | | | | | (626,601 | ) |
| | | | | | | | | | | | | | |
| | Net Assets 100.0% | | | | | | | | | | $ | 276,229,727 | |
| | | | | | | | | | | | | | |
See Abbreviations on page TD-24.
aSecurity was purchased pursuant to Regulation S under the Securities Act of 1933, which exempts from registration securities offered and sold outside of the United States. Such a security cannot be sold in the United States without either an effective registration statement filed pursuant to the Securities Act of 1933, or pursuant to an exemption from registration. These securities have been deemed liquid under guidelines approved by the Trust’s Board of Trustees. At December 31, 2015, the aggregate value of these securities was $1,572,021, representing 0.57% of net assets.
bNon-income producing.
cAt December 31, 2015, pursuant to the Fund’s policies and the requirements of applicable securities law, the Fund is restricted from trading this security at year end.
dSee Note 1(c) regarding Participatory Notes.
eSecurity was purchased pursuant to Rule 144A under the Securities Act of 1933 and may be sold in transactions exempt from registration only to qualified institutional buyers or in a public offering registered under the Securities Act of 1933. This security has been deemed liquid under guidelines approved by the Trust’s Board of Trustees.
fSee Note 3(e) regarding investments in affiliated management investment companies.
| | | | | | |
| | TD-12 | | | Annual Report | The accompanying notes are an integral part of these financial statements. | | |
FRANKLIN TEMPLETON VARIABLE INSURANCE PRODUCTS TRUST
Financial Statements
Statement of Assets and Liabilities
December 31, 2015
| | | | |
| | | Templeton
Developing Markets
VIP Fund | |
Assets: | | | | |
Investments in securities: | | | | |
Cost - Unaffiliated issuers | | $ | 242,598,619 | |
Cost - Non-controlled affiliates (Note 3e) | | | 36,108,301 | |
| | | | |
Total cost of investments | | $ | 278,706,920 | |
| | | | |
Value - Unaffiliated issuers | | $ | 240,748,027 | |
Value - Non-controlled affiliates (Note 3e) | | | 36,108,301 | |
| | | | |
Total value of investments | | | 276,856,328 | |
Foreign currency, at value (cost $219,189) | | | 219,189 | |
Receivables: | | | | |
Investment securities sold | | | 533,765 | |
Capital shares sold | | | 54,063 | |
Dividends | | | 573,602 | |
Foreign tax | | | 23,166 | |
Other assets | | | 30 | |
| | | | |
Total assets | | | 278,260,143 | |
| | | | |
Liabilities: | | | | |
Payables: | | | | |
Investment securities purchased | | | 1,250,665 | |
Capital shares redeemed | | | 87,497 | |
Management fees | | | 291,442 | |
Distribution fees | | | 86,905 | |
Reports to shareholders | | | 129,000 | |
Deferred tax | | | 119,852 | |
Accrued expenses and other liabilities | | | 65,055 | |
| | | | |
Total liabilities | | | 2,030,416 | |
| | | | |
Net assets, at value | | $ | 276,229,727 | |
| | | | |
Net assets consist of: | | | | |
Paid-in capital | | $ | 328,588,846 | |
Distributions in excess of net investment income | | | (3,021,032 | ) |
Net unrealized appreciation (depreciation) | | | (2,009,916 | ) |
Accumulated net realized gain (loss) | | | (47,328,171 | ) |
| | | | |
Net assets, at value | | $ | 276,229,727 | |
| | | | |
| | | | | | |
| | | The accompanying notes are an integral part of these financial statements. | Annual Report | | | TD-13 | |
FRANKLIN TEMPLETON VARIABLE INSURANCE PRODUCTS TRUST
FINANCIAL STATEMENTS
Statement of Assets and Liabilities (continued)
December 31, 2015
| | | | |
| | | Templeton
Developing Markets
VIP Fund | |
| |
| Class 1: | | | | |
Net assets, at value | | $ | 77,000,388 | |
| | | | |
Shares outstanding | | | 12,082,238 | |
| | | | |
Net asset value and maximum offering price per share | | $ | 6.37 | |
| | | | |
| |
| Class 2: | | | | |
Net assets, at value | | $ | 192,119,846 | |
| | | | |
Shares outstanding | | | 30,394,847 | |
| | | | |
Net asset value and maximum offering price per share | | $ | 6.32 | |
| | | | |
| |
| Class 4: | | | | |
Net assets, at value | | $ | 7,109,493 | |
| | | | |
Shares outstanding | | | 1,120,931 | |
| | | | |
Net asset value and maximum offering price per share | | $ | 6.34 | |
| | | | |
| | | | | | |
| | TD-14 | | | Annual Report | The accompanying notes are an integral part of these financial statements. | | |
FRANKLIN TEMPLETON VARIABLE INSURANCE PRODUCTS TRUST
FINANCIAL STATEMENTS
Statement of Operations
for the year ended December 31, 2015
| | | | |
| | | Templeton
Developing Markets
VIP Fund | |
Investment income: | | | | |
Dividends (net of foreign taxes of $757,277) | | $ | 6,893,056 | |
Income from securities loaned | | | 32 | |
| | | | |
Total investment income | | | 6,893,088 | |
| | | | |
Expenses: | | | | |
Management fees (Note 3a) | | | 4,165,783 | |
Distribution fees: (Note 3c) | | | | |
Class 2 | | | 566,203 | |
Class 4 | | | 32,286 | |
Custodian fees (Note 4) | | | 103,114 | |
Reports to shareholders | | | 107,348 | |
Professional fees | | | 66,358 | |
Trustees’ fees and expenses | | | 1,525 | |
Other | | | 20,143 | |
| | | | |
Total expenses | | | 5,062,760 | |
Expenses waived/paid by affiliates (Note 3e) | | | (38,678 | ) |
| | | | |
Net expenses | | | 5,024,082 | |
| | | | |
Net investment income | | | 1,869,006 | |
| | | | |
Realized and unrealized gains (losses): | | | | |
Net realized gain (loss) from: | | | | |
Investments | | | (39,632,078 | ) |
Foreign currency transactions | | | (606,798 | ) |
| | | | |
Net realized gain (loss) | | | (40,238,876 | ) |
| | | | |
Net change in unrealized appreciation (depreciation) on: | | | | |
Investments | | | (29,089,383 | ) |
Translation of other assets and liabilities denominated in foreign currencies | | | (4,173 | ) |
Change in deferred taxes on unrealized appreciation | | | (90,450 | ) |
| | | | |
Net change in unrealized appreciation (depreciation) | | | (29,184,006 | ) |
| | | | |
Net realized and unrealized gain (loss) | | | (69,422,882 | ) |
| | | | |
Net increase (decrease) in net assets resulting from operations | | $ | (67,553,876 | ) |
| | | | |
| | | | | | |
| | | The accompanying notes are an integral part of these financial statements. | Annual Report | | | TD-15 | |
FRANKLIN TEMPLETON VARIABLE INSURANCE PRODUCTS TRUST
FINANCIAL STATEMENTS
Statements of Changes in Net Assets
| | | | | | | | |
| | | Templeton Developing Markets VIP Fund | |
| | | Year Ended December 31, | |
| | | 2015 | | | 2014 | |
Increase (decrease) in net assets: | | | | | | | | |
Operations: | | | | | | | | |
Net investment income | | $ | 1,869,006 | | | $ | 5,767,995 | |
Net realized gain (loss) | | | (40,238,876 | ) | | | 66,732,640 | |
Net change in unrealized appreciation (depreciation) | | | (29,184,006 | ) | | | (106,645,647 | ) |
| | | | |
Net increase (decrease) in net assets resulting from operations | | | (67,553,876 | ) | | | (34,145,012 | ) |
| | | | |
Distributions to shareholders from: | | | | | | | | |
Net investment income: | | | | | | | | |
Class 1 | | | (2,280,023 | ) | | | (2,319,775 | ) |
Class 2 | | | (4,605,588 | ) | | | (4,358,800 | ) |
Class 4 | | | (178,865 | ) | | | (173,399 | ) |
Net realized gains: | | | | | | | | |
Class 1 | | | (12,555,712 | ) | | | — | |
Class 2 | | | (29,329,089 | ) | | | — | |
Class 4 | | | (1,242,906 | ) | | | — | |
| | | | |
Total distributions to shareholders | | | (50,192,183 | ) | | | (6,851,974 | ) |
| | | | |
Capital share transactions: (Note 2) | | | | | | | | |
Class 1 | | | (3,228,881 | ) | | | (18,560,195 | ) |
Class 2 | | | 21,548,017 | | | | 2,280,393 | |
Class 3 | | | — | | | | (33,674,042 | ) |
Class 4 | | | (748,959 | ) | | | (2,909,339 | ) |
| | | | |
Total capital share transactions | | | 17,570,177 | | | | (52,863,183 | ) |
| | | | |
Redemption fees | | | — | | | | 68 | |
| | | | |
Net increase (decrease) in net assets | | | (100,175,882 | ) | | | (93,860,101 | ) |
Net assets: | | | | | | | | |
Beginning of year | | | 376,405,609 | | | | 470,265,710 | |
| | | | |
End of year | | $ | 276,229,727 | | | $ | 376,405,609 | |
| | | | |
Distributions in excess of net investment income included in net assets: | | | | | | | | |
End of year | | $ | (3,021,032 | ) | | $ | (531,967 | ) |
| | | | |
| | | | | | |
| | TD-16 | | | Annual Report | The accompanying notes are an integral part of these financial statements. | | |
FRANKLIN TEMPLETON VARIABLE INSURANCE PRODUCTS TRUST
Notes to Financial Statements
Templeton Developing Markets VIP Fund
1. Organization and Significant Accounting Policies
Franklin Templeton Variable Insurance Products Trust (Trust) is registered under the Investment Company Act of 1940 (1940 Act) as an open-end management investment company, consisting of nineteen separate funds and applies the specialized accounting and reporting guidance in U.S. Generally Accepted Accounting Principles (U.S. GAAP). Templeton Developing Markets VIP Fund (Fund) is included in this report. The financial statements of the remaining funds in the Trust are presented separately. Shares of the Fund are generally sold only to insurance company separate accounts to fund the benefits of variable life insurance policies or variable annuity contracts. The Fund offers three classes of shares: Class 1, Class 2 and Class 4. Effective May 1, 2014, all Class 3 shares were converted to Class 2. Each class of shares differs by its distribution fees, voting rights on matters affecting a single class and its exchange privilege.
The following summarizes the Fund’s significant accounting policies.
a. Financial Instrument Valuation
The Fund’s investments in financial instruments are carried at fair value daily. Fair value is the price that would be received to sell an asset or paid to transfer a liability in an orderly transaction between market participants on the measurement date. The Fund calculates the net asset value (NAV) per share as of 4 p.m. Eastern time each day the New York Stock Exchange (NYSE) is open for trading. Under compliance policies and procedures approved by the Trust’s Board of Trustees (the Board), the Fund’s administrator has responsibility for oversight of valuation, including leading the cross-functional Valuation and Liquidity Oversight Committee (VLOC). The VLOC provides administration and oversight of the Fund’s valuation policies and procedures, which are approved annually by the Board. Among other things, these procedures allow the Fund to utilize independent pricing services, quotations from securities and financial instrument dealers, and other market sources to determine fair value.
Equity securities listed on an exchange or on the NASDAQ National Market System are valued at the last quoted sale price or the official closing price of the day, respectively. Foreign equity securities are valued as of the close of trading on the foreign stock exchange on which the security is primarily traded or as of 4 p.m. Eastern time whichever is earlier. The value is then
converted into its U.S. dollar equivalent at the foreign exchange rate in effect at 4 p.m. Eastern time on the day that the value of the security is determined. Over-the-counter (OTC) securities are valued within the range of the most recent quoted bid and ask prices. Securities that trade in multiple markets or on multiple exchanges are valued according to the broadest and most representative market. Certain equity securities are valued based upon fundamental characteristics or relationships to similar securities.
Investments in open-end mutual funds are valued at the closing NAV.
The Fund has procedures to determine the fair value of financial instruments for which market prices are not reliable or readily available. Under these procedures, the VLOC convenes on a regular basis to review such financial instruments and considers a number of factors, including significant unobservable valuation inputs, when arriving at fair value. The VLOC primarily employs a market-based approach which may use related or comparable assets or liabilities, recent transactions, market multiples, book values, and other relevant information for the investment to determine the fair value of the investment. An income-based valuation approach may also be used in which the anticipated future cash flows of the investment are discounted to calculate fair value. Discounts may also be applied due to the nature or duration of any restrictions on the disposition of the investments. Due to the inherent uncertainty of valuations of such investments, the fair values may differ significantly from the values that would have been used had an active market existed. The VLOC employs various methods for calibrating these valuation approaches including a regular review of key inputs and assumptions, transactional back-testing or disposition analysis, and reviews of any related market activity.
Trading in securities on foreign securities stock exchanges and OTC markets may be completed before 4 p.m. Eastern time. In addition, trading in certain foreign markets may not take place on every NYSE business day. Occasionally, events occur between the time at which trading in a foreign security is completed and the close of the NYSE that might call into question the reliability of the value of a portfolio security held by the Fund. As a result, differences may arise between the value of the Fund’s portfolio securities as determined at the foreign market close and the latest indications of value at the close of the NYSE. In order to minimize the potential for these differences, the VLOC monitors price movements following the close
FRANKLIN TEMPLETON VARIABLE INSURANCE PRODUCTS TRUST
NOTES TO FINANCIAL STATEMENTS
Templeton Developing Markets VIP Fund (continued)
1. Organization and Significant Accounting Policies (continued)
a. Financial Instrument Valuation (continued)
of trading in foreign stock markets through a series of country specific market proxies (such as baskets of American Depositary Receipts, futures contracts and exchange traded funds). These price movements are measured against established trigger thresholds for each specific market proxy to assist in determining if an event has occurred that may call into question the reliability of the values of the foreign securities held by the Fund. If such an event occurs, the securities may be valued using fair value procedures, which may include the use of independent pricing services.
When the last day of the reporting period is a non-business day, certain foreign markets may be open on those days that the NYSE is closed, which could result in differences between the value of the Fund’s portfolio securities on the last business day and the last calendar day of the reporting period. Any significant security valuation changes due to an open foreign market are adjusted and reflected by the Fund for financial reporting purposes.
b. Foreign Currency Translation
Portfolio securities and other assets and liabilities denominated in foreign currencies are translated into U.S. dollars based on the exchange rate of such currencies against U.S. dollars on the date of valuation. The Fund may enter into foreign currency exchange contracts to facilitate transactions denominated in a foreign currency. Purchases and sales of securities, income and expense items denominated in foreign currencies are translated into U.S. dollars at the exchange rate in effect on the transaction date. Portfolio securities and assets and liabilities denominated in foreign currencies contain risks that those currencies will decline in value relative to the U.S. dollar. Occasionally, events may impact the availability or reliability of foreign exchange rates used to convert the U.S. dollar equivalent value. If such an event occurs, the foreign exchange rate will be valued at fair value using procedures established and approved by the Board.
The Fund does not separately report the effect of changes in foreign exchange rates from changes in market prices on securities held. Such changes are included in net realized and unrealized gain or loss from investments in the Statement of Operations.
Realized foreign exchange gains or losses arise from sales of foreign currencies, currency gains or losses realized between the trade and settlement dates on securities transactions and the difference between the recorded amounts of dividends, interest, and foreign withholding taxes and the U.S. dollar equivalent of the amounts actually received or paid. Net unrealized foreign exchange gains and losses arise from changes in foreign exchange rates on foreign denominated assets and liabilities other than investments in securities held at the end of the reporting period.
c. Participatory Notes
The Fund invests in Participatory Notes (P-Notes). P-notes are promissory notes that are designed to offer a return linked to the performance of a particular underlying equity security or market. P-Notes are issued by banks or broker-dealers and allow the Fund to gain exposure to common stocks in markets where direct investment is not allowed. Income received from P-Notes is recorded as dividend income in the Statement of Operations. P-Notes may contain various risks including the potential inability of the counterparty to fulfill their obligations under the terms of the contract. These securities may be more volatile and less liquid than other investments held by the Fund.
d. Securities Lending
The Fund participates in an agency based securities lending program to earn additional income. The Fund receives cash collateral against the loaned securities in an amount equal to at least 102% of the fair value of the loaned securities. Collateral is maintained over the life of the loan in an amount not less than 100% of the fair value of loaned securities, as determined at the close of Fund business each day; any additional collateral required due to changes in security values is delivered to the Fund on the next business day. The collateral is deposited into a joint cash account with other funds and is used to invest in a money market fund managed by Franklin Advisers, Inc., an affiliate of the Fund. The Fund may receive income from the investment of cash collateral, in addition to lending fees and rebates paid by the borrower. Income from securities loaned is reported separately in the Statement of Operations. The Fund bears the market risk with respect to the collateral investment, securities loaned, and the risk that the agent may default on its obligations to the Fund. If the borrower defaults on its obligation to return the securities loaned, the Fund has the right to repurchase the securities in the open market using the collateral received. The securities lending agent has agreed to indemnify
FRANKLIN TEMPLETON VARIABLE INSURANCE PRODUCTS TRUST
NOTES TO FINANCIAL STATEMENTS
Templeton Developing Markets VIP Fund (continued)
the Fund in the event of default by a third party borrower. At December 31, 2015, the Fund had no securities on loan.
It is the Fund’s policy to qualify as a regulated investment company under the Internal Revenue Code. The Fund intends to distribute to shareholders substantially all of its taxable income and net realized gains to relieve it from federal income and if applicable, excise taxes. As a result, no provision for U.S. federal income taxes is required.
The Fund may be subject to foreign taxation related to income received, capital gains on the sale of securities and certain foreign currency transactions in the foreign jurisdictions in which it invests. Foreign taxes, if any, are recorded based on the tax regulations and rates that exist in the foreign markets in which the Fund invests. When a capital gain tax is determined to apply, the Fund records an estimated deferred tax liability in an amount that would be payable if the securities were disposed of on the valuation date.
The Fund may recognize an income tax liability related to its uncertain tax positions under U.S. GAAP when the uncertain tax position has a less than 50% probability that it will be sustained upon examination by the tax authorities based on its technical merits. As of December 31, 2015, the Fund has determined that no tax liability is required in its financial statements related to uncertain tax positions for any open tax years (or expected to be taken on future tax returns). Open tax years are those that remain subject to examination and are based on each tax jurisdiction’s statute of limitation.
f. Security Transactions, Investment Income, Expenses and Distributions
Security transactions are accounted for on trade date. Realized gains and losses on security transactions are determined on a specific identification basis. Estimated expenses are accrued daily. Dividend income is recorded on the ex-dividend date except for certain dividends from foreign securities where the dividend rate is not available. In such cases, the dividend is recorded as soon as the information is received by the Fund. Distributions to shareholders are recorded on the ex-dividend date and are determined according to income tax regulations (tax basis). Distributable earnings determined on a tax basis may differ from earnings recorded in accordance with U.S. GAAP. These differences may be permanent or temporary. Permanent differences are reclassified among capital accounts to reflect their tax character. These reclassifications have no impact on net
assets or the results of operations. Temporary differences are not reclassified, as they may reverse in subsequent periods.
Common expenses incurred by the Trust are allocated among the Funds based on the ratio of net assets of each Fund to the combined net assets of the Trust. Fund specific expenses are charged directly to the fund that incurred the expense.
Realized and unrealized gains and losses and net investment income, not including class specific expenses, are allocated daily to each class of shares based upon the relative proportion of net assets of each class. Differences in per share distributions, by class, are generally due to differences in class specific expenses.
g. Accounting Estimates
The preparation of financial statements in accordance with U.S. GAAP requires management to make estimates and assumptions that affect the reported amounts of assets and liabilities at the date of the financial statements and the amounts of income and expenses during the reporting period. Actual results could differ from those estimates.
h. Redemption Fees
Redemptions and exchanges of interests in an insurance company subaccount that invested in Class 3 shares of the Fund were subject to a 1.0% short term trading fee if the interest in the subaccount had been held for less than 60 days. Such fees were retained by the Fund and accounted for as an addition to paid-in capital, allocated to each class of shares based upon the relative proportion of net assets of each class. There were no redemption fees for the year.
i. Guarantees and Indemnifications
Under the Trust’s organizational documents, its officers and trustees are indemnified by the Trust against certain liabilities arising out of the performance of their duties to the Trust. Additionally, in the normal course of business, the Trust, on behalf of the Fund, enters into contracts with service providers that contain general indemnification clauses. The Trust’s maximum exposure under these arrangements is unknown as this would involve future claims that may be made against the Trust that have not yet occurred. Currently, the Trust expects the risk of loss to be remote.
FRANKLIN TEMPLETON VARIABLE INSURANCE PRODUCTS TRUST
NOTES TO FINANCIAL STATEMENTS
Templeton Developing Markets VIP Fund (continued)
2. Shares of Beneficial Interest
At December 31, 2015, there were an unlimited number of shares authorized (without par value). Transactions in the Fund’s shares were as follows:
| | | | | | | | | | | | | | | | | | |
| | | Year Ended December 31, | |
| | | 2015 | | | | | 2014 | |
| | | Shares | | | Amount | | | | | Shares | | | Amount | |
| | | | | |
| Class 1 Shares: | | | | | | | | | | | | | | | | | | |
Shares sold | | | 1,121,738 | | | $ | 9,288,141 | | | | | | 1,624,952 | | | $ | 16,226,245 | |
Shares issued in reinvestment of distributions | | | 1,921,727 | | | | 14,835,735 | | | | | | 229,681 | | | | 2,319,775 | |
Shares redeemed | | | (3,309,863 | ) | | | (27,352,757 | ) | | | | | (3,701,849 | ) | | | (37,106,215 | ) |
| | | | |
Net increase (decrease) | | | (266,398 | ) | | $ | (3,228,881 | ) | | | | | (1,847,216 | ) | | $ | (18,560,195 | ) |
| | | | |
| Class 2 Shares: | | | | | | | | | | | | | | | | | | |
Shares sold | | | 4,635,193 | | | $ | 35,599,642 | | | | | | 7,755,421 | | | $ | 76,467,757 | |
Shares issued in reinvestment of distributions | | | 4,430,114 | | | | 33,934,677 | | | | | | 434,143 | | | | 4,358,800 | |
Shares redeemed | | | (5,930,164 | ) | | | (47,986,302 | ) | | | | | (7,896,683 | ) | | | (78,546,164 | ) |
| | | | |
Net increase (decrease) | | | 3,135,143 | | | $ | 21,548,017 | | | | | | 292,881 | | | $ | 2,280,393 | |
| | | | |
| Class 3 Sharesa: | | | | | | | | | | | | | | | | | | |
Shares sold | | | | | | | | | | | | | 171,371 | | | $ | 1,697,483 | |
Shares redeemed | | | | | | | | | | | | | (3,593,907 | ) | | | (35,371,525 | ) |
| | | | | | | | | | | | | | |
Net increase (decrease) | | | | | | | | | | | | | (3,422,536 | ) | | $ | (33,674,042 | ) |
| | | | | | | | | | | | | | |
| Class 4 Shares: | | | | | | | | | | | | | | | | | | |
Shares sold | | | 96,241 | | | $ | 723,497 | | | | | | 89,395 | | | $ | 875,146 | |
Shares issued in reinvestment of distributions | | | 184,886 | | | | 1,421,771 | | | | | | 17,219 | | | | 173,399 | |
Shares redeemed | | | (364,639 | ) | | | (2,894,227 | ) | | | | | (395,412 | ) | | | (3,957,884 | ) |
| | | | |
Net increase (decrease) | | | (83,512 | ) | | $ | (748,959 | ) | | | | | (288,798 | ) | | $ | (2,909,339 | ) |
| | | | |
aEffective May 1, 2014, all Class 3 shares were converted to Class 2.
3. Transactions With Affiliates
Franklin Resources, Inc. is the holding company for various subsidiaries that together are referred to as Franklin Templeton Investments. Certain officers and trustees of the Fund are also officers and/or trustees of the following subsidiaries:
| | |
| Subsidiary | | Affiliation |
Templeton Asset Management Ltd. (TAML) | | Investment manager |
Franklin Templeton Services, LLC (FT Services) | | Administrative manager |
Franklin Templeton Distributors, Inc. (Distributors) | | Principal underwriter |
Franklin Templeton Investor Services, LLC (Investor Services) | | Transfer agent |
FRANKLIN TEMPLETON VARIABLE INSURANCE PRODUCTS TRUST
NOTES TO FINANCIAL STATEMENTS
Templeton Developing Markets VIP Fund (continued)
a. Management Fees
The Fund pays an investment management fee to TAML based on the average daily net assets of the Fund as follows:
| | |
| Annualized Fee Rate | | Net Assets |
1.250% | | Up to and including $200 million |
1.235% | | Over $200 million, up to and including $700 million |
1.200% | | Over $700 million, up to and including $1 billion |
1.150% | | Over $1 billion, up to and including $1.2 billion |
1.125% | | Over $1.2 billion, up to and including $5 billion |
1.075% | | Over $5 billion, up to and including $10 billion |
1.025% | | Over $10 billion, up to and including $15 billion |
0.975% | | Over $15 billion, up to and including $20 billion |
0.925% | | In excess of $20 billion |
b. Administrative Fees
Under an agreement with TAML, FT Services provides administrative services to the Fund. The fee is paid by TAML based on the Fund’s average daily net assets, and is not an additional expense of the Fund.
c. Distribution Fees
The Board has adopted distribution plans for Class 2 and Class 4 shares pursuant to Rule 12b-1 under the 1940 Act. Under the Fund’s compensation distribution plans, the Fund pays Distributors for costs incurred in connection with the servicing, sale and distribution of the Fund’s shares up to 0.25% and 0.35% per year of its average daily net assets of Class 2 and Class 4, respectively. The plan year, for purposes of monitoring compliance with the maximum annual plan rates, is February 1 through January 31.
d. Transfer Agent Fees
Investor Services, under terms of an agreement, performs shareholder servicing for the Fund and is not paid by the Fund for the services.
e. Investments in Affiliated Management Investment Companies
The Fund invests in an affiliated management investment company for purposes other than exercising a controlling influence over the management or policies. Management fees paid by the Fund are waived on assets invested in the affiliated management investment company, as noted in the Statement of Operations, in an amount not to exceed the management and administrative fees paid directly or indirectly by each affiliate. Prior to January 1, 2014, the waiver was accounted for as a reduction to management fees.
| | | | | | | | | | | | | | | | | | | | | | | | | | | | | | | | |
| | | Number
of Shares
Held at
Beginning
of Year | | | Gross
Additions | | | Gross
Reductions | | | Number
of Shares
Held at
End of
Year | | | Value at
End of
Year | | | Investment
Income | | | Realized
Gain
(Loss) | | | % of
Affiliated
Fund Shares
Outstanding
Held at End
of Year | |
| Non-Controlled Affiliates | | | | | | | | | | | | | | | | | | | | | | | | | | | | | | | | |
Institutional Fiduciary Trust Money Market Portfolio | | | 29,018,398 | | | | 147,819,607 | | | | (140,729,704 | ) | | | 36,108,301 | | | $ | 36,108,301 | | | $ | — | | | $ | — | | | | 0.18 | % |
| | | | | | | | | | | | | | | | | | | | | | | | |
f. Interfund Transactions
The Fund engaged in purchases and sales of investments with funds or other accounts that have a common investment manager (or affiliated investment managers), directors, trustees, or officers. These transactions complied with Rule 17a-7 under the 1940 Act. During the year ended December 31, 2015, the purchase and sale transactions aggregated $15,932,431 and $4,791,642, respectively.
FRANKLIN TEMPLETON VARIABLE INSURANCE PRODUCTS TRUST
NOTES TO FINANCIAL STATEMENTS
Templeton Developing Markets VIP Fund (continued)
4. Expense Offset Arrangement
The Fund has entered into an arrangement with its custodian whereby credits realized as a result of uninvested cash balances are used to reduce a portion of the Fund’s custodian expenses. During the year ended December 31, 2015, there were no credits earned.
5. Income Taxes
For tax purposes, capital losses may be carried over to offset future capital gains, if any.
At December 31, 2015, capital loss carryforwards were as follows:
| | | | |
Capital loss carryforwards not subject to expiration: | | | | |
Short term | | $ | 22,864,241 | |
Long term | | | 18,453,194 | |
| | | | |
Total capital loss carryforwards | | $ | 41,317,435 | |
| | | | |
The tax character of distributions paid during the years ended December 31, 2015 and 2014, was as follows:
| | | | | | | | |
| | | 2015 | | | 2014 | |
Distributions paid from: | | | | | | | | |
Ordinary income | | $ | 7,065,009 | | | $ | 6,851,974 | |
Long term capital gain | | | 43,127,174 | | | | — | |
| | | | |
| | $ | 50,192,183 | | | $ | 6,851,974 | |
| | | | |
At December 31, 2015, the cost of investments, net unrealized appreciation (depreciation) and undistributed ordinary income for income tax purposes were as follows:
| | | | |
Cost of investments | | $ | 290,270,246 | |
| | | | |
Unrealized appreciation | | $ | 26,814,133 | |
Unrealized depreciation | | | (40,228,051 | ) |
| | | | |
Net unrealized appreciation (depreciation) | | $ | (13,413,918 | ) |
| | | | |
Distributable earnings – undistributed ordinary income | | $ | 2,531,599 | |
| | | | |
Differences between income and/or capital gains as determined on a book basis and a tax basis are primarily due to differing treatments of corporate actions and wash sales.
6. Investment Transactions
Purchases and sales of investments (excluding short term securities) for the year ended December 31, 2015, aggregated $212,828,608 and $250,489,203, respectively.
7. Concentration of Risk
Investing in foreign securities may include certain risks and considerations not typically associated with investing in U.S. securities, such as fluctuating currency values and changing local and regional economic, political and social conditions, which may result in greater market volatility. In addition, certain foreign securities may not be as liquid as U.S. securities.
FRANKLIN TEMPLETON VARIABLE INSURANCE PRODUCTS TRUST
NOTES TO FINANCIAL STATEMENTS
Templeton Developing Markets VIP Fund (continued)
8. Credit Facility
The Fund, together with other U.S. registered and foreign investment funds (collectively, Borrowers), managed by Franklin Templeton Investments, are borrowers in a joint syndicated senior unsecured credit facility totaling $2 billion (Global Credit Facility) which matured on February 12, 2016. This Global Credit Facility provides a source of funds to the Borrowers for temporary and emergency purposes, including the ability to meet future unanticipated or unusually large redemption requests. Effective February 12, 2016, the Borrowers renewed the Global Credit Facility for a one year term, maturing February 10, 2017, for a total of $2 billion.
Under the terms of the Global Credit Facility, the Fund shall, in addition to interest charged on any borrowings made by the Fund and other costs incurred by the Fund, pay its share of fees and expenses incurred in connection with the implementation and maintenance of the Global Credit Facility, based upon its relative share of the aggregate net assets of all of the Borrowers, including an annual commitment fee of 0.07% based upon the unused portion of the Global Credit Facility. Effective February 12, 2016, the annual commitment fee is 0.15%. These fees are reflected in other expenses in the Statement of Operations. During the year ended December 31, 2015, the Fund did not use the Global Credit Facility.
9. Fair Value Measurements
The Fund follows a fair value hierarchy that distinguishes between market data obtained from independent sources (observable inputs) and the Fund’s own market assumptions (unobservable inputs). These inputs are used in determining the value of the Fund’s financial instruments and are summarized in the following fair value hierarchy:
| | • | | Level 1 – quoted prices in active markets for identical financial instruments |
| | • | | Level 2 – other significant observable inputs (including quoted prices for similar financial instruments, interest rates, prepayment speed, credit risk, etc.) |
| | • | | Level 3 – significant unobservable inputs (including the Fund’s own assumptions in determining the fair value of financial instruments) |
The input levels are not necessarily an indication of the risk or liquidity associated with financial instruments at that level.
For movements between the levels within the fair value hierarchy, the Fund has adopted a policy of recognizing the transfers as of the date of the underlying event which caused the movement.
A summary of inputs used as of December 31, 2015, in valuing the Fund’s assets carried at fair value, is as follows:
| | | | | | | | | | | | | | | | |
| | | Level 1 | | | Level 2 | | | Level 3 | | | Total | |
| | | | |
| Assets: | | | | | | | | | | | | | | | | |
Investments in Securities: | | | | | | | | | | | | | | | | |
Equity Investmentsa,b | | $ | 239,857,853 | | | $ | — | | | $ | — | | | $ | 239,857,853 | |
Participatory Notes | | | — | | | | 890,174 | | | | — | | | | 890,174 | |
Short Term Investments | | | 36,108,301 | | | | — | | | | — | | | | 36,108,301 | |
| | | | |
Total Investments in Securities | | $ | 275,966,154 | | | $ | 890,174 | | | $ | — | | | $ | 276,856,328 | |
| | | | |
aIncludes common and preferred stocks.
bFor detailed categories, see the accompanying Statement of Investments.
10. Subsequent Events
The Fund has evaluated subsequent events through the issuance of the financial statements and determined that no events have occurred that require disclosure other than those already disclosed in the financial statements.
FRANKLIN TEMPLETON VARIABLE INSURANCE PRODUCTS TRUST
NOTES TO FINANCIAL STATEMENTS
Templeton Developing Markets VIP Fund (continued)
Abbreviations
| | |
| Selected Portfolio |
| |
| ADR | | American Depositary Receipt |
| |
| GDR | | Global Depositary Receipt |
FRANKLIN TEMPLETON VARIABLE INSURANCE PRODUCTS TRUST
Report of Independent Registered Public Accounting Firm
Templeton Developing Markets VIP Fund
To the Board of Trustees and Shareholders of Franklin Templeton Variable Insurance Products Trust
In our opinion, the accompanying statement of assets and liabilities, including the statement of investments, and the related statements of operations and of changes in net assets and the financial highlights present fairly, in all material respects, the financial position of Templeton Developing Markets VIP Fund (the “Fund”) at December 31, 2015, the results of its operations for the year then ended, the changes in its net assets for each of the two years in the period then ended and the financial highlights for each of the periods presented, in conformity with accounting principles generally accepted in the United States of America. These financial statements and financial highlights (hereafter referred to as “financial statements”) are the responsibility of the Fund’s management. Our responsibility is to express an opinion on these financial statements based on our audit. We conducted our audit of these financial statements in accordance with the standards of the Public Company Accounting Oversight Board (United States). Those standards require that we plan and perform the audit to obtain reasonable assurance about whether the financial statements are free of material misstatement. An audit includes examining, on a test basis, evidence supporting the amounts and disclosures in the financial statements, assessing the accounting principles used and significant estimates made by management, and evaluating the overall financial statement presentation. We believe that our audit, which included confirmation of securities at December 31, 2015 by correspondence with the custodian, transfer agent and brokers, provides a reasonable basis for our opinion.
PricewaterhouseCoopers LLP
San Francisco, California
February 16, 2016
FRANKLIN TEMPLETON VARIABLE INSURANCE PRODUCTS TRUST
Tax Information (unaudited)
Templeton Developing Markets VIP Fund
Under Section 852(b)(3)(C) of the Internal Revenue Code (Code), the Fund hereby reports the maximum amount allowable but no less than $43,127,174 as long term capital gain dividends for the fiscal year ended December 31, 2015.
At December 31, 2015, more than 50% of the Fund’s total assets were invested in securities of foreign issuers. In most instances, foreign taxes were withheld from income paid to the Fund on these investments. The Fund elects to treat foreign taxes paid as allowed under Section 853 of the Code. This election will allow shareholders of record as of the 2016 distribution date, to treat their proportionate share of foreign taxes paid by the Fund as having been paid directly by them. The shareholder shall consider these amounts as foreign taxes paid in the tax year in which they receive the Fund distribution.
Templeton Foreign VIP Fund
This annual report for Templeton Foreign VIP Fund covers the fiscal year ended December 31, 2015.
Class 4 Performance Summary as of December 31, 2015
Average annual total return of Class 4 shares* represents the average annual change in value, assuming reinvestment of dividends and capital gains. Average returns smooth out variations in returns, which can be significant; they are not the same as year-by-year results.
| | | | | | | | | | | | |
| Periods ended 12/31/15 | | 1-Year | | | 5-Year | | | 10-Year | |
Average Annual Total Return | | | -6.65% | | | | +1.43% | | | | +2.94% | |
*For the period beginning 2/29/08, Class 4 performance reflects a 12b-1 fee expense of 0.35% per year, which affects future performance. Class 4 performance prior to 2/29/08 reflects historical Class 1 performance, which does not have a 12b-1 fee expense. Since 2/29/08 (effective date), the average annual total return of Class 4 shares was +0.41%. The Fund has a fee waiver associated with any investment in a Franklin Templeton money fund, contractually guaranteed through at least its current fiscal year-end. Fund investment results reflect the fee waiver, to the extent applicable; without this reduction, the results would have been lower.
Performance reflects the Fund’s Class 4 operating expenses, but does not include any contract fees, expenses or sales charges. If they had been included, performance would be lower. These charges and deductions, particularly for variable life policies, can have a significant effect on contract values and insurance benefits. See the contract prospectus for a complete description of these expenses, including sales charges.
Performance data represent past performance, which does not guarantee future results. Investment return and principal value will fluctuate, and you may have a gain or loss when you sell your shares. Current performance may differ from figures shown.
Total Return Index Comparison for a Hypothetical $10,000 Investment (1/1/06–12/31/15)
The graph below shows the change in value of a hypothetical $10,000 investment in the Fund over the indicated period and includes reinvestment of any income or distributions. The Fund’s performance* is compared to the performance of the MSCI Europe, Australasia, Far East (EAFE) Index. One cannot invest directly in an index, and an index is not representative of the Fund’s portfolio. Please see Important Notes to Performance Information preceding the Fund Summaries.
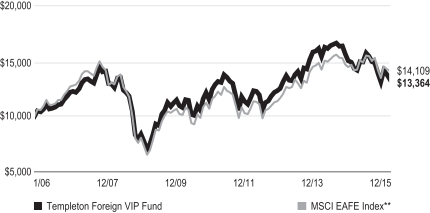
**Source: Morningstar. Please see Index Descriptions following the Fund Summaries.
TEMPLETON FOREIGN VIP FUND
Fund Goal and Main Investments
The Fund seeks long-term capital growth. Under normal market conditions, the Fund invests at least 80% of its net assets in investments of issuers located outside the U.S., including those in emerging markets.
Fund Risks
All investments involve risks, including possible loss of principal. Special risks are associated with foreign investing, including currency fluctuations, economic instability and political developments; investments in emerging markets involve heightened risks related to the same factors. In addition, smaller company stocks have historically experienced more price volatility than larger company stocks, especially over the short term. To the extent the Fund focuses on particular countries, regions, industries, sectors or types of investment from time to time, it may be subject to greater risks of adverse developments in such areas of focus than a fund that invests in a wider variety of countries, regions, industries, sectors or investments. The Fund is actively managed but there is no guarantee that the manager’s investment decisions will produce the desired results. The Fund’s prospectus also includes a description of the main investment risks.
Performance Overview
You can find the Fund’s one-year total return in the Performance Summary. In comparison, the Fund’s benchmark, the MSCI EAFE Index, had a -0.39% total return for the same period.1 Please note, index performance information is provided for reference and we do not attempt to track the index but rather undertake investments on the basis of fundamental research.
Economic and Market Overview
The global economy expanded moderately during the 12 months under review. As measured by the MSCI World Index, stocks in global developed markets overall were down slightly for the year amid some positive developments. Weighing on global stocks at times were worries about China’s slowing economy and tumbling stock market, declining commodity prices, geopolitical tensions between Russia and Turkey, and ongoing uncertainty over the U.S. Federal Reserve’s (Fed’s) timing for raising interest rates. Toward period-end, equity markets recovered somewhat as the Fed increased its federal funds target range for the first time in nine years, alleviating some uncertainty about a change in the U.S. monetary policy.
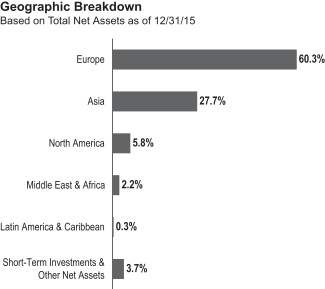
During the year, oil prices declined sharply largely due to increased global supply that exceeded demand. Gold and other commodity prices also fell. The U.S. dollar appreciated against most currencies during the period, which reduced returns of many foreign assets in U.S. dollar terms.
U.S. economic growth slowed in 2015’s first quarter but strengthened in 2015’s second quarter amid healthy consumer spending. The third and fourth quarters were less robust as exports slowed and state and local governments reduced their spending. At its December meeting, the Fed increased its target range for the federal funds rate to 0.25%–0.50%, as policymakers cited the labor market’s considerable improvement and were reasonably confident that inflation would move back to the Fed’s 2% medium-term objective. Furthermore, the Fed raised its forecast for 2016 U.S. economic growth and lowered its unemployment projections.
In Europe, U.K. economic growth gained momentum from the services sector, but the economy slowed in 2015 compared with 2014. The eurozone grew moderately and generally benefited during the period from lower oil prices, a weaker euro that supported exports, the European Central Bank’s (ECB’s) accommodative policy and expectations of further ECB stimulus. Although the eurozone’s annual inflation rate declined early in the period, it rose slightly during the rest of the period. The ECB maintained its benchmark interest rates although it reduced its bank deposit rate in December, seeking to boost the region’s slowing growth.
1. Source: Morningstar.
One cannot invest directly in an index, and an index is not representative of the Fund’s portfolio. Please see Index Descriptions following the Fund Summaries.
TEMPLETON FOREIGN VIP FUND
Japan’s economy continued to grow in 2015’s first quarter. After a decline in the second quarter of 2015, it expanded in the third quarter as capital expenditures improved. The Bank of Japan took several actions during the reporting period, including maintaining its monetary policy, lowering its economic growth and inflation forecasts, and reorganizing its stimulus program to increase exposure to long-term government bonds and exchange-traded funds.
In emerging markets, economic growth generally moderated. In China, the government’s intervention to cool domestic stock market speculation and its effective currency devaluation led to a severe slump in emerging market stocks from June through August. In October, emerging market equities gained after China expanded its monetary and fiscal stimulus to support its economy. Emerging equity markets recovered some of their losses after the Fed increased its target interest rate in December. Central bank actions varied across emerging markets during the 12 months under review, as some banks raised interest rates in response to rising inflation and weakening currencies, while others lowered interest rates to promote economic growth. In the recent global environment, emerging market stocks overall, as measured by the MSCI Emerging Markets Index, fell for the 12-month period.2
Investment Strategy
Our investment philosophy is bottom up, value oriented and long term. In choosing investments, we generally focus on the market price of a company’s securities relative to our evaluation of the company’s potential long-term earnings, asset value and cash flow. Among factors we consider are a company’s historical value measures, including price/earnings ratio, profit margins and liquidation value. We do in-depth research to construct a bargain list from which we buy.
Manager’s Discussion
During the 12-month period, the Fund underperformed its benchmark, the MSCI EAFE Index. Although the health care and materials sectors detracted overall, an overweighting in health care and an underweighting in materials helped mitigate the negative effects.3 In addition, a lack of exposure to the utilities sector contributed to the Fund’s relative performance.
Several individual holdings also supported relative returns. Significant contributors included automobile producer Nissan Motor (Japan) and financial exchange operator Deutsche Boerse (Germany). Nissan Motor reported strong U.S. sales, which rose
| | | | |
| Top 10 Holdings | |
| 12/31/15 | |
Company
Sector/Industry, Country | | % of Total
Net Assets | |
Samsung Electronics Co. Ltd. Technology Hardware, Storage & Peripherals, South Korea | | | 3.7% | |
BNP Paribas SA Banks, France | | | 2.4% | |
Credit Suisse Group AG Capital Markets, Switzerland | | | 2.4% | |
Teva Pharmaceutical Industries Ltd., ADR Pharmaceuticals, Israel | | | 2.2% | |
Nissan Motor Co. Ltd. Automobiles, Japan | | | 2.2% | |
GlaxoSmithKline PLC Pharmaceuticals, U.K. | | | 2.2% | |
Roche Holding AG Pharmaceuticals, Switzerland | | | 2.1% | |
AXA SA Insurance, France | | | 1.9% | |
Sanofi Pharmaceuticals, France | | | 1.8% | |
Hana Financial Group Inc. Banks, South Korea | | | 1.7% | |
The dollar value, number of shares or principal amount, and names of all portfolio holdings are listed in the Fund’s Statement of Investments (SOI).
during the period due to declining oil prices, an improved U.S. labor market and a weaker yen that made its exports more competitive. The company also raised its full-year 2016 forecast. Nissan’s sales rose during the holiday season in most segments, supported by price discounts. Deutsche Boerse’s earnings increased partly due to high trading volumes. The company also partnered with two Chinese exchanges. Near period-end, net revenue increased due to high market volatility as well as positive developments in custody and administration of securities. Teva Pharmaceutical Industries (Israel), provider of pharmaceutical services, experienced an increased share price after the company reported healthy first-quarter profits resulting from lower costs and robust sales of one its new generic drugs. Teva raised its full-year 2015 earnings forecast as it benefited from the acquisition of Allergan’s generic drug business, which improved the company’s market position. Other individual contributors included AXA (France), Lonza Group (Switzerland), Infineon Technologies (Germany), SBM Offshore (Netherlands), Capcom4 (Japan) and CRH (Ireland).
2. Please see Index Descriptions following the Fund Summaries.
3. The health care sector comprises biotechnology, health care equipment and supplies, health care providers and services, health care technology, life sciences tools and services, and pharmaceuticals in the SOI. The materials sector comprises chemicals, construction materials, containers and packaging, metals and mining, and paper and forest products in the SOI.
4. Not held at period-end.
TEMPLETON FOREIGN VIP FUND
In contrast, stock selection in financials hindered relative performance, notably South Korean bank Hana Financial Group.5 Hana shares were pressured after a court order suspended the merger between Hana’s banking entity with Korea Exchange Bank. However, they eventually merged later in the period. Hana’s third-quarter earnings fell due to costs surrounding the merger process. Other factors that weighed on the company’s stock price were South Korea’s slower economic growth, which was fueled by slower economic growth in China and a weaker Japanese yen, and the spread of a virus in South Korean hospitals.
Also hurting relative results was stock selection in consumer staples, particularly food and staples retailer Tesco (U.K.).6 Tesco shares gained in the first half of 2015, despite posting a huge loss, based on expectations that a new strategy would help improve the company’s market share and revenues. However, the firm reported a sharp before-tax profit decline for the first half of fiscal year 2016, along with falling revenues. The retailer also suffered a setback when it paid a significant amount to settle a U.S. lawsuit regarding an overstatement of commercial income.
An overweighting in the energy sector also held back relative returns, particularly Canadian oilfield services companies Trican Well Service4 (Canada) and Precision Drilling.7 During the period, energy stocks generally fell, as oil prices declined sharply due to larger inventories and strong global supply. Stock selection in telecommunication services, particularly in diversified telecommunication services, also weighed on relative performance.8 Positions in telecommunication services providers Telefonica (Spain) and off-benchmark China Telecom (China) hurt relative performance.
Other individual detractors included the Fund’s investments in mining company HudBay Minerals (Canada), steel manufacturer
POSCO (South Korea), electronics and computer peripherals manufacturer Samsung Electronics (South Korea) and solar photovoltaic company GCL-Poly Energy Holdings (Hong Kong).
From a geographic perspective, an overweighting in Israel and a single holding in off-benchmark Turkmenistan aided relative returns. In Europe, an underweighting in Spain and stock selection in Germany were beneficial. In contrast, an overweighting in China, exposure to off-benchmark South Korea and an underweighting in Japan led our Asian allocation to detract from relative returns. Further hurting performance was stock selection in Hong Kong. Our exposure to off-benchmark Canada, especially energy companies, also hurt relative performance. Stock selection in Europe, mainly investments in the U.K. and Italy, also detracted from results.
Thank you for your participation in Templeton Foreign VIP Fund. We look forward to serving your future investment needs.
The foregoing information reflects our analysis, opinions and portfolio holdings as of December 31, 2015, the end of the reporting period. The way we implement our main investment strategies and the resulting portfolio holdings may change depending on factors such as market and economic conditions. These opinions may not be relied upon as investment advice or an offer for a particular security. The information is not a complete analysis of every aspect of any market, country, industry, security or the Fund. Statements of fact are from sources considered reliable, but the investment manager makes no representation or warranty as to their completeness or accuracy. Although historical performance is no guarantee of future results, these insights may help you understand our investment management philosophy.
5. The financials sector comprises banks, capital markets, diversified financial services and insurance in the SOI.
6. The consumer staples sector comprises beverages and food and staples retailing in the SOI.
7. The energy sector comprises energy equipment and services; and oil, gas and consumable fuels in the SOI.
8. The telecommunication services sector comprises diversified telecommunication services and wireless telecommunication services in the SOI.
TEMPLETON FOREIGN VIP FUND
Class 4 Fund Expenses
As an investor in a variable insurance contract (Contract) that indirectly provides for investment in an underlying mutual fund, you can incur transaction and/or ongoing expenses at both the Fund level and the Contract level.
| • | | Transaction expenses can include sales charges (loads) on purchases, redemption fees, surrender fees, transfer fees and premium taxes. |
| • | | Ongoing expenses can include management fees, distribution and service (12b-1) fees, contract fees, annual maintenance fees, mortality and expense risk fees and other fees and expenses. All mutual funds and Contracts have some types of ongoing expenses. |
The expenses shown in the table are meant to highlight ongoing expenses at the Fund level only and do not include ongoing expenses at the Contract level, or transaction expenses at either the Fund or Contract level. While the Fund does not have transaction expenses, if the transaction and ongoing expenses at the Contract level were included, the expenses shown below would be higher. You should consult your Contract prospectus or disclosure document for more information.
The table shows Fund-level ongoing expenses and can help you understand these expenses and compare them with those of other mutual funds offered through the Contract. The table assumes a $1,000 investment held for the six months indicated. Please refer to the Fund prospectus for additional information on operating expenses.
Actual Fund Expenses
The first line (Actual) of the table provides actual account values and expenses. The “Ending Account Value” is derived from the Fund’s actual return, which includes the effect of ongoing Fund expenses, but does not include the effect of ongoing Contract expenses.
You can estimate the Fund-level expenses you incurred during the period by following these steps. Of course, your account value and expenses will differ from those in this illustration:
| 1. | Divide your account value by $1,000. |
If an account had an $8,600 value, then $8,600 ÷ $1,000 = 8.6.
| 2. | Multiply the result by the number under the heading “Fund-Level Expenses Incurred During Period.” |
If Fund-Level Expenses Incurred During Period were $7.50, then 8.6 × $7.50 = $64.50.
In this illustration, the estimated expenses incurred this period at the Fund level are $64.50.
Hypothetical Example for Comparison with Other Mutual Funds
Information in the second line (Hypothetical) of the table can help you compare ongoing expenses of the Fund with those of other mutual funds offered through the Contract. This information may not be used to estimate the actual ending account balance or expenses you incurred during the period. The hypothetical “Ending Account Value” is based on the Fund’s actual expense ratio and an assumed 5% annual rate of return before expenses, which does not represent the Fund’s actual return. The figure under the heading “Fund-Level Expenses Incurred During Period” shows the hypothetical expenses your account would have incurred under this scenario. You can compare this figure with the 5% hypothetical examples that appear in shareholder reports of other funds offered through a Contract.
| | | | | | | | | | | | |
| Class 4 | | Beginning Account Value 7/1/15 | | | Ending Account Value 12/31/15 | | | Fund-Level Expenses
Incurred During Period* 7/1/15–12/31/15 | |
Actual | | | $1,000 | | | | $ 894.30 | | | | $5.40 | |
Hypothetical (5% return before expenses) | | | $1,000 | | | | $1,019.51 | | | | $5.75 | |
*Expenses are calculated using the most recent six-month annualized expense ratio, net of expense waivers, for the Fund’s Class 4 shares (1.13%), which does not include any ongoing expenses of the Contract for which the Fund is an investment option, multiplied by the average account value over the period, multiplied by 184/365 to reflect the one-half year period.
FRANKLIN TEMPLETON VARIABLE INSURANCE PRODUCTS TRUST
Financial Highlights
Templeton Foreign VIP Fund
| | | | | | | | | | | | | | | | | | | | |
| | | Year Ended December 31, | |
| | | 2015 | | | 2014 | | | 2013 | | | 2012 | | | 2011 | |
| Class 1 | | | | | | | | | | | | | | | | | | | | |
Per share operating performance
(for a share outstanding throughout the year) | | | | | | | | | | | | | | | | | | | | |
| | | | | |
Net asset value, beginning of year | | | $15.34 | | | | $17.56 | | | | $14.63 | | | | $12.78 | | | | $14.54 | |
| | | | |
| | | | | |
| Income from investment operationsa: | | | | | | | | | | | | | | | | | | | | |
| | | | | |
Net investment incomeb | | | 0.31 | | | | 0.53 | c | | | 0.34 | | | | 0.38 | | | | 0.42 | |
| | | | | |
Net realized and unrealized gains (losses) | | | (1.16 | ) | | | (2.39 | ) | | | 3.00 | | | | 1.91 | | | | (1.90 | ) |
| | | | |
Total from investment operations | | | (0.85 | ) | | | (1.86 | ) | | | 3.34 | | | | 2.29 | | | | (1.48 | ) |
| | | | |
| | | | | |
| Less distributions from: | | | | | | | | | | | | | | | | | | | | |
| | | | | |
Net investment income | | | (0.53 | ) | | | (0.36 | ) | | | (0.41 | ) | | | (0.44 | ) | | | (0.28 | ) |
| | | | | |
Net realized gains | | | (0.50 | ) | | | — | | | | — | | | | — | | | | — | |
| | | | |
Total distributions | | | (1.03 | ) | | | (0.36 | ) | | | (0.41 | ) | | | (0.44 | ) | | | (0.28 | ) |
| | | | |
Redemption fees | | | — | | | | — | d | | | — | d | | | — | d | | | — | d |
| | | | |
Net asset value, end of year | | | $13.46 | | | | $15.34 | | | | $17.56 | | | | $14.63 | | | | $12.78 | |
| | | | |
| | | | | |
Total returne | | | (6.31)% | | | | (10.89)% | | | | 23.27% | | | | 18.60% | | | | (10.44)% | |
| | | | | |
| Ratios to average net assets | | | | | | | | | | | | | | | | | | | | |
| | | | | |
Expenses | | | 0.78% | f | | | 0.77% | f | | | 0.78% | | | | 0.79% | | | | 0.79% | g |
| | | | | |
Net investment income | | | 2.05% | | | | 3.11% | c | | | 2.16% | | | | 2.84% | | | | 2.92% | |
| | | | | |
| Supplemental data | | | | | | | | | | | | | | | | | | | | |
| | | | | |
Net assets, end of year (000’s) | | | $214,172 | | | | $248,355 | | | | $298,468 | | | | $265,924 | | | | $254,292 | |
| | | | | |
Portfolio turnover rate | | | 15.15% | | | | 25.71% | | | | 23.61% | | | | 12.53% | | | | 21.09% | |
aThe amount shown for a share outstanding throughout the period may not correlate with the Statement of Operations for the period due to the timing of sales and repurchases of the Fund’s shares in relation to income earned and/or fluctuating fair value of the investments of the Fund.
bBased on average daily shares outstanding.
cNet investment income per share includes approximately $0.16 per share related to income received in the form of special dividends in connection with certain Fund holdings. Excluding this amount, the ratio of net investment income to average net assets would have been 2.13%.
dAmount rounds to less than $0.01 per share.
eTotal return does not include fees, charges or expenses imposed by the variable annuity and life insurance contracts for which Franklin Templeton Variable Insurance Products Trust serves as an underlying investment vehicle.
fBenefit of waiver and payments by affiliates rounds to less than 0.01%.
gBenefit of expense reduction rounds to less than 0.01%.
| | | | |
| TF-6 | | Annual Report | The accompanying notes are an integral part of these financial statements. | | |
FRANKLIN TEMPLETON VARIABLE INSURANCE PRODUCTS TRUST
FINANCIAL HIGHLIGHTS
Templeton Foreign VIP Fund (continued)
| | | | | | | | | | | | | | | | | | | | |
| | | Year Ended December 31, | |
| | | 2015 | | | 2014 | | | 2013 | | | 2012 | | | 2011 | |
| Class 2 | | | | | | | | | | | | | | | | | | | | |
Per share operating performance
(for a share outstanding throughout the year) | | | | | | | | | | | | | | | | | | | | |
| | | | | |
Net asset value, beginning of year | | | $15.05 | | | | $17.24 | | | | $14.37 | | | | $12.56 | | | | $14.29 | |
| | | | |
| | | | | |
| Income from investment operationsa: | | | | | | | | | | | | | | | | | | | | |
| | | | | |
Net investment incomeb | | | 0.27 | | | | 0.48 | c | | | 0.30 | | | | 0.34 | | | | 0.37 | |
| | | | | |
Net realized and unrealized gains (losses) | | | (1.13 | ) | | | (2.35 | ) | | | 2.94 | | | | 1.87 | | | | (1.86 | ) |
| | | | |
Total from investment operations | | | (0.86 | ) | | | (1.87 | ) | | | 3.24 | | | | 2.21 | | | | (1.49 | ) |
| | | | |
| | | | | |
| Less distributions from: | | | | | | | | | | | | | | | | | | | | |
| | | | | |
Net investment income | | | (0.49 | ) | | | (0.32 | ) | | | (0.37 | ) | | | (0.40 | ) | | | (0.24 | ) |
| | | | | |
Net realized gains | | | (0.50 | ) | | | — | | | | — | | | | — | | | | — | |
| | | | |
Total distributions | | | (0.99 | ) | | | (0.32 | ) | | | (0.37 | ) | | | (0.40 | ) | | | (0.24 | ) |
| | | | |
Redemption fees | | | — | | | | — | d | | | — | d | | | — | d | | | — | d |
| | | | |
Net asset value, end of year | | | $13.20 | | | | $15.05 | | | | $17.24 | | | | $14.37 | | | | $12.56 | |
| | | | |
| | | | | |
Total returne | | | (6.49)% | | | | (11.13)% | | | | 22.97% | | | | 18.23% | | | | (10.63)% | |
| | | | | |
| Ratios to average net assets | | | | | | | | | | | | | | | | | | | | |
| | | | | |
Expenses | | | 1.03% | f | | | 1.02% | f | | | 1.03% | | | | 1.04% | | | | 1.04% | g |
| | | | | |
Net investment income | | | 1.80% | | | | 2.86% | c | | | 1.91% | | | | 2.59% | | | | 2.67% | |
| | | | | |
| Supplemental data | | | | | | | | | | | | | | | | | | | | |
| | | | | |
Net assets, end of year (000’s) | | | $1,456,854 | | | | $1,645,571 | | | | $1,873,586 | | | | $1,744,231 | | | | $1,679,412 | |
| | | | | |
Portfolio turnover rate | | | 15.15% | | | | 25.71% | | | | 23.61% | | | | 12.53% | | | | 21.09% | |
aThe amount shown for a share outstanding throughout the period may not correlate with the Statement of Operations for the period due to the timing of sales and repurchases of the Fund’s shares in relation to income earned and/or fluctuating fair value of the investments of the Fund.
bBased on average daily shares outstanding.
cNet investment income per share includes approximately $0.16 per share related to income received in the form of special dividends in connection with certain Fund holdings. Excluding this amount, the ratio of net investment income to average net assets would have been 1.88%.
dAmount rounds to less than $0.01 per share.
eTotal return does not include fees, charges or expenses imposed by the variable annuity and life insurance contracts for which Franklin Templeton Variable Insurance Products Trust serves as an underlying investment vehicle.
fBenefit of waiver and payments by affiliates rounds to less than 0.01%.
gBenefit of expense reduction rounds to less than 0.01%.
| | | | | | |
| | | The accompanying notes are an integral part of these financial statements. | Annual Report | | | TF-7 | |
FRANKLIN TEMPLETON VARIABLE INSURANCE PRODUCTS TRUST
FINANCIAL HIGHLIGHTS
Templeton Foreign VIP Fund (continued)
| | | | | | | | | | | | | | | | | | | | |
| | | Year Ended December 31, | |
| | | 2015 | | | 2014 | | | 2013 | | | 2012 | | | 2011 | |
| Class 4 | | | | | | | | | | | | | | | | | | | | |
Per share operating performance
(for a share outstanding throughout the year) | | | | | | | | | | | | | | | | | | | | |
| | | | | |
Net asset value, beginning of year | | | $15.16 | | | | $17.37 | | | | $14.48 | | | | $12.66 | | | | $14.43 | |
| | | | |
| | | | | |
| Income from investment operationsa: | | | | | | | | | | | | | | | | | | | | |
| | | | | |
Net investment incomeb | | | 0.25 | | | | 0.46 | c | | | 0.28 | | | | 0.33 | | | | 0.36 | |
| | | | | |
Net realized and unrealized gains (losses) | | | (1.14 | ) | | | (2.36 | ) | | | 2.97 | | | | 1.89 | | | | (1.88 | ) |
| | | | |
Total from investment operations | | | (0.89 | ) | | | (1.90 | ) | | | 3.25 | | | | 2.22 | | | | (1.52 | ) |
| | | | |
| | | | | |
| Less distributions from: | | | | | | | | | | | | | | | | | | | | |
| | | | | |
Net investment income | | | (0.48 | ) | | | (0.31 | ) | | | (0.36 | ) | | | (0.40 | ) | | | (0.25 | ) |
| | | | | |
Net realized gains | | | (0.50 | ) | | | — | | | | — | | | | — | | | | — | |
| | | | |
Total distributions | | | (0.98 | ) | | | (0.31 | ) | | | (0.36 | ) | | | (0.40 | ) | | | (0.25 | ) |
| | | | |
Redemption fees | | | — | | | | — | d | | | — | d | | | — | d | | | — | d |
| | | | |
Net asset value, end of year | | | $13.29 | | | | $15.16 | | | | $17.37 | | | | $14.48 | | | | $12.66 | |
| | | | |
| | | | | |
Total returne | | | (6.65)% | | | | (11.22)% | | | | 22.86% | | | | 18.14% | | | | (10.74)% | |
| | | | | |
| Ratios to average net assets | | | | | | | | | | | | | | | | | | | | |
| | | | | |
Expenses | | | 1.13% | f | | | 1.12% | f | | | 1.13% | | | | 1.14% | | | | 1.14% | g |
| | | | | |
Net investment income | | | 1.70% | | | | 2.76% | c | | | 1.81% | | | | 2.49% | | | | 2.57% | |
| | | | | |
| Supplemental data | | | | | | | | | | | | | | | | | | | | |
| | | | | |
Net assets, end of year (000’s) | | | $472,189 | | | | $503,143 | | | | $513,098 | | | | $416,277 | | | | $353,346 | |
| | | | | |
Portfolio turnover rate | | | 15.15% | | | | 25.71% | | | | 23.61% | | | | 12.53% | | | | 21.09% | |
aThe amount shown for a share outstanding throughout the period may not correlate with the Statement of Operations for the period due to the timing of sales and repurchases of the Fund’s shares in relation to income earned and/or fluctuating fair value of the investments of the Fund.
bBased on average daily shares outstanding.
cNet investment income per share includes approximately $0.16 per share related to income received in the form of special dividends in connection with certain Fund holdings. Excluding this amount, the ratio of net investment income to average net assets would have been 1.78%.
dAmount rounds to less than $0.01 per share.
eTotal return does not include fees, charges or expenses imposed by the variable annuity and life insurance contracts for which Franklin Templeton Variable Insurance Products Trust serves as an underlying investment vehicle.
fBenefit of waiver and payments by affiliates rounds to less than 0.01%.
gBenefit of expense reduction rounds to less than 0.01%.
| | | | |
| TF-8 | | Annual Report | The accompanying notes are an integral part of these financial statements. | | |
FRANKLIN TEMPLETON VARIABLE INSURANCE PRODUCTS TRUST
Statement of Investments, December 31, 2015
| | | | | | | | | | | | | | |
Templeton Foreign VIP Fund | | | | |
| | | | | Country | | | Shares/Rights | | | Value | |
| | | | | | | | | | | | | | |
| | Common Stocks and Other Equity Interests 96.3% | | | | | | | | | |
| | Aerospace & Defense 1.2% | | | | | | | | | | | | |
| | BAE Systems PLC | | | United Kingdom | | | | 3,520,780 | | | $ | 25,926,509 | |
| | | | | | | | | | | | | | |
| | Airlines 0.9% | | | | | | | | | | | | |
| a | | Deutsche Lufthansa AG | | | Germany | | | | 1,235,150 | | | | 19,541,594 | |
| | | | | | | | | | | | | | |
| | Auto Components 2.6% | | | | | | | | | | | | |
| | Cie Generale des Etablissements Michelin, B | | | France | | | | 308,070 | | | | 29,414,947 | |
| | Hyundai Mobis Co. Ltd. | | | South Korea | | | | 121,198 | | | | 25,419,087 | |
| | | | | | | | | | | | | | |
| | | | | | | | | | | | | 54,834,034 | |
| | | | | | | | | | | | | | |
| | Automobiles 4.0% | | | | | | | | | | | | |
| | Hero Motocorp Ltd. | | | India | | | | 199,386 | | | | 8,113,491 | |
| | Hyundai Motor Co. | | | South Korea | | | | 102,386 | | | | 12,979,991 | |
| | Nissan Motor Co. Ltd. | | | Japan | | | | 4,424,800 | | | | 47,102,888 | |
| | Toyota Motor Corp., ADR | | | Japan | | | | 136,317 | | | | 16,772,444 | |
| | | | | | | | | | | | | | |
| | | | | | | | | | | | | 84,968,814 | |
| | | | | | | | | | | | | | |
| | Banks 13.3% | | | | | | | | | | | | |
| | Bangkok Bank PCL, fgn. | | | Thailand | | | | 3,061,900 | | | | 13,129,713 | |
| | Barclays PLC | | | United Kingdom | | | | 5,594,600 | | | | 18,050,845 | |
| | BNP Paribas SA | | | France | | | | 918,660 | | | | 52,120,025 | |
| | DBS Group Holdings Ltd. | | | Singapore | | | | 510,520 | | | | 6,009,295 | |
| | Hana Financial Group Inc. | | | South Korea | | | | 1,860,993 | | | | 37,368,383 | |
| | HSBC Holdings PLC | | | United Kingdom | | | | 4,106,000 | | | | 32,741,405 | |
| | ING Groep NV, IDR | | | Netherlands | | | | 928,374 | | | | 12,555,156 | |
| | KB Financial Group Inc., ADR | | | South Korea | | | | 1,216,406 | | | | 33,901,235 | |
| | Societe Generale SA | | | France | | | | 400,690 | | | | 18,528,571 | |
| | Standard Chartered PLC | | | United Kingdom | | | | 2,032,611 | | | | 16,888,265 | |
| | UniCredit SpA | | | Italy | | | | 5,453,081 | | | | 30,416,706 | |
| | United Overseas Bank Ltd. | | | Singapore | | | | 1,007,200 | | | | 13,929,891 | |
| | | | | | | | | | | | | | |
| | | | | | | | | | | | | 285,639,490 | |
| | | | | | | | | | | | | | |
| | Beverages 0.8% | | | | | | | | | | | | |
| | Suntory Beverage & Food Ltd. | | | Japan | | | | 386,100 | | | | 17,089,330 | |
| | | | | | | | | | | | | | |
| | Building Products 1.1% | | | | | | | | | | | | |
| | Compagnie de Saint-Gobain | | | France | | | | 539,170 | | | | 23,339,085 | |
| | | | | | | | | | | | | | |
| | Capital Markets 2.9% | | | | | | | | | | | | |
| | Credit Suisse Group AG | | | Switzerland | | | | 2,331,942 | | | | 50,478,864 | |
| | GAM Holding Ltd. | | | Switzerland | | | | 654,050 | | | | 10,900,834 | |
| | | | | | | | | | | | | | |
| | | | | | | | | | | | | 61,379,698 | |
| | | | | | | | | | | | | | |
| | Chemicals 0.5% | | | | | | | | | | | | |
| | Johnson Matthey PLC | | | United Kingdom | | | | 268,900 | | | | 10,530,890 | |
| | | | | | | | | | | | | | |
| | Construction & Engineering 1.4% | | | | | | | | | | | | |
| | Carillion PLC | | | United Kingdom | | | | 3,835,100 | | | | 17,122,166 | |
| | Sinopec Engineering Group Co. Ltd. | | | China | | | | 15,387,500 | | | | 13,143,649 | |
| | | | | | | | | | | | | | |
| | | | | | | | | | | | | 30,265,815 | |
| | | | | | | | | | | | | | |
| | Construction Materials 1.1% | | | | | | | | | | | | |
| | CRH PLC | | | Ireland | | | | 829,830 | | | | 24,067,455 | |
| | | | | | | | | | | | | | |
FRANKLIN TEMPLETON VARIABLE INSURANCE PRODUCTS TRUST
STATEMENT OF INVESTMENTS
Templeton Foreign VIP Fund (continued)
| | | | | | | | | | | | | | |
| | | | | Country | | | Shares/Rights | | | Value | |
| | | | | | | | | | | | | | |
| | Common Stocks and Other Equity Interests (continued) | | | | | | | | | |
| | Diversified Financial Services 1.1% | | | | | | | | | | | | |
| | BM&F BOVESPA SA | | | Brazil | | | | 2,239,000 | | | $ | 6,156,006 | |
| | Deutsche Boerse AG | | | Germany | | | | 208,640 | | | | 18,445,839 | |
| | | | | | | | | | | | | | |
| | | | | | | | | | | | | 24,601,845 | |
| | | | | | | | | | | | | | |
| | Diversified Telecommunication Services 3.1% | | | | | | | | | | | | |
| | China Telecom Corp. Ltd., H | | | China | | | | 53,618,357 | | | | 25,182,844 | |
| | Telefonica SA, ADR | | | Spain | | | | 2,390,332 | | | | 26,437,072 | |
| | Telenor ASA | | | Norway | | | | 948,934 | | | | 15,914,653 | |
| | | | | | | | | | | | | | |
| | | | | | | | | | | | | 67,534,569 | |
| | | | | | | | | | | | | | |
| | Electrical Equipment 1.0% | | | | | | | | | | | | |
| | ABB Ltd. | | | Switzerland | | | | 1,152,880 | | | | 20,664,396 | |
| | | | | | | | | | | | | | |
| | Electronic Equipment, Instruments & Components 0.9% | | | | | | | | | | | | |
| | Kingboard Chemical Holdings Ltd. | | | Hong Kong | | | | 11,646,000 | | | | 18,573,132 | |
| | | | | | | | | | | | | | |
| | Energy Equipment & Services 6.4% | | | | | | | | | | | | |
| | Ensign Energy Services Inc. | | | Canada | | | | 2,009,500 | | | | 10,720,820 | |
| | Petrofac Ltd. | | | United Kingdom | | | | 2,312,160 | | | | 27,127,744 | |
| | Precision Drilling Corp. | | | Canada | | | | 4,296,000 | | | | 16,987,725 | |
| a | | SBM Offshore NV | | | Netherlands | | | | 2,879,260 | | | | 36,467,771 | |
| a | | Subsea 7 SA | | | United Kingdom | | | | 2,173,050 | | | | 15,494,402 | |
| | Technip SA | | | France | | | | 618,280 | | | | 30,715,930 | |
| | | | | | | | | | | | | | |
| | | | | | | | | | | | | 137,514,392 | |
| | | | | | | | | | | | | | |
| | Food & Staples Retailing 2.4% | | | | | | | | | | | | |
| | Metro AG | | | Germany | | | | 500,660 | | | | 16,075,967 | |
| a | | Tesco PLC | | | United Kingdom | | | | 16,164,250 | | | | 35,618,816 | |
| | | | | | | | | | | | | | |
| | | | | | | | | | | | | 51,694,783 | |
| | | | | | | | | | | | | | |
| | Health Care Equipment & Supplies 0.9% | | | | | | | | | | | | |
| | Getinge AB, B | | | Sweden | | | | 737,270 | | | | 19,426,887 | |
| | | | | | | | | | | | | | |
| | Health Care Providers & Services 1.6% | | | | | | | | | | | | |
| | Shanghai Pharmaceuticals Holding Co. Ltd., H | | | China | | | | 6,579,500 | | | | 14,245,403 | |
| | Sinopharm Group Co. | | | China | | | | 5,173,200 | | | | 20,759,149 | |
| | | | | | | | | | | | | | |
| | | | | | | | | | | | | 35,004,552 | |
| | | | | | | | | | | | | | |
| | Household Durables 0.2% | | | | | | | | | | | | |
| | Haier Electronics Group Co. Ltd. | | | China | | | | 1,668,300 | | | | 3,383,893 | |
| | | | | | | | | | | | | | |
| | Industrial Conglomerates 1.1% | | | | | | | | | | | | |
| | Siemens AG | | | Germany | | | | 238,364 | | | | 23,271,990 | |
| | | | | | | | | | | | | | |
| | Insurance 8.3% | | | | | | | | | | | | |
| | ACE Ltd. | | | United States | | | | 233,899 | | | | 27,331,098 | |
| | Aegon NV | | | Netherlands | | | | 4,546,720 | | | | 25,830,314 | |
| | Aviva PLC | | | United Kingdom | | | | 3,272,090 | | | | 24,886,147 | |
| | AXA SA | | | France | | | | 1,495,318 | | | | 40,980,815 | |
| | China Life Insurance Co. Ltd., H | | | China | | | | 5,057,000 | | | | 16,377,838 | |
| | Muenchener Rueckversicherungs-Gesellschaft AG | | | Germany | | | | 69,590 | | | | 13,950,529 | |
| | NN Group NV | | | Netherlands | | | | 463,600 | | | | 16,391,708 | |
| | Swiss Re AG | | | Switzerland | | | | 133,120 | | | | 13,039,649 | |
| | | | | | | | | | | | | | |
| | | | | | | | | | | | | 178,788,098 | |
| | | | | | | | | | | | | | |
FRANKLIN TEMPLETON VARIABLE INSURANCE PRODUCTS TRUST
STATEMENT OF INVESTMENTS
Templeton Foreign VIP Fund (continued)
| | | | | | | | | | | | | | |
| | | | | Country | | | Shares/Rights | | | Value | |
| | | | | | | | | | | | | | |
| | Common Stocks and Other Equity Interests (continued) | | | | | | | | | |
| | Life Sciences Tools & Services 2.3% | | | | | | | | | | | | |
| | Lonza Group AG | | | Switzerland | | | | 82,710 | | | $ | 13,463,075 | |
| a | | MorphoSys AG | | | Germany | | | | 195,900 | | | | 12,267,711 | |
| a | | QIAGEN NV | | | Netherlands | | | | 829,071 | | | | 22,618,025 | |
| | | | | | | | | | | | | | |
| | | | | | | | | | | | | 48,348,811 | |
| | | | | | | | | | | | | | |
| | Metals & Mining 3.7% | | | | | | | | | | | | |
| | Barrick Gold Corp. | | | Canada | | | | 1,328,790 | | | | 9,806,470 | |
| | Glencore PLC | | | Switzerland | | | | 10,884,600 | | | | 14,516,028 | |
| | HudBay Minerals Inc. | | | Canada | | | | 2,956,000 | | | | 11,347,039 | |
| | POSCO | | | South Korea | | | | 139,987 | | | | 19,831,224 | |
| | Silver Wheaton Corp. | | | Canada | | | | 1,858,400 | | | | 23,107,410 | |
| | | | | | | | | | | | | | |
| | | | | | | | | | | | | 78,608,171 | |
| | | | | | | | | | | | | | |
| | Multiline Retail 1.5% | | | | | | | | | | | | |
| | Marks & Spencer Group PLC | | | United Kingdom | | | | 4,863,720 | | | | 32,432,012 | |
| | | | | | | | | | | | | | |
| | Oil, Gas & Consumable Fuels 6.9% | | | | | | | | | | | | |
| | BP PLC | | | United Kingdom | | | | 5,586,215 | | | | 29,147,656 | |
| | Eni SpA | | | Italy | | | | 1,349,435 | | | | 20,228,368 | |
| | Kunlun Energy Co. Ltd. | | | China | | | | 9,276,000 | | | | 8,258,472 | |
| | LUKOIL PJSC, ADR | | | Russia | | | | 160,535 | | | | 5,169,227 | |
| | Royal Dutch Shell PLC, A | | | United Kingdom | | | | 16,803 | | | | 377,941 | |
| | Royal Dutch Shell PLC, B | | | United Kingdom | | | | 1,118,873 | | | | 25,446,582 | |
| | Suncor Energy Inc. | | | Canada | | | | 922,000 | | | | 23,808,169 | |
| | Total SA, B | | | France | | | | 781,006 | | | | 35,007,895 | |
| | | | | | | | | | | | | | |
| | | | | | | | | | | | | 147,444,310 | |
| | | | | | | | | | | | | | |
| | Pharmaceuticals 12.4% | | | | | | | | | | | | |
| | Bayer AG | | | Germany | | | | 216,810 | | | | 27,272,042 | |
| | GlaxoSmithKline PLC | | | United Kingdom | | | | 2,297,355 | | | | 46,492,337 | |
| | Merck KGaA | | | Germany | | | | 238,710 | | | | 23,225,388 | |
| | Novartis AG | | | Switzerland | | | | 252,140 | | | | 21,842,068 | |
| | Roche Holding AG | | | Switzerland | | | | 163,370 | | | | 45,065,337 | |
| | Sanofi | | | France | | | | 455,845 | | | | 38,919,704 | |
| | Teva Pharmaceutical Industries Ltd., ADR | | | Israel | | | | 728,858 | | | | 47,842,239 | |
| | UCB SA | | | Belgium | | | | 164,360 | | | | 14,859,555 | |
| | | | | | | | | | | | | | |
| | | | | | | | | | | | | 265,518,670 | |
| | | | | | | | | | | | | | |
| | Semiconductors & Semiconductor Equipment 2.0% | | | | | | | | | | | | |
| | GCL-Poly Energy Holdings Ltd. | | | China | | | | 141,417,000 | | | | 21,348,992 | |
| a | | GCL-Poly Energy Holdings Ltd., rts., 1/20/16 | | | China | | | | 28,283,400 | | | | 182,470 | |
| | Infineon Technologies AG | | | Germany | | | | 764,445 | | | | 11,214,260 | |
| | MediaTek Inc. | | | Taiwan | | | | 1,339,000 | | | | 10,169,826 | |
| | | | | | | | | | | | | | |
| | | | | | | | | | | | | 42,915,548 | |
| | | | | | | | | | | | | | |
| | Specialty Retail 1.0% | | | | | | | | | | | | |
| | Kingfisher PLC | | | United Kingdom | | | | 4,245,246 | | | | 20,617,738 | |
| | | | | | | | | | | | | | |
| | Technology Hardware, Storage & Peripherals 4.8% | | | | | | | | | | | | |
| | CANON Inc. | | | Japan | | | | 533,600 | | | | 16,314,988 | |
| | Konica Minolta Inc. | | | Japan | | | | 883,700 | | | | 8,984,412 | |
| | Samsung Electronics Co. Ltd. | | | South Korea | | | | 73,014 | | | | 78,275,213 | |
| | | | | | | | | | | | | | |
| | | | | | | | | | | | | 103,574,613 | |
| | | | | | | | | | | | | | |
FRANKLIN TEMPLETON VARIABLE INSURANCE PRODUCTS TRUST
STATEMENT OF INVESTMENTS
Templeton Foreign VIP Fund (continued)
| | | | | | | | | | | | | | |
| | | | | Country | | | Shares/Rights | | | Value | |
| | | | | | | | | | | | | | |
| | Common Stocks and Other Equity Interests (continued) | | | | | | | | | |
| | Trading Companies & Distributors 1.9% | | | | | | | | | | | | |
| | Daewoo International Corp. | | | South Korea | | | | 507,984 | | | $ | 7,066,679 | |
| | ITOCHU Corp. | | | Japan | | | | 2,902,500 | | | | 34,821,789 | |
| | | | | | | | | | | | | | |
| | | | | | | | | | | | | 41,888,468 | |
| | | | | | | | | | | | | | |
| | Wireless Telecommunication Services 3.0% | | | | | | | | | | | | |
| | China Mobile Ltd. | | | China | | | | 1,370,500 | | | | 15,473,087 | |
| | SoftBank Group Corp. | | | Japan | | | | 586,900 | | | | 29,976,115 | |
| | Vodafone Group PLC, ADR | | | United Kingdom | | | | 562,353 | | | | 18,141,508 | |
| | | | | | | | | | | | | | |
| | | | | | | | | | | | | 63,590,710 | |
| | | | | | | | | | | | | | |
| | | | |
| | Total Common Stocks and Other Equity Interests
(Cost $2,129,442,360) | | | | | | | | | | | 2,062,980,302 | |
| | | | | | | | | | | | | | |
| | Short Term Investments (Cost $71,421,269) 3.3% | | | | | | | | | | | | |
| | Money Market Funds 3.3% | | | | | | | | | | | | |
| a,b | | Institutional Fiduciary Trust Money Market Portfolio | | | United States | | | | 71,421,269 | | | | 71,421,269 | |
| | | | | | | | | | | | | | |
| | Total Investments (Cost $2,200,863,629) 99.6% | | | | | | | | | | | 2,134,401,571 | |
| | Other Assets, less Liabilities 0.4% | | | | | | | | | | | 8,813,058 | |
| | | | | | | | | | | | | | |
| | Net Assets 100.0% | | | | | | | | | | $ | 2,143,214,629 | |
| | | | | | | | | | | | | | |
See Abbreviations on page TF-23.
aNon-income producing.
bSee Note 3(e) regarding investments in affiliated management investment companies.
| | | | |
| TF-12 | | Annual Report | The accompanying notes are an integral part of these financial statements. | | |
FRANKLIN TEMPLETON VARIABLE INSURANCE PRODUCTS TRUST
Financial Statements
Statement of Assets and Liabilities
December 31, 2015
| | | | |
| | | Templeton
Foreign VIP
Fund | |
Assets: | | | | |
Investments in securities: | | | | |
Cost - Unaffiliated issuers | | $ | 2,129,442,360 | |
Cost - Non-controlled affiliates (Note 3e) | | | 71,421,269 | |
| | | | |
Total cost of investments | | $ | 2,200,863,629 | |
| | | | |
Value - Unaffiliated issuers | | $ | 2,062,980,302 | |
Value - Non-controlled affiliates (Note 3e) | | | 71,421,269 | |
| | | | |
Total value of investments | | | 2,134,401,571 | |
Cash | | | 1,727,122 | |
Receivables: | | | | |
Capital shares sold | | | 5,650,820 | |
Dividends | | | 4,181,297 | |
Other assets | | | 911,455 | |
| | | | |
Total assets | | | 2,146,872,265 | |
| | | | |
Liabilities: | | | | |
Payables: | | | | |
Investment securities purchased | | | 196,410 | |
Capital shares redeemed | | | 675,005 | |
Management fees | | | 1,370,401 | |
Distribution fees | | | 905,256 | |
Reports to shareholders | | | 252,436 | |
Deferred tax | | | 88,494 | |
Accrued expenses and other liabilities | | | 169,634 | |
| | | | |
Total liabilities | | | 3,657,636 | |
| | | | |
Net assets, at value | | $ | 2,143,214,629 | |
| | | | |
Net assets consist of: | | | | |
Paid-in capital | | $ | 2,135,192,485 | |
Undistributed net investment income | | | 42,293,744 | |
Net unrealized appreciation (depreciation) | | | (66,683,600 | ) |
Accumulated net realized gain (loss) | | | 32,412,000 | |
| | | | |
Net assets, at value | | $ | 2,143,214,629 | |
| | | | |
| | | | | | |
| | | The accompanying notes are an integral part of these financial statements. | Annual Report | | | TF-13 | |
FRANKLIN TEMPLETON VARIABLE INSURANCE PRODUCTS TRUST
FINANCIAL STATEMENTS
Statement of Assets and Liabilities (continued)
December 31, 2015
| | | | |
| | | Templeton
Foreign VIP
Fund | |
| |
| Class 1: | | | | |
Net assets, at value | | $ | 214,171,663 | |
| | | | |
Shares outstanding | | | 15,912,122 | |
| | | | |
Net asset value and maximum offering price per share | | $ | 13.46 | |
| | | | |
| |
| Class 2: | | | | |
Net assets, at value | | $ | 1,456,854,116 | |
| | | | |
Shares outstanding | | | 110,393,659 | |
| | | | |
Net asset value and maximum offering price per share | | $ | 13.20 | |
| | | | |
| |
| Class 4: | | | | |
Net assets, at value | | $ | 472,188,850 | |
| | | | |
Shares outstanding | | | 35,526,408 | |
| | | | |
Net asset value and maximum offering price per share | | $ | 13.29 | |
| | | | |
| | | | |
| TF-14 | | Annual Report | The accompanying notes are an integral part of these financial statements. | | |
FRANKLIN TEMPLETON VARIABLE INSURANCE PRODUCTS TRUST
FINANCIAL STATEMENTS
Statement of Operations
for the year ended December 31, 2015
| | | | |
| | | Templeton
Foreign VIP
Fund | |
Investment income: | | | | |
Dividends (net of foreign taxes of $5,960,562) | | $ | 64,586,713 | |
Interest | | | 9,072 | |
Income from securities loaned | | | 1,171,754 | |
Other income (Note 1d) | | | 902,241 | |
| | | | |
Total investment income | | | 66,669,780 | |
| | | | |
Expenses: | | | | |
Management fees (Note 3a) | | | 17,638,716 | |
Distribution fees: (Note 3c) | | | | |
Class 2 | | | 4,044,786 | |
Class 4 | | | 1,750,261 | |
Custodian fees (Note 4) | | | 250,173 | |
Reports to shareholders | | | 261,640 | |
Registration and filing fees | | | 1,374 | |
Professional fees | | | 163,732 | |
Trustees’ fees and expenses | | | 10,237 | |
Other | | | 110,243 | |
| | | | |
Total expenses | | | 24,231,162 | |
Expenses waived/paid by affiliates (Note 3e) | | | (134,024 | ) |
| | | | |
Net expenses | | | 24,097,138 | |
| | | | |
Net investment income | | | 42,572,642 | |
| | | | |
Realized and unrealized gains (losses): | | | | |
Net realized gain (loss) from: | | | | |
Investments | | | 37,073,191 | |
Foreign currency transactions | | | (272,851 | ) |
| | | | |
Net realized gain (loss) | | | 36,800,340 | |
| | | | |
Net change in unrealized appreciation (depreciation) on: | | | | |
Investments | | | (219,661,437 | ) |
Translation of other assets and liabilities denominated in foreign currencies | | | (40,109 | ) |
Change in deferred taxes on unrealized appreciation | | | (88,494 | ) |
| | | | |
Net change in unrealized appreciation (depreciation) | | | (219,790,040 | ) |
| | | | |
Net realized and unrealized gain (loss) | | | (182,989,700 | ) |
| | | | |
Net increase (decrease) in net assets resulting from operations | | $ | (140,417,058 | ) |
| | | | |
| | | | | | |
| | | The accompanying notes are an integral part of these financial statements. | Annual Report | | | TF-15 | |
FRANKLIN TEMPLETON VARIABLE INSURANCE PRODUCTS TRUST
FINANCIAL STATEMENTS
Statements of Changes in Net Assets
| | | | | | | | |
| | | Templeton Foreign VIP Fund | |
| | | Year Ended December 31, | |
| | | 2015 | | | 2014 | |
Increase (decrease) in net assets: | | | | | | | | |
Operations: | | | | | | | | |
Net investment income | | $ | 42,572,642 | | | $ | 75,694,144 | |
Net realized gain (loss) | | | 36,800,340 | | | | 132,002,353 | |
Net change in unrealized appreciation (depreciation) | | | (219,790,040 | ) | | | (498,830,366 | ) |
| | | | |
Net increase (decrease) in net assets resulting from operations | | | (140,417,058 | ) | | | (291,133,869 | ) |
| | | | |
Distributions to shareholders from: | | | | | | | | |
Net investment income: | | | | | | | | |
Class 1 | | | (8,346,614 | ) | | | (5,893,509 | ) |
Class 2 | | | (51,791,116 | ) | | | (34,594,703 | ) |
Class 4 | | | (15,312,865 | ) | | | (9,091,879 | ) |
Net realized gains: | | | | | | | | |
Class 1 | | | (7,826,999 | ) | | | — | |
Class 2 | | | (52,898,439 | ) | | | — | |
Class 4 | | | (16,028,658 | ) | | | — | |
| | | | |
Total distributions to shareholders | | | (152,204,691 | ) | | | (49,580,091 | ) |
| | | | |
Capital share transactions: (Note 2) | | | | | | | | |
Class 1 | | | (4,016,954 | ) | | | (13,666,266 | ) |
Class 2 | | | 11,936,472 | | | | 10,314,563 | |
Class 3 | | | — | | | | (96,991,462 | ) |
Class 4 | | | 30,848,243 | | | | 57,564,581 | |
| | | | |
Total capital share transactions | | | 38,767,761 | | | | (42,778,584 | ) |
| | | | |
Redemption fees | | | — | | | | 3,115 | |
| | | | |
Net increase (decrease) in net assets | | | (253,853,988 | ) | | | (383,489,429 | ) |
Net assets: | | | | | | | | |
Beginning of year | | | 2,397,068,617 | | | | 2,780,558,046 | |
| | | | |
End of year | | $ | 2,143,214,629 | | | $ | 2,397,068,617 | |
| | | | |
Undistributed net investment income included in net assets: | | | | | | | | |
End of year | | $ | 42,293,744 | | | $ | 75,444,548 | |
| | | | |
| | | | |
| TF-16 | | Annual Report | The accompanying notes are an integral part of these financial statements. | | |
FRANKLIN TEMPLETON VARIABLE INSURANCE PRODUCTS TRUST
Notes to Financial Statements
Templeton Foreign VIP Fund
1. Organization and Significant Accounting Policies
Franklin Templeton Variable Insurance Products Trust (Trust) is registered under the Investment Company Act of 1940 (1940 Act) as an open-end management investment company, consisting of nineteen separate funds and applies the specialized accounting and reporting guidance in U.S. Generally Accepted Accounting Principles (U.S. GAAP). Templeton Foreign VIP Fund (Fund) is included in this report. The financial statements of the remaining funds in the Trust are presented separately. Shares of the Fund are generally sold only to insurance company separate accounts to fund the benefits of variable life insurance policies or variable annuity contracts. The Fund offers three classes of shares: Class 1, Class 2, and Class 4. Each class of shares differs by its distribution fees, voting rights on matters affecting a single class and its exchange privilege.
The following summarizes the Fund’s significant accounting policies.
a. Financial Instrument Valuation
The Fund’s investments in financial instruments are carried at fair value daily. Fair value is the price that would be received to sell an asset or paid to transfer a liability in an orderly transaction between market participants on the measurement date. The Fund calculates the net asset value (NAV) per share as of 4 p.m. Eastern time each day the New York Stock Exchange (NYSE) is open for trading. Under compliance policies and procedures approved by the Trust’s Board of Trustees (the Board), the Fund’s administrator has responsibility for oversight of valuation, including leading the cross-functional Valuation and Liquidity Oversight Committee (VLOC). The VLOC provides administration and oversight of the Fund’s valuation policies and procedures, which are approved annually by the Board. Among other things, these procedures allow the Fund to utilize independent pricing services, quotations from securities and financial instrument dealers, and other market sources to determine fair value.
Equity securities listed on an exchange or on the NASDAQ National Market System are valued at the last quoted sale price or the official closing price of the day, respectively. Foreign equity securities are valued as of the close of trading on the foreign stock exchange on which the security is primarily traded or as of 4 p.m. Eastern time whichever is earlier. The value is then converted into its U.S. dollar equivalent at the foreign exchange rate in effect at 4 p.m. Eastern time on the day that the value of
the security is determined. Over-the-counter (OTC) securities are valued within the range of the most recent quoted bid and ask prices. Securities that trade in multiple markets or on multiple exchanges are valued according to the broadest and most representative market. Certain equity securities are valued based upon fundamental characteristics or relationships to similar securities.
Investments in open-end mutual funds are valued at the closing NAV.
The Fund has procedures to determine the fair value of financial instruments for which market prices are not reliable or readily available. Under these procedures, the VLOC convenes on a regular basis to review such financial instruments and considers a number of factors, including significant unobservable valuation inputs, when arriving at fair value. The VLOC primarily employs a market-based approach which may use related or comparable assets or liabilities, recent transactions, market multiples, book values, and other relevant information for the investment to determine the fair value of the investment. An income-based valuation approach may also be used in which the anticipated future cash flows of the investment are discounted to calculate fair value. Discounts may also be applied due to the nature or duration of any restrictions on the disposition of the investments. Due to the inherent uncertainty of valuations of such investments, the fair values may differ significantly from the values that would have been used had an active market existed. The VLOC employs various methods for calibrating these valuation approaches including a regular review of key inputs and assumptions, transactional back-testing or disposition analysis, and reviews of any related market activity.
Trading in securities on foreign securities stock exchanges and OTC markets may be completed before 4 p.m. Eastern time. In addition, trading in certain foreign markets may not take place on every NYSE business day. Occasionally, events occur between the time at which trading in a foreign security is completed and the close of the NYSE that might call into question the reliability of the value of a portfolio security held by the Fund. As a result, differences may arise between the value of the Fund’s portfolio securities as determined at the foreign market close and the latest indications of value at the close of the NYSE. In order to minimize the potential for these differences, the VLOC monitors price movements following the close of trading in foreign stock markets through a series of country specific market proxies (such as baskets of American
FRANKLIN TEMPLETON VARIABLE INSURANCE PRODUCTS TRUST
NOTES TO FINANCIAL STATEMENTS
Templeton Foreign VIP Fund (continued)
1. Organization and Significant Accounting Policies (continued)
a. Financial Instrument Valuation (continued)
Depositary Receipts, futures contracts and exchange traded funds). These price movements are measured against established trigger thresholds for each specific market proxy to assist in determining if an event has occurred that may call into question the reliability of the values of the foreign securities held by the Fund. If such an event occurs, the securities may be valued using fair value procedures, which may include the use of independent pricing services.
When the last day of the reporting period is a non-business day, certain foreign markets may be open on those days that the NYSE is closed, which could result in differences between the value of the Fund’s portfolio securities on the last business day and the last calendar day of the reporting period. Any significant security valuation changes due to an open foreign market are adjusted and reflected by the Fund for financial reporting purposes.
b. Foreign Currency Translation
Portfolio securities and other assets and liabilities denominated in foreign currencies are translated into U.S. dollars based on the exchange rate of such currencies against U.S. dollars on the date of valuation. The Fund may enter into foreign currency exchange contracts to facilitate transactions denominated in a foreign currency. Purchases and sales of securities, income and expense items denominated in foreign currencies are translated into U.S. dollars at the exchange rate in effect on the transaction date. Portfolio securities and assets and liabilities denominated in foreign currencies contain risks that those currencies will decline in value relative to the U.S. dollar. Occasionally, events may impact the availability or reliability of foreign exchange rates used to convert the U.S. dollar equivalent value. If such an event occurs, the foreign exchange rate will be valued at fair value using procedures established and approved by the Board.
The Fund does not separately report the effect of changes in foreign exchange rates from changes in market prices on securities held. Such changes are included in net realized and unrealized gain or loss from investments in the Statement of Operations.
Realized foreign exchange gains or losses arise from sales of foreign currencies, currency gains or losses realized between the
trade and settlement dates on securities transactions and the difference between the recorded amounts of dividends, interest, and foreign withholding taxes and the U.S. dollar equivalent of the amounts actually received or paid. Net unrealized foreign exchange gains and losses arise from changes in foreign exchange rates on foreign denominated assets and liabilities other than investments in securities held at the end of the reporting period.
c. Securities Lending
The Fund participates in an agency based securities lending program to earn additional income. The Fund receives cash collateral against the loaned securities in an amount equal to at least 102% of the fair value of the loaned securities. Collateral is maintained over the life of the loan in an amount not less than 100% of the fair value of loaned securities, as determined at the close of Fund business each day; any additional collateral required due to changes in security values is delivered to the Fund on the next business day. The collateral is deposited into a joint cash account with other funds and is used to invest in a money market fund managed by Franklin Advisers, Inc., an affiliate of the Fund. The Fund may receive income from the investment of cash collateral, in addition to lending fees and rebates paid by the borrower. Income from securities loaned is reported separately in the Statement of Operations. The Fund bears the market risk with respect to the collateral investment, securities loaned, and the risk that the agent may default on its obligations to the Fund. If the borrower defaults on its obligation to return the securities loaned, the Fund has the right to repurchase the securities in the open market using the collateral received. The securities lending agent has agreed to indemnify the Fund in the event of default by a third party borrower. At December 31, 2015, the Fund had no securities on loan.
d. Income and Deferred Taxes
It is the Fund’s policy to qualify as a regulated investment company under the Internal Revenue Code. The Fund intends to distribute to shareholders substantially all of its taxable income and net realized gains to relieve it from federal income and if applicable, excise taxes. As a result, no provision for U.S. federal income taxes is required.
The Fund may be subject to foreign taxation related to income received, capital gains on the sale of securities and certain foreign currency transactions in the foreign jurisdictions in which it invests. Foreign taxes, if any, are recorded based on the tax
FRANKLIN TEMPLETON VARIABLE INSURANCE PRODUCTS TRUST
NOTES TO FINANCIAL STATEMENTS
Templeton Foreign VIP Fund (continued)
regulations and rates that exist in the foreign markets in which the Fund invests. When a capital gain tax is determined to apply, the Fund records an estimated deferred tax liability in an amount that would be payable if the securities were disposed of on the valuation date. As a result of several court cases, in certain countries across the European Union, the Fund has filed additional tax reclaims for previously withheld taxes on dividends earned in those countries. These additional filings are subject to various administrative proceedings by the local jurisdictions’ tax authorities within the European Union, as well as a number of related judicial proceedings. During the year ended December 31, 2015, the Fund recognized $911,264 from Sweden for previously withheld foreign taxes and interest on such taxes. These amounts are reflected as other income and interest in the Statement of Operations. In regards to filings in other European Union countries, uncertainty exists as to the ultimate resolution of these proceedings, the likelihood of receipt of these reclaims, and the potential timing of payment, and accordingly, no amounts are reflected in the financial statements.
The Fund may recognize an income tax liability related to its uncertain tax positions under U.S. GAAP when the uncertain tax position has a less than 50% probability that it will be sustained upon examination by the tax authorities based on its technical merits. As of December 31, 2015, the Fund has determined that no tax liability is required in its financial statements related to uncertain tax positions for any open tax years (or expected to be taken on future tax returns). Open tax years are those that remain subject to examination and are based on each tax jurisdiction’s statute of limitation.
e. Security Transactions, Investment Income, Expenses and Distributions
Security transactions are accounted for on trade date. Realized gains and losses on security transactions are determined on a specific identification basis. Estimated expenses are accrued daily. Dividend income is recorded on the ex-dividend date except for certain dividends from foreign securities where the dividend rate is not available. In such cases, the dividend is recorded as soon as the information is received by the Fund. Distributions to shareholders are recorded on the ex-dividend date and are determined according to income tax regulations (tax basis). Distributable earnings determined on a tax basis may differ from earnings recorded in accordance with U.S. GAAP. These differences may be permanent or temporary. Permanent differences are reclassified among capital accounts to reflect
their tax character. These reclassifications have no impact on net assets or the results of operations. Temporary differences are not reclassified, as they may reverse in subsequent periods.
Common expenses incurred by the Trust are allocated among the Funds based on the ratio of net assets of each Fund to the combined net assets of the Trust. Fund specific expenses are charged directly to the fund that incurred the expense.
Realized and unrealized gains and losses and net investment income, not including class specific expenses, are allocated daily to each class of shares based upon the relative proportion of net assets of each class. Differences in per share distributions, by class, are generally due to differences in class specific expenses.
f. Accounting Estimates
The preparation of financial statements in accordance with U.S. GAAP requires management to make estimates and assumptions that affect the reported amounts of assets and liabilities at the date of the financial statements and the amounts of income and expenses during the reporting period. Actual results could differ from those estimates.
g. Redemption Fees
Redemptions and exchanges of interests in an insurance company subaccount that invested in Class 3 shares of the Fund were subject to a 1.0% short term trading fee if the interest in the subaccount had been held for less than 60 days. Such fees were retained by the Fund and accounted for as an addition to paid-in capital, allocated to each class of shares based upon the relative proportion of net assets of each class. There were no redemption fees for the year.
h. Guarantees and Indemnifications
Under the Trust’s organizational documents, its officers and trustees are indemnified by the Trust against certain liabilities arising out of the performance of their duties to the Trust. Additionally, in the normal course of business, the Trust, on behalf of the Fund, enters into contracts with service providers that contain general indemnification clauses. The Trust’s maximum exposure under these arrangements is unknown as this would involve future claims that may be made against the Trust that have not yet occurred. Currently, the Trust expects the risk of loss to be remote.
FRANKLIN TEMPLETON VARIABLE INSURANCE PRODUCTS TRUST
NOTES TO FINANCIAL STATEMENTS
Templeton Foreign VIP Fund (continued)
2. Shares of Beneficial Interest
At December 31, 2015, there were an unlimited number of shares authorized (without par value). Transactions in the Fund’s shares were as follows:
| | | | | | | | | | | | | | | | | | |
| | | Year Ended December 31, | |
| | | 2015 | | | | | 2014 | |
| | | Shares | | | Amount | | | | | Shares | | | Amount | |
| | | | | |
| Class 1 Shares: | | | | | | | | | | | | | | | | | | |
Shares sold | | | 454,466 | | | $ | 6,842,816 | | | | | | 620,933 | | | $ | 10,378,692 | |
Shares issued in reinvestment of distributions | | | 1,057,790 | | | | 16,173,612 | | | | | | 329,615 | | | | 5,893,509 | |
Shares redeemed | | | (1,792,103 | ) | | | (27,033,382 | ) | | | | | (1,754,194 | ) | | | (29,938,467 | ) |
| | | | |
Net increase (decrease) | | | (279,847 | ) | | $ | (4,016,954 | ) | | | | | (803,646 | ) | | $ | (13,666,266 | ) |
| | | | |
| Class 2 Shares: | | | | | | | | | | | | | | | | | | |
Shares sold | | | 14,594,828 | | | $ | 213,082,680 | | | | | | 18,861,260 | | | $ | 315,063,591 | |
Shares issued in reinvestment of distributions | | | 6,974,654 | | | | 104,689,555 | | | | | | 1,967,844 | | | | 34,594,703 | |
Shares redeemed | | | (20,492,400 | ) | | | (305,835,763 | ) | | | | | (20,169,191 | ) | | | (339,343,731 | ) |
| | | | |
Net increase (decrease) | | | 1,077,082 | | | $ | 11,936,472 | | | | | | 659,913 | | | $ | 10,314,563 | |
| | | | |
| Class 3 Sharesa: | | | | | | | | | | | | | | | | | | |
Shares sold | | | | | | | | | | | | | 149,791 | | | $ | 2,553,688 | |
Shares redeemed | | | | | | | | | | | | | (5,703,761 | ) | | | (99,545,150 | ) |
| | | | | | | | | | | | | | |
Net increase (decrease) | | | | | | | | | | | | | (5,553,970 | ) | | $ | (96,991,462 | ) |
| | | | | | | | | | | | | | |
| Class 4 Shares: | | | | | | | | | | | | | | | | | | |
Shares sold | | | 5,690,434 | | | $ | 80,692,209 | | | | | | 6,994,024 | | | $ | 113,655,992 | |
Shares issued in reinvestment of distributions | | | 2,072,852 | | | | 31,341,523 | | | | | | 513,375 | | | | 9,091,879 | |
Shares redeemed | | | (5,429,602 | ) | | | (81,185,489 | ) | | | | | (3,859,063 | ) | | | (65,183,290 | ) |
| | | | |
Net increase (decrease) | | | 2,333,684 | | | $ | 30,848,243 | | | | | | 3,648,336 | | | $ | 57,564,581 | |
| | | | |
aEffective May 1, 2014, all Class 3 Shares were converted to Class 2.
3. Transactions With Affiliates
Franklin Resources, Inc. is the holding company for various subsidiaries that together are referred to as Franklin Templeton Investments. Certain officers and trustees of the Fund are also officers and/or directors of the following subsidiaries:
| | |
| Subsidiary | | Affiliation |
Templeton Investment Counsel, LLC (TIC) | | Investment manager |
Franklin Templeton Services, LLC (FT Services) | | Administrative manager |
Franklin Templeton Distributors, Inc. (Distributors) | | Principal underwriter |
Franklin Templeton Investor Services, LLC (Investor Services) | | Transfer agent |
FRANKLIN TEMPLETON VARIABLE INSURANCE PRODUCTS TRUST
NOTES TO FINANCIAL STATEMENTS
Templeton Foreign VIP Fund (continued)
a. Management Fees
The Fund pays an investment management fee to TIC based on the average daily net assets of the Fund as follows:
| | |
| Annualized Fee Rate | | Net Assets |
0.900% | | Up to and including $200 million |
0.810% | | Over $200 million, up to and including $700 million |
0.775% | | Over $700 million, up to and including $1.2 billion |
0.750% | | Over $1.2 billion, up to and including $1.3 billion |
0.675% | | Over $1.3 billion, up to and including $10 billion |
0.655% | | Over $10 billion, up to and including $15 billion |
0.635% | | Over $15 billion, up to and including $20 billion |
0.615% | | In excess of $20 billion |
b. Administrative Fees
Under an agreement with TIC, FT Services provides administrative services to the Fund. The fee is paid by TIC based on the Fund’s average daily net assets, and is not an additional expense of the Fund.
c. Distribution Fees
The Board has adopted distribution plans for Class 2 and Class 4 shares pursuant to Rule 12b-1 under the 1940 Act. Under the Fund’s compensation distribution plans, the Fund pays Distributors for costs incurred in connection with the servicing, sale and distribution of the Fund’s shares up to 0.25% and 0.35% per year of its average daily net assets of Class 2 and Class 4, respectively. The plan year, for purposes of monitoring compliance with the maximum annual plan rates, is February 1 through January 31.
d. Transfer Agent Fees
Investor Services, under terms of an agreement, performs shareholder servicing for the Fund and is not paid by the Fund for the services.
e. Investments in Affiliated Management Investment Companies
The Fund invests in an affiliated management investment company for purposes other than exercising a controlling influence over the management or policies. Management fees paid by the Fund are waived on assets invested in the affiliated management investment company, as noted in the Statement of Operations, in an amount not to exceed the management and administrative fees paid directly or indirectly by each affiliate. Prior to January 1, 2014, the waiver was accounted for as a reduction to management fees.
| | | | | | | | | | | | | | | | | | | | | | | | | | | | | | | | |
| | | Number
of Shares
Held at
Beginning
of Year | | | Gross
Additions | | | Gross
Reductions | | | Number
of Shares
Held at
End of
Year | | | Value at
End of
Year | | | Investment
Income | | | Realized
Gain
(Loss) | | | % of
Affiliated
Fund Shares
Outstanding
Held at End
of Year | |
| Non-Controlled Affiliates | | | | | | | | | | | | | | | | | | | | | | | | | | | | | | | | |
Institutional Fiduciary Trust Money Market Portfolio | | | 135,800,137 | | | | 1,220,198,341 | | | | (1,284,577,209 | ) | | | 71,421,269 | | | $ | 71,421,269 | | | $ | — | | | $ | — | | | | 0.36% | |
| | | | | | | | | | | | | | | | | | | | | | | | |
f. Interfund Transactions
The Fund engaged in purchases and sales of investments with funds or other accounts that have a common investment manager (or affiliated investment managers), directors, trustees, or officers. These transactions complied with Rule 17a-7 under the 1940 Act. During the year ended December 31, 2015, the purchase and sale transactions aggregated $1,628,193 and $0, respectively.
FRANKLIN TEMPLETON VARIABLE INSURANCE PRODUCTS TRUST
NOTES TO FINANCIAL STATEMENTS
Templeton Foreign VIP Fund (continued)
4. Expense Offset Arrangement
The Fund has entered into an arrangement with its custodian whereby credits realized as a result of uninvested cash balances are used to reduce a portion of the Fund’s custodian expenses. During the year ended December 31, 2015, there were no credits earned.
5. Income Taxes
The tax character of distributions paid during the years ended December 31, 2015 and 2014 was as follows:
| | | | | | | | |
| | | 2015 | | | 2014 | |
Distributions paid from: | | | | | | | | |
Ordinary income | | $ | 75,450,595 | | | $ | 49,580,091 | |
Long term capital gain | | | 76,754,096 | | | | — | |
| | | | |
| | $ | 152,204,691 | | | $ | 49,580,091 | |
| | | | |
At December 31, 2015, the cost of investments, net unrealized appreciation (depreciation), undistributed ordinary income and undistributed long term capital gains for income tax purposes were as follows:
| | | | |
Cost of investments | | $ | 2,205,570,297 | |
| | | | |
Unrealized appreciation | | $ | 304,397,527 | |
Unrealized depreciation | | | (375,566,253 | ) |
| | | | |
Net unrealized appreciation (depreciation) | | $ | (71,168,726 | ) |
| | | | |
Undistributed ordinary income | | $ | 41,484,910 | |
Undistributed long term capital gains | | | 37,072,552 | |
| | | | |
Distributable earnings | | $ | 78,557,462 | |
| | | | |
Differences between income and/or capital gains as determined on a book basis and a tax basis are primarily due to differing treatment of foreign capital gains tax.
6. Investment Transactions
Purchases and sales of investments (excluding short term securities) for the year ended December 31, 2015, aggregated $358,075,306 and $341,020,080, respectively.
7. Concentration of Risk
Investing in foreign securities may include certain risks and considerations not typically associated with investing in U.S. securities, such as fluctuating currency values and changing local and regional economic, political and social conditions, which may result in greater market volatility. In addition, certain foreign securities may not be as liquid as U.S. securities.
8. Credit Facility
The Fund, together with other U.S. registered and foreign investment funds (collectively, Borrowers), managed by Franklin Templeton Investments, are borrowers in a joint syndicated senior unsecured credit facility totaling $2 billion (Global Credit Facility) which matured on February 12, 2016. This Global Credit Facility provides a source of funds to the Borrowers for temporary and emergency purposes, including the ability to meet future unanticipated or unusually large redemption requests. Effective February 12, 2016, the Borrowers renewed the Global Credit Facility for a one year term, maturing February 10, 2017, for a total of $2 billion.
FRANKLIN TEMPLETON VARIABLE INSURANCE PRODUCTS TRUST
NOTES TO FINANCIAL STATEMENTS
Templeton Foreign VIP Fund (continued)
8. Credit Facility (continued)
Under the terms of the Global Credit Facility, the Fund shall, in addition to interest charged on any borrowings made by the Fund and other costs incurred by the Fund, pay its share of fees and expenses incurred in connection with the implementation and maintenance of the Global Credit Facility, based upon its relative share of the aggregate net assets of all of the Borrowers, including an annual commitment fee of 0.07% based upon the unused portion of the Global Credit Facility. Effective February 12, 2016, the annual commitment fee is 0.15%. These fees are reflected in other expenses in the Statement of Operations. During the year ended December 31, 2015, the Fund did not use the Global Credit Facility.
9. Fair Value Measurements
The Fund follows a fair value hierarchy that distinguishes between market data obtained from independent sources (observable inputs) and the Fund’s own market assumptions (unobservable inputs). These inputs are used in determining the value of the Fund’s financial instruments and are summarized in the following fair value hierarchy:
| | • | | Level 1 – quoted prices in active markets for identical financial instruments |
| | • | | Level 2 – other significant observable inputs (including quoted prices for similar financial instruments, interest rates, prepayment speed, credit risk, etc.) |
| | • | | Level 3 – significant unobservable inputs (including the Fund’s own assumptions in determining the fair value of financial instruments) |
The input levels are not necessarily an indication of the risk or liquidity associated with financial instruments at that level.
For movements between the levels within the fair value hierarchy, the Fund has adopted a policy of recognizing the transfers as of the date of the underlying event which caused the movement.
At December 31, 2015, all of the Fund’s investments in financial instruments carried at fair value were valued using Level 1 inputs. For detailed categories, see the accompanying Statement of Investments.
10. Subsequent Events
The Fund has evaluated subsequent events through the issuance of the financial statements and determined that no events have occurred that require disclosure other than those already disclosed in the financial statements.
Abbreviations
| | |
| Selected Portfolio |
| |
| ADR | | American Depositary Receipt |
| |
| IDR | | International Depositary Receipt |
FRANKLIN TEMPLETON VARIABLE INSURANCE PRODUCTS TRUST
Report of Independent Registered Public Accounting Firm
Templeton Foreign VIP Fund
To the Board of Trustees and Shareholders of Franklin Templeton Variable Insurance Products Trust
In our opinion, the accompanying statement of assets and liabilities, including the statement of investments, and the related statements of operations and of changes in net assets and the financial highlights present fairly, in all material respects, the financial position of Templeton Foreign VIP Fund (the “Fund”) at December 31, 2015, the results of its operations for the year then ended, the changes in its net assets for each of the two years in the period then ended and the financial highlights for each of the periods presented, in conformity with accounting principles generally accepted in the United States of America. These financial statements and financial highlights (hereafter referred to as “financial statements”) are the responsibility of the Fund’s management. Our responsibility is to express an opinion on these financial statements based on our audit. We conducted our audit of these financial statements in accordance with the standards of the Public Company Accounting Oversight Board (United States). Those standards require that we plan and perform the audit to obtain reasonable assurance about whether the financial statements are free of material misstatement. An audit includes examining, on a test basis, evidence supporting the amounts and disclosures in the financial statements, assessing the accounting principles used and significant estimates made by management, and evaluating the overall financial statement presentation. We believe that our audit, which included confirmation of securities at December 31, 2015 by correspondence with the custodian, transfer agent and brokers, provides a reasonable basis for our opinion.
PricewaterhouseCoopers LLP
San Francisco, California
February 16, 2016
FRANKLIN TEMPLETON VARIABLE INSURANCE PRODUCTS TRUST
Tax Information (unaudited)
Templeton Foreign VIP Fund
Under Section 852(b)(3)(C) of the Internal Revenue Code (Code), the Fund hereby reports the maximum amount allowable but no less than $76,754,096 as a long term capital gain dividend for the fiscal year ended December 31, 2015.
At December 31, 2015, more than 50% of the Fund’s total assets were invested in securities of foreign issuers. In most instances, foreign taxes were withheld from income paid to the Fund on these investments. The Fund elects to treat foreign taxes paid as allowed under Section 853 of the Code. This election will allow shareholders of record as of the 2016 distribution date, to treat their proportionate share of foreign taxes paid by the Fund as having been paid directly by them. The shareholder shall consider these amounts as foreign taxes paid in the tax year in which they receive the Fund distribution.
Templeton Global Bond VIP Fund
This annual report for Templeton Global Bond VIP Fund covers the fiscal year ended December 31, 2015.
Class 4 Performance Summary as of December 31, 2015
Average annual total return of Class 4 shares* represents the average annual change in value, assuming reinvestment of dividends and capital gains. Average returns smooth out variations in returns, which can be significant; they are not the same as year-by-year results.
| | | | | | | | | | | | |
| Periods ended 12/31/15 | | 1-Year | | | 5-Year | | | 10-Year | |
Average Annual Total Return | | | -4.39% | | | | +2.37% | | | | +7.37% | |
*For the period beginning 2/29/08, Class 4 performance reflects a 12b-1 fee expense of 0.35% per year, which affects future performance. Class 4 performance prior to 2/29/08 reflects historical Class 1 performance, which does not have a 12b-1 fee expense. Since 2/29/08 (effective date), the average annual total return of Class 4 shares was +5.55%.
Performance reflects the Fund’s Class 4 operating expenses, but does not include any contract fees, expenses or sales charges. If they had been included, performance would be lower. These charges and deductions, particularly for variable life policies, can have a significant effect on contract values and insurance benefits. See the contract prospectus for a complete description of these expenses, including sales charges.
Performance data represent past performance, which does not guarantee future results. Investment return and principal value will fluctuate, and you may have a gain or loss when you sell your shares. Current performance may differ from figures shown.
Total Return Index Comparison for a Hypothetical $10,000 Investment (1/1/06–12/31/15)
The graph below shows the change in value of a hypothetical $10,000 investment in the Fund over the indicated period and includes reinvestment of any income or distributions. The Fund’s performance* is compared to the performance of the J.P. Morgan (JPM) Global Government Bond Index (GGBI), the Citigroup World Government Bond Index (WGBI) and the Consumer Price Index. One cannot invest directly in an index, and an index is not representative of the Fund’s portfolio. Please see Important Notes to Performance Information preceding the Fund Summaries.
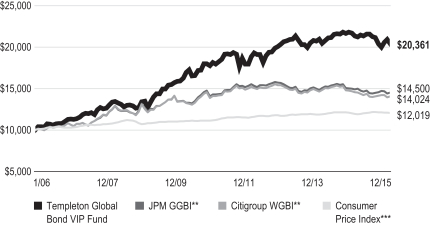
**Source: Morningstar. Please see Index Descriptions following the Fund Summaries.
***Source: Bureau of Labor Statistics, bls.gov/cpi. Please see Index Descriptions following the Fund Summaries.
TEMPLETON GLOBAL BOND VIP FUND
Fund Goal and Main Investments
The Fund seeks high current income, consistent with preservation of capital, with capital appreciation as a secondary consideration. Under normal market conditions, the Fund invests at least 80% of its net assets in bonds, which include debt securities of any maturity, such as bonds, notes, bills and debentures.
Fund Risks
All investments involve risks, including possible loss of principal. Currency rates may fluctuate significantly over short periods of time, and can reduce returns. Derivatives, including currency management strategies, involve costs and can create economic leverage in the portfolio that may result in significant volatility and cause the Fund to participate in losses (as well as enable gains) on an amount that exceeds the Fund’s initial investment. The Fund may not achieve the anticipated benefits and may realize losses when a counterparty fails to perform as promised. Foreign securities involve special risks, including currency fluctuations and economic and political uncertainties. Investments in emerging markets involve heightened risks related to the same factors, in addition to those associated with these markets’ smaller size and lesser liquidity. Sovereign debt securities are subject to various risks in addition to those relating to debt securities and foreign securities generally, including, but not limited to, the risk that a government entity may be unwilling or unable to pay interest and repay principal on its sovereign debt, or otherwise meet its obligations when due. Investments in lower rated bonds include higher risk of default and loss of principal. Changes in interest rates will affect the value of the Fund’s portfolio and its share price and yield. Bond prices generally move in the opposite direction of interest rates. As prices of bonds in the Fund adjust to a rise in interest rates, the Fund’s share price may decline. The markets for particular securities or types of securities are or may become relatively illiquid. Reduced liquidity will have an adverse impact on the security’s value and on the Fund’s ability to sell such securities when necessary to meet the Fund’s liquidity needs or in response to a specific market event. The Fund is also nondiversified, which involves the risk of greater price fluctuation than a more diversified portfolio. Changes in the financial strength of a bond issuer or in a bond’s credit rating may affect its value. The Fund is actively managed but there is no guarantee that the manager’s investment decisions will produce the desired results. The Fund’s prospectus also includes a description of the main investment risks.
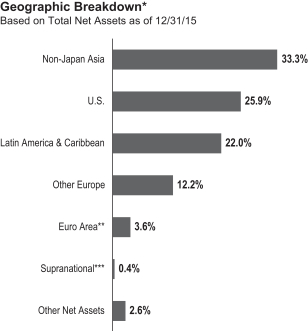
*Figures are stated as a percentage of total and may not equal 100% or may be negative due to rounding, use of any derivatives, unsettled trades or other factors.
**The Fund’s euro area investments were in Ireland, Slovenia and Portugal.
***The Fund’s supranational investment was denominated in the Mexican peso.
Performance Overview
You can find the Fund’s one-year total return in the Performance Summary. For comparison, the Fund’s benchmarks, the JPM GGBI had a -2.61% total return and the Citigroup WGBI, had a -3.57% total return for the same period.1
Economic and Market Overview
During the period, global financial markets were broadly influenced by growth in the U.S., economic moderation in China, quantitative easing (QE) measures from the Bank of Japan (BOJ) and the European Central Bank (ECB), a sharp decline in oil prices, and a protracted depreciation of emerging market currencies. At the beginning of the period, financial markets were experiencing volatility related to the rapid decline of oil prices in 2014 and the growing concerns for global growth. We believed the market was misjudging the underlying forces behind the decline in oil prices, which, by our assessment, were driven by supply dynamics rather than a loss of demand. We held the view that the global economy would benefit from lower oil prices and that most observers were too pessimistic. Amid
1. Source: Morningstar.
One cannot invest directly in an index, and an index is not representative of the Fund’s portfolio. Please see Index Descriptions following the Fund Summaries.
TEMPLETON GLOBAL BOND VIP FUND
| | | | |
| Currency Breakdown* | | | |
| 12/31/15 | | | |
| | | % of Total
Net Assets | |
| Americas | | | 122.4% | |
| U.S. Dollar | | | 97.1% | |
| Mexican Peso | | | 17.7% | |
| Brazilian Real | | | 4.8% | |
| Chilean Peso | | | 2.7% | |
| Peruvian Nuevo Sol | | | 0.1% | |
| Asia Pacific | | | 14.7% | |
| South Korean Won | | | 14.8% | |
| Malaysian Ringgit | | | 13.3% | |
| Indonesian Rupiah | | | 5.2% | |
| Indian Rupee | | | 4.3% | |
| Philippine Peso | | | 2.1% | |
| Sri Lankan Rupee | | | 1.2% | |
| Singapore Dollar | | | 0.4% | |
| Japanese Yen | | | -26.6% | |
| Europe | | | -28.8% | |
| Polish Zloty | | | 4.8% | |
| Hungarian Forint | | | 0.2% | |
| Euro | | | -33.8% | |
| Australia & New Zealand | | | -8.3% | |
| Australian Dollar | | | -8.3% | |
*Figures are stated as a percentage of total and may not equal 100% or may be negative due to rounding, use of any derivatives, unsettled trades or other factors.
The dollar value, number of shares or principal amount, and names of all portfolio holdings are listed in the Fund’s Statement of Investments.
the heightened risk aversion, the yield on the 10-year U.S. Treasury note reached 1.64%, its lowest level during 2015, at the end of January.
Global markets began to stabilize in February as oil prices halted their decline and leveled off to a more stable range. Credit spreads tightened while bond yields increased across much of the globe. In March, the ECB launched a new QE program with the aim of increasing the size of its balance sheet to a level higher than its previous peak, stating intentions to continue its asset purchases until it sees a sustained adjustment in the path of inflation. Concurrently, the BOJ continued deploying massive levels of its own QE measures. We anticipated that the QE programs would put downward pressure on the euro and the Japanese yen during the year while keeping bond yields low in these respective markets. The euro depreciated 10.23% against the U.S. dollar over the 12-month period while the Japanese yen depreciated 0.33%.2
2. Source: FactSet.
However, global volatility returned at the end of June as economic concerns over China spread across global financial markets. Several emerging market currencies depreciated sharply against the U.S. dollar due to heightened risk aversion, while the euro and the Japanese yen appreciated at times, acting as perceived safe havens. In our assessment, the depreciations of several emerging market currencies were excessive, leading to fundamentally cheap valuations. The heightened risk volatility persisted through much of July, August and September, before markets relatively stabilized in the autumn months. Several emerging market currencies rebounded and appreciated against the U.S. dollar in October while the euro and the yen depreciated. Similar stabilizing trends continued through November until global risk aversion returned in December.
On the whole, the U.S. dollar broadly strengthened against developed and emerging market currencies during the 12-month period. Global bond yields and spread levels fluctuated, with an overall trend toward higher yields across the Americas and the eurozone but lower yields in specific peripheral European markets. Across much of East Asia and in Japan yields declined during the period; however, yields increased across a number of countries in South and Southeast Asia. Credit spreads widened across a vast majority of global credit markets during the period.
Investment Strategy
We invest selectively in bonds around the world based upon our assessment of changing market, political and economic conditions. While seeking opportunities, we monitor various factors including changes in interest rates, currency exchange rates and credit risks. We seek to manage the Fund’s exposure to various currencies and may utilize currency forward contracts.
What is a currency forward contract?
A currency forward contract is an agreement between the Fund and a counterparty to buy or sell a foreign currency at a specific exchange rate on a future date.
Manager’s Discussion
The core of our strategy during the reporting period remained seeking to position ourselves to navigate a rising interest rate environment. Thus, we continued to maintain low portfolio duration while aiming at a negative correlation with U.S. Treasury rates. We were positioned with negative duration
TEMPLETON GLOBAL BOND VIP FUND
exposure to U.S. Treasuries, and we held select local currencies and local bond positions in specific emerging markets. We actively sought opportunities that could, in our view, potentially offer positive real yields without taking undue interest rate risk. We also held net-negative positions in the euro and the Japanese yen. Additionally, we continued to selectively invest in credit opportunities, with a particular focus on credit exposures in economies with strong growth indicators. During the period, we used currency forward contracts to actively manage exposure to currencies. We also used interest rate swaps to tactically manage duration exposures.
What is duration?
Duration is a measure of a bond’s price sensitivity to interest rate changes. In general, a portfolio of securities with a lower duration can be expected to be less sensitive to interest rate changes than a portfolio with a higher duration.
What is an interest rate swap?
An interest rate swap is an agreement between two parties to exchange interest rate obligations, generally one based on an interest rate fixed to maturity and the other based on an interest rate that changes in accordance with changes in a designated benchmark (for example, LIBOR, prime, commercial paper or other benchmarks).
During the period, currency positions detracted from the Fund’s absolute performance. Sovereign credit exposures contributed to absolute return while interest rate strategies had a largely neutral effect. Currency positions in Asia ex-Japan and Latin America detracted from absolute performance; however, the Fund’s net-negative position in the euro contributed. The Fund’s net-negative position in the Japanese yen had a largely neutral effect on absolute return. The Fund maintained a
defensive approach regarding interest rates in developed and emerging markets. Consequently, contributions from duration exposures were limited.
Relative to the Fund’s benchmark index, currency positions and interest rate strategies detracted from relative performance while sovereign credit exposures contributed. The Fund’s underweighted position in the euro contributed to relative return while overweighted currency positions in Asia ex-Japan and Latin America detracted. The Fund’s underweighted position in the Japanese yen had a largely neutral effect on relative return. The Fund maintained a shorter duration positioning relative to its benchmark. Select underweighted duration exposures in Europe and underweighted duration exposure in the U.S. detracted from relative performance.
Thank you for your participation in Templeton Global Bond VIP Fund. We look forward to serving your future investment needs.
The foregoing information reflects our analysis, opinions and portfolio holdings as of December 31, 2015, the end of the reporting period. The way we implement our main investment strategies and the resulting portfolio holdings may change depending on factors such as market and economic conditions. These opinions may not be relied upon as investment advice or an offer for a particular security. The information is not a complete analysis of every aspect of any market, country, industry, security or the Fund. Statements of fact are from sources considered reliable, but the investment manager makes no representation or warranty as to their completeness or accuracy. Although historical performance is no guarantee of future results, these insights may help you understand our investment management philosophy.
TEMPLETON GLOBAL BOND VIP FUND
Class 4 Fund Expenses
As an investor in a variable insurance contract (Contract) that indirectly provides for investment in an underlying mutual fund, you can incur transaction and/or ongoing expenses at both the Fund level and the Contract level.
| • | | Transaction expenses can include sales charges (loads) on purchases, redemption fees, surrender fees, transfer fees and premium taxes. |
| • | | Ongoing expenses can include management fees, distribution and service (12b-1) fees, contract fees, annual maintenance fees, mortality and expense risk fees and other fees and expenses. All mutual funds and Contracts have some types of ongoing expenses. |
The expenses shown in the table are meant to highlight ongoing expenses at the Fund level only and do not include ongoing expenses at the Contract level, or transaction expenses at either the Fund or Contract level. While the Fund does not have transaction expenses, if the transaction and ongoing expenses at the Contract level were included, the expenses shown below would be higher. You should consult your Contract prospectus or disclosure document for more information.
The table shows Fund-level ongoing expenses and can help you understand these expenses and compare them with those of other mutual funds offered through the Contract. The table assumes a $1,000 investment held for the six months indicated. Please refer to the Fund prospectus for additional information on operating expenses.
Actual Fund Expenses
The first line (Actual) of the table provides actual account values and expenses. The “Ending Account Value” is derived from the Fund’s actual return, which includes the effect of ongoing Fund expenses, but does not include the effect of ongoing Contract expenses.
You can estimate the Fund-level expenses you incurred during the period by following these steps. Of course, your account value and expenses will differ from those in this illustration:
| 1. | Divide your account value by $1,000. |
If an account had an $8,600 value, then $8,600 ÷ $1,000 = 8.6.
| 2. | Multiply the result by the number under the heading “Fund-Level Expenses Incurred During Period.” |
If Fund-Level Expenses Incurred During Period were $7.50, then 8.6 × $7.50 = $64.50.
In this illustration, the estimated expenses incurred this period at the Fund level are $64.50.
Hypothetical Example for Comparison with Other Mutual Funds
Information in the second line (Hypothetical) of the table can help you compare ongoing expenses of the Fund with those of other mutual funds offered through the Contract. This information may not be used to estimate the actual ending account balance or expenses you incurred during the period. The hypothetical “Ending Account Value” is based on the Fund’s actual expense ratio for each class and an assumed 5% annual rate of return before expenses, which does not represent the Fund’s actual return. The figure under the heading “Fund-Level Expenses Incurred During Period” shows the hypothetical expenses your account would have incurred under this scenario. You can compare this figure with the 5% hypothetical examples that appear in shareholder reports of other funds offered through a Contract.
| | | | | | | | | | | | |
| Class 4 | | Beginning Account Value 7/1/15 | | | Ending Account Value 12/31/15 | | | Fund-Level Expenses
Incurred During Period* 7/1/15–12/31/15 | |
Actual | | | $1,000 | | | | $ 959.90 | | | | $4.35 | |
Hypothetical (5% return before expenses) | | | $1,000 | | | | $1,020.77 | | | | $4.48 | |
*Expenses are calculated using the most recent six-month annualized expense ratio for the Fund’s Class 4 shares (0.88%), which does not include any ongoing expenses of the Contract for which the Fund is an investment option, multiplied by the average account value over the period, multiplied by 184/365 to reflect the one-half year period.
FRANKLIN TEMPLETON VARIABLE INSURANCE PRODUCTS TRUST
Financial Highlights
Templeton Global Bond VIP Fund
| | | | | | | | | | | | | | | | | | | | |
| | | Year Ended December 31, | |
| | | 2015 | | | 2014 | | | 2013 | | | 2012 | | | 2011 | |
| Class 1 | | | | | | | | | | | | | | | | | | | | |
Per share operating performance
(for a share outstanding throughout the year) | | | | | | | | | | | | | | | | | | | | |
| | | | | |
Net asset value, beginning of year | | | $18.56 | | | | $19.15 | | | | $20.01 | | | | $18.61 | | | | $19.94 | |
| | | | |
| | | | | |
| Income from investment operationsa: | | | | | | | | | | | | | | | | | | | | |
| | | | | |
Net investment incomeb | | | 0.52 | | | | 0.58 | | | | 0.64 | | | | 0.72 | | | | 0.87 | |
| | | | | |
Net realized and unrealized gains (losses) | | | (1.22 | ) | | | (0.16 | ) | | | (0.30 | ) | | | 1.99 | | | | (0.92 | ) |
| | | | |
Total from investment operations | | | (0.70 | ) | | | 0.42 | | | | 0.34 | | | | 2.71 | | | | (0.05 | ) |
| | | | |
| | | | | |
| Less distributions from: | | | | | | | | | | | | | | | | | | | | |
| | | | | |
Net investment income and net foreign currency gains | | | (1.43 | ) | | | (1.01 | ) | | | (0.96 | ) | | | (1.28 | ) | | | (1.15 | ) |
| | | | | |
Net realized gains | | | (0.09 | ) | | | — | | | | (0.24 | ) | | | (0.03 | ) | | | (0.13 | ) |
| | | | |
Total distributions | | | (1.52 | ) | | | (1.01 | ) | | | (1.20 | ) | | | (1.31 | ) | | | (1.28 | ) |
| | | | |
Redemption fees | | | — | | | | — | c | | | — | c | | | — | c | | | — | c |
| | | | |
Net asset value, end of year | | | $16.34 | | | | $18.56 | | | | $19.15 | | | | $20.01 | | | | $18.61 | |
| | | | |
| | | | | |
Total returnd | | | (4.10)% | | | | 2.12% | | | | 1.89% | | | | 15.31% | | | | (0.61)% | |
| | | | | |
| Ratios to average net assets | | | | | | | | | | | | | | | | | | | | |
| | | | | |
Expensese | | | 0.52% | f | | | 0.51% | | | | 0.51% | | | | 0.55% | | | | 0.56% | |
| | | | | |
Net investment income | | | 2.99% | | | | 3.08% | | | | 3.26% | | | | 3.71% | | | | 4.40% | |
| | | | | |
| Supplemental data | | | | | | | | | | | | | | | | | | | | |
| | | | | |
Net assets, end of year (000’s) | | | $292,802 | | | | $323,491 | | | | $280,963 | | | | $307,142 | | | | $269,819 | |
| | | | | |
Portfolio turnover rate | | | 51.58% | | | | 39.14% | | | | 34.39% | | | | 43.26% | | | | 34.18% | |
aThe amount shown for a share outstanding throughout the period may not correlate with the Statement of Operations for the period due to the timing of sales and repurchases of the Fund’s shares in relation to income earned, adjustments to interest income for the inflation-indexed bonds, and/or fluctuating fair value of the investments of the Fund.
bBased on average daily shares outstanding.
cAmount rounds to less than $0.01 per share.
dTotal return does not include fees, charges or expenses imposed by the variable annuity and life insurance contracts for which Franklin Templeton Variable Insurance Products Trust serves as an underlying investment vehicle.
eBenefit of expense reduction rounds to less than 0.01%.
fBenefit of waiver and payments by affiliates rounds to less than 0.01%.
| | | | |
| TGB-6 | | Annual Report | The accompanying notes are an integral part of these financial statements. | | |
FRANKLIN TEMPLETON VARIABLE INSURANCE PRODUCTS TRUST
FINANCIAL HIGHLIGHTS
Templeton Global Bond VIP Fund (continued)
| | | | | | | | | | | | | | | | | | | | |
| | | Year Ended December 31, | |
| | | 2015 | | | 2014 | | | 2013 | | | 2012 | | | 2011 | |
| Class 2 | | | | | | | | | | | | | | | | | | | | |
Per share operating performance
(for a share outstanding throughout the year) | | | | | | | | | | | | | | | | | | | | |
| | | | | |
Net asset value, beginning of year | | | $17.99 | | | | $18.60 | | | | $19.47 | | | | $18.15 | | | | $19.49 | |
| | | | |
| | | | | |
| Income from investment operationsa: | | | | | | | | | | | | | | | | | | | | |
| | | | | |
Net investment incomeb | | | 0.46 | | | | 0.52 | | | | 0.57 | | | | 0.65 | | | | 0.79 | |
| | | | | |
Net realized and unrealized gains (losses) | | | (1.17 | ) | | | (0.17 | ) | | | (0.27 | ) | | | 1.94 | | | | (0.89 | ) |
| | | | |
Total from investment operations | | | (0.71 | ) | | | 0.35 | | | | 0.30 | | | | 2.59 | | | | (0.10 | ) |
| | | | |
| | | | | |
| Less distributions from: | | | | | | | | | | | | | | | | | | | | |
| | | | | |
Net investment income and net foreign currency gains | | | (1.39 | ) | | | (0.96 | ) | | | (0.93 | ) | | | (1.24 | ) | | | (1.11 | ) |
| | | | | |
Net realized gains | | | (0.09 | ) | | | — | | | | (0.24 | ) | | | (0.03 | ) | | | (0.13 | ) |
| | | | |
Total distributions | | | (1.48 | ) | | | (0.96 | ) | | | (1.17 | ) | | | (1.27 | ) | | | (1.24 | ) |
| | | | |
Redemption fees | | | — | | | | — | c | | | — | c | | | — | c | | | — | c |
| | | | |
Net asset value, end of year | | | $15.80 | | | | $17.99 | | | | $18.60 | | | | $19.47 | | | | $18.15 | |
| | | | |
| | | | | |
Total returnd | | | (4.30)% | | | | 1.83% | | | | 1.63% | | | | 15.07% | | | | (0.87)% | |
| | | | | |
| Ratios to average net assets | | | | | | | | | | | | | | | | | | | | |
| | | | | |
Expensese | | | 0.77% | f | | | 0.76% | | | | 0.76% | | | | 0.80% | | | | 0.81% | |
| | | | | |
Net investment income | | | 2.74% | | | | 2.83% | | | | 3.01% | | | | 3.46% | | | | 4.15% | |
| | | | | |
| Supplemental data | | | | | | | | | | | | | | | | | | | | |
| | | | | |
Net assets, end of year (000’s) | | | $2,971,667 | | | | $3,177,638 | | | | $2,826,039 | | | | $2,418,229 | | | | $1,812,814 | |
| | | | | |
Portfolio turnover rate | | | 51.58% | | | | 39.14% | | | | 34.39% | | | | 43.26% | | | | 34.18% | |
aThe amount shown for a share outstanding throughout the period may not correlate with the Statement of Operations for the period due to the timing of sales and repurchases of the Fund’s shares in relation to income earned, adjustments to interest income for the inflation-indexed bonds, and/or fluctuating fair value of the investments of the Fund.
bBased on average daily shares outstanding.
cAmount rounds to less than $0.01 per share.
dTotal return does not include fees, charges or expenses imposed by the variable annuity and life insurance contracts for which Franklin Templeton Variable Insurance Products Trust serves as an underlying investment vehicle.
eBenefit of expense reduction rounds to less than 0.01%.
fBenefit of waiver and payments by affiliates rounds to less than 0.01%.
| | | | | | |
| | | The accompanying notes are an integral part of these financial statements. | Annual Report | | | TGB-7 | |
FRANKLIN TEMPLETON VARIABLE INSURANCE PRODUCTS TRUST
FINANCIAL HIGHLIGHTS
Templeton Global Bond VIP Fund (continued)
| | | | | | | | | | | | | | | | | | | | |
| | | Year Ended December 31, | |
| | | 2015 | | | 2014 | | | 2013 | | | 2012 | | | 2011 | |
| Class 4 | | | | | | | | | | | | | | | | | | | | |
Per share operating performance
(for a share outstanding throughout the year) | | | | | | | | | | | | | | | | | | | | |
| | | | | |
Net asset value, beginning of year | | | $18.38 | | | | $18.97 | | | | $19.82 | | | | $18.44 | | | | $19.78 | |
| | | | |
| | | | | |
| Income from investment operationsa: | | | | | | | | | | | | | | | | | | | | |
| | | | | |
Net investment incomeb | | | 0.46 | | | | 0.51 | | | | 0.56 | | | | 0.64 | | | | 0.79 | |
| | | | | |
Net realized and unrealized gains (losses) | | | (1.21 | ) | | | (0.18 | ) | | | (0.28 | ) | | | 1.98 | | | | (0.91 | ) |
| | | | |
Total from investment operations | | | (0.75 | ) | | | 0.33 | | | | 0.28 | | | | 2.62 | | | | (0.12 | ) |
| | | | |
| | | | | |
| Less distributions from: | | | | | | | | | | | | | | | | | | | | |
| | | | | |
Net investment income and net foreign currency gains | | | (1.36 | ) | | | (0.92 | ) | | | (0.89 | ) | | | (1.21 | ) | | | (1.09 | ) |
| | | | | |
Net realized gains | | | (0.09 | ) | | | — | | | | (0.24 | ) | | | (0.03 | ) | | | (0.13 | ) |
| | | | |
Total distributions | | | (1.45 | ) | | | (0.92 | ) | | | (1.13 | ) | | | (1.24 | ) | | | (1.22 | ) |
| | | | |
Redemption fees | | | — | | | | — | c | | | — | c | | | — | c | | | — | c |
| | | | |
Net asset value, end of year | | | $16.18 | | | | $18.38 | | | | $18.97 | | | | $19.82 | | | | $18.44 | |
| | | | |
| | | | | |
Total returnd | | | (4.39)% | | | | 1.69% | | | | 1.54% | | | | 14.97% | | | | (0.96)% | |
| | | | | |
| Ratios to average net assets | | | | | | | | | | | | | | | | | | | | |
| | | | | |
Expensese | | | 0.87% | f | | | 0.86% | | | | 0.86% | | | | 0.90% | | | | 0.91% | |
| | | | | |
Net investment income | | | 2.64% | | | | 2.73% | | | | 2.91% | | | | 3.36% | | | | 4.05% | |
| | | | | |
| Supplemental data | | | | | | | | | | | | | | | | | | | | |
| | | | | |
Net assets, end of year (000’s) | | | $103,045 | | | | $111,199 | | | | $118,145 | | | | $163,241 | | | | $151,695 | |
| | | | | |
Portfolio turnover rate | | | 51.58% | | | | 39.14% | | | | 34.39% | | | | 43.26% | | | | 34.18% | |
aThe amount shown for a share outstanding throughout the period may not correlate with the Statement of Operations for the period due to the timing of sales and repurchases of the Fund’s shares in relation to income earned, adjustments to interest income for the inflation-indexed bonds, and/or fluctuating fair value of the investments of the Fund.
bBased on average daily shares outstanding.
cAmount rounds to less than $0.01 per share.
dTotal return does not include fees, charges or expenses imposed by the variable annuity and life insurance contracts for which Franklin Templeton Variable Insurance Products Trust serves as an underlying investment vehicle.
eBenefit of expense reduction rounds to less than 0.01%.
fBenefit of waiver and payments by affiliates rounds to less than 0.01%.
| | | | |
| TGB-8 | | Annual Report | The accompanying notes are an integral part of these financial statements. | | |
FRANKLIN TEMPLETON VARIABLE INSURANCE PRODUCTS TRUST
Statement of Investments, December 31, 2015
| | | | | | | | | | |
Templeton Global Bond VIP Fund | |
| | | | | Principal Amount* | | | Value | |
| | Foreign Government and Agency Securities 60.0% | | | | | | | | |
| | Brazil 4.8% | | | | | | | | |
| | Letra Tesouro Nacional, Strip, | | | | | | | | |
| | 1/01/16 | | | 38,490 | a BRL | | $ | 9,712,603 | |
| | 7/01/16 | | | 8,470 | a BRL | | | 1,995,523 | |
| | 10/01/16 | | | 4,700 | a BRL | | | 1,064,134 | |
| | 1/01/17 | | | 46,660 | a BRL | | | 10,180,770 | |
| | 1/01/18 | | | 28,770 | a BRL | | | 5,366,108 | |
| | 1/01/19 | | | 66,660 | a BRL | | | 10,631,864 | |
| | 7/01/19 | | | 102,840 | a BRL | | | 15,206,224 | |
| | Nota Do Tesouro Nacional, | | | | | | | | |
| | 10.00%, 1/01/17 | | | 113,220 | a BRL | | | 27,206,931 | |
| | 10.00%, 1/01/21 | | | 44,610 | a BRL | | | 8,963,284 | |
| | 10.00%, 1/01/23 | | | 34,570 | a BRL | | | 6,544,573 | |
| | 10.00%, 1/01/25 | | | 42,400 | a BRL | | | 7,659,105 | |
| | bIndex Linked, 6.00%, 8/15/16 | | | 14,388 | a BRL | | | 10,073,077 | |
| | bIndex Linked, 6.00%, 5/15/17 | | | 202 | a BRL | | | 140,772 | |
| | bIndex Linked, 6.00%, 8/15/18 | | | 15,665 | a BRL | | | 10,739,848 | |
| | bIndex Linked, 6.00%, 5/15/19 | | | 8,578 | a BRL | | | 5,807,890 | |
| | bIndex Linked, 6.00%, 8/15/20 | | | 1,090 | a BRL | | | 728,030 | |
| | bIndex Linked, 6.00%, 8/15/22 | | | 18,770 | a BRL | | | 12,252,253 | |
| | bIndex Linked, 6.00%, 5/15/23 | | | 5,716 | a BRL | | | 3,707,620 | |
| | bIndex Linked, 6.00%, 8/15/24 | | | 3,110 | a BRL | | | 2,002,735 | |
| | bIndex Linked, 6.00%, 5/15/45 | | | 10,825 | a BRL | | | 6,398,288 | |
| | senior note, 10.00%, 1/01/19 | | | 21,390 | a BRL | | | 4,642,145 | |
| | | | | | | | | | |
| | | | | | | | | 161,023,777 | |
| | | | | | | | | | |
| | Hungary 1.6% | | | | | | | | |
| | Government of Hungary, | | | | | | | | |
| | 5.375%, 2/21/23 | | | 22,870,000 | | | | 24,955,744 | |
| | A, 6.75%, 11/24/17 | | | 1,771,440,000 | HUF | | | 6,682,392 | |
| | senior note, 6.25%, 1/29/20 | | | 5,510,000 | | | | 6,166,792 | |
| | senior note, 6.375%, 3/29/21 | | | 13,890,000 | | | | 15,828,072 | |
| | | | | | | | | | |
| | | | | | | | | 53,633,000 | |
| | | | | | | | | | |
| | Iceland 0.2% | | | | | | | | |
| c | | Government of Iceland, 144A, 5.875%, 5/11/22 | | | 6,830,000 | | | | 7,769,057 | |
| | | | | | | | | | |
| | India 2.0% | | | | | | | | |
| | Government of India, | | | | | | | | |
| | senior bond, 7.80%, 5/03/20 | | | 720,800,000 | INR | | | 10,920,953 | |
| | senior bond, 8.35%, 5/14/22 | | | 212,700,000 | INR | | | 3,286,920 | |
| | senior bond, 8.28%, 9/21/27 | | | 217,800,000 | INR | | | 3,357,755 | |
| | senior bond, 8.60%, 6/02/28 | | | 747,500,000 | INR | | | 11,824,131 | |
| | senior note, 7.28%, 6/03/19 | | | 28,000,000 | INR | | | 418,899 | |
| | senior note, 8.12%, 12/10/20 | | | 541,300,000 | INR | | | 8,306,545 | |
| | senior note, 7.16%, 5/20/23 | | | 133,700,000 | INR | | | 1,937,026 | |
| | senior note, 8.83%, 11/25/23 | | | 1,805,900,000 | INR | | | 28,692,307 | |
| | | | | | | | | | |
| | | | | | | | | 68,744,536 | |
| | | | | | | | | | |
| | Indonesia 4.9% | | | | | | | | |
| | Government of Indonesia, | | | | | | | | |
| | 7.875%, 4/15/19 | | | 183,709,000,000 | IDR | | | 13,024,527 | |
| | 6.125%, 5/15/28 | | | 37,000,000 | IDR | | | 2,115 | |
| | 8.375%, 3/15/34 | | | 81,180,000,000 | IDR | | | 5,534,666 | |
FRANKLIN TEMPLETON VARIABLE INSURANCE PRODUCTS TRUST
STATEMENT OF INVESTMENTS
Templeton Global Bond VIP Fund (continued)
| | | | | | | | | | |
| | | | | Principal Amount* | | | Value | |
| | Foreign Government and Agency Securities (continued) | | | | | | | | |
| | Indonesia (continued) | | | | | | | | |
| | FR31, 11.00%, 11/15/20 | | | 243,080,000,000 | IDR | | $ | 19,135,136 | |
| | FR34, 12.80%, 6/15/21 | | | 390,269,000,000 | IDR | | | 33,065,658 | |
| | FR35, 12.90%, 6/15/22 | | | 70,838,000,000 | IDR | | | 6,139,721 | |
| | FR36, 11.50%, 9/15/19 | | | 49,810,000,000 | IDR | | | 3,914,065 | |
| | FR39, 11.75%, 8/15/23 | | | 5,491,000,000 | IDR | | | 459,890 | |
| | FR40, 11.00%, 9/15/25 | | | 46,856,000,000 | IDR | | | 3,869,125 | |
| | FR43, 10.25%, 7/15/22 | | | 146,713,000,000 | IDR | | | 11,359,283 | |
| | FR44, 10.00%, 9/15/24 | | | 4,454,000,000 | IDR | | | 343,237 | |
| | FR46, 9.50%, 7/15/23 | | | 226,780,000,000 | IDR | | | 16,982,806 | |
| | FR47, 10.00%, 2/15/28 | | | 12,000,000 | IDR | | | 931 | |
| | FR48, 9.00%, 9/15/18 | | | 16,920,000,000 | IDR | | | 1,235,857 | |
| | FR61, 7.00%, 5/15/22 | | | 242,612,000,000 | IDR | | | 16,105,215 | |
| | senior bond, 5.625%, 5/15/23 | | | 258,112,000,000 | IDR | | | 15,496,089 | |
| | senior bond, 7.00%, 5/15/27 | | | 25,000,000 | IDR | | | 1,568 | |
| | senior bond, 9.00%, 3/15/29 | | | 20,350,000,000 | IDR | | | 1,483,354 | |
| | senior bond, FR53, 8.25%, 7/15/21 | | | 86,937,000,000 | IDR | | | 6,169,580 | |
| | senior bond, FR56, 8.375%, 9/15/26 | | | 32,066,000,000 | IDR | | | 2,279,216 | |
| | senior bond, FR70, 8.375%, 3/15/24 | | | 120,751,000,000 | IDR | | | 8,539,052 | |
| | senior note, 8.50%, 10/15/16 | | | 3,358,000,000 | IDR | | | 244,114 | |
| | | | | | | | | | |
| | | | | | | | | 165,385,205 | |
| | | | | | | | | | |
| | Ireland 0.8% | | | | | | | | |
| | Government of Ireland, senior bond, 5.40%, 3/13/25 | | | 18,421,980 | EUR | | | 27,408,496 | |
| | | | | | | | | | |
| | Lithuania 0.4% | | | | | | | | |
| c | | Government of Lithuania, 144A, | | | | | | | | |
| | 7.375%, 2/11/20 | | | 10,560,000 | | | | 12,520,200 | |
| | 6.125%, 3/09/21 | | | 1,890,000 | | | | 2,182,043 | |
| | | | | | | | | | |
| | | | | | | | | 14,702,243 | |
| | | | | | | | | | |
| | Malaysia 8.6% | | | | | | | | |
| | Government of Malaysia, | | | | | | | | |
| | 3.314%, 10/31/17 | | | 275,430,000 | MYR | | | 64,684,192 | |
| | senior bond, 4.262%, 9/15/16 | | | 88,243,000 | MYR | | | 20,791,724 | |
| | senior bond, 3.814%, 2/15/17 | | | 63,785,000 | MYR | | | 15,046,931 | |
| | senior bond, 4.24%, 2/07/18 | | | 44,360,000 | MYR | | | 10,603,316 | |
| | senior note, 3.172%, 7/15/16 | | | 178,906,000 | MYR | | | 41,806,959 | |
| | senior note, 3.394%, 3/15/17 | | | 387,890,000 | MYR | | | 91,122,304 | |
| | senior note, 4.012%, 9/15/17 | | | 185,720,000 | MYR | | | 44,118,611 | |
| | | | | | | | | | |
| | | | | | | | | 288,174,037 | |
| | | | | | | | | | |
| | Mexico 8.3% | | | | | | | | |
| | Government of Mexico, | | | | | | | | |
| | 6.25%, 6/16/16 | | | 5,519,810 | d MXN | | | 32,419,236 | |
| | 7.25%, 12/15/16 | | | 18,216,300 | d MXN | | | 109,262,392 | |
| | 7.75%, 12/14/17 | | | 11,282,600 | d MXN | | | 70,039,841 | |
| | senior note, 8.50%, 12/13/18 | | | 8,527,900 | d MXN | | | 54,569,159 | |
| e | | Mexican Udibonos, Index Linked, | | | | | | | | |
| | 5.00%, 6/16/16 | | | 605,490 | f MXN | | | 3,533,956 | |
| | 3.50%, 12/14/17 | | | 607,050 | f MXN | | | 3,626,998 | |
| | 4.00%, 6/13/19 | | | 416,664 | f MXN | | | 2,513,972 | |
| | 2.50%, 12/10/20 | | | 328,144 | f MXN | | | 1,851,686 | |
| | | | | | | | | | |
| | | | | | | | | 277,817,240 | |
| | | | | | | | | | |
FRANKLIN TEMPLETON VARIABLE INSURANCE PRODUCTS TRUST
STATEMENT OF INVESTMENTS
Templeton Global Bond VIP Fund (continued)
| | | | | | | | | | |
| | | | | Principal Amount* | | | Value | |
| | Foreign Government and Agency Securities (continued) | | | | | | | | |
| | Peru 0.1% | | | | | | | | |
| | Government of Peru, senior bond, 7.84%, 8/12/20 | | | 11,090,000 | PEN | | $ | 3,429,520 | |
| | | | | | | | | | |
| | Philippines 1.3% | | | | | | | | |
| | Government of the Philippines, | | | | | | | | |
| | senior bond, 9.125%, 9/04/16 | | | 31,840,000 | PHP | | | 702,997 | |
| | senior note, 7.00%, 1/27/16 | | | 1,053,730,000 | PHP | | | 22,498,500 | |
| | senior note, 1.625%, 4/25/16 | | | 1,008,970,000 | PHP | | | 21,443,748 | |
| | | | | | | | | | |
| | | | | | | | | 44,645,245 | |
| | | | | | | | | | |
| | Poland 4.8% | | | | | | | | |
| | Government of Poland, | | | | | | | | |
| | 5.00%, 4/25/16 | | | 61,000,000 | PLN | | | 15,715,926 | |
| | 4.75%, 10/25/16 | | | 340,685,000 | PLN | | | 89,115,692 | |
| | 5.75%, 9/23/22 | | | 48,750,000 | PLN | | | 14,796,189 | |
| | gFRN, 1.79%, 1/25/17 | | | 59,279,000 | PLN | | | 15,134,034 | |
| | gFRN, 1.79%, 1/25/21 | | | 60,135,000 | PLN | | | 15,099,553 | |
| | Strip, 1/25/16 | | | 47,077,000 | PLN | | | 11,993,579 | |
| | | | | | | | | | |
| | | | | | | | | 161,854,973 | |
| | | | | | | | | | |
| | Portugal 2.4% | | | | | | | | |
| | Government of Portugal, | | | | | | | | |
| | c144A, 5.125%, 10/15/24 | | | 28,820,000 | | | | 29,608,371 | |
| | hReg S, 3.875%, 2/15/30 | | | 41,530,000 | EUR | | | 49,007,380 | |
| | hsenior bond, Reg S, 4.95%, 10/25/23 | | | 284,900 | EUR | | | 370,942 | |
| | hsenior bond, Reg S, 5.65%, 2/15/24 | | | 712,400 | EUR | | | 960,995 | |
| | | | | | | | | | |
| | | | | | | | | 79,947,688 | |
| | | | | | | | | | |
| | Serbia 1.5% | | | | | | | | |
| c | | Government of Serbia, senior note, 144A, | | | | | | | | |
| | 5.25%, 11/21/17 | | | 4,590,000 | | | | 4,766,944 | |
| | 4.875%, 2/25/20 | | | 8,800,000 | | | | 9,031,308 | |
| | 7.25%, 9/28/21 | | | 32,130,000 | | | | 36,464,819 | |
| | | | | | | | | | |
| | | | | | | | | 50,263,071 | |
| | | | | | | | | | |
| | Singapore 0.2% | | | | | | | | |
| | Government of Singapore, senior note, 1.125%, 4/01/16 | | | 11,000,000 | SGD | | | 7,763,383 | |
| | | | | | | | | | |
| | Slovenia 0.4% | | | | | | | | |
| c | | Government of Slovenia, senior note, 144A, | | | | | | | | |
| | 5.50%, 10/26/22 | | | 7,940,000 | | | | 8,883,232 | |
| | 5.85%, 5/10/23 | | | 3,630,000 | | | | 4,140,632 | |
| | | | | | | | | | |
| | | | | | | | | 13,023,864 | |
| | | | | | | | | | |
| | South Korea 12.5% | | | | | | | | |
| | Korea Monetary Stabilization Bond, senior note, | | | | | | | | |
| | 2.78%, 2/02/16 | | | 20,416,550,000 | KRW | | | 17,388,124 | |
| | 1.92%, 3/09/16 | | | 640,770,000 | KRW | | | 545,559 | |
| | 2.80%, 4/02/16 | | | 38,761,670,000 | KRW | | | 33,081,170 | |
| | 1.74%, 5/09/16 | | | 11,405,300,000 | KRW | | | 9,710,395 | |
| | 2.79%, 6/02/16 | | | 25,559,400,000 | KRW | | | 21,856,091 | |
| | 1.62%, 6/09/16 | | | 6,427,100,000 | KRW | | | 5,469,660 | |
| | 2.46%, 8/02/16 | | | 49,449,700,000 | KRW | | | 42,291,440 | |
| | 1.56%, 8/09/16 | | | 33,975,300,000 | KRW | | | 28,903,216 | |
| | 2.22%, 10/02/16 | | | 9,647,500,000 | KRW | | | 8,246,559 | |
FRANKLIN TEMPLETON VARIABLE INSURANCE PRODUCTS TRUST
STATEMENT OF INVESTMENTS
Templeton Global Bond VIP Fund (continued)
| | | | | | | | | | |
| | | | | Principal Amount* | | | Value | |
| | Foreign Government and Agency Securities (continued) | | | | | | | | |
| | South Korea (continued) | | | | | | | | |
| | 1.61%, 11/09/16 | | | 33,034,700,000 | KRW | | $ | 28,108,374 | |
| | 2.07%, 12/02/16 | | | 35,696,200,000 | KRW | | | 30,497,562 | |
| | 1.96%, 2/02/17 | | | 16,503,100,000 | KRW | | | 14,093,258 | |
| | 1.70%, 8/02/17 | | | 9,221,100,000 | KRW | | | 7,854,533 | |
| | 1.56%, 10/02/17 | | | 54,756,600,000 | KRW | | | 46,535,773 | |
| | Korea Treasury Bond, senior note, | | | | | | | | |
| | 4.00%, 3/10/16 | | | 1,283,100,000 | KRW | | | 1,096,560 | |
| | 2.75%, 6/10/16 | | | 41,951,400,000 | KRW | | | 35,874,870 | |
| | 5.00%, 9/10/16 | | | 2,806,000,000 | KRW | | | 2,442,317 | |
| | 3.00%, 12/10/16 | | | 52,145,160,000 | KRW | | | 44,934,877 | |
| | 2.00%, 12/10/17 | | | 49,196,500,000 | KRW | | | 42,150,405 | |
| | | | | | | | | | |
| | | | | | | | | 421,080,743 | |
| | | | | | | | | | |
| | Sri Lanka 1.2% | | | | | | | | |
| | Government of Sri Lanka, | | | | | | | | |
| | 8.25%, 3/01/17 | | | 41,710,000 | LKR | | | 290,841 | |
| | 8.00%, 6/15/17 | | | 40,210,000 | LKR | | | 279,064 | |
| | 10.60%, 7/01/19 | | | 1,071,930,000 | LKR | | | 7,721,760 | |
| | 10.60%, 9/15/19 | | | 704,060,000 | LKR | | | 5,080,360 | |
| | 8.00%, 11/01/19 | | | 40,210,000 | LKR | | | 266,968 | |
| | 9.25%, 5/01/20 | | | 153,220,000 | LKR | | | 1,043,080 | |
| | 11.20%, 7/01/22 | | | 69,990,000 | LKR | | | 515,216 | |
| | A, 6.40%, 8/01/16 | | | 109,200,000 | LKR | | | 754,968 | |
| | A, 5.80%, 1/15/17 | | | 112,300,000 | LKR | | | 765,252 | |
| | A, 7.50%, 8/15/18 | | | 63,830,000 | LKR | | | 427,382 | |
| | A, 8.00%, 11/15/18 | | | 512,300,000 | LKR | | | 3,458,904 | |
| | A, 9.00%, 5/01/21 | | | 861,720,000 | LKR | | | 5,786,218 | |
| | A, 11.00%, 8/01/21 | | | 575,640,000 | LKR | | | 4,182,080 | |
| | B, 6.40%, 10/01/16 | | | 119,100,000 | LKR | | | 820,919 | |
| | B, 8.50%, 7/15/18 | | | 146,350,000 | LKR | | | 1,009,785 | |
| | C, 8.50%, 4/01/18 | | | 483,480,000 | LKR | | | 3,338,593 | |
| | D, 8.50%, 6/01/18 | | | 633,000,000 | LKR | | | 4,357,936 | |
| | | | | | | | | | |
| | | | | | | | | 40,099,326 | |
| | | | | | | | | | |
| i | | Supranational 0.4% | | | | | | | | |
| | Inter-American Development Bank, senior note, 7.50%, 12/05/24 | | | 200,000,000 | MXN | | | 13,012,707 | |
| | | | | | | | | | |
| | Ukraine 3.6% | | | | | | | | |
| c | | Government of Ukraine, 144A, | | | | | | | | |
| | 7.75%, 9/01/19 | | | 4,249,000 | | | | 3,968,205 | |
| | 7.75%, 9/01/20 | | | 14,822,000 | | | | 13,711,684 | |
| | 7.75%, 9/01/21 | | | 14,769,000 | | | | 13,514,595 | |
| | 7.75%, 9/01/22 | | | 14,769,000 | | | | 13,435,950 | |
| | 7.75%, 9/01/23 | | | 14,769,000 | | | | 13,231,916 | |
| | 7.75%, 9/01/24 | | | 14,769,000 | | | | 13,140,422 | |
| | 7.75%, 9/01/25 | | | 14,769,000 | | | | 13,059,710 | |
| | 7.75%, 9/01/26 | | | 14,658,000 | | | | 12,823,478 | |
| | 7.75%, 9/01/27 | | | 14,658,000 | | | | 12,805,009 | |
| | j GDP Linked Securities, 5/31/40 | | | 29,978,000 | | | | 12,103,619 | |
| | | | | | | | | | |
| | | | | | | | | 121,794,588 | |
| | | | | | | | | | |
| | | |
| | Total Foreign Government and Agency Securities
(Cost $2,283,860,850) | | | | | | | 2,021,572,699 | |
| | | | | | | | | | |
FRANKLIN TEMPLETON VARIABLE INSURANCE PRODUCTS TRUST
STATEMENT OF INVESTMENTS
Templeton Global Bond VIP Fund (continued)
| | | | | | | | | | |
| | | | | Principal Amount* | | | Value | |
| | Quasi-Sovereign and Corporate Bonds 0.1% | | | | | | | | |
| | South Korea 0.0%† | | | | | | | | |
| | The Export-Import Bank of Korea, senior note, 4.625%, 2/20/17 | | | 230,000 | EUR | | $ | 262,412 | |
| | | | | | | | | | |
| | Ukraine 0.1% | | | | | | | | |
| c,k | | Ukreiximbank (BIZ Finance PLC), loan participation, senior bond, 144A, 9.75%, 1/22/25 | | | 2,480,000 | | | | 2,161,084 | |
| | | | | | | | | | |
| | | |
| | Total Quasi-Sovereign and Corporate Bonds (Cost $2,459,865) | | | | | | | 2,423,496 | |
| | | | | | | | | | |
| | | |
| | Total Investments before Short Term Investments
(Cost $2,286,320,715) | | | | | | | 2,023,996,195 | |
| | | | | | | | | | |
| | Short Term Investments 37.3% | | | | | | | | |
| | Foreign Government and Agency Securities 11.4% | | | | | | | | |
| | Indonesia 0.1% | | | | | | | | |
| l | | Indonesia Treasury Bill, 1/07/16 - 2/04/16 | | | 40,862,000,000 | IDR | | | 2,956,432 | |
| | | | | | | | | | |
| | Malaysia 1.3% | | | | | | | | |
| l | | Bank of Negara Monetary Note, 3/01/16 - 10/11/16 | | | 156,667,000 | MYR | | | 36,013,653 | |
| l | | Malaysia Treasury Bill, 1/22/16 - 5/27/16 | | | 27,090,000 | MYR | | | 6,272,844 | |
| | | | | | | | | | |
| | | | | | | | | 42,286,497 | |
| | | | | | | | | | |
| | Mexico 8.8% | | | | | | | | |
| l | | Mexico Treasury Bill, | | | | | | | | |
| | 3/31/16 | | | 132,797,920 | m MXN | | | 76,404,072 | |
| | 5/26/16 | | | 59,766,780 | m MXN | | | 34,216,351 | |
| | 6/23/16 | | | 87,177,870 | m MXN | | | 49,767,512 | |
| | 1/07/16 - 12/08/16 | | | 233,570,980 | m MXN | | | 134,405,459 | |
| | | | | | | | | | |
| | | | | | | | | 294,793,394 | |
| | | | | | | | | | |
| | Philippines 0.5% | | | | | | | | |
| l | | Philippine Treasury Bill, 2/03/16 - 12/07/16 | | | 837,140,000 | PHP | | | 17,728,619 | |
| | | | | | | | | | |
| | Singapore 0.0%† | | | | | | | | |
| l | | Monetary Authority of Singapore Treasury Bill, 1/05/16 | | | 1,760,000 | SGD | | | 1,241,257 | |
| | | | | | | | | | |
| | South Korea 0.7% | | | | | | | | |
| | Korea Monetary Stabilization Bond, | | | | | | | | |
| | l 1/05/16 - 4/19/16 | | | 8,584,900,000 | KRW | | | 7,295,900 | |
| | senior note, 1.57%, 7/09/16 | | | 5,579,800,000 | KRW | | | 4,747,518 | |
| | senior note, 1.52%, 9/09/16 | | | 8,119,500,000 | KRW | | | 6,905,130 | |
| | senior note, 1.53%, 10/08/16 | | | 5,289,000,000 | KRW | | | 4,497,713 | |
| | | | | | | | | | |
| | | | | | | | | 23,446,261 | |
| | | | | | | | | | |
| | | |
| | Total Foreign Government and Agency Securities
(Cost $411,785,568) | | | | | | | 382,452,460 | |
| | | | | | | | | | |
| | U.S. Government and Agency Securities (Cost $194,999,350) 5.8% | | | | | | | | |
| l | | FHLB, 1/04/16 | | | 195,000,000 | | | | 195,000,000 | |
| | | | | | | | | | |
| | | |
| | Total Investments before Money Market Funds and Repurchase Agreements (Cost $2,893,105,633) | | | | | | | 2,601,448,655 | |
| | | | | | | | | | |
| | | |
| | | | | Shares | | | | |
| | Money Market Funds (Cost $420,632,565) 12.5% | | | | | | | | |
| | United States 12.5% | | | | | | | | |
| n,o | | Institutional Fiduciary Trust Money Market Portfolio | | | 420,632,565 | | | | 420,632,565 | |
| | | | | | | | | | |
FRANKLIN TEMPLETON VARIABLE INSURANCE PRODUCTS TRUST
STATEMENT OF INVESTMENTS
Templeton Global Bond VIP Fund (continued)
| | | | | | | | | | |
| | | | | Principal Amount* | | | Value | |
| | Repurchase Agreements (Cost $256,339,988) 7.6% | | | | | | | | |
| | United States 7.6% | | | | | | | | |
| p | | Joint Repurchase Agreement, 0.279%, 1/04/16 (Maturity Value $256,347,934) | | | 256,339,988 | | | $ | 256,339,988 | |
| | BNP Paribas Securities Corp. (Maturity Value $74,351,155) | | | | | | | | |
| | HSBC Securities (USA) Inc. (Maturity Value $156,141,526) | | | | | | | | |
| | Merrill Lynch, Pierce, Fenner & Smith Inc. (Maturity Value $25,855,253) | | | | | | | | |
| | Collateralized by U.S. Government Agency Securities, 0.184% - 0.289%, 5/08/17 - 4/09/18; lU.S. Treasury Bill, 3/03/16 - 5/26/16; and U.S. Treasury Note, 1.375% - 2.625%, 2/29/20 - 11/15/20 (valued at $261,629,800) | | | | | | | | |
| | | | | | | | | | |
| | Total Investments (Cost $3,570,078,186) 97.4% | | | | | | | 3,278,421,208 | |
| | Other Assets, less Liabilities 2.6% | | | | | | | 89,093,580 | |
| | | | | | | | | | |
| | Net Assets 100.0% | | | | | | $ | 3,367,514,788 | |
| | | | | | | | | | |
See Abbreviations on page TGB-37.
†Rounds to less than 0.1% of net assets.
*The principal amount is stated in U.S. dollars unless otherwise indicated.
aPrincipal amount is stated in 1,000 Brazilian Real Units.
bRedemption price at maturity is adjusted for inflation. See Note 1(h).
cSecurity was purchased pursuant to Rule 144A under the Securities Act of 1933 and may be sold in transactions exempt from registration only to qualified institutional buyers or in a public offering registered under the Securities Act of 1933. These securities have been deemed liquid under guidelines approved by the Trust’s Board of Trustees. At December 31, 2015, the aggregate value of these securities was $239,322,278, representing 7.11% of net assets.
dPrincipal amount is stated in 100 Mexican Peso Units.
ePrincipal amount of security is adjusted for inflation. See Note 1(h).
fPrincipal amount is stated in Unidad de Inversion Units.
gThe coupon rate shown represents the rate at period end.
hSecurity was purchased pursuant to Regulation S under the Securities Act of 1933, which exempts from registration securities offered and sold outside of the United States. Such a security cannot be sold in the United States without either an effective registration statement filed pursuant to the Securities Act of 1933, or pursuant to an exemption from registration. These securities have been deemed liquid under guidelines approved by the Trust’s Board of Trustees. At December 31, 2015, the aggregate value of these securities was $50,339,317, representing 1.49% of net assets.
iA supranational organization is an entity formed by two or more central governments through international treaties.
jSecurity is linked to the Ukrainian GDP and does not pay principal over the life of the security or at expiration. The holder is entitled to receive only variable payments, subject to certain conditions, which are based on the growth of the Ukrainian GDP and the principal of “notional” value of this GDP linked security.
kSee Note 1(f) regarding loan participation notes.
lThe security is traded on a discount basis with no stated coupon rate.
mPrincipal amount is stated in 10 Mexican Peso Units.
nNon-income producing.
oSee Note 3(e) regarding investments in affiliated management investment companies.
pSee Note 1(c) regarding joint repurchase agreement.
FRANKLIN TEMPLETON VARIABLE INSURANCE PRODUCTS TRUST
STATEMENT OF INVESTMENTS
Templeton Global Bond VIP Fund (continued)
At December 31, 2015, the Fund had the following forward exchange contracts outstanding. See Note 1(d).
| | | | | | | | | | | | | | | | | | | | | | | | | | | | | | | | |
| Forward Exchange Contracts | | | | | | | |
| Currency | | Counterpartya | | | Type | | | Quantity | | | Contract
Amount* | | | | | | Settlement
Date | | | Unrealized
Appreciation | | | Unrealized
Depreciation | |
| OTC Forward Exchange Contracts | | | | | | | | | | | | | | | | | | | | | | | | | | | | | | | | |
Euro | | | BZWS | | | | Sell | | | | 6,863,000 | | | | 8,364,804 | | | | | | | | 1/05/16 | | | $ | 908,928 | | | $ | — | |
Chilean Peso | | | DBAB | | | | Buy | | | | 3,166,824,000 | | | | 4,522,096 | | | | | | | | 1/06/16 | | | | — | | | | (55,994 | ) |
Chilean Peso | | | MSCO | | | | Buy | | | | 2,370,410,000 | | | | 3,421,492 | | | | | | | | 1/07/16 | | | | — | | | | (78,964 | ) |
Euro | | | DBAB | | | | Sell | | | | 2,285,618 | | | | 2,741,416 | | | | | | | | 1/07/16 | | | | 258,224 | | | | — | |
Japanese Yen | | | DBAB | | | | Sell | | | | 770,370,000 | | | | 6,468,045 | | | | | | | | 1/07/16 | | | | 57,707 | | | | — | |
Japanese Yen | | | JPHQ | | | | Sell | | | | 1,415,975,000 | | | | 11,797,924 | | | | | | | | 1/07/16 | | | | 15,432 | | | | — | |
Japanese Yen | | | GSCO | | | | Sell | | | | 329,010,000 | | | | 2,778,449 | | | | | | | | 1/08/16 | | | | 40,657 | | | | — | |
Chilean Peso | | | MSCO | | | | Buy | | | | 2,814,050,000 | | | | 3,968,481 | | | | | | | | 1/11/16 | | | | — | | | | (2,312 | ) |
Euro | | | BZWS | | | | Sell | | | | 6,181,000 | | | | 7,355,019 | | | | | | | | 1/11/16 | | | | 639,041 | | | | — | |
Indian Rupee | | | DBAB | | | | Buy | | | | 258,123,000 | | | | 3,897,249 | | | | | | | | 1/11/16 | | | | — | | | | (3,453 | ) |
Malaysian Ringgit | | | JPHQ | | | | Buy | | | | 3,956,000 | | | | 1,070,202 | | | | | | | | 1/11/16 | | | | — | | | | (148,966 | ) |
Euro | | | CITI | | | | Sell | | | | 5,040,000 | | | | 5,988,528 | | | | | | | | 1/13/16 | | | | 512,029 | | | | — | |
Euro | | | SCNY | | | | Sell | | | | 15,572,000 | | | | 18,495,643 | | | | | | | | 1/13/16 | | | | 1,575,000 | | | | — | |
Japanese Yen | | | CITI | | | | Sell | | | | 138,680,000 | | | | 1,169,743 | | | | | | | | 1/14/16 | | | | 15,590 | | | | — | |
Japanese Yen | | | SCNY | | | | Sell | | | | 415,980,000 | | | | 3,530,640 | | | | | | | | 1/14/16 | | | | 68,681 | | | | — | |
Chilean Peso | | | DBAB | | | | Buy | | | | 642,230,000 | | | | 931,308 | | | | | | | | 1/15/16 | | | | — | | | | (26,580 | ) |
Euro | | | DBAB | | | | Sell | | | | 9,460,000 | | | | 11,193,545 | | | | | | | | 1/15/16 | | | | 913,724 | | | | — | |
Euro | | | JPHQ | | | | Sell | | | | 29,033,000 | | | | 34,339,030 | | | | | | | | 1/15/16 | | | | 2,789,977 | | | | — | |
Japanese Yen | | | BZWS | | | | Sell | | | | 1,089,820,000 | | | | 9,275,616 | | | | | | | | 1/15/16 | | | | 205,476 | | | | — | |
Japanese Yen | | | JPHQ | | | | Sell | | | | 708,450,000 | | | | 6,007,072 | | | | | | | | 1/15/16 | | | | 110,923 | | | | — | |
Malaysian Ringgit | | | JPHQ | | | | Buy | | | | 1,700,000 | | | | 461,180 | | | | | | | | 1/15/16 | | | | — | | | | (65,324 | ) |
Chilean Peso | | | MSCO | | | | Buy | | | | 2,725,362,500 | | | | 3,853,301 | | | | | | | | 1/19/16 | | | | ��� | | | | (15,879 | ) |
Euro | | | BZWS | | | | Sell | | | | 30,339,000 | | | | 35,732,221 | | | | | | | | 1/19/16 | | | | 2,760,654 | | | | — | |
Euro | | | JPHQ | | | | Sell | | | | 27,973,000 | | | | 33,054,295 | | | | | | | | 1/19/16 | | | | 2,654,031 | | | | — | |
Indian Rupee | | | JPHQ | | | | Buy | | | | 82,107,000 | | | | 1,249,460 | | | | | | | | 1/19/16 | | | | — | | | | (12,017 | ) |
Japanese Yen | | | HSBC | | | | Sell | | | | 536,380,000 | | | | 4,369,410 | | | | | | | | 1/19/16 | | | | — | | | | (95,068 | ) |
Japanese Yen | | | SCNY | | | | Sell | | | | 707,660,000 | | | | 5,731,990 | | | | | | | | 1/19/16 | | | | — | | | | (158,111 | ) |
Malaysian Ringgit | | | JPHQ | | | | Buy | | | | 1,856,000 | | | | 499,327 | | | | | | | | 1/19/16 | | | | — | | | | (67,174 | ) |
Euro | | | BZWS | | | | Sell | | | | 3,518,000 | | | | 3,837,012 | | | | | | | | 1/20/16 | | | | 13,653 | | | | — | |
Euro | | | DBAB | | | | Sell | | | | 4,856,000 | | | | 5,692,932 | | | | | | | | 1/20/16 | | | | 415,435 | | | | — | |
Indian Rupee | | | DBAB | | | | Buy | | | | 491,655,000 | | | | 7,464,621 | | | | | | | | 1/20/16 | | | | — | | | | (55,696 | ) |
Japanese Yen | | | JPHQ | | | | Sell | | | | 652,895,000 | | | | 5,619,274 | | | | | | | | 1/20/16 | | | | 184,880 | | | | — | |
Chilean Peso | | | DBAB | | | | Buy | | | | 1,216,245,000 | | | | 1,774,245 | | | | | | | | 1/21/16 | | | | — | | | | (62,140 | ) |
Euro | | | BZWS | | | | Sell | | | | 2,638,000 | | | | 3,078,810 | | | | | | | | 1/21/16 | | | | 211,761 | | | | — | |
Polish Zloty | | | DBAB | | | | Buy | | | | 59,155,000 | | | | 13,878,983 | | | | EUR | | | | 1/21/16 | | | | — | | | | (11,723 | ) |
Polish Zloty | | | DBAB | | | | Sell | | | | 59,155,000 | | | | 13,895,283 | | | | EUR | | | | 1/21/16 | | | | 29,439 | | | | — | |
Chilean Peso | | | MSCO | | | | Buy | | | | 2,572,200,000 | | | | 3,722,862 | | | | | | | | 1/22/16 | | | | — | | | | (102,425 | ) |
Euro | | | DBAB | | | | Sell | | | | 1,935,000 | | | | 2,106,828 | | | | | | | | 1/22/16 | | | | 3,765 | | | | — | |
Euro | | | JPHQ | | | | Sell | | | | 300,000 | | | | 349,890 | | | | | | | | 1/22/16 | | | | 23,834 | | | | — | |
Japanese Yen | | | DBAB | | | | Sell | | | | 858,140,000 | | | | 6,945,128 | | | | | | | | 1/22/16 | | | | — | | | | (197,950 | ) |
Malaysian Ringgit | | | DBAB | | | | Buy | | | | 12,933,000 | | | | 3,084,721 | �� | | | EUR | | | | 1/22/16 | | | | — | | | | (341,442 | ) |
Chilean Peso | | | DBAB | | | | Buy | | | | 2,227,910,000 | | | | 3,189,107 | | | | | | | | 1/25/16 | | | | — | | | | (54,414 | ) |
Chilean Peso | | | JPHQ | | | | Buy | | | | 1,501,938,000 | | | | 2,149,926 | | | | | | | | 1/25/16 | | | | — | | | | (36,683 | ) |
Chilean Peso | | | MSCO | | | | Buy | | | | 3,307,630,000 | | | | 4,587,559 | | | | | | | | 1/25/16 | | | | 66,312 | | | | — | |
Euro | | | JPHQ | | | | Sell | | | | 28,236,000 | | | | 33,053,880 | | | | | | | | 1/25/16 | | | | 2,363,140 | | | | — | |
Indian Rupee | | | DBAB | | | | Buy | | | | 79,271,000 | | | | 1,202,462 | | | | | | | | 1/25/16 | | | | — | | | | (8,589 | ) |
Singapore Dollar | | | JPHQ | | | | Buy | | | | 5,740,000 | | | | 4,174,242 | | | | | | | | 1/25/16 | | | | — | | | | (129,627 | ) |
Singapore Dollar | | | JPHQ | | | | Sell | | | | 5,740,000 | | | | 4,019,495 | | | | | | | | 1/25/16 | | | | — | | | | (25,120 | ) |
Chilean Peso | | | DBAB | | | | Buy | | | | 1,812,300,000 | | | | 2,601,637 | | | | | | | | 1/26/16 | | | | — | | | | (52,022 | ) |
Euro | | | DBAB | | | | Sell | | | | 4,715,000 | | | | 5,199,702 | | | | | | | | 1/27/16 | | | | 74,537 | | | | — | |
Euro | | | GSCO | | | | Sell | | | | 4,711,000 | | | | 5,179,721 | | | | | | | | 1/27/16 | | | | 58,904 | | | | — | |
Indian Rupee | | | DBAB | | | | Buy | | | | 130,201,000 | | | | 1,974,729 | | | | | | | | 1/27/16 | | | | — | | | | (14,269 | ) |
Japanese Yen | | | GSCO | | | | Sell | | | | 944,420,000 | | | | 8,073,691 | | | | | | | | 1/27/16 | | | | 211,548 | | | | — | |
FRANKLIN TEMPLETON VARIABLE INSURANCE PRODUCTS TRUST
STATEMENT OF INVESTMENTS
Templeton Global Bond VIP Fund (continued)
| | | | | | | | | | | | | | | | | | | | | | | | | | | | | | |
| Forward Exchange Contracts (continued) | | | | | | | |
| Currency | | Counterpartya | | | Type | | | Quantity | | | Contract
Amount* | | | | | Settlement
Date | | | Unrealized
Appreciation | | | Unrealized
Depreciation | |
Japanese Yen | | | JPHQ | | | | Sell | | | | 490,100,000 | | | | 3,962,998 | | | | | | 1/27/16 | | | $ | — | | | $ | (117,005 | ) |
Chilean Peso | | | DBAB | | | | Buy | | | | 1,343,670,500 | | | | 1,943,546 | | | | | | 1/28/16 | | | | — | | | | (53,679 | ) |
Chilean Peso | | | JPHQ | | | | Buy | | | | 337,685,000 | | | | 488,782 | | | | | | 1/28/16 | | | | — | | | | (13,830 | ) |
Indian Rupee | | | DBAB | | | | Buy | | | | 98,937,000 | | | | 1,502,111 | | | | | | 1/28/16 | | | | — | | | | (12,571 | ) |
Japanese Yen | | | DBAB | | | | Sell | | | | 8,368,505,770 | | | | 71,593,000 | | | | | | 1/28/16 | | | | 1,924,988 | | | | — | |
Japanese Yen | | | HSBC | | | | Sell | | | | 1,162,462,488 | | | | 9,934,091 | | | | | | 1/28/16 | | | | 256,563 | | | | — | |
Euro | | | CITI | | | | Sell | | | | 4,998,400 | | | | 5,694,777 | | | | | | 1/29/16 | | | | 261,284 | | | | — | |
Euro | | | DBAB | | | | Sell | | | | 57,063,000 | | | | 65,106,030 | | | | | | 1/29/16 | | | | 3,075,896 | | | | — | |
Indian Rupee | | | DBAB | | | | Buy | | | | 609,812,988 | | | | 9,244,381 | | | | | | 1/29/16 | | | | — | | | | (64,437 | ) |
Indian Rupee | | | HSBC | | | | Buy | | | | 679,529,000 | | | | 10,305,137 | | | | | | 1/29/16 | | | | — | | | | (75,709 | ) |
Indian Rupee | | | JPHQ | | | | Buy | | | | 358,075,000 | | | | 5,443,292 | | | | | | 1/29/16 | | | | — | | | | (52,937 | ) |
Japanese Yen | | | DBAB | | | | Sell | | | | 897,860,782 | | | | 7,658,576 | | | | | | 1/29/16 | | | | 183,696 | | | | — | |
Malaysian Ringgit | | | HSBC | | | | Buy | | | | 3,005,000 | | | | 774,584 | | | | | | 1/29/16 | | | | — | | | | (75,004 | ) |
Brazilian Real | | | CITI | | | | Buy | | | | 13,655,266 | | | | 3,421,824 | | | | | | 2/02/16 | | | | — | | | | (14,694 | ) |
Brazilian Real | | | CITI | | | | Sell | | | | 13,655,266 | | | | 3,582,931 | | | | | | 2/02/16 | | | | 175,801 | | | | — | |
Chilean Peso | | | DBAB | | | | Buy | | | | 1,271,380,000 | | | | 1,827,483 | | | | | | 2/04/16 | | | | — | | | | (40,754 | ) |
Indian Rupee | | | HSBC | | | | Buy | | | | 240,033,500 | | | | 3,614,364 | | | | | | 2/05/16 | | | | — | | | | (4,484 | ) |
Chilean Peso | | | CITI | | | | Buy | | | | 2,285,090,000 | | | | 3,281,289 | | | | | | 2/08/16 | | | | — | | | | (71,420 | ) |
Chilean Peso | | | DBAB | | | | Buy | | | | 760,285,000 | | | | 1,094,880 | | | | | | 2/08/16 | | | | — | | | | (26,907 | ) |
Chilean Peso | | | MSCO | | | | Buy | | | | 1,592,750,000 | | | | 2,284,823 | | | | | | 2/08/16 | | | | — | | | | (47,484 | ) |
Euro | | | BZWS | | | | Sell | | | | 7,003,000 | | | | 7,692,375 | | | | | | 2/08/16 | | | | 77,830 | | | | — | |
Indian Rupee | | | DBAB | | | | Buy | | | | 457,757,494 | | | | 6,887,714 | | | | | | 2/08/16 | | | | — | | | | (6,420 | ) |
Japanese Yen | | | JPHQ | | | | Sell | | | | 1,719,500,000 | | | | 14,740,045 | | | | | | 2/08/16 | | | | 421,930 | | | | — | |
Japanese Yen | | | SCNY | | | | Sell | | | | 1,720,000,000 | | | | 14,741,804 | | | | | | 2/08/16 | | | | 419,525 | | | | — | |
Euro | | | CITI | | | | Sell | | | | 6,572,000 | | | | 7,548,599 | | | | | | 2/09/16 | | | | 402,508 | | | | — | |
Euro | | | DBAB | | | | Sell | | | | 1,738,000 | | | | 2,000,264 | | | | | | 2/09/16 | | | | 110,443 | | | | — | |
Euro | | | GSCO | | | | Sell | | | | 2,045,000 | | | | 2,350,728 | | | | | | 2/09/16 | | | | 127,088 | | | | — | |
Indian Rupee | | | JPHQ | | | | Buy | | | | 60,607,000 | | | | 909,844 | | | | | | 2/09/16 | | | | 1,108 | | | | — | |
Japanese Yen | | | BZWS | | | | Sell | | | | 1,720,220,000 | | | | 14,743,563 | | | | | | 2/09/16 | | | | 419,164 | | | | — | |
Japanese Yen | | | CITI | | | | Sell | | | | 366,860,000 | | | | 3,145,179 | | | | | | 2/09/16 | | | | 90,309 | | | | — | |
Japanese Yen | | | JPHQ | | | | Sell | | | | 1,723,960,000 | | | | 14,770,681 | | | | | | 2/09/16 | | | | 415,138 | | | | — | |
Euro | | | HSBC | | | | Sell | | | | 1,800,000 | | | | 2,044,332 | | | | | | 2/10/16 | | | | 87,044 | | | | — | |
Indian Rupee | | | DBAB | | | | Buy | | | | 39,609,000 | | | | 595,714 | | | | | | 2/10/16 | | | | — | | | | (457 | ) |
Malaysian Ringgit | | | HSBC | | | | Buy | | | | 1,320,000 | | | | 332,251 | | | | | | 2/10/16 | | | | — | | | | (25,079 | ) |
Singapore Dollar | | | DBAB | | | | Buy | | | | 6,207,000 | | | | 4,480,941 | | | | | | 2/10/16 | | | | — | | | | (109,709 | ) |
Singapore Dollar | | | DBAB | | | | Sell | | | | 6,207,000 | | | | 4,309,459 | | | | | | 2/10/16 | | | | — | | | | (61,773 | ) |
Euro | | | BZWS | | | | Sell | | | | 6,341,000 | | | | 7,206,694 | | | | | | 2/11/16 | | | | 311,426 | | | | — | |
Malaysian Ringgit | | | HSBC | | | | Buy | | | | 2,230,000 | | | | 556,248 | | | | | | 2/11/16 | | | | — | | | | (37,332 | ) |
Chilean Peso | | | DBAB | | | | Buy | | | | 2,296,779,000 | | | | 3,253,228 | | | | | | 2/12/16 | | | | — | | | | (28,419 | ) |
Chilean Peso | | | JPHQ | | | | Buy | | | | 612,933,000 | | | | 865,419 | | | | | | 2/12/16 | | | | — | | | | (4,826 | ) |
Japanese Yen | | | CITI | | | | Sell | | | | 684,870,000 | | | | 5,510,258 | | | | | | 2/12/16 | | | | — | | | | (193,050 | ) |
Japanese Yen | | | GSCO | | | | Sell | | | | 394,373,000 | | | | 3,346,540 | | | | | | 2/12/16 | | | | 62,368 | | | | — | |
Japanese Yen | | | HSBC | | | | Sell | | | | 1,035,240,000 | | | | 8,788,190 | | | | | | 2/12/16 | | | | 167,149 | | | | — | |
Japanese Yen | | | JPHQ | | | | Sell | | | | 1,034,700,000 | | | | 8,783,792 | | | | | | 2/12/16 | | | | 167,248 | | | | — | |
Malaysian Ringgit | | | HSBC | | | | Buy | | | | 6,100,000 | | | | 1,520,439 | | | | | | 2/12/16 | | | | — | | | | (101,035 | ) |
Singapore Dollar | | | BZWS | | | | Buy | | | | 1,717,028 | | | | 1,234,828 | | | | | | 2/12/16 | | | | — | | | | (25,708 | ) |
Singapore Dollar | | | BZWS | | | | Sell | | | | 1,717,028 | | | | 1,219,697 | | | | | | 2/12/16 | | | | 10,577 | | | | — | |
Chilean Peso | | | DBAB | | | | Buy | | | | 1,866,989,500 | | | | 2,633,272 | | | | | | 2/16/16 | | | | — | | | | (13,113 | ) |
Chilean Peso | | | MSCO | | | | Buy | | | | 2,725,362,500 | | | | 3,841,731 | | | | | | 2/16/16 | | | | — | | | | (16,920 | ) |
Euro | | | SCNY | | | | Sell | | | | 657,000 | | | | 747,354 | | | | | | 2/16/16 | | | | 32,833 | | | | — | |
Indian Rupee | | | DBAB | | | | Buy | | | | 239,338,000 | | | | 3,564,229 | | | | | | 2/16/16 | | | | 29,542 | | | | — | |
Indian Rupee | | | HSBC | | | | Buy | | | | 402,232,000 | | | | 5,970,243 | | | | | | 2/16/16 | | | | 69,458 | | | | — | |
Japanese Yen | | | CITI | | | | Sell | | | | 1,371,360,000 | | | | 11,534,793 | | | | | | 2/16/16 | | | | 113,766 | | | | — | |
Japanese Yen | | | JPHQ | | | | Sell | | | | 686,710,000 | | | | 5,795,143 | | | | | | 2/16/16 | | | | 76,052 | | | | — | |
Chilean Peso | | | DBAB | | | | Buy | | | | 642,230,000 | | | | 905,123 | | | | | | 2/17/16 | | | | — | | | | (3,912 | ) |
Euro | | | GSCO | | | | Sell | | | | 2,038,000 | | | | 2,341,519 | | | | | | 2/17/16 | | | | 125,035 | | | | — | |
Euro | | | JPHQ | | | | Sell | | | | 3,942,000 | | | | 4,525,613 | | | | | | 2/17/16 | | | | 238,379 | | | | — | |
FRANKLIN TEMPLETON VARIABLE INSURANCE PRODUCTS TRUST
STATEMENT OF INVESTMENTS
Templeton Global Bond VIP Fund (continued)
| | | | | | | | | | | | | | | | | | | | | | | | | | | | | | |
| Forward Exchange Contracts (continued) | | | | | | | |
| Currency | | Counterpartya | | | Type | | | Quantity | | | Contract
Amount* | | | | | Settlement
Date | | | Unrealized
Appreciation | | | Unrealized
Depreciation | |
Japanese Yen | | | GSCO | | | | Sell | | | | 810,877,280 | | | | 6,875,979 | | | | | | 2/17/16 | | | $ | 122,655 | | | $ | — | |
Japanese Yen | | | JPHQ | | | | Sell | | | | 831,970,000 | | | | 7,042,327 | | | | | | 2/17/16 | | | | 113,335 | | | | — | |
Chilean Peso | | | BZWS | | | | Buy | | | | 727,392,000 | | | | 1,016,407 | | | | | | 2/18/16 | | | | 4,190 | | | | — | |
Malaysian Ringgit | | | HSBC | | | | Buy | | | | 4,899,000 | | | | 1,165,014 | | | | | | 2/19/16 | | | | — | | | | (25,367 | ) |
Chilean Peso | | | MSCO | | | | Buy | | | | 2,572,200,000 | | | | 3,565,073 | | | | | | 2/22/16 | | | | 42,307 | | | | — | |
Euro | | | BZWS | | | | Sell | | | | 6,280,000 | | | | 7,197,948 | | | | | | 2/22/16 | | | | 367,075 | | | | — | |
Euro | | | DBAB | | | | Sell | | | | 3,964,000 | | | | 4,389,179 | | | | | | 2/22/16 | | | | 77,462 | | | | — | |
Chilean Peso | | | DBAB | | | | Buy | | | | 2,188,820,000 | | | | 3,033,287 | | | | | | 2/23/16 | | | | 36,070 | | | | — | |
Indian Rupee | | | JPHQ | | | | Buy | | | | 378,455,000 | | | | 5,649,383 | | | | | | 2/23/16 | | | | 27,626 | | | | — | |
Japanese Yen | | | DBAB | | | | Sell | | | | 371,821,000 | | | | 3,022,370 | | | | | | 2/24/16 | | | | — | | | | (74,747 | ) |
Japanese Yen | | | HSBC | | | | Sell | | | | 746,218,000 | | | | 6,064,594 | | | | | | 2/24/16 | | | | — | | | | (151,097 | ) |
Singapore Dollar | | | DBAB | | | | Buy | | | | 3,667,000 | | | | 2,602,001 | | | | | | 2/24/16 | | | | — | | | | (20,796 | ) |
Singapore Dollar | | | DBAB | | | | Sell | | | | 3,667,000 | | | | 2,544,990 | | | | | | 2/24/16 | | | | — | | | | (36,215 | ) |
Chilean Peso | | | BZWS | | | | Buy | | | | 3,010,700,000 | | | | 4,179,496 | | | | | | 2/25/16 | | | | 41,407 | | | | — | |
Chilean Peso | | | JPHQ | | | | Buy | | | | 931,485,000 | | | | 1,287,867 | | | | | | 2/25/16 | | | | 18,045 | | | | — | |
Japanese Yen | | | BZWS | | | | Sell | | | | 343,460,000 | | | | 2,910,135 | | | | | | 2/25/16 | | | | 49,196 | | | | — | |
Japanese Yen | | | HSBC | | | | Sell | | | | 385,460,000 | | | | 3,267,552 | | | | | | 2/25/16 | | | | 56,762 | | | | — | |
Euro | | | BOFA | | | | Sell | | | | 2,694,506 | | | | 3,076,668 | | | | | | 2/26/16 | | | | 145,501 | | | | — | |
Euro | | | BZWS | | | | Sell | | | | 13,673,773 | | | | 15,603,553 | | | | | | 2/26/16 | | | | 728,801 | | | | — | |
Euro | | | DBAB | | | | Sell | | | | 1,530,900 | | | | 1,744,154 | | | | | | 2/26/16 | | | | 78,794 | | | | — | |
Japanese Yen | | | BZWS | | | | Sell | | | | 1,576,550,000 | | | | 13,282,362 | | | | | | 2/26/16 | | | | 149,815 | | | | — | |
Singapore Dollar | | | DBAB | | | | Buy | | | | 15,499,000 | | | | 10,904,038 | | | | | | 2/26/16 | | | | 4,969 | | | | — | |
Singapore Dollar | | | DBAB | | | | Sell | | | | 15,499,000 | | | | 11,010,550 | | | | | | 2/26/16 | | | | 101,542 | | | | — | |
Chilean Peso | | | DBAB | | | | Buy | | | | 5,582,470,500 | | | | 7,732,489 | | | | | | 2/29/16 | | | | 90,370 | | | | — | |
Euro | | | DBAB | | | | Sell | | | | 2,579,651 | | | | 2,951,043 | | | | | | 2/29/16 | | | | 144,602 | | | | — | |
Euro | | | HSBC | | | | Sell | | | | 18,537,726 | | | | 21,216,799 | | | | | | 2/29/16 | | | | 1,049,329 | | | | — | |
Japanese Yen | | | DBAB | | | | Sell | | | | 229,660,000 | | | | 1,943,965 | | | | | | 2/29/16 | | | | 30,798 | | | | — | |
Japanese Yen | | | HSBC | | | | Sell | | | | 1,247,125,000 | | | | 10,442,309 | | | | | | 2/29/16 | | | | 53,220 | | | | — | |
Malaysian Ringgit | | | HSBC | | | | Buy | | | | 2,087,700 | | | | 485,568 | | | | | | 2/29/16 | | | | — | | | | (90 | ) |
Malaysian Ringgit | | | JPHQ | | | | Buy | | | | 8,340,000 | | | | 1,954,993 | | | | | | 2/29/16 | | | | — | | | | (15,593 | ) |
Chilean Peso | | | DBAB | | | | Buy | | | | 1,982,198,000 | | | | 2,763,030 | | | | | | 3/02/16 | | | | 14,104 | | | | — | |
Euro | | | DBAB | | | | Sell | | | | 1,732,000 | | | | 1,952,137 | | | | | | 3/02/16 | | | | 67,765 | | | | — | |
Chilean Peso | | | BZWS | | | | Buy | | | | 1,142,900,000 | | | | 1,598,797 | | | | | | 3/03/16 | | | | 2,285 | | | | — | |
Chilean Peso | | | CITI | | | | Buy | | | | 3,039,493,000 | | | | 4,244,213 | | | | | | 3/03/16 | | | | 13,794 | | | | — | |
Indian Rupee | | | JPHQ | | | | Buy | | | | 139,661,000 | | | | 2,071,876 | | | | | | 3/03/16 | | | | 20,220 | | | | — | |
Japanese Yen | | | JPHQ | | | | Sell | | | | 848,300,000 | | | | 7,158,801 | | | | | | 3/03/16 | | | | 91,232 | | | | — | |
Euro | | | DBAB | | | | Sell | | | | 8,105,300 | | | | 9,138,726 | | | | | | 3/04/16 | | | | 319,877 | | | | — | |
Japanese Yen | | | HSBC | | | | Sell | | | | 400,800,000 | | | | 3,371,609 | | | | | | 3/04/16 | | | | 32,228 | | | | — | |
Euro | | | DBAB | | | | Sell | | | | 1,536,000 | | | | 1,730,765 | | | | | | 3/07/16 | | | | 59,405 | | | | — | |
Euro | | | BZWS | | | | Sell | | | | 7,226,276 | | | | 8,050,361 | | | | | | 3/09/16 | | | | 186,837 | | | | — | |
Euro | | | GSCO | | | | Sell | | | | 21,480,000 | | | | 23,909,818 | | | | | | 3/09/16 | | | | 535,608 | | | | — | |
Euro | | | HSBC | | | | Sell | | | | 1,844,000 | | | | 2,050,344 | | | | | | 3/09/16 | | | | 43,731 | | | | — | |
Japanese Yen | | | BZWS | | | | Sell | | | | 1,712,605,900 | | | | 14,359,548 | | | | | | 3/09/16 | | | | 87,568 | | | | — | |
Euro | | | CITI | | | | Sell | | | | 31,404,613 | | | | 34,460,282 | | | | | | 3/10/16 | | | | 285,318 | | | | — | |
Euro | | | MSCO | | | | Sell | | | | 5,225,000 | | | | 5,727,384 | | | | | | 3/10/16 | | | | 41,461 | | | | — | |
Chilean Peso | | | DBAB | | | | Buy | | | | 1,866,989,500 | | | | 2,629,192 | | | | | | 3/11/16 | | | | — | | | | (15,886 | ) |
Indian Rupee | | | CITI | | | | Buy | | | | 69,318,000 | | | | 1,027,085 | | | | | | 3/11/16 | | | | 9,836 | | | | — | |
Mexican Peso | | | CITI | | | | Buy | | | | 30,688,400 | | | | 1,927,506 | | | | | | 3/11/16 | | | | — | | | | (156,094 | ) |
Mexican Peso | | | CITI | | | | Sell | | | | 30,688,400 | | | | 1,973,569 | | | | | | 3/11/16 | | | | 202,156 | | | | — | |
Mexican Peso | | | HSBC | | | | Buy | | | | 135,500,950 | | | | 8,518,858 | | | | | | 3/11/16 | | | | — | | | | (697,399 | ) |
Mexican Peso | | | HSBC | | | | Sell | | | | 135,500,950 | | | | 8,714,728 | | | | | | 3/11/16 | | | | 893,270 | | | | — | |
Mexican Peso | | | CITI | | | | Buy | | | | 13,389,800 | | | | 834,177 | | | | | | 3/14/16 | | | | — | | | | (61,448 | ) |
Mexican Peso | | | CITI | | | | Sell | | | | 13,389,800 | | | | 860,892 | | | | | | 3/14/16 | | | | 88,163 | | | | — | |
Singapore Dollar | | | DBAB | | | | Buy | | | | 12,363,000 | | | | 8,687,983 | | | | | | 3/14/16 | | | | 9,127 | | | | — | |
Singapore Dollar | | | DBAB | | | | Sell | | | | 12,363,000 | | | | 8,779,604 | | | | | | 3/14/16 | | | | 82,494 | | | | — | |
Chilean Peso | | | DBAB | | | | Buy | | | | 1,231,460,000 | | | | 1,713,050 | | | | | | 3/16/16 | | | | 9,794 | | | | — | |
Chilean Peso | | | JPHQ | | | | Buy | | | | 1,792,000,000 | | | | 2,493,738 | | | | | | 3/16/16 | | | | 13,316 | | | | — | |
FRANKLIN TEMPLETON VARIABLE INSURANCE PRODUCTS TRUST
STATEMENT OF INVESTMENTS
Templeton Global Bond VIP Fund (continued)
| | | | | | | | | | | | | | | | | | | | | | | | | | | | | | |
| Forward Exchange Contracts (continued) | | | | | | | |
| Currency | | Counterpartya | | | Type | | | Quantity | | | Contract
Amount* | | | | | Settlement
Date | | | Unrealized
Appreciation | | | Unrealized
Depreciation | |
Euro | | | BZWS | | | | Sell | | | | 1,161,439 | | | | 1,242,902 | | | | | | 3/16/16 | | | $ | — | | | $ | (21,202 | ) |
Euro | | | CITI | | | | Sell | | | | 861,168 | | | | 922,742 | | | | | | 3/16/16 | | | | — | | | | (14,549 | ) |
Euro | | | JPHQ | | | | Sell | | | | 541,000 | | | | 579,330 | | | | | | 3/16/16 | | | | — | | | | (9,492 | ) |
Japanese Yen | | | CITI | | | | Sell | | | | 286,112,008 | | | | 2,381,889 | | | | | | 3/16/16 | | | | — | | | | (3,103 | ) |
Singapore Dollar | | | HSBC | | | | Buy | | | | 10,521,600 | | | | 7,427,099 | | | | | | 3/16/16 | | | | — | | | | (25,826 | ) |
Singapore Dollar | | | HSBC | | | | Sell | | | | 10,521,600 | | | | 7,359,564 | | | | | | 3/16/16 | | | | — | | | | (41,709 | ) |
Mexican Peso | | | CITI | | | | Buy | | | | 12,505,100 | | | | 784,806 | | | | | | 3/18/16 | | | | — | | | | (63,337 | ) |
Mexican Peso | | | CITI | | | | Sell | | | | 12,505,100 | | | | 803,763 | | | | | | 3/18/16 | | | | 82,293 | | | | — | |
Euro | | | BZWS | | | | Sell | | | | 678,250 | | | | 770,763 | | | | | | 3/21/16 | | | | 32,458 | | | | — | |
Japanese Yen | | | CITI | | | | Sell | | | | 1,866,452,000 | | | | 15,518,075 | | | | | | 3/22/16 | | | | — | | | | (44,227 | ) |
Japanese Yen | | | MSCO | | | | Sell | | | | 575,230,000 | | | | 4,781,868 | | | | | | 3/22/16 | | | | — | | | | (14,346 | ) |
Malaysian Ringgit | | | HSBC | | | | Buy | | | | 36,880,000 | | | | 8,519,289 | | | | | | 3/22/16 | | | | 49,989 | | | | — | |
Euro | | | BZWS | | | | Sell | | | | 744,197 | | | | 799,573 | | | | | | 3/23/16 | | | | — | | | | (10,564 | ) |
Euro | | | DBAB | | | | Sell | | | | 8,070,000 | | | | 9,097,311 | | | | | | 3/23/16 | | | | 312,270 | | | | — | |
Mexican Peso | | | CITI | | | | Buy | | | | 75,637,200 | | | | 4,824,170 | | | | | | 3/23/16 | | | | — | | | | (461,896 | ) |
Mexican Peso | | | CITI | | | | Sell | | | | 75,637,200 | | | | 4,859,722 | | | | | | 3/23/16 | | | | 497,448 | | | | — | |
Euro | | | BZWS | | | | Sell | | | | 1,647,381 | | | | 1,841,591 | | | | | | 3/24/16 | | | | 48,194 | | | | — | |
Japanese Yen | | | DBAB | | | | Sell | | | | 725,287,000 | | | | 6,040,535 | | | | | | 3/24/16 | | | | — | | | | (7,334 | ) |
Japanese Yen | | | BZWS | | | | Sell | | | | 983,714,840 | | | | 8,304,475 | | | | | | 3/28/16 | | | | 100,345 | | | | — | |
Malaysian Ringgit | | | HSBC | | | | Buy | | | | 20,347,000 | | | | 4,956,585 | | | | | | 3/28/16 | | | | 16,926 | | | | (246,802 | ) |
Philippine Peso | | | JPHQ | | | | Buy | | | | 123,740,000 | | | | 2,604,450 | | | | | | 3/28/16 | | | | 8,285 | | | | — | |
Euro | | | BOFA | | | | Sell | | | | 50,857,200 | | | | 56,167,756 | | | | | | 3/29/16 | | | | 795,203 | | | | — | |
Euro | | | BZWS | | | | Sell | | | | 18,402,361 | | | | 20,274,801 | | | | | | 3/29/16 | | | | 238,588 | | | | — | |
Euro | | | CITI | | | | Sell | | | | 1,532,964 | | | | 1,731,184 | | | | | | 3/29/16 | | | | 62,116 | | | | — | |
Euro | | | DBAB | | | | Sell | | | | 6,489,000 | | | | 7,250,606 | | | | | | 3/29/16 | | | | 185,481 | | | | — | |
Euro | | | GSCO | | | | Sell | | | | 30,376,000 | | | | 33,387,780 | | | | | | 3/29/16 | | | | 314,849 | | | | — | |
Euro | | | HSBC | | | | Sell | | | | 20,544,891 | | | | 22,609,653 | | | | | | 3/29/16 | | | | 240,685 | | | | — | |
Japanese Yen | | | JPHQ | | | | Sell | | | | 285,510,329 | | | | 2,375,393 | | | | | | 3/29/16 | | | | — | | | | (5,846 | ) |
South Korean Won | | | DBAB | | | | Buy | | | | 21,440,000,000 | | | | 19,317,056 | | | | | | 3/29/16 | | | | — | | | | (1,111,951 | ) |
Euro | | | BOFA | | | | Sell | | | | 14,283,200 | | | | 15,836,712 | | | | | | 3/30/16 | | | | 284,950 | | | | — | |
Euro | | | BZWS | | | | Sell | | | | 6,085,000 | | | | 6,725,659 | | | | | | 3/30/16 | | | | 100,220 | | | | — | |
Euro | | | BZWS | | | | Sell | | | | 6,085,000 | | | | 6,838,506 | | | | | | 3/31/16 | | | | 212,850 | | | | — | |
Euro | | | GSCO | | | | Sell | | | | 4,020,000 | | | | 4,415,568 | | | | | | 3/31/16 | | | | 38,389 | | | | — | |
Euro | | | HSBC | | | | Sell | | | | 5,430,000 | | | | 6,102,587 | | | | | | 3/31/16 | | | | 190,128 | | | | — | |
Japanese Yen | | | JPHQ | | | | Sell | | | | 172,207,000 | | | | 1,441,998 | | | | | | 3/31/16 | | | | 5,635 | | | | — | |
Malaysian Ringgit | | | HSBC | | | | Buy | | | | 7,790,000 | | | | 1,755,097 | | | | | | 3/31/16 | | | | 54,359 | | | | — | |
South Korean Won | | | HSBC | | | | Buy | | | | 9,530,000,000 | | | | 7,966,895 | | | | | | 3/31/16 | | | | 125,005 | | | | — | |
Australian Dollar | | | GSCO | | | | Sell | | | | 127,700,540 | | | | 88,610,000 | | | | | | 4/06/16 | | | | — | | | | (3,977,081 | ) |
Japanese Yen | | | JPHQ | | | | Sell | | | | 1,415,975,000 | | | | 11,821,267 | | | | | | 4/07/16 | | | | 7,985 | | | | — | |
Euro | | | CITI | | | | Sell | | | | 6,421,600 | | | | 7,126,576 | | | | | | 4/08/16 | | | | 132,581 | | | | — | |
Malaysian Ringgit | | | HSBC | | | | Buy | | | | 4,010,000 | | | | 1,072,422 | | | | | | 4/11/16 | | | | — | | | | (141,365 | ) |
Euro | | | DBAB | | | | Sell | | | | 7,243,000 | | | | 7,842,938 | | | | | | 4/13/16 | | | | — | | | | (46,966 | ) |
Euro | | | SCNY | | | | Sell | | | | 4,346,000 | | | | 4,664,236 | | | | | | 4/13/16 | | | | — | | | | (69,924 | ) |
Japanese Yen | | | CITI | | | | Sell | | | | 261,800,000 | | | | 2,191,455 | | | | | | 4/13/16 | | | | 6,856 | | | | — | |
Euro | | | JPHQ | | | | Sell | | | | 3,907,000 | | | | 4,175,098 | | | | | | 4/14/16 | | | | — | | | | (80,992 | ) |
Euro | | | HSBC | | | | Sell | | | | 6,919,000 | | | | 7,372,195 | | | | | | 4/18/16 | | | | — | | | | (166,006 | ) |
Japanese Yen | | | BZWS | | | | Sell | | | | 700,840,000 | | | | 5,918,507 | | | | | | 4/18/16 | | | | 69,344 | | | | — | |
Euro | | | HSBC | | | | Sell | | | | 12,569,000 | | | | 14,350,781 | | | | | | 4/20/16 | | | | 656,050 | | | | — | |
Japanese Yen | | | JPHQ | | | | Sell | | | | 1,233,160,000 | | | | 10,378,213 | | | | | | 4/20/16 | | | | 85,654 | | | | — | |
Japanese Yen | | | JPHQ | | | | Sell | | | | 917,650,000 | | | | 7,782,224 | | | | | | 4/21/16 | | | | 122,810 | | | | — | |
Euro | | | DBAB | | | | Sell | | | | 4,545,000 | | | | 5,032,224 | | | | | | 4/27/16 | | | | 79,019 | | | | — | |
Euro | | | BZWS | | | | Sell | | | | 6,575,679 | | | | 7,186,987 | | | | | | 4/29/16 | | | | 20,250 | | | | — | |
Euro | | | DBAB | | | | Sell | | | | 3,319,244 | | | | 3,678,054 | | | | | | 4/29/16 | | | | 60,458 | | | | — | |
Euro | | | SCNY | | | | Sell | | | | 11,263,000 | | | | 12,403,942 | | | | | | 4/29/16 | | | | 128,561 | | | | — | |
Malaysian Ringgit | | | JPHQ | | | | Buy | | | | 7,468,000 | | | | 1,734,929 | | | | | | 4/29/16 | | | | — | | | | (2,147 | ) |
Euro | | | BOFA | | | | Sell | | | | 32,701,000 | | | | 36,206,547 | | | | | | 5/04/16 | | | | 560,360 | | | | — | |
Euro | | | BZWS | | | | Sell | | | | 1,581,109 | | | | 1,724,713 | | | | | | 5/06/16 | | | | 1,090 | | | | — | |
FRANKLIN TEMPLETON VARIABLE INSURANCE PRODUCTS TRUST
STATEMENT OF INVESTMENTS
Templeton Global Bond VIP Fund (continued)
| | | | | | | | | | | | | | | | | | | | | | | | | | | | | | |
| Forward Exchange Contracts (continued) | | | | | | | |
| Currency | | Counterpartya | | | Type | | | Quantity | | | Contract
Amount* | | | | | Settlement
Date | | | Unrealized
Appreciation | | | Unrealized
Depreciation | |
Euro | | | BZWS | | | | Sell | | | | 1,259,000 | | | | 1,410,584 | | | | | | 5/09/16 | | | $ | 37,968 | | | $ | — | |
Euro | | | GSCO | | | | Sell | | | | 2,990,000 | | | | 3,268,130 | | | | | | 5/09/16 | | | | 8,304 | | | | — | |
Euro | | | BZWS | | | | Sell | | | | 2,643,000 | | | | 2,849,920 | | | | | | 5/12/16 | | | | — | | | | (31,875 | ) |
Euro | | | GSCO | | | | Sell | | | | 2,279,000 | | | | 2,450,951 | | | | | | 5/12/16 | | | | — | | | | (33,957 | ) |
Euro | | | MSCO | | | | Sell | | | | 4,572,000 | | | | 4,941,052 | | | | | | 5/12/16 | | | | — | | | | (44,029 | ) |
Euro | | | SCNY | | | | Sell | | | | 629,000 | | | | 675,521 | | | | | | 5/12/16 | | | | — | | | | (10,309 | ) |
Japanese Yen | | | GSCO | | | | Sell | | | | 490,555,000 | | | | 3,997,808 | | | | | | 5/12/16 | | | | — | | | | (99,623 | ) |
Japanese Yen | | | SCNY | | | | Sell | | | | 366,681,000 | | | | 2,985,844 | | | | | | 5/12/16 | | | | — | | | | (76,912 | ) |
Euro | | | GSCO | | | | Sell | | | | 3,095,000 | | | | 3,348,573 | | | | | | 5/16/16 | | | | — | | | | (26,503 | ) |
Euro | | | MSCO | | | | Sell | | | | 5,391,000 | | | | 5,806,242 | | | | | | 5/16/16 | | | | — | | | | (72,606 | ) |
Japanese Yen | | | SCNY | | | | Sell | | | | 340,600,700 | | | | 2,786,510 | | | | | | 5/16/16 | | | | — | | | | (58,787 | ) |
Australian Dollar | | | JPHQ | | | | Sell | | | | 57,889,000 | | | | 40,985,412 | | | | | | 5/18/16 | | | | — | | | | (908,823 | ) |
Euro | | | BZWS | | | | Sell | | | | 8,551,980 | | | | 9,822,804 | | | | | | 5/18/16 | | | | 496,317 | | | | — | |
Japanese Yen | | | BOFA | | | | Sell | | | | 1,105,661,700 | | | | 9,033,258 | | | | | | 5/18/16 | | | | — | | | | (203,795 | ) |
Japanese Yen | | | CITI | | | | Sell | | | | 1,104,534,000 | | | | 9,341,458 | | | | | | 5/18/16 | | | | 113,826 | | | | — | |
Australian Dollar | | | CITI | | | | Sell | | | | 13,307,000 | | | | 9,374,515 | | | | | | 5/19/16 | | | | — | | | | (255,331 | ) |
Australian Dollar | | | JPHQ | | | | Sell | | | | 42,398,000 | | | | 29,848,192 | | | | | | 5/19/16 | | | | — | | | | (833,872 | ) |
Euro | | | DBAB | | | | Sell | | | | 5,073,398 | | | | 5,426,405 | | | | | | 5/19/16 | | | | — | | | | (106,645 | ) |
Euro | | | UBSW | | | | Sell | | | | 3,245,000 | | | | 3,474,194 | | | | | | 5/19/16 | | | | — | | | | (64,804 | ) |
Japanese Yen | | | BOFA | | | | Sell | | | | 1,102,846,375 | | | | 9,272,759 | | | | | | 5/19/16 | | | | 58,918 | | | | — | |
Japanese Yen | | | BZWS | | | | Sell | | | | 1,105,842,500 | | | | 9,295,919 | | | | | | 5/19/16 | | | | 57,046 | | | | — | |
Japanese Yen | | | CITI | | | | Sell | | | | 986,239,000 | | | | 8,046,333 | | | | | | 5/19/16 | | | | — | | | | (193,301 | ) |
Japanese Yen | | | HSBC | | | | Sell | | | | 1,106,730,400 | | | | 9,348,570 | | | | | | 5/19/16 | | | | 102,278 | | | | — | |
Euro | | | JPHQ | | | | Sell | | | | 15,309,581 | | | | 17,571,036 | | | | | | 5/20/16 | | | | 873,853 | | | | — | |
Japanese Yen | | | JPHQ | | | | Sell | | | | 715,709,000 | | | | 6,026,186 | | | | | | 5/20/16 | | | | 46,522 | | | | — | |
Malaysian Ringgit | | | HSBC | | | | Buy | | | | 4,326,000 | | | | 977,296 | | | | | | 5/20/16 | | | | 25,668 | | | | — | |
Euro | | | DBAB | | | | Sell | | | | 3,887,000 | | | | 4,355,461 | | | | | | 5/23/16 | | | | 115,741 | | | | — | |
Malaysian Ringgit | | | HSBC | | | | Buy | | | | 298,500 | | | | 80,621 | | | | | | 5/23/16 | | | | — | | | | (11,423 | ) |
Euro | | | GSCO | | | | Sell | | | | 4,454,000 | | | | 4,787,248 | | | | | | 5/24/16 | | | | — | | | | (71,082 | ) |
Japanese Yen | | | HSBC | | | | Sell | | | | 207,909,000 | | | | 1,701,160 | | | | | | 5/25/16 | | | | — | | | | (36,186 | ) |
Euro | | | BZWS | | | | Sell | | | | 2,680,925 | | | | 3,122,674 | | | | | | 5/26/16 | | | | 198,185 | | | | — | |
Euro | | | JPHQ | | | | Sell | | | | 4,730,771 | | | | 5,303,265 | | | | | | 5/26/16 | | | | 142,700 | | | | — | |
Japanese Yen | | | BZWS | | | | Sell | | | | 1,085,075,000 | | | | 9,215,074 | | | | | | 5/26/16 | | | | 147,579 | | | | — | |
Japanese Yen | | | SCNY | | | | Sell | | | | 937,086,000 | | | | 7,905,230 | | | | | | 5/26/16 | | | | 74,414 | | | | — | |
Euro | | | BZWS | | | | Sell | | | | 2,836,669 | | | | 3,093,785 | | | | | | 5/31/16 | | | | — | | | | (1,106 | ) |
Malaysian Ringgit | | | HSBC | | | | Buy | | | | 1,229,300 | | | | 332,243 | | | | | | 5/31/16 | | | | — | | | | (47,353 | ) |
Euro | | | BZWS | | | | Sell | | | | 7,895,591 | | | | 8,783,253 | | | | | | 6/06/16 | | | | 167,232 | | | | — | |
Euro | | | DBAB | | | | Sell | | | | 5,440,000 | | | | 5,794,144 | | | | | | 6/06/16 | | | | — | | | | (142,226 | ) |
Euro | | | GSCO | | | | Sell | | | | 2,033,100 | | | | 2,315,111 | | | | | | 6/08/16 | | | | 96,356 | | | | — | |
Japanese Yen | | | CITI | | | | Sell | | | | 1,370,500,000 | | | | 11,124,577 | | | | | | 6/08/16 | | | | — | | | | (333,083 | ) |
Euro | | | HSBC | | | | Sell | | | | 2,155,292 | | | | 2,342,802 | | | | | | 6/09/16 | | | | — | | | | (9,380 | ) |
Euro | | | SCNY | | | | Sell | | | | 2,400,751 | | | | 2,610,085 | | | | | | 6/09/16 | | | | — | | | | (9,980 | ) |
Japanese Yen | | | HSBC | | | | Sell | | | | 2,052,400,000 | | | | 16,718,120 | | | | | | 6/09/16 | | | | — | | | | (440,937 | ) |
Japanese Yen | | | BZWS | | | | Sell | | | | 1,689,110,000 | | | | 13,602,548 | | | | | | 6/10/16 | | | | — | | | | (519,703 | ) |
Japanese Yen | | | CITI | | | | Sell | | | | 2,595,800,000 | | | | 20,921,217 | | | | | | 6/10/16 | | | | — | | | | (781,655 | ) |
Japanese Yen | | | HSBC | | | | Sell | | | | 1,798,900,000 | | | | 14,511,354 | | | | | | 6/10/16 | | | | — | | | | (528,825 | ) |
Euro | | | GSCO | | | | Sell | | | | 8,105,300 | | | | 9,231,531 | | | | | | 6/13/16 | | | | 384,635 | | | | — | |
Japanese Yen | | | DBAB | | | | Sell | | | | 595,700,000 | | | | 4,837,348 | | | | | | 6/13/16 | | | | — | | | | (143,661 | ) |
Japanese Yen | | | JPHQ | | | | Sell | | | | 1,666,680,000 | | | | 13,520,949 | | | | | | 6/13/16 | | | | — | | | | (415,172 | ) |
Australian Dollar | | | CITI | | | | Sell | | | | 29,097,000 | | | | 20,823,559 | | | | | | 6/14/16 | | | | — | | | | (209,056 | ) |
Australian Dollar | | | JPHQ | | | | Sell | | | | 43,169,000 | | | | 31,235,146 | | | | | | 6/14/16 | | | | 30,658 | | | | — | |
Malaysian Ringgit | | | JPHQ | | | | Buy | | | | 13,361,013 | | | | 3,136,388 | | | | | | 6/14/16 | | | | — | | | | (41,587 | ) |
Euro | | | BOFA | | | | Sell | | | | 17,769,000 | | | | 19,582,504 | | | | | | 6/15/16 | | | | 186,451 | | | | — | |
Euro | | | DBAB | | | | Sell | | | | 2,383,000 | | | | 2,715,524 | | | | | | 6/15/16 | | | | 114,320 | | | | — | |
Japanese Yen | | | CITI | | | | Sell | | | | 310,702,000 | | | | 2,533,220 | | | | | | 6/16/16 | | | | — | | | | (65,009 | ) |
Japanese Yen | | | HSBC | | | | Sell | | | | 1,455,540,000 | | | | 12,139,616 | | | | | | 6/16/16 | | | | — | | | | (32,259 | ) |
Japanese Yen | | | JPHQ | | | | Sell | | | | 702,800,000 | | | | 5,727,441 | | | | | | 6/16/16 | | | | — | | | | (149,686 | ) |
FRANKLIN TEMPLETON VARIABLE INSURANCE PRODUCTS TRUST
STATEMENT OF INVESTMENTS
Templeton Global Bond VIP Fund (continued)
| | | | | | | | | | | | | | | | | | | | | | | | | | | | | | | | |
| Forward Exchange Contracts (continued) | | | | | | | |
| Currency | | Counterpartya | | | Type | | | Quantity | | | Contract
Amount* | | | | | | Settlement
Date | | | Unrealized
Appreciation | | | Unrealized
Depreciation | |
Japanese Yen | | | DBAB | | | | Sell | | | | 1,453,310,000 | | | | 12,014,103 | | | | | | | | 6/17/16 | | | $ | — | | | $ | (139,532 | ) |
Japanese Yen | | | CITI | | | | Sell | | | | 1,086,780,000 | | | | 8,969,126 | | | | | | | | 6/20/16 | | | | — | | | | (120,233 | ) |
Malaysian Ringgit | | | JPHQ | | | | Buy | | | | 14,772,000 | | | | 3,838,877 | | | | | | | | 6/20/16 | | | | — | | | | (418,016 | ) |
Euro | | | BZWS | | | | Sell | | | | 1,124,367 | | | | 1,291,195 | | | | | | | | 6/22/16 | | | | 63,591 | | | | — | |
Japanese Yen | | | DBAB | | | | Sell | | | | 1,455,820,000 | | | | 11,913,421 | | | | | | | | 6/22/16 | | | | — | | | | (263,247 | ) |
Philippine Peso | | | JPHQ | | | | Buy | | | | 251,010,000 | | | | 5,477,219 | | | | | | | | 6/27/16 | | | | — | | | | (206,791 | ) |
Philippine Peso | | | JPHQ | | | | Buy | | | | 17,950,000 | | | | 392,093 | | | | | | | | 6/29/16 | | | | — | | | | (15,236 | ) |
Malaysian Ringgit | | | JPHQ | | | | Buy | | | | 5,661,200 | | | | 1,476,193 | | | | | | | | 7/05/16 | | | | — | | | | (166,003 | ) |
Japanese Yen | | | JPHQ | | | | Sell | | | | 1,415,975,000 | | | | 11,849,064 | | | | | | | | 7/07/16 | | | | — | | | | (993 | ) |
Euro | | | MSCO | | | | Sell | | | | 9,679,000 | | | | 10,685,616 | | | | | | | | 7/18/16 | | | | 107,513 | | | | — | |
Malaysian Ringgit | | | JPHQ | | | | Buy | | | | 23,832,213 | | | | 5,722,020 | | | | | | | | 7/19/16 | | | | — | | | | (210,025 | ) |
Malaysian Ringgit | | | DBAB | | | | Buy | | | | 11,455,000 | | | | 2,644,275 | | | | EUR | | | | 7/20/16 | | | | — | | | | (240,906 | ) |
Euro | | | MSCO | | | | Sell | | | | 12,182,000 | | | | 13,316,753 | | | | | | | | 7/22/16 | | | | 1,046 | | | | — | |
Euro | | | DBAB | | | | Sell | | | | 1,759,000 | | | | 1,939,720 | | | | | | | | 7/25/16 | | | | 16,793 | | | | — | |
Japanese Yen | | | CITI | | | | Sell | | | | 913,412,000 | | | | 7,426,235 | | | | | | | | 7/25/16 | | | | — | | | | (223,477 | ) |
Japanese Yen | | | JPHQ | | | | Sell | | | | 1,407,000,000 | | | | 11,437,165 | | | | | | | | 7/25/16 | | | | — | | | | (346,284 | ) |
Malaysian Ringgit | | | HSBC | | | | Buy | | | | 14,613,000 | | | | 3,376,776 | | | | | | | | 7/25/16 | | | | 2,030 | | | | — | |
Malaysian Ringgit | | | HSBC | | | | Buy | | | | 7,209,825 | | | | 1,664,510 | | | | | | | | 7/26/16 | | | | 2,463 | | | | — | |
Malaysian Ringgit | | | DBAB | | | | Buy | | | | 16,628,000 | | | | 3,850,411 | | | | EUR | | | | 7/27/16 | | | | — | | | | (365,217 | ) |
Malaysian Ringgit | | | JPHQ | | | | Buy | | | | 9,715,000 | | | | 2,481,481 | | | | | | | | 7/27/16 | | | | — | | | | (235,395 | ) |
Euro | | | CITI | | | | Sell | | | | 1,935,410 | | | | 2,137,147 | | | | | | | | 7/28/16 | | | | 21,121 | | | | — | |
Euro | | | GSCO | | | | Sell | | | | 11,263,000 | | | | 12,418,809 | | | | | | | | 7/28/16 | | | | 104,721 | | | | — | |
Euro | | | JPHQ | | | | Sell | | | | 11,263,000 | | | | 12,561,511 | | | | | | | | 7/29/16 | | | | 246,938 | | | | — | |
Japanese Yen | | | BZWS | | | | Sell | | | | 1,079,470,000 | | | | 8,837,430 | | | | | | | | 7/29/16 | | | | — | | | | (204,447 | ) |
Malaysian Ringgit | | | JPHQ | | | | Buy | | | | 17,021,000 | | | | 4,322,245 | | | | | | | | 7/29/16 | | | | — | | | | (387,390 | ) |
Malaysian Ringgit | | | JPHQ | | | | Buy | | | | 16,628,000 | | | | 3,780,122 | | | | EUR | | | | 7/29/16 | | | | — | | | | (289,052 | ) |
Euro | | | BZWS | | | | Sell | | | | 282,898 | | | | 312,285 | | | | | | | | 8/05/16 | | | | 2,889 | | | | — | |
Euro | | | HSBC | | | | Sell | | | | 11,263,000 | | | | 12,433,226 | | | | | | | | 8/05/16 | | | | 115,259 | | | | — | |
Euro | | | JPHQ | | | | Sell | | | | 5,724,900 | | | | 6,320,433 | | | | | | | | 8/05/16 | | | | 59,301 | | | | — | |
Malaysian Ringgit | | | DBAB | | | | Buy | | | | 143,249,150 | | | | 32,381,471 | | | | EUR | | | | 8/08/16 | | | | — | | | | (2,318,188 | ) |
Malaysian Ringgit | | | HSBC | | | | Buy | | | | 21,208,085 | | | | 5,290,119 | | | | | | | | 8/08/16 | | | | — | | | | (389,574 | ) |
Malaysian Ringgit | | | JPHQ | | | | Buy | | | | 1,100,000 | | | | 274,794 | | | | | | | | 8/08/16 | | | | — | | | | (20,617 | ) |
Euro | | | CITI | | | | Sell | | | | 7,698,954 | | | | 8,456,146 | | | | | | | | 8/10/16 | | | | 34,400 | | | | — | |
Japanese Yen | | | CITI | | | | Sell | | | | 751,731,000 | | | | 6,085,265 | | | | | | | | 8/10/16 | | | | — | | | | (214,432 | ) |
South Korean Won | | | HSBC | | | | Buy | | | | 21,363,430,000 | | | | 18,182,416 | | | | | | | | 8/10/16 | | | | — | | | | (62,614 | ) |
Euro | | | DBAB | | | | Sell | | | | 4,845,000 | | | | 5,348,614 | | | | | | | | 8/11/16 | | | | 48,547 | | | | — | |
Euro | | | JPHQ | | | | Sell | | | | 6,343,900 | | | | 6,981,462 | | | | | | | | 8/11/16 | | | | 41,711 | | | | — | |
South Korean Won | | | HSBC | | | | Buy | | | | 11,980,000,000 | | | | 1,262,275,045 | | | | JPY | | | | 8/12/16 | | | | — | | | | (418,096 | ) |
Euro | | | MSCO | | | | Sell | | | | 1,962,500 | | | | 2,215,790 | | | | | | | | 8/15/16 | | | | 68,624 | | | | — | |
Euro | | | MSCO | | | | Sell | | | | 1,962,500 | | | | 2,200,335 | | | | | | | | 8/17/16 | | | | 53,000 | | | | — | |
Singapore Dollar | | | BZWS | | | | Buy | | | | 4,886,000 | | | | 3,473,377 | | | | | | | | 8/17/16 | | | | — | | | | (49,558 | ) |
Singapore Dollar | | | BZWS | | | | Sell | | | | 4,886,000 | | | | 3,453,858 | | | | | | | | 8/17/16 | | | | 30,038 | | | | — | |
Singapore Dollar | | | HSBC | | | | Buy | | | | 3,667,000 | | | | 2,607,181 | | | | | | | | 8/17/16 | | | | — | | | | (37,564 | ) |
Euro | | | BZWS | | | | Sell | | | | 7,066,000 | | | | 7,910,210 | | | | | | | | 8/18/16 | | | | 178,406 | | | | — | |
Japanese Yen | | | DBAB | | | | Sell | | | | 838,612,000 | | | | 6,811,781 | | | | | | | | 8/18/16 | | | | — | | | | (218,258 | ) |
Euro | | | JPHQ | | | | Sell | | | | 7,851,000 | | | | 8,744,954 | | | | | | | | 8/22/16 | | | | 152,828 | | | | — | |
Japanese Yen | | | HSBC | | | | Sell | | | | 1,621,372,000 | | | | 13,158,351 | | | | | | | | 8/22/16 | | | | — | | | | (435,706 | ) |
Japanese Yen | | | JPHQ | | | | Sell | | | | 1,135,828,000 | | | | 9,216,653 | | | | | | | | 8/22/16 | | | | — | | | | (306,462 | ) |
Japanese Yen | | | BZWS | | | | Sell | | | | 376,247,000 | | | | 3,069,400 | | | | | | | | 8/24/16 | | | | — | | | | (85,419 | ) |
Euro | | | SCNY | | | | Sell | | | | 13,581,483 | | | | 15,820,526 | | | | | | | | 8/26/16 | | | | 954,623 | | | | — | |
Japanese Yen | | | JPHQ | | | | Sell | | | | 1,135,833,000 | | | | 9,641,146 | | | | | | | | 8/26/16 | | | | 116,460 | | | | — | |
Euro | | | JPHQ | | | | Sell | | | | 14,996,625 | | | | 17,249,118 | | | | | | | | 8/29/16 | | | | 832,300 | | | | — | |
Japanese Yen | | | DBAB | | | | Sell | | | | 685,950,000 | | | | 5,766,709 | | | | | | | | 8/29/16 | | | | 13,886 | | | | — | |
Japanese Yen | | | JPHQ | | | | Sell | | | | 751,903,000 | | | | 6,318,592 | | | | | | | | 8/29/16 | | | | 12,645 | | | | — | |
Euro | | | DBAB | | | | Sell | | | | 1,058,312 | | | | 1,196,951 | | | | | | | | 8/31/16 | | | | 38,325 | | | | — | |
Japanese Yen | | | JPHQ | | | | Sell | | | | 372,662,000 | | | | 3,118,471 | | | | | | | | 8/31/16 | | | | — | | | | (7,166 | ) |
Euro | | | JPHQ | | | | Sell | | | | 20,765,000 | | | | 23,527,472 | | | | | | | | 9/06/16 | | | | 788,841 | | | | — | |
FRANKLIN TEMPLETON VARIABLE INSURANCE PRODUCTS TRUST
STATEMENT OF INVESTMENTS
Templeton Global Bond VIP Fund (continued)
| | | | | | | | | | | | | | | | | | | | | | | | | | | | | | | | |
| Forward Exchange Contracts (continued) | | | | | | | |
| Currency | | Counterpartya | | | Type | | | Quantity | | | Contract
Amount* | | | | | | Settlement
Date | | | Unrealized
Appreciation | | | Unrealized
Depreciation | |
Australian Dollar | | | CITI | | | | Sell | | | | 28,906,000 | | | | 20,823,304 | | | | | | | | 9/14/16 | | | $ | 4,196 | | | $ | — | |
Japanese Yen | | | BZWS | | | | Sell | | | | 981,707,504 | | | | 8,158,168 | | | | | | | | 9/20/16 | | | | — | | | | (82,352 | ) |
Euro | | | DBAB | | | | Sell | | | | 14,880,000 | | | | 16,867,968 | | | | | | | | 10/03/16 | | | | 555,756 | | | | — | |
Euro | | | JPHQ | | | | Sell | | | | 6,370,000 | | | | 7,197,399 | | | | | | | | 10/07/16 | | | | 213,041 | | | | — | |
Japanese Yen | | | JPHQ | | | | Sell | | | | 1,415,975,000 | | | | 11,884,369 | | | | | | | | 10/07/16 | | | | — | | | | (10,638 | ) |
Euro | | | DBAB | | | | Sell | | | | 18,880,000 | | | | 21,406,750 | | | | | | | | 10/11/16 | | | | 702,176 | | | | — | |
Japanese Yen | | | HSBC | | | | Sell | | | | 2,816,800,000 | | | | 23,703,454 | | | | | | | | 10/11/16 | | | | 36,115 | | | | — | |
Euro | | | HSBC | | | | Sell | | | | 8,692,000 | | | | 9,857,684 | | | | | | | | 10/13/16 | | | | 324,836 | | | | — | |
Japanese Yen | | | BZWS | | | | Sell | | | | 1,426,300,000 | | | | 12,005,387 | | | | | | | | 10/13/16 | | | | 20,153 | | | | — | |
Japanese Yen | | | DBAB | | | | Sell | | | | 1,406,600,000 | | | | 11,843,058 | | | | | | | | 10/13/16 | | | | 23,364 | | | | — | |
Malaysian Ringgit | | | DBAB | | | | Buy | | | | 60,000,000 | | | | 12,390,550 | | | | EUR | | | | 10/17/16 | | | | 227,867 | | | | — | |
Japanese Yen | | | JPHQ | | | | Sell | | | | 652,895,000 | | | | 5,559,439 | | | | | | | | 10/19/16 | | | | 71,547 | | | | — | |
Japanese Yen | | | BZWS | | | | Sell | | | | 735,200,000 | | | | 6,190,767 | | | | | | | | 10/24/16 | | | | 9,563 | | | | — | |
Euro | | | BZWS | | | | Sell | | | | 5,604,306 | | | | 6,239,134 | | | | | | | | 10/27/16 | | | | 88,850 | | | | — | |
Euro | | | DBAB | | | | Sell | | | | 224,556 | | | | 250,110 | | | | | | | | 11/04/16 | | | | 3,590 | | | | — | |
Euro | | | DBAB | | | | Sell | | | | 15,875,000 | | | | 17,454,563 | | | | | | | | 11/09/16 | | | | 22,928 | | | | — | |
Japanese Yen | | | CITI | | | | Sell | | | | 341,992,119 | | | | 2,841,410 | | | | | | | | 11/09/16 | | | | — | | | | (36,130 | ) |
Euro | | | CITI | | | | Sell | | | | 5,658,426 | | | | 6,115,910 | | | | | | | | 11/14/16 | | | | — | | | | (98,740 | ) |
Euro | | | JPHQ | | | | Sell | | | | 8,969,211 | | | | 9,693,161 | | | | | | | | 11/14/16 | | | | — | | | | (157,725 | ) |
Japanese Yen | | | CITI | | | | Sell | | | | 796,524,000 | | | | 6,545,517 | | | | | | | | 11/14/16 | | | | — | | | | (158,108 | ) |
Japanese Yen | | | HSBC | | | | Sell | | | | 413,563,000 | | | | 3,395,845 | | | | | | | | 11/14/16 | | | | — | | | | (84,742 | ) |
Japanese Yen | | | JPHQ | | | | Sell | | | | 335,950,000 | | | | 2,756,377 | | | | | | | | 11/14/16 | | | | — | | | | (71,011 | ) |
Japanese Yen | | | CITI | | | | Sell | | | | 366,680,000 | | | | 3,022,295 | | | | | | | | 11/16/16 | | | | — | | | | (64,020 | ) |
Japanese Yen | | | MSCO | | | | Sell | | | | 300,000,000 | | | | 2,471,475 | | | | | | | | 11/16/16 | | | | — | | | | (53,600 | ) |
Euro | | | DBAB | | | | Sell | | | | 2,768,730 | | | | 3,008,834 | | | | | | | | 11/17/16 | | | | — | | | | (32,468 | ) |
Euro | | | DBAB | | | | Sell | | | | 2,240,000 | | | | 2,430,960 | | | | | | | | 11/18/16 | | | | — | | | | (29,670 | ) |
Japanese Yen | | | DBAB | | | | Sell | | | | 796,770,000 | | | | 6,561,180 | | | | | | | | 11/18/16 | | | | — | | | | (145,819 | ) |
Japanese Yen | | | CITI | | | | Sell | | | | 1,107,834,000 | | | | 9,088,429 | | | | | | | | 11/21/16 | | | | — | | | | (238,386 | ) |
Euro | | | DBAB | | | | Sell | | | | 837,570 | | | | 904,626 | | | | | | | | 11/28/16 | | | | — | | | | (15,851 | ) |
Euro | | | GSCO | | | | Sell | | | | 463,000 | | | | 496,405 | | | | | | | | 12/02/16 | | | | — | | | | (12,515 | ) |
Australian Dollar | | | JPHQ | | | | Sell | | | | 29,260,000 | | | | 20,823,728 | | | | | | | | 12/12/16 | | | | — | | | | (186,497 | ) |
Australian Dollar | | | JPHQ | | | | Sell | | | | 14,544,000 | | | | 10,411,759 | | | | | | | | 12/14/16 | | | | — | | | | (30,904 | ) |
Euro | | | MSCO | | | | Sell | | | | 1,412,000 | | | | 1,567,461 | | | | | | | | 12/14/16 | | | | 14,588 | | | | — | |
Euro | | | JPHQ | | | | Sell | | | | 5,095,000 | | | | 5,670,378 | | | | | | | | 12/15/16 | | | | 66,808 | | | | — | |
| | | | | | | | | | | | | | | | | | | | | | | | | | | | |
Total Forward Exchange Contracts | | | $ | 49,581,222 | | | $ | (27,857,622 | ) |
| | | | | | | | | | | | | | | | | | | | | | | | | | | | |
Net unrealized appreciation (depreciation) | | | $ | 21,723,600 | | | | | |
| | | | | | | | | | | | | | | | | | | | | | | | | | | | | | | | |
aMay be comprised of multiple contracts with the same counterparty, currency and settlement date.
*In U.S. dollars unless otherwise indicated.
See Abbreviations on page TGB-37
FRANKLIN TEMPLETON VARIABLE INSURANCE PRODUCTS TRUST
STATEMENT OF INVESTMENTS
Templeton Global Bond VIP Fund (continued)
At December 31, 2015, the Fund had the following interest rate swap contracts outstanding. See Note 1(d).
| | | | | | | | | | | | | | | | | | | | |
| Interest Rate Swap Contracts | | | | | | | | | | | | | | | |
| Description | | Counterparty /
Exchange | | | Notional
Amount | | | Expiration
Date | | | Unrealized
Appreciation | | | Unrealized
Depreciation | |
| Centrally Cleared Swap Contracts | | | | | | | | | | | | | | | | | | | | |
Receive Floating rate 3-month USD BBA LIBOR
Pay Fixed rate 0.926% | | | LCH | | | $ | 183,490,000 | | | | 10/17/17 | | | $ | 321,238 | | | $ | — | |
Receive Floating rate 3-month USD BBA LIBOR
Pay Fixed rate 2.775% | | | CME | | | | 13,090,000 | | | | 10/04/23 | | | | — | | | | (805,234 | ) |
Receive Floating rate 3-month USD BBA LIBOR
Pay Fixed rate 2.795% | | | CME | | | | 13,090,000 | | | | 10/04/23 | | | | — | | | | (825,006 | ) |
Receive Floating rate 3-month USD BBA LIBOR
Pay Fixed rate 2.765% | | | CME | | | | 13,090,000 | | | | 10/07/23 | | | | — | | | | (793,851 | ) |
Receive Floating rate 3-month USD BBA LIBOR
Pay Fixed rate 2.731% | | | LCH | | | | 34,000,000 | | | | 7/07/24 | | | | — | | | | (2,189,647 | ) |
Receive Floating rate 3-month USD BBA LIBOR
Pay Fixed rate 1.914% | | | LCH | | | | 114,670,000 | | | | 1/22/25 | | | | 1,105,191 | | | | — | |
Receive Floating rate 3-month USD BBA LIBOR
Pay Fixed rate 1.970% | | | LCH | | | | 143,340,000 | | | | 1/23/25 | | | | 686,685 | | | | — | |
Receive Floating rate 3-month USD BBA LIBOR
Pay Fixed rate 1.973% | | | LCH | | | | 84,590,000 | | | | 1/27/25 | | | | 401,799 | | | | — | |
Receive Floating rate 3-month USD BBA LIBOR
Pay Fixed rate 1.937% | | | LCH | | | | 21,150,000 | | | | 1/29/25 | | | | 170,263 | | | | — | |
Receive Floating rate 3-month USD BBA LIBOR
Pay Fixed rate 1.942% | | | LCH | | | | 17,910,000 | | | | 1/30/25 | | | | 137,428 | | | | — | |
Receive Floating rate 3-month USD BBA LIBOR
Pay Fixed rate 1.817% | | | LCH | | | | 28,210,000 | | | | 2/03/25 | | | | 538,223 | | | | — | |
Receive Floating rate 3-month USD BBA LIBOR
Pay Fixed rate 3.668% | | | CME | | | | 6,370,000 | | | | 10/04/43 | | | | — | | | | (1,447,119 | ) |
Receive Floating rate 3-month USD BBA LIBOR
Pay Fixed rate 3.687% | | | CME | | | | 6,370,000 | | | | 10/04/43 | | | | — | | | | (1,472,006 | ) |
Receive Floating rate 3-month USD BBA LIBOR
Pay Fixed rate 3.675% | | | CME | | | | 6,370,000 | | | | 10/07/43 | | | | — | | | | (1,455,588 | ) |
| | | | | | | | | | | | | | | | |
Total Centrally Cleared Swap Contracts | | | | 3,360,827 | | | | (8,988,451 | ) |
| | | | | | | | | | | | | | | | |
| OTC Swap Contracts | | | | | | | | | | | | | | | | | | | | |
Receive Floating rate 3-month USD BBA LIBOR
Pay Fixed rate 3.558% | | | JPHQ | | | | 3,240,000 | | | | 3/04/21 | | | | — | | | | (329,784 | ) |
Receive Floating rate 3-month USD BBA LIBOR
Pay Fixed rate 3.523% | | | DBAB | | | | 14,630,000 | | | | 3/28/21 | | | | — | | | | (1,440,294 | ) |
Receive Floating rate 3-month USD BBA LIBOR
Pay Fixed rate 4.347% | | | CITI | | | | 7,460,000 | | | | 2/25/41 | | | | — | | | | (2,653,496 | ) |
Receive Floating rate 3-month USD BBA LIBOR
Pay Fixed rate 4.349% | | | JPHQ | | | | 7,460,000 | | | | 2/25/41 | | | | — | | | | (2,657,408 | ) |
Receive Floating rate 3-month USD BBA LIBOR
Pay Fixed rate 4.320% | | | JPHQ | | | | 5,600,000 | | | | 2/28/41 | | | | — | | | | (1,971,357 | ) |
Receive Floating rate 3-month USD BBA LIBOR
Pay Fixed rate 4.299% | | | JPHQ | | | | 1,870,000 | | | | 3/01/41 | | | | — | | | | (646,676 | ) |
| | | | | | | | | | | | | | | | |
Total OTC Swap Contracts | | | | — | | | | (9,699,015 | ) |
| | | | | | | | | | | | | | | | |
Total Interest Rate Swap Contracts | | | | 3,360,827 | | | | (18,687,466 | ) |
| | | | | | | | | | | | | | | | |
Net unrealized appreciation (depreciation) | | | $ | (15,326,639 | ) |
| | | | | | | | | | | | | | | | | | | | |
See Abbreviations on page TGB-37.
| | | | | | |
| | TGB-22 | | | Annual Report | The accompanying notes are an integral part of these financial statements. | | |
FRANKLIN TEMPLETON VARIABLE INSURANCE PRODUCTS TRUST
Financial Statements
Statement of Assets and Liabilities
December 31, 2015
| | | | |
| | | Templeton Global
Bond VIP Fund | |
Assets: | | | | |
Investments in securities: | | | | |
Cost - Unaffiliated issuers | | $ | 2,893,105,633 | |
Cost - Non-controlled affiliates (Note 3e) | | | 420,632,565 | |
Cost - Repurchase agreements | | | 256,339,988 | |
| | | | |
Total cost of investments | | $ | 3,570,078,186 | |
| | | | |
Value - Unaffiliated issuers | | $ | 2,601,448,655 | |
Value - Non-controlled affiliates (Note 3e) | | | 420,632,565 | |
Value - Repurchase agreements | | | 256,339,988 | |
| | | | |
Total value of investments | | | 3,278,421,208 | |
Cash | | | 3,820,980 | |
Restricted cash (Note 1e) | | | 11,046,257 | |
Foreign currency, at value (cost $24,785,830) | | | 24,835,444 | |
Receivables: | | | | |
Capital shares sold | | | 764,216 | |
Interest | | | 24,193,124 | |
Due from brokers | | | 32,922,862 | |
Unrealized appreciation on OTC forward exchange contracts | | | 49,581,222 | |
Other assets | | | 3,505 | |
| | | | |
Total assets | | | 3,425,588,818 | |
| | | | |
Liabilities: | | | | |
Payables: | | | | |
Capital shares redeemed | | | 2,271,758 | |
Management fees | | | 1,306,046 | |
Distribution fees | | | 1,324,426 | |
Variation margin | | | 1,991,557 | |
Due to Brokers | | | 11,046,257 | |
Unrealized depreciation on OTC forward exchange contracts | | | 27,857,622 | |
Unrealized depreciation on OTC swap contracts | | | 9,699,015 | |
Deferred tax | | | 1,386,352 | |
Accrued expenses and other liabilities | | | 1,190,997 | |
| | | | |
Total liabilities | | | 58,074,030 | |
| | | | |
Net assets, at value | | $ | 3,367,514,788 | |
| | | | |
Net assets consist of: | | | | |
Paid-in capital | | $ | 3,691,143,545 | |
Distributions in excess of net investment income | | | (39,413,185 | ) |
Net unrealized appreciation (depreciation) | | | (286,954,306 | ) |
Accumulated net realized gain (loss) | | | 2,738,734 | |
| | | | |
Net assets, at value | | $ | 3,367,514,788 | |
| | | | |
| | | | | | |
| | | The accompanying notes are an integral part of these financial statements. | Annual Report | | | TGB-23 | |
FRANKLIN TEMPLETON VARIABLE INSURANCE PRODUCTS TRUST
FINANCIAL STATEMENTS
Statement of Assets and Liabilities (continued)
December 31, 2015
| | | | |
| | | Templeton Global
Bond VIP Fund | |
| |
| Class 1: | | | | |
Net assets, at value | | $ | 292,802,321 | |
| | | | |
Shares outstanding | | | 17,915,670 | |
| | | | |
Net asset value and maximum offering price per share | | $ | 16.34 | |
| | | | |
| |
| Class 2: | | | | |
Net assets, at value | | $ | 2,971,667,106 | |
| | | | |
Shares outstanding | | | 188,099,690 | |
| | | | |
Net asset value and maximum offering price per share | | $ | 15.80 | |
| | | | |
| |
| Class 4: | | | | |
Net assets, at value | | $ | 103,045,361 | |
| | | | |
Shares outstanding | | | 6,368,724 | |
| | | | |
Net asset value and maximum offering price per share | | $ | 16.18 | |
| | | | |
| | | | | | |
| | TGB-24 | | | Annual Report | The accompanying notes are an integral part of these financial statements. | | |
FRANKLIN TEMPLETON VARIABLE INSURANCE PRODUCTS TRUST
FINANCIAL STATEMENTS
Statement of Operations
for the year ended December 31, 2015
| | | | |
| | | Templeton Global
Bond VIP Fund | |
Investment income: | | | | |
Interest (net of foreign taxes $3,263,991) | | $ | 112,995,300 | |
Inflation principal adjustments | | | 11,243,553 | |
| | | | |
Total investment income | | | 124,238,853 | |
| | | | |
Expenses: | | | | |
Management fees (Note 3a) | | | 16,194,413 | |
Distribution fees: (Note 3c) | | | | |
Class 2 | | | 7,809,079 | |
Class 4 | | | 382,765 | |
Custodian fees (Note 4) | | | 1,404,679 | |
Reports to shareholders | | | 582,267 | |
Professional fees | | | 112,653 | |
Trustees’ fees and expenses | | | 15,330 | |
Other | | | 161,260 | |
| | | | |
Total expenses | | | 26,662,446 | |
Expense reductions (Note 4) | | | (15,911 | ) |
Expenses waived/paid by affiliates (Note 3e) | | | (14,054 | ) |
| | | | |
Net expenses | | | 26,632,481 | |
| | | | |
Net investment income | | | 97,606,372 | |
| | | | |
Realized and unrealized gains (losses): | | | | |
Net realized gain (loss) from: | | | | |
Investments | | | (176,801,684 | ) |
Foreign currency transactions | | | 254,546,819 | |
Swap contracts | | | (8,296,986 | ) |
| | | | |
Net realized gain (loss) | | | 69,448,149 | |
| | | | |
Net change in unrealized appreciation (depreciation) on: | | | | |
Investments | | | (154,083,391 | ) |
Translation of other assets and liabilities denominated in foreign currencies | | | (169,975,505 | ) |
Swap contracts | | | 700,784 | |
Change in deferred taxes on unrealized appreciation | | | 1,238,313 | |
| | | | |
Net change in unrealized appreciation (depreciation) | | | (322,119,799 | ) |
| | | | |
Net realized and unrealized gain (loss) | | | (252,671,650 | ) |
| | | | |
Net increase (decrease) in net assets resulting from operations | | $ | (155,065,278 | ) |
| | | | |
| | | | | | |
| | | The accompanying notes are an integral part of these financial statements. | Annual Report | | | TGB-25 | |
FRANKLIN TEMPLETON VARIABLE INSURANCE PRODUCTS TRUST
FINANCIAL STATEMENTS
Statements of Changes in Net Assets
| | | | | | | | |
| | | Templeton Global Bond VIP Fund | |
| | | Year Ended December 31, | |
| | | 2015 | | | 2014 | |
Increase (decrease) in net assets: | | | | | | | | |
Operations: | | | | | | | | |
Net investment income | | $ | 97,606,372 | | | $ | 100,660,962 | |
Net realized gain (loss) | | | 69,448,149 | | | | 33,697,929 | |
Net change in unrealized appreciation (depreciation) | | | (322,119,799 | ) | | | (73,886,293 | ) |
| | | | |
Net increase (decrease) in net assets resulting from operations | | | (155,065,278 | ) | | | 60,472,598 | |
| | | | |
Distributions to shareholders from: | | | | | | | | |
Net investment income and net foreign currency gains: | | | | | | | | |
Class 1 | | | (24,254,176 | ) | | | (15,858,865 | ) |
Class 2 | | | (245,964,961 | ) | | | (156,385,457 | ) |
Class 4 | | | (8,346,133 | ) | | | (5,645,270 | ) |
Net realized gains: | | | | | | | | |
Class 1 | | | (1,526,914 | ) | | | — | |
Class 2 | | | (15,975,209 | ) | | | — | |
Class 4 | | | (550,981 | ) | | | — | |
| | | | |
Total distributions to shareholders | | | (296,618,374 | ) | | | (177,889,592 | ) |
| | | | |
Capital share transactions: (Note 2) | | | | | | | | |
Class 1 | | | 8,052,024 | | | | 52,744,146 | |
Class 2 | | | 193,114,598 | | | | 457,068,596 | |
Class 3 | | | — | | | | (195,888,546 | ) |
Class 4 | | | 5,703,235 | | | | (3,448,828 | ) |
| | | | |
Total capital share transactions | | | 206,869,857 | | | | 310,475,368 | |
| | | | |
Redemption fees | | | — | | | | 1,163 | |
| | | | |
Net increase (decrease) in net assets | | | (244,813,795 | ) | | | 193,059,537 | |
Net assets: | | | | | | | | |
Beginning of year | | | 3,612,328,583 | | | | 3,419,269,046 | |
| | | | |
End of year | | $ | 3,367,514,788 | | | $ | 3,612,328,583 | |
| | | | |
Undistributed net investment income (distributions in excess of net investment income) included in net assets: | | | | | | | | |
End of year | | $ | (39,413,185 | ) | | $ | 39,205,955 | |
| | | | |
| | | | | | |
| | TGB-26 | | | Annual Report | The accompanying notes are an integral part of these financial statements. | | |
FRANKLIN TEMPLETON VARIABLE INSURANCE PRODUCTS TRUST
Notes to Financial Statements
Templeton Global Bond VIP Fund
1. Organization and Significant Accounting Policies
Franklin Templeton Variable Insurance Products Trust (Trust) is registered under the Investment Company Act of 1940 (1940 Act) as an open-end management investment company, consisting of nineteen separate funds and applies the specialized accounting and reporting guidance in U.S. Generally Accepted Accounting Principles (U.S. GAAP). Templeton Global Bond VIP Fund (Fund) is included in this report. The financial statements of the remaining funds in the Trust are presented separately. Shares of the Fund are generally sold only to insurance company separate accounts to fund the benefits of variable life insurance policies or variable annuity contracts. The Fund offers three classes of shares: Class 1, Class 2 and Class 4. Effective May 1, 2014, all Class 3 shares were converted to Class 2. Each class of shares differs by its distribution fees, voting rights on matters affecting a single class and its exchange privilege.
The following summarizes the Fund’s significant accounting policies.
a. Financial Instrument Valuation
The Fund’s investments in financial instruments are carried at fair value daily. Fair value is the price that would be received to sell an asset or paid to transfer a liability in an orderly transaction between market participants on the measurement date. The Fund calculates the net asset value (NAV) per share as of 4 p.m. Eastern time each day the New York Stock Exchange (NYSE) is open for trading. Under compliance policies and procedures approved by the Trust’s Board of Trustees (the Board), the Fund’s administrator has responsibility for oversight of valuation, including leading the cross-functional Valuation and Liquidity Oversight Committee (VLOC). The VLOC provides administration and oversight of the Fund’s valuation policies and procedures, which are approved annually by the Board. Among other things, these procedures allow the Fund to utilize independent pricing services, quotations from securities and financial instrument dealers, and other market sources to determine fair value.
Debt securities generally trade in the over-the-counter (OTC) market rather than on a securities exchange. The Fund’s pricing services use multiple valuation techniques to determine fair value. In instances where sufficient market activity exists, the pricing services may utilize a market-based approach through which quotes from market makers are used to determine fair value. In instances where sufficient market activity may not
exist or is limited, the pricing services also utilize proprietary valuation models which may consider market characteristics such as benchmark yield curves, credit spreads, estimated default rates, anticipated market interest rate volatility, coupon rates, anticipated timing of principal repayments, underlying collateral, and other unique security features in order to estimate the relevant cash flows, which are then discounted to calculate the fair value. Securities denominated in a foreign currency are converted into their U.S. dollar equivalent at the foreign exchange rate in effect at 4 p.m. Eastern time on the date that the values of the foreign debt securities are determined.
Investments in open-end mutual funds are valued at the closing NAV. Repurchase agreements are valued at cost, which approximates fair value.
Derivative financial instruments (derivatives) listed on an exchange are valued at the official closing price of the day. Certain derivatives trade in the OTC market. The Fund’s pricing services use various techniques including industry standard option pricing models and proprietary discounted cash flow models to determine the fair value of those instruments. The Fund’s net benefit or obligation under the derivative contract, as measured by the fair value of the contract, is included in net assets.
The Fund has procedures to determine the fair value of financial instruments for which market prices are not reliable or readily available. Under these procedures, the VLOC convenes on a regular basis to review such financial instruments and considers a number of factors, including significant unobservable valuation inputs, when arriving at fair value. The VLOC primarily employs a market-based approach which may use related or comparable assets or liabilities, recent transactions, market multiples, book values, and other relevant information for the investment to determine the fair value of the investment. An income-based valuation approach may also be used in which the anticipated future cash flows of the investment are discounted to calculate fair value. Discounts may also be applied due to the nature or duration of any restrictions on the disposition of the investments. Due to the inherent uncertainty of valuations of such investments, the fair values may differ significantly from the values that would have been used had an active market existed. The VLOC employs various methods for calibrating these valuation approaches including a regular review of key inputs and assumptions, transactional back-testing or disposition analysis, and reviews of any related market activity.
FRANKLIN TEMPLETON VARIABLE INSURANCE PRODUCTS TRUST
NOTES TO FINANCIAL STATEMENTS
Templeton Global Bond VIP Fund (continued)
1. Organization and Significant Accounting Policies (continued)
b. Foreign Currency Translation
Portfolio securities and other assets and liabilities denominated in foreign currencies are translated into U.S. dollars based on the exchange rate of such currencies against U.S. dollars on the date of valuation. The Fund may enter into foreign currency exchange contracts to facilitate transactions denominated in a foreign currency. Purchases and sales of securities, income and expense items denominated in foreign currencies are translated into U.S. dollars at the exchange rate in effect on the transaction date. Portfolio securities and assets and liabilities denominated in foreign currencies contain risks that those currencies will decline in value relative to the U.S. dollar. Occasionally, events may impact the availability or reliability of foreign exchange rates used to convert the U.S. dollar equivalent value. If such an event occurs, the foreign exchange rate will be valued at fair value using procedures established and approved by the Board.
The Fund does not separately report the effect of changes in foreign exchange rates from changes in market prices on securities held. Such changes are included in net realized and unrealized gain or loss from investments in the Statement of Operations.
Realized foreign exchange gains or losses arise from sales of foreign currencies, currency gains or losses realized between the trade and settlement dates on securities transactions and the difference between the recorded amounts of dividends, interest, and foreign withholding taxes and the U.S. dollar equivalent of the amounts actually received or paid. Net unrealized foreign exchange gains and losses arise from changes in foreign exchange rates on foreign denominated assets and liabilities other than investments in securities held at the end of the reporting period.
c. Joint Repurchase Agreement
The Fund enters into a joint repurchase agreement whereby its uninvested cash balance is deposited into a joint cash account with other funds managed by the investment manager or an affiliate of the investment manager and is used to invest in one or more repurchase agreements. The value and face amount of the joint repurchase agreement are allocated to the funds based on their pro-rata interest. A repurchase agreement is accounted for as a loan by the Fund to the seller, collateralized by securities which are delivered to the Fund’s custodian. The fair value, including accrued interest, of the initial collateralization
is required to be at least 102% of the dollar amount invested by the funds, with the value of the underlying securities marked to market daily to maintain coverage of at least 100%. Repurchase agreements are subject to the terms of Master Repurchase Agreements (MRAs) with approved counterparties (sellers). The MRAs contain various provisions, including but not limited to events of default and maintenance of collateral for repurchase agreements. In the event of default by either the seller or the Fund, certain MRAs may permit the non-defaulting party to net and close-out all transactions, if any, traded under such agreements. The Fund may sell securities it holds as collateral and apply the proceeds towards the repurchase price and any other amounts owed by the seller to the Fund in the event of default by the seller. This could involve costs or delays in addition to a loss on the securities if their value falls below the repurchase price owed by the seller. The joint repurchase agreement held by the Fund at year end, as indicated in the Statement of Investments, had been entered into on December 31, 2015.
d. Derivative Financial Instruments
The Fund invested in derivatives in order to manage risk or gain exposure to various other investments or markets. Derivatives are financial contracts based on an underlying or notional amount, require no initial investment or an initial net investment that is smaller than would normally be required to have a similar response to changes in market factors, and require or permit net settlement. Derivatives contain various risks including the potential inability of the counterparty to fulfill their obligations under the terms of the contract, the potential for an illiquid secondary market, and/or the potential for market movements which expose the Fund to gains or losses in excess of the amounts shown in the Statement of Assets and Liabilities. Realized gain and loss and unrealized appreciation and depreciation on these contracts for the period are included in the Statement of Operations.
Derivative counterparty credit risk is managed through a formal evaluation of the creditworthiness of all potential counterparties. The Fund attempts to reduce its exposure to counterparty credit risk on OTC derivatives, whenever possible, by entering into International Swaps and Derivatives Association (ISDA) master agreements with certain counterparties. These agreements contain various provisions, including but not limited to collateral requirements, events of default, or early termination. Termination events applicable to the counterparty include certain deteriorations in the credit quality of the counterparty.
FRANKLIN TEMPLETON VARIABLE INSURANCE PRODUCTS TRUST
NOTES TO FINANCIAL STATEMENTS
Templeton Global Bond VIP Fund (continued)
Termination events applicable to the Fund include failure of the Fund to maintain certain net asset levels and/or limit the decline in net assets over various periods of time. In the event of default or early termination, the ISDA master agreement gives the non-defaulting party the right to net and close-out all transactions traded, whether or not arising under the ISDA agreement, to one net amount payable by one counterparty to the other. However, absent an event of default or early termination, OTC derivative assets and liabilities are presented gross and not offset in the Statement of Assets and Liabilities. Early termination by the counterparty may result in an immediate payment by the Fund of any net liability owed to that counterparty under the ISDA agreement.
Collateral requirements differ by type of derivative. Collateral or initial margin requirements are set by the broker or exchange clearing house for exchange traded and centrally cleared derivatives. Initial margin deposited is held at the exchange and can be in the form of cash and/or securities. For OTC derivatives traded under an ISDA master agreement, posting of collateral is required by either the Fund or the applicable counterparty if the total net exposure of all OTC derivatives with the applicable counterparty exceeds the minimum transfer amount, which typically ranges from $100,000 to $250,000, and can vary depending on the counterparty and the type of the agreement. Generally, collateral is determined at the close of Fund business each day and any additional collateral required due to changes in derivative values may be delivered by the Fund or the counterparty within a few business days. Collateral pledged and/or received by the Fund for OTC derivatives, if any, is held in segregated accounts with the Fund’s custodian/counterparty broker and can be in the form of cash and/or securities. Unrestricted cash may be invested according to the Fund’s investment objectives. To the extent that the amounts due to the Fund from its counterparties are not subject to collateralization or are not fully collateralized, the Fund bears the risk of loss from counterparty non-performance.
The Fund entered into OTC forward exchange contracts primarily to manage and/or gain exposure to certain foreign currencies. A forward exchange contract is an agreement between the Fund and a counterparty to buy or sell a foreign currency at a specific exchange rate on a future date.
The Fund entered into interest rate swap contracts primarily to manage interest rate risk. An interest rate swap is an agreement between the Fund and a counterparty to exchange cash flows
based on the difference between two interest rates, applied to a notional amount. These agreements may be privately negotiated in the over-the-counter market (OTC interest rate swaps) or may be executed on a registered exchange (centrally cleared interest rate swaps). For centrally cleared interest rate swaps, required initial margins are pledged by the Fund, and the daily change in fair value is accounted for as a variation margin payable or receivable in the Statement of Assets and Liabilities. Over the term of the contract, contractually required payments to be paid and to be received are accrued daily and recorded as unrealized depreciation and appreciation until the payments are made, at which time they are realized.
See Note 9 regarding other derivative information.
e. Restricted Cash
At December 31, 2015, the Fund held restricted cash in connection with investments in certain derivative securities. Restricted cash is held in a segregated account with the Fund’s counterparty broker and is reflected in the Statement of Assets and Liabilities.
f. Loan Participation Notes
The Fund invests in loan participation notes (Participations). Participations are loans originally issued to a borrower by one or more financial institutions (the Lender) and subsequently sold to other investors, such as the Fund. Participations typically result in the Fund having a contractual relationship only with the Lender and not with the borrower. The Fund has the right to receive from the Lender any payments of principal, interest and fees which the Lender received from the borrower. The Fund generally has no rights to either enforce compliance by the borrower with the terms of the loan agreement or to any collateral relating to the original loan. As a result, the Fund assumes the credit risk of both the borrower and the Lender that is selling the Participation. The Participations may also involve interest rate risk and liquidity risk, including the potential default or insolvency of the borrower and/or the Lender.
g. Income and Deferred Taxes
It is the Fund’s policy to qualify as a regulated investment company under the Internal Revenue Code. The Fund intends to distribute to shareholders substantially all of its taxable income and net realized gains to relieve it from federal income and if applicable, excise taxes. As a result, no provision for U.S. federal income taxes is required.
FRANKLIN TEMPLETON VARIABLE INSURANCE PRODUCTS TRUST
NOTES TO FINANCIAL STATEMENTS
Templeton Global Bond VIP Fund (continued)
1. Organization and Significant Accounting Policies (continued)
g. Income and Deferred Taxes (continued)
The Fund may be subject to foreign taxation related to income received, capital gains on the sale of securities and certain foreign currency transactions in the foreign jurisdictions in which it invests. Foreign taxes, if any, are recorded based on the tax regulations and rates that exist in the foreign markets in which the Fund invests. When a capital gain tax is determined to apply, the Fund records an estimated deferred tax liability in an amount that would be payable if the securities were disposed of on the valuation date.
The Fund may recognize an income tax liability related to its uncertain tax positions under U.S. GAAP when the uncertain tax position has a less than 50% probability that it will be sustained upon examination by the tax authorities based on its technical merits. As of December 31, 2015, the Fund has determined that no tax liability is required in its financial statements related to uncertain tax positions for any open tax years (or expected to be taken on future tax returns). Open tax years are those that remain subject to examination and are based on each tax jurisdiction’s statute of limitation.
h. Security Transactions, Investment Income, Expenses and Distributions
Security transactions are accounted for on trade date. Realized gains and losses on security transactions are determined on a specific identification basis. Interest income and estimated expenses are accrued daily. Amortization of premium and accretion of discount on debt securities are included in interest income. Distributions to shareholders are recorded on the ex-dividend date and are determined according to income tax regulations (tax basis). Distributable earnings determined on a tax basis may differ from earnings recorded in accordance with U.S. GAAP. These differences may be permanent or temporary. Permanent differences are reclassified among capital accounts to reflect their tax character. These reclassifications have no impact on net assets or the results of operations. Temporary differences are not reclassified, as they may reverse in subsequent periods.
Common expenses incurred by the Trust are allocated among the Funds based on the ratio of net assets of each Fund to the combined net assets of the Trust. Fund specific expenses are charged directly to the fund that incurred the expense.
Realized and unrealized gains and losses and net investment income, not including class specific expenses, are allocated daily to each class of shares based upon the relative proportion of net assets of each class. Differences in per share distributions, by class, are generally due to differences in class specific expenses.
Inflation-indexed bonds are adjusted for inflation through periodic increases or decreases in the security’s interest accruals, face amount, or principal redemption value, by amounts corresponding to the rate of inflation as measured by an index. Any increase or decrease in the face amount or principal redemption value will be included as inflation principal adjustments in the Statement of Operations.
i. Accounting Estimates
The preparation of financial statements in accordance with U.S. GAAP requires management to make estimates and assumptions that affect the reported amounts of assets and liabilities at the date of the financial statements and the amounts of income and expenses during the reporting period. Actual results could differ from those estimates.
j. Redemption Fees
Redemptions and exchanges of interests in an insurance company subaccount that invested in Class 3 shares of the Fund were subject to a 1.0% short term trading fee if the interest in the subaccount had been held for less than 60 days. Such fees were retained by the Fund and accounted for as an addition to paid-in capital, allocated to each class of shares based upon the relative proportion of net assets of each class. There were no redemption fees for the year.
k. Guarantees and Indemnifications
Under the Trust’s organizational documents, its officers and trustees are indemnified by the Trust against certain liabilities arising out of the performance of their duties to the Trust. Additionally, in the normal course of business, the Trust, on behalf of the Fund, enters into contracts with service providers that contain general indemnification clauses. The Trust’s maximum exposure under these arrangements is unknown as this would involve future claims that may be made against the Trust that have not yet occurred. Currently, the Trust expects the risk of loss to be remote.
FRANKLIN TEMPLETON VARIABLE INSURANCE PRODUCTS TRUST
NOTES TO FINANCIAL STATEMENTS
Templeton Global Bond VIP Fund (continued)
2. Shares of Beneficial Interest
At December 31, 2015, there were an unlimited number of shares authorized (without par value). Transactions in the Fund’s shares were as follows:
| | | | | | | | | | | | | | | | | | |
| | | Year Ended December 31, | |
| | | 2015 | | | | | 2014 | |
| | | Shares | | | Amount | | | | | Shares | | | Amount | |
| | | | | |
| Class 1 Shares: | | | | | | | | | | | | | | | | | | |
Shares sold | | | 3,348,667 | | | $ | 58,944,948 | | | | | | 4,252,687 | | | $ | 81,034,541 | |
Shares issued in reinvestment of distributions | | | 1,514,753 | | | | 25,781,090 | | | | | | 844,006 | | | | 15,858,865 | |
Shares redeemed | | | (4,380,221 | ) | | | (76,674,014 | ) | | | | | (2,332,299 | ) | | | (44,149,260 | ) |
| | | | |
Net increase (decrease) | | | 483,199 | | | $ | 8,052,024 | | | | | | 2,764,394 | | | $ | 52,744,146 | |
| | | | |
| Class 2 Shares: | | | | | | | | | | | | | | | | | | |
Shares sold | | | 15,666,500 | | | $ | 268,873,539 | | | | | | 34,833,702 | | | $ | 645,437,884 | |
Shares issued in reinvestment of distributions | | | 15,904,078 | | | | 261,940,170 | | | | | | 8,573,764 | | | | 156,385,457 | |
Shares redeemed | | | (20,123,134 | ) | | | (337,699,111 | ) | | | | | (18,696,173 | ) | | | (344,754,745 | ) |
| | | | |
Net increase (decrease) | | | 11,447,444 | | | $ | 193,114,598 | | | | | | 24,711,293 | | | $ | 457,068,596 | |
| | | | |
| Class 3 Sharesa: | | | | | | | | | | | | | | | | | | |
Shares sold | | | | | | | | | | | | | 167,296 | | | $ | 3,090,319 | |
Shares redeemed | | | | | | | | | | | | | (10,595,103 | ) | | | (198,978,865 | ) |
| | | | | | | | | | | | | | |
Net increase (decrease) | | | | | | | | | | | | | (10,427,807 | ) | | $ | (195,888,546 | ) |
| | | | | | | | | | | | | | |
| Class 4 Shares: | | | | | | | | | | | | | | | | | | |
Shares sold | | | 1,068,838 | | | $ | 18,598,516 | | | | | | 721,184 | | | $ | 13,510,739 | |
Shares issued in reinvestment of distributions | | | 527,080 | | | | 8,897,114 | | | | | | 302,695 | | | | 5,645,270 | |
Shares redeemed | | | (1,276,578 | ) | | | (21,792,395 | ) | | | | | (1,203,628 | ) | | | (22,604,837 | ) |
| | | | |
Net increase (decrease) | | | 319,340 | | | $ | 5,703,235 | | | | | | (179,749 | ) | | $ | (3,448,828 | ) |
| | | | |
aEffective May 1, 2014, all Class 3 shares were converted to Class 2.
3. Transactions With Affiliates
Franklin Resources, Inc. is the holding company for various subsidiaries that together are referred to as Franklin Templeton Investments. Certain officers and trustees of the Fund are also officers and/or directors of the following subsidiaries:
| | |
| Subsidiary | | Affiliation |
Franklin Advisers, Inc. (Advisers) | | Investment manager |
Franklin Templeton Services, LLC (FT Services) | | Administrative manager |
Franklin Templeton Distributors, Inc. (Distributors) | | Principal underwriter |
Franklin Templeton Investor Services, LLC (Investor Services) | | Transfer agent |
FRANKLIN TEMPLETON VARIABLE INSURANCE PRODUCTS TRUST
NOTES TO FINANCIAL STATEMENTS
Templeton Global Bond VIP Fund (continued)
3. Transactions With Affiliates (continued)
a. Management Fees
The Fund pays an investment management fee to Advisers based on the average daily net assets of the Fund as follows:
| | |
| Annualized Fee Rate | | Net Assets |
0.625% | | Up to and including $100 million |
0.500% | | Over $100 million, up to and including $250 million |
0.450% | | Over $250 million, up to and including $7.5 billion |
0.440% | | Over $7.5 billion, up to and including $10 billion |
0.430% | | Over $10 billion, up to and including $12.5 billion |
0.420% | | Over $12.5 billion, up to and including $15 billion |
0.400% | | In excess of $15 billion |
b. Administrative Fees
Under an agreement with Advisers, FT Services provides administrative services to the Fund. The fee is paid by Advisers based on the Fund’s average daily net assets, and is not an additional expense of the Fund.
c. Distribution Fees
The Board has adopted distribution plans for Class 2 and Class 4 shares pursuant to Rule 12b-1 under the 1940 Act. Under the Fund’s compensation distribution plans, the Fund pays Distributors for costs incurred in connection with the servicing, sale and distribution of the Fund’s shares up to 0.25% and 0.35% per year of its average daily net assets of Class 2 and Class 4, respectively. The plan year, for purposes of monitoring compliance with the maximum annual plan rates, is February 1 through January 31.
d. Transfer Agent Fees
Investor Services, under terms of an agreement, performs shareholder servicing for the Fund and is not paid by the Fund for the services.
e. Investments in Affiliated Management Investment Companies
The Fund invests in an affiliated management investment company for purposes other than exercising a controlling influence over the management or policies. Management fees paid by the Fund are waived on assets invested in the affiliated management investment company, as noted in the Statement of Operations, in an amount not to exceed the management and administrative fees paid directly or indirectly by each affiliate.
| | | | | | | | | | | | | | | | | | | | | | | | | | | | | | | | |
| | | Number
of Shares
Held at
Beginning
of Year | | | Gross
Additions | | | Gross
Reductions | | | Number
of Shares
Held at
End of
Year | | | Value at
End of
Year | | | Investment
Income | | | Realized
Gain
(Loss) | | | % of
Affiliated
Fund Shares
Outstanding
Held at End
of Year | |
| Non-Controlled Affiliates | | | | | | | | | | | | | | | | | | | | | | | | | | | | | | | | |
Institutional Fiduciary Trust Money Market Portfolio | | | — | | | | 508,326,667 | | | | (87,694,102 | ) | | | 420,632,565 | | | $ | 420,632,565 | | | $ | — | | | $ | — | | | | 2.15% | |
| | | | | | | | | | | | | | | | | | | | | | | | |
FRANKLIN TEMPLETON VARIABLE INSURANCE PRODUCTS TRUST
NOTES TO FINANCIAL STATEMENTS
Templeton Global Bond VIP Fund (continued)
4. Expense Offset Arrangement
The Fund has entered into an arrangement with its custodian whereby credits realized as a result of uninvested cash balances are used to reduce a portion of the Fund’s custodian expenses. During the year ended December 31, 2015, the custodian fees were reduced as noted in the Statement of Operations.
5. Income Taxes
The tax character of distributions paid during the years ended December 31, 2015 and 2014, was as follows:
| | | | | | | | |
| | | 2015 | | | 2014 | |
Distributions paid from: | | | | | | | | |
Ordinary income | | $ | 296,603,607 | | | $ | 177,889,592 | |
Long term capital gain | | | 14,767 | | | | — | |
| | | | |
| | $ | 296,618,374 | | | $ | 177,889,592 | |
| | | | |
At December 31, 2015, the cost of investments, net unrealized appreciation (depreciation) and undistributed long term capital gains for income tax purposes were as follows:
| | | | |
Cost of investments | | $ | 3,584,417,545 | |
| | | | |
Unrealized appreciation | | $ | 22,783,422 | |
Unrealized depreciation | | | (328,779,759 | ) |
| | | | |
Net unrealized appreciation (depreciation) | | $ | (305,996,337 | ) |
| | | | |
Distributable earnings – undistributed long term capital gains | | $ | 2,737,578 | |
| | | | |
Differences between income and/or capital gains as determined on a book basis and a tax basis are primarily due to differing treatments of foreign currency transactions and inflation related adjustments on foreign securities.
6. Investment Transactions
Purchases and sales of investments (excluding short term securities) for the year ended December 31, 2015, aggregated $1,156,376,637 and $1,062,944,774, respectively.
7. Credit Risk
At December 31, 2015, the Fund had 10.61% of its portfolio invested in high yield or other securities rated below investment grade. These securities may be more sensitive to economic conditions causing greater price volatility and are potentially subject to a greater risk of loss due to default than higher rated securities.
8. Concentration of Risk
Investing in foreign securities may include certain risks and considerations not typically associated with investing in U.S. securities, such as fluctuating currency values and changing local and regional economic, political and social conditions, which may result in greater market volatility. In addition, certain foreign securities may not be as liquid as U.S. securities.
FRANKLIN TEMPLETON VARIABLE INSURANCE PRODUCTS TRUST
NOTES TO FINANCIAL STATEMENTS
Templeton Global Bond VIP Fund (continued)
9. Other Derivative Information
At December 31, 2015, the Fund’s investments in derivative contracts are reflected in the Statement of Assets and Liabilities as follows:
| | | | | | | | | | | | |
| | | Asset Derivatives | | | Liability Derivatives | |
Derivative Contracts
Not Accounted for
as Hedging Instruments | | Statement of Assets and
Liabilities Location | | Fair Value | | | Statement of Assets and
Liabilities Location | | Fair Value | |
Interest rate contracts | | Variation margin | | $ | 3,360,827 | a | | Variation margin | | $ | 8,988,451 | a |
| | Unrealized appreciation on OTC swap contracts | | | — | | | Unrealized depreciation on OTC swap contracts | | | 9,699,015 | |
| | | | |
Foreign exchange contracts | | Unrealized appreciation on OTC forward exchange contracts | | | 49,581,222 | | | Unrealized depreciation on OTC forward exchange contracts | | | 27,857,622 | |
| | | | | | | | | | | | |
Totals | | | | $ | 52,942,049 | | | | | $ | 46,545,088 | |
| | | | | | | | | | | | |
aThis amount reflects the cumulative appreciation (depreciation) of centrally cleared swaps contracts as reported in the Statement of Investments. Only the variation margin receivable/payable at year end is separately reported within the Statement of Assets and Liabilities. Prior variation margin movements were recorded to cash upon receipt or payment.
For the year ended December 31, 2015, the effect of derivative contracts in the Fund’s Statement of Operations was as follows:
| | | | | | | | | | | | |
Derivative Contracts
Not Accounted for
as Hedging Instruments | | Statement of Operations
Locations | | Net Realized
Gain (Loss)
for the Year | | | Statement of Operations
Locations | | Net Change in
Unrealized
Appreciation
(Depreciation)
for the Year | |
| | Net realized gain (loss) from: | | | | | | Net change in unrealized appreciation (depreciation) on: | | | | |
Interest rate contracts | | Swap contracts | | $
| (8,296,986
| )
| | Swap contracts | | $ | 700,784 | |
Foreign exchange contracts | | Foreign currency transactions | | | 270,973,045 | a | | Translation of other assets and liabilities denominated in foreign currencies | | | (170,939,683 | )a |
| | | | | | | | | | | | |
Totals | | | | $ | 262,676,059 | | | | | $ | (170,238,899 | ) |
| | | | | | | | | | | | |
aForward exchange contracts are included in net realized gain (loss) from foreign currency transactions and net change in unrealized appreciation (depreciation) on translation of other assets and liabilities denominated in foreign currencies in the Statement of Operations.
At December 31, 2015, the Fund’s OTC derivative assets and liabilities are as follows:
| | | | | | | | |
| | | Gross and Net Amounts
of Assets and Liabilities
Presented in the
Statement of Assets and
Liabilities | |
| | | Assetsa | | | Liabilitiesa | |
| Derivatives | | | | | | | | |
Forward Exchange Contracts | | $ | 49,581,222 | | | $ | 27,857,622 | |
Swap Contracts | | | — | | | | 9,699,015 | |
| | | | |
Total | | $ | 49,581,222 | | | $ | 37,556,637 | |
| | | | |
aAbsent an event of default or early termination, OTC derivative assets and liabilities are presented gross and not offset in the Statement of Assets and Liabilities.
FRANKLIN TEMPLETON VARIABLE INSURANCE PRODUCTS TRUST
NOTES TO FINANCIAL STATEMENTS
Templeton Global Bond VIP Fund (continued)
At December 31, 2015, the Fund’s OTC derivative assets, which may be offset against the Fund’s OTC derivative liabilities and collateral received from the counterparty, are as follows:
| | | | | | | | | | | | | | | | | | | | |
| | | | | | Amounts Not Offset in the Statement of
Assets and Liabilities | | | | |
| | | Gross and Net
Amounts of Assets
Presented in the
Statement of
Assets and Liabilities | | | Financial
Instruments
Available for Offset | | | Financial
Instruments
Collateral
Receiveda | | | Cash Collateral
Received | | | Net Amount (Not
less than zero) | |
| Counterparty | | | | | | | | | | | | | | | | | | | | |
BOFA | | $ | 2,031,383 | | | $ | (203,795 | ) | | $ | (1,007,751 | ) | | $ | — | | | $ | 819,837 | |
BZWS | | | 9,496,840 | | | | (1,031,934 | ) | | | — | | | | (7,410,000 | ) | | | 1,054,906 | |
CITI | | | 3,125,391 | | | | (3,125,391 | ) | | | — | | | | — | | | | — | |
DBAB | | | 10,725,090 | | | | (8,222,300 | ) | | | — | | | | (1,210,000 | ) | | | 1,292,790 | |
GSCO | | | 2,231,117 | | | | (2,231,117 | ) | | | — | | | | — | | | | — | |
HSBC | | | 4,650,545 | | | | (4,444,031 | ) | | | (92,097 | ) | | | — | | | | 114,417 | |
JPHQ | | | 13,672,368 | | | | (11,808,149 | ) | | | (471,929 | ) | | | (16,257 | ) | | | 1,376,033 | |
MSCO | | | 394,851 | | | | (394,851 | ) | | | — | | | | — | | | | — | |
SCNY | | | 3,253,637 | | | | (384,023 | ) | | | — | | | | (2,410,000 | ) | | | 459,614 | |
UBSW | | | — | | | | — | | | | — | | | | — | | | | — | |
| | | | |
Total | | $ | 49,581,222 | | | $ | (31,845,591 | ) | | $ | (1,571,777 | ) | | $ | (11,046,257 | ) | | $ | 5,117,597 | |
| | | | |
At December 31, 2015, the Fund’s OTC derivative liabilities, which may be offset against the Fund’s OTC derivative assets and collateral pledged to the counterparty, are as follows:
| | | | | | | | | | | | | | | | | | | | |
| | | | | | Amounts Not Offset in the Statement of
Assets and Liabilities | | | | |
| | | Gross and Net
Amounts of Liabilities
Presented in the
Statement of
Assets and Liabilities | | | Financial
Instruments
Available for Offset | | | Financial
Instruments
Collateral
Pledged | | | Cash Collateral
Pledgedb | | | Net Amount (Not
less than zero) | |
| Counterparty | | | | | | | | | | | | | | | | | | | | |
BOFA | | $ | 203,795 | | | $ | (203,795 | ) | | $ | — | | | $ | — | | | $ | — | |
BZWS | | | 1,031,934 | | | | (1,031,934 | ) | | | — | | | | — | | | | — | |
CITI | | | 6,728,275 | | | | (3,125,391 | ) | | | — | | | | (3,602,884 | ) | | | — | |
DBAB | | | 8,222,300 | | | | (8,222,300 | ) | | | — | | | | — | | | | — | |
GSCO | | | 4,220,761 | | | | (2,231,117 | ) | | | — | | | | (1,989,644 | ) | | | — | |
HSBC | | | 4,444,031 | | | | (4,444,031 | ) | | | — | | | | — | | | | — | |
JPHQ | | | 11,808,149 | | | | (11,808,149 | ) | | | — | | | | — | | | | — | |
MSCO | | | 448,565 | | | | (394,851 | ) | | | — | | | | (53,714 | ) | | | — | |
SCNY | | | 384,023 | | | | (384,023 | ) | | | — | | | | — | | | | — | |
UBSW | | | 64,804 | | | | — | | | | — | | | | — | | | | 64,804 | |
| | | | |
Total | | $ | 37,556,637 | | | $ | (31,845,591 | ) | | $ | — | | | $ | (5,646,242 | ) | | $ | 64,804 | |
| | | | |
aAt December 31, 2015, the Fund received United Kingdom Bonds and Notes, U.S. Government and Agency Securities and U.S. Treasury Bonds and Notes as collateral for derivatives.
bIn some instances, the collateral amounts disclosed in the table above were adjusted due to the requirement to limit collateral amounts to avoid the effect of overcollateralization. Actual collateral received and/or pledged may be more than the amounts disclosed herein.
For the year ended December 31, 2015, the average month end fair value of derivatives represented 6.36% of average month end net assets. The average month end number of open derivative contracts for the year was 491.
FRANKLIN TEMPLETON VARIABLE INSURANCE PRODUCTS TRUST
NOTES TO FINANCIAL STATEMENTS
Templeton Global Bond VIP Fund (continued)
9. Other Derivative Information (continued)
See Note 1(d) regarding derivative financial instruments.
See Abbreviations on page TGB-37
10. Credit Facility
The Fund, together with other U.S. registered and foreign investment funds (collectively, Borrowers), managed by Franklin Templeton Investments, are borrowers in a joint syndicated senior unsecured credit facility totaling $2 billion (Global Credit Facility) which matured on February 12, 2016. This Global Credit Facility provides a source of funds to the Borrowers for temporary and emergency purposes, including the ability to meet future unanticipated or unusually large redemption requests. Effective February 12, 2016, the Borrowers renewed the Global Credit Facility for a one year term, maturing February 10, 2017, for a total of $2 billion.
Under the terms of the Global Credit Facility, the Fund shall, in addition to interest charged on any borrowings made by the Fund and other costs incurred by the Fund, pay its share of fees and expenses incurred in connection with the implementation and maintenance of the Global Credit Facility, based upon its relative share of the aggregate net assets of all of the Borrowers, including an annual commitment fee of 0.07% based upon the unused portion of the Global Credit Facility. Effective February 12, 2016, the annual commitment fee is 0.15%. These fees are reflected in other expenses in the Statement of Operations. During the year ended December 31, 2015, the Fund did not use the Global Credit Facility.
11. Fair Value Measurements
The Fund follows a fair value hierarchy that distinguishes between market data obtained from independent sources (observable inputs) and the Fund’s own market assumptions (unobservable inputs). These inputs are used in determining the value of the Fund’s financial instruments and are summarized in the following fair value hierarchy:
| | • | | Level 1 – quoted prices in active markets for identical financial instruments |
| | • | | Level 2 – other significant observable inputs (including quoted prices for similar financial instruments, interest rates, prepayment speed, credit risk, etc.) |
| | • | | Level 3 – significant unobservable inputs (including the Fund’s own assumptions in determining the fair value of financial instruments) |
The input levels are not necessarily an indication of the risk or liquidity associated with financial instruments at that level.
For movements between the levels within the fair value hierarchy, the Fund has adopted a policy of recognizing the transfers as of the date of the underlying event which caused the movement.
A summary of inputs used as of December 31, 2015, in valuing the Fund’s assets and liabilities carried at fair value, is as follows:
| | | | | | | | | | | | | | | | |
| | | Level 1 | | | Level 2 | | | Level 3 | | | Total | |
| Assets: | | | | | | | | | | | | | | | | |
Investments in Securities: | | | | | | | | | | | | | | | | |
Foreign Government and Agency Securitiesa | | $ | — | | | $ | 2,021,572,699 | | | $ | — | | | $ | 2,021,572,699 | |
Quasi-Sovereign and Corporate Bondsa | | | — | | | | 2,423,496 | | | | — | | | | 2,423,496 | |
Short Term Investments | | | 420,632,565 | | | | 833,792,448 | | | | — | | | | 1,254,425,013 | |
| | | | |
Total Investments in Securities | | $ | 420,632,565 | | | $ | 2,857,788,643 | | | $ | — | | | $ | 3,278,421,208 | |
| | | | |
Other Financial Instruments | | | | | | | | | | | | | | | | |
Forward Exchange Contracts | | $ | — | | | $ | 49,581,222 | | | $ | — | | | $ | 49,581,222 | |
Swap Contracts | | | — | | | | 3,360,827 | | | | — | | | | 3,360,827 | |
| | | | |
Total Other Financial Instruments | | $ | — | | | $ | 52,942,049 | | | $ | — | | | $ | 52,942,049 | |
| | | | |
FRANKLIN TEMPLETON VARIABLE INSURANCE PRODUCTS TRUST
NOTES TO FINANCIAL STATEMENTS
Templeton Global Bond VIP Fund (continued)
| | | | | | | | | | | | | | | | |
| | | Level 1 | | | Level 2 | | | Level 3 | | | Total | |
| Liabilities: | | | | | | | | | | | | | | | | |
Other Financial Instruments | | | | | | | | | | | | | | | | |
Forward Exchange Contracts | | $ | — | | | $ | 27,857,622 | | | $ | — | | | $ | 27,857,622 | |
Swap Contracts | | | — | | | | 18,687,466 | | | | — | | | | 18,687,466 | |
| | | | |
Total Other Financial Instruments | | $ | — | | | $ | 46,545,088 | | | $ | — | | | $ | 46,545,088 | |
| | | | |
aFor detailed categories, see accompanying Statement of Investments.
12. Subsequent Events
The Fund has evaluated subsequent events through the issuance of the financial statements and determined that no events have occurred that require disclosure other than those already disclosed in the financial statements.
Abbreviations
| | | | | | | | | | |
| Counterparty/Exchange | | | | Currency | | Selected Portfolio |
| | | | | |
| BOFA | | Bank of America Corp. | | BRL | | Brazilian Real | | FHLB | | Federal Home Loan Bank |
| | | | | |
| BZWS | | Barclays Bank PLC | | EUR | | Euro | | FRN | | Floating Rate Note |
| | | | | |
| CITI | | Citigroup, Inc. | | HUF | | Hungarian Forint | | GDP | | Gross Domestic Product |
| | | | | |
| CME | | Chicago Mercantile Exchange | | IDR | | Indonesian Rupiah | | | | |
| | | | | |
| DBAB | | Deutsche Bank AG | | INR | | Indian Rupee | | | | |
| | | | | |
| GSCO | | Goldman Sachs Group, Inc. | | JPY | | Japanese Yen | | | | |
| | | | | |
| HSBK | | HSBC Bank USA N.A. | | KRW | | South Korean Won | | | | |
| | | | | |
| JPHQ | | JPMorgan Chase & Co. | | LKR | | Sri Lankan Rupee | | | | |
| | | | | |
| LCH | | London Clearing House | | MXN | | Mexican Peso | | | | |
| | | | | |
| MSCO | | Morgan Stanley | | MYR | | Malaysian Ringgit | | | | |
| | | | | |
| SCNY | | Standard Chartered Bank | | PEN | | Peruvian Nuevo Sol | | | | |
| | | | | |
| UBSW | | UBS AG | | PHP | | Philippine Peso | | | | |
| | | | | |
| | | | PLN | | Polish Zloty | | | | |
| | | | | |
| | | | SGD | | Singapore Dollar | | | | |
FRANKLIN TEMPLETON VARIABLE INSURANCE PRODUCTS TRUST
Report of Independent Registered Public Accounting Firm
Templeton Global Bond VIP Fund
To the Board of Trustees and Shareholders of Franklin Templeton Variable Insurance Products Trust
In our opinion, the accompanying statement of assets and liabilities, including the statement of investments, and the related statements of operations and of changes in net assets and the financial highlights present fairly, in all material respects, the financial position of Templeton Global Bond VIP Fund (the “Fund”) at December 31, 2015, the results of its operations for the year then ended, the changes in its net assets for each of the two years in the period then ended and the financial highlights for each of the periods presented, in conformity with accounting principles generally accepted in the United States of America. These financial statements and financial highlights (hereafter referred to as “financial statements”) are the responsibility of the Fund’s management. Our responsibility is to express an opinion on these financial statements based on our audit. We conducted our audit of these financial statements in accordance with the standards of the Public Company Accounting Oversight Board (United States). Those standards require that we plan and perform the audit to obtain reasonable assurance about whether the financial statements are free of material misstatement. An audit includes examining, on a test basis, evidence supporting the amounts and disclosures in the financial statements, assessing the accounting principles used and significant estimates made by management, and evaluating the overall financial statement presentation. We believe that our audit, which included confirmation of securities at December 31, 2015 by correspondence with the custodian, transfer agent and brokers, provides a reasonable basis for our opinion.
PricewaterhouseCoopers LLP
San Francisco, California
February 16, 2016
FRANKLIN TEMPLETON VARIABLE INSURANCE PRODUCTS TRUST
Tax Information (unaudited)
Templeton Global Bond VIP Fund
Under Section 852(b)(3)(C) of the Internal Revenue Code, the Fund hereby reports the maximum amount allowable but no less than $14,767 as long term capital gain dividends for the fiscal year ended December 31, 2015.
Templeton Growth VIP Fund
This annual report for Templeton Growth VIP Fund covers the fiscal year ended December 31, 2015.
Class 4 Performance Summary as of December 31, 2015
Average annual total return of Class 4 shares* represents the average annual change in value, assuming reinvestment of dividends and capital gains. Average returns smooth out variations in returns, which can be significant; they are not the same as year-by-year results.
| | | | | | | | | | | | |
| Periods ended 12/31/15 | | 1-Year | | | 5-Year | | | 10-Year | |
Average Annual Total Return | | �� | -6.54% | | | | +5.91% | | | | +3.07% | |
*For the period beginning 2/29/08, Class 4 performance reflects a 12b-1 fee expense of 0.35% per year, which affects future performance. Class 4 performance prior to 2/29/08 reflects historical Class 1 performance, which does not have a 12b-1 fee expense. Since 2/29/08 (effective date), the average annual total return of Class 4 shares was +2.38%. The Fund has a fee waiver associated with any investment in a Franklin Templeton money fund, contractually guaranteed through at least its current fiscal year-end. Fund investment results reflect the fee waiver, to the extent applicable; without this reduction, the results would have been lower.
Performance reflects the Fund’s Class 4 operating expenses, but does not include any contract fees, expenses or sales charges. If they had been included, performance would be lower. These charges and deductions, particularly for variable life policies, can have a significant effect on contract values and insurance benefits. See the contract prospectus for a complete description of these expenses, including sales charges.
Performance data represent past performance, which does not guarantee future results. Investment return and principal value will fluctuate, and you may have a gain or loss when you sell your shares. Current performance may differ from figures shown.
Total Return Index Comparison for a Hypothetical $10,000 Investment (1/1/06–12/31/15)
The graph below shows the change in value of a hypothetical $10,000 investment in the Fund over the indicated period and includes reinvestment of any income or distributions. The Fund’s performance* is compared to the performance of the MSCI World Index and the MSCI All Country World Index (ACWI). One cannot invest directly in an index, and an index is not representative of the Fund’s portfolio. Please see Important Notes to Performance Information preceding the Fund Summaries.
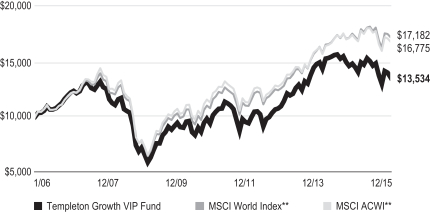
**Source: Morningstar. Please see Index Descriptions following the Fund Summaries.
TEMPLETON GROWTH VIP FUND
Fund Goal and Main Investments
The Fund seeks long-term capital growth. Under normal market conditions, the Fund invests predominantly in equity securities of companies located anywhere in the world, including emerging markets.
Fund Risks
All investments involve risks, including possible loss of principal. Special risks are associated with foreign investing, including currency fluctuations, economic instability and political developments; investments in emerging markets involve heightened risks related to the same factors. In addition, smaller and midsized-company stocks have historically experienced more price volatility than larger company stocks, especially over the short term. Value securities may not increase in price as anticipated or may decline further in value. To the extent the Fund focuses on particular countries, regions, industries, sectors or types of investments from time to time, it may be subject to greater risks of adverse developments in such areas of focus than a fund that invests in a wider variety of countries, regions, industries, sectors or investments. The Fund is actively managed but there is no guarantee that the manager’s investment decisions will produce the desired results. The Fund’s prospectus also includes a description of the main investment risks.
Performance Overview
You can find the Fund’s one-year total return in the Performance Summary. For comparison, the Fund’s benchmarks, the MSCI ACWI returned -1.84%, and the MSCI World Index returned -0.32% for the period under review.1
Economic and Market Overview
The global economy expanded moderately during the 12 months under review. As measured by the MSCI World Index, stocks in global developed markets overall were nearly unchanged for the year amid some positive developments. Weighing on global stocks at times were worries about China’s slowing economy and tumbling stock market, declining commodity prices, geopolitical tensions between Russia and Turkey, and ongoing uncertainty over the U.S. Federal Reserve’s (Fed’s) timing for raising interest rates. Toward period-end, equity markets recovered somewhat as the Fed increased its federal funds target range for the first time in nine years, alleviating some uncertainty about a change in the U.S.
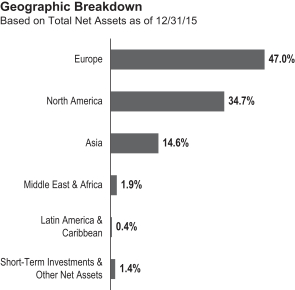
monetary policy. During the year, oil prices declined sharply largely due to increased global supply that exceeded demand. Gold and other commodity prices also fell. The U.S. dollar appreciated against most currencies during the period, which reduced returns of many foreign assets in U.S. dollar terms.
U.S. economic growth slowed in 2015’s first quarter but strengthened in 2015’s second quarter amid healthy consumer spending. The third and fourth quarters were less robust as exports slowed and state and local governments reduced their spending. At its December meeting, the Fed increased its target range for the federal funds rate to 0.25%–0.50%, as policymakers cited the labor market’s considerable improvement and were reasonably confident that inflation would move back to the Fed’s 2% medium-term objective. Furthermore, the Fed raised its forecast for 2016 U.S. economic growth and lowered its unemployment projections.
In Europe, U.K. economic growth gained momentum from the services sector, but the economy slowed in 2015 compared with 2014. The eurozone grew moderately and generally benefited during the period from lower oil prices, a weaker euro that supported exports, the European Central Bank’s (ECB’s) accommodative policy and expectations of further ECB stimulus. Although the eurozone’s annual inflation rate declined early in the period, it rose slightly during the rest of the period. The ECB maintained its benchmark interest rates although it reduced its bank deposit rate in December, seeking to boost the region’s slowing growth.
1. Source: Morningstar.
One cannot invest directly in an index, and an index is not representative of the Fund’s portfolio. Please see Index Descriptions following the Fund Summaries.
TEMPLETON GROWTH VIP FUND
Japan’s economy continued to grow in 2015’s first quarter. After a decline in the second quarter of 2015, it expanded in the third quarter as capital expenditures improved. The Bank of Japan took several actions during the reporting period, including maintaining its monetary policy, lowering its economic growth and inflation forecasts, and reorganizing its stimulus program to increase exposure to long-term government bonds and exchange-traded funds.
In emerging markets, economic growth generally moderated. In China, the government’s intervention to cool domestic stock market speculation and its effective currency devaluation led to a severe slump in emerging market stocks from June through August. In October, emerging market equities gained after China expanded its monetary and fiscal stimulus to support its economy. Emerging equity markets recovered some of their losses after the Fed increased its target interest rate in December. Central bank actions varied across emerging markets during the 12 months under review, as some banks raised interest rates in response to rising inflation and weakening currencies, while others lowered interest rates to promote economic growth. In the recent global environment, emerging market stocks overall, as measured by the MSCI Emerging Markets Index, fell for the 12-month period.2
Investment Strategy
Our investment philosophy is bottom up, value oriented and long term. In choosing investments, we will focus on the market price of a company’s securities relative to our evaluation of the company’s potential long-term earnings, asset value and cash flow. Among factors we may consider are a company’s historical value measures, including price/earnings ratio, profit margins and liquidation value. We do in-depth research to construct a bargain list from which we buy.
Manager’s Discussion
During the tumultuous past year, global stocks hit record highs before succumbing in the third quarter to fears about Fed tightening, emerging market instability and commodity weakness. Stocks staged a patchy and partial recovery throughout the final months of 2015, but ultimately ended the year modestly down, with a narrow group of high growth, high-quality, low risk issues outperforming value-priced and economically cyclical stocks.
Stock selection in the industrials sector notably detracted from performance relative to the MSCI ACWI, pressured by
| | | | |
| Top 10 Holdings | | | |
| 12/31/15 | | | |
Company
Sector/Industry, Country | | % of Total
Net Assets | |
Samsung Electronics Co. Ltd.
Technology Hardware, Storage & Peripherals, South Korea | | | 3.6% | |
Citigroup Inc.
Banks, U.S. | | | 2.6% | |
Microsoft Corp.
Software, U.S. | | | 2.4% | |
Amgen Inc.
Biotechnology, U.S. | | | 2.2% | |
Allergan PLC
Pharmaceuticals, U.S. | | | 2.0% | |
JPMorgan Chase & Co.
Banks, U.S. | | | 2.0% | |
American International Group Inc.
Insurance, U.S. | | | 2.0% | |
Total SA, B
Oil, Gas & Consumable Fuels, France | | | 1.9% | |
Deutsche Lufthansa AG
Airlines, Germany | | | 1.9% | |
Teva Pharmaceutical Industries Ltd., ADR
Pharmaceuticals, Israel | | | 1.9% | |
The dollar value, number of shares or principal amount, and names of all portfolio holdings are listed in the Fund’s Statement of Investments (SOI).
off-benchmark U.S. truck-maker Navistar International.3 Shares declined after a failed engine strategy and poor international results led to a string of earnings disappointments. The firm is under new management with a chief executive officer (CEO) who we believe is aggressively rebuilding the brand and helping Navistar gain market share in the profitable medium-duty truck segment. A prominent activist investor has also become the firm’s largest shareholder and is advocating further restructuring. More broadly, we have not found an abundance of what we consider value in the diverse industrials sector given significant overcapacity and still anemic global growth trends. However, in our analysis, select opportunities existed among companies that have benefited from restructuring in the aftermath of the global financial crisis, and whose share prices failed to properly discount an eventual cyclical recovery.
Stock selection in telecommunication services also detracted, pressured by Turkish mobile company Turkcell Iletisim Hizmetleri and Spanish mobile operator Telefonica.4 The former declined amid an ongoing shareholder dispute, a
2. Please see Index Descriptions following the Fund Summaries.
3. The industrials sector comprises aerospace and defense, air freight and logistics, airlines, commercial services and supplies, construction and engineering, industrial conglomerates and machinery in the SOI.
4. The telecommunication services sector comprises diversified telecommunication services and wireless telecommunication services in the SOI.
TEMPLETON GROWTH VIP FUND
flagging Turkish lira and heightened geopolitical tensions in the region. However, in our analysis, valuations and dividends at Turkcell remained attractive and the firm is well positioned in a secular growth market, representing an interesting long-term opportunity. Shares of Telefonica fell primarily due to continued concerns about the company’s Latin American exposure. Although the firm’s CEO admitted that Brazil’s longest recession since the 1930s has created considerable headwinds, he also confirmed solid operational progress and an improving market position in the important region. Telefonica has taken major steps to streamline and focus its operations where it has the best growth opportunities, exiting ancillary European markets and using cash to reduce debt and improve its market position in Brazil, Spain and Germany. With Spain exiting recession and the commercial environment in Brazil likely to improve over our investment horizon, we believed Telefonica appeared well positioned for the long term.
Stock selection in energy helped relative returns, though our overweighted allocation to the weak sector resulted in energy detracting overall from relative performance.5 Although the timing for recovery in the broader energy sector remained uncertain, at year-end oil traded near the cash cost of production, a very depressed level realized only a few times in the past 25 years. In our opinion, these types of prices should continue to accelerate the supply adjustment, ultimately restoring balance at a level that encourages continued investment in the production necessary to meet global demand over the long term. U.S. oil and gas producer Chesapeake Energy was a major laggard, declining as the rout in hydrocarbon prices continued. Although we believed the stock would likely remain depressed in an environment of low oil and gas prices, we were pleased to see Chesapeake making progress in the things that it can control, including lowering costs, increasing drilling efficiencies and selling assets to shore up its balance sheet. In our analysis, the company’s stock is cheap with the potential to appreciate over a long-term horizon once the cycle turns.
Stock selection and underweightings in consumer staples and consumer discretionary also detracted during the year in review.6 From the former sector, U.K. grocer Tesco declined following difficult holiday trading. However, with sentiment at an all-time low, valuation extremely depressed and progress evident under new management in the form of steadily
improving transactions and volume, Tesco appeared to us positioned for a recovery. From the latter sector, U.S. fashion retailer Michael Kors Holdings fell after posting a sales decline in its primary North American market and issuing a disappointing forecast. Although the company generated positive cash flows, with a strong balance sheet and shareholder-friendly buyback policy, growth has been moderating following a phenomenal expansion, and the consequent uncertainty has created potential opportunities for price-sensitive buyers, in our view.
Turning to contributors, stock selection and an overweighted position in health care contributed to relative performance, led by off-benchmark Israeli generic drug maker Teva Pharmaceutical Industries and U.S.-based specialty pharmaceuticals firm Allergan.7 The main catalyst for the outperformance of both stocks was a third-quarter deal in which Teva agreed to buy Allergan’s generic drug business to create one of the world’s largest pharmaceuticals companies. We believed the transaction was mutually beneficial, giving Teva market-leading scale and cost-reduction opportunities in a highly competitive market, and providing Allergan the ability to reduce debt and focus on its core portfolio of lucrative brand-name drugs following a spree of major acquisitions. More broadly in health care, major pharmaceuticals firms have been rallying and the industry has been trading at a slight premium to the broader market. Biotechnology stocks have also become more expensive, though we continued to find select opportunities among firms where we believe growth and innovation were still being underestimated.
Stock selection in materials also contributed.8 Irish building materials firm CRH delivered strong gains as firmer demand in key markets like the U.S. and Europe improved the company’s earnings outlook. We believe restructuring and cost-saving initiatives have been well executed thus far, and CRH stands to benefit from the acquisition of assets divested as a regulatory requirement of a merger between competitors. Within the materials sector more broadly, we continued to find what we considered only selective values. In general, construction materials firms are highly sensitive to wider economic trends, and we believe valuations have begun to reflect expected earnings improvements as major western property markets recover. Elsewhere, chemicals stocks looked generally expensive to us with margins near cyclical peaks and new capacity negatively impacting industry pricing. The mining industry also suffered
5. The energy sector comprises energy equipment and services; and oil, gas and consumable fuels in the SOI.
6. The consumer staples sector comprises food and staples retailing in the SOI. The consumer discretionary sector comprises auto components; automobiles; media; specialty retail; and textiles, apparel and luxury goods in the SOI.
7. The health care sector comprises biotechnology, health care equipment and supplies, life sciences tools and services, and pharmaceuticals in the SOI.
8. The materials sector comprises chemicals, construction materials, and metals and mining in the SOI.
TEMPLETON GROWTH VIP FUND
from significant excess capacity following an unprecedented investment boom in China. Although the sector began to look attractively valued to us following extreme weakness, bottom-up bargains remained highly selective, in our analysis.
Although our overweighting in financials detracted, stock selection benefited and led to overall contribution for the sector.9 European insurers Axa and Swiss Re and U.S. insurer American International Group were major contributors. Following a relatively benign year for natural weather events, corporate profits in the sector have strengthened, supporting insurance stocks. Long-term opportunities appeared attractive to us in the financials sector, where low-valued firms have restructured, cut costs and provisions and should benefit from a turn in the business or interest-rate cycle and any potential easing of financial crisis-era regulations.
From a regional standpoint, Asian holdings detracted, pressured by an underweighting and stock selection in a strong Japanese market as well as stock selection and an overweighting in South Korea. Stock selection and an underweighting in the solid U.S. market as well as stock selection and an overweighting in Europe also detracted.
It is also important to recognize the effect of currency movements on the Fund’s performance. In general, if the value of the U.S. dollar goes up compared with a foreign currency, an investment traded in that foreign currency will go down in value because it will be worth fewer U.S. dollars. This can have a negative effect on Fund performance. Conversely, when the U.S. dollar weakens in relation to a foreign currency, an investment traded in that foreign currency will increase in value, which can contribute to Fund performance. For the year ended December 31, 2015, the U.S. dollar rose in value relative to most currencies. As a result, the Fund’s performance was negatively affected by the portfolio’s substantial investment in securities with non-U.S. currency exposure.
A critical insight we have gleaned through six decades of investing in global equity markets is that returns seem to accrue to value intermittently. Our style of investing has historically provided positive performance over a long-term investment horizon. But, it has rarely been a steady appreciation. At Templeton, we buy on pessimism, and the market can remain at odds with our portfolios for a considerable stretch. However, empirical evidence has shown that when the value cycle turns, it does so swiftly and abruptly. We believe being properly positioned for these turns is essential to capturing the long-term benefits of the value investment discipline. We have been witnessing historical extremes in the discount afforded to value relative to growth, quality and safety. Although this environment has been, and may remain, painful for some time, we believe the eventual normalization of these extremes represents the most compelling opportunity in equity markets today, and we have sought to position our portfolio accordingly.
Thank you for your participation in Templeton Growth VIP Fund. We look forward to serving your future investment needs.
The foregoing information reflects our analysis, opinions and portfolio holdings as of December 31, 2015, the end of the reporting period. The way we implement our main investment strategies and the resulting portfolio holdings may change depending on factors such as market and economic conditions. These opinions may not be relied upon as investment advice or an offer for a particular security. The information is not a complete analysis of every aspect of any market, country, industry, security or the Fund. Statements of fact are from sources considered reliable, but the investment manager makes no representation or warranty as to their completeness or accuracy. Although historical performance is no guarantee of future results, these insights may help you understand our investment management philosophy.
9. The financials sector comprises banks, capital markets, consumer finance and insurance in the SOI.
TEMPLETON GROWTH VIP FUND
Class 4 Fund Expenses
As an investor in a variable insurance contract (Contract) that indirectly provides for investment in an underlying mutual fund, you can incur transaction and/or ongoing expenses at both the Fund level and the Contract level.
| • | | Transaction expenses can include sales charges (loads) on purchases, redemption fees, surrender fees, transfer fees and premium taxes. |
| • | | Ongoing expenses can include management fees, distribution and service (12b-1) fees, contract fees, annual maintenance fees, mortality and expense risk fees and other fees and expenses. All mutual funds and Contracts have some types of ongoing expenses. |
The expenses shown in the table are meant to highlight ongoing expenses at the Fund level only and do not include ongoing expenses at the Contract level, or transaction expenses at either the Fund or Contract level. While the Fund does not have transaction expenses, if the transaction and ongoing expenses at the Contract level were included, the expenses shown below would be higher. You should consult your Contract prospectus or disclosure document for more information.
The table shows Fund-level ongoing expenses and can help you understand these expenses and compare them with those of other mutual funds offered through the Contract. The table assumes a $1,000 investment held for the six months indicated. Please refer to the Fund prospectus for additional information on operating expenses.
Actual Fund Expenses
The first line (Actual) of the table provides actual account values and expenses. The “Ending Account Value” is derived from the Fund’s actual return, which includes the effect of ongoing Fund expenses, but does not include the effect of ongoing Contract expenses.
You can estimate the Fund-level expenses you incurred during the period by following these steps. Of course, your account value and expenses will differ from those in this illustration:
| 1. | Divide your account value by $1,000. |
If an account had an $8,600 value, then $8,600 ÷ $1,000 = 8.6.
| 2. | Multiply the result by the number under the heading “Fund-Level Expenses Incurred During Period.” |
If Fund-Level Expenses Incurred During Period were $7.50, then 8.6 × $7.50 = $64.50.
In this illustration, the estimated expenses incurred this period at the Fund level are $64.50.
Hypothetical Example for Comparison with Other Mutual Funds
Information in the second line (Hypothetical) of the table can help you compare ongoing expenses of the Fund with those of other mutual funds offered through the Contract. This information may not be used to estimate the actual ending account balance or expenses you incurred during the period. The hypothetical “Ending Account Value” is based on the Fund’s actual expense ratio and an assumed 5% annual rate of return before expenses, which does not represent the Fund’s actual return. The figure under the heading “Fund-Level Expenses Incurred During Period” shows the hypothetical expenses your account would have incurred under this scenario. You can compare this figure with the 5% hypothetical examples that appear in shareholder reports of other funds offered through a Contract.
| | | | | | | | | | | | |
| Class 4 | | Beginning Account Value 7/1/15 | | | Ending Account Value 12/31/15 | | | Fund-Level Expenses
Incurred During Period* 7/1/15–12/31/15 | |
Actual | | | $1,000 | | | | $ 925.00 | | | | $5.63 | |
Hypothetical (5% return before expenses) | | | $1,000 | | | | $1,019.36 | | | | $5.90 | |
*Expenses are calculated using the most recent six-month annualized expense ratio, net of expense waivers, for the Fund’s Class 4 shares (1.16%), which does not include any ongoing expenses of the Contract for which the Fund is an investment option, multiplied by the average account value over the period, multiplied by 184/365 to reflect the one-half year period.
FRANKLIN TEMPLETON VARIABLE INSURANCE PRODUCTS TRUST
Financial Highlights
Templeton Growth VIP Fund
| | | | | | | | | | | | | | | | | | | | |
| | | Year Ended December 31, | |
| | | 2015 | | | 2014 | | | 2013 | | | 2012 | | | 2011 | |
| Class 1 | | | | | | | | | | | | | | | | | | | | |
Per share operating performance
(for a share outstanding throughout the year) | | | | | | | | | | | | | | | | | | | | |
| | | | | |
Net asset value, beginning of year | | | $14.85 | | | | $15.47 | | | | $12.16 | | | | $10.27 | | | | $11.19 | |
| | | | |
| | | | | |
| Income from investment operationsa: | | | | | | | | | | | | | | | | | | | | |
| | | | | |
Net investment incomeb | | | 0.28 | | | | 0.38 | c | | | 0.22 | | | | 0.27 | | | | 0.25 | |
| | | | | |
Net realized and unrealized gains (losses) | | | (1.17 | ) | | | (0.75 | ) | | | 3.49 | | | | 1.88 | | | | (0.99 | ) |
| | | | |
Total from investment operations | | | (0.89 | ) | | | (0.37 | ) | | | 3.71 | | | | 2.15 | | | | (0.74 | ) |
| | | | |
Less distributions from net investment income | | | (0.42 | ) | | | (0.25 | ) | | | (0.40 | ) | | | (0.26 | ) | | | (0.18 | ) |
| | | | |
Net asset value, end of year | | | $13.54 | | | | $14.85 | | | | $15.47 | | | | $12.16 | | | | $10.27 | |
| | | | |
| | | | | |
Total returnd | | | (6.24)% | | | | (2.53)% | | | | 31.05% | | | | 21.40% | | | | (6.80)% | |
| | | | | |
| Ratios to average net assets | | | | | | | | | | | | | | | | | | | | |
| | | | | |
Expenses | | | 0.80% | e | | | 0.78% | | | | 0.78% | f | | | 0.78% | f | | | 0.78% | f |
| | | | | |
Net investment income | | | 1.96% | | | | 2.46% | c | | | 1.62% | | | | 2.31% | | | | 2.22% | |
| | | | | |
| Supplemental data | | | | | | | | | | | | | | | | | | | | |
| | | | | |
Net assets, end of year (000’s) | | | $468,548 | | | | $572,860 | | | | $588,409 | | | | $476,954 | | | | $1,200,682 | |
| | | | | |
Portfolio turnover rate | | | 20.92% | | | | 17.46% | | | | 11.60% | | | | 18.73% | g | | | 42.13% | g |
aThe amount shown for a share outstanding throughout the period may not correlate with the Statement of Operations for the period due to the timing of sales and repurchases of the Fund’s shares in relation to income earned and/or fluctuating fair value of the investments of the Fund.
bBased on average daily shares outstanding.
cNet investment income per share includes approximately $0.09 per share related to income received in form of special dividends in connection with certain Fund holdings. Excluding this amount, the ratio of net investment income to average net assets would have been 1.88%.
dTotal return does not include fees, charges or expenses imposed by the variable annuity and life insurance contracts for which Franklin Templeton Variable Insurance Products Trust serves as an underlying investment vehicle.
eBenefit of waiver and payments by affiliates rounds to less than 0.01%.
fBenefit of expense reduction rounds to less than 0.01%.
gExcludes the value of portfolio securities delivered as a result of redemption in-kind.
| | | | | | |
| | | The accompanying notes are an integral part of these financial statements. | Annual Report | | | TG-7 | |
FRANKLIN TEMPLETON VARIABLE INSURANCE PRODUCTS TRUST
FINANCIAL HIGHLIGHTS
Templeton Growth VIP Fund (continued)
| | | | | | | | | | | | | | | | | | | | |
| | | Year Ended December 31, | |
| | | 2015 | | | 2014 | | | 2013 | | | 2012 | | | 2011 | |
| Class 2 | | | | | | | | | | | | | | | | | | | | |
Per share operating performance
(for a share outstanding throughout the year) | | | | | | | | | | | | | | | | | | | | |
| | | | | |
Net asset value, beginning of year | | | $14.61 | | | | $15.23 | | | | $11.97 | | | | $10.11 | | | | $11.01 | |
| | | | |
| | | | | |
| Income from investment operationsa: | | | | | | | | | | | | | | | | | | | | |
| | | | | |
Net investment incomeb | | | 0.25 | | | | 0.34 | c | | | 0.19 | | | | 0.21 | | | | 0.21 | |
| | | | | |
Net realized and unrealized gains (losses) | | | (1.16 | ) | | | (0.75 | ) | | | 3.44 | | | | 1.88 | | | | (0.96 | ) |
| | | | |
Total from investment operations | | | (0.91 | ) | | | (0.41 | ) | | | 3.63 | | | | 2.09 | | | | (0.75 | ) |
| | | | |
Less distributions from net investment income | | | (0.38 | ) | | | (0.21 | ) | | | (0.37 | ) | | | (0.23 | ) | | | (0.15 | ) |
| | | | |
Net asset value, end of year | | | $13.32 | | | | $14.61 | | | | $15.23 | | | | $11.97 | | | | $10.11 | |
| | | | |
| | | | | |
Total returnd | | | (6.49)% | | | | (2.81)% | | | | 30.82% | | | | 21.07% | | | | (6.97)% | |
| | | | | |
| Ratios to average net assets | | | | | | | | | | | | | | | | | | | | |
| | | | | |
Expenses | | | 1.05% | e | | | 1.03% | | | | 1.03% | f | | | 1.03% | f | | | 1.03% | f |
| | | | | |
Net investment income | | | 1.71% | | | | 2.21% | c | | | 1.37% | | | | 2.06% | | | | 1.97% | |
| | | | | |
| Supplemental data | | | | | | | | | | | | | | | | | | | | |
| | | | | |
Net assets, end of year (000’s) | | | $921,895 | | | | $1,171,896 | | | | $1,450,304 | | | | $1,352,554 | | | | $1,254,193 | |
| | | | | |
Portfolio turnover rate | | | 20.92% | | | | 17.46% | | | | 11.60% | | | | 18.73% | g | | | 42.13% | g |
aThe amount shown for a share outstanding throughout the period may not correlate with the Statement of Operations for the period due to the timing of sales and repurchases of the Fund’s shares in relation to income earned and/or fluctuating fair value of the investments of the Fund.
bBased on average daily shares outstanding.
cNet investment income per share includes approximately $0.09 per share related to income received in form of special dividends in connection with certain Fund holdings. Excluding this amount, the ratio of net investment income to average net assets would have been 1.63%.
dTotal return does not include fees, charges or expenses imposed by the variable annuity and life insurance contracts for which Franklin Templeton Variable Insurance Products Trust serves as an underlying investment vehicle.
eBenefit of waiver and payments by affiliates rounds to less than 0.01%.
fBenefit of expense reduction rounds to less than 0.01%.
gExcludes the value of portfolio securities delivered as a result of redemption in-kind.
| | | | | | |
| | TG-8 | | | Annual Report | The accompanying notes are an integral part of these financial statements. | | |
FRANKLIN TEMPLETON VARIABLE INSURANCE PRODUCTS TRUST
FINANCIAL HIGHLIGHTS
Templeton Growth VIP Fund (continued)
| | | | | | | | | | | | | | | | | | | | |
| | | Year Ended December 31, | |
| | | 2015 | | | 2014 | | | 2013 | | | 2012 | | | 2011 | |
| Class 4 | | | | | | | | | | | | | | | | | | | | |
Per share operating performance
(for a share outstanding throughout the year) | | | | | | | | | | | | | | | | | | | | |
| | | | | |
Net asset value, beginning of year | | | $14.73 | | | | $15.35 | | | | $12.07 | | | | $10.19 | | | | $11.11 | |
| | | | |
| | | | | |
| Income from investment operationsa: | | | | | | | | | | | | | | | | | | | | |
| | | | | |
Net investment incomeb | | | 0.23 | | | | 0.33 | c | | | 0.17 | | | | 0.20 | | | | 0.20 | |
| | | | | |
Net realized and unrealized gains (losses) | | | (1.16 | ) | | | (0.76 | ) | | | 3.47 | | | | 1.90 | | | | (0.98 | ) |
| | | | |
Total from investment operations | | | (0.93 | ) | | | (0.43 | ) | | | 3.64 | | | | 2.10 | | | | (0.78 | ) |
| | | | |
Less distributions from net investment income | | | (0.36 | ) | | | (0.19 | ) | | | (0.36 | ) | | | (0.22 | ) | | | (0.14 | ) |
| | | | |
Net asset value, end of year | | | $13.44 | | | | $14.73 | | | | $15.35 | | | | $12.07 | | | | $10.19 | |
| | | | |
| | | | | |
Total returnd | | | (6.54)% | | | | (2.88)% | | | | 30.64% | | | | 21.02% | | | | (7.14)% | |
| | | | | |
| Ratios to average net assets | | | | | | | | | | | | | | | | | | | | |
| | | | | |
Expenses | | | 1.15% | e | | | 1.13% | | | | 1.13% | f | | | 1.13% | f | | | 1.13% | f |
| | | | | |
Net investment income | | | 1.61% | | | | 2.11% | c | | | 1.27% | | | | 1.96% | | | | 1.87% | |
| | | | | |
| Supplemental data | | | | | | | | | | | | | | | | | | | | |
| | | | | |
Net assets, end of year (000’s) | | | $47,777 | | | | $59,989 | | | | $72,683 | | | | $67,158 | | | | $56,170 | |
| | | | | |
Portfolio turnover rate | | | 20.92% | | | | 17.46% | | | | 11.60% | | | | 18.73% | g | | | 42.13% | g |
aThe amount shown for a share outstanding throughout the period may not correlate with the Statement of Operations for the period due to the timing of sales and repurchases of the Fund’s shares in relation to income earned and/or fluctuating fair value of the investments of the Fund.
bBased on average daily shares outstanding.
cNet investment income per share includes approximately $0.09 per share related to income received in form of special dividends in connection with certain Fund holdings. Excluding this amount, the ratio of net investment income to average net assets would have been 1.53%.
dTotal return does not include fees, charges or expenses imposed by the variable annuity and life insurance contracts for which Franklin Templeton Variable Insurance Products Trust serves as an underlying investment vehicle.
eBenefit of waiver and payments by affiliates rounds to less than 0.01%.
fBenefit of expense reduction rounds to less than 0.01%.
gExcludes the value of portfolio securities delivered as a result of redemption in-kind.
| | | | | | |
| | | The accompanying notes are an integral part of these financial statements. | Annual Report | | | TG-9 | |
FRANKLIN TEMPLETON VARIABLE INSURANCE PRODUCTS TRUST
Statement of Investments, December 31, 2015
| | | | | | | | | | | | | | |
Templeton Growth VIP Fund | | | | |
| | | | | Country | | | Shares | | | Value | |
| | Common Stocks 98.2% | | | | | | | | | | | | |
| | Aerospace & Defense 1.2% | | | | | | | | | | | | |
| | BAE Systems PLC | | | United Kingdom | | | | 2,319,032 | | | $ | 17,077,013 | |
| | | | | | | | | | | | | | |
| | Air Freight & Logistics 1.0% | | | | | | | | | | | | |
| | United Parcel Service Inc., B | | | United States | | | | 145,580 | | | | 14,009,163 | |
| | | | | | | | | | | | | | |
| | Airlines 1.9% | | | | | | | | | | | | |
| a | | Deutsche Lufthansa AG | | | Germany | | | | 1,735,414 | | | | 27,456,386 | |
| | | | | | | | | | | | | | |
| | Auto Components 1.2% | | | | | | | | | | | | |
| | Cie Generale des Etablissements Michelin, B | | | France | | | | 179,759 | | | | 17,163,636 | |
| | | | | | | | | | | | | | |
| | Automobiles 3.7% | | | | | | | | | | | | |
| | Hero Motocorp Ltd. | | | India | | | | 220,820 | | | | 8,985,691 | |
| | Hyundai Motor Co. | | | South Korea | | | | 178,330 | | | | 22,607,797 | |
| | Nissan Motor Co. Ltd. | | | Japan | | | | 2,052,920 | | | | 21,853,747 | |
| | | | | | | | | | | | | | |
| | | | | | | | | | | | | 53,447,235 | |
| | | | | | | | | | | | | | |
| | Banks 16.4% | | | | | | | | | | | | |
| | Bangkok Bank PCL, fgn. | | | Thailand | | | | 913,600 | | | | 3,866,889 | |
| | BNP Paribas SA | | | France | | | | 401,637 | | | | 22,786,810 | |
| | Citigroup Inc. | | | United States | | | | 714,070 | | | | 36,953,122 | |
| | Credit Agricole SA | | | France | | | | 1,640,346 | | | | 19,386,265 | |
| | DBS Group Holdings Ltd. | | | Singapore | | | | 932,690 | | | | 10,978,628 | |
| | HSBC Holdings PLC | | | United Kingdom | | | | 3,052,064 | | | | 24,337,278 | |
| | ING Groep NV, IDR | | | Netherlands | | | | 1,273,446 | | | | 17,221,845 | |
| | JPMorgan Chase & Co. | | | United States | | | | 440,760 | | | | 29,103,383 | |
| | KB Financial Group Inc. | | | South Korea | | | | 657,984 | | | | 18,558,652 | |
| | Standard Chartered PLC | | | United Kingdom | | | | 1,768,693 | | | | 14,695,461 | |
| | SunTrust Banks Inc. | | | United States | | | | 478,520 | | | | 20,499,797 | |
| | UniCredit SpA | | | Italy | | | | 3,118,881 | | | | 17,396,786 | |
| | | | | | | | | | | | | | |
| | | | | | | | | | | | | 235,784,916 | |
| | | | | | | | | | | | | | |
| | Biotechnology 2.7% | | | | | | | | | | | | |
| | Amgen Inc. | | | United States | | | | 197,700 | | | | 32,092,641 | |
| | Gilead Sciences Inc. | | | United States | | | | 70,840 | | | | 7,168,299 | |
| | | | | | | | | | | | | | |
| | | | | | | | | | | | | 39,260,940 | |
| | | | | | | | | | | | | | |
| | Capital Markets 2.9% | | | | | | | | | | | | |
| | Credit Suisse Group AG | | | Switzerland | | | | 1,221,040 | | | | 26,431,495 | |
| | Morgan Stanley | | | United States | | | | 476,620 | | | | 15,161,282 | |
| | | | | | | | | | | | | | |
| | | | | | | | | | | | | 41,592,777 | |
| | | | | | | | | | | | | | |
| | Chemicals 1.0% | | | | | | | | | | | | |
| | Akzo Nobel NV | | | Netherlands | | | | 204,762 | | | | 13,719,033 | |
| | | | | | | | | | | | | | |
| | Commercial Services & Supplies 0.5% | | | | | | | | | | | | |
| a | | Serco Group PLC | | | United Kingdom | | | | 4,886,178 | | | | 6,805,873 | |
| | | | | | | | | | | | | | |
| | Communications Equipment 2.0% | | | | | | | | | | | | |
| | Cisco Systems Inc. | | | United States | | | | 778,890 | | | | 21,150,758 | |
| | Ericsson, B | | | Sweden | | | | 723,972 | | | | 7,056,157 | |
| | | | | | | | | | | | | | |
| | | | | | | | | | | | | 28,206,915 | |
| | | | | | | | | | | | | | |
| | Construction & Engineering 0.6% | | | | | | | | | | | | |
| b | | FLSmidth & Co. AS | | | Denmark | | | | 250,000 | | | | 8,735,405 | |
| | | | | | | | | | | | | | |
FRANKLIN TEMPLETON VARIABLE INSURANCE PRODUCTS TRUST
STATEMENT OF INVESTMENTS
Templeton Growth VIP Fund (continued)
| | | | | | | | | | | | | | |
| | | | | Country | | | Shares | | | Value | |
| | Common Stocks (continued) | | | | | | | | | | | | |
| | Construction Materials 1.3% | | | | | | | | | | | | |
| | CRH PLC | | | Ireland | | | | 648,081 | | | $ | 18,796,212 | |
| | | | | | | | | | | | | | |
| | Consumer Finance 1.3% | | | | | | | | | | | | |
| | Capital One Financial Corp. | | | United States | | | | 249,970 | | | | 18,042,834 | |
| | | | | | | | | | | | | | |
| | Diversified Telecommunication Services 2.8% | | | | | | | | | | | | |
| | China Telecom Corp. Ltd., ADR | | | China | | | | 179,195 | | | | 8,323,608 | |
| | Singapore Telecommunications Ltd. | | | Singapore | | | | 4,679,470 | | | | 12,112,035 | |
| | Telefonica SA | | | Spain | | | | 1,787,635 | | | | 19,874,512 | |
| | | | | | | | | | | | | | |
| | | | | | | | | | | | | 40,310,155 | |
| | | | | | | | | | | | | | |
| | Electronic Equipment, Instruments & Components 0.5% | | | | | | | | | | | | |
| a | | Flextronics International Ltd. | | | Singapore | | | | 691,118 | | | | 7,747,433 | |
| | | | | | | | | | | | | | |
| | Energy Equipment & Services 2.2% | | | | | | | | | | | | |
| | Baker Hughes Inc. | | | United States | | | | 301,680 | | | | 13,922,532 | �� |
| | Halliburton Co. | | | United States | | | | 316,780 | | | | 10,783,191 | |
| | Technip SA | | | France | | | | 137,470 | | | | 6,829,461 | |
| | | | | | | | | | | | | | |
| | | | | | | | | | | | | 31,535,184 | |
| | | | | | | | | | | | | | |
| | Food & Staples Retailing 2.3% | | | | | | | | | | | | |
| | Metro AG | | | Germany | | | | 587,740 | | | | 18,872,067 | |
| a | | Tesco PLC | | | United Kingdom | | | | 6,655,808 | | | | 14,666,440 | |
| | | | | | | | | | | | | | |
| | | | | | | | | | | | | 33,538,507 | |
| | | | | | | | | | | | | | |
| | Health Care Equipment & Supplies 3.1% | | | | | | | | | | | | |
| | Getinge AB, B | | | Sweden | | | | 925,050 | | | | 24,374,845 | |
| | Medtronic PLC | | | United States | | | | 257,610 | | | | 19,815,361 | |
| | | | | | | | | | | | | | |
| | | | | | | | | | | | | 44,190,206 | |
| | | | | | | | | | | | | | |
| | Industrial Conglomerates 1.8% | | | | | | | | | | | | |
| | Siemens AG | | | Germany | | | | 164,562 | | | | 16,066,542 | |
| a | | Toshiba Corp. | | | Japan | | | | 4,835,860 | | | | 10,054,340 | |
| | | | | | | | | | | | | | |
| | | | | | | | | | | | | 26,120,882 | |
| | | | | | | | | | | | | | |
| | Insurance 5.6% | | | | | | | | | | | | |
| | Aegon NV | | | Netherlands | | | | 3,053,986 | | | | 17,349,961 | |
| | American International Group Inc. | | | United States | | | | 453,280 | | | | 28,089,762 | |
| | AXA SA | | | France | | | | 732,778 | | | | 20,082,578 | |
| | Swiss Re AG | | | Switzerland | | | | 148,166 | | | | 14,513,466 | |
| | | | | | | | | | | | | | |
| | | | | | | | | | | | | 80,035,767 | |
| | | | | | | | | | | | | | |
| | Internet Software & Services 1.6% | | | | | | | | | | | | |
| a | | Alphabet Inc., A | | | United States | | | | 29,370 | | | | 22,850,154 | |
| | | | | | | | | | | | | | |
| | Life Sciences Tools & Services 0.7% | | | | | | | | | | | | |
| a | | QIAGEN NV | | | Netherlands | | | | 385,000 | | | | 10,503,250 | |
| | | | | | | | | | | | | | |
| | Machinery 0.4% | | | | | | | | | | | | |
| a | | Navistar International Corp. | | | United States | | | | 598,440 | | | | 5,290,210 | |
| | | | | | | | | | | | | | |
| | Media 4.3% | | | | | | | | | | | | |
| | Comcast Corp., A | | | United States | | | | 405,602 | | | | 22,888,121 | |
| | News Corp., A | | | United States | | | | 319,435 | | | | 4,267,652 | |
| | Sky PLC | | | United Kingdom | | | | 1,074,857 | | | | 17,617,253 | |
| | Twenty-First Century Fox Inc., A | | | United States | | | | 641,182 | | | | 17,414,503 | |
| | | | | | | | | | | | | | |
| | | | | | | | | | | | | 62,187,529 | |
| | | | | | | | | | | | | | |
FRANKLIN TEMPLETON VARIABLE INSURANCE PRODUCTS TRUST
STATEMENT OF INVESTMENTS
Templeton Growth VIP Fund (continued)
| | | | | | | | | | | | | | |
| | | | | Country | | | Shares | | | Value | |
| | Common Stocks (continued) | | | | | | | | | | | | |
| | Metals & Mining 1.5% | | | | | | | | | | | | |
| | Glencore PLC | | | Switzerland | | | | 6,553,520 | | | $ | 8,739,970 | |
| | MMC Norilsk Nickel PJSC, ADR | | | Russia | | | | 1,040,760 | | | | 13,181,225 | |
| | | | | | | | | | | | | | |
| | | | | | | | | | | | | 21,921,195 | |
| | | | | | | | | | | | | | |
| | Oil, Gas & Consumable Fuels 10.3% | | | | | | | | | | | | |
| | Apache Corp. | | | United States | | | | 357,350 | | | | 15,891,355 | |
| | BG Group PLC | | | United Kingdom | | | | 630,010 | | | | 9,146,741 | |
| | BP PLC | | | United Kingdom | | | | 2,969,971 | | | | 15,496,663 | |
| | Chesapeake Energy Corp. | | | United States | | | | 2,047,110 | | | | 9,211,995 | |
| | Chevron Corp. | | | United States | | | | 198,410 | | | | 17,848,964 | |
| | Eni SpA | | | Italy | | | | 776,759 | | | | 11,643,812 | |
| | Galp Energia SGPS SA, B | | | Portugal | | | | 1,575,520 | | | | 18,346,300 | |
| | Kunlun Energy Co. Ltd. | | | China | | | | 17,103,030 | | | | 15,226,919 | |
| | Royal Dutch Shell PLC, A | | | United Kingdom | | | | 15,359 | | | | 345,462 | |
| | Royal Dutch Shell PLC, B | | | United Kingdom | | | | 299,573 | | | | 6,813,203 | |
| | Suncor Energy Inc. | | | Canada | | | | 46,000 | | | | 1,187,826 | |
| | Total SA, B | | | France | | | | 618,659 | | | | 27,730,836 | |
| | | | | | | | | | | | | | |
| | | | | | | | | | | | | 148,890,076 | |
| | | | | | | | | | | | | | |
| | Pharmaceuticals 10.5% | | | | | | | | | | | | |
| a | | Allergan PLC | | | United States | | | | 93,324 | | | | 29,163,750 | |
| | Eli Lilly & Co. | | | United States | | | | 97,150 | | | | 8,185,859 | |
| | GlaxoSmithKline PLC | | | United Kingdom | | | | 1,154,149 | | | | 23,356,897 | |
| | Merck KGaA | | | Germany | | | | 166,284 | | | | 16,178,670 | |
| | Roche Holding AG | | | Switzerland | | | | 90,103 | | | | 24,854,760 | |
| | Sanofi | | | France | | | | 251,317 | | | | 21,457,257 | |
| | Teva Pharmaceutical Industries Ltd., ADR | | | Israel | | | | 417,580 | | | | 27,409,951 | |
| | | | | | | | | | | | | | |
| | | | | | | | | | | | | 150,607,144 | |
| | | | | | | | | | | | | | |
| | Software 3.2% | | | | | | | | | | | | |
| | Microsoft Corp. | | | United States | | | | 633,769 | | | | 35,161,504 | |
| | Oracle Corp. | | | United States | | | | 307,200 | | | | 11,222,016 | |
| | | | | | | | | | | | | | |
| | | | | | | | | | | | | 46,383,520 | |
| | | | | | | | | | | | | | |
| | Specialty Retail 1.0% | | | | | | | | | | | | |
| | Kingfisher PLC | | | United Kingdom | | | | 2,861,338 | | | | 13,896,560 | |
| | | | | | | | | | | | | | |
| | Technology Hardware, Storage & Peripherals 4.9% | | | | | | | | | | | | |
| | Hewlett Packard Enterprise Co. | | | United States | | | | 677,340 | | | | 10,295,568 | |
| | HP Inc. | | | United States | | | | 677,340 | | | | 8,019,706 | |
| | Samsung Electronics Co. Ltd. | | | South Korea | | | | 48,400 | | | | 51,887,587 | |
| | | | | | | | | | | | | | |
| | | | | | | | | | | | | 70,202,861 | |
| | | | | | | | | | | | | | |
| | Textiles, Apparel & Luxury Goods 0.9% | | | | | | | | | | | | |
| a | | Michael Kors Holdings Ltd. | | | United States | | | | 321,440 | | | | 12,876,886 | |
| | | | | | | | | | | | | | |
| | Wireless Telecommunication Services 2.9% | | | | | | | | | | | | |
| | SoftBank Group Corp. | | | Japan | | | | 346,820 | | | | 17,713,948 | |
| | Turkcell Iletisim Hizmetleri AS, ADR | | | Turkey | | | | 1,653,543 | | | | 14,038,580 | |
| | Vodafone Group PLC | | | United Kingdom | | | | 3,292,417 | | | | 10,724,816 | |
| | | | | | | | | | | | | | |
| | | | | | | | | | | | | 42,477,344 | |
| | | | | | | | | | | | | | |
| | | | |
| | Total Common Stocks (Cost $1,306,478,339) | | | | | | | | | | | 1,411,663,201 | |
| | | | | | | | | | | | | | |
FRANKLIN TEMPLETON VARIABLE INSURANCE PRODUCTS TRUST
STATEMENT OF INVESTMENTS
Templeton Growth VIP Fund (continued)
| | | | | | | | | | | | | | |
| | | | | Country | | | Shares | | | Value | |
| | Preferred Stocks (Cost $22,230,600) 0.4% | | | | | | | | | | | | |
| | Oil, Gas & Consumable Fuels 0.4% | | | | | | | | | | | | |
| a | | Petroleo Brasileiro SA, ADR, pfd. | | | Brazil | | | | 1,913,392 | | | $ | 6,505,533 | |
| | | | | | | | | | | | | | |
| | | | |
| | Total Investments before Short Term Investments
(Cost $1,328,708,939) | | | | | | | | | | | 1,418,168,734 | |
| | | | | | | | | | | | | | |
| | | | |
| | | | | | | | Principal Amount | | | | |
| | Short Term Investments 2.3% | | | | | | | | | | | | |
| | Time Deposits 1.7% | | | | | | | | | | | | |
| | Bank of Montreal, 0.10%, 1/04/16 | | | United States | | | $ | 13,000,000 | | | | 13,000,000 | |
| | Royal Bank of Canada, 0.10%, 1/04/16 | | | United States | | | | 11,500,000 | | | | 11,500,000 | |
| | | | | | | | | | | | | | |
| | | | |
| | Total Time Deposits (Cost $24,500,000) | | | | | | | | | | | 24,500,000 | |
| | | | | | | | | | | | | | |
| | | | |
| | Total Investments before Money Market Funds
(Cost $1,353,208,939) | | | | | | | | | | | 1,442,668,734 | |
| | | | | | | | | | | | | | |
| | | | |
| | | | | | | | Shares | | | | |
| c | | Investments from Cash Collateral Received for Loaned Securities (Cost $8,864,598) 0.6% | | | | | | | | | | | | |
| | Money Market Funds 0.6% | | | | | | | | | | | | |
| a,d | | Institutional Fiduciary Trust Money Market Portfolio | | | United States | | | | 8,864,598 | | | | 8,864,598 | |
| | | | | | | | | | | | | | |
| | Total Investments (Cost $1,362,073,537) 100.9% | | | | | | | | | | | 1,451,533,332 | |
| | Other Assets, less Liabilities (0.9)% | | | | | | | | | | | (13,313,763 | ) |
| | | | | | | | | | | | | | |
| | Net Assets 100.0% | | | | | | | | | | $ | 1,438,219,569 | |
| | | | | | | | | | | | | | |
See Abbreviations on page TG-23.
aNon-income producing.
bA portion or all of the security is on loan at December 31, 2015. See Note 1(c).
cSee Note 1(c) regarding securities on loan.
dSee Note 3(e) regarding investments in affiliated management investment companies.
| | | | | | |
| | | The accompanying notes are an integral part of these financial statements. | Annual Report | | | TG-13 | |
FRANKLIN TEMPLETON VARIABLE INSURANCE PRODUCTS TRUST
Financial Statements
Statement of Assets and Liabilities
December 31, 2015
| | | | |
| | | Templeton Growth
VIP Fund | |
Assets: | | | | |
Investments in securities: | | | | |
Cost - Unaffiliated issuers | | $ | 1,353,208,939 | |
Cost - Non-controlled affiliates (Note 3e) | | | 8,864,598 | |
| | | | |
Total cost of investments | | $ | 1,362,073,537 | |
| | | | |
Value - Unaffiliated issuers | | $ | 1,442,668,734 | |
Value - Non-controlled affiliates (Note 3e) | | | 8,864,598 | |
| | | | |
Total value of investments (Includes securities loaned in the amount of $8,394,130) | | | 1,451,533,332 | |
Cash | | | 263,278 | |
Receivables: | | | | |
Capital shares sold | | | 95,309 | |
Dividends and interest | | | 2,561,782 | |
Other assets | | | 776,856 | |
| | | | |
Total assets | | | 1,455,230,557 | |
| | | | |
Liabilities: | | | | |
Payables: | | | | |
Investment securities purchased | | | 5,565,265 | |
Capital shares redeemed | | | 794,191 | |
Management fees | | | 959,522 | |
Distribution fees | | | 428,286 | |
Payable upon return of securities loaned | | | 8,864,598 | |
Deferred tax | | | 95,682 | |
Accrued expenses and other liabilities | | | 303,444 | |
| | | | |
Total liabilities | | | 17,010,988 | |
| | | | |
Net assets, at value | | $ | 1,438,219,569 | |
| | | | |
Net assets consist of: | | | | |
Paid-in capital | | $ | 1,278,468,683 | |
Undistributed net investment income | | | 28,729,403 | |
Net unrealized appreciation (depreciation) | | | 89,287,654 | |
Accumulated net realized gain (loss) | | | 41,733,829 | |
| | | | |
Net assets, at value | | $ | 1,438,219,569 | |
| | | | |
| |
| Class 1: | | | | |
Net assets, at value | | $ | 468,547,530 | |
| | | | |
Shares outstanding | | | 34,607,360 | |
| | | | |
Net asset value and maximum offering price per share | | $ | 13.54 | |
| | | | |
| |
| Class 2: | | | | |
Net assets, at value | | $ | 921,895,486 | |
| | | | |
Shares outstanding | | | 69,201,526 | |
| | | | |
Net asset value and maximum offering price per share | | $ | 13.32 | |
| | | | |
| |
| Class 4: | | | | |
Net assets, at value | | $ | 47,776,553 | |
| | | | |
Shares outstanding | | | 3,556,057 | |
| | | | |
Net asset value and maximum offering price per share | | $ | 13.44 | |
| | | | |
| | | | | | |
| | TG-14 | | | Annual Report | The accompanying notes are an integral part of these financial statements. | | |
FRANKLIN TEMPLETON VARIABLE INSURANCE PRODUCTS TRUST
FINANCIAL STATEMENTS
Statement of Operations
for the year ended December 31, 2015
| | | | |
| | | Templeton Growth
VIP Fund | |
Investment income: | | | | |
Dividends (net of foreign taxes of $3,801,734) | | $ | 44,050,949 | |
Interest | | | 20,197 | |
Income from securities loaned | | | 985,092 | |
Other income (Note 1d) | | | 898,971 | |
| | | | |
Total investment income | | | 45,955,209 | |
| | | | |
Expenses: | | | | |
Management fees (Note 3a) | | | 12,745,094 | |
Distribution fees: (Note 3c) | | | | |
Class 2 | | | 2,687,141 | |
Class 4 | | | 194,619 | |
Custodian fees (Note 4) | | | 135,178 | |
Reports to shareholders | | | 160,317 | |
Registration and filing fees | | | 348 | |
Professional fees | | | 138,254 | |
Trustees’ fees and expenses | | | 7,438 | |
Other | | | 157,565 | |
| | | | |
Total expenses | | | 16,225,954 | |
Expenses waived/paid by affiliates (Note 3e) | | | (29,818 | ) |
| | | | |
Net expenses | | | 16,196,136 | |
| | | | |
Net investment income | | | 29,759,073 | |
| | | | |
Realized and unrealized gains (losses): | | | | |
Net realized gain (loss) from: | | | | |
Investments | | | 131,279,844 | |
Foreign currency transactions | | | (233,753 | ) |
| | | | |
Net realized gain (loss) | | | 131,046,091 | |
| | | | |
Net change in unrealized appreciation (depreciation) on: | | | | |
Investments | | | (259,324,308 | ) |
Translation of other assets and liabilities denominated in foreign currencies | | | (28,994 | ) |
Change in deferred taxes on unrealized appreciation | | | (95,682 | ) |
| | | | |
Net change in unrealized appreciation (depreciation) | | | (259,448,984 | ) |
| | | | |
Net realized and unrealized gain (loss) | | | (128,402,893 | ) |
| | | | |
Net increase (decrease) in net assets resulting from operations | | $ | (98,643,820 | ) |
| | | | |
| | | | | | |
| | | The accompanying notes are an integral part of these financial statements. | Annual Report | | | TG-15 | |
FRANKLIN TEMPLETON VARIABLE INSURANCE PRODUCTS TRUST
FINANCIAL STATEMENTS
Statements of Changes in Net Assets
| | | | | | | | |
| | | Templeton Growth VIP Fund | |
| | | Year Ended December 31, | |
| | | 2015 | | | 2014 | |
Increase (decrease) in net assets: | | | | | | | | |
Operations: | | | | | | | | |
Net investment income | | $ | 29,759,073 | | | $ | 45,743,743 | |
Net realized gain (loss) | | | 131,046,091 | | | | 105,495,221 | |
Net change in unrealized appreciation (depreciation) | | | (259,448,984 | ) | | | (200,494,822 | ) |
| | | | |
Net increase (decrease) in net assets resulting from operations | | | (98,643,820 | ) | | | (49,255,858 | ) |
| | | | |
Distributions to shareholders from: | | | | | | | | |
Net investment income: | | | | | | | | |
Class 1 | | | (15,123,132 | ) | | | (9,482,577 | ) |
Class 2 | | | (28,110,279 | ) | | | (18,300,865 | ) |
Class 4 | | | (1,358,156 | ) | | | (885,005 | ) |
| | | | |
Total distributions to shareholders | | | (44,591,567 | ) | | | (28,668,447 | ) |
| | | | |
Capital share transactions: (Note 2) | | | | | | | | |
Class 1 | | | (58,388,439 | ) | | | 9,471,206 | |
Class 2 | | | (157,221,222 | ) | | | (227,816,318 | ) |
Class 4 | | | (7,679,959 | ) | | | (10,381,665 | ) |
| | | | |
Total capital share transactions | | | (223,289,620 | ) | | | (228,726,777 | ) |
| | | | |
Net increase (decrease) in net assets | | | (366,525,007 | ) | | | (306,651,082 | ) |
Net assets: | | | | | | | | |
Beginning of year | | | 1,804,744,576 | | | | 2,111,395,658 | |
| | | | |
End of year | | $ | 1,438,219,569 | | | $ | 1,804,744,576 | |
| | | | |
Undistributed net investment income included in net assets: | | | | | | | | |
End of year | | $ | 28,729,403 | | | $ | 44,589,038 | |
| | | | |
| | | | | | |
| | TG-16 | | | Annual Report | The accompanying notes are an integral part of these financial statements. | | |
FRANKLIN TEMPLETON VARIABLE INSURANCE PRODUCTS TRUST
Notes to Financial Statements
Templeton Growth VIP Fund
1. Organization and Significant Accounting Policies
Franklin Templeton Variable Insurance Products Trust (Trust) is registered under the Investment Company Act of 1940 (1940 Act) as an open-end management investment company, consisting of nineteen separate funds and applies the specialized accounting and reporting guidance in U.S. Generally Accepted Accounting Principles (U.S. GAAP). Templeton Growth VIP Fund (Fund) is included in this report. The financial statements of the remaining funds in the Trust are presented separately. Shares of the Fund are generally sold only to insurance company separate accounts to fund the benefits of variable life insurance policies or variable annuity contracts. Fund offers three classes of shares: Class 1, Class 2, and Class 4. Each class of shares differs by its distribution fees, voting rights on matters affecting a single class and its exchange privilege.
The following summarizes the Fund’s significant accounting policies.
a. Financial Instrument Valuation
The Fund’s investments in financial instruments are carried at fair value daily. Fair value is the price that would be received to sell an asset or paid to transfer a liability in an orderly transaction between market participants on the measurement date. The Fund calculates the net asset value (NAV) per share as of 4 p.m. Eastern time each day the New York Stock Exchange (NYSE) is open for trading. Under compliance policies and procedures approved by the Trust’s Board of Trustees (the Board), the Fund’s administrator has responsibility for oversight of valuation, including leading the cross-functional Valuation and Liquidity Oversight Committee (VLOC). The VLOC provides administration and oversight of the Fund’s valuation policies and procedures, which are approved annually by the Board. Among other things, these procedures allow the Fund to utilize independent pricing services, quotations from securities and financial instrument dealers, and other market sources to determine fair value.
Equity securities listed on an exchange or on the NASDAQ National Market System are valued at the last quoted sale price or the official closing price of the day, respectively. Foreign equity securities are valued as of the close of trading on the foreign stock exchange on which the security is primarily traded or as of 4 p.m. Eastern time whichever is earlier. The value is then converted into its U.S. dollar equivalent at the foreign exchange rate in effect at 4 p.m. Eastern time on the day that the value of
the security is determined. Over-the-counter (OTC) securities are valued within the range of the most recent quoted bid and ask prices. Securities that trade in multiple markets or on multiple exchanges are valued according to the broadest and most representative market. Certain equity securities are valued based upon fundamental characteristics or relationships to similar securities.
Investments in open-end mutual funds are valued at the closing NAV. Time deposits are valued at cost, which approximates fair value.
The Fund has procedures to determine the fair value of financial instruments for which market prices are not reliable or readily available. Under these procedures, the VLOC convenes on a regular basis to review such financial instruments and considers a number of factors, including significant unobservable valuation inputs, when arriving at fair value. The VLOC primarily employs a market-based approach which may use related or comparable assets or liabilities, recent transactions, market multiples, book values, and other relevant information for the investment to determine the fair value of the investment. An income-based valuation approach may also be used in which the anticipated future cash flows of the investment are discounted to calculate fair value. Discounts may also be applied due to the nature or duration of any restrictions on the disposition of the investments. Due to the inherent uncertainty of valuations of such investments, the fair values may differ significantly from the values that would have been used had an active market existed. The VLOC employs various methods for calibrating these valuation approaches including a regular review of key inputs and assumptions, transactional back-testing or disposition analysis, and reviews of any related market activity.
Trading in securities on foreign securities stock exchanges and OTC markets may be completed before 4 p.m. Eastern time. In addition, trading in certain foreign markets may not take place on every NYSE business day. Occasionally, events occur between the time at which trading in a foreign security is completed and the close of the NYSE that might call into question the reliability of the value of a portfolio security held by the Fund. As a result, differences may arise between the value of the Fund’s portfolio securities as determined at the foreign market close and the latest indications of value at the close of the NYSE. In order to minimize the potential for these differences, the VLOC monitors price movements following the close of trading in foreign stock markets through a series of
FRANKLIN TEMPLETON VARIABLE INSURANCE PRODUCTS TRUST
NOTES TO FINANCIAL STATEMENTS
Templeton Growth VIP Fund (continued)
1. Organization and Significant Accounting Policies (continued)
a. Financial Instrument Valuation (continued)
country specific market proxies (such as baskets of American Depositary Receipts, futures contracts and exchange traded funds). These price movements are measured against established trigger thresholds for each specific market proxy to assist in determining if an event has occurred that may call into question the reliability of the values of the foreign securities held by the Fund. If such an event occurs, the securities may be valued using fair value procedures, which may include the use of independent pricing services.
When the last day of the reporting period is a non-business day, certain foreign markets may be open on those days that the NYSE is closed, which could result in differences between the value of the Fund’s portfolio securities on the last business day and the last calendar day of the reporting period. Any significant security valuation changes due to an open foreign market are adjusted and reflected by the Fund for financial reporting purposes.
b. Foreign Currency Translation
Portfolio securities and other assets and liabilities denominated in foreign currencies are translated into U.S. dollars based on the exchange rate of such currencies against U.S. dollars on the date of valuation. The Fund may enter into foreign currency exchange contracts to facilitate transactions denominated in a foreign currency. Purchases and sales of securities, income and expense items denominated in foreign currencies are translated into U.S. dollars at the exchange rate in effect on the transaction date. Portfolio securities and assets and liabilities denominated in foreign currencies contain risks that those currencies will decline in value relative to the U.S. dollar. Occasionally, events may impact the availability or reliability of foreign exchange rates used to convert the U.S. dollar equivalent value. If such an event occurs, the foreign exchange rate will be valued at fair value using procedures established and approved by the Board.
The Fund does not separately report the effect of changes in foreign exchange rates from changes in market prices on securities held. Such changes are included in net realized and unrealized gain or loss from investments in the Statement of Operations.
Realized foreign exchange gains or losses arise from sales of foreign currencies, currency gains or losses realized between the
trade and settlement dates on securities transactions and the difference between the recorded amounts of dividends, interest, and foreign withholding taxes and the U.S. dollar equivalent of the amounts actually received or paid. Net unrealized foreign exchange gains and losses arise from changes in foreign exchange rates on foreign denominated assets and liabilities other than investments in securities held at the end of the reporting period.
c. Securities Lending
The Fund participates in an agency based securities lending program to earn additional income. The Fund receives cash collateral against the loaned securities in an amount equal to at least 102% of the fair value of the loaned securities. Collateral is maintained over the life of the loan in an amount not less than 100% of the fair value of loaned securities, as determined at the close of Fund business each day; any additional collateral required due to changes in security values is delivered to the Fund on the next business day. The collateral is deposited into a joint cash account with other funds and is used to invest in a money market fund managed by Franklin Advisers, Inc., an affiliate of the Fund. The Fund may receive income from the investment of cash collateral, in addition to lending fees and rebates paid by the borrower. Income from securities loaned is reported separately in the Statement of Operations. The Fund bears the market risk with respect to the collateral investment, securities loaned, and the risk that the agent may default on its obligations to the Fund. If the borrower defaults on its obligation to return the securities loaned, the Fund has the right to repurchase the securities in the open market using the collateral received. The securities lending agent has agreed to indemnify the Fund in the event of default by a third party borrower.
Securities lending transactions are accounted for as secured borrowing transactions. The securities out on loan represent the collateral pledged by the Fund, and the cash collateral received for the loaned securities represents the amount borrowed by the Fund. At December 31, 2015, the Fund‘s secured borrowing transactions were as follows:
| | | | |
Securities lending transactionsa: | | | | |
Equity investmentsb | | $ | 8,864,598 | |
| | | | |
aThe agreements open at year end can be terminated at any time.
bGross amount of recognized liabilities for securities lending transactions is included in payable upon return of securities loaned in the Statement of Assets and Liabilities.
FRANKLIN TEMPLETON VARIABLE INSURANCE PRODUCTS TRUST
NOTES TO FINANCIAL STATEMENTS
Templeton Growth VIP Fund (continued)
d. Income and Deferred Taxes
It is the Fund’s policy to qualify as a regulated investment company under the Internal Revenue Code. The Fund intends to distribute to shareholders substantially all of its taxable income and net realized gains to relieve it from federal income and if applicable, excise taxes. As a result, no provision for U.S. federal income taxes is required.
The Fund may be subject to foreign taxation related to income received, capital gains on the sale of securities and certain foreign currency transactions in the foreign jurisdictions in which it invests. Foreign taxes, if any, are recorded based on the tax regulations and rates that exist in the foreign markets in which the Fund invests. When a capital gain tax is determined to apply, the Fund records an estimated deferred tax liability in an amount that would be payable if the securities were disposed of on the valuation date. As a result of several court cases, in certain countries across the European Union, the Fund has filed additional tax reclaims for previously withheld taxes on dividends earned in those countries. These additional filings are subject to various administrative proceedings by the local jurisdictions’ tax authorities within the European Union, as well as a number of related judicial proceedings. During the year ended December 31, 2015, the Fund recognized $909,116 from Sweden for previously withheld foreign taxes and interest on such taxes. These amounts are reflected as other income and interest in the Statement of Operations. In regards to filings in other European Union countries, uncertainty exists as to the ultimate resolution of these proceedings, the likelihood of receipt of these reclaims, and the potential timing of payment, and accordingly, no amounts are reflected in the financial statements.
The Fund may recognize an income tax liability related to its uncertain tax positions under U.S. GAAP when the uncertain tax position has a less than 50% probability that it will be sustained upon examination by the tax authorities based on its technical merits. As of December 31, 2015, the Fund has determined that no tax liability is required in its financial statements related to uncertain tax positions for any open tax years (or expected to be taken on future tax returns). Open tax years are those that remain subject to examination and are based on each tax jurisdiction’s statute of limitation.
e. Security Transactions, Investment Income, Expenses and Distributions
Security transactions are accounted for on trade date. Realized gains and losses on security transactions are determined on a
specific identification basis. Interest income and estimated expenses are accrued daily. Dividend income is recorded on the ex-dividend date except for certain dividends from foreign securities where the dividend rate is not available. In such cases, the dividend is recorded as soon as the information is received by the Fund. Distributions to shareholders are recorded on the ex-dividend date and are determined according to income tax regulations (tax basis). Distributable earnings determined on a tax basis may differ from earnings recorded in accordance with U.S. GAAP. These differences may be permanent or temporary. Permanent differences are reclassified among capital accounts to reflect their tax character. These reclassifications have no impact on net assets or the results of operations. Temporary differences are not reclassified, as they may reverse in subsequent periods.
Common expenses incurred by the Trust are allocated among the Funds based on the ratio of net assets of each Fund to the combined net assets of the Trust. Fund specific expenses are charged directly to the fund that incurred the expense.
Realized and unrealized gains and losses and net investment income, not including class specific expenses, are allocated daily to each class of shares based upon the relative proportion of net assets of each class. Differences in per share distributions, by class, are generally due to differences in class specific expenses.
f. Accounting Estimates
The preparation of financial statements in accordance with U.S. GAAP requires management to make estimates and assumptions that affect the reported amounts of assets and liabilities at the date of the financial statements and the amounts of income and expenses during the reporting period. Actual results could differ from those estimates.
g. Guarantees and Indemnifications
Under the Trust’s organizational documents, its officers and trustees are indemnified by the Trust against certain liabilities arising out of the performance of their duties to the Trust. Additionally, in the normal course of business, the Trust, on behalf of the Fund, enters into contracts with service providers that contain general indemnification clauses. The Trust’s maximum exposure under these arrangements is unknown as this would involve future claims that may be made against the Trust that have not yet occurred. Currently, the Trust expects the risk of loss to be remote.
FRANKLIN TEMPLETON VARIABLE INSURANCE PRODUCTS TRUST
NOTES TO FINANCIAL STATEMENTS
Templeton Growth VIP Fund (continued)
2. Shares of Beneficial Interest
At December 31, 2015, there were an unlimited number of shares authorized (without par value). Transactions in the Fund’s shares were as follows:
| | | | | | | | | | | | | | | | | | |
| | | Year Ended December 31, | |
| | | 2015 | | | | | 2014 | |
| | | Shares | | | Amount | | | | | Shares | | | Amount | |
| | | | | |
| Class 1 Shares: | | | | | | | | | | | | | | | | | | |
Shares sold | | | 326,516 | | | $ | 4,799,095 | | | | | | 2,100,767 | | | $ | 33,047,439 | |
Shares issued in reinvestment of distributions | | | 1,016,340 | | | | 15,123,132 | | | | | | 589,713 | | | | 9,482,577 | |
Shares redeemed | | | (5,310,550 | ) | | | (78,310,666 | ) | | | | | (2,142,457 | ) | | | (33,058,810 | ) |
| | | | |
Net increase (decrease) | | | (3,967,694 | ) | | $ | (58,388,439 | ) | | | | | 548,023 | | | $ | 9,471,206 | |
| | | | |
| Class 2 Shares: | | | | | | | | | | | | | | | | | | |
Shares sold | | | 2,945,698 | | | $ | 42,909,317 | | | | | | 2,721,083 | | | $ | 41,308,837 | |
Shares issued in reinvestment of distributions | | | 1,917,482 | | | | 28,110,279 | | | | | | 1,155,358 | | | | 18,300,865 | |
Shares redeemed | | | (15,863,936 | ) | | | (228,240,818 | ) | | | | | (18,911,727 | ) | | | (287,426,020 | ) |
| | | | |
Net increase (decrease) | | | (11,000,756 | ) | | $ | (157,221,222 | ) | | | | | (15,035,286 | ) | | $ | (227,816,318 | ) |
| | | | |
| Class 4 Shares: | | | | | | | | | | | | | | | | | | |
Shares sold | | | 307,977 | | | $ | 4,289,876 | | | | | | 416,620 | | | $ | 6,355,215 | |
Shares issued on reinvestment of distributions | | | 91,767 | | | | 1,358,156 | | | | | | 55,382 | | | | 885,005 | |
Shares redeemed | | | (916,167 | ) | | | (13,327,991 | ) | | | | | (1,134,025 | ) | | | (17,621,885 | ) |
| | | | |
Net increase (decrease) | | | (516,423 | ) | | $ | (7,679,959 | ) | | | | | (662,023 | ) | | $ | (10,381,665 | ) |
| | | | |
3. Transactions With Affiliates
Franklin Resources, Inc. is the holding company for various subsidiaries that together are referred to as Franklin Templeton Investments. Certain officers and trustees of the Fund are also officers and/or directors of the following subsidiaries:
| | |
| Subsidiary | | Affiliation |
Templeton Global Advisors Limited (TGAL) | | Investment manager |
Franklin Templeton Services, LLC (FT Services) | | Administrative manager |
Franklin Templeton Distributors, Inc. (Distributors) | | Principal underwriter |
Franklin Templeton Investor Services, LLC (Investor Services) | | Transfer agent |
a. Management Fees
The Fund pays an investment management fee to TGAL based on the average daily net assets of the Fund as follows:
| | |
| Annualized Fee Rate | | Net Assets |
1.000% | | Up to and including $100 million |
0.900% | | Over $100 million, up to and including $250 million |
0.800% | | Over $250 million, up to and including $500 million |
0.750% | | Over $500 million, up to and including $1 billion |
0.700% | | Over $1 billion, up to and including $5 billion |
0.675% | | Over $5 billion, up to and including $10 billion |
0.655% | | Over $10 billion, up to and including $15 billion |
0.635% | | Over $15 billion, up to and including $20 billion |
0.615% | | In excess of $20 billion |
FRANKLIN TEMPLETON VARIABLE INSURANCE PRODUCTS TRUST
NOTES TO FINANCIAL STATEMENTS
Templeton Growth VIP Fund (continued)
b. Administrative Fees
Under an agreement with TGAL, FT Services provides administrative services to the Fund. The fee is paid by TGAL based on the Fund’s average daily net assets, and is not an additional expense of the Fund.
c. Distribution Fees
The Board has adopted distribution plans for Class 2 and Class 4 shares pursuant to Rule 12b-1 under the 1940 Act. Under the Fund’s compensation distribution plans, the Fund pays Distributors for costs incurred in connection with the servicing, sale and distribution of the Fund’s shares up to 0.35% per year of its average daily net assets of each class. The Board has agreed to limit the current rate to 0.25% per year for Class 2. The plan year, for purposes of monitoring compliance with the maximum annual plan rates, is February 1 through January 31.
d. Transfer Agent Fees
Investor Services, under terms of an agreement, performs shareholder servicing for the Fund and is not paid by the Fund for the services.
e. Investments in Affiliated Management Investment Companies
The Fund invests in an affiliated management investment company for purposes other than exercising a controlling influence over the management or policies. Management fees paid by the Fund are waived on assets invested in the affiliated management investment company, as noted in the Statement of Operations, in an amount not to exceed the management and administrative fees paid directly or indirectly by each affiliate.
| | | | | | | | | | | | | | | | | | | | | | | | | | | | | | | | |
| | | Number
of Shares
Held at
Beginning
of Year | | | Gross
Additions | | | Gross
Reductions | | | Number
of Shares
Held at
End of
Year | | | Value at
End of
Year | | | Investment
Income | | | Realized
Gain
(Loss) | | | % of
Affiliated
Fund Shares
Outstanding
Held at End
of Year | |
| Non-Controlled Affiliates | | | | | | | | | | | | | | | | | | | | | | | | | | | | | | | | |
Institutional Fiduciary Trust Money Market Portfolio | | | — | | | | 562,895,305 | | | | (554,030,707 | ) | | | 8,864,598 | | | $ | 8,864,598 | | | $ | — | | | $ | — | | | | 0.05% | |
| | | | | | | | | | | | | | | | | | | | | | | | |
f. Other Affiliated Transactions
At December 31, 2015, Franklin Templeton Variable Insurance Products Trust – Franklin Founding Funds Allocation VIP Fund owned 23.40% of the Fund’s outstanding shares.
4. Expense Offset Arrangement
The Fund has entered into an arrangement with its custodian whereby credits realized as a result of uninvested cash balances are used to reduce a portion of the Fund’s custodian expenses. During the year ended December 31, 2015, there were no credits earned.
5. Income Taxes
For tax purposes, capital losses may be carried over to offset future capital gains. Capital loss carryforwards with no expiration, if any, must be fully utilized before those losses with expiration dates.
During the year ended December 31, 2015, the Fund utilized $72,285,267 of capital loss carryforwards.
FRANKLIN TEMPLETON VARIABLE INSURANCE PRODUCTS TRUST
NOTES TO FINANCIAL STATEMENTS
Templeton Growth VIP Fund (continued)
5. Income Taxes (continued)
The tax character of distributions paid during the years ended December 31, 2015 and 2014, was as follows:
| | | | | | | | |
| | | 2015 | | | 2014 | |
Distributions paid from ordinary income | | $ | 44,591,567 | | | $ | 28,668,447 | |
| | | | |
At December 31, 2015, the cost of investments, net unrealized appreciation (depreciation), undistributed ordinary income and undistributed long term capital gains for income tax purposes were as follows:
| | | | |
Cost of investments | | $ | 1,373,094,168 | |
| | | | |
Unrealized appreciation | | $ | 298,622,741 | |
Unrealized depreciation | | | (220,183,577 | ) |
| | | | |
Net unrealized appreciation (depreciation) | | $ | 78,439,164 | |
| | | | |
Undistributed ordinary income | | $ | 28,741,094 | |
Undistributed long term capital gains | | | 52,754,459 | |
| | | | |
Distributable earnings | | $ | 81,495,553 | |
| | | | |
Differences between income and/or capital gains as determined on a book basis and a tax basis are primarily due to differing treatments of foreign capital gains tax and wash sales.
6. Investment Transactions
Purchases and sales of investments (excluding short term securities) for the year ended December 31, 2015, aggregated $342,165,565 and $559,263,133, respectively.
7. Concentration of Risk
Investing in foreign securities may include certain risks and considerations not typically associated with investing in U.S. securities, such as fluctuating currency values and changing local and regional economic, political and social conditions, which may result in greater market volatility. In addition, certain foreign securities may not be as liquid as U.S. securities.
8. Credit Facility
The Fund, together with other U.S. registered and foreign investment funds (collectively, Borrowers), managed by Franklin Templeton Investments, are borrowers in a joint syndicated senior unsecured credit facility totaling $2 billion (Global Credit Facility) which matured on February 12, 2016. This Global Credit Facility provides a source of funds to the Borrowers for temporary and emergency purposes, including the ability to meet future unanticipated or unusually large redemption requests.
Effective February 12, 2016, the Borrowers renewed the Global Credit Facility for a one year term, maturing February 10, 2017, for a total of $2 billion.
Under the terms of the Global Credit Facility, the Fund shall, in addition to interest charged on any borrowings made by the Fund and other costs incurred by the Fund, pay its share of fees and expenses incurred in connection with the implementation and maintenance of the Global Credit Facility, based upon its relative share of the aggregate net assets of all of the Borrowers, including an annual commitment fee of 0.07% based upon the unused portion of the Global Credit Facility. Effective February 12, 2016, the annual commitment fee is 0.15%. These fees are reflected in other expenses in the Statement of Operations. During the year ended December 31, 2015, the Fund did not use the Global Credit Facility.
FRANKLIN TEMPLETON VARIABLE INSURANCE PRODUCTS TRUST
NOTES TO FINANCIAL STATEMENTS
Templeton Growth VIP Fund (continued)
9. Fair Value Measurements
The Fund follows a fair value hierarchy that distinguishes between market data obtained from independent sources (observable inputs) and the Fund’s own market assumptions (unobservable inputs). These inputs are used in determining the value of the Fund’s financial instruments and are summarized in the following fair value hierarchy:
| | • | | Level 1 – quoted prices in active markets for identical financial instruments |
| | • | | Level 2 – other significant observable inputs (including quoted prices for similar financial instruments, interest rates, prepayment speed, credit risk, etc.) |
| | • | | Level 3 – significant unobservable inputs (including the Fund’s own assumptions in determining the fair value of financial instruments) |
The input levels are not necessarily an indication of the risk or liquidity associated with financial instruments at that level.
For movements between the levels within the fair value hierarchy, the Fund has adopted a policy of recognizing the transfers as of the date of the underlying event which caused the movement.
A summary of inputs used as of December 31, 2015, in valuing the Fund’s assets carried at fair value, is as follows:
| | | | | | | | | | | | | | | | |
| | | Level 1 | | | Level 2 | | | Level 3 | | | Total | |
| | | | |
| Assets: | | | | | | | | | | | | | | | | |
Investments in Securities: | | | | | | | | | | | | | | | | |
Equity Investmentsa,b | | $ | 1,418,168,734 | | | $ | — | | | $ | — | | | $ | 1,418,168,734 | |
Short Term Investments | | | 8,864,598 | | | | 24,500,000 | | | | — | | | | 33,364,598 | |
| | | | |
Total Investments in Securities | | $ | 1,427,033,332 | | | $ | 24,500,000 | | | $ | — | | | $ | 1,451,533,332 | |
| | | | |
aIncludes common and preferred stocks.
bFor detailed categories, see the accompanying Statement of Investments.
10. Subsequent Events
The Fund has evaluated subsequent events through the issuance of the financial statements and determined that no events have occurred that require disclosure other than those already disclosed in the financial statements.
Abbreviations
| | |
| Selected Portfolio |
| |
| ADR | | American Depositary Receipt |
| |
| IDR | | International Depositary Receipt |
FRANKLIN TEMPLETON VARIABLE INSURANCE PRODUCTS TRUST
Report of Independent Registered Public Accounting Firm
Templeton Growth VIP Fund
To the Board of Trustees and Shareholders of Franklin Templeton Variable Insurance Products Trust
In our opinion, the accompanying statement of assets and liabilities, including the statement of investments, and the related statements of operations and of changes in net assets and the financial highlights present fairly, in all material respects, the financial position of Templeton Growth VIP Fund (the “Fund”) at December 31, 2015, the results of its operations for the year then ended, the changes in its net assets for each of the two years in the period then ended and the financial highlights for each of the periods presented, in conformity with accounting principles generally accepted in the United States of America. These financial statements and financial highlights (hereafter referred to as “financial statements”) are the responsibility of the Fund’s management. Our responsibility is to express an opinion on these financial statements based on our audit. We conducted our audit of these financial statements in accordance with the standards of the Public Company Accounting Oversight Board (United States). Those standards require that we plan and perform the audit to obtain reasonable assurance about whether the financial statements are free of material misstatement. An audit includes examining, on a test basis, evidence supporting the amounts and disclosures in the financial statements, assessing the accounting principles used and significant estimates made by management, and evaluating the overall financial statement presentation. We believe that our audit, which included confirmation of securities at December 31, 2015 by correspondence with the custodian, transfer agent and brokers, provides a reasonable basis for our opinion.
PricewaterhouseCoopers LLP
San Francisco, California
February 16, 2016
FRANKLIN TEMPLETON VARIABLE INSURANCE PRODUCTS TRUST
Tax Information (unaudited)
Templeton Growth VIP Fund
Under Section 854(b)(1)(A) of the Internal Revenue Code (Code), the Fund hereby reports 23.06% of the ordinary income dividends as income qualifying for the dividends received deduction for the fiscal year ended December 31, 2015.
At December 31, 2015, more than 50% of the Fund’s total assets were invested in securities of foreign issuers. In most instances, foreign taxes were withheld from income paid to the Fund on these investments. The Fund elects to treat foreign taxes paid as allowed under Section 853 of the Code. This election will allow shareholders of record as of the 2016 distribution date, to treat their proportionate share of foreign taxes paid by the Fund as having been paid directly by them. The shareholder shall consider these amounts as foreign taxes paid in the tax year in which they receive the Fund distribution.
FRANKLIN TEMPLETON VARIABLE INSURANCE PRODUCTS TRUST
Index Descriptions
The indexes are unmanaged and include reinvestment of any income or distributions.
For Russell Indexes: Russell Investment Group is the source and owner of the trademarks, service marks and copyrights related to the Russell Indexes. Russell® is a trademark of Russell Investment Group.
See www.franklintempletondatasources.com for additional data provider information.
Barclays 1-3 Month U.S. Treasury Bill Index includes all publicly issued zero-coupon U.S. Treasury bills that have a remaining maturity between one month and three months and are investment-grade rated, U.S. dollar denominated, fixed rate and nonconvertible.
Barclays U.S. Aggregate Bond Index is a market capitalization-weighted index representing the U.S. investment-grade, fixed-rate, taxable bond market with index components for government and corporate, mortgage pass-through and asset-backed securities. All issues included are SEC registered, taxable, dollar denominated and nonconvertible, must have at least one year to final maturity and must be rated investment grade (Baa3/BBB-/BBB- or higher) using the middle rating of Moody’s, Standard & Poor’s and Fitch, respectively.
Barclays U.S. Government Index: Intermediate Component is the intermediate component of the Barclays U.S. Government Index, which includes public obligations of the U.S. Treasury with at least one year to final maturity and publicly issued debt of U.S. government agencies, quasi-federal corporations, and corporate or foreign debt guaranteed by the U.S. government.
Bloomberg Commodity Index comprises exchange-traded futures on physical commodities, which are weighted to account for economic significance and market liquidity.
Citigroup World Government Bond Index is a market capitalization-weighted index consisting of investment-grade world government bond markets.
Consumer Price Index (CPI) is a commonly used measure of the inflation rate.
Credit Suisse (CS) High Yield Index is designed to mirror the investable universe of the U.S. dollar-denominated high yield debt market.
FTSE® EPRA®/NAREIT® Developed Index is a free float-adjusted index designed to measure the performance of publicly traded real estate securities in the North American, European and Asian real estate markets.
J.P. Morgan (JPM) Global Government Bond Index (GGBI) tracks total returns for liquid, fixed-rate, domestic government bonds with maturities greater than one year issued by developed countries globally.
Lipper Multi-Sector Income Funds Classification Average is calculated by averaging the total returns of all funds within the Lipper Multi-Sector Income Funds classification in the Lipper Open-End underlying funds universe. Lipper Multi-Sector Income Funds are defined as funds that seek current income by allocating assets among different fixed income securities sectors (not primarily in one sector except for defensive purposes), including U.S. and foreign governments, with a significant portion rated below investment grade. For the 12-month period ended 12/31/15, there were 286 funds in this category. Lipper calculations do not include contract fees, expenses or sales charges, and may have been different if such charges had been considered.
Lipper VIP Equity Income Funds Classification Average is an equally weighted average calculation of performance figures for all funds within the Lipper Equity Income Funds classification in the Lipper VIP underlying funds universe. Lipper Equity Income Funds seek relatively high current income and growth of income through investing 60% or more of their portfolios in equities. For the 12-month period ended 12/31/15, there were 71 funds in this category. Lipper calculations do not include contract fees, expenses or sales charges, and may have been different if such charges had been considered.
Lipper VIP General U.S. Government Funds Classification Average is an equally weighted average calculation of performance figures for all funds within the Lipper General U.S. Government Funds classification in the Lipper VIP underlying funds universe. Lipper General U.S. Government Funds invest primarily in U.S. government and agency issues. For the 12-month period ended 12/31/15, there were 55 funds in this category. Lipper calculations do not include contract fees, expenses or sales charges, and may have been different if such charges had been considered.
FRANKLIN TEMPLETON VARIABLE INSURANCE PRODUCTS TRUST
INDEX DESCRIPTIONS
Lipper VIP High Yield Funds Classification Average is an equally weighted average calculation of performance figures for all funds within the Lipper High Yield Funds Classification in the Lipper VIP underlying funds universe. Lipper High Yield Funds aim at high (relative) current yield from fixed income securities, have no quality or maturity restrictions, and tend to invest in lower grade debt issues. For the 12-month period ended 12/31/15, there were 111 funds in this category. Lipper calculations do not include contract fees, expenses or sales charges, and may have been different if such charges had been considered.
MSCI All Country World Index (ACWI) is a free float-adjusted, market capitalization-weighted index designed to measure equity market performance in global developed and emerging markets.
MSCI Emerging Markets (EM) Index is a free float-adjusted, market capitalization-weighted index designed to measure equity market performance in global emerging markets.
MSCI Europe, Australasia, Far East (EAFE) Index is a free float-adjusted, market capitalization-weighted index designed to measure equity market performance in global developed markets excluding the U.S. and Canada.
MSCI World Index is a free float-adjusted, market capitalization-weighted index designed to measure equity market performance in global developed markets.
Russell 1000® Growth Index is market capitalization weighted and measures performance of those Russell 1000® Index companies with higher price-to-book ratios and higher forecasted growth values.
Russell 1000® Index is market capitalization weighted and measures performance of the largest companies in the Russell 3000® Index, which represents the majority of the U.S. market’s total capitalization.
Russell 2500TM Index is market capitalization weighted and measures performance of the smallest companies in the Russell 3000® Index, which represent a modest amount of the Russell 3000® Index’s total market capitalization.
Russell 2500 TM Value Index is market capitalization weighted and measures performance of those Russell 2500 TM Index companies with lower price-to-book ratios and lower forecasted growth values.
Russell 3000® Growth Index is market capitalization weighted and measures performance of those Russell 3000® Index companies with higher price-to-book ratios and higher forecasted growth values.
Russell 3000® Index is market capitalization weighted and measures performance of the largest U.S. companies based on total market capitalization and represents the majority of the investable U.S. equity market.
Russell Midcap® Growth Index is market capitalization weighted and measures performance of those Russell Midcap® Index companies with higher price-to-book ratios and higher forecasted growth values.
Russell Midcap® Index is market capitalization weighted and measures performance of the smallest companies in the Russell 1000® Index, which represent a modest amount of the Russell 1000® Index’s total market capitalization.
Standard & Poor’s® 500 Index (S&P 500®) is a market capitalization-weighted index of 500 stocks designed to measure total U.S. equity market performance.
Standard & Poor’s®/International Finance Corporation Investable (S&P/IFCI) Composite Index is a free float-adjusted, market capitalization-weighted index designed to measure equity performance in global emerging markets.
Board Members and Officers
The name, year of birth and address of the officers and board members, as well as their affiliations, positions held with the Trust, principal occupation during at least the past five years and number of portfolios overseen in the Franklin Templeton Investments fund complex, are shown below. Generally, each board member serves until that person’s successor is elected and qualified.
Independent Board Members
| | | | | | | | |
Name, Year of Birth
and Address | | Position | | Length of
Time Served | | Number of Portfolios in
Fund Complex Overseen
by Board Member* | | Other Directorships Held During
at Least the Past 5 Years |
| | | | |
Harris J. Ashton (1932) One Franklin Parkway San Mateo, CA 94403-1906 | | Trustee | | Since 1988 | | 147 | | Bar-S Foods (meat packing company) (1981-2010). |
|
| Principal Occupation During at Least the Past 5 Years: |
| Director of various companies; and formerly, Director, RBC Holdings, Inc. (bank holding company) (until 2002); and President, Chief Executive Officer and Chairman of the Board, General Host Corporation (nursery and craft centers) (until 1998). |
| | | | |
Mary C. Choksi (1950) One Franklin Parkway San Mateo, CA 94403-1906 | | Trustee | | Since 2014 | | 123 | | Avis Budget Group Inc. (car rental) (2007-present), Omnicom Group Inc. (advertising and marketing communications services) (2011-present) and H.J. Heinz Company (processed foods and allied products) (1998-2006). |
|
| Principal Occupation During at Least the Past 5 Years: |
| Senior Advisor, Strategic Investment Group (investment management group) (August 2015-present); director of various companies; and formerly, Founding Partner and Senior Managing Director, Strategic Investment Group (1987-2015); Founding Partner and Managing Director, Emerging Markets Management LLC (investment management firm) (1987-2011); and Loan Officer/Senior Loan Officer/Senior Pension Investment Officer, World Bank Group (international financial institution) (1977-1987). |
| | | | |
Edith E. Holiday (1952) One Franklin Parkway San Mateo, CA 94403-1906 | | Trustee | | Since 2005 | | 147 | | Hess Corporation (exploration and refining of oil and gas) (1993-present), Canadian National Railway (railroad) (2001-present), White Mountains Insurance Group, Ltd. (holding company) (2004-present), RTI International Metals, Inc. (manufacture and distribution of titanium) (1999-2015) and H.J. Heinz Company (processed foods and allied products) (1994-2013). |
|
| Principal Occupation During at Least the Past 5 Years: |
| Director or Trustee of various companies and trusts; and formerly, Assistant to the President of the United States and Secretary of the Cabinet (1990-1993); General Counsel to the United States Treasury Department (1989-1990); and Counselor to the Secretary and Assistant Secretary for Public Affairs and Public Liaison-United States Treasury Department (1988-1989). |
| | | | |
J. Michael Luttig (1954) One Franklin Parkway San Mateo, CA 94403-1906 | | Trustee | | Since 2009 | | 147 | | Boeing Capital Corporation (aircraft financing) (2006-2013). |
|
| Principal Occupation During at Least the Past 5 Years: |
| Executive Vice President, General Counsel and member of the Executive Council, The Boeing Company (aerospace company); and formerly, Federal Appeals Court Judge, U.S. Court of Appeals for the Fourth Circuit (1991-2006). |
Independent Board Members (continued)
| | | | | | | | |
Name, Year of Birth
and Address | | Position | | Length of
Time Served | | Number of Portfolios in
Fund Complex Overseen
by Board Member* | | Other Directorships Held During
at Least the Past 5 Years |
| | | | |
Frank A. Olson (1932) One Franklin Parkway
San Mateo, CA 94403-1906 | | Trustee | | Since 2005 | | 147 | | Hess Corporation (exploration and refining of oil and gas) (1998-2013). |
|
| Principal Occupation During at Least the Past 5 Years: |
| Director of various companies; and formerly, Chairman of the Board, The Hertz Corporation (car rental) (1980-2000) and Chief Executive Officer (1977-1999); and Chairman of the Board, President and Chief Executive Officer, UAL Corporation (airlines) (June – December 1987). |
| | | | |
Larry D. Thompson (1945) One Franklin Parkway San Mateo, CA 94403-1906 | | Trustee | | Since 2007 | | 147 | | The Southern Company (energy company) (2014-present; previously 2010-2012), Graham Holdings Company (education and media organization) (2011-present) and Cbeyond, Inc. (business communications provider) (2010-2012). |
|
| Principal Occupation During at Least the Past 5 Years: |
| Director of various companies; John A. Sibley Professor of Corporate and Business Law, University of Georgia School of Law (January 2015; previously 2011-2012); and formerly, Executive Vice President – Government Affairs, General Counsel and Corporate Secretary, PepsiCo, Inc. (consumer products) (2012-2014); Senior Vice President – Government Affairs, General Counsel and Secretary, PepsiCo, Inc. (2004-2011); Senior Fellow of The Brookings Institution (2003-2004); Visiting Professor, University of Georgia School of Law (2004); and Deputy Attorney General, U.S. Department of Justice (2001-2003). |
| | | | |
John B. Wilson (1959)
One Franklin Parkway San Mateo, CA 94403-1906 | | Lead Independent Trustee | | Trustee since 2007 and Lead Independent Trustee since 2008 | | 123 | | None |
|
| Principal Occupation During at Least the Past 5 Years: |
| President, Staples Europe (office supplies) (2012-present); President and Founder, Hyannis Port Capital, Inc. (real estate and private equity investing); serves on private and non-profit boards; and formerly, Chief Operating Officer and Executive Vice President, Gap, Inc. (retail) (1996-2000); Chief Financial Officer and Executive Vice President – Finance and Strategy, Staples, Inc. (1992-1996); Senior Vice President – Corporate Planning, Northwest Airlines, Inc. (airlines) (1990-1992); and Vice President and Partner, Bain & Company (consulting firm) (1986-1990). |
Interested Board Members and Officers
| | | | | | | | |
Name, Year of Birth
and Address | | Position | | Length of
Time Served | | Number of Portfolios in
Fund Complex Overseen
by Board Member* | | Other Directorships Held During
at Least the Past 5 Years |
| | | | |
**Gregory E. Johnson (1961)
One Franklin Parkway
San Mateo, CA 94403-1906 | | Trustee | | Since 2013 | | 164 | | None |
|
| Principal Occupation During at Least the Past 5 Years: |
| Chairman of the Board, Member – Office of the Chairman, Director and Chief Executive Officer, Franklin Resources, Inc.; officer and/or director or trustee, as the case may be, of some of the other subsidiaries of Franklin Resources, Inc. and of 44 of the investment companies in Franklin Templeton Investments; Vice Chairman, Investment Company Institute; and formerly, President, Franklin Resources, Inc. (1994-2015). |
Interested Board Members and Officers (continued)
| | | | | | | | |
Name, Year of Birth
and Address | | Position | | Length of
Time Served | | Number of Portfolios in
Fund Complex Overseen
by Board Member* | | Other Directorships Held During
at Least the Past 5 Years |
| | | | |
**Rupert H. Johnson, Jr. (1940) One Franklin Parkway San Mateo, CA 94403-1906 | | Chairman of the Board and Trustee | | Chairman of the Board since 2013 and Trustee since 1988 | | 147 | | None |
|
| Principal Occupation During at Least the Past 5 Years: |
| Vice Chairman, Member – Office of the Chairman and Director, Franklin Resources, Inc.; Director, Franklin Advisers, Inc.; Senior Vice President, Franklin Advisory Services, LLC; and officer and/or director or trustee, as the case may be, of some of the other subsidiaries of Franklin Resources, Inc. and of 42 of the investment companies in Franklin Templeton Investments. |
| | | | |
Alison E. Baur (1964) One Franklin Parkway San Mateo, CA 94403-1906 | | Vice President | | Since 2012 | | Not Applicable | | Not Applicable |
|
| Principal Occupation During at Least the Past 5 Years: |
| Deputy General Counsel, Franklin Templeton Investments; and officer of some of the other subsidiaries of Franklin Resources, Inc. and of 44 of the investment companies in Franklin Templeton Investments. |
| | | | |
Laura F. Fergerson (1962) One Franklin Parkway San Mateo, CA 94403-1906 | | Chief Executive Officer – Finance and Administration | | Since 2009 | | Not Applicable | | Not Applicable |
|
| Principal Occupation During at Least the Past 5 Years: |
| Senior Vice President, Franklin Templeton Services, LLC; Vice President, Franklin Advisers, Inc. and Franklin Templeton Institutional, LLC; and officer of 44 of the investment companies in Franklin Templeton Investments. |
| | | | |
Gaston Gardey (1967) One Franklin Parkway San Mateo, CA 94403-1906 | | Treasurer, Chief Financial Officer and Chief Accounting Officer | | Since 2009 | | Not Applicable | | Not Applicable |
|
| Principal Occupation During at Least the Past 5 Years: |
| Treasurer, U.S. Fund Administration & Reporting, Franklin Templeton Investments; and officer of 27 of the investment companies in Franklin Templeton Investments. |
| | | | |
Aliya S. Gordon (1973) One Franklin Parkway San Mateo, CA 94403-1906 | | Vice President | | Since 2009 | | Not Applicable | | Not Applicable |
|
| Principal Occupation During at Least the Past 5 Years: |
| Senior Associate General Counsel, Franklin Templeton Investments; and officer of 44 of the investment companies in Franklin Templeton Investments. |
| | | | |
Steven J. Gray (1955) One Franklin Parkway San Mateo, CA 94403-1906 | | Vice President | | Since 2009 | | Not Applicable | | Not Applicable |
|
| Principal Occupation During at Least the Past 5 Years: |
| Senior Associate General Counsel, Franklin Templeton Investments; Vice President, Franklin Templeton Distributors, Inc. and Franklin Alternative Strategies Advisers, LLC; and officer of 44 of the investment companies in Franklin Templeton Investments. |
Interested Board Members and Officers (continued)
| | | | | | | | |
Name, Year of Birth
and Address | | Position | | Length of
Time Served | | Number of Portfolios in
Fund Complex Overseen
by Board Member* | | Other Directorships Held During
at Least the Past 5 Years |
| | | | |
Selena L. Holmes (1965) 100 Fountain Parkway St. Petersburg, FL 33716-1205 | | Vice President – AML Compliance | | Since 2012 | | Not Applicable | | Not Applicable |
|
| Principal Occupation During at Least the Past 5 Years: |
| Director, Global Compliance Monitoring; Chief Compliance Officer, Franklin Alternative Strategies Advisers, LLC; Vice President, Franklin Templeton Companies, LLC; and officer of 44 of the investment companies in Franklin Templeton Investments. |
| | | | |
Edward B. Jamieson (1948) One Franklin Parkway San Mateo, CA 94403-1906 | | President and Chief Executive Officer – Investment Management | | Since 2010 | | Not Applicable | | Not Applicable |
|
| Principal Occupation During at Least the Past 5 Years: |
| President, Chief Investment Officer and Director, Franklin Advisers, Inc.; Executive Vice President, Franklin Templeton Institutional, LLC; and officer and/or trustee, as the case may be, of some of the other subsidiaries of Franklin Resources, Inc. and of 10 of the investment companies in Franklin Templeton Investments. |
| | | | |
Kimberly H. Novotny (1972)
300 S.E. 2nd Street
Fort Lauderdale, FL 33301-1923 | | Vice President | | Since 2013 | | Not Applicable | | Not Applicable |
|
| Principal Occupation During at Least the Past 5 Years: |
| Associate General Counsel, Franklin Templeton Investments; Vice President, Fiduciary Trust International of the South and Templeton Investment Counsel, LLC; Assistant Secretary, Franklin Resources, Inc.; and officer of 44 of the investment companies in Franklin Templeton Investments. |
| | | | |
Robert C. Rosselot (1960)
300 S.E. 2nd Street
Fort Lauderdale, FL 33301-1923 | | Chief Compliance Officer | | Since 2013 | | Not Applicable | | Not Applicable |
|
| Principal Occupation During at Least the Past 5 Years: |
| Director, Global Compliance, Franklin Templeton Investments; Vice President, Franklin Templeton Companies, LLC; officer of 44 of the investment companies in Franklin Templeton Investments; and formerly, Senior Associate General Counsel, Franklin Templeton Investments (2007-2013); and Secretary and Vice President, Templeton Group of Funds (2004-2013). |
| | | | |
Karen L. Skidmore (1952)
One Franklin Parkway
San Mateo, CA 94403-1906 | | Vice President and Secretary | | Since 2006 | | Not Applicable | | Not Applicable |
|
| Principal Occupation During at Least the Past 5 Years: |
| Senior Associate General Counsel, Franklin Templeton Investments; and officer of 44 of the investment companies in Franklin Templeton Investments. |
| | | | |
Navid Tofigh (1972) One Franklin Parkway San Mateo, CA 94403-1906 | | Vice President | | Since November 2015 | | Not Applicable | | Not Applicable |
|
| Principal Occupation During at Least the Past 5 Years: |
| Associate General Counsel, Franklin Templeton Investments; and officer of 44 of the investment companies in Franklin Templeton Investments. |
Interested Board Members and Officers (continued)
| | | | | | | | |
Name, Year of Birth
and Address | | Position | | Length of
Time Served | | Number of Portfolios in
Fund Complex Overseen
by Board Member* | | Other Directorships Held During
at Least the Past 5 Years |
| | | | |
Craig S. Tyle (1960) One Franklin Parkway San Mateo, CA 94403-1906 | | Vice President | | Since 2005 | | Not Applicable | | Not Applicable |
|
| Principal Occupation During at Least the Past 5 Years: |
| General Counsel and Executive Vice President, Franklin Resources, Inc.; and officer of some of the other subsidiaries of Franklin Resources, Inc. and of 44 of the investment companies in Franklin Templeton Investments. |
| | | | |
Lori A. Weber (1964) 300 S.E. 2nd Street Fort Lauderdale, FL 33301-1923 | | Vice President | | Since 2011 | | Not Applicable | | Not Applicable |
|
| Principal Occupation During at Least the Past 5 Years: |
| Senior Associate General Counsel, Franklin Templeton Investments; Assistant Secretary, Franklin Resources, Inc.; Vice President and Secretary, Templeton Investment Counsel, LLC; and officer of 44 of the investment companies in Franklin Templeton Investments. |
*We base the number of portfolios on each separate series of the U.S. registered investment companies within the Franklin Templeton Investments fund complex. These portfolios have a common investment manager or affiliated investment managers.
**Gregory E. Johnson is considered to be an interested person of the Fund under the federal securities laws due to his position as an officer and director of Franklin Resources, Inc. (Resources), which is the parent company of the Fund’s investment manager and distributor. Rupert H. Johnson, Jr. is considered to be an interested person of the Fund under the federal securities laws due to his position as officer and director and major shareholder of Resources.
Note 1: Rupert H. Johnson, Jr. is the uncle of Gregory E. Johnson.
Note 2: Officer information is current as of the date of this report. It is possible that after this date, information about officers may change.
Note 3: Effective April 30, 2015, Sam Ginn ceased to be a trustee of the Trust.
The Sarbanes-Oxley Act of 2002 and Rules adopted by the Securities and Exchange Commission require the Fund to disclose whether the Fund’s Audit Committee includes at least one member who is an audit committee financial expert within the meaning of such Act and Rules. The Fund’s Board has determined that there is at least one such financial expert on the Audit Committee and has designated John B. Wilson as its audit committee financial expert. The Board believes that Mr. Wilson qualifies as such an expert in view of his extensive business background and experience, including service as chief financial officer of Staples, Inc. from 1992 to 1996. Mr. Wilson has been a Member and Chairman of the Fund’s Audit Committee since 2007. As a result of such background and experience, the Board believes that Mr. Wilson has acquired an understanding of generally accepted accounting principles and financial statements, the general application of such principles in connection with the accounting estimates, accruals and reserves, and analyzing and evaluating financial statements that present a breadth and level of complexity of accounting issues generally comparable to those of the Fund, as well as an understanding of internal controls and procedures for financial reporting and an understanding of audit committee functions. Mr. Wilson is an independent Board member as that term is defined under the relevant Securities and Exchange Commission Rules and Releases.
The Statement of Additional Information (SAI) includes additional information about the board members and is available, without charge, upon request. Shareholders may call (800) 321-8563 or their insurance companies to request the SAI.
FRANKLIN TEMPLETON VARIABLE INSURANCE PRODUCTS TRUST
Shareholder Information
Proxy Voting Policies and Procedures
The Trust’s investment manager has established Proxy Voting Policies and Procedures (Policies) that the Trust uses to determine how to vote proxies relating to portfolio securities. Shareholders may view the Trust’s complete Policies online at franklintempleton.com. Alternatively, shareholders may request copies of the Policies free of charge by calling the Proxy Group collect at (954) 527-7678 or by sending a written request to: Franklin Templeton Companies, LLC, 300 S.E. 2nd Street, Fort Lauderdale, FL 33301, Attention: Proxy Group. Copies of the Trust’s proxy voting records are also made available online at franklintempleton.com and posted on the U.S. Securities and Exchange Commission’s website at sec.gov and reflect the most recent 12-month period ended June 30.
Quarterly Statement of Investments
The Trust files a complete statement of investments with the U.S. Securities and Exchange Commission for the first and third quarters for each fiscal year on Form N-Q. Shareholders may view the filed Form N-Q by visiting the Commission’s website at sec.gov. The filed form may also be viewed and copied at the Commission’s Public Reference Room in Washington, DC. Information regarding the operations of the Public Reference Room may be obtained by calling (800) SEC-0330.
Annual Report
Franklin Templeton
Variable Insurance Products Trust
Investment Managers
Franklin Advisers, Inc.
Franklin Advisory Services, LLC
Franklin Mutual Advisers, LLC
Templeton Asset Management Ltd.
Templeton Global Advisors Limited
Templeton Investment Counsel, LLC
Fund Administrator
Franklin Templeton Services, LLC
Distributor
Franklin Templeton Distributors, Inc.
Franklin Templeton Variable Insurance Products Trust (FTVIP) shares are not offered to the public; they are offered and sold only to:
(1) insurance company separate accounts (Separate Account) to serve as the underlying investment vehicle for variable contracts;
(2) certain qualified plans; and (3) other mutual funds (funds of funds).
Authorized for distribution to investors in Separate Accounts only when accompanied or preceded by the current prospectus for the applicable contract, which includes the Separate Account and the FTVIP prospectuses. Investors should carefully consider a fund’s investment goals, risks, charges and expenses before investing. The prospectus contains this and other information; please read it carefully before investing.
To help ensure we provide you with quality service, all calls to and from our service areas are monitored and/or recorded.
| | |
| ©2016 Franklin Templeton Investments. All rights reserved. | | VIP4 A 02/16 |
| (a) | The Registrant has adopted a code of ethics that applies to its principal executive officers and principal financial and accounting officer. |
| (f) | Pursuant to Item 12(a)(1), the Registrant is attaching as an exhibit a copy of its code of ethics that applies to its principal executive officers and principal financial and accounting officer. |
| Item 3. | Audit Committee Financial Expert. |
| (a) (1) | The Registrant has an audit committee financial expert serving on its audit committee. |
| (2) | The audit committee financial expert is John B. Wilson and he is “independent” as defined under the relevant Securities and Exchange Commission Rules and Releases. |
| Item 4. | Principal Accountant Fees and Services. |
(a) Audit Fees
The aggregate fees paid to the principal accountant for professional services rendered by the principal accountant for the audit of the registrant’s annual financial statements or for services that are normally provided by the principal accountant in connection with statutory and regulatory filings or engagements were $870,366 for the fiscal year ended December 31, 2015 and $903,163 for the fiscal year ended December 31, 2014.
(b) Audit-Related Fees
There were no fees paid to the principal accountant for assurance and related services rendered by the principal accountant to the registrant that are reasonably related to the performance of the audit of the registrant’s financial statements and are not reported under paragraph (a) of Item 4.
There were no fees paid to the principal accountant for assurance and related services rendered by the principal accountant to the registrant’s investment adviser and any entity controlling, controlled by or under common control with the investment adviser that provides ongoing services to the registrant that are reasonably related to the performance of the audit of their financial statements.
(c) Tax Fees
There were no fees paid to the principal accountant for professional services rendered by the principal accountant to the registrant for tax compliance, tax advice and tax planning.
There were no fees paid to the principal accountant for professional services rendered by the principal accountant to the registrant’s
investment adviser and any entity controlling, controlled by or under common control with the investment adviser that provides ongoing services to the registrant for tax compliance, tax advice and tax planning.
The aggregate fees paid to the principal accountant for products and services rendered by the principal accountant to the registrant not reported in paragraphs (a)-(c) of Item 4 were $0 for the fiscal year ended December 31, 2015 and $9,566 for the fiscal year ended December 31, 2014. The services for which these fees were paid include review of materials provided to the fund Board in connection with the investment management contract renewal process.
The aggregate fees paid to the principal accountant for products and services rendered by the principal accountant to the registrant’s investment adviser and any entity controlling, controlled by or under common control with the investment adviser that provides ongoing services to the registrant other than services reported in paragraphs (a)-(c) of Item 4 were $595,846 for the fiscal year ended December 31, 2015 and $195,213 for the fiscal year ended December 31, 2014. The services for which these fees were paid include preparation and review of materials provided to the fund Board in connection with the investment management contract renewal process and derivatives assessment, certifying assets under management, and XBRL tagging on financial statements. Other services include compliance examination for Investment Advisor Act rule 204-2 and 206-4(2) and review of system processes related to fixed income securities.
(e) (1) The registrant’s audit committee is directly responsible for approving the services to be provided by the auditors, including:
(i) pre-approval of all audit and audit related services;
(ii) pre-approval of all non-audit related services to be provided to the Fund by the auditors;
(iii) pre-approval of all non-audit related services to be provided to the registrant by the auditors to the registrant’s investment adviser or to any entity that controls, is controlled by or is under common control with the registrant’s investment adviser and that provides ongoing services to the registrant where the non-audit services relate directly to the operations or financial reporting of the registrant; and
(iv) establishment by the audit committee, if deemed necessary or appropriate, as an alternative to committee pre-approval of services to be provided by the auditors, as required by paragraphs (ii) and (iii) above, of policies and procedures to permit such services to be pre-approved by other means, such as through establishment of guidelines or by action of a designated member or members of the committee; provided the policies and procedures are detailed as to the particular service and the committee is informed of each service and such policies and procedures do not include delegation of audit committee responsibilities, as contemplated under the Securities Exchange Act of 1934, to management; subject, in the case of (ii) through (iv), to any waivers, exceptions or exemptions that may be available under applicable law or rules.
(e) (2) None of the services provided to the registrant described in paragraphs (b)-(d) of Item 4 were approved by the audit committee pursuant to paragraph (c)(7)(i)(C) of Rule 2-01 of regulation S-X.
| (f) | No disclosures are required by this Item 4(f). |
(g) The aggregate non-audit fees paid to the principal accountant for services rendered by the principal accountant to the registrant and the registrant’s investment adviser and any entity controlling, controlled by or under common control with the investment adviser that provides ongoing services to the registrant were $595,846 for the fiscal year ended December 31, 2015 and $204,779 for the fiscal year ended December 31, 2014.
(h) The registrant’s audit committee of the board has considered whether the provision of non-audit services that were rendered to the registrant’s investment adviser (not including any sub-adviser whose role is primarily portfolio management and is subcontracted with or overseen by another investment adviser), and any entity controlling, controlled by, or under common control with the investment adviser that provides ongoing services to the registrant that were not pre-approved pursuant to paragraph (c)(7)(ii) of Rule 2-01 of Regulation S-X is compatible with maintaining the principal accountant’s independence.
| Item 5. | Audit Committee of Listed Registrants. N/A |
| Item 6. | Schedule of Investments. N/A |
| Item 7. | Disclosure of Proxy Voting Policies and Procedures for Closed-End Management Investment Companies. N/A |
| Item 8. | Portfolio Managers of Closed-End Management Investment Companies. N/A |
| Item 9. | Purchases of Equity Securities by Closed-End Management Investment Company and Affiliated Purchasers. N/A |
| Item 10. | Submission of Matters to a Vote of Security Holders. |
There have been no changes to the procedures by which shareholders may recommend nominees to the Registrant’s Board of Trustees that would require disclosure herein.
| Item 11. | Controls and Procedures. |
(a) Evaluation of Disclosure Controls and Procedures. The Registrant maintains disclosure controls and procedures that are designed to ensure that information required to be disclosed in the Registrant’s filings under the Securities Exchange Act of 1934 and the Investment Company Act of 1940 is recorded, processed, summarized and reported within the periods specified in the rules and forms of the Securities and Exchange Commission. Such information is accumulated and communicated to the Registrant’s management, including its principal executive officer and principal financial officer, as appropriate, to allow timely decisions regarding required disclosure. The Registrant’s management, including the principal executive officer and the principal financial officer, recognizes that any set of controls and procedures, no matter how well designed and operated, can provide only reasonable assurance of achieving the desired control objectives.
Within 90 days prior to the filing date of this Shareholder Report on Form N-CSR, the Registrant had carried out an evaluation, under the supervision and with the participation of the Registrant’s management, including the Registrant’s principal executive officer and the Registrant’s principal financial officer, of the effectiveness of the design and operation of the Registrant’s disclosure controls and procedures. Based on such evaluation, the Registrant’s principal executive officer and principal financial officer concluded that the Registrant’s disclosure controls and procedures are effective.
(b) Changes in Internal Controls. There have been no changes in the Registrant’s internal controls or in other factors that could materially affect the internal controls over financial reporting subsequent to the date of their evaluation in connection with the preparation of this Shareholder Report on Form N-CSR.
Item 12. Exhibits.
(a)(1) Code of Ethics
(a)(2) Certifications pursuant to Section 302 of the Sarbanes-Oxley Act of 2002 of Laura F. Fergerson, Chief Executive Officer - Finance and Administration, and Gaston Gardey, Chief Financial Officer and Chief Accounting Officer
(b) Certifications pursuant to Section 906 of the Sarbanes-Oxley Act of 2002 of Laura F. Fergerson, Chief Executive Officer - Finance and Administration, and Gaston Gardey, Chief Financial Officer and Chief Accounting Officer
SIGNATURES
Pursuant to the requirements of the Securities Exchange Act of 1934 and the Investment Company Act of 1940, the registrant has duly caused this report to be signed on its behalf by the undersigned, thereunto duly authorized.
Franklin Templeton Variable Insurance Products Trust
| | |
| By | | /s/ LAURA F. FERGERSON |
| | Laura F. Fergerson |
| | Chief Executive Officer – |
| | Finance and Administration |
| Date February 26, 2016 |
Pursuant to the requirements of the Securities Exchange Act of 1934 and the Investment Company Act of 1940, this report has been signed below by the following persons on behalf of the registrant and in the capacities and on the dates indicated.
| | |
| By | | /s/ LAURA F. FERGERSON |
| | Laura F. Fergerson |
| | Chief Executive Officer – |
| | Finance and Administration |
| Date February 26, 2016 |
| |
| By | | /s/ GASTON GARDEY |
| | Gaston Gardey |
| | Chief Financial Officer and |
| | Chief Accounting Officer |
| Date February 26, 2016 |