UNITED STATES
SECURITIES AND EXCHANGE COMMISSION
Washington, DC 20549
FORM N-CSR
CERTIFIED SHAREHOLDER REPORT OF REGISTERED
MANAGEMENT INVESTMENT COMPANIES
Investment Company Act file number 811-05583
Franklin Templeton Variable Insurance Products Trust
(Exact name of registrant as specified in charter)
One Franklin Parkway, San Mateo, CA 94403-1906
(Address of principal executive offices) (Zip code)
Craig S. Tyle, One Franklin Parkway, San Mateo, CA 94403-1906
(Name and address of agent for service)
Registrant’s telephone number, including area code: (650) 312-2000
Date of fiscal year end: 12/31
Date of reporting period: 12/31/16
| Item 1. | Reports to Stockholders. |
| | |
 | | Annual Report December 31, 2016 |
Franklin Templeton
Variable Insurance Products Trust

Franklin Templeton Variable Insurance
Products Trust Annual Report
*Not part of the annual report. Retain for your records.
| | |
| Not FDIC Insured | May Lose Value | No Bank Guarantee | | |
MASTER CLASS – 2
FRANKLIN TEMPLETON VARIABLE INSURANCE PRODUCTS TRUST
Important Notes to
Performance Information
Performance data is historical and cannot predict or guarantee future results. Principal value and investment return will fluctuate with market conditions, and you may have a gain or loss when you withdraw your money. Inception dates of the funds may have preceded the effective dates of the subaccounts, contracts or their availability in all states.
When reviewing the index comparisons, please keep in mind that indexes have a number of inherent performance differentials over the funds. First, unlike the funds, which must hold a minimum amount of cash to maintain liquidity, indexes do not
have a cash component. Second, the funds are actively managed and, thus, are subject to management fees to cover salaries of securities analysts or portfolio managers in addition to other expenses. Indexes are unmanaged and do not include any commissions or other expenses typically associated with investing in securities. Third, indexes often contain a different mix of securities than the fund to which they are compared. Additionally, please remember that indexes are simply a measure of performance and cannot be invested in directly.
VIP3 SAI5 09/16
SUPPLEMENT DATED SEPTEMBER 28, 2016
TO THE STATEMENT OF ADDITIONAL INFORMATION
DATED MAY 1, 2016
OF
FRANKLIN FLEX CAP GROWTH VIP FUND
FRANKLIN FOUNDING FUNDS ALLOCATION VIP FUND
FRANKLIN GLOBAL REAL ESTATE VIP FUND
FRANKLIN GROWTH AND INCOME VIP FUND
FRANKLIN HIGH INCOME VIP FUND
FRANKLIN INCOME VIP FUND
FRANKLIN LARGE CAP GROWTH VIP FUND
FRANKLIN MUTUAL GLOBAL DISCOVERY VIP FUND
FRANKLIN MUTUAL SHARES VIP FUND
FRANKLIN RISING DIVIDENDS VIP FUND
FRANKLIN SMALL CAP VALUE VIP FUND
FRANKLIN SMALL-MID CAP GROWTH VIP FUND
FRANKLIN STRATEGIC INCOME VIP FUND
FRANKLIN VOLSMART ALLOCATION VIP FUND
TEMPLETON DEVELOPING MARKETS VIP FUND
TEMPLETON FOREIGN VIP FUND
TEMPLETON GLOBAL BOND VIP FUND
TEMPLETON GROWTH VIP FUND
(Series of Franklin Variable Insurance Products Trust)
The Statement of Additional Information is amended as follows:
“The Funds – Goals, Additional Strategies and Risks – Foreign securities” section is revised to add the following after the seventh paragraph:
On June 23, 2016, the United Kingdom voted via referendum to leave the European Union (EU), which immediately led to significant market volatility around the world, as well as political, economic, and legal uncertainty. It is generally expected that the United Kingdom’s exit from the EU will take place within two years after the United Kingdom formally notifies the European Council of its intention to withdraw, but there is still considerable uncertainty relating to the potential consequences and timeframe for the exit. The consequences and timeframe of the exit; how the negotiations for the withdrawal and new trade agreements will be conducted; and whether the United Kingdom’s exit will increase the likelihood of other countries also departing the EU, may increase market volatility across the global economy. During this period of uncertainty, the negative impact on, not only the United Kingdom and European economies, but the broader global economy, could be significant, potentially resulting in increased volatility and illiquidity and lower economic growth for companies that rely significantly on Europe for their business activities and revenues. Any further exits from the EU, or an increase in the belief that such exits are likely or possible, would likely cause additional market disruption globally and introduce new legal and regulatory uncertainties.
Please keep this supplement with your Statement of Additional Information for future reference.
Franklin Flex Cap Growth VIP Fund
This annual report for Franklin Flex Cap Growth VIP Fund covers the fiscal year ended December 31, 2016.
Class 2 Performance Summary as of December 31, 2016
Average annual total return of Class 2 shares* represents the average annual change in value, assuming reinvestment of dividends and capital gains. Average returns smooth out variations in returns, which can be significant; they are not the same as year-by-year results.
| | | | | | | | | | | | |
| Periods ended 12/31/16 | | 1-Year | | | 5-Year | | | 10-Year | |
Average Annual Total Return | | | -2.89% | | | | +10.07% | | | | +5.80% | |
*The Fund has an expense reduction contractually guaranteed through 4/30/17. The Fund also has a fee waiver associated with any investments it makes in a Franklin Templeton money fund and/or other Franklin Templeton fund, contractually guaranteed through its current fiscal year-end. Fund investment results reflect the expense reduction and fee waiver; without these reductions, the results would have been lower.
Performance reflects the Fund’s Class 2 operating expenses, but does not include any contract fees, expenses or sales charges. If they had been included, performance would be lower. These charges and deductions, particularly for variable life policies, can have a significant effect on contract values and insurance benefits. See the contract prospectus for a complete description of these expenses, including sales charges.
Performance data represent past performance, which does not guarantee future results. Investment return and principal value will fluctuate, and you may have a gain or loss when you sell your shares. Current performance may differ from figures shown.
Total Return Index Comparison for a Hypothetical $10,000 Investment (1/1/07–12/31/16)
The graph below shows the change in value of a hypothetical $10,000 investment in the Fund over the indicated period and includes reinvestment of any income or distributions. The Fund’s performance* is compared to the performance of the Russell 1000® Growth Index, the Russell 3000® Growth Index and the Standard & Poors® 500 Index (S&P 500®). One cannot invest directly in an index, and an index is not representative of the Fund’s portfolio. Please see Important Notes to Performance Information preceding the Fund Summaries.
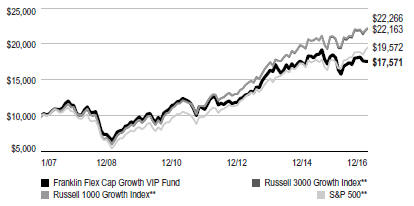
**Source: Morningstar. Please see Index Descriptions following the Fund Summaries.
FRANKLIN FLEX CAP GROWTH VIP FUND
Fund Goal and Main Investments
The Fund seeks capital appreciation. Under normal market conditions, the Fund invests predominantly in equity securities of companies that the investment manager believes have the potential for capital appreciation.
Fund Risks
All investments involve risks, including possible loss of principal. Growth stock prices reflect projections of future earnings or revenues, and can, therefore, fall dramatically if the company fails to meet those projections. Smaller, midsized and relatively new or unseasoned companies can be particularly sensitive to changing economic conditions, and their prospects for growth are less certain than those of larger, more established companies. Historically, these securities have experienced more price volatility than larger company stocks, especially over the short term. To the extent the Fund focuses on particular countries, regions, industries, sectors or types of investment from time to time, it may be subject to greater risk of adverse developments in such areas of focus than a fund that invests in a wider variety of countries, regions, industries, sectors or investments. Foreign securities involve special risks, including currency fluctuations and economic and political uncertainties. The Fund is actively managed but there is no guarantee that the manager’s investment decisions will produce the desired results. The Fund’s prospectus also includes a description of the main investment risks.
Performance Overview
You can find the Fund’s one-year total return in the Performance Summary. In comparison, the Russell 1000® Growth Index generated a +7.08% total return, the Russell 3000® Growth Index delivered a +7.39% total return, and the S&P 500 produced a +11.96% total return for the same period.1
Economic and Market Overview
The U.S. economy expanded during the 12 months under review. The economy grew at a faster pace in 2016’s third quarter than in the second and first quarters, mainly due to personal consumption expenditures, exports, private inventory investment, federal government spending and nonresidential fixed investment. Manufacturing conditions remained volatile but generally expanded, and the services sector also continued
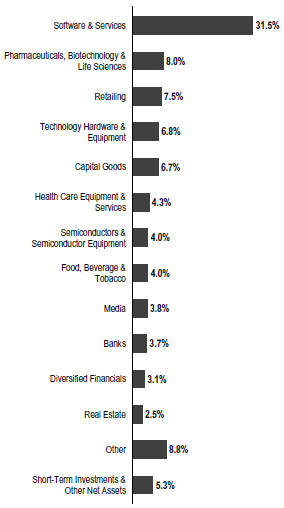
Portfolio Composition
Based on Total Net Assets as of 12/31/16
to grow for most of the period. The unemployment rate decreased from 5.0% in December 2015 to 4.7% at period-end.2 Monthly retail sales grew for most of the review period, and rose to its highest level in April in more than a year, due to a broad-based increase across most retail categories. Inflation, as measured by the Consumer Price Index, remained relatively subdued for most of the period, but rose in 2016’s fourth quarter.
1. Source: Morningstar. One cannot invest directly in an index, and an index is not representative of the Fund’s portfolio. Please see Index Descriptions following the Fund Summaries.
2. Source: Bureau of Labor Statistics.
The dollar value, number of shares or principal amount, and names of all portfolio holdings are listed in the Fund’s Statement of Investments (SOI).
FRANKLIN FLEX CAP GROWTH VIP FUND
After maintaining its target interest rate in the 0.25%–0.50% range for nearly a year, the U.S. Federal Reserve (Fed), at its December meeting, increased its target range for the federal funds rate to 0.50%–0.75%, as policymakers noted improvement in U.S. labor market and inflation. The Federal Open Market Committee also hinted at three additional hikes in 2017. Furthermore, the Fed raised its forecast for 2017 U.S. economic growth, and lowered its unemployment projections.
U.S. equity markets rose during the review period, benefiting from mostly upbeat economic data and better corporate earnings in the U.S., signs of improvement in the Chinese and European economies and ongoing expansionary monetary policies from key central banks. Other contributing factors included investors’ expectations of higher interest rates and inflation in the U.S. driven by hopes of expansionary fiscal policies under the new president Donald Trump, and an Organization of the Petroleum Exporting Countries deal to curb oil production. The Fed’s decision to keep interest rates unchanged at its November meeting further boosted investor confidence. However, the U.K.’s historic vote to leave the European Union (also known as “Brexit”) and global growth concerns weighed on market sentiment. The broad U.S. stock market ended the 12-month period higher, as measured by the S&P 500.
Investment Strategy
We use fundamental, bottom-up research to seek companies meeting our criteria of growth potential, quality and valuation. In seeking sustainable growth characteristics, we look for companies we believe can produce sustainable earnings and cash flow growth, evaluating the long-term market opportunity and competitive structure of an industry to target leaders and emerging leaders. We define quality companies as those with strong and improving competitive positions in attractive markets. We also believe important attributes of quality are experienced and talented management teams as well as financial strength reflected in the capital structure, gross and operating margins, free cash flow generation and returns on capital employed. Our valuation analysis includes a range of potential outcomes based on an assessment of multiple scenarios. In assessing value, we consider whether security prices fully reflect the balance of the sustainable growth opportunities relative to business and financial risks.
Manager’s Discussion
During the year under review, some sectors represented in the Fund’s portfolio delivered positive returns and contributed to absolute performance. Relative to the Russell 3000® Growth Index, stock selection in the real estate sector was a notable
Top 10 Holdings
12/31/16
| | | | |
Company Sector/Industry | | % of Total
Net Assets | |
Facebook Inc. Software & Services | | | 4.8% | |
Amazon.com Inc. Retailing | | | 4.1% | |
Alphabet Inc. Software & Services | | | 4.0% | |
Microsoft Corp. Software & Services | | | 3.7% | |
Mastercard Inc. Software & Services | | | 3.6% | |
Celgene Corp. Pharmaceuticals, Biotechnology & Life Sciences | | | 3.1% | |
Apple Inc. Technology Hardware & Equipment | | | 2.7% | |
Signature Bank Banks | | | 2.5% | |
Constellation Brands Inc. Food, Beverage & Tobacco | | | 2.4% | |
ServiceNow Inc. Software & Services | | | 2.4% | |
contributor. A slightly favorable overweighted position in energy also aided the Fund’s performance.
Within real estate, data center provider Equinix benefited from trends toward hybrid cloud architecture for enterprises. The company also benefited from the strong growth of cloud computing technology. Equinix made several acquisitions in 2016 including Bit-Isle and data center and colocation center company TelecityGroup, which have expanded its global footprint. Additionally, Equinix recently announced a deal to acquire Verizon’s datacenters.
In energy, shares of independent oil and gas company Cabot Oil & Gas performed well mostly in the beginning of the year as natural gas prices recovered from last winter’s record warmth. Cabot was also able to generate free cash flow during the middle part of the year when natural gas prices were lowest, demonstrating its position as the lowest cost U.S. natural gas producer. Finally, the presidential election victory by Donald Trump appeared to remove some market risk that Cabot’s new natural gas pipelines would be delayed indefinitely. At year-end, the Federal Energy Regulatory Commission approved the environmental permit for its Atlantic Sunrise pipeline, which now looks to come online in 2018 and should help Cabot move stranded, low-priced natural gas out of Appalachia and into higher priced end markets in the Southeast, thereby
FRANKLIN FLEX CAP GROWTH VIP FUND
improving its pricing and enabling higher-than-expected volume growth.
Other notable contributors to the Fund’s relative performance included HD Supply Holdings, NXP Semiconductors (sold by period-end) and SVB Financial Group. Construction and industrial products distributor HD Supply Holdings posted solid gains in 2016 due to strong performance in non-residential construction, their primary end market. The company outperformed the market and increased profit margins on an overall company level. Activism in shares led to strong performance in the fourth quarter of 2016. In information technology (IT), NXP Semiconductors outperformed the general market and most technology stocks in 2016. Early in the year, NXP’s outperformance was driven by better-than-expected results and growth from its acquisition of Freescale Semiconductor, which closed early December. Later in the year, NXP shares advanced, as speculation was followed by Qualcomm making an acquisition bid for NXP shares. The transaction is expected to close by the end of 2017. In the financials sector, shares of financial services provider and bank SVP Financial Group contributed to the Fund’s relative performance. As one of the most asset-sensitive bank stocks, it benefited more than others from post-election expectations for higher interest rates.
Conversely, key detractors from the Fund’s relative performance included stock selection in the IT, health care and consumer discretionary sectors.3 Within IT, network security solutions provider Palo Alto Networks, cloud-based solutions provider ServiceNow and public sector integrated technology and management services provider Tyler Technologies hurt the Fund’s performance. Palo Alto Networks experienced difficulties during the period when investors became concerned about slowing product revenue growth and the impact of a public cloud on the company’s long-term growth potential. Nevertheless, given the growing importance of cyber security and Palo Alto’s differentiated platform offering, we believe that spending trends could re-accelerate over the next few quarters and we find the company’s valuation compelling at current levels. ServiceNow underperformed over the past year as higher valuation stocks were pressured in the wake of expectations for increased interest rates. However, we are optimistic about ServiceNow’s emerging platform opportunity and the growth the company is seeing outside of its first IT service management market. Shares of Tyler Technologies
declined early in the year after poor quarters from LinkedIn and Tableau Software caused the whole software sector to sell off. The stock rallied back throughout the year, but was later pressured due to an acquisition that did not lead to as much growth as anticipated. Most recently, media reports citing issues related to Tyler’s civil and criminal court case management software led to investor concern.
In health care, holdings that hurt the Fund’s relative performance included health services and information technology company McKesson (sold by period-end) and pharmaceutical firm Regeneron. During the year, McKesson’s stock performed poorly due to heightened concerns about intensifying competition among drug distributors, as well as concerns on moderating drug price inflation and its effects on the company’s distribution business model. Most of the decline for Regeneron happened early in the year in conjunction with a sector sell-off. Other factors also include higher-than-expected spending, mostly in research and development, which caused downward revisions in earnings per share estimates, and a disappointing initial launch for cholesterol-fighting drug Praluent. Disappointing product news also hurt Regeneron’s stock including the Food & Drug Administration rejecting Sarilumab, Rinucumab failing its phase II trials and losing a patent suit brought by Amgen against praluent.
Within the consumer discretionary sector, footwear, apparel and equipment manufacturer Nike detracted from Fund performance. Nike’s shares declined as a function of lower-than-expected revenue and operating profits achieved as a result of retailer bankruptcies and port delays, which caused inventory disruptions and higher-than-usual promotions leading to lower profit margins. Another factor, to a smaller extent, was the negative impact of increased competition in basketball and casual footwear. However, we believe Nike’s innovation pipeline continues to be strong and margins could start to expand once again benefiting from the innovation in manufacturing and Nike’s pricing power.
Thank you for your participation in Franklin Flex Cap Growth VIP Fund. We look forward to serving your future investment needs.
3. The IT sector comprises semiconductors and semiconductor equipment; software and services; and technology hardware and equipment in the SOI. The health care sector comprises health care equipment and services; and pharmaceuticals, biotechnology and life sciences in the SOI. The consumer discretionary sector comprises automobiles and components; consumer durables and apparel; consumer services; media; and retailing in the SOI.
FRANKLIN FLEX CAP GROWTH VIP FUND
The foregoing information reflects our analysis, opinions and portfolio holdings as of December 31, 2016, the end of the reporting period. The way we implement our main investment strategies and the resulting portfolio holdings may change depending on factors such as market and economic conditions. These opinions may not be relied upon as investment advice or an offer for a particular security. The information is not a complete analysis of every aspect of any market, state, industry, security or the Fund. Statements of fact are from sources considered reliable, but the investment manager makes no representation or warranty as to their completeness or accuracy. Although historical performance is no guarantee of future results, these insights may help you understand our investment management philosophy.
FRANKLIN FLEX CAP GROWTH VIP FUND
Class 2 Fund Expenses
As an investor in a variable insurance contract (Contract) that indirectly provides for investment in an underlying mutual fund, you can incur transaction and/or ongoing expenses at both the Fund level and the Contract Level: (1) transaction expenses can include sales charges (loads) on purchases, surrender fees, transfer fees and premium taxes; and (2) ongoing expenses can include management fees, distribution and service (12b-1) fees, contract fees, annual maintenance fees, mortality and expense risk fees and other fees and expenses. All mutual funds and Contracts have some types of ongoing expenses. The table below shows Fund-level ongoing expenses and can help you understand these costs and compare them with those of other mutual funds offered through the Contract. The table assumes a $1,000 investment held for the six months indicated. Please refer to the Fund prospectus for additional information on operating expenses.
Actual Fund Expenses
The table below provides information about the actual account values and actual expenses in the columns under the heading “Actual.” In these columns the Fund’s actual return, which includes the effect of ongoing Fund expenses but does not include the effect of ongoing Contract expenses, is used to calculate the “Ending Account Value.”
You can estimate the Fund-level expenses you paid during the period by following these steps (of course, your account value and expenses will differ from those in this illustration):
| | Divide your account value by $1,000
(if your account had an $8,600 value,
then $8,600 ÷ $1,000 = 8.6). |
| | Then multiply the result by the number under the headings “Actual” and “Fund-Level Expenses Paid During Period”
(if Fund-Level Expenses Paid During Period were $7.50,
then 8.6 x $7.50 = $64.50). |
In this illustration, the estimated expenses paid this period at the Fund level are $64.50.
Hypothetical Example for Comparison
with Other Mutual Funds
Under the heading “Hypothetical” in the table, information is provided about hypothetical account values and hypothetical expenses based on the Fund’s actual expense ratio and an assumed rate of return of 5% per year before expenses, which is not the Fund’s actual return. This information may not be used to estimate the actual ending account balance or expenses you paid for the period, but it can help you compare ongoing costs of investing in the Fund with those of other mutual funds offered through the Contract. To do so, compare this 5% hypothetical example with the 5% hypothetical examples that appear in the shareholder reports of other funds offered through the Contract.
Please note that expenses shown in the table are meant to highlight ongoing costs at the Fund level only and do not reflect any ongoing expenses at the Contract level, or transaction expenses at either the Fund or Contract levels. In addition, while the Fund does not have transaction expenses, if the transaction and ongoing expenses at the Contract level were included, the expenses shown below would be higher. You should consult your Contract prospectus or disclosure document for more information.
| | | | | | | | | | | | | | | | | | | | | | | | |
| | | | | | Actual
(actual return after expenses) | | | Hypothetical
(5% annual return before expenses) | | | | |
| Share Class | |
| Beginning Account
Value 7/1/16 |
| |
| Ending Account
Value 12/31/16 |
| |
| Fund-Level
Expenses Paid
During Period7/1/16–12/31/16 |
1,2 | |
| Ending Account
Value 12/31/16 |
| |
| Fund-Level
Expenses Paid
During Period7/1/16–12/31/16 |
1,2 | |
| Net
Annualized
Expense
Ratio |
2 |
Class 2 | | | $1,000 | | | | $1,026.10 | | | | $4.89 | | | | $1,020.31 | | | | $4.88 | | | | 0.96% | |
1. Expenses are equal to the annualized expense ratio for the six-month period as indicated above — in the far right column — multiplied by the simple average account value over the period indicated, and then multiplied by 184/366 to reflect the one-half year period.
2. Reflects expenses after fee waivers and expense reimbursements. Does not include any ongoing expenses of the Contract for which the Fund is an investment option or acquired fund fees and expenses.
FRANKLIN TEMPLETON VARIABLE INSURANCE PRODUCTS TRUST
Financial Highlights
Franklin Flex Cap Growth VIP Fund
| | | | | | | | | | | | | | | | | | | | |
| | | Year Ended December 31, | |
| | | 2016 | | | 2015 | | | 2014 | | | 2013 | | | 2012 | |
| Class 2 | | | | | | | | | | | | | | | | | | | | |
Per share operating performance
(for a share outstanding throughout the year) | | | | | | | | | | | | | | | | | | | | |
| | | | | |
Net asset value, beginning of year | | | $7.09 | | | | $16.61 | | | | $18.11 | | | | $13.21 | | | | $12.09 | |
| | | | |
| | | | | |
| Income from investment operationsa: | | | | | | | | | | | | | | | | | | | | |
| | | | | |
Net investment income (loss)b | | | (0.03 | ) | | | (0.06 | ) | | | (0.08 | ) | | | (0.01 | ) | | | 0.01 | |
| | | | | |
Net realized and unrealized gains (losses) | | | (0.20 | ) | | | 1.00 | | | | 1.09 | | | | 4.95 | | | | 1.11 | |
| | | | |
Total from investment operations | | | (0.23 | ) | | | 0.94 | | | | 1.01 | | | | 4.94 | | | | 1.12 | |
| | | | |
| | | | | |
| Less distributions from: | | | | | | | | | | | | | | | | | | | | |
| | | | | |
Net investment income | | | — | | | | — | | | | — | | | | (— | )c | | | — | |
| | | | | |
Net realized gains | | | (0.97 | ) | | | (10.46 | ) | | | (2.51 | ) | | | (0.04 | ) | | | — | |
| | | | |
Total distributions | | | (0.97 | ) | | | (10.46 | ) | | | (2.51 | ) | | | (0.04 | ) | | | — | |
| | | | |
Net asset value, end of year | | | $5.89 | | | | $7.09 | | | | $16.61 | | | | $18.11 | | | | $13.21 | |
| | | | |
| | | | | |
Total returnd | | | (2.89)% | | | | 4.37% | | | | 6.11% | | | | 37.48% | | | | 9.26% | |
| | | | | |
| Ratios to average net assets | | | | | | | | | | | | | | | | | | | | |
| | | | | |
Expenses before waiver and payments by affiliates | | | 1.36% | | | | 1.33% | | | | 1.20% | | | | 1.18% | | | | 1.18% | |
| | | | | |
Expenses net of waiver and payments by affiliates | | | 0.96% | | | | 0.96% | | | | 0.95% | | | | 0.93% | | | | 0.93% | |
| | | | | |
Net investment income (loss) | | | (0.44)% | | | | (0.62)% | | | | (0.46)% | | | | (0.09)% | | | | 0.09% | |
| | | | | |
| Supplemental data | | | | | | | | | | | | | | | | | | | | |
| | | | | |
Net assets, end of year (000’s) | | | $73,337 | | | | $82,901 | | | | $93,354 | | | | $169,123 | | | | $159,122 | |
| | | | | |
Portfolio turnover rate | | | 17.76% | | | | 88.15% | | | | 52.83% | | | | 52.15% | | | | 43.50% | |
aThe amount shown for a share outstanding throughout the period may not correlate with the Statement of Operations for the period due to the timing of sales and repurchases of the Fund’s shares in relation to income earned and/or fluctuating fair value of the investments of the Fund.
bBased on average daily shares outstanding.
cAmount rounds to less than $0.01 per share.
dTotal return does not include fees, charges or expenses imposed by the variable annuity and life insurance contracts for which Franklin Templeton Variable Insurance Products Trust serves as an underlying investment vehicle.
| | | | | | |
| | | The accompanying notes are an integral part of these financial statements. | Annual Report | | | FFC-7 | |
FRANKLIN TEMPLETON VARIABLE INSURANCE PRODUCTS TRUST
FINANCIAL HIGHLIGHTS
Franklin Flex Cap Growth VIP Fund (continued)
| | | | | | | | | | | | | | | | | | | | |
| | | Year Ended December 31, | |
| | | 2016 | | | 2015 | | | 2014 | | | 2013 | | | 2012 | |
| Class 4 | | | | | | | | | | | | | | | | | | | | |
Per share operating performance (for a share outstanding throughout the year) | | | | | | | | | | | | | | | | | | | | |
| | | | | |
Net asset value, beginning of year | | | $6.90 | | | | $16.44 | | | | $17.96 | | | | $13.12 | | | | $12.01 | |
| | | | |
| | | | | |
| Income from investment operationsa: | | | | | | | | | | | | | | | | | | | | |
| | | | | |
Net investment income (loss)b | | | (0.03 | ) | | | (0.07 | ) | | | (0.10 | ) | | | (0.03 | ) | | | (— | )c |
| | | | | |
Net realized and unrealized gains (losses) | | | (0.20 | ) | | | 0.99 | | | | 1.09 | | | | 4.91 | | | | 1.11 | |
| | | | |
Total from investment operations | | | (0.23 | ) | | | 0.92 | | | | 0.99 | | | | 4.88 | | | | 1.11 | |
| | | | |
Less distributions from net realized gains | | | (0.97 | ) | | | (10.46 | ) | | | (2.51 | ) | | | (0.04 | ) | | | — | |
| | | | |
Net asset value, end of year. | | | $5.70 | | | | $6.90 | | | | $16.44 | | | | $17.96 | | | | $13.12 | |
| | | | |
| | | | | |
Total returnd | | | (2.98)% | | | | 4.32% | | | | 5.98% | | | | 37.28% | | | | 9.24% | |
| | | | | |
| Ratios to average net assets | | | | | | | | | | | | | | | | | | | | |
| | | | | |
Expenses before waiver and payments by affiliates | | | 1.46% | | | | 1.43% | | | | 1.30% | | | | 1.28% | | | | 1.28% | |
| | | | | |
Expenses net of waiver and payments by affiliates | | | 1.06% | | | | 1.06% | | | | 1.05% | | | | 1.03% | | | | 1.03% | |
| | | | | |
Net investment income (loss) | | | (0.54)% | | | | (0.72)% | | | | (0.56)% | | | | (0.19)% | | | | (0.01)% | |
| | | | | |
| Supplemental data | | | | | | | | | | | | | | | | | | | | |
| | | | | |
Net assets, end of year (000’s) | | | $27,163 | | | | $34,479 | | | | $31,355 | | | | $251,339 | | | | $216,607 | |
| | | | | |
Portfolio turnover rate | | | 17.76% | | | | 88.15% | | | | 52.83% | | | | 52.15% | | | | 43.50% | |
aThe amount shown for a share outstanding throughout the period may not correlate with the Statement of Operations for the period due to the timing of sales and repurchases of the Fund’s shares in relation to income earned and/or fluctuating fair value of the investments of the Fund.
bBased on average daily shares outstanding.
cAmount rounds to less than $0.01 per share.
dTotal return does not include fees, charges or expenses imposed by the variable annuity and life insurance contracts for which Franklin Templeton Variable Insurance Products Trust serves as an underlying investment vehicle.
| | | | |
| FFC-8 | | Annual Report | The accompanying notes are an integral part of these financial statements. | | |
FRANKLIN TEMPLETON VARIABLE INSURANCE PRODUCTS TRUST
Statement of Investments, December 31, 2016
| | | | | | | | | | |
Franklin Flex Cap Growth VIP Fund | |
| | | | | Shares | | | Value | |
| | | Common Stocks 94.7% | | | | | | |
| | | Automobiles & Components 0.6% | | | | | | |
| a,b | | Tesla Motors Inc. | | | 2,700 | | | $ | 576,963 | |
| | | | | | | | | | |
| | | Banks 3.7% | | | | | | |
| a | | Signature Bank | | | 17,000 | | | | 2,553,400 | |
| a | | SVB Financial Group | | | 7,000 | | | | 1,201,620 | |
| | | | | | | | | | |
| | | | | | | | | 3,755,020 | |
| | | | | | | | | | |
| | | Capital Goods 6.7% | | | | | | |
| | Fortive Corp. | | | 20,000 | | | | 1,072,601 | |
| | Fortune Brands Home & Security Inc. | | | 27,000 | | | | 1,443,420 | |
| a | | HD Supply Holdings Inc. | | | 54,000 | | | | 2,295,540 | |
| | Honeywell International Inc. | | | 7,500 | | | | 868,875 | |
| | Roper Technologies Inc. | | | 5,590 | | | | 1,023,417 | |
| | | | | | | | | | |
| | | | | | | | | 6,703,853 | |
| | | | | | | | | | |
| | Commercial & Professional Services 1.5% | | | | | | | | |
| a | | IHS Markit Ltd. | | | 33,787 | | | | 1,196,398 | |
| a | | Stericycle Inc. | | | 4,000 | | | | 308,160 | |
| | | | | | | | | | |
| | | | | | | | | 1,504,558 | |
| | | | | | | | | | |
| | | Consumer Durables & Apparel 1.5% | | | | | | |
| | NIKE Inc., B | | | 30,000 | | | | 1,524,900 | |
| | | | | | | | | | |
| | | Consumer Services 1.9% | | | | | | |
| | Starbucks Corp. | | | 35,000 | | | | 1,943,200 | |
| | | | | | | | | | |
| | | Diversified Financials 3.1% | | | | | | |
| a | | Affiliated Managers Group Inc. | | | 6,000 | | | | 871,800 | |
| | Intercontinental Exchange Inc. | | | 27,500 | | | | 1,551,550 | |
| a | | PRA Group Inc. | | | 16,500 | | | | 645,150 | |
| | | | | | | | | | |
| | | | | | | | | 3,068,500 | |
| | | | | | | | | | |
| | | Energy 1.2% | | | | | | |
| | Cabot Oil & Gas Corp., A | | | 50,000 | | | | 1,168,000 | |
| | | | | | | | | | |
| | | Food, Beverage & Tobacco 4.0% | | | | | | |
| | Constellation Brands Inc., A | | | 16,000 | | | | 2,452,960 | |
| a | | Monster Beverage Corp. | | | 36,000 | | | | 1,596,240 | |
| | | | | | | | | | |
| | | | | | | | | 4,049,200 | |
| | | | | | | | | | |
| | | Health Care Equipment & Services 4.3% | | | | | | |
| a | | Cerner Corp. | | | 13,500 | | | | 639,495 | |
| a | | DexCom Inc. | | | 7,500 | | | | 447,750 | |
| a | | Edwards Lifesciences Corp. | | | 18,000 | | | | 1,686,600 | |
| | Medtronic PLC | | | 14,000 | | | | 997,220 | |
| a | | Nevro Corp. | | | 7,000 | | | | 508,620 | |
| | | | | | | | | | |
| | | | | | | | | 4,279,685 | |
| | | | | | | | | | |
| | | Materials 1.7% | | | | | | |
| | Ecolab Inc. | | | 14,500 | | | | 1,699,690 | |
| | | | | | | | | | |
| | | Media 3.8% | | | | | | |
| a | | Charter Communications Inc., A | | | 3,616 | | | | 1,041,119 | |
| a | | IMAX Corp. | | | 25,500 | | | | 800,700 | |
| | The Walt Disney Co. | | | 18,500 | | | | 1,928,070 | |
| | | | | | | | | | |
| | | | | | | | | 3,769,889 | |
| | | | | | | | | | |
FRANKLIN TEMPLETON VARIABLE INSURANCE PRODUCTS TRUST
STATEMENT OF INVESTMENTS
Franklin Flex Cap Growth VIP Fund (continued)
| | | | | | | | | | |
| | | | | Shares | | | Value | |
| | | Common Stocks (continued) | | | | | | |
| | | Pharmaceuticals, Biotechnology & Life Sciences 8.0% | | | | | | |
| a | | Allergan PLC | | | 3,500 | | | $ | 735,035 | |
| a | | Biogen Inc. | | | 4,000 | | | | 1,134,320 | |
| | Bristol-Myers Squibb Co. | | | 22,500 | | | | 1,314,900 | |
| a | | Celgene Corp. | | | 26,500 | | | | 3,067,375 | |
| a | | Illumina Inc. | | | 3,600 | | | | 460,944 | |
| a | | Regeneron Pharmaceuticals Inc. | | | 3,000 | | | | 1,101,270 | |
| a | | Revance Therapeutics Inc. | | | 11,000 | | | | 227,700 | |
| | | | | | | | | | |
| | | | | | | | | 8,041,544 | |
| | | | | | | | | | |
| | | Real Estate 2.5% | | | | | | |
| | American Tower Corp. | | | 10,500 | | | | 1,109,640 | |
| | Equinix Inc. | | | 4,000 | | | | 1,429,640 | |
| | | | | | | | | | |
| | | | | | | | | 2,539,280 | |
| | | | | | | | | | |
| | | Retailing 7.5% | | | | | | |
| | Advance Auto Parts Inc. | | | 4,500 | | | | 761,040 | |
| a | | Amazon.com Inc. | | | 5,500 | | | | 4,124,285 | |
| a | | The Priceline Group Inc. | | | 1,350 | | | | 1,979,181 | |
| | Tractor Supply Co. | | | 8,850 | | | | 670,919 | |
| | | | | | | | | | |
| | | | | | | | | 7,535,425 | |
| | | | | | | | | | |
| | | Semiconductors & Semiconductor Equipment 4.0% | | | | | | |
| | Analog Devices Inc. | | | 30,000 | | | | 2,178,600 | |
| a | | Cavium Inc. | | | 10,000 | | | | 624,400 | |
| a | | MACOM Technology Solutions Holdings Inc. | | | 17,500 | | | | 809,900 | |
| a | | Nanometrics Inc. | | | 17,490 | | | | 438,299 | |
| | | | | | | | | | |
| | | | | | | | | 4,051,199 | |
| | | | | | | | | | |
| | | Software & Services 31.5% | | | | | | |
| a | | Alphabet Inc., C | | | 5,250 | | | | 4,052,055 | |
| a | | CoStar Group Inc. | | | 5,000 | | | | 942,450 | |
| a | | Electronic Arts Inc. | | | 16,000 | | | | 1,260,160 | |
| a | | Ellie Mae Inc. | | | 6,000 | | | | 502,080 | |
| a | | Envestnet Inc. | | | 9,446 | | | | 332,971 | |
| a | | EPAM Systems Inc. | | | 12,000 | | | | 771,720 | |
| a | | Facebook Inc., A | | | 42,000 | | | | 4,832,100 | |
| a | | FleetCor Technologies Inc. | | | 10,000 | | | | 1,415,200 | |
| | Mastercard Inc., A | | | 35,000 | | | | 3,613,750 | |
| | Microsoft Corp. | | | 60,000 | | | | 3,728,400 | |
| a | | Mobileye NV (Israel) | | | 15,000 | | | | 571,800 | |
| a | | Paylocity Holding Corp. | | | 30,000 | | | | 900,300 | |
| a | | PTC Inc. | | | 1,000 | | | | 46,270 | |
| a | | Salesforce.com Inc. | | | 27,500 | | | | 1,882,650 | |
| a | | ServiceNow Inc. | | | 32,500 | | | | 2,416,050 | |
| a | | Tyler Technologies Inc. | | | 11,000 | | | | 1,570,470 | |
| | Visa Inc., A | | | 26,500 | | | | 2,067,530 | |
| a | | Zendesk Inc. | | | 35,000 | | | | 742,000 | |
| | | | | | | | | | |
| | | | | | | | | 31,647,956 | |
| | | | | | | | | | |
| | | Technology Hardware & Equipment 6.8% | | | | | | |
| | Apple Inc. | | | 23,500 | | | | 2,721,770 | |
| | Harris Corp. | | | 22,500 | | | | 2,305,575 | |
| a | | Palo Alto Networks Inc. | | | 14,500 | | | | 1,813,225 | |
| | | | | | | | | | |
| | | | | | | | | 6,840,570 | |
| | | | | | | | | | |
FRANKLIN TEMPLETON VARIABLE INSURANCE PRODUCTS TRUST
STATEMENT OF INVESTMENTS
Franklin Flex Cap Growth VIP Fund (continued)
| | | | | | | | | | |
| | | | | Shares | | | Value | |
| | Common Stocks (continued) | | | | | | | | |
| | | Transportation 0.4% | | | | | | |
| a | | Spirit Airlines Inc. | | | 7,770 | | | $ | 449,572 | |
| | | | | | | | | | |
| | | |
| | Total Common Stocks (Cost $59,645,442) | | | | | | | 95,149,004 | |
| | | | | | | | | | |
| | Short Term Investments 6.0% | | | | | | | | |
| | | Money Market Funds (Cost $5,497,919) 5.5% | | | | | | |
| c,d | | Institutional Fiduciary Trust Money Market Portfolio, 0.09% | | | 5,497,919 | | | | 5,497,919 | |
| | | | | | | | | | |
| e | | Investments from Cash Collateral Received for Loaned Securities (Cost $547,500) 0.5% | | | | | | | | |
| | | Money Market Funds 0.5% | | | | | | |
| c,d | | Institutional Fiduciary Trust Money Market Portfolio, 0.09% | | | 547,500 | | | | 547,500 | |
| | | | | | | | | | |
| | Total Investments (Cost $65,690,861) 100.7% | | | | | | | 101,194,423 | |
| | Other Assets, less Liabilities (0.7)% | | | | | | | (694,829 | ) |
| | | | | | | | | | |
| | Net Assets 100.0% | | | | | | $ | 100,499,594 | |
| | | | | | | | | | |
aNon-income producing.
bA portion or all of the security is on loan at December 31, 2016. See Note 1(b).
cSee Note 3(e) regarding investments in affiliated management investment companies.
dThe rate shown is the annualized seven-day yield at period end.
eSee Note 1(b) regarding securities on loan.
| | | | | | |
| | | The accompanying notes are an integral part of these financial statements. | Annual Report | | | FFC-11 | |
FRANKLIN TEMPLETON VARIABLE INSURANCE PRODUCTS TRUST
Financial Statements
Statement of Assets and Liabilities
December 31, 2016
| | | | |
| | | Franklin Flex
Cap Growth
VIP Fund | |
Assets: | | | | |
Investments in securities: | | | | |
Cost - Unaffiliated issuers | | $ | 59,645,442 | |
Cost - Non-controlled affiliates (Note 3e) | | | 6,045,419 | |
| | | | |
Total cost of investments | | $ | 65,690,861 | |
| | | | |
Value - Unaffiliated issuers | | $ | 95,149,004 | |
Value - Non-controlled affiliates (Note 3e) | | | 6,045,419 | |
| | | | |
Total value of investments (includes securities loaned in the amount of $534,225) | | | 101,194,423 | |
Receivables: | | | | |
Capital shares sold | | | 37,195 | |
Dividends and interest | | | 38,602 | |
Other assets | | | 9 | |
| | | | |
Total assets | | | 101,270,229 | |
| | | | |
Liabilities: | | | | |
Payables: | | | | |
Capital shares redeemed | | | 56,142 | |
Management fees | | | 56,188 | |
Distribution fees | | | 47,377 | |
Payable upon return of securities loaned | | | 547,500 | |
Accrued expenses and other liabilities | | | 63,428 | |
| | | | |
Total liabilities | | | 770,635 | |
| | | | |
Net assets, at value | | $ | 100,499,594 | |
| | | | |
Net assets consist of: | | | | |
Paid-in capital | | $ | 65,139,844 | |
Net unrealized appreciation (depreciation) | | | 35,503,562 | |
Accumulated net realized gain (loss) | | | (143,812 | ) |
| | | | |
Net assets, at value | | $ | 100,499,594 | |
| | | | |
| |
| Class 2: | | | | |
Net assets, at value | | $ | 73,336,887 | |
| | | | |
Shares outstanding | | | 12,449,117 | |
| | | | |
Net asset value and maximum offering price per share | | $ | 5.89 | |
| | | | |
| |
| Class 4: | | | | |
Net assets, at value | | $ | 27,162,707 | |
| | | | |
Shares outstanding | | | 4,765,190 | |
| | | | |
Net asset value and maximum offering price per share | | $ | 5.70 | |
| | | | |
| | | | |
| FFC-12 | | Annual Report | The accompanying notes are an integral part of these financial statements. | | |
FRANKLIN TEMPLETON VARIABLE INSURANCE PRODUCTS TRUST
FINANCIAL STATEMENTS
Statement of Operations
for the year ended December 31, 2016
| | | | |
| | | Franklin Flex
Cap Growth
VIP Fund | |
Investment income: | | | | |
Dividends: | | | | |
Unaffiliated issuers | | $ | 525,024 | |
Non-controlled affiliates (Note 3e) | | | 252 | |
Income from securities loaned (net of fees and rebates) | | | 7,860 | |
| | | | |
Total investment income | | | 533,136 | |
| | | | |
Expenses: | | | | |
Management fees (Note 3a) | | | 1,027,697 | |
Distribution fees: (Note 3c) | | | | |
Class 2 | | | 181,304 | |
Class 4 | | | 107,104 | |
Custodian fees (Note 4) | | | 1,125 | |
Reports to shareholders | | | 60,811 | |
Professional fees | | | 40,993 | |
Trustees’ fees and expenses | | | 504 | |
Other | | | 9,071 | |
| | | | |
Total expenses | | | 1,428,609 | |
Expenses waived/paid by affiliates (Note 3e and 3f) | | | (407,625 | ) |
| | | | |
Net expenses | | | 1,020,984 | |
| | | | |
Net investment income (loss) | | | (487,848 | ) |
| | | | |
Realized and unrealized gains (losses): | | | | |
Net realized gain (loss) from investments | | | 383,295 | |
Net change in unrealized appreciation (depreciation) on investments | | | (3,840,892 | ) |
| | | | |
Net realized and unrealized gain (loss) | | | (3,457,597 | ) |
| | | | |
Net increase (decrease) in net assets resulting from operations | | $ | (3,945,445 | ) |
| | | | |
| | | | | | |
| | | The accompanying notes are an integral part of these financial statements. | Annual Report | | | FFC-13 | |
FRANKLIN TEMPLETON VARIABLE INSURANCE PRODUCTS TRUST
FINANCIAL STATEMENTS
Statements of Changes in Net Assets
| | | | | | | | |
| | | Franklin Flex Cap Growth VIP Fund | |
| | | Year Ended December 31, | |
| | | 2016 | | | 2015 | |
Increase (decrease) in net assets: | | | | | | | | |
Operations: | | | | | | | | |
Net investment income (loss) | | $ | (487,848 | ) | | $ | (797,786 | ) |
Net realized gain (loss) | | | 383,295 | | | | 14,700,445 | |
Net change in unrealized appreciation (depreciation) | | | (3,840,892 | ) | | | (9,006,175 | ) |
| | | | |
Net increase (decrease) in net assets resulting from operations | | | (3,945,445 | ) | | | 4,896,484 | |
| | | | |
Distributions to shareholders from: | | | | | | | | |
Net realized gains: | | | | | | | | |
Class 2 | | | (9,849,775 | ) | | | (55,457,455 | ) |
Class 4 | | | (4,640,994 | ) | | | (20,021,151 | ) |
| | | | |
Total distributions to shareholders | | | (14,490,769 | ) | | | (75,478,606 | ) |
| | | | |
Capital share transactions: (Note 2) | | | | | | | | |
Class 2 | | | 3,213,957 | | | | 41,392,972 | |
Class 4 | | | (1,658,082 | ) | | | 21,859,783 | |
| | | | |
Total capital share transactions | | | 1,555,875 | | | | 63,252,755 | |
| | | | |
Net increase (decrease) in net assets | | | (16,880,339 | ) | | | (7,329,367 | ) |
Net assets (there is no undistributed net investment income at beginning or end of year): | | | | | | | | |
Beginning of year | | | 117,379,933 | | | | 124,709,300 | |
| | | | |
End of year | | $ | 100,499,594 | | | $ | 117,379,933 | |
| | | | |
| | | | |
| FFC-14 | | Annual Report | The accompanying notes are an integral part of these financial statements. | | |
FRANKLIN TEMPLETON VARIABLE INSURANCE PRODUCTS TRUST
Notes to Financial Statements
Franklin Flex Cap Growth VIP Fund
1. Organization and Significant Accounting Policies
Franklin Templeton Variable Insurance Products Trust (Trust) is registered under the Investment Company Act of 1940 (1940 Act) as an open-end management investment company, consisting of nineteen separate funds and applies the specialized accounting and reporting guidance in U.S. Generally Accepted Accounting Principles (U.S. GAAP). Franklin Flex Cap Growth VIP Fund (Fund) is included in this report. The financial statements of the remaining funds in the Trust are presented separately. Shares of the Fund are generally sold only to insurance company separate accounts to fund the benefits of variable life insurance policies or variable annuity contracts. The Fund offers two classes of shares: Class 2 and Class 4. Each class of shares differs by its distribution fees, voting rights on matters affecting a single class and its exchange privilege.
The following summarizes the Fund’s significant accounting policies.
a. Financial Instrument Valuation
The Fund’s investments in financial instruments are carried at fair value daily. Fair value is the price that would be received to sell an asset or paid to transfer a liability in an orderly transaction between market participants on the measurement date. The Fund calculates the net asset value (NAV) per share as of 4 p.m. Eastern time each day the New York Stock Exchange (NYSE) is open for trading. Under compliance policies and procedures approved by the Trust’s Board of Trustees (the Board), the Fund’s administrator has responsibility for oversight of valuation, including leading the cross-functional Valuation Committee (VC). The VC provides administration and oversight of the Fund’s valuation policies and procedures, which are approved annually by the Board. Among other things, these procedures allow the Fund to utilize independent pricing services, quotations from securities and financial instrument dealers, and other market sources to determine fair value.
Equity securities listed on an exchange or on the NASDAQ National Market System are valued at the last quoted sale price or the official closing price of the day, respectively. Foreign equity securities are valued as of the close of trading on the foreign stock exchange on which the security is primarily traded, or as of 4 p.m. Eastern time. The value is then converted into its U.S. dollar equivalent at the foreign exchange rate in effect at 4 p.m. Eastern time on the day that the value of the
security is determined. Over-the-counter (OTC) securities are valued within the range of the most recent quoted bid and ask prices. Securities that trade in multiple markets or on multiple exchanges are valued according to the broadest and most representative market. Certain equity securities are valued based upon fundamental characteristics or relationships to similar securities.
Investments in open-end mutual funds are valued at the
closing NAV.
The Fund has procedures to determine the fair value of financial instruments for which market prices are not reliable or readily available. Under these procedures, the VC convenes on a regular basis to review such financial instruments and considers a number of factors, including significant unobservable valuation inputs, when arriving at fair value. The VC primarily employs a market-based approach which may use related or comparable assets or liabilities, recent transactions, market multiples, book values, and other relevant information for the investment to determine the fair value of the investment. An income-based valuation approach may also be used in which the anticipated future cash flows of the investment are discounted to calculate fair value. Discounts may also be applied due to the nature or duration of any restrictions on the disposition of the investments. Due to the inherent uncertainty of valuations of such investments, the fair values may differ significantly from the values that would have been used had an active market existed. The VC employs various methods for calibrating these valuation approaches including a regular review of key inputs and assumptions, transactional back-testing or disposition analysis, and reviews of any related market activity.
Trading in securities on foreign securities stock exchanges and OTC markets may be completed before 4 p.m. Eastern time. In addition, trading in certain foreign markets may not take place on every Fund’s business day. Occasionally, events occur between the time at which trading in a foreign security is completed and 4 p.m. Eastern time that might call into question the reliability of the value of a portfolio security held by the Fund. As a result, differences may arise between the value of the Fund’s portfolio securities as determined at the foreign market close and the latest indications of value at 4 p.m. Eastern time. In order to minimize the potential for these differences, the VC monitors price movements following the close of trading in foreign stock markets through a series of country specific market proxies (such as baskets of American Depositary Receipts, futures contracts and exchange traded
FRANKLIN TEMPLETON VARIABLE INSURANCE PRODUCTS TRUST
NOTES TO FINANCIAL STATEMENTS
Franklin Flex Cap Growth VIP Fund (continued)
1. Organization and Significant Accounting Policies (continued)
a. Financial Instrument Valuation (continued)
funds). These price movements are measured against established trigger thresholds for each specific market proxy to assist in determining if an event has occurred that may call into question the reliability of the values of the foreign securities held by the Fund. If such an event occurs, the securities may be valued using fair value procedures, which may include the use of independent pricing services.
When the last day of the reporting period is a non-business day, certain foreign markets may be open on those days that the Fund’s NAV is not calculated, which could result in differences between the value of the Fund’s portfolio securities on the last business day and the last calendar day of the reporting period. Any significant security valuation changes due to an open foreign market are adjusted and reflected by the Fund for financial reporting purposes.
b. Securities Lending
The Fund participates in an agency based securities lending program to earn additional income. The Fund receives cash collateral against the loaned securities in an amount equal to at least 102% of the fair value of the loaned securities. Collateral is maintained over the life of the loan in an amount not less than 100% of the fair value of loaned securities, as determined at the close of Fund business each day; any additional collateral required due to changes in security values is delivered to the Fund on the next business day. The collateral is deposited into a joint cash account with other funds and is used to invest in a money market fund managed by Franklin Advisers, Inc., an affiliate of the Fund. The Fund may receive income from the investment of cash collateral, in addition to lending fees and rebates paid by the borrower. Income from securities loaned, net of fees paid to the securities lending agent and/or third-party vendor, is reported separately in the Statement of Operations. The Fund bears the market risk with respect to the collateral investment, securities loaned, and the risk that the agent may default on its obligations to the Fund. If the borrower defaults on its obligation to return the securities loaned, the Fund has the right to repurchase the securities in the open market using the collateral received. The securities lending agent has agreed to indemnify the Fund in the event of default by a third party borrower.
c. Income and Deferred Taxes
It is the Fund’s policy to qualify as a regulated investment company under the Internal Revenue Code. The Fund intends to distribute to shareholders substantially all of its taxable income and net realized gains to relieve it from federal income and if applicable, excise taxes. As a result, no provision for U.S. federal income taxes is required.
The Fund may be subject to foreign taxation related to income received, capital gains on the sale of securities and certain foreign currency transactions in the foreign jurisdictions in which it invests. Foreign taxes, if any, are recorded based on the tax regulations and rates that exist in the foreign markets in which the Fund invests. When a capital gain tax is determined to apply, the Fund records an estimated deferred tax liability in an amount that would be payable if the securities were disposed of on the valuation date.
The Fund may recognize an income tax liability related to its uncertain tax positions under U.S. GAAP when the uncertain tax position has a less than 50% probability that it will be sustained upon examination by the tax authorities based on its technical merits. As of December 31, 2016, the Fund has determined that no tax liability is required in its financial statements related to uncertain tax positions for any open tax years (or expected to be taken in future tax years). Open tax years are those that remain subject to examination and are based on each tax jurisdiction’s statute of limitation.
d. Security Transactions, Investment Income, Expenses and Distributions
Security transactions are accounted for on trade date. Realized gains and losses on security transactions are determined on a specific identification basis. Estimated expenses are accrued daily. Dividend income is recorded on the ex-dividend date except for certain dividends from securities where the dividend rate is not available. In such cases, the dividend is recorded as soon as the information is received by the Fund. Distributions to shareholders are recorded on the ex-dividend date and are determined according to income tax regulations (tax basis). Distributable earnings determined on a tax basis may differ from earnings recorded in accordance with U.S. GAAP. These differences may be permanent or temporary. Permanent differences are reclassified among capital accounts to reflect their tax character. These reclassifications have no impact on net assets or the results of operations. Temporary differences are not reclassified, as they may reverse in subsequent periods.
FRANKLIN TEMPLETON VARIABLE INSURANCE PRODUCTS TRUST
NOTES TO FINANCIAL STATEMENTS
Franklin Flex Cap Growth VIP Fund (continued)
Common expenses incurred by the Trust are allocated among the Funds based on the ratio of net assets of each Fund to the combined net assets of the Trust. Fund specific expenses are charged directly to the Fund that incurred the expense.
Realized and unrealized gains and losses and net investment income, not including class specific expenses, are allocated daily to each class of shares based upon the relative proportion of net assets of each class. Differences in per share distributions, by class, are generally due to differences in class specific expenses.
e. Accounting Estimates
The preparation of financial statements in accordance with U.S. GAAP requires management to make estimates and assumptions that affect the reported amounts of assets and
liabilities at the date of the financial statements and the amounts of income and expenses during the reporting period. Actual results could differ from those estimates.
f. Guarantees and Indemnifications
Under the Trust’s organizational documents, its officers and trustees are indemnified by the Trust against certain liabilities arising out of the performance of their duties to the Trust. Additionally, in the normal course of business, the Trust, on behalf of the Fund, enters into contracts with service providers that contain general indemnification clauses. The Trust’s maximum exposure under these arrangements is unknown as this would involve future claims that may be made against the Trust that have not yet occurred. Currently, the Trust expects the risk of loss to be remote.
2. Shares of Beneficial Interest
At December 31, 2016, there were an unlimited number of shares authorized (without par value). Transactions in the Fund’s shares were as follows:
| | | | | | | | | | | | | | | | | | | | |
| | | Year Ended December 31, | |
| | | 2016 | | | | | | 2015 | |
| | | Shares | | | Amount | | | | | | Shares | | | Amount | |
| | | | | |
| Class 2 Shares: | | | | | | | | | | | | | | | | | | | | |
Shares sold | | | 2,595,394 | | | $ | 15,855,206 | | | | | | | | 2,700,321 | | | $ | 22,329,959 | |
Shares issued in reinvestment of distributions | | | 1,710,030 | | | | 9,849,775 | | | | | | | | 7,659,869 | | | | 55,457,455 | |
Shares redeemed | | | (3,555,838 | ) | | | (22,491,024 | ) | | | | | | | (4,281,552 | ) | | | (36,394,442 | ) |
| | | | |
Net increase (decrease) | | | 749,586 | | | $ | 3,213,957 | | | | | | | | 6,078,638 | | | $ | 41,392,972 | |
| | | | |
| Class 4 Shares: | | | | | | | | | | | | | | | | | | | | |
Shares sold | | | 593,508 | | | $ | 3,606,248 | | | | | | | | 1,255,219 | | | $ | 10,687,379 | |
Shares issued in reinvestment of distributions | | | 831,720 | | | | 4,640,994 | | | | | | | | 2,839,880 | | | | 20,021,151 | |
Shares redeemed | | | (1,660,346 | ) | | | (9,905,324 | ) | | | | | | | (1,002,629 | ) | | | (8,848,747 | ) |
| | | | |
Net increase (decrease) | | | (235,118 | ) | | $ | (1,658,082 | ) | | | | | | | 3,092,470 | | | $ | 21,859,783 | |
| | | | |
3. Transactions with Affiliates
Franklin Resources, Inc. is the holding company for various subsidiaries that together are referred to as Franklin Templeton Investments. Certain officers and trustees of the Fund are also officers and/or directors of the following subsidiaries:
| | |
| Subsidiary | | Affiliation |
Franklin Advisers, Inc. (Advisers) | | Investment manager |
Franklin Templeton Services, LLC (FT Services) | | Administrative manager |
Franklin Templeton Distributors, Inc. (Distributors) | | Principal underwriter |
Franklin Templeton Investor Services, LLC (Investor Services) | | Transfer agent |
FRANKLIN TEMPLETON VARIABLE INSURANCE PRODUCTS TRUST
NOTES TO FINANCIAL STATEMENTS
Franklin Flex Cap Growth VIP Fund (continued)
3. Transactions with Affiliates (continued)
a. Management Fees
The Fund pays an investment management fee to Advisers based on the average daily net assets of the Fund as follows:
| | |
| Annualized Fee Rate | | Net Assets |
1.000% | | Up to and including $100 million |
0.900% | | Over $100 million, up to and including $250 million |
0.850% | | Over $250 million, up to and including $10 billion |
0.800% | | Over $10 billion, up to and including $12.5 billion |
0.775% | | Over $12.5 billion, up to and including $15 billion |
0.750% | | In excess of $15 billion |
For the year ended December 31, 2016, the effective investment management fee rate was 0.997% of the Fund’s average daily net assets.
b. Administrative Fees
Under an agreement with Advisers, FT Services provides administrative services to the Fund. The fee is paid by Advisers based on the Fund’s average daily net assets, and is not an additional expense of the Fund.
c. Distribution Fees
The Board has adopted distribution plans for Class 2 and Class 4 shares pursuant to Rule 12b-1 under the 1940 Act. Under the Fund’s compensation distribution plans, the Fund pays Distributors for costs incurred in connection with the servicing, sale and distribution of the Fund’s shares up to 0.35% per year of its average daily net assets of each class. The Board has agreed to limit the current rate to 0.25% per year for Class 2. The plan year, for purposes of monitoring compliance with the maximum annual plan rates, is February 1 through January 31.
d. Transfer Agent Fees
Investor Services, under terms of an agreement, performs shareholder servicing for the Fund and is not paid by the Fund for the services.
FRANKLIN TEMPLETON VARIABLE INSURANCE PRODUCTS TRUST
NOTES TO FINANCIAL STATEMENTS
Franklin Flex Cap Growth VIP Fund (continued)
e. Investments in Affiliated Management Investment Companies
The Fund invests in one or more affiliated management investment companies for purposes other than exercising a controlling influence over the management or policies. Management fees paid by the Fund are waived on assets invested in the affiliated management investment companies, as noted in the Statement of Operations, in an amount not to exceed the management and administrative fees paid directly or indirectly by each affiliate. Prior to January 1, 2014, the waiver was accounted for as a reduction to management fees. During the year ended December 31, 2016, the Fund held investments in affiliated management investment companies as follows:
| | | | | | | | | | | | | | | | | | | | | | | | | | | | | | | | |
| | | Number of Shares
Held at Beginning
of Year | | | Gross
Additions | | | Gross
Reductions | | | Number
of Shares
Held at End of
Year | | | Value at End of Year | | | Investment
Income | | | Realized
Gain
(Loss) | | | % of Affiliated
Fund Shares
Outstanding
Held at End
of Year | |
| Non-Controlled Affiliates | | | | | | | | | | | | | | | | | | | | | | | | | | | | | | | | |
Institutional Fiduciary Trust Money Market Portfolio, 0.09% | | | — | | | | 32,893,540 | | | | (26,848,121 | ) | | | 6,045,419 | | | $ | 6,045,419 | | | $ | 252 | | | $ | — | | | | —%a | |
| | | | | | | | | | | | | | | | | | | | | | | | |
aRounds to less than 0.1%.
f. Waiver and Expense Reimbursements
Advisers has contractually agreed in advance to waive or limit its fees and to assume as its own expense certain expenses otherwise payable by the Fund so that the expenses (excluding distribution fees, and acquired fund fees and expenses) for each class of the Fund do not exceed 0.71% based on the average net assets of each class (other than certain non-routine expenses or costs, including those relating to litigation, indemnification, reorganizations, and liquidations) until April 30, 2017. Total expenses waived or paid are not subject to recapture subsequent to the Fund’s fiscal year end.
4. Expense Offset Arrangement
The Fund has entered into an arrangement with its custodian whereby credits realized as a result of uninvested cash balances are used to reduce a portion of the Fund’s custodian expenses. During the year ended December 31, 2016, there were no credits earned.
5. Income Taxes
The tax character of distributions paid during the years ended December 31, 2016 and 2015, was as follows:
| | | | | | | | |
| | | 2016 | | | 2015 | |
Distributions paid from: | | | | | | | | |
Ordinary income | | $ | — | | | $ | 1,341,946 | |
Long term capital gain | | | 14,490,769 | | | | 74,136,659 | |
| | | | |
| | $ | 14,490,769 | | | $ | 75,478,605 | |
| | | | |
FRANKLIN TEMPLETON VARIABLE INSURANCE PRODUCTS TRUST
NOTES TO FINANCIAL STATEMENTS
Franklin Flex Cap Growth VIP Fund (continued)
5. Income Taxes (continued)
At December 31, 2016, the cost of investments, net unrealized appreciation (depreciation) and undistributed long term capital gains for income tax purposes were as follows:
| | | | |
Cost of investments | | $ | 66,082,310 | |
| | | | |
Unrealized appreciation | | $ | 36,133,760 | |
Unrealized depreciation | | | (1,021,647 | ) |
| | | | |
Net unrealized appreciation (depreciation) | | $ | 35,112,113 | |
| | | | |
Distributable earnings - undistributed long term capital gains | | $ | 247,642 | |
| | | | |
Differences between income and/or capital gains as determined on a book basis and a tax basis are primarily due to differing treatment of wash sales.
6. Investment Transactions
Purchases and sales of investments (excluding short term securities) for the year ended December 31, 2016, aggregated $17,693,265 and $34,358,179, respectively.
At December 31, 2016, in connection with securities lending transactions, the Fund loaned equity investments and received $547,500 of cash collateral. The gross amount of recognized liability for such transactions is included in payable upon return of securities loaned in the Statement of Assets and Liabilities. The agreements can be terminated at any time.
7. Credit Facility
The Fund, together with other U.S. registered and foreign investment funds (collectively, Borrowers), managed by Franklin Templeton Investments, are borrowers in a joint syndicated senior unsecured credit facility totaling $2 billion (Global Credit Facility) which matured on February 10, 2017. This Global Credit Facility provides a source of funds to the Borrowers for temporary and emergency purposes, including the ability to meet future unanticipated or unusually large redemption requests. Effective February 10, 2017, the Borrowers renewed the Global Credit Facility for a one year term, maturing February 9, 2018, for a total of $2 billion.
Under the terms of the Global Credit Facility, the Fund shall, in addition to interest charged on any borrowings made by the Fund and other costs incurred by the Fund, pay its share of fees and expenses incurred in connection with the implementation and maintenance of the Global Credit Facility, based upon its relative share of the aggregate net assets of all of the Borrowers, including an annual commitment fee of 0.15% based upon the unused portion of the Global Credit Facility. These fees are reflected in other expenses in the Statement of Operations. During the year ended December 31, 2016, the Fund did not use the Global Credit Facility.
8. Fair Value Measurements
The Fund follows a fair value hierarchy that distinguishes between market data obtained from independent sources (observable inputs) and the Fund’s own market assumptions (unobservable inputs). These inputs are used in determining the value of the Fund’s financial instruments and are summarized in the following fair value hierarchy:
| | • | | Level 1 – quoted prices in active markets for identical financial instruments |
FRANKLIN TEMPLETON VARIABLE INSURANCE PRODUCTS TRUST
NOTES TO FINANCIAL STATEMENTS
Franklin Flex Cap Growth VIP Fund (continued)
| | • | | Level 2 – other significant observable inputs (including quoted prices for similar financial instruments, interest rates, prepayment speed, credit risk, etc.) |
| | • | | Level 3 – significant unobservable inputs (including the Fund’s own assumptions in determining the fair value of financial instruments) |
The input levels are not necessarily an indication of the risk or liquidity associated with financial instruments at that level.
For movements between the levels within the fair value hierarchy, the Fund has adopted a policy of recognizing the transfers as of the date of the underlying event which caused the movement.
At December 31, 2016, all of the Fund’s investments in financial instruments carried at fair value were valued using Level 1 inputs. For detailed categories, see the accompanying Statement of Investments.
9. Investment Company Reporting Modernization
In October 2016, the U.S. Securities and Exchange Commission adopted new rules and amended existing rules (together, final rules) intended to modernize the reporting and disclosure of information by registered investment companies. In part, the final rules amend Regulation S-X and require standardized, enhanced disclosures about derivatives in investment company financial statements, as well as other amendments. The compliance date for the amendments to Regulation S-X is August 1, 2017. Management is currently evaluating the impact that the adoption of the amendments to Regulation S-X will have on the Fund’s financial statements and related disclosures.
10. Subsequent Events
The Fund has evaluated subsequent events through the issuance of the financial statements and determined that no events have occurred that require disclosure other than those already disclosed in the financial statements.
FRANKLIN TEMPLETON VARIABLE INSURANCE PRODUCTS TRUST
Report of Independent Registered Public Accounting Firm
Franklin Flex Cap Growth VIP Fund
To the Board of Trustees and Shareholders of Franklin Templeton Variable Insurance Products Trust
In our opinion, the accompanying statement of assets and liabilities, including the statement of investments, and the related statements of operations and of changes in net assets and the financial highlights present fairly, in all material respects, the financial position of Franklin Flex Cap Growth VIP Fund (the “Fund”) as of December 31, 2016, the results of its operations for the year then ended, the changes in its net assets for each of the two years in the period then ended and the financial highlights for the periods presented, in conformity with accounting principles generally accepted in the United States of America. These financial statements and financial highlights (hereafter referred to as “financial statements”) are the responsibility of the Fund’s management. Our responsibility is to express an opinion on these financial statements based on our audits. We conducted our audits of these financial statements in accordance with the standards of the Public Company Accounting Oversight Board (United States). Those standards require that we plan and perform the audit to obtain reasonable assurance about whether the financial statements are free of material misstatement. An audit includes examining, on a test basis, evidence supporting the amounts and disclosures in the financial statements, assessing the accounting principles used and significant estimates made by management, and evaluating the overall financial statement presentation. We believe that our audits, which included confirmation of securities as of December 31, 2016 by correspondence with the custodian, transfer agent and brokers, provide a reasonable basis for our opinion.
PricewaterhouseCoopers LLP
San Francisco, California
February 15, 2017
FRANKLIN TEMPLETON VARIABLE INSURANCE PRODUCTS TRUST
Tax Information (unaudited)
Franklin Flex Cap Growth VIP Fund
Under Section 852(b)(3)(C) of the Internal Revenue Code, the Fund hereby reports the maximum amount allowable but no less than $14,490,769 as a long term capital gain dividend for the fiscal year ended December 31, 2016.
Franklin Founding Funds Allocation VIP Fund
We are pleased to bring you Franklin Founding Funds Allocation VIP Fund’s annual report for the fiscal year ended December 31, 2016.
Class 2 Performance Summary as of December 31, 2016
Average annual total return of Class 2 shares* represents the average annual change in value, assuming reinvestment of dividends and capital gains. Average returns smooth out variations in returns, which can be significant; they are not the same as year-by-year results.
| | | | | | | | | | | | |
| Periods ended 12/31/16 | | 1-Year | | | 5-Year | | | Since Inception (7/2/07) | |
Average Annual Total Return | | | +13.18% | | | | +9.28% | | | | +2.93% | |
*The Fund has an expense reduction contractually guaranteed through 4/30/17. Fund investment results reflect the expense reduction, to the extent applicable; without this reduction, the results would have been lower.
Performance reflects the Fund’s Class 2 operating expenses, but does not include any contract fees, expenses or sales charges. If they had been included, performance would be lower. These charges and deductions, particularly for variable life policies, can have a significant effect on contract values and insurance benefits. See the contract prospectus for a complete description of these expenses, including sales charges.
Performance data represent past performance, which does not guarantee future results. Investment return and principal value will fluctuate, and you may have a gain or loss when you sell your shares. Current performance may differ from figures shown.
Total Return Index Comparison for a Hypothetical $10,000 Investment (7/2/07–12/31/16)
The graph below shows the change in value of a hypothetical $10,000 investment in the Fund over the indicated period and includes reinvestment of any income or distributions. The Fund’s performance* is compared to the performance of the Standard & Poor’s® 500 Index (S&P 500®) and the MSCI World Index. One cannot invest directly in an index, and an index is not representative of the Fund’s portfolio. Please see Important Notes to Performance Information preceding the Fund Summaries.
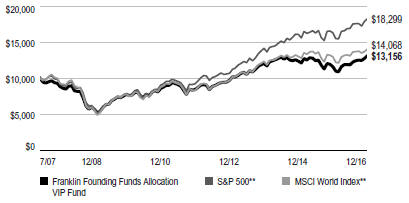
**Source: Morningstar. Please see Index Descriptions following the Fund Summaries.
FRANKLIN FOUNDING FUNDS ALLOCATION VIP FUND
Fund Goal and Main Investments
The Fund seeks capital appreciation, with income as a secondary goal. Under normal market conditions, the Fund invests equal portions in Class 1 shares of Franklin Income VIP Fund, Franklin Mutual Shares VIP Fund and Templeton Growth VIP Fund.
Fund Risks
All investments involve risks, including possible loss of principal. Because the Fund invests in underlying funds that may engage in a variety of investment strategies involving certain risks, the Fund may be subject to these same risks. Stock prices fluctuate, sometimes rapidly and dramatically, due to factors affecting individual companies, particular industries or sectors, or general market conditions. Bonds are affected by changes in interest rates and the creditworthiness of their issuers. Bond prices generally move in the opposite direction of interest rates. Thus, as prices of bonds adjust to a rise in interest rates, the Fund’s share price may decline. Higher yielding, lower rated corporate bonds entail a greater degree of credit risk compared to investment-grade securities. Foreign investing carries additional risks such as currency and market volatility and political or social instability, risks that are heightened in developing countries. Value securities may not increase in price as anticipated or may decline further in value. The Fund’s prospectus also includes a description of the main investment risks.
Performance Overview
You can find the Fund’s one-year total return in the Performance Summary. In comparison, the S&P 500 Index generated a +11.96% total return and the MSCI World Index produced a +8.15% total return for the same period.1
Economic and Market Overview
The global economy grew moderately during the 12-month period despite slower growth in some countries. In this environment, global developed and emerging market stocks, as measured by the MSCI World Index, rose. Global markets were aided by accommodative monetary policies of various global central banks, improved commodity prices after 2016’s first quarter, finalization of Greece’s new debt deal and generally encouraging global economic data. Further supporting markets
Asset Allocation*
Based on Total Net Assets as of 12/31/16
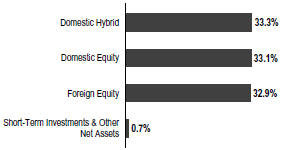
*The asset allocation is based on the Statement of Investments (SOI), which classifies each underlying fund into a broad asset class.
were expectations of higher interest rates and inflation in the U.S. driven by talk of expansionary fiscal policies under new U.S. president Donald Trump, and an Organization of the Petroleum Exporting Countries deal to curb oil production. However, these factors were partially offset by a slowdown in China’s economy and declining commodity prices early in the period, geopolitical tensions in certain regions, uncertainty about the U.S. Federal Reserve’s (Fed’s) timing for raising interest rates and worries about the health of European banks. In addition, global economic concerns and the U.K.’s historic referendum to leave the European Union (also known as “Brexit”) contributed to volatility in global stock markets.
The U.S. economy grew in 2016 despite a general decline in private inventory and business investments, which partly offset strength in consumer spending, residential investment and government spending. Manufacturing conditions remained volatile but generally expanded. The services sector also grew for most of the period, contributing to new jobs that helped the unemployment rate decrease from 5.0% in December 2015 to 4.7% at period-end.2 Retail sales generally rose, as did home sales and prices amid declining mortgage rates. At its December meeting, the Fed increased its target range for the federal funds rate to 0.50%–0.75%, as policymakers cited an improvement in U.S. labor markets and higher inflation. The Federal Open Market Committee also hinted at three additional hikes in 2017, and the Fed raised its 2017 U.S. economic growth forecast, while lowering its unemployment projections.
1. Source: Morningstar. One cannot invest directly in an index, and an index is not representative of the Fund’s portfolio. Please see Index Descriptions following the Fund Summaries.
2. Source: Bureau of Labor Statistics.
The dollar value, number of shares or principal amount, and names of all portfolio holdings are listed in the Fund’s Statement of Investments (SOI).
FRANKLIN FOUNDING FUNDS ALLOCATION VIP FUND
In Europe, the U.K.’s annualized economic growth accelerated in 2016’s second half, driven by gross fixed capital formation in the third quarter and manufacturing and services in the fourth quarter. Immediate effects of the Brexit vote in June materialized as U.K. stocks declined significantly, the British pound hit a three-decade low amid intensified selling and the U.K.’s credit rating was downgraded. In the eurozone, despite investor concerns about banking sector weakness, low corporate earnings and post-Brexit politics, some regions benefited from rising consumer spending, resulting from a cheaper euro, low inflation and signs of sustained economic growth. The eurozone grew slightly early in the period, aided by lower oil prices, improved exports and the European Central Bank’s (ECB’s) accommodative monetary policy. However, growth moderated in 2016’s second quarter and improved in the third and fourth quarters. After declining in the beginning of 2016, the eurozone’s annual inflation rate increased gradually to reach its highest reading in three years toward period-end, ending at an estimated 1.1% in December. The ECB cut its benchmark interest rate and expanded its massive bond-buying program in March and August 2016 to boost the region’s slowing growth. Furthermore, at its December meeting, the ECB extended the continuation of its monthly asset purchases from March to December of 2017, but it agreed to scale back the purchase amount beginning in April 2017.
In Asia, Japan’s quarterly gross domestic product grew slower in the third quarter than in the second and first quarters, mainly due to declines in private non-residential and public investments. In January 2016, the Bank of Japan (BOJ) introduced negative interest rates on excess reserves held by financial institutions with the central bank to boost lending and help achieve its inflation target. In July 2016, Japan’s Prime Minister Shinzo Abe announced a higher-than-expected fiscal stimulus to revive the economy, followed by an additional monetary stimulus announcement by the BOJ. The BOJ kept its interest rates unchanged toward period-end; however, it overhauled its monetary policy in September to focus on yield-curve control. The bank further announced that it adjusted its Japanese government bond purchases to maintain the 10-year rate for these bonds near 0%.
In emerging markets, economic growth generally moderated during the period. Brazil’s economy continued to be in recession and the country’s central bank cut its benchmark interest rate in October and November 2016 to spur economic growth. Russia’s economic contraction eased in 2016, following a rebound in oil prices and improved industrial production. The Bank of Russia reduced its key interest rates in June and September of 2016 to revive its economy.
China’s economy grew at a stable rate in the first three quarters of 2016 and expanded slightly faster in the fourth quarter, as full-year 2016 growth remained within the government’s targeted range. However, the People’s Bank of China employed monetary easing measures that included cutting the cash reserve requirement ratio for the country’s banks and effectively devaluing the Chinese currency against the U.S. dollar. In India, economic growth marginally increased from July through September 2016 due to slower private consumption growth and increased government spending. Overall, emerging market stocks, as measured by the MSCI Emerging Markets Index, rose during the period.
Investment Strategy
The Fund normally invests its assets in an equally weighted combination of Class 1 shares of Franklin Income VIP Fund, Franklin Mutual Shares VIP Fund and Templeton Growth VIP Fund. These underlying funds, in turn, invest in a variety of U.S. and foreign equity securities and, to a lesser extent, fixed income and money market securities. As market conditions affect the underlying funds, we rebalance the Fund’s allocations seeking to maintain equal weightings of approximately 33 1⁄3% of total net assets in each underlying fund whenever the actual allocations exceed plus or minus 3% of the fixed allocation percentages.
Manager’s Discussion
The Fund’s performance can be attributed largely to its allocation among the underlying funds and their investments in domestic and foreign equities, fixed income securities, and short-term investments and other net assets.
During the 12 months under review, Franklin Income VIP Fund – Class 1 and Franklin Mutual Shares VIP Fund – Class 1 outperformed the S&P 500 Index. Templeton Growth VIP Fund – Class 1 outperformed the MSCI World Index.
Thank you for your participation in Franklin Founding Funds Allocation VIP Fund. We look forward to serving your future investment needs.
FRANKLIN FOUNDING FUNDS ALLOCATION VIP FUND
The foregoing information reflects our analysis, opinions and portfolio holdings as of December 31, 2016, the end of the reporting period. The way we implement our main investment strategies and the resulting portfolio holdings may change depending on factors such as market and economic conditions. These opinions may not be relied upon as investment advice or an offer for a particular security. The information is not a complete analysis of every aspect of any market, country, industry, security or the Fund. Statements of fact are from sources considered reliable, but the investment manager makes no representation or warranty as to their completeness or accuracy. Although historical performance is no guarantee of future results, these insights may help you understand our investment
management philosophy.
FRANKLIN FOUNDING FUNDS ALLOCATION VIP FUND
Class 2 Fund Expenses
As an investor in a variable insurance contract (Contract) that indirectly provides for investment in an underlying mutual fund, you can incur transaction and/or ongoing expenses at both the Fund level and the Contract Level: (1) transaction expenses can include sales charges (loads) on purchases, surrender fees, transfer fees and premium taxes; and (2) ongoing expenses can include management fees, distribution and service (12b-1) fees, contract fees, annual maintenance fees, mortality and expense risk fees and other fees and expenses. All mutual funds and Contracts have some types of ongoing expenses. The table below shows Fund-level ongoing expenses and can help you understand these costs and compare them with those of other mutual funds offered through the Contract. The table assumes a $1,000 investment held for the six months indicated. Please refer to the Fund prospectus for additional information on operating expenses.
Actual Fund Expenses
The table below provides information about the actual account values and actual expenses in the columns under the heading “Actual.” In these columns the Fund’s actual return, which includes the effect of ongoing Fund expenses but does not include the effect of ongoing Contract expenses, is used to calculate the “Ending Account Value.”
You can estimate the Fund-level expenses you paid during the period by following these steps (of course, your account value and expenses will differ from those in this illustration):
| | Divide your account value by $1,000 |
| | (if your account had an $8,600 value, |
| | then $8,600 ÷ $1,000 = 8.6). |
| | Then multiply the result by the number under the headings “Actual” and “Fund-Level Expenses Paid During Period” |
| | (if Fund-Level Expenses Paid During Period were $ 7.50, |
| | then 8.6 x $7.50 = $64.50). |
| | In this illustration, the estimated expenses paid this period at the Fund level are $64.50. |
Hypothetical Example for Comparison
with Other Mutual Funds
Under the heading “Hypothetical” in the table, information is provided about hypothetical account values and hypothetical expenses based on the Fund’s actual expense ratio and an assumed rate of return of 5% per year before expenses, which is not the Fund’s actual return. This information may not be used to estimate the actual ending account balance or expenses you paid for the period, but it can help you compare ongoing costs of investing in the Fund with those of other mutual funds offered through the Contract. To do so, compare this 5% hypothetical example with the 5% hypothetical examples that appear in the shareholder reports of other funds offered through the Contract.
Please note that expenses shown in the table are meant to highlight ongoing costs at the Fund level only and do not reflect any ongoing expenses at the Contract level, or transaction expenses at either the Fund or Contract levels. In addition, while the Fund does not have transaction expenses, if the transaction and ongoing expenses at the Contract level were included, the expenses shown below would be higher. You should consult your Contract prospectus or disclosure document for more information.
| | | | | | | | | | | | | | | | | | | | | | | | |
| | | | | | Actual
(actual return after expenses) | | | Hypothetical
(5% annual return before expenses) | | | | |
| Share Class | |
| Beginning Account
Value 7/1/16 |
| |
| Ending Account
Value 12/31/16 |
| |
| Fund-Level
Expenses Paid
During Period
7/1/16–12/31/16 |
1,2 | |
| Ending Account
Value 12/31/16 |
| |
| Fund-Level
Expenses Paid
During Period
7/1/16–12/31/16 |
1,2 | |
| Net
Annualized
Expense
Ratio |
2 |
Class 2 | | | $1,000 | | | | $1,106.30 | | | | $1.85 | | | | $1,023.38 | | | | $1.78 | | | | 0.35% | |
1. Expenses are equal to the annualized expense ratio for the six-month period as indicated above–in the far right column–multiplied by the simple average account value over the period indicated, and then multiplied by 184/366 to reflect the one-half year period.
2. Reflects expenses after fee waivers and expense reimbursements. Does not include any ongoing expenses of the Contract for which the Fund is an investment option or acquired fund fees and expenses.
FRANKLIN TEMPLETON VARIABLE INSURANCE PRODUCTS TRUST
Financial Highlights
Franklin Founding Funds Allocation VIP Fund
| | | | | | | | | | | | | | | | | | | | |
| | | Year Ended December 31, | |
| | | 2016 | | | 2015 | | | 2014 | | | 2013 | | | 2012 | |
| Class 1 | | | | | | | | | | | | | | | | | | | | |
Per share operating performance
(for a share outstanding throughout the year) | | | | | | | | | | | | | | | | | | | | |
| | | | | |
Net asset value, beginning of year | | | $6.80 | | | | $7.47 | | | | $7.47 | | | | $8.55 | | | | $7.63 | |
| | | | |
| | | | | |
| Income from investment operationsa: | | | | | | | | | | | | | | | | | | | | |
| | | | | |
Net investment incomeb,c | | | 0.21 | | | | 0.26 | | | | 0.22 | | | | 0.30 | | | | 0.26 | |
| | | | | |
Net realized and unrealized gains (losses) | | | 0.64 | | | | (0.68 | ) | | | 0.02 | | | | 1.42 | | | | 0.90 | |
| | | | |
Total from investment operations | | | 0.85 | | | | (0.42 | ) | | | 0.24 | | | | 1.72 | | | | 1.16 | |
| | | | |
| | | | | |
| Less distributions from: | | | | | | | | | | | | | | | | | | | | |
| | | | | |
Net investment income | | | (0.29 | ) | | | (0.24 | ) | | | (0.23 | ) | | | (1.15 | ) | | | (0.24 | ) |
| | | | | |
Net realized gains | | | (0.23 | ) | | | (0.01 | ) | | | (0.01 | ) | | | (1.65 | ) | | | — | |
| | | | |
Total distributions | | | (0.52 | ) | | | (0.25 | ) | | | (0.24 | ) | | | (2.80 | ) | | | (0.24 | ) |
| | | | |
Net asset value, end of year. | | | $7.13 | | | | $6.80 | | | | $7.47 | | | | $7.47 | | | | $8.55 | |
| | | | |
| | | | | |
Total returnd | | | 13.43% | | | | (5.93)% | | | | 3.05% | | | | 24.14% | | | | 15.56% | |
| | | | | |
| Ratios to average net assets | | | | | | | | | | | | | | | | | | | | |
| | | | | |
Expenses before waiver and payments by affiliatese | | | 0.11% | | | | 0.11% | | | | 0.11% | | | | 0.11% | | | | 0.11% | |
| | | | | |
Expenses net of waiver and payments by affiliatese | | | 0.10% | | | | 0.10% | | | | 0.10% | | | | 0.10% | | | | 0.10% | |
| | | | | |
Net investment incomec | | | 3.09% | | | | 3.51% | | | | 2.88% | | | | 3.67% | | | | 4.06% | |
| | | | | |
| Supplemental data | | | | | | | | | | | | | | | | | | | | |
| | | | | |
Net assets, end of year (000’s) | | | $1,025 | | | | $1,083 | | | | $1,114 | | | | $952 | | | | $767 | |
| | | | | |
Portfolio turnover rate | | | 0.10% | | | | 0.26% | | | | 4.80% | | | | 3.91% | | | | 28.46%f | |
aThe amount shown for a share outstanding throughout the period may not correlate with the Statement of Operations for the period due to the timing of sales and repurchases of the Fund’s shares in relation to income earned and/or fluctuating fair value of the investments of the Fund.
bBased on average daily shares outstanding.
cRecognition of net investment income by the Fund is affected by the timing of declaration of dividends by the Underlying Funds in which the Fund invests.
dTotal return does not include fees, charges or expenses imposed by the variable annuity and life insurance contracts for which Franklin Templeton Variable Insurance Products Trust serves as an underlying investment vehicle.
eDoes not include expenses of the Underlying Funds in which the Fund invests. The weighted average indirect expenses of the Underlying Funds was 0.65% for the year ended December 31, 2016.
f Excludes the value of portfolio securities delivered as a result of a redemption in-kind.
| | | | |
| FFA-6 | | Annual Report | The accompanying notes are an integral part of these financial statements. | | |
FRANKLIN TEMPLETON VARIABLE INSURANCE PRODUCTS TRUST
FINANCIAL HIGHLIGHTS
Franklin Founding Funds Allocation VIP Fund (continued)
| | | | | | | | | | | | | | | | | | | | |
| | | Year Ended December 31, | |
| | | 2016 | | | 2015 | | | 2014 | | | 2013 | | | 2012 | |
| Class 2 | | | | | | | | | | | | | | | | | | | | |
Per share operating performance
(for a share outstanding throughout the year) | | | | | | | | | | | | | | | | | | | | |
| | | | | |
Net asset value, beginning of year | | | $6.75 | | | | $7.42 | | | | $7.42 | | | | $8.51 | | | | $7.59 | |
| | | | |
| | | | | |
| Income from investment operationsa: | | | | | | | | | | | | | | | | | | | | |
| | | | | |
Net investment incomeb,c | | | 0.19 | | | | 0.24 | | | | 0.20 | | | | 0.27 | | | | 0.25 | |
| | | | | |
Net realized and unrealized gains (losses) | | | 0.64 | | | | (0.68 | ) | | | 0.02 | | | | 1.42 | | | | 0.89 | |
| | | | |
Total from investment operations | | | 0.83 | | | | (0.44 | ) | | | 0.22 | | | | 1.69 | | | | 1.14 | |
| | | | |
| | | | | |
| Less distributions from: | | | | | | | | | | | | | | | | | | | | |
| | | | | |
Net investment income | | | (0.27 | ) | | | (0.22 | ) | | | (0.21 | ) | | | (1.13 | ) | | | (0.22 | ) |
| | | | | |
Net realized gains | | | (0.23 | ) | | | (0.01 | ) | | | (0.01 | ) | | | (1.65 | ) | | | — | |
| | | | |
Total distributions | | | (0.50 | ) | | | (0.23 | ) | | | (0.22 | ) | | | (2.78 | ) | | | (0.22 | ) |
| | | | |
Net asset value, end of year. | | | $7.08 | | | | $6.75 | | | | $7.42 | | | | $7.42 | | | | $8.51 | |
| | | | |
| | | | | |
Total returnd | | | 13.18% | | | | (6.21)% | | | | 2.85% | | | | 23.77% | | | | 15.33% | |
| | | | | |
| Ratios to average net assets | | | | | | | | | | | | | | | | | | | | |
| | | | | |
Expenses before waiver and payments by affiliatese | | | 0.36% | | | | 0.36% | | | | 0.36% | | | | 0.36% | | | | 0.36% | |
| | | | | |
Expenses net of waiver and payments by affiliatese | | | 0.35% | | | | 0.35% | | | | 0.35% | | | | 0.35% | | | | 0.35% | |
| | | | | |
Net investment incomec | | | 2.84% | | | | 3.26% | | | | 2.63% | | | | 3.42% | | | | 3.81% | |
| | | | | |
| Supplemental data | | | | | | | | | | | | | | | | | | | | |
| | | | | |
Net assets, end of year (000’s) | | | $474,669 | | | | $480,715 | | | | $557,704 | | | | $547,506 | | | | $472,686 | |
| | | | | |
Portfolio turnover rate | | | 0.10% | | | | 0.26% | | | | 4.80% | | | | 3.91% | | | | 28.46%f | |
aThe amount shown for a share outstanding throughout the period may not correlate with the Statement of Operations for the period due to the timing of sales and repurchases of the Fund’s shares in relation to income earned and/or fluctuating fair value of the investments of the Fund.
bBased on average daily shares outstanding.
cRecognition of net investment income by the Fund is affected by the timing of declaration of dividends by the Underlying Funds in which the Fund invests.
dTotal return does not include fees, charges or expenses imposed by the variable annuity and life insurance contracts for which Franklin Templeton Variable Insurance Products Trust serves as an underlying investment vehicle.
eDoes not include expenses of the Underlying Funds in which the Fund invests. The weighted average indirect expenses of the Underlying Funds was 0.65% for the year ended December 31, 2016.
f Excludes the value of portfolio securities delivered as a result of a redemption in-kind.
| | | | | | |
| | | The accompanying notes are an integral part of these financial statements. | Annual Report | | | FFA-7 | |
FRANKLIN TEMPLETON VARIABLE INSURANCE PRODUCTS TRUST
FINANCIAL HIGHLIGHTS
Franklin Founding Funds Allocation VIP Fund (continued)
| | | | | | | | | | | | | | | | | | | | |
| | | Year Ended December 31, | |
| | | 2016 | | | 2015 | | | 2014 | | | 2013 | | | 2012 | |
| Class 4 | | | | | | | | | | | | | | | | | | | | |
Per share operating performance
(for a share outstanding throughout the year) | | | | | | | | | | | | | | | | | | | | |
| | | | | |
Net asset value, beginning of year | | | $6.87 | | | | $7.54 | | | | $7.54 | | | | $8.49 | | | | $7.58 | |
| | | | |
| | | | | |
| Income from investment operationsa: | | | | | | | | | | | | | | | | | | | | |
| | | | | |
Net investment incomeb,c | | | 0.19 | | | | 0.23 | | | | 0.20 | | | | 0.26 | | | | 0.30 | |
| | | | | |
Net realized and unrealized gains (losses) | | | 0.64 | | | | (0.68 | ) | | | 0.02 | | | | 1.43 | | | | 0.83 | |
| | | | |
Total from investment operations | | | 0.83 | | | | (0.45 | ) | | | 0.22 | | | | 1.69 | | | | 1.13 | |
| | | | |
| | | | | |
| Less distributions from: | | | | | | | | | | | | | | | | | | | | |
| | | | | |
Net investment income | | | (0.26 | ) | | | (0.21 | ) | | | (0.21 | ) | | | (0.99 | ) | | | (0.22 | ) |
| | | | | |
Net realized gains | | | (0.23 | ) | | | (0.01 | ) | | | (0.01 | ) | | | (1.65 | ) | | | — | |
| | | | |
Total distributions | | | (0.49 | ) | | | (0.22 | ) | | | (0.22 | ) | | | (2.64 | ) | | | (0.22 | ) |
| | | | |
Net asset value, end of year. | | | $7.21 | | | | $6.87 | | | | $7.54 | | | | $7.54 | | | | $8.49 | |
| | | | |
| | | | | |
Total returnd | | | 12.92% | | | | (6.24)% | | | | 2.75% | | | | 23.68% | | | | 15.17% | |
| | | | | |
| Ratios to average net assets | | | | | | | | | | | | | | | | | | | | |
| | | | | |
Expenses before waiver and payments by affiliatese | | | 0.46% | | | | 0.46% | | | | 0.46% | | | | 0.46% | | | | 0.46% | |
| | | | | |
Expenses net of waiver and payments by affiliatese | | | 0.45% | | | | 0.45% | | | | 0.45% | | | | 0.45% | | | | 0.45% | |
| | | | | |
Net investment incomec | | | 2.74% | | | | 3.16% | | | | 2.53% | | | | 3.32% | | | | 3.71% | |
| | | | | |
| Supplemental data | | | | | | | | | | | | | | | | | | | | |
| | | | | |
Net assets, end of year (000’s) | | | $530,403 | | | | $550,825 | | | | $702,324 | | | | $676,781 | | | | $493,813 | |
| | | | | |
Portfolio turnover rate | | | 0.10% | | | | 0.26% | | | | 4.80% | | | | 3.91% | | | | 28.46%f | |
aThe amount shown for a share outstanding throughout the period may not correlate with the Statement of Operations for the period due to the timing of sales and repurchases of the Fund’s shares in relation to income earned and/or fluctuating fair value of the investments of the Fund.
bBased on average daily shares outstanding.
cRecognition of net investment income by the Fund is affected by the timing of declaration of dividends by the Underlying Funds in which the Fund invests.
dTotal return does not include fees, charges or expenses imposed by the variable annuity and life insurance contracts for which Franklin Templeton Variable Insurance Products Trust serves as an underlying investment vehicle.
eDoes not include expenses of the Underlying Funds in which the Fund invests. The weighted average indirect expenses of the Underlying Funds was 0.65% for the year ended December 31, 2016.
fExcludes the value of portfolio securities delivered as a result of a redemption in-kind.
| | | | |
| FFA-8 | | Annual Report | The accompanying notes are an integral part of these financial statements. | | |
FRANKLIN TEMPLETON VARIABLE INSURANCE PRODUCTS TRUST
Statement of Investments, December 31, 2016
| | | | | | | | | | |
Franklin Founding Funds Allocation VIP Fund | |
| | | | | Shares | | | Value | |
| | | Investments in Underlying Funds 99.3% | | | | | | |
| | | Domestic Equity 33.1% | | | | | | |
| a | | Franklin Mutual Shares VIP Fund, Class 1 | | | 16,336,774 | | | $ | 333,270,195 | |
| | | | | | | | | | |
| | | Domestic Hybrid 33.3% | | | | | | |
| a | | Franklin Income VIP Fund, Class 1 | | | 21,065,303 | | | | 334,517,009 | |
| | | | | | | | | | |
| | | Foreign Equity 32.9% | | | | | | |
| a | | Templeton Growth VIP Fund, Class 1 | | | 23,748,961 | | | | 330,823,032 | |
| | | | | | | | | | |
| | Total Investments in Underlying Funds (Cost $745,715,141) | | | | | | | 998,610,236 | |
| | Other Assets, less Liabilities 0.7% | | | | | | | 7,486,259 | |
| | | | | | | | | | |
| | Net Assets 100.0% | | | | | | $ | 1,006,096,495 | |
| | | | | | | | | | |
aSee Note 3(d) regarding investments in Underlying Funds.
| | | | | | |
| | | The accompanying notes are an integral part of these financial statements. | Annual Report | | | FFA-9 | |
FRANKLIN TEMPLETON VARIABLE INSURANCE PRODUCTS TRUST
Financial Statements
Statement of Assets and Liabilities
December 31, 2016
| | | | |
| | | Franklin Founding
Funds Allocation
VIP Fund | |
Assets: | | | | |
Investments in securities: | | | | |
Cost - Non-controlled affiliates (Note 3d) | | $ | 745,715,141 | |
| | | | |
Value - Non-controlled affiliates (Note 3d) | | $ | 998,610,236 | |
Cash | | | 9,599,901 | |
Receivables: | | | | |
Capital shares sold | | | 150,296 | |
Other assets | | | 81 | |
| | | | |
Total assets | | | 1,008,360,514 | |
| | | | |
Liabilities: | | | | |
Payables: | | | | |
Capital shares redeemed | | | 1,605,106 | |
Administrative fees | | | 76,984 | |
Distribution fees | | | 500,784 | |
Accrued expenses and other liabilities | | | 81,145 | |
| | | | |
Total liabilities | | | 2,264,019 | |
| | | | |
Net assets, at value. | | $ | 1,006,096,495 | |
| | | | |
Net assets consist of: | | | | |
Paid-in capital. | | $ | 734,038,673 | |
Undistributed net investment income | | | 26,674,273 | |
Net unrealized appreciation (depreciation) | | | 252,895,095 | |
Accumulated net realized gain (loss) | | | (7,511,546 | ) |
| | | | |
Net assets, at value. | | $ | 1,006,096,495 | |
| | | | |
| |
| Class 1: | | | | |
Net assets, at value. | | $ | 1,025,195 | |
| | | | |
Shares outstanding | | | 143,858 | |
| | | | |
Net asset value and maximum offering price per share | | $ | 7.13 | |
| | | | |
| |
| Class 2: | | | | |
Net assets, at value. | | $ | 474,668,786 | |
| | | | |
Shares outstanding | | | 67,074,212 | |
| | | | |
Net asset value and maximum offering price per share | | $ | 7.08 | |
| | | | |
| |
| Class 4: | | | | |
Net assets, at value. | | $ | 530,402,514 | |
| | | | |
Shares outstanding | | | 73,591,426 | |
| | | | |
Net asset value and maximum offering price per share | | $ | 7.21 | |
| | | | |
| | | | |
| FFA-10 | | Annual Report | The accompanying notes are an integral part of these financial statements. | | |
FRANKLIN TEMPLETON VARIABLE INSURANCE PRODUCTS TRUST
FINANCIAL STATEMENTS
Statement of Operations
for the year ended December 31, 2016
| | | | |
| | | Franklin Founding
Funds Allocation
VIP Fund | |
Investment income: | | | | |
Dividends from non-controlled affliates (Note 3d) | | $ | 31,551,371 | |
| | | | |
Expenses: | | | | |
Administrative fees (Note 3a) | | | 987,565 | |
Distribution fees: (Note 3b) | | | | |
Class 2 | | | 1,162,044 | |
Class 4 | | | 1,825,948 | |
Reports to shareholders. | | | 82,141 | |
Professional fees | | | 37,225 | |
Trustees’ fees and expenses. | | | 4,691 | |
Other | | | 17,132 | |
| | | | |
Total expenses | | | 4,116,746 | |
Expenses waived/paid by affiliates (Note 3e) | | | (141,194 | ) |
| | | | |
Net expenses | | | 3,975,552 | |
| | | | |
Net investment income | | | 27,575,819 | |
| | | | |
Realized and unrealized gains (losses): | | | | |
Net realized gain (loss) from: | | | | |
Sale of investments: | | | | |
Non-controlled affiliates (Note 3d) | | | 7,106,225 | |
Realized gain distributions: | | | | |
Non-controlled affiliates (Note 3d) | | | 38,571,501 | |
| | | | |
Net realized gain (loss) | | | 45,677,726 | |
| | | | |
Net change in unrealized appreciation (depreciation) on investments | | | 46,468,720 | |
| | | | |
Net realized and unrealized gain (loss) | | | 92,146,446 | |
| | | | |
Net increase (decrease) in net assets resulting from operations | | $ | 119,722,265 | |
| | | | |
| | | | | | |
| | | The accompanying notes are an integral part of these financial statements. | Annual Report | | | FFA-11 | |
FRANKLIN TEMPLETON VARIABLE INSURANCE PRODUCTS TRUST
FINANCIAL STATEMENTS
Statements of Changes in Net Assets
| | | | | | | | |
| | | Franklin Founding Funds
Allocation VIP Fund | |
| | | Year Ended December 31, | |
| | | 2016 | | | 2015 | |
Increase (decrease) in net assets: | | | | | | | | |
Operations: | | | | | | | | |
Net investment income | | $ | 27,575,819 | | | $ | 37,413,879 | |
Net realized gain (loss) | | | 45,677,726 | | | | 35,400,605 | |
Net change in unrealized appreciation (depreciation) | | | 46,468,720 | | | | (142,745,103 | ) |
| | | | |
Net increase (decrease) in net assets resulting from operations | | | 119,722,265 | | | | (69,930,619 | ) |
| | | | |
Distributions to shareholders from: | | | | | | | | |
Net investment income: | | | | | | | | |
Class 1 | | | (42,944 | ) | | | (36,795 | ) |
Class 2 | | | (18,199,650 | ) | | | (15,525,526 | ) |
Class 4 | | | (19,362,702 | ) | | | (17,645,320 | ) |
Net realized gains: | | | | | | | | |
Class 1 | | | (33,890 | ) | | | (1,845 | ) |
Class 2 | | | (15,405,932 | ) | | | (848,940 | ) |
Class 4 | | | (17,041,267 | ) | | | (1,013,211 | ) |
| | | | |
Total distributions to shareholders | | | (70,086,385 | ) | | | (35,071,637 | ) |
| | | | |
Capital share transactions: (Note 2) | | | | | | | | |
Class 1 | | | (111,375 | ) | | | 76,918 | |
Class 2 | | | (29,371,071 | ) | | | (28,851,107 | ) |
Class 4 | | | (46,679,895 | ) | | | (94,741,812 | ) |
| | | | |
Total capital share transactions | | | (76,162,341 | ) | | | (123,516,001 | ) |
| | | | |
Net increase (decrease) in net assets | | | (26,526,461 | ) | | | (228,518,257 | ) |
Net assets: | | | | | | | | |
Beginning of year | | | 1,032,622,956 | | | | 1,261,141,213 | |
| | | | |
End of year | | $ | 1,006,096,495 | | | $ | 1,032,622,956 | |
| | | | |
Undistributed net investment income included in net assets: | | | | | | | | |
End of year | | $ | 26,674,273 | | | $ | 35,824,134 | |
| | | | |
| | | | |
| FFA-12 | | Annual Report | The accompanying notes are an integral part of these financial statements. | | |
FRANKLIN TEMPLETON VARIABLE INSURANCE PRODUCTS TRUST
Notes to Financial Statements
Franklin Founding Funds Allocation VIP Fund
1. Organization and Significant Accounting Policies
Franklin Templeton Variable Insurance Products Trust (Trust) is registered under the Investment Company Act of 1940 (1940 Act) as an open-end management investment company, consisting of nineteen separate funds and applies the specialized accounting and reporting guidance in U.S. Generally Accepted Accounting Principles (U.S. GAAP). Franklin Founding Funds Allocation VIP Fund (Fund) is included in this report. The financial statements of the remaining funds in the Trust are presented separately. The Fund invests primarily in other funds of the Trust (Underlying Funds). Shares of the Fund are generally sold only to insurance company separate accounts to fund the benefits of variable life insurance policies or variable annuity contracts. The Fund offers three classes of shares: Class 1, Class 2 and Class 4. Each class of shares differs by its distribution fees, voting rights on matters affecting a single class and its exchange privilege.
The accounting policies of the Underlying Funds are outlined in their respective shareholder reports. A copy of the Underlying Funds’ shareholder reports is available on the U.S. Securities and Exchange Commission (SEC) website at sec.gov or at the SEC’s Public Reference Room in Washington, D.C. The Underlying Funds’ shareholder reports are not covered by this report.
The following summarizes the Fund’s significant accounting policies.
a. Financial Instrument Valuation
The Fund’s investments in financial instruments are carried at fair value daily. Fair value is the price that would be received to sell an asset or paid to transfer a liability in an orderly transaction between market participants on the measurement date. The Fund calculates the net asset value (NAV) per share as of 4 p.m. Eastern time each day the New York Stock Exchange (NYSE) is open for trading. Under compliance policies and procedures approved by the Trust’s Board of Trustees (the Board), the Fund’s administrator has responsibility for oversight of valuation, including leading the cross-functional Valuation Committee (VC). The VC provides administration and oversight of the Fund’s valuation policies and procedures, which are approved annually by the Board. Investments in the Underlying Funds are valued at their closing NAV each trading day.
b. Income Taxes
It is the Fund’s policy to qualify as a regulated investment company under the Internal Revenue Code. The Fund intends to distribute to shareholders substantially all of its taxable income and net realized gains to relieve it from federal income and if applicable, excise taxes. As a result, no provision for U.S. federal income taxes is required.
The Fund may recognize an income tax liability related to its uncertain tax positions under U.S. GAAP when the uncertain tax position has a less than 50% probability that it will be sustained upon examination by the tax authorities based on its technical merits. As of December 31, 2016, the Fund has determined that no tax liability is required in its financial statements related to uncertain tax positions for any open tax years (or expected to be taken in future tax years). Open tax years are those that remain subject to examination and are based on each tax jurisdiction’s statute of limitation.
c. Security Transactions, Investment Income, Expenses and Distributions
Security transactions are accounted for on trade date. Realized gains and losses on security transactions are determined on a specific identification basis. Estimated expenses are accrued daily. Dividend income and realized gain distributions by Underlying Funds are recorded on the ex-dividend date. Distributions to shareholders are recorded on the ex-dividend date and are determined according to income tax regulations (tax basis). Distributable earnings determined on a tax basis may differ from earnings recorded in accordance with U.S. GAAP. These differences may be permanent or temporary. Permanent differences are reclassified among capital accounts to reflect their tax character. These reclassifications have no impact on net assets or the results of operations. Temporary differences are not reclassified, as they may reverse in
subsequent periods.
Common expenses incurred by the Trust are allocated among the Funds based on the ratio of net assets of each Fund to the combined net assets of the Trust. Fund specific expenses are charged directly to the Fund that incurred the expense.
The Fund indirectly bears its proportionate share of expenses from the Underlying Funds. Since the Underlying Funds have varied expense levels and the Fund may own different proportions of the Underlying Funds at different times, the amount of expenses incurred indirectly by the Fund will vary.
FRANKLIN TEMPLETON VARIABLE INSURANCE PRODUCTS TRUST
NOTES TO FINANCIAL STATEMENTS
Franklin Founding Funds Allocation VIP Fund (continued)
1. Organization and Significant Accounting
Policies (continued)
c. Security Transactions, Investment Income, Expenses and Distributions (continued)
Realized and unrealized gains and losses and net investment income, not including class specific expenses, are allocated daily to each class of shares based upon the relative proportion of net assets of each class. Differences in per share distributions, by class, are generally due to differences in class specific expenses.
d. Accounting Estimates
The preparation of financial statements in accordance with U.S. GAAP requires management to make estimates and assumptions that affect the reported amounts of assets and
liabilities at the date of the financial statements and the amounts of income and expenses during the reporting period. Actual results could differ from those estimates.
e. Guarantees and Indemnifications
Under the Trust’s organizational documents, its officers and trustees are indemnified by the Trust against certain liabilities arising out of the performance of their duties to the Trust. Additionally, in the normal course of business, the Trust, on behalf of the Fund, enters into contracts with service providers that contain general indemnification clauses. The Trust’s maximum exposure under these arrangements is unknown as this would involve future claims that may be made against the Trust that have not yet occurred. Currently, the Trust expects the risk of loss to be remote.
2. Shares of Beneficial Interest
At December 31, 2016, there were an unlimited number of shares authorized (without par value). Transactions in the Fund’s shares
were as follows:
| | | | | | | | | | | | | | | | | | | | |
| | | Year Ended December 31, | |
| | | 2016 | | | | | | 2015 | |
| | | Shares | | | Amount | | | | | | Shares | | | Amount | |
| | | | | |
| Class 1 Shares: | | | | | | | | | | | | | | | | | | | | |
Shares sold. | | | 16,848 | | | $ | 112,841 | | | | | | | | 19,319 | | | $ | 143,699 | |
Shares issued in reinvestment of distributions | | | 12,138 | | | | 76,834 | | | | | | | | 5,229 | | | | 38,640 | |
Shares redeemed | | | (44,358 | ) | | | (301,050 | ) | | | | | | | (14,405 | ) | | | (105,421 | ) |
| | | | |
Net increase (decrease) | | | (15,372 | ) | | $ | (111,375 | ) | | | | | | | 10,143 | | | $ | 76,918 | |
| | | | |
| | | | | |
| Class 2 Shares: | | | | | | | | | | | | | | | | | | | | |
Shares sold. | | | 5,277,050 | | | $ | 35,702,809 | | | | | | | | 6,246,409 | | | $ | 45,291,801 | |
Shares issued in reinvestment of distributions | | | 5,334,220 | | | | 33,605,582 | | | | | | | | 2,227,819 | | | | 16,374,466 | |
Shares redeemed | | | (14,716,105 | ) | | | (98,679,462 | ) | | | | | | | (12,470,063 | ) | | | (90,517,374 | ) |
| | | | |
Net increase (decrease) | | | (4,104,835 | ) | | $ | (29,371,071 | ) | | | | | | | (3,995,835 | ) | | $ | (28,851,107 | ) |
| | | | |
| | | | | |
| Class 4 Shares: | | | | | | | | | | | | | | | | | | | | |
Shares sold. | | | 1,664,792 | | | $ | 11,425,501 | | | | | | | | 2,856,721 | | | $ | 21,294,894 | |
Shares issued in reinvestment of distributions | | | 5,670,400 | | | | 36,403,969 | | | | | | | | 2,494,456 | | | | 18,658,531 | |
Shares redeemed | | | (13,975,336 | ) | | | (94,509,365 | ) | | | | | | | (18,324,962 | ) | | | (134,695,237 | ) |
| | | | |
Net increase (decrease) | | | (6,640,144 | ) | | $ | (46,679,895 | ) | | | | | | | (12,973,785 | ) | | $ | (94,741,812 | ) |
| | | | |
FRANKLIN TEMPLETON VARIABLE INSURANCE PRODUCTS TRUST
NOTES TO FINANCIAL STATEMENTS
Franklin Founding Funds Allocation VIP Fund (continued)
3. Transactions with Affiliates
Franklin Resources, Inc. is the holding company for various subsidiaries that together are referred to as Franklin Templeton Investments. Certain officers and trustees of the Fund are also officers and/or directors of the following subsidiaries:
| | |
| Subsidiary | | Affiliation |
Franklin Templeton Services, LLC (FT Services) | | Administrative manager |
Franklin Templeton Distributors, Inc. (Distributors) | | Principal underwriter |
Franklin Templeton Investor Services, LLC (Investor Services) | | Transfer agent |
a. Administrative Fees
The Fund pays an administrative fee to FT Services of 0.10% per year of the average daily net assets of the Fund for administrative services including monitoring and rebalancing the percentage of the Fund’s investments in the Underlying Funds.
b. Distribution Fees
The Board has adopted distribution plans for Class 2 and Class 4 shares pursuant to Rule 12b-1 under the 1940 Act. Under the Fund’s compensation distribution plans, the Fund pays Distributors for costs incurred in connection with the servicing, sale and distribution of the Fund’s shares up to 0.35% per year of its average daily net assets of each class. The Board has agreed to limit the current rate to 0.25% per year for Class 2. The plan year, for purposes of monitoring compliance with the maximum annual plan rates, is February 1 through January 31.
c. Transfer Agent Fees
Investor Services, under terms of an agreement, performs shareholder servicing for the Fund and is not paid by the Fund for the services.
d. Investments in Underlying Funds
The Fund invests in Underlying Funds which are managed by affiliates of the Fund’s administrative manager, FT Services. The Fund does not invest in Underlying Funds for the purpose of exercising a controlling influence over the management or policies.
Investments in Underlying Funds for the year ended December 31, 2016, were as follows:
| | | | | | | | | | | | | | | | | | | | | | | | | | | | | | | | |
| Underlying Funds | | Number
of Shares
Held at
Beginning
of Year | | | Gross
Additions | | | Gross
Reductions | | | Number
of Shares
Held at
End of
Year | | | Value at End
of Year | | | Investment
Income | | | Realized
Gain (Loss) | | | %of Underlying
Fund Shares
Outstanding
Held at End of
Year | |
| Non-Controlled Affiliates | | | | | | | | | | | | | | | | | | | | | | | | | | | | | | | | |
Franklin Income VIP Fund, Class 1 | | | 23,343,030 | | | | 1,232,946 | | | | (3,510,673 | ) | | | 21,065,303 | | | $ | 334,517,009 | | | $ | 16,820,344 | | | $ | (2,462,380 | ) | | | 5.34% | |
Franklin Mutual Shares VIP Fund, Class 1 | | | 17,510,038 | | | | 1,720,020 | | | | (2,893,284 | ) | | | 16,336,774 | | | | 333,270,195 | | | | 7,188,696 | | | | 29,468,783a | | | | 7.55% | |
Templeton Growth VIP Fund, Class 1 | | | 25,118,084 | | | | 1,645,407 | | | | (3,014,530 | ) | | | 23,748,961 | | | | 330,823,032 | | | | 7,542,331 | | | | 18,671,323a | | | | 23.83% | |
| | | | | | | | | | | | | | | | | | | | | | | | |
Total | | | | | | | | | | | | | | | | | | $ | 998,610,236 | | | $ | 31,551,371 | | | $ | 45,677,726 | | | | | |
| | | | | | | | | | | | | | | | | | | | | | | | |
aIncludes realized gain distributions received.
FRANKLIN TEMPLETON VARIABLE INSURANCE PRODUCTS TRUST
NOTES TO FINANCIAL STATEMENTS
Franklin Founding Funds Allocation VIP Fund (continued)
3. Transactions with Affiliates (continued)
e. Waiver and Expense Reimbursements
FT Services has contractually agreed in advance to waive or limit its fees and to assume as its own expense certain expenses otherwise payable by the Fund so that the expenses (excluding distribution fees, and acquired fund fees and expenses) for each class of the Fund do not exceed 0.10%, based on the average net assets of each class (other than certain non-routine expenses or costs, including those relating to litigation, indemnification, reorganizations, and liquidations) until April 30, 2017. Total expenses waived or paid are not subject to recapture subsequent to the Fund’s fiscal year end.
4. Expense Offset Arrangement
The Fund has entered into an arrangement with its custodian whereby credits realized as a result of uninvested cash balances are used to reduce a portion of the Fund’s custodian expenses. During the year ended December 31, 2016, there were no credits earned.
5. Income Taxes
The tax character of distributions paid during the years ended December 31, 2016 and 2015, was as follows:
| | | | | | | | |
| | | 2016 | | | 2015 | |
Distributions paid from: | | | | | | | | |
Ordinary income | | $ | 37,605,296 | | | $ | 33,207,641 | |
Long term capital gain | | | 32,481,089 | | | | 1,863,996 | |
| | | | |
| | $ | 70,086,385 | | | $ | 35,071,637 | |
| | | | |
At December 31, 2016, the cost of investments, net unrealized appreciation (depreciation), undistributed ordinary income and undistributed long term capital gains for income tax purposes were as follows:
| | | | |
Cost of investments | | $ | 795,179,667 | |
| | | | |
Unrealized appreciation | | $ | 252,895,095 | |
Unrealized depreciation | | | (49,464,526 | ) |
| | | | |
Net unrealized appreciation (depreciation) | | $ | 203,430,569 | |
| | | | |
Undistributed ordinary income | | $ | 28,250,431 | |
Undistributed long term capital gains | | | 40,376,813 | |
| | | | |
Distributable earnings. | | $ | 68,627,244 | |
| | | | |
Differences between income and/or capital gains as determined on a book basis and a tax basis are primarily due to differing treatment
of wash sales.
6. Investment Transactions
Purchases and sales of Underlying Funds (excluding short term securities) for the year ended December 31, 2016, aggregated $1,000,000 and $149,023,936 respectively.
FRANKLIN TEMPLETON VARIABLE INSURANCE PRODUCTS TRUST
NOTES TO FINANCIAL STATEMENTS
Franklin Founding Funds Allocation VIP Fund (continued)
7. Credit Facility
The Fund, together with other U.S. registered and foreign investment funds (collectively, Borrowers), managed by Franklin Templeton Investments, are borrowers in a joint syndicated senior unsecured credit facility totaling $2 billion (Global Credit Facility) which matured on February 10, 2017. This Global Credit Facility provides a source of funds to the Borrowers for temporary and emergency purposes, including the ability to meet future unanticipated or unusually large redemption requests. Effective February 10, 2017, the Borrowers renewed the Global Credit Facility for a one year term, maturing February 9, 2018, for a total of $2 billion.
Under the terms of the Global Credit Facility, the Fund shall, in addition to interest charged on any borrowings made by the Fund and other costs incurred by the Fund, pay its share of fees and expenses incurred in connection with the implementation and maintenance of the Global Credit Facility, based upon its relative share of the aggregate net assets of all of the Borrowers, including an annual commitment fee of 0.15% based upon the unused portion of the Global Credit Facility. These fees are reflected in other expenses in the Statement of Operations. During the year ended December 31, 2016, the Fund did not use the Global Credit Facility.
8. Fair Value Measurements
The Fund follows a fair value hierarchy that distinguishes between market data obtained from independent sources (observable inputs) and the Fund’s own market assumptions (unobservable inputs). These inputs are used in determining the value of the Fund’s financial instruments and are summarized in the following fair value hierarchy:
| | • | | Level 1 – quoted prices in active markets for identical financial instruments |
| | • | | Level 2 – other significant observable inputs (including quoted prices for similar financial instruments, interest rates, prepayment speed, credit risk, etc.) |
| | • | | Level 3 – significant unobservable inputs (including the Fund’s own assumptions in determining the fair value of
financial instruments) |
The input levels are not necessarily an indication of the risk or liquidity associated with financial instruments at that level.
For movements between the levels within the fair value hierarchy, the Fund has adopted a policy of recognizing the transfers as of the date of the underlying event which caused the movement.
At December 31, 2016, all of the Fund’s investments in financial instruments carried at fair value were valued using Level 1 inputs. For detailed categories, see the accompanying Statement of Investments.
9. Investment Company Reporting Modernization
In October 2016, the U.S. Securities and Exchange Commission adopted new rules and amended existing rules (together, final rules) intended to modernize the reporting and disclosure of information by registered investment companies. In part, the final rules amend Regulation S-X and require standardized, enhanced disclosures about derivatives in investment company financial statements, as well as other amendments. The compliance date for the amendments to Regulation S-X is August 1, 2017. Management is currently evaluating the impact that the adoption of the amendments to Regulation S-X will have on the Fund’s financial statements and related disclosures.
10. Subsequent Events
The Fund has evaluated subsequent events through the issuance of the financial statements and determined that no events have occurred that require disclosure other than those already disclosed in the financial statements.
FRANKLIN TEMPLETON VARIABLE INSURANCE PRODUCTS TRUST
Report of Independent Registered Public Accounting Firm
Franklin Founding Funds Allocation VIP Fund
To the Board of Trustees and Shareholders of Franklin Templeton Variable Insurance Products Trust
In our opinion, the accompanying statement of assets and liabilities, including the statement of investments, and the related statements of operations and of changes in net assets and the financial highlights present fairly, in all material respects, the financial position of Franklin Founding Funds Allocation VIP Fund (the “Fund”) as of December 31, 2016, the results of its operations for the year then ended, the changes in its net assets for each of the two years in the period then ended and the financial highlights for the periods presented, in conformity with accounting principles generally accepted in the United States of America. These financial statements and financial highlights (hereafter referred to as “financial statements”) are the responsibility of the Fund’s management. Our responsibility is to express an opinion on these financial statements based on our audits. We conducted our audits of these financial statements in accordance with the standards of the Public Company Accounting Oversight Board (United States). Those standards require that we plan and perform the audit to obtain reasonable assurance about whether the financial statements are free of material misstatement. An audit includes examining, on a test basis, evidence supporting the amounts and disclosures in the financial statements, assessing the accounting principles used and significant estimates made by management, and evaluating the overall financial statement presentation. We believe that our audits, which included confirmation of securities as of December 31, 2016 by correspondence with the transfer agent and brokers, provide a reasonable basis for our opinion.
PricewaterhouseCoopers LLP
San Francisco, California
February 15, 2017
FRANKLIN TEMPLETON VARIABLE INSURANCE PRODUCTS TRUST
Tax Information (unaudited)
Franklin Founding Funds Allocation VIP Fund
Under Section 852(b)(3)(C) of the Internal Revenue Code (Code), the Fund hereby reports the maximum amount allowable but no less than $32,481,089 as a long term capital gain dividend for the fiscal year ended December 31, 2016.
Under Section 854(b)(1)(A) of the Code, the Fund hereby reports 32.59% of the ordinary income dividends as income qualifying for the dividends received deduction for the fiscal year ended December 31, 2016.
At December 31, 2016, the Fund, a qualified fund of funds under Section 852(g)(2) of the Code, received an allocation of foreign taxes paid from one or more of its underlying funds. The Fund elects to treat foreign taxes paid as allowed under Section 853 of the Code. This election will allow shareholders of record as of the 2017 distribution date, to treat their proportionate share of foreign taxes paid by the underlying funds as having been paid directly by them. The shareholder shall consider these amounts as foreign taxes paid in the tax year in which they receive the Fund distribution.
Franklin Global Real Estate VIP Fund
This annual report for Franklin Global Real Estate VIP Fund covers the fiscal year ended December 31, 2016.
Class 2 Performance Summary as of December 31, 2016
Average annual total return of Class 2 shares* represents the average annual change in value, assuming reinvestment of dividends and capital gains. Average returns smooth out variations in returns, which can be significant; they are not the same as year-by-year results.
| | | | | | | | | | | | |
| Periods ended 12/31/16 | | 1-Year | | | 5-Year | | | 10-Year | |
Average Annual Total Return | | | +0.54% | | | | +8.68% | | | | -0.62% | |
*The Fund has a fee waiver associated with any investment it makes in a Franklin Templeton money fund and/or other Franklin Templeton fund, contractually guaranteed through its current fiscal year-end. Fund investment results reflect the fee waiver; without this waiver, the results would have been lower.
Performance reflects the Fund’s Class 2 operating expenses, but does not include any contract fees, expenses or sales charges. If they had been included, performance would be lower. These charges and deductions, particularly for variable life policies, can have a significant effect on contract values and insurance benefits. See the contract prospectus for a complete description of these expenses, including sales charges.
Performance data represent past performance, which does not guarantee future results. Investment return and principal value will fluctuate, and you may have a gain or loss when you sell your shares. Current performance may differ from figures shown.
Total Return Index Comparison for a Hypothetical $10,000 Investment (1/1/07–12/31/16)
The graph below shows the change in value of a hypothetical $10,000 investment in the Fund over the indicated period and includes reinvestment of any income or distributions. The Fund’s performance* is compared to the performance of the FTSE® EPRA®/NAREIT® Developed Index. One cannot invest directly in an index, and an index is not representative of the Fund’s portfolio. Please see Important Notes to Performance Information preceding the Fund Summaries.
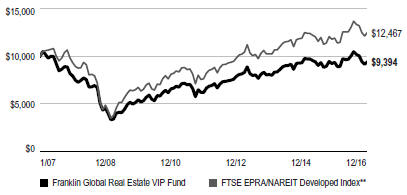
**Source: Morningstar. Please see Index Descriptions following the Fund Summaries.
FRANKLIN GLOBAL REAL ESTATE VIP FUND
Fund Goal and Main Investments
The Fund seeks high total return. Under normal market conditions, the Fund invests at least 80% of its net assets in investments of companies located anywhere in the world that operate in the real estate sector.
Fund Risks
All investments involve risks, including possible loss of principal. The Fund concentrates in real estate securities, which involve special risks, such as declines in the value of real estate and increased susceptibility to adverse economic or regulatory developments affecting the sector. The Fund’s investments in REITs involve additional risks; since REITs typically are invested in a limited number of projects or in a particular market segment, they are more susceptible to adverse developments affecting a single project or market segment than more broadly diversified investments. Foreign investing, especially in emerging markets, involves additional risks such as currency and market volatility, as well as political and social instability. The Fund is actively managed but there is no guarantee that the manager’s investment decisions will produce the desired results. The Fund’s prospectus also includes a description of the main investment risks.
What is a REIT?
A REIT is a type of real estate company that is dedicated to owning and usually operating income-producing real estate properties such as apartments, hotels, industrial properties, office buildings or shopping centers. Equity REITs generally receive income from rents received, are generally operated by experienced property management teams and typically concentrate on a specific geographic region or property type.
Performance Overview
You can find the Fund’s one-year total return in the Performance Summary. In comparison, the FTSE
EPRA/NAREIT Developed Index posted a +4.99% total return for the same period.1
Economic and Market Overview
The global economy grew moderately during the 12-month period despite slower growth in some countries. In this environment, global developed and emerging market stocks, as
measured by the MSCI All Country World Index, rose. Global markets were aided by accommodative monetary policies of various global central banks, improved commodity prices after 2016’s first quarter, finalization of Greece’s new debt deal and generally encouraging global economic data. Further supporting markets were expectations of higher interest rates and inflation in the U.S., driven by talk of expansionary fiscal policies under new U.S. president Donald Trump, and an Organization of the Petroleum Exporting Countries deal to curb oil production. However, these factors were partially offset by a slowdown in China’s economy and declining commodity prices early in the period, geopolitical tensions in certain regions, uncertainty about the U.S. Federal Reserve’s (Fed’s) timing for raising interest rates and worries about the health of European banks. In addition, global economic concerns and the U.K.’s historic referendum to leave the European Union (also known as “Brexit”) contributed to volatility in global stock markets.
The U.S. economy grew in 2016 despite a general decline in private inventory and business investments, which partly offset strength in consumer spending, residential investment and government spending. Manufacturing conditions remained volatile but generally expanded. The services sector also grew for most of the period, contributing to new jobs that helped the unemployment rate decrease from 5.0% in December 2015 to 4.7% at period-end.2 Retail sales generally rose, as did home sales and prices amid declining mortgage rates. At its December meeting, the Fed increased its target range for the federal funds rate to 0.50%–0.75%, as policymakers cited an improvement in U.S. labor markets and higher inflation. The Federal Open Market Committee also hinted at three additional hikes in 2017, and the Fed raised its 2017 U.S. economic growth forecast, while lowering its
unemployment projections.
In Europe, the U.K.’s annualized economic growth accelerated in 2016’s second half, driven by gross fixed capital formation in the third quarter and manufacturing and services in the fourth quarter. Immediate effects of the Brexit vote in June materialized as U.K. stocks declined significantly, the British pound hit a three-decade low amid intensified selling and the U.K.’s credit rating was downgraded. In the eurozone, despite investor concerns about banking sector weakness, low corporate earnings and post-Brexit politics, some regions benefited from rising consumer spending, resulting from a cheaper euro, low inflation and signs of
sustained economic
1. Source: Morningstar. One cannot invest directly in an index, and an index is not representative of the Fund’s portfolio. Please see Index Descriptions following the Fund Summaries.
2. Source: Bureau of Labor Statistics.
The dollar value, number of shares or principal amount, and names of all portfolio holdings are listed in the Fund’s Statement of Investments (SOI).
FRANKLIN GLOBAL REAL ESTATE VIP FUND
Portfolio Composition
Based on Total Net Assets as of 12/31/16
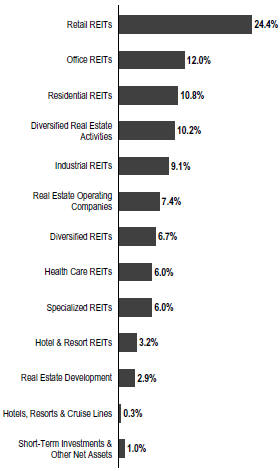
growth. The eurozone grew slightly early in the period, aided by lower oil prices, improved exports and the European Central Bank’s (ECB’s) accommodative monetary policy. However, growth moderated in 2016’s second quarter and improved in the third and fourth quarters. After declining in the beginning of 2016, the eurozone’s annual inflation rate increased gradually to reach its highest reading in three years toward period-end, ending at an estimated 1.1% in December. The ECB cut its benchmark interest rate and expanded its massive bond-buying program in March and August 2016 to boost the region’s slowing growth. Furthermore, at its December meeting, the ECB extended the continuation of its monthly asset purchases from March to December of 2017, but it agreed to scale back the purchase amount beginning in April 2017.
In Asia, Japan’s quarterly gross domestic product grew slower in the third quarter than in the second and first quarters, mainly due to declines in private non-residential and public investments. In January 2016, the Bank of Japan (BOJ) introduced negative interest rates on excess reserves held by financial institutions with the central bank to boost lending and help achieve its inflation target. In July 2016, Japan’s Prime Minister Shinzo Abe announced a higher-than-expected fiscal stimulus to revive the economy, followed by an additional monetary stimulus announcement by the BOJ. The BOJ kept its interest rates unchanged toward period-end; however, it overhauled its monetary policy in September to focus on yield-curve control. The bank further announced that it adjusted its Japanese government bond purchases to maintain the 10-year rate for these bonds near 0%.
In emerging markets, economic growth generally moderated during the period. Brazil’s economy continued to be in recession and the country’s central bank cut its benchmark interest rate in October and November 2016 to spur economic growth. Russia’s economic contraction eased in 2016, following a rebound in oil prices and improved industrial production. The Bank of Russia reduced its key interest rates in June and September of 2016 to revive its economy. China’s economy grew at a stable rate in the first three quarters of 2016 and expanded slightly faster in the fourth quarter, as full-year 2016 growth remained within the government’s targeted range. However, the People’s Bank of China employed monetary easing measures that included cutting the cash reserve requirement ratio for the country’s banks and effectively devaluing the Chinese currency against the U.S. dollar. In India, economic growth marginally increased from July through September 2016 due to slower private consumption growth and increased government spending. Overall, emerging market stocks, as measured by the MSCI Emerging Markets Index, rose during the period.3
Global Real Estate Market Overview
According to the FTSE EPRA/NAREIT Developed Index, in U.S. dollar terms, Norway outpaced the index and led global real estate markets. Canada, Israel and Australia also posted solid results. In contrast, some markets represented in the index lost value, including the U.K., Italy, Ireland and the Guernsey Islands. At period-end, the U.S. was the index’s largest country weighting.
3. Please see Index Descriptions following the Fund Summaries.
FRANKLIN GLOBAL REAL ESTATE VIP FUND
Top 10 Countries
12/31/16
| | | | |
| | | % of Total Net Assets | |
| |
| U.S. | | | 55.0% | |
| Japan | | | 11.3% | |
| Hong Kong | | | 6.7% | |
| Australia | | | 6.3% | |
| U.K. | | | 4.5% | |
| France | | | 3.8% | |
| Germany | | | 3.8% | |
| Singapore | | | 2.3% | |
| Canada | | | 1.8% | |
| Sweden | | | 1.8% | |
Investment Strategy
We seek to limit price volatility by investing across markets and property types and seek to provide a consistently high level of income in our pursuit of high total return. When selecting investments for the Fund’s portfolio, we apply a “bottom-up” stock selection process that incorporates macro-level views in the evaluation process. Our portfolio construction process combines bottom-up analysis of individual stock and real estate market fundamentals and top-down macro overlays to provide country/regional, property type, and company size perspectives in identifying international/local cyclical and thematic trends that highlight investment opportunities.
Manager’s Discussion
During the year, key contributors to the Fund’s performance relative to the FTSE EPRA/NAREIT Developed Index included an overweighting in the specialty sector, with an off-benchmark investment in U.S.-based data center company Coresite Realty proving especially beneficial.4 Shares of Coresite delivered strong performance compared to U.S. property stocks and outperformed the global property benchmark. The company reported strong financial results during the year due to strong leasing results from its data center properties. In the company’s third quarter financial statements, the company reported that funds-from-operations (FFO) per share, a metric used by real estate investment trusts (REITs) to define the cash flow from their operations, increased and revenues rose during the trailing one-year period. The FFO per share financial result was particularly impressive since the
company operates with a much lower leverage ratio than most U.S. REITs. Investors also seemed encouraged by leasing demand for its new data centers as well as the company’s conservative debt level. An overweighting in the industrial property sector also boosted results.5 Shares of Duke Realty appreciated during the reporting period. Similar to other industrial REITs, Duke benefited from the continued strength of the existing industrial fundamentals with limited supply outpaced by healthy tenant demand, especially related to e-commerce. We believe the stock performed well as Duke has become much more focused into major industrials after successfully exiting its suburban office portfolio. We had a favorable view on industrials and a positive outlook given strong fundamentals. Thus, we maintained our overweighted position in Duke. We believe the company remained well positioned to benefit from healthy industrial fundamentals with a substantial pre-leased development pipeline, a respected and strong management team and a solid balance sheet. Other notable contributors included Summit Hotel Properties, a mid-capitalization hotel REIT, which focuses on the premium select-service segment.6 Shares performed well during the reporting period. Despite a challenging backdrop with a negative hotel revenue growth outlook, we believe the stock’s positive performance was largely attributable to the company’s lack of exposure to major gateway cities such as New York City where fundamentals have weakened due to the ongoing supply pressure on pricing, weaker inbound international travel due to a strong U.S. dollar, and the existence of other lodging alternatives. During the period, Summit successfully executed on its portfolio repositioning strategy via accretive acquisitions of properties located outside the top 20 hotel markets. In our analysis, these acquisitions had healthier fundamentals and less competition in terms of asset pricing. As a result, the company assembled, in our view, a much better quality hotel portfolio in non-gateway/non-coastal markets and generated consistently above industry average revenue growth. Based on our analysis, we had an overall unfavorable view on the hotel/resort sector and remained underweighted to this property sector given revenue growth deceleration and negative outlook for the next 12 months, but we maintained our overweighted
position in Summit.
In contrast, key detractors from the Fund’s relative performance included stock selection and an underweighting in
4. Specialty holdings are in office REITs and specialized REITs in the SOI.
5. Industrial property holdings are in industrial REITs in the SOI.
6. Hotel/resort holdings are in hotel and resort REITs and hotels, resorts and cruise lines in the SOI.
FRANKLIN GLOBAL REAL ESTATE VIP FUND
Top 10 Holdings
12/31/16
| | | | |
Company Sector/Industry, Country | | % of Total Net Assets | |
Simon Property Group Inc. Retail REITs, U.S. | | | 5.0% | |
Mitsui Fudosan Co. Ltd. Diversified Real Estate Activities, Japan | | | 2.8% | |
Mitsubishi Estate Co. Ltd. Diversified Real Estate Activities, Japan | | | 2.6% | |
Prologis Inc. Industrial REITs, U.S. | | | 2.5% | |
Unibail-Rodamco SE Retail REITs, France | | | 2.5% | |
AvalonBay Communities Inc. Residential REITs, U.S. | | | 2.2% | |
Ventas Inc. Health Care REITs, U.S. | | | 2.1% | |
Scentre Group Retail REITs, Australia | | | 2.0% | |
Public Storage Specialized REITs, U.S. | | | 2.0% | |
Welltower Inc. Health Care REITs, U.S. | | | 1.9% | |
the office space sector.7 Shares of U.K.-based office REIT Great Portland Estates weakened during the year along with most U.K. property stocks, as Britain unexpectedly voted to leave the European Union. This development led to political turmoil and effectively caused the British pound to decline significantly versus the U.S. dollar. We exited our position in Great Portland during the reporting period, as the stock started flagging on our internal momentum model and as we started to see signs of a decelerating trend in central London office fundamentals along with lowered rental growth expectations. Great Portland, in our opinion, has a strong management team and a healthy balance sheet and was trading at what we considered an attractive discount to net asset value. However, we saw what we considered greater potential in other companies and property types. The Fund’s investment in diversified Japanese REIT Mitsui Fudosan was one of the Fund’s main detractors during the year. Despite its record operating profit and sustained earnings growth in 2016, the company’s share price decline was largely driven by economic factors including weaker economic growth and investors’ cautious outlook on the real estate sector in Japan. Following the Brexit vote in June 2016, investors sold off the company’s shares along with other developers partly due to its redevelopment project in London. There were also investor
concerns about office leasing conditions amid economic uncertainties as well as a large supply scheduled in 2018. However, market sentiment improved since late 2016 and Mitsui Fudosan’s share price rebounded considerably with a rise in the expected inflation rate due to sharp yen deprecation. We maintained our overweighted position in Mitsui Fudosan as the company has largely pre-leased its office project planned in 2018 and new project completions could contribute to ongoing profit growth in the next two years. The company, as one of Japan’s largest property developers, could also be well positioned to benefit if economic conditions in Japan improve. Within the residential sector, our position in Essex Property Trust detracted from performance during the reporting period.8 The company’s shares also performed poorly compared to U.S. property stocks and the U.S. apartment sector. Essex, an owner and operator of apartment communities located on the U.S. west coast had been a leading performer as a result of superior fundamentals for apartments in northern California and sound capital allocation decisions by the management team. However, during the first quarter of 2016, the company’s performance weakened as early signs of a potential slowing in northern California apartment rental growth rates surfaced. Softer conditions ensued due to a combination of new supply in San Francisco and weaker job growth in the technology sector. Positive releasing spreads (the change in rent per square foot between new and expiring leases) in Essex’s portfolio narrowed and the management team ultimately revised its growth earnings guidance down slightly for 2016. We began the year with an overweighted position in Essex, but subsequently modified to an underweighted position as evidence of a softening in fundamentals emerged.
It is important to recognize the effect of currency movements on the Fund’s performance. In general, if the value of the U.S. dollar goes up compared with a foreign currency, an investment traded in that foreign currency will go down in value because it will be worth fewer U.S. dollars. This can have a negative effect on Fund performance. Conversely, when the U.S. dollar weakens in relation to a foreign currency, an investment traded in that foreign currency will increase in value, which can contribute to Fund performance. For the 12 months ended December 31, 2016, the U.S. dollar rose in value relative to most currencies. As a result, the Fund’s performance was negatively affected by the portfolio’s significant investment in securities with non-U.S. currency exposure.
7. Office space holdings are in office REITs and real estate operating companies in the SOI.
8. Residential holdings are in real estate operating companies and residential REITs in the SOI.
FRANKLIN GLOBAL REAL ESTATE VIP FUND
Thank you for your participation in Franklin Global Real Estate VIP Fund. We look forward to serving your future investment needs.
The foregoing information reflects our analysis, opinions and portfolio holdings as of December 31, 2016, the end of the reporting period. The way we implement our main investment strategies and the resulting portfolio holdings may change depending on factors such as market and economic conditions. These opinions may not be relied upon as investment advice or an offer for a particular security. The information is not a complete analysis of every aspect of any market, country, industry, security or the Fund. Statements of fact are from sources considered reliable, but the investment manager makes no representation or warranty as to their completeness or accuracy. Although historical performance is no guarantee of future results, these insights may help you understand our investment management philosophy.
FRANKLIN GLOBAL REAL ESTATE VIP FUND
Class 2 Fund Expenses
As an investor in a variable insurance contract (Contract) that indirectly provides for investment in an underlying mutual fund, you can incur transaction and/or ongoing expenses at both the Fund level and the Contract Level: (1) transaction expenses can include sales charges (loads) on purchases, surrender fees, transfer fees and premium taxes; and (2) ongoing expenses can include management fees, distribution and service (12b-1) fees, contract fees, annual maintenance fees, mortality and expense risk fees and other fees and expenses. All mutual funds and Contracts have some types of ongoing expenses. The table below shows Fund-level ongoing expenses and can help you understand these costs and compare them with those of other mutual funds offered through the Contract. The table assumes a $1,000 investment held for the six months indicated. Please refer to the Fund prospectus for additional information on operating expenses.
Actual Fund Expenses
The table below provides information about the actual account values and actual expenses in the columns under the heading “Actual.” In these columns the Fund’s actual return, which includes the effect of ongoing Fund expenses but does not include the effect of ongoing Contract expenses, is used to calculate the “Ending Account Value.”
You can estimate the Fund-level expenses you paid during the period by following these steps (of course, your account value and expenses will differ from those in this illustration):
| | Divide your account value by $1,000 |
| | (if your account had an $8,600 value, |
| | then $8,600 ÷ $1,000 = 8.6). |
| | Then multiply the result by the number under the headings “Actual” and “Fund-Level Expenses Paid During Period” (if Fund-Level Expenses Paid During Period were $ 7.50, then 8.6 x $7.50 = $64.50). |
In this illustration, the estimated expenses paid this period at the Fund level are $64.50.
Hypothetical Example for Comparison
with Other Mutual Funds
Under the heading “Hypothetical” in the table, information is provided about hypothetical account values and hypothetical expenses based on the Fund’s actual expense ratio and an assumed rate of return of 5% per year before expenses, which is not the Fund’s actual return. This information may not be used to estimate the actual ending account balance or expenses you paid for the period, but it can help you compare ongoing costs of investing in the Fund with those of other mutual funds offered through the Contract. To do so, compare this 5% hypothetical example with the 5% hypothetical examples that appear in the shareholder reports of other funds offered through the Contract.
Please note that expenses shown in the table are meant to highlight ongoing costs at the Fund level only and do not reflect any ongoing expenses at the Contract level, or transaction expenses at either the Fund or Contract levels. In addition, while the Fund does not have transaction expenses, if the transaction and ongoing expenses at the Contract level were included, the expenses shown below would be higher. You should consult your Contract prospectus or disclosure document for more information.
| | | | | | | | | | | | | | | | | | | | | | | | |
| | | | | | Actual
(actual return after expenses) | | | Hypothetical
(5% annual return before expenses) | | | | |
| Share Class | |
| Beginning Account
Value 7/1/16 |
| |
| Ending Account
Value 12/31/16 |
| |
| Fund-Level
Expenses Paid
During Period
7/1/16–12/31/16 |
1,2 | |
| Ending Account
Value 12/31/16 |
| |
| Fund-Level
Expenses PaidDuring Period
7/1/16–12/31/16 |
1,2 | |
| Net
Annualized
Expense
Ratio |
2 |
Class 2 | | | $1,000 | | | | $940.20 | | | | $6.58 | | | | $1,018.35 | | | | $6.85 | | | | 1.35% | |
1. Expenses are equal to the annualized expense ratio for the six-month period as indicated above–in the far right column–multiplied by the simple average account value over the period indicated, and then multiplied by 184/366 to reflect the one-half year period.
2. Reflects expenses after fee waivers and expense reimbursements. Does not include any ongoing expenses of the Contract for which the Fund is an investment option or acquired fund fees and expenses.
VIP2 P1, P2, P4 07/16
SUPPLEMENT DATED JULY 18, 2016
TO THE PROSPECTUSES
DATED MAY 1, 2016
OF
FRANKLIN GLOBAL REAL ESTATE VIP FUND
FRANKLIN SMALL CAP VALUE VIP FUND
(Series of Franklin Templeton Variable Insurance Products Trust)
IMPORTANT NOTICE REGARDING CHANGE IN INVESTMENT POLICY
The prospectus of Franklin Small Cap Value VIP Fund is amended as follows:
I. The first paragraph under the “FUND SUMMARIES” – “Principal Investment Strategies” section, on page FSV-S1, is replaced with the following:
Under normal market conditions, the Fund invests at least 80% of its net assets in investments of small-capitalization (small-cap) companies. Small-cap companies are companies with market capitalizations (the total market value of a company’s outstanding stock) under $3.5 billion at the time of purchase. Effective September 30, 2016, the definition of small-cap companies will be revised to read as follows: Small-cap companies are companies with market capitalizations (the total market value of a company’s outstanding stock) not exceeding either: 1) the highest market capitalization in the Russell 2000 Index; or 2) the 12-month average of the highest market capitalization in the Russell 2000 Index, whichever is greater, at the time of purchase. As of May 31, 2016, the highest market capitalization in the Russell 2000 Index was $5.96 billion.
II. The “Performance” section, on page FSV-S3, is revised to add the following:
| | | | | | | | | | | | |
| | | 1 Year | | | 5 Years | | | 10 Years | |
Russell 2000 Value Index (index reflects no deduction for fees, expenses or taxes)1 | | | -7.47% | | | | 7.67% | | | | 5.58% | |
1. Performance figures as of December 31, 2015. The Russell 2000 Value Index is replacing the Russell 2500 Value Index as the Fund’s benchmark. The investment manager believes the composition of the Russell 2000 Value Index more accurately reflects the Fund’s holdings.
No one index is representative of the Fund’s portfolio.
III. Effective September 30, 2016, the first paragraph under the “FUND DETAILS” – “Principal Investment Policies and Practices” section on page FSV D-1 is replaced with the following:
Under normal market conditions, the Fund invests at least 80% of its net assets in investments of small-capitalization (small-cap) companies. Shareholders will be given at least 60 days’ advance notice of any change to this 80% policy. Small-cap companies are companies with market capitalizations (the total market value of a company’s outstanding stock) under $3.5 billion at the time of purchase. Effective September 30, 2016, the definition of small-cap companies will be revised to read as follows: Under normal market conditions, the Fund invests at least 80% of its net assets in investments of small-capitalization (small-cap) companies. Small-cap companies are companies with market capitalizations (the total market value of a company’s outstanding stock) not exceeding either: 1) the highest market capitalization in the Russell 2000 Index; or 2) the 12-month average of the highest market capitalization in the Russell 2000 Index, whichever is greater, at the time of purchase. As of May 31, 2016, the highest market capitalization in the Russell 2000 Index was $5.96 billion.
The prospectus of Franklin Global Real Estate VIP Fund is amended as follows:
The “FUND DETAILS” – “Management” section, on page FGR D-6, is revised to show the address of Franklin Templeton Institutional, LLC (FT Institutional) as 280 Park Avenue, New York, NY 10017.
Please keep this supplement with your prospectus for future reference.
VIP3 P1_P2_P4 09/16
SUPPLEMENT DATED SEPTEMBER 28, 2016
TO THE PROSPECTUSES
DATED MAY 1, 2016
OF
FRANKLIN GLOBAL REAL ESTATE VIP FUND
FRANKLIN INCOME VIP FUND
FRANKLIN MUTUAL GLOBAL DISCOVERY VIP FUND
FRANKLIN MUTUAL SHARES VIP FUND
TEMPLETON FOREIGN VIP FUND
TEMPLETON GROWTH VIP FUND
(Series of Franklin Templeton Variable Insurance Products Trust)
The Prospectus is amended as follows:
I. For the Franklin Mutual Global Discovery VIP Fund, Templeton Foreign VIP Fund and Templeton Growth VIP Fund, the following is added to the “Fund Summary – Principal Risks” section:
Regional Focus Because the Fund may invest at least a significant portion of its assets in companies in a specific region, including Europe, the Fund is subject to greater risks of adverse developments in that region and/or the surrounding regions than a fund that is more broadly diversified geographically. Political, social or economic disruptions in the region, even in countries in which the Fund is not invested, may adversely affect the value of securities values held by the Fund. Current political uncertainty surrounding the European Union (EU) and its membership, including the 2016 referendum in which the United Kingdom voted to exit the EU, may increase market volatility. The financial instability of some countries in the EU, including Greece, Italy and Spain, together with the risk of that impacting other more stable countries may increase the economic risk of investing in companies in Europe.
II. For all funds (excluding the Franklin Mutual Global Discovery VIP Fund and Franklin Mutual Shares VIP Fund), the “Fund Details – Principal Risks – Foreign Securities” section is revised to add the following as a second paragraph to the “Regional” sub-section:
The risk of investments in Europe may be heightened due to the 2016 referendum in which the United Kingdom voted to exit the European Union (EU). Political, economic and legal uncertainty may cause increased market volatility. In addition, if one or more countries were to exit the EU or abandon the use of the Euro as a currency, the value of investments associated with those countries or the Euro could decline significantly and unpredictably and it would likely cause additional market disruption globally and introduce new legal and regulatory uncertainties.
III. For the Franklin Mutual Global Discovery VIP Fund and Franklin Mutual Shares VIP Fund, the “Fund Details – Principal Risks
– Foreign Securities” section is revised to add the following:
Regional. Adverse conditions in a certain region or country can adversely affect securities of issuers in other countries whose economies appear to be unrelated. To the extent that the Fund invests a significant portion of its assets in a specific geographic region or a particular country, the Fund will generally have more exposure to the specific regional or country economic risks. In the event of economic or political turmoil or a deterioration of diplomatic relations in a region or country where a substantial portion of the Fund’s assets are invested, the Fund may experience substantial illiquidity or reduction in the value of the Fund’s investments.
The risk of investments in Europe may be heightened due to the 2016 referendum in which the United Kingdom voted to exit the European Union (EU). Political, economic and legal uncertainty may cause increased market volatility. In addition, if one or more countries were to exit the EU or abandon the use of the Euro as a currency, the value of investments associated with those countries or the Euro could decline significantly and unpredictably and it would likely cause additional market disruption globally and introduce new legal and regulatory uncertainties.
Please keep this supplement with your prospectus for future reference.
FRANKLIN TEMPLETON VARIABLE INSURANCE PRODUCTS TRUST
Financial Highlights
Franklin Global Real Estate VIP Fund
| | | | | | | | | | | | | | | | | | | | |
| | | Year Ended December 31, | |
| | | 2016 | | | 2015 | | | 2014 | | | 2013 | | | 2012 | |
| Class 1 | | | | | | | | | | | | | | | | | | | | |
Per share operating performance (for a share outstanding throughout the year) | | | | | | | | | | | | | | | | | | | | |
| | | | | |
Net asset value, beginning of year | | | $15.93 | | | | $16.36 | | | | $14.29 | | | | $14.66 | | | | $11.47 | |
| | | | |
| | | | | |
Income from investment operationsa: | | | | | | | | | | | | | | | | | | | | |
| | | | | |
Net investment incomeb | | | 0.30c | | | | 0.24 | | | | 0.26 | | | | 0.24 | | | | 0.25 | |
| | | | | |
Net realized and unrealized gains (losses) | | | (0.16 | ) | | | (0.12 | ) | | | 1.92 | | | | 0.13 | | | | 2.94 | |
| | | | |
| | | | | |
Total from investment operations | | | 0.14 | | | | 0.12 | | | | 2.18 | | | | 0.37 | | | | 3.19 | |
| | | | |
| | | | | |
Less distributions from net investment income and net foreign currency gains | | | (0.24 | ) | | | (0.55 | ) | | | (0.11 | ) | | | (0.74 | ) | | | — | |
| | | | |
| | | | | |
Net asset value, end of year. | | | $15.83 | | | | $15.93 | | | | $16.36 | | | | $14.29 | | | | $14.66 | |
| | | | |
| | | | | |
Total returnd | | | 0.81% | | | | 0.83% | | | | 15.27% | | | | 2.61% | | | | 27.81% | |
| | | | | |
| Ratios to average net assets | | | | | | | | | | | | | | | | | | | | |
| | | | | |
Expenses before waiver and payments by affiliates | | | 1.11% | | | | 1.11% | | | | 1.10% | | | | 1.10% | | | | 1.11% | |
| | | | | |
Expenses net of waiver and payments by affiliates | | | 1.11%e | | | | 1.11% | | | | 1.10%f | | | | 1.10% | | | | 1.07% | |
| | | | | |
Net investment income | | | 1.99%c | | | | 1.49% | | | | 1.66% | | | | 1.62% | | | | 1.92% | |
| | | | | |
| Supplemental data | | | | | | | | | | | | | | | | | | | | |
| | | | | |
Net assets, end of year (000’s) | | | $821 | | | | $32,161 | | | | $35,686 | | | | $34,276 | | | | $38,329 | |
| | | | | |
Portfolio turnover rate | | | 28.53%g | | | | 23.35% | | | | 16.67% | | | | 21.29% | | | | 22.29% | |
aThe amount shown for a share outstanding throughout the period may not correlate with the Statement of Operations for the period due to the timing of sales and repurchases of the Fund’s shares in relation to income earned and/or fluctuating fair value of the investments of the Fund.
bBased on average daily shares outstanding.
cNet investment income per share includes approximately $0.06 per share related to income received in the form of special dividends in connection with certain Fund holdings. Excluding this amount, the ratio of net investment income to average net assets would have been 1.59%.
dTotal return does not include fees, charges or expenses imposed by the variable annuity and life insurance contracts for which Franklin Templeton Variable Insurance Products Trust serves as an underlying investment vehicle.
eBenefit of waiver and payments by affiliates rounds to less than 0.01%.
fBenefit of expense reduction rounds to less than 0.01%.
gExcludes the value of portfolio securities delivered as a result of a redemption in-kind. See Note 9.
| | | | |
| FGR-10 | | | Annual Report | The accompanying notes are an integral part of these financial statements. | | |
FRANKLIN TEMPLETON VARIABLE INSURANCE PRODUCTS TRUST
FINANCIAL HIGHLIGHTS
Franklin Global Real Estate VIP Fund (continued)
| | | | | | | | | | | | | | | | | | | | |
| | | Year Ended December 31, | |
| | | 2016 | | | 2015 | | | 2014 | | | 2013 | | | 2012 | |
| Class 2 | | | | | | | | | | | | | | | | | | | | |
Per share operating performance (for a share outstanding throughout the year) | | | | | | | | | | | | | | | | | | | | |
| | | | | |
Net asset value, beginning of year | | | $15.52 | | | | $15.95 | | | | $13.93 | | | | $14.27 | | | | $11.20 | |
| | | | |
| | | | | |
Income from investment operationsa: | | | | | | | | | | | | | | | | | | | | |
| | | | | |
Net investment incomeb | | | 0.28c | | | | 0.20 | | | | 0.21 | | | | 0.20 | | | | 0.21 | |
| | | | | |
Net realized and unrealized gains (losses) | | | (0.19 | ) | | | (0.12 | ) | | | 1.88 | | | | 0.13 | | | | 2.86 | |
| | | | |
| | | | | |
Total from investment operations | | | 0.09 | | | | 0.08 | | | | 2.09 | | | | 0.33 | | | | 3.07 | |
| | | | |
| | | | | |
Less distributions from net investment income and net foreign currency gains | | | (0.19 | ) | | | (0.51 | ) | | | (0.07 | ) | | | (0.67 | ) | | | — | |
| | | | |
| | | | | |
Net asset value, end of year. | | | $15.42 | | | | $15.52 | | | | $15.95 | | | | $13.93 | | | | $14.27 | |
| | | | |
| | | | | |
Total returnd | | | 0.54% | | | | 0.57% | | | | 15.01% | | | | 2.32% | | | | 27.41% | |
| | | | | |
| Ratios to average net assets | | | | | | | | | | | | | | | | | | | | |
| | | | | |
Expenses before waiver and payments by affiliates | | | 1.36% | | | | 1.36% | | | | 1.35% | | | | 1.35% | | | | 1.36% | |
| | | | | |
Expenses net of waiver and payments by affiliates | | | 1.36%e | | | | 1.36% | | | | 1.35%f | | | | 1.35% | | | | 1.32% | |
| | | | | |
Net investment income | | | 1.74%c | | | | 1.24% | | | | 1.41% | | | | 1.37% | | | | 1.67% | |
| | | | | |
| Supplemental data | | | | | | | | | | | | | | | | | | | | |
| | | | | |
Net assets, end of year (000’s) | | | $193,707 | | | | $287,473 | | | | $333,554 | | | | $328,825 | | | | $344,044 | |
| | | | | |
Portfolio turnover rate | | | 28.53%g | | | | 23.35% | | | | 16.67% | | | | 21.29% | | | | 22.29% | |
aThe amount shown for a share outstanding throughout the period may not correlate with the Statement of Operations for the period due to the timing of sales and repurchases of the Fund’s shares in relation to income earned and/or fluctuating fair value of the investments of the Fund.
bBased on average daily shares outstanding.
cNet investment income per share includes approximately $0.06 per share related to income received in the form of special dividends in connection with certain Fund holdings. Excluding this amount, the ratio of net investment income to average net assets would have been 1.34%.
dTotal return does not include fees, charges or expenses imposed by the variable annuity and life insurance contracts for which Franklin Templeton Variable Insurance Products Trust serves as an underlying investment vehicle.
eBenefit of waiver and payments by affiliates rounds to less than 0.01%.
fBenefit of expense reduction rounds to less than 0.01%.
gExcludes the value of portfolio securities delivered as a result of a redemption in-kind. See Note 9.
| | | | | | |
| | | The accompanying notes are an integral part of these financial statements. | Annual Report | | | FGR-11 | |
FRANKLIN TEMPLETON VARIABLE INSURANCE PRODUCTS TRUST
Statement of Investments, December 31, 2016
| | | | | | | | | | | | | | |
Franklin Global Real Estate VIP Fund | |
| | | | | Country | | | Shares | | | Value | |
| | | Common Stocks 99.0% | | | | | | | | | |
| | | Diversified Real Estate Activities 10.2% | | | | | | | | | |
| | CapitaLand Ltd. | | | Singapore | | | | 882,595 | | | $ | 1,840,898 | |
| | City Developments Ltd. | | | Singapore | | | | 217,847 | | | | 1,245,786 | |
| | Mitsubishi Estate Co. Ltd. | | | Japan | | | | 252,356 | | | | 5,024,668 | |
| | Mitsui Fudosan Co. Ltd. | | | Japan | | | | 239,578 | | | | 5,543,937 | |
| | New World Development Co. Ltd. | | | Hong Kong | | | | 1,765,585 | | | | 1,867,019 | |
| | Sun Hung Kai Properties Ltd. | | | Hong Kong | | | | 164,171 | | | | 2,074,764 | |
| | Tokyo Tatemono Co. Ltd. | | | Japan | | | | 106,632 | | | | 1,425,774 | |
| | The Wharf Holdings Ltd. | | | Hong Kong | | | | 120,818 | | | | 803,168 | |
| | | | | | | | | | | | | | |
| | | | | | | | | | | | | 19,826,014 | |
| | | | | | | | | | | | | | |
| | | Diversified REITs 6.7% | | | | | | | | | |
| | Activia Properties Inc. | | | Japan | | | | 274 | | | | 1,291,535 | |
| | Hispania Activos Inmobiliarios SOCIMI SA | | | Spain | | | | 115,361 | | | | 1,358,881 | |
| | Hulic REIT Inc. | | | Japan | | | | 620 | | | | 1,040,096 | |
| | Kenedix Office Investment Corp. | | | Japan | | | | 309 | | | | 1,776,364 | |
| | Land Securities Group PLC | | | United Kingdom | | | | 183,501 | | | | 2,409,647 | |
| | Spirit Realty Capital Inc. | | | United States | | | | 137,708 | | | | 1,495,509 | |
| | United Urban Investment Corp. | | | Japan | | | | 832 | | | | 1,266,203 | |
| | VEREIT Inc. | | | United States | | | | 280,670 | | | | 2,374,468 | |
| | | | | | | | | | | | | | |
| | | | | | | | | | | | | 13,012,703 | |
| | | | | | | | | | | | | | |
| | | Health Care REITs 6.0% | | | | | | | | | |
| | HCP Inc. | | | United States | | | | 93,989 | | | | 2,793,353 | |
| | Physicians Realty Trust | | | United States | | | | 60,681 | | | | 1,150,512 | |
| | Ventas Inc. | | | United States | | | | 65,517 | | | | 4,096,123 | |
| | Welltower Inc. | | | United States | | | | 55,376 | | | | 3,706,315 | |
| | | | | | | | | | | | | | |
| | | | | | | | | | | | | 11,746,303 | |
| | | | | | | | | | | | | | |
| | | Hotel & Resort REITs 3.2% | | | | | | | | | |
| | Hoshino Resorts REIT Inc. | | | Japan | | | | 141 | | | | 735,789 | |
| | Host Hotels & Resorts Inc. | | | United States | | | | 137,406 | | | | 2,588,729 | |
| | Summit Hotel Properties Inc. | | | United States | | | | 95,514 | | | | 1,531,089 | |
| | Sunstone Hotel Investors Inc. | | | United States | | | | 84,309 | | | | 1,285,712 | |
| | | | | | | | | | | | | | |
| | | | | | | | | | | | | 6,141,319 | |
| | | | | | | | | | | | | | |
| | | Hotels, Resorts & Cruise Lines 0.3% | | | | | | | | | |
| | Hilton Worldwide Holdings Inc. | | | United States | | | | 21,824 | | | | 593,613 | |
| | | | | | | | | | | | | | |
| | | Industrial REITs 9.1% | | | | | | | | | |
| | Duke Realty Corp. | | | United States | | | | 99,593 | | | | 2,645,190 | |
| | First Industrial Realty Trust Inc. | | | United States | | | | 66,153 | | | | 1,855,592 | |
| a | | Frasers Logistics & Industrial Trust | | | Singapore | | | | 1,073,866 | | | | 686,046 | |
| | Goodman Group | | | Australia | | | | 360,050 | | | | 1,852,460 | |
| | Mapletree Logistics Trust | | | Singapore | | | | 1,015,365 | | | | 715,293 | |
| | Nippon Prologis REIT Inc. | | | Japan | | | | 643 | | | | 1,314,108 | |
| | PLA Administradora Industrial S de RL de CV | | | Mexico | | | | 541,807 | | | | 682,485 | |
| | Prologis Inc. | | | United States | | | | 93,469 | | | | 4,934,228 | |
| | Rexford Industrial Realty Inc. | | | United States | | | | 50,374 | | | | 1,168,173 | |
| | Segro PLC | | | United Kingdom | | | | 322,476 | | | | 1,819,766 | |
| | | | | | | | | | | | | | |
| | | | | | | | | | | | | 17,673,341 | |
| | | | | | | | | | | | | | |
| | | Office REITs 12.0% | | | | | | | | | |
| | Alexandria Real Estate Equities Inc. | | | United States | | | | 27,021 | | | | 3,002,844 | |
| | Boston Properties Inc. | | | United States | | | | 27,785 | | | | 3,494,797 | |
| | Brandywine Realty Trust | | | United States | | | | 71,795 | | | | 1,185,335 | |
FRANKLIN TEMPLETON VARIABLE INSURANCE PRODUCTS TRUST
STATEMENT OF INVESTMENTS
Franklin Global Real Estate VIP Fund (continued)
| | | | | | | | | | | | | | |
| | | | | Country | | | Shares | | | Value | |
| | | Common Stocks (continued) | | | | | | | | | |
| | | Office REITs (continued) | | | | | | | | | |
| | Derwent London PLC | | | United Kingdom | | | | 41,697 | | | $ | 1,423,823 | |
| | Dexus Property Group | | | Australia | | | | 315,963 | | | | 2,193,349 | |
| | Highwoods Properties Inc. | | | United States | | | | 41,710 | | | | 2,127,627 | |
| | Japan Real Estate Investment Corp. | | | Japan | | | | 322 | | | | 1,754,686 | |
| | Kilroy Realty Corp. | | | United States | | | | 33,444 | | | | 2,448,770 | |
| | Mack-Cali Realty Corp. | | | United States | | | | 59,010 | | | | 1,712,470 | |
| | SL Green Realty Corp. | | | United States | | | | 22,222 | | | | 2,389,976 | |
| | Vornado Realty Trust | | | United States | | | | 15,827 | | | | 1,651,864 | |
| | | | | | | | | | | | | | |
| | | | | | | | | | | | | 23,385,541 | |
| | | | | | | | | | | | | | |
| | | Real Estate Development 2.9% | | | | | | | | | |
| | Cheung Kong Property Holdings Ltd. | | | Hong Kong | | | | 544,627 | | | | 3,339,611 | |
| | China Overseas Land & Investment Ltd. | | | China | | | | 190,685 | | | | 505,329 | |
| | China Resources Land Ltd. | | | China | | | | 232,016 | | | | 521,808 | |
| | Sino Land Co. Ltd. | | | Hong Kong | | | | 803,506 | | | | 1,204,042 | |
| | | | | | | | | | | | | | |
| | | | | | | | | | | | | 5,570,790 | |
| | | | | | | | | | | | | | |
| | | Real Estate Operating Companies 7.4% | | | | | | | | | |
| | ADO Properties SA | | | Germany | | | | 14,287 | | | | 481,200 | |
| b | | ADO Properties SA, 144A | | | Germany | | | | 36,157 | | | | 1,217,801 | |
| | Deutsche Wohnen AG | | | Germany | | | | 91,040 | | | | 2,858,442 | |
| | Fabege AB | | | Sweden | | | | 77,519 | | | | 1,267,134 | |
| | First Capital Realty Inc. | | | Canada | | | | 60,264 | | | | 927,656 | |
| | Hemfosa Fastigheter AB | | | Sweden | | | | 106,166 | | | | 990,659 | |
| | Hufvudstaden AB, A | | | Sweden | | | | 83,394 | | | | 1,317,393 | |
| | Hysan Development Co. Ltd. | | | Hong Kong | | | | 290,065 | | | | 1,198,863 | |
| | Unite Group PLC | | | United Kingdom | | | | 185,086 | | | | 1,381,669 | |
| | Vonovia SE | | | Germany | | | | 85,553 | | | | 2,782,033 | |
| | | | | | | | | | | | | | |
| | | | | | | | | | | | | 14,422,850 | |
| | | | | | | | | | | | | | |
| | | Residential REITs 10.8% | | | | | | | | | |
| | American Homes 4 Rent, A | | | United States | | | | 114,613 | | | | 2,404,581 | |
| | Apartment Investment & Management Co., A | | | United States | | | | 53,790 | | | | 2,444,755 | |
| | AvalonBay Communities Inc. | | | United States | | | | 24,189 | | | | 4,285,081 | |
| | Camden Property Trust | | | United States | | | | 20,600 | | | | 1,731,842 | |
| | Canadian Apartment Properties REIT | | | Canada | | | | 69,775 | | | | 1,630,058 | |
| | Education Realty Trust Inc. | | | United States | | | | 34,664 | | | | 1,466,287 | |
| | Equity Lifestyle Properties Inc. | | | United States | | | | 29,458 | | | | 2,123,922 | |
| | Equity Residential | | | United States | | | | 36,633 | | | | 2,357,700 | |
| | Essex Property Trust Inc. | | | United States | | | | 4,252 | | | | 988,590 | |
| | Invincible Investment Corp. | | | Japan | | | | 1,721 | | | | 775,882 | |
| | UDR Inc. | | | United States | | | | 23,857 | | | | 870,303 | |
| | | | | | | | | | | | | | |
| | | | | | | | | | | | | 21,079,001 | |
| | | | | | | | | | | | | | |
| | | Retail REITs 24.4% | | | | | | | | | |
| | Federal Realty Investment Trust | | | United States | | | | 7,638 | | | | 1,085,436 | |
| | General Growth Properties Inc. | | | United States | | | | 62,474 | | | | 1,560,601 | |
| | Hammerson PLC | | | United Kingdom | | | | 235,805 | | | | 1,664,430 | |
| | Kimco Realty Corp. | | | United States | | | | 88,149 | | | | 2,217,829 | |
| | Klepierre | | | France | | | | 67,337 | | | | 2,645,967 | |
| | Link REIT | | | Hong Kong | | | | 395,237 | | | | 2,568,824 | |
| | The Macerich Co. | | | United States | | | | 11,089 | | | | 785,545 | |
| | National Retail Properties Inc. | | | United States | | | | 30,933 | | | | 1,367,239 | |
| | Realty Income Corp. | | | United States | | | | 52,117 | | | | 2,995,685 | |
FRANKLIN TEMPLETON VARIABLE INSURANCE PRODUCTS TRUST
STATEMENT OF INVESTMENTS
Franklin Global Real Estate VIP Fund (continued)
| | | | | | | | | | | | | | |
| | | | | Country | | | Shares | | | Value | |
| | | Common Stocks (continued) | | | | | | | | | |
| | | Retail REITs (continued) | | | | | | | | | |
| | Regency Centers Corp. | | | United States | | | | 36,539 | | | $ | 2,519,364 | |
| | Retail Properties of America Inc., A | | | United States | | | | 95,100 | | | | 1,457,883 | |
| | Scentre Group | | | Australia | | | | 1,139,061 | | | | 3,813,831 | |
| | Simon Property Group Inc. | | | United States | | | | 54,326 | | | | 9,652,100 | |
| | Smart Real Estate Investment Trust | | | Canada | | | | 43,230 | | | | 1,039,542 | |
| | Unibail-Rodamco SE | | | France | | | | 20,031 | | | | 4,779,123 | |
| | Vicinity Centres | | | Australia | | | | 712,030 | | | | 1,536,265 | |
| | Washington Prime Group Inc. | | | United States | | | | 78,659 | | | | 818,840 | |
| | Weingarten Realty Investors | | | United States | | | | 58,729 | | | | 2,101,911 | |
| | Westfield Corp. | | | Australia | | | | 421,523 | | | | 2,853,124 | |
| | | | | | | | | | | | | | |
| | | | | | | | | | | | | 47,463,539 | |
| | | | | | | | | | | | | | |
| | | Specialized REITs 6.0% | | | | | | | | | |
| | Coresite Realty Corp. | | | United States | | | | 18,069 | | | | 1,434,136 | |
| | CubeSmart | | | United States | | | | 57,893 | | | | 1,549,796 | |
| a | | CyrusOne Inc. | | | United States | | | | 15,167 | | | | 678,420 | |
| | Digital Realty Trust Inc. | | | United States | | | | 31,868 | | | | 3,131,350 | |
| | Extra Space Storage Inc. | | | United States | | | | 12,700 | | | | 980,948 | |
| | Public Storage | | | United States | | | | 17,044 | | | | 3,809,334 | |
| | | | | | | | | | | | | | |
| | | | | | | | | | | | | 11,583,984 | |
| | | | | | | | | | | | | | |
| | | Total Common Stocks (Cost $134,975,596) | | | | | | | | 192,498,998 | |
| | | | | | | | | | | | | | |
| | | | | | | | Principal
Amount | | | | |
| | Short Term Investments (Cost $1,413,605) 0.7% | | | | | | | | | | | | |
| | | Repurchase Agreements 0.7% | | | | | | | | | |
| c | | Joint Repurchase Agreement, 0.437%, 1/03/17 (Maturity Value $1,413,674) | | | | | | | | | | | | |
| | BNP Paribas Securities Corp. (Maturity Value $594,238) | | | | | | | | | | | | |
| | Deutsche Bank Securities Inc. (Maturity Value $74,260) | | | | | | | | | | | | |
| | HSBC Securities (USA) Inc. (Maturity Value $594,238) | | | | | | | | | | | | |
| | Merrill Lynch, Pierce, Fenner & Smith Inc. (Maturity Value $150,938) Collateralized by U.S. Government Agency Securities, 0.00% - 1.75%, 6/09/17 - 2/26/19; dU.S. Treasury Bill, 5/04/17 - 5/25/17; U.S. Treasury Note, 0.50% - 3.50%, 12/31/16 - 8/31/21; and U.S. Treasury Note, Index Linked, 1.375%, 7/15/18 (valued at $1,442,206) | | | United States | | | $ | 1,413,605 | | | | 1,413,605 | |
| | | | | | | | | | | | | | |
| | Total Investments (Cost $136,389,201) 99.7% | | | | | | | | | | | 193,912,603 | |
| | Other Assets, less Liabilities 0.3% | | | | | | | | | | | 615,380 | |
| | | | | | | | | | | | | | |
| | Net Assets 100.0% | | | | | | | | | | $ | 194,527,983 | |
| | | | | | | | | | | | | | |
See Abbreviations on page FGR- 26.
aNon-income producing.
bSecurity was purchased pursuant to Rule 144A under the Securities Act of 1933 and may be sold in transactions exempt from registration only to qualified institutional buyers or in a public offering registered under the Securities Act of 1933. This security has been deemed liquid under guidelines approved by the Trust’s Board of Trustees. At December 31, 2016, the value of this security was $1,217,801, representing 0.6% of net assets.
cSee Note 1(c) regarding joint repurchase agreement.
dThe security was issued on a discount basis with no stated coupon rate.
| | | | |
| FGR-14 | | Annual Report | The accompanying notes are an integral part of these financial statements. | | |
FRANKLIN TEMPLETON VARIABLE INSURANCE PRODUCTS TRUST
Financial Statements
Statement of Assets and Liabilities
December 31, 2016
| | | | |
| | | Franklin Global
Real Estate VIP Fund | |
Assets: | | | | |
Investments in securities: | | | | |
Cost - Unaffiliated issuers | | $ | 134,975,596 | |
Cost - Repurchase agreements | | | 1,413,605 | |
| | | | |
Total cost of investments. | | $ | 136,389,201 | |
| | | | |
Value - Unaffiliated issuers | | $ | 192,498,998 | |
Value - Repurchase agreements | | | 1,413,605 | |
| | | | |
Total value of investments | | | 193,912,603 | |
Cash | | | 765 | |
Foreign currency, at value (cost $2,330) | | | 2,331 | |
Receivables: | | | | |
Capital shares sold | | | 8,291 | |
Dividends | | | 897,163 | |
European Union tax reclaims. | | | 75,993 | |
Other assets | | | 25 | |
| | | | |
Total assets | | | 194,897,171 | |
| | | | |
Liabilities: | | | | |
Payables: | | | | |
Capital shares redeemed | | | 14,676 | |
Management fees | | | 170,685 | |
Distribution fees | | | 79,589 | |
Reports to shareholders | | | 44,196 | |
Professional fees | | | 52,137 | |
Accrued expenses and other liabilities | | | 7,905 | |
| | | | |
Total liabilities | | | 369,188 | |
| | | | |
Net assets, at value | | $ | 194,527,983 | |
| | | | |
Net assets consist of: | | | | |
Paid-in capital | | $ | 349,002,216 | |
Undistributed net investment income | | | 3,322,944 | |
Net unrealized appreciation (depreciation) | | | 57,508,484 | |
Accumulated net realized gain (loss) | | | (215,305,661 | ) |
| | | | |
Net assets, at value | | $ | 194,527,983 | |
| | | | |
| |
| Class 1: | | | | |
Net assets, at value | | $ | 821,359 | |
| | | | |
Shares outstanding | | | 51,880 | |
| | | | |
Net asset value and maximum offering price per share. | | $ | 15.83 | |
| | | | |
| |
| Class 2: | | | | |
Net assets, at value | | $ | 193,706,624 | |
| | | | |
Shares outstanding | | | 12,560,530 | |
| | | | |
Net asset value and maximum offering price per share. | | $ | 15.42 | |
| | | | |
| | | | | | |
| | | The accompanying notes are an integral part of these financial statements. | Annual Report | | | FGR-15 | |
FRANKLIN TEMPLETON VARIABLE INSURANCE PRODUCTS TRUST
FINANCIAL STATEMENTS
Statement of Operations
for the year ended December 31, 2016
| | | | |
| | | Franklin Global
Real Estate VIP Fund | |
Investment income: | | | | |
Dividends | | $ | 8,807,146 | |
Interest | | | 6,577 | |
Income from securities loaned (net of fees and rebates) | | | 10,376 | |
Other income (Note 1e) | | | 21,838 | |
| | | | |
Total investment income | | | 8,845,937 | |
| | | | |
Expenses: | | | | |
Management fees (Note 3a) | | | 2,999,837 | |
Distribution fees - Class 2 (Note 3c) | | | 650,940 | |
Custodian fees (Note 4) | | | 20,884 | |
Reports to shareholders | | | 45,710 | |
Professional fees | | | 80,995 | |
Trustees’ fees and expenses | | | 1,449 | |
Other | | | 18,615 | |
| | | | |
Total expenses | | | 3,818,430 | |
Expenses waived/paid by affiliates (Note 3e) | | | (1,180 | ) |
| | | | |
Net expenses | | | 3,817,250 | |
| | | | |
Net investment income | | | 5,028,687 | |
| | | | |
Realized and unrealized gains (losses): | | | | |
Net realized gain (loss) from: | | | | |
Investments (includes gains from a redemption in-kind of $27,545,389) (Note 9) | | | 51,075,135 | |
Realized gain distributions from REITs | | | 1,268,398 | |
Foreign currency transactions | | | (27,816 | ) |
| | | | |
Net realized gain (loss) | | | 52,315,717 | |
| | | | |
Net change in unrealized appreciation (depreciation) on: | | | | |
Investments | | | (53,932,642 | ) |
Translation of other assets and liabilities denominated in foreign currencies | | | (13,043 | ) |
| | | | |
Net change in unrealized appreciation (depreciation) | | | (53,945,685 | ) |
| | | | |
Net realized and unrealized gain (loss) | | | (1,629,968 | ) |
| | | | |
Net increase (decrease) in net assets resulting from operations | | $ | 3,398,719 | |
| | | | |
| | | | |
| FGR-16 | | Annual Report | The accompanying notes are an integral part of these financial statements. | | |
FRANKLIN TEMPLETON VARIABLE INSURANCE PRODUCTS TRUST
FINANCIAL STATEMENTS
Statements of Changes in Net Assets
| | | | | | | | |
| | | Franklin Global Real Estate VIP Fund | |
| | | Year Ended December 31, | |
| | | 2016 | | | 2015 | |
Increase (decrease) in net assets: | | | | | | | | |
Operations: | | | | | | | | |
Net investment income | | $ | 5,028,687 | | | $ | 4,420,691 | |
Net realized gain (loss) | | | 52,315,717 | | | | 25,460,067 | |
Net change in unrealized appreciation (depreciation) | | | (53,945,685 | ) | | | (27,803,613 | ) |
| | | | |
Net increase (decrease) in net assets resulting from operations. | | | 3,398,719 | | | | 2,077,145 | |
| | | | |
Distributions to shareholders from: | | | | | | | | |
Net investment income: | | | | | | | | |
Class 1 | | | (442,226 | ) | | | (1,164,404 | ) |
Class 2 | | | (3,274,922 | ) | | | (10,130,962 | ) |
| | | | |
Total distributions to shareholders | | | (3,717,148 | ) | | | (11,295,366 | ) |
| | | | |
Capital share transactions: (Note 2) | | | | | | | | |
Class 1 | | | (31,539,337 | ) | | | (2,627,260 | ) |
Class 2 | | | (93,248,371 | ) | | | (37,760,478 | ) |
| | | | |
Total capital share transactions | | | (124,787,708 | ) | | | (40,387,738 | ) |
| | | | |
Net increase (decrease) in net assets. | | | (125,106,137 | ) | | | (49,605,959 | ) |
Net assets: | | | | | | | | |
Beginning of year | | | 319,634,120 | | | | 369,240,079 | |
| | | | |
End of year | | $ | 194,527,983 | | | $ | 319,634,120 | |
| | | | |
Undistributed net investment income included in net assets: | | | | | | | | |
End of year | | $ | 3,322,944 | | | $ | — | |
| | | | |
Distributions in excess of net investment income included in net assets: | | | | | | | | |
End of year | | $ | — | | | $ | (103,206 | ) |
| | | | |
| | | | | | |
| The accompanying notes are an integral part of these financial statements. | Annual Report | | | FGR-17 | |
FRANKLIN TEMPLETON VARIABLE INSURANCE PRODUCTS TRUST
Notes to Financial Statements
Franklin Global Real Estate VIP Fund
1. Organization and Significant Accounting Policies
Franklin Templeton Variable Insurance Products Trust (Trust) is registered under the Investment Company Act of 1940 (1940 Act) as an open-end management investment company, consisting of nineteen separate funds and applies the specialized accounting and reporting guidance in U.S. Generally Accepted Accounting Principles (U.S. GAAP). Franklin Global Real Estate VIP Fund (Fund) is included in this report. The financial statements of the remaining funds in the Trust are presented separately. Shares of the Fund are generally sold only to insurance company separate accounts to fund the benefits of variable life insurance policies or variable annuity contracts. At December 31, 2016, 86.5% of the Fund’s shares were held through one insurance company. Investment activities of these insurance company separate accounts could have a material impact on the Fund. The Fund offers two classes of shares: Class 1 and Class 2. Each class of shares differs by its distribution fees, voting rights on matters affecting a single class and its exchange privilege.
The following summarizes the Fund’s significant accounting policies.
a. Financial Instrument Valuation
The Fund’s investments in financial instruments are carried at fair value daily. Fair value is the price that would be received to sell an asset or paid to transfer a liability in an orderly transaction between market participants on the measurement date. The Fund calculates the net asset value (NAV) per share as of 4 p.m. Eastern time each day the New York Stock Exchange (NYSE) is open for trading. Under compliance policies and procedures approved by the Trust’s Board of Trustees (the Board), the Fund’s administrator has responsibility for oversight of valuation, including leading the cross-functional Valuation Committee (VC). The VC provides administration and oversight of the Fund’s valuation policies and procedures, which are approved annually by the Board. Among other things, these procedures allow the Fund to utilize independent pricing services, quotations from securities and financial instrument dealers, and other market sources to determine fair value.
Equity securities listed on an exchange or on the NASDAQ National Market System are valued at the last quoted sale price or the official closing price of the day, respectively. Foreign equity securities are valued as of the close of trading on the
foreign stock exchange on which the security is primarily traded, or as of 4 p.m. Eastern time. The value is then converted into its U.S. dollar equivalent at the foreign exchange rate in effect at 4 p.m. Eastern time on the day that the value of the security is determined. Over-the-counter (OTC) securities are valued within the range of the most recent quoted bid and ask prices. Securities that trade in multiple markets or on multiple exchanges are valued according to the broadest and most representative market. Certain equity securities are valued based upon fundamental characteristics or relationships to similar securities.
Investments in open-end mutual funds are valued at the closing NAV. Investments in repurchase agreements are valued at cost, which approximates fair value.
The Fund has procedures to determine the fair value of financial instruments for which market prices are not reliable or readily available. Under these procedures, the VC convenes on a regular basis to review such financial instruments and considers a number of factors, including significant unobservable valuation inputs, when arriving at fair value. The VC primarily employs a market-based approach which may use related or comparable assets or liabilities, recent transactions, market multiples, book values, and other relevant information for the investment to determine the fair value of the investment. An income-based valuation approach may also be used in which the anticipated future cash flows of the investment are discounted to calculate fair value. Discounts may also be applied due to the nature or duration of any restrictions on the disposition of the investments. Due to the inherent uncertainty of valuations of such investments, the fair values may differ significantly from the values that would have been used had an active market existed. The VC employs various methods for calibrating these valuation approaches including a regular review of key inputs and assumptions, transactional back-testing or disposition analysis, and reviews of any related market activity.
Trading in securities on foreign securities stock exchanges and OTC markets may be completed before 4 p.m. Eastern time. In addition, trading in certain foreign markets may not take place on every Fund’s business day. Occasionally, events occur between the time at which trading in a foreign security is completed and 4 p.m. Eastern time that might call into question the reliability of the value of a portfolio security held by the Fund. As a result, differences may arise between the value of the Fund’s portfolio securities as determined at the foreign market close and the latest indications of value at 4 p.m. Eastern
FRANKLIN TEMPLETON VARIABLE INSURANCE PRODUCTS TRUST
NOTES TO FINANCIAL STATEMENTS
Franklin Global Real Estate VIP Fund (continued)
a. Financial Instrument Valuation (continued)
time. In order to minimize the potential for these differences, the VC monitors price movements following the close of trading in foreign stock markets through a series of country specific market proxies (such as baskets of American Depositary Receipts, futures contracts and exchange traded funds). These price movements are measured against established trigger thresholds for each specific market proxy to assist in determining if an event has occurred that may call into question the reliability of the values of the foreign securities held by the Fund. If such an event occurs, the securities may be valued using fair value procedures, which may include the use of independent pricing services.
When the last day of the reporting period is a non-business day, certain foreign markets may be open on those days that the Fund’s NAV is not calculated, which could result in differences between the value of the Fund’s portfolio securities on the last business day and the last calendar day of the reporting period. Any significant security valuation changes due to an open foreign market are adjusted and reflected by the Fund for financial reporting purposes.
b. Foreign Currency Translation
Portfolio securities and other assets and liabilities denominated in foreign currencies are translated into U.S. dollars based on the exchange rate of such currencies against U.S. dollars on the date of valuation. The Fund may enter into foreign currency exchange contracts to facilitate transactions denominated in a foreign currency. Purchases and sales of securities, income and expense items denominated in foreign currencies are translated into U.S. dollars at the exchange rate in effect on the transaction date. Portfolio securities and assets and liabilities denominated in foreign currencies contain risks that those currencies will decline in value relative to the U.S. dollar. Occasionally, events may impact the availability or reliability of foreign exchange rates used to convert the U.S. dollar equivalent value. If such an event occurs, the foreign exchange rate will be valued at fair value using procedures established and approved by the Board.
The Fund does not separately report the effect of changes in foreign exchange rates from changes in market prices on securities held. Such changes are included in net realized and unrealized gain or loss from investments in the Statement of Operations.
Realized foreign exchange gains or losses arise from sales of foreign currencies, currency gains or losses realized between the trade and settlement dates on securities transactions and the difference between the recorded amounts of dividends, interest, and foreign withholding taxes and the U.S. dollar equivalent of the amounts actually received or paid. Net unrealized foreign exchange gains and losses arise from changes in foreign exchange rates on foreign denominated assets and liabilities other than investments in securities held at the end of the reporting period.
c. Joint Repurchase Agreement
The Fund enters into a joint repurchase agreement whereby its uninvested cash balance is deposited into a joint cash account with other funds managed by the investment manager or an affiliate of the investment manager and is used to invest in one or more repurchase agreements. The value and face amount of the joint repurchase agreement are allocated to the funds based on their pro-rata interest. A repurchase agreement is accounted for as a loan by the Fund to the seller, collateralized by securities which are delivered to the Fund’s custodian. The fair value, including accrued interest, of the initial collateralization is required to be at least 102% of the dollar amount invested by the funds, with the value of the underlying securities marked to market daily to maintain coverage of at least 100%. Repurchase agreements are subject to the terms of Master Repurchase Agreements (MRAs) with approved counterparties (sellers). The MRAs contain various provisions, including but not limited to events of default and maintenance of collateral for repurchase agreements. In the event of default by either the seller or the Fund, certain MRAs may permit the non-defaulting party to net and close-out all transactions, if any, traded under such agreements. The Fund may sell securities it holds as collateral and apply the proceeds towards the repurchase price and any other amounts owed by the seller to the Fund in the event of default by the seller. This could involve costs or delays in addition to a loss on the securities if their value falls below the repurchase price owed by the seller. The joint repurchase agreement held by the Fund at year end, as indicated in the Statement of Investments, had been entered into on December 30, 2016.
d. Securities Lending
The Fund participates in an agency based securities lending program to earn additional income. The Fund receives cash collateral against the loaned securities in an amount equal to at
FRANKLIN TEMPLETON VARIABLE INSURANCE PRODUCTS TRUST
NOTES TO FINANCIAL STATEMENTS
Franklin Global Real Estate VIP Fund (continued)
1. Organization and Significant Accounting
Policies (continued)
d. Securities Lending (continued)
least 102% of the fair value of the loaned securities. Collateral is maintained over the life of the loan in an amount not less than 100% of the fair value of loaned securities, as determined at the close of Fund business each day; any additional collateral required due to changes in security values is delivered to the Fund on the next business day. The collateral is deposited into a joint cash account with other funds and is used to invest in a money market fund managed by Franklin Advisers, Inc., an affiliate of the Fund, and/or a joint repurchase agreement. The Fund may receive income from the investment of cash collateral, in addition to lending fees and rebates paid by the borrower. Income from securities loaned, net of fees paid to the securities lending agent and/or third-party vendor, is reported separately in the Statement of Operations. The Fund bears the market risk with respect to the collateral investment, securities loaned, and the risk that the agent may default on its obligations to the Fund. If the borrower defaults on its obligation to return the securities loaned, the Fund has the right to repurchase the securities in the open market using the collateral received. The securities lending agent has agreed to indemnify the Fund in the event of default by a third party borrower. At December 31, 2016, the Fund had no securities on loan.
e. Income and Deferred Taxes
It is the Fund’s policy to qualify as a regulated investment company under the Internal Revenue Code. The Fund intends to distribute to shareholders substantially all of its taxable income and net realized gains to relieve it from federal income and if applicable, excise taxes. As a result, no provision for U.S. federal income taxes is required.
The Fund may be subject to foreign taxation related to income received, capital gains on the sale of securities and certain foreign currency transactions in the foreign jurisdictions in which it invests. Foreign taxes, if any, are recorded based on the tax regulations and rates that exist in the foreign markets in which the Fund invests. When a capital gain tax is determined to apply, the Fund records an estimated deferred tax liability in an amount that would be payable if the securities were disposed of on the valuation date. As a result of several court cases, in certain countries across the European Union, the Fund filed additional tax reclaims for previously withheld taxes on dividends earned in those countries (EU reclaims). These
additional filings are subject to various administrative proceedings by the local jurisdictions’ tax authorities within the European Union, as well as a number of related judicial proceedings. Income recognized, if any, for EU reclaims is reflected as other income in the Statement of Operations and any related receivable, if any, is reflected as European Union tax reclaims in the Statement of Assets and Liabilities. When uncertainty exists as to the ultimate resolution of these proceedings, the likelihood of receipt of these EU reclaims, and the potential timing of payment, no amounts are reflected in the financial statements. For U.S. income tax purposes, when EU reclaims are received by the Fund and the Fund previously passed foreign tax credit on to its shareholders, the Fund must either amend historic tax reporting to shareholders or enter into a closing agreement with the Internal Revenue Service (IRS) in order to pay the associated tax liability on behalf of the Fund’s shareholders.
The Fund may recognize an income tax liability related to its uncertain tax positions under U.S. GAAP when the uncertain tax position has a less than 50% probability that it will be sustained upon examination by the tax authorities based on its technical merits. As of December 31, 2016, the Fund has determined that no tax liability is required in its financial statements related to uncertain tax positions for any open tax years (or expected to be taken in future tax years). Open tax years are those that remain subject to examination and are based on each tax jurisdiction’s statute of limitation.
f. Security Transactions, Investment Income, Expenses and Distributions
Security transactions are accounted for on trade date. Realized gains and losses on security transactions are determined on a specific identification basis. Interest income and estimated expenses are accrued daily. Dividend income is recorded on the ex-dividend date except for certain dividends from securities where the dividend rate is not available. In such cases, the dividend is recorded as soon as the information is received by the Fund. Distributions to shareholders are recorded on the ex-dividend date and are determined according to income tax regulations (tax basis). Distributable earnings determined on a tax basis may differ from earnings recorded in accordance with U.S. GAAP. These differences may be permanent or temporary. Permanent differences are reclassified among capital accounts to reflect their tax character. These reclassifications have no
FRANKLIN TEMPLETON VARIABLE INSURANCE PRODUCTS TRUST
NOTES TO FINANCIAL STATEMENTS
Franklin Global Real Estate VIP Fund (continued)
impact on net assets or the results of operations. Temporary differences are not reclassified, as they may reverse in subsequent periods.
Common expenses incurred by the Trust are allocated among the Funds based on the ratio of net assets of each Fund to the combined net assets of the Trust. Fund specific expenses are charged directly to the Fund that incurred the expense.
Realized and unrealized gains and losses and net investment income, not including class specific expenses, are allocated daily to each class of shares based upon the relative proportion of net assets of each class. Differences in per share distributions, by class, are generally due to differences in class specific expenses.
Distributions received by the Fund from certain securities may be a return of capital (ROC). Such distributions reduce the cost basis of the securities, and any distributions in excess of the cost basis are recognized as capital gains. For Real Estate Investment Trust (REIT) securities, the Fund records ROC estimates, if any, on the ex-dividend date and are adjusted once actual tax designations are known.
g. Accounting Estimates
The preparation of financial statements in accordance with U.S. GAAP requires management to make estimates and assumptions that affect the reported amounts of assets and liabilities at the date of the financial statements and the amounts of income and expenses during the reporting period. Actual results could differ from those estimates.
h. Guarantees and Indemnifications
Under the Trust’s organizational documents, its officers and trustees are indemnified by the Trust against certain liabilities arising out of the performance of their duties to the Trust. Additionally, in the normal course of business, the Trust, on behalf of the Fund, enters into contracts with service providers that contain general indemnification clauses. The Trust’s maximum exposure under these arrangements is unknown as this would involve future claims that may be made against the Trust that have not yet occurred. Currently, the Trust expects the risk of loss to be remote.
2. Shares of Beneficial Interest
At December 31, 2016, there were an unlimited number of shares authorized (without par value). Transactions in the Fund’s shares were as follows:
| | | | | | | | | | | | | | | | | | | | |
| | | Year Ended December 31, | |
| | | 2016 | | | | | | 2015 | |
| | | Shares | | | Amount | | | | | | Shares | | | Amount | |
| | | | | |
| Class 1 Shares: | | | | | | | | | | | | | | | | | | | | |
Shares sold | | | 8,244 | | | $ | 135,524 | | | | | | | | 18,700 | | | $ | 311,427 | |
Shares issued in reinvestment of distributions | | | 27,081 | | | | 442,226 | | | | | | | | 74,498 | | | | 1,164,404 | |
Shares redeemed in-kind (Note 9) | | | (1,772,621 | ) | | | (28,376,646 | ) | | | | | | | — | | | | — | |
Shares redeemed | | | (230,198 | ) | | | (3,740,441 | ) | | | | | | | (255,495 | ) | | | (4,103,091 | ) |
| | | | |
Net increase (decrease) | | | (1,967,494 | ) | | $ | (31,539,337 | ) | | | | | | | (162,297 | ) | | $ | (2,627,260 | ) |
| | | | |
| | | | | |
| Class 2 Shares: | | | | | | | | | | | | | | | | | | | | |
Shares sold | | | 397,098 | | | $ | 6,351,063 | | | | | | | | 502,026 | | | $ | 8,041,404 | |
Shares issued in reinvestment of distributions | | | 205,582 | | | | 3,274,922 | | | | | | | | 664,325 | | | | 10,130,962 | |
Shares redeemed in-kind (Note 9) | | | (3,806,704 | ) | | | (59,402,467 | ) | | | | | | | — | | | | — | |
Shares redeemed | | | (2,762,366 | ) | | | (43,471,889 | ) | | | | | | | (3,555,406 | ) | | | (55,932,844 | ) |
| | | | |
Net increase (decrease) | | | (5,966,390 | ) | | $ | (93,248,371 | ) | | | | | | | (2,389,055 | ) | | $ | (37,760,478 | ) |
| | | | |
FRANKLIN TEMPLETON VARIABLE INSURANCE PRODUCTS TRUST
NOTES TO FINANCIAL STATEMENTS
Franklin Global Real Estate VIP Fund (continued)
3. Transactions with Affiliates
Franklin Resources, Inc. is the holding company for various subsidiaries that together are referred to as Franklin Templeton Investments. Certain officers and trustees of the Fund are also officers and/or directors of the following subsidiaries:
| | |
| Subsidiary | | Affiliation |
Franklin Templeton Institutional, LLC (FT Institutional) | | Investment manager |
Franklin Templeton Services, LLC (FT Services) | | Administrative manager |
Franklin Templeton Distributors, Inc. (Distributors) | | Principal underwriter |
Franklin Templeton Investor Services, LLC (Investor Services) | | Transfer agent |
a. Management Fees
The Fund pays an investment management fee to FT Institutional based on the average daily net assets of the Fund as follows:
| | |
| Annualized Fee Rate | | Net Assets |
1.050% | | Up to and including $500 million |
0.950% | | Over $500 million, up to and including $1 billion |
0.900% | | Over $1 billion, up to and including $1.5 billion |
0.850% | | Over $1.5 billion, up to and including $6.5 billion |
0.830% | | Over $6.5 billion, up to and including $11.5 billion |
0.810% | | Over $11.5 billion, up to and including $16.5 billion |
0.790% | | Over $16.5 billion, up to and including $19 billion |
0.780% | | Over $19 billion, up to and including $21.5 billion |
0.770% | | In excess of $21.5 billion |
For the year ended December 31, 2016, the effective investment management fee rate was 1.050% of the Fund’s average daily net assets.
b. Administrative Fees
Under an agreement with FT Institutional, FT Services provides administrative services to the Fund. The fee is paid by FT Institutional based on the Fund’s average daily net assets, and is not an additional expense of the Fund.
c. Distribution Fees
The Board has adopted a distribution plan for Class 2 shares pursuant to Rule 12b-1 under the 1940 Act. Under the Fund’s compensation distribution plan, the Fund pays Distributors for costs incurred in connection with the servicing, sale and distribution of the Fund’s shares up to 0.35% per year of its average daily net assets. The Board has agreed to limit the current rate to 0.25% per year for Class 2. The plan year, for purposes of monitoring compliance with the maximum annual plan rate, is February 1 through January 31.
d. Transfer Agent Fees
Investor Services, under terms of an agreement, performs shareholder servicing for the Fund and is not paid by the Fund for the services.
FRANKLIN TEMPLETON VARIABLE INSURANCE PRODUCTS TRUST
NOTES TO FINANCIAL STATEMENTS
Franklin Global Real Estate VIP Fund (continued)
e. Investments in Affiliated Management Investment Companies
The Fund invests in one or more affiliated management investment companies for purposes other than exercising a controlling influence over the management or policies. Management fees paid by the Fund are waived on assets invested in the affiliated management investment companies, as noted in the Statement of Operations, in an amount not to exceed the management and administrative fees paid directly or indirectly by each affiliate. During the year ended December 31, 2016, the Fund held investments in affiliated management investment companies as follows:
| | | | | | | | | | | | | | | | | | | | | | | | | | | | | | | | |
| | | Number of Shares Held at Beginning of Year | | | Gross Additions | | | Gross Reductions | | | Number of Shares Held at End of Year | | | Value at End of Year | | | Investment Income | | | Realized Gain (Loss) | | | % of Affiliated Fund Shares Outstanding Held at End of Year | |
| Non-Controlled Affiliates | | | | | | | | | | | | | | | | | | | | | | | | | | | | | | | | |
Institutional Fiduciary Trust Money Market Portfolio, 0.09% | | | — | | | | 10,848,000 | | | | (10,848,000 | ) | | | — | | | $ | — | | | $ | — | | | $ | — | | | | –% | |
| | | | | | | | | | | | | | | | | | | | | | | | |
4. Expense Offset Arrangement
The Fund has entered into an arrangement with its custodian whereby credits realized as a result of uninvested cash balances are used to reduce a portion of the Fund’s custodian expenses. During the year ended December 31, 2016, there were no credits earned.
5. Income Taxes
For tax purposes, capital losses may be carried over to offset future capital gains. Capital loss carryforwards with no expiration, if any, must be fully utilized before those losses with expiration dates.
At December 31, 2016, capital loss carryforwards were as follows:
| | | | |
Capital loss carryforwards subject to expiration: | |
2017 | | $ | 207,448,609 | |
2018 | | | 2,192,369 | |
| | | | |
Total capital loss carryforwards | | $ | 209,640,978 | |
| | | | |
During the year ended December 31, 2016, the Fund utilized $21,262,598 of capital loss carryforwards.
On December 31, 2016, the Fund had expired capital loss carryforwards of $68,684,254 which were reclassified to paid-in capital.
The tax character of distributions paid during the years ended December 31, 2016 and 2015, was as follows:
| | | | | | | | |
| | | 2016 | | | 2015 | |
Distributions paid from ordinary income | | $ | 3,717,148 | | | $ | 11,295,366 | |
| | | | |
FRANKLIN TEMPLETON VARIABLE INSURANCE PRODUCTS TRUST
NOTES TO FINANCIAL STATEMENTS
Franklin Global Real Estate VIP Fund (continued)
5. Income Taxes (continued)
At December 31, 2016, the cost of investments, net unrealized appreciation (depreciation) and undistributed ordinary income for income tax purposes were as follows:
| | | | |
Cost of investments | | $ | 146,841,637 | |
| | | | |
Unrealized appreciation | | $ | 62,095,453 | |
Unrealized depreciation | | | (15,024,487 | ) |
| | | | |
Net unrealized appreciation (depreciation) | | $ | 47,070,966 | |
| | | | |
Distributable earnings - undistributed ordinary income . | | $ | 8,005,656 | |
| | | | |
Differences between income and/or capital gains as determined on a book basis and a tax basis are primarily due to differing treatments of passive foreign investment company shares and gains realized on in-kind shareholder redemptions.
In accordance with U.S. GAAP permanent differences are reclassified among capital accounts to reflect their tax character. At the year ended December 31, 2016, such reclassifications were as follows:
| | | | |
Paid-in capital | | $ | (45,655,419 | ) |
Undistributed net investment income | | $ | 2,114,611 | |
Accumulated net realized gain (loss) | | $ | 43,540,808 | |
6. Investment Transactions
Purchases and sales of investments (excluding short term securities) for the year ended December 31, 2016, aggregated $80,583,145 and $112,562,137, respectively. Sales of investments excludes in-kind transactions of $87,416,272.
7. Concentration of Risk
Investing in foreign securities may include certain risks and considerations not typically associated with investing in U.S. securities, such as fluctuating currency values and changing local and regional economic, political and social conditions, which may result in greater market volatility. In addition, certain foreign securities may not be as liquid as U.S. securities.
The Fund invests a large percentage of its total assets in REIT securities. Such concentration may subject the Fund to special risks associated with real estate securities. These securities may be more sensitive to economic or regulatory developments due to a variety of factors such as local, regional, national and global economic conditions, interest rates and tax considerations.
8. Credit Facility
The Fund, together with other U.S. registered and foreign investment funds (collectively, Borrowers), managed by Franklin Templeton Investments, are borrowers in a joint syndicated senior unsecured credit facility totaling $2 billion (Global Credit Facility) which matured on February 10, 2017. This Global Credit Facility provides a source of funds to the Borrowers for temporary and emergency purposes, including the ability to meet future unanticipated or unusually large redemption requests. Effective February 10, 2017, the Borrowers renewed the Global Credit Facility for a one year term, maturing February 9, 2018, for a total of $2 billion.
FRANKLIN TEMPLETON VARIABLE INSURANCE PRODUCTS TRUST
NOTES TO FINANCIAL STATEMENTS
Franklin Global Real Estate VIP Fund (continued)
Under the terms of the Global Credit Facility, the Fund shall, in addition to interest charged on any borrowings made by the Fund and other costs incurred by the Fund, pay its share of fees and expenses incurred in connection with the implementation and maintenance of the Global Credit Facility, based upon its relative share of the aggregate net assets of all of the Borrowers, including an annual commitment fee of 0.15% based upon the unused portion of the Global Credit Facility. These fees are reflected in other expenses in the Statement of Operations. During the year ended December 31, 2016, the Fund did not use the Global Credit Facility.
9. Redemption In-Kind
During the year ended December 31, 2016, the Fund realized $27,545,389 of net gains resulting from a redemption in-kind in which a shareholder redeemed fund shares for cash and securities held by the Fund. Because such gains are not taxable to the Fund, and are not distributed to remaining shareholders, they have been reclassified from accumulated net realized gains to paid-in capital.
10. Fair Value Measurements
The Fund follows a fair value hierarchy that distinguishes between market data obtained from independent sources (observable inputs) and the Fund’s own market assumptions (unobservable inputs). These inputs are used in determining the value of the Fund’s financial instruments and are summarized in the following fair value hierarchy:
| | • | | Level 1 – quoted prices in active markets for identical financial instruments |
| | • | | Level 2 – other significant observable inputs (including quoted prices for similar financial instruments, interest rates, prepayment speed, credit risk, etc.) |
| | • | | Level 3 – significant unobservable inputs (including the Fund’s own assumptions in determining the fair value of financial instruments) |
The input levels are not necessarily an indication of the risk or liquidity associated with financial instruments at that level.
For movements between the levels within the fair value hierarchy, the Fund has adopted a policy of recognizing the transfers as of the date of the underlying event which caused the movement.
A summary of inputs used as of December 31, 2016, in valuing the Fund’s assets carried at fair value, is as follows:
| | | | | | | | | | | | | | | | |
| | | Level 1 | | | Level 2 | | | Level 3 | | | Total | |
| | | | |
| Assets: | | | | | | | | | | | | | | | | |
Investments in Securities: | | | | | | | | | | | | | | | | |
Equity Investmentsa | | $ | 192,498,998 | | | $ | — | | | $ | — | | | $ | 192,498,998 | |
Short Term Investments | | | — | | | | 1,413,605 | | | | — | | | | 1,413,605 | |
| | | | |
Total Investments in Securities | | $ | 192,498,998 | | | $ | 1,413,605 | | | $ | — | | | $ | 193,912,603 | |
| | | | |
aFor detailed categories, see the accompanying Statement of Investments.
11. Investment Company Reporting Modernization
In October 2016, the U.S. Securities and Exchange Commission adopted new rules and amended existing rules (together, final rules) intended to modernize the reporting and disclosure of information by registered investment companies. In part, the final rules amend Regulation S-X and require standardized, enhanced disclosures about derivatives in investment company financial statements, as well as other amendments. The compliance date for the amendments to Regulation S-X is August 1, 2017. Management is currently evaluating the impact that the adoption of the amendments to Regulation S-X will have on the Fund’s financial statements and related disclosures.
FRANKLIN TEMPLETON VARIABLE INSURANCE PRODUCTS TRUST
NOTES TO FINANCIAL STATEMENTS
Franklin Global Real Estate VIP Fund (continued)
The Fund has evaluated subsequent events through the issuance of the financial statements and determined that no events have occurred that require disclosure other than those already disclosed in the financial statements.
Abbreviations
| | | | | | |
| Selected Portfolio |
| |
| REIT | | Real Estate Investment Trust |
FRANKLIN TEMPLETON VARIABLE INSURANCE PRODUCTS TRUST
Report of Independent Registered Public Accounting Firm
Franklin Global Real Estate VIP Fund
To the Board of Trustees and Shareholders of Franklin Templeton Variable Insurance Products Trust
In our opinion, the accompanying statement of assets and liabilities, including the statement of investments, and the related statements of operations and of changes in net assets and the financial highlights present fairly, in all material respects, the financial position of Franklin Global Real Estate VIP Fund (the “Fund”) at December 31, 2016, the results of its operations for the year then ended, the changes in its net assets for each of the two years in the period then ended and the financial highlights for the periods presented, in conformity with accounting principles generally accepted in the United States of America. These financial statements and financial highlights (hereafter referred to as “financial statements”) are the responsibility of the Fund’s management. Our responsibility is to express an opinion on these financial statements based on our audits. We conducted our audits of these financial statements in accordance with the standards of the Public Company Accounting Oversight Board (United States). Those standards require that we plan and perform the audit to obtain reasonable assurance about whether the financial statements are free of material misstatement. An audit includes examining, on a test basis, evidence supporting the amounts and disclosures in the financial statements, assessing the accounting principles used and significant estimates made by management, and evaluating the overall financial statement presentation. We believe that our audits, which included confirmation of securities at December 31, 2016 by correspondence with the custodian and brokers, provide a reasonable basis for our opinion.
PricewaterhouseCoopers LLP
San Francisco, California
February 15, 2017
Franklin Growth and Income VIP Fund
This annual report for Franklin Growth and Income VIP Fund covers the fiscal year ended December 31, 2016.
Class 2 Performance Summary as of December 31, 2016
Average annual total return of Class 2 shares* represents the average annual change in value, assuming reinvestment of dividends and capital gains. Average returns smooth out variations in returns, which can be significant; they are not the same as year-by-year results.
| | | | | | | | | | | | |
| Periods ended 12/31/16 | | 1-Year | | | 5-Year | | | 10-Year | |
Average Annual Total Return | | | +11.62% | | | | +11.92% | | | | +5.19% | |
*The Fund has an expense reduction contractually guaranteed through April 30, 2018. Fund investment results reflect the expense reduction; without this reduction, the results would have been lower.
Performance reflects the Fund’s Class 2 operating expenses, but does not include any contract fees, expenses or sales charges. If they had been included, performance would be lower. These charges and deductions, particularly for variable life policies, can have a significant effect on contract values and insurance benefits. See the contract prospectus for a complete description of these expenses, including sales charges.
Performance data represent past performance, which does not guarantee future results. Investment return and principal value will fluctuate, and you may have a gain or loss when you sell your shares. Current performance may differ from figures shown.
Total Return Index Comparison for a Hypothetical $10,000 Investment (1/1/07–12/31/16)
The graph below shows the change in value of a hypothetical $10,000 investment in the Fund over the indicated period and includes reinvestment of any income or distributions. The Fund’s performance* is compared to the performance of the Standard & Poor’s® 500 Index (S&P 500®), the Lipper VIP Equity Income Funds Classification Average and the Consumer Price Index. One cannot invest directly in an index, and an index is not representative of the Fund’s portfolio. Please see Important Notes to Performance Information preceding the Fund Summaries.
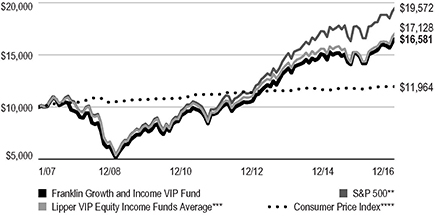
**Source: Morningstar. Please see Index Descriptions following the Fund Summaries.
***Source: Lipper, a Thomson Reuters Company. Please see Index Descriptions following the Fund Summaries.
****Source: Bureau of Labor Statistics, bls.gov/cpi. Please see Index Descriptions following the Fund Summaries.
FRANKLIN GROWTH AND INCOME VIP FUND
Fund Goal and Main Investments
The Fund seeks capital appreciation with current income as a secondary goal. Under normal market conditions, the Fund invests predominantly in equity securities, including securities convertible into common stock.
Fund Risks
All investments involve risks, including possible loss of principal. Stock prices fluctuate, sometimes rapidly and dramatically, due to factors affecting individual companies, particular industries or sectors, or general market conditions. Convertible securities are subject to the risks of stocks when the underlying stock price is high relative to the conversion price and debt securities when the underlying stock price is low relative to the conversion price. The Fund’s investment in foreign securities also involves special risks, including currency fluctuations and economic as well as political uncertainty. The Fund is actively managed but there is no guarantee that the manager’s investment decisions will produce the desired results. The Fund’s prospectus also includes a description of the main investment risks.
Performance Overview
You can find the Fund’s one-year total return in the Performance Summary. In comparison, the Fund’s benchmark, the S&P 500, produced a +11.96% total return.1 The Fund’s peers, as measured by the Lipper VIP Equity Income Funds Classification Average, had a +14.21% total return for the same period.2
Economic and Market Overview
The U.S. economy expanded during the 12 months under review. The economy grew at a faster pace in 2016’s third quarter than in the second and first quarters, mainly due to personal consumption expenditures, exports, private inventory investment, federal government spending and nonresidential fixed investment. Manufacturing conditions remained volatile but generally expanded, and the services sector also continued to grow for most of the period. The unemployment rate decreased from 5.0% in December 2015 to 4.7% at period-end.3 Monthly retail sales grew for most of the review period, and rose to its highest level in April in more than a year,
Portfolio Composition
Based on Total Net Assets as of 12/31/16
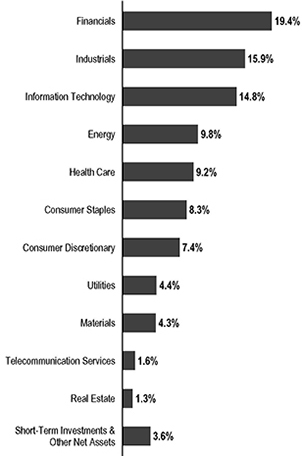
due to a broad-based increase across most retail categories. Inflation, as measured by the Consumer Price Index, remained relatively subdued for most of the period, but rose in 2016’s fourth quarter.
After maintaining its target interest rate in the 0.25%–0.50% range for nearly a year, the U.S. Federal Reserve (Fed), at its December meeting, increased its target range for the federal funds rate to 0.50%–0.75%, as policymakers noted improvement in U.S. labor market and inflation. The Federal Open Market Committee also hinted at three additional hikes in 2017. Furthermore, the Fed raised its forecast for 2017 U.S. economic growth, and lowered its unemployment projections.
1. Source: Morningstar.
2. Source: Lipper, a Thomson Reuters Company.
One cannot invest directly in an index, and an index is not representative of the Fund’s portfolio. Please see Index Descriptions following the Fund Summaries.
3. Source: Bureau of Labor Statistics.
The dollar value, number of shares or principal amount, and names of all portfolio holdings are listed in the Fund’s Statement of Investments (SOI).
FRANKLIN GROWTH AND INCOME VIP FUND
The 10-year U.S. Treasury yield, which moves inversely to price, ended the period slightly higher than where it started and shifted significantly during the period. At the beginning of the period, negative global interest rates, continued accommodative central bank policies and a general risk-averse sentiment boosted safe haven buying by investors. These factors drove the 10-year yield to a period low of 1.37% in early July, down from 2.27% on December 31, 2015. Near period-end, rates moved higher based on improved economic data, expectations for the Fed to raise interest rates at its December 2016 meeting and a sentiment shift among investors that held that possible expansionary fiscal policies under the new U.S. president Donald Trump could lead to a stronger economy and higher inflation.
Investment Strategy
We seek to invest in a broadly diversified portfolio of equity securities that we consider to be financially strong, with a focus on “blue chip” companies. We apply a bottom-up approach to investing in individual securities. We will assess the market price of a company’s securities relative to our evaluation of the company’s long-term earnings, asset value and cash flow potential. We also consider a company’s price/earnings ratio, profit margins, balance sheet and liquidation value. We consider dividend yield in selecting stocks for the Fund because we believe that, over time, dividend income can contribute significantly to total return and can be a more consistent source of investment return than capital appreciation. We seek to take advantage of price dislocations that result from the market’s short-term focus and choose to invest in those companies that, in our opinion, offer the best trade-off between growth opportunity, business and financial risk, and valuation.
Manager’s Discussion
During the period under review, sectors that rose in value among the Fund’s investments included financials, industrials and energy. In contrast, declining sectors included health care and consumer discretionary.
In the financials sector, banks including JPMorgan Chase & Co., U.S. Bancorp and Morgan Stanley appreciated significantly following the U.S. presidential elections in November. In the post-election environment, these highly cyclical stocks benefited from investor expectations of higher GDP growth, higher inflation that could lead to a more hawkish Fed, a lower corporate tax rate, a more favorable regulatory environment and stronger capital markets activity. Additionally, some investors considered banking positions inexpensive relative to other industries and under-owned, which led to positive technical conditions for the industry.
Top 10 Holdings
12/31/16
| | | | |
Company Sector/Industry | | % of Total
Net Assets | |
Microsoft Corp. Information Technology | | | 3.9% | |
JPMorgan Chase & Co. Financials | | | 3.9% | |
Wells Fargo & Co. Financials | | | 3.0% | |
Chevron Corp. Energy | | | 2.8% | |
General Electric Co. Industrials | | | 2.6% | |
U.S. Bancorp Financials | | | 2.6% | |
PepsiCo Inc. Consumer Staples | | | 2.5% | |
Intel Corp. Information Technology | | | 2.4% | |
Cisco Systems Inc. Information Technology | | | 2.2% | |
Apple Inc. Information Technology | | | 2.0% | |
JPMorgan and Morgan Stanley also benefited from investor expectations for increased capital market activity.
In industrials, diversified industrial products and equipment manufacturer Illinois Tool Works (ITW) performed well as it outgrew its peer group and reported solid earnings throughout the reporting period. ITW was one of the few multi-industry companies to raise earnings guidance throughout a challenging period for industrial companies. ITW also completed a medium-sized acquisition that it will integrate into its automotive supply division. Waste disposal and trash pickup service provider Republic Services benefited from continued price increases for its collection services and a more disciplined competitive environment following the merger of its competitors. An improvement in recycled commodity prices also positively affected the company. Additionally, Republic Services continued to make small acquisitions that modestly helped results. Leading aerospace defense company Lockheed Martin’s stock appreciated throughout the year and more sharply (along with the rest of the defense sector) after the U.S. presidential election. Investors expect the incoming administration to increase troop levels and the defense budget.
In the energy sector, shares of oil company Chevron continued to recover as a result of improved project delivery, cost reductions, an improvement in oil and natural gas fundamentals and increased investor focus on the company’s assets in Texas.
FRANKLIN GROWTH AND INCOME VIP FUND
Also, commodity prices stabilized at healthier levels over the past year and were further supported by an agreement by the Organization of the Petroleum Exporting Countries to curtail production. Additionally, Chevron made advances in delivering their Gorgon and Wheatstone liquefied natural gas projects in Australia. Cost reductions also helped move the company toward, in our view, a better balance between cash flow and spending in a lower commodity price environment. Shares of Royal Dutch Shell similarly benefited from some of the factors that drove Chevron’s shares. Also, the closure of the acquisition of BG Group, which had been weighing on Shell’s stock, was beneficial. As with most integrated oil companies, Shell made progress on reducing costs and capital spending, which was critically important to Shell, given the company’s higher levels of debt after the BG acquisition and the importance of dividend sustainability to investors. Amid these developments, the improved commodity price environment was particularly important to Shell, and helped the company make progress on asset sales late in the year. In addition to the fundamental improvements in commodity markets and prices, Schlumberger shares also benefited from prospects for increased spending and a rise in rig count, an important measure of spending. The company also continued to generate strong results as its business lines, geographic diversity, cost cutting measures and strong balance sheet allowed Schlumberger to generate relatively strong returns and free cash flow.
In the health care sector, our convertible preferred stock position in pharmaceutical company Allergan was a detractor. The company’s planned sale to Pfizer was terminated after the U.S. Treasury modified tax rules that eliminated many of the financial benefits of the merger. Also, investors soured on specialty pharmaceutical stocks due to drug pricing concerns. Additionally, Allergan’s third quarter earnings underperformed expectations. Drug maker Teva Pharmaceuticals was hurt by a decline in generic drug prices due to increased competition and a consolidation of drug purchasers.4 The company was also impacted by investor concerns about the duration of the exclusivity of its top-selling multiple sclerosis drug, Copaxone, due to patent challenges. The delay in closing the acquisition of Actavis, Allergan’s generic division, enabled competitors and customers to create competitive challenges. Pharmaceutical developer Eli Lilly & Company was hurt by the failure of its late stage study of Solanezumab, a therapy for Alzheimer’s disease. The company was also negatively affected by pricing concerns about its diabetes medications. Investors also became
concerned that Eli Lilly could lose the patent case for Alimta, an important oncology medicine.
In consumer discretionary, toy company Mattel underperformed in its fourth quarter because of investor fears of weak holiday sales and a potential border adjustment tax. Mattel sources most of its products from outside the U.S., so investors believed the company could be subject to a proposed border adjustment tax. Hotel operator Starwood Hotels & Resorts Worldwide declined in value as the lodging group experienced weakness in late 2015 and early 2016.4 During that time, revenue-per-available-room expectations declined, corporate travel was slowing and investors began to digest the impact of competition from alternative accommodations (e.g., Airbnb5). During the period, the company received an initial takeover bid from Marriott5 that was viewed as disappointing by investors though a takeover was ultimately completed at higher values. Automobile manufacturer Ford Motor also hindered results. The company suffered from negative sentiment toward the auto business cycle in North America, where investors seemed to believe demand had peaked and, as a result, declining earnings and profits would be experienced across the industry.
Other individual detractors included retail pharmacy and health care company CVS Health in consumer staples, insurer MetLife4 in financials and brewer Anheuser-Busch InBev in consumer staples. CVS Health, a retail drugstore operator and pharmacy-benefits manager, underperformed as competition for prescription volume among drug retailers intensified. The company lost market share in retail script volume and established lower than expected 2017 guidance. MetLife’s ongoing business restructuring resulted in greater-than expected charges and headwinds in the first half of its fiscal year. The company’s business model is sensitive to changes in long-term interest rates. When the likelihood of higher rates declined during the early summer months, the stock price was pressured and it became a detractor from Fund performance. Anheuser-Busch underperformed in its fourth quarter following disappointing earnings results in its third quarter and a sharp rotation out of higher dividend yield, defensive stocks. Additionally, a rally in the U.S. dollar during the period pressured the stock given the company’s global presence.
Thank you for your participation in Franklin Growth and Income VIP Fund. We look forward to serving your future investment needs.
4. Sold by period-end.
5. Not a Fund holding.
FRANKLIN GROWTH AND INCOME VIP FUND
The foregoing information reflects our analysis, opinions and portfolio holdings as of December 31, 2016, the end of the reporting period. The way we implement our main investment strategies and the resulting portfolio holdings may change depending on factors such as market and economic conditions. These opinions may not be relied upon as investment advice or an offer for a particular security. The information is not a complete analysis of every aspect of any market, country, industry, security or the Fund. Statements of fact are from sources considered reliable, but the investment manager makes no representation or warranty as to their completeness or accuracy. Although historical performance is no guarantee of future results, these insights may help you understand our investment management philosophy.
FRANKLIN GROWTH AND INCOME VIP FUND
Class 2 Fund Expenses
As an investor in a variable insurance contract (Contract) that indirectly provides for investment in an underlying mutual fund, you can incur transaction and/or ongoing expenses at both the Fund level and the Contract Level: (1) transaction expenses can include sales charges (loads) on purchases, surrender fees, transfer fees and premium taxes; and (2) ongoing expenses can include management fees, distribution and service (12b-1) fees, contract fees, annual maintenance fees, mortality and expense risk fees and other fees and expenses. All mutual funds and Contracts have some types of ongoing expenses. The table below shows Fund-level ongoing expenses and can help you understand these costs and compare them with those of other mutual funds offered through the Contract. The table assumes a $1,000 investment held for the six months indicated. Please refer to the Fund prospectus for additional information on operating expenses.
Actual Fund Expenses
The table below provides information about the actual account values and actual expenses in the columns under the heading “Actual.” In these columns the Fund’s actual return, which includes the effect of ongoing Fund expenses but does not include the effect of ongoing Contract expenses, is used to calculate the “Ending Account Value.”
You can estimate the Fund-level expenses you paid during the period by following these steps (of course, your account value and expenses will differ from those in this illustration):
| | Divide your account value by $1,000 |
| | (if your account had an $8,600 value, |
| | then $8,600 ÷ $1,000 = 8.6). |
| | Then multiply the result by the number under the headings “Actual” and “Fund-Level Expenses Paid During Period” |
| | (if Fund-Level Expenses Paid During Period were $ 7.50, |
| | then 8.6 x $7.50 = $64.50). |
In this illustration, the estimated expenses paid this period at the Fund level are $64.50.
Hypothetical Example for Comparison
with Other Mutual Funds
Under the heading “Hypothetical” in the table, information is provided about hypothetical account values and hypothetical expenses based on the Fund’s actual expense ratio and an assumed rate of return of 5% per year before expenses, which is not the Fund’s actual return. This information may not be used to estimate the actual ending account balance or expenses you paid for the period, but it can help you compare ongoing costs of investing in the Fund with those of other mutual funds offered through the Contract. To do so, compare this 5% hypothetical example with the 5% hypothetical examples that appear in the shareholder reports of other funds offered through the Contract.
Please note that expenses shown in the table are meant to highlight ongoing costs at the Fund level only and do not reflect any ongoing expenses at the Contract level, or transaction expenses at either the Fund or Contract levels. In addition, while the Fund does not have transaction expenses, if the transaction and ongoing expenses at the Contract level were included, the expenses shown below would be higher. You should consult your Contract prospectus or disclosure document for more information.
| | | | | | | | | | | | | | | | | | | | | | | | |
| | | | | | Actual
(actual return after expenses) | | | Hypothetical
(5% annual return before expenses) | | | | |
| Share Class | |
| Beginning Account
Value 7/1/16 |
| |
| Ending Account
Value 12/31/16 |
| |
| Fund-Level
Expenses Paid
During Period
7/1/16–12/31/16 |
1,2 | |
| Ending Account
Value 12/31/16 |
| |
| Fund-Level
Expenses Paid
During Period
7/1/16–12/31/16 |
1,2 | |
| Net
Annualized
Expense
Ratio |
2 |
Class 2 | | | $1,000 | | | | $1,072.50 | | | | $4.38 | | | | $1,020.91 | | | | $4.27 | | | | 0.84% | |
1. Expenses are equal to the annualized expense ratio for the six-month period as indicated above–in the far right column–multiplied by the simple average account value over the period indicated, and then multiplied by 184/366 to reflect the one-half year period.
2. Reflects expenses after fee waivers and expense reimbursements. Does not include any ongoing expenses of the Contract for which the Fund is an investment option.
VIP4 P1_P2_P4 10/16
SUPPLEMENT DATED OCTOBER 17, 2016
TO THE PROSPECTUSES DATED MAY 1, 2016
OF
FRANKLIN GROWTH AND INCOME VIP FUND
FRANKLIN HIGH INCOME VIP FUND
(each, a series of Franklin Templeton Variable Insurance Products Trust)
Effective October 17, 2016, the prospectuses are amended as follows:
I. The “Fund Summary – Annual Fund Operating Expenses” table on page FGI-S1 in the Franklin Growth and Income VIP Fund’s Class 1 prospectus is replaced with the following:
Annual Fund Operating Expenses
(expenses that you pay each year as a percentage of the value of your investment)
| | | | |
| | | Class 1 | |
| Management fees1 | | | 0.63% | |
| Distribution and service (12b-1) fees | | | None | |
| Other expenses1 | | | 0.08% | |
| Total annual Fund operating expenses | | | 0.71% | |
| Fee waiver and/or expense reimbursement2 | | | -0.07% | |
| Total annual Fund operating expenses after fee waiver and/or expense reimbursement2 | | | 0.64% | |
| 1. | Management fees and other expenses have been restated to reflect increased fees due to a decline in the assets of the Fund as a result of shareholder redemptions. |
| 2. | The investment manager has contractually agreed to waive or assume certain expenses so that common expenses (excluding Rule 12b-1 fees, acquired fund fees and expenses and certain non-routine expenses) do not exceed 0.64% until April 30, 2018. Contractual fee waiver and/or expense reimbursement agreements may not be changed or terminated during the time periods set forth above. |
II. The “Fund Summary – Example” table on page FGI-S1 in the Franklin Growth and Income VIP Fund’s Class 1 prospectus is replaced with the following:
| | | | | | | | |
| | | 1 Year | | 3 Years | | 5 Years | | 10 Years |
| Class 1 | | $ 65 | | $ 220 | | $ 388 | | $ 876 |
III. The “Fund Summary – Annual Fund Operating Expenses” table on page FH-S1 in the Franklin High Income VIP Fund’s Class 1 prospectus is replaced with the following:
Annual Fund Operating Expenses
(expenses that you pay each year as a percentage of the value of your investment)
| | | | |
| | | Class 1 | |
| Management fees1 | | | 0.63% | |
| Distribution and service (12b-1) fees | | | None | |
| Other expenses1 | | | 0.30% | |
| Total annual Fund operating expenses | | | 0.93% | |
| Fee waiver and/or expense reimbursement2 | | | -0.27% | |
| Total annual Fund operating expenses after fee waiver and/or expense reimbursement2 | | | 0.66% | |
| 1. | Management fees and other expenses have been restated to reflect increased fees due to a decline in the assets of the Fund as a result of shareholder redemptions. |
| 2. | The investment manager has contractually agreed to waive or assume certain expenses so that common expenses (excluding Rule 12b-1 fees, acquired fund fees and expenses and certain non-routine expenses) do not exceed 0.66% until April 30, 2018. Contractual fee waiver and/or expense reimbursement agreements may not be changed or terminated during the time periods set forth above. |
IV. The “Fund Summary – Example” table on page FH-S1 in the Franklin High Income VIP Fund’s Class 1 prospectus is replaced with the following:
| | | | | | | | |
| | | 1 Year | | 3 Years | | 5 Years | | 10 Years |
| Class 1 | | $ 67 | | $ 269 | | $ 488 | | $ 1,118 |
V. The end of the second to last paragraph in the “Fund Details – Franklin Growth and Income VIP Fund – Management” section on page FGI-D7 in the Franklin Growth and Income VIP Fund’s Class 1 prospectus is revised to add the following:
Advisers has agreed to waive or limit its fees and to assume as its own certain expenses otherwise payable by the Fund so that common expenses (i.e., a combination of investment management fees, administration fees, and other expenses, but excluding the Rule 12b 1 fees, acquired fund fees and expenses, expenses related to securities sold short and certain non-routine expenses including those relating to litigation, indemnification, reorganizations and liquidations) for each class of the Fund do not exceed (and could be less than) 0.64% until April 30, 2018.
VI. The end of the second to last paragraph in the “Fund Details – Franklin High Income VIP Fund – Management” section on page FH-D9 in the Franklin High Income VIP Fund’s Class 1 prospectus is revised to add the following:
Advisers has agreed to waive or limit its fees and to assume as its own certain expenses otherwise payable by the Fund so that common expenses (i.e., a combination of investment management fees, administration fees, and other expenses, but excluding the Rule 12b 1 fees, acquired fund fees and expenses, expenses related to securities sold short and certain non-routine expenses including those relating to litigation, indemnification, reorganizations and liquidations) for each class of the Fund do not exceed (and could be less than) 0.66% until April 30, 2018.
VII. The “Fund Summary – Annual Fund Operating Expenses” table on page FGI-S1 in the Franklin Growth and Income VIP Fund’s Class 2 prospectus is replaced with the following:
Annual Fund Operating Expenses
(expenses that you pay each year as a percentage of the value of your investment)
| | | | |
| | | Class 2 | |
| Management fees1 | | | 0.63% | |
| Distribution and service (12b-1) fees | | | 0.25% | |
| Other expenses1 | | | 0.08% | |
| Total annual Fund operating expenses | | | 0.96% | |
| Fee waiver and/or expense reimbursement2 | | | -0.07% | |
| Total annual Fund operating expenses after fee waiver and/or expense reimbursement2 | | | 0.89% | |
| 1. | Management fees and other expenses have been restated to reflect increased fees due to a decline in the assets of the Fund as a result of shareholder redemptions. |
| 2. | The investment manager has contractually agreed to waive or assume certain expenses so that common expenses (excluding Rule 12b-1 fees, acquired fund fees and expenses and certain non-routine expenses) do not exceed 0.64% until April 30, 2018. Contractual fee waiver and/or expense reimbursement agreements may not be changed or terminated during the time periods set forth above. |
VIII. The “Fund Summary – Example” table on page FGI-S1 in the Franklin Growth and Income VIP Fund’s Class 2 prospectus is replaced with the following:
| | | | | | | | |
| | | 1 Year | | 3 Years | | 5 Years | | 10 Years |
| Class 2 | | $ 91 | | $ 299 | | $ 524 | | $ 1,172 |
IX. The “Fund Summary – Annual Fund Operating Expenses” table on page FH-S1 in the Franklin High Income VIP Fund’s Class 2 prospectus is replaced with the following:
Annual Fund Operating Expenses
(expenses that you pay each year as a percentage of the value of your investment)
| | | | |
| | | Class 2 | |
| Management fees1 | | | 0.63% | |
| Distribution and service (12b-1) fees | | | 0.25% | |
| Other expenses1 | | | 0.30% | |
| Total annual Fund operating expenses | | | 1.18% | |
| Fee waiver and/or expense reimbursement2 | | | -0.27% | |
| Total annual Fund operating expenses after fee waiver and/or expense reimbursement2 | | | 0.91% | |
| 1. | Management fees and other expenses have been restated to reflect increased fees due to a decline in the assets of the Fund as a result of shareholder redemptions. |
| 2. | The investment manager has contractually agreed to waive or assume certain expenses so that common expenses (excluding Rule 12b-1 fees, acquired fund fees and expenses and certain non-routine expenses) do not exceed 0.66% until April 30, 2018. Contractual fee waiver and/or expense reimbursement agreements may not be changed or terminated during the time periods set forth above. |
X. The “Fund Summary – Example” table on page FH-S1 in the Franklin High Income VIP Fund’s Class 2 prospectus is replaced with the following:
| | | | | | | | |
| | | 1 Year | | 3 Years | | 5 Years | | 10 Years |
| Class 2 | | $ 93 | | $ 348 | | $ 623 | | $ 1,408 |
XI. The end of the second to last paragraph in the “Fund Details – Franklin Growth and Income VIP Fund – Management” section on page FGI-D7 in the Franklin Growth and Income VIP Fund’s Class 2 prospectus is revised to add the following:
Advisers has agreed to waive or limit its fees and to assume as its own certain expenses otherwise payable by the Fund so that common expenses (i.e., a combination of investment management fees, administration fees, and other expenses, but excluding the Rule 12b 1 fees, acquired fund fees and expenses, expenses related to securities sold short and certain non-routine expenses including those relating to litigation, indemnification, reorganizations and liquidations) for each class of the Fund do not exceed (and could be less than) 0.64% until April 30, 2018.
XII. The end of the second to last paragraph in the “Fund Details – Franklin High Income VIP Fund – Management” section on page FH-D9 in the Franklin High Income VIP Fund’s Class 2 prospectus is revised to add the following:
Advisers has agreed to waive or limit its fees and to assume as its own certain expenses otherwise payable by the Fund so that common expenses (i.e., a combination of investment management fees, administration fees, and other expenses, but excluding the Rule 12b 1 fees, acquired fund fees and expenses, expenses related to securities sold short and certain non-routine expenses including those relating to litigation, indemnification, reorganizations and liquidations) for each class of the Fund do not exceed (and could be less than) 0.66% until April 30, 2018.
XIII. The “Fund Summary – Annual Fund Operating Expenses” table on page FH-S1 in the Franklin High Income VIP Fund’s Class 4 prospectus is replaced with the following:
Annual Fund Operating Expenses
(expenses that you pay each year as a percentage of the value of your investment)
| | | | |
| | | Class 4 | |
| Management fees1 | | | 0.63% | |
| Distribution and service (12b-1) fees | | | 0.35% | |
| Other expenses1 | | | 0.30% | |
| Total annual Fund operating expenses | | | 1.28% | |
| Fee waiver and/or expense reimbursement2 | | | -0.27% | |
| Total annual Fund operating expenses after fee waiver and/or expense reimbursement2 | | | 1.01% | |
| 1. | Management fees and other expenses have been restated to reflect increased fees due to a decline in the assets of the Fund as a result of shareholder redemptions. |
| 2. | The investment manager has contractually agreed to waive or assume certain expenses so that common expenses (excluding Rule 12b-1 fees, acquired fund fees and expenses and certain non-routine expenses) do not exceed 0.66% until April 30, 2018. Contractual fee waiver and/or expense reimbursement agreements may not be changed or terminated during the time periods set forth above. |
XIV. The “Fund Summary – Example” table on page FH-S1 in the Franklin High Income VIP Fund’s Class 4 prospectus is replaced with the following:
| | | | | | | | |
| | | 1 Year | | 3 Years | | 5 Years | | 10 Years |
| Class 4 | | $ 103 | | $ 379 | | $ 676 | | $ 1,522 |
XV. The end of the second to last paragraph in the “Fund Details – Franklin High Income VIP Fund – Management” section on page FH-D9 in the Franklin High Income VIP Fund’s Class 4 prospectus is revised to add the following:
Advisers has agreed to waive or limit its fees and to assume as its own certain expenses otherwise payable by the Fund so that common expenses (i.e., a combination of investment management fees, administration fees, and other expenses, but excluding the Rule 12b 1 fees, acquired fund fees and expenses, expenses related to securities sold short and certain non-routine expenses including those relating to litigation, indemnification, reorganizations and liquidations) for each class of the Fund do not exceed (and could be less than) 0.66% until April 30, 2018.
Please keep this supplement with your prospectus for future reference.
FRANKLIN TEMPLETON VARIABLE INSURANCE PRODUCTS TRUST
Financial Highlights
Franklin Growth and Income VIP Fund
| | | | | | | | | | | | | | | | | | | | |
| | | Year Ended December 31, | |
| | | 2016 | | | 2015 | | | 2014 | | | 2013 | | | 2012 | |
| Class 1 | | | | | | | | | | | | | | | | | | | | |
Per share operating performance
(for a share outstanding throughout the year) | | | | | | | | | | | | | | | | | | | | |
| | | | | |
Net asset value, beginning of year | | | $15.94 | | | | $17.02 | | | | $15.97 | | | | $12.64 | | | | $11.60 | |
| | | | |
| | | | | |
| Income from investment operationsa: | | | | | | | | | | | | | | | | | | | | |
| | | | | |
Net investment incomeb | | | 0.40 | | | | 0.45 | | | | 0.53 | c | | | 0.33 | | | | 0.35 | |
| | | | | |
Net realized and unrealized gains (losses) | | | 1.33 | | | | (0.54 | ) | | | 0.95 | | | | 3.40 | | | | 1.08 | |
| | | | |
Total from investment operations | | | 1.73 | | | | (0.09 | ) | | | 1.48 | | | | 3.73 | | | | 1.43 | |
| | | | |
| | | | | |
| Less distributions from: | | | | | | | | | | | | | | | | | | | | |
| | | | | |
Net investment income | | | (0.46 | ) | | | (0.61 | ) | | | (0.43 | ) | | | (0.40 | ) | | | (0.39 | ) |
| | | | | |
Net realized gains | | | (1.24 | ) | | | (0.38 | ) | | | — | | | | — | | | | — | |
| | | | |
Total distributions | | | (1.70 | ) | | | (0.99 | ) | | | (0.43 | ) | | | (0.40 | ) | | | (0.39 | ) |
| | | | |
Net asset value, end of year | | | $15.97 | | | | $15.94 | | | | $17.02 | | | | $15.97 | | | | $12.64 | |
| | | | |
| | | | | |
Total returnd | | | 11.86% | | | | (0.62)% | | | | 9.40% | | | | 29.96% | | | | 12.53% | |
| | | | | |
| Ratios to average net assets | | | | | | | | | | | | | | | | | | | | |
| | | | | |
Expenses | | | 0.59% | e,f | | | 0.58% | | | | 0.57% | e | | | 0.58% | e | | | 0.60% | |
| | | | | |
Net investment income | | | 2.38% | | | | 2.74% | | | | 3.26% | c | | | 2.29% | | | | 2.86% | |
| | | | | |
| Supplemental data | | | | | | | | | | | | | | | | | | | | |
| | | | | |
Net assets, end of year (000’s) | | | $29,829 | | | | $144,663 | | | | $168,961 | | | | $175,860 | | | | $154,463 | |
| | | | | |
Portfolio turnover rate | | | 40.59% | g | | | 48.81% | | | | 20.54% | | | | 35.16% | | | | 30.00% | |
aThe amount shown for a share outstanding throughout the period may not correlate with the Statement of Operations for the period due to the timing of sales and repurchases of the Fund’s shares in relation to income earned and/or fluctuating fair value of the investments of the Fund.
bBased on average daily shares outstanding.
cNet investment income per share includes approximately $0.12 per share related to income received in the form of special dividends in connection with certain Fund holdings. Excluding this amount, the ratio of net investment income to average net assets would have been 2.53%.
dTotal return does not include fees, charges or expenses imposed by the variable annuity and life insurance contracts for which Franklin Templeton Variable Insurance Products Trust serves as an underlying investment vehicle.
eBenefit of expense reduction rounds to less than 0.01%.
fBenefit of waiver and payments by affiliates rounds to less than 0.01%.
gExcludes the value of portfolio securities delivered as a result of a redemption in-kind. See Note 9.
| | | | | | |
| | | The accompanying notes are an integral part of these financial statements. | Annual Report | | | FGI-11 | |
FRANKLIN TEMPLETON VARIABLE INSURANCE PRODUCTS TRUST
FINANCIAL HIGHLIGHTS
Franklin Growth and Income VIP Fund (continued)
| | | | | | | | | | | | | | | | | | | | |
| | | Year Ended December 31, | |
| | | 2016 | | | 2015 | | | 2014 | | | 2013 | | | 2012 | |
| Class 2 | | | | | | | | | | | | | | | | | | | | |
Per share operating performance
(for a share outstanding throughout the year) | | | | | | | | | | | | | | | | | | | | |
| | | | | |
Net asset value, beginning of year | | | $15.68 | | | | $16.76 | | | | $15.73 | | | | $12.46 | | | | $11.44 | |
| | | | |
| | | | | |
| Income from investment operationsa: | | | | | | | | | | | | | | | | | | | | |
| | | | | |
Net investment incomeb | | | 0.30 | | | | 0.40 | | | | 0.48 | c | | | 0.29 | | | | 0.32 | |
| | | | | |
Net realized and unrealized gains (losses) | | | 1.37 | | | | (0.54 | ) | | | 0.94 | | | | 3.35 | | | | 1.05 | |
| | | | |
Total from investment operations | | | 1.67 | | | | (0.14 | ) | | | 1.42 | | | | 3.64 | | | | 1.37 | |
| | | | |
| | | | | |
| Less distributions from: | | | | | | | | | | | | | | | | | | | | |
| | | | | |
Net investment income | | | (0.42 | ) | | | (0.56 | ) | | | (0.39 | ) | | | (0.37 | ) | | | (0.35 | ) |
| | | | | |
Net realized gains | | | (1.24 | ) | | | (0.38 | ) | | | — | | | | — | | | | — | |
| | | | |
Total distributions | | | (1.66 | ) | | | (0.94 | ) | | | (0.39 | ) | | | (0.37 | ) | | | (0.35 | ) |
| | | | |
Net asset value, end of year | | | $15.69 | | | | $15.68 | | | | $16.76 | | | | $15.73 | | | | $12.46 | |
| | | | |
| | | | | |
Total returnd | | | 11.62% | | | | (0.91)% | | | | 9.14% | | | | 29.60% | | | | 12.23% | |
| | | | | |
| Ratios to average net assets | | | | | | | | | | | | | | | | | | | | |
| | | | | |
Expenses | | | 0.84% | e,f | | | 0.83% | | | | 0.82% | e | | | 0.83% | e | | | 0.85% | |
| | | | | |
Net investment income | | | 2.13% | | | | 2.49% | | | | 3.01% | c | | | 2.04% | | | | 2.61% | |
| | | | | |
| Supplemental data | | | | | | | | | | | | | | | | | | | | |
| | | | | |
Net assets, end of year (000’s) | | | $69,474 | | | | $124,691 | | | | $138,191 | | | | $150,966 | | | | $131,400 | |
| | | | | |
Portfolio turnover rate | | | 40.59% | g | | | 48.81% | | | | 20.54% | | | | 35.16% | | | | 30.00% | |
aThe amount shown for a share outstanding throughout the period may not correlate with the Statement of Operations for the period due to the timing of sales and repurchases of the Fund’s shares in relation to income earned and/or fluctuating fair value of the investments of the Fund.
bBased on average daily shares outstanding.
cNet investment income per share includes approximately $0.12 per share related to income received in the form of special dividends in connection with certain Fund holdings. Excluding this amount, the ratio of net investment income to average net assets would have been 2.28%.
dTotal return does not include fees, charges or expenses imposed by the variable annuity and life insurance contracts for which Franklin Templeton Variable Insurance Products Trust serves as an underlying investment vehicle.
eBenefit of expense reduction rounds to less than 0.01%.
fBenefit of waiver and payments by affiliates rounds to less than 0.01%.
gExcludes the value of portfolio securities delivered as a result of a redemption in-kind. See Note 9.
| | | | |
| FGI-12 | | Annual Report | The accompanying notes are an integral part of these financial statements. | | |
FRANKLIN TEMPLETON VARIABLE INSURANCE PRODUCTS TRUST
Statement of Investments, December 31, 2016
| | | | | | | | | | | | | | |
Franklin Growth and Income VIP Fund | |
| | | | | Country | | | Shares | | | Value | |
| | | Common Stocks 87.1% | | | | | | | | | |
| | | Consumer Discretionary 6.3% | | | | | | | | | |
| | Ford Motor Co. | | | United States | | | | 56,807 | | | $ | 689,069 | |
| | L Brands Inc. | | | United States | | | | 9,500 | | | | 625,481 | |
| | Lowe’s Cos. Inc. | | | United States | | | | 20,348 | | | | 1,447,150 | |
| | Mattel Inc. | | | United States | | | | 34,898 | | | | 961,440 | |
| | Newell Brands Inc. | | | United States | | | | 23,819 | | | | 1,063,518 | |
| | Target Corp. | | | United States | | | | 20,380 | | | | 1,472,047 | |
| | | | | | | | | | | | | | |
| | | | | | | | | | | | | 6,258,705 | |
| | | | | | | | | | | | | | |
| | | Consumer Staples 8.3% | | | | | | | | | |
| | Anheuser-Busch InBev SA/NV, ADR | | | Belgium | | | | 11,337 | | | | 1,195,373 | |
| | CVS Health Corp. | | | United States | | | | 18,884 | | | | 1,490,137 | |
| | Kimberly-Clark Corp. | | | United States | | | | 8,481 | | | | 967,852 | |
| | The Kraft Heinz Co. | | | United States | | | | 20,981 | | | | 1,832,061 | |
| | PepsiCo Inc. | | | United States | | | | 23,498 | | | | 2,458,596 | |
| | Reynolds American Inc. | | | United States | | | | 5,261 | | | | 294,826 | |
| | | | | | | | | | | | | | |
| | | | | | | | | | | | | 8,238,845 | |
| | | | | | | | | | | | | | |
| | | Energy 9.4% | | | | | | | | | |
| | Anadarko Petroleum Corp. | | | United States | | | | 9,618 | | | | 670,663 | |
| | BP PLC, ADR | | | United Kingdom | | | | 16,286 | | | | 608,771 | |
| | Chevron Corp. | | | United States | | | | 23,368 | | | | 2,750,414 | |
| | ConocoPhillips | | | United States | | | | 14,263 | | | | 715,147 | |
| | Exxon Mobil Corp. | | | United States | | | | 16,977 | | | | 1,532,344 | |
| | Royal Dutch Shell PLC, A, ADR | | | United Kingdom | | | | 12,813 | | | | 696,771 | |
| | Schlumberger Ltd. | | | United States | | | | 14,457 | | | | 1,213,665 | |
| | Suncor Energy Inc. | | | Canada | | | | 35,782 | | | | 1,169,713 | |
| | | | | | | | | | | | | | |
| | | | | | | | | | | | | 9,357,488 | |
| | | | | | | | | | | | | | |
| | | Financials 18.0% | | | | | | | | | |
| | Arthur J. Gallagher & Co. | | | United States | | | | 30,666 | | | | 1,593,405 | |
| | Bank of America Corp. | | | United States | | | | 22,400 | | | | 495,040 | |
| | BB&T Corp. | | | United States | | | | 31,176 | | | | 1,465,896 | |
| | BlackRock Inc. | | | United States | | | | 5,161 | | | | 1,963,967 | |
| | The Charles Schwab Corp. | | | United States | | | | 4,703 | | | | 185,627 | |
| | JPMorgan Chase & Co. | | | United States | | | | 44,674 | | | | 3,854,920 | |
| | Morgan Stanley | | | United States | | | | 44,037 | | | | 1,860,563 | |
| | T. Rowe Price Group Inc. | | | United States | | | | 12,619 | | | | 949,706 | |
| | U.S. Bancorp. | | | United States | | | | 50,155 | | | | 2,576,462 | |
| | Wells Fargo & Co. | | | United States | | | | 53,250 | | | | 2,934,608 | |
| | | | | | | | | | | | | | |
| | | | | | | | | | | | | 17,880,194 | |
| | | | | | | | | | | | | | |
| | | Health Care 6.8% | | | | | | | | | |
| | AstraZeneca PLC, ADR | | | United Kingdom | | | | 30,292 | | | | 827,577 | |
| | Eli Lilly & Co. | | | United States | | | | 24,537 | | | | 1,804,696 | |
| | Johnson & Johnson | | | United States | | | | 6,765 | | | | 779,396 | |
| | Medtronic PLC | | | United States | | | | 24,381 | | | | 1,736,659 | |
| | Pfizer Inc. | | | United States | | | | 48,463 | | | | 1,574,078 | |
| | | | | | | | | | | | | | |
| | | | | | | | | | | | | 6,722,406 | |
| | | | | | | | | | | | | | |
| | | Industrials 15.9% | | | | | | | | | |
| | Deere & Co. | | | United States | | | | 8,742 | | | | 900,776 | |
| | General Electric Co. | | | United States | | | | 82,532 | | | | 2,608,011 | |
| | Illinois Tool Works Inc. | | | United States | | | | 14,111 | | | | 1,728,033 | |
| | Lockheed Martin Corp. | | | United States | | | | 6,169 | | | | 1,541,880 | |
| | Norfolk Southern Corp. | | | United States | | | | 7,000 | | | | 756,490 | |
FRANKLIN TEMPLETON VARIABLE INSURANCE PRODUCTS TRUST
STATEMENT OF INVESTMENTS
Franklin Growth and Income VIP Fund (continued)
| | | | | | | | | | | | | | |
| | | | | Country | | | Shares | | | Value | |
| | | Common Stocks (continued) | | | | | | | | | |
| | | Industrials (continued) | | | | | | | | | |
| | Raytheon Co. | | | United States | | | | 13,616 | | | $ | 1,933,472 | |
| | Republic Services Inc. | | | United States | | | | 29,780 | | | | 1,698,949 | |
| | Stanley Black & Decker Inc. | | | United States | | | | 13,132 | | | | 1,506,109 | |
| | United Parcel Service Inc., B. | | | United States | | | | 12,317 | | | | 1,412,021 | |
| | United Technologies Corp. | | | United States | | | | 15,334 | | | | 1,680,913 | |
| | | | | | | | | | | | | | |
| | | | | | | | | | | | | 15,766,654 | |
| | | | | | | | | | | | | | |
| | | Information Technology 12.4% | | | | | | | | | |
| | Apple Inc. | | | United States | | | | 17,132 | | | | 1,984,228 | |
| | Broadcom Ltd. | | | Singapore | | | | 2,741 | | | | 484,526 | |
| | Cisco Systems Inc. | | | United States | | | | 72,789 | | | | 2,199,684 | |
| | Intel Corp. | | | United States | | | | 29,963 | | | | 1,086,758 | |
| | Microsoft Corp. | | | United States | | | | 62,676 | | | | 3,894,687 | |
| | Oracle Corp. | | | United States | | | | 25,829 | | | | 993,125 | |
| | Texas Instruments Inc. | | | United States | | | | 22,796 | | | | 1,663,424 | |
| | | | | | | | | | | | | | |
| | | | | | | | | | | | | 12,306,432 | |
| | | | | | | | | | | | | | |
| | | Materials 4.3% | | | | | | | | | |
| | BASF SE | | | Germany | | | | 13,437 | | | | 1,248,563 | |
| | The Dow Chemical Co. | | | United States | | | | 24,573 | | | | 1,406,067 | |
| | International Paper Co. | | | United States | | | | 31,620 | | | | 1,677,757 | |
| | | | | | | | | | | | | | |
| | | | | | | | | | | | | 4,332,387 | |
| | | | | | | | | | | | | | |
| | | Real Estate 1.3% | | | | | | | | | |
| | Host Hotels & Resorts Inc. | | | United States | | | | 68,741 | | | | 1,295,080 | |
| | | | | | | | | | | | | | |
| | | Telecommunication Services 1.6% | | | | | | | | | |
| | Rogers Communications Inc., B | | | Canada | | | | 16,744 | | | | 645,983 | |
| | Verizon Communications Inc. | | | United States | | | | 18,110 | | | | 966,712 | |
| | | | | | | | | | | | | | |
| | | | | | | | | | | | | 1,612,695 | |
| | | | | | | | | | | | | | |
| | | Utilities 2.8% | | | | | | | | | |
| | Dominion Resources Inc. | | | United States | | | | 19,604 | | | | 1,501,471 | |
| | Xcel Energy Inc. | | | United States | | | | 31,296 | | | | 1,273,747 | |
| | | | | | | | | | | | | | |
| | | | | | | | | | | | | 2,775,218 | |
| | | | | | | | | | | | | | |
| | | | |
| | Total Common Stocks (Cost $64,023,901) | | | | | | | | | | | 86,546,104 | |
| | | | | | | | | | | | | | |
| a | | Equity-Linked Securities 6.3% | | | | | | | | | | | | |
| | | Consumer Discretionary 1.1% | | | | | | | | | |
| b | | Wells Fargo Bank National Assn. into Amazon.com Inc., 5.00%, 144A | | | United States | | | | 1,500 | | | | 1,124,411 | |
| | | | | | | | | | | | | | |
| | | Energy 0.4% | | | | | | | | | |
| b | | UBS AG London into Anadarko Petroleum Corp., 9.00%, 144A | | | United States | | | | 6,000 | | | | 414,133 | |
| | | | | | | | | | | | | | |
| | | Financials 1.4% | | | | | | | | | |
| b | | The Goldman Sachs Group Inc. into The Charles Schwab Corp., 7.00%, 144A | | | United States | | | | 41,000 | | | | 1,393,762 | |
| | | | | | | | | | | | | | |
| | | Health Care 1.0% | | | | | | | | | |
| b | | Merrill Lynch International & Co. CV into Gilead Sciences Inc., 7.25%, 144A | | | United States | | | | 13,000 | | | | 950,204 | |
| | | | | | | | | | | | | | |
| | | Information Technology 2.4% | | | | | | | | | |
| b | | Barclays Bank PLC into Broadcom Ltd., 9.00%, 144A | | | Singapore | | | | 6,400 | | | | 1,068,077 | |
| b | | UBS AG into Intel Corp., 7.00%, 144A | | | United States | | | | 35,000 | | | | 1,280,170 | |
| | | | | | | | | | | | | | |
| | | | | | | | | | | | | 2,348,247 | |
| | | | | | | | | | | | | | |
| | | | |
| | Total Equity-Linked Securities (Cost $6,072,335) | | | | | | | | | | | 6,230,757 | |
| | | | | | | | | | | | | | |
FRANKLIN TEMPLETON VARIABLE INSURANCE PRODUCTS TRUST
STATEMENT OF INVESTMENTS
Franklin Growth and Income VIP Fund (continued)
| | | | | | | | | | | | | | |
| | | | | Country | | | Shares | | | Value | |
| | | Convertible Preferred Stocks 3.0% | | | | | | | | | |
| | | Health Care 1.4% | | | | | | | | | |
| | Allergan PLC, 5.50%, cvt. pfd | | | United States | | | | 1,851 | | | $ | 1,411,314 | |
| | | | | | | | | | | | | | |
| | | Utilities 1.6% | | | | | | | | | |
| | NextEra Energy Inc., 6.371%, cvt. pfd | | | United States | | | | 26,777 | | | | 1,532,983 | |
| | | | | | | | | | | | | | |
| | | | |
| | Total Convertible Preferred Stocks (Cost $3,218,070) | | | | | | | | | | | 2,944,297 | |
| | | | | | | | | | | | | | |
| | | | |
| | Total Investments before Short Term Investments
(Cost $73,314,306) | | | | | | | | | | | 95,721,158 | |
| | | | | | | | | | | | | | |
| | | | |
| | | | | | | | Principal Amount | | | | |
| | | | |
| | Short Term Investments (Cost $4,021,690) 4.0% | | | | | | | | | | | | |
| | | Repurchase Agreements 4.0% | | | | | | | | | |
| c | | Joint Repurchase Agreement, 0.437%, 1/03/17 (Maturity Value $4,021,886) | | | | | | | | | | | | |
| | BNP Paribas Securities Corp. (Maturity Value $1,690,600) | | | | | | | | | | | | |
| | Deutsche Bank Securities Inc. (Maturity Value $211,270) | | | | | | | | | | | | |
| | HSBC Securities (USA) Inc. (Maturity Value $1,690,600) | | | | | | | | | | | | |
| | Merrill Lynch, Pierce, Fenner & Smith Inc. (Maturity Value $429,416) Collateralized by U.S. Government Agency Securities, 0.00% - 1.75%, 6/09/17 - 2/26/19; dU.S. Treasury Bill, 5/04/17 - 5/25/17; U.S. Treasury Note, 0.50% - 3.50%, 12/31/16 - 8/31/21; and U.S. Treasury Note, Index Linked, 1.375%, 7/15/18 (valued at $4,103,058) | | | United States | | | $ | 4,021,690 | | | | 4,021,690 | |
| | | | | | | | | | | | | | |
| | | | |
| | Total Investments (Cost $77,335,996) 100.4% | | | | | | | | | | | 99,742,848 | |
| | Other Assets, less Liabilities (0.4)% | | | | | | | | | | | (440,499 | ) |
| | | | | | | | | | | | | | |
| | Net Assets 100.0% | | | | | | | | | | $ | 99,302,349 | |
| | | | | | | | | | | | | | |
See Abbreviations on page FGI- 27.
aSee Note 1(e) regarding equity-linked securities.
bSecurity was purchased pursuant to Rule 144A under the Securities Act of 1933 and may be sold in transactions exempt from registration only to qualified institutional buyers or in a public offering registered under the Securities Act of 1933. These securities have been deemed liquid under guidelines approved by the Trust’s Board of Trustees. At December 31, 2016, the aggregate value of these securities was $6,230,757, representing 6.3% of net assets.
cSee Note 1(c) regarding joint repurchase agreement.
dThe security was issued on a discount basis with no stated coupon rate.
| | | | | | |
| | | The accompanying notes are an integral part of these financial statements. | Annual Report | | | FGI-15 | |
FRANKLIN TEMPLETON VARIABLE INSURANCE PRODUCTS TRUST
Financial Statements
Statement of Assets and Liabilities
December 31, 2016
| | | | |
| | | Franklin Growth
and Income
VIP Fund | |
Assets: | | | | |
Investments in securities: | | | | |
Cost - Unaffiliated issuers | | $ | 73,314,306 | |
Cost - Repurchase agreements | | | 4,021,690 | |
| | | | |
Total cost of investments | | $ | 77,335,996 | |
| | | | |
Value - Unaffiliated issuers | | $ | 95,721,158 | |
Value - Repurchase agreements. | | | 4,021,690 | |
| | | | |
Total value of investments | | | 99,742,848 | |
Receivables: | | | | |
Capital shares sold | | | 25,716 | |
Dividends | | | 266,244 | |
Other assets | | | 21 | |
| | | | |
Total assets | | | 100,034,829 | |
| | | | |
Liabilities: | | | | |
Payables: | | | | |
Investment securities purchased. | | | 291,307 | |
Capital shares redeemed. | | | 296,692 | |
Management fees | | | 39,849 | |
Distribution fees | | | 28,619 | |
Accrued expenses and other liabilities | | | 76,013 | |
| | | | |
Total liabilities. | | | 732,480 | |
| | | | |
Net assets, at value | | $ | 99,302,349 | |
| | | | |
Net assets consist of: | | | | |
Paid-in capital | | $ | 64,233,665 | |
Undistributed net investment income. | | | 6,282,159 | |
Net unrealized appreciation (depreciation) | | | 22,402,886 | |
Accumulated net realized gain (loss) | | | 6,383,639 | |
| | | | |
Net assets, at value | | $ | 99,302,349 | |
| | | | |
| |
| Class 1: | | | | |
Net assets, at value | | $ | 29,828,830 | |
| | | | |
Shares outstanding | | | 1,867,910 | |
| | | | |
Net asset value and maximum offering price per share | | $ | 15.97 | |
| | | | |
| |
| Class 2: | | | | |
Net assets, at value | | $ | 69,473,519 | |
| | | | |
Shares outstanding | | | 4,428,633 | |
| | | | |
Net asset value and maximum offering price per share | | $ | 15.69 | |
| | | | |
| | | | |
| FGI-16 | | Annual Report | The accompanying notes are an integral part of these financial statements. | | |
FRANKLIN TEMPLETON VARIABLE INSURANCE PRODUCTS TRUST
FINANCIAL STATEMENTS
Statement of Operations
for the year ended December 31, 2016
| | | | |
| | | Franklin Growth
and Income VIP Fund | |
Investment income: | | | | |
Dividends | | $ | 7,191,142 | |
Interest | | | 22,952 | |
| | | | |
Total investment income | | | 7,214,094 | |
| | | | |
Expenses: | | | | |
Management fees (Note 3a) | | | 1,329,131 | |
Distribution fees - Class 2 (Note 3c) | | | 279,532 | |
Custodian fees (Note 4) | | | 1,889 | |
Reports to shareholders | | | 43,517 | |
Registration and filing fees | | | 119 | |
Professional fees | | | 51,158 | |
Trustees’ fees and expenses | | | 1,305 | |
Other | | | 11,862 | |
| | | | |
Total expenses | | | 1,718,513 | |
Expense reductions (Note 4) | | | (69 | ) |
Expenses waived/paid by affiliates (Note 3e) | | | (12,744 | ) |
| | | | |
Net expenses | | | 1,705,700 | |
| | | | |
Net investment income | | | 5,508,394 | |
| | | | |
Realized and unrealized gains (losses): | | | | |
Net realized gain (loss) from: | | | | |
Investments (includes gains from a redemption in-kind of $38,040,305) (Note 9) | | | 45,017,757 | |
Written options | | | 179,694 | |
Foreign currency transactions | | | (26,219 | ) |
| | | | |
Net realized gain (loss) | | | 45,171,232 | |
| | | | |
Net change in unrealized appreciation (depreciation) on: | | | | |
Investments | | | (27,856,092 | ) |
Translation of other assets and liabilities denominated in foreign currencies | | | (1,620 | ) |
| | | | |
Net change in unrealized appreciation (depreciation) | | | (27,857,712 | ) |
| | | | |
Net realized and unrealized gain (loss) | | | 17,313,520 | |
| | | | |
Net increase (decrease) in net assets resulting from operations | | $ | 22,821,914 | |
| | | | |
| | | | | | |
| | | The accompanying notes are an integral part of these financial statements. | Annual Report | | | FGI-17 | |
FRANKLIN TEMPLETON VARIABLE INSURANCE PRODUCTS TRUST
FINANCIAL STATEMENTS
Statements of Changes in Net Assets
| | | | | | | | |
| | | Franklin Growth and Income VIP Fund | |
| | | Year Ended December 31, | |
| | | 2016 | | | 2015 | |
Increase (decrease) in net assets: | | | | | | | | |
Operations: | | | | | | | | |
Net investment income | | $ | 5,508,394 | | | $ | 7,562,301 | |
Net realized gain (loss) | | | 45,171,232 | | | | 21,830,508 | |
Net change in unrealized appreciation (depreciation) | | | (27,857,712 | ) | | | (31,573,522 | ) |
| | | | |
Net increase (decrease) in net assets resulting from operations | | | 22,821,914 | | | | (2,180,713 | ) |
| | | | |
Distributions to shareholders from: | | | | | | | | |
Net investment income: | | | | | | | | |
Class 1 | | | (4,525,425 | ) | | | (5,633,682 | ) |
Class 2 | | | (3,230,836 | ) | | | (4,366,077 | ) |
Net realized gains: | | | | | | | | |
Class 1 | | | (12,121,008 | ) | | | (3,526,285 | ) |
Class 2 | | | (9,525,503 | ) | | | (2,955,426 | ) |
| | | | |
Total distributions to shareholders | | | (29,402,772 | ) | | | (16,481,470 | ) |
| | | | |
Capital share transactions: (Note 2) | | | | | | | | |
Class 1 | | | (110,461,648 | ) | | | (14,135,093 | ) |
Class 2 | | | (53,009,745 | ) | | | (5,000,453 | ) |
| | | | |
Total capital share transactions | | | (163,471,393 | ) | | | (19,135,546 | ) |
| | | | |
Net increase (decrease) in net assets. | | | (170,052,251 | ) | | | (37,797,729 | ) |
Net assets: | | | | | | | | |
Beginning of year | | | 269,354,600 | | | | 307,152,329 | |
| | | | |
End of year | | $ | 99,302,349 | | | $ | 269,354,600 | |
| | | | |
Undistributed net investment income included in net assets: | | | | | | | | |
End of year | | $ | 6,282,159 | | | $ | 7,645,390 | |
| | | | |
| | | | |
| FGI-18 | | Annual Report | The accompanying notes are an integral part of these financial statements. | | |
FRANKLIN TEMPLETON VARIABLE INSURANCE PRODUCTS TRUST
Notes to Financial Statements
Franklin Growth and Income VIP Fund
1. Organization and Significant Accounting Policies
Franklin Templeton Variable Insurance Products Trust (Trust) is registered under the Investment Company Act of 1940 (1940 Act) as an open-end management investment company, consisting of nineteen separate funds and applies the specialized accounting and reporting guidance in U.S. Generally Accepted Accounting Principles (U.S. GAAP). Franklin Growth and Income VIP Fund (Fund) is included in this report. The financial statements of the remaining funds in the Trust are presented separately. Shares of the Fund are generally sold only to insurance company separate accounts to fund the benefits of variable life insurance policies or variable annuity contracts. The Fund offers two classes of shares: Class 1 and Class 2. Each class of shares differs by its distribution fees, voting rights on matters affecting a single class, its exchange privilege.
The following summarizes the Fund’s significant accounting policies.
a. Financial Instrument Valuation
The Fund’s investments in financial instruments are carried at fair value daily. Fair value is the price that would be received to sell an asset or paid to transfer a liability in an orderly transaction between market participants on the measurement date. The Fund calculates the net asset value (NAV) per share as of 4 p.m. Eastern time each day the New York Stock Exchange (NYSE) is open for trading. Under compliance policies and procedures approved by the Trust’s Board of Trustees (the Board), the Fund’s administrator has responsibility for oversight of valuation, including leading the cross-functional Valuation Committee (VC). The VC provides administration and oversight of the Fund’s valuation policies and procedures, which are approved annually by the Board. Among other things, these procedures allow the Fund to utilize independent pricing services, quotations from securities and financial instrument dealers, and other market sources to determine fair value.
Equity securities and derivative financial instruments listed on an exchange or on the NASDAQ National Market System are valued at the last quoted sale price or the official closing price of the day, respectively. Foreign equity securities are valued as of the close of trading on the foreign stock exchange on which the security is primarily traded, or as of 4 p.m. Eastern time. The value is then converted into its U.S. dollar equivalent at the foreign exchange rate in effect at 4 p.m. Eastern time on the day
that the value of the security is determined. Over-the-counter (OTC) securities are valued within the range of the most recent quoted bid and ask prices. Securities that trade in multiple markets or on multiple exchanges are valued according to the broadest and most representative market. Certain equity securities are valued based upon fundamental characteristics or relationships to similar securities.
Investments in repurchase agreements are valued at cost, which approximates fair value.
The Fund has procedures to determine the fair value of financial instruments for which market prices are not reliable or readily available. Under these procedures, the VC convenes on a regular basis to review such financial instruments and considers a number of factors, including significant unobservable valuation inputs, when arriving at fair value. The VC primarily employs a market-based approach which may use related or comparable assets or liabilities, recent transactions, market multiples, book values, and other relevant information for the investment to determine the fair value of the investment. An income-based valuation approach may also be used in which the anticipated future cash flows of the investment are discounted to calculate fair value. Discounts may also be applied due to the nature or duration of any restrictions on the disposition of the investments. Due to the inherent uncertainty of valuations of such investments, the fair values may differ significantly from the values that would have been used had an active market existed. The VC employs various methods for calibrating these valuation approaches including a regular review of key inputs and assumptions, transactional back-testing or disposition analysis, and reviews of any related market activity.
Trading in securities on foreign securities stock exchanges and OTC markets may be completed before 4 p.m. Eastern time. In addition, trading in certain foreign markets may not take place on every Fund’s business day. Occasionally, events occur between the time at which trading in a foreign security is completed and 4 p.m. Eastern time that might call into question the reliability of the value of a portfolio security held by the Fund. As a result, differences may arise between the value of the Fund’s portfolio securities as determined at the foreign market close and the latest indications of value at 4 p.m. Eastern time. In order to minimize the potential for these differences, the VC monitors price movements following the close of trading in foreign stock markets through a series of country specific market proxies (such as baskets of American Depositary Receipts, futures contracts and exchange traded
FRANKLIN TEMPLETON VARIABLE INSURANCE PRODUCTS TRUST
NOTES TO FINANCIAL STATEMENTS
Franklin Growth and Income VIP Fund (continued)
1. Organization and Significant Accounting
Policies (continued)
a. Financial Instrument Valuation (continued)
funds). These price movements are measured against established trigger thresholds for each specific market proxy to assist in determining if an event has occurred that may call into question the reliability of the values of the foreign securities held by the Fund. If such an event occurs, the securities may be valued using fair value procedures, which may include the use of independent pricing services.
When the last day of the reporting period is a non-business day, certain foreign markets may be open on those days that the Fund’s NAV is not calculated, which could result in differences between the value of the Fund’s portfolio securities on the last business day and the last calendar day of the reporting period. Any significant security valuation changes due to an open foreign market are adjusted and reflected by the Fund for financial reporting purposes.
b. Foreign Currency Translation
Portfolio securities and other assets and liabilities denominated in foreign currencies are translated into U.S. dollars based on the exchange rate of such currencies against U.S. dollars on the date of valuation. The Fund may enter into foreign currency exchange contracts to facilitate transactions denominated in a foreign currency. Purchases and sales of securities, income and expense items denominated in foreign currencies are translated into U.S. dollars at the exchange rate in effect on the transaction date. Portfolio securities and assets and liabilities denominated in foreign currencies contain risks that those currencies will decline in value relative to the U.S. dollar. Occasionally, events may impact the availability or reliability of foreign exchange rates used to convert the U.S. dollar equivalent value. If such an event occurs, the foreign exchange rate will be valued at fair value using procedures established and approved by the Board.
The Fund does not separately report the effect of changes in foreign exchange rates from changes in market prices on securities held. Such changes are included in net realized and unrealized gain or loss from investments in the Statement of Operations.
Realized foreign exchange gains or losses arise from sales of foreign currencies, currency gains or losses realized between the trade and settlement dates on securities transactions and the difference between the recorded amounts of dividends, interest,
and foreign withholding taxes and the U.S. dollar equivalent of the amounts actually received or paid. Net unrealized foreign exchange gains and losses arise from changes in foreign exchange rates on foreign denominated assets and liabilities other than investments in securities held at the end of the reporting period.
c. Joint Repurchase Agreement
The Fund enters into a joint repurchase agreement whereby its uninvested cash balance is deposited into a joint cash account with other funds managed by the investment manager or an affiliate of the investment manager and is used to invest in one or more repurchase agreements. The value and face amount of the joint repurchase agreement are allocated to the funds based on their pro-rata interest. A repurchase agreement is accounted for as a loan by the Fund to the seller, collateralized by securities which are delivered to the Fund’s custodian. The fair value, including accrued interest, of the initial collateralization is required to be at least 102% of the dollar amount invested by the funds, with the value of the underlying securities marked to market daily to maintain coverage of at least 100%. Repurchase agreements are subject to the terms of Master Repurchase Agreements (MRAs) with approved counterparties (sellers). The MRAs contain various provisions, including but not limited to events of default and maintenance of collateral for repurchase agreements. In the event of default by either the seller or the Fund, certain MRAs may permit the non-defaulting party to net and close-out all transactions, if any, traded under such agreements. The Fund may sell securities it holds as collateral and apply the proceeds towards the repurchase price and any other amounts owed by the seller to the Fund in the event of default by the seller. This could involve costs or delays in addition to a loss on the securities if their value falls below the repurchase price owed by the seller. The joint repurchase agreement held by the Fund at year end, as indicated in the Statement of Investments, had been entered into on December 30, 2016.
d. Derivative Financial Instruments
The Fund invested in derivative financial instruments in order to manage risk or gain exposure to various other investments or markets. Derivatives are financial contracts based on an underlying or notional amount, require no initial investment or an initial net investment that is smaller than would normally be required to have a similar response to changes in market factors, and require or permit net settlement. Derivatives contain various
FRANKLIN TEMPLETON VARIABLE INSURANCE PRODUCTS TRUST
NOTES TO FINANCIAL STATEMENTS
Franklin Growth and Income VIP Fund (continued)
risks including the potential inability of the counterparty to fulfill their obligations under the terms of the contract, the potential for an illiquid secondary market, and/or the potential for market movements which expose the Fund to gains or losses in excess of the amounts shown in the Statement of Assets and Liabilities. Realized gain and loss and unrealized appreciation and depreciation on these contracts for the period are included in the Statement of Operations.
The Fund purchased or wrote exchange traded option contracts primarily to manage exposure to equity price risk. An option is a contract entitling the holder to purchase or sell a specific amount of shares or units of an asset or notional amount of a swap (swaption), at a specified price. When an option is purchased or written, an amount equal to the premium paid or received is recorded as an asset or liability, respectively. Upon exercise of an option, the acquisition cost or sales proceeds of the underlying investment is adjusted by any premium received or paid. Upon expiration of an option, any premium received or paid is recorded as a realized gain or loss. Upon closing an option other than through expiration or exercise, the difference between the premium received or paid and the cost to close the position is recorded as a realized gain or loss.
See Notes 6 and 7 regarding investment transactions and other derivative information, respectively.
e. Equity-Linked Securities
The Fund invests in equity-linked securities. Equity-linked securities are hybrid financial instruments that generally combine both debt and equity characteristics into a single note form. Income received from equity-linked securities is recorded as realized gains in the Statement of Operations and may be based on the performance of an underlying equity security, an equity index, or an option position. The risks of investing in equity-linked securities include unfavorable price movements in the underlying security and the credit risk of the issuing financial institution. There may be no guarantee of a return of principal with equity-linked securities and the appreciation potential may be limited. Equity-linked securities may be more volatile and less liquid than other investments held by the Fund.
f. Income and Deferred Taxes
It is the Fund’s policy to qualify as a regulated investment company under the Internal Revenue Code. The Fund intends to distribute to shareholders substantially all of its taxable income
and net realized gains to relieve it from federal income and if applicable, excise taxes. As a result, no provision for U.S. federal income taxes is required
The Fund may be subject to foreign taxation related to income received, capital gains on the sale of securities and certain foreign currency transactions in the foreign jurisdictions in which it invests. Foreign taxes, if any, are recorded based on the tax regulations and rates that exist in the foreign markets in which the Fund invests. When a capital gain tax is determined to apply, the Fund records an estimated deferred tax liability in an amount that would be payable if the securities were disposed of on the valuation date. As a result of several court cases, in certain countries across the European Union, the Fund filed additional tax reclaims for previously withheld taxes on dividends earned in those countries (EU reclaims). These additional filings are subject to various administrative proceedings by the local jurisdictions’ tax authorities within the European Union, as well as a number of related judicial proceedings. Income recognized, if any, for EU reclaims is reflected as other income in the Statement of Operations and any related receivable, if any, is reflected as European Union tax reclaims in the Statement of Assets and Liabilities. When uncertainty exists as to the ultimate resolution of these proceedings, the likelihood of receipt of these EU reclaims, and the potential timing of payment, no amounts are reflected in the financial statements. For U.S. income tax purposes, when EU reclaims are received by the Fund and the Fund previously passed foreign tax credit on to its shareholders, the Fund must either amend historic tax reporting to shareholders or enter into a closing agreement with the Internal Revenue Service (IRS) in order to pay the associated tax liability on behalf of the Fund’s shareholders.
The Fund may recognize an income tax liability related to its uncertain tax positions under U.S. GAAP when the uncertain tax position has a less than 50% probability that it will be sustained upon examination by the tax authorities based on its technical merits. As of December 31, 2016, the Fund has determined that no tax liability is required in its financial statements related to uncertain tax positions for any open tax years (or expected to be taken in future tax years). Open tax years are those that remain subject to examination and are based on each tax jurisdiction’s statute of limitation.
FRANKLIN TEMPLETON VARIABLE INSURANCE PRODUCTS TRUST
NOTES TO FINANCIAL STATEMENTS
Franklin Growth and Income VIP Fund (continued)
1. Organization and Significant Accounting
Policies (continued)
g. Security Transactions, Investment Income, Expenses and Distributions
Security transactions are accounted for on trade date. Realized gains and losses on security transactions are determined on a specific identification basis. Interest income and estimated expenses are accrued daily. Dividend income is recorded on the ex-dividend date except for certain dividends from securities where the dividend rate is not available. In such cases, the dividend is recorded as soon as the information is received by the Fund. Distributions to shareholders are recorded on the ex-dividend date and are determined according to income tax regulations (tax basis). Distributable earnings determined on a tax basis may differ from earnings recorded in accordance with U.S. GAAP. These differences may be permanent or temporary. Permanent differences are reclassified among capital accounts to reflect their tax character. These reclassifications have no impact on net assets or the results of operations. Temporary differences are not reclassified, as they may reverse in subsequent periods.
Common expenses incurred by the Trust are allocated among the Funds based on the ratio of net assets of each Fund to the combined net assets of the Trust. Fund specific expenses are charged directly to the Fund that incurred the expense.
Realized and unrealized gains and losses and net investment income, not including class specific expenses, are allocated daily to each class of shares based upon the relative proportion of net assets of each class. Differences in per share distributions, by class, are generally due to differences in class specific expenses.
h. Accounting Estimates
The preparation of financial statements in accordance with U.S. GAAP requires management to make estimates and assumptions that affect the reported amounts of assets and liabilities at the date of the financial statements and the amounts of income and expenses during the reporting period. Actual results could differ from those estimates.
i. Guarantees and Indemnifications
Under the Trust’s organizational documents, its officers and trustees are indemnified by the Trust against certain liabilities arising out of the performance of their duties to the Trust. Additionally, in the normal course of business, the Trust, on behalf of the Fund, enters into contracts with service providers that contain general indemnification clauses. The Trust’s maximum exposure under these arrangements is unknown as this would involve future claims that may be made against the Trust that have not yet occurred. Currently, the Trust expects the risk of loss to be remote.
2. Shares of Beneficial Interest
At December 31, 2016, there were an unlimited number of shares authorized (without par value). Transactions in the Fund’s shares were as follows:
| | | | | | | | | | | | | | | | | | | | |
| | | Year Ended December 31, | |
| | | 2016 | | | | | | 2015 | |
| | | Shares | | | Amount | | | | | | Shares | | | Amount | |
| | | | | |
| Class 1 Shares: | | | | | | | | | | | | | | | | | | | | |
Shares sold | | | 1,575,501 | | | $ | 23,479,446 | | | | | | | | 10,666 | | | $ | 171,797 | |
Shares issued in reinvestment of distributions | | | 1,140,948 | | | | 16,646,433 | | | | | | | | 568,589 | | | | 9,159,967 | |
Shares redeemed in-kind (Note 9) | | | (8,891,023 | ) | | | (134,564,738 | ) | | | | | | | — | | | | — | |
Shares redeemed | | | (1,034,562 | ) | | | (16,022,789 | ) | | | | | | | (1,429,423 | ) | | | (23,466,857 | ) |
| | | | |
Net increase (decrease) | | | (7,209,136 | ) | | $ | (110,461,648 | ) | | | | | | | (850,168 | ) | | $ | (14,135,093 | ) |
| | | | |
FRANKLIN TEMPLETON VARIABLE INSURANCE PRODUCTS TRUST
NOTES TO FINANCIAL STATEMENTS
Franklin Growth and Income VIP Fund (continued)
| | | | | | | | | | | | | | | | | | | | |
| | | Year Ended December 31, | |
| | | 2016 | | | | | | 2015 | |
| | | Shares | | | Amount | | | | | | Shares | | | Amount | |
| | | | | |
| Class 2 Shares: | | | | | | | | | | | | | | | | | | | | |
Shares sold | | | 781,106 | | | $ | 11,854,554 | | | | | | | | 871,092 | | | $ | 13,824,195 | |
Shares issued in reinvestment of distributions | | | 888,944 | | | | 12,756,339 | | | | | | | | 461,342 | | | | 7,321,503 | |
Shares redeemed in-kind (Note 9) | | | (4,019,533 | ) | | | (59,794,978 | ) | | | | | | | — | | | | — | |
Shares redeemed | | | (1,173,608 | ) | | | (17,825,660 | ) | | | | | | | (1,627,140 | ) | | | (26,146,151 | ) |
| | | | |
Net increase (decrease) | | | (3,523,091 | ) | | $ | (53,009,745 | ) | | | | | | | (294,706 | ) | | $ | (5,000,453 | ) |
| | | | |
3. Transactions with Affiliates
Franklin Resources, Inc. is the holding company for various subsidiaries that together are referred to as Franklin Templeton Investments. Certain officers and trustees of the Fund are also officers and/or directors of the following subsidiaries:
| | |
| Subsidiary | | Affiliation |
Franklin Advisers, Inc. (Advisers) | | Investment manager |
Franklin Templeton Services, LLC (FT Services) | | Administrative manager |
Franklin Templeton Distributors, Inc. (Distributors) | | Principal underwriter |
Franklin Templeton Investor Services, LLC (Investor Services) | | Transfer agent |
a. Management Fees
The Fund pays an investment management fee to Advisers based on the average daily net assets of the Fund as follows:
| | |
| Annualized Fee Rate | | Net Assets |
0.625% | | Up to and including $100 million |
0.500% | | Over $100 million, up to and including $250 million |
0.450% | | Over $250 million, up to and including $7.5 billion |
0.440% | | Over $7.5 billion, up to and including $10 billion |
0.430% | | Over $10 billion, up to and including $12.5 billion |
0.420% | | Over $12.5 billion, up to and including $15 billion |
0.400% | | In excess of $15 billion |
For the year ended December 31, 2016, the effective investment management fee rate was 0.547% of the Fund’s average daily net assets.
b. Administrative Fees
Under an agreement with Advisers, FT Services provides administrative services to the Fund. The fee is paid by Advisers based on the Fund’s average daily net assets, and is not an additional expense of the Fund.
c. Distribution Fees
The Board has adopted a distribution plan for Class 2 shares pursuant to Rule 12b-1 under the 1940 Act. Under the Fund’s compensation distribution plan, the Fund pays Distributors for costs incurred in connection with the servicing, sale and distribution of the Fund’s shares up to 0.35% per year of its average daily net assets. The Board has agreed to limit the current rate to 0.25% per year for Class 2. The plan year, for purposes of monitoring compliance with the maximum annual plan rate, is February 1 through January 31.
FRANKLIN TEMPLETON VARIABLE INSURANCE PRODUCTS TRUST
NOTES TO FINANCIAL STATEMENTS
Franklin Growth and Income VIP Fund (continued)
3. Transactions with Affiliates (continued)
d. Transfer Agent Fees
Investor Services, under terms of an agreement, performs shareholder servicing for the Fund and is not paid by the Fund for the services.
e. Waiver and Expense Reimbursements
Effective October 17, 2016, Advisers has contractually agreed in advance to waive or limit its fees and to assume as its own expense certain expenses otherwise payable by the Fund so that the expenses (excluding distribution fees and acquired fund fees and expenses) for each class of the Fund do not exceed 0.64% based on the average net assets of each class (other than certain non-routine expenses or costs, including those relating to litigation, indemnification, reorganizations, and liquidations) until April 30, 2018. Total expenses waived or paid are not subject to recapture subsequent to the Fund’s fiscal year end.
In addition, effective October 17, 2016, Advisers has voluntarily agreed to waive or limit its fees and to assume as its own expense certain expenses otherwise payable by the Fund so that the expenses (excluding distribution fees and acquired fund fees and expenses) for each class of the Fund do not exceed 0.59% based on the average net assets of each class (other than certain non-routine expenses or costs, including those relating to litigation, indemnification, reorganizations, and liquidations). This waiver is voluntary and may be modified or discontinued by Advisers at any time, and without further notice.
4. Expense Offset Arrangement
The Fund has entered into an arrangement with its custodian whereby credits realized as a result of uninvested cash balances are used to reduce a portion of the Funds’ custodian expenses. During the year ended December 31, 2016, the custodian fees were reduced as noted in the Statement of Operations.
5. Income Taxes
The tax character of distributions paid during the years ended December 31, 2016 and 2015, was as follows:
| | | | | | | | |
| | | 2016 | | | 2015 | |
Distributions paid from: | | | | | | | | |
Ordinary income | | $ | 7,756,261 | | | $ | 9,999,759 | |
Long term capital gain | | | 21,646,511 | | | | 6,481,711 | |
| | | | |
| | $ | 29,402,772 | | | $ | 16,481,470 | |
| | | | |
At December 31, 2016, the cost of investments, net unrealized appreciation (depreciation), undistributed ordinary income and undistributed long term capital gains for income tax purposes were as follows:
| | | | |
Cost of investments | | $ | 77,418,724 | |
| | | | |
Unrealized appreciation | | $ | 24,232,340 | |
Unrealized depreciation | | | (1,908,216 | ) |
| | | | |
Net unrealized appreciation (depreciation) | | $ | 22,324,124 | |
| | | | |
Undistributed ordinary income | | $ | 7,912,060 | |
Undistributed long term capital gains | | | 4,886,015 | |
| | | | |
Distributable earnings | | $ | 12,798,075 | |
| | | | |
FRANKLIN TEMPLETON VARIABLE INSURANCE PRODUCTS TRUST
NOTES TO FINANCIAL STATEMENTS
Franklin Growth and Income VIP Fund (continued)
Differences between income and/or capital gains as determined on a book basis and a tax basis are primarily due to differing treatments of equity linked securities and gains realized on in-kind shareholder redemptions.
In accordance with U.S. GAAP permanent differences are reclassified among capital accounts to reflect their tax character. At the year ended December 31, 2016, such reclassifications were as follows:
| | | | |
Paid-in capital | | $ | 38,011,430 | |
Undistributed net investment income | | $ | 884,636 | |
Accumulated net realized gain (loss) | | $ | (38,896,066 | ) |
6. Investment Transactions
Purchases and sales of investments (excluding short term securities) for the year ended December 31, 2016, aggregated $94,149,164 and $99,446,994, respectively. Sales of investments excludes in-kind transactions of $180,871,270.
Transactions in options written during the year ended December 31, 2016, were as follows:
| | | | | | | | |
| | | Number of
Contracts | | | Premiums | |
Options outstanding at December 31, 2015 | | | — | | | $ | — | |
Options written | | | 2,996 | | | | 299,458 | |
Options expired. | | | (1,595 | ) | | | (78,422 | ) |
Options exercised | | | (325 | ) | | | (50,393 | ) |
Options closed | | | (1,076 | ) | | | (170,643 | ) |
| | | | |
Options outstanding at December 31, 2016 | | | — | | | $ | — | |
| | | | |
See Notes 1(d) and 7 regarding derivative financial instruments and other derivative information, respectively.
7. Other Derivative Information
For the year ended December 31, 2016, the effect of derivative contracts in the Fund’s Statement of Operations was as follows:
| | | | | | | | | | | | |
Derivative Contracts Not Accounted for as Hedging Instruments | | Statement of Operations Locations | | Net Realized Gain (Loss) for the Period | | | Statement of Operations Locations | | Net Change in Unrealized Appreciation (Depreciation) for the Period | |
| | | | |
| | | | |
| | | | |
| | | | |
| Equity contracts | | Net realized gain (loss) from written options | | $ | 179,694 | | | Net change in unrealized appreciation (depreciation) on written options | | $ | — | |
| | | | | | | | | | | | |
8. Credit Facility
The Fund, together with other U.S. registered and foreign investment funds (collectively, Borrowers), managed by Franklin Templeton Investments, are borrowers in a joint syndicated senior unsecured credit facility totaling $2 billion (Global Credit Facility) which matured on February 10, 2017. This Global Credit Facility provides a source of funds to the Borrowers for temporary and emergency purposes, including the ability to meet future unanticipated or unusually large redemption requests. Effective February 10, 2017, the Borrowers renewed the Global Credit Facility for a one year term, maturing February 9, 2018, for a total of $2 billion.
FRANKLIN TEMPLETON VARIABLE INSURANCE PRODUCTS TRUST
NOTES TO FINANCIAL STATEMENTS
Franklin Growth and Income VIP Fund (continued)
8. Credit Facility (continued)
Under the terms of the Global Credit Facility, the Fund shall, in addition to interest charged on any borrowings made by the Fund and other costs incurred by the Fund, pay its share of fees and expenses incurred in connection with the implementation and maintenance of the Global Credit Facility, based upon its relative share of the aggregate net assets of all of the Borrowers, including an annual commitment fee of 0.15% based upon the unused portion of the Global Credit Facility. These fees are reflected in other expenses in the Statement of Operations. During the year ended December 31, 2016, the Fund did not use the Global Credit Facility.
9. Redemption In-Kind
During the year ended December 31, 2016, the Fund realized $38,040,305 of net gains resulting from a redemption in-kind in which a shareholder redeemed fund shares for cash and securities held by the Fund. Because such gains are not taxable to the Fund, and are not distributed to remaining shareholders, they have been reclassified from accumulated net realized gains to paid-in capital.
10. Fair Value Measurements
The Fund follows a fair value hierarchy that distinguishes between market data obtained from independent sources (observable inputs) and the Fund’s own market assumptions (unobservable inputs). These inputs are used in determining the value of the Fund’s financial instruments and are summarized in the following fair value hierarchy:
| | • | | Level 1 – quoted prices in active markets for identical financial instruments |
| | • | | Level 2 – other significant observable inputs (including quoted prices for similar financial instruments, interest rates, prepayment speed, credit risk, etc.) |
| | • | | Level 3 – significant unobservable inputs (including the Fund’s own assumptions in determining the fair value of financial instruments) |
The input levels are not necessarily an indication of the risk or liquidity associated with financial instruments at that level.
For movements between the levels within the fair value hierarchy, the Fund has adopted a policy of recognizing the transfers as of the date of the underlying event which caused the movement.
A summary of inputs used as of December 31, 2016, in valuing the Fund’s assets carried at fair value, is as follows:
| | | | | | | | | | | | | | | | |
| | | Level 1 | | | Level 2 | | | Level 3 | | | Total | |
| | | | |
| Assets: | | | | | | | | | | | | | | | | |
Investments in Securities: | | | | | | | | | | | | | | | | |
Equity Investmentsa,b | | $ | 89,490,401 | | | $ | — | | | $ | — | | | $ | 89,490,401 | |
Equity-Linked Securitiesb | | | — | | | | 6,230,757 | | | | — | | | | 6,230,757 | |
Short Term Investments | | | — | | | | 4,021,690 | | | | — | | | | 4,021,690 | |
| | | | |
Total Investments in Securities | | $ | 89,490,401 | | | $ | 10,252,447 | | | $ | — | | | $ | 99,742,848 | |
| | | | |
aIncludes common and convertible preferred stocks.
bFor detailed categories, see the accompanying Statement of Investments.
FRANKLIN TEMPLETON VARIABLE INSURANCE PRODUCTS TRUST
NOTES TO FINANCIAL STATEMENTS
Franklin Growth and Income VIP Fund (continued)
11. Investment Company Reporting Modernization
In October 2016, the U.S. Securities and Exchange Commission adopted new rules and amended existing rules (together, final rules) intended to modernize the reporting and disclosure of information by registered investment companies. In part, the final rules amend Regulation S-X and require standardized, enhanced disclosures about derivatives in investment company financial statements, as well as other amendments. The compliance date for the amendments to Regulation S-X is August 1, 2017. Management is currently evaluating the impact that the adoption of the amendments to Regulation S-X will have on the Fund’s financial statements and related disclosures.
12. Subsequent Events
The Fund has evaluated subsequent events through the issuance of the financial statements and determined that no events have occurred that require disclosure other than those already disclosed in the financial statements.
Abbreviations
| | | | |
| Selected Portfolio | | |
| | |
| ADR | | American Depositary Receipt | | |
FRANKLIN TEMPLETON VARIABLE INSURANCE PRODUCTS TRUST
Report of Independent Registered Public Accounting Firm
Franklin Growth and Income VIP Fund
To the Board of Trustees and Shareholders of Franklin Templeton Variable Insurance Products Trust
In our opinion, the accompanying statement of assets and liabilities, including the statement of investments, and the related statements of operations and of changes in net assets and the financial highlights present fairly, in all material respects, the financial position of Franklin Growth and Income VIP Fund (the “Fund”) as of December 31, 2016, the results of its operations for the year then ended, the changes in its net assets for each of the two years in the period then ended and the financial highlights for the periods presented, in conformity with accounting principles generally accepted in the United States of America. These financial statements and financial highlights (hereafter referred to as “financial statements”) are the responsibility of the Fund’s management. Our responsibility is to express an opinion on these financial statements based on our audits. We conducted our audits of these financial statements in accordance with the standards of the Public Company Accounting Oversight Board (United States). Those standards require that we plan and perform the audit to obtain reasonable assurance about whether the financial statements are free of material misstatement. An audit includes examining, on a test basis, evidence supporting the amounts and disclosures in the financial statements, assessing the accounting principles used and significant estimates made by management, and evaluating the overall financial statement presentation. We believe that our audits, which included confirmation of securities as of December 31, 2016 by correspondence with the custodian and brokers, provide a reasonable basis for our opinion.
PricewaterhouseCoopers LLP
San Francisco, California
February 15, 2017
FRANKLIN TEMPLETON VARIABLE INSURANCE PRODUCTS TRUST
Tax Information (unaudited)
Franklin Growth and Income VIP Fund
Under Section 852(b)(3)(C) of the Internal Revenue Code (Code), the Fund hereby reports the maximum amount allowable but no less than $21,646,511 as a long term capital gain dividend for the fiscal year ended December 31, 2016.
Under Section 854(b)(1)(A) of the Code, the Fund hereby reports 65.09% of the ordinary income dividends as income qualifying for the dividends received deduction for the fiscal year ended December 31, 2016.
Franklin High Income VIP Fund
This annual report for Franklin High Income VIP Fund covers the fiscal year ended
December 31, 2016.
Class 2 Performance Summary as of December 31, 2016
Average annual total return of Class 2 shares* represents the average annual change in value, assuming reinvestment of dividends and capital gains. Average returns smooth out variations in returns, which can be significant; they are not the same as year-by-year results.
| | | | | | | | | | | | |
| Periods ended 12/31/16 | | 1-Year | | | 5-Year | | | 10-Year | |
Average Annual Total Return | | | +16.95% | | | | +5.77% | | | | +5.82% | |
*The Fund has a fee waiver associated with any investment it makes in a Franklin Templeton money fund and/or other Franklin Templeton fund, contractually guaranteed through its current fiscal year-end. Fund investment results reflect the fee waiver; without this waiver, the results would have been lower.
Performance reflects the Fund’s Class 2 operating expenses, but does not include any contract fees, expenses or sales charges. If they had been included, performance would be lower. These charges and deductions, particularly for variable life policies, can have a significant effect on contract values and insurance benefits. See the contract prospectus for a complete description of these expenses, including sales charges.
Performance data represent past performance, which does not guarantee future results. Investment return and principal value will fluctuate, and you may have a gain or loss when you sell your shares. Current performance may differ from figures shown.
Total Return Index Comparison for a Hypothetical $10,000 Investment (1/1/07–12/31/16)
The graph below shows the change in value of a hypothetical $10,000 investment in the Fund over the indicated period and includes reinvestment of any income or distributions. The Fund’s performance* is compared to the performance of the Credit Suisse (CS) High Yield Index and the Lipper VIP High Yield Funds Classification Average. One cannot invest directly in an index, and an index is not representative of the Fund’s portfolio. Please see Important Notes to Performance Information preceding the Fund Summaries.
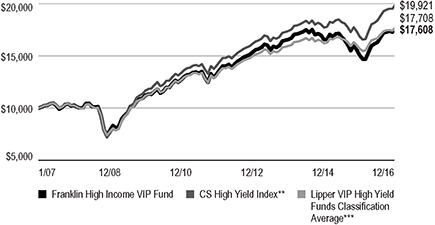
** Source: Credit Suisse Group. Please see Index Descriptions following the Fund Summaries.
*** Source: Lipper, a Thomson Reuters Company. Please see Index Descriptions following the Fund Summaries.
FRANKLIN HIGH INCOME VIP FUND
Fund Goal and Main Investments
The Fund seeks a high level of current income with capital appreciation as a secondary goal. Under normal market conditions, the Fund invests predominantly in high yield, lower rated debt securities and preferred stocks.
On December 1, 2016, the Board of Trustees of Franklin Templeton Variable Insurance Products Trust approved a proposal to liquidate the Franklin High Income VIP Fund. Effective at the close of market on or about April 21, 2017, the Fund will be closed to new investors and to additional investments from existing shareholders. The liquidation is currently planned for April 28, 2017, and may be delayed if unforeseen circumstances arise.
Fund Risks
All investments involve risks, including possible loss of principal. The risks associated with higher yielding, lower rated securities include higher risk of default and loss of principal. Changes in the financial strength of a bond issuer or in a bond’s credit rating may affect its value. In addition, interest rate movements will affect the Fund’s share price and yield. Bond prices generally move in the opposite direction of interest rates. Thus, as prices of bonds in the Fund adjust to a rise in interest rates, the Fund’s share price may decline. Investment in foreign securities also involves special risks, including currency fluctuations, and political and economic uncertainty. The Fund is actively managed but there is no guarantee that the manager’s investment decisions will produce the desired results. The Fund’s prospectus also includes a description of the main investment risks.
Performance Overview
You can find the Fund’s one-year total return in the Performance Summary. In comparison, the Fund’s benchmark, the CS High Yield Index, posted a +18.25% total return for the period under review.1 The Fund’s peers, as measured by the Lipper VIP High Yield Funds Classification Average, delivered a +13.27% total return.2
Asset Allocation
Based on Total Net Assets as of 12/31/16
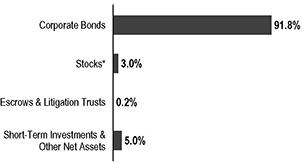
*Includes common and convertible preferred shares.
Economic and Market Overview
The U.S. economy expanded during the 12 months under review. The economy grew at a faster pace in 2016’s third quarter than in the second and first quarters, mainly due to personal consumption expenditures, exports, private inventory investment, federal government spending and nonresidential fixed investment. Manufacturing conditions remained volatile but generally expanded, and the services sector also continued to grow for most of the period. The unemployment rate decreased from 5.0% in December 2015 to 4.7% at period-end.3 Monthly retail sales grew for most of the review period, and rose to its highest level in April in more than a year, due to a broad-based increase across most retail categories. Inflation, as measured by the Consumer Price Index, remained relatively subdued for most of the period, but rose in 2016’s fourth quarter.
After maintaining its target interest rate in the 0.25%–0.50% range for nearly a year, the U.S. Federal Reserve (Fed), at its December meeting, increased its target range for the federal funds rate to 0.50%–0.75%, as policymakers noted improvement in U.S. labor market and inflation. The Federal Open Market Committee also hinted at three additional hikes in 2017. Furthermore, the Fed raised its forecast for 2017 U.S. economic growth, and lowered its unemployment projections.
The 10-year U.S. Treasury yield, which moves inversely to price, ended the period slightly higher than where it started and shifted significantly during the period. At the beginning of the period, negative global interest rates, continued accommodative
1. Source: Credit Suisse Group.
2. Source: Lipper, a Thomson Reuters Company.
One cannot invest directly in an index, and an index is not representative of the Fund’s portfolio. Please see Index Descriptions following the Fund Summaries.
3. Source: Bureau of Labor Statistics.
The dollar value, number of shares or principal amount, and names of all portfolio holdings are listed in the Fund’s Statement of Investments (SOI).
FRANKLIN HIGH INCOME VIP FUND
central bank policies and a general risk-averse sentiment boosted safe haven buying by investors. These factors drove the 10-year yield to a period low of 1.37% in early July, down from 2.27% on December 31, 2015. Near period-end, rates moved higher based on improved economic data, expectations for the Fed to raise interest rates at its December 2016 meeting and a sentiment shift among investors that held that possible expansionary fiscal policies under the new U.S. president Donald Trump could lead to a stronger economy and higher inflation.
Investment Strategy
We are research-driven, fundamental investors who rely on a team of analysts to provide in-depth industry expertise and use qualitative and quantitative analyses to evaluate companies. As bottom-up investors, we focus primarily on individual securities. We also consider sectors when choosing investments. In selecting securities for the Fund’s investment portfolio, we do not rely principally on ratings assigned by rating agencies but perform our own independent analysis to evaluate an issuer’s creditworthiness. We consider a variety of factors, including an issuer’s experience and managerial strength, its sensitivity to economic conditions and its current financial condition.
Manager’s Discussion
During the first quarter of 2016, volatility was the predominant theme of global financial markets. Fears of slowing U.S. and Chinese growth, weak commodity markets, the threat of rising U.S. interest rates and the possibility Britain would exit the European Union weighed on investor risk appetites. However, by the second quarter, rate fears subsided. Also, oil posted a notable recovery as supply and demand levels rebalanced, while other commodities rebounded on general increased optimism for global growth. This generally positive investor sentiment continued through the summer until the surprise results of the U.S. presidential election were revealed in November. After an initial negative reaction by the equity markets, expectations of increased fiscal spending and income tax cuts spurred upward movement. The U.S. Treasury yield curve shifted higher and steepened on higher inflation expectations and the U.S. Federal Reserve Board raised short-term rates for only the second time during the cycle.
Specific to the high yield market, the rebound in oil and commodity prices had a significantly positive effect on returns given our relatively high weightings in these sectors. Also,
Top 10 Sectors/Industries
12/31/16
| | | | |
| | | % of Total Net Assets | |
| Materials | | | 13.8% | |
| Energy | | | 13.2% | |
| Media | | | 8.4% | |
| Telecommunication Services | | | 7.9% | |
| Diversified Financials | | | 5.4% | |
| Capital Goods | | | 5.1% | |
| Health Care Equipment & Services | | | 4.5% | |
| Utilities | | | 4.4% | |
| Consumer Durables & Apparel | | | 3.8% | |
| Food, Beverage & Tobacco | | | 3.6% | |
continued investor interest in the asset class drove positive inflows, while new issue supply fell year-over-year, despite generally constructive corporate fundamentals. The sell-off in U.S. Treasuries in the fourth quarter subdued returns for high yield bonds, but the combination of the aforementioned factors outweighed interest-rate pressure.
Following our investment strategy, we drew on our fundamental research process to both make individual investments and to overweight and underweight certain industries relative to our benchmark in an effort to outperform. Although select positions contributed to relative performance, our overall industry exposure had a negative impact on relative returns for the year.
For instance, as the turnaround in the energy sector gained steam at the end of the first quarter, we began to reduce our relative weighting to a modestly underweighted position versus the benchmark. Given a significant rally in the sector, this positioning had a negative impact from an industry point of view. However, we maintained a higher risk stance within the industry to reflect our positive outlook for oil prices. These lower quality, longer dated holdings substantially outperformed the index and drove the net impact of the sector on the Fund to a positive one.
However, in a continuation of trends from earlier in the year, our overweighting of the media cable sector remained a net drag on performance.4 Although the sector delivered a double-digit positive return during the period, it did not keep pace with the overall market given merger and acquisition activity in the sector, heavy new issuance and a highly competitive landscape. In addition, our overweighted position
4. Media cable is part of media in the SOI.
FRANKLIN HIGH INCOME VIP FUND
in large capitalization issuer Intelsat Jackson, which is a major player in the satellite market, hurt Fund results as the company’s highly leveraged balance sheet remained under pressure in the face of uncertain demand. After a sharp price drop in the first quarter, the company’s bonds stabilized at slightly higher levels, but did not recover the earlier price loss.
Similarly, our overweighted position in the typically defensive health care sector continued to detract from relative returns as did several positions in the pharmaceuticals industry.5 Heightened political scrutiny of drug pricing and investigations into potential accounting irregularities weighed heavily on some of our pharmaceutical holdings. The hospital industry was also impacted by investor speculation surrounding the incoming President Trump administration.
Although some of the Fund’s allocations detracted from relative performance, certain weightings contributed to results. For instance, our overweighted position in the metals and mining sector continued to benefit the Fund’s returns during the period.6 The rebound in commodity prices persisted as the year progressed and drove the sector to turn in the highest return within the benchmark. Our overweighted position was a notable positive as were certain large holdings such as First Quantum Minerals and ArcelorMittal, which enjoyed significant price gains. We were underweighted in the consumer products sector, which was among the lowest returning industries in the high yield market, driven by company difficulties within the industry.7 Finally, we maintained our underweighted position in the retailers sector.8 Similar to the consumer sector, certain issuers encountered financial distress and weighed on overall sector return. We continued to be selective in the retail sector given the pressure on traditional brick-and-mortar retailers as well a still somewhat cautious view on consumer spending.
Thank you for your participation in Franklin High Income VIP Fund. We look forward to serving your future investment needs.
The foregoing information reflects our analysis, opinions and portfolio holdings as of December 31, 2016, the end of the reporting period. The way we implement our main investment strategies and the resulting portfolio holdings may change depending on factors such as market and economic conditions. These opinions may not be relied upon as investment advice or an offer for a particular security. The information is not a complete analysis of every aspect of any market, country, industry, security or the Fund. Statements of fact are from sources considered reliable, but the investment manager makes no representation or warranty as to their completeness or accuracy. Although historical performance is no guarantee of future results, these insights may help you understand our investment management philosophy.
5. The health care sector comprises health care equipment and services and pharmaceuticals, biotechnology and life sciences in the SOI.
6. Metals and mining is part of materials in the SOI.
7. Consumer products is part of automobiles and components; consumer durables and apparel; food, beverage and tobacco; and retailing in the SOI.
8. Retailers is part of retailing in the SOI.
FRANKLIN HIGH INCOME VIP FUND
Class 2 Fund Expenses
As an investor in a variable insurance contract (Contract) that indirectly provides for investment in an underlying mutual fund, you can incur transaction and/or ongoing expenses at both the Fund level and the Contract Level: (1) transaction expenses can include sales charges (loads) on purchases, surrender fees, transfer fees and premium taxes; and (2) ongoing expenses can include management fees, distribution and service (12b-1) fees, contract fees, annual maintenance fees, mortality and expense risk fees and other fees and expenses. All mutual funds and Contracts have some types of ongoing expenses. The table below shows Fund-level ongoing expenses and can help you understand these costs and compare them with those of other mutual funds offered through the Contract. The table assumes a $1,000 investment held for the six months indicated. Please refer to the Fund prospectus for additional information on operating expenses.
Actual Fund Expenses
The table below provides information about the actual account values and actual expenses in the columns under the heading “Actual.” In these columns the Fund’s actual return, which includes the effect of ongoing Fund expenses but does not include the effect of ongoing Contract expenses, is used to calculate the “Ending Account Value.”
You can estimate the Fund-level expenses you paid during the period by following these steps (of course, your account value and expenses will differ from those in this illustration):
| | Divide your account value by $1,000 |
| | (if your account had an $8,600 value, |
| | then $8,600 ÷ $1,000 = 8.6). |
| | Then multiply the result by the number under the headings “Actual” and “Fund-Level Expenses Paid During Period” |
| | (if Fund-Level Expenses Paid During Period were $ 7.50, |
| | then 8.6 x $7.50 = $64.50). |
In this illustration, the estimated expenses paid this period at the Fund level are $64.50.
Hypothetical Example for Comparison
with Other Mutual Funds
Under the heading “Hypothetical” in the table, information is provided about hypothetical account values and hypothetical expenses based on the Fund’s actual expense ratio and an assumed rate of return of 5% per year before expenses, which is not the Fund’s actual return. This information may not be used to estimate the actual ending account balance or expenses you paid for the period, but it can help you compare ongoing costs of investing in the Fund with those of other mutual funds offered through the Contract. To do so, compare this 5% hypothetical example with the 5% hypothetical examples that appear in the shareholder reports of other funds offered through the Contract.
Please note that expenses shown in the table are meant to highlight ongoing costs at the Fund level only and do not reflect any ongoing expenses at the Contract level, or transaction expenses at either the Fund or Contract levels. In addition, while the Fund does not have transaction expenses, if the transaction and ongoing expenses at the Contract level were included, the expenses shown below would be higher. You should consult your Contract prospectus or disclosure document for more information.
| | | | | | | | | | | | | | | | | | | | | | | | |
| | | | | | Actual
(actual return after expenses) | | | Hypothetical
(5% annual return before expenses) | | | | |
| Share Class | |
| Beginning Account
Value 7/1/16 |
| |
| Ending Account
Value 12/31/16 |
| |
| Fund-Level
Expenses Paid
During Period7/1/16–12/31/16 |
1,2 | |
| Ending Account
Value 12/31/16 |
| |
| Fund-Level
Expenses Paid
During Period7/1/16–12/31/16 |
1,2 | |
| Net
Annualized
Expense
Ratio |
2 |
Class 2 | | | $1,000 | | | | $1,080.30 | | | | $4.50 | | | | $1,020.81 | | | | $4.37 | | | | 0.86% | |
1. Expenses are equal to the annualized expense ratio for the six-month period as indicated above–in the far right column–multiplied by the simple average account value over the period indicated, and then multiplied by 184/366 to reflect the one-half year period.
2. Reflects expenses after fee waivers and expense reimbursements. Does not include any ongoing expenses of the Contract for which the Fund is an investment option.
VIP4 P1_P2_P4 10/16
SUPPLEMENT DATED OCTOBER 17, 2016
TO THE PROSPECTUSES DATED MAY 1, 2016 OF
FRANKLIN GROWTH AND INCOME VIP FUND
FRANKLIN HIGH INCOME VIP FUND
(each, a series of Franklin Templeton Variable Insurance Products Trust)
Effective October 17, 2016, the prospectuses are amended as follows:
I. The “Fund Summary – Annual Fund Operating Expenses” table on page FGI-S1 in the Franklin Growth and Income VIP Fund’s Class 1 prospectus is replaced with the following:
Annual Fund Operating Expenses
(expenses that you pay each year as a percentage of the value of your investment)
| | | | |
| | | Class 1 | |
| Management fees1 | | | 0.63% | |
| Distribution and service (12b-1) fees | | | None | |
| Other expenses1 | | | 0.08% | |
| Total annual Fund operating expenses | | | 0.71% | |
| Fee waiver and/or expense reimbursement2 | | | -0.07% | |
| Total annual Fund operating expenses after fee waiver and/or expense reimbursement2 | | | 0.64% | |
| 1. | Management fees and other expenses have been restated to reflect increased fees due to a decline in the assets of the Fund as a result of shareholder redemptions. |
| 2. | The investment manager has contractually agreed to waive or assume certain expenses so that common expenses (excluding Rule 12b-1 fees, acquired fund fees and expenses and certain non-routine expenses) do not exceed 0.64% until April 30, 2018. Contractual fee waiver and/or expense reimbursement agreements may not be changed or terminated during the time periods set forth above. |
II. The “Fund Summary – Example” table on page FGI-S1 in the Franklin Growth and Income VIP Fund’s Class 1 prospectus is replaced with the following:
| | | | | | | | |
| | | 1 Year | | 3 Years | | 5 Years | | 10 Years |
| Class 1 | | $ 65 | | $ 220 | | $ 388 | | $ 876 |
III. The “Fund Summary – Annual Fund Operating Expenses” table on page FH-S1 in the Franklin High Income VIP Fund’s Class 1 prospectus is replaced with the following:
Annual Fund Operating Expenses
(expenses that you pay each year as a percentage of the value of your investment)
| | | | |
| | | Class 1 | |
| Management fees1 | | | 0.63% | |
| Distribution and service (12b-1) fees | | | None | |
| Other expenses1 | | | 0.30% | |
| Total annual Fund operating expenses | | | 0.93% | |
| Fee waiver and/or expense reimbursement2 | | | -0.27% | |
| Total annual Fund operating expenses after fee waiver and/or expense reimbursement2 | | | 0.66% | |
| 1. | Management fees and other expenses have been restated to reflect increased fees due to a decline in the assets of the Fund as a result of shareholder redemptions. |
| 2. | The investment manager has contractually agreed to waive or assume certain expenses so that common expenses (excluding Rule 12b-1 fees, acquired fund fees and expenses and certain non-routine expenses) do not exceed 0.66% until April 30, 2018. Contractual fee waiver and/or expense reimbursement agreements may not be changed or terminated during the time periods set forth above. |
IV. The “Fund Summary – Example” table on page FH-S1 in the Franklin High Income VIP Fund’s Class 1 prospectus is replaced with the following:
| | | | | | | | |
| | | 1 Year | | 3 Years | | 5 Years | | 10 Years |
| Class 1 | | $ 67 | | $ 269 | | $ 488 | | $ 1,118 |
V. The end of the second to last paragraph in the “Fund Details – Franklin Growth and Income VIP Fund – Management” section on page FGI-D7 in the Franklin Growth and Income VIP Fund’s Class 1 prospectus is revised to add the following:
Advisers has agreed to waive or limit its fees and to assume as its own certain expenses otherwise payable by the Fund so that common expenses (i.e., a combination of investment management fees, administration fees, and other expenses, but excluding the Rule 12b 1 fees, acquired fund fees and expenses, expenses related to securities sold short and certain non-routine expenses including those relating to litigation, indemnification, reorganizations and liquidations) for each class of the Fund do not exceed (and could be less than) 0.64% until April 30, 2018.
VI. The end of the second to last paragraph in the “Fund Details – Franklin High Income VIP Fund – Management” section on page FH-D9 in the Franklin High Income VIP Fund’s Class 1 prospectus is revised to add the following:
Advisers has agreed to waive or limit its fees and to assume as its own certain expenses otherwise payable by the Fund so that common expenses (i.e., a combination of investment management fees, administration fees, and other expenses, but excluding the Rule 12b 1 fees, acquired fund fees and expenses, expenses related to securities sold short and certain non-routine expenses including those relating to litigation, indemnification, reorganizations and liquidations) for each class of the Fund do not exceed (and could be less than) 0.66% until April 30, 2018.
VII. The “Fund Summary – Annual Fund Operating Expenses” table on page FGI-S1 in the Franklin Growth and Income VIP Fund’s Class 2 prospectus is replaced with the following:
Annual Fund Operating Expenses
(expenses that you pay each year as a percentage of the value of your investment)
| | | | |
| | | Class 2 | |
| Management fees1 | | | 0.63% | |
| Distribution and service (12b-1) fees | | | 0.25% | |
| Other expenses1 | | | 0.08% | |
| Total annual Fund operating expenses | | | 0.96% | |
| Fee waiver and/or expense reimbursement2 | | | -0.07% | |
| Total annual Fund operating expenses after fee waiver and/or expense reimbursement2 | | | 0.89% | |
| 1. | Management fees and other expenses have been restated to reflect increased fees due to a decline in the assets of the Fund as a result of shareholder redemptions. |
| 2. | The investment manager has contractually agreed to waive or assume certain expenses so that common expenses (excluding Rule 12b-1 fees, acquired fund fees and expenses and certain non-routine expenses) do not exceed 0.64% until April 30, 2018. Contractual fee waiver and/or expense reimbursement agreements may not be changed or terminated during the time periods set forth above. |
VIII. The “Fund Summary – Example” table on page FGI-S1 in the Franklin Growth and Income VIP Fund’s Class 2 prospectus is replaced with the following:
| | | | | | | | |
| | | 1 Year | | 3 Years | | 5 Years | | 10 Years |
| Class 2 | | $ 91 | | $ 299 | | $ 524 | | $ 1,172 |
IX. The “Fund Summary – Annual Fund Operating Expenses” table on page FH-S1 in the Franklin High Income VIP Fund’s Class 2 prospectus is replaced with the following:
Annual Fund Operating Expenses
(expenses that you pay each year as a percentage of the value of your investment)
| | | | |
| | | Class 2 | |
| Management fees1 | | | 0.63% | |
| Distribution and service (12b-1) fees | | | 0.25% | |
| Other expenses1 | | | 0.30% | |
| Total annual Fund operating expenses | | | 1.18% | |
| Fee waiver and/or expense reimbursement2 | | | -0.27% | |
| Total annual Fund operating expenses after fee waiver and/or expense reimbursement2 | | | 0.91% | |
| 1. | Management fees and other expenses have been restated to reflect increased fees due to a decline in the assets of the Fund as a result of shareholder redemptions. |
| 2. | The investment manager has contractually agreed to waive or assume certain expenses so that common expenses (excluding Rule 12b-1 fees, acquired fund fees and expenses and certain non-routine expenses) do not exceed 0.66% until April 30, 2018. Contractual fee waiver and/or expense reimbursement agreements may not be changed or terminated during the time periods set forth above. |
X. The “Fund Summary – Example” table on page FH-S1 in the Franklin High Income VIP Fund’s Class 2 prospectus is replaced with the following:
| | | | | | | | |
| | | 1 Year | | 3 Years | | 5 Years | | 10 Years |
| Class 2 | | $ 93 | | $ 348 | | $ 623 | | $ 1,408 |
XI. The end of the second to last paragraph in the “Fund Details – Franklin Growth and Income VIP Fund – Management” section on page FGI-D7 in the Franklin Growth and Income VIP Fund’s Class 2 prospectus is revised to add the following:
Advisers has agreed to waive or limit its fees and to assume as its own certain expenses otherwise payable by the Fund so that common expenses (i.e., a combination of investment management fees, administration fees, and other expenses, but excluding the Rule 12b 1 fees, acquired fund fees and expenses, expenses related to securities sold short and certain non-routine expenses including those relating to litigation, indemnification, reorganizations and liquidations) for each class of the Fund do not exceed (and could be less than) 0.64% until April 30, 2018.
XII. The end of the second to last paragraph in the “Fund Details – Franklin High Income VIP Fund – Management” section on page FH-D9 in the Franklin High Income VIP Fund’s Class 2 prospectus is revised to add the following:
Advisers has agreed to waive or limit its fees and to assume as its own certain expenses otherwise payable by the Fund so that common expenses (i.e., a combination of investment management fees, administration fees, and other expenses, but excluding the Rule 12b 1 fees, acquired fund fees and expenses, expenses related to securities sold short and certain non-routine expenses including those relating to litigation, indemnification, reorganizations and liquidations) for each class of the Fund do not exceed (and could be less than) 0.66% until April 30, 2018.
XIII. The “Fund Summary – Annual Fund Operating Expenses” table on page FH-S1 in the Franklin High Income VIP Fund’s Class 4 prospectus is replaced with the following:
Annual Fund Operating Expenses
(expenses that you pay each year as a percentage of the value of your investment)
| | | | |
| | | Class 4 | |
| Management fees1 | | | 0.63% | |
| Distribution and service (12b-1) fees | | | 0.35% | |
| Other expenses1 | | | 0.30% | |
| Total annual Fund operating expenses | | | 1.28% | |
| Fee waiver and/or expense reimbursement2 | | | -0.27% | |
| Total annual Fund operating expenses after fee waiver and/or expense reimbursement2 | | | 1.01% | |
| 1. | Management fees and other expenses have been restated to reflect increased fees due to a decline in the assets of the Fund as a result of shareholder redemptions. |
| 2. | The investment manager has contractually agreed to waive or assume certain expenses so that common expenses (excluding Rule 12b-1 fees, acquired fund fees and expenses and certain non-routine expenses) do not exceed 0.66% until April 30, 2018. Contractual fee waiver and/or expense reimbursement agreements may not be changed or terminated during the time periods set forth above. |
XIV. The “Fund Summary – Example” table on page FH-S1 in the Franklin High Income VIP Fund’s Class 4 prospectus is replaced with the following:
| | | | | | | | |
| | | 1 Year | | 3 Years | | 5 Years | | 10 Years |
| Class 4 | | $ 103 | | $ 379 | | $ 676 | | $ 1,522 |
XV. The end of the second to last paragraph in the “Fund Details – Franklin High Income VIP Fund – Management” section on page FH-D9 in the Franklin High Income VIP Fund’s Class 4 prospectus is revised to add the following:
Advisers has agreed to waive or limit its fees and to assume as its own certain expenses otherwise payable by the Fund so that common expenses (i.e., a combination of investment management fees, administration fees, and other expenses, but excluding the Rule 12b 1 fees, acquired fund fees and expenses, expenses related to securities sold short and certain non-routine expenses including those relating to litigation, indemnification, reorganizations and liquidations) for each class of the Fund do not exceed (and could be less than) 0.66% until April 30, 2018.
Please keep this supplement with your prospectus for future reference.
FH P1 P2 P4 01/17
SUPPLEMENT DATED JANUARY 6, 2017
TO THE PROSPECTUSES DATED MAY 1, 2016
OF
FRANKLIN HIGH INCOME VIP FUND
(A series of Franklin Templeton Variable Insurance Products Trust)
The prospectus is amended to add the following:
On December 1, 2016, the Board of Trustees (the “Board”) of Franklin Templeton Variable Insurance Products Trust (the “Trust”) approved a proposal to liquidate the Franklin High Income VIP Fund (the “Fund”). Effective at the close of market on or about April 21, 2017, the Fund will be closed to new investors and to additional investments from existing shareholders. The liquidation is currently planned for April 28, 2017 (the “Liquidation”), and may be delayed if unforeseen circumstances arise.
Contract owners should refer to documents provided by their insurance companies concerning the effect of the Liquidation and any steps they may need to take. In addition, in considering new purchases or transfers, contract owners may want to refer to their contract and Trust prospectuses or consult with their investment representatives to consider other investment options.
Please keep this supplement with your prospectus for future reference.
FRANKLIN TEMPLETON VARIABLE INSURANCE PRODUCTS TRUST
Financial Highlights
Franklin High Income VIP Fund
| | | | | | | | | | | | | | | | | | | | |
| | | Year Ended December 31, | |
| | | 2016 | | | 2015 | | | 2014 | | | 2013 | | | 2012 | |
| Class 1 | | | | | | | | | | | | | | | | | | | | |
Per share operating performance
(for a share outstanding throughout the year) | | | | | | | | | | | | | | | | | | | | |
| | | | | |
Net asset value, beginning of year | | | $5.63 | | | | $6.62 | | | | $7.02 | | | | $7.01 | | | | $6.52 | |
| | | | |
| | | | | |
Income from investment operationsa: | | | | | | | | | | | | | | | | | | | | |
| | | | | |
Net investment incomeb | | | 0.34 | | | | 0.39 | | | | 0.42 | | | | 0.46 | | | | 0.48 | |
| | | | | |
Net realized and unrealized gains (losses) | | | 0.59 | | | | (0.93 | ) | | | (0.38 | ) | | | 0.09 | | | | 0.51 | |
| | | | |
| | | | | |
Total from investment operations | | | 0.93 | | | | (0.54 | ) | | | 0.04 | | | | 0.55 | | | | 0.99 | |
| | | | |
| | | | | |
Less distributions from net investment income | | | (0.42 | ) | | | (0.45 | ) | | | (0.44 | ) | | | (0.54 | ) | | | (0.50 | ) |
| | | | |
| | | | | |
Net asset value, end of year | | | $6.14 | | | | $5.63 | | | | $6.62 | | | | $7.02 | | | | $7.01 | |
| | | | |
| | | | | |
Total returnc | | | 17.25% | | | | (8.88)% | | | | 0.21% | | | | 8.17% | | | | 15.94% | |
| | | | | |
| Ratios to average net assets | | | | | | | | | | | | | | | | | | | | |
| | | | | |
Expenses before waiver and payments by affiliates | | | 0.62% | | | | 0.59% | | | | 0.57% | | | | 0.58% | | | | 0.58% | |
| | | | | |
Expenses net of waiver and payments by affiliates | | | 0.61% | d | | | 0.59% | d | | | 0.57% | d | | | 0.58% | d | | | 0.58% | |
| | | | | |
Net investment income | | | 5.82% | | | | 6.20% | | | | 6.00% | | | | 6.63% | | | | 7.15% | |
| | | | | |
| Supplemental data | | | | | | | | | | | | | | | | | | | | |
| | | | | |
Net assets, end of year (000’s) | | | $389 | | | | $26,835 | | | | $34,552 | | | | $39,300 | | | | $42,166 | |
| | | | | |
Portfolio turnover rate | | | 37.79% | e | | | 28.56% | | | | 39.46% | | | | 30.78% | | | | 37.03% | |
aThe amount shown for a share outstanding throughout the period may not correlate with the Statement of Operations for the period due to the timing of sales and repurchases of the Fund’s shares in relation to income earned and/or fluctuating fair value of the investments of the Fund.
bBased on average daily shares outstanding.
cTotal return does not include fees, charges or expenses imposed by the variable annuity and life insurance contracts for which Franklin Templeton Variable Insurance Products Trust serves as an underlying investment vehicle.
dBenefit of expense reduction rounds to less than 0.01%.
eExcludes the value of portfolio securities delivered as a result of a redemption in-kind. See Note 11.
| | | | | | |
| | | The accompanying notes are an integral part of these financial statements. | Annual Report | | | FH-11 | |
FRANKLIN TEMPLETON VARIABLE INSURANCE PRODUCTS TRUST
FINANCIAL HIGHLIGHTS
Franklin High Income VIP Fund (continued)
| | | | | | | | | | | | | | | | | | | | |
| | | Year Ended December 31, | |
| | | 2016 | | | 2015 | | | 2014 | | | 2013 | | | 2012 | |
| Class 2 | | | | | | | | | | | | | | | | | | | | |
Per share operating performance
(for a share outstanding throughout the year) | | | | | | | | | | | | | | | | | | | | |
| | | | | |
Net asset value, beginning of year | | | $5.44 | | | | $6.41 | | | | $6.81 | | | | $6.82 | | | | $6.36 | |
| | | | |
| | | | | |
Income from investment operationsa: | | | | | | | | | | | | | | | | | | | | |
| | | | | |
Net investment incomeb | | | 0.31 | | | | 0.36 | | | | 0.39 | | | | 0.43 | | | | 0.46 | |
| | | | | |
Net realized and unrealized gains (losses) | | | 0.58 | | | | (0.90 | ) | | | (0.37 | ) | | | 0.08 | | | | 0.48 | |
| | | | |
| | | | | |
Total from investment operations | | | 0.89 | | | | (0.54 | ) | | | 0.02 | | | | 0.51 | | | | 0.94 | |
| | | | |
| | | | | |
Less distributions from net investment income | | | (0.41 | ) | | | (0.43 | ) | | | (0.42 | ) | | | (0.52 | ) | | | (0.48 | ) |
| | | | |
| | | | | |
Net asset value, end of year | | | $5.92 | | | | $5.44 | | | | $6.41 | | | | $6.81 | | | | $6.82 | |
| | | | |
| | | | | |
Total returnc | | | 16.95% | | | | (9.12)% | | | | (0.02)% | | | | 7.83% | | | | 15.56% | |
| | | | | |
| Ratios to average net assets | | | | | | | | | | | | | | | | | | | | |
| | | | | |
Expenses before waiver and payments by affiliates | | | 0.87% | | | | 0.84% | | | | 0.82% | | | | 0.83% | | | | 0.83% | |
| | | | | |
Expenses net of waiver and payments by affiliates | | | 0.86% | d | | | 0.84% | d | | | 0.82% | d | | | 0.83% | d | | | 0.83% | |
| | | | | |
Net investment income | | | 5.57% | | | | 5.95% | | | | 5.75% | | | | 6.38% | | | | 6.90% | |
| | | | | |
| Supplemental data | | | | | | | | | | | | | | | | | | | | |
| | | | | |
Net assets, end of year (000’s) | | | $41,932 | | | | $205,339 | | | | $261,944 | | | | $291,826 | | | | $281,851 | |
| | | | | |
Portfolio turnover rate | | | 37.79% | e | | | 28.56% | | | | 39.46% | | | | 30.78% | | | | 37.03% | |
aThe amount shown for a share outstanding throughout the period may not correlate with the Statement of Operations for the period due to the timing of sales and repurchases of the Fund’s shares in relation to income earned and/or fluctuating fair value of the investments of the Fund.
bBased on average daily shares outstanding.
cTotal return does not include fees, charges or expenses imposed by the variable annuity and life insurance contracts for which Franklin Templeton Variable Insurance Products Trust serves as an underlying investment vehicle.
dBenefit of expense reduction rounds to less than 0.01%.
eExcludes the value of portfolio securities delivered as a result of a redemption in-kind. See Note 11.
| | | | |
| FH-12 | | Annual Report | The accompanying notes are an integral part of these financial statements. | | |
FRANKLIN TEMPLETON VARIABLE INSURANCE PRODUCTS TRUST
FINANCIAL HIGHLIGHTS
Franklin High Income VIP Fund (continued)
| | | | | | | | | | | | | | | | | | | | |
| | | Year Ended December 31, | |
| | | 2016 | | | 2015 | | | 2014 | | | 2013 | | | 2012 | |
| Class 4 | | | | | | | | | | | | | | | | | | | | |
Per share operating performance
(for a share outstanding throughout the year) | | | | | | | | | | | | | | | | | | | | |
| | | | | |
Net asset value, beginning of year | | | $5.56 | | | | $6.54 | | | | $6.94 | | | | $6.94 | | | | $6.46 | |
| | | | |
| | | | | |
Income from investment operationsa: | | | | | | | | | | | | | | | | | | | | |
| | | | | |
Net investment incomeb | | | 0.31 | | | | 0.37 | | | | 0.39 | | | | 0.43 | | | | 0.46 | |
| | | | | |
Net realized and unrealized gains (losses) | | | 0.59 | | | | (0.92 | ) | | | (0.38 | ) | | | 0.08 | | | | 0.49 | |
| | | | |
| | | | | |
Total from investment operations | | | 0.90 | | | | (0.55 | ) | | | 0.01 | | | | 0.51 | | | | 0.95 | |
| | | | |
| | | | | |
Less distributions from net investment income | | | (0.40 | ) | | | (0.43 | ) | | | (0.41 | ) | | | (0.51 | ) | | | (0.47 | ) |
| | | | |
| | | | | |
Net asset value, end of year | | | $6.06 | | | | $5.56 | | | | $6.54 | | | | $6.94 | | | | $6.94 | |
| | | | |
| | | | | |
Total returnc | | | 16.83% | | | | (9.20)% | | | | (0.15)% | | | | 7.72% | | | | 15.50% | |
| | | | | |
| Ratios to average net assets | | | | | | | | | | | | | | | | | | | | |
| | | | | |
Expenses before waiver and payments by affiliates | | | 0.97% | | | | 0.94% | | | | 0.92% | | | | 0.93% | | | | 0.93% | |
| | | | | |
Expenses net of waiver and payments by affiliates | | | 0.96% | d | | | 0.94% | d | | | 0.92% | d | | | 0.93% | d | | | 0.93% | |
| | | | | |
Net investment income | | | 5.47% | | | | 5.85% | | | | 5.65% | | | | 6.28% | | | | 6.80% | |
| | | | | |
| Supplemental data | | | | | | | | | | | | | | | | | | | | |
| | | | | |
Net assets, end of year (000’s) | | | $21,765 | | | | $21,708 | | | | $25,740 | | | | $27,789 | | | | $27,664 | |
| | | | | |
Portfolio turnover rate | | | 37.79% | e | | | 28.56% | | | | 39.46% | | | | 30.78% | | | | 37.03% | |
aThe amount shown for a share outstanding throughout the period may not correlate with the Statement of Operations for the period due to the timing of sales and repurchases of the Fund’s shares in relation to income earned and/or fluctuating fair value of the investments of the Fund.
bBased on average daily shares outstanding.
cTotal return does not include fees, charges or expenses imposed by the variable annuity and life insurance contracts for which Franklin Templeton Variable Insurance Products Trust serves as an underlying investment vehicle.
dBenefit of expense reduction rounds to less than 0.01%.
eExcludes the value of portfolio securities delivered as a result of a redemption in-kind. See Note 11.
| | | | | | |
| | | The accompanying notes are an integral part of these financial statements. | Annual Report | | | FH-13 | |
FRANKLIN TEMPLETON VARIABLE INSURANCE PRODUCTS TRUST
Statement of Investments, December 31, 2016
| | | | | | |
Franklin High Income VIP Fund |
| | | | | | | | | | | | | | |
| | | | | Country | | | Shares/ Warrants | | | Value | |
| | | Common Stocks and Other Equity Interests 2.8% | | | | | | | | | |
| | | Energy 2.5% | | | | | | | | | |
| a,b | | Goodrich Petroleum Corp. | | | United States | | | | 9,233 | | | $ | 107,408 | |
| a,b | | Halcon Resources Corp. | | | United States | | | | 117,731 | | | | 986,609 | |
| a | | Halcon Resources Corp., wts., 9/09/20 | | | United States | | | | 10,485 | | | | 21,704 | |
| a | | Midstates Petroleum Co. Inc. | | | United States | | | | 153 | | | | 3,173 | |
| a,c | | Midstates Petroleum Co. Inc., wts., 4/21/20 | | | United States | | | | 1,086 | | | | — | |
| a | | Penn Virginia Corp. | | | United States | | | | 1,489 | | | | 72,961 | |
| a,d | | Penn Virginia Corp., 144A | | | United States | | | | 8,285 | | | | 405,965 | |
| | | | | | | | | | | | | | |
| | | | | | | | | | | | | 1,597,820 | |
| | | | | | | | | | | | | | |
| | | Materials 0.0%† | | | | | | | | | |
| a | | Verso Corp., A | | | United States | | | | 1,562 | | | | 11,090 | |
| a | | Verso Corp., wts., 7/25/23 | | | United States | | | | 732 | | | | — | |
| | | | | | | | | | | | | | |
| | | | | | | | | | | | | 11,090 | |
| | | | | | | | | | | | | | |
| | | Transportation 0.1% | | | | | | | | | |
| a,c | | CEVA Holdings LLC | | | United States | | | | 224 | | | | 22,428 | |
| | | | | | | | | | | | | | |
| | | Utilities 0.2% | | | | | | | | | |
| | Vistra Energy Corp. | | | United States | | | | 9,612 | | | | 148,986 | |
| | | | | | | | | | | | | | |
| | Total Common Stocks and Other Equity Interests
(Cost $4,867,809) | | | | | | | | | | | 1,780,324 | |
| | | | | | | | | | | | | | |
| | | Convertible Preferred Stocks 0.2% | | | | | | | | | |
| | | Transportation 0.2% | | | | | | | | | |
| a,c | | CEVA Holdings LLC, cvt. pfd., A-1 | | | United States | | | | 6 | | | | 1,950 | |
| a,c | | CEVA Holdings LLC, cvt. pfd., A-2 | | | United States | | | | 486 | | | | 109,240 | |
| | | | | | | | | | | | | | |
| | Total Convertible Preferred Stocks
(Cost $731,856) | | | | | | | | | | | 111,190 | |
| | | | | | | | | | | | | | |
| | | | |
| | | | | | | | Principal Amount* | | | | |
| | | Corporate Bonds 91.8% | | | | | | | | | |
| | | Automobiles & Components 1.7% | | | | | | | | | |
| | Fiat Chrysler Automobiles NV, senior note, 5.25%, 4/15/23 | | | United Kingdom | | | $ | 474,000 | | | | 484,957 | |
| | The Goodyear Tire & Rubber Co., senior bond, 5.00%, 5/31/26 | | | United States | | | | 625,000 | | | | 623,712 | |
| | | | | | | | | | | | | | |
| | | | | | | | | | | | | 1,108,669 | |
| | | | | | | | | | | | | | |
| | | Banks 3.3% | | | | | | | | | |
| e | | Bank of America Corp., junior sub. bond, M, 8.125% to 5/15/18, FRN thereafter, Perpetual | | | United States | | | | 562,000 | | | | 584,480 | |
| | CIT Group Inc., | | | | | | | | | | | | |
| | senior note, 5.375%, 5/15/20 | | | United States | | | | 225,000 | | | | 239,625 | |
| | senior note, 5.00%, 8/15/22 | | | United States | | | | 382,000 | | | | 399,190 | |
| e | | Citigroup Inc., junior sub. bond, M, 6.30% to 5/15/24, FRN thereafter, Perpetual | | | United States | | | | 429,000 | | | | 425,890 | |
| | Royal Bank of Scotland Group PLC, sub. note, 6.125%, 12/15/22 | | | United Kingdom | | | | 449,000 | | | | 477,520 | |
| | | | | | | | | | | | | | |
| | | | | | | | | | | | | 2,126,705 | |
| | | | | | | | | | | | | | |
| | | Capital Goods 5.1% | | | | | | | | | |
| d | | Allison Transmission Inc., senior note, 144A, 5.00%, 10/01/24 | | | United States | | | | 629,000 | | | | 636,862 | |
| d | | Cloud Crane LLC, secured note, second lien, 144A, 10.125%, 8/01/24 | | | United States | | | | 315,000 | | | | 337,838 | |
| | CNH Industrial Capital LLC, senior note, 3.875%, 10/15/21 | | | United States | | | | 637,000 | | | | 628,241 | |
| d | | Cortes NP Acquisition Corp., senior note, 144A, 9.25%, 10/15/24 | | | United States | | | | 562,000 | | | | 598,530 | |
| | Navistar International Corp., senior bond, 8.25%, 11/01/21 | | | United States | | | | 315,000 | | | | 319,725 | |
FRANKLIN TEMPLETON VARIABLE INSURANCE PRODUCTS TRUST
STATEMENT OF INVESTMENTS
Franklin High Income VIP Fund (continued)
| | | | | | | | | | | | | | |
| | | | | Country | | | Principal Amount* | | | Value | |
| | | Corporate Bonds (continued) | | | | | | | | | |
| | Capital Goods (continued) | | | | | | | | | | | | |
| | TransDigm Inc., | | | | | | | | | | | | |
| | senior sub. bond, 6.50%, 7/15/24 | | | United States | | | $ | 225,000 | | | $ | 236,531 | |
| | d senior sub. bond, 144A, 6.375%, 6/15/26 | | | United States | | | | 368,000 | | | | 379,776 | |
| | senior sub. note, 6.00%, 7/15/22 | | | United States | | | | 113,000 | | | | 118,085 | |
| | | | | | | | | | | | | | |
| | | | | | | | | | | | | 3,255,588 | |
| | | | | | | | | | | | | | |
| | | Commercial & Professional Services 1.5% | | | | | | | | | |
| d | | Acosta Inc., senior note, 144A, 7.75%, 10/01/22 | | | United States | | | | 449,000 | | | | 379,405 | |
| c,f | | Goss Graphic Systems Inc., senior sub. note, 12.25%, 11/19/05 | | | United States | | | | 1,912,374 | | | | 191 | |
| | United Rentals North America Inc., senior bond, 5.75%, 11/15/24 | | | United States | | | | 562,000 | | | | 592,910 | |
| | | | | | | | | | | | | | |
| | | | | | | | | | | | | 972,506 | |
| | | | | | | | | | | | | | |
| | | Consumer Durables & Apparel 3.8% | | | | | | | | | |
| d | | Hanesbrands Inc., senior bond, 144A, 4.875%, 5/15/26 | | | United States | | | | 449,000 | | | | 441,143 | |
| | KB Home, | | | | | | | | | | | | |
| | senior bond, 7.50%, 9/15/22 | | | United States | | | | 472,000 | | | | 500,320 | |
| | senior note, 7.00%, 12/15/21 | | | United States | | | | 158,000 | | | | 167,875 | |
| | PulteGroup Inc., senior bond, 5.00%, 1/15/27 | | | United States | | | | 694,000 | | | | 661,902 | |
| d | | Taylor Morrison Communities Inc./Monarch Communities Inc., | | | | | | | | | | | | |
| | senior note, 144A, 5.25%, 4/15/21 | | | United States | | | | 203,000 | | | | 209,090 | |
| | senior note, 144A, 5.875%, 4/15/23 | | | United States | | | | 135,000 | | | | 137,700 | |
| | senior note, 144A, 5.625%, 3/01/24 | | | United States | | | | 337,000 | | | | 342,055 | |
| | | | | | | | | | | | | | |
| | | | | | | | | | | | | 2,460,085 | |
| | | | | | | | | | | | | | |
| | | Consumer Services 3.2% | | | | | | | | | |
| d | | 24 Hour Holdings III LLC, senior note, 144A, 8.00%, 6/01/22 | | | United States | | | | 562,000 | | | | 480,510 | |
| d | | KFC Holding Co./Pizza Hut Holdings LLC/Taco Bell of America LLC, | | | | | | | | | | | | |
| | senior note, 144A, 5.00%, 6/01/24 | | | United States | | | | 225,000 | | | | 230,344 | |
| | senior note, 144A, 5.25%, 6/01/26 | | | United States | | | | 225,000 | | | | 228,937 | |
| d | | ROC Finance LLC/ROC Finance 1 Corp., senior secured note, first lien, 144A, 6.75%, 11/15/21 | | | United States | | | | 500,000 | | | | 507,500 | |
| d | | Wynn Las Vegas LLC/Wynn Las Vegas Capital Corp., senior bond, 144A, 5.50%, 3/01/25 | | | United States | | | | 360,000 | | | | 358,020 | |
| d | | Wynn Macau Ltd., senior note, 144A, 5.25%, 10/15/21 | | | Macau | | | | 270,000 | | | | 273,375 | |
| | | | | | | | | | | | | | |
| | | | | | | | | | | | | 2,078,686 | |
| | | | | | | | | | | | | | |
| | | Diversified Financials 5.4% | | | | | | | | | |
| | AerCap Ireland Capital Ltd./AerCap Global Aviation Trust, | | | | | | | | | | | | |
| | senior note, 4.625%, 10/30/20 | | | Netherlands | | | | 382,000 | | | | 398,436 | |
| | senior note, 4.625%, 7/01/22 | | | Netherlands | | | | 225,000 | | | | 232,602 | |
| d | | Grinding Media Inc./MC Grinding Media Canada Inc., senior secured note, 144A, 7.375%, 12/15/23 | | | United States | | | | 100,000 | | | | 105,310 | |
| d | | Hilton Domestic Operating Co. Inc., first lien, senior note, 144A, 4.25%, 9/01/24 | | | United States | | | | 660,000 | | | | 643,500 | |
| d | | Lincoln Finance Ltd., senior secured note, 144A, 7.375%, 4/15/21 | | | Netherlands | | | | 562,000 | | | | 600,637 | |
| d | | MSCI Inc., senior note, 144A, 4.75%, 8/01/26 | | | United States | | | | 782,000 | | | | 777,112 | |
| | Navient Corp., | | | | | | | | | | | | |
| | senior note, 6.625%, 7/26/21 | | | United States | | | | 247,000 | | | | 261,820 | |
| | senior note, 7.25%, 9/25/23 | | | United States | | | | 449,000 | | | | 462,470 | |
| | | | | | | | | | | | | | |
| | | | | | | | | | | | | 3,481,887 | |
| | | | | | | | | | | | | | |
FRANKLIN TEMPLETON VARIABLE INSURANCE PRODUCTS TRUST
STATEMENT OF INVESTMENTS
Franklin High Income VIP Fund (continued)
| | | | | | | | | | | | | | |
| | | | | Country | | | Principal Amount* | | | Value | |
| | | Corporate Bonds (continued) | | | | | | | | | |
| | | Energy 10.7% | | | | | | | | | |
| d | | California Resources Corp., secured note, second lien, 144A, 8.00%, 12/15/22 | | | United States | | | $ | 484,000 | | | $ | 433,180 | |
| | Calumet Specialty Products Partners LP/Calumet Finance Corp., | | | | | | | | | | | | |
| | senior note, 7.75%, 4/15/23 | | | United States | | | | 337,000 | | | | 281,395 | |
| | d senior note, 144A, 11.50%, 1/15/21 | | | United States | | | | 135,000 | | | | 154,913 | |
| | CGG SA, senior note, 6.875%, 1/15/22 | | | France | | | | 292,000 | | | | 135,780 | |
| d | | Cheniere Corpus Christi Holdings LLC, | | | | | | | | | | | | |
| | senior secured note, 144A, 7.00%, 6/30/24 | | | United States | | | | 225,000 | | | | 244,688 | |
| | senior secured note, first lien, 144A, 5.875%, 3/31/25 | | | United States | | | | 200,000 | | | | 204,812 | |
| | CONSOL Energy Inc., | | | | | | | | | | | | |
| | senior note, 5.875%, 4/15/22 | | | United States | | | | 247,000 | | | | 243,295 | |
| | senior note, 8.00%, 4/01/23 | | | United States | | | | 405,000 | | | | 417,656 | |
| | CSI Compressco LP/CSI Compressco Finance Inc., senior note, 7.25%, 8/15/22 | | | United States | | | | 158,000 | | | | 150,100 | |
| | Energy Transfer Equity LP, | | | | | | | | | | | | |
| | senior note, first lien, 7.50%, 10/15/20 | | | United States | | | | 484,000 | | | | 542,080 | |
| | senior secured bond, first lien, 5.50%, 6/01/27 | | | United States | | | | 113,000 | | | | 110,740 | |
| d,g | | EnQuest PLC, 144A, PIK, 7.00%, 4/15/22 | | | United Kingdom | | | | 585,761 | | | | 424,387 | |
| | Ferrellgas LP/Ferrellgas Finance Corp., senior note, 6.75%, 6/15/23 | | | United States | | | | 539,000 | | | | 532,262 | |
| | Martin Midstream Partners LP/Martin Midstream Finance Corp., senior note, 7.25%, 2/15/21 | | | United States | | | | 247,000 | | | | 245,148 | |
| d | | Murray Energy Corp., secured note, second lien, 144A, 11.25%, 4/15/21 | | | United States | | | | 270,000 | | | | 209,250 | |
| | QEP Resources Inc., | | | | | | | | | | | | |
| | senior bond, 5.375%, 10/01/22 | | | United States | | | | 225,000 | | | | 226,688 | |
| | senior bond, 5.25%, 5/01/23 | | | United States | | | | 337,000 | | | | 339,527 | |
| | Sabine Pass Liquefaction LLC, first lien, 5.625%, 2/01/21 | | | United States | | | | 539,000 | | | | 579,425 | |
| h | | Sanchez Energy Corp., | | | | | | | | | | | | |
| | senior note, 7.75%, 6/15/21 | | | United States | | | | 405,000 | | | | 414,112 | |
| | senior note, 6.125%, 1/15/23 | | | United States | | | | 225,000 | | | | 214,875 | |
| | Weatherford International Ltd., | | | | | | | | | | | | |
| | senior note, 7.75%, 6/15/21 | | | United States | | | | 225,000 | | | | 228,094 | |
| | senior note, 8.25%, 6/15/23 | | | United States | | | | 292,000 | | | | 297,840 | |
| | WPX Energy Inc., senior note, 8.25%, 8/01/23 | | | United States | | | | 225,000 | | | | 252,562 | |
| | | | | | | | | | | | | | |
| | | | | | | | | | | | | 6,882,809 | |
| | | | | | | | | | | | | | |
| | | Food, Beverage & Tobacco 3.6% | | | | | | | | | |
| | Cott Beverages Inc., senior note, 6.75%, 1/01/20 | | | United States | | | | 247,000 | | | | 256,108 | |
| d | | Dole Food Co. Inc., senior secured note, 144A, 7.25%, 5/01/19 | | | United States | | | | 113,000 | | | | 115,543 | |
| d | | JBS USA LLC/Finance Inc., | | | | | | | | | | | | |
| | senior bond, 144A, 5.875%, 7/15/24 | | | United States | | | | 337,000 | | | | 349,637 | |
| | senior note, 144A, 8.25%, 2/01/20 | | | United States | | | | 225,000 | | | | 231,750 | |
| d | | Lamb Weston Holdings Inc., | | | | | | | | | | | | |
| | senior note, 144A, 4.625%, 11/01/24 | | | United States | | | | 100,000 | | | | 100,500 | |
| | senior note, 144A, 4.875%, 11/01/26 | | | United States | | | | 600,000 | | | | 595,125 | |
| d | | Post Holdings Inc., senior bond, 144A, 5.00%, 8/15/26 | | | United States | | | | 671,000 | | | | 644,160 | |
| | | | | | | | | | | | | | |
| | | | | | | | | | | | | 2,292,823 | |
| | | | | | | | | | | | | | |
| | | Health Care Equipment & Services 4.5% | | | | | | | | | |
| | Acadia Healthcare Co. Inc., senior note, 6.50%, 3/01/24 | | | United States | | | | 158,000 | | | | 161,950 | |
| | Alere Inc., senior sub. note, 6.50%, 6/15/20 | | | United States | | | | 45,000 | | | | 44,550 | |
| | CHS/Community Health Systems Inc., | | | | | | | | | | | | |
| | senior note, 7.125%, 7/15/20 | | | United States | | | | 158,000 | | | | 120,918 | |
| | senior note, 6.875%, 2/01/22 | | | United States | | | | 517,000 | | | | 361,900 | |
| | DaVita Inc., senior bond, 5.125%, 7/15/24 | | | United States | | | | 449,000 | | | | 448,719 | |
FRANKLIN TEMPLETON VARIABLE INSURANCE PRODUCTS TRUST
STATEMENT OF INVESTMENTS
Franklin High Income VIP Fund (continued)
| | | | | | | | | | | | | | |
| | | | | Country | | | Principal Amount* | | | Value | |
| | | Corporate Bonds (continued) | | | | | | | | | |
| | | Health Care Equipment & Services (continued) | | | | | | | | | |
| | HCA Inc., | | | | | | | | | | | | |
| | senior bond, 5.875%, 5/01/23 | | | United States | | | $ | 225,000 | | | $ | 239,625 | |
| | senior bond, 5.375%, 2/01/25 | | | United States | | | | 337,000 | | | | 338,264 | |
| | senior secured note, first lien, 5.00%, 3/15/24 | | | United States | | | | 517,000 | | | | 533,156 | |
| | Tenet Healthcare Corp., senior note, 8.125%, 4/01/22 | | | United States | | | | 674,000 | | | | 639,289 | |
| | | | | | | | | | | | | | |
| | | | | | | | | | | | | 2,888,371 | |
| | | | | | | | | | | | | | |
| | | Materials 13.8% | | | | | | | | | |
| | ArcelorMittal, senior note, 6.50%, 3/01/21 | | | France | | | | 427,000 | | | | 466,647 | |
| d,g,i | | ARD Finance SA, senior secured note, 144A, PIK, 7.125%, 9/15/23 | | | Luxembourg | | | | 400,000 | | | | 397,000 | |
| d | | Ardagh Packaging Finance PLC/Ardagh MP Holdings USA Inc., senior note, 144A, 6.00%, 6/30/21 | | | Luxembourg | | | | 427,000 | | | | 436,074 | |
| d | | Barminco Finance Pty. Ltd., senior note, 144A, 9.00%, 6/01/18 | | | Australia | | | | 360,000 | | | | 367,650 | |
| d | | Cemex Finance LLC, senior secured note, first lien, 144A, 6.00%, 4/01/24 | | | Mexico | | | | 382,000 | | | | 394,940 | |
| d | | Cemex SAB de CV, senior secured bond, first lien, 144A, 6.125%, 5/05/25 | | | Mexico | | | | 315,000 | | | | 324,340 | |
| | The Chemours Co., | | | | | | | | | | | | |
| | senior bond, 7.00%, 5/15/25 | | | United States | | | | 113,000 | | | | 111,870 | |
| | senior note, 6.625%, 5/15/23 | | | United States | | | | 405,000 | | | | 402,975 | |
| d | | CVR Partners LP/CVR Nitrogen Finance Corp., secured note, second lien, 144A, 9.25%, 6/15/23 | | | United States | | | | 449,000 | | | | 464,154 | |
| d | | Eldorado Gold Corp., senior note, 144A, 6.125%, 12/15/20. | | | Canada | | | | 360,000 | | | | 367,200 | |
| d | | First Quantum Minerals Ltd., | | | | | | | | | | | | |
| | senior note, 144A, 6.75%, 2/15/20 | | | Canada | | | | 449,000 | | | | 450,122 | |
| | senior note, 144A, 7.00%, 2/15/21 | | | Canada | | | | 413,000 | | | | 412,835 | |
| d | | HudBay Minerals Inc., senior note, 144A, 7.25%, 1/15/23 | | | Canada | | | | 100,000 | | | | 103,750 | |
| d | | NOVA Chemicals Corp., senior bond, 144A, 5.00%, 5/01/25 | | | Canada | | | | 449,000 | | | | 441,003 | |
| d | | Novelis Corp., senior note, 144A, 6.25%, 8/15/24 | | | United States | | | | 562,000 | | | | 597,125 | |
| d | | Owens-Brockway Glass Container Inc., | | | | | | | | | | | | |
| | senior note, 144A, 5.00%, 1/15/22 | | | United States | | | | 615,000 | | | | 631,144 | |
| | senior note, 144A, 5.875%, 8/15/23 | | | United States | | | | 135,000 | | | | 140,991 | |
| d | | Platform Specialty Products Corp., senior note, 144A, 6.50%, 2/01/22 | | | United States | | | | 337,000 | | | | 341,213 | |
| d | | Rain CII Carbon LLC/CII Carbon Corp., second lien, 144A, 8.25%, 1/15/21 | | | United States | | | | 270,000 | | | | 268,650 | |
| d | | Reynolds Group Issuer Inc./Reynolds Group Issuer LLC/Reynolds Group Issuer | | | | | | | | | | | | |
| | Luxembourg SA, | | | | | | | | | | | | |
| | first lien, 144A, 5.125%, 7/15/23. | | | United States | | | | 382,000 | | | | 388,685 | |
| | senior note, 144A, 7.00%, 7/15/24 | | | United States | | | | 449,000 | | | | 477,904 | |
| | Steel Dynamics Inc., | | | | | | | | | | | | |
| | senior bond, 5.50%, 10/01/24 | | | United States | | | | 180,000 | | | | 191,250 | |
| | senior note, 5.125%, 10/01/21 | | | United States | | | | 180,000 | | | | 188,629 | |
| | Summit Materials LLC/Summit Materials Finance Corp., senior note, 8.50%, 4/15/22 | | | United States | | | | 405,000 | | | | 449,550 | |
| | | | | | | | | | | | | | |
| | | | | | | | | | | | | 8,815,701 | |
| | | | | | | | | | | | | | |
| | | Media 8.4% | | | | | | | | | |
| d | | Altice U.S. Finance I Corp., senior secured bond, 144A, 5.50%, 5/15/26 | | | United States | | | | 449,000 | | | | 459,102 | |
| | AMC Networks Inc., senior note, 5.00%, 4/01/24 | | | United States | | | | 337,000 | | | | 339,106 | |
| | CCO Holdings LLC/CCO Holdings Capital Corp., | | | | | | | | | | | | |
| | senior bond, 5.25%, 9/30/22 | | | United States | | | | 225,000 | | | | 233,438 | |
| | d senior bond, 144A, 5.375%, 5/01/25 | | | United States | | | | 180,000 | | | | 185,850 | |
| | d senior bond, 144A, 5.75%, 2/15/26 | | | United States | | | | 113,000 | | | | 117,238 | |
| | Clear Channel Worldwide Holdings Inc., | | | | | | | | | | | | |
| | senior note, 6.50%, 11/15/22 | | | United States | | | | 225,000 | | | | 231,188 | |
| | senior sub. note, 7.625%, 3/15/20 | | | United States | | | | 247,000 | | | | 247,771 | |
FRANKLIN TEMPLETON VARIABLE INSURANCE PRODUCTS TRUST
STATEMENT OF INVESTMENTS
Franklin High Income VIP Fund (continued)
| | | | | | | | | | | | | | |
| | | | | Country | | | Principal Amount* | | | Value | |
| | | Corporate Bonds (continued) | | | | | | | | | |
| | | Media (continued) | | | | | | | | | |
| | CSC Holdings LLC, | | | | | | | | | | | | |
| | d senior bond, 144A, 5.50%, 4/15/27 | | | United States | | | $ | 113,000 | | | $ | 114,695 | |
| | senior note, 6.75%, 11/15/21 | | | United States | | | | 337,000 | | | | 363,117 | |
| | senior note, 5.25%, 6/01/24 | | | United States | | | | 225,000 | | | | 220,500 | |
| | DISH DBS Corp., senior note, 5.875%, 11/15/24 | | | United States | | | | 686,000 | | | | 708,466 | |
| | iHeartCommunications Inc., | | | | | | | | | | | | |
| | senior secured bond, first lien, 9.00%, 3/01/21 | | | United States | | | | 562,000 | | | | 417,987 | |
| | senior secured note, first lien, 9.00%, 9/15/22 | | | United States | | | | 158,000 | | | | 116,723 | |
| d | | Nextstar Escrow Corp., senior note, 144A, 5.625%, 8/01/24 | | | United States | | | | 558,000 | | | | 555,210 | |
| d | | Radio One Inc., senior sub. note, 144A, 9.25%, 2/15/20 | | | United States | | | | 380,000 | | | | 346,750 | |
| d | | Univision Communications Inc., senior secured note, first lien, 144A, 5.125%, 2/15/25 | | | United States | | | | 600,000 | | | | 576,000 | |
| d | | WMG Acquisition Corp., senior note, 144A, 5.625%, 4/15/22 | | | United States | | | | 140,000 | | | | 145,425 | |
| | | | | | | | | | | | | | |
| | | | | | | | | | | | | 5,378,566 | |
| | | | | | | | | | | | | | |
| | | Pharmaceuticals, Biotechnology & Life Sciences 3.4% | | | | | | | | | |
| d | | Concordia International Corp., | | | | | | | | | | | | |
| | senior note, 144A, 7.00%, 4/15/23 | | | Canada | | | | 292,000 | | | | 90,520 | |
| | senior secured note, first lien, 144A, 9.00%, 4/01/22. | | | Canada | | | | 135,000 | | | | 114,919 | |
| d | | Endo Finance LLC/Endo Ltd./Endo Finco Inc., | | | | | | | | | | | | |
| | senior bond, 144A, 6.00%, 2/01/25 | | | United States | | | | 337,000 | | | | 282,237 | |
| | senior note, 144A, 6.00%, 7/15/23 | | | United States | | | | 158,000 | | | | 139,435 | |
| | Horizon Pharma Inc., senior note, 6.625%, 5/01/23 | | | United States | | | | 562,000 | | | | 536,710 | |
| | d Horizon Pharma Inc./Horizon Pharma USA Inc., senior note, 144A, 8.75%, 11/01/24 | | | United States | | | | 113,000 | | | | 114,978 | |
| | d Jaguar Holding Co. II/Pharmaceutical Product Development LLC, senior note, 144A, 6.375%, 8/01/23 | | | United States | | | | 203,000 | | | | 217,718 | |
| | d Valeant Pharmaceuticals International, senior note, 144A, 6.375%, 10/15/20 | | | United States | | | | 574,000 | | | | 495,970 | |
| | d Valeant Pharmaceuticals International Inc., | | | | | | | | | | | | |
| | senior bond, 144A, 6.125%, 4/15/25 | | | United States | | | | 158,000 | | | | 119,290 | |
| | senior note, 144A, 5.625%, 12/01/21 | | | United States | | | | 68,000 | | | | 53,040 | |
| | | | | | | | | | | | | | |
| | | | | | | | | | | | | 2,164,817 | |
| | | | | | | | | | | | | | |
| | | Real Estate 1.2% | | | | | | | | | |
| | Equinix Inc., senior bond, 5.375%, 4/01/23 | | | United States | | | | 729,000 | | | | 759,983 | |
| | | | | | | | | | | | | | |
| | | Retailing 1.7% | | | | | | | | | |
| | Netflix Inc., senior bond, 5.875%, 2/15/25 | | | United States | | | | 427,000 | | | | 461,694 | |
| d | | PetSmart Inc., senior note, 144A, 7.125%, 3/15/23 | | | United States | | | | 584,000 | | | | 597,140 | |
| | | | | | | | | | | | | | |
| | | | | | | | | | | | | 1,058,834 | |
| | | | | | | | | | | | | | |
| | | Semiconductors & Semiconductor Equipment 0.5% | | | | | | | | | |
| | Qorvo Inc., senior bond, 7.00%, 12/01/25 | | | United States | | | | 270,000 | | | | 300,375 | |
| | | | | | | | | | | | | | |
| | | Software & Services 2.9% | | | | | | | | | |
| d | | BMC Software Finance Inc., senior note, 144A, 8.125%, 7/15/21 | | | United States | | | | 574,000 | | | | 539,201 | |
| d | | First Data Corp., | | | | | | | | | | | | |
| | second lien, 144A, 5.75%, 1/15/24 | | | United States | | | | 652,000 | | | | 675,231 | |
| | senior note, 144A, 7.00%, 12/01/23 | | | United States | | | | 158,000 | | | | 168,665 | |
| | Infor (U.S.) Inc., senior note, 6.50%, 5/15/22 | | | United States | | | | 462,000 | | | | 482,790 | |
| | | | | | | | | | | | | | |
| | | | | | | | | | | | | 1,865,887 | |
| | | | | | | | | | | | | | |
FRANKLIN TEMPLETON VARIABLE INSURANCE PRODUCTS TRUST
STATEMENT OF INVESTMENTS
Franklin High Income VIP Fund (continued)
| | | | | | | | | | | | | | |
| | | | | Country | | | Principal Amount* | | | Value | |
| | | Corporate Bonds (continued) | | | | | | | | | |
| | | Technology Hardware & Equipment 3.5% | | | | | | | | | |
| d | | Blackboard Inc., second lien, 144A, 9.75%, 10/15/21 | | | United States | | | $ | 467,000 | | | $ | 481,010 | |
| d | | CommScope Technologies Finance LLC, senior bond, 144A, 6.00%, 6/15/25 | | | United States | | | | 660,000 | | | | 702,900 | |
| d | | Diamond 1 Finance Corp./Diamond 2 Finance Corp., | | | | | | | | | | | | |
| | senior note, 144A, 5.875%, 6/15/21 | | | United States | | | | 68,000 | | | | 72,351 | |
| | senior note, 144A, 7.125%, 6/15/24 | | | United States | | | | 68,000 | | | | 75,503 | |
| | senior secured bond, first lien, 144A, 6.02%, 6/15/26 | | | United States | | | | 113,000 | | | | 122,471 | |
| | senior secured note, first lien, 144A, 5.45%, 6/15/23. | | | United States | | | | 158,000 | | | | 167,648 | |
| d | | Western Digital Corp., senior note, 144A, 10.50%, 4/01/24 | | | United States | | | | 539,000 | | | | 638,715 | |
| | | | | | | | | | | | | | |
| | | | | | | | | | | | | 2,260,598 | |
| | | | | | | | | | | | | | |
| | | Telecommunication Services 7.9% | | | | | | | | | |
| | CenturyLink Inc., senior note, 5.80%, 3/15/22 | | | United States | | | | 562,000 | | | | 576,545 | |
| d | | Digicel Group Ltd., senior note, 144A, 8.25%, 9/30/20 | | | Bermuda | | | | 337,000 | | | | 289,314 | |
| d | | Digicel Ltd., senior note, 144A, 6.00%, 4/15/21 | | | Bermuda | | | | 494,000 | | | | 448,305 | |
| d | | Hughes Satellite Systems Corp., senior bond, 144A, 6.625%, 8/01/26 | | | United States | | | | 539,000 | | | | 543,042 | |
| | Intelsat Jackson Holdings SA, | | | | | | | | | | | | |
| | senior bond, 5.50%, 8/01/23 | | | Luxembourg | | | | 337,000 | | | | 229,160 | |
| | senior note, 7.50%, 4/01/21 | | | Luxembourg | | | | 754,000 | | | | 578,695 | |
| d | | Sprint Communications Inc., senior note, 144A, 9.00%, 11/15/18 | | | United States | | | | 158,000 | | | | 174,590 | |
| | Sprint Corp., | | | | | | | | | | | | |
| | senior bond, 7.875%, 9/15/23 | | | United States | | | | 113,000 | | | | 120,910 | |
| | senior bond, 7.125%, 6/15/24 | | | United States | | | | 113,000 | | | | 116,673 | |
| d | | Sprint Spectrum Co. LLC/Sprint Spectrum Co. II LLC, 144A, 3.36%, 3/20/23 | | | United States | | | | 741,000 | | | | 744,238 | |
| | T-Mobile USA Inc., | | | | | | | | | | | | |
| | senior bond, 6.50%, 1/15/24 | | | United States | | | | 203,000 | | | | 218,225 | |
| | senior bond, 6.375%, 3/01/25 | | | United States | | | | 360,000 | | | | 385,650 | |
| | senior note, 6.00%, 4/15/24 | | | United States | | | | 135,000 | | | | 142,594 | |
| d | | Wind Acquisition Finance SA, secured note, second lien, 144A, 7.375%, 4/23/21 | | | Italy | | | | 474,000 | | | | 493,244 | |
| | | | | | | | | | | | | | |
| | | | | | | | | | | | | 5,061,185 | |
| | | | | | | | | | | | | | |
| | | Transportation 1.5% | | | | | | | | | |
| d | | Florida East Coast Holdings Corp., | | | | | | | | | | | | |
| | secured note, first lien, 144A, 6.75%, 5/01/19 | | | United States | | | | 203,000 | | | | 210,612 | |
| | senior note, 144A, 9.75%, 5/01/20 | | | United States | | | | 113,000 | | | | 116,673 | |
| d | | Stena International SA, senior secured bond, first lien, 144A, 5.75%, 3/01/24 | | | Sweden | | | | 158,000 | | | | 137,926 | |
| d | | XPO Logistics Inc., senior note, 144A, 6.125%, 9/01/23 | | | United States | | | | 449,000 | | | | 470,889 | |
| | | | | | | | | | | | | | |
| | | | | | | | | | | | | 936,100 | |
| | | | | | | | | | | | | | |
| | | Utilities 4.2% | | | | | | | | | |
| | Calpine Corp., | | | | | | | | | | | | |
| | senior bond, 5.75%, 1/15/25 | | | United States | | | | 382,000 | | | | 370,540 | |
| | senior note, 5.375%, 1/15/23 | | | United States | | | | 292,000 | | | | 286,890 | |
| | Dynegy Inc., | | | | | | | | | | | | |
| | senior bond, 7.625%, 11/01/24 | | | United States | | | | 449,000 | | | | 416,447 | |
| | d senior note, 144A, 8.00%, 1/15/25 | | | United States | | | | 225,000 | | | | 210,938 | |
| d | | InterGen NV, secured bond, 144A, 7.00%, 6/30/23 | | | Netherlands | | | | 674,000 | | | | 603,230 | |
| | NRG Yield Operating LLC, | | | | | | | | | | | | |
| | senior bond, 5.375%, 8/15/24 | | | United States | | | | 349,000 | | | | 352,490 | |
| | d senior bond, 144A, 5.00%, 9/15/26 | | | United States | | | | 360,000 | | | | 345,600 | |
| | Talen Energy Supply LLC, senior note, 6.50%, 6/01/25. | | | United States | | | | 158,000 | | | | 122,845 | |
| | | | | | | | | | | | | | |
| | | | | | | | | | | | | 2,708,980 | |
| | | | | | | | | | | | | | |
| | Total Corporate Bonds (Cost $60,159,652) | | | | | | | | | | | 58,859,155 | |
| | | | | | | | | | | | | | |
FRANKLIN TEMPLETON VARIABLE INSURANCE PRODUCTS TRUST
STATEMENT OF INVESTMENTS
Franklin High Income VIP Fund (continued)
| | | | | | | | | | | | | | |
| | | | | Country | | | Shares | | | Value | |
| | | Escrows and Litigation Trusts 0.2% | | | | | | | | | |
| a,c | | Midstates Petroleum Co. Inc./Midstates Petroleum Co. LLC, Litigation Trust | | | United States | | | | 337,000 | | | $ | — | |
| a,c | | NewPage Corp., Litigation Trust | | | United States | | | | 2,500,000 | | | | — | |
| a | | Penn Virginia Corp., Litigation Trust | | | United States | | | | 1,200,000 | | | | 30,000 | |
| a,c | | Vistra Energy Corp., Litigation Trust | | | United States | | | | 2,500,000 | | | | 29,000 | |
| a | | Vistra Energy Corp., Litigation Trust, TRA | | | United States | | | | 42,815 | | | | 62,082 | |
| | | | | | | | | | | | | | |
| | Total Escrows and Litigation Trusts (Cost $239,490) | | | | | | | | | | | 121,082 | |
| | | | | | | | | | | | | | |
| | Total Investments before Short Term Investments
(Cost $65,998,807) | | | | | | | | | | | 60,871,751 | |
| | | | | | | | | | | | | | |
| | | | |
| | | | | | | | Principal Amount* | | | | |
| | | Short Term Investments (Cost $3,447,434) 5.4% | | | | | | | | | |
| | | Repurchase Agreements 5.4% | | | | | | | | | |
| j | | Joint Repurchase Agreement, 0.437%, 1/03/17 (Maturity Value $3,447,602) | | | | | | | | | | | | |
| | BNP Paribas Securities Corp. (Maturity Value $1,449,200) | | | | | | | | | | | | |
| | Deutsche Bank Securities Inc. (Maturity Value $181,102) | | | | | | | | | | | | |
| | HSBC Securities (USA) Inc. (Maturity Value $1,449,200) | | | | | | | | | | | | |
| | Merrill Lynch, Pierce, Fenner & Smith Inc. (Maturity Value $368,100) Collateralized by U.S. Government Agency Securities, 0.00% - 1.75%, 6/09/17 - 2/26/19; kU.S. Treasury Bill, 5/04/17 - 5/25/17; U.S. Treasury Note, 0.50% - 3.50%, 12/31/16 - 8/31/21; and U.S. Treasury Note, Index Linked, 1.375%, 7/15/18 (valued at $3,517,184) | | | | | | $ | 3,447,434 | | | | 3,447,434 | |
| | | | | | | | | | | | | | |
| | Total Investments (Cost $69,446,241) 100.4%. | | | | | | | | | | | 64,319,185 | |
| | Other Assets, less Liabilities (0.4)% | | | | | | | | | | | (232,857 | ) |
| | | | | | | | | | | | | | |
| | Net Assets 100.0% | | | | | | | | | | $ | 64,086,328 | |
| | | | | | | | | | | | | | |
See Abbreviations on page FH- 33.
†Rounds to less than 0.1% of net assets.
*The principal amount is stated in U.S. dollars unless otherwise indicated.
aNon-income producing.
bSee Note 8 regarding restricted securities.
cSecurity has been deemed illiquid because it may not be able to be sold within seven days. At December 31, 2016, the aggregate value of these securities was $162,809 representing 0.3% of net assets.
dSecurity was purchased pursuant to Rule 144A under the Securities Act of 1933 and may be sold in transactions exempt from registration only to qualified institutional buyers or in a public offering registered under the Securities Act of 1933. These securities have been deemed liquid under guidelines approved by the Trust’s Board of Trustees. At December 31, 2016, the aggregate value of these securities was $31,944,147, representing 49.8% of net assets.
ePerpetual security with no stated maturity date.
fSee Note 7 regarding defaulted securities.
gIncome may be received in additional securities and/or cash.
hAt December 31, 2016, pursuant to the Fund’s policies and the requirements of applicable securities law, the Fund is restricted from trading these securities at year end.
iA portion or all of the security purchased on a delayed delivery basis. See Note 1(d).
jSee Note 1(c) regarding joint repurchase agreement.
kThe security was issued on a discount basis with no stated coupon rate.
| | | | |
| FH-20 | | Annual Report | The accompanying notes are an integral part of these financial statements. |
FRANKLIN TEMPLETON VARIABLE INSURANCE PRODUCTS TRUST
Financial Statements
Statement of Assets and Liabilities
December 31, 2016
| | | | |
| | | Franklin High
Income VIP
Fund | |
Assets: | | | | |
Investments in securities: | | | | |
Cost - Unaffiliated issuers | | $ | 65,998,807 | |
Cost - Repurchase agreements | | | 3,447,434 | |
| | | | |
Total cost of investments | | $ | 69,446,241 | |
| | | | |
Value - Unaffiliated issuers | | $ | 60,871,751 | |
Value - Repurchase agreements | | | 3,447,434 | |
| | | | |
Total value of investments | | | 64,319,185 | |
Cash | | | 67 | |
Receivables: | | | | |
Capital shares sold | | | 41,006 | |
Interest | | | 934,030 | |
Other assets | | | 22 | |
| | | | |
Total assets | | | 65,294,310 | |
| | | | |
Liabilities: | | | | |
Payables: | | | | |
Investment securities purchased | | | 1,030,782 | |
Capital shares redeemed | | | 33,580 | |
Management fees | | | 23,215 | |
Distribution fees | | | 27,912 | |
Accrued expenses and other liabilities | | | 92,493 | |
| | | | |
Total liabilities | | | 1,207,982 | |
| | | | |
Net assets, at value | | $ | 64,086,328 | |
| | | | |
Net assets consist of: | | | | |
Paid-in capital | | $ | 84,232,177 | |
Undistributed net investment income | | | 12,730,264 | |
Net unrealized appreciation (depreciation) | | | (5,127,056 | ) |
Accumulated net realized gain (loss) | | | (27,749,057 | ) |
| | | | |
Net assets, at value | | $ | 64,086,328 | |
| | | | |
| |
| Class 1: | | | | |
Net assets, at value | | $ | 389,454 | |
| | | | |
Shares outstanding | | | 63,398 | |
| | | | |
Net asset value and maximum offering price per share | | $ | 6.14 | |
| | | | |
| |
| Class 2: | | | | |
Net assets, at value | | $ | 41,931,687 | |
| | | | |
Shares outstanding | | | 7,080,380 | |
| | | | |
Net asset value and maximum offering price per share | | $ | 5.92 | |
| | | | |
| |
| Class 4: | | | | |
Net assets, at value | | $ | 21,765,187 | |
| | | | |
Shares outstanding | | | 3,589,916 | |
| | | | |
Net asset value and maximum offering price per share | | $ | 6.06 | |
| | | | |
| | | | | | |
| | | The accompanying notes are an integral part of these financial statements. | Annual Report | | | FH-21 | |
FRANKLIN TEMPLETON VARIABLE INSURANCE PRODUCTS TRUST
FINANCIAL STATEMENTS
Statement of Operations
for the year ended December 31, 2016
| | | | |
| | | Franklin High Income VIP Fund | |
Investment income: | | | | |
Dividends | | $ | 22,300 | |
Interest | | | 14,626,789 | |
| | | | |
Total investment income | | | 14,649,089 | |
| | | | |
Expenses: | | | | |
Management fees (Note 3a) | | | 1,252,862 | |
Distribution fees: (Note 3c) | | | | |
Class 2 | | | 454,367 | |
Class 4 | | | 78,660 | |
Custodian fees (Note 4) | | | 1,769 | |
Reports to shareholders | | | 57,081 | |
Professional fees | | | 60,835 | |
Trustees’ fees and expenses | | | 1,220 | |
Other | | | 32,063 | |
| | | | |
Total expenses | | | 1,938,857 | |
Expense reductions (Note 4) | | | (80 | ) |
Expenses waived/paid by affiliates (Note 3e) | | | (18,095 | ) |
| | | | |
Net expenses | | | 1,920,682 | |
| | | | |
Net investment income | | | 12,728,407 | |
| | | | |
Realized and unrealized gains (losses): | | | | |
Net realized gain (loss) from investments (includes loss from a redemption in-kind of $10,734,357) (Note 11) | | | (15,918,236 | ) |
Net change in unrealized appreciation (depreciation) on investments | | | 42,121,378 | |
| | | | |
Net realized and unrealized gain (loss) | | | 26,203,142 | |
| | | | |
Net increase (decrease) in net assets resulting from operations | | $ | 38,931,549 | |
| | | | |
| | | | |
| FH-22 | Annual Report | The accompanying notes are an integral part of these financial statements. |
FRANKLIN TEMPLETON VARIABLE INSURANCE PRODUCTS TRUST
FINANCIAL STATEMENTS
Statements of Changes in Net Assets
| | | | | | | | |
| | | Franklin High Income VIP Fund | |
| | | Year Ended December 31, | |
| | | 2016 | | | 2015 | |
Increase (decrease) in net assets: | | | | | | | | |
Operations: | | | | | | | | |
Net investment income | | $ | 12,728,407 | | | $ | 17,823,602 | |
Net realized gain (loss) | | | (15,918,236 | ) | | | (8,895,014 | ) |
Net change in unrealized appreciation (depreciation) | | | 42,121,378 | | | | (34,561,954 | ) |
| | | | |
Net increase (decrease) in net assets resulting from operations | | | 38,931,549 | | | | (25,633,366 | ) |
| | | | |
Distributions to shareholders from: | | | | | | | | |
Net investment income: | | | | | | | | |
Class 1 | | | (1,890,311 | ) | | | (2,177,640 | ) |
Class 2 | | | (14,579,216 | ) | | | (17,219,440 | ) |
Class 4 | | | (1,529,698 | ) | | | (1,604,998 | ) |
| | | | |
Total distributions to shareholders | | | (17,999,225 | ) | | | (21,002,078 | ) |
| | | | |
Capital share transactions: (Note 2) | | | | | | | | |
Class 1 | | | (28,565,813 | ) | | | (2,896,859 | ) |
Class 2 | | | (180,200,753 | ) | | | (18,609,864 | ) |
Class 4 | | | (1,961,507 | ) | | | (212,162 | ) |
| | | | |
Total capital share transactions | | | (210,728,073 | ) | | | (21,718,885 | ) |
| | | | |
Net increase (decrease) in net assets | | | (189,795,749 | ) | | | (68,354,329 | ) |
Net assets: | | | | | | | | |
Beginning of year | | | 253,882,077 | | | | 322,236,406 | |
| | | | |
End of year | | $ | 64,086,328 | | | $ | 253,882,077 | |
| | | | |
Undistributed net investment income included in net assets: | | | | | | | | |
End of year | | $ | 12,730,264 | | | $ | 16,279,338 | |
| | | | |
| | | | | | |
| The accompanying notes are an integral part of these financial statements. | Annual Report | | | FH-23 | |
FRANKLIN TEMPLETON VARIABLE INSURANCE PRODUCTS TRUST
Notes to Financial Statements
Franklin High Income VIP Fund
1. Organization and Significant Accounting Policies
Franklin Templeton Variable Insurance Products Trust (Trust) is registered under the Investment Company Act of 1940 (1940 Act) as an open-end management investment company, consisting of nineteen separate funds and applies the specialized accounting and reporting guidance in U.S. Generally Accepted Accounting Principles (U.S. GAAP). Franklin High Income VIP Fund (Fund) is included in this report. The financial statements of the remaining funds in the Trust are presented separately. Shares of the Fund are generally sold only to insurance company separate accounts to fund the benefits of variable life insurance policies or variable annuity contracts. The Fund offers three classes of shares: Class 1, Class 2, and Class 4. Each class of shares differs by its distribution fees, voting rights on matters affecting a single class and its exchange privilege.
The following summarizes the Fund’s significant accounting policies.
a. Financial Instrument Valuation
The Fund’s investments in financial instruments are carried at fair value daily. Fair value is the price that would be received to sell an asset or paid to transfer a liability in an orderly transaction between market participants on the measurement date. The Fund calculates the net asset value (NAV) per share as of 4 p.m. Eastern time each day the New York Stock Exchange (NYSE) is open for trading. Under compliance policies and procedures approved by the Trust’s Board of Trustees (the Board), the Fund’s administrator has responsibility for oversight of valuation, including leading the
cross-functional Valuation Committee (VC). The VC provides administration and oversight of the Fund’s valuation policies and procedures, which are approved annually by the Board. Among other things, these procedures allow the Fund to utilize independent pricing services, quotations from securities and financial instrument dealers, and other market sources to determine fair value.
Equity securities listed on an exchange or on the NASDAQ National Market System are valued at the last quoted sale price or the official closing price of the day, respectively. Foreign equity securities are valued as of the close of trading on the foreign stock exchange on which the security is primarily traded, or as of 4 p.m. Eastern time. The value is then converted into its U.S. dollar equivalent at the foreign exchange rate in
effect at 4 p.m. Eastern time on the day that the value of the security is determined. Over-the-counter (OTC) securities are valued within the range of the most recent quoted bid and ask prices. Securities that trade in multiple markets or on multiple exchanges are valued according to the broadest and most representative market. Certain equity securities are valued based upon fundamental characteristics or relationships to similar securities.
Debt securities generally trade in the OTC market rather than on a securities exchange. The Fund’s pricing services use multiple valuation techniques to determine fair value. In instances where sufficient market activity exists, the pricing services may utilize a market-based approach through which quotes from market makers are used to determine fair value. In instances where sufficient market activity may not exist or is limited, the pricing services also utilize proprietary valuation models which may consider market characteristics such as benchmark yield curves, credit spreads, estimated default rates, anticipated market interest rate volatility, coupon rates, anticipated timing of principal repayments, underlying collateral, and other unique security features in order to estimate the relevant cash flows, which are then discounted to calculate the fair value.
Investments in repurchase agreements are valued at cost, which approximates fair value.
The Fund has procedures to determine the fair value of financial instruments for which market prices are not reliable or readily available. Under these procedures, the VC convenes on a regular basis to review such financial instruments and considers a number of factors, including significant unobservable valuation inputs, when arriving at fair value. The VC primarily employs a market-based approach which may use related or comparable assets or liabilities, recent transactions, market multiples, book values, and other relevant information for the investment to determine the fair value of the investment. An income-based valuation approach may also be used in which the anticipated future cash flows of the investment are discounted to calculate fair value. Discounts may also be applied due to the nature or duration of any restrictions on the disposition of the investments. Due to the inherent uncertainty of valuations of such investments, the fair values may differ significantly from the values that would have been used had an active market existed. The VC employs various methods for calibrating these valuation approaches including a regular review of key inputs and assumptions, transactional back-testing or disposition analysis, and reviews of any related market activity.
FRANKLIN TEMPLETON VARIABLE INSURANCE PRODUCTS TRUST
NOTES TO FINANCIAL STATEMENTS
Franklin High Income VIP Fund (continued)
Trading in securities on foreign securities stock exchanges and OTC markets may be completed before 4 p.m. Eastern time. In addition, trading in certain foreign markets may not take place on every Fund’s business day. Occasionally, events occur between the time at which trading in a foreign security is completed and 4 p.m. Eastern time that might call into question the reliability of the value of a portfolio security held by the Fund. As a result, differences may arise between the value of the Fund’s portfolio securities as determined at the foreign market close and the latest indications of value at 4 p.m. Eastern time. In order to minimize the potential for these differences, the VC monitors price movements following the close of trading in foreign stock markets through a series of country specific market proxies (such as baskets of American Depositary Receipts, futures contracts and exchange traded funds). These price movements are measured against established trigger thresholds for each specific market proxy to assist in determining if an event has occurred that may call into question the reliability of the values of the foreign securities held by the Fund. If such an event occurs, the securities may be valued using fair value procedures, which may include the use of independent pricing services.
When the last day of the reporting period is a non-business day, certain foreign markets may be open on those days that the Fund’s NAV is not calculated, which could result in differences between the value of the Fund’s portfolio securities on the last business day and the last calendar day of the reporting period. Any significant security valuation changes due to an open foreign market are adjusted and reflected by the Fund for financial reporting purposes.
b. Foreign Currency Translation
Portfolio securities and other assets and liabilities denominated in foreign currencies are translated into U.S. dollars based on the exchange rate of such currencies against U.S. dollars on the date of valuation. The Fund may enter into foreign currency exchange contracts to facilitate transactions denominated in a foreign currency. Purchases and sales of securities, income and expense items denominated in foreign currencies are translated into U.S. dollars at the exchange rate in effect on the transaction date. Portfolio securities and assets and liabilities denominated in foreign currencies contain risks that those currencies will decline in value relative to the U.S. dollar. Occasionally, events may impact the availability or reliability of foreign exchange
rates used to convert the U.S. dollar equivalent value. If such an event occurs, the foreign exchange rate will be valued at fair value using procedures established and approved by the Board.
The Fund does not separately report the effect of changes in foreign exchange rates from changes in market prices on securities held. Such changes are included in net realized and unrealized gain or loss from investments in the Statement of Operations.
Realized foreign exchange gains or losses arise from sales of foreign currencies, currency gains or losses realized between the trade and settlement dates on securities transactions and the difference between the recorded amounts of dividends, interest, and foreign withholding taxes and the U.S. dollar equivalent of the amounts actually received or paid. Net unrealized foreign exchange gains and losses arise from changes in foreign exchange rates on foreign denominated assets and liabilities other than investments in securities held at the end of the reporting period.
c. Joint Repurchase Agreement
The Fund enters into a joint repurchase agreement whereby its uninvested cash balance is deposited into a joint cash account with other funds managed by the investment manager or an affiliate of the investment manager and is used to invest in one or more repurchase agreements. The value and face amount of the joint repurchase agreement are allocated to the funds based on their pro-rata interest. A repurchase agreement is accounted for as a loan by the Fund to the seller, collateralized by securities which are delivered to the Fund’s custodian. The fair value, including accrued interest, of the initial collateralization is required to be at least 102% of the dollar amount invested by the funds, with the value of the underlying securities marked to market daily to maintain coverage of at least 100%. Repurchase agreements are subject to the terms of Master Repurchase Agreements (MRAs) with approved counterparties (sellers). The MRAs contain various provisions, including but not limited to events of default and maintenance of collateral for repurchase agreements. In the event of default by either the seller or the Fund, certain MRAs may permit the
non-defaulting party to net and close-out all transactions, if any, traded under such agreements. The Fund may sell securities it holds as collateral and apply the proceeds towards the repurchase price and any other amounts owed by the seller to the Fund in the event of default by the seller. This could involve costs or delays in addition to a loss on the securities if their value falls below the
FRANKLIN TEMPLETON VARIABLE INSURANCE PRODUCTS TRUST
NOTES TO FINANCIAL STATEMENTS
Franklin High Income VIP Fund (continued)
1. Organization and Significant Accounting Policies (continued)
c. Joint Repurchase Agreement (continued)
repurchase price owed by the seller. The joint repurchase agreement held by the Fund at year end, as indicated in the Statement of Investments, had been entered into on December 30, 2016.
d. Securities Purchased on a Delayed Delivery Basis
The Fund purchases securities on a delayed delivery basis, with payment and delivery scheduled for a future date. These transactions are subject to market fluctuations and are subject to the risk that the value at delivery may be more or less than the trade date purchase price. Although the Fund will generally purchase these securities with the intention of holding the securities, it may sell the securities before the settlement date. Sufficient assets have been segregated for these securities.
e. Income and Deferred Taxes
It is the Fund’s policy to qualify as a regulated investment company under the Internal Revenue Code. The Fund intends to distribute to shareholders substantially all of its taxable income and net realized gains to relieve it from federal income and if applicable, excise taxes. As a result, no provision for U.S. federal income taxes is required.
The Fund may be subject to foreign taxation related to income received, capital gains on the sale of securities and certain foreign currency transactions in the foreign jurisdictions in which it invests. Foreign taxes, if any, are recorded based on the tax regulations and rates that exist in the foreign markets in which the Fund invests. When a capital gain tax is determined to apply, the Fund records an estimated deferred tax liability in an amount that would be payable if the securities were disposed of on the valuation date.
The Fund may recognize an income tax liability related to its uncertain tax positions under U.S. GAAP when the uncertain tax position has a less than 50% probability that it will be sustained upon examination by the tax authorities based on its technical merits. As of December 31, 2016, the Fund has determined that no tax liability is required in its financial statements related to uncertain tax positions for any open tax years (or expected to be taken in future tax years). Open tax years are those that remain subject to examination and are based on each tax jurisdiction’s statute of limitation.
f. Security Transactions, Investment Income, Expenses and Distributions
Security transactions are accounted for on trade date. Realized gains and losses on security transactions are determined on a specific identification basis. Interest income and estimated expenses are accrued daily. Amortization of premium and accretion of discount on debt securities are included in interest income. Dividend income is recorded on the ex-dividend date. Distributions to shareholders are recorded on the ex-dividend date and are determined according to income tax regulations (tax basis). Distributable earnings determined on a tax basis may differ from earnings recorded in accordance with U.S. GAAP. These differences may be permanent or temporary. Permanent differences are reclassified among capital accounts to reflect their tax character. These reclassifications have no impact on net assets or the results of operations. Temporary differences are not reclassified, as they may reverse in subsequent periods.
Common expenses incurred by the Trust are allocated among the Funds based on the ratio of net assets of each Fund to the combined net assets of the Trust. Fund specific expenses are charged directly to the Fund that incurred the expense.
Realized and unrealized gains and losses and net investment income, not including class specific expenses, are allocated daily to each class of shares based upon the relative proportion of net assets of each class. Differences in per share distributions, by class, are generally due to differences in class specific expenses.
g. Accounting Estimates
The preparation of financial statements in accordance with U.S. GAAP requires management to make estimates and assumptions that affect the reported amounts of assets and liabilities at the date of the financial statements and the amounts of income and expenses during the reporting period. Actual results could differ from those estimates.
h. Guarantees and Indemnifications
Under the Trust’s organizational documents, its officers and trustees are indemnified by the Trust against certain liabilities arising out of the performance of their duties to the Trust. Additionally, in the normal course of business, the Trust, on behalf of the Fund, enters into contracts with service providers that contain general indemnification clauses. The Trust’s maximum exposure under these arrangements is unknown as
FRANKLIN TEMPLETON VARIABLE INSURANCE PRODUCTS TRUST
NOTES TO FINANCIAL STATEMENTS
Franklin High Income VIP Fund (continued)
this would involve future claims that may be made against the Trust that have not yet occurred. Currently, the Trust expects the risk of loss to be remote.
2. Shares of Beneficial Interest
At December 31, 2016, there were an unlimited number of shares authorized (without par value). Transactions in the Fund’s shares were as follows:
| | | | | | | | | | | | | | | | | | | | |
| | | Year Ended December 31, | |
| | | 2016 | | | | | | 2015 | |
| | | Shares | | | Amount | | | | | | Shares | | | Amount | |
| | | | | |
| Class 1 Shares: | | | | | | | | | | | | | | | | | | | | |
Shares sold | | | 112,783 | | | $ | 652,747 | | | | | | | | 75,416 | | | $ | 488,620 | |
Shares issued in reinvestment of distributions | | | 336,354 | | | | 1,890,311 | | | | | | | | 345,109 | | | | 2,177,640 | |
Shares redeemed in-kind (Note 11) | | | (4,541,577 | ) | | | (27,588,715 | ) | | | | | | | — | | | | — | |
Shares redeemed | | | (609,738 | ) | | | (3,520,156 | ) | | | | | | | (874,142 | ) | | | (5,563,119 | ) |
| | | | |
Net increase (decrease) | | | (4,702,178 | ) | | $ | (28,565,813 | ) | | | | | | | (453,617 | ) | | $ | (2,896,859 | ) |
| | | | |
| | | | | |
| Class 2 Shares: | | | | | | | | | | | | | | | | | | | | |
Shares sold | | | 11,225,731 | | | $ | 63,325,550 | | | | | | | | 8,301,712 | | | $ | 51,141,411 | |
Shares issued in reinvestment of distributions | | | 2,684,938 | | | | 14,579,216 | | | | | | | | 2,818,239 | | | | 17,219,440 | |
Shares redeemed in-kind (Note 11) | | | (32,646,934 | ) | | | (191,428,559 | ) | | | | | | | — | | | | — | |
Shares redeemed | | | (11,899,974 | ) | | | (66,676,960 | ) | | | | | | | (14,249,319 | ) | | | (86,970,715 | ) |
| | | | |
Net increase (decrease) | | | (30,636,239 | ) | | $ | (180,200,753 | ) | | | | | | | (3,129,368 | ) | | $ | (18,609,864 | ) |
| | | | |
| | | | | |
| Class 4 Shares: | | | | | | | | | | | | | | | | | | | | |
Shares sold | | | 187,202 | | | $ | 1,019,031 | | | | | | | | 185,105 | | | $ | 1,139,732 | |
Shares issued in reinvestment of distributions | | | 275,126 | | | | 1,529,698 | | | | | | | | 256,800 | | | | 1,604,998 | |
Shares redeemed | | | (773,471 | ) | | | (4,510,236 | ) | | | | | | | (474,184 | ) | | | (2,956,892 | ) |
| | | | |
Net increase (decrease) | | | (311,143 | ) | | $ | (1,961,507 | ) | | | | | | | (32,279 | ) | | $ | (212,162 | ) |
| | | | |
3. Transactions with Affiliates
Franklin Resources, Inc. is the holding company for various subsidiaries that together are referred to as Franklin Templeton Investments. Certain officers and trustees of the Fund are also officers and/or directors of the following subsidiaries:
| | |
| Subsidiary | | Affiliation |
Franklin Advisers, Inc. (Advisers) | | Investment manager |
Franklin Templeton Services, LLC (FT Services) | | Administrative manager |
Franklin Templeton Distributors, Inc. (Distributors) | | Principal underwriter |
Franklin Templeton Investor Services, LLC (Investor Services) | | Transfer agent |
FRANKLIN TEMPLETON VARIABLE INSURANCE PRODUCTS TRUST
NOTES TO FINANCIAL STATEMENTS
Franklin High Income VIP Fund (continued)
3. Transactions with Affiliates (continued)
a. Management Fees
The Fund pays an investment management fee to Advisers based on the average daily net assets of the Fund as follows:
| | |
| Annualized Fee Rate | | Net Assets |
0.625% | | Up to and including $100 million |
0.500% | | Over $100 million, up to and including $250 million |
0.450% | | Over $250 million, up to and including $7.5 billion |
0.440% | | Over $7.5 billion, up to and including $10 billion |
0.430% | | Over $10 billion, up to and including $12.5 billion |
0.420% | | Over $12.5 billion, up to and including $15 billion |
0.400% | | In excess of $15 billion |
For the year ended December 31, 2016, the effective investment management fee rate was 0.550% of the Fund’s average daily net assets.
b. Administrative Fees
Under an agreement with Advisers, FT Services provides administrative services to the Fund. The fee is paid by Advisers based on the Fund’s average daily net assets, and is not an additional expense of the Fund.
c. Distribution Fees
The Board has adopted distribution plans for Class 2 and Class 4 shares pursuant to Rule 12b-1 under the 1940 Act. Under the Fund’s compensation distribution plans, the Fund pays Distributors for costs incurred in connection with the servicing, sale and distribution of the Fund’s shares up to 0.35% per year of its average daily net assets of each class. The Board has agreed to limit the current rate to 0.25% per year for Class 2. The plan year, for purposes of monitoring compliance with the maximum annual plan rates, is February 1 through January 31.
d. Transfer Agent Fees
Investor Services, under terms of an agreement, performs shareholder servicing for the Fund and is not paid by the Fund for the services.
e. Waiver and Expense Reimbursements
Effective October 17, 2016, Advisers has contractually agreed in advance to waive or limit its fees and to assume as its own expense certain expenses otherwise payable by the Fund so that the expenses (excluding distribution fees and acquired fund fees and expenses) for each class of the Fund do not exceed 0.66% based on the average net assets of each class (other than certain non-routine expenses or costs, including those relating to litigation, indemnification, reorganizations, and liquidations) until April 30, 2018. Total expenses waived or paid are not subject to recapture subsequent to the Fund’s fiscal year end.
4. Expense Offset Arrangement
The Fund has entered into an arrangement with its custodian whereby credits realized as a result of uninvested cash balances are used to reduce a portion of the Funds’ custodian expenses. During the year ended December 31, 2016, the custodian fees were reduced as noted in the Statement of Operations.
FRANKLIN TEMPLETON VARIABLE INSURANCE PRODUCTS TRUST
NOTES TO FINANCIAL STATEMENTS
Franklin High Income VIP Fund (continued)
5. Income Taxes
For tax purposes, capital losses may be carried over to offset future capital gains. Capital loss carryforwards with no expiration, if any, must be fully utilized before those losses with expiration dates.
At December 31, 2016, the capital loss carryforwards were as follows:
| | | | |
Capital loss carryforwards subject to expiration: | | | | |
2017 | | $ | 10,621,353 | |
Capital loss carryforwards not subject to expiration: | | | | |
Short term | | | — | |
Long term | | | 17,127,527 | |
| | | | |
Total capital loss carryforwards | | $ | 27,748,880 | a |
| | | | |
aSubject to certain limitations under Internal Revenue Code Section 382.
On December 31, 2016, the Fund had expired capital loss carryforwards of $5,148,804, which were reclassified to paid-in capital.
The tax character of distributions paid during the years ended December 31, 2016 and 2015, was as follows:
| | | | | | | | |
| | | 2016 | | | 2015 | |
Distributions paid from ordinary income | | $ | 17,999,225 | | | $ | 21,002,078 | |
| | | | |
At December 31, 2016, the cost of investments, net unrealized appreciation (depreciation) and undistributed ordinary income for income tax purposes were as follows:
| | | | |
Cost of investments | | $ | 70,067,669 | |
| | | | |
Unrealized appreciation | | $ | 1,983,319 | |
Unrealized depreciation | | | (7,731,803 | ) |
| | | | |
Net unrealized appreciation (depreciation) | | $ | (5,748,484 | ) |
| | | | |
Distributable earnings - undistributed ordinary income | | $ | 13,498,838 | |
| | | | |
Differences between income and/or capital gains as determined on a book basis and a tax basis are primarily due to differing treatments of defaulted securities, bond discounts and premiums, wash sales, and losses realized on in-kind shareholder redemptions.
In accordance with U.S. GAAP permanent differences are reclassified among capital accounts to reflect their tax character. At the year ended December 31, 2016, such reclassifications were as follows:
| | | | |
Paid-in capital | | $ | (14,919,592 | ) |
Undistributed net investment income | | $ | 1,721,744 | |
Accumulated net realized gain (loss) | | $ | 13,197,848 | |
6. Investment Transactions
Purchases and sales of investments (excluding short term securities) for the year ended December 31, 2016, aggregated $83,157,403 and $77,688,975, respectively. Sales of investments excludes in-kind transactions of $205,884,291.
FRANKLIN TEMPLETON VARIABLE INSURANCE PRODUCTS TRUST
NOTES TO FINANCIAL STATEMENTS
Franklin High Income VIP Fund (continued)
7. Credit Risk and Defaulted Securities
At December 31, 2016, Fund had 91.8% of its portfolio invested in high yield securities rated below investment grade and unrated securities, if any. These securities may be more sensitive to economic conditions causing greater price volatility and are potentially subject to a greater risk of loss due to default than higher rated securities.
The Fund held a defaulted security and/or other securities for which the income has been deemed uncollectible. At December 31, 2016, the value of this security was $191, representing less than 0.1% of the Fund’s net assets. The Fund discontinues accruing income on securities for which income has been deemed uncollectible and provides an estimate for losses on interest receivable. The security has been identified in the accompanying Statement of Investments.
8. Restricted Securities
The Fund invests in securities that are restricted under the Securities Act of 1933 (1933 Act) or which are subject to legal, contractual, or other agreed upon restrictions on resale. Restricted securities are often purchased in private placement transactions, and cannot be sold without prior registration unless the sale is pursuant to an exemption under the 1933 Act. Disposal of these securities may require greater effort and expense, and prompt sale at an acceptable price may be difficult. The Fund may have registration rights for restricted securities. The issuer generally incurs all registration costs.
At December 31, 2016, the Fund held investments in restricted securities, excluding certain securities exempt from registration under the 1933 Act deemed to be liquid, as follows:
| | | | | | | | | | | | | | | | |
| Shares | | | Issuer | | Acquisition
Dates | | | Cost | | | Value | |
| | 9,233 | | | Goodrich Petroleum Corp. | | | 10/13/16 | | | $ | 81,647 | | | $ | 107,408 | |
| | 117,731 | | | a Halcon Resources Corp. | | | 10/23/12 - 4/08/14 | | | | 3,365,853 | | | | 986,609 | |
| | | | | | | | | | | | |
| | | | Total Restricted Securities (Value is 1.7% of Net Assets) | | | | | | $ | 3,447,500 | | | $ | 1,094,017 | |
| | | | | | | | | | | | |
aThe Fund also invests in unrestricted securities or other investments in the issuer, valued at $21,704 as of December 31, 2016.
9. Upcoming Liquidation
On December 1, 2016, the Board approved a proposal to liquidate the Fund. Effective at the close of market on or about April 21, 2017, the Fund will be closed to new investors and to additional investments from existing shareholders. The Fund is scheduled to liquidate on April 28, 2017, but may be delayed if unforeseen circumstances arise.
10. Credit Facility
The Fund, together with other U.S. registered and foreign investment funds (collectively, Borrowers), managed by Franklin Templeton Investments, are borrowers in a joint syndicated senior unsecured credit facility totaling $2 billion (Global Credit Facility) which matured on February 10, 2017. This Global Credit Facility provides a source of funds to the Borrowers for temporary and emergency purposes, including the ability to meet future unanticipated or unusually large redemption requests. Effective February 10, 2017, the Borrowers renewed the Global Credit Facility for a one year term, maturing February 9, 2018, for a total of $2 billion.
Under the terms of the Global Credit Facility, the Fund shall, in addition to interest charged on any borrowings made by the Fund and other costs incurred by the Fund, pay its share of fees and expenses incurred in connection with the implementation and maintenance of the Global Credit Facility, based upon its relative share of the aggregate net assets of all of the Borrowers, including an annual commitment fee of 0.15% based upon the unused portion of the Global Credit Facility. These fees are reflected in other expenses in the Statement of Operations. During the year ended December 31, 2016, the Fund did not use the Global Credit Facility.
FRANKLIN TEMPLETON VARIABLE INSURANCE PRODUCTS TRUST
NOTES TO FINANCIAL STATEMENTS
Franklin High Income VIP Fund (continued)
11. Redemption In-Kind
During the year ended December 31, 2016, the Fund realized $10,734,357 of net losses resulting from a redemption in-kind in which a shareholder redeemed fund shares for cash and securities held by the Fund. Because such losses are not taxable to the Fund, and are not netted with capital gains that are distributed to remaining shareholders, they have been reclassified from accumulated net realized losses to
paid-in capital.
12. Fair Value Measurements
The Fund follows a fair value hierarchy that distinguishes between market data obtained from independent sources (observable inputs) and the Fund’s own market assumptions (unobservable inputs). These inputs are used in determining the value of the Fund’s financial instruments and are summarized in the following fair value hierarchy:
| | • | | Level 1 – quoted prices in active markets for identical financial instruments |
| | • | | Level 2 – other significant observable inputs (including quoted prices for similar financial instruments, interest rates, prepayment speed, credit risk, etc.) |
| | • | | Level 3 – significant unobservable inputs (including the Fund’s own assumptions in determining the fair value of financial instruments) |
The input levels are not necessarily an indication of the risk or liquidity associated with financial instruments at that level.
For movements between the levels within the fair value hierarchy, the Fund has adopted a policy of recognizing the transfers as of the date of the underlying event which caused the movement.
A summary of inputs used as of December 31, 2016, in valuing the Fund’s assets carried at fair value, is as follows:
| | | | | | | | | | | | | | | | |
| | | Level 1 | | | Level 2 | | | Level 3 | | | Total | |
| Assets: | | | | | | | | | | | | | | | | |
Investments in Securities: | | | | | | | | | | | | | | | | |
Equity Investments:a | | | | | | | | | | | | | | | | |
Energy | | $ | 503,803 | | | $ | — | | | $ | 1,094,017 | b | | $ | 1,597,820 | |
Transportation | | | — | | | | 133,618 | b | | | — | | | | 133,618 | |
All Other Equity Investmentsc | | | 160,076 | | | | — | | | | — | b | | | 160,076 | |
Corporate Bonds | | | — | | | | 58,858,964 | | | | 191 | | | | 58,859,155 | |
Escrows and Litigation Trusts | | | — | | | | 62,082 | | | | 59,000 | b | | | 121,082 | |
Short Term Investments | | | — | | | | 3,447,434 | | | | — | | | | 3,447,434 | |
| | | | |
Total Investments in Securities | | $ | 663,879 | | | $ | 62,502,098 | | | $ | 1,153,208 | | | $ | 64,319,185 | |
| | | | |
aIncludes common and convertible preferred stocks as well as other equity investments.
bIncludes securities determined to have no value at December 31, 2016.
cFor detailed categories, see the accompanying Statement of Investments.
FRANKLIN TEMPLETON VARIABLE INSURANCE PRODUCTS TRUST
NOTES TO FINANCIAL STATEMENTS
Franklin High Income VIP Fund (continued)
A reconciliation of assets in which Level 3 inputs are used in determining fair value is presented when there are significant Level 3 financial instruments at the end of the year. At December 31, 2016, the reconciliation of assets, is as follows:
| | | | | | | | | | | | | | | | | | | | | | | | | | | | | | | | | | | | | | | | |
| | |
| Balance at
Beginning of
Year |
| | | Purchases | | | | Sales | | |
| Transfers Into
Level 3 |
a | |
| Transfers
out of Level 3 |
b | |
| Cost Basis
Adjustments |
| |
| Net
Realized Gain (Loss) |
| |
| Net
Unrealized Appreciation
(Depreciation) |
| |
| Balance
at End of Year |
| |
| Net Change in
Unrealized
Appreciation
(Depreciation)
on Assets
Held at
Year End |
|
| Assets: | | | | | | | | | | | | | | | | | | | | | | | | | | | | | | | | | | | | | | | | |
| Investments in Securities: | | | | | | | | | | | | | | | | | | | | | | | | | | | | | | | | | | | | | | | | |
Equity Investments: | | | | | | | | | | | | | | | | | | | | | | | | | | | | | | | | | | | | | | | | |
Energy | | $ | — | | | $ | — | | | $ | (282,020 | ) | | $ | 1,483,984 | c | | $ | — | | | $ | — | | | $ | — | | | $ | (107,947 | ) | | $ | 1,094,017 | c | | $ | (107,947 | ) |
Corporate Bonds | | | 453,991 | | | | — | | | | (57,745 | ) | | | — | | | | (363,668 | ) | | | — | | | | (2,335,251 | ) | | | 2,302,864 | | | | 191 | | | | — | |
Escrows and Litigation Trusts | | | — | c | | | — | | | | — | | | | 61,000 | c | | | — | | | | — | | | | — | | | | (2,000 | ) | | | 59,000 | c | | | (2,000 | ) |
| | | | |
Total Investments in Securities | | $ | 453,991 | | | $ | — | | | $ | (339,765 | ) | | $ | 1,544,984 | | | $ | (363,668 | ) | | $ | — | | | $ | (2,335,251 | ) | | $ | 2,192,917 | | | $ | 1,153,208 | | | $ | (109,947 | ) |
| | | | |
aThe investments were transferred into Level 3 as a result of their value being determined using a significant unobservable input. May include amounts related to a corporate action.
bThe investments were transferred out of Level 3 as a result of the removal of a significant unobservable valuation input. May include amounts related to a corporate action.
cIncludes securities determined to have no value.
Significant unobservable valuation inputs developed by the VC for material Level 3 financial instruments and impact to fair value as a result of changes in unobservable valuation inputs as of December 31, 2016, are as follows:
| | | | | | | | | | | | | | | | |
| Description | |
| Fair Value at
End of Year |
| | Valuation
Technique | | Unobservable Input | | | Amount | | |
| Impact to Fair
Value if Input
Increases |
a |
| Assets: | | | | | | | | | | | | | | | | |
| | | | | |
Investments in Securities: | | | | | | | | | | | | | | | | |
| | | | | |
Equity Investments: | | | | | | | | | | | | | | | | |
| | | | | |
Energy | | $ | 1,094,017 | | | Market Comparables | | Discount for lack of marketability | | | 6.2% - 10.3% | | | | Decrease | b |
| | | | | |
All other investmentsc | | | 59,191 | | | | | | | | | | | | | |
| | | | | |
Total | | $ | 1,153,208 | | | | | | | | | | | | | |
aRepresents the directional change in the fair value of the Level 3 financial instruments that would result from a significant and reasonable increase in the corresponding input. A significant and reasonable decrease in the input would have the opposite effect. Significant impacts, if any, to fair value and/or net assets have been indicated.
b Represents a significant impact to fair value of the investment but not net assets.
cIncludes fair value of immaterial investments developed using various valuation techniques and unobservable inputs. May also include investments with values derived using prior transaction prices or third party pricing information without adjustment for which such inputs are also unobservable.
FRANKLIN TEMPLETON VARIABLE INSURANCE PRODUCTS TRUST
NOTES TO FINANCIAL STATEMENTS
Franklin High Income VIP Fund (continued)
13. Investment Company Reporting Modernization
In October 2016, the U.S. Securities and Exchange Commission adopted new rules and amended existing rules (together, final rules) intended to modernize the reporting and disclosure of information by registered investment companies. In part, the final rules amend Regulation S-X and require standardized, enhanced disclosures about derivatives in investment company financial statements, as well as other amendments. The compliance date for the amendments to Regulation S-X is August 1, 2017. Management is currently evaluating the impact that the adoption of the amendments to Regulation S-X will have on the Fund’s financial statements and related disclosures.
14. Subsequent Events
The Fund has evaluated subsequent events through the issuance of the financial statements and determined that no events have occurred that require disclosure other than those already disclosed in the financial statements.
Abbreviations
| | |
| Selected Portfolio |
| |
| FRN | | Floating Rate Note |
| |
| PIK | | Payment-In-Kind |
| |
| TRA | | Tax Receivable Agreement Right |
FRANKLIN TEMPLETON VARIABLE INSURANCE PRODUCTS TRUST
Report of Independent Registered Public Accounting Firm
Franklin High Income VIP Fund
To the Board of Trustees and Shareholders of Franklin Templeton Variable Insurance Products Trust
In our opinion, the accompanying statement of assets and liabilities, including the statement of investments, and the related statements of operations and of changes in net assets and the financial highlights present fairly, in all material respects, the financial position of Franklin High Income VIP Fund (the “Fund”) as of December 31, 2016, the results of its operations for the year then ended, the changes in its net assets for each of the two years in the period then ended and the financial highlights for the periods presented, in conformity with accounting principles generally accepted in the United States of America. These financial statements and financial highlights (hereafter referred to as “financial statements”) are the responsibility of the Fund’s management. Our responsibility is to express an opinion on these financial statements based on our audits. We conducted our audits of these financial statements in accordance with the standards of the Public Company Accounting Oversight Board (United States). Those standards require that we plan and perform the audit to obtain reasonable assurance about whether the financial statements are free of material misstatement. An audit includes examining, on a test basis, evidence supporting the amounts and disclosures in the financial statements, assessing the accounting principles used and significant estimates made by management, and evaluating the overall financial statement presentation. We believe that our audits, which included confirmation of securities as of December 31, 2016 by correspondence with the custodian and brokers, provides a reasonable basis for our opinion.
As discussed in Note 9, the Investment Manager is in the process of completing the liquidation of the Fund, after which the Fund will cease all operations. Our opinion is not modified with respect to this matter.
PricewaterhouseCoopers LLP
San Francisco, California
February 15, 2017
Franklin Income VIP Fund
We are pleased to bring you Franklin Income VIP Fund’s annual report for the fiscal year ended December 31, 2016.
Class 2 Performance Summary as of December 31, 2016
Average annual total return of Class 2 shares* represents the average annual change in value, assuming reinvestment of dividends and capital gains. Average returns smooth out variations in returns, which can be significant; they are not the same as year-by-year results.
| | | | | | | | | | | | |
| Periods ended 12/31/16 | | 1-Year | | | 5-Year | | | 10-Year | |
Average Annual Total Return | | | +14.02% | | | | +7.31% | | | | +4.97% | |
*The Fund has a fee waiver associated with any investment it makes in a Franklin Templeton money fund and/or other Franklin Templeton fund, contractually guaranteed through its current fiscal year-end. Fund investment results reflect the fee waiver; without this waiver, the results would have been lower.
Performance reflects the Fund’s Class 2 operating expenses, but does not include any contract fees, expenses or sales charges. If they had been included, performance would be lower. These charges and deductions, particularly for variable life policies, can have a significant effect on contract values and insurance benefits. See the contract prospectus for a complete description of these expenses, including sales charges.
Performance data represent past performance, which does not guarantee future results. Investment return and principal value will fluctuate, and you may have a gain or loss when you sell your shares. Current performance may differ from figures shown.
Total Return Index Comparison for a Hypothetical $10,000 Investment (1/1/07–12/31/16)
The graph below shows the change in value of a hypothetical $10,000 investment in the Fund over the indicated period and includes reinvestment of any income or distributions. The Fund’s performance* is compared to the performance of the Standard & Poor’s® 500 Index (S&P 500®) and the Bloomberg Barclays U.S. Aggregate Bond Index. One cannot invest directly in an index, and an index is not representative of the Fund’s portfolio. Please see Important Notes to Performance Information preceding the Fund Summaries.
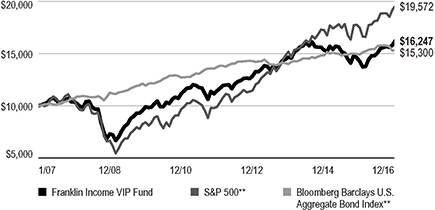
*Source: Morningstar. Please see Index Descriptions following the Fund Summaries.
FRANKLIN INCOME VIP FUND
Fund Goal and Main Investments
The Fund seeks to maximize income while maintaining prospects for capital appreciation. Under normal market conditions, the Fund invests in both equity and debt securities.
Fund Risks
All investments involve risks, including possible loss of principal. Stock prices fluctuate, sometimes rapidly and dramatically, due to factors affecting individual companies, particular industries or sectors, or general market conditions. The Fund’s share price and yield will be affected by interest rate movements. Bond prices generally move in the opposite direction of interest rates. Thus, as prices of bonds in the Fund adjust to a rise in interest rates, the Fund’s share price may decline. Changes in the financial strength of a bond issuer or in a bond’s credit rating may affect its value. The Fund’s portfolio includes a substantial portion of higher yielding, lower rated corporate bonds because of the relatively higher yields they offer. Floating rate loans are lower rated, higher yielding instruments, which are subject to increased risk of default and can potentially result in loss of principal. These securities carry a greater degree of credit risk relative to investment-grade securities. The Fund is actively managed but there is no guarantee that the manager’s investment decisions will produce the desired results. The Fund’s prospectus also includes a description of the main investment risks.
Performance Overview
You can find the Fund’s one-year total return in the Performance Summary. For comparison, the Fund’s equity benchmark, the S&P 500, posted a +11.96% total return, and its fixed income benchmark, the Bloomberg Barclays U.S. Aggregate Index, produced a +2.65% total return for the same period.1
Economic and Market Overview
The U.S. economy expanded during the 12 months under review. The economy grew at a faster pace in 2016’s third quarter than in the second and first quarters, mainly due to personal consumption expenditures, exports, private inventory investment, federal government spending and nonresidential fixed investment. Manufacturing conditions remained volatile but generally expanded, and the services sector also continued
| | | | |
Portfolio Composition 12/31/16 | | | |
| | | % of Total
Net Assets | |
| Equity* | | | 59.1% | |
| Energy | | | 9.9% | |
| Information Technology | | | 8.4% | |
| Financials | | | 7.6% | |
| Utilities | | | 7.4% | |
| Health Care | | | 6.2% | |
| Industrials | | | 5.9% | |
| Consumer Discretionary | | | 4.5% | |
| Materials | | | 3.9% | |
| Consumer Staples | | | 3.3% | |
| Telecommunication Services | | | 1.5% | |
| Real Estate | | | 0.5% | |
| Fixed Income | | | 35.2% | |
| Energy | | | 6.7% | |
| Health Care | | | 6.2% | |
| Consumer Discretionary | | | 5.0% | |
| Financials | | | 3.8% | |
| Information Technology | | | 3.4% | |
| Telecommunication Services | | | 3.1% | |
| Utilities | | | 2.6% | |
| Industrials | | | 2.3% | |
| Materials | | | 1.7% | |
| Consumer Staples | | | 0.3% | |
| Real Estate | | | 0.1% | |
| Short-Term Investments & Other Net Assets | | | 5.7% | |
* Includes convertible bonds.
to grow for most of the period. The unemployment rate decreased from 5.0% in December 2015 to 4.7% at period-end.2 Monthly retail sales grew for most of the review period, and rose to its highest level in April in more than a year, due to a broad-based increase across most retail categories. Inflation, as measured by the Consumer Price Index, remained relatively subdued for most of the period, but rose in 2016’s fourth quarter.
After maintaining its target interest rate in the 0.25%–0.50% range for nearly a year, the U.S. Federal Reserve (Fed), at its December meeting, increased its target range for the federal funds rate to 0.50%–0.75%, as policymakers noted improvement in U.S. labor market and inflation. The Federal
1. Source: Morningstar. One cannot invest directly in an index, and an index is not representative of the Fund’s portfolio. Please see Index Descriptions following the Fund Summaries.
2. Source: Bureau of Labor Statistics.
The dollar value, number of shares or principal amount, and names of all portfolio holdings are listed in the Fund’s Statement of Investments (SOI).
FRANKLIN INCOME VIP FUND
Open Market Committee also hinted at three additional hikes in 2017. Furthermore, the Fed raised its forecast for 2017 U.S. economic growth, and lowered its unemployment projections.
U.S. equity markets rose during the review period, benefiting from mostly upbeat economic data and better corporate earnings in the U.S., signs of improvement in the Chinese and European economies and ongoing expansionary monetary policies from key central banks. Other contributing factors included investors’ expectations of higher interest rates and inflation in the U.S. driven by hopes of expansionary fiscal policies under the new president Donald Trump, and an Organization of the Petroleum Exporting Countries deal to curb oil production. The Fed’s decision to keep interest rates unchanged at its November meeting further boosted investor confidence. However, the U.K.’s historic vote to leave the European Union (also known as “Brexit”) and global growth concerns weighed on market sentiment. The broad U.S. stock market ended the 12-month period higher, as measured by the S&P 500.
The 10-year U.S. Treasury yield, which moves inversely to price, ended the period slightly higher than where it started and shifted significantly during the period. At the beginning of the period, negative global interest rates, continued accommodative central bank policies and a general risk-averse sentiment boosted safe haven buying by investors. These factors drove the 10-year yield to a period low of 1.37% in early July, down from 2.27% on December 31, 2015. Near period-end, rates moved higher based on improved economic data, expectations for the Fed to raise interest rates at its December 2016 meeting and a sentiment shift among investors that held that possible expansionary fiscal policies under the new U.S. president Donald Trump could lead to a stronger economy and higher inflation.
Investment Strategy
We search for undervalued or out-of-favor securities we believe offer opportunities for income today and growth tomorrow. We generally perform independent analysis of the debt securities being considered for the Fund’s portfolio, rather than relying principally on ratings assigned by rating agencies. In analyzing debt and equity securities, we consider a variety of factors, including: a security’s relative value based on such factors as anticipated cash flow, interest or dividend coverage, asset coverage, and earnings prospects; the experience and strength of a company’s management; a company’s sensitivity to changes in interest rates and business conditions; a company’s debt maturity schedules and borrowing requirements; and a
company’s changing financial condition and market recognition of the change.
Manager’s Discussion
During the fiscal year, we shifted the Fund’s asset mix after finding what we considered attractive opportunities in the fixed income sector, while realizing gains in our equity positions. We strategically reduced our equity weighting from 62.7% to 59.1%, and increased our fixed income weighting from 24.2% to 35.2%. Our cash position fell from 13.1% to 5.7% of total net assets.
The equity energy sector was a significant contributor to Fund results. Royal Dutch Shell, Chevron and BP generated attractive gains in the energy sector, supported in large part by the robust recovery in crude oil prices that built momentum in 2016 and culminated in a renewed effort by major oil producers to limit production gains and better balance global supply demand. Importantly, all three companies aggressively pursued self-help measures that emphasized reductions in upstream capital investment and select non-core asset sales. We believe these actions proved critical in enabling these companies to navigate the severe decline in oil prices and sustain attractive dividends for shareholders. At period-end, dividend coverage appeared more sustainable to us as a result.
Information technology was another equity contributor during the period, and our positions in Microsoft and an equity-linked note of Texas Instruments were meaningful contributors. Strong demand for semiconductors and integrated circuits across a range of important end markets, including personal computers, smartphones, automotive applications and a growing list of consumer devices, helped Texas Instruments deliver several quarters of improving revenues, operating profit and earnings. Microsoft benefited from the rollout of Office 365 and strong growth in its cloud computing platform. A mid-year selloff in the company’s shares presented what we considered an attractive opportunity to add to holdings to try to take advantage of what we viewed as an improving long-term growth outlook, attractive dividend yield and valuation discount to the broader equity market. In addition to the strong price appreciation, these companies delivered robust dividend growth during the year.
Utility sector equity holdings favorably impacted performance in the first half of the year. With valuations elevated, in our view, relative to many other sectors offering attractive dividend yields, we reduced holdings and had a lower weighting in the sector than we have had historically.
FRANKLIN INCOME VIP FUND
Top Five Equity Holdings
12/31/16
| | | | |
Company Sector/Industry | | % of Total
Net Assets | |
Royal Dutch Shell PLC Energy | | | 2.7% | |
General Electric Co. Industrials | | | 2.1% | |
Chevron Corp. Energy | | | 2.0% | |
Wells Fargo & Co. Banks | | | 1.8% | |
Apple Inc. Information Technology | | | 1.8% | |
In contrast, the equity health care and consumer staples sectors were major detractors during the period. The sectors sold off sharply following the market’s significant sector rotation from defensive, stable sectors to more cyclical sectors following the U.S. presidential election outcome.
The primary detractors among equity health care holdings included major and specialty pharmaceutical manufacturers, which continued to experience backlash from select inquiries into industry pricing policies. We believe in general the major drug manufacturers deliver significant value to the overall health care system through improved outcomes and reduced treatment times and hospital stays. Holdings including Eli Lilly & Company, AstraZeneca, Roche Holding and convertible preferred securities of Teva Pharmaceutical Industries and Allergan detracted from performance during the period.
Among fixed income holdings, the communications sector3 was a major contributor. Telecommunications provider Sprint Capital’s bonds advanced as key operating metrics improved and the company took significant steps to raise capital to fund expenditures to improve its wireless networks capability and services. Media and entertainment company iHeartCommunications benefited from stable trends in its core media and radio businesses, while also making progress in dealing with its substantial debt load and upcoming maturities.
Fixed income energy4 sector investments generally experienced strong returns over the course of the year as oil and gas prices moved higher after bottoming in the first quarter of 2016. Holdings of exploration and production companies including Chesapeake Energy, Bill Barrett and Sanchez Energy delivered
Top Five Fixed Income Holdings and Senior Floating Rate Interests Holdings*
12/31/16
| | | | |
Company Sector/Industry | | % of Total
Net Assets | |
DISH DBS Corp. Consumer Discretionary | | | 1.6% | |
CHS/Community Health Systems Inc. Health Care | | | 1.6% | |
Chesapeake Energy Corp. Energy | | | 1.4% | |
Weatherford International Ltd. Energy | | | 1.4% | |
Tenet Healthcare Corp. Health Care | | | 1.3% | |
*Does not include convertible bonds.
The dollar value, number of shares or principal amount, and names of all portfolio holdings are listed in the Fund’s Statement of Investments (SOI).
attractive income and generated strong price gains for the period. In addition to the increase in oil and gas prices, each of the companies took significant steps to improve liquidity and right size their balance sheets to a more uncertain price environment.
The only fixed income sector that hurt performance was consumer non-cyclical.5 Hospital manager and operator CHS/Community Health Systems was a major detractor.
The fixed income energy sector delivered strong results during the period; however, oil and natural gas companies Linn Energy,6 California Resources6 and Energy XXI Gulf Coast6 notably detracted. Natural gas exploration company Sandridge Energy6 also hampered returns.
Thank you for your participation in Franklin Income VIP Fund. We look forward to serving your future investment needs.
3. Communications holdings are in consumer discretionary and telecommunication services in the fixed income section of the SOI.
4. Energy holdings are in energy and utilities in the fixed income section of the SOI.
5. Consumer non-cyclical holdings are in consumer staples and health care in the fixed income section of the SOI.
6. Not held at period-end.
FRANKLIN INCOME VIP FUND
The foregoing information reflects our analysis, opinions and portfolio holdings as of December 31, 2016, the end of the reporting period. The way we implement our main investment strategies and the resulting portfolio holdings may change depending on factors such as market and economic conditions. These opinions may not be relied upon as investment advice or an offer for a particular security. The information is not a complete analysis of every aspect of any market, country, industry, security or the Fund. Statements of fact are from sources considered reliable, but the investment manager makes no representation or warranty as to their completeness or accuracy. Although historical performance is no guarantee of future results, these insights may help you understand our investment management philosophy.
FRANKLIN INCOME VIP FUND
Class 2 Fund Expenses
As an investor in a variable insurance contract (Contract) that indirectly provides for investment in an underlying mutual fund, you can incur transaction and/or ongoing expenses at both the Fund level and the Contract Level: (1) transaction expenses can include sales charges (loads) on purchases, surrender fees, transfer fees and premium taxes; and (2) ongoing expenses can include management fees, distribution and service (12b-1) fees, contract fees, annual maintenance fees, mortality and expense risk fees and other fees and expenses. All mutual funds and Contracts have some types of ongoing expenses. The table below shows Fund-level ongoing expenses and can help you understand these costs and compare them with those of other mutual funds offered through the Contract. The table assumes a $1,000 investment held for the six months indicated. Please refer to the Fund prospectus for additional information on operating expenses.
Actual Fund Expenses
The table below provides information about the actual account values and actual expenses in the columns under the heading “Actual.” In these columns the Fund’s actual return, which includes the effect of ongoing Fund expenses but does not include the effect of ongoing Contract expenses, is used to calculate the “Ending Account Value.”
You can estimate the Fund-level expenses you paid during the period by following these steps (of course, your account value and expenses will differ from those in this illustration):
| | Divide your account value by $1,000
(if your account had an $8,600 value,
then $8,600 ÷ $1,000 = 8.6). |
| | Then multiply the result by the number under the headings “Actual” and “Fund-Level Expenses Paid During Period”
(if Fund-Level Expenses Paid During Period were $7.50,
then 8.6 x $7.50 = $64.50). |
In this illustration, the estimated expenses paid this period at the Fund level are $64.50.
Hypothetical Example for Comparison with Other Mutual Funds
Under the heading “Hypothetical” in the table, information is provided about hypothetical account values and hypothetical expenses based on the Fund’s actual expense ratio and an assumed rate of return of 5% per year before expenses, which is not the Fund’s actual return. This information may not be used to estimate the actual ending account balance or expenses you paid for the period, but it can help you compare ongoing costs of investing in the Fund with those of other mutual funds offered through the Contract. To do so, compare this 5% hypothetical example with the 5% hypothetical examples that appear in the shareholder reports of other funds offered through the Contract.
Please note that expenses shown in the table are meant to highlight ongoing costs at the Fund level only and do not reflect any ongoing expenses at the Contract level, or transaction expenses at either the Fund or Contract levels. In addition, while the Fund does not have transaction expenses, if the transaction and ongoing expenses at the Contract level were included, the expenses shown below would be higher. You should consult your Contract prospectus or disclosure document for more information.
| | | | | | | | | | | | | | | | | | | | | | | | |
| | | | | | Actual
(actual return after expenses) | | | Hypothetical
(5% annual return before expenses) | | | | |
| Share Class | |
| Beginning Account
Value 7/1/16 |
| |
| Ending Account
Value 12/31/16 |
| |
| Fund-Level
Expenses Paid
During Period
7/1/16–12/31/16 |
1,2 | |
| Ending Account
Value 12/31/16 |
| |
| Fund-Level
Expenses Paid
During Period
7/1/16–12/31/16 |
1,2 | |
| Net
Annualized
Expense
Ratio |
2 |
Class 2 | | | $1,000 | | | | $1,079.30 | | | | $3.61 | | | | $1,021.67 | | | | $3.51 | | | | 0.69% | |
1. Expenses are equal to the annualized expense ratio for the six-month period as indicated above—in the far right column—multiplied by the simple average account value over the period indicated, and then multiplied by 184/366 to reflect the one-half year period.
2. Reflects expenses after fee waivers and expense reimbursements. Does not include any ongoing expenses of the Contract for which the Fund is an investment option or acquired fund fees and expenses.
VIP3 P1_P2_P4 09/16
SUPPLEMENT DATED SEPTEMBER 28, 2016
TO THE PROSPECTUSES
DATED MAY 1, 2016
OF
FRANKLIN GLOBAL REAL ESTATE VIP FUND
FRANKLIN INCOME VIP FUND
FRANKLIN MUTUAL GLOBAL DISCOVERY VIP FUND
FRANKLIN MUTUAL SHARES VIP FUND
TEMPLETON FOREIGN VIP FUND
TEMPLETON GROWTH VIP FUND
(Series of Franklin Templeton Variable Insurance Products Trust)
The Prospectus is amended as follows:
I. For the Franklin Mutual Global Discovery VIP Fund, Templeton Foreign VIP Fund and Templeton Growth VIP Fund, the following is added to the “Fund Summary – Principal Risks” section:
Regional Focus Because the Fund may invest at least a significant portion of its assets in companies in a specific region, including Europe, the Fund is subject to greater risks of adverse developments in that region and/or the surrounding regions than a fund that is more broadly diversified geographically. Political, social or economic disruptions in the region, even in countries in which the Fund is not invested, may adversely affect the value of securities values held by the Fund. Current political uncertainty surrounding the European Union (EU) and its membership, including the 2016 referendum in which the United Kingdom voted to exit the EU, may increase market volatility. The financial instability of some countries in the EU, including Greece, Italy and Spain, together with the risk of that impacting other more stable countries may increase the economic risk of investing in companies in Europe.
II. For all funds (excluding the Franklin Mutual Global Discovery VIP Fund and Franklin Mutual Shares VIP Fund), the “Fund Details – Principal Risks – Foreign Securities” section is revised to add the following as a second paragraph to the “Regional” sub-section:
The risk of investments in Europe may be heightened due to the 2016 referendum in which the United Kingdom voted to exit the European Union (EU). Political, economic and legal uncertainty may cause increased market volatility. In addition, if one or more countries were to exit the EU or abandon the use of the Euro as a currency, the value of investments associated with those countries or the Euro could decline significantly and unpredictably and it would likely cause additional market disruption globally and introduce new legal and regulatory uncertainties.
III. For the Franklin Mutual Global Discovery VIP Fund and Franklin Mutual Shares VIP Fund, the “Fund Details – Principal Risks – Foreign Securities” section is revised to add the following:
Regional. Adverse conditions in a certain region or country can adversely affect securities of issuers in other countries whose economies appear to be unrelated. To the extent that the Fund invests a significant portion of its assets in a specific geographic region or a particular country, the Fund will generally have more exposure to the specific regional or country economic risks. In the event of economic or political turmoil or a deterioration of diplomatic relations in a region or country where a substantial portion of the Fund’s assets are invested, the Fund may experience substantial illiquidity or reduction in the value of the Fund’s investments.
The risk of investments in Europe may be heightened due to the 2016 referendum in which the United Kingdom voted to exit the European Union (EU). Political, economic and legal uncertainty may cause increased market volatility. In addition, if one or more countries were to exit the EU or abandon the use of the Euro as a currency, the value of investments associated with those countries or the Euro could decline significantly and unpredictably and it would likely cause additional market disruption globally and introduce new legal and regulatory uncertainties.
Please keep this supplement with your prospectus for future reference.
FRANKLIN TEMPLETON VARIABLE INSURANCE PRODUCTS TRUST
Financial Highlights
Franklin Income VIP Fund
| | | | | | | | | | | | | | | | | | | | |
| | | Year Ended December 31, | |
| | | 2016 | | | 2015 | | | 2014 | | | 2013 | | | 2012 | |
| Class 1 | | | | | | | | | | | | | | | | | | | | |
Per share operating performance (for a share outstanding throughout the year) | | | | | | | | | | | | | | | | | | | | |
| | | | | |
Net asset value, beginning of year | | | $14.64 | | | | $16.48 | | | | $16.53 | | | | $15.47 | | | | $14.68 | |
| | | | |
| | | | | |
| Income from investment operationsa: | | | | | | | | | | | | | | | | | | | | |
| | | | | |
Net investment incomeb | | | 0.67 | | | | 0.71 | | | | 0.72 | | | | 0.81 | | | | 0.91 | |
| | | | | |
Net realized and unrealized gains (losses) | | | 1.34 | | | | (1.78 | ) | | | 0.11 | | | | 1.31 | | | | 0.90 | |
| | | | |
Total from investment operations | | | 2.01 | | | | (1.07 | ) | | | 0.83 | | | | 2.12 | | | | 1.81 | |
| | | | |
Less distributions from net investment income | | | (0.78 | ) | | | (0.77 | ) | | | (0.88 | ) | | | (1.06 | ) | | | (1.02 | ) |
| | | | |
Net asset value, end of year | | | $15.87 | | | | $14.64 | | | | $16.48 | | | | $16.53 | | | | $15.47 | |
| | | | |
| | | | | |
Total returnc | | | 14.33% | | | | (6.84)% | | | | 4.92% | | | | 14.18% | | | | 12.91% | |
| | | | | |
| Ratios to average net assets | | | | | | | | | | | | | | | | | | | | |
| | | | | |
Expenses before waiver and payments by affiliates | | | 0.47% | | | | 0.46% | | | | 0.47% | | | | 0.47% | | | | 0.47% | |
| | | | | |
Expenses net of waiver and payments by affiliates | | | 0.44% | d | | | 0.46% | d,e | | | 0.47% | d | | | 0.47% | d | | | 0.47% | |
| | | | | |
Net investment income | | | 4.47% | | | | 4.47% | | | | 4.26% | | | | 5.07% | | | | 6.03% | |
| | | | | |
| Supplemental data | | | | | | | | | | | | | | | | | | | | |
| | | | | |
Net assets, end of year (000’s) | | | $696,227 | | | | $604,228 | | | | $714,664 | | | | $695,004 | | | | $584,391 | |
| | | | | |
Portfolio turnover rate | | | 39.03% | | | | 31.53% | | | | 24.77% | | | | 21.71% | | | | 26.66% | f |
aThe amount shown for a share outstanding throughout the period may not correlate with the Statement of Operations for the period due to the timing of sales and repurchases of the Fund’s shares in relation to income earned and/or fluctuating fair value of the investments of the Fund.
bBased on average daily shares outstanding.
cTotal return does not include fees, charges or expenses imposed by the variable annuity and life insurance contracts for which Franklin Templeton Variable Insurance Products Trust serves as an underlying investment vehicle.
dBenefit of expense reduction rounds to less than 0.01%.
eBenefit of waiver and payments by affiliates rounds to less than 0.01%.
fExcludes the value of portfolio securities delivered as a result of a redemption in-kind.
| | | | |
| FI-8 | | Annual Report | The accompanying notes are an integral part of these financial statements. | | |
FRANKLIN TEMPLETON VARIABLE INSURANCE PRODUCTS TRUST
FINANCIAL HIGHLIGHTS
Franklin Income VIP Fund (continued)
| | | | | | | | | | | | | | | | | | | | |
| | | Year Ended December 31, | |
| | | 2016 | | | 2015 | | | 2014 | | | 2013 | | | 2012 | |
| Class 2 | | | | | | | | | | | | | | | | | | | | |
Per share operating performance (for a share outstanding throughout the year) | | | | | | | | | | | | | | | | | | | | |
| | | | | |
Net asset value, beginning of year | | | $14.20 | | | | $16.00 | | | | $16.07 | | | | $15.07 | | | | $14.32 | |
| | | | |
| | | | | |
| Income from investment operationsa: | | | | | | | | | | | | | | | | | | | | |
| | | | | |
Net investment incomeb | | | 0.61 | | | | 0.65 | | | | 0.66 | | | | 0.75 | | | | 0.85 | |
| | | | | |
Net realized and unrealized gains (losses) | | | 1.31 | | | | (1.73 | ) | | | 0.11 | | | | 1.27 | | | | 0.88 | |
| | | | |
Total from investment operations | | | 1.92 | | | | (1.08 | ) | | | 0.77 | | | | 2.02 | | | | 1.73 | |
| | | | |
Less distributions from net investment income | | | (0.74 | ) | | | (0.72 | ) | | | (0.84 | ) | | | (1.02 | ) | | | (0.98 | ) |
| | | | |
Net asset value, end of year | | | $15.38 | | | | $14.20 | | | | $16.00 | | | | $16.07 | | | | $15.07 | |
| | | | |
| | | | | |
Total returnc | | | 14.02% | | | | (7.05)% | | | | 4.62% | | | | 13.94% | | | | 12.65% | |
| | | | | |
| Ratios to average net assets | | | | | | | | | | | | | | | | | | | | |
| | | | | |
Expenses before waiver and payments by affiliates | | | 0.72% | | | | 0.71% | | | | 0.72% | | | | 0.72% | | | | 0.72% | |
| | | | | |
Expenses net of waiver and payments by affiliates | | | 0.69% | d | | | 0.71% | d,e | | | 0.72% | d | | | 0.72% | d | | | 0.72% | |
| | | | | |
Net investment income | | | 4.22% | | | | 4.22% | | | | 4.01% | | | | 4.82% | | | | 5.78% | |
| | | | | |
| Supplemental data | | | | | | | | | | | | | | | | | | | | |
| | | | | |
Net assets, end of year (000’s) | | | $5,088,556 | | | | $4,907,599 | | | | $6,022,804 | | | | $6,188,045 | | | | $6,182,997 | |
| | | | | |
Portfolio turnover rate | | | 39.03% | | | | 31.53% | | | | 24.77% | | | | 21.71% | | | | 26.66%f | |
aThe amount shown for a share outstanding throughout the period may not correlate with the Statement of Operations for the period due to the timing of sales and repurchases of the Fund’s shares in relation to income earned and/or fluctuating fair value of the investments of the Fund.
bBased on average daily shares outstanding.
cTotal return does not include fees, charges or expenses imposed by the variable annuity and life insurance contracts for which Franklin Templeton Variable Insurance Products Trust serves as an underlying investment vehicle.
dBenefit of expense reduction rounds to less than 0.01%.
eBenefit of waiver and payments by affiliates rounds to less than 0.01%.
fExcludes the value of portfolio securities delivered as a result of a redemption in-kind.
| | | | | | |
| | | The accompanying notes are an integral part of these financial statements. | Annual Report | | | FI-9 | |
FRANKLIN TEMPLETON VARIABLE INSURANCE PRODUCTS TRUST
FINANCIAL HIGHLIGHTS
Franklin Income VIP Fund (continued)
| | | | | | | | | | | | | | | | | | | | |
| | | Year Ended December 31, | |
| | | 2016 | | | 2015 | | | 2014 | | | 2013 | | | 2012 | |
| Class 4 | | | | | | | | | | | | | | | | | | | | |
Per share operating performance (for a share outstanding throughout the year) | | | | | | | | | | | | | | | | | | | | |
| | | | | |
Net asset value, beginning of year | | | $14.49 | | | | $16.31 | | | | $16.36 | | | | $15.32 | | | | $14.54 | |
| | | | |
| | | | | |
| Income from investment operationsa: | | | | | | | | | | | | | | | | | | | | |
| | | | | |
Net investment incomeb | | | 0.61 | | | | 0.65 | | | | 0.66 | | | | 0.75 | | | | 0.85 | |
| | | | | |
Net realized and unrealized gains (losses) | | | 1.33 | | | | (1.76 | ) | | | 0.11 | | | | 1.30 | | | | 0.90 | |
| | | | |
Total from investment operations | | | 1.94 | | | | (1.11 | ) | | | 0.77 | | | | 2.05 | | | | 1.75 | |
| | | | |
Less distributions from net investment income | | | (0.72 | ) | | | (0.71 | ) | | | (0.82 | ) | | | (1.01 | ) | | | (0.97 | ) |
| | | | |
Net asset value, end of year | | | $15.71 | | | | $14.49 | | | | $16.31 | | | | $16.36 | | | | $15.32 | |
| | | | |
| | | | | |
Total returnc | | | 13.87% | | | | (7.15)% | | | | 4.52% | | | | 13.85% | | | | 12.56% | |
| | | | | |
| Ratios to average net assets | | | | | | | | | | | | | | | | | | | | |
| | | | | |
Expenses before waiver and payments by affiliates | | | 0.82% | | | | 0.81% | | | | 0.82% | | | | 0.82% | | | | 0.82% | |
| | | | | |
Expenses net of waiver and payments by affiliates | | | 0.79% | d | | | 0.81% | d,e | | | 0.82% | d | | | 0.82% | d | | | 0.82% | |
| | | | | |
Net investment income | | | 4.12% | | | | 4.12% | | | | 3.91% | | | | 4.72% | | | | 5.68% | |
| | | | | |
| Supplemental data | | | | | | | | | | | | | | | | | | | | |
| | | | | |
Net assets, end of year (000’s) | | | $309,935 | | | | $306,023 | | | | $378,545 | | | | $397,652 | | | | $436,405 | |
| | | | | |
Portfolio turnover rate | | | 39.03% | | | | 31.53% | | | | 24.77% | | | | 21.71% | | | | 26.66% | f |
aThe amount shown for a share outstanding throughout the period may not correlate with the Statement of Operations for the period due to the timing of sales and repurchases of the Fund’s shares in relation to income earned and/or fluctuating fair value of the investments of the Fund.
bBased on average daily shares outstanding.
cTotal return does not include fees, charges or expenses imposed by the variable annuity and life insurance contracts for which Franklin Templeton Variable Insurance Products Trust serves as an underlying investment vehicle.
dBenefit of expense reduction rounds to less than 0.01%.
eBenefit of waiver and payments by affiliates rounds to less than 0.01%.
fExcludes the value of portfolio securities delivered as a result of a redemption in-kind.
| | | | |
| FI-10 | | Annual Report | The accompanying notes are an integral part of these financial statements. | | |
FRANKLIN TEMPLETON VARIABLE INSURANCE PRODUCTS TRUST
Statement of Investments, December 31, 2016
| | | | | | | | | | | | | | |
Franklin Income VIP Fund | | | | |
| | | | | Country | | | Shares | | | Value | |
| | | Common Stocks 50.2% | | | | | | | | | |
| | | Consumer Discretionary 3.2% | | | | | | | | | |
| | Ford Motor Co. | | | United States | | | | 4,643,943 | | | $ | 56,331,029 | |
| | General Motors Co. | | | United States | | | | 2,000,000 | | | | 69,680,000 | |
| | Target Corp. | | | United States | | | | 939,100 | | | | 67,831,193 | |
| | | | | | | | | | | | | | |
| | | | | | | | | | | | | 193,842,222 | |
| | | | | | | | | | | | | | |
| | | Consumer Staples 3.3% | | | | | | | | | |
| | Anheuser-Busch InBev SA/NV, ADR | | | Belgium | | | | 505,000 | | | | 53,247,200 | |
| | The Coca-Cola Co. | | | United States | | | | 1,325,000 | | | | 54,934,500 | |
| | PepsiCo Inc. | | | United States | | | | 584,000 | | | | 61,103,920 | |
| | Philip Morris International Inc. | | | United States | | | | 350,000 | | | | 32,021,500 | |
| | | | | | | | | | | | | | |
| | | | | | | | | | | | | 201,307,120 | |
| | | | | | | | | | | | | | |
| | | Energy 8.9% | | | | | | | | | |
| | Anadarko Petroleum Corp. | | | United States | | | | 600,000 | | | | 41,838,000 | |
| | BP PLC, ADR | | | United Kingdom | | | | 1,800,000 | | | | 67,284,000 | |
| | Chevron Corp. | | | United States | | | | 1,055,000 | | | | 124,173,500 | |
| a | | Energy XXI Gulf Coast Inc. | | | United States | | | | 510,163 | | | | 14,053,482 | |
| a,b | | Halcon Resources Corp. | | | United States | | | | 74,398 | | | | 623,470 | |
| | Occidental Petroleum Corp. | | | United States | | | | 436,000 | | | | 31,056,280 | |
| a | | PetroQuest Energy Inc. | | | United States | | | | 36,128 | | | | 119,584 | |
| a | | Rex Energy Corp. | | | United States | | | | 75,000 | | | | 35,340 | |
| | Royal Dutch Shell PLC, A, ADR | | | United Kingdom | | | | 3,021,748 | | | | 164,322,656 | |
| | Schlumberger Ltd. | | | United States | | | | 180,000 | | | | 15,111,000 | |
| | Total SA, B, ADR | | | France | | | | 1,192,900 | | | | 60,802,113 | |
| a | | W&T Offshore Inc. | | | United States | | | | 3,829,500 | | | | 10,607,715 | |
| a | | Weatherford International PLC | | | United States | | | | 2,500,000 | | | | 12,475,000 | |
| | | | | | | | | | | | | | |
| | | | | | | | | | | | | 542,502,140 | |
| | | | | | | | | | | | | | |
| | | Financials 5.8% | | | | | | | | | |
| | Bank of America Corp. | | | United States | | | | 800,000 | | | | 17,680,000 | |
| | HSBC Holdings PLC | | | United Kingdom | | | | 5,000,000 | | | | 40,460,116 | |
| | JPMorgan Chase & Co. | | | United States | | | | 690,100 | | | | 59,548,729 | |
| | MetLife Inc. | | | United States | | | | 1,245,108 | | | | 67,098,870 | |
| | Morgan Stanley | | | United States | | | | 500,000 | | | | 21,125,000 | |
| | U.S. Bancorp. | | | United States | | | | 1,000,000 | | | | 51,370,000 | |
| | Wells Fargo & Co. | | | United States | | | | 1,700,000 | | | | 93,687,000 | |
| | | | | | | | | | | | | | |
| | | | | | | | | | | | | 350,969,715 | |
| | | | | | | | | | | | | | |
| | | Health Care 4.9% | | | | | | | | | |
| | AstraZeneca PLC | | | United Kingdom | | | | 1,000,000 | | | | 54,663,347 | |
| | Eli Lilly & Co. | | | United States | | | | 764,800 | | | | 56,251,040 | |
| | Medtronic PLC | | | United States | | | | 335,000 | | | | 23,862,050 | |
| | Pfizer Inc. | | | United States | | | | 2,638,975 | | | | 85,713,908 | |
| | Roche Holding AG | | | Switzerland | | | | 136,500 | | | | 31,176,257 | |
| | Sanofi, ADR | | | France | | | | 1,208,292 | | | | 48,863,328 | |
| | | | | | | | | | | | | | |
| | | | | | | | | | | | | 300,529,930 | |
| | | | | | | | | | | | | | |
| | | Industrials 6.0% | | | | | | | | | |
| a,c | | CEVA Holdings LLC | | | United States | | | | 13,012 | | | | 1,301,226 | |
| | Deere & Co. | | | United States | | | | 600,000 | | | | 61,824,000 | |
| | General Electric Co. | | | United States | | | | 3,976,200 | | | | 125,647,920 | |
| | Republic Services Inc. | | | United States | | | | 527,300 | | | | 30,082,465 | |
| | Union Pacific Corp. | | | United States | | | | 650,000 | | | | 67,392,000 | |
FRANKLIN TEMPLETON VARIABLE INSURANCE PRODUCTS TRUST
STATEMENT OF INVESTMENTS
Franklin Income VIP Fund (continued)
| | | | | | | | | | | | | | |
| | | | | Country | | | Shares | | | Value | |
| | | Common Stocks (continued) | | | | | | | | | |
| | | Industrials (continued) | | | | | | | | | |
| | United Technologies Corp. | | | United States | | | | 700,000 | | | $ | 76,734,000 | |
| | | | | | | | | | | | | | |
| | | | | | | | | | | | | 362,981,611 | |
| | | | | | | | | | | | | | |
| | | Information Technology 5.7% | | | | | | | | | |
| | Analog Devices Inc. | | | United States | | | | 400,000 | | | | 29,048,000 | |
| | Apple Inc. | | | United States | | | | 915,317 | | | | 106,012,015 | |
| | Intel Corp. | | | United States | | | | 1,727,000 | | | | 62,638,290 | |
| | Microsoft Corp. | | | United States | | | | 1,683,500 | | | | 104,612,690 | |
| | QUALCOMM Inc. | | | United States | | | | 700,000 | | | | 45,640,000 | |
| | | | | | | | | | | | | | |
| | | | | | | | | | | | | 347,950,995 | |
| | | | | | | | | | | | | | |
| | | Materials 3.8% | | | | | | | | | |
| | BASF SE | | | Germany | | | | 387,500 | | | | 36,006,414 | |
| | The Dow Chemical Co. | | | United States | | | | 1,700,000 | | | | 97,274,000 | |
| | The Mosaic Co. | | | United States | | | | 1,100,000 | | | | 32,263,000 | |
| | Rio Tinto PLC, ADR | | | United Kingdom | | | | 1,800,000 | | | | 69,228,000 | |
| | | | | | | | | | | | | | |
| | | | | | | | | | | | | 234,771,414 | |
| | | | | | | | | | | | | | |
| | | Real Estate 0.5% | | | | | | | | | |
| | Host Hotels & Resorts Inc. | | | United States | | | | 1,500,000 | | | | 28,260,000 | |
| | | | | | | | | | | | | | |
| | | Telecommunication Services 1.5% | | | | | | | | | |
| | BCE Inc. | | | Canada | | | | 466,000 | | | | 20,138,502 | |
| | Telstra Corp. Ltd. | | | Australia | | | | 3,946,331 | | | | 14,523,129 | |
| | Verizon Communications Inc. | | | United States | | | | 1,075,000 | | | | 57,383,500 | |
| | | | | | | | | | | | | | |
| | | | | | | | | | | | | 92,045,131 | |
| | | | | | | | | | | | | | |
| | | Utilities 6.6% | | | | | | | | | |
| | Dominion Resources Inc. | | | United States | | | | 1,000,000 | | | | 76,590,000 | |
| | Duke Energy Corp. | | | United States | | | | 702,500 | | | | 54,528,050 | |
| | Great Plains Energy Inc. | | | United States | | | | 777,900 | | | | 21,275,565 | |
| | NextEra Energy Inc. | | | United States | | | | 125,000 | | | | 14,932,500 | |
| | PG&E Corp. | | | United States | | | | 935,300 | | | | 56,838,181 | |
| | PPL Corp. | | | United States | | | | 450,000 | | | | 15,322,500 | |
| | Public Service Enterprise Group Inc. | | | United States | | | | 923,500 | | | | 40,523,180 | |
| | Sempra Energy | | | United States | | | | 368,300 | | | | 37,065,712 | |
| | The Southern Co. | | | United States | | | | 1,062,100 | | | | 52,244,699 | |
| | Xcel Energy Inc. | | | United States | | | | 810,964 | | | | 33,006,235 | |
| | | | | | | | | | | | | | |
| | | | | | | | | | | | | 402,326,622 | |
| | | | | | | | | | | | | | |
| | | | |
| | Total Common Stocks (Cost $2,558,619,952) | | | | | | | | | | | 3,057,486,900 | |
| | | | | | | | | | | | | | |
| d | | Equity-Linked Securities 5.4% | | | | | | | | | | | | |
| | | Consumer Discretionary 1.3% | | | | | | | | | |
| e | | Morgan Stanley into Ford Motors, 8.50%, 144A | | | United States | | | | 2,485,000 | | | | 30,572,707 | |
| e | | Royal Bank of Canada into Target Corp., 6.00%, 144A | | | United States | | | | 700,000 | | | | 50,936,900 | |
| | | | | | | | | | | | | | |
| | | | | | | | | | | | | 81,509,607 | |
| | | | | | | | | | | | | | |
| | | Energy 0.4% | | | | | | | | | |
| e | | Wells Fargo Bank National Assn. into Halliburton Co., 8.00%, 144A | | | United States | | | | 435,000 | | | | 21,603,492 | |
| | | | | | | | | | | | | | |
| | | Financials 0.5% | | | | | | | | | |
| e | | Citigroup Inc. into Bank of America Corp., 7.50%, 144A | | | United States | | | | 2,100,000 | | | | 33,181,050 | |
| | | | | | | | | | | | | | |
| | | Health Care 0.5% | | | | | | | | | |
| e | | JPMorgan Chase & Co. into Merck & Co. Inc., 6.25%, 144A | | | United States | | | | 500,000 | | | | 29,042,450 | |
| | | | | | | | | | | | | | |
FRANKLIN TEMPLETON VARIABLE INSURANCE PRODUCTS TRUST
STATEMENT OF INVESTMENTS
Franklin Income VIP Fund (continued)
| | | | | | | | | | | | | | | | | | |
| | | | | Country | | | Shares | | | | | | Value | |
| d | | Equity-Linked Securities (continued) | | | | | | | | | | | | |
| | | Information Technology 2.7% | | | | | | | | | | | | |
| e | | JPMorgan Chase & Co. into Oracle Corp., 6.00%, 144A | | | United States | | | | 700,000 | | | | | | | $ | 27,313,650 | |
| e | | Royal Bank of Canada into Texas Instruments Inc., 6.00%, 144A | | | United States | | | | 725,000 | | | | | | | | 48,967,877 | |
| e | | Wells Fargo Bank National Assn. into Cisco Systems Inc., 7.25%, 144A | | | United States | | | | 1,050,000 | | | | | | | | 30,997,680 | |
| e | | Wells Fargo Bank National Assn. into Intel Corp., 7.00%, 144A | | | United States | | | | 1,700,000 | | | | | | | | 59,630,050 | |
| | | | | | | | | | | | | | | | | | |
| | | | | | | | | | | | | | | | | 166,909,257 | |
| | | | | | | | | | | | | | | | | | |
| | | | | |
| | Total Equity-Linked Securities (Cost $324,814,100) | | | | | | | | | | | | | | | 332,245,856 | |
| | | | | | | | | | | | | | | | | | |
| | Convertible Preferred Stocks 2.4% | | | | | | | | | | | | | | | | |
| | | Financials 1.2% | | | | | | | | | | | | |
| | Bank of America Corp., 7.25%, cvt. pfd., L | | | United States | | | | 34,600 | | | | | | | | 40,371,280 | |
| a | | FNMA, 5.375%, cvt. pfd | | | United States | | | | 475 | | | | | | | | 12,943,750 | |
| | Wells Fargo & Co., 7.50%, cvt. pfd., A | | | United States | | | | 15,000 | | | | | | | | 17,850,000 | |
| | | | | | | | | | | | | | | | | | |
| | | | | | | | | | | | | | | | | 71,165,030 | |
| | | | | | | | | | | | | | | | | | |
| | | Health Care 0.4% | | | | | | | | | | | | |
| | Allergan PLC, 5.50%, cvt. pfd | | | United States | | | | 9,500 | | | | | | | | 7,243,370 | |
| | | | | | | | | | | | | | | | | | |
| | Teva Pharmaceutical Industries Ltd., 7.00%, cvt. pfd | | | Israel | | | | 25,000 | | | | | | | | 16,125,000 | |
| | | | | | | | | | | | | | | | | | |
| | | | | | | | | | | | | | | | | 23,368,370 | |
| | | Industrials 0.0%† | | | | | | | | | | | | |
| a,c | | CEVA Holdings LLC, cvt. pfd., A-1 | | | United States | | | | 397 | | | | | | | | 129,025 | |
| a,c | | CEVA Holdings LLC, cvt. pfd., A-2 | | | United States | | | | 14,711 | | | | | | | | 3,309,952 | |
| | | | | | | | | | | | | | | | | | |
| | | | | | | | | | | | | | | | | 3,438,977 | |
| | | | | | | | | | | | | | | | | | |
| | | Real Estate 0.0%† | | | | | | | | | | | | |
| | FelCor Lodging Trust Inc., 7.80%, cvt. pfd., A | | | United States | | | | 135,225 | | | | | | | | 3,368,455 | |
| | | | | | | | | | | | | | | | | | |
| | | Utilities 0.8% | | | | | | | | | | | | |
| | Dominion Resources Inc., 6.375%, cvt. pfd., A | | | United States | | | | 162,000 | | | | | | | | 8,109,720 | |
| | Great Plains Energy Inc., 7.00%, cvt. pfd | | | United States | | | | 216,000 | | | | | | | | 10,929,600 | |
| | NextEra Energy Inc., 6.371%, cvt. pfd | | | United States | | | | 500,000 | | | | | | | | 28,625,000 | |
| | | | | | | | | | | | | | | | | | |
| | | | | | | | | | | | | | | | | 47,664,320 | |
| | | | | | | | | | | | | | | | | | |
| | | | | |
| | Total Convertible Preferred Stocks (Cost $174,480,955) | | | | | | | | | | | | | | | 149,005,152 | |
| | | | | | | | | | | | | | | | | | |
| | Preferred Stocks (Cost $4,945,000) 0.1% | | | | | | | | | | | | | | | | |
| | | Financials 0.1% | | | | | | | | | | | | |
| | Morgan Stanley, 6.375%, pfd., I | | | United States | | | | 197,800 | | | | | | | | 5,089,394 | |
| | | | | | | | | | | | | | | | | | |
| | | | | |
| | | | | | | | Principal Amount* | | | | | | | |
| | Convertible Bonds 1.0% | | | | | | | | | | | | | | | | |
| | | Energy 0.6% | | | | | | | | | | | | |
| | Cobalt International Energy Inc., cvt., senior bond, 3.125%, 5/15/24 | | | United States | | | | 9,500,000 | | | | | | | | 2,755,000 | |
| f | | Stone Energy Corp., cvt., senior note, 1.75%, 3/01/17 | | | United States | | | | 13,507,000 | | | | | | | | 8,171,735 | |
| | Weatherford International Ltd., cvt., senior note, 5.875%, 7/01/21 | | | United States | | | | 22,000,000 | | | | | | | | 23,925,000 | |
| | | | | | | | | | | | | | | | | | |
| | | | | | | | | | | | | | | | | 34,851,735 | |
| | | | | | | | | | | | | | | | | | |
| | | Health Care 0.4% | | | | | | | | | | | | |
| e | | Bayer Capital Corp BV, cvt., junior sub. note, 144A, 5.625%, 11/22/19 | | | Germany | | | | 25,000,000 | | | | EUR | | | | 28,747,418 | |
| | | | | | | | | | | | | | | | | | |
| | | | | |
| | Total Convertible Bonds (Cost $69,978,653) | | | | | | | | | | | | | | | 63,599,153 | |
| | | | | | | | | | | | | | | | | | |
FRANKLIN TEMPLETON VARIABLE INSURANCE PRODUCTS TRUST
STATEMENT OF INVESTMENTS
Franklin Income VIP Fund (continued)
| | | | | | | | | | | | | | |
| | | | | Country | | | Principal Amount* | | | Value | |
| | | Corporate Bonds 31.9% | | | | | | | | | |
| | | Consumer Discretionary 3.8% | | | | | | | | | |
| e | | 24 Hour Holdings III LLC, senior note, 144A, 8.00%, 6/01/22 | | | United States | | | | 500,000 | | | $ | 427,500 | |
| | CCO Holdings LLC/CCO Holdings Capital Corp., senior bond, 5.125%, 2/15/23 | | | United States | | | | 10,000,000 | | | | 10,300,000 | |
| e | | CSC Holdings LLC, senior bond, 144A, 10.875%, 10/15/25 | | | United States | | | | 8,000,000 | | | | 9,536,000 | |
| | DISH DBS Corp., | | | | | | | | | | | | |
| | senior bond, 5.00%, 3/15/23 | | | United States | | | | 35,000,000 | | | | 34,912,500 | |
| | senior note, 5.875%, 7/15/22 | | | United States | | | | 40,000,000 | | | | 42,200,000 | |
| | senior note, 5.875%, 11/15/24 | | | United States | | | | 9,400,000 | | | | 9,707,850 | |
| | senior note, 7.75%, 7/01/26 | | | United States | | | | 10,000,000 | | | | 11,300,000 | |
| | Fiat Chrysler Automobiles NV, senior note, 5.25%, 4/15/23 | | | United Kingdom | | | | 11,300,000 | | | | 11,561,200 | |
| | iHeartCommunications Inc., | | | | | | | | | | | | |
| | senior secured bond, first lien, 9.00%, 3/01/21 | | | United States | | | | 15,400,000 | | | | 11,453,750 | |
| | senior secured note, first lien, 9.00%, 12/15/19 | | | United States | | | | 18,000,000 | | | | 14,782,500 | |
| e | | International Game Technology PLC, senior secured note, 144A, 6.25%, 2/15/22 | | | United States | | | | 8,500,000 | | | | 9,158,750 | |
| | KB Home, senior bond, 7.50%, 9/15/22 | | | United States | | | | 6,500,000 | | | | 6,890,000 | |
| e | | PetSmart Inc., senior note, 144A, 7.125%, 3/15/23 | | | United States | | | | 3,000,000 | | | | 3,067,500 | |
| e | | Shea Homes LP/Shea Homes Funding Corp., | | | | | | | | | | | | |
| | senior bond, 144A, 6.125%, 4/01/25 | | | United States | | | | 10,000,000 | | | | 9,725,000 | |
| | senior note, 144A, 5.875%, 4/01/23 | | | United States | | | | 5,000,000 | | | | 4,900,000 | |
| e | | Sirius XM Radio Inc., senior bond, 144A, 6.00%, 7/15/24 | | | United States | | | | 7,500,000 | | | | 7,856,250 | |
| e | | Univision Communications Inc., | | | | | | | | | | | | |
| | senior secured note, first lien, 144A, 5.125%, 5/15/23 | | | United States | | | | 10,000,000 | | | | 9,887,500 | |
| | senior secured note, first lien, 144A, 5.125%, 2/15/25 | | | United States | | | | 7,140,000 | | | | 6,854,400 | |
| e | | Virgin Media Secured Finance PLC, senior secured bond, first lien, 144A, 5.50%, 1/15/25 | | | United Kingdom | | | | 7,000,000 | | | | 7,131,250 | |
| e | | Ziggo Secured Finance BV, secured bond, 144A, 5.50%, 1/15/27 | | | Netherlands | | | | 7,500,000 | | | | 7,329,750 | |
| | | | | | | | | | | | | | |
| | | | | | | | | | | | | 228,981,700 | |
| | | | | | | | | | | | | | |
| | | Consumer Staples 0.3% | | | | | | | | | |
| | Cott Beverages Inc., senior note, 5.375%, 7/01/22 | | | United States | | | | 2,500,000 | | | | 2,553,125 | |
| e | | JBS USA LLC/Finance Inc., senior note, 144A, 7.25%, 6/01/21 | | | United States | | | | 12,500,000 | | | | 13,031,250 | |
| | | | | | | | | | | | | | |
| | | | | | | | | | | | | 15,584,375 | |
| | | | | | | | | | | | | | |
| | | Energy 6.6% | | | | | | | | | |
| | Bill Barrett Corp., | | | | | | | | | | | | |
| | senior note, 7.625%, 10/01/19 | | | United States | | | | 30,000,000 | | | | 29,700,000 | |
| | senior note, 7.00%, 10/15/22 | | | United States | | | | 17,937,000 | | | | 17,219,520 | |
| | Calumet Specialty Products Partners LP/Calumet Finance Corp., senior note, 6.50%, 4/15/21 | | | United States | | | | 9,500,000 | | | | 8,098,750 | |
| | Chesapeake Energy Corp., | | | | | | | | | | | | |
| | e secured note, second lien, 144A, 8.00%, 12/15/22 | | | United States | | | | 47,500,000 | | | | 51,501,875 | |
| | senior bond, 6.125%, 2/15/21 | | | United States | | | | 5,000,000 | | | | 4,900,000 | |
| | e senior note, 144A, 8.00%, 1/15/25 | | | United States | | | | 15,000,000 | | | | 15,356,250 | |
| | g senior note, FRN, 4.13%, 4/15/19 | | | United States | | | | 14,000,000 | | | | 14,140,000 | |
| e | | Denbury Resources Inc., senior secured note, 144A, 9.00%, 5/15/21 | | | United States | | | | 7,200,000 | | | | 7,830,000 | |
| | Ferrellgas LP/Ferrellgas Finance Corp., senior note, 6.50%, 5/01/21 | | | United States | | | | 5,000,000 | | | | 4,975,000 | |
| e | | Halcon Resources Corp., secured note, second lien, 144A, 8.625%, 2/01/20 | | | United States | | | | 9,000,000 | | | | 9,405,000 | |
| | Kinder Morgan Inc., | | | | | | | | | | | | |
| | senior bond, MTN, 7.75%, 1/15/32 | | | United States | | | | 22,000,000 | | | | 26,992,152 | |
| | e senior secured bond, first lien, 144A, 5.625%, 11/15/23 | | | United States | | | | 7,000,000 | | | | 7,686,154 | |
FRANKLIN TEMPLETON VARIABLE INSURANCE PRODUCTS TRUST
STATEMENT OF INVESTMENTS
Franklin Income VIP Fund (continued)
| | | | | | | | | | | | | | |
| | | | | Country | | | Principal Amount* | | | Value | |
| | | Corporate Bonds (continued) | | | | | | | | | |
| | | Energy (continued) | | | | | | | | | |
| e | | McDermott International Inc., second lien, 144A, 8.00%, 5/01/21 | | | United States | | | | 17,592,000 | | | $ | 17,855,880 | |
| e | | NGPL PipeCo LLC, secured note, 144A, 7.119%, 12/15/17 | | | United States | | | | 3,750,000 | | | | 3,928,125 | |
| e,h | | PetroQuest Energy Inc., secured note, second lien, 144A, PIK, 10.00%, 2/15/21 | | | United States | | | | 1,653,000 | | | | 1,146,683 | |
| | Rex Energy Corp., second lien, 8.00%, 10/01/20 | | | United States | | | | 5,000,000 | | | | 2,550,000 | |
| e | | Sabine Pass Liquefaction LLC, | | | | | | | | | | | | |
| | senior secured bond, 144A, 5.875%, 6/30/26 | | | United States | | | | 15,000,000 | | | | 16,218,750 | |
| | senior secured bond, 144A, 5.00%, 3/15/27 | | | United States | | | | 12,200,000 | | | | 12,352,500 | |
| i | | Sanchez Energy Corp., senior note, 7.75%, 6/15/21 | | | United States | | | | 27,000,000 | | | | 27,607,500 | |
| f | | Stone Energy Corp., senior bond, 7.50%, 11/15/22 | | | United States | | | | 26,905,000 | | | | 16,277,525 | |
| e | | Transocean Inc., senior note, 144A, 9.00%, 7/15/23 | | | United States | | | | 10,000,000 | | | | 10,300,000 | |
| e,h | | W&T Offshore Inc., | | | | | | | | | | | | |
| | second lien, 144A, PIK, 10.75%, 5/15/20 | | | United States | | | | 10,330,593 | | | | 7,849,085 | |
| | senior secured note, third lien, 144A, PIK, 10.00%, 6/15/21 | | | United States | | | | 9,245,000 | | | | 5,523,983 | |
| | Weatherford International Ltd., | | | | | | | | | | | | |
| | senior note, 5.125%, 9/15/20 | | | United States | | | | 17,500,000 | | | | 16,537,500 | |
| | j senior note, 7.75%, 6/15/21 | | | United States | | | | 30,000,000 | | | | 30,412,500 | |
| | senior note, 4.50%, 4/15/22 | | | United States | | | | 9,900,000 | | | | 8,637,750 | |
| | senior note, 8.25%, 6/15/23 | | | United States | | | | 27,500,000 | | | | 28,050,000 | |
| | | | | | | | | | | | | | |
| | | | | | | | | | | | | 403,052,482 | |
| | | | | | | | | | | | | | |
| | | Financials 3.1% | | | | | | | | | |
| k | | Bank of America Corp., | | | | | | | | | | | | |
| | junior sub. bond, AA, 6.10% to 3/17/25, FRN thereafter, Perpetual | | | United States | | | | 8,000,000 | | | | 8,054,000 | |
| | junior sub. bond, M, 8.125% to 5/15/18, FRN thereafter, Perpetual | | | United States | | | | 5,000,000 | | | | 5,200,000 | |
| k | | Citigroup Inc., | | | | | | | | | | | | |
| | junior sub. bond, 5.35% to 5/15/23, FRN thereafter, Perpetual | | | United States | | | | 10,000,000 | | | | 9,437,500 | |
| | junior sub. bond, 5.90% to 2/15/23, FRN thereafter, Perpetual | | | United States | | | | 12,500,000 | | | | 12,671,875 | |
| | junior sub. bond, 5.95% to 1/30/23, FRN thereafter, Perpetual | | | United States | | | | 4,500,000 | | | | 4,567,500 | |
| | junior sub. bond, M, 6.30% to 5/15/24, FRN thereafter, Perpetual | | | United States | | | | 16,800,000 | | | | 16,678,200 | |
| | junior sub. bond, O, 5.875% to 3/27/20, FRN thereafter, Perpetual | | | United States | | | | 25,000,000 | | | | 25,281,250 | |
| | junior sub. bond, Q, 5.95% to 8/15/20, FRN thereafter, Perpetual | | | United States | | | | 10,000,000 | | | | 10,168,250 | |
| k | | JPMorgan Chase & Co., | | | | | | | | | | | | |
| | junior sub. bond, I, 7.90% to 4/30/19, FRN thereafter, Perpetual | | | United States | | | | 50,000,000 | | | | 51,837,500 | |
| | junior sub. bond, R, 6.00% to 8/01/23, FRN thereafter, Perpetual | | | United States | | | | 3,200,000 | | | | 3,220,000 | |
| | junior sub. bond, V, 5.00% to 7/30/19, FRN thereafter, Perpetual | | | United States | | | | 10,000,000 | | | | 9,987,500 | |
| k | | Morgan Stanley, junior sub. bond, 5.55% to 7/15/20, FRN thereafter, Perpetual | | | United States | | | | 7,300,000 | | | | 7,391,250 | |
| | Navient Corp., senior note, 6.125%, 3/25/24 | | | United States | | | | 5,000,000 | | | | 4,881,250 | |
| e | | OneMain Financial Holdings Inc., | | | | | | | | | | | | |
| | senior note, 144A, 6.75%, 12/15/19 | | | United States | | | | 6,000,000 | | | | 6,277,500 | |
| | senior note, 144A, 7.25%, 12/15/21 | | | United States | | | | 5,000,000 | | | | 5,237,500 | |
| k | | Wells Fargo & Co., junior sub. bond, S, 5.90% to 6/15/24, FRN thereafter, Perpetual | | | United States | | | | 7,900,000 | | | | 7,949,375 | |
| | | | | | | | | | | | | | |
| | | | | | | | | | | | | 188,840,450 | |
| | | | | | | | | | | | | | |
| | | Health Care 5.9% | | | | | | | | | |
| | CHS/Community Health Systems Inc., | | | | | | | | | | | | |
| | senior note, 8.00%, 11/15/19 | | | United States | | | | 64,195,000 | | | | 53,602,825 | |
| | senior note, 7.125%, 7/15/20 | | | United States | | | | 25,000,000 | | | | 19,132,500 | |
| | senior note, 6.875%, 2/01/22 | | | United States | | | | 33,500,000 | | | | 23,450,000 | |
| e | | Concordia International Corp., | | | | | | | | | | | | |
| | senior note, 144A, 9.50%, 10/21/22 | | | Canada | | | | 5,000,000 | | | | 1,800,000 | |
| | senior note, 144A, 7.00%, 4/15/23 | | | Canada | | | | 2,500,000 | | | | 775,000 | |
FRANKLIN TEMPLETON VARIABLE INSURANCE PRODUCTS TRUST
STATEMENT OF INVESTMENTS
Franklin Income VIP Fund (continued)
| | | | | | | | | | | | | | |
| | | | | Country | | | Principal Amount* | | | Value | |
| | | Corporate Bonds (continued) | | | | | | | | | |
| | | Health Care (continued) | | | | | | | | | |
| | DaVita Inc., senior bond, 5.125%, 7/15/24 | | | United States | | | | 5,000,000 | | | $ | 4,996,875 | |
| e | | Endo Finance LLC, senior note, 144A, 5.75%, 1/15/22 | | | United States | | | | 22,500,000 | | | | 20,137,500 | |
| e | | Endo Finance LLC/Endo Ltd./Endo Finco Inc., | | | | | | | | | | | | |
| | senior bond, 144A, 6.00%, 2/01/25 | | | United States | | | | 10,000,000 | | | | 8,375,000 | |
| | senior note, 144A, 6.00%, 7/15/23 | | | United States | | | | 15,000,000 | | | | 13,237,500 | |
| | HCA Inc., | | | | | | | | | | | | |
| | senior bond, 5.875%, 5/01/23 | | | United States | | | | 7,500,000 | | | | 7,987,500 | |
| | senior note, 7.50%, 2/15/22 | | | United States | | | | 25,000,000 | | | | 28,437,500 | |
| | senior secured note, first lien, 5.00%, 3/15/24 | | | United States | | | | 10,400,000 | | | | 10,725,000 | |
| | Mallinckrodt International Finance SA, senior bond, 4.75%, 4/15/23 | | | United States | | | | 5,000,000 | | | | 4,375,000 | |
| e | | Mallinckrodt International Finance SA/Mallinckrodt CB LLC, | | | | | | | | | | | | |
| | senior note, 144A, 5.75%, 8/01/22 | | | United States | | | | 14,200,000 | | | | 13,738,500 | |
| | senior note, 144A, 5.625%, 10/15/23 | | | United States | | | | 10,000,000 | | | | 9,375,000 | |
| | senior note, 144A, 5.50%, 4/15/25 | | | United States | | | | 10,000,000 | | | | 9,000,000 | |
| | Tenet Healthcare Corp., | | | | | | | | | | | | |
| | senior note, 5.00%, 3/01/19 | | | United States | | | | 10,000,000 | | | | 9,800,000 | |
| | senior note, 8.00%, 8/01/20 | | | United States | | | | 5,000,000 | | | | 4,937,500 | |
| | senior note, 8.125%, 4/01/22 | | | United States | | | | 40,000,000 | | | | 37,940,000 | |
| | senior note, 6.75%, 6/15/23 | | | United States | | | | 33,200,000 | | | | 29,299,000 | |
| e | | Valeant Pharmaceuticals International, senior note, 144A, 6.375%, 10/15/20 | | | United States | | | | 7,500,000 | | | | 6,480,450 | |
| e | | Valeant Pharmaceuticals International Inc., | | | | | | | | | | | | |
| | senior bond, 144A, 6.125%, 4/15/25 | | | United States | | | | 9,400,000 | | | | 7,097,000 | |
| | senior note, 144A, 6.75%, 8/15/18 | | | United States | | | | 13,325,000 | | | | 12,692,062 | |
| | senior note, 144A, 5.375%, 3/15/20 | | | United States | | | | 17,000,000 | | | | 14,450,000 | |
| | senior note, 144A, 5.875%, 5/15/23 | | | United States | | | | 12,500,000 | | | | 9,500,000 | |
| | | | | | | | | | | | | | |
| | | | | | | | | | | | | 361,341,712 | |
| | | | | | | | | | | | | | |
| | | Industrials 1.6% | | | | | | | | | |
| | The ADT Corp., senior note, 3.50%, 7/15/22 | | | United States | | | | 3,600,000 | | | | 3,447,000 | |
| e | | Bombardier Inc., | | | | | | | | | | | | |
| | senior bond, 144A, 6.125%, 1/15/23 | | | Canada | | | | 5,000,000 | | | | 4,792,000 | |
| | senior bond, 144A, 7.50%, 3/15/25 | | | Canada | | | | 11,000,000 | | | | 10,923,220 | |
| e | | CEVA Group PLC, senior note, first lien, 144A, 4.00%, 5/01/18 | | | United Kingdom | | | | 12,691,882 | | | | 11,486,153 | |
| e | | Cloud Crane LLC, secured note, second lien, 144A, 10.125%, 8/01/24 | | | United States | | | | 4,400,000 | | | | 4,719,000 | |
| e | | Cortes NP Acquisition Corp., senior note, 144A, 9.25%, 10/15/24 | | | United States | | | | 5,800,000 | | | | 6,177,000 | |
| | Hertz Corp., senior note, 6.75%, 4/15/19 | | | United States | | | | 3,474,000 | | | | 3,482,685 | |
| | Navistar International Corp., senior bond, 8.25%, 11/01/21 | | | United States | | | | 5,675,000 | | | | 5,760,125 | |
| e | | Prime Security Services Borrower LLC/Prime Finance Inc., secured note,second lien, 144A, 9.25%, 5/15/23 | | | United States | | | | 2,000,000 | | | | 2,182,500 | |
| | TransDigm Inc., | | | | | | | | | | | | |
| | senior sub. bond, 6.50%, 7/15/24 | | | United States | | | | 10,000,000 | | | | 10,512,500 | |
| | senior sub. note, 6.00%, 7/15/22 | | | United States | | | | 7,700,000 | | | | 8,046,500 | |
| | United Rentals North America Inc., senior bond, 6.125%, 6/15/23 | | | United States | | | | 11,400,000 | | | | 12,141,000 | |
| e | | XPO Logistics Inc., senior note, 144A, 6.50%, 6/15/22 | | | United States | | | | 13,980,000 | | | | 14,731,425 | |
| | | | | | | | | | | | | | |
| | | | | | | | | | | | | 98,401,108 | |
| | | | | | | | | | | | | | |
| | | Information Technology 3.2% | | | | | | | | | |
| e | | BMC Software Finance Inc., senior note, 144A, 8.125%, 7/15/21 | | | United States | | | | 16,500,000 | | | | 15,499,687 | |
| e | | CommScope Inc., | | | | | | | | | | | | |
| | senior bond, 144A, 5.50%, 6/15/24 | | | United States | | | | 10,000,000 | | | | 10,387,500 | |
| | senior note, 144A, 5.00%, 6/15/21 | | | United States | | | | 8,422,000 | | | | 8,706,243 | |
FRANKLIN TEMPLETON VARIABLE INSURANCE PRODUCTS TRUST
STATEMENT OF INVESTMENTS
Franklin Income VIP Fund (continued)
| | | | | | | | | | | | | | |
| | | | | Country | | | Principal Amount* | | | Value | |
| | | Corporate Bonds (continued) | | | | | | | | | |
| | | Information Technology (continued) | | | | | | | | | |
| e | | Diamond 1 Finance Corp./Diamond 2 Finance Corp., | | | | | | | | | | | | |
| | senior note, 144A, 5.875%, 6/15/21 | | | United States | | | | 3,100,000 | | | $ | 3,298,338 | |
| | senior note, 144A, 7.125%, 6/15/24 | | | United States | | | | 3,600,000 | | | | 3,997,246 | |
| | senior secured bond, first lien, 144A, 6.02%, 6/15/26 | | | United States | | | | 16,200,000 | | | | 17,557,787 | |
| | senior secured note, first lien, 144A, 4.42%, 6/15/21 | | | United States | | | | 12,500,000 | | | | 12,936,162 | |
| | senior secured note, first lien, 144A, 5.45%, 6/15/23 | | | United States | | | | 21,100,000 | | | | 22,388,471 | |
| e | | First Data Corp., | | | | | | | | | | | | |
| | second lien, 144A, 5.75%, 1/15/24 | | | United States | | | | 5,000,000 | | | | 5,178,150 | |
| | senior note, 144A, 7.00%, 12/01/23 | | | United States | | | | 25,000,000 | | | | 26,687,500 | |
| | senior secured note, first lien, 144A, 5.375%, 8/15/23 | | | United States | | | | 5,000,000 | | | | 5,200,000 | |
| e | | Microsemi Corp., senior note, 144A, 9.125%, 4/15/23 | | | United States | | | | 5,500,000 | | | | 6,435,000 | |
| | NCR Corp., | | | | | | | | | | | | |
| | senior note, 5.00%, 7/15/22 | | | United States | | | | 5,500,000 | | | | 5,637,500 | |
| | senior note, 6.375%, 12/15/23 | | | United States | | | | 7,000,000 | | | | 7,542,500 | |
| e | | Western Digital Corp., | | | | | | | | | | | | |
| | senior note, 144A, 10.50%, 4/01/24 | | | United States | | | | 30,000,000 | | | | 35,550,000 | |
| | senior secured note, 144A, 7.375%, 4/01/23 | | | United States | | | | 10,000,000 | | | | 11,025,000 | |
| | | | | | | | | | | | | | |
| | | | | | | | | | | | | 198,027,084 | |
| | | | | | | | | | | | | | |
| | | Materials 1.6% | | | | | | | | | |
| e | | Ardagh Packaging Finance PLC/Ardagh MP Holdings USA Inc., | | | | | | | | | | | | |
| | senior note, 144A, 6.25%, 1/31/19 | | | Luxembourg | | | | 7,500,000 | | | | 7,650,000 | |
| | senior note, 144A, 4.625%, 5/15/23 | | | Luxembourg | | | | 15,000,000 | | | | 14,943,750 | |
| | senior note, 144A, 7.25%, 5/15/24 | | | Luxembourg | | | | 10,200,000 | | | | 10,786,500 | |
| e | | Cemex Finance LLC, senior secured note, first lien, 144A, 6.00%, 4/01/24 | | | Mexico | | | | 14,700,000 | | | | 15,197,963 | |
| e | | FMG Resources (August 2006) Pty. Ltd., senior secured note, 144A, 9.75%, 3/01/22 | | | Australia | | | | 27,000,000 | | | | 31,456,890 | |
| e | | Platform Specialty Products Corp., senior note, 144A, 6.50%, 2/01/22 | | | United States | | | | 3,500,000 | | | | 3,543,750 | |
| e | | Reynolds Group Issuer Inc./Reynolds Group Issuer LLC/Reynolds Group | | | | | | | | | | | | |
| | Issuer Luxembourg SA, | | | | | | | | | | | | |
| | first lien, 144A, 5.125%, 7/15/23 | | | United States | | | | 4,300,000 | | | | 4,375,250 | |
| | g senior secured note, first lien, 144A, FRN, 4.38%, 7/15/21 | | | United States | | | | 7,600,000 | | | | 7,790,000 | |
| | | | | | | | | | | | | | |
| | | | | | | | | | | | | 95,744,103 | |
| | | | | | | | | | | | | | |
| | | Real Estate 0.1% | | | | | | | | | |
| | Iron Mountain Inc., senior sub. bond, 5.75%, 8/15/24 | | | United States | | | | 3,000,000 | | | | 3,097,500 | |
| | iStar Inc., senior note, 5.00%, 7/01/19 | | | United States | | | | 3,500,000 | | | | 3,526,250 | |
| | | | | | | | | | | | | | |
| | | | | | | | | | | | | 6,623,750 | |
| | | | | | | | | | | | | | |
| | | Telecommunication Services 3.1% | | | | | | | | | |
| | Frontier Communications Corp., | | | | | | | | | | | | |
| | senior note, 9.25%, 7/01/21 | | | United States | | | | 7,400,000 | | | | 7,797,750 | |
| | senior note, 10.50%, 9/15/22 | | | United States | | | | 10,000,000 | | | | 10,550,500 | |
| | senior note, 7.125%, 1/15/23 | | | United States | | | | 7,800,000 | | | | 7,098,000 | |
| | Intelsat Jackson Holdings SA, senior bond, 5.50%, 8/01/23 | | | Luxembourg | | | | 8,400,000 | | | | 5,712,000 | |
| | Sprint Capital Corp., senior note, 6.90%, 5/01/19 | | | United States | | | | 13,500,000 | | | | 14,326,875 | |
| | Sprint Communications Inc., 11.50%, 11/15/21 | | | United States | | | | 30,000,000 | | | | 36,975,000 | |
| | senior note, 7.00%, 8/15/20 | | | United States | | | | 7,500,000 | | | | 7,969,575 | |
| | e senior note, 144A, 9.00%, 11/15/18 | | | United States | | | | 11,900,000 | | | | 13,149,500 | |
FRANKLIN TEMPLETON VARIABLE INSURANCE PRODUCTS TRUST
STATEMENT OF INVESTMENTS
Franklin Income VIP Fund (continued)
| | | | | | | | | | | | | | |
| | | | | Country | | | Principal Amount* | | | Value | |
| | | Corporate Bonds (continued) | | | | | | | | | |
| | | Telecommunication Services (continued) | | | | | | | | | |
| | Sprint Corp., | | | | | | | | | | | | |
| | senior bond, 7.875%, 9/15/23 | | | United States | | | | 37,500,000 | | | $ | 40,125,000 | |
| | senior bond, 7.125%, 6/15/24 | | | United States | | | | 8,200,000 | | | | 8,466,500 | |
| | senior note, 7.625%, 2/15/25 | | | United States | | | | 15,000,000 | | | | 15,806,250 | |
| | T-Mobile USA Inc., senior note, 6.633%, 4/28/21 | | | United States | | | | 7,500,000 | | | | 7,846,875 | |
| e | | Wind Acquisition Finance SA, secured note, second lien, 144A, 7.375%, 4/23/21 | | | Italy | | | | 11,500,000 | | | | 11,966,900 | |
| | Zayo Group LLC/Zayo Capital Inc., senior note, 6.375%, 5/15/25 | | | United States | | | | 1,700,000 | | | | 1,782,875 | |
| | | | | | | | | | | | | | |
| | | | | | | | | | | | | 189,573,600 | |
| | | | | | | | | | | | | | |
| | | Utilities 2.6% | | | | | | | | | |
| | Calpine Corp., | | | | | | | | | | | | |
| | senior bond, 5.75%, 1/15/25 | | | United States | | | | 15,000,000 | | | | 14,550,000 | |
| | senior note, 5.375%, 1/15/23 | | | United States | | | | 20,000,000 | | | | 19,650,000 | |
| | senior note, 5.50%, 2/01/24 | | | United States | | | | 16,375,000 | | | | 15,883,750 | |
| | e senior secured bond, 144A, 5.25%, 6/01/26 | | | United States | | | | 15,000,000 | | | | 14,850,000 | |
| | Dynegy Inc., | | | | | | | | | | | | |
| | senior note, 6.75%, 11/01/19 | | | United States | | | | 43,000,000 | | | | 43,967,500 | |
| | senior note, 7.375%, 11/01/22 | | | United States | | | | 20,000,000 | | | | 19,200,000 | |
| | senior note, 5.875%, 6/01/23 | | | United States | | | | 8,000,000 | | | | 6,980,000 | |
| e | | InterGen NV, secured bond, 144A, 7.00%, 6/30/23 | | | Netherlands | | | | 25,000,000 | | | | 22,375,000 | |
| | | | | | | | | | | | | | |
| | | | | | | | | | | | | 157,456,250 | |
| | | | | | | | | | | | | | |
| | | | |
| | Total Corporate Bonds (Cost $1,893,077,510) | | | | | | | | | | | 1,943,626,614 | |
| | | | | | | | | | | | | | |
| g,l | | Senior Floating Rate Interests 3.3% | | | | | | | | | | | | |
| | | Consumer Discretionary 1.3% | | | | | | | | | |
| | Belk Inc., Closing Date Term Loan, 5.75%, 12/12/22 | | | United States | | | | 24,812,500 | | | | 21,504,175 | |
| | iHeartCommunications Inc., | | | | | | | | | | | | |
| | Tranche D Term Loan, 7.52%, 1/30/19 | | | United States | | | | 35,864,664 | | | | 29,259,576 | |
| | Tranche E Term Loan, 8.27%, 7/30/19 | | | United States | | | | 13,142,768 | | | | 10,809,927 | |
| | Petco Animal Supplies Stores Inc., Term Loan B-1, 5.00%, 1/26/23 | | | United States | | | | 14,887,500 | | | | 15,020,863 | |
| | | | | | | | | | | | | | |
| | | | | | | | | | | | | 76,594,541 | |
| | | | | | | | | | | | | | |
| | | Energy 0.1% | | | | | | | | | |
| | W&T Offshore Inc., Second Lien Term Loan, 9.00%, 5/15/20 | | | United States | | | | 11,000,000 | | | | 8,772,500 | |
| | | | | | | | | | | | | | |
| | | Financials 0.7% | | | | | | | | | |
| | First Eagle Investment Management, Initial Term Loans, 4.998%, 12/01/22 | | | United States | | | | 39,600,000 | | | | 40,045,500 | |
| | | | | | | | | | | | | | |
| | | Health Care 0.3% | | | | | | | | | |
| | Vizient Inc., Term Loan, 5.00%, 2/11/23 | | | United States | | | | 17,597,059 | | | | 17,897,669 | |
| | | | | | | | | | | | | | |
| | | Industrials 0.7% | | | | | | | | | |
| | CEVA Group PLC, Pre-Funded L/C, 6.50%, 3/19/21 | | | United States | | | | 5,418,719 | | | | 4,434,886 | |
| | CEVA Intercompany BV, Dutch BV Term Loan, 6.50%, 3/19/21 | | | Netherlands | | | | 5,557,143 | | | | 4,548,177 | |
| | CEVA Logistics Canada ULC, Canadian Term Loan, 6.50%, 3/19/21 | | | Canada | | | | 958,128 | | | | 784,168 | |
| | CEVA Logistics U.S. Holdings Inc., U.S. Term Loan, 6.50%, 3/19/21 | | | United States | | | | 7,665,025 | | | | 6,273,347 | |
| | Commercial Barge Line Co., Initial Term Loan, 9.75%, 11/12/20 | | | United States | | | | 9,625,000 | | | | 9,143,750 | |
| | Cortes NP Acquisition Corp., Initial Term Loan, 6.00%, 11/30/23 | | | United States | | | | 11,400,000 | | | | 11,514,000 | |
| | Navistar Inc., Tranche B Term Loans, 6.50%, 8/07/20 | | | United States | | | | 6,020,211 | | | | 6,106,752 | |
| | | | | | | | | | | | | | |
| | | | | | | | | | | | | 42,805,080 | |
| | | | | | | | | | | | | | |
| | | Information Technology 0.1% | | | | | | | | | |
| | Western Digital Corp., Term Loan B-1, 4.52%, 4/29/23 | | | United States | | | | 7,960,000 | | | | 8,080,825 | |
| | | | | | | | | | | | | | |
FRANKLIN TEMPLETON VARIABLE INSURANCE PRODUCTS TRUST
STATEMENT OF INVESTMENTS
Franklin Income VIP Fund (continued)
| | | | | | | | | | | | | | |
| | | | | Country | | | Principal Amount* | | | Value | |
| g,l | | Senior Floating Rate Interests (continued) | | | | | | | | | |
| | | Materials 0.1% | | | | | | | | | |
| | FMG America Finance Inc. (Fortescue Metals Group), Loans, 3.75%, 6/30/19 | | | Australia | | | | 4,732,116 | | | $ | 4,747,496 | |
| | | | | | | | | | | | | | |
| | | | |
| | Total Senior Floating Rate Interests (Cost $206,805,773) | | | | | | | | | | | 198,943,611 | |
| | | | | | | | | | | | | | |
| | | | |
| | | | | | | | Shares | | | | |
| | Escrows and Litigation Trusts (Cost $62,602) 0.0% | | | | | | | | | | | | |
| a,c | | Motors Liquidation Co., Escrow Account, cvt. pfd., C | | | United States | | | | 1,400,000 | | | | — | |
| | | | | | | | | | | | | | |
| | | | |
| | Total Investments before Short Term Investments (Cost $5,232,784,545) | | | | | | | | | | | 5,749,996,680 | |
| | | | | | | | | | | | | | |
| | Short Term Investments 5.1% | | | | | | | | | | | | |
| | | Money Market Funds (Cost $307,800,028) 5.1% | | | | | | | | | |
| m,n | | Institutional Fiduciary Trust Money Market Portfolio, 0.09% | | | United States | | | | 307,800,028 | | | | 307,800,028 | |
| | | | | | | | | | | | | | |
| o | | Investments from Cash Collateral Received for Loaned Securities 0.0%† | | | | | | | | | | | | |
| | | Money Market Funds (Cost $2,450,000) 0.0%† | | | | | | | | | |
| m,n | | Institutional Fiduciary Trust Money Market Portfolio, 0.09% | | | United States | | | | 2,450,000 | | | | 2,450,000 | |
| | | | | | | | | | | | | | |
| | | | |
| | | | | | | | Principal Amount* | | | | |
| | | Repurchase Agreement (Cost $612,840) 0.0%† | | | | | | | | | |
| p | | Joint Repurchase Agreement, 0.50%, 1/03/17 (Maturity Value $612,874) | | | | | | | | | | | | |
| | BNP Paribas Securities Corp. | | | | | | | | | | | | |
| | Collateralized by qU.S. Treasury Bill, 2/02/17; U.S. Treasury Note, 1.00% - 3.50%, 12/31/16 - 11/15/20; U.S. Treasury Strips, 11/15/20 (valued at $625,097) | | | United States | | | | 612,840 | | | | 612,840 | |
| | | | | | | | | | | | | | |
| | | | |
| | Total Investments from Cash Collateral Received for Loaned Securities (Cost $3,062,840) | | | | | | | | | | | 3,062,840 | |
| | | | | | | | | | | | | | |
| | Total Investments (Cost $5,543,647,413) 99.4% | | | | | | | | | | | 6,060,859,548 | |
| | Other Assets, less Liabilities 0.6% | | | | | | | | | | | 33,858,039 | |
| | | | | | | | | | | | | | |
| | Net Assets 100.0% | | | | | | | | | | $ | 6,094,717,587 | |
| | | | | | | | | | | | | | |
FRANKLIN TEMPLETON VARIABLE INSURANCE PRODUCTS TRUST
STATEMENT OF INVESTMENTS
Franklin Income VIP Fund (continued)
See Abbreviations on page FI-33.
†Rounds to less than 0.1% of net assets.
*The principal amount is stated in U.S. dollars unless otherwise indicated. aNon-income producing.
bSee Note 8 regarding restricted securities.
cSecurity has been deemed illiquid because it may not be able to be sold within seven days. At December 31, 2016 , the aggregate value of these securities was $4,740,203, representing 0.1% of net assets.
dSee Note 1(d) regarding equity-linked securities.
eSecurity was purchased pursuant to Rule 144A under the Securities Act of 1933 and may be sold in transactions exempt from registration only to qualified institutional buyers or in a public offering registered under the Securities Act of 1933. These securities have been deemed liquid under guidelines approved by the Trust’s Board of Trustees. At December 31, 2016, the aggregate value of these securities was $1,152,969,606, representing 18.9% of net assets.
fSee Note 7 regarding defaulted securities.
gThe coupon rate shown represents the rate at period end.
hIncome may be received in additional securities and/or cash.
iAt December 31, 2016, pursuant to the Fund’s policies and the requirements of applicable securities law, the Fund is restricted from trading this security at year end.
jA portion or all of the security is on loan at December 31, 2016. See Note 1(e).
kPerpetual security with no stated maturity date.
lSee Note 1(f) regarding senior floating rate interests.
mSee Note 3(e) regarding investments in affiliated management investment companies.
nThe rate shown is the annualized seven-day yield at period end.
oSee Note 1(e) regarding securities on loan.
pSee Note 1(c) regarding joint repurchase agreement.
qThe security was issued on a discount basis with no stated coupon rate.
| | | | |
| FI-20 | | Annual Report | The accompanying notes are an integral part of these financial statements. | | |
FRANKLIN TEMPLETON VARIABLE INSURANCE PRODUCTS TRUST
Financial Statements
Statement of Assets and Liabilities
December 31, 2016
| | | | |
| | | Franklin
Income VIP
Fund | |
Assets: | | | | |
Investments in securities: | | | | |
Cost - Unaffiliated issuers | | $ | 5,232,784,545 | |
Cost - Non-controlled affiliates (Note 3e) | | | 310,250,028 | |
Cost - Repurchase agreements | | | 612,840 | |
| | | | |
Total cost of investments | | $ | 5,543,647,413 | |
| | | | |
Value - Unaffiliated issuers | | $ | 5,749,996,680 | |
Value - Non-controlled affiliates (Note 3e) | | | 310,250,028 | |
Value - Repurchase agreements | | | 612,840 | |
| | | | |
Total value of investments (includes securities loaned in the amount of $2,984,480) | | | 6,060,859,548 | |
Cash | | | 863,676 | |
Receivables: | | | | |
Investment securities sold | | | 757,737 | |
Capital shares sold | | | 1,364,798 | |
Dividends and interest | | | 44,342,772 | |
Other assets | | | 634 | |
| | | | |
Total assets | | | 6,108,189,165 | |
| | | | |
Liabilities: | | | | |
Payables: | | | | |
Capital shares redeemed | | | 5,440,266 | |
Management fees | | | 2,214,311 | |
Distribution fees | | | 2,265,545 | |
Payable upon return of securities loaned | | | 3,062,840 | |
Accrued expenses and other liabilities | | | 488,616 | |
| | | | |
Total liabilities | | | 13,471,578 | |
| | | | |
Net assets, at value | | $ | 6,094,717,587 | |
| | | | |
Net assets consist of: | | | | |
Paid-in capital | | $ | 6,215,721,736 | |
Undistributed net investment income | | | 258,365,808 | |
Net unrealized appreciation (depreciation) | | | 517,184,433 | |
Accumulated net realized gain (loss) | | | (896,554,390 | ) |
| | | | |
Net assets, at value | | $ | 6,094,717,587 | |
| | | | |
| |
| Class 1: | | | | |
Net assets, at value | | $ | 696,226,593 | |
| | | | |
Shares outstanding. | | | 43,860,523 | |
| | | | |
Net asset value and maximum offering price per share | | $ | 15.87 | |
| | | | |
| |
| Class 2: | | | | |
Net assets, at value | | $ | 5,088,555,854 | |
| | | | |
Shares outstanding | | | 330,921,115 | |
| | | | |
Net asset value and maximum offering price per share | | $ | 15.38 | |
| | | | |
| |
| Class 4: | | | | |
Net assets, at value | | $ | 309,935,140 | |
| | | | |
Shares outstanding | | | 19,728,974 | |
| | | | |
Net asset value and maximum offering price per share | | $ | 15.71 | |
| | | | |
| | | | | | |
| | | The accompanying notes are an integral part of these financial statements. | Annual Report | | | FI-21 | |
FRANKLIN TEMPLETON VARIABLE INSURANCE PRODUCTS TRUST
FINANCIAL STATEMENTS
Statement of Operations
for the year ended December 31, 2016
| | | | |
| | | Franklin Income VIP Fund | |
Investment income: | | | | |
Dividends: | | | | |
Unaffiliated issuers | | $ | 124,308,584 | |
Non-controlled affiliates (Note 3e) | | | 14,868 | |
Interest. | | | 161,299,288 | |
Income from securities loaned (net of fees and rebates) | | | 1,450,116 | |
| | | | |
Total investment income | | | 287,072,856 | |
| | | | |
Expenses: | | | | |
Management fees (Note 3a) | | | 26,559,717 | |
Distribution fees: (Note 3c) | | | | |
Class 2 | | | 12,227,908 | |
Class 4 | | | 1,061,284 | |
Custodian fees (Note 4) | | | 64,240 | |
Reports to shareholders | | | 361,893 | |
Professional fees | | | 342,699 | |
Trustees’ fees and expenses | | | 27,253 | |
Other | | | 168,760 | |
| | | | |
Total expenses | | | 40,813,754 | |
Expense reductions (Note 4) | | | (2,113 | ) |
Expenses waived/paid by affiliates (Note 3e) | | | (1,607,550 | ) |
| | | | |
Net expenses | | | 39,204,091 | |
| | | | |
Net investment income | | | 247,868,765 | |
| | | | |
Realized and unrealized gains (losses): | | | | |
Net realized gain (loss) from: | | | | |
Investments | | | 22,629,406 | |
Foreign currency transactions | | | 815,253 | |
| | | | |
Net realized gain (loss) | | | 23,444,659 | |
| | | | |
Net change in unrealized appreciation (depreciation) on: | | | | |
Investments | | | 499,708,357 | |
Translation of other assets and liabilities denominated in foreign currencies | | | (17,754 | ) |
| | | | |
Net change in unrealized appreciation (depreciation) | | | 499,690,603 | |
| | | | |
Net realized and unrealized gain (loss) | | | 523,135,262 | |
| | | | |
Net increase (decrease) in net assets resulting from operations | | $ | 771,004,027 | |
| | | | |
| | | | |
| FI-22 | | Annual Report | The accompanying notes are an integral part of these financial statements. | | |
FRANKLIN TEMPLETON VARIABLE INSURANCE PRODUCTS TRUST
FINANCIAL STATEMENTS
Statements of Changes in Net Assets
| | | | | | | | |
| | | Franklin Income VIP Fund | |
| | | Year Ended December 31, | |
| | | 2016 | | | 2015 | |
Increase (decrease) in net assets: | | | | | | | | |
Operations: | | | | | | | | |
Net investment income | | $ | 247,868,765 | | | $ | 280,263,160 | |
Net realized gain (loss) | | | 23,444,659 | | | | (198,185,492 | ) |
Net change in unrealized appreciation (depreciation) | | | 499,690,603 | | | | (544,397,831 | ) |
| | | | |
Net increase (decrease) in net assets resulting from operations | | | 771,004,027 | | | | (462,320,163 | ) |
| | | | |
Distributions to shareholders from: | | | | | | | | |
Net investment income: | | | | | | | | |
Class 1 | | | (33,648,017 | ) | | | (32,196,540 | ) |
Class 2 | | | (243,664,392 | ) | | | (260,631,132 | ) |
Class 4 | | | (14,419,491 | ) | | | (15,803,892 | ) |
| | | | |
Total distributions to shareholders | | | (291,731,900 | ) | | | (308,631,564 | ) |
| | | | |
Capital share transactions: (Note 2) | | | | | | | | |
Class 1 | | | 34,616,416 | | | | (31,781,112 | ) |
Class 2 | | | (215,782,069 | ) | | | (463,715,750 | ) |
Class 4 | | | (21,239,696 | ) | | | (31,713,868 | ) |
| | | | |
Total capital share transactions | | | (202,405,349 | ) | | | (527,210,730 | ) |
| | | | |
Net increase (decrease) in net assets | | | 276,866,778 | | | | (1,298,162,457 | ) |
Net assets: | | | | | | | | |
Beginning of year | | | 5,817,850,809 | | | | 7,116,013,266 | |
| | | | |
End of year | | $ | 6,094,717,587 | | | $ | 5,817,850,809 | |
| | | | |
Undistributed net investment income included in net assets: | | | | | | | | |
End of year | | $ | 258,365,808 | | | $ | 284,418,214 | |
| | | | |
| | | | | | |
| The accompanying notes are an integral part of these financial statements. | Annual Report | | | FI-23 | |
FRANKLIN TEMPLETON VARIABLE INSURANCE PRODUCTS TRUST
Notes to Financial Statements
Franklin Income VIP Fund
1. Organization and Significant Accounting Policies
Franklin Templeton Variable Insurance Products Trust (Trust) is registered under the Investment Company Act of 1940 (1940 Act) as an open-end management investment company, consisting of nineteen separate funds and applies the specialized accounting and reporting guidance in U.S. Generally Accepted Accounting Principles (U.S. GAAP). Franklin Income VIP Fund (Fund) is included in this report. The financial statements of the remaining funds in the Trust are presented separately. Shares of the Fund are generally sold only to insurance company separate accounts to fund the benefits of variable life insurance policies or variable annuity contracts. The Fund offers three classes of shares: Class 1, Class 2 and Class 4. Each class of shares differs by its distribution fees, voting rights on matters affecting a single class and its exchange privilege.
The following summarizes the Fund’s significant accounting policies.
a. Financial Instrument Valuation
The Fund’s investments in financial instruments are carried at fair value daily. Fair value is the price that would be received to sell an asset or paid to transfer a liability in an orderly transaction between market participants on the measurement date. The Fund calculates the net asset value (NAV) per share as of 4 p.m. Eastern time each day the New York Stock Exchange (NYSE) is open for trading. Under compliance policies and procedures approved by the Trust’s Board of Trustees (the Board), the Fund’s administrator has responsibility for oversight of valuation, including leading the cross-functional Valuation Committee (VC). The VC provides administration and oversight of the Fund’s valuation policies and procedures, which are approved annually by the Board. Among other things, these procedures allow the Fund to utilize independent pricing services, quotations from securities and financial instrument dealers, and other market sources to determine fair value.
Equity securities listed on an exchange or on the NASDAQ National Market System are valued at the last quoted sale price or the official closing price of the day, respectively. Foreign equity securities are valued as of the close of trading on the foreign stock exchange on which the security is primarily traded or as of 4 p.m. Eastern time. The value is then converted into its U.S. dollar equivalent at the foreign exchange rate in effect at 4 p.m. Eastern time on the day that the value of the security is
determined. Over-the-counter (OTC) securities are valued within the range of the most recent quoted bid and ask prices. Securities that trade in multiple markets or on multiple exchanges are valued according to the broadest and most representative market. Certain equity securities are valued based upon fundamental characteristics or relationships to similar securities.
Debt securities generally trade in the OTC market rather than on a securities exchange. The Fund’s pricing services use multiple valuation techniques to determine fair value. In instances where sufficient market activity exists, the pricing services may utilize a market-based approach through which quotes from market makers are used to determine fair value. In instances where sufficient market activity may not exist or is limited, the pricing services also utilize proprietary valuation models which may consider market characteristics such as benchmark yield curves, credit spreads, estimated default rates, anticipated market interest rate volatility, coupon rates, anticipated timing of principal repayments, underlying collateral, and other unique security features in order to estimate the relevant cash flows, which are then discounted to calculate the fair value. Securities denominated in a foreign currency are converted into their U.S. dollar equivalent at the foreign exchange rate in effect at 4 p.m. Eastern time on the date that the values of the foreign debt securities are determined.
Investments in open-end mutual funds are valued at the closing NAV. Investments in repurchase agreements are valued at cost, which approximates fair value.
The Fund has procedures to determine the fair value of financial instruments for which market prices are not reliable or readily available. Under these procedures, the VC convenes on a regular basis to review such financial instruments and considers a number of factors, including significant unobservable valuation inputs, when arriving at fair value. The VC primarily employs a market-based approach which may use related or comparable assets or liabilities, recent transactions, market multiples, book values, and other relevant information for the investment to determine the fair value of the investment. An income-based valuation approach may also be used in which the anticipated future cash flows of the investment are discounted to calculate fair value. Discounts may also be applied due to the nature or duration of any restrictions on the disposition of the investments. Due to the inherent uncertainty of valuations of such investments, the fair values may differ significantly from the values that would have been used had an active market
FRANKLIN TEMPLETON VARIABLE INSURANCE PRODUCTS TRUST
NOTES TO FINANCIAL STATEMENTS
Franklin Income VIP Fund (continued)
existed. The VC employs various methods for calibrating these valuation approaches including a regular review of key inputs and assumptions, transactional back-testing or disposition analysis, and reviews of any related market activity.
Trading in securities on foreign securities stock exchanges and OTC markets may be completed before 4 p.m. Eastern time. In addition, trading in certain foreign markets may not take place on every Fund’s business day. Occasionally, events occur between the time at which trading in a foreign security is completed and 4 p.m. Eastern time that might call into question the reliability of the value of a portfolio security held by the Fund. As a result, differences may arise between the value of the Fund’s portfolio securities as determined at the foreign market close and the latest indications of value at 4 p.m. Eastern time. In order to minimize the potential for these differences, the VC monitors price movements following the close of trading in foreign stock markets through a series of country specific market proxies (such as baskets of American Depositary Receipts, futures contracts and exchange traded funds). These price movements are measured against established trigger thresholds for each specific market proxy to assist in determining if an event has occurred that may call into question the reliability of the values of the foreign securities held by the Fund. If such an event occurs, the securities may be valued using fair value procedures, which may include the use of independent pricing services.
When the last day of the reporting period is a non-business day, certain foreign markets may be open on those days that the Fund’s NAV is not calculated, which could result in differences between the value of the Fund’s portfolio securities on the last business day and the last calendar day of the reporting period. Any significant security valuation changes due to an open foreign market are adjusted and reflected by the Fund for financial reporting purposes.
b. Foreign Currency Translation
Portfolio securities and other assets and liabilities denominated in foreign currencies are translated into U.S. dollars based on the exchange rate of such currencies against U.S. dollars on the date of valuation. The Fund may enter into foreign currency exchange contracts to facilitate transactions denominated in a foreign currency. Purchases and sales of securities, income and expense items denominated in foreign currencies are translated into U.S. dollars at the exchange rate in effect on the transaction date. Portfolio securities and assets and liabilities denominated
in foreign currencies contain risks that those currencies will decline in value relative to the U.S. dollar. Occasionally, events may impact the availability or reliability of foreign exchange rates used to convert the U.S. dollar equivalent value. If such an event occurs, the foreign exchange rate will be valued at fair value using procedures established and approved by the Board.
The Fund does not separately report the effect of changes in foreign exchange rates from changes in market prices on securities held. Such changes are included in net realized and unrealized gain or loss from investments in the Statement of Operations.
Realized foreign exchange gains or losses arise from sales of foreign currencies, currency gains or losses realized between the trade and settlement dates on securities transactions and the difference between the recorded amounts of dividends, interest, and foreign withholding taxes and the U.S. dollar equivalent of the amounts actually received or paid. Net unrealized foreign exchange gains and losses arise from changes in foreign exchange rates on foreign denominated assets and liabilities other than investments in securities held at the end of the reporting period.
c. Joint Repurchase Agreement
The Fund enters into a joint repurchase agreement whereby its uninvested cash balance is deposited into a joint cash account with other funds managed by the investment manager or an affiliate of the investment manager and is used to invest in one or more repurchase agreements. The value and face amount of the joint repurchase agreement are allocated to the funds based on their pro-rata interest. A repurchase agreement is accounted for as a loan by the Fund to the seller, collateralized by securities which are delivered to the Fund’s custodian. The fair value, including accrued interest, of the initial collateralization is required to be at least 102% of the dollar amount invested by the funds, with the value of the underlying securities marked to market daily to maintain coverage of at least 100%. Repurchase agreements are subject to the terms of Master Repurchase Agreements (MRAs) with approved counterparties (sellers). The MRAs contain various provisions, including but not limited to events of default and maintenance of collateral for repurchase agreements. In the event of default by either the seller or the Fund, certain MRAs may permit the non-defaulting party to net and close-out all transactions, if any, traded under such agreements. The Fund may sell securities it holds as collateral and apply the proceeds towards the repurchase price and any
FRANKLIN TEMPLETON VARIABLE INSURANCE PRODUCTS TRUST
NOTES TO FINANCIAL STATEMENTS
Franklin Income VIP Fund (continued)
1. Organization and Significant Accounting Policies (continued)
c. Joint Repurchase Agreement (continued)
other amounts owed by the seller to the Fund in the event of default by the seller. This could involve costs or delays in addition to a loss on the securities if their value falls below the repurchase price owed by the seller. The joint repurchase agreement held by the Fund at year end, as indicated in the Statement of Investments, had been entered into on December 30, 2016.
d. Equity-Linked Securities
The Fund invests in equity-linked securities. Equity-linked securities are hybrid financial instruments that generally combine both debt and equity characteristics into a single note form. Income received from equity-linked securities is recorded as realized gains in the Statement of Operations and may be based on the performance of an underlying equity security, an equity index, or an option position. The risks of investing in equity-linked securities include unfavorable price movements in the underlying security and the credit risk of the issuing financial institution. There may be no guarantee of a return of principal with equity-linked securities and the appreciation potential may be limited. Equity-linked securities may be more volatile and less liquid than other investments held by the Fund.
e. Securities Lending
The Fund participates in an agency based securities lending program to earn additional income. The Fund receives cash collateral against the loaned securities in an amount equal to at least 102% of the fair value of the loaned securities. Collateral is maintained over the life of the loan in an amount not less than 100% of the fair value of loaned securities, as determined at the close of Fund business each day; any additional collateral required due to changes in security values is delivered to the Fund on the next business day. The collateral is deposited into a joint cash account with other funds and is used to invest in a money market fund managed by Franklin Advisers, Inc., an affiliate of the Fund, and/or a joint repurchase agreement. The Fund may receive income from the investment of cash collateral, in addition to lending fees and rebates paid by the borrower. Income from securities loaned, net of fees paid to the securities lending agent and/or third-party vendor, is reported separately in the Statement of Operations. The Fund bears the market risk with respect to the collateral investment, securities
loaned, and the risk that the agent may default on its obligations to the Fund. If the borrower defaults on its obligation to return the securities loaned, the Fund has the right to repurchase the securities in the open market using the collateral received. The securities lending agent has agreed to indemnify the Fund in the event of default by a third party borrower.
f. Senior Floating Rate Interests
The Fund invests in senior secured corporate loans that pay interest at rates which are periodically reset by reference to a base lending rate plus a spread. These base lending rates are generally the prime rate offered by a designated U.S. bank or the London InterBank Offered Rate (LIBOR). Senior secured corporate loans often require prepayment of principal from excess cash flows or at the discretion of the borrower. As a result, actual maturity may be substantially less than the stated maturity. Senior secured corporate loans in which the Fund invests are generally readily marketable, but may be subject to certain restrictions on resale.
g. Income and Deferred Taxes
It is the Fund’s policy to qualify as a regulated investment company under the Internal Revenue Code. The Fund intends to distribute to shareholders substantially all of its taxable income and net realized gains to relieve it from federal income and if applicable, excise taxes. As a result, no provision for U.S. federal income taxes is required.
The Fund may be subject to foreign taxation related to income received, capital gains on the sale of securities and certain foreign currency transactions in the foreign jurisdictions in which it invests. Foreign taxes, if any, are recorded based on the tax regulations and rates that exist in the foreign markets in which the Fund invests. When a capital gain tax is determined to apply, the Fund records an estimated deferred tax liability in an amount that would be payable if the securities were disposed of on the valuation date. As a result of several court cases, in certain countries across the European Union, the Fund filed additional tax reclaims for previously withheld taxes on dividends earned in those countries (EU reclaims). These additional filings are subject to various administrative proceedings by the local jurisdictions’ tax authorities within the European Union, as well as a number of related judicial proceedings. Income recognized, if any, for EU reclaims is reflected as other income in the Statement of Operations and any related receivable, if any, is reflected as European Union tax reclaims in the Statement of Assets and Liabilities. When
FRANKLIN TEMPLETON VARIABLE INSURANCE PRODUCTS TRUST
NOTES TO FINANCIAL STATEMENTS
Franklin Income VIP Fund (continued)
uncertainty exists as to the ultimate resolution of these proceedings, the likelihood of receipt of these EU reclaims, and the potential timing of payment, no amounts are reflected in the financial statements. For U.S. income tax purposes, when EU reclaims are received by the Fund and the Fund previously passed foreign tax credit on to its shareholders, the Fund must either amend historic tax reporting to shareholders or enter into a closing agreement with the Internal Revenue Service (IRS) in order to pay the associated tax liability on behalf of the Fund’s shareholders.
The Fund may recognize an income tax liability related to its uncertain tax positions under U.S. GAAP when the uncertain tax position has a less than 50% probability that it will be sustained upon examination by the tax authorities based on its technical merits. As of December 31, 2016, the Fund has determined that no tax liability is required in its financial statements related to uncertain tax positions for any open tax years (or expected to be taken in future tax years). Open tax years are those that remain subject to examination and are based on each tax jurisdiction’s statute of limitation.
h. Security Transactions, Investment Income, Expenses and Distributions
Security transactions are accounted for on trade date. Realized gains and losses on security transactions are determined on a specific identification basis. Interest income and estimated expenses are accrued daily. Amortization of premium and accretion of discount on debt securities are included in interest income. Facility fees are recognized as income over the expected term of the loan. Dividend income is recorded on the ex-dividend date except for certain dividends from securities where the dividend rate is not available. In such cases, the dividend is recorded as soon as the information is received by the Fund. Distributions from realized capital gains and other distributions, if any, are recorded on the ex-dividend date. Distributions to shareholders are recorded on the ex-dividend date and are determined according to income tax regulations (tax basis). Distributable earnings determined on a tax basis
may differ from earnings recorded in accordance with U.S. GAAP. These differences may be permanent or temporary. Permanent differences are reclassified among capital accounts to reflect their tax character. These reclassifications have no impact on net assets or the results of operations. Temporary differences are not reclassified, as they may reverse in subsequent periods.
Common expenses incurred by the Trust are allocated among the Funds based on the ratio of net assets of each Fund to the combined net assets of the Trust. Fund specific expenses are charged directly to the Fund that incurred the expense.
Realized and unrealized gains and losses and net investment income, not including class specific expenses, are allocated daily to each class of shares based upon the relative proportion of net assets of each class. Differences in per share distributions, by class, are generally due to differences in class specific expenses.
i. Accounting Estimates
The preparation of financial statements in accordance with U.S. GAAP requires management to make estimates and assumptions that affect the reported amounts of assets and liabilities at the date of the financial statements and the amounts of income and expenses during the reporting period. Actual results could differ from those estimates.
j. Guarantees and Indemnifications
Under the Trust’s organizational documents, its officers and trustees are indemnified by the Trust against certain liabilities arising out of the performance of their duties to the Trust. Additionally, in the normal course of business, the Trust, on behalf of the Fund, enters into contracts with service providers that contain general indemnification clauses. The Trust’s maximum exposure under these arrangements is unknown as this would involve future claims that may be made against the Trust that have not yet occurred. Currently, the Trust expects the risk of loss to be remote.
FRANKLIN TEMPLETON VARIABLE INSURANCE PRODUCTS TRUST
NOTES TO FINANCIAL STATEMENTS
Franklin Income VIP Fund (continued)
2. Shares of Beneficial Interest
At December 31, 2016, there were an unlimited number of shares authorized (without par value). Transactions in the Fund’s shares were as follows:
| | | | | | | | | | | | | | | | | | | | |
| | | Year Ended December 31, | |
| | | 2016 | | | | | | 2015 | |
| | | Shares | | | Amount | | | | | | Shares | | | Amount | |
| | | | | |
| Class 1 Shares: | | | | | | | | | | | | | | | | | | | | |
Shares sold | | | 6,134,123 | | | $ | 87,911,597 | | | | | | | | 1,738,174 | | | $ | 27,618,019 | |
Shares issued in reinvestment of distributions | | | 2,331,810 | | | | 33,648,017 | | | | | | | | 2,040,338 | | | | 32,196,540 | |
Shares redeemed | | | (5,877,695 | ) | | | (86,943,198 | ) | | | | | | | (5,869,235 | ) | | | (91,595,671 | ) |
| | | | |
Net increase (decrease) | | | 2,588,238 | | | $ | 34,616,416 | | | | | | | | (2,090,723 | ) | | $ | (31,781,112 | ) |
| | | | |
| Class 2 Shares: | | | | | | | | | | | | | | | | | | | | |
Shares sold | | | 25,914,952 | | | $ | 378,696,453 | | | | | | | | 21,413,080 | | | $ | 334,630,165 | |
Shares issued in reinvestment of distributions | | | 17,417,040 | | | | 243,664,392 | | | | | | | | 17,001,378 | | | | 260,631,132 | |
Shares redeemed | | | (58,055,463 | ) | | | (838,142,914 | ) | | | | | | | (69,202,126 | ) | | | (1,058,977,047 | ) |
| | | | |
Net increase (decrease) | | | (14,723,471 | ) | | $ | (215,782,069 | ) | | | | | | | (30,787,668 | ) | | $ | (463,715,750 | ) |
| | | | |
| Class 4 Shares: | | | | | | | | | | | | | | | | | | | | |
Shares sold | | | 1,804,015 | | | $ | 26,579,870 | | | | | | | | 2,745,531 | | | $ | 43,147,056 | |
Shares issued in reinvestment of distributions | | | 1,008,356 | | | | 14,419,491 | | | | | | | | 1,010,479 | | | | 15,803,892 | |
Shares redeemed | | | (4,209,003 | ) | | | (62,239,057 | ) | | | | | | | (5,843,737 | ) | | | (90,664,816 | ) |
| | | | |
Net increase (decrease) | | | (1,396,632 | ) | | $ | (21,239,696 | ) | | | | | | | (2,087,727 | ) | | $ | (31,713,868 | ) |
| | | | |
3. Transactions with Affiliates
Franklin Resources, Inc. is the holding company for various subsidiaries that together are referred to as Franklin Templeton Investments. Certain officers and trustees of the Fund are also officers and/or directors of the following subsidiaries:
| | |
| Subsidiary | | Affiliation |
Franklin Advisers, Inc. (Advisers) | | Investment manager |
Franklin Templeton Services, LLC (FT Services) | | Administrative manager |
Franklin Templeton Distributors, Inc. (Distributors) | | Principal underwriter |
Franklin Templeton Investor Services, LLC (Investor Services) | | Transfer agent |
a. Management Fees
The Fund pays an investment management fee to Advisers based on the average daily net assets of the Fund as follows:
| | |
| Annualized Fee Rate | | Net Assets |
0.625% | | Up to and including $100 million |
0.500% | | Over $100 million, up to and including $250 million |
0.450% | | Over $250 million, up to and including $7.5 billion |
0.440% | | Over $7.5 billion, up to and including $10 billion |
0.430% | | Over $10 billion, up to and including $12.5 billion |
0.420% | | Over $12.5 billion, up to and including $15 billion |
0.400% | | In excess of $15 billion |
FRANKLIN TEMPLETON VARIABLE INSURANCE PRODUCTS TRUST
NOTES TO FINANCIAL STATEMENTS
Franklin Income VIP Fund (continued)
For the year ended December 31, 2016, the effective investment management fee rate was 0.454% of the Fund’s average daily net assets.
b. Administrative Fees
Under an agreement with Advisers, FT Services provides administrative services to the Fund. The fee is paid by Advisers based on the Fund’s average daily net assets, and is not an additional expense of the Fund.
c. Distribution Fees
The Board has adopted distribution plans for Class 2 and Class 4 shares pursuant to Rule 12b-1 under the 1940 Act. Under the Fund’s compensation distribution plans, the Fund pays Distributors for costs incurred in connection with the servicing, sale and distribution of the Fund’s shares up to 0.35%, per year of its average daily net assets of each class. The Board has agreed to limit the current rate to 0.25% per year for Class 2. The plan year, for purposes of monitoring compliance with the maximum annual plan rates, is February 1 through January 31.
d. Transfer Agent Fees
Investor Services, under terms of an agreement, performs shareholder servicing for the Fund and is not paid by the Fund for the services.
e. Investments in Affiliated Management Investment Companies
The Fund invests in one or more affiliated management investment companies for purposes other than exercising a controlling influence over the management or policies. Management fees paid by the Fund are waived on assets invested in the affiliated management investment companies, as noted in the Statement of Operations, in an amount not to exceed the management and administrative fees paid directly or indirectly by each affiliate. During the year ended December 31, 2016, the Fund held investments in affiliated management investment companies as follows:
| | | | | | | | | | | | | | | | | | | | | | | | | | | | | | | | |
| | | Number of Shares Held at Beginning
of Year | | | Gross
Additions | | | Gross
Reductions | | | Number of Shares Held at End of Year | | | Value at End of Year | | | Investment
Income | | | Realized Gain (Loss) | | | % of Affiliated Fund Shares Outstanding Held at End of Year | |
| Non-Controlled Affiliates | | | | | | | | | | | | | | | | | | | | | | | | | | | | | | | | |
Institutional Fiduciary Trust Money Market Portfolio, 0.09% | | | 589,053,827 | | | | 1,471,178,493 | | | | (1,749,982,292 | ) | | | 310,250,028 | | | $ | 310,250,028 | | | $ | 14,868 | | | $ | — | | | | 1.9% | |
| | | | | | | | | | | | | | | | | | | | | | | | |
f. Other Affiliated Transactions
At December 31, 2016, Franklin Templeton Variable Insurance Products Trust—Franklin Founding Funds Allocation VIP Fund owned 5.3% of the Fund’s outstanding shares.
4. Expense Offset Arrangement
The Fund has entered into an arrangement with its custodian whereby credits realized as a result of uninvested cash balances are used to reduce a portion of the Fund’s custodian expenses. During the year ended December 31, 2016, the custodian fees were reduced as noted in the Statement of Operations.
FRANKLIN TEMPLETON VARIABLE INSURANCE PRODUCTS TRUST
NOTES TO FINANCIAL STATEMENTS
Franklin Income VIP Fund (continued)
5. Income Taxes
For tax purposes, capital losses may be carried over to offset future capital gains. Capital loss carryforwards with no expiration, if any, must be fully utilized before those losses with expiration dates.
At December 31, 2016, the capital loss carryforwards were as follows:
| | | | |
Capital loss carryforwards subject to expiration: | | | | |
2017 | | $ | 521,405,875 | |
2018 | | | 157,561,044 | |
Capital loss carryforwards not subject to expiration: | | | | |
Short term | | | 135,162,624 | |
Long term | | | 76,910,085 | |
| | | | |
Total capital loss carryforwards | | $ | 891,039,628 | |
| | | | |
During the year ended December 31, 2016, the Fund utilized $6,170,076 of capital loss carryforwards.
On December 31, 2016, the Fund had expired capital loss carryforwards of $51,901,081, which were reclassified to paid-in capital.
The tax character of distributions paid during the years ended December 31, 2016 and 2015, was as follows:
| | | | | | | | |
| | | 2016 | | | 2015 | |
Distributions paid from ordinary income | | $ | 291,731,900 | | | $ | 308,631,564 | |
| | | | |
At December 31, 2016, the cost of investments, net unrealized appreciation (depreciation), and undistributed ordinary income for income tax purposes were as follows:
| | | | |
Cost of investments | | $ | 5,546,860,635 | |
| | | | |
Unrealized appreciation | | $ | 816,046,074 | |
Unrealized depreciation | | | (302,047,161 | ) |
| | | | |
Net unrealized appreciation (depreciation) | | $ | 513,998,913 | |
| | | | |
Distributable earnings - undistributed ordinary income | | $ | 255,750,685 | |
| | | | |
Differences between income and/or capital gains as determined on a book basis and a tax basis are primarily due to differing treatments of bond discounts and premiums and wash sales.
6. Investment Transactions
Purchases and sales of investments (excluding short term securities) for the year ended December 31, 2016, aggregated $2,202,732,116 and $2,046,466,359, respectively.
At December 31, 2016, in connection with securities lending transactions, the Fund loaned corporate bonds and received $3,062,840 of cash collateral. The gross amount of recognized liability for such transactions is included in payable upon return of securities loaned in the Statement of Assets and Liabilities. The agreements can be terminated at any time.
FRANKLIN TEMPLETON VARIABLE INSURANCE PRODUCTS TRUST
NOTES TO FINANCIAL STATEMENTS
Franklin Income VIP Fund (continued)
7. Credit Risk and Defaulted Securities
At December 31, 2016, the Fund had 32.4% of its portfolio invested in high yield, senior secured floating rate notes, or other securities rated below investment grade and unrated securities, if any. These securities may be more sensitive to economic conditions causing greater price volatility and are potentially subject to a greater risk of loss due to default than higher rated securities.
The Fund held defaulted securities and/or other securities for which the income has been deemed uncollectible. At December 31, 2016, the aggregate value of these securities was $24,449,260, representing 0.4% of the Fund’s net assets. The Fund discontinues accruing income on securities for which income has been deemed uncollectible and provides an estimate for losses on interest receivable. The securities have been identified in the accompanying Statement of Investments.
8. Restricted Securities
The Fund invests in securities that are restricted under the Securities Act of 1933 (1933 Act) or which are subject to legal, contractual, or other agreed upon restrictions on resale. Restricted securities are often purchased in private placement transactions, and cannot be sold without prior registration unless the sale is pursuant to an exemption under the 1933 Act. Disposal of these securities may require greater effort and expense, and prompt sale at an acceptable price may be difficult. The Fund may have registration rights for restricted securities. The issuer generally incurs all registration costs.
At December 31, 2016, the Fund held investments in restricted securities, excluding certain securities exempt from registration under the 1933 Act deemed to be liquid, as follows:
| | | | | | | | | | | | | | |
| | | | | Acquisition | | | | | | | |
| Shares | | Issuer | | Date | | | Cost | | | Value | |
74,398 | | a Halcon Resources Corp. (Value is 0.0%† of Net Assets) | | | 10/23/15 | | | $ | 633,916 | | | $ | 623,470 | |
| | | | | | | | | | | | | | |
†Rounds to less than 0.1% of net assets.
aThe Fund also invests in unrestricted securities of other investments in the issuer, valued at $9,405,000 as of December 31, 2016.
9. Credit Facility
The Fund, together with other U.S. registered and foreign investment funds (collectively, Borrowers), managed by Franklin Templeton Investments, are borrowers in a joint syndicated senior unsecured credit facility totaling $2 billion (Global Credit Facility) which matured on February 10, 2017. This Global Credit Facility provides a source of funds to the Borrowers for temporary and emergency purposes, including the ability to meet future unanticipated or unusually large redemption requests. Effective February 10, 2017, the Borrowers renewed the Global Credit Facility for a one year term, maturing February 9, 2018, for a total of $2 billion.
Under the terms of the Global Credit Facility, the Fund shall, in addition to interest charged on any borrowings made by the Fund and other costs incurred by the Fund, pay its share of fees and expenses incurred in connection with the implementation and maintenance of the Global Credit Facility, based upon its relative share of the aggregate net assets of all of the Borrowers, including an annual commitment fee of 0.15% based upon the unused portion of the Global Credit Facility. These fees are reflected in other expenses in the Statement of Operations. During the year ended December 31, 2016, the Fund did not use the Global Credit Facility.
FRANKLIN TEMPLETON VARIABLE INSURANCE PRODUCTS TRUST
NOTES TO FINANCIAL STATEMENTS
Franklin Income VIP Fund (continued)
10. Fair Value Measurements
The Fund follows a fair value hierarchy that distinguishes between market data obtained from independent sources (observable inputs) and the Fund’s own market assumptions (unobservable inputs). These inputs are used in determining the value of the Fund’s financial instruments and are summarized in the following fair value hierarchy:
| | • | | Level 1 – quoted prices in active markets for identical financial instruments |
| | • | | Level 2 – other significant observable inputs (including quoted prices for similar financial instruments, interest rates, prepayment speed, credit risk, etc.) |
| | • | | Level 3 – significant unobservable inputs (including the Fund’s own assumptions in determining the fair value of financial instruments) |
The input levels are not necessarily an indication of the risk or liquidity associated with financial instruments at that level.
For movements between the levels within the fair value hierarchy, the Fund has adopted a policy of recognizing the transfers as of the date of the underlying event which caused the movement.
A summary of inputs used as of December 31, 2016, in valuing the Fund’s assets carried at fair value, is as follows:
| | | | | | | | | | | | | | | | |
| | | Level 1 | | | Level 2 | | | Level 3 | | | Total | |
| | | | |
| Assets: | | | | | | | | | | | | | | | | |
Investments in Securities: | | | | | | | | | | | | | | | | |
Equity Investments:a | | | | | | | | | | | | | | | | |
Banks | | $ | 320,967,125 | | | $ | 12,943,750 | | | $ | — | | | $ | 333,910,875 | |
Energy | | | 527,825,188 | | | | 14,053,482 | | | | 623,470 | | | | 542,502,140 | |
Transportation | | | 67,392,000 | | | | 4,740,203 | | | | — | | | | 72,132,203 | |
All Other Equity Investmentsb | | | 2,263,036,228 | | | | — | | | | — | | | | 2,263,036,228 | |
Equity-Linked Securities | | | — | | | | 332,245,856 | | | | — | | | | 332,245,856 | |
Convertible Bonds | | | — | | | | 63,599,153 | | | | — | | | | 63,599,153 | |
Corporate Bonds | | | — | | | | 1,943,626,614 | | | | — | | | | 1,943,626,614 | |
Senior Floating Rate Interests | | | — | | | | 198,943,611 | | | | — | | | | 198,943,611 | |
Escrows and Litigation Trusts | | | — | | | | — | | | | — | c | | | — | |
Short Term Investments | | | 310,250,028 | | | | 612,840 | | | | — | | | | 310,862,868 | |
| | | | |
Total Investments in Securities | | $ | 3,489,470,569 | | | $ | 2,570,765,509 | | | $ | 623,470 | | | $ | 6,060,859,548 | |
| | | | |
aIncludes common, preferred and convertible preferred stocks.
bFor detailed categories, see the accompanying Statement of Investments.
cIncludes securities determined to have no value at December 31, 2016.
A reconciliation of assets in which Level 3 inputs are used in determining fair value is presented when there are significant Level 3 financial instruments at the end of the year.
11. Investment Company Reporting Modernization
In October 2016, the U.S. Securities and Exchange Commission adopted new rules and amended existing rules (together, final rules) intended to modernize the reporting and disclosure of information by registered investment companies. In part, the final rules amend Regulation S-X and require standardized, enhanced disclosures about derivatives in investment company financial statements, as well as other amendments. The compliance date for the amendments to Regulation S-X is August 1, 2017. Management is currently evaluating the impact that the adoption of the amendments to Regulation S-X will have on the Fund’s financial statements and related disclosures.
FRANKLIN TEMPLETON VARIABLE INSURANCE PRODUCTS TRUST
NOTES TO FINANCIAL STATEMENTS
Franklin Income VIP Fund (continued)
12. Subsequent Events
The Fund has evaluated subsequent events through the issuance of the financial statements and determined that no events have occurred that require disclosure other than those already disclosed in the financial statements.
Abbreviations
| | | | | | |
| Currency | | Selected Portfolio |
| | | |
| EUR | | Euro | | ADR | | American Depositary Receipt |
| | | |
| | | | FRN | | Floating Rate Note |
| | | |
| | | | L/C | | Letter of Credit |
| | | |
| | | | MTN | | Medium Term Note |
| | | |
| | | | PIK | | Payment-In-Kind |
FRANKLIN TEMPLETON VARIABLE INSURANCE PRODUCTS TRUST
Report of Independent Registered Public Accounting Firm
Franklin Income VIP Fund
To the Board Trustees and Shareholders of Franklin Templeton Variable Insurance Products Trust
In our opinion, the accompanying statement of assets and liabilities, including the statement of investments, and the related statements of operations and of changes in net assets and the financial highlights present fairly, in all material respects, the financial position of
Franklin Income VIP Fund (the “Fund”) as of December 31, 2016, the results of its operations for the year then ended, the changes in its net assets for each of the two years in the period then ended and the financial highlights for the periods presented, in conformity with accounting principles generally accepted in the United States of America. These financial statements and financial highlights (hereafter referred to as “financial statements”) are the responsibility of the Fund’s management. Our responsibility is to express an opinion on these financial statements based on our audits. We conducted our audits of these financial statements in accordance with the standards of the Public Company Accounting Oversight Board (United States). Those standards require that we plan and perform the audit to obtain reasonable assurance about whether the financial statements are free of material misstatement. An audit includes examining, on a test basis, evidence supporting the amounts and disclosures in the financial statements, assessing the accounting principles used and significant estimates made by management, and evaluating the overall financial statement presentation. We believe that our audits, which included confirmation of securities as of December 31, 2016 by correspondence with the custodian, transfer agent and brokers, provide a reasonable basis for our opinion.
PricewaterhouseCoopers LLP
San Francisco, California
February 15, 2017
FRANKLIN TEMPLETON VARIABLE INSURANCE PRODUCTS TRUST
Tax Information (unaudited)
Franklin Income VIP Fund
Under Section 854(b)(1)(A) of the Internal Revenue Code, the Fund hereby reports 27.97% of the ordinary income dividends as income qualifying for the dividends received deduction for the fiscal year ended December 31, 2016.
Franklin Large Cap Growth VIP Fund
This annual report for Franklin Large Cap Growth VIP Fund covers the fiscal year ended December 31, 2016.
Class 2 Performance Summary as of December 31, 2016
Average annual total return of Class 2 shares represents the average annual change in value, assuming reinvestment of dividends and capital gains. Average returns smooth out variations in returns, which can be significant; they are not the same as year-by-year results.
| | | | | | | | | | | | |
| Periods ended 12/31/16 | | 1-Year | | | 5-Year | | | 10-Year | |
Average Annual Total Return | | | -1.79% | | | | +11.02% | | | | +5.28% | |
Performance reflects the Fund’s Class 2 operating expenses, but does not include any contract fees, expenses or sales charges. If they had been included, performance would be lower. These charges and deductions, particularly for variable life policies, can have a significant effect on contract values and insurance benefits. See the contract prospectus for a complete description of these expenses, including sales charges.
Performance data represent past performance, which does not guarantee future results. Investment return and principal value will fluctuate, and you may have a gain or loss when you sell your shares. Current performance may differ from figures shown.
Total Return Index Comparison for a Hypothetical $10,000 Investment (1/1/07–12/31/16)
The graph below shows the change in value of a hypothetical $10,000 investment in the Fund over the indicated period and includes reinvestment of any income or distributions. The Fund’s performance is compared to the performance of the Standard & Poor’s® 500 Index (S&P 500®). One cannot invest directly in an index, and an index is not representative of the Fund’s portfolio. Please see Important Notes to Performance Information preceding the Fund Summaries.
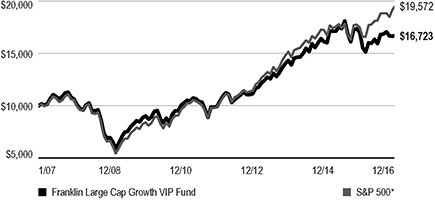
*Source: Morningstar. Please see Index Descriptions following the Fund Summaries.
FRANKLIN LARGE CAP GROWTH VIP FUND
Fund Goal and Main Investments
The Fund seeks capital appreciation. Under normal market conditions, the Fund invests at least 80% of its net assets in investments of large capitalization companies. For this Fund, large capitalization companies are those with market capitalization values within those of the top 50% of companies in the Russell 1000® Index at the time of purchase.1
Fund Risks
All investments involve risks, including possible loss of principal. Stock prices fluctuate, sometimes rapidly and dramatically, due to factors affecting individual companies, particular industries or sectors, or general market conditions. The Fund may focus on particular sectors of the market from time to time, which can carry greater risks of adverse developments in such sectors. Smaller or midsized companies can be particularly sensitive to changing economic conditions, and their prospects for growth are less certain than those of larger, more established companies. Investments in foreign securities may involve special risks including currency fluctuations and economic and political uncertainty. The Fund is actively managed but there is no guarantee that the manager’s investment decisions will produce the desired results. The Fund’s prospectus also includes a description of the main investment risks.
Performance Overview
You can find the Fund’s one-year total return in the Performance Summary. In comparison, the Fund’s benchmark, the S&P 500, generated a +11.96% total return.2
Economic and Market Overview
The U.S. economy expanded during the 12 months under review. The economy grew at a faster pace in 2016’s third quarter than in the second and first quarters, mainly due to personal consumption expenditures, exports, private inventory investment, federal government spending and nonresidential fixed investment. Manufacturing conditions remained volatile but generally expanded, and the services sector also continued to grow for most of the period. The unemployment rate decreased from 5.0% in December 2015 to 4.7% at period-end.3 Monthly retail sales grew for most of the review
Portfolio Composition
Based on Total Net Assets as of 12/31/16
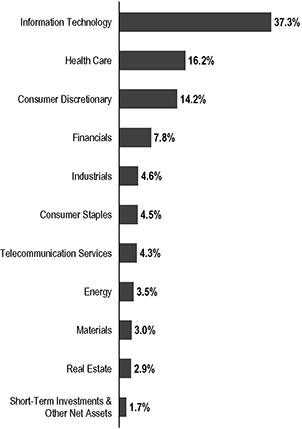
period, and rose to its highest level in April in more than a year, due to a broad-based increase across most retail categories. Inflation, as measured by the Consumer Price Index, remained relatively subdued for most of the period, but rose in 2016’s fourth quarter.
After maintaining its target interest rate in the 0.25%–0.50% range for nearly a year, the U.S. Federal Reserve (Fed), at its December meeting, increased its target range for the federal funds rate to 0.50%–0.75%, as policymakers noted improvement in U.S. labor market and inflation. The Federal Open Market Committee also hinted at three additional hikes in 2017. Furthermore, the Fed raised its forecast for 2017 U.S. economic growth, and lowered its unemployment projections.
1. Please see Index Descriptions following the Fund Summaries.
2. Source: Morningstar. One cannot invest directly in an index, and an index is not representative of the Fund’s portfolio. Please see Index Descriptions following the Fund Summaries.
3. Source: Bureau of Labor Statistics.
The dollar value, number of shares or principal amount, and names of all portfolio holdings are listed in the Fund’s Statement of Investments (SOI).
FRANKLIN LARGE CAP GROWTH VIP FUND
U.S. equity markets rose during the review period, benefiting from mostly upbeat economic data and better corporate earnings in the U.S., signs of improvement in the Chinese and European economies and ongoing expansionary monetary policies from key central banks. Other contributing factors included investors’ expectations of higher interest rates and inflation in the U.S. driven by hopes of expansionary fiscal policies under the new president Donald Trump, and an Organization of the Petroleum Exporting Countries deal to curb oil production. The Fed’s decision to keep interest rates unchanged at its November meeting further boosted investor confidence. However, the U.K.’s historic vote to leave the European Union (also known as “Brexit”) and global growth concerns weighed on market sentiment. The broad U.S. stock market ended the 12-month period higher, as measured by the S&P 500.
Investment Strategy
We are a research driven, fundamental investor, pursuing a growth strategy. As a “bottom-up” investor focusing primarily on individual securities, we seek companies that have identifiable drivers of future earnings growth and that present, in our opinion, the best trade-off between that potential earnings growth, business and financial risk, and valuation.
Manager’s Discussion
Looking back on the key factors impacting the Fund’s returns during the 12 months under review, we would like to remind shareholders that our investment strategy is primarily bottom-up and driven by individual stock selection. However, we recognize that a sector-based discussion can be a helpful way to organize a portfolio review of key performance drivers. We employed our long-held strategy: bottom-up, individual company, fundamental research aimed at opportunistically finding what we believed to be outstanding large-cap companies across all sectors, at valuations we believed understated their fair worth, with future growth potential being a key driver of estimated worth.
During the year under review, some sectors represented in the Fund’s portfolio contributed to absolute performance. Relative to the S&P 500, an underweighting in the consumer staples sector and stock selection in the materials sector helped performance.
In consumer staples, WhiteWave Foods contributed to relative performance. The company’s shares surged as multinational food company Danone announced in July its intention to acquire WhiteWave in an all-cash transaction. We believed the
purchase price was fair so decided to exit our position following the announcement.
Within the materials sector, trade and construction materials manufacturer Martin Marietta Materials enjoyed strong demand for aggregates and cement across all three of its end-markets: residential construction, non-residential and infrastructure. The company’s stock was strong following the U.S. election on expectations for a large increase in infrastructure spending at the federal level, as well as expectations around the benefits of a lower corporate tax rate. It also benefited from the passage of the Fixing America’s Surface Transportation Act in late 2015, a federal highway bill that provided funding visibility for the next five years, along with the passage of several state gas tax increases and other initiatives to support the construction of new roads, highways and bridges. Share buybacks have also continued.
Other individual contributors to the Fund’s relative performance included Texas-based oil and natural gas company Diamondback Energy, information technology (IT) designer and manufacturer NVIDIA and mobile communications services provider T-Mobile. Diamondback Energy’s shares performed well as crude oil prices recovered from recent lows. Additionally, the company was able to expand its oil position in the Permian Basin of West Texas by entering the emerging western side of the area, called the Delaware Basin, at a reasonable price and without sacrificing its low debt balance sheet. Diamondback continued to execute on its existing Permian acreage and exceeded expectations for production growth throughout the year. In late 2016, Diamondback acquired Brigham Resources, which doubled its Permian Basin oil acreage and reduced doubts about the longevity of its future reserves. NVIDIA’s shares performed well above expectations in 2016, and its valuation expanded accordingly. The company executed quite well in its primary graphics processing unit (GPU) market versus its main competitor Advanced Micro Devices, which was late getting out their own GPU. NVIDIA’s shares appreciated also due to a dramatic increase in investor excitement regarding virtual reality, artificial intelligence adoption and Advanced Driver Assistance Systems. T-Mobile did well in 2016 as the only secularly growing telecommunication services company in the U.S. The company continues to grow and take market share against its competitors through promotions and a unique marketing strategy. T-Mobile was also the beneficiary of renewed speculation of the company being acquired by both Softbank/Sprint or by cable companies Comcast/Charter.
In contrast, relative to the S&P 500, a major detractor from the Fund’s relative performance was stock selection and an
FRANKLIN LARGE CAP GROWTH VIP FUND
Top 10 Holdings
12/31/16
| | |
Company Sector/Industry | | % of Total Net Assets |
Alphabet Inc. Information Technology | | 4.5% |
Amazon.com Inc. Consumer Discretionary | | 4.4% |
Apple Inc. Information Technology | | 4.3% |
Facebook Inc. Information Technology | | 4.2% |
Visa Inc. Information Technology | | 3.9% |
Celgene Corp. Health Care | | 3.8% |
Microsoft Corp. Information Technology | | 3.5% |
Mastercard Inc. Information Technology | | 3.4% |
SBA Communications Corp. Telecommunication Services | | 3.1% |
Allergan PLC Health Care | | 2.3% |
overweighting in the health care sector. Stock selection in the IT sector also detracted from relative results but it was slightly offset by a favorable overweighting in the sector. Finally, stock selection and an overweighting in the consumer discretionary sector hampered relative performance.
Key detractors in the health care sector included Allergan and Celgene. Pharmaceutical firm Allergan’s planned sale to Pfizer was terminated after the U.S. Treasury modified tax rules that eliminated many of the financial benefits of the merger. Also, investors soured on specialty pharmaceutical stocks due to drug pricing concerns. Additionally, Allergan’s third quarter earnings performed below expectations. Biopharmaceutical company Celgene’s stock performance was flat during 2016. Its key myeloma franchise delivered solid growth, but there was some weakening in the solid tumor franchise as a result of increased competition from immuno-oncology drugs. Additionally, Celgene lagged biotechnology and pharmaceutical peers that provided a dividend, as investors sought yield. A lack of meaningful pipeline catalysts further deterred the company’s performance.
Within IT, business and employment-oriented social networking service LinkedIn and network security solutions provider Palo Alto Networks hindered the Fund’s performance. LinkedIn’s shares declined in February 2016 after the company reported fourth quarter 2015 revenues lower than consensus
estimates. We sold our LinkedIn position prior to it being acquired by Microsoft in mid-2016. Palo Alto Networks experienced difficulties during the period when investors became concerned about slowing product revenue growth and the impact of a public cloud on the company’s long-term growth potential. Nevertheless, given the growing importance of cyber security and Palo Alto’s differentiated platform offering, we believe that spending trends could re-accelerate over the next few quarters and we find the company’s valuation compelling at current levels.
Within the consumer discretionary sector, coffee and tea manufacturer and retailer Starbucks detracted from relative performance. Restaurant stocks weakened during most of 2016 as industry sales slowed and many headwinds persisted. Starbucks declined primarily because of investor concerns about slowing in-store sales in the Americas during the period.
Thank you for your participation in Franklin Large Cap Growth VIP Fund. We look forward to serving your future investment needs.
The foregoing information reflects our analysis, opinions and portfolio holdings as of December 31, 2016, the end of the reporting period. The way we implement our main investment strategies and the resulting portfolio holdings may change depending on factors such as market and economic conditions. These opinions may not be relied upon as investment advice or an offer for a particular security. The information is not a complete analysis of every aspect of any market, country, industry, security or the Fund. Statements of fact are from sources considered reliable, but the investment manager makes no representation or warranty as to their completeness or accuracy. Although historical performance is no guarantee of future results, these insights may help you understand our investment management philosophy.
FRANKLIN LARGE CAP GROWTH VIP FUND
Class 2 Fund Expenses
As an investor in a variable insurance contract (Contract) that indirectly provides for investment in an underlying mutual fund, you can incur transaction and/or ongoing expenses at both the Fund level and the Contract Level: (1) transaction expenses can include sales charges (loads) on purchases, surrender fees, transfer fees and premium taxes; and (2) ongoing expenses can include management fees, distribution and service (12b-1) fees, contract fees, annual maintenance fees, mortality and expense risk fees and other fees and expenses. All mutual funds and Contracts have some types of ongoing expenses. The table below shows Fund-level ongoing expenses and can help you understand these costs and compare them with those of other mutual funds offered through the Contract. The table assumes a $1,000 investment held for the six months indicated. Please refer to the Fund prospectus for additional information on operating expenses.
Actual Fund Expenses
The table below provides information about the actual account values and actual expenses in the columns under the heading “Actual.” In these columns the Fund’s actual return, which includes the effect of ongoing Fund expenses but does not include the effect of ongoing Contract expenses, is used to calculate the “Ending Account Value.”
You can estimate the Fund-level expenses you paid during the period by following these steps (of course, your account value and expenses will differ from those in this illustration):
| | Divide your account value by $1,000 |
| | (if your account had an $8,600 value, |
| | then $8,600 ÷ $1,000 = 8.6). |
| | Then multiply the result by the number under the headings “Actual” and “Fund-Level Expenses Paid During Period” |
| | (if Fund-Level Expenses Paid During Period were $7.50, |
| | then 8.6 x $7.50 = $64.50). |
In this illustration, the estimated expenses paid this period at the Fund level are $64.50.
Hypothetical Example for Comparison
with Other Mutual Funds
Under the heading “Hypothetical” in the table, information is provided about hypothetical account values and hypothetical expenses based on the Fund’s actual expense ratio and an assumed rate of return of 5% per year before expenses, which is not the Fund’s actual return. This information may not be used to estimate the actual ending account balance or expenses you paid for the period, but it can help you compare ongoing costs of investing in the Fund with those of other mutual funds offered through the Contract. To do so, compare this 5% hypothetical example with the 5% hypothetical examples that appear in the shareholder reports of other funds offered through the Contract.
Please note that expenses shown in the table are meant to highlight ongoing costs at the Fund level only and do not reflect any ongoing expenses at the Contract level, or transaction expenses at either the Fund or Contract levels. In addition, while the Fund does not have transaction expenses, if the transaction and ongoing expenses at the Contract level were included, the expenses shown below would be higher. You should consult your Contract prospectus or disclosure document for more information.
| | | | | | | | | | | | | | | | | | | | | | | | |
| | | | | | Actual
(actual return after expenses) | | | Hypothetical
(5% annual return before expenses) | | | | |
| Share Class | |
| Beginning Account
Value 7/1/16 |
| |
| Ending Account
Value 12/31/16 |
| |
| Fund-Level
Expenses Paid During Period 7/1/16–12/31/16 |
1 | |
| Ending Account
Value 12/31/16 |
| |
| Fund-Level
Expenses Paid During Period 7/1/16–12/31/16 |
1 | |
| Annualized
Expense
Ratio |
|
Class 2 | | | $1,000 | | | | $1,048.60 | | | | $5.51 | | | | $1,019.76 | | | | $5.43 | | | | 1.07 | % |
1. Expenses are equal to the annualized expense ratio for the six-month period as indicated above — in the far right column — multiplied by the simple average account value over the period indicated, and then multiplied by 184/366 to reflect the one-half year period.
FRANKLIN TEMPLETON VARIABLE INSURANCE PRODUCTS TRUST
Financial Highlights
Franklin Large Cap Growth VIP Fund
| | | | | | | | | | | | | | | | | | | | |
| | | Year Ended December 31, | |
| | | 2016 | | | 2015 | | | 2014 | | | 2013 | | | 2012 | |
| Class 1 | | | | | | | | | | | | | | | | | | | | |
Per share operating performance
(for a share outstanding throughout the year) | | | | | | | | | | | | | | | | | | | | |
| | | | | |
Net asset value, beginning of year | | | $18.42 | | | | $23.26 | | | | $20.91 | | | | $16.43 | | | | $14.75 | |
| | | | |
| | | | | |
| Income from investment operationsa: | | | | | | | | | | | | | | | | | | | | |
| | | | | |
Net investment income (loss)b | | | (0.04 | ) | | | (0.06 | ) | | | 0.11 | | | | 0.24 | | | | 0.21 | |
| | | | | |
Net realized and unrealized gains (losses) | | | (0.26 | ) | | | 1.56 | | | | 2.54 | | | | 4.48 | | | | 1.65 | |
| | | | |
Total from investment operations | | | (0.30 | ) | | | 1.50 | | | | 2.65 | | | | 4.72 | | | | 1.86 | |
| | | | |
| | | | | |
| Less distributions from: | | | | | | | | | | | | | | | | | | | | |
| | | | | |
Net investment income | | | — | | | | (0.13 | ) | | | (0.30 | ) | | | (0.24 | ) | | | (0.18 | ) |
| | | | | |
Net realized gains | | | (0.27 | ) | | | (6.21 | ) | | | — | | | | — | | | | — | |
| | | | |
Total distributions | | | (0.27 | ) | | | (6.34 | ) | | | (0.30 | ) | | | (0.24 | ) | | | (0.18 | ) |
| | | | |
Net asset value, end of year | | | $17.85 | | | | $18.42 | | | | $23.26 | | | | $20.91 | | | | $16.43 | |
| | | | |
| | | | | |
Total returnc | | | (1.49)% | | | | 5.89% | | | | 12.74% | | | | 28.92% | | | | 12.65% | |
| | | | | |
| Ratios to average net assets | | | | | | | | | | | | | | | | | | | | |
| | | | | |
Expenses | | | 0.80% | d | | | 0.78% | | | | 0.79% | | | | 0.79% | | | | 0.80% | |
| | | | | |
Net investment income (loss) | | | (0.19)% | | | | (0.27)% | | | | 0.50% | | | | 1.27% | | | | 1.31% | |
| | | | | |
| Supplemental data | | | | | | | | | | | | | | | | | | | | |
| | | | | |
Net assets, end of year (000’s) | | | $883 | | | | $47,864 | | | | $54,971 | | | | $54,291 | | | | $46,756 | |
| | | | | |
Portfolio turnover rate | | | 36.26% | e | | | 23.23% | | | | 93.53% | | | | 28.27% | | | | 33.88% | |
aThe amount shown for a share outstanding throughout the period may not correlate with the Statement of Operations for the period due to the timing of sales and repurchases of the Fund’s shares in relation to income earned and/or fluctuating fair value of the investments of the Fund.
bBased on average daily shares outstanding.
cTotal return does not include fees, charges or expenses imposed by the variable annuity and life insurance contracts for which Franklin Templeton Variable Insurance Products Trust serves as an underlying investment vehicle.
dBenefit of expense reduction rounds to less than 0.01%.
eExcludes the value of portfolio securities delivered as a result of redemption in-kind.
| | | | |
| FLG-6 | | Annual Report | The accompanying notes are an integral part of these financial statements. | | |
FRANKLIN TEMPLETON VARIABLE INSURANCE PRODUCTS TRUST
FINANCIAL HIGHLIGHTS
Franklin Large Cap Growth VIP Fund (continued)
| | | | | | | | | | | | | | | | | | | | |
| | | Year Ended December 31, | |
| | | 2016 | | | 2015 | | | 2014 | | | 2013 | | | 2012 | |
| Class 2 | | | | | | | | | | | | | | | | | | | | |
Per share operating performance
(for a share outstanding throughout the year) | | | | | | | | | | | | | | | | | | | | |
| | | | | |
Net asset value, beginning of year | | | $18.09 | | | | $22.94 | | | | $20.62 | | | | $16.20 | | | | $14.54 | |
| | | | |
| | | | | |
| Income from investment operationsa: | | | | | | | | | | | | | | | | | | | | |
| | | | | |
Net investment income (loss)b | | | (0.08 | ) | | | (0.11 | ) | | | 0.06 | | | | 0.19 | | | | 0.17 | |
| | | | | |
Net realized and unrealized gains (losses) | | | (0.26 | ) | | | 1.54 | | | | 2.50 | | | | 4.42 | | | | 1.62 | |
| | | | |
Total from investment operations | | | (0.34 | ) | | | 1.43 | | | | 2.56 | | | | 4.61 | | | | 1.79 | |
| | | | |
| | | | | |
| Less distributions from: | | | | | | | | | | | | | | | | | | | | |
| | | | | |
Net investment income | | | — | | | | (0.07 | ) | | | (0.24 | ) | | | (0.19 | ) | | | (0.13 | ) |
| | | | | |
Net realized gains | | | (0.27 | ) | | | (6.21 | ) | | | — | | | | — | | | | — | |
| | | | |
Total distributions | | | (0.27 | ) | | | (6.28 | ) | | | (0.24 | ) | | | (0.19 | ) | | | (0.13 | ) |
| | | | |
Net asset value, end of year | | | $17.48 | | | | $18.09 | | | | $22.94 | | | | $20.62 | | | | $16.20 | |
| | | | |
| | | | | |
Total returnc | | | (1.79)% | | | | 5.62% | | | | 12.46% | | | | 28.63% | | | | 12.37% | |
| | | | | |
| Ratios to average net assets | | | | | | | | | | | | | | | | | | | | |
| | | | | |
Expenses | | | 1.05% | d | | | 1.03% | | | | 1.04% | | | | 1.04% | | | | 1.05% | |
| | | | | |
Net investment income (loss) | | | (0.44)% | | | | (0.52)% | | | | 0.25% | | | | 1.02% | | | | 1.06% | |
| | | | | |
| Supplemental data | | | | | | | | | | | | | | | | | | | | |
| | | | | |
Net assets, end of year (000’s) | | | $113,028 | | | | $223,807 | | | | $256,098 | | | | $285,477 | | | | $278,989 | |
| | | | | |
Portfolio turnover rate | | | 36.26% | e | | | 23.23% | | | | 93.53% | | | | 28.27% | | | | 33.88% | |
aThe amount shown for a share outstanding throughout the period may not correlate with the Statement of Operations for the period due to the timing of sales and repurchases of the Fund’s shares in relation to income earned and/or fluctuating fair value of the investments of the Fund.
bBased on average daily shares outstanding.
cTotal return does not include fees, charges or expenses imposed by the variable annuity and life insurance contracts for which Franklin Templeton Variable Insurance Products Trust serves as an underlying investment vehicle.
dBenefit of expense reduction rounds to less than 0.01%.
eExcludes the value of portfolio securities delivered as a result of redemption in-kind.
| | | | | | |
| | | The accompanying notes are an integral part of these financial statements. | Annual Report | | | FLG-7 | |
FRANKLIN TEMPLETON VARIABLE INSURANCE PRODUCTS TRUST
Statement of Investments, December 31, 2016
| | | | | | | | | | |
Franklin Large Cap Growth VIP Fund | |
| | | | | Shares | | | Value | |
| | | Common Stocks 98.3% | | | | | | |
| | | Consumer Discretionary 14.2% | | | | | | |
| a | | Amazon.com Inc. | | | 6,718 | | | $ | 5,037,627 | |
| a | | Charter Communications Inc., A | | | 6,684 | | | | 1,924,457 | |
| | Comcast Corp., A | | | 12,705 | | | | 877,280 | |
| | Delphi Automotive PLC (United Kingdom) | | | 8,397 | | | | 565,538 | |
| | Las Vegas Sands Corp. | | | 5,013 | | | | 267,744 | |
| | Newell Brands Inc. | | | 22,486 | | | | 1,004,000 | |
| | NIKE Inc., B | | | 13,244 | | | | 673,193 | |
| a | | The Priceline Group Inc. | | | 919 | | | | 1,347,309 | |
| | Starbucks Corp. | | | 34,905 | | | | 1,937,926 | |
| | The Walt Disney Co. | | | 24,291 | | | | 2,531,608 | |
| | | | | | | | | | |
| | | | | | | | | 16,166,682 | |
| | | | | | | | | | |
| | | Consumer Staples 4.5% | | | | | | |
| | Constellation Brands Inc., A | | | 7,558 | | | | 1,158,717 | |
| a | | Monster Beverage Corp. | | | 45,227 | | | | 2,005,365 | |
| | Pinnacle Foods Inc. | | | 17,654 | | | | 943,606 | |
| | Reynolds American Inc. | | | 19,166 | | | | 1,074,063 | |
| | | | | | | | | | |
| | | | | | | | | 5,181,751 | |
| | | | | | | | | | |
| | | Energy 3.5% | | | | | | |
| | Anadarko Petroleum Corp. | | | 24,463 | | | | 1,705,805 | |
| a | | Diamondback Energy Inc. | | | 8,047 | | | | 813,230 | |
| | Halliburton Co. | | | 26,695 | | | | 1,443,932 | |
| | | | | | | | | | |
| | | | | | | | | 3,962,967 | |
| | | | | | | | | | |
| | | Financials 7.8% | | | | | | |
| a | | Athene Holding Ltd., A (Bermuda) | | | 18,786 | | | | 901,540 | |
| | BlackRock Inc. | | | 3,033 | | | | 1,154,178 | |
| | The Charles Schwab Corp. | | | 46,144 | | | | 1,821,304 | |
| | Intercontinental Exchange Inc. | | | 10,360 | | | | 584,511 | |
| | MarketAxess Holdings Inc. | | | 7,579 | | | | 1,113,507 | |
| | Moody’s Corp. | | | 8,953 | | | | 843,999 | |
| a | | Signature Bank | | | 8,586 | | | | 1,289,617 | |
| a | | SVB Financial Group | | | 3,838 | | | | 658,831 | |
| | Synchrony Financial | | | 14,139 | | | | 512,822 | |
| | | | | | | | | | |
| | | | | | | | | 8,880,309 | |
| | | | | | | | | | |
| | | Health Care 16.2% | | | | | | |
| a,b | | Acerta Pharma BV (Netherlands) | | | 9,780,975 | | | | 364,322 | |
| a | | Alexion Pharmaceuticals Inc. | | | 4,841 | | | | 592,296 | |
| a | | Allergan PLC | | | 12,497 | | | | 2,624,495 | |
| a | | Biogen Inc. | | | 4,925 | | | | 1,396,631 | |
| | Bristol-Myers Squibb Co. | | | 19,634 | | | | 1,147,411 | |
| a | | Celgene Corp. | | | 36,981 | | | | 4,280,551 | |
| a | | Edwards Lifesciences Corp. | | | 17,168 | | | | 1,608,642 | |
| | Eli Lilly & Co. | | | 15,185 | | | | 1,116,857 | |
| a | | Envision Healthcare Corp. | | | 1,121 | | | | 70,948 | |
| a | | Heron Therapeutics Inc. | | | 29,654 | | | | 388,467 | |
| a | | Incyte Corp. | | | 8,252 | | | | 827,428 | |
| | Medtronic PLC | | | 13,590 | | | | 968,016 | |
| a | | Nevro Corp. | | | 5,758 | | | | 418,376 | |
| a | | Regeneron Pharmaceuticals Inc. | | | 1,453 | | | | 533,382 | |
| a | | Tesaro Inc. | | | 9,572 | | | | 1,287,242 | |
FRANKLIN TEMPLETON VARIABLE INSURANCE PRODUCTS TRUST
STATEMENT OF INVESTMENTS
Franklin Large Cap Growth VIP Fund (continued)
| | | | | | | | | | |
| | | | | Shares | | | Value | |
| | | Common Stocks (continued) | | | | | | |
| | | Health Care (continued) | | | | | | |
| | UnitedHealth Group Inc. | | | 5,348 | | | $ | 855,894 | |
| | | | | | | | | | |
| | | | | | | | | 18,480,958 | |
| | | | | | | | | | |
| | | Industrials 4.6% | | | | | | |
| | Allegiant Travel Co. | | | 5,145 | | | | 856,128 | |
| | Honeywell International Inc. | | | 4,941 | | | | 572,415 | |
| a | | IHS Markit Ltd. | | | 32,482 | | | | 1,150,187 | |
| | Raytheon Co. | | | 11,647 | | | | 1,653,874 | |
| | Roper Technologies Inc. | | | 3,573 | | | | 654,145 | |
| a | | Univar Inc. | | | 11,016 | | | | 312,524 | |
| | | | | | | | | | |
| | | | | | | | | 5,199,273 | |
| | | | | | | | | | |
| | | Information Technology 37.3% | | | | | | |
| a | | Adobe Systems Inc. | | | 21,771 | | | | 2,241,324 | |
| a | | Alibaba Group Holding Ltd., ADR (China) | | | 5,163 | | | | 453,363 | |
| a | | Alphabet Inc., A | | | 4,018 | | | | 3,184,064 | |
| a | | Alphabet Inc., C | | | 2,518 | | | | 1,943,443 | |
| | Analog Devices Inc. | | | 3,977 | | | | 288,810 | |
| | Apple Inc. | | | 42,609 | | | | 4,934,974 | |
| | Broadcom Ltd. (Singapore) | | | 11,280 | | | | 1,993,966 | |
| a | | BroadSoft Inc. | | | 15,758 | | | | 650,017 | |
| a | | CoStar Group Inc. | | | 4,443 | | | | 837,461 | |
| a | | Electronic Arts Inc. | | | 17,388 | | | | 1,369,479 | |
| a | | Facebook Inc., A | | | 41,177 | | | | 4,737,414 | |
| a | | Fiserv Inc. | | | 8,134 | | | | 864,482 | |
| | Mastercard Inc., A | | | 38,064 | | | | 3,930,108 | |
| | Microsoft Corp. | | | 63,372 | | | | 3,937,936 | |
| a | | Mobileye NV (Israel) | | | 11,838 | | | | 451,265 | |
| | NVIDIA Corp. | | | 11,495 | | | | 1,226,976 | |
| a | | Palo Alto Networks Inc. | | | 6,611 | | | | 826,706 | |
| a | | Salesforce.com Inc. | | | 18,906 | | | | 1,294,305 | |
| a | | ServiceNow Inc. | | | 20,296 | | | | 1,508,805 | |
| a | | Tyler Technologies Inc. | | | 7,624 | | | | 1,088,478 | |
| | Visa Inc., A | | | 57,245 | | | | 4,466,255 | |
| | Xilinx Inc. | | | 5,085 | | | | 306,981 | |
| | | | | | | | | | |
| | | | | | | | | 42,536,612 | |
| | | | | | | | | | |
| | | Materials 3.0% | | | | | | |
| a | | Axalta Coating Systems Ltd. | | | 34,636 | | | | 942,099 | |
| | Ecolab Inc. | | | 10,481 | | | | 1,228,583 | |
| | Martin Marietta Materials Inc. | | | 5,553 | | | | 1,230,156 | |
| | | | | | | | | | |
| | | | | | | | | 3,400,838 | |
| | | | | | | | | | |
| | | Real Estate 2.9% | | | | | | |
| | American Tower Corp. | | | 15,712 | | | | 1,660,444 | |
| | Equinix Inc. | | | 4,537 | | | | 1,621,569 | |
| | | | | | | | | | |
| | | | | | | | | 3,282,013 | |
| | | | | | | | | | |
| | | Telecommunication Services 4.3% | | | | | | |
| a | | SBA Communications Corp. | | | 34,120 | | | | 3,523,231 | |
| a | | T-Mobile U.S. Inc. | | | 23,526 | | | | 1,352,981 | |
| | | | | | | | | | |
| | | | | | | | | 4,876,212 | |
| | | | | | | | | | |
| | | |
| | Total Common Stocks (Cost $78,533,405) | | | | | | | 111,967,615 | |
| | | | | | | | | | |
FRANKLIN TEMPLETON VARIABLE INSURANCE PRODUCTS TRUST
STATEMENT OF INVESTMENTS
Franklin Large Cap Growth VIP Fund (continued)
| | | | | | | | | | |
| | | | | Principal Amount | | | Value | |
| | Short Term Investments (Cost $531,668) 0.5% | | | | | | | | |
| c | | Repurchase Agreements 0.5% | | | | | | | | |
| | Joint Repurchase Agreement, 0.437%, 1/03/17 (Maturity Value $531,694) | | | | | | | | |
| | BNP Paribas Securities Corp. (Maturity Value $223,498) | | | | | | | | |
| | Deutsche Bank Securities Inc. (Maturity Value $27,930) | | | | | | | | |
| | HSBC Securities (USA) Inc. (Maturity Value $223,498) | | | | | | | | |
| | Merrill Lynch, Pierce, Fenner & Smith Inc. (Maturity Value $56,768) | | | | | | | | |
| | Collateralized by U.S. Government Agency Securities, 0.00% - 1.75%, 6/09/17 - 2/26/19; dU.S. | | | | | | | | |
| | Treasury Bill, 5/04/17 - 5/25/17; U.S. Treasury Note, 0.50% - 3.50%, 12/31/16 - 8/31/21; and U.S. | | | | | | | | |
| | Treasury Note, Index Linked, 1.375%, 7/15/18 (valued at $542,425) | | $ | 531,668 | | | $ | 531,668 | |
| | | | | | | | | | |
| | Total Investments (Cost $79,065,073) 98.8% | | | | | | | 112,499,283 | |
| | Other Assets, less Liabilities 1.2% | | | | | | | 1,411,774 | |
| | | | | | | | | | |
| | Net Assets 100.0% | | | | | | $ | 113,911,057 | |
| | | | | | | | | | |
See Abbreviations on page FLG- 21.
aNon-income producing.
bSee Note 7 regarding restricted securities.
cSee Note 1(c) regarding joint repurchase agreement.
dThe security was issued on a discount basis with no stated coupon rate.
| | | | |
| FLG-10 | | Annual Report | The accompanying notes are an integral part of these financial statements. | | |
FRANKLIN TEMPLETON VARIABLE INSURANCE PRODUCTS TRUST
Financial Statements
Statement of Assets and Liabilities
December 31, 2016
| | | | |
| | | Franklin Large
Cap Growth VIP Fund | |
Assets: | | | | |
Investments in securities: | | | | |
Cost - Unaffiliated issuers | | $ | 78,533,405 | |
Cost - Repurchase agreements | | | 531,668 | |
| | | | |
Total cost of investments | | $ | 79,065,073 | |
| | | | |
Value - Unaffiliated issuers | | $ | 111,967,615 | |
Value - Repurchase agreements | | | 531,668 | |
| | | | |
Total value of investments | | | 112,499,283 | |
Receivables: | | | | |
Investment securities sold | | | 1,213,164 | |
Capital shares sold | | | 590,725 | |
Dividends | | | 63,954 | |
Other assets | | | 20 | |
| | | | |
Total assets | | | 114,367,146 | |
| | | | |
Liabilities: | | | | |
Payables: | | | | |
Investment securities purchased | | | 178,448 | |
Capital shares redeemed | | | 84,445 | |
Management fees | | | 72,875 | |
Distribution fees | | | 47,668 | |
Reports to shareholders | | | 36,247 | |
Professional fees | | | 31,887 | |
Accrued expenses and other liabilities | | | 4,519 | |
| | | | |
Total liabilities | | | 456,089 | |
| | | | |
Net assets, at value | | $ | 113,911,057 | |
| | | | |
Net assets consist of: | | | | |
Paid-in capital | | $ | 70,263,282 | |
Undistributed net investment income | | | 760,767 | |
Net unrealized appreciation (depreciation) | | | 33,405,728 | |
Accumulated net realized gain (loss) | | | 9,481,280 | |
| | | | |
Net assets, at value | | $ | 113,911,057 | |
| | | | |
| |
| Class 1: | | | | |
Net assets, at value | | $ | 882,569 | |
| | | | |
Shares outstanding | | | 49,431 | |
| | | | |
Net asset value and maximum offering price per share | | $ | 17.85 | |
| | | | |
| |
| Class 2: | | | | |
Net assets, at value | | $ | 113,028,488 | |
| | | | |
Shares outstanding | | | 6,465,777 | |
| | | | |
Net asset value and maximum offering price per share | | $ | 17.48 | |
| | | | |
| | | | | | |
| | | The accompanying notes are an integral part of these financial statements. | Annual Report | | | FLG-11 | |
FRANKLIN TEMPLETON VARIABLE INSURANCE PRODUCTS TRUST
FINANCIAL STATEMENTS
Statement of Operations
for the year ended December 31, 2016
| | | | |
| | | Franklin Large Cap Growth VIP Fund | |
Investment income: | | | | |
Dividends | | $ | 1,294,958 | |
Interest | | | 7,216 | |
| | | | |
Total investment income | | | 1,302,174 | |
| | | | |
Expenses: | | | | |
Management fees (Note 3a) | | | 1,598,429 | |
Distribution fees - Class 2 (Note 3c) | | | 444,652 | |
Custodian fees (Note 4) | | | 1,982 | |
Reports to shareholders | | | 54,429 | |
Professional fees | | | 41,558 | |
Trustees’ fees and expenses | | | 1,162 | |
Other | | | 14,124 | |
| | | | |
Total expenses | | | 2,156,336 | |
Expense reductions (Note 4) | | | (24 | ) |
| | | | |
Net expenses | | | 2,156,312 | |
| | | | |
Net investment income (loss) | | | (854,138 | ) |
| | | | |
Realized and unrealized gains (losses): | | | | |
Net realized gain (loss) from: | | | | |
Investments (includes gains from a redemption in-kind of $34,226,067) (Note 9) | | | 45,677,591 | |
Foreign currency transactions | | | (2,434 | ) |
| | | | |
Net realized gain (loss) | | | 45,675,157 | |
| | | | |
Net change in unrealized appreciation (depreciation) on: | | | | |
Investments | | | (50,287,195 | ) |
Translation of other assets and liabilities denominated in foreign currencies | | | (28,483 | ) |
| | | | |
Net change in unrealized appreciation (depreciation) | | | (50,315,678 | ) |
| | | | |
Net realized and unrealized gain (loss) | | | (4,640,521 | ) |
| | | | |
Net increase (decrease) in net assets resulting from operations | | $ | (5,494,659 | ) |
| | | | |
| | | | |
| FLG-12 | | Annual Report | The accompanying notes are an integral part of these financial statements. | | |
FRANKLIN TEMPLETON VARIABLE INSURANCE PRODUCTS TRUST
FINANCIAL STATEMENTS
Statements of Changes in Net Assets
| | | | | | | | |
| | | Franklin Large Cap Growth VIP Fund | |
| | | Year Ended December 31, | |
| | | 2016 | | | 2015 | |
Increase (decrease) in net assets: | | | | | | | | |
Operations: | | | | | | | | |
Net investment income (loss) | | $ | (854,138 | ) | | $ | (1,428,248 | ) |
Net realized gain (loss) | | | 45,675,157 | | | | 3,534,624 | |
Net change in unrealized appreciation (depreciation) | | | (50,315,678 | ) | | | 15,220,871 | |
| | | | |
Net increase (decrease) in net assets resulting from operations | | | (5,494,659 | ) | | | 17,327,247 | |
| | | | |
Distributions to shareholders from: | | | | | | | | |
Net investment income: | | | | | | | | |
Class 1 | | | — | | | | (286,901 | ) |
Class 2 | | | — | | | | (675,379 | ) |
Net realized gains: | | | | | | | | |
Class 1 | | | (673,017 | ) | | | (13,634,161 | ) |
Class 2 | | | (3,070,097 | ) | | | (63,414,142 | ) |
| | | | |
Total distributions to shareholders | | | (3,743,114 | ) | | | (78,010,583 | ) |
| | | | |
Capital share transactions: (Note 2) | | | | | | | | |
Class 1 | | | (45,655,781 | ) | | | 3,730,750 | |
Class 2 | | | (102,866,036 | ) | | | 17,554,979 | |
| | | | |
Total capital share transactions | | | (148,521,817 | ) | | | 21,285,729 | |
| | | | |
Net increase (decrease) in net assets | | | (157,759,590 | ) | | | (39,397,607 | ) |
Net assets: | | | | | | | | |
Beginning of year | | | 271,670,647 | | | | 311,068,254 | |
| | | | |
End of year | | $ | 113,911,057 | | | $ | 271,670,647 | |
| | | | |
Undistributed net investment income included in net assets: | | | | | | | | |
End of year | | $ | 760,767 | | | $ | — | |
| | | | |
| | | | | | |
| | | The accompanying notes are an integral part of these financial statements. | Annual Report | | | FLG-13 | |
FRANKLIN TEMPLETON VARIABLE INSURANCE PRODUCTS TRUST
Notes to Financial Statements
Franklin Large Cap Growth VIP Fund
1. Organization and Significant Accounting Policies
Franklin Templeton Variable Insurance Products Trust (Trust) is registered under the Investment Company Act of 1940 (1940 Act) as an open-end management investment company, consisting of nineteen separate funds and applies the specialized accounting and reporting guidance in U.S. Generally Accepted Accounting Principles (U.S. GAAP). Franklin Large Cap Growth VIP Fund (Fund) is included in this report. The financial statements of the remaining funds in the Trust are presented separately. Shares of the Fund are generally sold only to insurance company separate accounts to fund the benefits of variable life insurance policies or variable annuity contracts. At December 31, 2016, 67.2% of the Fund’s shares were held through one insurance company. Investment activities of these insurance company separate accounts could have a material impact on the Fund. The Fund offers two classes of shares: Class 1 and Class 2. Each class of shares differs by its distribution fees, voting rights on matters affecting a single class and its exchange privilege.
The following summarizes the Fund’s significant accounting policies.
a. Financial Instrument Valuation
The Fund’s investments in financial instruments are carried at fair value daily. Fair value is the price that would be received to sell an asset or paid to transfer a liability in an orderly transaction between market participants on the measurement date. The Fund calculates the net asset value (NAV) per share as of 4 p.m. Eastern time each day the New York Stock Exchange (NYSE) is open for trading. Under compliance policies and procedures approved by the Trust’s Board of Trustees (the Board), the Fund’s administrator has responsibility for oversight of valuation, including leading the
cross-functional Valuation Committee (VC). The VC provides administration and oversight of the Fund’s valuation policies and procedures, which are approved annually by the Board. Among other things, these procedures allow the Fund to utilize independent pricing services, quotations from securities and financial instrument dealers, and other market sources to determine fair value.
Equity securities listed on an exchange or on the NASDAQ National Market System are valued at the last quoted sale price or the official closing price of the day, respectively. Foreign equity securities are valued as of the close of trading on the
foreign stock exchange on which the security is primarily traded, or as of 4 p.m. Eastern time. The value is then converted into its U.S. dollar equivalent at the foreign exchange rate in effect at 4 p.m. Eastern time on the day that the value of the security is determined. Over-the-counter (OTC) securities are valued within the range of the most recent quoted bid and ask prices. Securities that trade in multiple markets or on multiple exchanges are valued according to the broadest and most representative market. Certain equity securities are valued based upon fundamental characteristics or relationships to similar securities.
Investments in repurchase agreements are valued at cost, which approximates fair value.
The Fund has procedures to determine the fair value of financial instruments for which market prices are not reliable or readily available. Under these procedures, the VC convenes on a regular basis to review such financial instruments and considers a number of factors, including significant unobservable valuation inputs, when arriving at fair value. The VC primarily employs a market-based approach which may use related or comparable assets or liabilities, recent transactions, market multiples, book values, and other relevant information for the investment to determine the fair value of the investment. An income-based valuation approach may also be used in which the anticipated future cash flows of the investment are discounted to calculate fair value. Discounts may also be applied due to the nature or duration of any restrictions on the disposition of the investments. Due to the inherent uncertainty of valuations of such investments, the fair values may differ significantly from the values that would have been used had an active market existed. The VC employs various methods for calibrating these valuation approaches including a regular review of key inputs and assumptions, transactional back-testing or disposition analysis, and reviews of any related market activity.
Trading in securities on foreign securities stock exchanges and OTC markets may be completed before 4 p.m. Eastern time. In addition, trading in certain foreign markets may not take place on every Fund’s business day. Occasionally, events occur between the time at which trading in a foreign security is completed and 4 p.m. Eastern time that might call into question the reliability of the value of a portfolio security held by the Fund. As a result, differences may arise between the value of the Fund’s portfolio securities as determined at the foreign market close and the latest indications of value at 4 p.m. Eastern time. In order to minimize the potential for these differences,
FRANKLIN TEMPLETON VARIABLE INSURANCE PRODUCTS TRUST
NOTES TO FINANCIAL STATEMENTS
Franklin Large Cap Growth VIP Fund (continued)
the VC monitors price movements following the close of trading in foreign stock markets through a series of country specific market proxies (such as baskets of American Depositary Receipts, futures contracts and exchange traded funds). These price movements are measured against established trigger thresholds for each specific market proxy to assist in determining if an event has occurred that may call into question the reliability of the values of the foreign securities held by the Fund. If such an event occurs, the securities may be valued using fair value procedures, which may include the use of independent pricing services.
When the last day of the reporting period is a non-business day, certain foreign markets may be open on those days that the Fund’s NAV is not calculated, which could result in differences between the value of the Fund’s portfolio securities on the last business day and the last calendar day of the reporting period. Any significant security valuation changes due to an open foreign market are adjusted and reflected by the Fund for financial reporting purposes.
b. Foreign Currency Translation
Portfolio securities and other assets and liabilities denominated in foreign currencies are translated into U.S. dollars based on the exchange rate of such currencies against U.S. dollars on the date of valuation. The Fund may enter into foreign currency exchange contracts to facilitate transactions denominated in a foreign currency. Purchases and sales of securities, income and expense items denominated in foreign currencies are translated into U.S. dollars at the exchange rate in effect on the transaction date. Portfolio securities and assets and liabilities denominated in foreign currencies contain risks that those currencies will decline in value relative to the U.S. dollar. Occasionally, events may impact the availability or reliability of foreign exchange rates used to convert the U.S. dollar equivalent value. If such an event occurs, the foreign exchange rate will be valued at fair value using procedures established and approved by the Board.
The Fund does not separately report the effect of changes in foreign exchange rates from changes in market prices on securities held. Such changes are included in net realized and unrealized gain or loss from investments in the Statement of Operations.
Realized foreign exchange gains or losses arise from sales of foreign currencies, currency gains or losses realized between the trade and settlement dates on securities transactions and the
difference between the recorded amounts of dividends, interest, and foreign withholding taxes and the U.S. dollar equivalent of the amounts actually received or paid. Net unrealized foreign exchange gains and losses arise from changes in foreign exchange rates on foreign denominated assets and liabilities other than investments in securities held at the end of the reporting period.
c. Joint Repurchase Agreement
The Fund enters into a joint repurchase agreement whereby its uninvested cash balance is deposited into a joint cash account with other funds managed by the investment manager or an affiliate of the investment manager and is used to invest in one or more repurchase agreements. The value and face amount of the joint repurchase agreement are allocated to the funds based on their
pro-rata interest. A repurchase agreement is accounted for as a loan by the Fund to the seller, collateralized by securities which are delivered to the Fund’s custodian. The fair value, including accrued interest, of the initial collateralization is required to be at least 102% of the dollar amount invested by the funds, with the value of the underlying securities marked to market daily to maintain coverage of at least 100%. Repurchase agreements are subject to the terms of Master Repurchase Agreements (MRAs) with approved counterparties (sellers). The MRAs contain various provisions, including but not limited to events of default and maintenance of collateral for repurchase agreements. In the event of default by either the seller or the Fund, certain MRAs may permit the non-defaulting party to net and close-out all transactions, if any, traded under such agreements. The Fund may sell securities it holds as collateral and apply the proceeds towards the repurchase price and any other amounts owed by the seller to the Fund in the event of default by the seller. This could involve costs or delays in addition to a loss on the securities if their value falls below the repurchase price owed by the seller. The joint repurchase agreement held by the Fund at year end, as indicated in the Statement of Investments, had been entered into on December 30, 2016.
d. Income and Deferred Taxes
It is the Fund’s policy to qualify as a regulated investment company under the Internal Revenue Code. The Fund intends to distribute to shareholders substantially all of its taxable income and net realized gains to relieve it from federal income and if applicable, excise taxes. As a result, no provision for U.S. federal income taxes is required.
FRANKLIN TEMPLETON VARIABLE INSURANCE PRODUCTS TRUST
NOTES TO FINANCIAL STATEMENTS
Franklin Large Cap Growth VIP Fund (continued)
1. Organization and Significant Accounting Policies (continued)
d. Income and Deferred Taxes (continued)
The Fund may be subject to foreign taxation related to income received, capital gains on the sale of securities and certain foreign currency transactions in the foreign jurisdictions in which it invests. Foreign taxes, if any, are recorded based on the tax regulations and rates that exist in the foreign markets in which the Fund invests. When a capital gain tax is determined to apply, the Fund records an estimated deferred tax liability in an amount that would be payable if the securities were disposed of on the valuation date.
The Fund may recognize an income tax liability related to its uncertain tax positions under U.S. GAAP when the uncertain tax position has a less than 50% probability that it will be sustained upon examination by the tax authorities based on its technical merits. As of December 31, 2016, the Fund has determined that no tax liability is required in its financial statements related to uncertain tax positions for any open tax years (or expected to be taken in future tax years). Open tax years are those that remain subject to examination and are based on each tax jurisdiction’s statute of limitation.
e. Security Transactions, Investment Income, Expenses and Distributions
Security transactions are accounted for on trade date. Realized gains and losses on security transactions are determined on a specific identification basis. Interest income and estimated expenses are accrued daily. Dividend income is recorded on the ex-dividend date except for certain dividends from securities where the dividend rate is not available. In such cases, the dividend is recorded as soon as the information is received by the Fund. Distributions to shareholders are recorded on the ex-dividend date and are determined according to income tax regulations (tax basis). Distributable earnings determined on a tax basis may differ from earnings recorded in accordance with U.S. GAAP. These differences may be permanent or temporary.
Permanent differences are reclassified among capital accounts to reflect their tax character. These reclassifications have no impact on net assets or the results of operations. Temporary differences are not reclassified, as they may reverse in subsequent periods.
Common expenses incurred by the Trust are allocated among the Funds based on the ratio of net assets of each Fund to the combined net assets of the Trust. Fund specific expenses are charged directly to the Fund that incurred the expense.
Realized and unrealized gains and losses and net investment income, not including class specific expenses, are allocated daily to each class of shares based upon the relative proportion of net assets of each class. Differences in per share distributions, by class, are generally due to differences in class specific expenses.
f. Accounting Estimates
The preparation of financial statements in accordance with U.S GAAP requires management to make estimates and assumptions that affect the reported amounts of assets and liabilities at the date of the financial statements and the amounts of income and expenses during the reporting period. Actual results could differ from those estimates.
g. Guarantees and Indemnifications
Under the Trust’s organizational documents, its officers and trustees are indemnified by the Trust against certain liabilities arising out of the performance of their duties to the Trust. Additionally, in the normal course of business, the Trust, on behalf of the Fund, enters into contracts with service providers that contain general indemnification clauses. The Trust’s maximum exposure under these arrangements is unknown as this would involve future claims that may be made against the Trust that have not yet occurred. Currently, the Trust expects the risk of loss to be remote.
FRANKLIN TEMPLETON VARIABLE INSURANCE PRODUCTS TRUST
NOTES TO FINANCIAL STATEMENTS
Franklin Large Cap Growth VIP Fund (continued)
2. Shares of Beneficial Interest
At December 31, 2016, there were an unlimited number of shares authorized (without par value). Transactions in the Fund’s shares were as follows:
| | | | | | | | | | | | | | | | | | | | |
| | | Year Ended December 31, | |
| | | 2016 | | | | | | 2015 | |
| | | Shares | | | Amount | | | | | | Shares | | | Amount | |
| | | | | |
| Class 1 Shares: | | | | | | | | | | | | | | | | | | | | |
Shares sold | | | 5,179 | | | $ | 86,575 | | | | | | | | 5,480 | | | $ | 124,849 | |
Shares issued in reinvestment of distributions | | | 39,404 | | | | 673,017 | | | | | | | | 740,482 | | | | 13,921,062 | |
Shares redeemed in-kind (Note 9) | | | (2,315,969 | ) | | | (41,560,066 | ) | | | | | | | — | | | | — | |
Shares redeemed | | | (277,582 | ) | | | (4,855,307 | ) | | | | | | | (510,479 | ) | | | (10,315,161 | ) |
| | | | |
Net increase (decrease) | | | (2,548,968 | ) | | $ | (45,655,781 | ) | | | | | | | 235,483 | | | $ | 3,730,750 | |
| | | | |
| Class 2 Shares: | | | | | | | | | | | | | | | | | | | | |
Shares sold | | | 490,428 | | | $ | 8,312,649 | | | | | | | | 700,609 | | | $ | 14,776,651 | |
Shares issued in reinvestment of distributions | | | 183,399 | | | | 3,070,097 | | | | | | | | 3,468,048 | | | | 64,089,521 | |
Shares redeemed in-kind (Note 9) | | | (3,930,777 | ) | | | (69,101,102 | ) | | | | | | | — | | | | — | |
Shares redeemed | | | (2,651,505 | ) | | | (45,147,680 | ) | | | | | | | (2,958,403 | ) | | | (61,311,193 | ) |
| | | | |
Net increase (decrease) | | | (5,908,455 | ) | | $ | (102,866,036 | ) | | | | | | | 1,210,254 | | | $ | 17,554,979 | |
| | | | |
3. Transactions with Affiliates
Franklin Resources, Inc. is the holding company for various subsidiaries that together are referred to as Franklin Templeton Investments. Certain officers and trustees of the Fund are also officers and/or directors of the following subsidiaries:
| | |
| Subsidiary | | Affiliation |
Franklin Advisers, Inc. (Advisers) | | Investment manager |
Franklin Templeton Services, LLC (FT Services) | | Administrative manager |
Franklin Templeton Distributors, Inc. (Distributors) | | Principal underwriter |
Franklin Templeton Investor Services, LLC (Investor Services) | | Transfer agent |
a. Management Fees
The Fund pays an investment management fee to Advisers based on the average daily net assets of the Fund as follows:
| | |
| Annualized Fee Rate | | Net Assets |
0.750% | | Up to and including $500 million |
0.625% | | Over $500 million, up to and including $1 billion |
0.500% | | In excess of $1 billion |
For the year ended December 31, 2016, the effective investment management fee rate was 0.750% of the Fund’s average daily net assets.
b. Administrative Fees
Under an agreement with Advisers, FT Services provides administrative services to the Fund. The fee is paid by Advisers based on the Fund’s average daily net assets, and is not an additional expense of the Fund.
FRANKLIN TEMPLETON VARIABLE INSURANCE PRODUCTS TRUST
NOTES TO FINANCIAL STATEMENTS
Franklin Large Cap Growth VIP Fund (continued)
3. Transactions with Affiliates (continued)
c. Distribution Fees
The Board has adopted distribution plans for Class 2 shares pursuant to Rule 12b-1 under the 1940 Act. Under the Fund’s compensation distribution plans, the Fund pays Distributors for costs incurred in connection with the servicing, sale and distribution of the Fund’s shares up to 0.35% per year of its average daily net assets. The Board has agreed to limit the current rate to 0.25% per year for Class 2. The plan year, for purposes of monitoring compliance with the maximum annual plan rate, is February 1 through January 31.
d. Transfer Agent Fees
Investor Services, under terms of an agreement, performs shareholder servicing for the Fund and is not paid by the Fund for the services.
4. Expense Offset Arrangement
The Fund has entered into an arrangement with its custodian whereby credits realized as a result of uninvested cash balances are used to reduce a portion of the Fund’s custodian expenses. During the year ended December 31, 2016, the custodian fees were reduced as noted in the Statement of Operations.
5. Income Taxes
The tax character of distributions paid during the years ended December 31, 2016 and 2015, was as follows:
| | | | | | | | |
| | | 2016 | | | 2015 | |
Distributions paid from: | | | | | | | | |
Ordinary income | | $ | — | | | $ | 961,572 | |
Long term capital gain | | | 3,743,114 | | | | 77,049,011 | |
| | | | |
| | $ | 3,743,114 | | | $ | 78,010,583 | |
| | | | |
At December 31, 2016, the cost of investments, net unrealized appreciation (depreciation), undistributed ordinary income and undistributed long term capital gains for income tax purposes were as follows:
| | | | |
Cost of investments | | $ | 79,265,581 | |
| | | | |
Unrealized appreciation | | $ | 35,073,562 | |
Unrealized depreciation | | | (1,839,860 | ) |
| | | | |
Net unrealized appreciation (depreciation) | | $ | 33,233,702 | |
| | | | |
Undistributed ordinary income | | $ | 760,763 | |
Undistributed long term capital gains | | | 9,681,790 | |
| | | | |
Distributable earnings | | $ | 10,442,553 | |
| | | | |
Differences between income and/or capital gains as determined on a book basis and a tax basis are primarily due to differing treatments of passive foreign investment company shares and wash sales.
6. Investment Transactions
Purchases and sales of investments (excluding short term securities) for the year ended December 31, 2016, aggregated $75,912,293 and $120,521,118, respectively. Sales of investments excludes in-kind transactions of $108,420,867.
FRANKLIN TEMPLETON VARIABLE INSURANCE PRODUCTS TRUST
NOTES TO FINANCIAL STATEMENTS
Franklin Large Cap Growth VIP Fund (continued)
7. Restricted Securities
The Fund invests in securities that are restricted under the Securities Act of 1933 (1933 Act) or which are subject to legal, contractual, or other agreed upon restrictions on resale. Restricted securities are often purchased in private placement transactions, and cannot be sold without prior registration unless the sale is pursuant to an exemption under the 1933 Act. Disposal of these securities may require greater effort and expense, and prompt sale at an acceptable price may be difficult. The Fund may have registration rights for restricted securities. The issuer generally incurs all registration costs.
At December 31, 2016, the Fund held investments in restricted securities, excluding certain securities exempt from registration under the 1933 Act deemed to be liquid, as follows:
| | | | | | | | | | | | | | |
| Shares | | Issuer | | Acquisition
Date | | | Cost | | | Value | |
| 9,780,975 | | Acerta Pharma BV (Value is 0.3% of Net Assets) | | | 5/06/15 | | | $ | 562,683 | | | $ | 364,322 | |
| | | | | | | | | | |
8. Credit Facility
The Fund, together with other U.S. registered and foreign investment funds (collectively, Borrowers), managed by Franklin Templeton Investments, are borrowers in a joint syndicated senior unsecured credit facility totaling $2 billion (Global Credit Facility) which matured on February 10, 2017. This Global Credit Facility provides a source of funds to the Borrowers for temporary and emergency purposes, including the ability to meet future unanticipated or unusually large redemption requests. Effective February 10, 2017, the Borrowers renewed the
Global Credit Facility for a one year term, maturing February 9, 2018, for a total of $2 billion.
Under the terms of the Global Credit Facility, the Fund shall, in addition to interest charged on any borrowings made by the Fund and other costs incurred by the Fund, pay its share of fees and expenses incurred in connection with the implementation and maintenance of the Global Credit Facility, based upon its relative share of the aggregate net assets of all of the Borrowers, including an annual commitment fee of 0.15% based upon the unused portion of the Global Credit Facility. These fees are reflected in other expenses in the Statement of Operations. During the year ended December 31, 2016, the Fund did not use the Global Credit Facility.
9. Redemption In-Kind
During the year ended December 31, 2016, the Fund realized $34,226,067 of net gains resulting from a redemption in-kind in which a shareholder redeemed fund shares for cash and securities held by the Fund. Because such gains are not taxable to the Fund and are not distributed to remaining shareholders, they have been reclassified from accumulated net realized gains to paid-in capital.
10. Fair Value Measurements
The Fund follows a fair value hierarchy that distinguishes between market data obtained from independent sources (observable inputs) and the Fund’s own market assumptions (unobservable inputs). These inputs are used in determining the value of the Fund’s financial instruments and are summarized in the following fair value hierarchy:
| | • | | Level 1 – quoted prices in active markets for identical financial instruments |
| | • | | Level 2 – other significant observable inputs (including quoted prices for similar financial instruments, interest rates, prepayment speed, credit risk, etc.) |
| | • | | Level 3 – significant unobservable inputs (including the Fund’s own assumptions in determining the fair value of financial instruments) |
FRANKLIN TEMPLETON VARIABLE INSURANCE PRODUCTS TRUST
NOTES TO FINANCIAL STATEMENTS
Franklin Large Cap Growth VIP Fund (continued)
10. Fair Value Measurements (continued)
The input levels are not necessarily an indication of the risk or liquidity associated with financial instruments at that level.
For movements between the levels within the fair value hierarchy, the Funds have adopted a policy of recognizing the transfers as of the date of the underlying event which caused the movement.
A summary of inputs used as of December 31, 2016, in valuing the Fund’s assets carried at fair value, is as follows:
| | | | | | | | | | | | | | | | |
| | | Level 1 | | | Level 2 | | | Level 3 | | | Total | |
| | | | |
| Assets: | | | | | | | | | | | | | | | | |
Investments in Securities: | | | | | | | | | | | | | | | | |
Equity Investments:a | | | | | | | | | | | | | | | | |
Health Care | | $ | 18,116,636 | | | $ | — | | | $ | 364,322 | | | $ | 18,480,958 | |
All Other Equity Investmentsb | | | 93,486,657 | | | | — | | | | — | | | | 93,486,657 | |
Short Term Investments | | | — | | | | 531,668 | | | | — | | | | 531,668 | |
| | | | |
Total Investments in Securities | | $ | 111,603,293 | | | $ | 531,668 | | | $ | 364,322 | | | $ | 112,499,283 | |
| | | | |
| | | | |
| Receivables: | | | | | | | | | | | | | | | | |
Investment Securities Sold | | $ | — | | | $ | — | | | $ | 826,648 | | | $ | 826,648 | |
| | | | |
aIncludes common stocks.
bFor detailed categories, see the accompanying Statement of Investments.
A reconciliation of assets in which Level 3 inputs are used in determining fair value is presented when there are significant Level 3 financial instruments at the end of the year. At December 31, 2016, the reconciliation of assets, is as follows:
| | | | | | | | | | | | | | | | | | | | | | | | | | | | | | | | |
| | | Balance at
Beginning of
Year | | | Purchases
(Sales) | | | Transfers Into (Out of) Level 3 | | | Cost Basis
Adjustments | | | Net Realized Gain (Loss) | | | Net Unrealized
Appreciation
(Depreciation) | | | Balance at End of Year | | | Net Change in
Unrealized
Appreciation
(Depreciation)
on Assets
Held at Year End | |
| Assets: | | | | | | | | | | | | | | | | | | | | | | | | | | | | | | | | |
Investments in Securities: | | | | | | | | | | | | | | | | | | | | | | | | | | | | | | | | |
Equity Investments:a | | | | | | | | | | | | | | | | | | | | | | | | | | | | | | | | |
Health Care | | $ | 2,694,736 | | | $ | (2,277,653 | ) | | $ | — | | | $ | — | | | $ | 1,589,929 | | | $ | (1,642,690 | ) | | $ | 364,322 | | | $ | (198,361 | ) |
| | | | |
| Receivables: | | | | | | | | | | | | | | | | | | | | | | | | | | | | | | | | |
Investment Securities Sold | | $ | — | | | $ | — | | | $ | 813,595 | b | | $ | — | | | $ | — | | | $ | 13,053 | | | $ | 826,648 | | | $ | 13,053 | |
| | | | |
aIncludes common stocks.
bThe receivable was transferred into Level 3 as a result of it being discounted to reflect the current fair value.
Significant unobservable valuation inputs developed by the VC for material Level 3 financial instruments and impact to fair value as a result of changes in unobservable valuation inputs as of December 31, 2016, are as follows:
FRANKLIN TEMPLETON VARIABLE INSURANCE PRODUCTS TRUST
NOTES TO FINANCIAL STATEMENTS
Franklin Large Cap Growth VIP Fund (continued)
| | | | | | | | | | | | | | | | |
| Description | |
| Fair Value at
End of Year |
| | Valuation
Technique | | Unobservable Input | | | Amount | | |
| Impact to Fair
Value if Input
Increases |
a |
| Assets: | | | | | | | | | | | | | | | | |
| | | | | |
Investments in Securities: | | | | | | | | | | | | | | | | |
| | | | | |
Equity Investments:b | | | | | | | | | | | | | | | | |
| | | | | |
Health Care | | $ | 364,322 | | | Probability Weighted | | Free Cash Flowc | | $ | 3,000 (mil | ) | | | Increase | |
| | | | | |
| | | | | | | Discounted Cash Flow Model | | Discount for lack of marketability | | | 12.5% | | | | Decreased | |
| Receivables: | | | | | | | | | | | | | | | | |
| | | | | |
Investments in Securities Sold | | $ | 826,648 | | | Discounted Cash Flow Model | | Discount Rate | | | 1.7% | | | | Decrease | |
aRepresents the directional change in the fair value of the Level 3 financial instruments that would result from a significant and reasonable increase in the corresponding input. A significant and reasonable decrease in input would have the opposite effect. Significant impacts, if any, to fair value and/or net assets have been indicated.
bIncludes common stocks.
cIncludes probability assumptions for various outcomes of contingent payments for clinical trials and regulatory approvals.
dRepresents a significant impact to fair value and net assets.
11. Investment Company Reporting Modernization
In October 2016, the U.S. Securities and Exchange Commission adopted new rules and amended existing rules (together, final rules) intended to modernize the reporting and disclosure of information by registered investment companies. In part, the final rules amend Regulation S-X and require standardized, enhanced disclosures about derivatives in investment company financial statements, as well as other amendments. The compliance date for the amendments to Regulation S-X is August 1, 2017. Management is currently evaluating the impact that the adoption of the amendments to Regulation S-X will have on the Fund’s financial statements and related disclosures.
12. Subsequent Events
The Fund has evaluated subsequent events through the issuance of the financial statements and determined that no events have occurred that require disclosure others than those already disclosed in the financial statements.
Abbreviations
| | |
| Selected Portfolio |
| |
| ADR | | American Depositary Receipt |
FRANKLIN TEMPLETON VARIABLE INSURANCE PRODUCTS TRUST
Report of Independent Registered Public Accounting Firm
Franklin Large Cap Growth VIP Fund
To the Board Trustees and Shareholders of Franklin Templeton Variable Insurance Products Trust
In our opinion, the accompanying statement of assets and liabilities, including the statement of investments, and the related statements of operations and of changes in net assets and the financial highlights present fairly, in all material respects, the financial position of
Franklin Large Cap Growth VIP Fund (the “Fund”) as of December 31, 2016, the results of its operations for the year then ended, the changes in its net assets for each of the two years in the period then ended and the financial highlights for the periods presented, in conformity with accounting principles generally accepted in the United States of America. These financial statements and financial highlights (hereafter referred to as “financial statements”) are the responsibility of the Fund’s management. Our responsibility is to express an opinion on these financial statements based on our audits. We conducted our audits of these financial statements in accordance with the standards of the Public Company Accounting Oversight Board (United States). Those standards require that we plan and perform the audit to obtain reasonable assurance about whether the financial statements are free of material misstatement. An audit includes examining, on a test basis, evidence supporting the amounts and disclosures in the financial statements, assessing the accounting principles used and significant estimates made by management, and evaluating the overall financial statement presentation. We believe that our audits, which included confirmation of securities as of December 31, 2016 by correspondence with the custodian and brokers, provide a reasonable basis for our opinion.
PricewaterhouseCoopers LLP
San Francisco, California
February 15, 2017
FRANKLIN TEMPLETON VARIABLE INSURANCE PRODUCTS TRUST
Tax Information (unaudited)
Franklin Large Cap Growth VIP Fund
Under Section 852(b)(3)(C) of the Internal Revenue Code, the Fund hereby reports the maximum amount allowable but no less than $3,743,114 as a long term capital gain dividend for the fiscal year ended December 31, 2016.
Franklin Mutual Global Discovery VIP Fund
We are pleased to bring you Franklin Mutual Global Discovery VIP Fund’s annual report for the fiscal year ended December 31, 2016.
Class 2 Performance Summary as of December 31, 2016
Average annual total return of Class 2 shares* represents the average annual change in value, assuming reinvestment of dividends and capital gains. Average returns smooth out variations in returns, which can be significant; they are not the same as year-by-year results.
| | | | | | | | | | | | |
| Periods ended 12/31/16 | | 1-Year** | | | 5-Year | | | 10-Year | |
Average Annual Total Return | | | +12.18% | | | | +10.57% | | | | +5.89% | |
*The Fund has a fee waiver associated with any investment it makes in a Franklin Templeton money fund and/or other Franklin Templeton fund, contractually guaranteed through its current fiscal year-end. Fund investment results reflect the fee waiver; without this waiver, the results would have been lower.
**Return information is based on net asset values calculated for shareholder transactions. Certain adjustments were made to the net assets of the Fund at 12/31/16 for financial reporting purposes, and as a result, the total returns based on those net asset values differ from the adjusted total returns reported in the Financial Highlights.
Performance reflects the Fund’s Class 2 operating expenses, but does not include any contract fees, expenses or sales charges. If they had been included, performance would be lower. These charges and deductions, particularly for variable life policies, can have a significant effect on contract values and insurance benefits. See the contract prospectus for a complete description of these expenses, including sales charges.
Performance data represent past performance, which does not guarantee future results. Investment return and principal value will fluctuate, and you may have a gain or loss when you sell your shares. Current performance may differ from figures shown.
Total Return Index Comparison for a Hypothetical $10,000 Investment (1/1/07–12/31/16)
The graph below shows the change in value of a hypothetical $10,000 investment in the Fund over the indicated period and includes reinvestment of any income or distributions. The Fund’s performance* is compared to the performance of the MSCI World Index and the Standard & Poor’s® 500 Index (S&P 500®). One cannot invest directly in an index, and an index is not representative of the Fund’s portfolio. Please see Important Notes to Performance Information preceding the Fund Summaries.
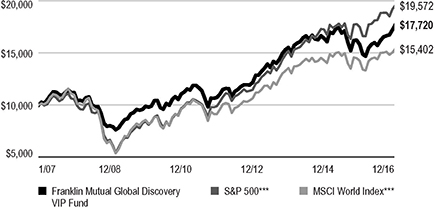
***Source: Morningstar. Please see Index Descriptions following the Fund Summaries.
FRANKLIN MUTUAL GLOBAL DISCOVERY VIP FUND
Fund Goal and Main Investments
The Fund seeks capital appreciation. Under normal market conditions, the Fund invests primarily in U.S. and foreign equity securities that the investment manager believes are undervalued.
Fund Risks
All investments involve risks, including possible loss of principal. Value securities may not increase in price as anticipated, or may decline further in value. The Fund’s investments in foreign securities involve certain risks including currency fluctuations, and economic and political uncertainties. Derivatives involve costs and can create economic leverage in the Fund’s portfolio which may result in significant volatility and cause the Fund to participate in losses (as well as gains) in an amount that exceeds the Fund’s initial investment. Smaller company stocks have exhibited greater price volatility than larger company stocks, particularly over the short term. The Fund’s investments in companies engaged in mergers, reorganizations or liquidations also involve special risks as pending deals may not be completed on time or on favorable terms. The Fund may invest in lower rated bonds, which entail higher credit risk. The Fund is actively managed but there is no guarantee that the manager’s investment decisions will produce the desired results. The Fund’s prospectus also includes a description of the main investment risks.
Performance Overview
You can find the Fund’s one-year total return in the Performance Summary. In comparison, the Fund’s benchmark, the MSCI World Index, posted a +8.15% total return and the S&P 500 generated a +11.96% total return for the same period.1
Economic and Market Overview
The global economy grew moderately during the 12-month period despite slower growth in some countries. In this environment, global developed and emerging market stocks, as measured by the MSCI All Country World Index, rose. Global markets were aided by accommodative monetary policies of various global central banks, improved commodity prices after 2016’s first quarter, finalization of Greece’s new debt deal and generally encouraging global economic data. Further
Geographic Composition*
Based on total Net Assets as of 12/31/16
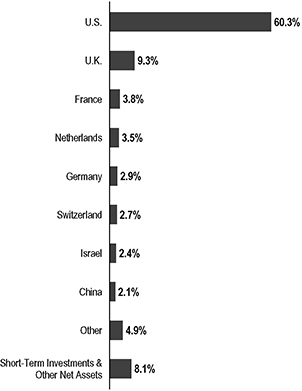
*Figures are stated as a percentage of total and may not equal 100% or may be negative due to rounding, use of any derivatives, unsettled trades or other factors.
supporting markets were expectations of higher interest rates and inflation in the U.S., driven by talk of expansionary fiscal policies under new U.S. president Donald Trump, and an Organization of the Petroleum Exporting Countries deal to curb oil production. However, these factors were partially offset by a slowdown in China’s economy and declining commodity prices early in the period, geopolitical tensions in certain regions, uncertainty about the U.S. Federal Reserve’s (Fed’s) timing for raising interest rates and worries about the health of European banks. In addition, global economic concerns and the U.K.’s historic referendum to leave the European Union (also known as “Brexit”) contributed to volatility in global stock markets.
The U.S. economy grew in 2016 despite a general decline in private inventory and business investments, which partly offset strength in consumer spending, residential investment and government spending. Manufacturing conditions remained
1. Source: Morningstar. One cannot invest directly in an index, and an index is not representative of the Fund’s portfolio. Please see Index Descriptions following the Fund Summaries
The dollar value, number of shares or principal amount, and names of all portfolio holdings are listed in the Fund’s Statement of Investments (SOI).
FRANKLIN MUTUAL GLOBAL DISCOVERY VIP FUND
volatile but generally expanded. The services sector also grew for most of the period, contributing to new jobs that helped the unemployment rate decrease from 5.0% in December 2015 to 4.7% at period-end.2 Retail sales generally rose, as did home sales and prices amid declining mortgage rates. At its December meeting, the Fed increased its target range for the federal funds rate to 0.50%–0.75%, as policymakers cited an improvement in U.S. labor markets and higher inflation. The Federal Open Market Committee also hinted at three additional hikes in 2017, and the Fed raised its 2017 U.S. economic growth forecast, while lowering its unemployment projections.
In Europe, the U.K.’s annualized economic growth accelerated in 2016’s second half, driven by gross fixed capital formation in the third quarter and manufacturing and services in the fourth quarter. Immediate effects of the Brexit vote in June materialized as U.K. stocks declined significantly, the British pound hit a three-decade low amid intensified selling and the U.K.’s credit rating was downgraded. In the eurozone, despite investor concerns about banking sector weakness, low corporate earnings and post-Brexit politics, some regions benefited from rising consumer spending, resulting from a cheaper euro, low inflation and signs of sustained economic growth. The eurozone grew slightly early in the period, aided by lower oil prices, improved exports and the European Central Bank’s (ECB’s) accommodative monetary policy. However, growth moderated in 2016’s second quarter and improved in the third and fourth quarters. After declining in the beginning of 2016, the eurozone’s annual inflation rate increased gradually to reach its highest reading in three years toward period-end, ending at an estimated 1.1% in December. The ECB cut its benchmark interest rate and expanded its massive bond-buying program in March and August 2016 to boost the region’s slowing growth. Furthermore, at its December meeting, the ECB extended the continuation of its monthly asset purchases from March to December of 2017, but it agreed to scale back the purchase amount beginning in April 2017.
In Asia, Japan’s quarterly gross domestic product grew slower in the third quarter than in the second and first quarters, mainly due to declines in private non-residential and public investments. In January 2016, the Bank of Japan (BOJ) introduced negative interest rates on excess reserves held by financial institutions with the central bank to boost lending and help achieve its inflation target. In July 2016, Japan’s Prime Minister Shinzo Abe announced a higher-than-expected fiscal stimulus to revive the economy, followed by an additional monetary stimulus announcement by the BOJ. The BOJ kept its
2. Source: Bureau of Labor Statistics.
interest rates unchanged toward period-end; however, it overhauled its monetary policy in September to focus on yield-curve control. The bank further announced that it adjusted its Japanese government bond purchases to maintain the 10-year rate for these bonds near 0%.
In emerging markets, economic growth generally moderated during the period. Brazil’s economy continued to be in recession and the country’s central bank cut its benchmark interest rate in October and November 2016 to spur economic growth. Russia’s economic contraction eased in 2016, following a rebound in oil prices and improved industrial production. The Bank of Russia reduced its key interest rates in June and September of 2016 to revive its economy. China’s economy grew at a stable rate in the first three quarters of 2016 and expanded slightly faster in the fourth quarter, as full-year 2016 growth remained within the government’s targeted range. However, the People’s Bank of China employed monetary easing measures that included cutting the cash reserve requirement ratio for the country’s banks and effectively devaluing the Chinese currency against the U.S. dollar. In India, economic growth marginally increased from July through September 2016 due to slower private consumption growth and increased government spending. Overall, emerging market stocks, as measured by the MSCI Emerging Markets Index, rose during the period.
Investment Strategy
At Franklin Mutual Advisors, we are committed to our distinctive value approach to investing. Our major investment strategy is investing in undervalued stocks. When selecting undervalued equities, we are attracted to what we believe are fundamentally strong companies with healthy balance sheets, high-quality assets, substantial free cash flow and shareholder-oriented management teams and whose stocks are trading at discounts to our assessment of the companies’ intrinsic or business value. We also look for asset-rich companies whose shares may be trading at depressed levels due to concerns over short-term earnings disappointments, litigation, management strategy or other perceived negatives. While the vast majority of our undervalued equity investments are made in publicly traded companies globally, we may invest occasionally in privately held companies as well.
We complement this more traditional investment strategy with two others. One is distressed investing, which is complex and can take many forms. The most common distressed investment
FRANKLIN MUTUAL GLOBAL DISCOVERY VIP FUND
the Fund undertakes is the purchase of financially troubled or bankrupt companies’ debt at a substantial discount to face value. After the financially distressed company is reorganized, often in bankruptcy court, the old debt is typically replaced with new securities issued by the financially stronger company.
The other piece of our investment strategy is participating in arbitrage situations, another highly specialized field. When companies announce proposed mergers or takeovers, commonly referred to as “deals,” the target company may trade at a discount to the bid it ultimately accepts. One form of arbitrage involves purchasing the target company’s stock when it is trading below the value we believe it would receive in a deal. In keeping with our commitment to a relatively conservative investment approach, we typically focus our arbitrage efforts on announced deals, and eschew rumored deals or other situations we consider relatively risky.
In addition, it is our practice to hedge the Fund’s currency exposure when we deem it advantageous for our shareholders.
What is meant by “hedge”?
To hedge an investment is to take a position intended to offset potential losses/gains that may be incurred by a companion financial instrument.
Manager’s Discussion
The year 2016 was a roller coaster year for most markets. Fears of global recession drove markets down early in the year, a gradual recovery was briefly disrupted by the Brexit referendum vote in late June and the unexpected election of Donald Trump in November served as the catalyst for a late year market spike. Early year recession fears steadily faded, with U.S. unemployment reaching new lows for this business cycle. As economic activity picked up, commodity markets also recovered, with Brent oil prices climbing back over US$50 a barrel, from lows of almost half that level early in the year. As the year ended, equity markets appreciated, apparently in anticipation of accelerating economic growth and increasing corporate profit driven by expectations of rapid adoption of Republican proposals to decrease regulation and dramatically reduce tax rates.
Political activity in 2016 was unpredictable, by most standards, with material impact on markets. In mid-year, the Brexit vote surprised markets, triggering a significant depreciation in the value of the British pound. The process by which Brexit will be implemented remains very unclear and in our view will be an overhang for some time. The election of Donald Trump was also a material surprise, and was coupled with an unexpected
Republican “sweep” of both houses of Congress. Markets quickly reacted to Trump and Republican policy preferences, with cyclical and regulated sectors, such as banks, posting strong returns. Late in the year, the Italian referendum to reform the electoral system failed, leading to a resignation of the prime minister and the formation of a new government. Put together, these events reflect widespread skepticism of “the powers that be” and a desire for change, of whatever type, by significant portions of the population of developed economies.
| | | | |
Top 10 Sectors/Industries | | | |
| 12/31/16 | | | |
| | | % of Total
Net Assets | |
| Banks | | | 15.6% | |
| Pharmaceuticals | | | 7.9% | |
| Insurance | | | 7.7% | |
| Oil, Gas & Consumable Fuels | | | 6.8% | |
| Software | | | 5.9% | |
| Tobacco | | | 4.7% | |
| Media | | | 4.6% | |
| Food & Staples Retailing | | | 4.2% | |
| Health Care Equipment & Supplies | | | 3.9% | |
| Communications Equipment | | | 2.4% | |
The implications of such desire for political change for financial markets are not clear. In the near term, each event has led to “first order” impacts. For Brexit, we saw strong stock price movements among U.K. firms with significant non-U.K. business exposure, while shares of primarily domestic firms weakened. The U.S. election led to outperformance by sectors expected to benefit the most from corporate tax reform, decreased regulation and changes in terms of trade. The Italian referendum has been followed by difficulties in getting investors to support needed recapitalizations of Italian banks. However, the longer term impacts remain unclear. Will the U.K. have a “hard Brexit” with limited room for negotiations with the European Union? Will the new U.S. administration spark a global trade war? Will Italy further drag down Europe?
As value investors, we certainly benefited this year from steady economic growth and the year-end market surge. However, we do not invest primarily on views of political outcomes. We invest prudently in securities that we believe represent good value, and then we adjust our views as the world around us changes.
FRANKLIN MUTUAL GLOBAL DISCOVERY VIP FUND
The financials sector has been a significant area of investment for the Fund.3 Financials have traded at historically low price-to-book valuations almost continuously since the financial crisis of 2008. The Franklin Mutual Global Discovery VIP Fund has held various positions, and entered 2016 with significant positions in JPMorgan Chase, Wells Fargo, Société Générale, and others. Through the year, the financials sector was volatile like the overall market, but ended the year well. The firms mentioned benefited from several trends, including improved economic growth, which drives new business and lowers credit costs. They also benefited from rising interest rates. Most banks have substantial assets which generate more income as rates rise and often have some funding that is not tied to rates, and so it can become a more advantageous environment when rates are higher. Finally, financial firms would benefit from a reduction in regulation, as many are still being investigated or paying fines for activities that occurred as much as a decade ago. If all of these effects materialize, we believe the valuations of financials will likely continue to improve.
An example of such a firm held by the Fund is JPMorgan Chase, one of the biggest banks in the world. JPMorgan is diversified, with activities in retail banking, credit cards, mortgages, investment banking and asset management. We believe JPMorgan is likely to benefit from all the trends mentioned above. Higher rates should drive income from the substantial assets JPMorgan carries, as well as increase the value of the non-interest bearing accounts JPMorgan provides. An improving economy kept credit losses low and increased demand for new loans and other services, and a recovering financial market benefited investment bank and asset management activities. JPMorgan shares appreciated in 2016 but, in our view, remained modestly valued and an attractive investment for the Fund.
Merger and acquisition (M&A) activity continued to be strong in 2016, helping to support equity market valuations. Regulatory uncertainty persisted throughout the year, with deal failures from the first half of the year, such as the failed acquisitions of Office Depot4 and Baker Hughes, followed by the Department of Justice’s decisions to sue to block two major health insurance mergers. However, major deals continued to be announced, including Microsoft’s acquisition of LinkedIn4 and AT&T’s4 acquisition of Time Warner. Several of these
deals have presented attractive merger arbitrage opportunities, in our view.
Credit spreads widened dramatically across industries and countries in early 2016 and then narrowed steadily through the rest of the year. The trend was particularly apparent in subinvestment-grade credit, which created additional challenges for industries already experiencing distress, including energy, metals and mining.5 Dislocations in debt capital markets created some unique opportunities, in our view, especially in stressed and event-driven credit situations, where we felt the yield reached attractive levels and that cheap enterprise valuation multiples provided downside protection. Early in the year, the Fund invested in debt needed to complete acquisitions. These “hung deals” in our view presented attractive opportunities for us to allocate capital at times when significant stress was observed in the market. By the end of the period, credit spreads had tightened materially from their intra-period highs and the Fund had exited many of the opportunistic investments.
We are also reaching the end of the investment horizon of some long-standing high yield positions. The Fund’s position in the debt issued in the leveraged buyout of TXU in 2007 came through bankruptcy and the Fund now holds equity in a reorganized entity. Debt held in other leveraged buyouts, such as iHeartMedia (formerly known as Clear Channel Communications), Avaya and Caesars Entertainment continue to head toward long-term resolutions of their stressed capital structures.
Turning to Fund performance, top contributors included Netherlands-based oil and natural gas producer Royal Dutch Shell, global U.K.-based tobacco company British American Tobacco and U.S.-based energy services company Baker Hughes.
Although average crude oil prices during the period were lower than the prior year, they appeared to have bottomed in February, and the outlook at year-end was improved in part due to a production cut agreement by both the Organization of the Petroleum Exporting Countries (OPEC) and certain non-OPEC countries, which benefited many energy shares, including those of Royal Dutch Shell. Early in the year, Shell completed the acquisition of BG group, which strengthened the company’s portfolio, but placed some pressure on its balance sheet at a time of weak commodity prices. In June, investors reacted
3. The financials sector comprises banks, consumer finance, diversified financial services and insurance in the SOI.
4. Not a Fund holding.
5. The energy sector comprises energy equipment and services; and oil, gas and consumable fuels in the SOI.
FRANKLIN MUTUAL GLOBAL DISCOVERY VIP FUND
| | | | |
| Top 10 Equity Holdings | | | |
| 12/31/16 | | | |
Company
Sector/Industry, Country | | % of Total
Net Assets | |
Microsoft Corp. Software, U.S. | | | 2.8% | |
Merck & Co. Inc. Pharmaceuticals, U.S. | | | 2.5% | |
Time Warner Inc. Media, U.S. | | | 2.1% | |
Wells Fargo & Co. Banks, U.S. | | | 2.1% | |
Royal Dutch Shell PLC Oil, Gas & Consumable Fuels, U.K. | | | 2.0% | |
Capital Bank Financial Corp. Banks, U.S. | | | 2.0% | |
Citigroup Inc. Banks, U.S. | | | 2.0% | |
American International Group Inc. Insurance, U.S. | | | 2.0% | |
Medtronic PLC Health Care Equipment & Supplies, U.S. | | | 2.0% | |
PNC Financial Services Group Inc. Banks, U.S. | | | 1.8% | |
favorably to Royal Dutch Shell’s strategy update, which included an upward revision to synergies related to the BG Group acquisition, including a lower cost base, a limit on capital spending and an implicit lower oil-price breakeven point. The company also reiterated its intention to dispose of $30 billion of assets through 2018, maintain its dividend, eliminate the scrip dividend, and buy back $25 billion of shares over time. Shares of Royal Dutch Shell did not follow the broad equity market decline after the Brexit referendum result in June. The company is a U.S. dollar-based business, which reports and declares its dividends in U.S. dollars, resulting in what we consider to be a more attractive valuation in its local market, given the decline of the pound.
In 2016’s first half, shares of British American Tobacco benefited from a general investor preference for company stocks perceived to be less sensitive to economic conditions (defensive stocks), and those having an attractive dividend yield. Such equities included consumer staples stocks that generally outperformed in the first half of the year despite tepid global economic conditions, low interest rates and uncertainty ahead of the Brexit referendum. Later in 2016, shares of British American Tobacco were a beneficiary of the Brexit decision, as the company generates nearly all of its operating profits outside the U.K. The meaningful post-Brexit drop in the British pound caused analysts to increase their outlook for 2016 and 2017 results as foreign earnings, when translated back into pounds,
were expected to post strong growth. A stronger U.S. dollar further benefited British American Tobacco via its substantial stake in U.S.-based Reynolds American. These events caused the stock price of British American Tobacco to rise, and in October, the company seized the opportunity to offer a non-binding proposal for full ownership of Reynolds American, which if consummated, would further add to operating profits and cash flow.
The stock price of Baker Hughes broadly followed the fluctuations of crude oil prices during much of 2016. In late October, the company announced a merger with General Electric’s oil and gas business. Baker Hughes’ stock price jumped on the news but quickly gave back much of the initial gain as investors processed the fact that it was not a takeover of Baker Hughes, and that the combined company will be less exposed to short-term cyclical moves in the oil markets due to the longer cycle nature of GE’s oil and gas business revenue mix. Shares of Baker Hughes subsequently rallied in November, due in part to investors’ further consideration of the benefits of the merger and a rise in oil prices during the second half of the month.
During the period under review, Fund investments that detracted from performance included Israel-based pharmaceutical services provider Teva Pharmaceutical Industries, Germany-based commercial bank Commerzbank and Finland-based global communications and IT company Nokia.
Shares of Teva Pharmaceutical Industries followed the broad-based retreat in global financial markets in January and early February 2016. The stock slid further in the first half of the year due to a delay in the closing of Teva’s acquisition of Actavis, Allergan’s generics unit, which was finally completed in August. Downward pressure on the stock during the second half of the year came from heightened concerns around generic drug price deflation in the U.S., lowered 2016 fiscal year guidance issued in November, and the unexpected announcement that Siggi Olafsson would step down as the head of Teva’s global generic medicine group in early 2017 and be replaced by Dipankar Bhattacharjee, the head of Teva’s generics business in Europe. Olafsson’s departure raised investor concerns about the integration of Actavis. At the close of 2016, Teva’s stock price reflected a high degree of caution by investors. However, we believe Teva has a strong global generics business and an emerging specialty drug pipeline, as well as an improving balance sheet due to de-leveraging.
Shares of Commerzbank declined significantly in January and early February as Europe’s financials sector was hindered by
FRANKLIN MUTUAL GLOBAL DISCOVERY VIP FUND
the detrimental effects of low interest rates, ongoing concerns about the health of the global economy, and challenging conditions in capital markets. The stock also dropped ahead of and immediately after the Brexit referendum result. We decided to exit the position in July as the risk-reward profile of the company became considerably less attractive for reasons beyond Brexit, including pressure on performance from low rates and a highly competitive German banking sector.
Nokia’s stock price retreated in early February 2016 after the International Court of Arbitration issued a binding ruling prescribing lower-than-estimated royalty rates that South Korea-based Samsung is to pay to Nokia. The decision has negative implications for the high-margin cash flows Nokia is supposed to receive. In February 2016, Nokia also announced its first set of quarterly results following the January 2016 close of its Alcatel-Lucent acquisition. Investors reacted negatively to management’s cautious comments regarding demand for new mobile networks in China and the absence of formal guidance. In late October, shares fell further as quarterly results showed a decline in network equipment revenues and management cautioned that year-over-year sales in 2017 could be negative.
During the period, the Fund held currency forwards and futures to partially hedge a significant portion of the currency risk of the portfolio’s non-U.S. dollar investments. The currency forwards had a positive impact on the Fund’s performance during the period, while currency futures had a negligible impact.
What is a currency forward?
A currency forward is an agreement between the Fund and a counterparty to buy or sell a foreign currency in exchange for another currency at a specific exchange rate on a future date.
What is a future?
A future is an agreement between the Fund and a counterparty made through a U.S. or foreign futures exchange to buy or sell an underlying instrument or asset at a specific price on a future date.
Thank you for your participation in Franklin Mutual Global Discovery VIP Fund. We look forward to serving your future investment needs.
The foregoing information reflects our analysis, opinions and portfolio holdings as of December 31, 2016, the end of the reporting period. The way we implement our main investment strategies and the resulting portfolio holdings may change depending on factors such as market and economic conditions. These opinions may not be relied upon as investment advice or an offer for a particular security. The information is not a complete analysis of every aspect of any market, country, industry, security or the Fund. Statements of fact are from sources considered reliable, but the investment manager makes no representation or warranty as to their completeness or accuracy. Although historical performance is no guarantee of future results, these insights may help you understand our investment management philosophy.
FRANKLIN MUTUAL GLOBAL DISCOVERY VIP FUND
Class 2 Fund Expenses
As an investor in a variable insurance contract (Contract) that indirectly provides for investment in an underlying mutual fund, you can incur transaction and/or ongoing expenses at both the Fund level and the Contract Level: (1) transaction expenses can include sales charges (loads) on purchases, surrender fees, transfer fees and premium taxes; and (2) ongoing expenses can include management fees, distribution and service (12b-1) fees, contract fees, annual maintenance fees, mortality and expense risk fees and other fees and expenses. All mutual funds and Contracts have some types of ongoing expenses. The table below shows Fund-level ongoing expenses and can help you understand these costs and compare them with those of other mutual funds offered through the Contract. The table assumes a $1,000 investment held for the six months indicated. Please refer to the Fund prospectus for additional information on operating expenses.
Actual Fund Expenses
The table below provides information about the actual account values and actual expenses in the columns under the heading “Actual.” In these columns the Fund’s actual return, which includes the effect of ongoing Fund expenses but does not include the effect of ongoing Contract expenses, is used to calculate the “Ending Account Value.”
You can estimate the Fund-level expenses you paid during the period by following these steps (of course, your account value and expenses will differ from those in this illustration):
| | Divide your account value by $1,000 (if your account had an $8,600 value, then $8,600 ÷ $1,000 = 8.6). |
| | Then multiply the result by the number under the headings “Actual” and “Fund-Level Expenses Paid During Period” (if Fund-Level Expenses Paid During Period were $ 7.50, then 8.6 x $7.50 = $64.50). |
In this illustration, the estimated expenses paid this period at the Fund level are $64.50.
Hypothetical Example for Comparison with Other Mutual Funds
Under the heading “Hypothetical” in the table, information is provided about hypothetical account values and hypothetical expenses based on the Fund’s actual expense ratio and an assumed rate of return of 5% per year before expenses, which is not the Fund’s actual return. This information may not be used to estimate the actual ending account balance or expenses you paid for the period, but it can help you compare ongoing costs of investing in the Fund with those of other mutual funds offered through the Contract. To do so, compare this 5% hypothetical example with the 5% hypothetical examples that appear in the shareholder reports of other funds offered through the Contract.
Please note that expenses shown in the table are meant to highlight ongoing costs at the Fund level only and do not reflect any ongoing expenses at the Contract level, or transaction expenses at either the Fund or Contract levels. In addition, while the Fund does not have transaction expenses, if the transaction and ongoing expenses at the Contract level were included, the expenses shown below would be higher. You should consult your Contract prospectus or disclosure document for more information.
| | | | | | | | | | | | | | | | | | | | | | | | |
| | | | | | Actual
(actual return after expenses) | | | Hypothetical
(5% annual return before expenses) | | | | |
| Share Class | |
| Beginning Account
Value 7/1/16 |
| |
| Ending Account
Value 12/31/16 |
| |
| Fund-Level
Expenses Paid
During Period
7/1/16–12/31/16 |
1,2 | |
| Ending Account
Value 12/31/16 |
| |
| Fund-Level
Expenses Paid
During Period
7/1/16–12/31/16 |
1,2 | |
| Net
Annualized
Expense
Ratio |
2 |
Class 2 | | | $1,000 | | | | $1,127.60 | | | | $6.85 | | | | $1,018.70 | | | | $6.50 | | | | 1.28% | |
1. Expenses are equal to the annualized expense ratio for the six-month period as indicated above–in the far right column–multiplied by the simple average account value over the period indicated, and then multiplied by 184/366 to reflect the one-half year period.
2. Reflects expenses after fee waivers and expense reimbursements. Does not include any ongoing expenses of the Contract for which the Fund is an investment option or acquired fund fees and expenses.
VIP3 P1_P2_P4 09/16
SUPPLEMENT DATED SEPTEMBER 28, 2016
TO THE PROSPECTUSES
DATED MAY 1, 2016
OF
FRANKLIN GLOBAL REAL ESTATE VIP FUND
FRANKLIN INCOME VIP FUND
FRANKLIN MUTUAL GLOBAL DISCOVERY VIP FUND
FRANKLIN MUTUAL SHARES VIP FUND
TEMPLETON FOREIGN VIP FUND
TEMPLETON GROWTH VIP FUND
(Series of Franklin Templeton Variable Insurance Products Trust)
The Prospectus is amended as follows:
I. For the Franklin Mutual Global Discovery VIP Fund, Templeton Foreign VIP Fund and Templeton Growth VIP Fund, the following is added to the “Fund Summary – Principal Risks” section:
Regional Focus Because the Fund may invest at least a significant portion of its assets in companies in a specific region, including Europe, the Fund is subject to greater risks of adverse developments in that region and/or the surrounding regions than a fund that is more broadly diversified geographically. Political, social or economic disruptions in the region, even in countries in which the Fund is not invested, may adversely affect the value of securities values held by the Fund. Current political uncertainty surrounding the European Union (EU) and its membership, including the 2016 referendum in which the United Kingdom voted to exit the EU, may increase market volatility. The financial instability of some countries in the EU, including Greece, Italy and Spain, together with the risk of that impacting other more stable countries may increase the economic risk of investing in companies in Europe.
II. For all funds (excluding the Franklin Mutual Global Discovery VIP Fund and Franklin Mutual Shares VIP Fund), the “Fund Details – Principal Risks – Foreign Securities” section is revised to add the following as a second paragraph to the “Regional” sub-section:
The risk of investments in Europe may be heightened due to the 2016 referendum in which the United Kingdom voted to exit the European Union (EU). Political, economic and legal uncertainty may cause increased market volatility. In addition, if one or more countries were to exit the EU or abandon the use of the Euro as a currency, the value of investments associated with those countries or the Euro could decline significantly and unpredictably and it would likely cause additional market disruption globally and introduce new legal and regulatory uncertainties.
III. For the Franklin Mutual Global Discovery VIP Fund and Franklin Mutual Shares VIP Fund, the “Fund Details – Principal Risks
– Foreign Securities” section is revised to add the following:
Regional. Adverse conditions in a certain region or country can adversely affect securities of issuers in other countries whose economies appear to be unrelated. To the extent that the Fund invests a significant portion of its assets in a specific geographic region or a particular country, the Fund will generally have more exposure to the specific regional or country economic risks. In the event of economic or political turmoil or a deterioration of diplomatic relations in a region or country where a substantial portion of the Fund’s assets are invested, the Fund may experience substantial illiquidity or reduction in the value of the Fund’s investments.
The risk of investments in Europe may be heightened due to the 2016 referendum in which the United Kingdom voted to exit the European Union (EU). Political, economic and legal uncertainty may cause increased market volatility. In addition, if one or more countries were to exit the EU or abandon the use of the Euro as a currency, the value of investments associated with those countries or the Euro could decline significantly and unpredictably and it would likely cause additional market disruption globally and introduce new legal and regulatory uncertainties.
Please keep this supplement with your prospectus for future reference.
FRANKLIN TEMPLETON VARIABLE INSURANCE PRODUCTS TRUST
Financial Highlights
Franklin Mutual Global Discovery VIP Fund
| | | | | | | | | | | | | | | | | | | | |
| | | Year Ended December 31, | |
| | | 2016 | | | 2015 | | | 2014 | | | 2013 | | | 2012 | |
| Class 1 | | | | | | | | | | | | | | | | | | | | |
Per share operating performance
(for a share outstanding throughout the year) | | | | | | | | | | | | | | | | | | | | |
| | | | | |
Net asset value, beginning of year | | | $19.85 | | | | $22.61 | | | | $23.31 | | | | $20.55 | | | | $19.66 | |
| | | | |
| | | | | |
| Income from investment operationsa: | | | | | | | | | | | | | | | | | | | | |
| | | | | |
Net investment incomeb | | | 0.41 | | | | 0.37 | | | | 0.68 | c | | | 0.46 | | | | 0.43 | |
| | | | | |
Net realized and unrealized gains (losses) | | | 1.92 | | | | (1.17 | ) | | | 0.76 | | | | 5.03 | | | | 2.21 | |
| | | | |
Total from investment operations | | | 2.33 | | | | (0.80 | ) | | | 1.44 | | | | 5.49 | | | | 2.64 | |
| | | | |
| | | | | |
| Less distributions from: | | | | | | | | | | | | | | | | | | | | |
| | | | | |
Net investment income | | | (0.39 | ) | | | (0.69 | ) | | | (0.57 | ) | | | (0.58 | ) | | | (0.64 | ) |
| | | | | |
Net realized gains | | | (1.57 | ) | | | (1.27 | ) | | | (1.57 | ) | | | (2.15 | ) | | | (1.11 | ) |
| | | | |
Total distributions | | | (1.96 | ) | | | (1.96 | ) | | | (2.14 | ) | | | (2.73 | ) | | | (1.75 | ) |
| | | | |
Net asset value, end of year | | | $20.22 | | | | $19.85 | | | | $22.61 | | | | $23.31 | | | | $20.55 | |
| | | | |
| | | | | |
Total returnd | | | 12.32% | | | | (3.39)% | | | | 5.98% | | | | 27.95% | | | | 13.63% | |
| | | | | |
| Ratios to average net assets | | | | | | | | | | | | | | | | | | | | |
| | | | | |
Expensese | | | 1.01% | f,g | | | 1.02% | f,g | | | 1.00%f | | | | 0.97%f | | | | 0.99% | |
| | | | | |
Expenses incurred in connection with securities sold short | | | 0.01% | | | | 0.02% | | | | 0.03% | | | | —%h | | | | —%h | |
| | | | | |
Net investment income | | | 2.10% | | | | 1.71% | | | | 2.85%c | | | | 2.13% | | | | 2.12% | |
| | | | | |
| Supplemental data | | | | | | | | | | | | | | | | | | | | |
| | | | | |
Net assets, end of year (000’s) | | | $3,084 | | | | $2,632 | | | | $2,313 | | | | $2,465 | | | | $1,136 | |
| | | | | |
Portfolio turnover rate | | | 17.54% | | | | 21.88% | | | | 22.18% | | | | 15.58% | | | | 25.63% | |
aThe amount shown for a share outstanding throughout the period may not correlate with the Statement of Operations for the period due to the timing of sales and repurchases of the Fund’s shares in relation to income earned and/or fluctuating fair value of the investments of the Fund.
bBased on average daily shares outstanding.
cNet investment income per share includes approximately $0.34 per share related to income received in the form of special dividends in connection with certain Fund holdings. Excluding this amount, the ratio of net investment income to average net assets would have been 1.40%.
dTotal return does not include fees, charges or expenses imposed by the variable annuity and life insurance contracts for which Franklin Templeton Variable Insurance Products Trust serves as an underlying investment vehicle.
eIncludes dividend and/or interest expense on securities sold short and security borrowing fees, if any. See below for the ratios of such expenses to average net assets for the periods presented. See Note 1(e).
fBenefit of expense reduction rounds to less than 0.01%.
gBenefit of waiver and payments by affiliates rounds to less than 0.01%.
hRounds to less than 0.01%.
| | | | |
| MGD-10 | | Annual Report | The accompanying notes are an integral part of these financial statements. | | |
FRANKLIN TEMPLETON VARIABLE INSURANCE PRODUCTS TRUST
FINANCIAL HIGHLIGHTS
Franklin Mutual Global Discovery VIP Fund (continued)
| | | | | | | | | | | | | | | | | | | | |
| | | Year Ended December 31, | |
| | | 2016 | | | 2015 | | | 2014 | | | 2013 | | | 2012 | |
| Class 2 | | | | | | | | | | | | | | | | | | | | |
Per share operating performance
(for a share outstanding throughout the year) | | | | | | | | | | | | | | | | | | | | |
| | | | | |
Net asset value, beginning of year | | | $19.37 | | | | $22.11 | | | | $22.84 | | | | $20.17 | | | | $19.30 | |
| | | | |
| | | | | |
| Income from investment operationsa: | | | | | | | | | | | | | | | | | | | | |
| | | | | |
Net investment incomeb | | | 0.35 | | | | 0.32 | | | | 0.60 | c | | | 0.42 | | | | 0.38 | |
| | | | | |
Net realized and unrealized gains (losses) | | | 1.87 | | | | (1.16 | ) | | | 0.75 | | | | 4.92 | | | | 2.15 | |
| | | | |
Total from investment operations | | | 2.22 | | | | (0.84 | ) | | | 1.35 | | | | 5.34 | | | | 2.53 | |
| | | | |
| | | | | |
| Less distributions from: | | | | | | | | | | | | | | | | | | | | |
| | | | | |
Net investment income | | | (0.33 | ) | | | (0.63 | ) | | | (0.51 | ) | | | (0.52 | ) | | | (0.55 | ) |
| | | | | |
Net realized gains | | | (1.57 | ) | | | (1.27 | ) | | | (1.57 | ) | | | (2.15 | ) | | | (1.11 | ) |
| | | | |
Total distributions | | | (1.90 | ) | | | (1.90 | ) | | | (2.08 | ) | | | (2.67 | ) | | | (1.66 | ) |
| | | | |
Net asset value, end of year | | | $19.69 | | | | $19.37 | | | | $22.11 | | | | $22.84 | | | | $20.17 | |
| | | | |
| | | | | |
Total returnd | | | 12.06% | | | | (3.65)% | | | | 5.71% | | | | 27.61% | | | | 13.36% | |
| | | | | |
| Ratios to average net assets | | | | | | | | | | | | | | | | | | | | |
| | | | | |
Expensese | | | 1.26% | f,g | | | 1.27% | f,g | | | 1.25% | f | | | 1.22% | f | | | 1.24% | |
| | | | | |
Expenses incurred in connection with securities sold short | | | 0.01% | | | | 0.02% | | | | 0.03% | | | | —% | h | | | —% | h |
| | | | | |
Net investment income | | | 1.85% | | | | 1.46% | | | | 2.60% | c | | | 1.88% | | | | 1.87% | |
| | | | | |
| Supplemental data | | | | | | | | | | | | | | | | | | | | |
| | | | | |
Net assets, end of year (000’s) | | | $630,397 | | | | $629,366 | | | | $685,711 | | | | $684,780 | | | | $660,465 | |
| | | | | |
Portfolio turnover rate | | | 17.54% | | | | 21.88% | | | | 22.18% | | | | 15.58% | | | | 25.63% | |
aThe amount shown for a share outstanding throughout the period may not correlate with the Statement of Operations for the period due to the timing of sales and repurchases of the Fund’s shares in relation to income earned and/or fluctuating fair value of the investments of the Fund.
bBased on average daily shares outstanding.
cNet investment income per share includes approximately $0.34 per share related to income received in the form of special dividends in connection with certain Fund holdings. Excluding this amount, the ratio of net investment income to average net assets would have been 1.15%.
dTotal return does not include fees, charges or expenses imposed by the variable annuity and life insurance contracts for which Franklin Templeton Variable Insurance Products Trust serves as an underlying investment vehicle.
eIncludes dividend and/or interest expense on securities sold short and security borrowing fees, if any. See below for the ratios of such expenses to average net assets for the periods presented. See Note 1(e).
fBenefit of expense reduction rounds to less than 0.01%.
gBenefit of waiver and payments by affiliates rounds to less than 0.01%.
hRounds to less than 0.01%.
| | | | | | |
| | | The accompanying notes are an integral part of these financial statements. | Annual Report | | | MGD-11 | |
FRANKLIN TEMPLETON VARIABLE INSURANCE PRODUCTS TRUST
FINANCIAL HIGHLIGHTS
Franklin Mutual Global Discovery VIP Fund (continued)
| | | | | | | | | | | | | | | | | | | | |
| | | Year Ended December 31, | |
| | | 2016 | | | 2015 | | | 2014 | | | 2013 | | | 2012 | |
| Class 4 | | | | | | | | | | | | | | | | | | | | |
Per share operating performance
(for a share outstanding throughout the year) | | | | | | | | | | | | | | | | | | | | |
| | | | | |
Net asset value, beginning of year | | | $19.66 | | | | $22.39 | | | | $23.10 | | | | $20.38 | | | | $19.50 | |
| | | | |
| | | | | |
| Income from investment operationsa: | | | | | | | | | | | | | | | | | | | | |
| | | | | |
Net investment incomeb | | | 0.34 | | | | 0.30 | | | | 0.61 | c | | | 0.40 | | | | 0.36 | |
| | | | | |
Net realized and unrealized gains (losses) | | | 1.89 | | | | (1.17 | ) | | | 0.73 | | | | 4.97 | | | | 2.19 | |
| | | | |
Total from investment operations | | | 2.23 | | | | (0.87 | ) | | | 1.34 | | | | 5.37 | | | | 2.55 | |
| | | | |
| | | | | |
| Less distributions from: | | | | | | | | | | | | | | | | | | | | |
| | | | | |
Net investment income | | | (0.30 | ) | | | (0.59 | ) | | | (0.48 | ) | | | (0.50 | ) | | | (0.56 | ) |
| | | | | |
Net realized gains | | | (1.57 | ) | | | (1.27 | ) | | | (1.57 | ) | | | (2.15 | ) | | | (1.11 | ) |
| | | | |
Total distributions | | | (1.87 | ) | | | (1.86 | ) | | | (2.05 | ) | | | (2.65 | ) | | | (1.67 | ) |
| | | | |
Net asset value, end of year. | | | $20.02 | | | | $19.66 | | | | $22.39 | | | | $23.10 | | | | $20.38 | |
| | | | |
| | | | | |
Total returnd | | | 11.91% | | | | (3.74)% | | | | 5.60% | | | | 27.52% | | | | 13.27% | |
| | | | | |
| Ratios to average net assets | | | | | | | | | | | | | | | | | | | | |
| | | | | |
Expensese | | | 1.36% | f,g | | | 1.37% | f,g | | | 1.35% | f | | | 1.32% | f | | | 1.34% | |
| | | | | |
Expenses incurred in connection with securities sold short | | | 0.01% | | | | 0.02% | | | | 0.03% | | | | —% | h | | | —% | h |
| | | | | |
Net investment income | | | 1.75% | | | | 1.36% | | | | 2.50% | c | | | 1.78% | | | | 1.77% | |
| | | | | |
| Supplemental data | | | | | | | | | | | | | | | | | | | | |
| | | | | |
Net assets, end of year (000’s) | | | $45,262 | | | | $49,054 | | | | $59,961 | | | | $70,354 | | | | $62,346 | |
| | | | | |
Portfolio turnover rate | | | 17.54% | | | | 21.88% | | | | 22.18% | | | | 15.58% | | | | 25.63% | |
aThe amount shown for a share outstanding throughout the period may not correlate with the Statement of Operations for the period due to the timing of sales and repurchases of the Fund’s shares in relation to income earned and/or fluctuating fair value of the investments of the Fund.
bBased on average daily shares outstanding.
cNet investment income per share includes approximately $0.34 per share related to income received in the form of special dividends in connection with certain Fund holdings. Excluding this amount, the ratio of net investment income to average net assets would have been 1.05%.
dTotal return does not include fees, charges or expenses imposed by the variable annuity and life insurance contracts for which Franklin Templeton Variable Insurance Products Trust serves as an underlying investment vehicle.
eIncludes dividend and/or interest expense on securities sold short and security borrowing fees, if any. See below for the ratios of such expenses to average net assets for the periods presented. See Note 1(e).
fBenefit of expense reduction rounds to less than 0.01%.
gBenefit of waiver and payments by affiliates rounds to less than 0.01%.
hRounds to less than 0.01%.
| | | | |
| MGD-12 | | Annual Report | The accompanying notes are an integral part of these financial statements. | | |
FRANKLIN TEMPLETON VARIABLE INSURANCE PRODUCTS TRUST
Statement of Investments, December 31, 2016
| | | | | | | | | | | | | | |
Franklin Mutual Global Discovery VIP Fund | | | | |
| | | | | Country | | | Shares/
Units | | | Value | |
| | | Common Stocks and Other Equity Interests 87.4% | | | | | | | | | |
| | | Aerospace & Defense 0.8% | | | | | | | | | |
| | B/E Aerospace Inc. | | | United States | | | | 65,840 | | | $ | 3,962,910 | |
| a | | KLX Inc. | | | United States | | | | 32,920 | | | | 1,485,021 | |
| | | | | | | | | | | | | | |
| | | | | | | | | | | | | 5,447,931 | |
| | | | | | | | | | | | | | |
| | Auto Components 0.9% | | | | | | | | | | | | |
| | Cie Generale des Etablissements Michelin, B | | | France | | | | 30,800 | | | | 3,425,500 | |
| a,b | | International Automotive Components Group Brazil LLC | | | Brazil | | | | 424,073 | | | | 10,435 | |
| a,b,c | | International Automotive Components Group North America LLC | | | United States | | | | 4,052,916 | | | | 3,014,964 | |
| | | | | | | | | | | | | | |
| | | | | | | | | | | | | 6,450,899 | |
| | | | | | | | | | | | | | |
| | Automobiles 1.5% | | | | | | | | | | | | |
| | General Motors Co. | | | United States | | | | 214,110 | | | | 7,459,592 | |
| | Hyundai Motor Co. | | | South Korea | | | | 20,953 | | | | 2,533,962 | |
| | | | | | | | | | | | | | |
| | | | | | | | | | | | | 9,993,554 | |
| | | | | | | | | | | | | | |
| | Banks 15.6% | | | | | | | | | | | | |
| | Barclays PLC | | | United Kingdom | | | | 2,052,511 | | | | 5,649,679 | |
| | BNP Paribas SA | | | France | | | | 117,870 | | | | 7,509,581 | |
| | Capital Bank Financial Corp., A | | | United States | | | | 78,494 | | | | 3,080,890 | |
| d | | Capital Bank Financial Corp., B, 144A, non-voting | | | United States | | | | 269,922 | | | | 10,594,439 | |
| | CIT Group Inc. | | | United States | | | | 174,912 | | | | 7,465,244 | |
| | Citigroup Inc. | | | United States | | | | 229,050 | | | | 13,612,441 | |
| | Citizens Financial Group Inc. | | | United States | | | | 310,923 | | | | 11,078,186 | |
| | HSBC Holdings PLC | | | United Kingdom | | | | 438,755 | | | | 3,550,416 | |
| | JPMorgan Chase & Co. | | | United States | | | | 96,110 | | | | 8,293,332 | |
| | PNC Financial Services Group Inc. | | | United States | | | | 105,531 | | | | 12,342,906 | |
| | Societe Generale SA | | | France | | | | 118,614 | | | | 5,834,040 | |
| a | | Standard Chartered PLC | | | United Kingdom | | | | 374,211 | | | | 3,059,009 | |
| | Wells Fargo & Co. | | | United States | | | | 256,320 | | | | 14,125,795 | |
| | | | | | | | | | | | | | |
| | | | | | | | | | | | | 106,195,958 | |
| | | | | | | | | | | | | | |
| | Beverages 0.9% | | | | | | | | | | | | |
| | PepsiCo Inc. | | | United States | | | | 55,497 | | | | 5,806,651 | |
| | | | | | | | | | | | | | |
| | Chemicals 1.3% | | | | | | | | | | | | |
| | Monsanto Co. | | | United States | | | | 64,910 | | | | 6,829,181 | |
| | Syngenta AG | | | Switzerland | | | | 4,660 | | | | 1,841,762 | |
| | | | | | | | | | | | | | |
| | | | | | | | | | | | | 8,670,943 | |
| | | | | | | | | | | | | | |
| | Communications Equipment 2.4% | | | | | | | | | | | | |
| | Cisco Systems Inc. | | | United States | | | | 359,180 | | | | 10,854,419 | |
| | Nokia OYJ, A | | | Finland | | | | 611,269 | | | | 2,950,897 | |
| | Nokia OYJ, ADR | | | Finland | | | | 519,486 | | | | 2,498,728 | |
| | | | | | | | | | | | | | |
| | | | | | | | | | | | | 16,304,044 | |
| | | | | | | | | | | | | | |
| | Construction Materials 0.6% | | | | | | | | | | | | |
| | LafargeHolcim Ltd., B | | | Switzerland | | | | 78,676 | | | | 4,144,705 | |
| | | | | | | | | | | | | | |
| | Consumer Finance 1.2% | | | | | | | | | | | | |
| | Ally Financial Inc. | | | United States | | | | 151,600 | | | | 2,883,432 | |
| | Capital One Financial Corp. | | | United States | | | | 60,788 | | | | 5,303,145 | |
| | | | | | | | | | | | | | |
| | | | | | | | | | | | | 8,186,577 | |
| | | | | | | | | | | | | | |
FRANKLIN TEMPLETON VARIABLE INSURANCE PRODUCTS TRUST
STATEMENT OF INVESTMENTS
Franklin Mutual Global Discovery VIP Fund (continued)
| | | | | | | | | | | | | | |
| | | | | Country | | | Shares/
Units | | | Value | |
| | Common Stocks and Other Equity Interests (continued) | | | | | | | | | | | | |
| | | Diversified Financial Services 1.4% | | | | | | | | | |
| a,b | | Hightower Holding LLC, B, Series 2 | | | United States | | | | 1,775,736 | | | $ | 5,466,782 | |
| | Voya Financial Inc. | | | United States | | | | 101,650 | | | | 3,986,713 | |
| | | | | | | | | | | | | | |
| | | | | | | | | | | | | 9,453,495 | |
| | | | | | | | | | | | | | |
| | | Diversified Telecommunication Services 1.4% | | | | | | | | | |
| | China Telecom Corp. Ltd., H | | | China | | | | 13,642,104 | | | | 6,298,115 | |
| | Koninklijke KPN NV | | | Netherlands | | | | 979,670 | | | | 2,900,696 | |
| | | | | | | | | | | | | | |
| | | | | | | | | | | | | 9,198,811 | |
| | | | | | | | | | | | | | |
| | | Electric Utilities 0.5% | | | | | | | | | |
| | Vistra Energy Corp. | | | United States | | | | 199,533 | | | | 3,092,762 | |
| | | | | | | | | | | | | | |
| | | Energy Equipment & Services 1.7% | | | | | | | | | |
| | Baker Hughes Inc. | | | United States | | | | 178,964 | | | | 11,627,291 | |
| | | | | | | | | | | | | | |
| | | Food & Staples Retailing 4.2% | | | | | | | | | |
| | CVS Health Corp. | | | United States | | | | 84,991 | | | | 6,706,640 | |
| | Empire Co. Ltd., A | | | Canada | | | | 252,979 | | | | 2,961,595 | |
| | Metro AG | | | Germany | | | | 204,955 | | | | 6,811,420 | |
| a | | Rite Aid Corp. | | | United States | | | | 391,098 | | | | 3,222,648 | |
| | Walgreens Boots Alliance Inc. | | | United States | | | | 102,904 | | | | 8,516,335 | |
| | | | | | | | | | | | | | |
| | | | | | | | | | | | | 28,218,638 | |
| | | | | | | | | | | | | | |
| | | Health Care Equipment & Supplies 4.4% | | | | | | | | | |
| | Medtronic PLC | | | United States | | | | 187,330 | | | | 13,343,516 | |
| | St. Jude Medical Inc. | | | United States | | | | 103,840 | | | | 8,326,929 | |
| | Stryker Corp. | | | United States | | | | 69,848 | | | | 8,368,489 | |
| | | | | | | | | | | | | | |
| | | | | | | | | | | | | 30,038,934 | |
| | | | | | | | | | | | | | |
| | | Health Care Providers & Services 0.4% | | | | | | | | | |
| | Cigna Corp. | | | United States | | | | 20,116 | | | | 2,683,273 | |
| | | | | | | | | | | | | | |
| | | Hotels, Restaurants & Leisure 1.7% | | | | | | | | | |
| | Accor SA | | | France | | | | 233,913 | | | | 8,720,147 | |
| | Sands China Ltd. | | | Hong Kong | | | | 648,800 | | | | 2,819,596 | |
| | | | | | | | | | | | | | |
| | | | | | | | | | | | | 11,539,743 | |
| | | | | | | | | | | | | | |
| | | Industrial Conglomerates 1.5% | | | | | | | | | |
| | Koninklijke Philips NV | | | Netherlands | | | | 328,294 | | | | 10,017,497 | |
| | | | | | | | | | | | | | |
| | | Insurance 7.7% | | | | | | | | | |
| a | | Alleghany Corp. | | | United States | | | | 2,730 | | | | 1,660,168 | |
| | American International Group Inc. | | | United States | | | | 204,833 | | | | 13,377,643 | |
| | China Pacific Insurance Group Co. Ltd., H | | | China | | | | 845,908 | | | | 2,950,778 | |
| | Chubb Ltd. | | | United States | | | | 59,966 | | | | 7,922,708 | |
| | The Hartford Financial Services Group Inc. | | | United States | | | | 31,215 | | | | 1,487,395 | |
| | MetLife Inc. | | | United States | | | | 100,526 | | | | 5,417,346 | |
| | NN Group NV | | | Netherlands | | | | 323,882 | | | | 10,971,690 | |
| | XL Group Ltd. | | | Ireland | | | | 235,290 | | | | 8,766,905 | |
| | | | | | | | | | | | | | |
| | | | | | | | | | | | | 52,554,633 | |
| | | | | | | | | | | | | | |
| | | IT Services 0.8% | | | | | | | | | |
| a | | Cognizant Technology Solutions Corp., A | | | United States | | | | 100,270 | | | | 5,618,128 | |
| | | | | | | | | | | | | | |
| | | Machinery 0.8% | | | | | | | | | |
| | Caterpillar Inc. | | | United States | | | | 58,695 | | | | 5,443,374 | |
| | | | | | | | | | | | | | |
| | | Marine 1.5% | | | | | | | | | |
| | A.P. Moeller-Maersk AS, B | | | Denmark | | | | 6,595 | | | | 10,521,304 | |
| | | | | | | | | | | | | | |
FRANKLIN TEMPLETON VARIABLE INSURANCE PRODUCTS TRUST
STATEMENT OF INVESTMENTS
Franklin Mutual Global Discovery VIP Fund (continued)
| | | | | | | | | | | | | | |
| | | | | Country | | | Shares/
Units | | | Value | |
| | Common Stocks and Other Equity Interests (continued) | | | | | | | | | |
| | | Media 4.6% | | | | | | | | | |
| a | | Charter Communications Inc., A | | | United States | | | | 30,386 | | | $ | 8,748,737 | |
| a | | DISH Network Corp., A | | | United States | | | | 124,103 | | | | 7,189,287 | |
| a | | Liberty Global PLC, C | | | United Kingdom | | | | 29,079 | | | | 863,646 | |
| | Time Warner Inc. | | | United States | | | | 146,582 | | | | 14,149,561 | |
| | | | | | | | | | | | | | |
| | | | | | | | | | | | | 30,951,231 | |
| | | | | | | | | | | | | | |
| | | Metals & Mining 1.2% | | | | | | | | | |
| a | | Freeport-McMoRan Inc. | | | United States | | | | 186,260 | | | | 2,456,770 | |
| | ThyssenKrupp AG | | | Germany | | | | 242,203 | | | | 5,769,713 | |
| | | | | | | | | | | | | | |
| | | | | | | | | | | | | 8,226,483 | |
| | | | | | | | | | | | | | |
| | | Multi-Utilities 0.3% | | | | | | | | | |
| a | | innogy SE | | | Germany | | | | 49,195 | | | | 1,708,696 | |
| | | | | | | | | | | | | | |
| | | Oil, Gas & Consumable Fuels 6.8% | | | | | | | | | |
| | Apache Corp. | | | United States | | | | 33,879 | | | | 2,150,300 | |
| | BP PLC | | | United Kingdom | | | | 1,028,014 | | | | 6,453,366 | |
| | China Shenhua Energy Co. Ltd., H | | | China | | | | 2,009,534 | | | | 3,783,506 | |
| | CONSOL Energy Inc. | | | United States | | | | 219,381 | | | | 3,999,316 | |
| | Kinder Morgan Inc. | | | United States | | | | 296,590 | | | | 6,142,379 | |
| | Marathon Oil Corp. | | | United States | | | | 438,465 | | | | 7,589,829 | |
| | Royal Dutch Shell PLC, A (EUR Traded) | | | United Kingdom | | | | 327,191 | | | | 8,945,865 | |
| | Royal Dutch Shell PLC, A (GBP Traded) | | | United Kingdom | | | | 179,410 | | | | 4,956,065 | |
| a,b,c | | Warrior Met Coal LLC, A | | | United States | | | | 1,841 | | | | 598,325 | |
| a,b,c | | Warrior Met Coal LLC, B | | | United States | | | | 4,306 | | | | 1,399,450 | |
| | | | | | | | | | | | | | |
| | | | | | | | | | | | | 46,018,401 | |
| | | | | | | | | | | | | | |
| | | Pharmaceuticals 7.9% | | | | | | | | | |
| | Eli Lilly & Co. | | | United States | | | | 165,580 | | | | 12,178,409 | |
| | GlaxoSmithKline PLC | | | United Kingdom | | | | 262,323 | | | | 5,047,487 | |
| | Merck & Co. Inc. | | | United States | | | | 289,528 | | | | 17,044,513 | |
| | Novartis AG, ADR | | | Switzerland | | | | 166,721 | | | | 12,143,958 | |
| | Teva Pharmaceutical Industries Ltd., ADR | | | Israel | | | | 191,531 | | | | 6,942,999 | |
| | | | | | | | | | | | | | |
| | | | | | | | | | | | | 53,357,366 | |
| | | | | | | | | | | | | | |
| | | Software 5.9% | | | | | | | | | |
| a | | Check Point Software Technologies Ltd. | | | Israel | | | | 112,852 | | | | 9,531,480 | |
| a | | Dell Technologies Inc., V | | | United States | | | | 33,415 | | | | 1,836,823 | |
| | Microsoft Corp. | | | United States | | | | 303,622 | | | | 18,867,071 | |
| | Symantec Corp. | | | United States | | | | 425,161 | | | | 10,157,096 | |
| | | | | | | | | | | | | | |
| | | | | | | | | | | | | 40,392,470 | |
| | | | | | | | | | | | | | |
| | | Specialty Retail 0.7% | | | | | | | | | |
| | Kingfisher PLC | | | United Kingdom | | | | 1,151,830 | | | | 4,970,343 | |
| | | | | | | | | | | | | | |
| | | Technology Hardware, Storage & Peripherals 0.8% | | | | | | | | | |
| | Hewlett Packard Enterprise Co. | | | United States | | | | 190,760 | | | | 4,414,186 | |
| | Lenovo Group Ltd. | | | China | | | | 1,500,454 | | | | 909,425 | |
| | | | | | | | | | | | | | |
| | | | | | | | | | | | | 5,323,611 | |
| | | | | | | | | | | | | | |
| | | Tobacco 4.7% | | | | | | | | | |
| | Altria Group Inc. | | | United States | | | | 125,656 | | | | 8,496,859 | |
| | British American Tobacco PLC | | | United Kingdom | | | | 188,332 | | | | 10,721,731 | |
| | Philip Morris International Inc. | | | United States | | | | 41,509 | | | | 3,797,658 | |
| | Reynolds American Inc. | | | United States | | | | 159,669 | | | | 8,947,851 | |
| | | | | | | | | | | | | | |
| | | | | | | | | | | | | 31,964,099 | |
| | | | | | | | | | | | | | |
FRANKLIN TEMPLETON VARIABLE INSURANCE PRODUCTS TRUST
STATEMENT OF INVESTMENTS
Franklin Mutual Global Discovery VIP Fund (continued)
| | | | | | | | | | | | | | |
| | | | | Country | | | Shares/ Units | | | Value | |
| | Common Stocks and Other Equity Interests (continued) | | | | | | | | | |
| | | Wireless Telecommunication Services 1.3% | | | | | | | | | |
| | Vodafone Group PLC | | | United Kingdom | | | | 3,618,505 | | | $ | 8,908,225 | |
| | | | | | | | | | | | | | |
| | | | |
| | Total Common Stocks and Other Equity Interests
(Cost $479,586,092) | | | | | | | | | | | 593,030,070 | |
| | | | | | | | | | | | | | |
| | Preferred Stocks (Cost $7,441,859) 0.8% | | | | | | | | | | | | |
| | | Automobiles 0.8% | | | | | | | | | |
| e | | Volkswagen AG, 0.127%, pfd | | | Germany | | | | 40,296 | | | | 5,653,967 | |
| | | | | | | | | | | | | | |
| | | | |
| | | | | | | | Principal Amount | | | | |
| | Corporate Bonds, Notes and Senior Floating Rate Interests 3.7% | | | | | | | | | |
| c,d | | Avaya Inc., senior note, 144A, 10.50%, 3/01/21 | | | United States | | | $ | 1,270,000 | | | | 552,450 | |
| f,g | | Belk Inc., Closing Date Term Loan, 5.75%, 12/12/22 | | | United States | | | | 949,109 | | | | 822,562 | |
| | CHS/Community Health Systems Inc., | | | | | | | | | | | | |
| | senior note, 7.125%, 7/15/20 | | | United States | | | | 814,000 | | | | 622,954 | |
| | senior note, 6.875%, 2/01/22 | | | United States | | | | 1,220,000 | | | | 854,000 | |
| | iHeartCommunications Inc., | | | | | | | | | | | | |
| | senior secured note, first lien, 9.00%, 12/15/19 | | | United States | | | | 5,184,000 | | | | 4,257,360 | |
| f,g | | Tranche D Term Loan, 7.52%, 1/30/19 | | | United States | | | | 6,889,154 | | | | 5,620,399 | |
| f,g | | Tranche E Term Loan, 8.27%, 7/30/19 | | | United States | | | | 2,213,881 | | | | 1,820,917 | |
| d | | Valeant Pharmaceuticals International, | | | | | | | | | | | | |
| | senior bond, 144A, 6.75%, 8/15/21 | | | United States | | | | 487,000 | | | | 406,645 | |
| | senior bond, 144A, 7.25%, 7/15/22 | | | United States | | | | 241,000 | | | | 198,222 | |
| | senior note, 144A, 6.375%, 10/15/20 | | | United States | | | | 3,059,000 | | | | 2,643,159 | |
| d | | Valeant Pharmaceuticals International Inc., | | | | | | | | | | | | |
| | senior note, 144A, 5.375%, 3/15/20 | | | United States | | | | 127,000 | | | | 107,950 | |
| | senior note, 144A, 7.50%, 7/15/21 | | | United States | | | | 711,000 | | | | 605,239 | |
| | senior note, 144A, 5.625%, 12/01/21 | | | United States | | | | 318,000 | | | | 248,040 | |
| f,g | | Veritas Software Corp., | | | | | | | | | | | | |
| | Term Loan B1, 6.625%, 1/27/23 | | | United States | | | | 1,989,962 | | | | 1,841,545 | |
| | Term Loan B2, 8.625%, 1/27/23 | | | United States | | | | 1,920,557 | | | | 1,723,220 | |
| d | | Veritas U.S. Inc./Veritas Bermuda Ltd., | | | | | | | | | | | | |
| | senior note, 144A, 7.50%, 2/01/23 | | | United States | | | | 336,000 | | | | 315,000 | |
| | senior note, 144A, 10.50%, 2/01/24 | | | United States | | | | 2,419,000 | | | | 2,216,409 | |
| | | | | | | | | | | | | | |
| | | | |
| | Total Corporate Bonds, Notes and Senior Floating Rate Interests (Cost $27,162,135) | | | | | | | | | | | 24,856,071 | |
| | | | | | | | | | | | | | |
| | | | |
| | Corporate Notes and Senior Floating Rate Interests in Reorganization 0.2% | | | | | | | | | | | | |
| b,h | | Broadband Ventures III LLC, secured promissory note, 5.00%, 2/01/12 | | | United States | | | | 595 | | | | — | |
| f,g,h | | Caesars Entertainment Operating Co. Inc., Term B-7 Loans, 1.50%, 3/01/17 | | | United States | | | | 1,110,195 | | | | 1,299,613 | |
| | | | | | | | | | | | | | |
| | | | |
| | Total Corporate Notes and Senior Floating Rate Interests in Reorganization (Cost $1,092,574) | | | | | | | | | | | 1,299,613 | |
| | | | | | | | | | | | | | |
FRANKLIN TEMPLETON VARIABLE INSURANCE PRODUCTS TRUST
STATEMENT OF INVESTMENTS
Franklin Mutual Global Discovery VIP Fund (continued)
| | | | | | | | | | | | | | |
| | | | | Country | | | Shares | | | Value | |
| | Companies in Liquidation 0.2% | | | | | | | | | | | | |
| a | | Adelphia Recovery Trust | | | United States | | | | 5,379,562 | | | $ | 3,228 | |
| a,i | | Adelphia Recovery Trust, Arahova Contingent Value Vehicle, Contingent Distribution | | | United States | | | | 386,774 | | | | 3,868 | |
| a,i,j | | Century Communications Corp., Contingent Distribution | | | United States | | | | 1,074,000 | | | | — | |
| a,b | | FIM Coinvestor Holdings I, LLC | | | United States | | | | 2,077,368 | | | | — | |
| a,k | | Lehman Brothers Holdings Inc., Bankruptcy Claim | | | United States | | | | 17,348,669 | | | | 590,896 | |
| a,j | | NewPage Corp., Litigation Trust | | | United States | | | | 4,854,000 | | | | — | |
| a,i,j | | Tribune Media Litigation Trust, Contingent Distribution | | | United States | | | | 56,997 | | | | — | |
| a,j | | Vistra Energy Corp., Litigation Trust | | | United States | | | | 11,807,264 | | | | 136,964 | |
| a | | Vistra Energy Corp., Litigation Trust, TRA | | | United States | | | | 199,534 | | | | 289,323 | |
| | | | | | | | | | | | | | |
| | | | |
| | Total Companies in Liquidation (Cost $2,847,848) | | | | | | | | | | | 1,024,279 | |
| | | | | | | | | | | | | | |
| | | | |
| | | | | | | | Principal Amount | | | | |
| | Municipal Bonds in Reorganization (Cost $2,115,501) 0.2% | | | | | | | | | | | | |
| h | | Puerto Rico Commonwealth GO, Refunding, Series A, 8.00%, 7/01/35 | | | United States | | | $ | 2,261,000 | | | | 1,526,175 | |
| | | | | | | | | | | | | | |
| | | | |
| | Total Investments before Short Term Investments
(Cost $520,246,009) | | | | | | | | | | | 627,390,175 | |
| | | | | | | | | | | | | | |
| | Short Term Investments 7.3% | | | | | | | | | | | | |
| | | U.S. Government and Agency Securities 7.3% | | | | | | | | | |
| l | | FHLB, 1/03/17 | | | United States | | | | 9,700,000 | | | | 9,700,000 | |
| l | | U.S. Treasury Bill, | | | | | | | | | | | | |
| | m 3/02/17 | | | United States | | | | 4,000,000 | | | | 3,996,940 | |
| | 1/05/17 - 6/15/17 | | | United States | | | | 36,000,000 | | | | 35,960,328 | |
| | | | | | | | | | | | | | |
| | | | |
| | Total U.S. Government and Agency Securities
(Cost $49,655,680) | | | | | | | | | | | 49,657,268 | |
| | | | | | | | | | | | | | |
| | | | |
| | Total Investments (Cost $569,901,689) 99.8% | | | | | | | | | | | 677,047,443 | |
| | Securities Sold Short (0.5)% | | | | | | | | | | | (3,473,186 | ) |
| | Other Assets, less Liabilities 0.7% | | | | | | | | | | | 5,168,584 | |
| | | | | | | | | | | | | | |
| | | | |
| | Net Assets 100.0% | | | | | | | | | | $ | 678,742,841 | |
| | | | | | | | | | | | | | |
| | | | |
| | | | | | | | Shares | | | | |
| n | | Securities Sold Short (Proceeds $3,486,096) (0.5)% | | | | | | | | | | | | |
| | | Common Stocks (0.5)% | | | | | | | | | |
| | | Health Care Equipment & Supplies (0.5)% | | | | | | | | | |
| | Abbott Laboratories | | | United States | | | | 90,424 | | | $ | (3,473,186 | ) |
| | | | | | | | | | | | | | |
FRANKLIN TEMPLETON VARIABLE INSURANCE PRODUCTS TRUST
STATEMENT OF INVESTMENTS
Franklin Mutual Global Discovery VIP Fund (continued)
aNon-income producing.
bSee Note 8 regarding restricted securities.
cAt December 31, 2016, pursuant to the Fund’s policies and the requirements of applicable securities law, the Fund is restricted from trading these securities at year end.
dSecurity was purchased pursuant to Rule 144A under the Securities Act of 1933 and may be sold in transactions exempt from registration only to qualified institutional buyers or in a public offering registered under the Securities Act of 1933. These securities have been deemed liquid under guidelines approved by the Trust’s Board of Trustees. At December 31, 2016, the aggregate value of these securities was $17,887,553, representing 2.6% of net assets.
eVariable rate security. The rate shown represents the yield at period end.
fThe coupon rate shown represents the rate at period end.
gSee Note 1(g) regarding senior floating rate interests.
hSee Note 7 regarding credit risk and defaulted securities.
iContingent distributions represent the right to receive additional distributions, if any, during the reorganization of the underlying company. Shares represent total underlying principal of debt securities.
jSecurity has been deemed illiquid because it may not be able to be sold within seven days. At December 31, 2016, the aggregate value of these securities was $136,964, representing less than 0.1% of net assets.
kBankruptcy claims represent the right to receive distributions, if any, during the liquidation of the underlying pool of assets. Shares represent amount of allowed unsecured claims.
lThe security was issued on a discount basis with no stated coupon rate.
mA portion or all of the security has been segregated as collateral for securities sold short. At December 31, 2016, the value of this security and/or cash pledged amounted to $5,962,628, representing 0.9% of net assets.
nSee Note 1(e) regarding securities sold short.
FRANKLIN TEMPLETON VARIABLE INSURANCE PRODUCTS TRUST
STATEMENT OF INVESTMENTS
Franklin Mutual Global Discovery VIP Fund (continued)
At December 31, 2016, the Fund had the following futures contracts outstanding. See Note 1(c).
| | | | | | | | | | | | | | | | | | | | | | | | |
| Futures Contracts | | | | | | | | | | | | | | | | | | |
| Description | | Type | | | Number of Contracts | | | Notional Value | | | Expiration Date | | | Unrealized Appreciation | | | Unrealized Depreciation | |
| Currency Contracts | | | | | | | | | | | | | | | | | | | | | | | | |
EUR/USD | | | Short | | | | 207 | | | $ | 27,360,225 | | | | 3/13/17 | | | $ | 105,683 | | | $ | — | |
GBP/USD | | | Short | | | | 272 | | | | 21,008,600 | | | | 3/13/17 | | | | 469,761 | | | | — | |
| | | | | | | | | | | | | | | | | | | | |
Total Financial Futures Contracts | | | $ | 575,444 | | | $ | — | |
| | | | | | | | | | | | | | | | | | | | |
Net unrealized appreciation (depreciation) | | | $ | 575,444 | | | | | |
| | | | | | | | | | | | | | | | | | | | | | | | |
At December 31, 2016, the Fund had the following forward exchange contracts outstanding. See Note 1(c).
| | | | | | | | | | | | | | | | | | | | | | | | | | | | |
| Forward Exchange Contracts | | | | | | | | | | | | | | | | |
| Currency | | | Counterpartya | | | | Type | | | | Quantity | | |
| Contract
Amount |
| |
| Settlement
Date |
| |
| Unrealized
Appreciation |
| |
| Unrealized
Depreciation |
|
| OTC Forward Exchange Contracts | |
South Korean Won | | | FBCO | | | | Buy | | | | 16,383,375 | | | $ | 13,962 | | | | 1/13/17 | | | $ | — | | | $ | (394 | ) |
South Korean Won | | | FBCO | | | | Sell | | | | 1,800,598,428 | | | | 1,572,712 | | | | 1/13/17 | | | | 81,459 | | | | — | |
South Korean Won | | | HSBK | | | | Buy | | | | 367,196,425 | | | | 312,910 | | | | 1/13/17 | | | | — | | | | (8,797 | ) |
South Korean Won | | | HSBK | | | | Sell | | | | 51,963,440 | | | | 42,956 | | | | 1/13/17 | | | | — | | | | (80 | ) |
South Korean Won | | | HSBK | | | | Sell | | | | 1,369,730,372 | | | | 1,198,708 | | | | 1/13/17 | | | | 64,299 | | | | — | |
South Korean Won | | | UBSW | | | | Sell | | | | 143,947,110 | | | | 123,560 | | | | 1/13/17 | | | | 4,343 | | | | — | |
Canadian Dollar | | | HSBK | | | | Sell | | | | 4,455,349 | | | | 3,298,621 | | | | 1/23/17 | | | | — | | | | (20,359 | ) |
Canadian Dollar | | | SSBT | | | | Buy | | | | 826,232 | | | | 618,255 | | | | 1/23/17 | | | | — | | | | (2,760 | ) |
Canadian Dollar | | | SSBT | | | | Sell | | | | 99,832 | | | | 74,003 | | | | 1/23/17 | | | | — | | | | (366 | ) |
Canadian Dollar | | | SSBT | | | | Sell | | | | 144,960 | | | | 109,428 | | | | 1/23/17 | | | | 1,441 | | | | — | |
British Pound | | | HSBK | | | | Sell | | | | 243,872 | | | | 303,148 | | | | 2/13/17 | | | | 2,383 | | | | — | |
British Pound | | | SSBT | | | | Sell | | | | 13,150 | | | | 16,140 | | | | 2/13/17 | | | | — | | | | (77 | ) |
British Pound | | | SSBT | | | | Sell | | | | 117,514 | | | | 144,975 | | | | 2/13/17 | | | | 47 | | | | — | |
British Pound | | | UBSW | | | | Sell | | | | 25,485,956 | | | | 31,783,556 | | | | 2/13/17 | | | | 352,111 | | | | — | |
Euro | | | BOFA | | | | Sell | | | | 80,360 | | | | 85,847 | | | | 2/17/17 | | | | 1,085 | | | | — | |
Euro | | | BOFA | | | | Sell | | | | 397,753 | | | | 415,730 | | | | 2/17/17 | | | | — | | | | (3,811 | ) |
Euro | | | BONY | | | | Sell | | | | 80,554 | | | | 86,136 | | | | 2/17/17 | | | | 1,170 | | | | — | |
Euro | | | BONY | | | | Sell | | | | 442,383 | | | | 462,518 | | | | 2/17/17 | | | | — | | | | (4,098 | ) |
Euro | | | HSBK | | | | Sell | | | | 23,923,440 | | | | 25,003,883 | | | | 2/17/17 | | | | — | | | | (230,032 | ) |
Euro | | | SSBT | | | | Sell | | | | 80,361 | | | | 86,011 | | | | 2/17/17 | | | | 1,248 | | | | — | |
Euro | | | SSBT | | | | Sell | | | | 24,022,381 | | | | 25,105,578 | | | | 2/17/17 | | | | — | | | | (232,698 | ) |
Euro | | | UBSW | | | | Sell | | | | 236,639 | | | | 247,516 | | | | 2/17/17 | | | | — | | | | (2,086 | ) |
| | | | | | | | | | | | | | | | | | | | | | | | |
Total Forward Exchange Contracts | | | $ | 509,586 | | | $ | (505,558 | ) |
| | | | | | | | | | | | | | | | | | | | | | | | |
Net unrealized appreciation (depreciation) | | | $ | 4,028 | | | | | |
| | | | | | | | | | | | | | | | | | | | | | | | | | | | |
aMay be comprised of multiple contracts with the same counterparty, currency and settlement date.
See Abbreviations on page MGD- 36.
| | | | | | |
| The accompanying notes are an integral part of these financial statements. | | Annual Report | | | MGD-19 | |
FRANKLIN TEMPLETON VARIABLE INSURANCE PRODUCTS TRUST
Financial Statements
Statement of Assets and Liabilities
December 31, 2016
| | | | |
| | | Franklin Mutual Global Discovery VIP Fund | |
Assets: | | | | |
Investments in securities: | | | | |
Cost | | $ | 569,901,689 | |
| | | | |
Value | | $ | 677,047,443 | |
Cash | | | 204,659 | |
Restricted Cash (Note 1d) | | | 420,000 | |
Foreign currency, at value (cost $298,725) | | | 300,005 | |
Receivables: | | | | |
Investment securities sold | | | 50,371 | |
Capital shares sold | | | 82,256 | |
Dividends and interest | | | 1,522,118 | |
European Union tax reclaims | | | 271,415 | |
Due from brokers | | | 5,038,571 | |
Unrealized appreciation on OTC forward exchange contracts | | | 509,586 | |
Other assets | | | 98,402 | |
| | | | |
Total assets | | | 685,544,826 | |
| | | | |
Liabilities: | | | | |
Payables: | | | | |
Investment securities purchased | | | 262,056 | |
Capital shares redeemed | | | 775,378 | |
Management fees | | | 542,442 | |
Distribution fees | | | 285,287 | |
Variation margin | | | 279,938 | |
Securities sold short, at value (proceeds $3,486,096) | | | 3,473,186 | |
Due to brokers | | | 420,000 | |
Unrealized depreciation on OTC forward exchange contracts | | | 505,558 | |
Accrued expenses and other liabilities | | | 258,140 | |
| | | | |
Total liabilities | | | 6,801,985 | |
| | | | |
Net assets, at value | | $ | 678,742,841 | |
| | | | |
Net assets consist of: | | | | |
Paid-in capital | | $ | 524,319,782 | |
Undistributed net investment income | | | 11,343,159 | |
Net unrealized appreciation (depreciation) | | | 107,703,094 | |
Accumulated net realized gain (loss) | | | 35,376,806 | |
| | | | |
Net assets, at value | | $ | 678,742,841 | |
| | | | |
| | | | |
| MGD-20 | | Annual Report | The accompanying notes are an integral part of these financial statements. | | |
FRANKLIN TEMPLETON VARIABLE INSURANCE PRODUCTS TRUST
FINANCIAL STATEMENTS
Statement of Assets and Liabilities (continued)
December 31, 2016
| | | | |
| | | Franklin Mutual Global Discovery VIP Fund | |
| |
| Class 1: | | | | |
Net assets, at value | | $ | 3,084,168 | |
| | | | |
Shares outstanding | | | 152,515 | |
| | | | |
Net asset value and maximum offering price per share | | $ | 20.22 | |
| | | | |
| |
| Class 2: | | | | |
Net assets, at value | | $ | 630,396,542 | |
| | | | |
Shares outstanding | | | 32,012,939 | |
| | | | |
Net asset value and maximum offering price per share | | $ | 19.69 | |
| | | | |
| |
| Class 4: | | | | |
Net assets, at value | | $ | 45,262,131 | |
| | | | |
Shares outstanding | | | 2,260,388 | |
| | | | |
Net asset value and maximum offering price per share | | $ | 20.02 | |
| | | | |
| | | | | | |
| | | The accompanying notes are an integral part of these financial statements. | Annual Report | | | MGD-21 | |
FRANKLIN TEMPLETON VARIABLE INSURANCE PRODUCTS TRUST
FINANCIAL STATEMENTS
Statement of Operations
for the year ended December 31, 2016
| | | | |
| | | Franklin Mutual Global Discovery VIP Fund | |
Investment income: | | | | |
Dividends. | | $ | 17,082,071 | |
Interest | | | 2,976,372 | |
Income from securities loaned (net of fees and rebates) | | | 290,439 | |
| | | | |
Total investment income | | | 20,348,882 | |
| | | | |
Expenses: | | | | |
Management fees (Note 3a) | | | 6,137,350 | |
Distribution fees: (Note 3c) | | | | |
Class 2 | | | 1,512,222 | |
Class 4 | | | 159,456 | |
Custodian fees (Note 4) | | | 29,677 | |
Reports to shareholders | | | 151,814 | |
Professional fees | | | 190,582 | |
Trustees’ fees and expenses | | | 3,093 | |
Dividends and/or interest on securities sold short | | | 57,851 | |
Other | | | 43,655 | |
| | | | |
Total expenses | | | 8,285,700 | |
Expense reductions (Note 4) | | | (1,337 | ) |
Expenses waived/paid by affiliates (Note 3e) | | | (8,329 | ) |
| | | | |
Net expenses | | | 8,276,034 | |
| | | | |
Net investment income | | | 12,072,848 | |
| | | | |
Realized and unrealized gains (losses): | | | | |
Net realized gain (loss) from: | | | | |
Investments | | | 27,260,445 | |
Foreign currency transactions | | | 7,041,993 | |
Futures contracts | | | 4,697,347 | |
Securities sold short | | | (125,155 | ) |
| | | | |
Net realized gain (loss) | | | 38,874,630 | |
| | | | |
Net change in unrealized appreciation (depreciation) on: | | | | |
Investments | | | 24,455,425 | |
Translation of other assets and liabilities denominated in foreign currencies | | | (826,338 | ) |
Futures contracts | | | 32,096 | |
| | | | |
Net change in unrealized appreciation (depreciation) | | | 23,661,183 | |
| | | | |
Net realized and unrealized gain (loss) | | | 62,535,813 | |
| | | | |
Net increase (decrease) in net assets resulting from operations | | $ | 74,608,661 | |
| | | | |
| | | | |
| MGD-22 | | Annual Report | The accompanying notes are an integral part of these financial statements. | | |
FRANKLIN TEMPLETON VARIABLE INSURANCE PRODUCTS TRUST
FINANCIAL STATEMENTS
Statements of Changes in Net Assets
| | | | | | | | |
| | | Franklin Mutual Global Discovery VIP Fund | |
| | | Year Ended December 31, | |
| | | 2016 | | | 2015 | |
Increase (decrease) in net assets: | | | | | | | | |
Operations: | | | | | | | | |
Net investment income | | $ | 12,072,848 | | | $ | 10,694,516 | |
Net realized gain (loss) | | | 38,874,630 | | | | 57,004,189 | |
Net change in unrealized appreciation (depreciation) | | | 23,661,183 | | | | (93,151,143 | ) |
| | | | |
Net increase (decrease) in net assets resulting from operations | | | 74,608,661 | | | | (25,452,438 | ) |
| | | | |
Distributions to shareholders from: | | | | | | | | |
Class 1 | | | (54,304 | ) | | | (79,470 | ) |
Class 2 | | | (10,085,440 | ) | | | (18,967,567 | ) |
Class 4 | | | (662,593 | ) | | | (1,406,194 | ) |
Net realized gains: | | | | | | | | |
Class 1 | | | (220,428 | ) | | | (146,560 | ) |
Class 2 | | | (47,823,620 | ) | | | (38,175,344 | ) |
Class 4 | | | (3,482,606 | ) | | | (3,020,502 | ) |
| | | | |
Total distributions to shareholders | | | (62,328,991 | ) | | | (61,795,637 | ) |
| | | | |
Capital share transactions: (Note 2) | | | | | | | | |
Class 1 | | | 377,199 | | | | 643,019 | |
Class 2 | | | (10,255,413 | ) | | | 24,374,278 | |
Class 4 | | | (4,711,238 | ) | | | (4,702,254 | ) |
| | | | |
Total capital share transactions | | | (14,589,452 | ) | | | 20,315,043 | |
| | | | |
Net increase (decrease) in net assets | | | (2,309,782 | ) | | | (66,933,032 | ) |
Net assets: | | | | | | | | |
Beginning of year | | | 681,052,623 | | | | 747,985,655 | |
| | | | |
End of year. | | $ | 678,742,841 | | | $ | 681,052,623 | |
| | | | |
Undistributed net investment income included in net assets: | | | | | | | | |
End of year. | | $ | 11,343,159 | | | $ | 10,161,933 | |
| | | | |
| | | | | | |
| | | The accompanying notes are an integral part of these financial statements. | Annual Report | | | MGD-23 | |
FRANKLIN TEMPLETON VARIABLE INSURANCE PRODUCTS TRUST
Notes to Financial Statements
Franklin Mutual Global Discovery VIP Fund
1. Organization and Significant Accounting Policies
Franklin Templeton Variable Insurance Products Trust (Trust) is registered under the Investment Company Act of 1940 (1940 Act) as an open-end management investment company, consisting of nineteen separate funds and applies the specialized accounting and reporting guidance in U.S. Generally Accepted Accounting Principles (U.S. GAAP). Franklin Mutual Global Discovery VIP Fund (Fund) is included in this report. The financial statements of the remaining funds in the Trust are presented separately. Shares of the Fund are generally sold only to insurance company separate accounts to fund the benefits of variable life insurance policies or variable annuity contracts. At December 31, 2016, 50.7% of the Fund’s shares were held through one insurance company. Investment activities of these insurance company separate accounts could have a material impact on the Fund. The Fund offers three classes of shares: Class 1, Class 2 and Class 4. Each class of shares differs by its distribution fees, voting rights on matters affecting a single class and its exchange privilege.
The following summarizes the Fund’s significant accounting policies.
a. Financial Instrument Valuation
The Fund’s investments in financial instruments are carried at fair value daily. Fair value is the price that would be received to sell an asset or paid to transfer a liability in an orderly transaction between market participants on the measurement date. The Fund calculates the net asset value (NAV) per share as of 4 p.m. Eastern time each day the New York Stock Exchange (NYSE) is open for trading. Under compliance policies and procedures approved by the Trust’s Board of Trustees (the Board), the Fund’s administrator has responsibility for oversight of valuation, including leading the cross-functional Valuation Committee (VC). The VC provides administration and oversight of the Fund’s valuation policies and procedures, which are approved annually by the Board. Among other things, these procedures allow the Fund to utilize independent pricing services, quotations from securities and financial instrument dealers, and other market sources to determine fair value.
Equity securities and derivative financial instruments listed on an exchange or on the NASDAQ National Market System are valued at the last quoted sale price or the official closing price of the day, respectively. Foreign equity securities are valued as
of the close of trading on the foreign stock exchange on which the security is primarily traded, or as of 4 p.m. Eastern time. The value is then converted into its U.S. dollar equivalent at the foreign exchange rate in effect at 4 p.m. Eastern time on the day that the value of the security is determined. Over-the-counter (OTC) securities are valued within the range of the most recent quoted bid and ask prices. Securities that trade in multiple markets or on multiple exchanges are valued according to the broadest and most representative market. Certain equity securities are valued based upon fundamental characteristics or relationships to similar securities.
Debt securities generally trade in the OTC market rather than on a securities exchange. The Fund’s pricing services use multiple valuation techniques to determine fair value. In instances where sufficient market activity exists, the pricing services may utilize a market-based approach through which quotes from market makers are used to determine fair value. In instances where sufficient market activity may not exist or is limited, the pricing services also utilize proprietary valuation models which may consider market characteristics such as benchmark yield curves, credit spreads, estimated default rates, anticipated market interest rate volatility, coupon rates, anticipated timing of principal repayments, underlying collateral, and other unique security features in order to estimate the relevant cash flows, which are then discounted to calculate the fair value. Securities denominated in a foreign currency are converted into their U.S. dollar equivalent at the foreign exchange rate in effect at 4 p.m. Eastern time on the date that the values of the foreign debt securities are determined.
Investments in open-end mutual funds are valued at the closing NAV.
Certain derivative financial instruments trade in the OTC market. The Fund’s pricing services use various techniques including industry standard option pricing models and proprietary discounted cash flow models to determine the fair value of those instruments. The Fund’s net benefit or obligation under the derivative contract, as measured by the fair value of the contract, is included in net assets.
The Fund has procedures to determine the fair value of financial instruments for which market prices are not reliable or readily available. Under these procedures, the VC convenes on a regular basis to review such financial instruments and considers a number of factors, including significant unobservable valuation inputs, when arriving at fair value. The VC primarily
FRANKLIN TEMPLETON VARIABLE INSURANCE PRODUCTS TRUST
NOTES TO FINANCIAL STATEMENTS
Franklin Mutual Global Discovery VIP Fund (continued)
employs a market-based approach which may use related or comparable assets or liabilities, recent transactions, market multiples, book values, and other relevant information for the investment to determine the fair value of the investment. An income-based valuation approach may also be used in which the anticipated future cash flows of the investment are discounted to calculate fair value. Discounts may also be applied due to the nature or duration of any restrictions on the disposition of the investments. Due to the inherent uncertainty of valuations of such investments, the fair values may differ significantly from the values that would have been used had an active market existed. The VC employs various methods for calibrating these valuation approaches including a regular review of key inputs and assumptions, transactional back-testing or disposition analysis, and reviews of any related market activity.
Trading in securities on foreign securities stock exchanges and OTC markets may be completed before 4 p.m. Eastern time. In addition, trading in certain foreign markets may not take place on every Fund’s business day. Occasionally, events occur between the time at which trading in a foreign security is completed and 4 p.m. Eastern time that might call into question the reliability of the value of a portfolio security held by the Fund. As a result, differences may arise between the value of the Fund’s portfolio securities as determined at the foreign market close and the latest indications of value at 4 p.m. Eastern time. In order to minimize the potential for these differences, the VC monitors price movements following the close of trading in foreign stock markets through a series of country specific market proxies (such as baskets of American Depositary Receipts, futures contracts and exchange traded funds). These price movements are measured against established trigger thresholds for each specific market proxy to assist in determining if an event has occurred that may call into question the reliability of the values of the foreign securities held by the Fund. If such an event occurs, the securities may be valued using fair value procedures, which may include the use of independent pricing services.
When the last day of the reporting period is a non-business day, certain foreign markets may be open on those days that the Fund’s NAV is not calculated, which could result in differences between the value of the Fund’s portfolio securities on the last business day and the last calendar day of the reporting period. Any significant security valuation changes due to an open foreign market are adjusted and reflected by the Fund for financial reporting purposes.
b. Foreign Currency Translation
Portfolio securities and other assets and liabilities denominated in foreign currencies are translated into U.S. dollars based on the exchange rate of such currencies against U.S. dollars on the date of valuation. The Fund may enter into foreign currency exchange contracts to facilitate transactions denominated in a foreign currency. Purchases and sales of securities, income and expense items denominated in foreign currencies are translated into U.S. dollars at the exchange rate in effect on the transaction date. Portfolio securities and assets and liabilities denominated in foreign currencies contain risks that those currencies will decline in value relative to the U.S. dollar. Occasionally, events may impact the availability or reliability of foreign exchange rates used to convert the U.S. dollar equivalent value. If such an event occurs, the foreign exchange rate will be valued at fair value using procedures established and approved by the Board.
The Fund does not separately report the effect of changes in foreign exchange rates from changes in market prices on securities held. Such changes are included in net realized and unrealized gain or loss from investments in the Statement of Operations.
Realized foreign exchange gains or losses arise from sales of foreign currencies, currency gains or losses realized between the trade and settlement dates on securities transactions and the difference between the recorded amounts of dividends, interest, and foreign withholding taxes and the U.S. dollar equivalent of the amounts actually received or paid. Net unrealized foreign exchange gains and losses arise from changes in foreign exchange rates on foreign denominated assets and liabilities other than investments in securities held at the end of the reporting period.
c. Derivative Financial Instruments
The Fund invested in derivative financial instruments in order to manage risk or gain exposure to various other investments or markets. Derivatives are financial contracts based on an underlying or notional amount, require no initial investment or an initial net investment that is smaller than would normally be required to have a similar response to changes in market factors, and require or permit net settlement. Derivatives contain various risks including the potential inability of the counterparty to fulfill their obligations under the terms of the contract, the potential for an illiquid secondary market, and/or the potential for market movements which expose the Fund to gains or losses in excess of the amounts shown in the Statement of Assets and
FRANKLIN TEMPLETON VARIABLE INSURANCE PRODUCTS TRUST
NOTES TO FINANCIAL STATEMENTS
Franklin Mutual Global Discovery VIP Fund (continued)
1. Organization and Significant Accounting
Policies (continued)
c. Derivative Financial Instruments (continued)
Liabilities. Realized gain and loss and unrealized appreciation and depreciation on these contracts for the period are included in the Statement of Operations.
Derivative counterparty credit risk is managed through a formal evaluation of the creditworthiness of all potential counterparties The Fund attempts to reduce its exposure to counterparty credit risk on OTC derivatives, whenever possible, by entering into International Swaps and Derivatives Association (ISDA) master agreements with certain counterparties. These agreements contain various provisions, including but not limited to collateral requirements, events of default, or early termination. Termination events applicable to the counterparty include certain deteriorations in the credit quality of the counterparty. Termination events applicable to the Fund include failure of the Fund to maintain certain net asset levels and/or limit the decline in net assets over various periods of time. In the event of default or early termination, the ISDA master agreement gives the non-defaulting party the right to net and close-out all transactions traded, whether or not arising under the ISDA agreement, to one net amount payable by one counterparty to the other. However, absent an event of default or early termination, OTC derivative assets and liabilities are presented gross and not offset in the Statement of Assets and Liabilities. Early termination by the counterparty may result in an immediate payment by the Fund of any net liability owed to that counterparty under the ISDA agreement. At December 31, 2016, the Fund had OTC derivatives in a net liability position for such contracts of $431,404.
Collateral requirements differ by type of derivative. Collateral or initial margin requirements are set by the broker or exchange clearing house for exchange traded and centrally cleared derivatives. Initial margin deposited is held at the exchange and can be in the form of cash and/or securities. For OTC derivatives traded under an ISDA master agreement, posting of collateral is required by either the Fund or the applicable counterparty if the total net exposure of all OTC derivatives with the applicable counterparty exceeds the minimum transfer amount, which typically ranges from $100,000 to $250,000, and can vary depending on the counterparty and the type of the agreement. Generally, collateral is determined at the close of Fund business each day and any additional collateral required
due to changes in derivative values may be delivered by the Fund or the counterparty within a few business days. Collateral pledged and/or received by the Fund for OTC derivatives, if any, is held in segregated accounts with the Fund’s custodian/counterparty broker and can be in the form of cash and/or securities. Unrestricted cash may be invested according to the Fund’s investment objectives. To the extent that the amounts due to the Fund from its counterparties are not subject to collateralization or are not fully collateralized, the Fund bears the risk of loss from counterparty non-performance.
The Fund entered into exchange traded futures contracts primarily to manage exposure to certain foreign currencies. A futures contract is an agreement between the Fund and a counterparty to buy or sell an asset at a specified price on a future date. Required initial margins are pledged by the Fund, and the daily change in fair value is accounted for as a variation margin payable or receivable in the Statement of Assets and Liabilities.
The Fund entered into OTC forward exchange contracts primarily to manage exposure to certain foreign currencies. A forward exchange contract is an agreement between the Fund and a counterparty to buy or sell a foreign currency at a specific exchange rate on a future date.
See Note 10 regarding other derivative information.
d. Restricted Cash
At December 31, 2016, the Fund held restricted cash in connection with investments in certain derivative securities. Restricted cash is held in a segregated account with the Fund’s custodian and is reflected in the Statement of Assets and Liabilities.
e. Securities Sold Short
The Fund is engaged in selling securities short, which obligates the Fund to replace a borrowed security with the same security at current fair value. The Fund incurs a loss if the price of the security increases between the date of the short sale and the date on which the Fund replaces the borrowed security. The Fund realizes a gain if the price of the security declines between those dates. Gains are limited to the price at which the Fund sold the security short, while losses are potentially unlimited in size.
The Fund is required to establish a margin account with the broker lending the security sold short. While the short sale is outstanding, the broker retains the proceeds of the short sale to
FRANKLIN TEMPLETON VARIABLE INSURANCE PRODUCTS TRUST
NOTES TO FINANCIAL STATEMENTS
Franklin Mutual Global Discovery VIP Fund (continued)
the extent necessary to meet margin requirements until the short position is closed out. A deposit must also be maintained with the Fund’s custodian/counterparty broker consisting of cash and/or securities having a value equal to a specified percentage of the value of the securities sold short. The Fund is obligated to pay fees for borrowing the securities sold short and is required to pay the counterparty any dividends and/or interest due on securities sold short. Such dividends and/or interest and any security borrowing fees are recorded as an expense to the Fund.
f. Securities Lending
The Fund participates in an agency based securities lending program to earn additional income. The Fund receives cash collateral against the loaned securities in an amount equal to at least 102% of the fair value of the loaned securities. Collateral is maintained over the life of the loan in an amount not less than 100% of the fair value of loaned securities, as determined at the close of Fund business each day; any additional collateral required due to changes in security values is delivered to the Fund on the next business day. The collateral is deposited into a joint cash account with other funds and is used to invest in a money market fund managed by Franklin Advisers, Inc., an affiliate of the Fund and/or a joint repurchase agreement. The Fund may receive income from the investment of cash collateral, in addition to lending fees and rebates paid by the borrower. Income from securities loaned, net of fees paid to the securities lending agent and/or third-party vendor, is reported separately in the Statement of Operations. The Fund bears the market risk with respect to the collateral investment, securities loaned, and the risk that the agent may default on its obligations to the Fund. If the borrower defaults on its obligation to return the securities loaned, the Fund has the right to repurchase the securities in the open market using the collateral received. The securities lending agent has agreed to indemnify the Fund in the event of default by a third party borrower. At December 31, 2016, the Fund had no securities on loan.
g. Senior Floating Rate Interests
The Fund invests in senior secured corporate loans that pay interest at rates which are periodically reset by reference to a base lending rate plus a spread. These base lending rates are generally the prime rate offered by a designated U.S. bank or the London InterBank Offered Rate (LIBOR). Senior secured corporate loans often require prepayment of principal from excess cash flows or at the discretion of the borrower. As a result, actual maturity may be substantially less than the stated
maturity. Senior secured corporate loans in which the Fund invests are generally readily marketable, but may be subject to certain restrictions on resale.
h. Income and Deferred Taxes
It is the Fund’s policy to qualify as a regulated investment company under the Internal Revenue Code. The Fund intends to distribute to shareholders substantially all of its taxable income and net realized gains to relieve it from federal income and if applicable, excise taxes. As a result, no provision for U.S. federal income taxes is required.
The Fund may be subject to foreign taxation related to income received, capital gains on the sale of securities and certain foreign currency transactions in the foreign jurisdictions in which it invests. Foreign taxes, if any, are recorded based on the tax regulations and rates that exist in the foreign markets in which the Fund invests. When a capital gain tax is determined to apply, the Fund records an estimated deferred tax liability in an amount that would be payable if the securities were disposed of on the valuation date. As a result of several court cases, in certain countries across the European Union, the Fund filed additional tax reclaims for previously withheld taxes on dividends earned in those countries (EU reclaims). These additional filings are subject to various administrative proceedings by the local jurisdictions’ tax authorities within the European Union, as well as a number of related judicial proceedings. Income recognized, if any, for EU reclaims is reflected as other income in the Statement of Operations and any related receivable, if any, is reflected as European Union tax reclaims in the Statement of Assets and Liabilities. When uncertainty exists as to the ultimate resolution of these proceedings, the likelihood of receipt of these EU reclaims, and the potential timing of payment, no amounts are reflected in the financial statements. For U.S. income tax purposes, when EU reclaims are received by the Fund and the Fund previously passed foreign tax credit on to its shareholders, the Fund must either amend historic tax reporting to shareholders or enter into a closing agreement with the Internal Revenue Service (IRS) in order to pay the associated tax liability on behalf of the Fund’s shareholders.
The Fund may recognize an income tax liability related to its uncertain tax positions under U.S. GAAP when the uncertain tax position has a less than 50% probability that it will be sustained upon examination by the tax authorities based on its technical merits. As of December 31, 2016, the Fund has
FRANKLIN TEMPLETON VARIABLE INSURANCE PRODUCTS TRUST
NOTES TO FINANCIAL STATEMENTS
Franklin Mutual Global Discovery VIP Fund (continued)
1. Organization and Significant Accounting
Policies (continued)
h. Income and Deferred Taxes (continued)
determined that no tax liability is required in its financial statements related to uncertain tax positions for any open tax years (or expected to be taken in future tax years). Open tax years are those that remain subject to examination and are based on each tax jurisdiction’s statute of limitation.
i. Security Transactions, Investment Income, Expenses and Distributions
Security transactions are accounted for on trade date. Realized gains and losses on security transactions are determined on a specific identification basis. Interest income and estimated expenses are accrued daily. Amortization of premium and accretion of discount on debt securities are included in interest income. Dividend income and dividends declared on securities sold short are recorded on the ex-dividend date except for certain dividends from securities where the dividend rate is not available. In such cases, the dividend is recorded as soon as the information is received by the Fund. Distributions to shareholders are recorded on the ex-dividend date and are determined according to income tax regulations (tax basis). Distributable earnings determined on a tax basis may differ from earnings recorded in accordance with U.S. GAAP. These differences may be permanent or temporary. Permanent differences are reclassified among capital accounts to reflect their tax character. These reclassifications have no impact on net assets or the results of operations. Temporary differences are not reclassified, as they may reverse in subsequent periods.
Common expenses incurred by the Trust are allocated among the Funds based on the ratio of net assets of each Fund to the combined net assets of the Trust. Fund specific expenses are charged directly to the Fund that incurred the expense.
Realized and unrealized gains and losses and net investment income, not including class specific expenses, are allocated daily to each class of shares based upon the relative proportion of net assets of each class. Differences in per share distributions, by class, are generally due to differences in class specific expenses.
j. Accounting Estimates
The preparation of financial statements in accordance with U.S. GAAP requires management to make estimates and assumptions that affect the reported amounts of assets and liabilities at the date of the financial statements and the amounts of income and expenses during the reporting period. Actual results could differ from those estimates.
k. Guarantees and Indemnifications
Under the Trust’s organizational documents, its officers and trustees are indemnified by the Trust against certain liabilities arising out of the performance of their duties to the Trust. Additionally, in the normal course of business, the Trust, on behalf of the Fund, enters into contracts with service providers that contain general indemnification clauses. The Trust’s maximum exposure under these arrangements is unknown as this would involve future claims that may be made against the Trust that have not yet occurred. Currently, the Trust expects the risk of loss to be remote.
FRANKLIN TEMPLETON VARIABLE INSURANCE PRODUCTS TRUST
NOTES TO FINANCIAL STATEMENTS
Franklin Mutual Global Discovery VIP Fund (continued)
2. Shares of Beneficial Interest
At December 31, 2016, there were an unlimited number of shares authorized (without par value). Transactions in the Fund’s shares were as follows:
| | | | | | | | | | | | | | | | | | | | |
| | | Year Ended December 31, | |
| | | 2016 | | | | | | 2015 | |
| | | Shares | | | Amount | | | | | | Shares | | | Amount | |
| | | | | |
| Class 1 Shares: | | | | | | | | | | | | | | | | | | | | |
Shares sold | | | 23,387 | | | $ | 453,227 | | | | | | | | 29,371 | | | $ | 659,819 | |
Shares issued in reinvestment of distributions | | | 14,414 | | | | 274,732 | | | | | | | | 11,573 | | | | 226,030 | |
Shares redeemed | | | (17,886 | ) | | | (350,760 | ) | | | | | | | (10,639 | ) | | | (242,830 | ) |
| | | | |
Net increase (decrease) | | | 19,915 | | | $ | 377,199 | | | | | | | | 30,305 | | | $ | 643,019 | |
| | | | |
| Class 2 Shares: | | | | | | | | | | | | | | | | | | | | |
Shares sold | | | 1,329,879 | | | $ | 25,305,228 | | | | | | | | 2,941,446 | | | $ | 64,431,215 | |
Shares issued in reinvestment of distributions | | | 3,118,420 | | | | 57,909,060 | | | | | | | | 2,996,482 | | | | 57,142,910 | |
Shares redeemed | | | (4,923,922 | ) | | | (93,469,701 | ) | | | | | | | (4,457,652 | ) | | | (97,199,847 | ) |
| | | | |
Net increase (decrease) | | | (475,623 | ) | | $ | (10,255,413 | ) | | | | | | | 1,480,276 | | | $ | 24,374,278 | |
| | | | |
| Class 4 Shares: | | | | | | | | | | | | | | | | | | | | |
Shares sold | | | 108,847 | | | $ | 2,055,482 | | | | | | | | 121,580 | | | $ | 2,592,251 | |
Shares issued in reinvestment of distributions | | | 219,439 | | | | 4,145,199 | | | | | | | | 228,652 | | | | 4,426,697 | |
Shares redeemed | | | (563,526 | ) | | | (10,911,919 | ) | | | | | | | (532,685 | ) | | | (11,721,202 | ) |
| | | | |
Net increase (decrease) | | | (235,240 | ) | | $ | (4,711,238 | ) | | | | | | | (182,453 | ) | | $ | (4,702,254 | ) |
| | | | |
3. Transactions with Affiliates
Franklin Resources, Inc. is the holding company for various subsidiaries that together are referred to as Franklin Templeton Investments. Certain officers and trustees of the Fund are also officers and/or directors of the following subsidiaries:
| | |
| Subsidiary | | Affiliation |
Franklin Mutual Advisers, LLC (Franklin Mutual) | | Investment manager |
Franklin Templeton Services, LLC (FT Services) | | Administrative manager |
Franklin Templeton Distributors, Inc. (Distributors) | | Principal underwriter |
Franklin Templeton Investor Services, LLC (Investor Services) | | Transfer agent |
a. Management Fees
The Fund pays an investment management fee to Franklin Mutual based on the average daily net assets of the Fund as follows:
| | |
| Annualized Fee Rate | | Net Assets |
0.950% | | Up to and including $200 million |
0.935% | | Over $200 million, up to and including $700 million |
0.900% | | Over $700 million, up to and including $1.2 billion |
0.875% | | Over $1.2 billion, up to and including $4 billion |
0.845% | | Over $4 billion, up to and including $7 billion |
0.825% | | Over $7 billion, up to and including $10 billion |
0.805% | | In excess of $10 billion |
FRANKLIN TEMPLETON VARIABLE INSURANCE PRODUCTS TRUST
NOTES TO FINANCIAL STATEMENTS
Franklin Mutual Global Discovery VIP Fund (continued)
3. Transactions with Affiliates (continued)
a. Management Fees (continued)
For the year ended December 31, 2016, the effective investment management fee rate was 0.940% of the Fund’s average daily net assets.
b. Administrative Fees
Under an agreement with Franklin Mutual, FT Services provides administrative services to the Fund. The fee is paid by Franklin Mutual based on the Fund’s average daily net assets, and is not an additional expense of the Fund.
c. Distribution Fees
The Board has adopted a distribution plans for Class 2 and Class 4 shares pursuant to Rule 12b-1 under the 1940 Act. Under the Fund’s compensation distribution plans, the Fund pays Distributors for costs incurred in connection with the servicing, sale and distribution of the Fund’s shares up to 0.35% per year of its average daily net assets of each class. The Board has agreed to limit the current rate to 0.25% per year for Class 2. The plan year, for purposes of monitoring compliance with the maximum annual plan rates, is February 1 through January 31.
d. Transfer Agent Fees
Investor Services, under terms of an agreement, performs shareholder servicing for the Fund and is not paid by the Fund for the services.
e. Investments in Affiliated Management Investment Companies
The Fund invests in one or more affiliated management investment companies for purposes other than exercising a controlling influence over the management or policies. Management fees paid by the Fund are waived on assets invested in the affiliated management investment companies, as noted in the Statement of Operations, in an amount not to exceed the management and administrative fees paid directly or indirectly by each affiliate. During the year ended December 31, 2016, the Fund held investments in affiliated management investment companies as follows:
| | | | | | | | | | | | | | | | | | | | | | | | | | | | | | | | |
| | | Number
of Shares
Held at
Beginning
of Year | | | Gross
Additions | | | Gross
Reductions | | | Number
of Shares
Held at
End of
Year | | | Value at
End of
Year | | | Investment
Income | | | Realized
Gain
(Loss) | | | % of Affiliated
Fund Shares
Outstanding
Held at End
of Year | |
| Non-Controlled Affiliates | | | | | | | | | | | | | | | | | | | | | | | | | | | | | | | | |
Institutional Fiduciary Trust Money Market Portfolio, 0.09% | | | — | | | | 86,347,000 | | | | (86,347,000 | ) | | | — | | | $ | — | | | $ | — | | | $ | — | | | | —% | |
| | | | | | | | | | | | | | | | | | | | | | | | |
4. Expense Offset Arrangement
The Fund has entered into an arrangement with its custodian whereby credits realized as a result of uninvested cash balances are used to reduce a portion of the Fund’s custodian expenses. During the year ended December 31, 2016, the custodian fees were reduced as noted in the Statement of Operations.
FRANKLIN TEMPLETON VARIABLE INSURANCE PRODUCTS TRUST
NOTES TO FINANCIAL STATEMENTS
Franklin Mutual Global Discovery VIP Fund (continued)
5. Income Taxes
The tax character of distributions paid during the years ended December 31, 2016 and 2015, was as follows:
| | | | | | | | |
| | | 2016 | | | 2015 | |
Distributions paid from: | | | | | | | | |
Ordinary income | | $ | 16,793,274 | | | $ | 20,453,231 | |
Long term capital gain | | | 45,535,717 | | | | 41,342,406 | |
| | | | |
| | $ | 62,328,991 | | | $ | 61,795,637 | |
| | | | |
At December 31, 2016, the cost of investments, net unrealized appreciation (depreciation), undistributed ordinary income and undistributed long term capital gains for income tax purposes were as follows:
| | | | |
Cost of investments | | $ | 570,092,552 | |
| | | | |
Unrealized appreciation | | $ | 155,500,323 | |
Unrealized depreciation | | | (48,545,432 | ) |
| | | | |
Net unrealized appreciation (depreciation) | | $ | 106,954,891 | |
| | | | |
Undistributed ordinary income | | $ | 14,160,125 | |
Undistributed long term capital gains | | | 36,165,362 | |
| | | | |
Distributable earnings. | | $ | 50,325,487 | |
| | | | |
Differences between income and/or capital gains as determined on a book basis and a tax basis are primarily due to differing treatments of foreign currency transactions.
6. Investment Transactions
Purchases and sales of investments (excluding short term securities and securities sold short) for the year ended December 31, 2016, aggregated $108,011,272 and $189,824,140, respectively.
7. Credit Risk and Defaulted Securities
The Fund may purchase the pre-default or defaulted debt of distressed companies. Distressed companies are financially troubled and could be or are already involved in financial restructuring or bankruptcy. Risks associated with purchasing these securities include the possibility that the bankruptcy or other restructuring process takes longer than expected, or that distributions in restructuring are less than anticipated, either or both of which may result in unfavorable consequences to the Fund. If it becomes probable that the income on debt securities, including those of distressed companies, will not be collected, the Fund discontinues accruing income and recognizes an adjustment for uncollectible interest.
At December 31, 2016, the aggregate long value of distressed company securities for which interest recognition has been discontinued was $2,825,788, representing 0.4% of the Fund’s net assets. For information as to specific securities, see the accompanying Statement of Investments.
FRANKLIN TEMPLETON VARIABLE INSURANCE PRODUCTS TRUST
NOTES TO FINANCIAL STATEMENTS
Franklin Mutual Global Discovery VIP Fund (continued)
8. Restricted Securities
The Fund invests in securities that are restricted under the Securities Act of 1933 (1933 Act) or which are subject to legal, contractual, or other agreed upon restrictions on resale. Restricted securities are often purchased in private placement transactions, and cannot be sold without prior registration unless the sale is pursuant to an exemption under the 1933 Act. Disposal of these securities may require greater effort and expense, and prompt sale at an acceptable price may be difficult. The Fund may have registration rights for restricted securities. The issuer generally incurs all registration costs.
At December 31, 2016, the Fund held investments in restricted securities, excluding certain securities exempt from registration under the 1933 Act deemed to be liquid, as follows:
| | | | | | | | | | | | | | |
Principal Amount/ Shares/ Units | | Issuer | | Acquisition Date | | | Cost | | | Value | |
| 595 | | Broadband Ventures III LLC, secured promissory note, 5.00%, 2/01/12 | | | 7/01/10 - 11/30/12 | | | $ | 595 | | | $ | — | |
| 2,077,368 | | FIM Coinvestor Holdings I, LLC | | | 11/20/06 - 6/02/09 | | | | — | | | | — | |
| 1,775,736 | | Hightower Holding LLC, B, Series 2. | | | 6/10/10 - 5/10/12 | | | | 5,430,000 | | | | 5,466,782 | |
| 424,073 | | International Automotive Components Group Brazil LLC | | | 4/13/06 - 12/26/08 | | | | 281,629 | | | | 10,435 | |
| 4,052,916 | | International Automotive Components Group North America LLC | | | 1/12/06 - 3/18/13 | | | | 3,247,714 | | | | 3,014,964 | |
| 1,841 | | Warrior Met Coal LLC, A | | | 9/19/14 - 3/31/16 | | | | 2,420,000 | | | | 598,325 | |
| 4,306 | | Warrior Met Coal LLC, B | | | 3/31/16 - 6/23/16 | | | | 344,500 | | | | 1,399,450 | |
| | | | | | | | | | |
| | Total Restricted Securities(Value is 1.5% of Net Assets) | | | | | | $ | 11,724,438 | | | $ | 10,489,956 | |
| | | | | | | | | | |
9. Unfunded Capital Commitments
The Fund enters into certain capital commitments and may be obligated to perform on such agreements at a future date. The Fund monitors these commitments and assesses the probability of required performance. For any agreements whose probability of performance is determined to be greater than remote, the Fund assesses the fair value of the commitment. In instances where the probability of performance is greater than remote and the performance under the commitment would result in an unrealized loss, the Fund recognizes such losses in the Statement of Assets and Liabilities and the Statement of Operations.
At December 31, 2016, the Fund had an unfunded capital commitment of $172,240, for which no depreciation has been recognized.
10. Other Derivative Information
At December 31, 2016, the Fund’s investments in derivative contracts are reflected in the Statement of Assets and Liabilities as follows:
| | | | | | | | | | | | |
| | | Asset Derivatives | | | Liability Derivatives | |
Derivative Contracts
Not Accounted for
as Hedging Instruments | | Statement of Assets and
Liabilities Location | | Fair Value | | | Statement of Assets and
Liabilities Location | | Fair Value | |
Foreign exchange contracts | | Variation margin | | $ | 575,444 | a | | Variation margin | | $ | — | |
| | Unrealized appreciation on OTC forward exchange contracts | | | 509,586 | | | Unrealized depreciation on OTC forward exchange contracts | | | 505,558 | |
| | | | | | | | | | | | |
Totals | | | | $ | 1,085,030 | | | | | $ | 505,558 | |
| | | | | | | | | | | | |
aThis amount reflects the cumulative appreciation (depreciation) of futures contracts as reported in the Statement of Investments. Only the variation margin receivable/payable at year end is separately reported within the Statement of Assets and Liabilities. Prior variation margin movements were recorded to cash upon receipt or payment.
FRANKLIN TEMPLETON VARIABLE INSURANCE PRODUCTS TRUST
NOTES TO FINANCIAL STATEMENTS
Franklin Mutual Global Discovery VIP Fund (continued)
For the year ended December 31, 2016, the effect of derivative contracts in the Fund’s Statement of Operations was as follows:
| | | | | | | | | | | | |
Derivative Contracts Not Accounted for as Hedging Instruments | | Statement of Operations
Locations | | Net
Realized
Gain (Loss)
for the Year | | | Statement of Operations
Locations | | Net Change in
Unrealized
Appreciation
(Depreciation)
for the Year | |
| | Net realized gain (loss) from: | | | | | | Net change in unrealized appreciation (depreciation) on: | | | | |
Foreign exchange contracts | | Foreign currency transactions | | $ | 7,251,207 | a | | Translation of other assets and liabilities denominated in foreign currencies | | $ | (822,472 | )a |
| | Futures contracts | | | 4,697,347 | | | Futures contracts | | | 32,096 | |
| | | | | | | | | | | | |
Totals | | | | $ | 11,948,554 | | | | | $ | (790,376 | ) |
| | | | | | | | | | | | |
aForward exchange contracts are included in net realized gain (loss) from foreign currency transactions and net change in unrealized appreciation (depreciation) on translation of other assets and liabilities denominated in foreign currencies in the Statement of Operations.
For the year ended December 31, 2016, the average month end fair value of derivatives represented 0.5% of average month end net assets. The average month end number of open derivatives contracts for the year was 55.
See Note 1(c) regarding derivative financial instruments.
11. Credit Facility
The Fund, together with other U.S. registered and foreign investment funds (collectively, Borrowers), managed by Franklin Templeton Investments, are borrowers in a joint syndicated senior unsecured credit facility totaling $2 billion (Global Credit Facility) which matured on February 10, 2017. This Global Credit Facility provides a source of funds to the Borrowers for temporary and emergency purposes, including the ability to meet future unanticipated or unusually large redemption requests. Effective February 10, 2017, the Borrowers renewed the Global Credit Facility for a one year term, maturing February 9, 2018, for a total of $2 billion.
Under the terms of the Global Credit Facility, the Fund shall, in addition to interest charged on any borrowings made by the Fund and other costs incurred by the Fund, pay its share of fees and expenses incurred in connection with the implementation and maintenance of the Global Credit Facility, based upon its relative share of the aggregate net assets of all of the Borrowers, including an annual commitment fee of 0.15% based upon the unused portion of the Global Credit Facility. These fees are reflected in other expenses in the Statement of Operations. During the year ended December 31, 2016, the Fund did not use the Global Credit Facility.
12. Fair Value Measurements
The Fund follows a fair value hierarchy that distinguishes between market data obtained from independent sources (observable inputs) and the Fund’s own market assumptions (unobservable inputs). These inputs are used in determining the value of the Fund’s financial instruments and are summarized in the following fair value hierarchy:
| | • | | Level 1 – quoted prices in active markets for identical financial instruments |
| | • | | Level 2 – other significant observable inputs (including quoted prices for similar financial instruments, interest rates, prepayment speed, credit risk, etc.) |
| | • | | Level 3 – significant unobservable inputs (including the Fund’s own assumptions in determining the fair value of financial instruments) |
The input levels are not necessarily an indication of the risk or liquidity associated with financial instruments at that level.
FRANKLIN TEMPLETON VARIABLE INSURANCE PRODUCTS TRUST
NOTES TO FINANCIAL STATEMENTS
Franklin Mutual Global Discovery VIP Fund (continued)
12. Fair Value Measurements (continued)
For movements between the levels within the fair value hierarchy, the Fund has adopted a policy of recognizing the transfers as of the date of the underlying event which caused the movement.
A summary of inputs used as of December 31, 2016, in valuing the Fund’s assets and liabilities carried at fair value, is as follows:
| | | | | | | | | | | | | | | | |
| | | Level 1 | | | Level 2 | | | Level 3 | | | Total | |
| Assets: | | | | | | | | | | | | | | | | |
Investments in Securities: | | | | | | | | | | | | | | | | |
Equity Investments:a | | | | | | | | | | | | | | | | |
Auto Components | | $ | 3,425,500 | | | $ | — | | | $ | 3,025,399 | | | $ | 6,450,899 | |
Banks | | | 95,601,519 | | | | 10,594,439 | | | | — | | | | 106,195,958 | |
Diversified Financial Services | | | 3,986,713 | | | | — | | | | 5,466,782 | | | | 9,453,495 | |
Oil, Gas & Consumable Fuels | | | 44,020,626 | | | | — | | | | 1,997,775 | | | | 46,018,401 | |
All Other Equity Investmentsb | | | 430,565,284 | | | | — | | | | — | | | | 430,565,284 | |
Corporate Bonds, Notes and Senior Floating Rate Interests | | | — | | | | 24,856,071 | | | | — | | | | 24,856,071 | |
Corporate Notes and Senior Floating Rate Interests in Reorganization | | | — | | | | 1,299,613 | | | | — | c | | | 1,299,613 | |
Companies in Liquidation | | | 3,228 | | | | 884,087 | | | | 136,964 | c | | | 1,024,279 | |
Municipal Bonds in Reorganization | | | — | | | | 1,526,175 | | | | — | | | | 1,526,175 | |
Short Term Investments | | | 39,957,268 | | | | 9,700,000 | | | | — | | | | 49,657,268 | |
| | | | |
Total Investments in Securities | | $ | 617,560,138 | | | $ | 48,860,385 | | | $ | 10,626,920 | | | $ | 677,047,443 | |
| | | | |
Other Financial Instruments: | | | | | | | | | | | | | | | | |
Futures Contracts | | $ | 575,444 | | | $ | — | | | $ | — | | | $ | 575,444 | |
Forward Exchange Contracts | | | — | | | | 509,586 | | | | — | | | | 509,586 | |
| | | | |
Total Other Financial Instruments | | $ | 575,444 | | | $ | 509,586 | | | $ | — | | | $ | 1,085,030 | |
| | | | |
| | | | |
| Liabilities: | | | | | | | | | | | | | | | | |
Other Financial Instruments: | | | | | | | | | | | | | | | | |
Securities Sold Short | | $ | 3,473,186 | | | $ | — | | | $ | — | | | $ | 3,473,186 | |
Forward Exchange Contracts | | | — | | | | 505,558 | | | | — | | | | 505,558 | |
| | | | |
Total Other Financial Instruments | | $ | 3,473,186 | | | $ | 505,558 | | | $ | — | | | $ | 3,978,744 | |
| | | | |
aIncludes common and preferred stocks as well as other equity investments.
bFor detailed categories, see the accompanying Statement of Investments.
cIncludes securities determined to have no value at December 31, 2016.
A reconciliation of assets in which Level 3 inputs are used in determining fair value is presented when there are significant Level 3 financial instruments at the end of the year. At December 31, 2016, the reconciliation of assets is as follows:
| | | | | | | | | | | | | | | | | | | | | | | | | | | | | | | | | | | | | | | | |
| | |
| Balance at
Beginning of
Year |
| | | Purchases | | | | Sales | | |
| Transfers
Into
Level 3 |
a
| |
| Transfers
Out of
Level 3 |
b | |
| Cost Basis
Adjustments |
| |
| Net
Realized
Gain
(Loss) |
| |
| Net Unrealized
Appreciation
(Depreciation) |
| |
| Balance at
End of
Year |
| |
| Net Change in
Unrealized
Appreciation
(Depreciation)
on Assets Held
at Year End |
|
| Assets: | | | | | | | | | | | | | | | | | | | | | | | | | | | | | | | | | | | | | | | | |
Investments in Securities: | | | | | | | | | | | | | | | | | | | | | | | | | | | | | | | | | | | | | | | | |
Equity Investments: | | | | | | | | | | | | | | | | | | | | | | | | | | | | | | | | | | | | | | | | |
Auto Components | | $ | 2,192,388 | | | $ | — | | | $ | — | | | $ | — | | | $ | — | | | $ | — | | | $ | — | | | $ | 833,011 | | | $ | 3,025,399 | | | $ | 833,011 | |
Diversified Financial Services | | | 5,157,849 | | | | — | | | | — | | | | — | | | | — | | | | — | | | | — | | | | 308,933 | | | | 5,466,782 | | | | 308,933 | |
Oil, Gas & Consumable Fuels | | | — | | | | 344,500 | | | | — | | | | 221,058 | | | | — | | | | — | | | | — | | | | 1,432,217 | | | | 1,997,775 | | | | 1,432,217 | |
FRANKLIN TEMPLETON VARIABLE INSURANCE PRODUCTS TRUST
NOTES TO FINANCIAL STATEMENTS
Franklin Mutual Global Discovery VIP Fund (continued)
| | | | | | | | | | | | | | | | | | | | | | | | | | | | | | | | | | | | | | | | |
| | |
| Balance at
Beginning of Year |
| | | Purchases | | | | Sales | | |
| Transfers
Into Level 3 |
a | |
| Transfers
Out of Level 3 |
b | |
| Cost Basis
Adjustments |
| |
| Net
Realized Gain (Loss) |
| |
| Net
Unrealized Appreciation (Depreciation) |
| |
| Balance at
End of Year |
| |
| Net Change in
Unrealized Appreciation (Depreciation) on Assets Held at Year End |
|
Corporate Notes and Senior | | | | | | | | | | | | | | | | | | | | | | | | | | | | | | | | | | | | | | | | |
Floating Rate Interests in Reorganization | | $ | 2,053 | c | | $ | — | | | $ | — | | | $ | — | | | $ | (280 | ) | | $ | — | | | $ | — | | | $ | (1,773 | ) | | $ | — | c | | $ | — | |
Companies in Liquidation | | | — | | | | — | | | | — | | | | 188,916 | | | | — | | | | — | | | | — | | | | (51,952 | ) | | | 136,964 | c | | | (51,952 | ) |
| | | | |
Total Investments in Securities | | $ | 7,352,290 | | | $ | 344,500 | | | $ | — | | | $ | 409,974 | | | $ | (280 | ) | | $ | — | | | $ | — | | | $ | 2,520,436 | | | $ | 10,626,920 | | | $ | 2,522,209 | |
| | | | |
aThe investments were transferred into Level 3 as result of the unavailability of other significant observable valuation inputs. May include amounts related to a corporate action.
bThe investments were transferred out of Level 3 as a result of the availability of other significant observable valuation inputs.
cIncludes securities determined to have no value.
Significant unobservable valuation inputs developed by the VC for material Level 3 financial instruments and impact to fair value as a result of changes in unobservable valuation inputs as of December 31, 2016, are as follows:
| | | | | | | | | | | | | | | | |
| Description | | Fair Value at End of Year | | | Valuation Technique | | Unobservable Input | | Weighting/ Amount/ Range | | | Impact to Fair Value if Input Increasesa | |
| Assets: | | | | | | | | | | | | | | | | |
| | | | | |
Investments in Securities: | | | | | | | | | | | | | | | | |
| | | | | |
Equity Investments: | | | | | | | | | | | | | | | | |
| | | | | |
Auto Components | | $ | 3,014,964 | | | Market comparables Discounted Cash Flow | | EV / EBITDA multiple 3 Yr Forward EBITDA Growth Rate Discount Rate | |
| 3.6x
1.01%
10% |
| |
| Increase
Increase
Decrease |
|
Diversified Financial Services | | | 5,466,782 | | | Market comparables | | EV / Revenue multiple Last 12 Months EV / EBITDA multiple Forward 12 Months EV / EBITDA multiple EV / Equity multiple Discount rate | |
| 2.2x
11.3x
10.6x
2.7x
10.6% |
| |
| Increase
Increase Increase Increase Decrease | b
b c b |
All Other Investmentsd | | | 2,145,174 | | | | | | | | | | | | | |
Total | | $ | 10,626,920 | | | | | | | | | | | | | |
aRepresents the directional change in the fair value of the Level 3 financial instruments that would result from a significant and reasonable increase in the corresponding input. A significant and reasonable decrease in the input would have the opposite effect. Significant impacts, if any, to fair value and/or net assets have been indicated.
bRepresents a significant impact to fair value but not net assets.
cRepresents a significant impact to fair value and net assets.
dIncludes fair value of immaterial investments developed using various valuation techniques and unobservable inputs. May also include investments with values derived using prior transaction prices or third party pricing information without adjustment for which such inputs are also unobservable.
Abbreviations List
| | |
| |
| EBITDA | | Earnings before interest, taxes, depreciation and amortization |
| |
| EV | | Enterprise value |
FRANKLIN TEMPLETON VARIABLE INSURANCE PRODUCTS TRUST
NOTES TO FINANCIAL STATEMENTS
Franklin Mutual Global Discovery VIP Fund (continued)
13. Investment Company Reporting Modernization
In October 2016, the U.S. Securities and Exchange Commission adopted new rules and amended existing rules (together, final rules) intended to modernize the reporting and disclosure of information by registered investment companies. In part, the final rules amend Regulation S-X and require standardized, enhanced disclosures about derivatives in investment company financial statements, as well as other amendments. The compliance date for the amendments to Regulation S-X is August 1, 2017. Management is currently evaluating the impact that the adoption of the amendments to Regulation S-X will have on the Fund’s financial statements and related disclosures.
14. Subsequent Events
The Fund has evaluated subsequent events through the issuance of the financial statements and determined that no events have occurred that require disclosure other than those already disclosed in the financial statements.
Abbreviations
| | | | | | | | | | |
| Counterparty | | Currency | | Selected Portfolio |
| | | | | |
| BOFA | | Bank of America N.A. | | EUR | | Euro | | ADR | | American Depositary Receipt |
| | | | | |
| BONY | | Bank of New York Mellon | | GBP | | British Pound | | FHLB | | Federal Home Loan Bank |
| | | | | |
| FBCO | | Credit Suisse Group AG | | USD | | United States Dollar | | GO | | General Obligation |
| | | | | |
| HSBK | | HSBC Bank PLC | | | | | | TRA | | Tax Receivable Agreement Right |
| | | | | |
| SSBT | | State Street Bank and Trust Co., N.A. | | | | | | | | |
| | | | | |
| UBSW | | UBS AG | | | | | | | | |
FRANKLIN TEMPLETON VARIABLE INSURANCE PRODUCTS TRUST
Report of Independent Registered Public Accounting Firm
Franklin Mutual Global Discovery VIP Fund
To the Board of Trustees and Shareholders of Franklin Templeton Variable Insurance Products Trust
In our opinion, the accompanying statement of assets and liabilities, including the statement of investments, and the related statements of operations and of changes in net assets and the financial highlights present fairly, in all material respects, the financial position of Franklin Mutual Global Discovery VIP Fund (the “Fund”) as of December 31, 2016, the results of its operations for the year then ended, the changes in its net assets for each of the two years in the period then ended and the financial highlights for each of the periods presented, in conformity with accounting principles generally accepted in the United States of America. These financial statements and financial highlights (hereafter referred to as “financial statements”) are the responsibility of the Fund’s management. Our responsibility is to express an opinion on these financial statements based on our audits. We conducted our audits of these financial statements in accordance with the standards of the Public Company Accounting Oversight Board (United States). Those standards require that we plan and perform the audits to obtain reasonable assurance about whether the financial statements are free of material misstatement. An audit includes examining, on a test basis, evidence supporting the amounts and disclosures in the financial statements, assessing the account principles used and significant estimates made by management, and evaluating the overall financial statement presentation. We believe that our audits, which included confirmation of securities as of December 31, 2016 by correspondence with the custodian and brokers, provide a reasonable basis for our opinion.
PricewaterhouseCoopers LLP
San Francisco, California
February 15, 2017
FRANKLIN TEMPLETON VARIABLE INSURANCE PRODUCTS TRUST
Tax Information (unaudited)
Franklin Mutual Global Discovery VIP Fund
Under Section 852(b)(3)(C) of the Internal Revenue Code (Code), the Fund hereby reports the maximum amount allowable but no less than $45,535,717 as a long term capital gain dividend for the fiscal year ended December 31, 2016.
Under Section 854(b)(1)(A) of the Code, the Fund hereby reports 52.96% of the ordinary income dividends as income qualifying for the dividends received deduction for the fiscal year ended December 31, 2016.
Franklin Mutual Shares VIP Fund
We are pleased to bring you Franklin Mutual Shares VIP Fund’s annual report for the fiscal year ended December 31, 2016.
Class 2 Performance Summary as of December 31, 2016
Average annual total return of Class 2 shares* represents the average annual change in value, assuming reinvestment of dividends and capital gains. Average returns smooth out variations in returns, which can be significant; they are not the same as year-by-year results.
| | | | | | | | | | | | |
| Periods ended 12/31/16 | | 1-Year | | | 5-Year | | | 10-Year | |
Average Annual Total Return | | | +16.06% | | | | +11.61% | | | | +4.57% | |
*The Fund has a fee waiver associated with any investment it makes in a Franklin Templeton money fund and/or other Franklin Templeton fund, contractually guaranteed through its current fiscal year-end. Fund investment results reflect the fee waiver; without this waiver, the results would have been lower.
Performance reflects the Fund’s Class 2 operating expenses, but does not include any contract fees, expenses or sales charges. If they had been included, performance would be lower. These charges and deductions, particularly for variable life policies, can have a significant effect on contract values and insurance benefits. See the contract prospectus for a complete description of these expenses, including sales charges.
Performance data represent past performance, which does not guarantee future results. Investment return and principal value will fluctuate, and you may have a gain or loss when you sell your shares. Current performance may differ from figures shown.
Total Return Index Comparison for a Hypothetical $10,000 Investment (1/1/07–12/31/16)
The graph below shows the change in value of a hypothetical $10,000 investment in the Fund over the indicated period and includes reinvestment of any income or distributions. The Fund’s performance* is compared to the performance of the Standard & Poor’s® 500 Index (S&P 500®). One cannot invest directly in an index, and an index is not representative of the Fund’s portfolio. Please see Important Notes to Performance Information preceding the Fund Summaries.
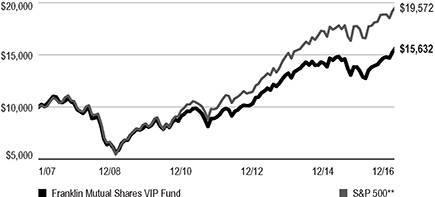
**Source: Morningstar. Please see Index Descriptions following the Fund Summaries.
FRANKLIN MUTUAL SHARES VIP FUND
Fund Goal and Main Investments
The Fund seeks capital appreciation, with income as a secondary goal, by investing primarily in equity securities of companies the Fund’s managers believe are at prices below their intrinsic value. The Fund may invest up to 35% of its assets in foreign securities.
Fund Risks
All investments involve risks, including possible loss of principal. Value securities may not increase in price as anticipated or may decline further in value. The Fund’s investments in foreign securities involve special risks including currency fluctuations, and economic and political uncertainties. Derivatives involve costs and can create economic leverage in the Fund’s portfolio which may result in significant volatility and cause the Fund to participate in losses (as well as gains) in an amount that exceeds the Fund’s initial investment. The Fund may also invest in companies engaged in mergers, reorganizations or liquidations, which involve special risks as pending deals may not be completed on time or on favorable terms, as well as lower rated bonds, which entail higher credit risk. The Fund is actively managed but there is no guarantee that the manager’s investment decisions will produce the desired results. The Fund’s prospectus also includes a description of the main investment risks.
Performance Overview
You can find the Fund’s one-year total return in the Performance Summary. In comparison, the Fund’s benchmark, the S&P 500, delivered a +11.96% total return for the period under review.1
Economic and Market Overview
The global economy grew moderately during the 12-month period despite slower growth in some countries. In this environment, global developed and emerging market stocks, as measured by the MSCI All Country World Index, rose. Global markets were aided by accommodative monetary policies of various global central banks, improved commodity prices after 2016’s first quarter, finalization of Greece’s new debt deal and generally encouraging global economic data. Further supporting markets were expectations of higher interest rates and inflation in the U.S., driven by talk of expansionary fiscal
Geographic Composition*
Based on total Net Assets as of 12/31/16
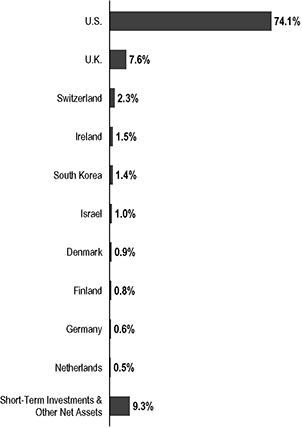
*Figures are stated as a percentage of total and may not equal 100% or may be negative due to rounding, use of any derivatives, unsettled trades or other factors.
policies under new U.S. president Donald Trump, and an Organization of the Petroleum Exporting Countries deal to curb oil production. However, these factors were partially offset by a slowdown in China’s economy and declining commodity prices early in the period, geopolitical tensions in certain regions, uncertainty about the U.S. Federal Reserve’s (Fed’s) timing for raising interest rates and worries about the health of European banks. In addition, global economic concerns and the U.K.’s historic referendum to leave the European Union (also known as “Brexit”) contributed to volatility in global stock markets.
The U.S. economy grew in 2016 despite a general decline in private inventory and business investments, which partly offset strength in consumer spending, residential investment and government spending. Manufacturing conditions remained
1. Source: Morningstar. One cannot invest directly in an index, and an index is not representative of the Fund’s portfolio. Please see Index Descriptions following the Fund Summaries.
The dollar value, number of shares or principal amount, and names of all portfolio holdings are listed in the Fund’s Statement of Investments (SOI).
FRANKLIN MUTUAL SHARES VIP FUND
volatile but generally expanded. The services sector also grew for most of the period, contributing to new jobs that helped the unemployment rate decrease from 5.0% in December 2015 to 4.7% at period-end.2 Retail sales generally rose, as did home sales and prices amid declining mortgage rates. At its December meeting, the Fed increased its target range for the federal funds rate to
0.50%–0.75%, as policymakers cited an improvement in U.S. labor markets and higher inflation. The Federal Open Market Committee also hinted at three additional hikes in 2017, and the Fed raised its 2017 U.S. economic growth forecast, while lowering its unemployment projections.
In Europe, the U.K.’s annualized economic growth accelerated in 2016’s second half, driven by gross fixed capital formation in the third quarter and manufacturing and services in the fourth quarter. Immediate effects of the Brexit vote in June materialized as U.K. stocks declined significantly, the British pound hit a three-decade low amid intensified selling and the U.K.’s credit rating was downgraded. In the eurozone, despite investor concerns about banking sector weakness, low corporate earnings and post-Brexit politics, some regions benefited from rising consumer spending, resulting from a cheaper euro, low inflation and signs of sustained economic growth. The eurozone grew slightly early in the period, aided by lower oil prices, improved exports and the European Central Bank’s (ECB’s) accommodative monetary policy. However, growth moderated in 2016’s second quarter and improved in the third and fourth quarters. After declining in the beginning of 2016, the eurozone’s annual inflation rate increased gradually to reach its highest reading in three years toward period-end, ending at an estimated 1.1% in December. The ECB cut its benchmark interest rate and expanded its massive bond-buying program in March and August 2016 to boost the region’s slowing growth. Furthermore, at its December meeting, the ECB extended the continuation of its monthly asset purchases from March to December of 2017, but it agreed to scale back the purchase amount beginning in April 2017.
In Asia, Japan’s quarterly gross domestic product grew slower in the third quarter than in the second and first quarters, mainly due to declines in private non-residential and public investments. In January 2016, the Bank of Japan (BOJ) introduced negative interest rates on excess reserves held by financial institutions with the central bank to boost lending and help achieve its inflation target. In July 2016, Japan’s Prime Minister Shinzo Abe announced a
higher-than-expected fiscal stimulus to revive the economy, followed by an additional monetary stimulus announcement by the BOJ. The BOJ kept its
2. Source: Bureau of Labor Statistics.
interest rates unchanged toward period-end; however, it overhauled its monetary policy in September to focus on yield-curve control. The bank further announced that it adjusted its Japanese government bond purchases to maintain the 10-year rate for these bonds near 0%.
In emerging markets, economic growth generally moderated during the period. Brazil’s economy continued to be in recession and the country’s central bank cut its benchmark interest rate in October and November 2016 to spur economic growth. Russia’s economic contraction eased in 2016, following a rebound in oil prices and improved industrial production. The Bank of Russia reduced its key interest rates in June and September of 2016 to revive its economy. China’s economy grew at a stable rate in the first three quarters of 2016 and expanded slightly faster in the fourth quarter, as full-year 2016 growth remained within the government’s targeted range. However, the People’s Bank of China employed monetary easing measures that included cutting the cash reserve requirement ratio for the country’s banks and effectively devaluing the Chinese currency against the U.S. dollar. In India, economic growth marginally increased from July through September 2016 due to slower private consumption growth and increased government spending. Overall, emerging market stocks, as measured by the MSCI Emerging Markets Index, rose during the period.
Investment Strategy
At Franklin Mutual Advisors, we are committed to our distinctive value approach to investing. Our major investment strategy is investing in undervalued stocks. When selecting undervalued equities, we are attracted to what we believe are fundamentally strong companies with healthy balance sheets, high-quality assets, substantial free cash flow and shareholder-oriented management teams and whose stocks are trading at discounts to our assessment of the companies’ intrinsic or business value. We also look for asset-rich companies whose shares may be trading at depressed levels due to concerns over short-term earnings disappointments, litigation, management strategy or other perceived negatives. While the vast majority of our undervalued equity investments are made in publicly traded companies globally, we may invest occasionally in privately held companies as well.
We complement this more traditional investment strategy with two others. One is distressed investing, which is complex and can take many forms. The most common distressed investment
FRANKLIN MUTUAL SHARES VIP FUND
the Fund undertakes is the purchase of financially troubled or bankrupt companies’ debt at a substantial discount to face value. After the financially distressed company is reorganized, often in bankruptcy court, the old debt is typically replaced with new securities issued by the financially stronger company.
The other piece of our investment strategy is participating in arbitrage situations, another highly specialized field. When companies announce proposed mergers or takeovers, commonly referred to as “deals,” the target company may trade at a discount to the bid it ultimately accepts. One form of arbitrage involves purchasing the target company’s stock when it is trading below the value we believe it would receive in a deal. In keeping with our commitment to a relatively conservative investment approach, we typically focus our arbitrage efforts on announced deals, and eschew rumored deals or other situations we consider relatively risky.
In addition, it is our practice to hedge the Fund’s currency exposure when we deem it advantageous for our shareholders.
What is meant by “hedge”?
To hedge an investment is to take a position intended to offset potential losses/gains that may be incurred by a companion financial instrument.
Manager’s Discussion
The year 2016 was a roller coaster year for most markets. Fears of global recession drove markets down early in the year, a gradual recovery was briefly disrupted by the Brexit referendum vote in late June and the unexpected election of Donald Trump in November served as the catalyst for a late year market spike. Early year recession fears steadily faded, with U.S. unemployment reaching new lows for this business cycle. As economic activity picked up, commodity markets also recovered, with Brent oil prices climbing back over US$50 a barrel, from lows of almost half that level early in the year. As the year ended, equity markets appreciated, apparently in anticipation of accelerating economic growth and increasing corporate profit driven by expectations of rapid adoption of Republican proposals to decrease regulation and dramatically reduce tax rates.
Political activity in 2016 was unpredictable, by most standards, with material impact on markets. In mid-year, the Brexit vote surprised markets, triggering a significant depreciation in the value of the British pound. The process by which Brexit will be implemented remains very unclear and in our view will be an overhang for some time. The election of Donald Trump was also a material surprise, and was coupled with an unexpected
Republican “sweep” of both houses of Congress. Markets quickly reacted to Trump and Republican policy preferences, with cyclical and regulated sectors, such as banks, posting strong returns. Late in the year, the Italian referendum to reform the electoral system failed, leading to a resignation of the prime minister and the formation of a new government. Put together, these events reflect widespread skepticism of “the powers that be” and a desire for change, of whatever type, by significant portions of the population of developed economies.
| | | | |
| Top 10 Sectors/Industries | | | |
| 12/31/16 | | | |
| | | % of Total
Net Assets | |
| Banks | | | 10.5% | |
| Insurance | | | 8.9% | |
| Pharmaceuticals | | | 7.6% | |
| Oil, Gas & Consumable Fuels | | | 6.7% | |
| Software | | | 6.0% | |
| Health Care Equipment & Supplies | | | 5.5% | |
| Tobacco | | | 5.4% | |
| Food & Staples Retailing | | | 4.8% | |
| Media | | | 4.7% | |
| Communications Equipment | | | 2.3% | |
The implications of such desire for political change for financial markets are not clear. In the near term, each event has led to “first order” impacts. For Brexit, we saw strong stock price movements among U.K. firms with significant non-U.K. business exposure, while shares of primarily domestic firms weakened. The U.S. election led to outperformance by sectors expected to benefit the most from corporate tax reform, decreased regulation and changes in terms of trade. The Italian referendum has been followed by difficulties in getting investors to support needed recapitalizations of Italian banks. However, the longer term impacts remain unclear. Will the U.K. have a “hard Brexit” with limited room for negotiations with the European Union? Will the new U.S. administration spark a global trade war? Will Italy further drag down Europe?
As value investors, we certainly benefited this year from steady economic growth and the year-end market surge. However, we do not invest primarily on views of political outcomes. We invest prudently in securities that we believe represent good value, and then we adjust our views as the world around us changes.
FRANKLIN MUTUAL SHARES VIP FUND
The financials sector has been a significant area of investment for the Fund.3 Financials have traded at historically low price-to-book valuations almost continuously since the financial crisis of 2008. The Franklin Mutual Shares VIP Fund has held various positions, and entered 2016 with significant positions in JPMorgan Chase, Wells Fargo and others. Through the year, the financials sector was volatile like the overall market, but ended the year well. The firms mentioned benefited from several trends, including improved economic growth, which drives new business and lowers credit costs. They also benefited from rising interest rates. Most banks have substantial assets which generate more income as rates rise and often have some funding that is not tied to rates, and so it can become a more advantageous environment when rates are higher. Finally, financial firms would benefit from a reduction in regulation, as many are still being investigated or paying fines for activities that occurred as much as a decade ago. If all of these effects materialize, we believe the valuations of financials will likely continue to improve.
An example of such a firm held by the Fund is JPMorgan Chase, one of the biggest banks in the world. JPMorgan is diversified, with activities in retail banking, credit cards, mortgages, investment banking and asset management. We believe JPMorgan is likely to benefit from all the trends mentioned above. Higher rates should drive income from the substantial assets JPMorgan carries, as well as increase the value of the non-interest bearing accounts JPMorgan provides. An improving economy kept credit losses low and increased demand for new loans and other services, and a recovering financial market benefited investment bank and asset management activities. JPMorgan shares appreciated in 2016 but, in our view, remained modestly valued and an attractive investment for the Fund.
Merger and acquisition (M&A) activity continued to be strong in 2016, helping to support equity market valuations. Regulatory uncertainty persisted throughout the year, with deal failures from the first half of the year, such as the failed acquisitions of Office Depot and Baker Hughes, followed by the Department of Justice’s decisions to sue to block two major health insurance mergers. However, major deals continued to be announced, including Microsoft’s acquisition of LinkedIn4 and AT&T’s4 acquisition of Time Warner.5 Several of these
deals have presented attractive merger arbitrage opportunities, in our view.
Credit spreads widened dramatically across industries and countries in early 2016 and then narrowed steadily through the rest of the year. The trend was particularly apparent in subinvestment-grade credit, which created additional challenges for industries already experiencing distress, including energy, metals and mining.6 Dislocations in debt capital markets created some unique opportunities, in our view, especially in stressed and event-driven credit situations, where we felt the yield reached attractive levels and that cheap enterprise valuation multiples provided downside protection. Early in the year, the Fund invested in debt needed to complete acquisitions. These “hung deals” in our view presented attractive opportunities for us to allocate capital at times when significant stress was observed in the market. By the end of the period, credit spreads had tightened materially from their intra-period highs and the Fund had exited many of the opportunistic investments.
We are also reaching the end of the investment horizon of some long-standing high yield positions. The Fund’s position in the debt issued in the leveraged buyout of TXU in 2007 came through bankruptcy and the Fund now holds equity in a reorganized entity. Debt held in other leveraged buyouts, such as iHeartCommunications (formerly known as Clear Channel Communications), Avaya and Caesars Entertainment Operating Co. continue to head toward long-term resolutions of their stressed capital structures.
Turning to Fund performance, top contributors included California-based information technology (IT) security company Symantec, oil and natural gas producer Royal Dutch Shell and global U.K.-based tobacco company British American Tobacco.7
In January of 2016, Symantec sold Veritas, its storage software business, to a private equity group, focusing the firm on its historic roots in security software. In June 2016, investors responded positively to Symantec’s announced acquisition of Blue Coat Systems, a cyber-defense technologies firm. The announcement that the chief executive officer (CEO) of Blue Coat Systems, Greg Clark, would lead the combined company
3. The financials sector comprises banks, consumer finance, diversified financial services, equity real estate investments trusts, insurance and real estate management and development in the SOI.
4. Not a Fund holding.
5. Not held at period-end.
6. The energy sector comprises energy equipment and services and oil, gas and consumable fuels in the SOI.
7. The IT sector comprises communications equipment; IT services; software; and technology hardware, storage and peripherals in the SOI.
FRANKLIN MUTUAL SHARES VIP FUND
| | | | |
| Top 10 Equity Holdings | | | |
| 12/31/16 | | | |
Company Sector/Industry, Country | | % of Total
Net Assets | |
Merck & Co. Inc. Pharmaceuticals, U.S. | | | 2.9% | |
Microsoft Corp. Software, U.S. | | | 2.8% | |
Medtronic PLC Health Care Equipment & Supplies, U.S. | | | 2.7% | |
PNC Financial Services Group Inc. Banks, U.S. | | | 2.6% | |
Eli Lilly & Co. Pharmaceuticals, U.S. | | | 2.1% | |
American International Group Inc. Insurance, U.S. | | | 2.1% | |
Time Warner Inc. Media, U.S. | | | 2.0% | |
Symantec Corp. Software, U.S. | | | 1.9% | |
Royal Dutch Shell PLC Oil, Gas & Consumable Fuels, U.K. | | | 1.9% | |
Novartis AG Pharmaceuticals, Switzerland | | | 1.6% | |
and management’s reiteration of its expectations for strong post-merger earnings growth were also positive drivers of stock performance. Unlike a number of prior Symantec CEOs, Mr. Clark has a background in security engineering, and initial meetings with investors were well received. In addition, Symantec reported positive quarterly results in August and November, and announced in late December the acquisition of LifeLock, a cybersecurity identity protection company. We believe the acquisition of LifeLock has the potential to yield significant revenue synergies by expanding the line of consumer security products offered by Symantec and its potential customer market. Together, the acquisitions of Blue Coat and LifeLock could materially strengthen the Symantec business and position the firm for several years of growth.
Although average crude oil prices during the period were lower than the prior year, they appeared to have bottomed in February, and the outlook at year-end was improved in part due to a production cut agreement by both the Organization of the Petroleum Exporting Countries (OPEC) and certain non-OPEC countries, which benefited many energy shares, including those of Royal Dutch Shell. Early in the year, Shell completed the acquisition of BG group, which strengthened the company’s portfolio, but placed some pressure on its balance sheet at a time of weak commodity prices. In June, investors reacted favorably to Royal Dutch Shell’s strategy update, which included an upward revision to synergies related to the BG
Group acquisition, including a lower cost base, a limit on capital spending and an implicit lower oil-price breakeven point. The company also reiterated its intention to dispose of $30 billion of assets through 2018, maintain its dividend, eliminate the scrip dividend, and buy back $25 billion of shares over time. Shares of Royal Dutch Shell did not follow the broad equity market decline after the Brexit referendum result in June. The company is a U.S. dollar-based business, which reports and declares its dividends in U.S. dollars, resulting in what we consider to be a more attractive valuation in its local market, given the decline of the pound.
In 2016’s first half, shares of British American Tobacco benefited from a general investor preference for company stocks perceived to be less sensitive to economic conditions (defensive stocks), and those having an attractive dividend yield. Such equities included consumer staples stocks that generally outperformed in the first half of the year despite tepid global economic conditions, low interest rates and uncertainty ahead of the Brexit referendum. Later in 2016, shares of British American Tobacco were a beneficiary of the Brexit decision, as the company generates nearly all of its operating profits outside the U.K. The meaningful post-Brexit drop in the British pound caused analysts to increase their outlook for 2016 and 2017 results as foreign earnings, when translated back into pounds, were expected to post strong growth. A stronger U.S. dollar further benefited British American Tobacco via its substantial stake in U.S.-based Reynolds American. These events caused the stock price of British American Tobacco to rise, and in October, the company seized the opportunity to offer a non-binding proposal for full ownership of Reynolds American, which if consummated, would further add to operating profits and cash flow.
During the period under review, Fund investments that detracted from performance included Israel-based pharmaceutical services provider Teva Pharmaceutical Industries, Finland-based global communications and IT company Nokia and U.S.-based pharmaceutical manufacturer Eli Lilly.
Shares of Teva Pharmaceutical Industries followed the broad-based retreat in global financial markets in January and early February 2016. The stock slid further in the first half of the year due to a delay in the closing of Teva’s acquisition of Actavis, Allergan’s generics unit, which was finally completed in August. Downward pressure on the stock during the second half of the year came from heightened concerns around generic drug price deflation in the U.S., lowered 2016 fiscal year guidance issued in November, and the unexpected announcement that Siggi Olafsson would step down as the head
FRANKLIN MUTUAL SHARES VIP FUND
of Teva’s global generic medicine group in early 2017 and be replaced by Dipankar Bhattacharjee, the head of Teva’s generics business in Europe. Olafsson’s departure raised investor concerns about the integration of Actavis. At the close of 2016, Teva’s stock price reflected a high degree of caution by investors. However, we believe Teva has a strong global generics business and an emerging specialty drug pipeline, as well as an improving balance sheet due to de-leveraging.
Nokia’s stock price retreated in early February 2016 after the International Court of Arbitration issued a binding ruling prescribing lower-than-estimated royalty rates that South Korea-based Samsung is to pay to Nokia. The decision has negative implications for the high-margin cash flows Nokia is supposed to receive. In February 2016, Nokia also announced its first set of quarterly results following the January 2016 close of its Alcatel-Lucent acquisition. Investors reacted negatively to management’s cautious comments regarding demand for new mobile networks in China and the absence of formal guidance. In late October, shares fell further as quarterly results showed a decline in network equipment revenues and management cautioned that year-over-year sales in 2017 could be negative.
Eli Lilly struggled in 2016 due in large part to its Alzheimer’s drug solanezumab. In March, investors reacted negatively to the company’s announcement that it made a change to the clinical trial for solanezumab. Eli Lilly eliminated changes in a person’s daily ability to function as a primary measure of the drug’s efficacy, which potentially raised questions regarding subsequent approvals by regulators globally. In November, the company announced that solanezumab failed to significantly slow mental decline in people with mild Alzheimer’s in a late-stage clinical trial. We viewed the clinical trial to be of high risk and its failure, although unfortunate, was not a total surprise for the company and the Alzheimer’s community. We believe Eli Lilly still has a strong product growth story, a strong commitment to research and development and room for potential margin expansion.
During the period, the Fund held currency forwards and futures to partially hedge a portion of the currency risk of the portfolio’s non-U.S. dollar investments. The currency forwards had a positive impact on the Fund’s performance during the period, while currency futures had a negligible impact.
What is a currency forward?
A currency forward is an agreement between the Fund and a counterparty to buy or sell a foreign currency in exchange for another currency at a specific exchange rate on a future date.
What is a future?
A future is an agreement between the Fund and a counterparty made through a U.S. or foreign futures exchange to buy or sell an underlying instrument or asset at a specific price on a future date.
Thank you for your participation in Franklin Mutual Shares VIP Fund. We look forward to serving your future investment needs.
The foregoing information reflects our analysis, opinions and portfolio holdings as of December 31, 2016, the end of the reporting period. The way we implement our main investment strategies and the resulting portfolio holdings may change depending on factors such as market and economic conditions. These opinions may not be relied upon as investment advice or an offer for a particular security. The information is not a complete analysis of every aspect of any market, country, industry, security or the Fund. Statements of fact are from sources considered reliable, but the investment manager makes no representation or warranty as to their completeness or accuracy. Although historical performance is no guarantee of future results, these insights may help you understand our investment management philosophy.
FRANKLIN MUTUAL SHARES VIP FUND
Class 2 Fund Expenses
As an investor in a variable insurance contract (Contract) that indirectly provides for investment in an underlying mutual fund, you can incur transaction and/or ongoing expenses at both the Fund level and the Contract Level: (1) transaction expenses can include sales charges (loads) on purchases, surrender fees, transfer fees and premium taxes; and (2) ongoing expenses can include management fees, distribution and service (12b-1) fees, contract fees, annual maintenance fees, mortality and expense risk fees and other fees and expenses. All mutual funds and Contracts have some types of ongoing expenses. The table below shows Fund-level ongoing expenses and can help you understand these costs and compare them with those of other mutual funds offered through the Contract. The table assumes a $1,000 investment held for the six months indicated. Please refer to the Fund prospectus for additional information on operating expenses.
Actual Fund Expenses
The table below provides information about the actual account values and actual expenses in the columns under the heading “Actual.” In these columns the Fund’s actual return, which includes the effect of ongoing Fund expenses but does not include the effect of ongoing Contract expenses, is used to calculate the “Ending Account Value.”
You can estimate the Fund-level expenses you paid during the period by following these steps (of course, your account value and expenses will differ from those in this illustration):
| | Divide your account value by $1,000 |
| | (if your account had an $8,600 value, then $8,600 ÷ $1,000 = 8.6). |
| | Then multiply the result by the number under the headings “Actual” and “Fund-Level Expenses Paid During Period” |
| | (if Fund-Level Expenses Paid During Period were $ 7.50, |
| | then 8.6 x $7.50 = $64.50). |
In this illustration, the estimated expenses paid this period at the Fund level are $64.50.
Hypothetical Example for Comparison with Other Mutual Funds
Under the heading “Hypothetical” in the table, information is provided about hypothetical account values and hypothetical expenses based on the Fund’s actual expense ratio and an assumed rate of return of 5% per year before expenses, which is not the Fund’s actual return. This information may not be used to estimate the actual ending account balance or expenses you paid for the period, but it can help you compare ongoing costs of investing in the Fund with those of other mutual funds offered through the Contract. To do so, compare this 5% hypothetical example with the 5% hypothetical examples that appear in the shareholder reports of other funds offered through the Contract.
Please note that expenses shown in the table are meant to highlight ongoing costs at the Fund level only and do not reflect any ongoing expenses at the Contract level, or transaction expenses at either the Fund or Contract levels. In addition, while the Fund does not have transaction expenses, if the transaction and ongoing expenses at the Contract level were included, the expenses shown below would be higher. You should consult your Contract prospectus or disclosure document for more information.
| | | | | | | | | | | | | | | | | | | | | | | | |
| | | | | | Actual
(actual return after expenses) | | | Hypothetical
(5% annual return before expenses) | | | | |
| Share Class | |
| Beginning Account
Value 7/1/16 |
| |
| Ending Account
Value 12/31/16 |
| |
| Fund-Level
Expenses Paid
During Period
7/1/16–12/31/16 |
1,2 | |
| Ending Account
Value 12/31/16 |
| |
| Fund-Level
Expenses Paid
During Period
7/1/16–12/31/16 |
1,2 | |
| Net
Annualized
Expense
Ratio |
2 |
Class 2 | | | $1,000 | | | | $1,111.90 | | | | $5.15 | | | | $1,020.26 | | | | $4.93 | | | | 0.97 | % |
1. Expenses are equal to the annualized expense ratio for the six-month period as indicated above – in the far right column – multiplied by the simple average account value over the period indicated, and then multiplied by 184/366 to reflect the one-half year period.
2. Reflects expenses after fee waivers and expense reimbursements. Does not include any ongoing expenses of the Contract for which the Fund is an investment option or acquired fund fees and expenses.
VIP3 P1_P2_P4 09/16
SUPPLEMENT DATED SEPTEMBER 28, 2016
TO THE PROSPECTUSES
DATED MAY 1, 2016
OF
FRANKLIN GLOBAL REAL ESTATE VIP FUND
FRANKLIN INCOME VIP FUND
FRANKLIN MUTUAL GLOBAL DISCOVERY VIP FUND
FRANKLIN MUTUAL SHARES VIP FUND
TEMPLETON FOREIGN VIP FUND
TEMPLETON GROWTH VIP FUND
(Series of Franklin Templeton Variable Insurance Products Trust)
The Prospectus is amended as follows:
I. For the Franklin Mutual Global Discovery VIP Fund, Templeton Foreign VIP Fund and Templeton Growth VIP Fund, the following is added to the “Fund Summary – Principal Risks” section:
Regional Focus Because the Fund may invest at least a significant portion of its assets in companies in a specific region, including Europe, the Fund is subject to greater risks of adverse developments in that region and/or the surrounding regions than a fund that is more broadly diversified geographically. Political, social or economic disruptions in the region, even in countries in which the Fund is not invested, may adversely affect the value of securities values held by the Fund. Current political uncertainty surrounding the European Union (EU) and its membership, including the 2016 referendum in which the United Kingdom voted to exit the EU, may increase market volatility. The financial instability of some countries in the EU, including Greece, Italy and Spain, together with the risk of that impacting other more stable countries may increase the economic risk of investing in companies in Europe.
II. For all funds (excluding the Franklin Mutual Global Discovery VIP Fund and Franklin Mutual Shares VIP Fund), the “Fund Details – Principal Risks – Foreign Securities” section is revised to add the following as a second paragraph to the “Regional” sub-section:
The risk of investments in Europe may be heightened due to the 2016 referendum in which the United Kingdom voted to exit the European Union (EU). Political, economic and legal uncertainty may cause increased market volatility. In addition, if one or more countries were to exit the EU or abandon the use of the Euro as a currency, the value of investments associated with those countries or the Euro could decline significantly and unpredictably and it would likely cause additional market disruption globally and introduce new legal and regulatory uncertainties.
III. For the Franklin Mutual Global Discovery VIP Fund and Franklin Mutual Shares VIP Fund, the “Fund Details – Principal Risks – Foreign Securities” section is revised to add the following:
Regional. Adverse conditions in a certain region or country can adversely affect securities of issuers in other countries whose economies appear to be unrelated. To the extent that the Fund invests a significant portion of its assets in a specific geographic region or a particular country, the Fund will generally have more exposure to the specific regional or country economic risks. In the event of economic or political turmoil or a deterioration of diplomatic relations in a region or country where a substantial portion of the Fund’s assets are invested, the Fund may experience substantial illiquidity or reduction in the value of the Fund’s investments.
The risk of investments in Europe may be heightened due to the 2016 referendum in which the United Kingdom voted to exit the European Union (EU). Political, economic and legal uncertainty may cause increased market volatility. In addition, if one or more countries were to exit the EU or abandon the use of the Euro as a currency, the value of investments associated with those countries or the Euro could decline significantly and unpredictably and it would likely cause additional market disruption globally and introduce new legal and regulatory uncertainties.
Please keep this supplement with your prospectus for future reference.
FRANKLIN TEMPLETON VARIABLE INSURANCE PRODUCTS TRUST
Financial Highlights
Franklin Mutual Shares VIP Fund
| | | | | | | | | | | | | | | | | | | | |
| | | Year Ended December 31, | |
| | | 2016 | | | 2015 | | | 2014 | | | 2013 | | | 2012 | |
| Class 1 | | | | | | | | | | | | | | | | | | | | |
Per share operating performance
(for a share outstanding throughout the year) | | | | | | | | | | | | | | | | | | | | |
| | | | | |
Net asset value, beginning of year | | | $19.48 | | | | $22.91 | | | | $21.92 | | | | $17.45 | | | | $15.57 | |
| | | | |
| | | | | |
| Income from investment operationsa: | | | | | | | | | | | | | | | | | | | | |
| | | | | |
Net investment incomeb | | | 0.50 | | | | 0.44 | | | | 0.62 | c | | | 0.42 | | | | 0.35 | |
| | | | | |
Net realized and unrealized gains (losses) | | | 2.56 | | | | (1.54 | ) | | | 1.01 | | | | 4.52 | | | | 1.92 | |
| | | | |
Total from investment operations | | | 3.06 | | | | (1.10 | ) | | | 1.63 | | | | 4.94 | | | | 2.27 | |
| | | | |
| | | | | |
| Less distributions from: | | | | | | | | | | | | | | | | | | | | |
| | | | | |
Net investment income | | | (0.46 | ) | | | (0.77 | ) | | | (0.52 | ) | | | (0.47 | ) | | | (0.39 | ) |
| | | | | |
Net realized gains | | | (1.68 | ) | | | (1.56 | ) | | | (0.12 | ) | | | — | | | | — | |
| | | | |
Total distributions | | | (2.14 | ) | | | (2.33 | ) | | | (0.64 | ) | | | (0.47 | ) | | | (0.39 | ) |
| | | | |
Net asset value, end of year. | | | $20.40 | | | | $19.48 | | | | $22.91 | | | | $21.92 | | | | $17.45 | |
| | | | |
| | | | | |
Total returnd | | | 16.35% | | | | (4.69)% | | | | 7.38% | | | | 28.53% | | | | 14.61% | |
| | | | | |
| Ratios to average net assets | | | | | | | | | | | | | | | | | | | | |
| | | | | |
Expensese | | | 0.72% | f,g | | | 0.73%f | ,g | | | 0.73%f | | | | 0.71%f | | | | 0.71% | |
| | | | | |
Expenses incurred in connection with securities sold short | | | 0.01% | | | | 0.02% | | | | 0.03% | | | | —% | h | | | —% | h |
| | | | | |
Net investment income | | | 2.57% | | | | 2.00% | | | | 2.83% | c | | | 2.08% | | | | 2.06% | |
| | | | | |
| Supplemental data | | | | | | | | | | | | | | | | | | | | |
| | | | | |
Net assets, end of year (000’s) | | | $610,395 | | | | $643,438 | | | | $656,463 | | | | $552,163 | | | | $449,343 | |
| | | | | |
Portfolio turnover rate | | | 24.45% | | | | 19.88% | | | | 21.33% | | | | 24.05% | | | | 34.07% | i |
aThe amount shown for a share outstanding throughout the period may not correlate with the Statement of Operations for the period due to the timing of sales and repurchases of the Fund’s shares in relation to income earned and/or fluctuating fair value of the investments of the Fund.
bBased on average daily shares outstanding.
cNet investment income per share includes approximately $0.23 per share related to income received in the form of special dividends in connection with certain Fund holdings. Excluding this amount, the ratio of net investment income to average net assets would have been 1.79%.
dTotal return does not include fees, charges or expenses imposed by the variable annuity and life insurance contracts for which Franklin Templeton Variable Insurance Products Trust serves as an underlying investment vehicle.
eIncludes dividend and/or interest expense on securities sold short and security borrowing fees, if any. See below for the ratios of such expenses to average net assets for the periods presented. See Note 1(e).
fBenefit of expense reduction rounds to less than 0.01%.
gBenefit of waiver and payments by affiliates rounds to less than 0.01%.
hRounds to less than 0.01%.
iExcludes the value of portfolio securities delivered as a result of a redemption in-kind.
| | | | |
| MS-10 | | Annual Report | The accompanying notes are an integral part of these financial statements. | | |
FRANKLIN TEMPLETON VARIABLE INSURANCE PRODUCTS TRUST
FINANCIAL HIGHLIGHTS
Franklin Mutual Shares VIP Fund (continued)
| | | | | | | | | | | | | | | | | | | | |
| | | Year Ended December 31, | |
| | | 2016 | | | 2015 | | | 2014 | | | 2013 | | | 2012 | |
| Class 2 | | | | | | | | | | | | | | | | | | | | |
Per share operating performance
(for a share outstanding throughout the year) | | | | | | | | | | | | | | | | | | | | |
| | | | | |
Net asset value, beginning of year | | | $19.20 | | | | $22.60 | | | | $21.63 | | | | $17.23 | | | | $15.38 | |
| | | | |
| | | | | |
| Income from investment operationsa: | | | | | | | | | | | | | | | | | | | | |
| | | | | |
Net investment incomeb | | | 0.45 | | | | 0.38 | | | | 0.58 | c | | | 0.36 | | | | 0.30 | |
| | | | | |
Net realized and unrealized gains (losses) | | | 2.52 | | | | (1.51 | ) | | | 0.97 | | | | 4.46 | | | | 1.90 | |
| | | | |
Total from investment operations | | | 2.97 | | | | (1.13 | ) | | | 1.55 | | | | 4.82 | | | | 2.20 | |
| | | | |
| | | | | |
| Less distributions from: | | | | | | | | | | | | | | | | | | | | |
| | | | | |
Net investment income | | | (0.41 | ) | | | (0.71 | ) | | | (0.46 | ) | | | (0.42 | ) | | | (0.35 | ) |
| | | | | |
Net realized gains | | | (1.68 | ) | | | (1.56 | ) | | | (0.12 | ) | | | — | | | | — | |
| | | | |
Total distributions | | | (2.09 | ) | | | (2.27 | ) | | | (0.58 | ) | | | (0.42 | ) | | | (0.35 | ) |
| | | | |
Net asset value, end of year. | | | $20.08 | | | | $19.20 | | | | $22.60 | | | | $21.63 | | | | $17.23 | |
| | | | |
| | | | | |
Total returnd | | | 16.06% | | | | (4.94)% | | | | 7.12% | | | | 28.26% | | | | 14.24% | |
| | | | | |
| Ratios to average net assets | | | | | | | | | | | | | | | | | | | | |
| | | | | |
Expensese | | | 0.97% | f,g | | | 0.98% | f,g | | | 0.98% | f | | | 0.96% | f | | | 0.96% | |
| | | | | |
Expenses incurred in connection with securities sold short | | | 0.01% | | | | 0.02% | | | | 0.03% | | | | —% | h | | | —% | h |
| | | | | |
Net investment income | | | 2.32% | | | | 1.75% | | | | 2.58% | c | | | 1.83% | | | | 1.81% | |
| | | | | |
| Supplemental data | | | | | | | | | | | | | | | | | | | | |
| | | | | |
Net assets, end of year (000’s) | | | $3,621,358 | | | | $3,353,505 | | | | $4,218,342 | | | | $4,558,547 | | | | $4,069,803 | |
| | | | | |
Portfolio turnover rate | | | 24.45% | | | | 19.88% | | | | 21.33% | | | | 24.05% | | | | 34.07% | i |
aThe amount shown for a share outstanding throughout the period may not correlate with the Statement of Operations for the period due to the timing of sales and repurchases of the Fund’s shares in relation to income earned and/or fluctuating fair value of the investments of the Fund.
bBased on average daily shares outstanding.
cNet investment income per share includes approximately $0.23 per share related to income received in the form of special dividends in connection with certain Fund holdings. Excluding this amount, the ratio of net investment income to average net assets would have been 1.54%.
dTotal return does not include fees, charges or expenses imposed by the variable annuity and life insurance contracts for which Franklin Templeton Variable Insurance Products Trust serves as an underlying investment vehicle.
eIncludes dividend and/or interest expense on securities sold short and security borrowing fees, if any. See below for the ratios of such expenses to average net assets for the periods presented. See Note 1(e).
fBenefit of expense reduction rounds to less than 0.01%.
gBenefit of waiver and payments by affiliates rounds to less than 0.01%.
hRounds to less than 0.01%.
iExcludes the value of portfolio securities delivered as a result of a redemption in-kind.
| | | | | | |
| | | The accompanying notes are an integral part of these financial statements. | Annual Report | | | MS-11 | |
FRANKLIN TEMPLETON VARIABLE INSURANCE PRODUCTS TRUST
FINANCIAL HIGHLIGHTS
Franklin Mutual Shares VIP Fund (continued)
| | | | | | | | | | | | | | | | | | | | |
| | | Year Ended December 31, | |
| | | 2016 | | | 2015 | | | 2014 | | | 2013 | | | 2012 | |
| Class 4 | | | | | | | | | | | | | | | | | | | | |
Per share operating performance
(for a share outstanding throughout the year) | | | | | | | | | | | | | | | | | | | | |
| | | | | |
Net asset value, beginning of year | | | $19.32 | | | | $22.72 | | | | $21.74 | | | | $17.31 | | | | $15.45 | |
| | | | |
| | | | | |
| Income from investment operationsa: | | | | | | | | | | | | | | | | | | | | |
| | | | | |
Net investment incomeb | | | 0.44 | | | | 0.36 | | | | 0.57 | c | | | 0.34 | | | | 0.28 | |
| | | | | |
Net realized and unrealized gains (losses) | | | 2.53 | | | | (1.52 | ) | | | 0.96 | | | | 4.49 | | | | 1.91 | |
| | | | |
Total from investment operations | | | 2.97 | | | | (1.16 | ) | | | 1.53 | | | | 4.83 | | | | 2.19 | |
| | | | |
| | | | | |
| Less distributions from: | | | | | | | | | | | | | | | | | | | | |
| | | | | |
Net investment income | | | (0.38 | ) | | | (0.68 | ) | | | (0.43 | ) | | | (0.40 | ) | | | (0.33 | ) |
| | | | | |
Net realized gains | | | (1.68 | ) | | | (1.56 | ) | | | (0.12 | ) | | | — | | | | — | |
| | | | |
Total distributions | | | (2.06 | ) | | | (2.24 | ) | | | (0.55 | ) | | | (0.40 | ) | | | (0.33 | ) |
| | | | |
Net asset value, end of year. | | | $20.23 | | | | $19.32 | | | | $22.72 | | | | $21.74 | | | | $17.31 | |
| | | | |
| | | | | |
Total returnd | | | 15.94% | | | | (5.05)% | | | | 7.04% | | | | 28.05% | | | | 14.20% | |
| | | | | |
| Ratios to average net assets | | | | | | | | | | | | | | | | | | | | |
| | | | | |
Expensese | | | 1.07% | f,g | | | 1.08% | f,g | | | 1.08% | f | | | 1.06% | f | | | 1.06% | |
| | | | | |
Expenses incurred in connection with securities sold short | | | 0.01% | | | | 0.02% | | | | 0.03% | | | | —% | h | | | —% | h |
| | | | | |
Net investment income | | | 2.22% | | | | 1.65% | | | | 2.48%c | | | | 1.73% | | | | 1.71% | |
| | | | | |
| Supplemental data | | | | | | | | | | | | | | | | | | | | |
| | | | | |
Net assets, end of year (000’s) | | | $122,476 | | | | $130,978 | | | | $158,020 | | | | $188,153 | | | | $165,015 | |
| | | | | |
Portfolio turnover rate | | | 24.45% | | | | 19.88% | | | | 21.33% | | | | 24.05% | | | | 34.07% | i |
aThe amount shown for a share outstanding throughout the period may not correlate with the Statement of Operations for the period due to the timing of sales and repurchases of the Fund’s shares in relation to income earned and/or fluctuating fair value of the investments of the Fund.
bBased on average daily shares outstanding.
cNet investment income per share includes approximately $0.23 per share related to income received in the form of special dividends in connection with certain Fund holdings. Excluding this amount, the ratio of net investment income to average net assets would have been 1.44%.
dTotal return does not include fees, charges or expenses imposed by the variable annuity and life insurance contracts for which Franklin Templeton Variable Insurance Products Trust serves as an underlying investment vehicle.
eIncludes dividend and/or interest expense on securities sold short and security borrowing fees, if any. See below for the ratios of such expenses to average net assets for the periods presented. See Note 1(e).
fBenefit of expense reduction rounds to less than 0.01%.
gBenefit of waiver and payments by affiliates rounds to less than 0.01%.
hRounds to less than 0.01%.
iExcludes the value of portfolio securities delivered as a result of a redemption in-kind.
| | | | |
| MS-12 | | Annual Report | The accompanying notes are an integral part of these financial statements. | | |
FRANKLIN TEMPLETON VARIABLE INSURANCE PRODUCTS TRUST
Statement of Investments, December 31, 2016
| | | | | | | | | | | | | | |
Franklin Mutual Shares VIP Fund | | | | |
| | | | | Country | | | Shares/
Units | | | Value | |
| | | Common Stocks and Other Equity Interests 85.3% | | | | | | | | | |
| | Aerospace & Defense 0.8% | | | | | | | | | | | | |
| | B/E Aerospace Inc. | | | United States | | | | 403,812 | | | $ | 24,305,444 | |
| a | | KLX Inc. | | | United States | | | | 224,586 | | | | 10,131,075 | |
| | | | | | | | | | | | | | |
| | | | | | | | | | | | | 34,436,519 | |
| | | | | | | | | | | | | | |
| | Auto Components 0.8% | | | | | | | | | | | | |
| | The Goodyear Tire & Rubber Co. | | | United States | | | | 706,938 | | | | 21,823,176 | |
| a,b | | International Automotive Components Group Brazil LLC | | | Brazil | | | | 1,730,515 | | | | 42,581 | |
| a,b,c | | International Automotive Components Group North America LLC | | | United States | | | | 15,382,424 | | | | 11,442,985 | |
| | | | | | | | | | | | | | |
| | | | | | | | | | | | | 33,308,742 | |
| | | | | | | | | | | | | | |
| | Automobiles 1.4% | | | | | | | | | | | | |
| | General Motors Co. | | | United States | | | | 1,770,350 | | | | 61,678,994 | |
| | | | | | | | | | | | | | |
| | Banks 10.5% | | | | | | | | | | | | |
| | Barclays PLC | | | United Kingdom | | | | 10,534,300 | | | | 28,996,387 | |
| | CIT Group Inc. | | | United States | | | | 1,024,773 | | | | 43,737,312 | |
| | Citigroup Inc. | | | United States | | | | 970,749 | | | | 57,691,613 | |
| | Citizens Financial Group Inc. | | | United States | | | | 1,937,906 | | | | 69,047,591 | |
| a | | FCB Financial Holdings Inc., A | | | United States | | | | 493,723 | | | | 23,550,587 | |
| | Guaranty Bancorp | | | United States | | | | 209,583 | | | | 5,071,909 | |
| | JPMorgan Chase & Co. | | | United States | | | | 791,350 | | | | 68,285,591 | |
| | PNC Financial Services Group Inc. | | | United States | | | | 959,249 | | | | 112,193,763 | |
| | State Bank Financial Corp. | | | United States | | | | 352,200 | | | | 9,460,092 | |
| | Wells Fargo & Co. | | | United States | | | | 698,860 | | | | 38,514,175 | |
| | | | | | | | | | | | | | |
| | | | | | | | | | | | | 456,549,020 | |
| | | | | | | | | | | | | | |
| | Beverages 0.8% | | | | | | | | | | | | |
| | PepsiCo Inc. | | | United States | | | | 343,132 | | | | 35,901,901 | |
| | | | | | | | | | | | | | |
| | Chemicals 1.0% | | | | | | | | | | | | |
| a,d,e | | Dow Corning Corp., Contingent Distribution | | | United States | | | | 100,000 | | | | — | |
| | Monsanto Co. | | | United States | | | | 405,580 | | | | 42,671,072 | |
| | | | | | | | | | | | | | |
| | | | | | | | | | | | | 42,671,072 | |
| | | | | | | | | | | | | | |
| | Communications Equipment 2.3% | | | | | | | | | | | | |
| | Cisco Systems Inc. | | | United States | | | | 2,261,380 | | | | 68,338,904 | |
| | Nokia OYJ, A | | | Finland | | | | 3,670,248 | | | | 17,718,098 | |
| | Nokia OYJ, ADR | | | Finland | | | | 3,299,845 | | | | 15,872,254 | |
| | | | | | | | | | | | | | |
| | | | | | | | | | | | | 101,929,256 | |
| | | | | | | | | | | | | | |
| | Construction Materials 0.7% | | | | | | | | | | | | |
| | LafargeHolcim Ltd., B | | | Switzerland | | | | 547,060 | | | | 28,819,490 | |
| | | | | | | | | | | | | | |
| | Consumer Finance 1.3% | | | | | | | | | | | | |
| | Ally Financial Inc. | | | United States | | | | 943,970 | | | | 17,954,309 | |
| | Capital One Financial Corp. | | | United States | | | | 436,885 | | | | 38,113,848 | |
| | | | | | | | | | | | | | |
| | | | | | | | | | | | | 56,068,157 | |
| | | | | | | | | | | | | | |
| | Containers & Packaging 2.3% | | | | | | | | | | | | |
| | International Paper Co. | | | United States | | | | 1,163,335 | | | | 61,726,555 | |
| | WestRock Co. | | | United States | | | | 742,632 | | | | 37,703,427 | |
| | | | | | | | | | | | | | |
| | | | | | | | | | | | | 99,429,982 | |
| | | | | | | | | | | | | | |
| | Diversified Financial Services 0.9% | | | | | | | | | | | | |
| | Voya Financial Inc. | | | United States | | | | 959,810 | | | | 37,643,748 | |
| | | | | | | | | | | | | | |
| | Diversified Telecommunication Services 0.6% | | | | | | | | | | | | |
| | Koninklijke KPN NV | | | Netherlands | | | | 8,378,890 | | | | 24,808,977 | |
| | | | | | | | | | | | | | |
FRANKLIN TEMPLETON VARIABLE INSURANCE PRODUCTS TRUST
STATEMENT OF INVESTMENTS
Franklin Mutual Shares VIP Fund (continued)
| | | | | | | | | | | | | | |
| | | | | Country | | | Shares/
Units | | | Value | |
| | | Common Stocks and Other Equity Interests (continued) | | | | | | | | | |
| | | Electric Utilities 0.8% | | | | | | | | | |
| | Vistra Energy Corp. | | | United States | | | | 2,184,095 | | | $ | 33,853,473 | |
| | | | | | | | | | | | | | |
| | | Electrical Equipment 1.0% | | | | | | | | | |
| a | | Sensata Technologies Holding NV | | | United States | | | | 1,104,530 | | | | 43,021,444 | |
| | | | | | | | | | | | | | |
| | | Energy Equipment & Services 1.6% | | | | | | | | | |
| | Baker Hughes Inc. | | | United States | | | | 1,047,955 | | | | 68,085,636 | |
| | | | | | | | | | | | | | |
| | | Equity Real Estate Investment Trusts (REITs) 0.4% | | | | | | | | | |
| | Alexander’s Inc. | | | United States | | | | 40,126 | | | | 17,128,586 | |
| | | | | | | | | | | | | | |
| | | Food & Staples Retailing 4.8% | | | | | | | | | |
| | CVS Health Corp. | | | United States | | | | 821,861 | | | | 64,853,051 | |
| | The Kroger Co. | | | United States | | | | 2,049,600 | | | | 70,731,696 | |
| a | | Rite Aid Corp. | | | United States | | | | 2,439,970 | | | | 20,105,353 | |
| | Walgreens Boots Alliance Inc. | | | United States | | | | 654,058 | | | | 54,129,840 | |
| | | | | | | | | | | | | | |
| | | | | | | | | | | | | 209,819,940 | |
| | | | | | | | | | | | | | |
| | | Health Care Equipment & Supplies 5.5% | | | | | | | | | |
| | Medtronic PLC. | | | United States | | | | 1,677,282 | | | | 119,472,797 | |
| | St. Jude Medical Inc. | | | United States | | | | 647,790 | | | | 51,946,280 | |
| | Stryker Corp. | | | United States | | | | 556,291 | | | | 66,649,225 | |
| | | | | | | | | | | | | | |
| | | | | | | | | | | | | 238,068,302 | |
| | | | | | | | | | | | | | |
| | | Health Care Providers & Services 0.4% | | | | | | | | | |
| | Cigna Corp. | | | United States | | | | 142,154 | | | | 18,961,922 | |
| | | | | | | | | | | | | | |
| | | Household Products 0.2% | | | | | | | | | |
| | Energizer Holdings Inc. | | | United States | | | | 196,162 | | | | 8,750,787 | |
| | | | | | | | | | | | | | |
| | | Insurance 8.9% | | | | | | | | | |
| a | | Alleghany Corp. | | | United States | | | | 108,258 | | | | 65,833,855 | |
| | American International Group Inc. | | | United States | | | | 1,412,416 | | | | 92,244,889 | |
| | Chubb Ltd. | | | United States | | | | 335,835 | | | | 44,370,520 | |
| | The Hartford Financial Services Group Inc. | | | United States | | | | 200,039 | | | | 9,531,858 | |
| | MetLife Inc. | | | United States | | | | 1,019,123 | | | | 54,920,539 | |
| | White Mountains Insurance Group Ltd. | | | United States | | | | 65,521 | | | | 54,778,832 | |
| | XL Group Ltd. | | | Ireland | | | | 1,746,940 | | | | 65,090,984 | |
| | | | | | | | | | | | | | |
| | | | | | | | | | | | | 386,771,477 | |
| | | | | | | | | | | | | | |
| | | IT Services 0.8% | | | | | | | | | |
| a | | Cognizant Technology Solutions Corp., A | | | United States | | | | 626,430 | | | | 35,098,873 | |
| | | | | | | | | | | | | | |
| | | Machinery 2.1% | | | | | | | | | |
| | Caterpillar Inc. | | | United States | | | | 622,346 | | | | 57,716,368 | |
| | CNH Industrial NV | | | United Kingdom | | | | 888,427 | | | | 7,726,145 | |
| | CNH Industrial NV, special voting | | | United Kingdom | | | | 1,844,814 | | | | 16,043,301 | |
| | Federal Signal Corp. | | | United States | | | | 740,849 | | | | 11,564,653 | |
| | | | | | | | | | | | | | |
| | | | | | | | | | | | | 93,050,467 | |
| | | | | | | | | | | | | | |
| | | Marine 0.9% | | | | | | | | | |
| | A.P. Moeller-Maersk AS, B | | | Denmark | | | | 25,002 | | | | 39,886,831 | |
| | | | | | | | | | | | | | |
| | | Media 4.7% | | | | | | | | | |
| a | | Charter Communications Inc., A | | | United States | | | | 244,513 | | | | 70,400,183 | |
| a | | DISH Network Corp., A | | | United States | | | | 778,183 | | | | 45,080,141 | |
| | Time Warner Inc. | | | United States | | | | 918,888 | | | | 88,700,259 | |
| | | | | | | | | | | | | | |
| | | | | | | | | | | | | 204,180,583 | |
| | | | | | | | | | | | | | |
FRANKLIN TEMPLETON VARIABLE INSURANCE PRODUCTS TRUST
STATEMENT OF INVESTMENTS
Franklin Mutual Shares VIP Fund (continued)
| | | | | | | | | | | | | | |
| | | | | Country | | | Shares/
Units | | | Value | |
| | | Common Stocks and Other Equity Interests (continued) | | | | | | | | | |
| | | Metals & Mining 0.6% | | | | | | | | | |
| | ThyssenKrupp AG | | | Germany | | | | 1,147,037 | | | $ | 27,324,494 | |
| | | | | | | | | | | | | | |
| | | Oil, Gas & Consumable Fuels 6.7% | | | | | | | | | |
| | Apache Corp. | | | United States | | | | 171,929 | | | | 10,912,333 | |
| | BP PLC | | | United Kingdom | | | | 4,322,322 | | | | 27,133,411 | |
| | CONSOL Energy Inc. | | | United States | | | | 1,236,955 | | | | 22,549,690 | |
| | Kinder Morgan Inc. | | | United States | | | | 2,649,790 | | | | 54,877,151 | |
| | Marathon Oil Corp. | | | United States | | | | 3,158,398 | | | | 54,671,869 | |
| | Royal Dutch Shell PLC, A (EUR Traded) | | | United Kingdom | | | | 1,916,196 | | | | 52,391,512 | |
| | Royal Dutch Shell PLC, A (GBP Traded) | | | United Kingdom | | | | 1,048,110 | | | | 28,953,240 | |
| a,b,c | | Warrior Met Coal LLC, A | | | United States | | | | 12,324 | | | | 4,005,300 | |
| a,b,c | | Warrior Met Coal LLC, B | | | United States | | | | 28,821 | | | | 9,366,825 | |
| | The Williams Cos. Inc. | | | United States | | | | 845,109 | | | | 26,316,694 | |
| | | | | | | | | | | | | | |
| | | | | | | | | | | | | 291,178,025 | |
| | | | | | | | | | | | | | |
| | | Personal Products 0.1% | | | | | | | | | |
| a | | Edgewell Personal Care Co. | | | United States | | | | 61,560 | | | | 4,493,264 | |
| | | | | | | | | | | | | | |
| | | Pharmaceuticals 7.6% | | | | | | | | | |
| | Eli Lilly & Co. | | | United States | | | | 1,274,136 | | | | 93,712,703 | |
| | Merck & Co. Inc. | | | United States | | | | 2,122,688 | | | | 124,962,643 | |
| | Novartis AG, ADR | | | Switzerland | | | | 976,201 | | | | 71,106,481 | |
| | Teva Pharmaceutical Industries Ltd., ADR | | | Israel | | | | 1,169,793 | | | | 42,404,996 | |
| | | | | | | | | | | | | | |
| | | | | | | | | | | | | 332,186,823 | |
| | | | | | | | | | | | | | |
| | | Professional Services 0.7% | | | | | | | | | |
| | Relx PLC | | | United Kingdom | | | | 1,838,555 | | | | 32,817,301 | |
| | | | | | | | | | | | | | |
| | | Real Estate Management & Development 0.0%† | | | | | | | | | |
| a | | Forestar Group Inc. | | | United States | | | | 134,440 | | | | 1,788,052 | |
| | | | | | | | | | | | | | |
| | | Software 6.0% | | | | | | | | | |
| | CA Inc. | | | United States | | | | 1,584,119 | | | | 50,327,461 | |
| a | | Dell Technologies Inc., V | | | United States | | | | 198,331 | | | | 10,902,255 | |
| | Microsoft Corp. | | | United States | | | | 1,933,267 | | | | 120,133,211 | |
| | Symantec Corp. | | | United States | | | | 3,419,061 | | | | 81,681,367 | |
| | | | | | | | | | | | | | |
| | | | | | | | | | | | | 263,044,294 | |
| | | | | | | | | | | | | | |
| | | Technology Hardware, Storage & Peripherals 2.2% | | | | | | | | | |
| | Hewlett Packard Enterprise Co. | | | United States | | | | 1,418,347 | | | | 32,820,550 | |
| | Samsung Electronics Co. Ltd. | | | South Korea | | | | 41,741 | | | | 62,304,386 | |
| | | | | | | | | | | | | | |
| | | | | | | | | | | | | 95,124,936 | |
| | | | | | | | | | | | | | |
| | | Tobacco 5.4% | | | | | | | | | |
| | Altria Group Inc. | | | United States | | | | 788,721 | | | | 53,333,314 | |
| | British American Tobacco PLC | | | United Kingdom | | | | 1,220,767 | | | | 69,498,206 | |
| | Imperial Brands PLC | | | United Kingdom | | | | 1,059,777 | | | | 46,246,855 | |
| | Philip Morris International Inc. | | | United States | | | | 187,960 | | | | 17,196,460 | |
| | Reynolds American Inc. | | | United States | | | | 889,694 | | | | 49,858,452 | |
| | | | | | | | | | | | | | |
| | | | | | | | | | | | | 236,133,287 | |
| | | | | | | | | | | | | | |
| | | Wireless Telecommunication Services 0.5% | | | | | | | | | |
| | Vodafone Group PLC | | | United Kingdom | | | | 8,229,954 | | | | 20,260,932 | |
| | | | | | | | | | | | | | |
| | | | |
| | Total Common Stocks and Other Equity Interests
(Cost $2,766,623,126) | | | | | | | | | | | 3,714,275,587 | |
| | | | | | | | | | | | | | |
FRANKLIN TEMPLETON VARIABLE INSURANCE PRODUCTS TRUST
STATEMENT OF INVESTMENTS
Franklin Mutual Shares VIP Fund (continued)
| | | | | | | | | | | | | | |
| | | | | Country | | | Principal Amount | | | Value | |
| | | Corporate Bonds, Notes and Senior Floating Rate
Interests 4.7% | | | | | | | | | |
| c | | Avaya Inc., | | | | | | | | | | | | |
| | f senior note, 144A, 10.50%, 3/01/21 | | | United States | | | $ | 22,449,000 | | | $ | 9,765,315 | |
| | f senior secured note, 144A, 7.00%, 4/01/19 | | | United States | | | | 12,923,000 | | | | 11,372,240 | |
| | g,h Term B-3 Loan, 5.39%, 10/26/17 | | | United States | | | | 12,791,927 | | | | 11,232,911 | |
| | g,h Term B-6 Loan, 6.50%, 3/30/18 | | | United States | | | | 6,741,721 | | | | 5,896,903 | |
| | g,h Term B-7 Loan, 6.25%, 5/29/20 | | | United States | | | | 6,402,619 | | | | 5,573,480 | |
| g,h | | Belk Inc., Closing Date Term Loan, 5.75%, 12/12/22 | | | United States | | | | 5,771,068 | | | | 5,001,594 | |
| | CHS/Community Health Systems Inc., | | | | | | | | | | | | |
| | senior note, 7.125%, 7/15/20 | | | United States | | | | 5,205,000 | | | | 3,983,387 | |
| | senior note, 6.875%, 2/01/22 | | | United States | | | | 7,784,000 | | | | 5,448,800 | |
| | iHeartCommunications Inc., | | | | | | | | | | | | |
| | senior secured note, first lien, 9.00%, 12/15/19 | | | United States | | | | 26,449,000 | | | | 21,721,241 | |
| | g,h Tranche D Term Loan, 7.52%, 1/30/19 | | | United States | | | | 34,746,619 | | | | 28,347,439 | |
| | g,h Tranche E Term Loan, 8.27%, 7/30/19 | | | United States | | | | 11,168,253 | | | | 9,185,888 | |
| g,h | | Toys R Us-Delaware Inc., | | | | | | | | | | | | |
| | FILO Loans, 8.25%, 10/24/19 | | | United States | | | | 2,560,000 | | | | 2,528,000 | |
| | Term B-4 Loan, 9.75%, 4/24/20 | | | United States | | | | 21,241,837 | | | | 18,675,122 | |
| f | | Valeant Pharmaceuticals International, | | | | | | | | | | | | |
| | senior bond, 144A, 6.75%, 8/15/21 | | | United States | | | | 2,964,000 | | | | 2,474,940 | |
| | senior bond, 144A, 7.25%, 7/15/22 | | | United States | | | | 1,460,000 | | | | 1,200,850 | |
| | senior note, 144A, 6.375%, 10/15/20 | | | United States | | | | 18,570,000 | | | | 16,045,594 | |
| f | | Valeant Pharmaceuticals International Inc., | | | | | | | | | | | | |
| | senior note, 144A, 5.375%, 3/15/20 | | | United States | | | | 821,000 | | | | 697,850 | |
| | senior note, 144A, 7.50%, 7/15/21 | | | United States | | | | 4,600,000 | | | | 3,915,750 | |
| | senior note, 144A, 5.625%, 12/01/21 | | | United States | | | | 2,054,000 | | | | 1,602,120 | |
| g,h | | Veritas Software Corp., | | | | | | | | | | | | |
| | Term Loan B1, 6.625%, 1/27/23 | | | United States | | | | 12,564,058 | | | | 11,626,992 | |
| | Term Loan B2, 8.625%, 1/27/23 | | | United States | | | | 12,129,599 | | | | 10,883,282 | |
| f | | Veritas U.S. Inc./Veritas Bermuda Ltd., | | | | | | | | | | | | |
| | senior note, 144A, 7.50%, 2/01/23 | | | United States | | | | 2,386,000 | | | | 2,236,875 | |
| | senior note, 144A, 10.50%, 2/01/24 | | | United States | | | | 15,122,000 | | | | 13,855,533 | |
| | | | | | | | | | | | | | |
| | | | |
| | Total Corporate Bonds, Notes and Senior Floating Rate Interests (Cost $225,691,387) | | | | | | | | | | | 203,272,106 | |
| | | | | | | | | | | | | | |
| | Corporate Notes and Senior Floating Rate Interests in Reorganization 0.7% | | | | | | | | | | | | |
| b,i | | Broadband Ventures III LLC, secured promissory note, 5.00%, 2/01/12 | | | United States | | | | 1,754 | | | | — | |
| g,h,i | | Caesars Entertainment Operating Co. Inc., | | | | | | | | | | | | |
| | Term B-5-B Loans, 1.50%, 3/01/17 | | | United States | | | | 3,069,560 | | | | 3,325,868 | |
| | Term B-6-B Loans, 1.50%, 3/01/17 | | | United States | | | | 14,634,842 | | | | 16,208,087 | |
| | Term B-7 Loans, 1.50%, 3/01/17 | | | United States | | | | 9,298,589 | | | | 10,885,086 | |
| i | | Samson Investment Co., senior note, 9.75%, 2/15/20 | | | United States | | | | 16,690,000 | | | | 897,088 | |
| | | | | | | | | | | | | | |
| | | | |
| | Total Corporate Notes and Senior Floating Rate Interests in Reorganization (Cost $31,721,846) | | | | | | | | | | | 31,316,129 | |
| | | | | | | | | | | | | | |
FRANKLIN TEMPLETON VARIABLE INSURANCE PRODUCTS TRUST
STATEMENT OF INVESTMENTS
Franklin Mutual Shares VIP Fund (continued)
| | | | | | | | | | | | | | |
| | | | | Country | | | Shares | | | Value | |
| | | Companies in Liquidation 0.2% | | | | | | | | | |
| a | | Adelphia Recovery Trust. | | | United States | | | | 29,283,354 | | | $ | 17,570 | |
| a,d | | Adelphia Recovery Trust, Arahova Contingent Value Vehicle, Contingent Distribution | | | United States | | | | 1,955,453 | | | | 19,555 | |
| a,b,c,j | | CB FIM Coinvestors LLC | | | United States | | | | 6,400,507 | | | | — | |
| a,d,e | | Century Communications Corp., Contingent Distribution | | | United States | | | | 5,487,000 | | | | — | |
| a,b | | FIM Coinvestor Holdings I, LLC | | | United States | | | | 8,006,950 | | | | — | |
| a,k | | Lehman Brothers Holdings Inc., Bankruptcy Claim | | | United States | | | | 144,058,799 | | | | 4,906,643 | |
| a,d,e | | Tribune Media Litigation Trust, Contingent Distribution | | | United States | | | | 394,551 | | | | — | |
| a,d,e | | Tropicana Litigation Trust, Contingent Distribution | | | United States | | | | 18,305,000 | | | | — | |
| a,e | | Vistra Energy Corp., Litigation Trust | | | United States | | | | 129,926,405 | | | | 1,507,146 | |
| a | | Vistra Energy Corp., Litigation Trust, TRA | | | United States | | | | 2,184,095 | | | | 3,166,938 | |
| | | | | | | | | | | | | | |
| | Total Companies in Liquidation (Cost $24,880,548) | | | | | | | | | | | 9,617,852 | |
| | | | | | | | | | | | | | |
| | | | |
| | | | | | | | Principal Amount | | | | |
| | Municipal Bonds in Reorganization
(Cost $17,936,642) 0.3% | | | | | | | | | | | | |
| i | | Puerto Rico Commonwealth GO, Refunding, Series A, 8.00%, 7/01/35 | | | United States | | | $ | 20,409,000 | | | | 13,776,075 | |
| | | | | | | | | | | | | | |
| | | | |
| | Total Investments before Short Term Investments
(Cost $3,066,853,549) | | | | | | | | | | | 3,972,257,749 | |
| | | | | | | | | | | | | | |
| | Short Term Investments 8.5% | | | | | | | | | | | | |
| | U.S. Government and Agency Securities 8.5% | | | | | | | | | | | | |
| l | | FHLB, 1/03/17 | | | United States | | | | 58,500,000 | | | | 58,500,000 | |
| l | | U.S. Treasury Bill, | | | | | | | | | | | | |
| | 1/05/17 | | | United States | | | | 45,000,000 | | | | 44,999,235 | |
| | m 4/27/17 | | | United States | | | | 33,000,000 | | | | 32,943,834 | |
| | 1/19/17 - 6/15/17 | | | United States | | | | 232,500,000 | | | | 232,183,745 | |
| | | | | | | | | | | | | | |
| | | | |
| | Total U.S. Government and Agency Securities
(Cost $368,626,751) | | | | | | | | | | | 368,626,814 | |
| | | | | | | | | | | | | | |
| | | | |
| | Total Investments (Cost $3,435,480,300) 99.7% | | | | | | | | | | | 4,340,884,563 | |
| | Securities Sold Short (0.5)% | | | | | | | | | | | (21,666,889 | ) |
| | Other Assets, less Liabilities 0.8% | | | | | | | | | | | 35,010,423 | |
| | | | | | | | | | | | | | |
| | Net Assets 100.0% | | | | | | | | | | $ | 4,354,228,097 | |
| | | | | | | | | | | | | | |
| | | | |
| | | | | | | | Shares | | | | |
| n | | Securities Sold Short (Proceeds $21,743,820) (0.5)% | | | | | | | | | | | | |
| | | Common Stocks (0.5)% | | | | | | | | | |
| | | Health Care Equipment & Supplies (0.5)% | | | | | | | | | |
| | Abbott Laboratories | | | United States | | | | 564,095 | | | $ | (21,666,889 | ) |
| | | | | | | | | | | | | | |
FRANKLIN TEMPLETON VARIABLE INSURANCE PRODUCTS TRUST
STATEMENT OF INVESTMENTS
Franklin Mutual Shares VIP Fund (continued)
†Rounds to less than 0.1% of net assets.
aNon-income producing.
bSee Note 8 regarding restricted securities.
cAt December 31, 2016, pursuant to the Fund’s policies and the requirements of applicable securities law, the Fund is restricted from trading these securities at year end.
dContingent distributions represent the right to receive additional distributions, if any, during the reorganization of the underlying company. Shares represent total underlying principal of debt securities.
eSecurity has been deemed illiquid because it may not be able to be sold within seven days. At December 31, 2016, the aggregate value of these securities was $1,507,147, representing less than 0.1% of net assets.
fSecurity was purchased pursuant to Rule 144A under the Securities Act of 1933 and may be sold in transactions exempt from registration only to qualified institutional buyers or in a public offering registered under the Securities Act of 1933. These securities have been deemed liquid under guidelines approved by the Trust’s Board of Trustees. At December 31, 2016, the aggregate value of these securities was $63,167,067, representing 1.5% of net assets.
gThe coupon rate shown represents the rate at period end.
hSee Note 1(g) regarding senior floating rate interests.
iSee Note 7 regarding credit risk and defaulted securities.
jSee Note 11 regarding holdings of 5% voting securities.
kBankruptcy claims represent the right to receive distributions, if any, during the liquidation of the underlying pool of assets. Shares represent amount of allowed unsecured claims.
l The security was issued on a discount basis with no stated coupon rate.
mA portion or all of the security has been segregated as collateral for securities sold short and open forward contracts,. At December 31, 2016, the aggregate value of this security and/or cash pledged amounted to $33,352,843, representing 0.8% of net assets.
nSee Note 1(e) regarding securities sold short.
FRANKLIN TEMPLETON VARIABLE INSURANCE PRODUCTS TRUST
STATEMENT OF INVESTMENTS
Franklin Mutual Shares VIP Fund (continued)
At December 31, 2016, the Fund had the following futures contracts outstanding. See Note 1(c).
Futures Contracts
| | | | | | | | | | | | | | | | | | | | | | | | |
| Description | | Type | | | Number of
Contracts | | | Notional
Value | | | Expiration
Date | | | Unrealized
Appreciation | | | Unrealized
Depreciation | |
| Currency Contracts | | | | | | | | | | | | | | | | | | | | | | | | |
EUR/USD | | | Short | | | | 478 | | | $ | 63,179,650 | | | | 3/13/17 | | | $ | 237,863 | | | $ | — | |
GBP/USD | | | Short | | | | 1,341 | | | | 103,575,488 | | | | 3/13/17 | | | | 2,387,234 | | | | — | |
| | | | | | | | | | | | | | | | | | | | |
Total Futures Contracts | | | $ | 2,625,097 | | | $ | — | |
| | | | | | | | | | | | | | | | | | | | |
Net unrealized appreciation (depreciation) | | | $ | 2,625,097 | | | | | |
| | | | | | | | | | | | | | | | | | | | | | | | |
At December 31, 2016, the Fund had the following forward exchange contracts outstanding. See Note 1(c).
| | | | | | | | | | | | | | | | | | | | | | | | | | | | |
| Forward Exchange Contracts | |
| Currency | | | Counterparty | a | | | Type | | | | Quantity | | |
| Contract
Amount |
| |
| Settlement
Date |
| |
| Unrealized
Appreciation |
| |
| Unrealized
Depreciation |
|
| OTC Forward Exchange Contracts | | | | | | | | | | | | | |
South Korean Won | | | FBCO | | | | Sell | | | | 11,986,729,554 | | | $ | 10,445,154 | | | | 1/13/17 | | | $ | 517,757 | | | $ | — | |
South Korean Won | | | HSBC | | | | Buy | | | | 1,537,321,030 | | | | 1,313,506 | | | | 1/13/17 | | | | — | | | | (40,298 | ) |
South Korean Won | | | HSBC | | | | Sell | | | | 59,105,646,009 | | | | 51,599,594 | | | | 1/13/17 | | | | 2,648,360 | | | | — | |
South Korean Won | | | UBSW | | | | Sell | | | | 4,040,589,617 | | | | 3,469,710 | | | | 1/13/17 | | | | 123,298 | | | | — | |
British Pound | | | HSBC | | | | Sell | | | | 641,795 | | | | 796,519 | | | | 2/13/17 | | | | 5,003 | | | | — | |
British Pound | | | SSBT | | | | Sell | | | | 298,070 | | | | 365,850 | | | | 2/13/17 | | | | — | | | | (1,756 | ) |
British Pound | | | SSBT | | | | Sell | | | | 2,131,430 | | | | 2,636,385 | | | | 2/13/17 | | | | 7,723 | | | | — | |
British Pound | | | UBSW | | | | Sell | | | | 68,325,933 | | | | 85,208,033 | | | | 2/13/17 | | | | 942,692 | | | | — | |
Euro | | | BOFA | | | | Sell | | | | 451,824 | | | | 471,571 | | | | 2/17/17 | | | | �� | | | | (5,004 | ) |
Euro | | | BONY | | | | Sell | | | | 623,503 | | | | 652,125 | | | | 2/17/17 | | | | — | | | | (5,532 | ) |
Euro | | | HSBC | | | | Sell | | | | 40,003,872 | | | | 41,811,060 | | | | 2/17/17 | | | | — | | | | (384,138 | ) |
Euro | | | SSBT | | | | Sell | | | | 40,617,420 | | | | 42,451,643 | | | | 2/17/17 | | | | — | | | | (390,713 | ) |
Euro | | | UBSW | | | | Sell | | | | 692,606 | | | | 726,131 | | | | 2/17/17 | | | | — | | | | (4,414 | ) |
| | | | | | | | | | | | | | | | | | | | | | | | |
Total Forward Exchange Contracts | | | $ | 4,244,833 | | | $ | (831,855 | ) |
| | | | | | | | | | | | | | | | | | | | | | | | |
Net unrealized appreciation (depreciation) | | | $ | 3,412,978 | | | | | |
| | | | | | | | | | | | | | | | | | | | | | | | | | | | |
aMay be comprised of multiple contracts with the same counterparty, currency and settlement date.
| | | | | | |
| | | The accompanying notes are an integral part of these financial statements. | Annual Report | | | MS-19 | |
FRANKLIN TEMPLETON VARIABLE INSURANCE PRODUCTS TRUST
Financial Statements
Statement of Assets and Liabilities
December 31, 2016
| | | | |
| | | Franklin Mutual
Shares VIP Fund | |
Assets: | | | | |
Investments in securities: | | | | |
Cost | | $ | 3,435,480,300 | |
| | | | |
Value | | $ | 4,340,884,563 | |
Cash | | | 940,000 | |
Restricted Cash (Note 1d) | | | 1,700,000 | |
Foreign currency, at value (cost $2,275,175) | | | 2,281,954 | |
Receivables: | | | | |
Investment securities sold | | | 3,740 | |
Capital shares sold | | | 353,287 | |
Dividends and interest | | | 9,882,022 | |
European Union tax reclaims | | | 1,081,676 | |
Due from brokers | | | 27,670,860 | |
Unrealized appreciation on OTC forward exchange contracts | | | 4,244,833 | |
Other assets | | | 336 | |
| | | | |
Total assets | | | 4,389,043,271 | |
| | | | |
Liabilities: | | | | |
Payables: | | | | |
Investment securities purchased | | | 1,681,583 | |
Capital shares redeemed | | | 2,765,895 | |
Management fees | | | 2,556,529 | |
Distribution fees | | | 1,563,663 | |
Variation margin | | | 1,020,700 | |
Securities sold short, at value (proceeds $21,743,820) | | | 21,666,889 | |
Due to brokers | | | 2,260,000 | |
Unrealized depreciation on OTC forward exchange contracts | | | 831,855 | |
Accrued expenses and other liabilities | | | 468,060 | |
| | | | |
Total liabilities | | | 34,815,174 | |
| | | | |
Net assets, at value | | $ | 4,354,228,097 | |
| | | | |
Net assets consist of: | | | | |
Paid-in capital | | $ | 3,206,196,597 | |
Undistributed net investment income | | | 88,221,627 | |
Net unrealized appreciation (depreciation) | | | 911,378,499 | |
Accumulated net realized gain (loss) | | | 148,431,374 | |
| | | | |
Net assets, at value | | $ | 4,354,228,097 | |
| | | | |
| |
| Class 1: | | | | |
Net assets, at value | | $ | 610,394,885 | |
| | | | |
Shares outstanding | | | 29,922,939 | |
| | | | |
Net asset value and maximum offering price per share | | $ | 20.40 | |
| | | | |
| |
| Class 2: | | | | |
Net assets, at value | | $ | 3,621,357,603 | |
| | | | |
Shares outstanding | | | 180,338,218 | |
| | | | |
Net asset value and maximum offering price per share | | $ | 20.08 | |
| | | | |
| |
| Class 4: | | | | |
Net assets, at value | | $ | 122,475,609 | |
| | | | |
Shares outstanding | | | 6,053,370 | |
| | | | |
Net asset value and maximum offering price per share | | $ | 20.23 | |
| | | | |
| | | | |
| MS-20 | | Annual Report | The accompanying notes are an integral part of these financial statements. | | |
FRANKLIN TEMPLETON VARIABLE INSURANCE PRODUCTS TRUST
FINANCIAL STATEMENTS
Statement of Operations
for the year ended December 31, 2016
| | | | |
| | | Franklin Mutual
Shares VIP Fund | |
Investment income: | | | | |
Dividends | | $ | 106,559,236 | |
Interest | | | 28,371,938 | |
Income from securities loaned (net of fees and rebates) | | | 464,600 | |
| | | | |
Total investment income | | | 135,395,774 | |
| | | | |
Expenses: | | | | |
Management fees (Note 3a) | | | 28,389,916 | |
Distribution fees: (Note 3c) | | | | |
Class 2 | | | 8,550,276 | |
Class 4 | | | 433,440 | |
Custodian fees (Note 4) | | | 108,057 | |
Reports to shareholders | | | 332,731 | |
Registration and filing fees | | | 4,213 | |
Professional fees | | | 298,945 | |
Trustees’ fees and expenses | | | 19,113 | |
Dividends and/or interest on securities sold short | | | 352,544 | |
Other | | | 64,558 | |
| | | | |
Total expenses | | | 38,553,793 | |
Expense reductions (Note 4) | | | (6,191 | ) |
Expenses waived/paid by affiliates (Note 3e) | | | (9,175 | ) |
| | | | |
Net expenses | | | 38,538,427 | |
| | | | |
Net investment income | | | 96,857,347 | |
| | | | |
Realized and unrealized gains (losses): | | | | |
Net realized gain (loss) from: | | | | |
Investments | | | 125,221,459 | |
Foreign currency transactions | | | 28,983,743 | |
Futures contracts | | | 23,600,083 | |
Securities sold short | | | (763,869 | ) |
| | | | |
Net realized gain (loss) | | | 177,041,416 | |
| | | | |
Net change in unrealized appreciation (depreciation) on: | | | | |
Investments | | | 342,676,781 | |
Translation of other assets and liabilities denominated in foreign currencies | | | (1,794,674 | ) |
Futures contracts | | | (637,142 | ) |
| | | | |
Net change in unrealized appreciation (depreciation) | | | 340,244,965 | |
| | | | |
Net realized and unrealized gain (loss) | | | 517,286,381 | |
| | | | |
Net increase (decrease) in net assets resulting from operations | | $ | 614,143,728 | |
| | | | |
| | | | | | |
| | | The accompanying notes are an integral part of these financial statements. | Annual Report | | | MS-21 | |
FRANKLIN TEMPLETON VARIABLE INSURANCE PRODUCTS TRUST
FINANCIAL STATEMENTS
Statements of Changes in Net Assets
| | | | | | | | |
| | | Franklin Mutual Shares VIP Fund | |
| | | Year Ended December 31, | |
| | | 2016 | | | 2015 | |
Increase (decrease) in net assets: | | | | | | | | |
Operations: | | | | | | | | |
Net investment income | | $ | 96,857,347 | | | $ | 84,027,000 | |
Net realized gain (loss) | | | 177,041,416 | | | | 361,237,169 | |
Net change in unrealized appreciation (depreciation) | | | 340,244,965 | | | | (663,206,334 | ) |
| | | | |
Net increase (decrease) in net assets resulting from operations | | | 614,143,728 | | | | (217,942,165 | ) |
| | | | |
Distributions to shareholders from: | | | | | | | | |
Net investment income: | | | | | | | | |
Class 1 | | | (12,783,421 | ) | | | (22,253,593 | ) |
Class 2 | | | (69,990,186 | ) | | | (115,505,343 | ) |
Class 4 | | | (2,230,613 | ) | | | (4,240,573 | ) |
Net realized gains: | | | | | | | | |
Class 1 | | | (46,218,042 | ) | | | (44,812,385 | ) |
Class 2 | | | (288,327,268 | ) | | | (254,851,880 | ) |
Class 4 | | | (9,935,345 | ) | | | (9,773,474 | ) |
| | | | |
Total distributions to shareholders | | | (429,484,875 | ) | | | (451,437,248 | ) |
| | | | |
Capital share transactions: (Note 2) | | | | | | | | |
Class 1 | | | (54,403,896 | ) | | | 85,321,567 | |
Class 2 | | | 110,574,611 | | | | (314,542,720 | ) |
Class 4 | | | (14,522,761 | ) | | | (6,302,871 | ) |
| | | | |
Total capital share transactions | | | 41,647,954 | | | | (235,524,024 | ) |
| | | | |
Net increase (decrease) in net assets | | | 226,306,807 | | | | (904,903,437 | ) |
Net assets: | | | | | | | | |
Beginning of year | | | 4,127,921,290 | | | | 5,032,824,727 | |
| | | | |
End of year | | $ | 4,354,228,097 | | | $ | 4,127,921,290 | |
| | | | |
Undistributed net investment income included in net assets: | | | | | | | | |
End of year | | $ | 88,221,627 | | | $ | 76,933,954 | |
| | | | |
| | | | |
| MS-22 | | Annual Report | The accompanying notes are an integral part of these financial statements. | | |
FRANKLIN TEMPLETON VARIABLE INSURANCE PRODUCTS TRUST
Notes to Financial Statements
Franklin Mutual Shares VIP Fund
1. Organization and Significant Accounting Policies
Franklin Templeton Variable Insurance Products Trust (Trust) is registered under the Investment Company Act of 1940 (1940 Act) as an open-end management investment company, consisting of nineteen separate funds and applies the specialized accounting and reporting guidance in U.S. Generally Accepted Accounting Principles (U.S. GAAP). Franklin Mutual Shares VIP Fund (Fund) is included in this report. The financial statements of the remaining funds in the Trust are presented separately. Shares of the Fund are generally sold only to insurance company separate accounts to fund the benefits of variable life insurance policies or variable annuity contracts.The Fund offers three classes of shares: Class 1, Class 2 and Class 4. Each class of shares differs by its distribution fees, voting rights on matters affecting a single class and its
exchange privilege.
The following summarizes the Fund’s significant accounting policies.
a. Financial Instrument Valuation
The Fund’s investments in financial instruments are carried at fair value daily. Fair value is the price that would be received to sell an asset or paid to transfer a liability in an orderly transaction between market participants on the measurement date. The Fund calculates the net asset value (NAV) per share as of 4 p.m. Eastern time each day the New York Stock Exchange (NYSE) is open for trading. Under compliance policies and procedures approved by the Trust’s Board of Trustees (the Board), the Fund’s administrator has responsibility for oversight of valuation, including leading the
cross-functional Valuation Committee (VC). The VC provides administration and oversight of the Fund’s valuation policies and procedures, which are approved annually by the Board. Among other things, these procedures allow the Fund to utilize independent pricing services, quotations from securities and financial instrument dealers, and other market sources to determine fair value.
Equity securities and derivative financial instruments (derivatives) listed on an exchange or on the NASDAQ National Market System are valued at the last quoted sale price or the official closing price of the day, respectively. Foreign equity securities are valued as of the close of trading on the foreign stock exchange on which the security is primarily traded, or as of 4 p.m. Eastern time. The value is then converted into its U.S. dollar equivalent at the foreign exchange
rate in
effect at 4 p.m. Eastern time on the day that the value of the security is determined. Over-the-counter (OTC) securities are valued within the range of the most recent quoted bid and ask prices. Securities that trade in multiple markets or on multiple exchanges are valued according to the broadest and most representative market. Certain equity securities are valued based upon fundamental characteristics or relationships to similar securities.
Debt securities generally trade in the OTC market rather than on a securities exchange. The Fund’s pricing services use multiple valuation techniques to determine fair value. In instances where sufficient market activity exists, the pricing services may utilize a market-based approach through which quotes from market makers are used to determine fair value. In instances where sufficient market activity may not exist or is limited, the pricing services also utilize proprietary valuation models which may consider market characteristics such as benchmark yield curves, credit spreads, estimated default rates, anticipated market interest rate volatility, coupon rates, anticipated timing of principal repayments, underlying collateral, and other unique security features in order to estimate the relevant cash flows, which are then discounted to calculate the
fair value.
Investments in open-end mutual funds are valued at the closing NAV.
Certain derivative financial instruments trade in the OTC market. The Fund’s pricing services use various techniques including industry standard option pricing models and proprietary discounted cash flow models to determine the fair value of those instruments. The Fund’s net benefit or obligation under the derivative contract, as measured by the fair value of the contract, is included in net assets.
The Fund has procedures to determine the fair value of financial instruments for which market prices are not reliable or readily available. Under these procedures, the VC convenes on a regular basis to review such financial instruments and considers a number of factors, including significant unobservable valuation inputs, when arriving at fair value. The VC primarily employs a market-based approach which may use related or comparable assets or liabilities, recent transactions, market multiples, book values, and other relevant information for the investment to determine the fair value of the investment. An income-based valuation approach may also be used in which the anticipated future cash flows of the investment are discounted to calculate fair value. Discounts may also be applied due to the
FRANKLIN TEMPLETON VARIABLE INSURANCE PRODUCTS TRUST
NOTES TO FINANCIAL STATEMENTS
Franklin Mutual Shares VIP Fund (continued)
1. Organization and Significant Accounting Policies (continued)
a. Financial Instrument Valuation (continued)
nature or duration of any restrictions on the disposition of the investments. Due to the inherent uncertainty of valuations of such investments, the fair values may differ significantly from the values that would have been used had an active market existed. The VC employs various methods for calibrating these valuation approaches including a regular review of key inputs and assumptions, transactional back-testing or disposition analysis, and reviews of any related market activity.
Trading in securities on foreign securities stock exchanges and OTC markets may be completed before 4 p.m. Eastern time. In addition, trading in certain foreign markets may not take place on every Fund’s business day. Occasionally, events occur between the time at which trading in a foreign security is completed and 4 p.m. Eastern time that might call into question the reliability of the value of a portfolio security held by the Fund. As a result, differences may arise between the value of the Fund’s portfolio securities as determined at the foreign market close and the latest indications of value at 4 p.m. Eastern time. In order to minimize the potential for these differences, the VC monitors price movements following the close of trading in foreign stock markets through a series of country specific market proxies (such as baskets of American Depositary Receipts, futures contracts and exchange traded funds). These price movements are measured against established trigger thresholds for each specific market proxy to assist in determining if an event has occurred that may call into question the reliability of the values of the foreign securities held by the Fund. If such an event occurs, the securities may be valued using fair value procedures, which may include the use of independent pricing services.
When the last day of the reporting period is a non-business day, certain foreign markets may be open on those days that the Fund’s NAV is not calculated, which could result in differences between the value of the Fund’s portfolio securities on the last business day and the last calendar day of the reporting period. Any significant security valuation changes due to an open foreign market are adjusted and reflected by the Fund for financial reporting purposes.
b. Foreign Currency Translation
Portfolio securities and other assets and liabilities denominated in foreign currencies are translated into U.S. dollars based on the exchange rate of such currencies against U.S. dollars on the date of valuation. The Fund may enter into foreign currency exchange contracts to facilitate transactions denominated in a foreign currency. Purchases and sales of securities, income and expense items denominated in foreign currencies are translated into U.S. dollars at the exchange rate in effect on the transaction date. Portfolio securities and assets and liabilities denominated in foreign currencies contain risks that those currencies will decline in value relative to the U.S. dollar. Occasionally, events may impact the availability or reliability of foreign exchange rates used to convert the U.S. dollar equivalent value. If such an event occurs, the foreign exchange rate will be valued at fair value using procedures established and approved by the Board.
The Fund does not separately report the effect of changes in foreign exchange rates from changes in market prices on securities held. Such changes are included in net realized and unrealized gain or loss from investments in the Statement of Operations.
Realized foreign exchange gains or losses arise from sales of foreign currencies, currency gains or losses realized between the trade and settlement dates on securities transactions and the difference between the recorded amounts of dividends, interest, and foreign withholding taxes and the U.S. dollar equivalent of the amounts actually received or paid. Net unrealized foreign exchange gains and losses arise from changes in foreign exchange rates on foreign denominated assets and liabilities other than investments in securities held at the end of the reporting period.
c. Derivative Financial Instruments
The Fund invested in derivative financial instruments in order to manage risk or gain exposure to various other investments or markets. Derivatives are financial contracts based on an underlying or notional amount, require no initial investment or an initial net investment that is smaller than would normally be required to have a similar response to changes in market factors, and require or permit net settlement. Derivatives contain various risks including the potential inability of the counterparty to fulfill their obligations under the terms of the contract, the potential for an illiquid secondary market, and/or the potential for market movements which expose the Fund to gains or losses in excess of the amounts shown in the Statement of Assets and
FRANKLIN TEMPLETON VARIABLE INSURANCE PRODUCTS TRUST
NOTES TO FINANCIAL STATEMENTS
Franklin Mutual Shares VIP Fund (continued)
Liabilities. Realized gain and loss and unrealized appreciation and depreciation on these contracts for the period are included in the Statement of Operations.
Derivative counterparty credit risk is managed through a formal evaluation of the creditworthiness of all potential counterparties. The Fund attempts to reduce its exposure to counterparty credit risk on OTC derivatives, whenever possible, by entering into International Swaps and Derivatives Association (ISDA) master agreements with certain counterparties. These agreements contain various provisions, including but not limited to collateral requirements, events of default, or early termination. Termination events applicable to the counterparty include certain deteriorations in the credit quality of the counterparty. Termination events applicable to the Fund include failure of the Fund to maintain certain net asset levels and/or limit the decline in net assets over various periods of time. In the event of default or early termination, the ISDA master agreement gives the non-defaulting party the right to net and close-out all transactions traded, whether or not arising under the ISDA agreement, to one net amount payable by one counterparty to the other. However, absent an event of default or early termination, OTC derivative assets and liabilities are presented gross and not offset in the Statement of Assets and Liabilities. Early termination by the counterparty may result in an immediate payment by the Fund of any net liability owed to that counterparty under the ISDA agreement. At December 31, 2016, the Fund had OTC derivatives in a net liability position for such contracts of $395,282.
Collateral requirements differ by type of derivative. Collateral or initial margin requirements are set by the broker or exchange clearing house for exchange traded and centrally cleared derivatives. Initial margin deposited is held at the exchange and can be in the form of cash and/or securities. For OTC derivatives traded under an ISDA master agreement, posting of collateral is required by either the Fund or the applicable counterparty if the total net exposure of all OTC derivatives with the applicable counterparty exceeds the minimum transfer amount, which typically ranges from $100,000 to $250,000, and can vary depending on the counterparty and the type of the agreement. Generally, collateral is determined at the close of Fund business each day and any additional collateral required due to changes in derivative values may be delivered by the Fund or the counterparty within a few business days. Collateral pledged and/or received by the Fund, if any, is held in segregated accounts with the Fund’s custodian/counterparty
broker and can be in the form of cash and/or securities. Unrestricted cash may be invested according to the Fund’s investment objectives. To the extent that the amounts due to the Fund from its counterparties are not subject to collateralization or are not fully collateralized, the Fund bears the risk of loss from counterparty
non-performance.
At December 31, 2016, the Fund received $1,914,244 in United Kingdom Treasury Bonds as collateral for derivatives.
The Fund entered into exchange traded futures contracts primarily to manage exposure to certain foreign currencies. A futures contract is an agreement between the Fund and a counterparty to buy or sell an asset at a specified price on a future date. Required initial margins are pledged by the Fund, and the daily change in fair value is accounted for as a variation margin payable or receivable in the Statement of Assets and Liabilities.
The Fund entered into OTC forward exchange contracts primarily to manage exposure to certain foreign currencies. A forward exchange contract is an agreement between the Fund and a counterparty to buy or sell a foreign currency at a specific exchange rate on a future date.
See Note 10 regarding other derivative information.
d. Restricted Cash
At December 31, 2016, the Fund held restricted cash in connection with investments in certain derivative securities. Restricted cash is held in a segregated account with the Fund’s custodian and is reflected in the Statement of Assets and Liabilities.
e. Securities Sold Short
The Fund is engaged in selling securities short, which obligates the Fund to replace a borrowed security with the same security at current fair value. The Fund incurs a loss if the price of the security increases between the date of the short sale and the date on which the Fund replaces the borrowed security. The Fund realizes a gain if the price of the security declines between those dates. Gains are limited to the price at which the Fund sold the security short, while losses are potentially unlimited in size.
The Fund is required to establish a margin account with the broker lending the security sold short. While the short sale is outstanding, the broker retains the proceeds of the short sale to the extent necessary to meet margin requirements until the short
FRANKLIN TEMPLETON VARIABLE INSURANCE PRODUCTS TRUST
NOTES TO FINANCIAL STATEMENTS
Franklin Mutual Shares VIP Fund (continued)
1. Organization and Significant Accounting Policies (continued)
e. Securities Sold Short (continued)
position is closed out. A deposit must also be maintained with the Fund’s custodian/counterparty broker consisting of cash and/or securities having a value equal to a specified percentage of the value of the securities sold short. The Fund is obligated to pay fees for borrowing the securities sold short and is required to pay the counterparty any dividends and/or interest due on securities sold short. Such dividends and/or interest and any security borrowing fees are recorded as an expense to the Fund.
f. Securities Lending
The Fund participates in an agency based securities lending program to earn additional income. The Fund receives cash collateral against the loaned securities in an amount equal to at least 102% of the fair value of the loaned securities. Collateral is maintained over the life of the loan in an amount not less than 100% of the fair value of loaned securities, as determined at the close of Fund business each day; any additional collateral required due to changes in security values is delivered to the Fund on the next business day. The collateral is deposited into a joint cash account with other funds and is used to invest in a money market fund managed by Franklin Advisers, Inc., an affiliate of the Fund, and/or a joint repurchase agreement. The Fund may receive income from the investment of cash collateral, in addition to lending fees and rebates paid by the borrower. Income from securities loaned, net of fees paid to the securities lending agent and/or third-party vendor, is reported separately in the Statement of Operations. The Fund bears the market risk with respect to the collateral investment, securities loaned, and the risk that the agent may default on its obligations to the Fund. If the borrower defaults on its obligation to return the securities loaned, the Fund has the right to repurchase the securities in the open market using the collateral received. The securities lending agent has agreed to indemnify the Fund in the event of default by a third party borrower. At December 31, 2016, the Fund had no securities on loan.
g. Senior Floating Rate Interests
The Fund invests in senior secured corporate loans that pay interest at rates which are periodically reset by reference to a base lending rate plus a spread. These base lending rates are generally the prime rate offered by a designated U.S. bank or the London InterBank Offered Rate (LIBOR). Senior secured
corporate loans often require prepayment of principal from excess cash flows or at the discretion of the borrower. As a result, actual maturity may be substantially less than the stated maturity. Senior secured corporate loans in which the Fund invests are generally readily marketable, but may be subject to certain restrictions
on resale.
h. Income and Deferred Taxes
It is the Fund’s policy to qualify as a regulated investment company under the Internal Revenue Code. The Fund intends to distribute to shareholders substantially all of its taxable income and net realized gains to relieve it from federal income and if applicable, excise taxes. As a result, no provision for U.S. federal income taxes is required.
The Fund may be subject to foreign taxation related to income received, capital gains on the sale of securities and certain foreign currency transactions in the foreign jurisdictions in which it invests. Foreign taxes, if any, are recorded based on the tax regulations and rates that exist in the foreign markets in which the Fund invests. When a capital gain tax is determined to apply, the Fund records an estimated deferred tax liability in an amount that would be payable if the securities were disposed of on the valuation date. As a result of several court cases, in certain countries across the European Union, the Fund filed additional tax reclaims for previously withheld taxes on dividends earned in those countries (EU reclaims). These additional filings are subject to various administrative proceedings by the local jurisdictions’ tax authorities within the European Union, as well as a number of related judicial proceedings. Income recognized, if any, for EU reclaims is reflected as other income in the Statement of Operations and any related receivable, if any, is reflected as European Union tax reclaims in the Statement of Assets and Liabilities. When uncertainty exists as to the ultimate resolution of these proceedings, the likelihood of receipt of these EU reclaims, and the potential timing of payment, no amounts are reflected in the financial statements. For U.S. income tax purposes, when EU reclaims are received by the Fund and the Fund previously passed foreign tax credit on to its shareholders, the Fund must either amend historic tax reporting to shareholders or enter into a closing agreement with the Internal Revenue Service (IRS) in order to pay the associated tax liability on behalf of the Fund’ shareholders.
FRANKLIN TEMPLETON VARIABLE INSURANCE PRODUCTS TRUST
NOTES TO FINANCIAL STATEMENTS
Franklin Mutual Shares VIP Fund (continued)
The Fund may recognize an income tax liability related to its uncertain tax positions under U.S. GAAP when the uncertain tax position has a less than 50% probability that it will be sustained upon examination by the tax authorities based on its technical merits. As of December 31, 2016, the Fund has determined that no tax liability is required in its financial statements related to uncertain tax positions for any open tax years (or expected to be taken in future tax years). Open tax years are those that remain subject to examination and are based on each tax jurisdiction’s statute
of limitation.
i. Security Transactions, Investment Income, Expenses and Distributions
Security transactions are accounted for on trade date. Realized gains and losses on security transactions are determined on a specific identification basis. Interest income and estimated expenses are accrued daily. Amortization of premium and accretion of discount on debt securities are included in interest income. Dividend income and dividends declared on securities sold short are recorded on the ex-dividend date except for certain dividends from securities where the dividend rate is not available. In such cases, the dividend is recorded as soon as the information is received by the Fund. Distributions to shareholders are recorded on the ex-dividend date and are determined according to income tax regulations (tax basis). Distributable earnings determined on a tax basis may differ from earnings recorded in accordance with U.S. GAAP. These differences may be permanent or temporary. Permanent differences are reclassified among capital accounts to reflect their tax character. These reclassifications have no impact on net assets or the results of operations. Temporary differences are not reclassified, as they may reverse in subsequent periods.
Common expenses incurred by the Trust are allocated among the Funds based on the ratio of net assets of each Fund to the combined net assets of the Trust. Fund specific expenses are charged directly to the Fund that incurred the expense.
Realized and unrealized gains and losses and net investment income, not including class specific expenses, are allocated daily to each class of shares based upon the relative proportion of net assets of each class. Differences in per share distributions, by class, are generally due to differences in class specific expenses.
j. Accounting Estimates
The preparation of financial statements in accordance with U.S. GAAP requires management to make estimates and assumptions that affect the reported amounts of assets and liabilities at the date of the financial statements and the amounts of income and expenses during the reporting period. Actual results could differ from
those estimates.
k. Guarantees and Indemnifications
Under the Trust’s organizational documents, its officers and trustees are indemnified by the Trust against certain liabilities arising out of the performance of their duties to the Trust. Additionally, in the normal course of business, the Trust, on behalf of the Fund, enters into contracts with service providers that contain general indemnification clauses. The Trust’s maximum exposure under these arrangements is unknown as this would involve future claims that may be made against the Trust that have not yet occurred. Currently, the Trust expects the risk of loss to be remote.
2. Shares of Beneficial Interest
At December 31, 2016, there were an unlimited number of shares authorized (without par value). Transactions in the Fund’s shares were as follows:
| | | | | | | | | | | | | | | | | | | | |
| | | Year Ended December 31, | |
| | | 2016 | | | | | | 2015 | |
| | | Shares | | | Amount | | | | | | Shares | | | Amount | |
| | | | | |
| Class 1 Shares: | | | | | | | | | | | | | | | | | | | | |
Shares sold | | | 2,468,008 | | | $ | 48,112,430 | | | | | | | | 5,200,808 | | | $ | 114,565,674 | |
Shares issued in reinvestment of distributions | | | 3,058,655 | | | | 59,001,463 | | | | | | | | 3,480,331 | | | | 67,065,978 | |
Shares redeemed | | | (8,638,060 | ) | | | (161,517,789 | ) | | | | | | | (4,296,684 | ) | | | (96,310,085 | ) |
| | | | |
Net increase (decrease) | | | (3,111,397 | ) | | $ | (54,403,896 | ) | | | | | | | 4,384,455 | | | $ | 85,321,567 | |
| | | | |
FRANKLIN TEMPLETON VARIABLE INSURANCE PRODUCTS TRUST
NOTES TO FINANCIAL STATEMENTS
Franklin Mutual Shares VIP Fund (continued)
2. Shares of Beneficial Interest (continued)
| | | | | | | | | | | | | | | | | | | | |
| | | Year Ended December 31, | |
| | | 2016 | | | | | | 2015 | |
| | | Shares | | | Amount | | | | | | Shares | | | Amount | |
| | | | | |
| Class 2 Shares: | | | | | | | | | | | | | | | | | | | | |
Shares sold | | | 19,363,703 | | | $ | 382,884,835 | | | | | | | | 8,995,477 | | | $ | 199,602,688 | |
Shares issued in reinvestment of distributions | | | 18,848,893 | | | | 358,317,454 | | | | | | | | 19,482,232 | | | | 370,357,223 | |
Shares redeemed | | | (32,549,983 | ) | | | (630,627,678 | ) | | | | | | | (40,426,538 | ) | | | (884,502,631 | ) |
| | | | |
Net increase (decrease) | | | 5,662,613 | | | $ | 110,574,611 | | | | | | | | (11,948,829 | ) | | $ | (314,542,720 | ) |
| | | | |
| Class 4 Shares: | | | | | | | | | | | | | | | | | | | | |
Shares sold | | | 203,267 | | | $ | 3,894,989 | | | | | | | | 465,090 | | | $ | 9,850,242 | |
Shares issued in reinvestment of distributions | | | 634,967 | | | | 12,165,958 | | | | | | | | 732,186 | | | | 14,014,047 | |
Shares redeemed | | | (1,564,342 | ) | | | (30,583,708 | ) | | | | | | | (1,372,567 | ) | | | (30,167,160 | ) |
| | | | |
Net increase (decrease) | | | (726,108 | ) | | $ | (14,522,761 | ) | | | | | | | (175,291 | ) | | $ | (6,302,871 | ) |
| | | | |
3. Transactions with Affiliates
Franklin Resources, Inc. is the holding company for various subsidiaries that together are referred to as Franklin Templeton Investments. Certain officers trustees of the Fund are also officers and/or directors of the following subsidiaries:
| | |
| Subsidiary | | Affiliation |
Franklin Mutual Advisers, LLC (Franklin Mutual) | | Investment manager |
Franklin Templeton Services, LLC (FT Services) | | Administrative manager |
Franklin Templeton Distributors, Inc. (Distributors) | | Principal underwriter |
Franklin Templeton Investor Services, LLC (Investor Services) | | Transfer agent |
a. Management Fees
The Fund pays an investment management fee to Franklin Mutual based on the average daily net assets of the Fund as follows:
| | |
| Annualized Fee Rate | | Net Assets |
0.750% | | Up to and including $200 million |
0.735% | | Over $200 million, up to and including $700 million |
0.700% | | Over $700 million, up to and including $1.2 billion |
0.675% | | Over $1.2 billion, up to and including $5 billion |
0.645% | | Over $5 billion, up to and including $10 billion |
0.625% | | Over $10 billion, up to and including $15 billion |
0.605% | | Over $15 billion, up to and including $20 billion |
0.585% | | In excess of $20 billion |
For the year ended December 31, 2016, the effective investment management fee rate was 0.689% of the Fund’s average daily net assets.
b. Administrative Fees
Under an agreement with Franklin Mutual, FT Services provides administrative services to the Fund. The fee is paid by Franklin Mutual based on Fund’s average daily net assets, and is not an additional expense of the Fund.
FRANKLIN TEMPLETON VARIABLE INSURANCE PRODUCTS TRUST
NOTES TO FINANCIAL STATEMENTS
Franklin Mutual Shares VIP Fund (continued)
c. Distribution Fees
The Board has adopted distribution plans for Class 2 and Class 4 shares pursuant to Rule 12b-1 under the 1940 Act. Under the Fund’s compensation distribution plans, the Fund pays Distributors for costs incurred in connection with the servicing, sale and distribution of the Fund’s shares up to 0.35% per year of its average daily net assets of each class. The Board has agreed to limit the current rate to 0.25% per year for Class 2. The plan year, for purposes of monitoring compliance with the maximum annual plan rates, is February 1 through January 31.
d. Transfer Agent Fees
Investor Services, under terms of an agreement, performs shareholder servicing for the Fund and is not paid by the Fund for the services.
e. Investments in Affiliated Management Investment Companies
The Fund invests in one or more affiliated management investment companies for purposes other than exercising a controlling influence over the management or policies. Management fees paid by the Fund are waived on assets invested in the affiliated management investment companies, as noted in the Statement of Operations, in an amount not to exceed the management and administrative fees paid directly or indirectly by each affiliate. During the year ended December 31, 2016, the Fund held investments in affiliated management investment companies as follows:
| | | | | | | | | | | | | | | | | | | | | | | | | | | | | | | | |
| | | Number of Shares
Held at Beginning
of Year | | | Gross
Additions | | | Gross
Reductions | | | Number
of Shares
Held at End of
Year | | | Value at End of Year | | | Investment
Income | | | Realized
Gain
(Loss) | | | % of Affiliated
Fund Shares
Outstanding
Held at End
of Year | |
| Non-Controlled Affiliates | | | | | | | | | | | | | | | | | | | | | | | | | | | | | | | | |
Institutional Fiduciary Trust Money Market Portfolio, 0.09% | | | — | | | | 79,395,000 | | | | (79,395,000 | ) | | | — | | | $ | — | | | $ | — | | | $ | — | | | | —% | |
| | | | | | | | | | | | | | | | | | | | | | | | |
f. Other Affiliated Transactions
At December 31, 2016, Franklin Templeton Variable Insurance Products Trust – Franklin Founding Funds Allocation VIP Fund owned 7.6% of the Fund’s outstanding shares.
4. Expense Offset Arrangement
The Fund has entered into an arrangement with its custodian whereby credits realized as a result of uninvested cash balances are used to reduce a portion of the Fund’s custodian expenses. During the year ended December 31, 2016, the custodian fees were reduced as noted in the Statement of Operations.
FRANKLIN TEMPLETON VARIABLE INSURANCE PRODUCTS TRUST
NOTES TO FINANCIAL STATEMENTS
Franklin Mutual Shares VIP Fund (continued)
5. Income Taxes
The tax character of distributions paid during the years ended December 31, 2016 and 2015, was as follows:
| | | | | | | | |
| | | 2016 | | | 2015 | |
Distributions paid from: | | | | | | | | |
Ordinary income | | $ | 96,662,744 | | | $ | 141,999,509 | |
Long term capital gain | | | 332,822,131 | | | | 309,437,739 | |
| | | | |
| | $ | 429,484,875 | | | $ | 451,437,248 | |
| | | | |
At December 31, 2016, the cost of investments, net unrealized appreciation (depreciation), undistributed ordinary income and undistributed long term capital gains for income tax purposes were as follows:
| | | | |
Cost of investments. | | $ | 3,460,024,972 | |
| | | | |
Unrealized appreciation | | $ | 1,175,800,687 | |
Unrealized depreciation | | | (294,941,096 | ) |
| | | | |
Net unrealized appreciation (depreciation) | | $ | 880,859,591 | |
| | | | |
Undistributed ordinary income | | $ | 128,692,310 | |
Undistributed long term capital gains | | | 142,750,519 | |
| | | | |
Distributable earnings | | $ | 271,442,829 | |
| | | | |
Differences between income and/or capital gains as determined on a book basis and a tax basis are primarily due to differing treatments of foreign currency transactions.
6. Investment Transactions
Purchases and sales of investments (excluding short term securities and securities sold short) for the year ended December 31, 2016, aggregated $945,538,010 and $1,260,012,563, respectively.
7. Credit Risk and Defaulted Securities
The Fund may purchase the pre-default or defaulted debt of distressed companies. Distressed companies are financially troubled and could be or are already involved in financial restructuring or bankruptcy. Risks associated with purchasing these securities include the possibility that the bankruptcy or other restructuring process takes longer than expected, or that distributions in restructuring are less than anticipated, either or both of which may result in unfavorable consequences to the Fund. If it becomes probable that the income on debt securities, including those of distressed companies, will not be collected, the Fund discontinues accruing income and recognizes an adjustment for uncollectible interest.
At December 31, 2016, the aggregate long value of distressed company securities for which interest recognition has been discontinued was $ 45,092,204, representing 1.0% of the Fund’s net assets. For information as to specific securities, see the accompanying Statement of Investments.
FRANKLIN TEMPLETON VARIABLE INSURANCE PRODUCTS TRUST
NOTES TO FINANCIAL STATEMENTS
Franklin Mutual Shares VIP Fund (continued)
8. Restricted Securities
The Fund invests in securities that are restricted under the Securities Act of 1933 (1933 Act) or which are subject to legal, contractual, or other agreed upon restrictions on resale. Restricted securities are often purchased in private placement transactions, and cannot be sold without prior registration unless the sale is pursuant to an exemption under the 1933 Act. Disposal of these securities may require greater effort and expense, and prompt sale at an acceptable price may be difficult. The Fund may have registration rights for restricted securities. The issuer generally incurs all registration costs.
At December 31, 2016, the Fund held investments in restricted securities, excluding certain securities exempt from registration under the 1933 Act deemed to be liquid, as follows:
| | | | | | | | | | | | | | |
Principal
Amount/
Shares/
Units | | Issuer | | Acquisition
Dates | | | Cost | | | Value | |
| 1,754 | | Broadband Ventures III LLC, secured promissory note, 5.00%, 2/01/12 | | | 7/01/10 - 11/30/12 | | | $ | 1,754 | | | $ | — | |
| 6,400,507 | | CB FIM Coinvestors LLC | | | 1/15/09 - 6/02/09 | | | | — | | | | — | |
| 8,006,950 | | FIM Coinvestor Holdings I, LLC | | | 11/20/06 - 6/2/09 | | | | — | | | | — | |
| 1,730,515 | | International Automotive Components Group Brazil LLC | | | 4/13/06 - 12/26/08 | | | | 1,149,241 | | | | 42,581 | |
| 15,382,424 | | International Automotive Components Group North America LLC | | | 1/12/06 - 3/18/13 | | | | 12,591,586 | | | | 11,442,985 | |
| 12,324 | | Warrior Met Coal LLC, A | | | 9/19/14 - 3/31/16 | | | | 16,187,328 | | | | 4,005,300 | |
| 28,821 | | Warrior Met Coal LLC, B | | | 3/31/16 - 6/23/16 | | | | 2,305,674 | | | | 9,366,825 | |
| | | | | | | | | | |
| | Total Restricted Securities (Value is 0.6% of Net Assets) | | | | | | $ | 32,235,583 | | | $ | 24,857,691 | |
| | | | | | | | | | |
9. Unfunded Capital Commitments
The Fund enters into certain capital commitments and may be obligated to perform on such agreements at a future date. The Fund monitors these commitments and assesses the probability of required performance. For any agreements whose probability of performance is determined to be greater than remote, the Fund assesses the fair value of the commitment. In instances where the probability of performance is greater than remote and the performance under the commitment would result in an unrealized loss, the Fund recognizes such losses in the Statement of Assets and Liabilities and the Statement of Operations.
At December 31, 2016, the Fund had an unfunded capital commitment of $1,152,838, for which no depreciation has been recognized.
10. Other Derivative Information
At December 31, 2016, the Fund’s investments in derivative contracts are reflected in the Statement of Assets and Liabilities as follows:
| | | | | | | | | | | | |
| | | Asset Derivatives | | | Liability Derivatives | |
Derivative Contracts
Not Accounted for
as Hedging Instruments | | Statement of Assets and
Liabilities Location | | Fair Value | | | Statement of Assets and
Liabilities Location | | Fair Value | |
Foreign exchange contracts | | Variation margin | | $ | 2,625,097 | a | | Variation margin | | $ | — | |
| | Unrealized appreciation on OTC forward exchange contracts | | | 4,244,833 | | | Unrealized depreciation on OTC forward exchange contracts | | | 831,855 | |
| | | | | | | | | | | | |
Totals | | | | $ | 6,869,930 | | | | | $ | 831,855 | |
| | | | | | | | | | | | |
aThis amount reflects the cumulative appreciation (depreciation) of futures contracts as reported in the Statement of Investments. Only the variation margin receivable/ payable at year end is separately reported within the Statement of Assets and Liabilities. Prior variation margin movements were recorded to cash upon receipt or payment.
FRANKLIN TEMPLETON VARIABLE INSURANCE PRODUCTS TRUST
NOTES TO FINANCIAL STATEMENTS
Franklin Mutual Shares VIP Fund (continued)
10. Other Derivative Information (continued)
For the year ended December 31, 2016, the effect of derivative contracts in the Fund’s Statement of Operations was as follows:
| | | | | | | | | | | | |
Derivative Contracts Not Accounted for as Hedging Instruments | | Statement of Operations Locations | | Net Realized
Gain (Loss)
for the Year | | | Statement of Operations Locations | | Net Change in
Unrealized
Appreciation
(Depreciation)
for the Year | |
| | Net realized gain (loss) from: | | | | | | Net change in unrealized appreciation (depreciation) on: | | | | |
Foreign exchange contracts | | Foreign currency transactions | | $ | 29,842,803 | a | | Translation of other assets and liabilities denominated in foreign currencies | | $ | (1,734,850 | )a |
| | Futures contracts | | | 23,600,083 | | | Futures contracts | | | (637,142 | ) |
| | | | | | | | | | | | |
Totals | | | | $ | 53,442,886 | | | | | $ | (2,371,992 | ) |
| | | | | | | | | | | | |
aForward exchange contracts are included in net realized gain (loss) from foreign currency transactions and net change in unrealized appreciation (depreciation) on translation of other assets and liabilities denominated in foreign currencies in the Statement of Operations.
For the year ended December 31, 2016, the average month end fair value of derivatives represented 0.3% of average month end net assets. The average month end number of open derivatives contracts for the year was 44.
See Note 1(c) regarding derivative financial instruments.
11. Holdings of 5% Voting Securities of Portfolio Companies
The 1940 Act defines “affiliated companies” to include investments in portfolio companies in which a fund owns 5% or more of the outstanding voting securities. During the year ended December 31, 2016, the Fund held investments in “affiliated companies” as follows:
| | | | | | | | | | | | | | | | | | | | | | | | | | | | |
| Name of Issuer | | Number of Shares
Held at Beginning
of Year | | | Gross
Additions | | | Gross
Reductions | | | Number of Shares
Held at End
of Year | | | Value at
End of
Year | | | Investment
Income | | | Realized Gain (Loss) | |
| Non-Controlled Affiliates | | | | | | | | | | | | | | | | | | | | | | | | | | | | |
CB FIM Coinvestors LLC (Value is 0.0%of Net Assets) | | | 6,400,507 | | | | — | | | | — | | | | 6,400,507 | | | $ | — | | | $ | — | | | $ | — | |
| | | | | | | | | | | | | | | | | | | | |
12. Credit Facility
The Fund, together with other U.S. registered and foreign investment funds (collectively, Borrowers), managed by Franklin Templeton Investments, are borrowers in a joint syndicated senior unsecured credit facility totaling $2 billion (Global Credit Facility) which matured on February 10, 2017. This Global Credit Facility provides a source of funds to the Borrowers for temporary and emergency purposes, including the ability to meet future unanticipated or unusually large redemption requests. Effective February 10, 2017, the Borrowers renewed the Global Credit Facility for a one year term, maturing February 9, 2018, for a total of $2 billion.
FRANKLIN TEMPLETON VARIABLE INSURANCE PRODUCTS TRUST
NOTES TO FINANCIAL STATEMENTS
Franklin Mutual Shares VIP Fund (continued)
Under the terms of the Global Credit Facility, the Fund shall, in addition to interest charged on any borrowings made by the Fund and other costs incurred by the Fund, pay its share of fees and expenses incurred in connection with the implementation and maintenance of the Global Credit Facility, based upon its relative share of the aggregate net assets of all of the Borrowers, including an annual commitment fee of 0.15% based upon the unused portion of the Global Credit Facility. These fees are reflected in other expenses in the Statement of Operations. During the year ended December 31, 2016, the Fund did not use the Global Credit Facility.
13. Fair Value Measurements
The Fund follows a fair value hierarchy that distinguishes between market data obtained from independent sources (observable inputs) and the Fund’s own market assumptions (unobservable inputs). These inputs are used in determining the value of the Fund’s financial instruments and are summarized in the following fair value hierarchy:
| | • | | Level 1 – quoted prices in active markets for identical financial instruments |
| | • | | Level 2 – other significant observable inputs (including quoted prices for similar financial instruments, interest rates, prepayment speed, credit risk, etc.) |
| | • | | Level 3 – significant unobservable inputs (including the Fund’s own assumptions in determining the fair value of financial instruments) |
The input levels are not necessarily an indication of the risk or liquidity associated with financial instruments at that level.
For movements between the levels within the fair value hierarchy, the Fund has adopted a policy of recognizing the transfers as of the date of the underlying event which caused the movement.
FRANKLIN TEMPLETON VARIABLE INSURANCE PRODUCTS TRUST
NOTES TO FINANCIAL STATEMENTS
Franklin Mutual Shares VIP Fund (continued)
13. Fair Value Measurements (continued)
A summary of inputs used as of December 31, 2016, in valuing the Fund’s assets and liabilities carried at fair value, is as follows:
| | | | | | | | | | | | | | | | |
| | | Level 1 | | | Level 2 | | | Level 3 | | | Total | |
| Assets: | | | | | | | | | | | | | | | | |
Investments in Securities: | | | | | | | | | | | | | | | | |
Equity Investments:a | | | | | | | | | | | | | | | | |
Auto Components | | $ | 21,823,176 | | | $ | — | | | $ | 11,485,566 | | | $ | 33,308,742 | |
Machinery | | | 77,007,166 | | | | 16,043,301 | | | | — | | | | 93,050,467 | |
Oil, Gas & Consumable Fuels | | | 277,805,900 | | | | — | | | | 13,372,125 | | | | 291,178,025 | |
All Other Equity Investmentsb | | | 3,296,738,353 | | | | — | | | | — | c | | | 3,296,738,353 | |
Corporate Bonds, Notes and Senior Floating Rate Interests | | | — | | | | 203,272,106 | | | | — | | | | 203,272,106 | |
Corporate Notes and Senior Floating Rate Interests in Reorganization | | | — | | | | 31,316,129 | | | | — | c | | | 31,316,129 | |
Companies in Liquidation | | | 17,570 | | | | 8,093,136 | | | | 1,507,146 | c | | | 9,617,852 | |
Municipal Bonds in Reorganization | | | — | | | | 13,776,075 | | | | — | | | | 13,776,075 | |
Short Term Investments | | | 310,126,814 | | | | 58,500,000 | | | | — | | | | 368,626,814 | |
| | | | |
Total Investments in Securities | | $ | 3,983,518,979 | | | $ | 331,000,747 | | | $ | 26,364,837 | | | $ | 4,340,884,563 | |
| | | | |
Other Financial Instruments: | | | | | | | | | | | | | | | | |
Futures Contracts | | $ | 2,625,097 | | | $ | — | | | $ | — | | | $ | 2,625,097 | |
Forward Exchange Contracts | | | — | | | | 4,244,833 | | | | — | | | | 4,244,833 | |
| | | | |
Total Other Financial Instruments | | $ | 2,625,097 | | | $ | 4,244,833 | | | $ | — | | | $ | 6,869,930 | |
| | | | |
| | | | |
| Liabilities: | | | | | | | | | | | | | | | | |
Other Financial Instruments: | | | | | | | | | | | | | | | | |
Securities Sold Short | | $ | 21,666,889 | | | $ | — | | | $ | — | | | $ | 21,666,889 | |
Forward Exchange Contracts | | | — | | | | 831,855 | | | | — | | | | 831,855 | |
| | | | |
Total Other Financial Instruments | | $ | 21,666,889 | | | $ | 831,855 | | | $ | — | | | $ | 22,498,744 | |
| | | | |
aIncludes common stocks and other equity investments.
bFor detailed categories, see the accompanying Statement of Investments.
cIncludes securities determined to have no value at December 31, 2016.
A reconciliation of assets in which Level 3 inputs are used in determining fair value is presented when there are significant Level 3 financial instruments at the end of the year.
14. Investment Company Reporting Modernization
In October 2016, the U.S. Securities and Exchange Commission adopted new rules and amended existing rules (together, final rules) intended to modernize the reporting and disclosure of information by registered investment companies. In part, the final rules amend Regulation S-X and require standardized, enhanced disclosures about derivatives in investment company financial statements, as well as other amendments. The compliance date for the amendments to Regulation S-X is August 1, 2017. Management is currently evaluating the impact that the adoption of the amendments to Regulation S-X will have on the Fund’s financial statements and related disclosures.
15. Subsequent Events
The Fund has evaluated subsequent events through the issuance of the financial statements and determined that no events have occurred that require disclosure other than those already disclosed in the financial statements.
FRANKLIN TEMPLETON VARIABLE INSURANCE PRODUCTS TRUST
NOTES TO FINANCIAL STATEMENTS
Franklin Mutual Shares VIP Fund (continued)
Abbreviations
| | | | | | | | | | |
| Counterparty | | Currency | | Selected Portfolio |
| | | | | |
| BOFA | | Bank of America N.A. | | EUR | | Euro | | ADR | | American Depositary Receipt |
| | | | | |
| BONY | | Bank of New York Mellon | | GBP | | British Pound | | FHLB | | Federal Home Loan Bank |
| | | | | |
| FBCO | | Credit Suisse Group AG | | | | | | GO | | General Obligation |
| | | | | |
| HSBC | | HSBC Bank USA, N.A. | | | | | | TRA | | Tax Receivable Agreement |
| | | | | |
| SSBT | | State Street Bank and Trust Co., N.A. | | | | | | | | |
| | | | | |
| UBSW | | UBS AG | | | | | | | | |
FRANKLIN TEMPLETON VARIABLE INSURANCE PRODUCTS TRUST
Report of Independent Registered Public Accounting Firm
Franklin Mutual Shares VIP Fund
To the Board of Trustees and Shareholders of Franklin Mutual Shares VIP Fund
In our opinion, the accompanying statement of assets and liabilities, including the statement of investments, and the related statements of operations and of changes in net assets and the financial highlights present fairly, in all material respects, the financial position of Franklin Mutual Shares VIP Fund (the “Fund”) as of December 31, 2016, the results of its operations for the year then ended, the changes in its net assets for each of the two years in the period then ended and the financial highlights for the periods presented, in conformity with accounting principles generally accepted in the United States of America. These financial statements and financial highlights (hereafter referred to as “financial statements”) are the responsibility of the Fund’s management. Our responsibility is to express an opinion on these financial statements based on our audits. We conducted our audits of these financial statements in accordance with the standards of the Public Company Accounting Oversight Board (United States). Those standards require that we plan and perform the audit to obtain reasonable assurance about whether the financial statements are free of material misstatement. An audit includes examining, on a test basis, evidence supporting the amounts and disclosures in the financial statements, assessing the accounting principles used and significant estimates made by management, and evaluating the overall financial statement presentation. We believe that our audits, which included confirmation of securities as of December 31, 2016 by correspondence with the custodian and brokers, provide a reasonable basis for our opinion.
PricewaterhouseCoopers LLP
San Francisco, California
February 15, 2017
FRANKLIN TEMPLETON VARIABLE INSURANCE PRODUCTS TRUST
Tax Information (unaudited)
Franklin Mutual Shares VIP Fund
Under Section 852(b)(3)(C) of the Internal Revenue Code (Code), the Fund hereby reports the maximum amount allowable but no less than $332,822,131 as a long term capital gain dividend for the fiscal year ended December 31, 2016.
Under Section 854(b)(1)(A) of the Code, the Fund hereby reports 74.07% of the ordinary income dividends as income qualifying for the dividends received deduction for the fiscal year ended December 31, 2016.
Franklin Rising Dividends VIP Fund
We are pleased to bring you Franklin Rising Dividends VIP Fund’s annual report for the fiscal year ended December 31, 2016.
Class 2 Performance Summary as of December 31, 2016
Average annual total return of Class 2 shares* represents the average annual change in value, assuming reinvestment of dividends and capital gains. Average returns smooth out variations in returns, which can be significant; they are not the same as year-by-year results.
| | | | | | | | | | | | |
| Periods ended 12/31/16 | | 1-Year | | | 5-Year | | | 10-Year | |
Average Annual Total Return | | | +16.04% | | | | +12.03% | | | | +6.51% | |
*The Fund has a fee waiver associated with any investment it makes in a Franklin Templeton money fund and/or other Franklin Templeton fund, contractually guaranteed through its current fiscal year-end. Fund investment results reflect the fee waiver; without this waiver, the results would have been lower.
Performance reflects the Fund’s Class 2 operating expenses, but does not include any contract fees, expenses or sales charges. If they had been included, performance would be lower. These charges and deductions, particularly for variable life policies, can have a significant effect on contract values and insurance benefits. See the contract prospectus for a complete description of these expenses, including sales charges.
Performance data represent past performance, which does not guarantee future results. Investment return and principal value will fluctuate, and you may have a gain or loss when you sell your shares. Current performance may differ from figures shown.
Total Return Index Comparison for a Hypothetical $10,000 Investment (1/1/07–12/31/16)
The graph below shows the change in value of a hypothetical $10,000 investment in the Fund over the indicated period and includes reinvestment of any income or distributions. The Fund’s performance* is compared to the performance of the Standard & Poor’s® 500 Index (S&P 500®). One cannot invest directly in an index, and an index is not representative of the Fund’s portfolio. Please see Important Notes to Performance Information preceding the Fund Summaries.
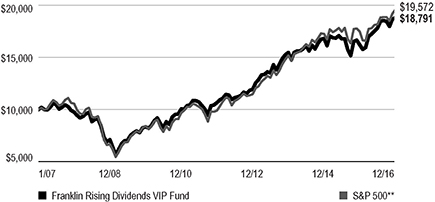
**Source: Morningstar. Please see Index Descriptions following the Fund Summaries.
FRANKLIN RISING DIVIDENDS VIP FUND
Fund Goal and Main Investments
The Fund seeks long-term capital appreciation, with preservation of capital as an important consideration. Under normal market conditions, the Fund invests at least 80% of its net assets in equity securities of companies that have paid rising dividends.
Fund Risks
All investments involve risks, including possible loss of principal. Value securities may not increase in price as anticipated or may decline further in value. While smaller and midsized companies may offer substantial opportunities for capital growth, they also involve heightened risks and should be considered speculative. Historically, smaller- and midsized-company securities have been more volatile in price than larger company securities, especially over the short term. The Fund is actively managed but there is no guarantee that the manager’s investment decisions will produce the desired results. The Fund’s prospectus also includes a description of the main investment risks.
Performance Overview
You can find the Fund’s one-year total return in the Performance Summary. In comparison, the S&P 500 rose +11.96% for the same period.1 Please note the Fund employs a bottom-up stock selection process, and the managers invest in securities without regard to benchmark comparisons.
Economic and Market Overview
The U.S. economy expanded during the 12 months under review. The economy grew at a faster pace in 2016’s third quarter than in the second and first quarters, mainly due to personal consumption expenditures, exports, private inventory investment, federal government spending and nonresidential fixed investment. Manufacturing conditions remained volatile but generally expanded, and the services sector also continued to grow for most of the period. The unemployment rate decreased from 5.0% in December 2015 to 4.7% at period-end.2 Monthly retail sales grew for most of the review period, and rose to its highest level in April in more than a year, due to a broad-based increase across most retail categories. Inflation, as measured by the Consumer Price Index, remained
relatively subdued for most of the period, but rose in 2016’s
fourth quarter.
After maintaining its target interest rate in the 0.25%–0.50% range for nearly a year, the U.S. Federal Reserve (Fed), at its December meeting, increased its target range for the federal funds rate to 0.50%–0.75%, as policymakers noted improvement in U.S. labor market and inflation. The Federal Open Market Committee also hinted at three additional hikes in 2017. Furthermore, the Fed raised its forecast for 2017 U.S. economic growth, and lowered its unemployment projections.
U.S. equity markets rose during the review period, benefiting from mostly upbeat economic data and better corporate earnings in the U.S., signs of improvement in the Chinese and European economies and ongoing expansionary monetary policies from key central banks. Other contributing factors included investors’ expectations of higher interest rates and inflation in the U.S. driven by hopes of expansionary fiscal policies under the new president Donald Trump, and an Organization of the Petroleum Exporting Countries deal to curb oil production. The Fed’s decision to keep interest rates unchanged at its November meeting further boosted investor confidence. However, the U.K.’s historic vote to leave the European Union (also known as “Brexit”) and global growth concerns weighed on market sentiment. The broad U.S. stock market ended the 12-month period higher, as measured by the S&P 500 Index.
Investment Strategy
We are a research-driven, fundamental investment adviser, pursuing a disciplined value-oriented strategy. As bottom-up investors concentrating primarily on individual securities, we seek fundamentally sound companies that we believe meet our screening criteria, which include consistent, substantial dividend increases; reinvested earnings; and strong balance sheets. We attempt to acquire such stocks at attractive prices, often when they are out of favor with other investors. In following these criteria, we do not necessarily focus on companies whose securities pay a high dividend but rather on companies that consistently raise
their dividends.
1. Source: Morningstar. One cannot invest directly in an index, and an index is not representative of the Fund’s portfolio. Please see Index Descriptions following the Fund Summaries.
2. Source: Bureau of Labor Statistics.
The dollar value, number of shares or principal amount, and names of all portfolio holdings are listed in the Fund’s Statement of Investments (SOI).
FRANKLIN RISING DIVIDENDS VIP FUND
Manager’s Discussion
During the fiscal year ended December 31, 2016, some holdings that contributed to absolute performance included Albemarle, West Pharmaceutical Services and Stryker.
Shares of Albemarle, a specialty chemicals producer, performed well over the period, as the company reported consistently strong performance and raised its full-year 2016 guidance repeatedly. Ongoing strength in the company’s lithium business contributed significantly to its strong performance, while the Refining Solutions and Bromine businesses generated solid results. Management also completed the sale of the Surface Treatment business and announced several measures to expand its leading position in lithium. The company has 22 consecutive years of dividend increases.
Shares of West Pharmaceutical Services, a drug delivery technology company, benefited from strong financial performance during the period. We believe West is well-positioned to supply drug delivery devices to the growing biotechnology and bio-similar drug end markets, which could continue to drive solid ongoing top-line growth and margin expansion. The company also implemented lean manufacturing and operating programs globally, which could improve West’s profitability and working capital management. West has increased its dividend for 24 consecutive years.
Shares of Stryker, a manufacturer of surgical and medical equipment, rose over the period due to strong earnings results. Management has embarked on a multi-year cost-reduction program, which we believe should improve the company’s competitive position and reduce the negative impact of ongoing price pressure. Growth initiatives, such as the rollout of the MAKO robotic platform, the expansion of Stryker’s sales infrastructure in Europe, and the acquisition of Sage, should help sustain top-line growth in the medium term. The company has raised its dividend for 24 consecutive years.
Conversely, some holdings that detracted from absolute performance included Perrigo, NIKE and Abbott Laboratories.
Perrigo, a health care supplier and pharmaceuticals company, was adversely impacted by the abrupt departure of its chief executive officer, a reduction in financial guidance, and concerns about diminishing pricing power in its prescriptions business. New management is focused on resetting the company’s guidance to more realistic levels and on improving profitability at its underperforming European subsidiary. We like management’s actions and regard many of the problems as rectifiable or one-time in nature. We also believe that Perrigo’s
Portfolio Composition
Based on Total Net Assets as of 12/31/16
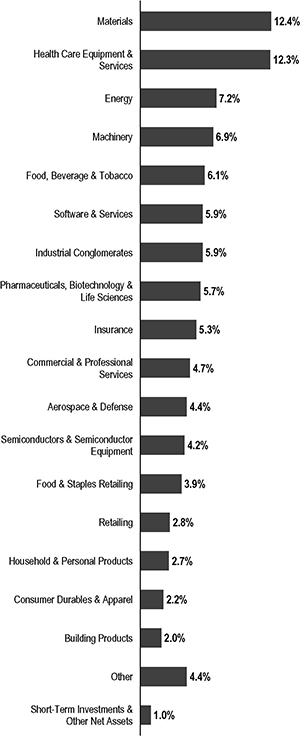
over-the-counter franchise remains a solid driver of long-term value. The company has 14 consecutive years of dividend increases.
FRANKLIN RISING DIVIDENDS VIP FUND
NIKE, an athletic footwear, apparel, and equipment company, declined over the period, resulting largely from concerns about market share erosion in the U.S. by competitors, including Adidas and Under Armour, and an inventory buildup, which the company is addressing. Adidas and Under Armour are not Fund holdings. Although NIKE continues to operate in a highly competitive market, the company has built an enduring franchise, which we believe remains well aligned with consumer trends. We believe that NIKE has multiple sources of growth and leverage potential, including innovation, continued overseas expansion, and increased automation, and that the company continues to be well positioned for the long term. The company has 15 consecutive years of dividend increases.
Shares of Abbott Laboratories, a diversified health care products manufacturer, declined due to slower-than-anticipated growth from its Chinese nutritionals business. We believe that Abbott’s diversified portfolio, including its emerging markets exposure and anticipated synergies from the merger with St. Jude, position the company well for ongoing growth. The company has raised its dividend for 45 consecutive years.
During the period, the Fund initiated new positions in Visa, a global payments technology company (eight consecutive years of dividend increases) and Analog Devices, a semiconductor company (13 consecutive years of dividend increases). We added to existing positions including Microsoft, a software and hardware services provider (13 years of consecutive dividend increases); the aforementioned Perrigo (14 consecutive years of dividend increases) and CVS Health, an integrated pharmacy healthcare provider (14 consecutive years of dividend increases).
Positions we exited included Knowles, Advansix and California Resources, all of which we received as a result of spin-offs and Teleflex. We also reduced several holdings including Hillenbrand, Wal-Mart and the aforementioned West Pharmaceutical Services.
Our 10 largest positions on December 31, 2016, represented 31.4% of the Fund’s total net assets. It is interesting to note how these 10 companies would respond to the Fund’s screening criteria based on a simple average of statistical measures. On average, these 10 companies have raised their dividends 29 years in a row and by 258% over the past 10 years. Their most recent year-over-year dividend increases averaged 7.99% with a yield of 1.8% on December 31, 2016, and a dividend payout ratio of 36.7%, based on estimates of calendar year 2016 operating earnings. The average price/earnings ratio was 21.5 times calendar year 2016 estimates versus 17.2 for that of the unmanaged S&P 500.
Top 10 Holdings
12/31/16
| | | | |
Company Sector/Industry | | % of Total
Net Assets | |
Microsoft Corp. Software & Services | | | 4.0% | |
Roper Technologies Inc. Industrial Conglomerates | | | 3.5% | |
Albemarle Corp. Materials | | | 3.5% | |
Praxair Inc. Materials | | | 3.1% | |
Dover Corp. Machinery | | | 3.0% | |
Air Products and Chemicals Inc. Materials | | | 3.0% | |
Stryker Corp. Health Care Equipment & Services | | | 2.9% | |
United Technologies Corp. Aerospace & Defense | | | 2.9% | |
Becton, Dickinson and Co. Health Care Equipment & Services | | | 2.8% | |
West Pharmaceutical Services Inc. Health Care Equipment & Services | | | 2.7% | |
Thank you for your participation in Franklin Rising Dividends VIP Fund. We look forward to continuing to serve your investment needs.
The foregoing information reflects our analysis, opinions and portfolio holdings as of December 31, 2016, the end of the reporting period. The way we implement our main investment strategies and the resulting portfolio holdings may change depending on factors such as market and economic conditions. These opinions may not be relied upon as investment advice or an offer for a particular security. The information is not a complete analysis of every aspect of any market, country, industry, security or the Fund. Statements of fact are from sources considered reliable, but the investment manager makes no representation or warranty as to their completeness or accuracy. Although historical performance is no guarantee of future results, these insights may help you understand our investment management philosophy.
FRANKLIN RISING DIVIDENDS VIP FUND
Class 2 Fund Expenses
As an investor in a variable insurance contract (Contract) that indirectly provides for investment in an underlying mutual fund, you can incur transaction and/or ongoing expenses at both the Fund level and the Contract Level: (1) transaction expenses can include sales charges (loads) on purchases, surrender fees, transfer fees and premium taxes; and (2) ongoing expenses can include management fees, distribution and service (12b-1) fees, contract fees, annual maintenance fees, mortality and expense risk fees and other fees and expenses. All mutual funds and Contracts have some types of ongoing expenses. The table below shows Fund-level ongoing expenses and can help you understand these costs and compare them with those of other mutual funds offered through the Contract. The table assumes a $1,000 investment held for the six months indicated. Please refer to the Fund prospectus for additional information on operating expenses.
Actual Fund Expenses
The table below provides information about the actual account values and actual expenses in the columns under the heading “Actual.” In these columns the Fund’s actual return, which includes the effect of ongoing Fund expenses but does not include the effect of ongoing Contract expenses, is used to calculate the “Ending Account Value.”
You can estimate the Fund-level expenses you paid during the period by following these steps (of course, your account value and expenses will differ from those in this illustration):
| | Divide your account value by $1,000 (if your account had an $8,600 value, then $8,600 ÷ $1,000 = 8.6). |
| | Then multiply the result by the number under the headings “Actual” and “Fund-Level Expenses Paid During Period” (if Fund-Level Expenses Paid During Period were $ 7.50, then 8.6 x $7.50 = $64.50). |
In this illustration, the estimated expenses paid this period at the Fund level are $64.50.
Hypothetical Example for Comparison with Other Mutual Funds
Under the heading “Hypothetical” in the table, information is provided about hypothetical account values and hypothetical expenses based on the Fund’s actual expense ratio and an assumed rate of return of 5% per year before expenses, which is not the Fund’s actual return. This information may not be used to estimate the actual ending account balance or expenses you paid for the period, but it can help you compare ongoing costs of investing in the Fund with those of other mutual funds offered through the Contract. To do so, compare this 5% hypothetical example with the 5% hypothetical examples that appear in the shareholder reports of other funds offered through the Contract.
Please note that expenses shown in the table are meant to highlight ongoing costs at the Fund level only and do not reflect any ongoing expenses at the Contract level, or transaction expenses at either the Fund or Contract levels. In addition, while the Fund does not have transaction expenses, if the transaction and ongoing expenses at the Contract level were included, the expenses shown below would be higher. You should consult your Contract prospectus or disclosure document for more information.
| | | | | | | | | | | | | | | | | | | | | | | | |
| | | | | | Actual
(actual return after expenses) | | | Hypothetical
(5% annual return before expenses) | | | | |
| Share Class | |
| Beginning Account
Value 7/1/16 |
| |
| Ending Account
Value 12/31/16 |
| |
| Fund-Level
Expenses Paid
During Period
7/1/16–12/31/16 |
1,2 | |
| Ending Account
Value 12/31/16 |
| |
| Fund-Level
Expenses Paid
During Period
7/1/16–12/31/16 |
1,2 | |
| Net
Annualized
Expense
Ratio |
2 |
Class 2 | | | $1,000 | | | | $1,055.60 | | | | $4.50 | | | | $1,020.76 | | | | $4.42 | | | | 0.87% | |
1. Expenses are equal to the annualized expense ratio for the six-month period as indicated above–in the far right column–multiplied by the simple average account value over the period indicated, and then multiplied by 184/366 to reflect the one-half year period.
2. Reflects expenses after fee waivers and expense reimbursements. Does not include any ongoing expenses of the Contract for which the Fund is an investment option or acquired fund fees and expenses.
FRANKLIN TEMPLETON VARIABLE INSURANCE PRODUCTS TRUST
Financial Highlights
Franklin Rising Dividends VIP Fund
| | | | | | | | | | | | | | | | | | | | |
| | | Year Ended December 31, | |
| | | 2016 | | | 2015 | | | 2014 | | | 2013 | | | 2012 | |
| Class 1 | | | | | | | | | | | | | | | | | | | | |
Per share operating performance
(for a share outstanding throughout the year) | | | | | | | | | | | | | | | | | | | | |
| | | | | |
Net asset value, beginning of year | | | $25.26 | | | | $29.63 | | | | $28.14 | | | | $22.03 | | | | $20.01 | |
| | | | |
| | | | | |
| Income from investment operationsa: | | | | | | | | | | | | | | | | | | | | |
| | | | | |
Net investment incomeb | | | 0.42 | | | | 0.45 | | | | 0.45 | | | | 0.40 | | | | 0.41 | |
| | | | | |
Net realized and unrealized gains (losses) | | | 3.45 | | | | (1.33 | ) | | | 2.03 | | | | 6.16 | | | | 2.00 | |
| | | | |
Total from investment operations | | | 3.87 | | | | (0.88 | ) | | | 2.48 | | | | 6.56 | | | | 2.41 | |
| | | | |
| | | | | |
| Less distributions from: | | | | | | | | | | | | | | | | | | | | |
| | | | | |
Net investment income | | | (0.44 | ) | | | (0.48 | ) | | | (0.44 | ) | | | (0.45 | ) | | | (0.39 | ) |
| | | | | |
Net realized gains | | | (3.18 | ) | | | (3.01 | ) | | | (0.55 | ) | | | — | | | | — | |
| | | | |
Total distributions | | | (3.62 | ) | | | (3.49 | ) | | | (0.99 | ) | | | (0.45 | ) | | | (0.39 | ) |
| | | | |
Net asset value, end of year | | | $25.51 | | | | $25.26 | | | | $29.63 | | | | $28.14 | | | | $22.03 | |
| | | | |
| | | | | |
Total returnc | | | 16.33% | | | | (3.42)% | | | | 9.01% | | | | 30.05% | | | | 12.18% | |
| | | | | |
| Ratios to average net assets | | | | | | | | | | | | | | | | | | | | |
| | | | | |
Expenses before waiver and payments by affiliates | | | 0.63% | | | | 0.63% | | | | 0.62% | | | | 0.61% | | | | 0.63% | |
| | | | | |
Expenses net of waiver and payments by affiliates | | | 0.62% | d | | | 0.63% | e | | | 0.62% | e | | | 0.61% | | | | 0.63% | |
| | | | | |
Net investment income | | | 1.67% | | | | 1.65% | | | | 1.58% | | | | 1.59% | | | | 1.96% | |
| | | | | |
| Supplemental data | | | | | | | | | | | | | | | | | | | | |
| | | | | |
Net assets, end of year (000’s) | | | $181,072 | | | | $143,376 | | | | $160,480 | | | | $168,380 | | | | $141,455 | |
| | | | | |
Portfolio turnover rate | | | 6.66% | | | | 4.74% | | | | 8.61% | | | | 0.07% | | | | 11.19% | |
aThe amount shown for a share outstanding throughout the period may not correlate with the Statement of Operations for the period due to the timing of sales and repurchases of the Fund’s shares in relation to income earned and/or fluctuating fair value of the investments of the Fund.
bBased on average daily shares outstanding.
cTotal return does not include fees, charges or expenses imposed by the variable annuity and life insurance contracts for which Franklin Templeton Variable Insurance Products Trust serves as an underlying investment vehicle.
dBenefit of expense reduction rounds to less than 0.01%.
eBenefit of waiver and payments by affiliates rounds to less than 0.01%.
| | | | |
| FRD-6 | | Annual Report | The accompanying notes are an integral part of these financial statements. | | |
FRANKLIN TEMPLETON VARIABLE INSURANCE PRODUCTS TRUST
FINANCIAL STATEMENTS
Franklin Rising Dividends VIP Fund (continued)
| | | | | | | | | | | | | | | | | | | | |
| | | Year Ended December 31, | |
| | | 2016 | | | 2015 | | | 2014 | | | 2013 | | | 2012 | |
| Class 2 | | | | | | | | | | | | | | | | | | | | |
Per share operating performance
(for a share outstanding throughout the year) | | | | | | | | | | | | | | | | | | | | |
| | | | | |
Net asset value, beginning of year | | | $24.72 | | | | $29.06 | | | | $27.62 | | | | $21.64 | | | | $19.65 | |
| | | | |
| | | | | |
| Income from investment operationsa: | | | | | | | | | | | | | | | | | | | | |
| | | | | |
Net investment incomeb | | | 0.35 | | | | 0.37 | | | | 0.37 | | | | 0.33 | | | | 0.35 | |
| | | | | |
Net realized and unrealized gains (losses) | | | 3.37 | | | | (1.29 | ) | | | 1.99 | | | | 6.04 | | | | 1.98 | |
| | | | |
Total from investment operations | | | 3.72 | | | | (0.92 | ) | | | 2.36 | | | | 6.37 | | | | 2.33 | |
| | | | |
| | | | | |
| Less distributions from: | | | | | | | | | | | | | | | | | | | | |
| | | | | |
Net investment income | | | (0.37 | ) | | | (0.41 | ) | | | (0.37 | ) | | | (0.39 | ) | | | (0.34 | ) |
| | | | | |
Net realized gains | | | (3.18 | ) | | | (3.01 | ) | | | (0.55 | ) | | | — | | | | — | |
| | | | |
Total distributions | | | (3.55 | ) | | | (3.42 | ) | | | (0.92 | ) | | | (0.39 | ) | | | (0.34 | ) |
| | | | |
Net asset value, end of year | | | $24.89 | | | | $24.72 | | | | $29.06 | | | | $27.62 | | | | $21.64 | |
| | | | |
| | | | | |
Total returnc | | | 16.04% | | | | (3.65)% | | | | 8.72% | | | | 29.69% | | | | 11.96% | |
| | | | | |
| Ratios to average net assets | | | | | | | | | | | | | | | | | | | | |
| | | | | |
Expenses before waiver and payments by affiliates | | | 0.88% | | | | 0.88% | | | | 0.87% | | | | 0.86% | | | | 0.88% | |
| | | | | |
Expenses net of waiver and payments by affiliates | | | 0.87% | d | | | 0.88% | e | | | 0.87% | e | | | 0.86% | | | | 0.88% | |
| | | | | |
Net investment income | | | 1.42% | | | | 1.40% | | | | 1.33% | | | | 1.34% | | | | 1.71% | |
| | | | | |
| Supplemental data | | | | | | | | | | | | | | | | | | | | |
| | | | | |
Net assets, end of year (000’s) | | | $1,530,374 | | | | $1,310,783 | | | | $1,667,816 | | | | $1,752,012 | | | | $1,550,084 | |
| | | | | |
Portfolio turnover rate | | | 6.66% | | | | 4.74% | | | | 8.61% | | | | 0.07% | | | | 11.19% | |
aThe amount shown for a share outstanding throughout the period may not correlate with the Statement of Operations for the period due to the timing of sales and repurchases of the Fund’s shares in relation to income earned and/or fluctuating fair value of the investments of the Fund.
bBased on average daily shares outstanding.
cTotal return does not include fees, charges or expenses imposed by the variable annuity and life insurance contracts for which Franklin Templeton Variable Insurance Products Trust serves as an underlying investment vehicle.
dBenefit of expense reduction rounds to less than 0.01%.
eBenefit of waiver and payments by affiliates rounds to less than 0.01%.
| | | | | | |
| | | The accompanying notes are an integral part of these financial statements. | Annual Report | | | FRD-7 | |
FRANKLIN TEMPLETON VARIABLE INSURANCE PRODUCTS TRUST
FINANCIAL HIGHLIGHTS
Franklin Rising Dividends VIP Fund (continued)
| | | | | | | | | | | | | | | | | | | | |
| | | Year Ended December 31, | |
| | | 2016 | | | 2015 | | | 2014 | | | 2013 | | | 2012 | |
| Class 4 | | | | | | | | | | | | | | | | | | | | |
Per share operating performance
(for a share outstanding throughout the year) | | | | | | | | | | | | | | | | | | | | |
| | | | | |
Net asset value, beginning of year | | | $24.81 | | | | $29.19 | | | | $27.76 | | | | $21.78 | | | | $19.83 | |
| | | | |
| | | | | |
| Income from investment operationsa: | | | | | | | | | | | | | | | | | | | | |
| | | | | |
Net investment incomeb | | | 0.32 | | | | 0.35 | | | | 0.35 | | | | 0.32 | | | | 0.35 | |
| | | | | |
Net realized and unrealized gains (losses) | | | 3.39 | | | | (1.31 | ) | | | 2.00 | | | | 6.07 | | | | 1.96 | |
| | | | |
Total from investment operations | | | 3.71 | | | | (0.96 | ) | | | 2.35 | | | | 6.39 | | | | 2.31 | |
| | | | |
| | | | | |
| Less distributions from: | | | | | | | | | | | | | | | | | | | | |
| | | | | |
Net investment income | | | (0.36 | ) | | | (0.41 | ) | | | (0.37 | ) | | | (0.41 | ) | | | (0.36 | ) |
| | | | | |
Net realized gains | | | (3.18 | ) | | | (3.01 | ) | | | (0.55 | ) | | | — | | | | — | |
| | | | |
Total distributions | | | (3.54 | ) | | | (3.42 | ) | | | (0.92 | ) | | | (0.41 | ) | | | (0.36 | ) |
| | | | |
Net asset value, end of year | | | $24.98 | | | | $24.81 | | | | $29.19 | | | | $27.76 | | | | $21.78 | |
| | | | |
| | | | | |
Total returnc | | | 15.93% | | | | (3.75)% | | | | 8.62% | | | | 29.57% | | | | 11.78% | |
| | | | | |
| Ratios to average net assets | | | | | | | | | | | | | | | | | | | | |
| | | | | |
Expenses before waiver and payments by affiliates | | | 0.98% | | | | 0.98% | | | | 0.97% | | | | 0.96% | | | | 0.98% | |
| | | | | |
Expenses net of waiver and payments by affiliates | | | 0.97% | d | | | 0.98% | e | | | 0.97% | e | | | 0.96% | | | | 0.98% | |
| | | | | |
Net investment income | | | 1.32% | | | | 1.30% | | | | 1.23% | | | | 1.24% | | | | 1.61% | |
| | | | | |
| Supplemental data | | | | | | | | | | | | | | | | | | | | |
| | | | | |
Net assets, end of year (000’s) | | | $28,579 | | | | $20,453 | | | | $15,503 | | | | $12,028 | | | | $6,432 | |
| | | | | |
Portfolio turnover rate | | | 6.66% | | | | 4.74% | | | | 8.61% | | | | 0.07% | | | | 11.19% | |
aThe amount shown for a share outstanding throughout the period may not correlate with the Statement of Operations for the period due to the timing of sales and repurchases of the Fund’s shares in relation to income earned and/or fluctuating fair value of the investments of the Fund.
bBased on average daily shares outstanding.
cTotal return does not include fees, charges or expenses imposed by the variable annuity and life insurance contracts for which Franklin Templeton Variable Insurance Products Trust serves as an underlying investment vehicle.
dBenefit of expense reduction rounds to less than 0.01%.
eBenefit of waiver and payments by affiliates rounds to less than 0.01%.
| | | | |
| FRD-8 | | Annual Report | The accompanying notes are an integral part of these financial statements. | | |
FRANKLIN TEMPLETON VARIABLE INSURANCE PRODUCTS TRUST
Statement of Investments, December 31, 2016
| | | | | | | | | | |
| Franklin Rising Dividends VIP Fund | | | | | | |
| | | | | Shares | | | Value | |
| | | Common Stocks 99.0% | | | | | | |
| | | Aerospace & Defense 4.4% | | | | | | |
| | General Dynamics Corp. | | | 157,911 | | | $ | 27,264,913 | |
| | United Technologies Corp. | | | 453,011 | | | | 49,659,066 | |
| | | | | | | | | | |
| | | | | | | | | 76,923,979 | |
| | | | | | | | | | |
| | | Automobiles & Components 0.3% | | | | | | |
| a | | Adient PLC | | | 84,865 | | | | 4,973,089 | |
| | | | | | | | | | |
| | | Building Products 2.0% | | | | | | |
| | Johnson Controls International PLC | | | 848,653 | | | | 34,956,017 | |
| | | | | | | | | | |
| | | Commercial & Professional Services 4.7% | | | | | | |
| | ABM Industries Inc. | | | 779,288 | | | | 31,826,122 | |
| | Brady Corp., A | | | 202,474 | | | | 7,602,899 | |
| | Cintas Corp. | | | 194,675 | | | | 22,496,643 | |
| | Matthews International Corp., A | | | 251,442 | | | | 19,323,317 | |
| | | | | | | | | | |
| | | | | | | | | 81,248,981 | |
| | | | | | | | | | |
| | | Consumer Durables & Apparel 2.2% | | | | | | |
| | Leggett & Platt Inc. | | | 332,800 | | | | 16,267,264 | |
| | NIKE Inc., B | | | 445,100 | | | | 22,624,433 | |
| | | | | | | | | | |
| | | | | | | | | 38,891,697 | |
| | | | | | | | | | |
| | | Consumer Services 1.8% | | | | | | |
| | McDonald’s Corp. | | | 207,045 | | | | 25,201,517 | |
| a | | Yum China Holdings Inc. (China) | | | 72,900 | | | | 1,904,148 | |
| | Yum! Brands Inc. | | | 72,900 | | | | 4,616,757 | |
| | | | | | | | | | |
| | | | | | | | | 31,722,422 | |
| | | | | | | | | | |
| | | Diversified Financials 0.5% | | | | | | |
| | State Street Corp. | | | 110,500 | | | | 8,588,060 | |
| | | | | | | | | | |
| | | Energy 7.2% | | | | | | |
| | Chevron Corp. | | | 252,900 | | | | 29,766,330 | |
| | EOG Resources Inc. | | | 33,600 | | | | 3,396,960 | |
| | Exxon Mobil Corp. | | | 358,500 | | | | 32,358,210 | |
| | Occidental Petroleum Corp. | | | 370,790 | | | | 26,411,372 | |
| | Schlumberger Ltd. | | | 398,000 | | | | 33,412,100 | |
| | | | | | | | | | |
| | | | | | | | | 125,344,972 | |
| | | | | | | | | | |
| | | Food & Staples Retailing 3.9% | | | | | | |
| | CVS Health Corp. | | | 210,200 | | | | 16,586,882 | |
| | Wal-Mart Stores Inc. | | | 352,800 | | | | 24,385,536 | |
| | Walgreens Boots Alliance Inc. | | | 326,000 | | | | 26,979,760 | |
| | | | | | | | | | |
| | | | | | | | | 67,952,178 | |
| | | | | | | | | | |
| | | Food, Beverage & Tobacco 6.1% | | | | | | |
| | Archer-Daniels-Midland Co. | | | 713,000 | | | | 32,548,450 | |
| | Bunge Ltd. | | | 307,700 | | | | 22,228,248 | |
| | McCormick & Co. Inc. | | | 208,900 | | | | 19,496,637 | |
| | PepsiCo Inc. | | | 308,500 | | | | 32,278,355 | |
| | | | | | | | | | |
| | | | | | | | | 106,551,690 | |
| | | | | | | | | | |
| | | Health Care Equipment & Services 12.3% | | | | | | |
| | Abbott Laboratories | | | 641,800 | | | | 24,651,538 | |
| | Becton, Dickinson and Co. | | | 291,200 | | | | 48,208,160 | |
| | DENTSPLY SIRONA Inc. | | | 4,000 | | | | 230,920 | |
| | Medtronic PLC | | | 602,000 | | | | 42,880,460 | |
| | Stryker Corp. | | | 420,200 | | | | 50,344,162 | |
FRANKLIN TEMPLETON VARIABLE INSURANCE PRODUCTS TRUST
STATEMENT OF INVESTMENTS
Franklin Rising Dividends VIP Fund (continued)
| | | | | | | | | | |
| | | | | Shares | | | Value | |
| | | Common Stocks (continued) | | | | | | |
| | | Health Care Equipment & Services (continued) | | | | | | |
| | West Pharmaceutical Services Inc. | | | 560,118 | | | $ | 47,514,810 | |
| | | | | | | | | | |
| | | | | | | | | 213,830,050 | |
| | | | | | | | | | |
| | | Household & Personal Products 2.7% | | | | | | |
| | Colgate-Palmolive Co. | | | 191,000 | | | | 12,499,040 | |
| | The Procter & Gamble Co. | | | 409,000 | | | | 34,388,720 | |
| | | | | | | | | | |
| | | | | | | | | 46,887,760 | |
| | | | | | | | | | |
| | | Industrial Conglomerates 5.9% | | | | | | |
| | Carlisle Cos. Inc. | | | 101,061 | | | | 11,146,018 | |
| | Honeywell International Inc. | | | 257,900 | | | | 29,877,715 | |
| | Roper Technologies Inc. | | | 333,043 | | | | 60,973,512 | |
| | | | | | | | | | |
| | | | | | | | | 101,997,245 | |
| | | | | | | | | | |
| | | Insurance 5.3% | | | | | | |
| | Aflac Inc. | | | 276,200 | | | | 19,223,520 | |
| | Arthur J. Gallagher & Co. | | | 645,400 | | | | 33,534,984 | |
| | Erie Indemnity Co., A | | | 267,952 | | | | 30,131,202 | |
| | Old Republic International Corp. | | | 410,908 | | | | 7,807,252 | |
| | RLI Corp. | | | 33,800 | | | | 2,133,794 | |
| | | | | | | | | | |
| | | | | | | | | 92,830,752 | |
| | | | | | | | | | |
| | | Machinery 6.9% | | | | | | |
| | Donaldson Co. Inc. | | | 350,068 | | | | 14,730,862 | |
| | Dover Corp. | | | 701,176 | | | | 52,539,118 | |
| | Hillenbrand Inc. | | | 348,278 | | | | 13,356,461 | |
| | Pentair PLC (United Kingdom) | | | 704,800 | | | | 39,518,136 | |
| | | | | | | | | | |
| | | | | | | | | 120,144,577 | |
| | | | | | | | | | |
| | | Materials 12.4% | | | | | | |
| | Air Products and Chemicals Inc. | | | 364,000 | | | | 52,350,480 | |
| | Albemarle Corp. | | | 706,700 | | | | 60,832,736 | |
| | Bemis Co. Inc. | | | 147,499 | | | | 7,053,402 | |
| | Ecolab Inc. | | | 115,600 | | | | 13,550,632 | |
| | Nucor Corp. | | | 447,055 | | | | 26,608,714 | |
| | Praxair Inc. | | | 465,760 | | | | 54,582,414 | |
| | | | | | | | | | |
| | | | | | | | | 214,978,378 | |
| | | | | | | | | | |
| | | Media 1.0% | | | | | | |
| | John Wiley & Sons Inc., A | | | 310,700 | | | | 16,933,150 | |
| | | | | | | | | | |
| | | Pharmaceuticals, Biotechnology & Life Sciences 5.7% | | | | | | |
| | AbbVie Inc. | | | 240,800 | | | | 15,078,896 | |
| | Johnson & Johnson | | | 381,800 | | | | 43,987,178 | |
| | Perrigo Co. PLC | | | 208,500 | | | | 17,353,455 | |
| | Pfizer Inc. | | | 669,700 | | | | 21,751,856 | |
| | Roche Holding AG, ADR (Switzerland) | | | 25,000 | | | | 713,250 | |
| | | | | | | | | | |
| | | | | | | | | 98,884,635 | |
| | | | | | | | | | |
| | | Retailing 2.8% | | | | | | |
| | The Gap Inc. | | | 556,300 | | | | 12,483,372 | |
| | Ross Stores Inc. | | | 185,000 | | | | 12,136,000 | |
| | Target Corp. | | | 164,600 | | | | 11,889,058 | |
| | Tiffany & Co. | | | 161,500 | | | | 12,504,945 | |
| | | | | | | | | | |
| | | | | | | | | 49,013,375 | |
| | | | | | | | | | |
FRANKLIN TEMPLETON VARIABLE INSURANCE PRODUCTS TRUST
STATEMENT OF INVESTMENTS
Franklin Rising Dividends VIP Fund (continued)
| | | | | | | | | | |
| | | | | Shares | | | Value | |
| | | Common Stocks (continued) | | | | | | |
| | | Semiconductors & Semiconductor Equipment 4.2% | | | | | | |
| | Analog Devices Inc. | | | 59,900 | | | $ | 4,349,938 | |
| | Linear Technology Corp. | | | 375,000 | | | | 23,381,250 | |
| | QUALCOMM Inc. | | | 210,300 | | | | 13,711,560 | |
| | Texas Instruments Inc. | | | 358,200 | | | | 26,137,854 | |
| a | | Versum Materials Inc. | | | 182,000 | | | | 5,108,740 | |
| | | | | | | | | | |
| | | | | | | | | 72,689,342 | |
| | | | | | | | | | |
| | | Software & Services 5.9% | | | | | | |
| | Accenture PLC, A | | | 231,700 | | | | 27,139,021 | |
| | Microsoft Corp. | | | 1,107,900 | | | | 68,844,906 | |
| | Visa Inc., A | | | 89,500 | | | | 6,982,790 | |
| | | | | | | | | | |
| | | | | | | | | 102,966,717 | |
| | | | | | | | | | |
| | | Trading Companies & Distributors 0.4% | | | | | | |
| | W.W. Grainger Inc. | | | 28,100 | | | | 6,526,225 | |
| | | | | | | | | | |
| | | Transportation 0.4% | | | | | | |
| | United Parcel Service Inc., B | | | 64,800 | | | | 7,428,672 | |
| | | | | | | | | | |
| | | |
| | Total Common Stocks (Cost $1,006,443,813) | | | | | | | 1,722,263,963 | |
| | | | | | | | | | |
| | Short Term Investments (Cost $14,889,095) 0.8% | | | | | | | | |
| | | Money Market Funds 0.8% | | 14,889,095 | | | 14,889,095 | |
| | | | | | | | | | |
| b,c | | Institutional Fiduciary Trust Money Market Portfolio, 0.09% | | | | | | | | |
| | Total Investments (Cost $1,021,332,908) 99.8% | | | | | | | 1,737,153,058 | |
| | Other Assets, less Liabilities 0.2% | | | | | | | 2,872,667 | |
| | | | | | | | | | |
| | Net Assets 100.0% | | | | | | $ | 1,740,025,725 | |
| | | | | | | | | | |
See Abbreviations on page FRD- 21.
aNon-income producing.
bSee Note 3(e) regarding investments in affiliated management investment companies.
cThe rate shown is the annualized seven-day yield at period end.
| | | | | | |
| | | The accompanying notes are an integral part of these financial statements. | Annual Report | | | FRD-11 | |
FRANKLIN TEMPLETON VARIABLE INSURANCE PRODUCTS TRUST
Financial Statements
Statement of Assets and Liabilities
December 31, 2016
| | | | |
| | | Franklin Rising
Dividends VIP Fund | |
Assets: | | | | |
Investments in securities: | | | | |
Cost - Unaffiliated issuers | | $ | 1,006,443,813 | |
Cost - Non-controlled affiliates (Note 3e) | | | 14,889,095 | |
| | | | |
Total cost of investments | | $ | 1,021,332,908 | |
| | | | |
Value - Unaffiliated issuers | | $ | 1,722,263,963 | |
Value - Non-controlled affiliates (Note 3e) | | | 14,889,095 | |
| | | | |
Total value of investments | | | 1,737,153,058 | |
Receivables: | | | | |
Investment securities sold | | | 4,420,533 | |
Capital shares sold | | | 337,122 | |
Dividends | | | 2,909,768 | |
Other assets | | | 120 | |
| | | | |
Total assets | | | 1,744,820,601 | |
| | | | |
Liabilities: | | | | |
Payables: | | | | |
Investment securities purchased | | | 2,058,074 | |
Capital shares redeemed | | | 1,014,173 | |
Management fees | | | 899,772 | |
Distribution fees | | | 654,664 | |
Accrued expenses and other liabilities | | | 168,193 | |
| | | | |
Total liabilities | | | 4,794,876 | |
| | | | |
Net assets, at value | | $ | 1,740,025,725 | |
| | | | |
Net assets consist of: | | | | |
Paid-in capital | | $ | 934,877,130 | |
Undistributed net investment income | | | 23,924,204 | |
Net unrealized appreciation (depreciation) | | | 715,820,150 | |
Accumulated net realized gain (loss) | | | 65,404,241 | |
| | | | |
Net assets, at value | | $ | 1,740,025,725 | |
| | | | |
| |
| Class 1: | | | | |
Net assets, at value | | $ | 181,072,279 | |
| | | | |
Shares outstanding | | | 7,097,688 | |
| | | | |
Net asset value and maximum offering price per share | | $ | 25.51 | |
| | | | |
| |
| Class 2: | | | | |
Net assets, at value | | $ | 1,530,374,044 | |
| | | | |
Shares outstanding | | | 61,477,627 | |
| | | | |
Net asset value and maximum offering price per share | | $ | 24.89 | |
| | | | |
| |
| Class 4: | | | | |
Net assets, at value | | $ | 28,579,402 | |
| | | | |
Shares outstanding | | | 1,143,982 | |
| | | | |
Net asset value and maximum offering price per share | | $ | 24.98 | |
| | | | |
| | | | |
| FRD-12 | | Annual Report | The accompanying notes are an integral part of these financial statements. | | |
FRANKLIN TEMPLETON VARIABLE INSURANCE PRODUCTS TRUST
FINANCIAL STATEMENTS
Statement of Operations
for the year ended December 31, 2016
| | | | |
| | | Franklin Rising
Dividends VIP Fund | |
Investment income: | | | | |
Dividends: | | | | |
Unaffiliated issuers | | $ | 37,772,595 | |
Non-controlled affiliates (Note 3e) | | | 739 | |
| | | | |
Total investment income | | | 37,773,334 | |
| | | | |
Expenses: | | | | |
Management fees (Note 3a) | | | 10,110,214 | |
Distribution fees: (Note 3c) | | | | |
Class 2 | | | 3,638,584 | |
Class 4 | | | 83,113 | |
Custodian fees (Note 4) | | | 14,347 | |
Reports to shareholders | | | 177,630 | |
Professional fees | | | 61,705 | |
Trustees’ fees and expenses | | | 7,449 | |
Other | | | 35,678 | |
| | | | |
Total expenses. | | | 14,128,720 | |
Expense reductions (Note 4) | | | (68 | ) |
Expenses waived/paid by affiliates (Note 3e) | | | (111,562 | ) |
| | | | |
Net expenses | | | 14,017,090 | |
| | | | |
Net investment income | | | 23,756,244 | |
| | | | |
Realized and unrealized gains (losses): | | | | |
Net realized gain (loss) from: | | | | |
Investments | | | 65,502,095 | |
Foreign currency transactions | | | (295 | ) |
| | | | |
Net realized gain (loss) | | | 65,501,800 | |
| | | | |
Net change in unrealized appreciation (depreciation) on investments | | | 155,534,476 | |
| | | | |
Net realized and unrealized gain (loss) | | | 221,036,276 | |
| | | | |
Net increase (decrease) in net assets resulting from operations | | $ | 244,792,520 | |
| | | | |
| | | | | | |
| | | The accompanying notes are an integral part of these financial statements. | Annual Report | | | FRD-13 | |
FRANKLIN TEMPLETON VARIABLE INSURANCE PRODUCTS TRUST
FINANCIAL STATEMENTS
Statements of Changes in Net Assets
| | | | | | | | |
| | | Franklin Rising Dividends VIP Fund | |
| | | Year Ended December 31, | |
| | | 2016 | | | 2015 | |
Increase (decrease) in net assets: | | | | | | | | |
Operations: | | | | | | | | |
Net investment income | | $ | 23,756,244 | | | $ | 23,865,895 | |
Net realized gain (loss) | | | 65,501,800 | | | | 200,231,316 | |
Net change in unrealized appreciation (depreciation) | | | 155,534,476 | | | | (288,246,073 | ) |
| | | | |
Net increase (decrease) in net assets resulting from operations | | | 244,792,520 | | | | (64,148,862 | ) |
| | | | |
Distributions to shareholders from: | | | | | | | | |
Net investment income: | | | | | | | | |
Class 1 | | | (2,718,521 | ) | | | (2,507,451 | ) |
Class 2 | | | (20,665,957 | ) | | | (22,189,853 | ) |
Class 4 | | | (304,600 | ) | | | (275,517 | ) |
Net realized gains: | | | | | | | | |
Class 1 | | | (19,761,965 | ) | | | (15,606,236 | ) |
Class 2 | | | (177,746,237 | ) | | | (164,222,373 | ) |
Class 4 | | | (2,696,441 | ) | | | (2,002,122 | ) |
| | | | |
Total distributions to shareholders | | | (223,893,721 | ) | | | (206,803,552 | ) |
| | | | |
Capital share transactions: (Note 2) | | | | | | | | |
Class 1 | | | 33,560,724 | | | | 6,114,953 | |
Class 2 | | | 203,254,702 | | | | (112,317,852 | ) |
Class 4 | | | 7,699,850 | | | | 7,967,834 | |
| | | | |
Total capital share transactions | | | 244,515,276 | | | | (98,235,065 | ) |
| | | | |
Net increase (decrease) in net assets | | | 265,414,075 | | | | (369,187,479 | ) |
Net assets: | | | | | | | | |
Beginning of year | | | 1,474,611,650 | | | | 1,843,799,129 | |
| | | | |
End of year | | $ | 1,740,025,725 | | | $ | 1,474,611,650 | |
| | | | |
Undistributed net investment income included in net assets: | | | | | | | | |
End of year | | $ | 23,924,204 | | | $ | 23,857,334 | |
| | | | |
| | | | |
| FRD-14 | | Annual Report | The accompanying notes are an integral part of these financial statements. | | |
FRANKLIN TEMPLETON VARIABLE INSURANCE PRODUCTS TRUST
Notes to Financial Statements
Franklin Rising Dividends VIP Fund
1. Organization and Significant Accounting Policies
Franklin Templeton Variable Insurance Products Trust (Trust) is registered under the Investment Company Act of 1940 (1940 Act) as an open-end management investment company, consisting of nineteen separate funds and applies the specialized accounting and reporting guidance in U.S. Generally Accepted Accounting Principles (U.S. GAAP). Franklin Rising Dividends VIP Fund (Fund) is included in this report. The financial statements of the remaining funds in the Trust are presented separately. Shares of the Fund are generally sold only to insurance company separate accounts to fund the benefits of variable life insurance policies or variable annuity contracts. The Fund offers three classes of shares: Class 1, Class 2 and Class 4. Each class of shares differs by its distribution fees, voting rights on matters affecting a single class and its exchange privilege.
The following summarizes the Fund’s significant accounting policies.
a. Financial Instrument Valuation
The Fund’s investments in financial instruments are carried at fair value daily. Fair value is the price that would be received to sell an asset or paid to transfer a liability in an orderly transaction between market participants on the measurement date. The Fund calculates the net asset value (NAV) per share as of 4 p.m. Eastern time each day the New York Stock Exchange (NYSE) is open for trading. Under compliance policies and procedures approved by the Trust’s Board of Trustees (the Board), the Fund’s administrator has responsibility for oversight of valuation, including leading the cross-functional Valuation Committee (VC). The VC provides administration and oversight of the Fund’s valuation policies and procedures, which are approved annually by the Board. Among other things, these procedures allow the Fund to utilize independent pricing services, quotations from securities and financial instrument dealers, and other market sources to determine fair value.
Equity securities listed on an exchange or on the NASDAQ National Market System are valued at the last quoted sale price or the official closing price of the day, respectively. Foreign equity securities are valued as of the close of trading on the foreign stock exchange on which the security is primarily traded or as of 4 p.m. Eastern time. The value is then converted into its U.S. dollar equivalent at the foreign exchange rate in effect at
4 p.m. Eastern time on the day that the value of the security is determined. Over-the-counter (OTC) securities are valued within the range of the most recent quoted bid and ask prices. Securities that trade in multiple markets or on multiple exchanges are valued according to the broadest and most representative market. Certain equity securities are valued based upon fundamental characteristics or relationships to similar securities.
Investments in open-end mutual funds are valued at the closing NAV.
The Fund has procedures to determine the fair value of financial instruments for which market prices are not reliable or readily available. Under these procedures, the VC convenes on a regular basis to review such financial instruments and considers a number of factors, including significant unobservable valuation inputs, when arriving at fair value. The VC primarily employs a market-based approach which may use related or comparable assets or liabilities, recent transactions, market multiples, book values, and other relevant information for the investment to determine the fair value of the investment. An income-based valuation approach may also be used in which the anticipated future cash flows of the investment are discounted to calculate fair value. Discounts may also be applied due to the nature or duration of any restrictions on the disposition of the investments. Due to the inherent uncertainty of valuations of such investments, the fair values may differ significantly from the values that would have been used had an active market existed. The VC employs various methods for calibrating these valuation approaches including a regular review of key inputs and assumptions, transactional back-testing or disposition analysis, and reviews of any related market activity.
Trading in securities on foreign securities stock exchanges and OTC markets may be completed before 4 p.m. Eastern time. In addition, trading in certain foreign markets may not take place on every Fund’s business day. Occasionally, events occur between the time at which trading in a foreign security is completed and 4 p.m. Eastern time that might call into question the reliability of the value of a portfolio security held by the Fund. As a result, differences may arise between the value of the Fund’s portfolio securities as determined at the foreign market close and the latest indications of value at 4 p.m. Eastern time. In order to minimize the potential for these differences, the VC monitors price movements following the close of trading in foreign stock markets through a series of country specific market proxies (such as baskets of American
FRANKLIN TEMPLETON VARIABLE INSURANCE PRODUCTS TRUST
NOTES TO FINANCIAL STATEMENTS
Franklin Rising Dividends VIP Fund (continued)
1. Organization and Significant Accounting
Policies (continued)
a. Financial Instrument Valuation (continued)
Depositary Receipts, futures contracts and exchange traded funds). These price movements are measured against established trigger thresholds for each specific market proxy to assist in determining if an event has occurred that may call into question the reliability of the values of the foreign securities held by the Fund. If such an event occurs, the securities may be valued using fair value procedures, which may include the use of independent pricing services.
When the last day of the reporting period is a non-business day, certain foreign markets may be open on those days that the Fund’s NAV is not calculated, which could result in differences between the value of the Fund’s portfolio securities on the last business day and the last calendar day of the reporting period. Any significant security valuation changes due to an open foreign market are adjusted and reflected by the Fund for financial reporting purposes.
b. Foreign Currency Translation
Portfolio securities and other assets and liabilities denominated in foreign currencies are translated into U.S. dollars based on the exchange rate of such currencies against U.S. dollars on the date of valuation. The Fund may enter into foreign currency exchange contracts to facilitate transactions denominated in a foreign currency. Purchases and sales of securities, income and expense items denominated in foreign currencies are translated into U.S. dollars at the exchange rate in effect on the transaction date. Portfolio securities and assets and liabilities denominated in foreign currencies contain risks that those currencies will decline in value relative to the U.S. dollar. Occasionally, events may impact the availability or reliability of foreign exchange rates used to convert the U.S. dollar equivalent value. If such an event occurs, the foreign exchange rate will be valued at fair value using procedures established and approved by the Board.
The Fund does not separately report the effect of changes in foreign exchange rates from changes in market prices on securities held. Such changes are included in net realized and unrealized gain or loss from investments in the Statement of Operations.
Realized foreign exchange gains or losses arise from sales of foreign currencies, currency gains or losses realized between the trade and settlement dates on securities transactions and the
difference between the recorded amounts of dividends, interest, and foreign withholding taxes and the U.S. dollar equivalent of the amounts actually received or paid. Net unrealized foreign exchange gains and losses arise from changes in foreign exchange rates on foreign denominated assets and liabilities other than investments in securities held at the end of the reporting period.
c. Income and Deferred Taxes
It is the Fund’s policy to qualify as a regulated investment company under the Internal Revenue Code. The Fund intends to distribute to shareholders substantially all of its taxable income and net realized gains to relieve it from federal income and if applicable, excise taxes. As a result, no provision for U.S. federal income taxes is required.
The Fund may be subject to foreign taxation related to income received, capital gains on the sale of securities and certain foreign currency transactions in the foreign jurisdictions in which it invests. Foreign taxes, if any, are recorded based on the tax regulations and rates that exist in the foreign markets in which the Fund invests. When a capital gain tax is determined to apply, the Fund records an estimated deferred tax liability in an amount that would be payable if the securities were disposed of on the valuation date.
The Fund may recognize an income tax liability related to its uncertain tax positions under U.S. GAAP when the uncertain tax position has a less than 50% probability that it will be sustained upon examination by the tax authorities based on its technical merits. As of December 31, 2016, the Fund has determined that no tax liability is required in its financial statements related to uncertain tax positions for any open tax years (or expected to be taken in future tax years). Open tax years are those that remain subject to examination and are based on each tax jurisdiction’s statute of limitation.
d. Security Transactions, Investment Income, Expenses and Distributions
Security transactions are accounted for on trade date. Realized gains and losses on security transactions are determined on a specific identification basis. Estimated expenses are accrued daily. Dividend income is recorded on the ex-dividend date except for certain dividends from securities where the dividend rate is not available. In such cases, the dividend is recorded as soon as the information is received by the Fund. Distributions to shareholders are recorded on the ex-dividend date and are
FRANKLIN TEMPLETON VARIABLE INSURANCE PRODUCTS TRUST
NOTES TO FINANCIAL STATEMENTS
Franklin Rising Dividends VIP Fund (continued)
determined according to income tax regulations (tax basis). Distributable earnings determined on a tax basis may differ from earnings recorded in accordance with U.S. GAAP. These differences may be permanent or temporary. Permanent differences are reclassified among capital accounts to reflect their tax character. These reclassifications have no impact on net assets or the results of operations. Temporary differences are not reclassified, as they may reverse in subsequent periods.
Common expenses incurred by the Trust are allocated among the Funds based on the ratio of net assets of each Fund to the combined net assets of the Trust. Fund specific expenses are charged directly to the Fund that incurred the expense.
Realized and unrealized gains and losses and net investment income, not including class specific expenses, are allocated daily to each class of shares based upon the relative proportion of net assets of each class. Differences in per share distributions, by class, are generally due to differences in class specific expenses.
e. Accounting Estimates
The preparation of financial statements in accordance with U.S. GAAP requires management to make estimates and assumptions that affect the reported amounts of assets and
liabilities at the date of the financial statements and the amounts of income and expenses during the reporting period. Actual results could differ from those estimates.
f. Guarantees and Indemnifications
Under the Trust’s organizational documents, its officers and trustees are indemnified by the Trust against certain liabilities arising out of the performance of their duties to the Trust. Additionally, in the normal course of business, the Trust, on behalf of the Fund, enters into contracts with service providers that contain general indemnification clauses. The Trust’s maximum exposure under these arrangements is unknown as this would involve future claims that may be made against the Trust that have not yet occurred. Currently, the Trust expects the risk of loss to be remote.
2. Shares of Beneficial Interest
At December 31, 2016, there were an unlimited number of shares authorized (without par value). Transactions in the Fund’s shares were as follows:
| | | | | | | | | | | | | | | | | | | | |
| | | Year Ended December 31, | |
| | | 2016 | | | | | | 2015 | |
| | | Shares | | | Amount | | | | | | Shares | | | Amount | |
| | | | | |
| Class 1 Shares: | | | | | | | | | | | | | | | | | | | | |
Shares sold | | | 1,408,862 | | | $ | 34,658,685 | | | | | | | | 379,085 | | | $ | 9,885,431 | |
Shares issued in reinvestment of distributions | | | 944,162 | | | | 22,480,486 | | | | | | | | 689,257 | | | | 18,113,687 | |
Shares redeemed | | | (931,787 | ) | | | (23,578,447 | ) | | | | | | | (808,697 | ) | | | (21,884,165 | ) |
| | | | |
Net increase (decrease) | | | 1,421,237 | | | $ | 33,560,724 | | | | | | | | 259,645 | | | $ | 6,114,953 | |
| | | | |
| Class 2 Shares: | | | | | | | | | | | | | | | | | | | | |
Shares sold | | | 9,423,278 | | | $ | 238,665,574 | | | | | | | | 4,959,597 | | | $ | 130,929,237 | |
Shares issued in reinvestment of distributions | | | 8,526,523 | | | | 198,412,194 | | | | | | | | 7,239,310 | | | | 186,412,226 | |
Shares redeemed | | | (9,496,533 | ) | | | (233,823,066 | ) | | | | | | | (16,563,559 | ) | | | (429,659,315 | ) |
| | | | |
Net increase (decrease) | | | 8,453,268 | | | $ | 203,254,702 | | | | | | | | (4,364,652 | ) | | $ | (112,317,852 | ) |
| | | | |
FRANKLIN TEMPLETON VARIABLE INSURANCE PRODUCTS TRUST
NOTES TO FINANCIAL STATEMENTS
Franklin Rising Dividends VIP Fund (continued)
2. Shares of Beneficial Interest (continued)
| | | | | | | | | | | | | | | | | | | | |
| | | Year Ended December 31, | |
| | | 2016 | | | | | | 2015 | |
| | | Shares | | | Amount | | | | | | Shares | | | Amount | |
| | | | | |
| Class 4 Shares: | | | | | | | | | | | | | | | | | | | | |
Shares sold | | | 404,421 | | | $ | 9,995,211 | | | | | | | | 322,291 | | | $ | 8,758,972 | |
Shares issued in reinvestment of distributions | | | 128,469 | | | | 3,001,041 | | | | | | | | 88,076 | | | | 2,277,639 | |
Shares redeemed | | | (213,254 | ) | | | (5,296,402 | ) | | | | | | | (117,097 | ) | | | (3,068,777 | ) |
| | | | |
Net increase (decrease) | | | 319,636 | | | $ | 7,699,850 | | | | | | | | 293,270 | | | $ | 7,967,834 | |
| | | | |
3. Transactions with Affiliates
Franklin Resources, Inc. is the holding company for various subsidiaries that together are referred to as Franklin Templeton Investments. Certain officers and trustees of the Fund are also officers and/or directors of the following subsidiaries:
| | |
| Subsidiary | | Affiliation |
Franklin Advisory Services, LLC (Advisory Services) | | Investment manager |
Franklin Templeton Services, LLC (FT Services) | | Administrative manager |
Franklin Templeton Distributors, Inc. (Distributors) | | Principal underwriter |
Franklin Templeton Investor Services, LLC (Investor Services) | | Transfer agent |
a. Management Fees
The Fund pays an investment management fee to Advisory Services based on the average daily net assets of the Fund as follows:
| | |
| Annualized Fee Rate | | Net Assets |
0.750% | | Up to and including $500 million |
0.625% | | Over $500 million, up to and including $1 billion |
0.500% | | In excess of $1 billion |
For the year ended December 31, 2016, the effective investment management fee rate was 0.614% of the Fund’s average daily net assets.
b. Administrative Fees
Under an agreement with Advisory Services, FT Services provides administrative services to the Fund. The fee is paid by Advisory Services based on the Fund’s average daily net assets, and is not an additional expense of the Fund.
c. Distribution Fees
The Board has adopted distribution plans for Class 2 and Class 4 shares pursuant to Rule 12b-1 under the 1940 Act. Under the Fund’s compensation distribution plans, the Fund pays Distributors for costs incurred in connection with the servicing, sale and distribution of the Fund’s shares up to 0.35% per year of its average daily net assets of each class. The Board has agreed to limit the current rate to 0.25% per year for Class 2. The plan year, for purposes of monitoring compliance with the maximum annual plan rates, is February 1 through January 31.
FRANKLIN TEMPLETON VARIABLE INSURANCE PRODUCTS TRUST
NOTES TO FINANCIAL STATEMENTS
Franklin Rising Dividends VIP Fund (continued)
d. Transfer Agent Fees
Investor Services, under terms of an agreement, performs shareholder servicing for the Fund and is not paid by the Fund for the services.
e. Investments in Affiliated Management Investment Companies
The Fund invests in one or more affiliated management investment companies for purposes other than exercising a controlling influence over the management or policies. Management fees paid by the Fund are waived on assets invested in the affiliated management investment companies, as noted in the Statement of Operations, in an amount not to exceed the management and administrative fees paid directly or indirectly by each affiliate. Prior to January 1, 2014, the waiver was accounted for as a reduction to management fees. During the year ended December 31, 2016, the Fund held investments in affiliated management investment companies as follows:
| | | | | | | | | | | | | | | | | | | | | | | | | | | | | | | | |
| | | Number
of Shares
Held at
Beginning
of Year | | | Gross
Additions | �� | | Gross
Reductions | | | Number
of Shares
Held at
End of
Year | | | Value at
End of
Year | | | Investment
Income | | | Realized
Gain
(Loss) | | | % of Affiliated
Fund Shares
Outstanding
Held at End
of Year | |
| Non-Controlled Affiliates | | | | | | | | | | | | | | | | | | | | | | | | | | | | | | | | |
Institutional Fiduciary Trust Money Market
Portfolio, 0.09% | | | 292,061 | | | | 215,633,691 | | | | (201,036,657 | ) | | | 14,889,095 | | | $ | 14,889,095 | | | $ | 739 | | | $ | — | | | | 0.1% | |
| | | | | | | | | | | | | | | | | | | | | | | | |
4. Expense Offset Arrangement
The Fund has entered into an arrangement with its custodian whereby credits realized as a result of uninvested cash balances are used to reduce a portion of the Fund’s custodian expenses. During the year ended December 31, 2016, the custodian fees were reduced as noted in the Statement of Operations.
5. Income Taxes
The tax character of distributions paid during the years ended December 31, 2016 and 2015, was as follows:
| | | | | | | | |
| | | 2016 | | | 2015 | |
Distributions paid from: | | | | | | | | |
Ordinary income | | $ | 23,726,865 | | | $ | 25,129,889 | |
Long term capital gain | | | 200,166,856 | | | | 181,673,663 | |
| | | | |
| | $ | 223,893,721 | | | $ | 206,803,552 | |
| | | | |
FRANKLIN TEMPLETON VARIABLE INSURANCE PRODUCTS TRUST
NOTES TO FINANCIAL STATEMENTS
Franklin Rising Dividends VIP Fund (continued)
5. Income Taxes (continued)
At December 31, 2016, the cost of investments, net unrealized appreciation (depreciation), undistributed ordinary income and undistributed long term capital gains for income tax purposes were as follows:
| | | | |
Cost of investments | | $ | 1,025,372,961 | |
| | | | |
Unrealized appreciation | | $ | 745,389,574 | |
Unrealized depreciation | | | (33,609,477 | ) |
| | | | |
Net unrealized appreciation (depreciation) | | $ | 711,780,097 | |
| | | | |
Undistributed ordinary income | | $ | 27,923,588 | |
Undistributed long term capital gains | | | 65,444,906 | |
| | | | |
Distributable earnings | | $ | 93,368,494 | |
| | | | |
Differences between income and/or capital gains as determined on a book basis and a tax basis are primarily due to differing treatments of corporate actions and wash sales.
6. Investment Transactions
Purchases and sales of investments (excluding short term securities) for the year ended December 31, 2016, aggregated $158,080,043 and $107,313,866, respectively.
7. Credit Facility
The Fund, together with other U.S. registered and foreign investment funds (collectively, Borrowers), managed by Franklin Templeton Investments, are borrowers in a joint syndicated senior unsecured credit facility totaling $2 billion (Global Credit Facility) which matured on February 10, 2017. This Global Credit Facility provides a source of funds to the Borrowers for temporary and emergency purposes, including the ability to meet future unanticipated or unusually large redemption requests. Effective February 10, 2017, the Borrowers renewed the Global Credit Facility for a one year term, maturing February 9, 2018, for a total of $2 billion.
Under the terms of the Global Credit Facility, the Fund shall, in addition to interest charged on any borrowings made by the Fund and other costs incurred by the Fund, pay its share of fees and expenses incurred in connection with the implementation and maintenance of the Global Credit Facility, based upon its relative share of the aggregate net assets of all of the Borrowers, including an annual commitment fee of 0.15% based upon the unused portion of the Global Credit Facility. These fees are reflected in other expenses in the Statement of Operations. During the year ended December 31, 2016, the Fund did not use the Global Credit Facility.
8. Fair Value Measurements
The Fund follows a fair value hierarchy that distinguishes between market data obtained from independent sources (observable inputs) and the Fund’s own market assumptions (unobservable inputs). These inputs are used in determining the value of the Fund’s financial instruments and are summarized in the following fair value hierarchy:
| | • | | Level 1 – quoted prices in active markets for identical financial instruments |
| | • | | Level 2 – other significant observable inputs (including quoted prices for similar financial instruments, interest rates, prepayment speed, credit risk, etc.) |
FRANKLIN TEMPLETON VARIABLE INSURANCE PRODUCTS TRUST
NOTES TO FINANCIAL STATEMENTS
Franklin Rising Dividends VIP Fund (continued)
| | • | | Level 3 – significant unobservable inputs (including the Fund’s own assumptions in determining the fair value of financial instruments) |
The input levels are not necessarily an indication of the risk or liquidity associated with financial instruments at that level.
For movements between the levels within the fair value hierarchy, the Fund has adopted a policy of recognizing the transfers as of the date of the underlying event which caused the movement.
At December 31, 2016, all of the Fund’s investments in financial instruments carried at fair value were valued using Level 1 inputs. For detailed categories, see the accompanying Statement of Investments.
9. Investment Company Reporting Modernization
In October 2016, the U.S. Securities and Exchange Commission adopted new rules and amended existing rules (together, final rules) intended to modernize the reporting and disclosure of information by registered investment companies. In part, the final rules amend Regulation S-X and require standardized, enhanced disclosures about derivatives in investment company financial statements, as well as other amendments. The compliance date for the amendments to Regulation S-X is August 1, 2017. Management is currently evaluating the impact that the adoption of the amendments to Regulation S-X will have on the Fund’s financial statements and related disclosures.
10. Subsequent Events
The Fund has evaluated subsequent events through the issuance of the financial statements and determined that no events have occurred that require disclosure other than those already disclosed in the financial statements.
Abbreviations
| | |
| Selected Portfolio |
| |
| ADR | | American Depositary Receipt |
FRANKLIN TEMPLETON VARIABLE INSURANCE PRODUCTS TRUST
Report of Independent Registered Public Accounting Firm
Franklin Rising Dividends VIP Fund
To the Board of Trustees and Shareholders of Franklin Templeton Variable Insurance Products Trust
In our opinion, the accompanying statement of assets and liabilities, including the statement of investments, and the related statements of operations and of changes in net assets and the financial highlights present fairly, in all material respects, the financial position of Franklin Rising Dividends VIP Fund (the “Fund”) as of December 31, 2016, the results of its operations for the year then ended, the changes in its net assets for each of the two years in the period then ended and the financial highlights for the periods presented, in conformity with accounting principles generally accepted in the United States of America. These financial statements and financial highlights (hereafter referred to as “financial statements”) are the responsibility of the Fund’s management. Our responsibility is to express an opinion on these financial statements based on our audits. We conducted our audits of these financial statements in accordance with the standards of the Public Company Accounting Oversight Board (United States). Those standards require that we plan and perform the audit to obtain reasonable assurance about whether the financial statements are free of material misstatement. An audit includes examining, on a test basis, evidence supporting the amounts and disclosures in the financial statements, assessing the accounting principles used and significant estimates made by management, and evaluating the overall financial statement presentation. We believe that our audits, which included confirmation of securities as of December 31, 2016 by correspondence with the custodian, transfer agent and brokers, provide a reasonable basis for our opinion.
PricewaterhouseCoopers LLP
San Francisco, California
February 15, 2017
FRANKLIN TEMPLETON VARIABLE INSURANCE PRODUCTS TRUST
Tax Information (unaudited)
Franklin Rising Dividends VIP Fund
Under Section 852(b)(3)(C) of the Internal Revenue Code (Code), the Fund hereby reports the maximum amount allowable but no less than $200,166,856 as a long term capital gain dividend for the fiscal year ended December 31, 2016.
Under Section 854(b)(1)(A) of the Code, the Fund hereby reports 100% of the ordinary income dividends as income qualifying for the dividends received deduction for the fiscal year ended December 31, 2016.
Franklin Small Cap Value VIP Fund
This annual report for Franklin Small Cap Value VIP Fund covers the fiscal year ended December 31, 2016.
Class 2 Performance Summary as of December 31, 2016
Average annual total return of Class 2 shares* represents the average annual change in value, assuming reinvestment of dividends and capital gains. Average returns smooth out variations in returns, which can be significant; they are not the same as year-by-year results.
| | | | | | | | | | | | |
| Periods ended 12/31/16 | | 1-Year | | | 5-Year | | | 10-Year | |
Average Annual Total Return | | | +30.19% | | | | +14.36% | | | | +7.38% | |
*The Fund has a fee waiver associated with any investment it makes in a Franklin Templeton money fund and/or other Franklin Templeton fund, contractually guaranteed through its current fiscal year-end. Fund investment results reflect the fee waiver; without this waiver, the results would have been lower.
Performance reflects the Fund’s Class 2 operating expenses, but does not include any contract fees, expenses or sales charges. If they had been included, performance would be lower. These charges and deductions, particularly for variable life policies, can have a significant effect on contract values and insurance benefits. See the contract prospectus for a complete description of these expenses, including sales charges.
Performance data represent past performance, which does not guarantee future results. Investment return and principal value will fluctuate, and you may have a gain or loss when you sell your shares. Current performance may differ from figures shown.
Total Return Index Comparison for a Hypothetical $10,000 Investment (1/1/07–12/31/16)
The graph below shows the change in value of a hypothetical $10,000 investment in the Fund over the indicated period and includes reinvestment of any income or distributions. The Fund’s performance* is compared to the performance of its new benchmark, the Russell 2000™ Value Index, and its old benchmark, the Russell 2500TM Value Index. We believe the composition of the new index aligns more closely with the Fund’s portfolio. One cannot invest directly in an index, and an index is not representative of the Fund’s portfolio. Please see Important Notes to Performance Information preceding the Fund Summaries.
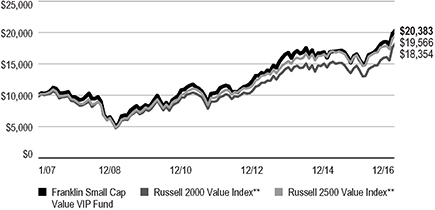
**Source: Morningstar. Please see Index Descriptions following the Fund Summaries.
FRANKLIN SMALL CAP VALUE VIP FUND
Fund Goal and Main Investments
The Fund seeks long-term total return. Under normal market conditions, the Fund invests at least 80% of its net assets in investments of small capitalization companies. For this Fund, small capitalization companies are those with market capitalizations under $3.5 billion at the time of purchase. The Fund generally invests in equity securities of companies that the manager believes are undervalued and have the potential for capital appreciation.
Fund Risks
All investments involve risks, including possible loss of principal. The Fund’s investments in smaller company stocks carry special risks as such stocks have historically exhibited greater price volatility than large-company stocks, particularly over the short term. Additionally, smaller companies often have relatively small revenues, limited product lines and a small market share. In addition, the Fund may invest up to 25% of its total assets in foreign securities, which involve special risks, including currency fluctuations and economic and political uncertainty. The Fund also may invest in equity real estate investment trusts (REITs). The Fund is actively managed but there is no guarantee that the manager’s investment decisions will produce the desired results. The Fund’s prospectus also includes a description of the main investment risks.
Performance Overview
You can find the Fund’s one-year total return in the Performance Summary. In comparison, the Fund’s new benchmark, the Russell 2000TM Value Index posted a +31.74% total return for the same period, while its old benchmark, the Russell 2500TM Value Index, had a +25.20% total return.1 We believe the composition of the new index aligns more closely with the Fund’s portfolio. Please note the Fund employs a bottom-up stock selection process, and the managers invest in securities without regard to
benchmark comparisons.
Economic and Market Overview
The U.S. economy expanded during the 12 months under review. The economy grew at a faster pace in 2016’s third quarter than in the second and first quarters, mainly due to personal consumption expenditures, exports, private inventory
investment, federal government spending and nonresidential fixed investment. Manufacturing conditions remained volatile but generally expanded, and the services sector also continued to grow for most of the period. The unemployment rate decreased from 5.0% in December 2015 to 4.7% at period-end.2 Monthly retail sales grew for most of the review period, and rose to its highest level in April in more than a year, due to a broad-based increase across most retail categories. Inflation, as measured by the Consumer Price Index, remained relatively subdued for most of the period, but rose in 2016’s fourth quarter.
After maintaining its target interest rate in the 0.25%–0.50% range for nearly a year, the U.S. Federal Reserve (Fed), at its December meeting, increased its target range for the federal funds rate to 0.50%–0.75%, as policymakers noted improvement in U.S. labor market and inflation. The Federal Open Market Committee also hinted at three additional hikes in 2017. Furthermore, the Fed raised its forecast for 2017 U.S. economic growth, and lowered its unemployment projections.
U.S. equity markets rose during the review period, benefiting from mostly upbeat economic data and better corporate earnings in the U.S., signs of improvement in the Chinese and European economies and ongoing expansionary monetary policies from key central banks. Other contributing factors included investors’ expectations of higher interest rates and inflation in the U.S. driven by hopes of expansionary fiscal policies under the new president Donald Trump, and an Organization of the Petroleum Exporting Countries deal to curb oil production. The Fed’s decision to keep interest rates unchanged at its November meeting further boosted investor confidence. However, the U.K.’s historic vote to leave the European Union (also known as “Brexit”) and global growth concerns weighed on market sentiment. The broad U.S. stock market ended the 12-month period higher, as measured by the Standard & Poor’s® 500 Index.3
Investment Strategy
We generally invest in stocks that we believe are undervalued and have the potential for capital appreciation. We consider a stock price a “value” when it trades at less than the price at which we believe it would trade if the market reflected all factors relating to the company’s worth. Accordingly, we invest
1. Source: Morningstar. One cannot invest directly in an index, and an index is not representative of the Fund’s portfolio. Please see Index Descriptions following the Fund Summaries.
2. Source: Bureau of Labor Statistics.
3. Please see Index Descriptions following the Fund Summaries.
The dollar value, number of shares or principal amount, and names of all portfolio holdings are listed in the Fund’s Statement of Investments (SOI).
FRANKLIN SMALL CAP VALUE VIP FUND
in companies that we believe have, for example, stock prices that are low relative to current or historical or future earnings, book value, cash flow or sales; recent sharp price declines but the potential for good long-term earnings prospects; and valuable intangibles not reflected in the stock price. Companies in which we may invest include those that may be considered out of favor, such as companies attempting to recover from bankruptcy, business setbacks, adverse events or cyclical downturns, or that may be considered potential takeover targets.
Manager’s Discussion
For the fiscal year ended December 31, 2016, some contributors to absolute Fund performance included Axiall, Astec Industries and LCI Industries.
Axiall, a chemical and building products manufacturer, was the subject of an all-cash takeover offer by Westlake Chemical (not a Fund holding) at a significant premium to Axiall’s share price at the time of the announcement. We exited our position in Axiall during the reporting period. Astec Industries, a manufacturer of road paving and construction related equipment, benefited from optimism surrounding further federal funding for highways, strong sales of new products such as wood pellet plants, a growing backlog and improved profitability due to increased overhead absorption. LCI Industries, formerly known as Drew Industries, is the dominant component supplier for recreational vehicles. The company consistently beat sales and earnings expectations during the year, driven by strong sales momentum as industry volumes recovered to pre-recession peaks, while favorable commodity costs along with better operating efficiencies supported significant margin expansion.
Detractors from absolute Fund performance included Bristow Group, Invacare and STERIS.
Bristow Group, a provider of helicopter transportation services to the offshore oil and gas industry, along with search and rescue operations to government entities, reported weak earnings and cut its dividend as declining energy prices early in the year, along with competitor pressures, negatively affected both revenues and profitability. We exited our position in Bristow during the reporting period. Invacare, a provider of wheelchairs, patient transportation and support systems, and respiratory products to home medical equipment providers, has been undergoing a turnaround, which has negatively affected both revenues and earnings. Invacare exited low-margin products in North America, while operating expenses and interest costs increased due to retraining of its sales force and issuance of debt. Overall, the turnaround was going slower than
Portfolio Composition
Based on Total Net Assets as of 12/31/16
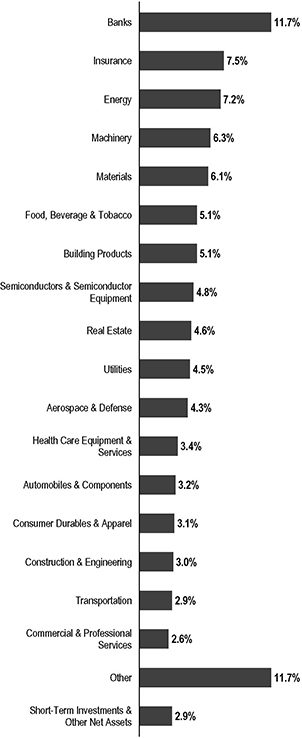
we expected, and we exited our position in Invacare during the period. STERIS, a provider of sterilization equipment, consumables and sterilization services to health care providers, laboratories and medical equipment companies, reported weak
FRANKLIN SMALL CAP VALUE VIP FUND
earnings during the period due to a slowdown in its instrument repair business from competitive pressures and negative currency effects from Brexit, the U.K.’s historic referendum to leave the European Union. Additionally, capital equipment sales were negatively impacted due to a delay in backlog conversion related to new projects.
During the period, we initiated several positions including First Horizon National, a bank holding company; Mueller Water Products, a manufacturer of products and services for transmitting, distributing and measuring water; Spirit Airlines, an airline operator; Cubic, a product and service provider to the transportation and defense markets; and BNC Bancorp, a commercial bank. The Fund also added to holdings including Columbia Banking System, a bank holding company; Brandywine Realty Trust, a real estate investment trust; and Kennametal, an industrial goods manufacturer; among several others. Conversely, we exited some positions including Teleflex, Crocs and the aforementioned Axiall, along with Ingram Micro and StanCorp Financial, both of which were due to takeovers. We reduced our positions in Universal Forest Products, Regal Beloit and the aforementioned LCI Industries, among others.
Thank you for your participation in Franklin Small Cap Value VIP Fund. We look forward to serving your future investment needs.
The foregoing information reflects our analysis, opinions and portfolio holdings as of December 31, 2016, the end of the reporting period. The way we implement our main investment strategies and the resulting portfolio holdings may change depending on factors such as market and economic conditions. These opinions may not be relied upon as investment advice or an offer for a particular security. The information is not a complete analysis of every aspect of any market, country, industry, security or the Fund. Statements of fact are from sources considered reliable, but the investment manager makes no representation or warranty as to their completeness or accuracy. Although historical performance is no guarantee of future results, these insights may help you understand our investment management philosophy.
| | | | |
| Top 10 Holdings | | | |
| 12/31/16 | | | |
Company Sector/Industry | | % of Total Net Assets | |
AAR Corp.
Aerospace & Defense | | | 2.5% | |
Maple Leaf Foods Inc.
Food, Beverage & Tobacco | | | 2.5% | |
Sensient Technologies Corp.
Materials | | | 2.4% | |
Unit Corp.
Energy | | | 2.4% | |
IDACORP Inc.
Utilities | | | 2.3% | |
LTC Properties Inc.
Real Estate | | | 2.3% | |
Chemical Financial Corp.
Banks | | | 2.2% | |
Spire Inc.
Utilities | | | 2.0% | |
Carlisle Cos. Inc.
Industrial Conglomerates | | | 1.9% | |
Columbia Banking System Inc.
Banks | | | 1.8% | |
FRANKLIN SMALL CAP VALUE VIP FUND
Class 2 Fund Expenses
As an investor in a variable insurance contract (Contract) that indirectly provides for investment in an underlying mutual fund, you can incur transaction and/or ongoing expenses at both the Fund level and the Contract Level: (1) transaction expenses can include sales charges (loads) on purchases, surrender fees, transfer fees and premium taxes; and (2) ongoing expenses can include management fees, distribution and service (12b-1) fees, contract fees, annual maintenance fees, mortality and expense risk fees and other fees and expenses. All mutual funds and Contracts have some types of ongoing expenses. The table below shows Fund-level ongoing expenses and can help you understand these costs and compare them with those of other mutual funds offered through the Contract. The table assumes a $1,000 investment held for the six months indicated. Please refer to the Fund prospectus for additional information on operating expenses.
Actual Fund Expenses
The table below provides information about the actual account values and actual expenses in the columns under the heading “Actual.” In these columns the Fund’s actual return, which includes the effect of ongoing Fund expenses but does not include the effect of ongoing Contract expenses, is used to calculate the “Ending Account Value.”
You can estimate the Fund-level expenses you paid during the period by following these steps (of course, your account value and expenses will differ from those in this illustration):
| | Divide your account value by $1,000 |
| | (if your account had an $8,600 value, |
| | then $8,600 ÷ $1,000 = 8.6). |
| | Then multiply the result by the number under the headings “Actual” and “Fund-Level Expenses Paid During Period” |
| | (if Fund-Level Expenses Paid During Period were $ 7.50, |
| | then 8.6 x $7.50 = $64.50). |
In this illustration, the estimated expenses paid this period at the Fund level are $64.50.
Hypothetical Example for Comparison with Other Mutual Funds
Under the heading “Hypothetical” in the table, information is provided about hypothetical account values and hypothetical expenses based on the Fund’s actual expense ratio and an assumed rate of return of 5% per year before expenses, which is not the Fund’s actual return. This information may not be used to estimate the actual ending account balance or expenses you paid for the period, but it can help you compare ongoing costs of investing in the Fund with those of other mutual funds offered through the Contract. To do so, compare this 5% hypothetical example with the 5% hypothetical examples that appear in the shareholder reports of other funds offered through the Contract.
Please note that expenses shown in the table are meant to highlight ongoing costs at the Fund level only and do not reflect any ongoing expenses at the Contract level, or transaction expenses at either the Fund or Contract levels. In addition, while the Fund does not have transaction expenses, if the transaction and ongoing expenses at the Contract level were included, the expenses shown below would be higher. You should consult your Contract prospectus or disclosure document for more information.
| | | | | | | | | | | | | | | | | | | | | | | | |
| | | | | | Actual
(actual return after expenses) | | | Hypothetical
(5% annual return before expenses) | | | | |
| Share Class | |
| Beginning Account
Value 7/1/16 |
| |
| Ending Account
Value 12/31/16 |
| |
| Fund-Level
Expenses Paid During Period 7/1/16–12/31/16 |
1,2 | |
| Ending Account
Value 12/31/16 |
| |
| Fund-Level
Expenses Paid During Period 7/1/16–12/31/16 |
1,2 | |
| Net
Annualized Expense Ratio |
2 |
Class 2 | | | $1,000 | | | | $1,170.50 | | | | $4.86 | | | | $1,020.66 | | | | $4.52 | | | | 0.89% | |
1. Expenses are equal to the annualized expense ratio for the six-month period as indicated above–in the far right column–multiplied by the simple average account value over the period indicated, and then multiplied by 184/366 to reflect the one-half year period.
2. Reflects expenses after fee waivers and expense reimbursements. Does not include any ongoing expenses of the Contract for which the Fund is an investment option or acquired fund fees and expenses.
VIP2 P1, P2, P4 07/16
SUPPLEMENT DATED JULY 18, 2016
TO THE PROSPECTUSES DATED MAY 1, 2016
OF
FRANKLIN GLOBAL REAL ESTATE VIP FUND
FRANKLIN SMALL CAP VALUE VIP FUND
(Series of Franklin Templeton Variable Insurance Products Trust)
IMPORTANT NOTICE REGARDING CHANGE IN INVESTMENT POLICY
The prospectus of Franklin Small Cap Value VIP Fund is amended as follows:
I. The first paragraph under the “FUND SUMMARIES” – “Principal Investment Strategies” section, on page FSV-S1, is replaced with the following:
Under normal market conditions, the Fund invests at least 80% of its net assets in investments of small-capitalization (small-cap) companies. Small-cap companies are companies with market capitalizations (the total market value of a company’s outstanding stock) under $3.5 billion at the time of purchase. Effective September 30, 2016, the definition of small-cap companies will be revised to read as follows: Small-cap companies are companies with market capitalizations (the total market value of a company’s outstanding stock) not exceeding either: 1) the highest market capitalization in the Russell 2000 Index; or 2) the 12-month average of the highest market capitalization in the Russell 2000 Index, whichever is greater, at the time of purchase. As of May 31, 2016, the highest market capitalization in the Russell 2000 Index was $5.96 billion.
II. The “Performance” section, on page FSV-S3, is revised to add the following:
| | | | | | |
| | | 1 Year | | 5 Years | | 10 Years |
| Russell 2000 Value Index (index reflects no deduction for fees, expenses or taxes)1 | | -7.47% | | 7.67% | | 5.58% |
| 1. | Performance figures as of December 31, 2015. The Russell 2000 Value Index is replacing the Russell 2500 Value Index as the Fund’s benchmark. The investment manager believes the composition of the Russell 2000 Value Index more accurately reflects the Fund’s holdings. |
No one index is representative of the Fund’s portfolio.
III. Effective September 30, 2016, the first paragraph under the “FUND DETAILS” – “Principal Investment Policies and Practices” section on page FSV D-1 is replaced with the following:
Under normal market conditions, the Fund invests at least 80% of its net assets in investments of small-capitalization (small-cap) companies. Shareholders will be given at least 60 days’ advance notice of any change to this 80% policy. Small-cap companies are companies with market capitalizations (the total market value of a company’s outstanding stock) under $3.5 billion at the time of purchase. Effective September 30, 2016, the definition of small-cap companies will be revised to read as follows: Under normal market conditions, the Fund invests at least 80% of its net assets in investments of small-capitalization (small-cap) companies. Small-cap companies are companies with market capitalizations (the total market value of a company’s outstanding stock) not exceeding either: 1) the highest market capitalization in the Russell 2000 Index; or 2) the 12-month average of the highest market capitalization in the Russell 2000 Index, whichever is greater, at the time of purchase. As of May 31, 2016, the highest market capitalization in the Russell 2000 Index was $5.96 billion.
The prospectus of Franklin Global Real Estate VIP Fund is amended as follows:
The “FUND DETAILS” – “Management” section, on page FGR D-6, is revised to show the address of Franklin Templeton Institutional, LLC (FT Institutional) as 280 Park Avenue, New York, NY 10017.
Please keep this supplement with your prospectus for future reference.
FRANKLIN TEMPLETON VARIABLE INSURANCE PRODUCTS TRUST
Financial Highlights
Franklin Small Cap Value VIP Fund
| | | | | | | | | | | | | | | | | | | | |
| | | Year Ended December 31, | |
| | | 2016 | | | 2015 | | | 2014 | | | 2013 | | | 2012 | |
| Class 1 | | | | | | | | | | | | | | | | | | | | |
Per share operating performance
(for a share outstanding throughout the year) | | | | | | | | | | | | | | | | | | | | |
| | | | | |
Net asset value, beginning of year | | | $18.12 | | | | $22.81 | | | | $24.54 | | | | $18.58 | | | | $15.82 | |
| | | | |
| | | | | |
| Income from investment operationsa: | | | | | | | | | | | | | | | | | | | | |
| | | | | |
Net investment incomeb | | | 0.15 | | | | 0.21 | | | | 0.19 | | | | 0.19 | | | | 0.29 | c |
| | | | | |
Net realized and unrealized gains (losses) | | | 4.79 | | | | (1.53 | ) | | | 0.06 | | | | 6.45 | | | | 2.64 | |
| | | | |
Total from investment operations | | | 4.94 | | | | (1.32 | ) | | | 0.25 | | | | 6.64 | | | | 2.93 | |
| | | | |
| | | | | |
| Less distributions from: | | | | | | | | | | | | | | | | | | | | |
| | | | | |
Net investment income | | | (0.21 | ) | | | (0.20 | ) | | | (0.20 | ) | | | (0.32 | ) | | | (0.17 | ) |
| | | | | |
Net realized gains | | | (2.92 | ) | | | (3.17 | ) | | | (1.78 | ) | | | (0.36 | ) | | | — | |
| | | | |
Total distributions | | | (3.13 | ) | | | (3.37 | ) | | | (1.98 | ) | | | (0.68 | ) | | | (0.17 | ) |
| | | | |
Net asset value, end of year | | | $19.93 | | | | $18.12 | | | | $22.81 | | | | $24.54 | | | | $18.58 | |
| | | | |
| | | | | |
Total returnd | | | 30.54% | | | | (7.18)% | | | | 0.88% | | | | 36.50% | | | | 18.75% | |
| | | | | |
| Ratios to average net assets | | | | | | | | | | | | | | | | | | | | |
| | | | | |
Expenses before waiver and payments by affiliates | | | 0.66% | | | | 0.65% | | | | 0.63% | | | | 0.63% | | | | 0.67% | |
| | | | | |
Expenses net of waiver and payments by affiliates | | | 0.64% | e | | | 0.64% | e | | | 0.63% | e,f | | | 0.63% | | | | 0.67% | |
| | | | | |
Net investment income | | | 0.84% | | | | 1.04% | | | | 0.82% | | | | 0.90% | | | | 1.70% | c |
| | | | | |
| Supplemental data | | | | | | | | | | | | | | | | | | | | |
| | | | | |
Net assets, end of year (000’s) | | | $47,831 | | | | $45,897 | | | | $57,843 | | | | $62,408 | | | | $40,133 | |
| | | | | |
Portfolio turnover rate | | | 34.60% | | | | 27.05% | | | | 19.45% | | | | 10.44% | | | | 5.84% | |
aThe amount shown for a share outstanding throughout the period may not correlate with the Statement of Operations for the period due to the timing of sales and repurchases of the Fund’s shares in relation to income earned and/or fluctuating fair value of the investments of the Fund.
bBased on average daily shares outstanding.
cNet investment income per share includes approximately $0.10 per share related to income received in the form of special dividends in connection with certain fund holdings. Excluding this amount, the ratio of net investment income to average net assets would have been 1.10%.
dTotal return does not include fees, charges or expenses imposed by the variable annuity and life insurance contracts for which Franklin Templeton Variable Insurance Products Trust serves as an underlying investment vehicle.
eBenefit of expense reduction rounds to less than 0.01%.
fBenefit of waiver and payments by affiliates rounds to less than 0.01%.
| | | | | | |
| | | The accompanying notes are an integral part of these financial statements. | Annual Report | | | FSV-7 | |
FRANKLIN TEMPLETON VARIABLE INSURANCE PRODUCTS TRUST
FINANCIAL HIGHLIGHTS
Franklin Small Cap Value VIP Fund (continued)
| | | | | | | | | | | | | | | | | | | | |
| | | Year Ended December 31, | |
| | | 2016 | | | 2015 | | | 2014 | | | 2013 | | | 2012 | |
| Class 2 | | | | | | | | | | | | | | | | | | | | |
Per share operating performance
(for a share outstanding throughout the year) | | | | | | | | | | | | | | | | | | | | |
| | | | | |
Net asset value, beginning of year | | | $17.68 | | | | $22.32 | | | | $24.07 | | | | $18.23 | | | | $15.53 | |
| | | | |
| | | | | |
| Income from investment operationsa: | | | | | | | | | | | | | | | | | | | | |
| | | | | |
Net investment incomeb | | | 0.10 | | | | 0.16 | | | | 0.13 | | | | 0.14 | | | | 0.24 | c |
| | | | | |
Net realized and unrealized gains (losses) | | | 4.66 | | | | (1.49 | ) | | | 0.05 | | | | 6.34 | | | | 2.59 | |
| | | | |
Total from investment operations | | | 4.76 | | | | (1.33 | ) | | | 0.18 | | | | 6.48 | | | | 2.83 | |
| | | | |
| | | | | |
| Less distributions from: | | | | | | | | | | | | | | | | | | | | |
| | | | | |
Net investment income | | | (0.16 | ) | | | (0.14 | ) | | | (0.15 | ) | | | (0.28 | ) | | | (0.13 | ) |
| | | | | |
Net realized gains | | | (2.92 | ) | | | (3.17 | ) | | | (1.78 | ) | | | (0.36 | ) | | | — | |
| | | | |
Total distributions | | | (3.08 | ) | | | (3.31 | ) | | | (1.93 | ) | | | (0.64 | ) | | | (0.13 | ) |
| | | | |
Net asset value, end of year | | | $19.36 | | | | $17.68 | | | | $22.32 | | | | $24.07 | | | | $18.23 | |
| | | | |
| | | | | |
Total returnd | | | 30.19% | | | | (7.39)% | | | | 0.57% | | | | 36.24% | | | | 18.39% | |
| | | | | |
| Ratios to average net assets | | | | | | | | | | | | | | | | | | | | |
| | | | | |
Expenses before waiver and payments by affiliates | | | 0.91% | | | | 0.90% | | | | 0.88% | | | | 0.88% | | | | 0.92% | |
| | | | | |
Expenses net of waiver and payments by affiliates | | | 0.89% | e | | | 0.89% | e | | | 0.88% | e,f | | | 0.88% | | | | 0.92% | |
| | | | | |
Net investment income | | | 0.59% | | | | 0.79% | | | | 0.57% | | | | 0.65% | | | | 1.45% | c |
| | | | | |
| Supplemental data | | | | | | | | | | | | | | | | | | | | |
| | | | | |
Net assets, end of year (000’s) | | | $1,366,807 | | | | $1,172,173 | | | | $1,445,325 | | | | $1,606,802 | | | | $1,286,573 | |
| | | | | |
Portfolio turnover rate | | | 34.60% | | | | 27.05% | | | | 19.45% | | | | 10.44% | | | | 5.84% | |
aThe amount shown for a share outstanding throughout the period may not correlate with the Statement of Operations for the period due to the timing of sales and repurchases of the Fund’s shares in relation to income earned and/or fluctuating fair value of the investments of the Fund.
bBased on average daily shares outstanding.
cNet investment income per share includes approximately $0.10 per share related to income received in the form of special dividends in connection with certain fund holdings. Excluding this amount, the ratio of net investment income to average net assets would have been 0.85%.
dTotal return does not include fees, charges or expenses imposed by the variable annuity and life insurance contracts for which Franklin Templeton Variable Insurance Products Trust serves as an underlying investment vehicle.
eBenefit of expense reduction rounds to less than 0.01%.
fBenefit of waiver and payments by affiliates rounds to less than 0.01%.
| | | | |
| FSV-8 | | Annual Report | The accompanying notes are an integral part of these financial statements. | | |
FRANKLIN TEMPLETON VARIABLE INSURANCE PRODUCTS TRUST
FINANCIAL HIGHLIGHTS
Franklin Small Cap Value VIP Fund (continued)
| | | | | | | | | | | | | | | | | | | | |
| | | Year Ended December 31, | |
| | | 2016 | | | 2015 | | | 2014 | | | 2013 | | | 2012 | |
| Class 4 | | | | | | | | | | | | | | | | | | | | |
Per share operating performance
(for a share outstanding throughout the year) | | | | | | | | | | | | | | | | | | | | |
| | | | | |
Net asset value, beginning of year | | | $17.96 | | | | $22.63 | | | | $24.37 | | | | $18.44 | | | | $15.71 | |
| | | | |
| | | | | |
| Income from investment operationsa: | | | | | | | | | | | | | | | | | | | | |
| | | | | |
Net investment incomeb | | | 0.09 | | | | 0.14 | | | | 0.11 | | | | 0.12 | | | | 0.22c | |
| | | | | |
Net realized and unrealized gains (losses) | | | 4.75 | | | | (1.52 | ) | | | 0.05 | | | | 6.42 | | | | 2.63 | |
| | | | |
Total from investment operations | | | 4.84 | | | | (1.38 | ) | | | 0.16 | | | | 6.54 | | | | 2.85 | |
| | | | |
| | | | | |
| Less distributions from: | | | | | | | | | | | | | | | | | | | | |
| | | | | |
Net investment income | | | (0.14 | ) | | | (0.12 | ) | | | (0.12 | ) | | | (0.25 | ) | | | (0.12 | ) |
| | | | | |
Net realized gains | | | (2.92 | ) | | | (3.17 | ) | | | (1.78 | ) | | | (0.36 | ) | | | — | |
| | | | |
Total distributions | | | (3.06 | ) | | | (3.29 | ) | | | (1.90 | ) | | | (0.61 | ) | | | (0.12 | ) |
| | | | |
Net asset value, end of year | | | $19.74 | | | | $17.96 | | | | $22.63 | | | | $24.37 | | | | $18.44 | |
| | | | |
| | | | | |
Total returnd | | | 30.12% | | | | (7.52)% | | | | 0.48% | | | | 36.12% | | | | 18.27% | |
| | | | | |
| Ratios to average net assets | | | | | | | | | | | | | | | | | | | | |
| | | | | |
Expenses before waiver and payments by affiliates | | | 1.01% | | | | 1.00% | | | | 0.98% | | | | 0.98% | | | | 1.02% | |
| | | | | |
Expenses net of waiver and payments by affiliates | | | 0.99% | e | | | 0.99% | e | | | 0.98% | e,f | | | 0.98% | | | | 1.02% | |
| | | | | |
Net investment income | | | 0.49% | | | | 0.69% | | | | 0.47% | | | | 0.55% | | | | 1.35% | c |
| | | | | |
| Supplemental data | | | | | | | | | | | | | | | | | | | | |
| | | | | |
Net assets, end of year (000’s) | | | $32,751 | | | | $26,128 | | | | $30,452 | | | | $35,936 | | | | $32,424 | |
| | | | | |
Portfolio turnover rate | | | 34.60% | | | | 27.05% | | | | 19.45% | | | | 10.44% | | | | 5.84% | |
aThe amount shown for a share outstanding throughout the period may not correlate with the Statement of Operations for the period due to the timing of sales and repurchases of the Fund’s shares in relation to income earned and/or fluctuating fair value of the investments of the Fund.
bBased on average daily shares outstanding.
cNet investment income per share includes approximately $0.10 per share related to income received in the form of special dividends in connection with certain fund holdings. Excluding this amount, the ratio of net investment income to average net assets would have been 0.75%.
dTotal return does not include fees, charges or expenses imposed by the variable annuity and life insurance contracts for which Franklin Templeton Variable Insurance Products Trust serves as an underlying investment vehicle.
eBenefit of expense reduction rounds to less than 0.01%.
fBenefit of waiver and payments by affiliates rounds to less than 0.01%.
| | | | | | |
| | | The accompanying notes are an integral part of these financial statements. | Annual Report | | | FSV-9 | |
FRANKLIN TEMPLETON VARIABLE INSURANCE PRODUCTS TRUST
Statement of Investments, December 31, 2016
| | | | | | | | | | |
| Franklin Small Cap Value VIP Fund | | | | | | |
| | | | | Shares | | | Value | |
| | | Common Stocks 96.4% | | | | | | |
| | | Aerospace & Defense 4.3% | | | | | | |
| | AAR Corp. | | | 1,110,700 | | | $ | 36,708,635 | |
| | Cubic Corp. | | | 270,800 | | | | 12,984,860 | |
| a | | Esterline Technologies Corp. | | | 145,900 | | | | 13,014,280 | |
| | | | | | | | | | |
| | | | | | | | | 62,707,775 | |
| | | | | | | | | | |
| | | Automobiles & Components 3.2% | | | | | | |
| | Gentex Corp. | | | 440,700 | | | | 8,677,383 | |
| | LCI Industries | | | 179,800 | | | | 19,373,450 | |
| | Thor Industries Inc. | | | 157,900 | | | | 15,797,895 | |
| | Winnebago Industries Inc. | | | 99,300 | | | | 3,142,845 | |
| | | | | | | | | | |
| | | | | | | | | 46,991,573 | |
| | | | | | | | | | |
| | | Banks 11.7% | | | | | | |
| | BNC Bancorp. | | | 668,200 | | | | 21,315,580 | |
| | Bryn Mawr Bank Corp. | | | 20,300 | | | | 855,645 | |
| | Chemical Financial Corp. | | | 591,154 | | | | 32,022,812 | |
| | Columbia Banking System Inc. | | | 585,600 | | | | 26,164,608 | |
| | EverBank Financial Corp. | | | 673,200 | | | | 13,093,740 | |
| | First Horizon National Corp. | | | 1,103,900 | | | | 22,089,039 | |
| | First of Long Island Corp. | | | 169,900 | | | | 4,850,645 | |
| | German American Bancorp Inc. | | | 67,200 | | | | 3,535,392 | |
| | Lakeland Financial Corp. | | | 551,400 | | | | 26,114,304 | |
| | Peoples Bancorp Inc. | | | 257,000 | | | | 8,342,220 | |
| | TrustCo Bank Corp. NY | | | 684,300 | | | | 5,987,625 | |
| | Washington Trust Bancorp Inc. | | | 101,800 | | | | 5,705,890 | |
| | | | | | | | | | |
| | | | | | | | | 170,077,500 | |
| | | | | | | | | | |
| | | Building Products 5.1% | | | | | | |
| a | | Armstrong Flooring Inc. | | | 492,100 | | | | 9,797,711 | |
| a | | Gibraltar Industries Inc. | | | 361,200 | | | | 15,043,980 | |
| | Griffon Corp. | | | 399,400 | | | | 10,464,280 | |
| | Insteel Industries Inc. | | | 130,700 | | | | 4,658,148 | |
| | Simpson Manufacturing Co. Inc. | | | 438,400 | | | | 19,180,000 | |
| | Universal Forest Products Inc. | | | 139,800 | | | | 14,284,764 | |
| | | | | | | | | | |
| | | | | | | | | 73,428,883 | |
| | | | | | | | | | |
| | | Commercial & Professional Services 2.6% | | | | | | |
| a | | Huron Consulting Group Inc. | | | 171,300 | | | | 8,676,345 | |
| | McGrath RentCorp. | | | 455,018 | | | | 17,832,156 | |
| | MSA Safety Inc. | | | 153,113 | | | | 10,615,324 | |
| | | | | | | | | | |
| | | | | | | | | 37,123,825 | |
| | | | | | | | | | |
| | | Construction & Engineering 3.0% | | | | | | |
| | Argan Inc. | | | 35,000 | | | | 2,469,250 | |
| | EMCOR Group Inc. | | | 338,000 | | | | 23,916,880 | |
| | Granite Construction Inc. | | | 312,700 | | | | 17,198,500 | |
| | | | | | | | | | |
| | | | | | | | | 43,584,630 | |
| | | | | | | | | | |
| | | Consumer Durables & Apparel 3.1% | | | | | | |
| a | | BRP Inc. (Canada) | | | 878,100 | | | | 18,538,975 | |
| | Brunswick Corp. | | | 49,900 | | | | 2,721,546 | |
| | Hooker Furniture Corp. | | | 158,800 | | | | 6,026,460 | |
| | La-Z-Boy Inc. | | | 296,500 | | | | 9,206,325 | |
| a | | M/I Homes Inc. | | | 361,300 | | | | 9,097,534 | |
| | | | | | | | | | |
| | | | | | | | | 45,590,840 | |
| | | | | | | | | | |
FRANKLIN TEMPLETON VARIABLE INSURANCE PRODUCTS TRUST
STATEMENT OF INVESTMENTS
Franklin Small Cap Value VIP Fund (continued)
| | | | | | | | | | |
| | | | | Shares | | | Value | |
| | | Common Stocks (continued) | | | | | | |
| | | Consumer Services 0.8% | | | | | | |
| | Brinker International Inc. | | | 246,900 | | | $ | 12,228,957 | |
| | | | | | | | | | |
| | | Electrical Equipment 1.6% | | | | | | |
| | Encore Wire Corp. | | | 9,200 | | | | 398,820 | |
| | EnerSys | | | 234,810 | | | | 18,338,661 | |
| | Regal Beloit Corp. | | | 68,600 | | | | 4,750,550 | |
| | | | | | | | | | |
| | | | | | | | 23,488,031 | |
| | | | | | | | | | |
| | | Energy 6.6% | | | | | | |
| a | | Energen Corp. | | | 280,107 | | | | 16,153,771 | |
| a | | Helix Energy Solutions Group Inc. | | | 679,700 | | | | 5,994,954 | |
| | Hunting PLC (United Kingdom) | | | 2,086,200 | | | | 16,126,032 | |
| a | | Natural Gas Services Group Inc. | | | 145,100 | | | | 4,664,965 | |
| a | | Oil States International Inc. | | | 567,900 | | | | 22,148,100 | |
| a | | Rowan Cos. PLC | | | 253,600 | | | | 4,790,504 | |
| a | | Unit Corp. | | | 940,700 | | | | 25,276,609 | |
| | | | | | | | | | |
| | | | | | | | | 95,154,935 | |
| | | | | | | | | | |
| | | Food, Beverage & Tobacco 5.1% | | | | | | |
| | AGT Food and Ingredients Inc. (Canada) | | | 170,500 | | | | 4,652,309 | |
| | Dairy Crest Group PLC (United Kingdom) | | | 1,294,000 | | | | 9,874,917 | |
| | GrainCorp Ltd. (Australia) | | | 408,300 | | | | 2,816,656 | |
| a | | Landec Corp. | | | 848,600 | | | | 11,710,680 | |
| | Maple Leaf Foods Inc. (Canada) | | | 1,700,800 | | | | 35,616,991 | |
| a | | Omega Protein Corp. | | | 375,800 | | | | 9,413,790 | |
| | | | | | | | | | |
| | | | | | | | | 74,085,343 | |
| | | | | | | | | | |
| | | Health Care Equipment & Services 3.4% | | | | | | |
| | Hill-Rom Holdings Inc. | | | 435,700 | | | | 24,460,198 | |
| | STERIS PLC | | | 363,600 | | | | 24,503,004 | |
| | | | | | | | | | |
| | | | | | | | | 48,963,202 | |
| | | | | | | | | | |
| | | Industrial Conglomerates 1.9% | | | | | | |
| | Carlisle Cos. Inc. | | | 245,400 | | | | 27,065,166 | |
| | | | | | | | | | |
| | | Insurance 7.5% | | | | | | |
| | Arthur J. Gallagher & Co. | | | 168,200 | | | | 8,739,672 | |
| | Aspen Insurance Holdings Ltd. | | | 466,400 | | | | 25,652,000 | |
| | Endurance Specialty Holdings Ltd. | | | 116,300 | | | | 10,746,120 | |
| | The Hanover Insurance Group Inc. | | | 199,100 | | | | 18,120,091 | |
| | Horace Mann Educators Corp. | | | 187,600 | | | | 8,029,280 | |
| | Old Republic International Corp. | | | 763,300 | | | | 14,502,700 | |
| | Validus Holdings Ltd. | | | 415,000 | | | | 22,829,150 | |
| | | | | | | | | | |
| | | | | | | | | 108,619,013 | |
| | | | | | | | | | |
| | | Machinery 6.3% | | | | | | |
| | Astec Industries Inc. | | | 311,300 | | | | 21,000,298 | |
| | Federal Signal Corp. | | | 134,600 | | | | 2,101,106 | |
| | Franklin Electric Co. Inc. | | | 89,464 | | | | 3,480,150 | |
| | Hillenbrand Inc. | | | 115,000 | | | | 4,410,250 | |
| | Kennametal Inc. | | | 338,400 | | | | 10,578,384 | |
| | Lindsay Corp. | | | 87,300 | | | | 6,513,453 | |
| | Mueller Industries Inc. | | | 475,700 | | | | 19,008,972 | |
| | Mueller Water Products Inc., A | | | 1,623,200 | | | | 21,604,792 | |
| | Watts Water Technologies Inc., A | | | 47,000 | | | | 3,064,400 | |
| | | | | | | | | | |
| | | | | | | | | 91,761,805 | |
| | | | | | | | | | |
FRANKLIN TEMPLETON VARIABLE INSURANCE PRODUCTS TRUST
STATEMENT OF INVESTMENTS
Franklin Small Cap Value VIP Fund (continued)
| | | | | | | | | | |
| | | | | Shares | | | Value | |
| | | Common Stocks (continued) | | | | | | |
| | | Materials 6.1% | | | | | | |
| | A Schulman Inc. | | | 98,166 | | | $ | 3,283,653 | |
| | AptarGroup Inc. | | | 65,000 | | | | 4,774,250 | |
| a | | Detour Gold Corp. (Canada) | | | 672,100 | | | | 9,154,534 | |
| | H.B. Fuller Co. | | | 149,140 | | | | 7,204,953 | |
| a | | Ingevity Corp. | | | 168,200 | | | | 9,227,452 | |
| | Minerals Technologies Inc. | | | 86,800 | | | | 6,705,300 | |
| | OceanaGold Corp. (Australia) | | | 2,985,200 | | | | 8,692,383 | |
| | Sensient Technologies Corp. | | | 443,800 | | | | 34,873,804 | |
| | Stepan Co. | | | 47,200 | | | | 3,845,856 | |
| | | | | | | | | | |
| | | | | | | | | 87,762,185 | |
| | | | | | | | | | |
| | | Pharmaceuticals, Biotechnology & Life Sciences 1.7% | | | | | | |
| | Gerresheimer AG (Germany) | | | 336,000 | | | | 24,966,937 | |
| | | | | | | | | | |
| | | Real Estate 4.6% | | | | | | |
| | Brandywine Realty Trust | | | 1,359,300 | | | | 22,442,043 | |
| | LTC Properties Inc. | | | 689,800 | | | | 32,406,804 | |
| | Sunstone Hotel Investors Inc. | | | 749,900 | | | | 11,435,975 | |
| | | | | | | | | | |
| | | | | | | | | 66,284,822 | |
| | | | | | | | | | |
| | | Retailing 1.7% | | | | | | |
| | Caleres Inc. | | | 355,600 | | | | 11,670,792 | |
| | The Cato Corp., A | | | 264,600 | | | | 7,959,168 | |
| | The Finish Line Inc., A | | | 184,300 | | | | 3,466,683 | |
| a | | Genesco Inc. | | | 14,108 | | | | 876,107 | |
| a | | West Marine Inc. | | | 23,600 | | | | 247,092 | |
| | | | | | | | | | |
| | | | | | | | | 24,219,842 | |
| | | | | | | | | | |
| | | Semiconductors & Semiconductor Equipment 4.8% | | | | | | |
| | Cohu Inc. | | | 736,000 | | | | 10,230,400 | |
| a | | Kulicke and Soffa Industries Inc. (Singapore) | | | 449,313 | | | | 7,166,542 | |
| | MKS Instruments Inc. | | | 435,700 | | | | 25,880,580 | |
| a | | Photronics Inc. | | | 911,000 | | | | 10,294,300 | |
| a | | Versum Materials Inc. | | | 548,200 | | | | 15,387,974 | |
| | | | | | | | | | |
| | | | | | | | | 68,959,796 | |
| | | | | | | | | | |
| | | Software & Services 1.5% | | | | | | |
| | Mentor Graphics Corp. | | | 592,300 | | | | 21,849,947 | |
| | | | | | | | | | |
| | | Technology Hardware & Equipment 1.8% | | | | | | |
| a | | NetScout Systems Inc. | | | 447,700 | | | | 14,102,550 | |
| a | | Rogers Corp. | | | 61,500 | | | | 4,723,815 | |
| a | | Zebra Technologies Corp., A | | | 79,300 | | | | 6,800,768 | |
| | | | | | | | | | |
| | | | | | | | | 25,627,133 | |
| | | | | | | | | | |
| | | Telecommunication Services 0.6% | | | | | | |
| a | | ORBCOMM Inc. | | | 1,042,000 | | | | 8,617,340 | |
| | | | | | | | | | |
| | | Transportation 2.9% | | | | | | |
| a | | SAIA Inc. | | | 482,500 | | | | 21,302,375 | |
| a | | Spirit Airlines Inc. | | | 345,200 | | | | 19,973,272 | |
| | | | | | | | | | |
| | | | | | | | | 41,275,647 | |
| | | | | | | | | | |
FRANKLIN TEMPLETON VARIABLE INSURANCE PRODUCTS TRUST
STATEMENT OF INVESTMENTS
Franklin Small Cap Value VIP Fund (continued)
| | | | | | | | | | |
| | | | | Shares | | | Value | |
| | | Common Stocks (continued) | | | | | | |
| | | Utilities 4.5% | | | | | | |
| | Connecticut Water Service Inc. | | | 47,200 | | | $ | 2,636,120 | |
| | IDACORP Inc. | | | 412,689 | | | | 33,242,099 | |
| | Spire Inc. | | | 452,000 | | | | 29,176,600 | |
| | | | | | | | | | |
| | | | | | | | | 65,054,819 | |
| | | | | | | | | | |
| | | |
| | Total Common Stocks (Cost $954,519,517) | | | | | | | 1,395,489,946 | |
| | | | | | | | | | |
| | | |
| | | | | Principal Amount | | | | |
| | Corporate Bonds (Cost $9,150,200) 0.7% | | | | | | | | |
| | | Energy 0.7% | | | | | | |
| | Unit Corp., senior sub. note, 6.625%, 5/15/21 | | $ | 9,632,000 | | | | 9,391,200 | |
| | | | | | | | | | |
| | | |
| | Total Investments before Short Term Investments (Cost $963,669,717) | | | | | | | 1,404,881,146 | |
| | | | | | | | | | |
| | | |
| | | | | Shares | | | | |
| | Short Term Investments (Cost $46,387,989) 3.2% | | | | | | | | |
| | | Money Market Funds 3.2% | | | | | | |
| b,c | | Institutional Fiduciary Trust Money Market Portfolio, 0.09% | | | 46,387,989 | | | | 46,387,989 | |
| | | | | | | | | | |
| | Total Investments (Cost $1,010,057,706) 100.3% | | | | | | | 1,451,269,135 | |
| | Other Assets, less Liabilities (0.3)% | | | | | | | (3,880,794 | ) |
| | | | | | | | | | |
| | Net Assets 100.0% | | | | | | $ | 1,447,388,341 | |
| | | | | | | | | | |
aNon-income producing.
bSee Note 3(e) regarding investments in affiliated management investment companies.
cThe rate shown is the annualized seven-day yield at period end.
| | | | | | |
| | | The accompanying notes are an integral part of these financial statements. | Annual Report | | | FSV-13 | |
FRANKLIN TEMPLETON VARIABLE INSURANCE PRODUCTS TRUST
Financial Statements
Statement of Assets and Liabilities
December 31, 2016
| | | | |
| | | Franklin Small Cap Value VIP Fund | |
Assets: | | | | |
Investments in securities: | | | | |
Cost - Unaffiliated issuers | | $ | 963,669,717 | |
Cost - Non-controlled affiliates (Note 3e) | | | 46,387,989 | |
| | | | |
Total cost of investments | | $ | 1,010,057,706 | |
| | | | |
Value - Unaffiliated issuers | | $ | 1,404,881,146 | |
Value - Non-controlled affiliates (Note 3e) | | | 46,387,989 | |
| | | | |
Total value of investments | | | 1,451,269,135 | |
Receivables: | | | | |
Investment securities sold | | | 1,565,468 | |
Capital shares sold | | | 295,542 | |
Dividends and interest | | | 1,432,927 | |
Other assets | | | 99 | |
| | | | |
Total assets | | | 1,454,563,171 | |
| | | | |
Liabilities: | | | | |
Payables: | | | | |
Investment securities purchased | | | 2,097,665 | |
Capital shares redeemed | | | 3,551,580 | |
Management fees | | | 747,432 | |
Distribution fees | | | 569,659 | |
Accrued expenses and other liabilities. | | | 208,494 | |
| | | | |
Total liabilities | | | 7,174,830 | |
| | | | |
Net assets, at value | | $ | 1,447,388,341 | |
| | | | |
Net assets consist of: | | | | |
Paid-in capital | | $ | 903,201,668 | |
Undistributed net investment income | | | 7,943,725 | |
Net unrealized appreciation (depreciation) | | | 441,206,111 | |
Accumulated net realized gain (loss) | | | 95,036,837 | |
| | | | |
Net assets, at value | | $ | 1,447,388,341 | |
| | | | |
| |
| Class 1: | | | | |
Net assets, at value | | $ | 47,830,815 | |
| | | | |
Shares outstanding | | | 2,400,230 | |
| | | | |
Net asset value and maximum offering price per share | | $ | 19.93 | |
| | | | |
| |
| Class 2: | | | | |
Net assets, at value | | $ | 1,366,806,647 | |
| | | | |
Shares outstanding | | | 70,592,228 | |
| | | | |
Net asset value and maximum offering price per share | | $ | 19.36 | |
| | | | |
| |
| Class 4: | | | | |
Net assets, at value | | $ | 32,750,879 | |
| | | | |
Shares outstanding | | | 1,659,046 | |
| | | | |
Net asset value and maximum offering price per share | | $ | 19.74 | |
| | | | |
| | | | |
| FSV-14 | | Annual Report | The accompanying notes are an integral part of these financial statements. | | |
FRANKLIN TEMPLETON VARIABLE INSURANCE PRODUCTS TRUST
FINANCIAL STATEMENTS
Statement of Operations
for the year ended December 31, 2016
| | | | |
| | | Franklin Small Cap Value VIP Fund | |
Investment income: | | | | |
Dividends: | | | | |
Unaffiliated issuers | | $ | 18,395,887 | |
Non-controlled affiliates (Note 3e) | | | 1,724 | |
Interest | | | 722,976 | |
Income from securities loaned (net of fees and rebates) | | | 143,159 | |
| | | | |
Total investment income | | | 19,263,746 | |
| | | | |
Expenses: | | | | |
Management fees (Note 3a) | | | 8,224,350 | |
Distribution fees: (Note 3c) | | | | |
Class 2 | | | 3,069,570 | |
Class 4 | | | 97,312 | |
Custodian fees (Note 4) | | | 19,655 | |
Reports to shareholders | | | 296,538 | |
Professional fees | | | 54,573 | |
Trustees’ fees and expenses | | | 6,010 | |
Other | | | 29,187 | |
| | | | |
Total expenses | | | 11,797,195 | |
Expense reductions (Note 4) | | | (12 | ) |
Expenses waived/paid by affiliates (Note 3e) | | | (282,691 | ) |
| | | | |
Net expenses | | | 11,514,492 | |
| | | | |
Net investment income | | | 7,749,254 | |
| | | | |
Realized and unrealized gains (losses): | | | | |
Net realized gain (loss) from: | | | | |
Investments | | | 96,485,228 | |
Foreign currency transactions | | | (122,306 | ) |
| | | | |
Net realized gain (loss) | | | 96,362,922 | |
| | | | |
Net change in unrealized appreciation (depreciation) on: | | | | |
Investments | | | 243,792,651 | |
Translation of other assets and liabilities denominated in foreign currencies | | | (4,935 | ) |
| | | | |
Net change in unrealized appreciation (depreciation) | | | 243,787,716 | |
| | | | |
Net realized and unrealized gain (loss) | | | 340,150,638 | |
| | | | |
Net increase (decrease) in net assets resulting from operations | | $ | 347,899,892 | |
| | | | |
| | | | | | |
| | | The accompanying notes are an integral part of these financial statements. | Annual Report | | | FSV-15 | |
FRANKLIN TEMPLETON VARIABLE INSURANCE PRODUCTS TRUST
FINANCIAL STATEMENTS
Statements of Changes in Net Assets
| | | | | | | | |
| | | Franklin Small Cap Value VIP Fund | |
| | | Year Ended December 31, | |
| | | 2016 | | | 2015 | |
Increase (decrease) in net assets: | | | | | | | | |
Operations: | | | | | | | | |
Net investment income | | $ | 7,749,254 | | | $ | 11,196,499 | |
Net realized gain (loss) | | | 96,362,922 | | | | 195,958,536 | |
Net change in unrealized appreciation (depreciation) | | | 243,787,716 | | | | (310,285,782 | ) |
| | | | |
Net increase (decrease) in net assets resulting from operations | | | 347,899,892 | | | | (103,130,747 | ) |
| | | | |
Distributions to shareholders from: | | | | | | | | |
Net investment income: | | | | | | | | |
Class 1 | | | (515,097 | ) | | | (483,179 | ) |
Class 2 | | | (10,103,275 | ) | | | (8,399,662 | ) |
Class 4 | | | (189,568 | ) | | | (155,331 | ) |
Net realized gains: | | | | | | | | |
Class 1 | | | (7,134,342 | ) | | | (7,665,840 | ) |
Class 2 | | | (185,669,944 | ) | | | (193,180,034 | ) |
Class 4 | | | (4,020,473 | ) | | | (4,250,502 | ) |
| | | | |
Total distributions to shareholders | | | (207,632,699 | ) | | | (214,134,548 | ) |
| | | | |
Capital share transactions: (Note 2) | | | | | | | | |
Class 1 | | | (2,877,866 | ) | | | (165,713 | ) |
Class 2 | | | 62,430,130 | | | | 25,699,762 | |
Class 4 | | | 3,371,117 | | | | 2,309,001 | |
| | | | |
Total capital share transactions | | | 62,923,381 | | | | 27,843,050 | |
| | | | |
Net increase (decrease) in net assets | | | 203,190,574 | | | | (289,422,245 | ) |
Net assets: | | | | | | | | |
Beginning of year | | | 1,244,197,767 | | | | 1,533,620,012 | |
| | | | |
End of year | | $ | 1,447,388,341 | | | $ | 1,244,197,767 | |
| | | | |
Undistributed net investment income included in net assets: | | | | | | | | |
End of year | | $ | 7,943,725 | | | $ | 11,124,717 | |
| | | | |
| | | | |
| FSV-16 | | Annual Report | The accompanying notes are an integral part of these financial statements. | | |
FRANKLIN TEMPLETON VARIABLE INSURANCE PRODUCTS TRUST
Notes to Financial Statements
Franklin Small Cap Value VIP Fund
1. Organization and Significant Accounting Policies
Franklin Templeton Variable Insurance Products Trust (Trust) is registered under the Investment Company Act of 1940 (1940 Act) as an open-end management investment company, consisting of nineteen separate funds and applies the specialized accounting and reporting guidance in U.S. Generally Accepted Accounting Principles (U.S. GAAP). Franklin Small Cap Value VIP Fund (Fund) is included in this report. The financial statements of the remaining funds in the Trust are presented separately. Shares of the Fund are generally sold only to insurance company separate accounts to fund the benefits of variable life insurance policies or variable annuity contracts. The Fund offers three classes of shares: Class 1, Class 2, and Class 4. Each class of shares differs by its distribution fees, voting rights on matters affecting a single class and its exchange privilege.
The following summarizes the Fund’s significant accounting policies.
a. Financial Instrument Valuation
The Fund’s investments in financial instruments are carried at fair value daily. Fair value is the price that would be received to sell an asset or paid to transfer a liability in an orderly transaction between market participants on the measurement date. The Fund calculates the net asset value (NAV) per share as of 4 p.m. Eastern time each day the New York Stock Exchange (NYSE) is open for trading. Under compliance policies and procedures approved by the Trust’s Board of Trustees (the Board), the Fund’s administrator has responsibility for oversight of valuation, including leading the cross-functional Valuation Committee (VC). The VC provides administration and oversight of the Fund’s valuation policies and procedures, which are approved annually by the Board. Among other things, these procedures allow the Fund to utilize independent pricing services, quotations from securities and financial instrument dealers, and other market sources to determine fair value.
Equity securities listed on an exchange or on the NASDAQ National Market System are valued at the last quoted sale price or the official closing price of the day, respectively. Foreign equity securities are valued as of the close of trading on the foreign stock exchange on which the security is primarily traded, or as of 4 p.m. Eastern time. The value is then converted into its U.S. dollar equivalent at the foreign exchange rate in
effect at 4 p.m. Eastern time on the day that the value of the security is determined. Over-the-counter (OTC) securities are valued within the range of the most recent quoted bid and ask prices. Securities that trade in multiple markets or on multiple exchanges are valued according to the broadest and most representative market. Certain equity securities are valued based upon fundamental characteristics or relationships to similar securities.
Debt securities generally trade in the OTC market rather than on a securities exchange. The Fund’s pricing services use multiple valuation techniques to determine fair value. In instances where sufficient market activity exists, the pricing services may utilize a market-based approach through which quotes from market makers are used to determine fair value. In instances where sufficient market activity may not exist or is limited, the pricing services also utilize proprietary valuation models which may consider market characteristics such as benchmark yield curves, credit spreads, estimated default rates, anticipated market interest rate volatility, coupon rates, anticipated timing of principal repayments, underlying collateral, and other unique security features in order to estimate the relevant cash flows, which are then discounted to calculate the fair value.
Investments in open-end mutual funds are valued at the closing NAV.
The Fund has procedures to determine the fair value of financial instruments for which market prices are not reliable or readily available. Under these procedures, the VC convenes on a regular basis to review such financial instruments and considers a number of factors, including significant unobservable valuation inputs, when arriving at fair value. The VC primarily employs a market-based approach which may use related or comparable assets or liabilities, recent transactions, market multiples, book values, and other relevant information for the investment to determine the fair value of the investment. An income-based valuation approach may also be used in which the anticipated future cash flows of the investment are discounted to calculate fair value. Discounts may also be applied due to the nature or duration of any restrictions on the disposition of the investments. Due to the inherent uncertainty of valuations of such investments, the fair values may differ significantly from the values that would have been used had an active market existed. The VC employs various methods for calibrating these valuation approaches including a regular review of key inputs and assumptions, transactional back-testing or disposition analysis, and reviews of any related market activity.
FRANKLIN TEMPLETON VARIABLE INSURANCE PRODUCTS TRUST
NOTES TO FINANCIAL STATEMENTS
Franklin Small Cap Value VIP Fund (continued)
1. Organization and Significant Accounting Policies (continued)
a. Financial Instrument Valuation (continued)
Trading in securities on foreign securities stock exchanges and OTC markets may be completed before 4 p.m. Eastern time. In addition, trading in certain foreign markets may not take place on every Fund’s business day. Occasionally, events occur between the time at which trading in a foreign security is completed and 4 p.m. Eastern time that might call into question the reliability of the value of a portfolio security held by the Fund. As a result, differences may arise between the value of the Fund’s portfolio securities as determined at the foreign market close and the latest indications of value at 4 p.m. Eastern time. In order to minimize the potential for these differences, the VC monitors price movements following the close of trading in foreign stock markets through a series of country specific market proxies (such as baskets of American Depositary Receipts, futures contracts and exchange traded funds). These price movements are measured against established trigger thresholds for each specific market proxy to assist in determining if an event has occurred that may call into question the reliability of the values of the foreign securities held by the Fund. If such an event occurs, the securities may be valued using fair value procedures, which may include the use of independent pricing services.
When the last day of the reporting period is a non-business day, certain foreign markets may be open on those days that the Fund’s NAV is not calculated, which could result in differences between the value of the Fund’s portfolio securities on the last business day and the last calendar day of the reporting period. Any significant security valuation changes due to an open foreign market are adjusted and reflected by the Fund for financial reporting purposes.
b. Foreign Currency Translation
Portfolio securities and other assets and liabilities denominated in foreign currencies are translated into U.S. dollars based on the exchange rate of such currencies against U.S. dollars on the date of valuation. The Fund may enter into foreign currency exchange contracts to facilitate transactions denominated in a foreign currency. Purchases and sales of securities, income and expense items denominated in foreign currencies are translated into U.S. dollars at the exchange rate in effect on the transaction date. Portfolio securities and assets and liabilities denominated in foreign currencies contain risks that those currencies will
decline in value relative to the U.S. dollar. Occasionally, events may impact the availability or reliability of foreign exchange rates used to convert the U.S. dollar equivalent value. If such an event occurs, the foreign exchange rate will be valued at fair value using procedures established and approved by the Board.
The Fund does not separately report the effect of changes in foreign exchange rates from changes in market prices on securities held. Such changes are included in net realized and unrealized gain or loss from investments in the Statement of Operations.
Realized foreign exchange gains or losses arise from sales of foreign currencies, currency gains or losses realized between the trade and settlement dates on securities transactions and the difference between the recorded amounts of dividends, interest, and foreign withholding taxes and the U.S. dollar equivalent of the amounts actually received or paid. Net unrealized foreign exchange gains and losses arise from changes in foreign exchange rates on foreign denominated assets and liabilities other than investments in securities held at the end of the reporting period.
c. Securities Lending
The Fund participates in an agency based securities lending program to earn additional income. The Fund receives cash collateral against the loaned securities in an amount equal to at least 102% of the fair value of the loaned securities. Collateral is maintained over the life of the loan in an amount not less than 100% of the fair value of loaned securities, as determined at the close of Fund business each day; any additional collateral required due to changes in security values is delivered to the Fund on the next business day. The collateral is deposited into a joint cash account with other funds and is used to invest in a money market fund managed by Franklin Advisers, Inc., an affiliate of the Fund, and/or a joint repurchase agreement. The Fund may receive income from the investment of cash collateral, in addition to lending fees and rebates paid by the borrower. Income from securities loaned, net of fees paid to the securities lending agent and/or third-party vendor, is reported separately in the Statement of Operations. The Fund bears the market risk with respect to the collateral investment, securities loaned, and the risk that the agent may default on its obligations to the Fund. If the borrower defaults on its obligation to return the securities loaned, the Fund has the right to repurchase the securities in the open market using the collateral received. The
FRANKLIN TEMPLETON VARIABLE INSURANCE PRODUCTS TRUST
NOTES TO FINANCIAL STATEMENTS
Franklin Small Cap Value VIP Fund (continued)
securities lending agent has agreed to indemnify the Fund in the event of default by a third party borrower. At December 31, 2016, the Fund had no securities on loan.
d. Income and Deferred Taxes
It is the Fund’s policy to qualify as a regulated investment company under the Internal Revenue Code. The Fund intends to distribute to shareholders substantially all of its taxable income and net realized gains to relieve it from federal income and if applicable, excise taxes. As a result, no provision for U.S. federal income taxes is required.
The Fund may be subject to foreign taxation related to income received, capital gains on the sale of securities and certain foreign currency transactions in the foreign jurisdictions in which it invests. Foreign taxes, if any, are recorded based on the tax regulations and rates that exist in the foreign markets in which the Fund invests. When a capital gain tax is determined to apply, the Fund records an estimated deferred tax liability in an amount that would be payable if the securities were disposed of on the valuation date.
The Fund may recognize an income tax liability related to its uncertain tax positions under U.S. GAAP when the uncertain tax position has a less than 50% probability that it will be sustained upon examination by the tax authorities based on its technical merits. As of December 31, 2016, the Fund has determined that no tax liability is required in its financial statements related to uncertain tax positions for any open tax years (or expected to be taken in future tax years). Open tax years are those that remain subject to examination and are based on each tax jurisdiction’s statute of limitation.
e. Security Transactions, Investment Income, Expenses and Distributions
Security transactions are accounted for on trade date. Realized gains and losses on security transactions are determined on a specific identification basis. Interest income and estimated expenses are accrued daily. Amortization of premium and accretion of discount on debt securities are included in interest income. Dividend income is recorded on the ex-dividend date except for certain dividends from securities where the dividend rate is not available. In such cases, the dividend is recorded as
soon as the information is received by the Fund. Distributions to shareholders are recorded on the ex-dividend date and are determined according to income tax regulations (tax basis). Distributable earnings determined on a tax basis may differ from earnings recorded in accordance with U.S. GAAP. These differences may be permanent or temporary. Permanent differences are reclassified among capital accounts to reflect their tax character. These reclassifications have no impact on net assets or the results of operations. Temporary differences are not reclassified, as they may reverse in subsequent periods.
Common expenses incurred by the Trust are allocated among the Funds based on the ratio of net assets of each Fund to the combined net assets of the Trust. Fund specific expenses are charged directly to the Fund that incurred the expense.
Realized and unrealized gains and losses and net investment income, not including class specific expenses, are allocated daily to each class of shares based upon the relative proportion of net assets of each class. Differences in per share distributions, by class, are generally due to differences in class specific expenses.
f. Accounting Estimates
The preparation of financial statements in accordance with U.S. GAAP requires management to make estimates and assumptions that affect the reported amounts of assets and liabilities at the date of the financial statements and the amounts of income and expenses during the reporting period. Actual results could differ from those estimates.
g. Guarantees and Indemnifications
Under the Trust’s organizational documents, its officers and trustees are indemnified by the Trust against certain liabilities arising out of the performance of their duties to the Trust. Additionally, in the normal course of business, the Trust, on behalf of the Fund, enters into contracts with service providers that contain general indemnification clauses. The Trust’s maximum exposure under these arrangements is unknown as this would involve future claims that may be made against the Trust that have not yet occurred. Currently, the Trust expects the risk of loss to be remote.
FRANKLIN TEMPLETON VARIABLE INSURANCE PRODUCTS TRUST
NOTES TO FINANCIAL STATEMENTS
Franklin Small Cap Value VIP Fund (continued)
2. Shares of Beneficial Interest
At December 31, 2016, there were an unlimited number of shares authorized (without par value). Transactions in the Fund’s shares were as follows:
| | | | | | | | | | | | | | | | | | | | |
| | | Year Ended December 31, | |
| | | 2016 | | | | | | 2015 | |
| | | Shares | | | Amount | | | | | | Shares | | | Amount | |
| | | | | |
| Class 1 Shares: | | | | | | | | | | | | | | | | | | | | |
Shares sold | | | 219,629 | | | $ | 4,034,514 | | | | | | | | 97,924 | | | $ | 2,017,340 | |
Shares issued in reinvestment of distributions | | | 456,683 | | | | 7,649,439 | | | | | | | | 407,044 | | | | 8,149,019 | |
Shares redeemed | | | (809,509 | ) | | | (14,561,819 | ) | | | | | | | (507,751 | ) | | | (10,332,072 | ) |
| | | | |
Net increase (decrease) | | | (133,197 | ) | | $ | (2,877,866 | ) | | | | | | | (2,783 | ) | | $ | (165,713 | ) |
| | | | |
| Class 2 Shares: | | | | | | | | | | | | | | | | | | | | |
Shares sold | | | 7,124,811 | | | $ | 128,912,250 | | | | | | | | 3,551,318 | | | $ | 71,764,155 | |
Shares issued in reinvestment of distributions | | | 12,018,000 | | | | 195,773,219 | | | | | | | | 10,305,710 | | | | 201,579,696 | |
Shares redeemed | | | (14,862,137 | ) | | | (262,255,339 | ) | | | | | | | (12,288,306 | ) | | | (247,644,089 | ) |
| | | | |
Net increase (decrease) | | | 4,280,674 | | | $ | 62,430,130 | | | | | | | | 1,568,722 | | | $ | 25,699,762 | |
| | | | |
| Class 4 Shares: | | | | | | | | | | | | | | | | | | | | |
Shares sold | | | 330,960 | | | $ | 6,027,880 | | | | | | | | 220,435 | | | $ | 4,535,105 | |
Shares issued in reinvestment of distributions | | | 253,312 | | | | 4,210,041 | | | | | | | | 221,510 | | | | 4,405,833 | |
Shares redeemed | | | (379,696 | ) | | | (6,866,804 | ) | | | | | | | (332,844 | ) | | | (6,631,937 | ) |
| | | | |
Net increase (decrease) | | | 204,576 | | | $ | 3,371,117 | | | | | | | | 109,101 | | | $ | 2,309,001 | |
| | | | |
3. Transactions with Affiliates
Franklin Resources, Inc. is the holding company for various subsidiaries that together are referred to as Franklin Templeton Investments. Certain officers and trustees of the Fund are also officers and/or directors of the following subsidiaries:
| | |
| Subsidiary | | Affiliation |
Franklin Advisory Services, LLC (Advisory Services) | | Investment manager |
Franklin Templeton Services, LLC (FT Services) | | Administrative manager |
Franklin Templeton Distributors, Inc. (Distributors) | | Principal underwriter |
Franklin Templeton Investor Services, LLC (Investor Services) | | Transfer agent |
a. Management Fees
The Fund pays an investment management fee to Advisory Services based on the average daily net assets of the Fund as follows:
| | |
| Annualized Fee Rate | | Net Assets |
0.750% | | Up to and including $200 million |
0.635% | | Over $200 million, up to and including $700 million |
0.600% | | Over $700 million, up to and including $1.2 billion |
0.575% | | Over $1.2 billion, up to and including $1.3 billion |
0.475% | | In excess of $1.3 billion |
For the year ended December 31, 2016, the effective investment management fee rate was 0.631% of the Fund’s average daily net assets.
FRANKLIN TEMPLETON VARIABLE INSURANCE PRODUCTS TRUST
NOTES TO FINANCIAL STATEMENTS
Franklin Small Cap Value VIP Fund (continued)
b. Administrative Fees
Under an agreement with Advisory Services, FT Services provides administrative services to the Fund. The fee is paid by Advisory Services based on the Fund’s average daily net assets, and is not an additional expense of the Fund.
c. Distribution Fees
The Board has adopted distribution plans for Class 2 and Class 4 shares pursuant to Rule 12b-1 under the 1940 Act. Under the Fund’s compensation distribution plans, the Fund pays Distributors for costs incurred in connection with the servicing, sale and distribution of the Fund’s shares up to 0.35% per year of its average daily net assets of each class. The Board has agreed to limit the current rate to 0.25% per year for Class 2. The plan year, for purposes of monitoring compliance with the maximum annual plan rates, is February 1 through January 31.
d. Transfer Agent Fees
Investor Services, under terms of an agreement, performs shareholder servicing for the Fund and is not paid by the Fund for the services.
e. Investments in Affiliated Management Investment Companies
The Fund invests in one or more affiliated management investment companies for purposes other than exercising a controlling influence over the management or policies. Management fees paid by the Fund are waived on assets invested in the affiliated management investment companies, as noted in the Statement of Operations, in an amount not to exceed the management and administrative fees paid directly or indirectly by each affiliate. Prior to January 1, 2014, the waiver was accounted for as a reduction to management fees. During the year ended December 31, 2016, the Fund held investments in affiliated management investment companies as follows:
| | | | | | | | | | | | | | | | | | | | | | | | | | | | | | | | |
| | | Number of Shares Held at Beginning of Year | | | Gross Additions | | | Gross Reductions | | | Number of Shares Held at End of Year | | | Value at End of Year | | | Investment Income | | | Realized Gain (Loss) | | | % of Affiliated Fund Shares Outstanding Held at End of Year | |
| Non-Controlled Affiliates | | | | | | | | | | | | | | | | | | | | | | | | | | | | | | | | |
Institutional Fiduciary Trust Money Market Portfolio, 0.09% | | | 103,357,618 | | | | 274,969,782 | | | | (331,939,411 | ) | | | 46,387,989 | | | $ | 46,387,989 | | | $ | 1,724 | | | $ | — | | | | 0.3% | |
| | | | | | | | | | | | | | | | | | | | | | | | |
4. Expense Offset Arrangement
The Fund has entered into an arrangement with its custodian whereby credits realized as a result of uninvested cash balances are used to reduce a portion of the Fund’s custodian expenses. During the year ended December 31, 2016, the custodian fees were reduced as noted in the Statement of Operations.
5. Income Taxes
The tax character of distributions paid during the years ended December 31, 2016 and 2015, was as follows:
| | | | | | | | |
| | | 2016 | | | 2015 | |
Distributions paid from: | | | | | | | | |
Ordinary income | | $ | 10,807,940 | | | $ | 11,870,655 | |
Long term capital gain | | | 196,824,759 | | | | 202,263,893 | |
| | | | |
| | $ | 207,632,699 | | | $ | 214,134,548 | |
| | | | |
FRANKLIN TEMPLETON VARIABLE INSURANCE PRODUCTS TRUST
NOTES TO FINANCIAL STATEMENTS
Franklin Small Cap Value VIP Fund (continued)
5. Income Taxes (continued)
At December 31, 2016, the cost of investments, net unrealized appreciation (depreciation), undistributed ordinary income and undistributed long term capital gains for income tax purposes were as follows:
| | | | |
Cost of investments | | $ | 1,010,851,072 | |
| | | | |
Unrealized appreciation | | $ | 459,747,620 | |
Unrealized depreciation | | | (19,329,557 | ) |
| | | | |
Net unrealized appreciation (depreciation) | | $ | 440,418,063 | |
| | | | |
Undistributed ordinary income | | $ | 7,943,724 | |
Undistributed long term capital gain | | | 95,830,205 | |
| | | | |
Distributable earnings | | $ | 103,773,929 | |
| | | | |
Differences between income and/or capital gains as determined on a book basis and a tax basis are primarily due to differing treatment of wash sales.
6. Investment Transactions
Purchases and sales of investments (excluding short term securities) for the year ended December 31, 2016, aggregated $422,233,611 and $499,426,429, respectively.
7. Credit Facility
The Fund, together with other U.S. registered and foreign investment funds (collectively, Borrowers), managed by Franklin Templeton Investments, are borrowers in a joint syndicated senior unsecured credit facility totaling $2 billion (Global Credit Facility) which matures on February 10, 2017. This Global Credit Facility provides a source of funds to the Borrowers for temporary and emergency purposes, including the ability to meet future unanticipated or unusually large redemption requests. Effective February 10, 2017, the Borrowers renewed the Global Credit Facility for a one year term, maturing February 9, 2018, for a total of $2 billion.
Under the terms of the Global Credit Facility, the Fund shall, in addition to interest charged on any borrowings made by the Fund and other costs incurred by the Fund, pay its share of fees and expenses incurred in connection with the implementation and maintenance of the Global Credit Facility, based upon its relative share of the aggregate net assets of all of the Borrowers, including an annual commitment fee of 0.15% based upon the unused portion of the Global Credit Facility. These fees are reflected in other expenses in the Statement of Operations. During the year ended December 31, 2016, the Fund did not use the Global Credit Facility.
8. Fair Value Measurements
The Fund follows a fair value hierarchy that distinguishes between market data obtained from independent sources (observable inputs) and the Fund’s own market assumptions (unobservable inputs). These inputs are used in determining the value of the Fund’s financial instruments and are summarized in the following fair value hierarchy:
| | • | | Level 1 – quoted prices in active markets for identical financial instruments |
| | • | | Level 2 – other significant observable inputs (including quoted prices for similar financial instruments, interest rates, prepayment speed, credit risk, etc.) |
FRANKLIN TEMPLETON VARIABLE INSURANCE PRODUCTS TRUST
NOTES TO FINANCIAL STATEMENTS
Franklin Small Cap Value VIP Fund (continued)
| | • | | Level 3 – significant unobservable inputs (including the Fund’s own assumptions in determining the fair value of financial instruments) |
The input levels are not necessarily an indication of the risk or liquidity associated with financial instruments at that level.
For movements between the levels within the fair value hierarchy, the Fund has adopted a policy of recognizing the transfers as of the date of the underlying event which caused the movement.
A summary of inputs used as of December 31, 2016, in valuing the Fund’s assets carried at fair value, is as follows:
| | | | | | | | | | | | | | | | |
| | | Level 1 | | | Level 2 | | | Level 3 | | | Total | |
| | | | |
| Assets: | | | | | | | | | | | | | | | | |
Investments in Securities: | | | | | | | | | | | | | | | | |
Equity Investmentsa | | $ | 1,395,489,946 | | | $ | — | | | $ | — | | | $ | 1,395,489,946 | |
Corporate Bonds | | | — | | | | 9,391,200 | | | | — | | | | 9,391,200 | |
Short Term Investments | | | 46,387,989 | | | | — | | | | — | | | | 46,387,989 | |
| | | | |
Total Investments in Securities | | $ | 1,441,877,935 | | | $ | 9,391,200 | | | $ | — | | | $ | 1,451,269,135 | |
| | | | |
aFor detailed categories, see the accompanying Statement of Investments.
9. Investment Company Reporting Modernization
In October 2016, the U.S. Securities and Exchange Commission adopted new rules and amended existing rules (together, final rules) intended to modernize the reporting and disclosure of information by registered investment companies. In part, the final rules amend Regulation S-X and require standardized, enhanced disclosures about derivatives in investment company financial statements, as well as other amendments. The compliance date for the amendments to Regulation S-X is August 1, 2017. Management is currently evaluating the impact that the adoption of the amendments to Regulation S-X will have on the Fund’s financial statements and related disclosures.
10. Subsequent Events
The Fund has evaluated subsequent events through the issuance of the financial statements and determined that no events have occurred that require disclosure others than those already disclosed in the financial statements.
FRANKLIN TEMPLETON VARIABLE INSURANCE PRODUCTS TRUST
Report of Independent Registered Public Accounting Firm
Franklin Small Cap Value VIP Fund
To the Board of Trustees and Shareholders of Franklin Templeton Variable Insurance Products Trust
In our opinion, the accompanying statement of assets and liabilities, including the statement of investments, and the related statements of operations and of changes in net assets and the financial highlights present fairly, in all material respects, the financial position of Franklin Small Cap Value VIP Fund (the “Fund”) as of December 31, 2016, the results of its operations for the year then ended, the changes in its net assets for each of the two years in the period then ended and the financial highlights for the periods presented, in conformity with accounting principles generally accepted in the United States of America. These financial statements and financial highlights (hereafter referred to as “financial statements”) are the responsibility of the Fund’s management. Our responsibility is to express an opinion on these financial statements based on our audits. We conducted our audits of these financial statements in accordance with the standards of the Public Company Accounting Oversight Board (United States). Those standards require that we plan and perform the audit to obtain reasonable assurance about whether the financial statements are free of material misstatement. An audit includes examining, on a test basis, evidence supporting the amounts and disclosures in the financial statements, assessing the accounting principles used and significant estimates made by management, and evaluating the overall financial statement presentation. We believe that our audits, which included confirmation of securities as of December 31, 2016 by correspondence with the custodian, transfer agent and brokers, provide a reasonable basis for our opinion.
PricewaterhouseCoopers LLP
San Francisco, California
February 15, 2017
FRANKLIN TEMPLETON VARIABLE INSURANCE PRODUCTS TRUST
Tax Information (unaudited)
Franklin Small Cap Value VIP Fund
Under Section 852(b)(3)(C) of the Internal Revenue Code (Code), the Fund hereby reports the maximum amount allowable but no less than $196,824,759 as a long term capital gain dividend for the fiscal year ended December 31, 2016.
Under Section 854(b)(1)(A) of the Code, the Fund hereby reports 100% of the ordinary income dividends as income qualifying for the dividends received deduction for the fiscal year ended December 31, 2016.
Franklin Small-Mid Cap Growth VIP Fund
This annual report for Franklin Small-Mid Cap Growth VIP Fund covers the fiscal year ended December 31, 2016.
Class 2 Performance Summary as of December 31, 2016
Average annual total return of Class 2 shares* represents the average annual change in value, assuming reinvestment of dividends and capital gains. Average returns smooth out variations in returns, which can be significant; they are not the same as year-by-year results.
| | | | | | | | | | | | |
| Periods ended 12/31/16 | | 1-Year | | | 5-Year | | | 10-Year | |
Average Annual Total Return | | | +4.17% | | | | +10.79% | | | | +6.41% | |
*The Fund has a fee waiver associated with any investment it makes in a Franklin Templeton money fund and/or other Franklin Templeton fund, contractually guaranteed through its current fiscal year-end. Fund investment results reflect the fee waiver; without this waiver, the results would have been lower.
Performance reflects the Fund’s Class 2 operating expenses, but does not include any contract fees, expenses or sales charges. If they had been included, performance would be lower. These charges and deductions, particularly for variable life policies, can have a significant effect on contract values and insurance benefits. See the contract prospectus for a complete description of these expenses, including sales charges.
Performance data represent past performance, which does not guarantee future results. Investment return and principal value will fluctuate, and you may have a gain or loss when you sell your shares. Current performance may differ from figures shown.
Total Return Index Comparison for a Hypothetical $10,000 Investment (1/1/07–12/31/16)
The graph below shows the change in value of a hypothetical $10,000 investment in the Fund over the indicated period and includes reinvestment of any income or distributions. The Fund’s performance* is compared to the performance of the Russell Midcap® Growth Index and the Standard & Poor’s® 500 Index (S&P 500®). One cannot invest directly in an index, and an index is not representative of the Fund’s portfolio. Please see Important Notes to Performance Information preceding the Fund Summaries.
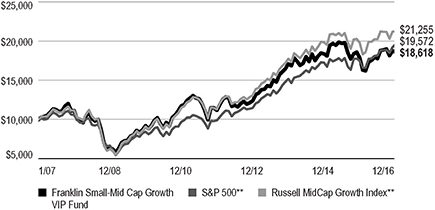
**Source: Morningstar. Please see Index Descriptions following the Fund Summaries.
FRANKLIN SMALL-MID CAP GROWTH VIP FUND
Fund Goal and Main Investments
The Fund seeks long-term capital growth. Under normal market conditions, the Fund invests at least 80% of its net assets in equity securities of small-capitalization and mid-capitalization companies. For this Fund, small cap companies are those within the market capitalization range of companies in the Russell 2500TM Index at the time of purchase, and midcap companies are those within the market capitalization range of companies in the Russell Midcap® Index at the time of purchase.1
Fund Risks
All investments involve risks, including possible loss of principal. Growth stock prices reflect projections of future earnings or revenues, and can, therefore, fall dramatically if the company fails to meet those projections. Smaller, midsized or relatively new or unseasoned companies can be particularly sensitive to changing economic conditions, and their prospects for growth are less certain than those of larger, more established companies. Historically, these securities have experienced more price volatility than larger company stocks, especially over the short term. To the extent the Fund focuses on particular countries, regions, industries, sectors or types of investment from time to time, it may be subject to greater risk of adverse developments in such areas of focus than a fund that invests in a wider variety of countries, regions, industries, sectors or investments. From time to time, the trading market for a particular security or type of security in which the Fund invests may become less liquid or even illiquid. The Fund is actively managed but there is no guarantee that the manager’s investment decisions will produce the desired results. The Fund’s prospectus also includes a description of the main investment risks.
Performance Overview
You can find the Fund’s one-year total return in the Performance Summary. In comparison, the Fund’s narrow benchmark, the Russell Midcap® Growth Index, generated a total return of +7.33%, and its broad benchmark, the S&P 500, produced a +11.96% total return for the same period.2
Portfolio Composition
Based on Total Net Assets as of 12/31/16

*Includes common and preferred stocks.
Economic and Market Overview
The U.S. economy expanded during the 12 months under review. The economy grew at a faster pace in 2016’s third quarter than in the second and first quarters, mainly due to personal consumption expenditures, exports, private inventory investment, federal government spending and nonresidential fixed investment. Manufacturing conditions remained volatile but generally expanded, and the services sector also continued to grow for most of the period. The unemployment rate decreased from 5.0% in December 2015 to 4.7% at period-end.3 Monthly retail sales grew for most of the review period, and rose to its highest level in April in more than a year, due to a broad-based increase across most retail categories.
1. Please see Index Descriptions following the Fund Summaries.
2. Source: Morningstar. One cannot invest directly in an index, and an index is not representative of the Fund’s portfolio. Please see Index Descriptions following the Fund Summaries.
3. Source: Bureau of Labor Statistics.
The dollar value, number of shares or principal amount, and names of all portfolio holdings are listed in the Fund’s Statement of Investments (SOI).
FRANKLIN SMALL-MID CAP GROWTH VIP FUND
Inflation, as measured by the Consumer Price Index, remained relatively subdued for most of the period, but rose in 2016’s
fourth quarter.
After maintaining its target interest rate in the 0.25%–0.50% range for nearly a year, the U.S. Federal Reserve (Fed), at its December meeting, increased its target range for the federal funds rate to 0.50%–0.75%, as policymakers noted improvement in U.S. labor market and inflation. The Federal Open Market Committee also hinted at three additional hikes in 2017. Furthermore, the Fed raised its forecast for 2017 U.S. economic growth, and lowered its unemployment projections.
U.S. equity markets rose during the review period, benefiting from mostly upbeat economic data and better corporate earnings in the U.S., signs of improvement in the Chinese and European economies and ongoing expansionary monetary policies from key central banks. Other contributing factors included investors’ expectations of higher interest rates and inflation in the U.S. driven by hopes of expansionary fiscal policies under the new president Donald Trump, and an Organization of the Petroleum Exporting Countries deal to curb oil production. The Fed’s decision to keep interest rates unchanged at its November meeting further boosted investor confidence. However, the U.K.’s historic vote to leave the European Union (also known as “Brexit”) and global growth concerns weighed on market sentiment. The broad U.S. stock market ended the 12-month period higher, as measured by the S&P 500.
Investment Strategy
We use fundamental, bottom-up research to seek companies meeting our criteria of growth potential, quality and valuation. In seeking sustainable growth characteristics, we look for companies we believe can produce sustainable earnings and cash flow growth, evaluating the long-term market opportunity and competitive structure of an industry to target leaders and emerging leaders. We define quality companies as those with strong and improving competitive positions in attractive markets. We also believe important attributes of quality are experienced and talented management teams as well as financial strength reflected in the capital structure, gross and operating margins, free cash flow generation and returns on capital employed. Our valuation analysis includes a range of potential outcomes based on an assessment of multiple scenarios. In assessing value, we consider whether security
prices fully reflect the balance of the sustainable growth opportunities relative to business and financial risks.
Manager’s Discussion
During the year under review, some sectors represented in the Fund’s portfolio delivered positive returns and contributed to absolute performance. Relative to the Fund’s narrow benchmark, the Russell Midcap Growth® Index, key contributors included an overweighted allocation in energy and stock selection in the consumer staples and real estate sectors.
In energy, positions in oil and natural gas provider Concho Resources and natural gas provider EQT contributed to the Fund’s relative performance.4 Shares of Concho Resources appreciated in 2016 as crude oil prices recovered from winter 2015–2016 lows and Concho was able to increase its Permian Basin oil acreage position, while delivering operating results above market expectations. Concho made several acquisitions of private Permian oil companies, including one of Reliance Energy, which increased its ownership of core acreage in the low cost Permian oil province. The company also raised its production growth guidance above market expectations for no volume growth in 2016 without changing its capital spending guidance, thus demonstrating better-than-expected drilling efficiency. The Fund’s holding in EQT benefited from a rebound in natural gas prices following a record warm winter that caused prices to decrease. Last winter’s drop in natural gas prices led to more decreases in the U.S. natural rig count, which helped the U.S. natural gas supply to continue to decline and balance the market. EQT also made several acquisitions in the Marcellus Shale basin of Pennsylvania and West Virginia at what we considered attractive values, which expanded its footprint and increased its inventory of premium undrilled locations, thereby removing some market concern that the company had drilled up its best natural
gas wells.
In the consumer staples sectors and real estate sectors, contributors included WhiteWave Foods4 and Equinix, respectively. American consumer packaged food and beverage company Whitewave’s shares surged as multinational food company Danone announced in July its intention to acquire WhiteWave in an all-cash transaction. We believed the purchase price was fair so decided to exit our position following the announcement. Data center provider Equinix benefited from trends toward hybrid cloud architecture for enterprises. The company also benefited from the strong growth of cloud computing technology. Equinix made several
4. Sold by period-end.
FRANKLIN SMALL-MID CAP GROWTH VIP FUND
| | | | |
| Top 10 Holdings | | | |
| 12/31/16 | | | |
Company Sector/Industry | | % of Total Net Assets | |
Roper Technologies Inc.
Industrials | | | 2.0% | |
Quintiles IMS Holdings Inc.
Health Care | | | 1.8% | |
Equinix Inc.
Real Estate | | | 1.7% | |
Signature Bank
Financials | | | 1.7% | |
The Cooper Cos. Inc.
Health Care | | | 1.6% | |
Edwards Lifesciences Corp.
Health Care | | | 1.6% | |
Willis Towers Watson PLC
Financials | | | 1.5% | |
Hologic Inc.
Health Care | | | 1.5% | |
Genesee & Wyoming Inc.
Industrials | | | 1.4% | |
Mettler-Toledo International Inc.
Health Care | | | 1.4% | |
acquisitions in 2016 including Bit-Isle and data center and colocation center company TelecityGroup, which have expanded its global footprint. Additionally, Equinix recently announced a deal to acquire Verizon’s datacenters.
Other notable contributors to the Fund’s relative performance included construction materials manufacturer Martin Marietta Materials and geospatial information products and services provider DigitalGlobe. Martin Marietta Materials enjoyed strong demand for aggregates and cement across all three of its end-markets: residential construction, non-residential and infrastructure. The company’s stock was strong following the U.S. election on expectations for a large increase in infrastructure spending at the federal level, as well as expectations around the benefits of a lower corporate tax rate. It also benefited from the passage of the Fixing America’s Surface Transportation Act in late 2015, a federal highway bill that provided funding visibility for the next five years, along with the passage of several state gas tax increases and other initiatives to support the construction of new roads, highways and bridges. Share buybacks have also continued. Shares of DigitalGlobe rebounded during the period under review as the company began to execute better after missing estimates previously. We believe the new chief financial officer has done an excellent job at trimming costs and driving better cash conversion. Finally, the market has become less concerned about new disruptive competition.
In contrast, a key detractor from the Fund’s relative performance was stock selection and an overweighted position in the health care sector. Stock selection in the financials sector also detracted from relative results but it was slightly offset by a favorable overweighting in the sector. Finally, stock selection and an overweighting in the information technology (IT) sector hampered relative performance.
Notable detractors in health care included Perrigo,4 Akorn4 and Impax Laboratories. Shares of specialty pharmaceuticals manufacturer Perrigo fell due to news of the departure of its chief executive officer and a write-down in its recently acquired European consumer brand product portfolio. The company is also experiencing challenges in its U.S. generic business due to pricing and competition. Generic pharmaceutical company Akorn declined following concerns over generic drug pricing due to competition and customer consolidation. Additionally, regulatory actions at a key manufacturing plant has delayed several generic drug approvals. Specialty pharmaceutical company Impax Labs was also negatively impacted by concerns over generic drug pricing due to competition and customer consolidation. Additionally, poorly executed and timed acquisition of several generic assets from Teva Pharmaceutials led to a significant write-down of the acquisition. The company also reduced earnings guidance three times in 2016.
In financials, advisory and broking solutions company Willis Towers Watson reported weak organic revenue growth and profit margins in the first three quarters following the merger of Willis and Towers Watson. We believe performance may improve in 2017, but 2016 was a more disappointing transition year than expected.
Within IT, network security solutions provider Palo Alto Networks and commercial real estate information company CoStar Group hindered the Fund’s performance. Palo Alto Networks experienced difficulties during the period when investors became concerned about slowing product revenue growth and the impact of a public cloud on the company’s long-term growth potential. Nevertheless, given the growing importance of cyber security and Palo Alto’s differentiated platform offering, we believe that spending trends could re-accelerate over the next few quarters and we find the company’s valuation compelling at current levels. CoStar’s management announced an unexpected investment in data research resources that was not previously incorporated in earnings estimates. We believe this investment could enable the company to capture a greater share of the upsell potential from its prior acquisition of LoopNet, but it has likely created some
FRANKLIN SMALL-MID CAP GROWTH VIP FUND
uncertainty among investors as to the company’s sustainable growth and margin profile.
Thank you for your participation in Franklin Small-Mid Cap Growth VIP Fund. We look forward to serving your future investment needs.
The foregoing information reflects our analysis, opinions and portfolio holdings as of December 31, 2016, the end of the reporting period. The way we implement our main investment strategies and the resulting portfolio holdings may change depending on factors such as market and economic conditions. These opinions may not be relied upon as investment advice or an offer for a particular security. The information is not a complete analysis of every aspect of any market, country, industry, security or the Fund. Statements of fact are from sources considered reliable, but the investment manager makes no representation or warranty as to their completeness or accuracy. Although historical performance is no guarantee of future results, these insights may help you understand our investment management philosophy.
FRANKLIN SMALL-MID CAP GROWTH VIP FUND
Class 2 Fund Expenses
As an investor in a variable insurance contract (Contract) that indirectly provides for investment in an underlying mutual fund, you can incur transaction and/or ongoing expenses at both the Fund level and the Contract Level: (1) transaction expenses can include sales charges (loads) on purchases, surrender fees, transfer fees and premium taxes; and (2) ongoing expenses can include management fees, distribution and service (12b-1) fees, contract fees, annual maintenance fees, mortality and expense risk fees and other fees and expenses. All mutual funds and Contracts have some types of ongoing expenses. The table below shows Fund-level ongoing expenses and can help you understand these costs and compare them with those of other mutual funds offered through the Contract. The table assumes a $1,000 investment held for the six months indicated. Please refer to the Fund prospectus for additional information on operating expenses.
Actual Fund Expenses
The table below provides information about the actual account values and actual expenses in the columns under the heading “Actual.” In these columns the Fund’s actual return, which includes the effect of ongoing Fund expenses but does not include the effect of ongoing Contract expenses, is used to calculate the “Ending Account Value.”
You can estimate the Fund-level expenses you paid during the period by following these steps (of course, your account value and expenses will differ from those in this illustration):
| | Divide your account value by $1,000 |
| | (if your account had an $8,600 value, |
| | then $8,600 ÷ $1,000 = 8.6). |
| | Then multiply the result by the number under the headings “Actual” and “Fund-Level Expenses Paid During Period” |
| | (if Fund-Level Expenses Paid During Period were $7.50, |
| | then 8.6 x $7.50 = $64.50). |
In this illustration, the estimated expenses paid this period at the Fund level are $64.50.
Hypothetical Example for Comparison with Other Mutual Funds
Under the heading “Hypothetical” in the table, information is provided about hypothetical account values and hypothetical expenses based on the Fund’s actual expense ratio and an assumed rate of return of 5% per year before expenses, which is not the Fund’s actual return. This information may not be used to estimate the actual ending account balance or expenses you paid for the period, but it can help you compare ongoing costs of investing in the Fund with those of other mutual funds offered through the Contract. To do so, compare this 5% hypothetical example with the 5% hypothetical examples that appear in the shareholder reports of other funds offered through the Contract.
Please note that expenses shown in the table are meant to highlight ongoing costs at the Fund level only and do not reflect any ongoing expenses at the Contract level, or transaction expenses at either the Fund or Contract levels. In addition, while the Fund does not have transaction expenses, if the transaction and ongoing expenses at the Contract level were included, the expenses shown below would be higher. You should consult your Contract prospectus or disclosure document for more information.
| | | | | | | | | | | | | | | | | | | | | | | | |
| | | | | | Actual
(actual return after expenses) | | | Hypothetical
(5% annual return before expenses) | | | | |
| Share Class | |
| Beginning Account
Value 7/1/16 |
| |
| Ending Account
Value 12/31/16 |
| |
| Fund-Level
Expenses Paid During Period 7/1/16–12/31/16 |
1,2 | |
| Ending Account
Value 12/31/16 |
| |
| Fund-Level
Expenses Paid During Period 7/1/16–12/31/16 |
1,2 | |
| Net
Annualized Expense Ratio |
2 |
Class 2 | | | $1,000 | | | | $1,048.30 | | | | $5.46 | | | | $1,019.81 | | | | $5.38 | | | | 1.06% | |
1. Expenses are equal to the annualized expense ratio for the six-month period as indicated above–in the far right column–multiplied by the simple average account value over the period indicated, and then multiplied by 184/366 to reflect the one-half year period.
2. Reflects expenses after fee waivers and expense reimbursements. Does not include any ongoing expenses of the Contract for which the Fund is an investment option or acquired fund fees and expenses.
FRANKLIN TEMPLETON VARIABLE INSURANCE PRODUCTS TRUST
Financial Highlights
Franklin Small-Mid Cap Growth VIP Fund
| | | | | | | | | | | | | | | | | | | | |
| | | Year Ended December 31, | |
| | | 2016 | | | 2015 | | | 2014 | | | 2013 | | | 2012 | |
| Class 1 | | | | | | | | | | | | | | | | | | | | |
Per share operating performance (for a share outstanding throughout the year) | | | | | | | | | | | | | | | | | | | | |
| | | | | |
Net asset value, beginning of year | | | $19.09 | | | | $24.95 | | | | $28.38 | | | | $21.87 | | | | $21.19 | |
| | | | |
| | | | | |
| Income from investment operationsa: | | | | | | | | | | | | | | | | | | | | |
| | | | | |
Net investment income (loss)b | | | (0.03 | ) | | | — | c,d | | | (0.07 | ) | | | (0.09 | ) | | | (0.01 | )e |
| | | | | |
Net realized and unrealized gains (losses) | | | 0.77 | | | | (0.03 | ) | | | 2.04 | | | | 8.19 | | | | 2.27 | |
| | | | |
Total from investment operations | | | 0.74 | | | | (0.03 | ) | | | 1.97 | | | | 8.10 | | | | 2.26 | |
| | | | |
| | | | | |
| Less distributions from net realized gains | | | (2.06 | ) | | | (5.83 | ) | | | (5.40 | ) | | | (1.59 | ) | | | (1.58 | ) |
| | | | |
| | | | | |
| Net asset value, end of year | | | $17.77 | | | | $19.09 | | | | $24.95 | | | | $28.38 | | | | $21.87 | |
| | | | |
| | | | | |
Total returnf | | | 4.40% | | | | (2.44)% | | | | 7.78% | | | | 38.50% | | | | 11.12% | |
| | | | | |
| Ratios to average net assets | | | | | | | | | | | | | | | | | | | | |
| | | | | |
Expenses before waiver and payments by affiliates | | | 0.84% | | | | 0.81% | | | | 0.80% | | | | 0.80% | | | | 0.80% | |
| | | | | |
Expenses net of waiver and payments by affiliates | | | 0.82% | g | | | 0.81% | h | | | 0.80% | h | | | 0.80% | g | | | 0.80% | |
| | | | | |
Net investment income (loss) | | | (0.16 | )% | | | 0.01% | d | | | (0.29 | )% | | | (0.35 | )% | | | (0.03)% | e |
| | | | | |
| Supplemental data | | | | | | | | | | | | | | | | | | | | |
| | | | | |
Net assets, end of year (000’s) | | | $31,756 | | | | $87,866 | | | | $99,803 | | | | $98,020 | | | | $75,977 | |
| | | | | |
Portfolio turnover rate | | | 32.23% | i | | | 37.85% | | | | 48.73% | | | | 42.77% | | | | 41.44% | |
aThe amount shown for a share outstanding throughout the period may not correlate with the Statement of Operations for the period due to the timing of sales and repurchases of the Fund’s shares in relation to income earned and/or fluctuating fair value of the investments of the Fund.
bBased on average daily shares outstanding.
cAmount rounds to less than $0.01 per share.
dNet investment income per share includes approximately $0.05 per share related to income received in the form of special dividends in connection with certain Fund holdings. Excluding this amount, the ratio of net investment income to average net assets would have been (0.24)%.
eNet investment income per share includes approximately $0.03 per share related to income received in the form of special dividends in connection with certain Fund holdings. Excluding this amount, the ratio of net investment income to average net assets would have been (0.16)%.
fTotal return does not include fees, charges or expenses imposed by the variable annuity and life insurance contracts for which Franklin Templeton Variable Insurance Products Trust serves as an underlying investment vehicle.
gBenefit of expense reduction rounds to less than 0.01%.
hBenefit of waiver and payments by affiliates rounds to less than 0.01%.
iExcludes the value of portfolio securities delivered as a result of a redemption in-kind. See Note 9.
| | | | | | |
| | | The accompanying notes are an integral part of these financial statements. | Annual Report | | | FSC-7 | |
FRANKLIN TEMPLETON VARIABLE INSURANCE PRODUCTS TRUST
FINANCIAL HIGHLIGHTS
Franklin Small-Mid Cap Growth VIP Fund (continued)
| | | | | | | | | | | | | | | | | | | | |
| | | Year Ended December 31, | |
| | | 2016 | | | 2015 | | | 2014 | | | 2013 | | | 2012 | |
| Class 2 | | | | | | | | | | | | | | | | | | | | |
Per share operating performance (for a share outstanding throughout the year) | | | | | | | | | | | | | | | | | | | | |
| | | | | |
Net asset value, beginning of year | | | $17.69 | | | | $23.56 | | | | $27.16 | | | | $21.04 | | | | $20.49 | |
| | | | |
| | | | | |
| Income from investment operationsa: | | | | | | | | | | | | | | | | | | | | |
| | | | | |
Net investment income (loss)b | | | (0.07 | ) | | | (0.05 | )c | | | (0.13 | ) | | | (0.14 | ) | | | (0.06 | )d |
| | | | | |
Net realized and unrealized gains (losses) | | | 0.71 | | | | 0.01 | | | | 1.93 | | | | 7.85 | | | | 2.19 | |
| | | | |
| | | | | |
| Total from investment operations | | | 0.64 | | | | (0.04 | ) | | | 1.80 | | | | 7.71 | | | | 2.13 | |
| | | | |
Less distributions from net realized gains | | | (2.06 | ) | | | (5.83 | ) | | | (5.40 | ) | | | (1.59 | ) | | | (1.58 | ) |
| | | | |
Net asset value, end of year | | | $16.27 | | | | $17.69 | | | | $23.56 | | | | $27.16 | | | | $21.04 | |
| | | | |
| | | | | |
Total returne | | | 4.17% | | | | (2.66)% | | | | 7.47% | | | | 38.15% | | | | 10.85% | |
| | | | | |
| Ratios to average net assets | | | | | | | | | | | | | | | | | | | | |
| | | | | |
Expenses before waiver and payments by affiliates | | | 1.09% | | | | 1.06% | | | | 1.05% | | | | 1.05% | | | | 1.05% | |
| | | | | |
Expenses net of waiver and payments by affiliates | | | 1.07% | f | | | 1.06% | g | | | 1.05% | g | | | 1.05% | f | | | 1.05% | |
| | | | | |
Net investment income (loss) | | | (0.41 | )% | | | (0.24 | )%c | | | (0.54 | )% | | | (0.60 | )% | | | (0.28)% | d |
| | | | | |
| Supplemental data | | | | | | | | | | | | | | | | | | | | |
| | | | | |
Net assets, end of year (000’s) | | | $392,777 | | | | $478,649 | | | | $582,772 | | | | $660,806 | | | | $670,193 | |
| | | | | |
Portfolio turnover rate | | | 32.23% | h | | | 37.85% | | | | 48.73% | | | | 42.77% | | | | 41.44% | |
aThe amount shown for a share outstanding throughout the period may not correlate with the Statement of Operations for the period due to the timing of sales and
repurchases of the Fund’s shares in relation to income earned and/or fluctuating fair value of the investments of the Fund.
bBased on average daily shares outstanding.
cNet investment income per share includes approximately $0.05 per share related to income received in the form of special dividends in connection with certain Fund
holdings. Excluding this amount, the ratio of net investment income to average net assets would have been (0.49)%.
dNet investment income per share includes approximately $0.03 per share related to income received in the form of special dividends in connection with certain Fund
holdings. Excluding this amount, the ratio of net investment income to average net assets would have been (0.41)%.
eTotal return does not include fees, charges or expenses imposed by the variable annuity and life insurance contracts for which Franklin Templeton Variable Insurance
Products Trust serves as an underlying investment vehicle.
fBenefit of expense reduction rounds to less than 0.01%.
gBenefit of waiver and payments by affiliates rounds to less than 0.01%.
hExcludes the value of portfolio securities delivered as a result of a redemption in-kind. See Note 9.
| | | | |
| FSC 8 | | Annual Report | The accompanying notes are an integral part of these financial statements. | | |
FRANKLIN TEMPLETON VARIABLE INSURANCE PRODUCTS TRUST
FINANCIAL HIGHLIGHTS
Franklin Small-Mid Cap Growth VIP Fund (continued)
| | | | | | | | | | | | | | | | | | | | |
| | | Year Ended December 31, | |
| | | 2016 | | | 2015 | | | 2014 | | | 2013 | | | 2012 | |
| Class 4 | | | | | | | | | | | | | | | | | | | | |
Per share operating performance (for a share outstanding throughout the year) | | | | | | | | | | | | | | | | | | | | |
| | | | | |
Net asset value, beginning of year | | | $18.23 | | | | $24.14 | | | | $27.72 | | | | $21.47 | | | | $20.90 | |
| | | | |
| | | | | |
| Income from investment operationsa: | | | | | | | | | | | | | | | | | | | | |
| | | | | |
Net investment income (loss)b | | | (0.09 | ) | | | (0.07 | )c | | | (0.16 | ) | | | (0.17 | ) | | | (0.09 | )d |
| | | | | |
Net realized and unrealized gains (losses) | | | 0.73 | | | | (0.01 | ) | | | 1.98 | | | | 8.01 | | | | 2.24 | |
| | | | |
Total from investment operations | | | 0.64 | | | | (0.08 | ) | | | 1.82 | | | | 7.84 | | | | 2.15 | |
| | | | |
| | | | | |
| Less distributions from net realized gains | | | (2.06 | ) | | | (5.83 | ) | | | (5.40 | ) | | | (1.59 | ) | | | (1.58 | ) |
| | | | |
| | | | | |
Net asset value, end of year | | | $16.81 | | | | $18.23 | | | | $24.14 | | | | $27.72 | | | | $21.47 | |
| | | | |
| | | | | |
Total returne | | | 4.04% | | | | (2.77)% | | | | 7.39% | | | | 37.99% | | | | 10.79% | |
| | | | | |
| Ratios to average net assets | | | | | | | | | | | | | | | | | | | | |
| | | | | |
Expenses before waiver and payments by affiliates | | | 1.19% | | | | 1.16% | | | | 1.15% | | | | 1.15% | | | | 1.15% | |
| | | | | |
Expenses net of waiver and payments by affiliates | | | 1.17% | f | | | 1.16% | g | | | 1.15% | g | | | 1.15% | f | | | 1.15% | |
| | | | | |
Net investment income (loss) | | | (0.51 | )% | | | (0.34 | )%c | | | (0.64 | )% | | | (0.70 | )% | | | (0.38 | )%d |
| | | | | |
| Supplemental data | | | | | | | | | | | | | | | | | | | | |
| | | | | |
Net assets, end of year (000’s) | | | $13,825 | | | | $15,105 | | | | $16,384 | | | | $19,132 | | | | $12,000 | |
| | | | | |
Portfolio turnover rate | | | 32.23% | h | | | 37.85% | | | | 48.73% | | | | 42.77% | | | | 41.44% | |
aThe amount shown for a share outstanding throughout the period may not correlate with the Statement of Operations for the period due to the timing of sales and
repurchases of the Fund’s shares in relation to income earned and/or fluctuating fair value of the investments of the Fund.
bBased on average daily shares outstanding.
cNet investment income per share includes approximately $0.05 per share related to income received in the form of special dividends in connection with certain Fund
holdings. Excluding this amount, the ratio of net investment income to average net assets would have been (0.59)%.
dNet investment income per share includes approximately $0.03 per share related to income received in the form of special dividends in connection with certain Fund
holdings. Excluding this amount, the ratio of net investment income to average net assets would have been (0.51)%.
eTotal return does not include fees, charges or expenses imposed by the variable annuity and life insurance contracts for which Franklin Templeton Variable Insurance
Products Trust serves as an underlying investment vehicle.
fBenefit of expense reduction rounds to less than 0.01%.
gBenefit of waiver and payments by affiliates rounds to less than 0.01%.
hExcludes the value of portfolio securities delivered as a result of a redemption in-kind. See Note 9.
| | | | | | |
| | | The accompanying notes are an integral part of these financial statements. | Annual Report | | | FSC-9 | |
FRANKLIN TEMPLETON VARIABLE INSURANCE PRODUCTS TRUST
Statement of Investments, December 31, 2016
| | | | | | | | | | |
| Franklin Small-Mid Cap Growth VIP Fund | |
| | | | | Shares | | | Value | |
| | | Common Stocks 96.5% | | | | | | |
| | | Consumer Discretionary 18.8% | | | | | | |
| | Advance Auto Parts Inc. | | | 17,273 | | | $ | 2,921,210 | |
| a | | Buffalo Wild Wings Inc. | | | 25,665 | | | | 3,962,676 | |
| | Delphi Automotive PLC (United Kingdom) | | | 68,077 | | | | 4,584,986 | |
| | Dick’s Sporting Goods Inc. | | | 91,742 | | | | 4,871,500 | |
| a | | Dollar Tree Inc. | | | 66,811 | | | | 5,156,473 | |
| | Dominos Pizza Inc. | | | 9,200 | | | | 1,465,008 | |
| | Expedia Inc. | | | 11,500 | | | | 1,302,720 | |
| a | | Global Eagle Entertainment Inc. | | | 243,694 | | | | 1,574,263 | |
| a | | Grand Canyon Education Inc. | | | 87,257 | | | | 5,100,172 | |
| | Hanesbrands Inc. | | | 212,907 | | | | 4,592,404 | |
| a | | IMAX Corp. | | | 124,088 | | | | 3,896,363 | |
| | L Brands Inc. | | | 74,388 | | | | 4,897,706 | |
| a | | Liberty Broadband Corp., C | | | 53,650 | | | | 3,973,855 | |
| | Marriott International Inc., A | | | 51,167 | | | | 4,230,488 | |
| | Newell Brands Inc. | | | 101,444 | | | | 4,529,475 | |
| a | | Norwegian Cruise Line Holdings Ltd. | | | 115,378 | | | | 4,907,026 | |
| a | | NVR Inc. | | | 2,382 | | | | 3,975,558 | |
| a | | O’Reilly Automotive Inc. | | | 18,007 | | | | 5,013,329 | |
| | Ross Stores Inc. | | | 76,385 | | | | 5,010,856 | |
| | Tractor Supply Co. | | | 62,337 | | | | 4,725,768 | |
| a,b | | Zoe’s Kitchen Inc. | | | 72,269 | | | | 1,733,733 | |
| | | | | | | | | | |
| | | | | | | | | 82,425,569 | |
| | | | | | | | | | |
| | | Consumer Staples 4.8% | | | | | | |
| | Church & Dwight Co. Inc. | | | 25,000 | | | | 1,104,750 | |
| | Molson Coors Brewing Co., B | | | 30,200 | | | | 2,938,762 | |
| a | | Monster Beverage Corp. | | | 69,416 | | | | 3,077,906 | |
| | Pinnacle Foods Inc. | | | 101,494 | | | | 5,424,854 | |
| a | | Post Holdings Inc. | | | 57,739 | | | | 4,641,638 | |
| a | | TreeHouse Foods Inc. | | | 53,449 | | | | 3,858,483 | |
| | | | | | | | | | |
| | | | | | | | | 21,046,393 | |
| | | | | | | | | | |
| | | Energy 2.5% | | | | | | |
| | Cabot Oil & Gas Corp., A | | | 153,649 | | | | 3,589,241 | |
| a | | Concho Resources Inc. | | | 7,722 | | | | 1,023,937 | |
| | Noble Energy Inc. | | | 83,207 | | | | 3,166,858 | |
| | Superior Energy Services Inc. | | | 185,061 | | | | 3,123,830 | |
| | | | | | | | | | |
| | | | | | | | | 10,903,866 | |
| | | | | | | | | | |
| | | Financials 9.1% | | | | | | |
| a | | Affiliated Managers Group Inc. | | | 42,286 | | | | 6,144,156 | |
| | Arthur J. Gallagher & Co. | | | 102,008 | | | | 5,300,336 | |
| | Lazard Ltd., A | | | 116,837 | | | | 4,800,832 | |
| | MarketAxess Holdings Inc. | | | 18,696 | | | | 2,746,816 | |
| | Moody’s Corp. | | | 36,909 | | | | 3,479,411 | |
| a | | Signature Bank | | | 48,479 | | | | 7,281,546 | |
| a | | SVB Financial Group | | | 21,578 | | | | 3,704,080 | |
| | Willis Towers Watson PLC | | | 54,100 | | | | 6,615,348 | |
| | | | | | | | | | |
| | | | | | | | | 40,072,525 | |
| | | | | | | | | | |
| | | Health Care 19.2% | | | | | | |
| a | | Acadia Pharmaceuticals Inc. | | | 41,773 | | | | 1,204,733 | |
| a,b | | AveXis Inc. | | | 18,000 | | | | 859,140 | |
| a | | BioMarin Pharmaceutical Inc. | | | 20,408 | | | | 1,690,599 | |
FRANKLIN TEMPLETON VARIABLE INSURANCE PRODUCTS TRUST
STATEMENT OF INVESTMENTS
Franklin Small-Mid Cap Growth VIP Fund (continued)
| | | | | | | | | | |
| | | | | Shares | | | Value | |
| | | Common Stocks (continued) | | | | | | |
| | | Health Care (continued) | | | | | | |
| a | | Celldex Therapeutics Inc. | | | 111,622 | | | $ | 395,142 | |
| a | | Cerner Corp. | | | 44,995 | | | | 2,131,413 | |
| | The Cooper Cos. Inc. | | | 39,272 | | | | 6,869,851 | |
| a | | DaVita Inc. | | | 64,692 | | | | 4,153,226 | |
| | DENTSPLY SIRONA Inc. | | | 61,189 | | | | 3,532,441 | |
| a | | DexCom Inc. | | | 64,388 | | | | 3,843,964 | |
| a | | Edwards Lifesciences Corp. | | | 72,921 | | | | 6,832,698 | |
| a | | Envision Healthcare Corp. | | | 21,210 | | | | 1,342,381 | |
| a,b | | Heron Therapeutics Inc. | | | 68,230 | | | | 893,813 | |
| a | | Hologic Inc. | | | 159,367 | | | | 6,393,804 | |
| a | | Impax Laboratories Inc. | | | 78,787 | | | | 1,043,928 | |
| a | | Incyte Corp. | | | 29,169 | | | | 2,924,776 | |
| a | | Insulet Corp. | | | 49,688 | | | | 1,872,244 | |
| a,b | | iRhythm Technologies Inc. | | | 34,200 | | | | 1,026,000 | |
| a | | Mallinckrodt PLC | | | 91,653 | | | | 4,566,152 | |
| a | | Mednax Inc. | | | 16,703 | | | | 1,113,422 | |
| a | | Mettler-Toledo International Inc. | | | 15,155 | | | | 6,343,277 | |
| a | | Neurocrine Biosciences Inc. | | | 24,944 | | | | 965,333 | |
| a | | Nevro Corp. | | | 58,581 | | | | 4,256,495 | |
| a | | Patheon NV | | | 42,276 | | | | 1,213,744 | |
| a | | Penumbra Inc. | | | 21,648 | | | | 1,381,142 | |
| a | | Pfenex Inc. | | | 129,710 | | | | 1,176,470 | |
| a | | Quintiles IMS Holdings Inc. | | | 101,193 | | | | 7,695,728 | |
| a,b | | Revance Therapeutics Inc. | | | 88,972 | | | | 1,841,720 | |
| a | | Tesaro Inc. | | | 23,724 | | | | 3,190,403 | |
| a,b | | TherapeuticsMD Inc. | | | 142,583 | | | | 822,704 | |
| a | | Waters Corp. | | | 17,500 | | | | 2,351,825 | |
| | | | | | | | | | |
| | | | | | | | | 83,928,568 | |
| | | | | | | | | | |
| | | Industrials 14.2% | | | | | | |
| | Acuity Brands Inc. | | | 17,707 | | | | 4,087,838 | |
| | Allegiant Travel Co. | | | 13,926 | | | | 2,317,286 | |
| a | | DigitalGlobe Inc. | | | 89,743 | | | | 2,571,137 | |
| | Dun & Bradstreet Corp. | | | 39,842 | | | | 4,833,631 | |
| a | | Genesee & Wyoming Inc. | | | 91,416 | | | | 6,345,185 | |
| a | | HD Supply Holdings Inc. | | | 103,545 | | | | 4,401,698 | |
| | Hexcel Corp. | | | 97,934 | | | | 5,037,725 | |
| a | | IHS Markit Ltd. | | | 175,315 | | | | 6,207,904 | |
| | J.B. Hunt Transport Services Inc. | | | 36,846 | | | | 3,576,641 | |
| | Robert Half International Inc. | | | 126,288 | | | | 6,160,329 | |
| | Roper Technologies Inc. | | | 46,743 | | | | 8,557,709 | |
| | Stanley Black & Decker Inc. | | | 22,996 | | | | 2,637,411 | |
| | Textron Inc. | | | 42,000 | | | | 2,039,520 | |
| a | | Univar Inc. | | | 15,000 | | | | 425,550 | |
| a | | Verisk Analytics Inc. | | | 37,561 | | | | 3,048,826 | |
| | | | | | | | | | |
| | | | | | | | | 62,248,390 | |
| | | | | | | | | | |
| | | Information Technology 20.6% | | | | | | |
| a | | 2U Inc. | | | 139,079 | | | | 4,193,232 | |
| a | | Alarm.com Holdings Inc. | | | 34,696 | | | | 965,590 | |
| | Alliance Data Systems Corp. | | | 10,266 | | | | 2,345,781 | |
| | Analog Devices Inc. | | | 46,091 | | | | 3,347,128 | |
| a | | ANSYS Inc. | | | 33,169 | | | | 3,067,801 | |
FRANKLIN TEMPLETON VARIABLE INSURANCE PRODUCTS TRUST
STATEMENT OF INVESTMENTS
Franklin Small-Mid Cap Growth VIP Fund (continued)
| | | | | | | | | | |
| | | | | Shares | | | Value | |
| | | Common Stocks (continued) | | | | | | |
| | | Information Technology (continued) | | | | | | |
| a | | Atlassian Corp. PLC (Australia) | | | 81,082 | | | $ | 1,952,455 | |
| a | | Blackline Inc. | | | 11,100 | | | | 306,693 | |
| a | | Bottomline Technologies (de) Inc. | | | 110,319 | | | | 2,760,181 | |
| a | | Cavium Inc. | | | 20,500 | | | | 1,280,020 | |
| | Cognex Corp. | | | 66,648 | | | | 4,240,146 | |
| a | | CoStar Group Inc. | | | 31,635 | | | | 5,962,881 | |
| | CSRA Inc. | | | 173,055 | | | | 5,510,071 | |
| a | | Electronic Arts Inc. | | | 31,349 | | | | 2,469,047 | |
| | Fidelity National Information Services Inc. | | | 64,682 | | | | 4,892,546 | |
| a | | FleetCor Technologies Inc. | | | 31,695 | | | | 4,485,476 | |
| a | | GoDaddy Inc., A | | | 127,917 | | | | 4,470,699 | |
| a | | Integrated Device Technology Inc. | | | 78,440 | | | | 1,848,046 | |
| | KLA-Tencor Corp. | | | 38,287 | | | | 3,012,421 | |
| | Lam Research Corp. | | | 37,316 | | | | 3,945,421 | |
| | Microchip Technology Inc. | | | 57,127 | | | | 3,664,697 | |
| | Monolithic Power Systems | | | 2,600 | | | | 213,018 | |
| a | | Palo Alto Networks Inc. | | | 34,998 | | | | 4,376,500 | |
| a | | Proofpoint Inc. | | | 31,124 | | | | 2,198,911 | |
| a | | Q2 Holdings Inc. | | | 19,696 | | | | 568,230 | |
| a | | Quantenna Communications Inc. | | | 11,900 | | | | 215,747 | |
| a | | ServiceNow Inc. | | | 60,537 | | | | 4,500,321 | |
| | Skyworks Solutions Inc. | | | 7,000 | | | | 522,620 | |
| a | | Square Inc., A | | | 28,000 | | | | 381,640 | |
| a | | Vantiv Inc., A | | | 105,734 | | | | 6,303,861 | |
| a | | ViaSat Inc. | | | 44,366 | | | | 2,937,916 | |
| a | | Workday Inc., A | | | 32,143 | | | | 2,124,331 | |
| a | | Zendesk Inc. | | | 53,100 | | | | 1,125,720 | |
| | | | | | | | | | |
| | | | | | | | | 90,189,147 | |
| | | | | | | | | | |
| | | Materials 3.9% | | | | | | |
| a | | Axalta Coating Systems Ltd. | | | 219,007 | | | | 5,956,991 | |
| a | | Ingevity Corp. | | | 41,921 | | | | 2,299,786 | |
| | International Flavors & Fragrances Inc. | | | 21,500 | | | | 2,533,345 | |
| | Martin Marietta Materials Inc. | | | 28,191 | | | | 6,245,152 | |
| | | | | | | | | | |
| | | | | | | | | 17,035,274 | |
| | | | | | | | | | |
| | | Real Estate 2.6% | | | | | | |
| a | | CBRE Group Inc. | | | 122,621 | | | | 3,861,335 | |
| | Equinix Inc. | | | 20,553 | | | | 7,345,848 | |
| | | | | | | | | | |
| | | | | | | | | 11,207,183 | |
| | | | | | | | | | |
| | | Telecommunication Services 0.8% | | | | | | |
| a | | SBA Communications Corp. | | | 35,557 | | | | 3,671,616 | |
| | | | | | | | | | |
| | Total Common Stocks (Cost $329,802,194) | | | | | | | 422,728,531 | |
| | | | | | | | | | |
| | Preferred Stocks 0.5% | | | | | | | | |
| | | Consumer Discretionary 0.5% | | | | | | |
| a,c | | DraftKings Inc., pfd., D | | | 115,528 | | | | 522,972 | |
| a,c | | DraftKings Inc., pfd., D-1 | | | 284,105 | | | | 1,782,475 | |
| | | | | | | | | | |
| | Total Preferred Stocks (Cost $2,800,003) | | | | | | | 2,305,447 | |
| | | | | | | | | | |
| | Total Investments before Short Term Investments (Cost $332,602,197) | | | | | | | 425,033,978 | |
FRANKLIN TEMPLETON VARIABLE INSURANCE PRODUCTS TRUST
STATEMENT OF INVESTMENTS
Franklin Small-Mid Cap Growth VIP Fund (continued)
| | | | | | | | | | |
| | | | | Shares | | | Value | |
| | | Short Term Investments 4.4% | | | | | | |
| | | Money Market Funds (Cost $14,138,203) 3.2% | | | | | | |
| d,e | | Institutional Fiduciary Trust Money Market Portfolio, 0.09% | | | 14,138,203 | | | $ | 14,138,203 | |
| | | | | | | | | | |
| f | | Investments from Cash Collateral Received for Loaned Securities
(Cost $5,131,350) 1.2% | | | | | | | | |
| | | Money Market Funds 1.2% | | | | | | |
| d,e | | Institutional Fiduciary Trust Money Market Portfolio, 0.09% | | | 5,131,350 | | | | 5,131,350 | |
| | | | | | | | | | |
| | Total Investments (Cost $351,871,750) 101.4% | | | | | | | 444,303,531 | |
| | Other Assets, less Liabilities (1.4)% | | | | | | | (5,945,746 | ) |
| | | | | | | | | | |
| | Net Assets 100.0% | | | | | | $ | 438,357,785 | |
| | | | | | | | | | |
aNon-income producing.
bA portion or all of the security is on loan at December 31, 2016. See Note 1(c).
cSee Note 7 regarding restricted securities.
dSee Note 3(e) regarding investments in affiliated management investment companies.
eThe rate shown is the annualized seven-day yield at period end.
fSee Note 1(c) regarding securities on loan.
| | | | | | |
| | | The accompanying notes are an integral part of these financial statements. | Annual Report | | | FSC-13 | |
FRANKLIN TEMPLETON VARIABLE INSURANCE PRODUCTS TRUST
Financial Statements
Statement of Assets and Liabilities
December 31, 2016
| | | | |
| | | Franklin Small-Mid
Cap Growth VIP Fund | |
Assets: | | | | |
Investments in securities: | | | | |
Cost - Unaffiliated issuers | | $ | 332,602,197 | |
Cost - Non-controlled affiliates (Note 3e) | | | 19,269,553 | |
| | | | |
Total cost of investments | | $ | 351,871,750 | |
| | | | |
Value - Unaffiliated issuers | | $ | 425,033,978 | |
Value - Non-controlled affiliates (Note 3e) | | | 19,269,553 | |
| | | | |
Total value of investments (includes securities loaned in the amount of $4,995,700) | | | 444,303,531 | |
Receivables: | | | | |
Capital shares sold | | | 17,510 | |
Dividends and interest | | | 113,821 | |
Other assets | | | 59 | |
| | | | |
Total assets | | | 444,434,921 | |
| | | | |
Liabilities: | | | | |
Payables: | | | | |
Investment securities purchased | | | 34,396 | |
Capital shares redeemed | | | 284,343 | |
Management fees | | | 296,613 | |
Distribution fees | | | 174,238 | |
Payable upon return of securities loaned | | | 5,131,350 | |
Accrued expenses and other liabilities | | | 156,196 | |
| | | | |
Total liabilities | | | 6,077,136 | |
| | | | |
Net assets, at value | | $ | 438,357,785 | |
| | | | |
Net assets consist of: | | | | |
Paid-in capital | | $ | 301,918,633 | |
Net unrealized appreciation (depreciation) | | | 92,431,781 | |
Accumulated net realized gain (loss) | | | 44,007,371 | |
| | | | |
Net assets, at value | | $ | 438,357,785 | |
| | | | |
| |
| Class 1: | | | | |
Net assets, at value | | $ | 31,756,411 | |
| | | | |
Shares outstanding | | | 1,786,607 | |
| | | | |
Net asset value and maximum offering price per share | | $ | 17.77 | |
| | | | |
| |
| Class 2: | | | | |
Net assets, at value | | $ | 392,776,519 | |
| | | | |
Shares outstanding | | | 24,144,615 | |
| | | | |
Net asset value and maximum offering price per share | | $ | 16.27 | |
| | | | |
| |
| Class 4: | | | | |
Net assets, at value | | $ | 13,824,855 | |
| | | | |
Shares outstanding | | | 822,362 | |
| | | | |
Net asset value and maximum offering price per share | | $ | 16.81 | |
| | | | |
| | | | |
| FSC-14 | | Annual Report | The accompanying notes are an integral part of these financial statements. | | |
FRANKLIN TEMPLETON VARIABLE INSURANCE PRODUCTS TRUST
FINANCIAL STATEMENTS
Statement of Operations
for the year ended December 31, 2016
| | | | |
| | | Franklin Small-Mid
Cap Growth VIP Fund | |
Investment income: | | | | |
Dividends: | | | | |
Unaffiliated issuers | | $ | 3,272,622 | |
Non-controlled affiliates (Note 3e) | | | 474 | |
Income from securities loaned (net of fees and rebates) | | | 187,907 | |
| | | | |
Total investment income | | | 3,461,003 | |
| | | | |
Expenses: | | | | |
Management fees (Note 3a) | | | 4,158,610 | |
Distribution fees: (Note 3c) | | | | |
Class 2 | | | 1,097,281 | |
Class 4 | | | 49,110 | |
Custodian fees (Note 4) | | | 4,390 | |
Reports to shareholders | | | 162,275 | |
Professional fees | | | 47,882 | |
Trustees’ fees and expenses | | | 2,621 | |
Other | | | 18,490 | |
| | | | |
Total expenses | | | 5,540,659 | |
Expense reductions (Note 4) | | | (40 | ) |
Expenses waived/paid by affiliates (Note 3e) | | | (83,600 | ) |
| | | | |
Net expenses | | | 5,457,019 | |
| | | | |
Net investment income (loss) | | | (1,996,016 | ) |
| | | | |
Realized and unrealized gains (losses): | | | | |
Net realized gain (loss) from: | | | | |
Investments (includes gains from a redemption in-kind of $22,002,600) (Note 9) | | | 66,634,973 | |
Foreign currency transactions | | | 2,038 | |
| | | | |
Net realized gain (loss) | | | 66,637,011 | |
| | | | |
Net change in unrealized appreciation (depreciation) on investments | | | (44,367,102 | ) |
| | | | |
Net realized and unrealized gain (loss) | | | 22,269,909 | |
| | | | |
Net increase (decrease) in net assets resulting from operations | | $ | 20,273,893 | |
| | | | |
| | | | | | |
| | | The accompanying notes are an integral part of these financial statements. | Annual Report | | | FSC-15 | |
FRANKLIN TEMPLETON VARIABLE INSURANCE PRODUCTS TRUST
FINANCIAL STATEMENTS
Statements of Changes in Net Assets
| | | | | | | | |
| | | Franklin Small-Mid Cap Growth VIP Fund | |
| | | Year Ended December 31, | |
| | | 2016 | | | 2015 | |
Increase (decrease) in net assets: | | | | | | | | |
Operations: | | | | | | | | |
Net investment income (loss) | | $ | (1,996,016 | ) | | $ | (1,403,843 | ) |
Net realized gain (loss) | | | 66,637,011 | | | | 63,022,161 | |
Net change in unrealized appreciation (depreciation) | | | (44,367,102 | ) | | | (74,279,798 | ) |
| | | | |
Net increase (decrease) in net assets resulting from operations | | | 20,273,893 | | | | (12,661,480 | ) |
| | | | |
Distributions to shareholders from: | | | | | | | | |
Net realized gains: | | | | | | | | |
Class 1 | | | (8,833,462 | ) | | | (22,509,343 | ) |
Class 2 | | | (52,547,749 | ) | | | (135,758,632 | ) |
Class 4 | | | (1,581,894 | ) | | | (4,098,814 | ) |
| | | | |
Total distributions to shareholders | | | (62,963,105 | ) | | | (162,366,789 | ) |
| | | | |
Capital share transactions: (Note 2) | | | | | | | | |
Class 1 | | | (50,265,073 | ) | | | 12,480,207 | |
Class 2 | | | (50,062,313 | ) | | | 41,958,103 | |
Class 4 | | | (245,962 | ) | | | 3,251,391 | |
| | | | |
Total capital share transactions. | | | (100,573,348 | ) | | | 57,689,701 | |
| | | | |
Net increase (decrease) in net assets | | | (143,262,560 | ) | | | (117,338,568 | ) |
Net assets (there is no undistributed net investment income at beginning or end of year): | | | | | | | | |
Beginning of year | | | 581,620,345 | | | | 698,958,913 | |
| | | | |
End of year | | $ | 438,357,785 | | | $ | 581,620,345 | |
| | | | |
| | | | |
| FSC-16 | | Annual Report | The accompanying notes are an integral part of these financial statements. | | |
FRANKLIN TEMPLETON VARIABLE INSURANCE PRODUCTS TRUST
Notes to Financial Statements
Franklin Small-Mid Cap Growth VIP Fund
1. Organization and Significant Accounting Policies
Franklin Templeton Variable Insurance Products Trust (Trust) is registered under the Investment Company Act of 1940 (1940 Act) as an open-end management investment company, consisting of nineteen separate funds and applies the specialized accounting and reporting guidance in U.S. Generally Accepted Accounting Principles (U.S. GAAP). Franklin Small-Mid Cap Growth VIP Fund (Fund) is included in this report. The financial statements of the remaining funds in the Trust are presented separately. Shares of the Fund are generally sold only to insurance company separate accounts to fund the benefits of variable life insurance policies or variable annuity contracts. At December 31, 2016, 46.5% of the Fund’s shares were held through one insurance company. Investment activities of these insurance company separate accounts could have a material impact on the Fund. The Fund offers three classes of shares: Class 1, Class 2 and Class 4. Each class of shares differs by its distribution fees, voting rights on matters affecting a single class and its exchange privilege.
The following summarizes the Fund’s significant accounting policies.
a. Financial Instrument Valuation
The Fund’s investments in financial instruments are carried at fair value daily. Fair value is the price that would be received to sell an asset or paid to transfer a liability in an orderly transaction between market participants on the measurement date. The Fund calculates the net asset value (NAV) per share as of 4 p.m. Eastern time each day the New York Stock Exchange (NYSE) is open for trading. Under compliance policies and procedures approved by the Trust’s Board of Trustees (the Board), the Fund’s administrator has responsibility for oversight of valuation, including leading the cross-functional Valuation Committee (VC). The VC provides administration and oversight of the Fund’s valuation policies and procedures, which are approved annually by the Board. Among other things, these procedures allow the Fund to utilize independent pricing services, quotations from securities and financial instrument dealers, and other market sources to determine fair value.
Equity securities listed on an exchange or on the NASDAQ National Market System are valued at the last quoted sale price or the official closing price of the day, respectively. Foreign equity securities are valued as of the close of trading on the
foreign stock exchange on which the security is primarily traded or as of 4 p.m. Eastern time. The value is then converted into its U.S. dollar equivalent at the foreign exchange rate in effect at 4 p.m. Eastern time on the day that the value of the security is determined. Over-the-counter (OTC) securities are valued within the range of the most recent quoted bid and ask prices. Securities that trade in multiple markets or on multiple exchanges are valued according to the broadest and most representative market. Certain equity securities are valued based upon fundamental characteristics or relationships to similar securities.
Investments in open-end mutual funds are valued at the
closing NAV.
The Fund has procedures to determine the fair value of financial instruments for which market prices are not reliable or readily available. Under these procedures, the VC convenes on a regular basis to review such financial instruments and considers a number of factors, including significant unobservable valuation inputs, when arriving at fair value. The VC primarily employs a market-based approach which may use related or comparable assets or liabilities, recent transactions, market multiples, book values, and other relevant information for the investment to determine the fair value of the investment. An income-based valuation approach may also be used in which the anticipated future cash flows of the investment are discounted to calculate fair value. Discounts may also be applied due to the nature or duration of any restrictions on the disposition of the investments. Due to the inherent uncertainty of valuations of such investments, the fair values may differ significantly from the values that would have been used had an active market existed. The VC employs various methods for calibrating these valuation approaches including a regular review of key inputs and assumptions, transactional back-testing or disposition analysis, and reviews of any related market activity.
Trading in securities on foreign securities stock exchanges and OTC markets may be completed before 4 p.m. Eastern time. In addition, trading in certain foreign markets may not take place on every Fund’s business day. Occasionally, events occur between the time at which trading in a foreign security is completed and 4 p.m. Eastern time that might call into question the reliability of the value of a portfolio security held by the Fund. As a result, differences may arise between the value of the Fund’s portfolio securities as determined at the foreign market close and the latest indications of value at 4 p.m. Eastern time. In order to minimize the potential for these differences,
FRANKLIN TEMPLETON VARIABLE INSURANCE PRODUCTS TRUST
NOTES TO FINANCIAL STATEMENTS
Franklin Small-Mid Cap Growth VIP Fund (continued)
1. Organization and Significant Accounting
Policies (continued)
a. Financial Instrument Valuation (continued)
the VC monitors price movements following the close of trading in foreign stock markets through a series of country specific market proxies (such as baskets of American Depositary Receipts, futures contracts and exchange traded funds). These price movements are measured against established trigger thresholds for each specific market proxy to assist in determining if an event has occurred that may call into question the reliability of the values of the foreign securities held by the Fund. If such an event occurs, the securities may be valued using fair value procedures, which may include the use of independent pricing services.
When the last day of the reporting period is a non-business day, certain foreign markets may be open on those days that the Fund’s NAV is not calculated, which could result in differences between the value of the Fund’s portfolio securities on the last business day and the last calendar day of the reporting period. Any significant security valuation changes due to an open foreign market are adjusted and reflected by the Fund for financial reporting purposes.
b. Foreign Currency Translation
Portfolio securities and other assets and liabilities denominated in foreign currencies are translated into U.S. dollars based on the exchange rate of such currencies against U.S. dollars on the date of valuation. The Fund may enter into foreign currency exchange contracts to facilitate transactions denominated in a foreign currency. Purchases and sales of securities, income and expense items denominated in foreign currencies are translated into U.S. dollars at the exchange rate in effect on the transaction date. Portfolio securities and assets and liabilities denominated in foreign currencies contain risks that those currencies will decline in value relative to the U.S. dollar. Occasionally, events may impact the availability or reliability of foreign exchange rates used to convert the U.S. dollar equivalent value. If such an event occurs, the foreign exchange rate will be valued at fair value using procedures established and approved by the Board.
The Fund does not separately report the effect of changes in foreign exchange rates from changes in market prices on securities held. Such changes are included in net realized and unrealized gain or loss from investments in the Statement of Operations.
Realized foreign exchange gains or losses arise from sales of foreign currencies, currency gains or losses realized between the trade and settlement dates on securities transactions and the difference between the recorded amounts of dividends, interest, and foreign withholding taxes and the U.S. dollar equivalent of the amounts actually received or paid. Net unrealized foreign exchange gains and losses arise from changes in foreign exchange rates on foreign denominated assets and liabilities other than investments in securities held at the end of the reporting period.
c. Securities Lending
The Fund participates in an agency based securities lending program to earn additional income. The Fund receives cash collateral against the loaned securities in an amount equal to at least 102% of the fair value of the loaned securities. Collateral is maintained over the life of the loan in an amount not less than 100% of the fair value of loaned securities, as determined at the close of Fund business each day; any additional collateral required due to changes in security values is delivered to the Fund on the next business day. The collateral is deposited into a joint cash account with other funds and is used to invest in a money market fund managed by Franklin Advisers, Inc., an affiliate of the Fund. The Fund may receive income from the investment of cash collateral, in addition to lending fees and rebates paid by the borrower. Income from securities loaned, net of fees paid to the securities lending agent and/or third-party vendor, is reported separately in the Statement of Operations. The Fund bears the market risk with respect to the collateral investment, securities loaned, and the risk that the agent may default on its obligations to the Fund. If the borrower defaults on its obligation to return the securities loaned, the Fund has the right to repurchase the securities in the open market using the collateral received. The securities lending agent has agreed to indemnify the Fund in the event of default by a third party borrower.
d. Income and Deferred Taxes
It is the Fund’s policy to qualify as a regulated investment company under the Internal Revenue Code. The Fund intends to distribute to shareholders substantially all of its taxable income and net realized gains to relieve it from federal income and if applicable, excise taxes. As a result, no provision for U.S. federal income taxes
is required.
FRANKLIN TEMPLETON VARIABLE INSURANCE PRODUCTS TRUST
NOTES TO FINANCIAL STATEMENTS
Franklin Small-Mid Cap Growth VIP Fund (continued)
The Fund may be subject to foreign taxation related to income received, capital gains on the sale of securities and certain foreign currency transactions in the foreign jurisdictions in which it invests. Foreign taxes, if any, are recorded based on the tax regulations and rates that exist in the foreign markets in which the Fund invests. When a capital gain tax is determined to apply, the Fund records an estimated deferred tax liability in an amount that would be payable if the securities were disposed of on the valuation date.
The Fund may recognize an income tax liability related to its uncertain tax positions under U.S. GAAP when the uncertain tax position has a less than 50% probability that it will be sustained upon examination by the tax authorities based on its technical merits. As of December 31, 2016, the Fund has determined that no tax liability is required in its financial statements related to uncertain tax positions for any open tax years (or expected to be taken in future tax years). Open tax years are those that remain subject to examination and are based on each tax jurisdiction’s statute
of limitation.
e. Security Transactions, Investment Income, Expenses and Distributions
Security transactions are accounted for on trade date. Realized gains and losses on security transactions are determined on a specific identification basis. Estimated expenses are accrued daily. Dividend income is recorded on the ex-dividend date except for certain dividends from securities where the dividend rate is not available. In such cases, the dividend is recorded as soon as the information is received by the Fund. Distributions to shareholders are recorded on the ex-dividend date and are determined according to income tax regulations (tax basis). Distributable earnings determined on a tax basis may differ from earnings recorded in accordance with U.S. GAAP. These differences may be permanent or temporary. Permanent differences are reclassified among capital accounts
to reflect
their tax character. These reclassifications have no impact on net assets or the results of operations. Temporary differences are not reclassified, as they may reverse in subsequent periods.
Common expenses incurred by the Trust are allocated among the Funds based on the ratio of net assets of each Fund to the combined net assets of the Trust. Fund specific expenses are charged directly to the Fund that incurred the expense.
Realized and unrealized gains and losses and net investment income, not including class specific expenses, are allocated daily to each class of shares based upon the relative proportion of net assets of each class. Differences in per share distributions, by class, are generally due to differences in class specific expenses.
f. Accounting Estimates
The preparation of financial statements in accordance with U.S. GAAP requires management to make estimates and assumptions that affect the reported amounts of assets and liabilities at the date of the financial statements and the amounts of income and expenses during the reporting period. Actual results could differ from
those estimates.
g. Guarantees and Indemnifications
Under the Trust’s organizational documents, its officers and trustees are indemnified by the Trust against certain liabilities arising out of the performance of their duties to the Trust. Additionally, in the normal course of business, the Trust, on behalf of the Fund, enters into contracts with service providers that contain general indemnification clauses. The Trust’s maximum exposure under these arrangements is unknown as this would involve future claims that may be made against the Trust that have not yet occurred. Currently, the Trust expects the risk of loss to be remote.
FRANKLIN TEMPLETON VARIABLE INSURANCE PRODUCTS TRUST
NOTES TO FINANCIAL STATEMENTS
Franklin Small-Mid Cap Growth VIP Fund (continued)
2. Shares of Beneficial Interest
At December 31, 2016, there were an unlimited number of shares authorized (without par value). Transactions in the Fund’s shares
were as follows:
| | | | | | | | | | | | | | | | | | | | |
| | | Year Ended December 31, | |
| | | 2016 | | | | | | 2015 | |
| | | Shares | | | Amount | | | | | | Shares | | | Amount | |
| | | | | |
| Class 1 Shares: | | | | | | | | | | | | | | | | | | | | |
Shares sold | | | 134,053 | | | $ | 2,403,127 | | | | | | | | 195,710 | | | $ | 4,581,670 | |
Shares issued in reinvestment of distributions | | | 521,763 | | | | 8,833,462 | | | | | | | | 1,062,262 | | | | 22,509,343 | |
Shares redeemed in-kind (Note 9) | | | (2,772,844 | ) | | | (48,919,064 | ) | | | | | | | — | | | | — | |
Shares redeemed | | | (698,942 | ) | | | (12,582,598 | ) | | | | | | | (655,587 | ) | | | (14,610,806 | ) |
| | | | |
Net increase (decrease) | | | (2,815,970 | ) | | $ | (50,265,073 | ) | | | | | | | 602,385 | | | $ | 12,480,207 | |
| | | | |
| | | | | |
| Class 2 Shares: | | | | | | | | | | | | | | | | | | | | |
Shares sold | | | 1,837,505 | | | $ | 30,239,284 | | | | | | | | 1,198,268 | | | $ | 26,202,656 | |
Shares issued in reinvestment of distributions | | | 3,385,809 | | | | 52,547,749 | | | | | | | | 6,905,322 | | | | 135,758,632 | |
Shares redeemed in-kind (Note 9) | | | (3,221,857 | ) | | | (52,049,416 | ) | | | | | | | — | | | | — | |
Shares redeemed | | | (4,916,789 | ) | | | (80,799,930 | ) | | | | | | | (5,776,970 | ) | | | (120,003,185 | ) |
| | | | |
Net increase (decrease) | | | (2,915,332 | ) | | $ | (50,062,313 | ) | | | | | | | 2,326,620 | | | $ | 41,958,103 | |
| | | | |
| | | | | |
| Class 4 Shares: | | | | | | | | | | | | | | | | | | | | |
Shares sold | | | 147,333 | | | $ | 2,490,349 | | | | | | | | 239,982 | | | $ | 5,202,958 | |
Shares issued in reinvestment of distributions | | | 98,560 | | | | 1,581,894 | | | | | | | | 202,211 | | | | 4,098,814 | |
Shares redeemed | | | (252,259 | ) | | | (4,318,205 | ) | | | | | | | (292,263 | ) | | | (6,050,381 | ) |
| | | | |
Net increase (decrease) | | | (6,366 | ) | | $ | (245,962 | ) | | | | | | | 149,930 | | | $ | 3,251,391 | |
| | | | |
3. Transactions with Affiliates
Franklin Resources, Inc. is the holding company for various subsidiaries that together are referred to as Franklin Templeton Investments. Certain officers and trustees of the Fund are also officers and/or directors of the following subsidiaries:
| | |
| Subsidiary | | Affiliation |
Franklin Advisers, Inc. (Advisers) | | Investment manager |
Franklin Templeton Services, LLC (FT Services) | | Administrative manager |
Franklin Templeton Distributors, Inc. (Distributors) | | Principal underwriter |
Franklin Templeton Investor Services, LLC (Investor Services) | | Transfer agent |
FRANKLIN TEMPLETON VARIABLE INSURANCE PRODUCTS TRUST
NOTES TO FINANCIAL STATEMENTS
Franklin Small-Mid Cap Growth VIP Fund (continued)
a. Management Fees
The Fund pays an investment management fee to Advisers based on the average daily net assets of the Fund as follows:
| | |
| Annualized Fee Rate | | Net Assets |
0.800% | | Up to and including $500 million |
0.700% | | Over $500 million, up to and including $1 billion |
0.650% | | Over $1 billion, up to and including $1.5 billion |
0.600% | | Over $1.5 billion, up to and including $6.5 billion |
0.575% | | Over $6.5 billion, up to and including $11.5 billion |
0.550% | | Over $11.5 billion, up to and including $16.5 billion |
0.540% | | Over $16.5 billion, up to and including $19 billion |
0.530% | | Over $19 billion, up to and including $21.5 billion |
0.520% | | In excess of $21.5 billion |
For the year ended December 31, 2016, the effective investment management fee rate was 0.793% of the Fund’s average daily net assets.
b. Administrative Fees
Under an agreement with Advisers, FT Services provides administrative services to the Fund. The fee is paid by Advisers based on the Fund’s average daily net assets, and is not an additional expense of the Fund.
c. Distribution Fees
The Board has adopted distribution plans for Class 2 and Class 4 shares pursuant to Rule 12b-1 under the 1940 Act. Under the Fund’s compensation distribution plans, the Fund pays Distributors for costs incurred in connection with the servicing, sale and distribution of the Fund’s shares up to 0.35% per year of its average daily net assets of each class. The Board has agreed to limit the current rate to 0.25% per year for Class 2. The plan year, for purposes of monitoring compliance with the maximum annual plan rates, is February 1 through January 31.
d. Transfer Agent Fees
Investor Services, under terms of an agreement, performs shareholder servicing for the Fund and is not paid by the Fund for the services.
FRANKLIN TEMPLETON VARIABLE INSURANCE PRODUCTS TRUST
NOTES TO FINANCIAL STATEMENTS
Franklin Small-Mid Cap Growth VIP Fund (continued)
3. Transactions with Affiliates (continued)
e. Investments in Affiliated Management Investment Companies
The Fund invests in one or more affiliated management investment companies for purposes other than exercising a controlling influence over the management or policies. Management fees paid by the Fund are waived on assets invested in the affiliated management investment companies, as noted in the Statement of Operations, in an amount not to exceed the management and administrative fees paid directly or indirectly by each affiliate. Prior to January 1, 2014, the waiver was accounted for as a reduction to management fees. During the year ended December 31, 2016, the Fund held investments in affiliated management investment companies as follows:
| | | | | | | | | | | | | | | | | | | | | | | | | | | | | | | | |
| | | Number of Shares
Held at Beginning
of Year | | | Gross
Additions | | | Gross
Reductions | | | Number
of Shares
Held at End of
Year | | | Value at End of Year | | | Investment
Income | | | Realized
Gain
(Loss) | | | % of Affiliated
Fund Shares
Outstanding
Held at End
of Year | |
| Non-Controlled Affiliates | | | | | | | | | | | | | | | | | | | | | | | | | | | | | | | | |
Institutional Fiduciary Trust Money Market Portfolio, 0.09% | | | 33,143,168 | | | | 261,372,889 | | | | (275,246,504 | ) | | | 19,269,553 | | | $ | 19,269,553 | | | $ | 474 | | | $ | — | | | | 0.1% | |
| | | | | | | | | | | | | | | | | | | | | | | | |
4. Expense Offset Arrangement
The Fund has entered into an arrangement with its custodian whereby credits realized as a result of uninvested cash balances are used to reduce a portion of the Fund’s custodian expenses. During the year ended December 31, 2016, the custodian fees were reduced as noted in the Statement of Operations.
5. Income Taxes
The tax character of distributions paid during the years ended December 31, 2016 and 2015, was as follows:
| | | | | | | | |
| | | 2016 | | | 2015 | |
Distributions paid from: | | | | | | | | |
Ordinary income | | $ | — | | | $ | 11,955,020 | |
Long term capital gain | | | 62,963,105 | | | | 150,411,769 | |
| | | | |
| | $ | 62,963,105 | | | $ | 162,366,789 | |
| | | | |
At December 31, 2016, the cost of investments, net unrealized appreciation (depreciation) and undistributed long term capital gains for income tax purposes were as follows:
| | | | |
Cost of investments | | $ | 352,347,018 | |
| | | | |
Unrealized appreciation | | $ | 109,088,488 | |
Unrealized depreciation | | | (17,131,975 | ) |
| | | | |
Net unrealized appreciation (depreciation) | | $ | 91,956,513 | |
| | | | |
Distributable earnings - undistributed long term capital gains | | $ | 44,482,636 | |
| | | | |
Differences between income and/or capital gains as determined on a book basis and a tax basis are primarily due to differing treatments of wash sales and gains realized on in-kind shareholder redemptions.
FRANKLIN TEMPLETON VARIABLE INSURANCE PRODUCTS TRUST
NOTES TO FINANCIAL STATEMENTS
Franklin Small-Mid Cap Growth VIP Fund (continued)
6. Investment Transactions
Purchases and sales of investments (excluding short term securities) for the year ended December 31, 2016, aggregated $164,657,812 and $235,627,723, respectively. Sales of investments excludes in-kind transactions of $95,156,094.
At December 31, 2016, in connection with securities lending transactions, the Fund loaned equity investments and received $5,131,350 of cash collateral. The gross amount of recognized liability for such transactions is included in payable upon return of securities loaned in the Statement of Assets and Liabilities. The agreements can be terminated at any time.
7. Restricted Securities
The Fund invests in securities that are restricted under the Securities Act of 1933 (1933 Act) or which are subject to legal, contractual, or other agreed upon restrictions on resale. Restricted securities are often purchased in private placement transactions, and cannot be sold without prior registration unless the sale is pursuant to an exemption under the 1933 Act. Disposal of these securities may require greater effort and expense, and prompt sale at an acceptable price may be difficult. The Fund may have registration rights for restricted securities. The issuer generally incurs all registration costs.
At December 31, 2016, the Fund held investments in restricted securities, excluding certain securities exempt from registration under the 1933 Act deemed to be liquid, as follows:
| | | | | | | | | | | | | | |
| Shares | | Issuer | | Acquisition
Date | | | Cost | | | Value | |
| 115,528 | | DraftKings Inc., pfd., D | | | 8/07/15 | | | $ | 622,222 | | | $ | 522,972 | |
| 284,105 | | DraftKings Inc., pfd., D-1 | | | 8/07/15 | | | | 2,177,781 | | | | 1,782,475 | |
| | | | | | | | | | |
| | Total Restricted Securities (Value is 0.5% of Net Assets) | | | | | | $ | 2,800,003 | | | $ | 2,305,447 | |
| | | | | | | | | | |
8. Credit Facility
The Fund, together with other U.S. registered and foreign investment funds (collectively, Borrowers), managed by Franklin Templeton Investments, are borrowers in a joint syndicated senior unsecured credit facility totaling $2 billion (Global Credit Facility) which matured on February 10, 2017. This Global Credit Facility provides a source of funds to the Borrowers for temporary and emergency purposes, including the ability to meet future unanticipated or unusually large redemption requests. Effective February 10, 2017, the Borrowers renewed the Global Credit Facility for a one year term, maturing February 9, 2018, for a total of $2 billion.
Under the terms of the Global Credit Facility, the Fund shall, in addition to interest charged on any borrowings made by the Fund and other costs incurred by the Fund, pay its share of fees and expenses incurred in connection with the implementation and maintenance of the Global Credit Facility, based upon its relative share of the aggregate net assets of all of the Borrowers, including an annual commitment fee of 0.15% based upon the unused portion of the Global Credit Facility. These fees are reflected in other expenses in the Statement of Operations. During the year ended December 31, 2016, the Fund did not use the Global Credit Facility.
9. Redemption In-Kind
During the year ended December 31, 2016, the Fund realized $22,002,600 of net gains resulting from a redemption in-kind in which a shareholder redeemed fund shares for cash and securities held by the Fund. Because such gains are not taxable to the Fund and are not distributed to remaining shareholders, they have been reclassified from accumulated net realized gains to paid-in capital.
FRANKLIN TEMPLETON VARIABLE INSURANCE PRODUCTS TRUST
NOTES TO FINANCIAL STATEMENTS
Franklin Small-Mid Cap Growth VIP Fund (continued)
10. Fair Value Measurements
The Fund follows a fair value hierarchy that distinguishes between market data obtained from independent sources (observable inputs) and the Fund’s own market assumptions (unobservable inputs). These inputs are used in determining the value of the Fund’s financial instruments and are summarized in the following fair value hierarchy:
| | • | | Level 1 – quoted prices in active markets for identical financial instruments |
| | • | | Level 2 – other significant observable inputs (including quoted prices for similar financial instruments, interest rates, prepayment speed, credit risk, etc.) |
| | • | | Level 3 – significant unobservable inputs (including the Fund’s own assumptions in determining the fair value of financial instruments) |
The input levels are not necessarily an indication of the risk or liquidity associated with financial instruments at that level.
For movements between the levels within the fair value hierarchy, the Fund has adopted a policy of recognizing the transfers as of the date of the underlying event which caused the movement.
A summary of inputs used as of December 31, 2016, in valuing the Fund’s assets carried at fair value, is as follows:
| | | | | | | | | | | | | | | | |
| | | Level 1 | | | Level 2 | | | Level 3 | | | Total | |
| | | | |
| Assets: | | | | | | | | | | | | | | | | |
Investments in Securities: | | | | | | | | | | | | | | | | |
Equity Investments:a | | | | | | | | | | | | | | | | |
Consumer Discretionary | | $ | 82,425,569 | | | $ | — | | | $ | 2,305,447 | | | $ | 84,731,016 | |
All Other Equity Investmentsb | | | 340,302,962 | | | | — | | | | — | | | | 340,302,962 | |
Short Term Investments | | | 19,269,553 | | | | — | | | | — | | | | 19,269,553 | |
| | | | |
Total Investments in Securities | | $ | 441,998,084 | | | $ | — | | | $ | 2,305,447 | | | $ | 444,303,531 | |
| | | | |
aIncludes common and preferred stocks.
bFor detailed categories, see the accompanying Statement of Investments.
A reconciliation of assets in which Level 3 inputs are used in determining fair value is presented when there are significant Level 3 financial instruments at the end of the year.
11. Investment Company Reporting Modernization
In October 2016, the U.S. Securities and Exchange Commission adopted new rules and amended existing rules (together, final rules) intended to modernize the reporting and disclosure of information by registered investment companies. In part, the final rules amend Regulation S-X and require standardized, enhanced disclosures about derivatives in investment company financial statements, as well as other amendments. The compliance date for the amendments to Regulation S-X is August 1, 2017. Management is currently evaluating the impact that the adoption of the amendments to Regulation S-X will have on the Fund’s financial statements and related disclosures.
12. Subsequent Events
The Fund has evaluated subsequent events through the issuance of the financial statements and determined that no events have occurred that require disclosure other than those already disclosed in the financial statements.
FRANKLIN TEMPLETON VARIABLE INSURANCE PRODUCTS TRUST
Report of Independent Registered Public Accounting Firm
Franklin Small-Mid Cap Growth VIP Fund
To the Board of Trustees and Shareholders of Franklin Templeton Variable Insurance Products Trust
In our opinion, the accompanying statement of assets and liabilities, including the statement of investments, and the related statements of operations and of changes in net assets and the financial highlights present fairly, in all material respects, the financial position of Franklin Small-Mid Cap Growth VIP Fund (the “Fund”) as of December 31, 2016, the results of its operations for the year then ended, the changes in its net assets for each of the two years in the period then ended and the financial highlights for the periods presented, in conformity with accounting principles generally accepted in the United States of America. These financial statements and financial highlights (hereafter referred to as “financial statements”) are the responsibility of the Fund’s management. Our responsibility is to express an opinion on these financial statements based on our audits. We conducted our audits of these financial statements in accordance with the standards of the Public Company Accounting Oversight Board (United States). Those standards require that we plan and perform the audit to obtain reasonable assurance about whether the financial statements are free of material misstatement. An audit includes examining, on a test basis, evidence supporting the amounts and disclosures in the financial statements, assessing the accounting principles used and significant estimates made by management, and evaluating the overall financial statement presentation. We believe that our audits, which included confirmation of securities as of December 31, 2016 by correspondence with the custodian, transfer agent and brokers, provides a reasonable basis for our opinion.
PricewaterhouseCoopers LLP
San Francisco, California
February 15, 2017
FRANKLIN TEMPLETON VARIABLE INSURANCE PRODUCTS TRUST
Tax Information (unaudited)
Franklin Small-Mid Cap Growth VIP Fund
Under Section 852(b)(3)(C) of the Internal Revenue Code, the Fund hereby reports the maximum amount allowable but no less than $62,963,105 as a long term capital gain dividend for the fiscal year ended December 31, 2016.
Franklin Strategic Income VIP Fund
We are pleased to bring you Franklin Strategic Income VIP Fund’s annual report for the fiscal year ended December 31, 2016.
Class 2 Performance Summary as of December 31, 2016
Average annual total return of Class 2 shares* represents the average annual change in value, assuming reinvestment of dividends and capital gains. Average returns smooth out variations in returns, which can be significant; they are not the same as year-by-year results.
| | | | | | | | | | | | |
| Periods ended 12/31/16 | | 1-Year | | | 5-Year | | | 10-Year | |
Average Annual Total Return | | | +7.94% | | | | +4.25% | | | | +5.17% | |
*The Fund has a fee waiver associated with any investment it makes in a Franklin Templeton money fund and/or other Franklin Templeton fund, contractually guaranteed through its current fiscal year-end. Fund investment results reflect the fee waiver; without this waiver, the results would have been lower.
Performance reflects the Fund’s Class 2 operating expenses, but does not include any contract fees, expenses or sales charges. If they had been included, performance would be lower. These charges and deductions, particularly for variable life policies, can have a significant effect on contract values and insurance benefits. See the contract prospectus for a complete description of these expenses, including sales charges.
Performance data represent past performance, which does not guarantee future results. Investment return and principal value will fluctuate, and you may have a gain or loss when you sell your shares. Current performance may differ from figures shown.
Total Return Index Comparison for a Hypothetical $10,000 Investment (1/1/07–12/31/16)
The graph below shows the change in value of a hypothetical $10,000 investment in the Fund over the indicated period and includes reinvestment of any income or distributions. The Fund’s performance* is compared to the performance of the Bloomberg Barclays U.S. Aggregate Bond Index and the Lipper Multi-Sector Income Funds Classification Average. One cannot invest directly in an index, and an index is not representative of the Fund’s portfolio. Please see Important Notes to Performance Information preceding the Fund Summaries.
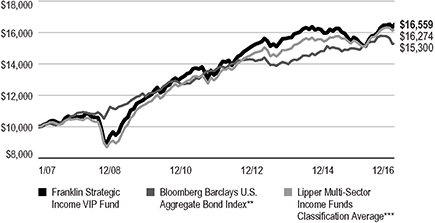
**Source: Morningstar. Please see Index Descriptions following the Fund Summaries.
***Source: Lipper, a Thomson Reuters Company. Please see Index Descriptions following the Fund Summaries.
FRANKLIN STRATEGIC INCOME VIP FUND
Fund Goal and Main Investments
The Fund seeks a high level of current income, with capital appreciation over the long term as a secondary goal. Under normal market conditions, the Fund invests primarily to predominantly in U.S. and foreign debt securities, including those in emerging markets.
Fund Risks
All investments involve risks, including possible loss of principal. Bond prices generally move in the opposite direction of interest rates. Thus, as prices of bonds in the Fund adjust to a rise in interest rates, the Fund’s share price may decline. Changes in the financial strength of a bond issuer or in a bond’s credit rating may affect its value. High yields reflect the higher credit risks associated with certain lower rated securities held in the portfolio. Floating rate loans and high yield corporate bonds are rated below investment grade and are subject to greater risk of default, which could result in loss of principal—a risk that may be heightened in a slowing economy. The risks of foreign securities include currency fluctuations and political uncertainty. Investments in developing markets involve heightened risks related to the same factors, in addition to those associated with their relatively small size and lesser liquidity. Investing in derivative securities and the use of foreign currency techniques involve special risks as such may not achieve the anticipated benefits and/or may result in losses to the Fund. The Fund is actively managed but there is no guarantee that the manager’s investment decisions will produce the desired results. The Fund’s prospectus also includes a description of the main investment risks.
Performance Overview
You can find the Fund’s one-year total return in the Performance Summary. For comparison, the Fund’s benchmark, the Bloomberg Barclays U.S. Aggregate Index, delivered a +2.65% total return for the period under review.1 The Fund’s peers, as measured by the Lipper Multi-Sector Income Funds Classification Average, produced a +7.26% return.2
Economic and Market Overview
The U.S. economy expanded during the 12 months under review. The economy grew at a faster pace in 2016’s third quarter than in the second and first quarters, mainly due to personal consumption expenditures, exports, private inventory investment, federal government spending and nonresidential fixed investment. Manufacturing conditions remained volatile but generally expanded, and the services sector also continued to grow for most of the period. The unemployment rate decreased from 5.0% in December 2015 to 4.7% at period-end.3 Monthly retail sales grew for most of the review period, and rose to its highest level in April in more than a year, due to a broad-based increase across most retail categories. Inflation, as measured by the Consumer Price Index, remained relatively subdued for most of the period, but rose in 2016’s
fourth quarter.
After maintaining its target interest rate in the 0.25%–0.50% range for nearly a year, the U.S. Federal Reserve (Fed), at its December meeting, increased its target range for the federal funds rate to 0.50%–0.75%, as policymakers noted improvement in U.S. labor market and inflation. The Federal Open Market Committee also hinted at three additional hikes in 2017. Furthermore, the Fed raised its forecast for 2017 U.S. economic growth, and lowered its unemployment projections.
The 10-year U.S. Treasury yield, which moves inversely to price, ended the period slightly higher than where it started and shifted significantly during the period. At the beginning of the period, negative global interest rates, continued accommodative central bank policies and a general risk-averse sentiment boosted safe haven buying by investors. These factors drove the 10-year yield to a period low of 1.37% in early July, down from 2.27% on December 31, 2015. Near period-end, rates moved higher based on improved economic data, expectations for the Fed to raise interest rates at its December 2016 meeting and a sentiment shift among investors that held that possible expansionary fiscal policies under the new U.S. president Donald Trump could lead to a stronger economy and higher inflation.
1. Source: Morningstar.
2. Source: Lipper, a Thomson Reuters Company.
One cannot invest directly in an index, and an index is not representative of the Fund’s portfolio. Please see Index Descriptions following the Fund Summaries.
3. Source: Bureau of Labor Statistics.
The dollar value, number of shares or principal amount, and names of all portfolio holdings are listed in the Fund’s Statement of Investments (SOI).
FRANKLIN STRATEGIC INCOME VIP FUND
Investment Strategy
We allocate our investments among the various types of debt available based on our assessment of changing economic, global market, industry and issuer conditions. We use a top-down analysis of macroeconomic trends, combined with a bottom-up fundamental analysis of market sectors, industries and issuers, seeking to take advantage of varying sector reactions to economic events. For example, we may evaluate business cycles, yield curves, country risk, and the relative interest rates among currencies, and values between and within markets. In selecting debt securities, we generally conduct our own analysis of the security’s intrinsic value rather than simply relying on the coupon rate or rating. We may also enter into various transactions involving certain currency-, interest rate-or credit-related derivative instruments.
What is the yield curve?
The yield curve is a line that plots the interest rates, at a set point in time, of bonds having equal credit quality but differing maturity dates. The most frequently reported yield curve compares three-month, two-year and 30-year U.S. Treasury debt.
Manager’s Discussion
The Fund allocated assets across the broad fixed income markets on a global basis. During the period, we maintained large allocations to credit-sensitive securities, primarily noninvestment-grade credit, with a smaller exposure to investment-grade corporate bonds. The Fund also held positions in select non-U.S. dollar global government bonds. Conversely, the Fund sought to maintain a relatively low sensitivity to U.S. interest rates, with its sector exposure favoring spread sectors, nongovernmental fixed income investments with higher yields and greater risk than governmental investments.
During the period, most spread sectors posted strong positive returns and delivered positive absolute performance. Corporate credit, both investment grade and below investment grade, was among the strongest performers. Corporate loans also benefited results.
The Fund’s overweighted exposure to corporate credit in general, particularly noninvestment-grade corporate bonds, was a major contributor to absolute performance. The Fund’s position in non-U.S. dollar denominated bonds was also additive to our results as were our positions in U.S. dollar denominated bonds. In contrast, our positions in select
| | | | | | | | |
| Asset Allocation* | | | | | | |
| Based on Total Net Assets | | | | | | |
| | | 12/31/16 | | | 12/31/15 | |
| High Yield Corporates | | | 25.6% | | | | 29.3% | |
| Floating-Rate Loans | | | 20.3% | | | | 20.0% | |
| Investment Grade Corporates | | | 16.9% | | | | 10.1% | |
| Mortgage-Backed Securities | | | 11.5% | | | | 3.9% | |
| International Bonds | | | 7.9% | | | | 15.7% | |
| U.S. Treasuries | | | 5.4% | | | | 4.0% | |
| Other | | | 4.1% | | | | 2.9% | |
| Cash & Cash Equivalents | | | 2.3% | | | | 7.4% | |
| Commercial Mortgage-Backed Securities | | | 2.1% | | | | 4.1% | |
| Asset-Backed Securities | | | 2.1% | | | | 0.2% | |
| Municipal Bonds | | | 1.9% | | | | 2.6% | |
*Figures reflect certain derivatives held in the portfolio (or their underlying reference assets) and may not total 100% or may be negative due to rounding, use of any derivatives, unsettled trades or other factors. The breakdown may not match the Statement of Investments (SOI).
non-U.S. dollar global government bonds detracted from performance.
The Fund utilized derivatives, including currency forwards and credit derivatives. Currency forwards are typically used to take long and short positions in currencies and as a tool to hedge currency risk. Credit derivatives can be used to hedge against credit risk or to otherwise enhance Fund returns by taking long or short positions in individual credits or baskets of credits in various sectors including in the corporate, municipal, sovereign and securitized markets.
What is a currency forward?
A currency forward is an agreement between the Fund and a counterparty to buy or sell a foreign currency in exchange for another currency at a specific exchange rate on a future date.
What is a credit derivative?
A credit derivative is a contract agreement between the Fund and a counterparty that is principally used by the Fund to gain or increase exposure to certain high yield securities or segments of the high yield bond market and/or to hedge against credit risk.
What is meant by “hedge”?
To hedge an investment is to take a position intended to offset potential losses/gains that may be incurred by a companion financial instrument.
FRANKLIN STRATEGIC INCOME VIP FUND
Thank you for your participation in Franklin Strategic Income VIP Fund. We look forward to serving your future investment needs.
The foregoing information reflects our analysis, opinions and portfolio holdings as of December 31, 2016, the end of the reporting period. The way we implement our main investment strategies and the resulting portfolio holdings may change depending on factors such as market and economic conditions. These opinions may not be relied upon as investment advice or an offer for a particular security. The information is not a complete analysis of every aspect of any market, country, industry, security or the Fund. Statements of fact are from sources considered reliable, but the investment manager makes no representation or warranty as to their completeness or accuracy. Although historical performance is no guarantee of future results, these insights may help you understand our investment
management philosophy.
FRANKLIN STRATEGIC INCOME VIP FUND
Class 2 Fund Expenses
As an investor in a variable insurance contract (Contract) that indirectly provides for investment in an underlying mutual fund, you can incur transaction and/or ongoing expenses at both the Fund level and the Contract Level: (1) transaction expenses can include sales charges (loads) on purchases, surrender fees, transfer fees and premium taxes; and (2) ongoing expenses can include management fees, distribution and service (12b-1) fees, contract fees, annual maintenance fees, mortality and expense risk fees and other fees and expenses. All mutual funds and Contracts have some types of ongoing expenses. The table below shows Fund-level ongoing expenses and can help you understand these costs and compare them with those of other mutual funds offered through the Contract. The table assumes a $1,000 investment held for the six months indicated. Please refer to the Fund prospectus for additional information on operating expenses.
Actual Fund Expenses
The table below provides information about the actual account values and actual expenses in the columns under the heading “Actual.” In these columns the Fund’s actual return, which includes the effect of ongoing Fund expenses but does not include the effect of ongoing Contract expenses, is used to calculate the “Ending Account Value.”
You can estimate the Fund-level expenses you paid during the period by following these steps (of course, your account value and expenses will differ from those in this illustration):
| | Divide your account value by $1,000 |
| | (if your account had an $8,600 value, |
| | then $8,600 ÷ $1,000 = 8.6). |
| | Then multiply the result by the number under the headings “Actual” and “Fund-Level Expenses Paid During Period” |
| | (if Fund-Level Expenses Paid During Period were $ 7.50, |
| | then 8.6 x $7.50 = $64.50). |
In this illustration, the estimated expenses paid this period at the Fund level are $64.50.
Hypothetical Example for Comparison with Other Mutual Funds
Under the heading “Hypothetical” in the table, information is provided about hypothetical account values and hypothetical expenses based on the Fund’s actual expense ratio and an assumed rate of return of 5% per year before expenses, which is not the Fund’s actual return. This information may not be used to estimate the actual ending account balance or expenses you paid for the period, but it can help you compare ongoing costs of investing in the Fund with those of other mutual funds offered through the Contract. To do so, compare this 5% hypothetical example with the 5% hypothetical examples that appear in the shareholder reports of other funds offered through the Contract.
Please note that expenses shown in the table are meant to highlight ongoing costs at the Fund level only and do not reflect any ongoing expenses at the Contract level, or transaction expenses at either the Fund or Contract levels. In addition, while the Fund does not have transaction expenses, if the transaction and ongoing expenses at the Contract level were included, the expenses shown below would be higher. You should consult your Contract prospectus or disclosure document for more information.
| | | | | | | | | | | | | | | | | | | | | | | | |
| | | | | | Actual
(actual return after expenses) | | | Hypothetical
(5% annual return before expenses) | | | | |
| Share Class | |
| Beginning Account
Value 7/1/16 |
| |
| Ending Account
Value 12/31/16 |
| |
| Fund-Level
Expenses Paid
During Period
7/1/16–12/31/16 |
1,2 | |
| Ending Account
Value 12/31/16 |
| |
| Fund-Level
Expenses Paid
During Period
7/1/16–12/31/16 |
1,2 | |
| Net
Annualized
Expense
Ratio |
2 |
Class 2 | | $ | 1,000 | | | $ | 1,036.00 | | | $ | 4.30 | | | $ | 1,020.91 | | | $ | 4.27 | | | | 0.84 | % |
1. Expenses are equal to the annualized expense ratio for the six-month period as indicated above–in the far right column–multiplied by the simple average account value over the period indicated, and then multiplied by 184/366 to reflect the one-half year period.
2. Reflects expenses after fee waivers and expense reimbursements. Does not include any ongoing expenses of the Contract for which the Fund is an investment option or acquired fund fees and expenses.
FSI 3 P1 P2 P4 10/16
SUPPLEMENT DATED OCTOBER 26, 2016
TO THE PROSPECTUSES DATED MAY 1, 2016
OF
FRANKLIN STRATEGIC INCOME VIP FUND
(A series of Franklin Templeton Variable Insurance Products Trust)
The Prospectus is amended as follows:
I. The fourth full paragraph on page FSI-D2 in the “Fund Details – Principal InvestmentPolicies and Practices” section is replaced with:
For purposes of pursuing its investment goals, the Fund regularly enters into currency-related transactions involving derivative instruments, including currency and cross currency forwards, currency swaps, currency and currency index futures contracts, and currency options. The Fund may also enter into interest rate and credit-related transactions involving certain derivative instruments, including interest rate, credit default and fixed income total return swaps and interest rate and/or bond futures contracts (including U.S. Treasury futures contracts) and options thereon, as well as inflation index swaps and options on fixed income exchange traded funds. The use of such derivative transactions may allow the Fund to obtain net long or net short exposures to selected currencies, interest rates, countries, durations or credit risks. The Fund may use currency, interest rate or credit-related derivative strategies for the purposes of enhancing Fund returns, increasing liquidity, gaining exposure to particular instruments in more efficient or less expensive ways and/or hedging risks relating to other portfolio holdings or changes in currency exchange rates, credit risks, interest rates and other market factors.
Please keep this supplement with your prospectus for future reference.
VIP SAI 6 10/16
SUPPLEMENT DATED OCTOBER 26, 2016
TO THE STATEMENT OF ADDITIONAL INFORMATION
DATED MAY 1, 2016
OF
FRANKLIN STRATEGIC INCOME VIP FUND
(A series of Franklin Templeton Variable Insurance Products Trust)
The Statement of Additional Information is amended as follows:
I. The fourteenth through twenty-first bullets in “The Funds - Goals, Additional Strategies and Risks – Franklin Strategic Income VIP Fund” section are replaced with the following:
| | • | | buy and sell put and call options on currencies |
| | • | | engage in interest rate swaps |
| | • | | buy interest rate/bond futures |
| | • | | buy and sell put and call options on interest rate/bond futures |
| | • | | buy and sell put and call options on interest rate swaps and single name and index credit default swaps (swaptions) |
| | • | | buy and sell single name and index credit default swaps |
| | • | | engage in inflation index swaps |
| | • | | engage in fixed income total return swaps |
| | • | | buy and sell options on fixed income total return swaps |
| | • | | invest in fixed income ETFs and buy and sell put and call options thereon |
II. The following is added to “The Funds – Goals, Additional Strategies and Risks – Glossary of Investments, Techniques, Strategies and Their Risks – Derivative Instruments – Options on swap agreements” section (which begins on page 33):
An option on a total return swap is a contract that gives the buyer the right (but not the obligation), in return for payment of a premium to the option seller, to enter into a new total return swap on a reference asset at a predetermined spread on a future date. This spread is the price at which the contract is executed (the option strike price). Similar to a payer option on a credit default swap, in a payer option on a total return swap, the option buyer pays a premium to the option seller for the right, but not the obligation, to sell the return on a reference asset or index at a predetermined spread on a future date in return for a regular payment. Similar to a receiver option on a credit default swap, in a receiver option on a total return swap the option buyer pays a premium for the right, but not the obligation to receive the total return of the reference asset or index in return for a regular payment. Depending on the movement of market spreads with respect to the particular referenced asset or index between the time of purchase and expiration of the option, the value of the underlying total return swap and therefore the value of the option will change. Options on total return swaps currently are traded OTC and the specific terms of each option on a total return swap are negotiated directly with the counterparty.
Please keep this supplement with your Statement of Additional Information for future reference.
FRANKLIN TEMPLETON VARIABLE INSURANCE PRODUCTS TRUST
Consolidated Financial Highlights
Franklin Strategic Income VIP Fund
| | | | | | | | | | | | | | | | | | | | |
| | | Year Ended December 31, | |
| | | 2016 | | | 2015 | | | 2014 | | | 2013 | | | 2012 | |
| Class 1 | | | | | | | | | | | | | | | | | | | | |
Per share operating performance
(for a share outstanding throughout the year) | | | | | | | | | | | | | | | | | | | | |
| | | | | |
Net asset value, beginning of year | | | $10.55 | | | | $11.90 | | | | $12.64 | | | | $13.17 | | | | $12.55 | |
| | | | |
| | | | | |
| Income from investment operationsa: | | | | | | | | | | | | | | | | | | | | |
| | | | | |
Net investment incomeb | | | 0.48 | | | | 0.53 | | | | 0.54 | | | | 0.59 | | | | 0.65 | |
| | | | | |
Net realized and unrealized gains (losses) | | | 0.37 | | | | (0.91 | ) | | | (0.25 | ) | | | (0.15 | ) | | | 0.92 | |
| | | | |
Total from investment operations | | | 0.85 | | | | (0.38 | ) | | | 0.29 | | | | 0.44 | | | | 1.57 | |
| | | | |
| | | | | |
| Less distributions from: | | | | | | | | | | | | | | | | | | | | |
| | | | | |
Net investment income and net foreign currency gains | | | (0.39 | ) | | | (0.77 | ) | | | (0.78 | ) | | | (0.80 | ) | | | (0.93 | ) |
| | | | | |
Net realized gains | | | — | | | | (0.20 | ) | | | (0.25 | ) | | | (0.17 | ) | | | (0.02 | ) |
| | | | |
Total distributions | | | (0.39 | ) | | | (0.97 | ) | | | (1.03 | ) | | | (0.97 | ) | | | (0.95 | ) |
| | | | |
Net asset value, end of year | | | $11.01 | | | | $10.55 | | | | $11.90 | | | | $12.64 | | | | $13.17 | |
| | | | |
| | | | | |
Total returnc | | | 8.25% | | | | (3.62)% | | | | 2.12% | | | | 3.52% | | | | 13.12% | |
| | | | | |
| Ratios to average net assets | | | | | | | | | | | | | | | | | | | | |
| | | | | |
Expenses before waiver and payments by affiliates | | | 0.67% | | | | 0.63% | | | | 0.63% | | | | 0.60% | | | | 0.58% | |
| | | | | |
Expenses net of waiver and payments by affiliates | | | 0.60% | d | | | 0.62% | d | | | 0.62% | d | | | 0.60% | d | | | 0.58% | |
| | | | | |
Net investment income | | | 4.42% | | | | 4.71% | | | | 4.34% | | | | 4.58% | | | | 5.04% | |
| | | | | |
| Supplemental data | | | | | | | | | | | | | | | | | | | | |
| | | | | |
Net assets, end of year (000’s) | | | $396,170 | | | | $441,658 | | | | $574,850 | | | | $705,493 | | | | $1,019,537 | |
| | | | | |
Portfolio turnover rate | | | 128.51% | | | | 85.85% | | | | 55.64% | | | | 48.06% | | | | 49.98% | |
| | | | | |
Portfolio turnover rate excluding mortgage dollar rollse | | | 77.93% | | | | 51.47% | | | | 48.86% | | | | 47.01% | | | | 48.75% | |
aThe amount shown for a share outstanding throughout the period may not correlate with the Consolidated Statement of Operations for the period due to the timing of sales and repurchases of the Fund’s shares in relation to income earned and/or fluctuating fair value of the investments of the Fund.
bBased on average daily shares outstanding.
cTotal return does not include fees, charges or expenses imposed by the variable annuity and life insurance contracts for which Franklin Templeton Variable Insurance Products Trust serves as an underlying investment vehicle.
dBenefit of expense reduction rounds to less than 0.01%.
eSee Note 1(h) regarding mortgage dollar rolls.
| | | | |
| FSI-8 | | Annual Report | The accompanying notes are an integral part of these consolidated financial statements. |
FRANKLIN TEMPLETON VARIABLE INSURANCE PRODUCTS TRUST
CONSOLIDATED FINANCIAL HIGHLIGHTS
Franklin Strategic Income VIP Fund (continued)
| | | | | | | | | | | | | | | | | | | | |
| | | Year Ended December 31, | |
| | | 2016 | | | 2015 | | | 2014 | | | 2013 | | | 2012 | |
| Class 2 | | | | | | | | | | | | | | | | | | | | |
Per share operating performance
(for a share outstanding throughout the year) | | | | | | | | | | | | | | | | | | | | |
| | | | | |
Net asset value, beginning of year | | | $10.21 | | | | $11.55 | | | | $12.30 | | | | $12.84 | | | | $12.27 | |
| | | | |
| | | | | |
| Income from investment operationsa: | | | | | | | | | | | | | | | | | | | | |
| | | | | |
Net investment incomeb | | | 0.43 | | | | 0.49 | | | | 0.49 | | | | 0.54 | | | | 0.60 | |
| | | | | |
Net realized and unrealized gains (losses) | | | 0.36 | | | | (0.89 | ) | | | (0.24 | ) | | | (0.13 | ) | | | 0.89 | |
| | | | |
Total from investment operations | | | 0.79 | | | | (0.40 | ) | | | 0.25 | | | | 0.41 | | | | 1.49 | |
| | | | |
| | | | | |
| Less distributions from: | | | | | | | | | | | | | | | | | | | | |
| | | | | |
Net investment income and net foreign currency gains | | | (0.36 | ) | | | (0.74 | ) | | | (0.75 | ) | | | (0.78 | ) | | | (0.90 | ) |
| | | | | |
Net realized gains | | | — | | | | (0.20 | ) | | | (0.25 | ) | | | (0.17 | ) | | | (0.02 | ) |
| | | | |
Total distributions | | | (0.36 | ) | | | (0.94 | ) | | | (1.00 | ) | | | (0.95 | ) | | | (0.92 | ) |
| | | | |
Net asset value, end of year | | | $10.64 | | | | $10.21 | | | | $11.55 | | | | $12.30 | | | | $12.84 | |
| | | | |
| | | | | |
Total returnc | | | 7.94% | | | | (3.87)% | | | | 1.86% | | | | 3.32% | | | | 12.75% | |
| | | | | |
| Ratios to average net assets | | | | | | | | | | | | | | | | | | | | |
| | | | | |
Expenses before waiver and payments by affiliates | | | 0.92% | | | | 0.88% | | | | 0.88% | | | | 0.85% | | | | 0.83% | |
| | | | | |
Expenses net of waiver and payments by affiliates | | | 0.85% | d | | | 0.87% | d | | | 0.87% | d | | | 0.85% | d | | | 0.83% | |
| | | | | |
Net investment income | | | 4.17% | | | | 4.46% | | | | 4.09% | | | | 4.33% | | | | 4.79% | |
| | | | | |
| Supplemental data | | | | | | | | | | | | | | | | | | | | |
| | | | | |
Net assets, end of year (000’s) | | | $203,418 | | | | $202,192 | | | | $206,571 | | | | $175,307 | | | | $158,451 | |
| | | | | |
Portfolio turnover rate | | | 128.51% | | | | 85.85% | | | | 55.64% | | | | 48.06% | | | | 49.98% | |
| | | | | |
Portfolio turnover rate excluding mortgage dollar rollse | | | 77.93% | | | | 51.47% | | | | 48.86% | | | | 47.01% | | | | 48.75% | |
aThe amount shown for a share outstanding throughout the period may not correlate with the Consolidated Statement of Operations for the period due to the timing of sales and repurchases of the Fund’s shares in relation to income earned and/or fluctuating fair value of the investments of the Fund.
bBased on average daily shares outstanding.
cTotal return does not include fees, charges or expenses imposed by the variable annuity and life insurance contracts for which Franklin Templeton Variable Insurance Products Trust serves as an underlying investment vehicle.
dBenefit of expense reduction rounds to less than 0.01%.
eSee Note 1(h) regarding mortgage dollar rolls.
| | | | | | |
| The accompanying notes are an integral part of these consolidated financial statements. | Annual Report | | | FSI-9 | |
FRANKLIN TEMPLETON VARIABLE INSURANCE PRODUCTS TRUST
CONSOLIDATED FINANCIAL HIGHLIGHTS
Franklin Strategic Income VIP Fund (continued)
| | | | | | | | | | | | | | | | | | | | |
| | | Year Ended December 31, | |
| | | 2016 | | | 2015 | | | 2014 | | | 2013 | | | 2012 | |
| Class 4 | | | | | | | | | | | | | | | | | | | | |
Per share operating performance
(for a share outstanding throughout the year) | | | | | | | | | | | | | | | | | | | | |
| | | | | |
Net asset value, beginning of year | | | $10.44 | | | | $11.78 | | | | $12.51 | | | | $13.04 | | | | $12.44 | |
| | | | |
| | | | | |
| Income from investment operationsa: | | | | | | | | | | | | | | | | | | | | |
| | | | | |
Net investment incomeb | | | 0.43 | | | | 0.49 | | | | 0.49 | | | | 0.54 | | | | 0.60 | |
| | | | | |
Net realized and unrealized gains (losses) | | | 0.38 | | | | (0.91 | ) | | | (0.25 | ) | | | (0.14 | ) | | | 0.91 | |
| | | | |
Total from investment operations | | | 0.81 | | | | (0.42 | ) | | | 0.24 | | | | 0.40 | | | | 1.51 | |
| | | | |
| | | | | |
| Less distributions from: | | | | | | | | | | | | | | | | | | | | |
| | | | | |
Net investment income and net foreign currency gains | | | (0.35 | ) | | | (0.72 | ) | | | (0.72 | ) | | | (0.76 | ) | | | (0.89 | ) |
| | | | | |
Net realized gains | | | — | | | | (0.20 | ) | | | (0.25 | ) | | | (0.17 | ) | | | (0.02 | ) |
| | | | |
Total distributions | | | (0.35 | ) | | | (0.92 | ) | | | (0.97 | ) | | | (0.93 | ) | | | (0.91 | ) |
| | | | |
Net asset value, end of year | | | $10.90 | | | | $10.44 | | | | $11.78 | | | | $12.51 | | | | $13.04 | |
| | | | |
| | | | | |
Total returnc | | | 7.86% | | | | (3.98)% | | | | 1.75% | | | | 3.17% | | | | 12.67% | |
| | | | | |
| Ratios to average net assets | | | | | | | | | | | | | | | | | | | | |
| | | | | |
Expenses before waiver and payments by affiliates | | | 1.02% | | | | 0.98% | | | | 0.98% | | | | 0.95% | | | | 0.93% | |
| | | | | |
Expenses net of waiver and payments by affiliates | | | 0.95% | d | | | 0.97% | d | | | 0.97% | d | | | 0.95% | d | | | 0.93% | |
| | | | | |
Net investment income | | | 4.07% | | | | 4.36% | | | | 3.99% | | | | 4.23% | | | | 4.69% | |
| | | | | |
| Supplemental data | | | | | | | | | | | | | | | | | | | | |
| | | | | |
Net assets, end of year (000’s) | | | $80,175 | | | | $92,965 | | | | $113,986 | | | | $134,970 | | | | $196,479 | |
| | | | | |
Portfolio turnover rate | | | 128.51% | | | | 85.85% | | | | 55.64% | | | | 48.06% | | | | 49.98% | |
| | | | | |
Portfolio turnover rate excluding mortgage dollar rollse | | | 77.93% | | | | 51.47% | | | | 48.86% | | | | 47.01% | | | | 48.75% | |
aThe amount shown for a share outstanding throughout the period may not correlate with the Consolidated Statement of Operations for the period due to the timing of sales and repurchases of the Fund’s shares in relation to income earned and/or fluctuating fair value of the investments of the Fund.
bBased on average daily shares outstanding.
cTotal return does not include fees, charges or expenses imposed by the variable annuity and life insurance contracts for which Franklin Templeton Variable Insurance Products Trust serves as an underlying investment vehicle.
dBenefit of expense reduction rounds to less than 0.01%.
eSee Note 1(h) regarding mortgage dollar rolls.
| | | | |
| FSI-10 | | Annual Report | The accompanying notes are an integral part of these consolidated financial statements. |
FRANKLIN TEMPLETON VARIABLE INSURANCE PRODUCTS TRUST
Consolidated Statement of Investments, December 31, 2016
| | | | | | | | | | | | | | |
Franklin Strategic Income VIP Fund | | | | |
| | | | | Country | | | Shares/ Units/
Warrants | | | Value | |
| | | Common Stocks and Other Equity Interests 2.0% | | | | | | | | | |
| | | Consumer Services 1.3% | | | | | | | | | |
| a,b,c | | Turtle Bay Resort | | | United States | | | | 1,901,449 | | | $ | 8,913,040 | |
| | | | | | | | | | | | | | |
| | Energy 0.5% | | | | | | | | | | | | |
| a | | Energy XXI Gulf Coast Inc. | | | United States | | | | 26,031 | | | | 717,077 | |
| a | | Energy XXI Gulf Coast Inc., wts., 12/30/21 | | | United States | | | | 4,009 | | | | — | |
| a,d | | Halcon Resources Corp. | | | United States | | | | 97,655 | | | | 818,368 | |
| a | | Halcon Resources Corp., wts., 9/09/20 | | | United States | | | | 8,155 | | | | 16,881 | |
| a | | Midstates Petroleum Co. Inc. | | | United States | | | | 682 | | | | 14,145 | |
| a,e | | Midstates Petroleum Co. Inc., wts., 4/21/20 | | | United States | | | | 4,836 | | | | — | |
| a | | Penn Virginia Corp. | | | United States | | | | 8,290 | | | | 406,210 | |
| a,f | | Penn Virginia Corp., 144A | | | United States | | | | 10,357 | | | | 507,493 | |
| a | | W&T Offshore Inc. | | | United States | | | | 170,200 | | | | 471,454 | |
| a,d | | Warrior Met Coal LLC, A | | | United States | | | | 1,499 | | | | 487,175 | |
| �� | | | | | | | | | | | | | |
| | | | | | | | | | | | | 3,438,803 | |
| | | | | | | | | | | | | | |
| | | Materials 0.0%† | | | | | | | | | |
| a | | Verso Corp., A | | | United States | | | | 6,954 | | | | 49,373 | |
| a | | Verso Corp., wts., 7/25/23 | | | United States | | | | 732 | | | | — | |
| | | | | | | | | | | | | | |
| | | | | | | | | | | | | 49,373 | |
| | | | | | | | | | | | | | |
| | | Transportation 0.0%† | | | | | | | | | |
| a,e | | CEVA Holdings LLC | | | United States | | | | 224 | | | | 22,428 | |
| | | | | | | | | | | | | | |
| | | Utilities 0.2% | | | | | | | | | |
| | Vistra Energy Corp. | | | United States | | | | 51,377 | | | | 796,344 | |
| | | | | | | | | | | | | | |
| | | | |
| | Total Common Stocks and Other Equity Interests
(Cost $17,408,792) | | | | | | | | | | | 13,219,988 | |
| | | | | | | | | | | | | | |
| | Management Investment Companies 7.2% | | | | | | | | | | | | |
| | | Diversified Financials 7.2% | | | | | | | | | |
| g | | Franklin Lower Tier Floating Rate Fund | | | United States | | | | 2,590,404 | | | | 27,173,334 | |
| g | | Franklin Middle Tier Floating Rate Fund | | | United States | | | | 2,175,846 | | | | 22,063,079 | |
| | | | | | | | | | | | | | |
| | | | |
| | Total Management Investment Companies (Cost $47,110,076) | | | | | | | | | | | 49,236,413 | |
| | | | | | | | | | | | | | |
| | | Convertible Preferred Stocks 0.0%† | | | | | | | | | |
| | | Transportation 0.0%† | | | | | | | | | |
| a,e | | CEVA Holdings LLC, cvt. pfd., A-1 | | | United States | | | | 6 | | | | 1,950 | |
| a,e | | CEVA Holdings LLC, cvt. pfd., A-2 | | | United States | | | | 486 | | | | 109,240 | |
| | | | | | | | | | | | | | |
| | | | |
| | Total Convertible Preferred Stocks (Cost $731,856) | | | | | | | | | | | 111,190 | |
| | | | | | | | | | | | | | |
| | | | |
| | | | | | | | Principal Amount* | | | | |
| | | Corporate Bonds 42.6% | | | | | | | | | |
| | | Automobiles & Components 1.0% | | | | | | | | | |
| | Fiat Chrysler Automobiles NV, senior note, 5.25%, 4/15/23 | | | United Kingdom | | | | 3,000,000 | | | | 3,069,345 | |
| | Ford Motor Credit Co. LLC, senior note, 3.096%, 5/04/23 | | | United States | | | | 2,100,000 | | | | 2,028,676 | |
| | The Goodyear Tire & Rubber Co., | | | | | | | | | | | | |
| | senior bond, 5.00%, 5/31/26 | | | United States | | | | 1,000,000 | | | | 997,940 | |
| | senior note, 5.125%, 11/15/23 | | | United States | | | | 400,000 | | | | 414,000 | |
| | | | | | | | | | | | | | |
| | | | | | | | | | | | | 6,509,961 | |
| | | | | | | | | | | | | | |
FRANKLIN TEMPLETON VARIABLE INSURANCE PRODUCTS TRUST
CONSOLIDATED STATEMENT OF INVESTMENTS
Franklin Strategic Income VIP Fund (continued)
| | | | | | | | | | | | | | |
| | | | | Country | | | Principal Amount* | | | Value | |
| | Corporate Bonds (continued) | | | | | | | | | | | | |
| | | Banks 4.7% | | | | | | | | | |
| | Bank of America Corp., | | | | | | | | | | | | |
| | senior note, 7.75%, 4/30/18 | | | United States | | | | 500,000 | GBP | | $ | 671,605 | |
| | senior note, 5.65%, 5/01/18 | | | United States | | | | 750,000 | | | | 785,963 | |
| | senior note, 3.50%, 4/19/26 | | | United States | | | | 4,800,000 | | | | 4,738,536 | |
| | CIT Group Inc., | | | | | | | | | | | | |
| | senior note, 5.375%, 5/15/20 | | | United States | | | | 1,000,000 | | | | 1,065,000 | |
| | senior note, 5.00%, 8/15/22 | | | United States | | | | 2,500,000 | | | | 2,612,500 | |
| | Citigroup Inc., | | | | | | | | | | | | |
| | senior note, 3.875%, 10/25/23 | | | United States | | | | 3,000,000 | | | | 3,092,373 | |
| | senior note, 3.30%, 4/27/25 | | | United States | | | | 300,000 | | | | 294,059 | |
| | senior note, 3.40%, 5/01/26 | | | United States | | | | 3,100,000 | | | | 3,013,752 | |
| | sub. bond, 5.50%, 9/13/25 | | | United States | | | | 500,000 | | | | 549,764 | |
| | sub. note, 4.05%, 7/30/22 | | | United States | | | | 300,000 | | | | 310,551 | |
| | JPMorgan Chase & Co., | | | | | | | | | | | | |
| | h junior sub. bond, R, 6.00% to 8/01/23, FRN thereafter, Perpetual | | | United States | | | | 1,500,000 | | | | 1,509,375 | |
| | h junior sub. bond, X, 6.10% to 10/01/24, FRN thereafter, Perpetual | | | United States | | | | 500,000 | | | | 506,563 | |
| | senior bond, 3.30%, 4/01/26 | | | United States | | | | 400,000 | | | | 392,920 | |
| | senior bond, 3.20%, 6/15/26 | | | United States | | | | 1,500,000 | | | | 1,467,742 | |
| | senior note, 4.25%, 10/15/20 | | | United States | | | | 1,000,000 | | | | 1,058,000 | |
| | sub. note, 3.375%, 5/01/23 | | | United States | | | | 1,000,000 | | | | 996,798 | |
| | sub. note, 3.875%, 9/10/24 | | | United States | | | | 1,000,000 | | | | 1,012,287 | |
| | Royal Bank of Scotland Group PLC, sub. note, 6.125%, 12/15/22 | | | United Kingdom | | | | 700,000 | | | | 744,464 | |
| | Wells Fargo & Co., | | | | | | | | | | | | |
| | h junior sub. bond, S, 5.90% to 6/15/24, FRN thereafter, Perpetual | | | United States | | | | 1,500,000 | | | | 1,509,375 | |
| | senior note, 2.60%, 7/22/20 | | | United States | | | | 700,000 | | | | 703,894 | |
| | senior note, 3.00%, 4/22/26 | | | United States | | | | 5,000,000 | | | | 4,770,155 | |
| | | | | | | | | | | | | | |
| | | | | | | | | | | | | 31,805,676 | |
| | | | | | | | | | | | | | |
| | | Capital Goods 0.7% | | | | | | | | | |
| f | | Cortes NP Acquisition Corp., senior note, 144A, 9.25%, 10/15/24 | | | United States | | | | 1,600,000 | | | | 1,704,000 | |
| | Navistar International Corp., senior bond, 8.25%, 11/01/21 | | | United States | | | | 1,400,000 | | | | 1,421,000 | |
| | TransDigm Inc., | | | | | | | | | | | | |
| | senior sub. bond, 6.50%, 7/15/24 | | | United States | | | | 500,000 | | | | 525,625 | |
| | senior sub. bond, 6.50%, 5/15/25 | | | United States | | | | 200,000 | | | | 210,250 | |
| | f senior sub. bond, 144A, 6.375%, 6/15/26 | | | United States | | | | 400,000 | | | | 412,800 | |
| | senior sub. note, 6.00%, 7/15/22 | | | United States | | | | 400,000 | | | | 418,000 | |
| | | | | | | | | | | | | | |
| | | | | | | | | | | | | 4,691,675 | |
| | | | | | | | | | | | | | |
| | | Commercial & Professional Services 0.1% | | | | | | | | | |
| | United Rentals North America Inc., senior bond, 5.875%, 9/15/26 | | | United States | | | | 700,000 | | | | 723,625 | |
| | | | | | | | | | | | | | |
| | | Consumer Durables & Apparel 0.7% | | | | | | | | | |
| f | | Hanesbrands Inc., senior bond, 144A, 4.875%, 5/15/26 | | | United States | | | | 1,500,000 | | | | 1,473,750 | |
| | KB Home, | | | | | | | | | | | | |
| | senior note, 4.75%, 5/15/19 | | | United States | | | | 1,000,000 | | | | 1,025,000 | |
| | senior note, 7.00%, 12/15/21 | | | United States | | | | 1,200,000 | | | | 1,275,000 | |
| | Toll Brothers Finance Corp., senior bond, 5.625%, 1/15/24 | | | United States | | | | 1,100,000 | | | | 1,146,750 | |
| | | | | | | | | | | | | | |
| | | | | | | | | | | | | 4,920,500 | |
| | | | | | | | | | | | | | |
FRANKLIN TEMPLETON VARIABLE INSURANCE PRODUCTS TRUST
CONSOLIDATED STATEMENT OF INVESTMENTS
Franklin Strategic Income VIP Fund (continued)
| | | | | | | | | | | | | | |
| | | | | Country | | | Principal Amount* | | | Value | |
| | Corporate Bonds (continued) | | | | | | | | | | | | |
| | | Consumer Services 1.9% | | | | | | | | | |
| f | | 1011778 BC ULC/New Red Finance Inc., secured note, second lien, 144A, 6.00%, 4/01/22 | | | Canada | | | | 2,000,000 | | | $ | 2,095,000 | |
| f,i | | Fontainebleau Las Vegas, senior secured bond, first lien, 144A, 11.00%, 6/15/15 | | | United States | | | | 2,500,000 | | | | 250 | |
| f | | International Game Technology PLC, senior secured bond, 144A, 6.50%, 2/15/25 | | | United States | | | | 3,300,000 | | | | 3,555,750 | |
| f | | KFC Holding Co./Pizza Hut Holdings LLC/Taco Bell of America LLC, | | | | | | | | | | | | |
| | senior note, 144A, 5.00%, 6/01/24 | | | United States | | | | 900,000 | | | | 921,375 | |
| | senior note, 144A, 5.25%, 6/01/26 | | | United States | | | | 800,000 | | | | 814,000 | |
| | Marriott International Inc., senior bond, 3.75%, 10/01/25 | | | United States | | | | 3,000,000 | | | | 3,005,490 | |
| | MGM Resorts International, senior note, 6.75%, 10/01/20 | | | United States | | | | 200,000 | | | | 223,000 | |
| f | | Wynn Las Vegas LLC/Wynn Las Vegas Capital Corp., senior bond, 144A, 5.50%, 3/01/25 | | | United States | | | | 700,000 | | | | 696,150 | |
| f | | Wynn Macau Ltd., senior note, 144A, 5.25%, 10/15/21 | | | Macau | | | | 1,300,000 | | | | 1,316,250 | |
| | | | | | | | | | | | | | |
| | | | | | | | | | | | | 12,627,265 | |
| | | | | | | | | | | | | | |
| | | Diversified Financials 2.8% | | | | | | | | | |
| | AerCap Ireland Capital Ltd./AerCap Global Aviation Trust, | | | | | | | | | | | | |
| | senior note, 4.625%, 10/30/20 | | | Netherlands | | | | 500,000 | | | | 521,513 | |
| | senior note, 5.00%, 10/01/21 | | | Netherlands | | | | 1,100,000 | | | | 1,157,788 | |
| | Capital One Financial Corp., senior note, 3.20%, 2/05/25 | | | United States | | | | 2,000,000 | | | | 1,939,390 | |
| | The Goldman Sachs Group Inc., | | | | | | | | | | | | |
| | senior note, 3.50%, 1/23/25 | | | United States | | | | 3,000,000 | | | | 2,961,483 | |
| | senior note, 3.75%, 2/25/26 | | | United States | | | | 1,500,000 | | | | 1,505,167 | |
| f | | Lincoln Finance Ltd., senior secured note, 144A, 6.875%, 4/15/21 | | | Netherlands | | | | 600,000 | EUR | | | 687,192 | |
| | Morgan Stanley, | | | | | | | | | | | | |
| | senior note, 3.875%, 1/27/26 | | | United States | | | | 4,200,000 | | | | 4,244,612 | |
| | sub. bond, 3.95%, 4/23/27 | | | United States | | | | 1,000,000 | | | | 990,468 | |
| | Navient Corp., | | | | | | | | | | | | |
| | senior note, 6.625%, 7/26/21 | | | United States | | | | 800,000 | | | | 848,000 | |
| | senior note, 7.25%, 9/25/23 | | | United States | | | | 2,500,000 | | | | 2,575,000 | |
| | senior note, 6.125%, 3/25/24 | | | United States | | | | 500,000 | | | | 488,125 | |
| f | | Transurban Finance Co. Pty. Ltd., 144A, 3.375%, 3/22/27 | | | Australia | | | | 1,100,000 | | | | 1,039,969 | |
| | | | | | | | | | | | | | |
| | | | | | | | | | | | | 18,958,707 | |
| | | | | | | | | | | | | | |
| | | Energy 4.9% | | | | | | | | | |
| | Access Midstream Partner LP/ACMP Finance Corp., senior note, 6.125%, 7/15/22 | | | United States | | | | 600,000 | | | | 618,860 | |
| | Apache Corp., senior bond, 2.625%, 1/15/23 | | | United States | | | | 1,900,000 | | | | 1,827,675 | |
| i | | BreitBurn Energy Partners LP/BreitBurn Finance Corp., senior bond, 7.875%, 4/15/22 | | | United States | | | | 2,300,000 | | | | 1,644,500 | |
| f | | California Resources Corp., secured note, second lien, 144A, 8.00%, 12/15/22 | | | United States | | | | 716,000 | | | | 640,820 | |
| | CGG SA, senior note, 6.50%, 6/01/21 | | | France | | | | 1,300,000 | | | | 604,500 | |
| c,i | | CHC Helicopter SA, senior secured note, first lien, 9.25%, 10/15/20 | | | Canada | | | | 2,205,000 | | | | 992,030 | |
| f | | Cheniere Corpus Christi Holdings LLC, | | | | | | | | | | | | |
| | senior secured note, 144A, 7.00%, 6/30/24 | | | United States | | | | 800,000 | | | | 870,000 | |
| | senior secured note, first lien, 144A, 5.875%, 3/31/25 | | | United States | | | | 700,000 | | | | 716,842 | |
| | CONSOL Energy Inc., senior note, 5.875%, 4/15/22 | | | United States | | | | 2,500,000 | | | | 2,462,500 | |
| | Energy Transfer Equity LP, senior note, first lien, 7.50%, 10/15/20 | | | United States | | | | 1,900,000 | | | | 2,128,000 | |
| | Energy Transfer Partners LP, senior note, 5.20%, 2/01/22 | | | United States | | | | 1,000,000 | | | | 1,070,899 | |
| f,j | | EnQuest PLC, 144A, PIK, 7.00%, 4/15/22 | | | United Kingdom | | | | 1,146,508 | | | | 830,652 | |
FRANKLIN TEMPLETON VARIABLE INSURANCE PRODUCTS TRUST
CONSOLIDATED STATEMENT OF INVESTMENTS
Franklin Strategic Income VIP Fund (continued)
| | | | | | | | | | | | | | |
| | | | | Country | | | Principal Amount* | | | Value | |
| | | Corporate Bonds (continued) | | | | | | | | | |
| | | Energy (continued) | | | | | | | | | |
| f,k | | Gaz Capital SA (OJSC Gazprom), loan participation, senior note, 144A, 3.85%, 2/06/20 | | | Russia | | | | 1,500,000 | | | $ | 1,525,372 | |
| f | | Kinder Morgan Finance Co. LLC, senior secured note, 144A, 6.00%, 1/15/18 | | | United States | | | | 2,000,000 | | | | 2,082,690 | |
| | Kinder Morgan Inc., senior note, 6.50%, 9/15/20 | | | United States | | | | 1,500,000 | | | | 1,681,869 | |
| f,i | | Linn Energy LLC/Finance Corp., senior secured note, second lien, 144A, 12.00%, 12/15/20 | | | United States | | | | 650,000 | | | | 570,375 | |
| f | | LUKOIL International Finance BV, senior note, 144A, 4.563%, 4/24/23 | | | Russia | | | | 2,000,000 | | | | 2,016,670 | |
| | Martin Midstream Partners LP/Martin Midstream Finance Corp., senior note, 7.25%, 2/15/21 | | | United States | | | | 2,000,000 | | | | 1,985,000 | |
| | PBF Holding Co. LLC, first lien, 8.25%, 2/15/20 | | | United States | | | | 1,000,000 | | | | 1,026,250 | |
| | Regency Energy Partners LP/Regency Energy Finance Corp., | | | | | | | | | | | | |
| | senior note, 5.875%, 3/01/22 | | | United States | | | | 200,000 | | | | 220,046 | |
| | senior note, 5.00%, 10/01/22 | | | United States | | | | 500,000 | | | | 529,942 | |
| | Sabine Pass Liquefaction LLC, | | | | | | | | | | | | |
| | first lien, 5.625%, 2/01/21 | | | United States | | | | 2,000,000 | | | | 2,150,000 | |
| | first lien, 5.625%, 4/15/23 | | | United States | | | | 900,000 | | | | 960,750 | |
| c | | Sanchez Energy Corp., senior note, 6.125%, 1/15/23 | | | United States | | | | 300,000 | | | | 286,500 | |
| f,j | | W&T Offshore Inc., | | | | | | | | | | | | |
| | second lien, 144A, PIK, 10.75%, 5/15/20 | | | United States | | | | 459,137 | | | | 348,848 | |
| | senior secured note, third lien, 144A, PIK, 10.00%, 6/15/21 | | | United States | | | | 410,889 | | | | 245,510 | |
| | Weatherford International Ltd., | | | | | | | | | | | | |
| | senior note, 7.75%, 6/15/21 | | | United States | | | | 800,000 | | | | 811,000 | |
| | senior note, 8.25%, 6/15/23 | | | United States | | | | 1,000,000 | | | | 1,020,000 | |
| f | | Woodside Finance Ltd., senior note, 144A, 3.70%, 9/15/26 | | | Australia | | | | 1,300,000 | | | | 1,271,956 | |
| | | | | | | | | | | | | | |
| | | | | | | | | | | | | 33,140,056 | |
| | | | | | | | | | | | | | |
| | | Food & Staples Retailing 0.6% | | | | | | | | | |
| | Kroger Co., senior bond, 2.65%, 10/15/26 | | | United States | | | | 1,400,000 | | | | 1,301,423 | |
| | Walgreens Boots Alliance Inc., senior note, 3.80%, 11/18/24 | | | United States | | | | 2,500,000 | | | | 2,545,565 | |
| | | | | | | | | | | | | | |
| | | | | | | | | | | | | 3,846,988 | |
| | | | | | | | | | | | | | |
| | | Food, Beverage & Tobacco 1.5% | | | | | | | | | |
| | Anheuser-Busch InBev Finance Inc., senior note, 3.30%, 2/01/23 | | | Belgium | | | | 1,300,000 | | | | 1,323,461 | |
| f | | Imperial Brands Finance PLC, senior note, 144A, 3.50%, 2/11/23 | | | United Kingdom | | | | 2,100,000 | | | | 2,107,427 | |
| f | | JBS USA LLC/Finance Inc., | | | | | | | | | | | | |
| | senior note, 144A, 8.25%, 2/01/20 | | | United States | | | | 2,000,000 | | | | 2,060,000 | |
| | senior note, 144A, 5.75%, 6/15/25 | | | United States | | | | 500,000 | | | | 508,750 | |
| | Kraft Heinz Foods Co., senior bond, 3.00%, 6/01/26 | | | United States | | | | 1,800,000 | | | | 1,690,824 | |
| f | | Lamb Weston Holdings Inc., | | | | | | | | | | | | |
| | senior note, 144A, 4.625%, 11/01/24 | | | United States | | | | 600,000 | | | | 603,000 | |
| | senior note, 144A, 4.875%, 11/01/26 | | | United States | | | | 600,000 | | | | 595,125 | |
| f | | Post Holdings Inc., | | | | | | | | | | | | |
| | senior note, 144A, 6.00%, 12/15/22 | | | United States | | | | 500,000 | | | | 524,375 | |
| | senior note, 144A, 7.75%, 3/15/24 | | | United States | | | | 1,000,000 | | | | 1,115,000 | |
| | | | | | | | | | | | | | |
| | | | | | | | | | | | | 10,527,962 | |
| | | | | | | | | | | | | | |
| | | Health Care Equipment & Services 1.8% | | | | | | | | | |
| | CHS/Community Health Systems Inc., | | | | | | | | | | | | |
| | senior note, 8.00%, 11/15/19 | | | United States | | | | 1,500,000 | | | | 1,252,500 | |
| | senior note, 6.875%, 2/01/22 | | | United States | | | | 400,000 | | | | 280,000 | |
FRANKLIN TEMPLETON VARIABLE INSURANCE PRODUCTS TRUST
CONSOLIDATED STATEMENT OF INVESTMENTS
Franklin Strategic Income VIP Fund (continued)
| | | | | | | | | | | | | | |
| | | | | Country | | | Principal Amount* | | | Value | |
| | | Corporate Bonds (continued) | | | | | | | | | |
| | | Health Care Equipment & Services (continued) | | | | | | | | | |
| | DaVita Inc., | | | | | | | | | | | | |
| | senior bond, 5.125%, 7/15/24 | | | United States | | | | 500,000 | | | $ | 499,688 | |
| | senior bond, 5.00%, 5/01/25 | | | United States | | | | 900,000 | | | | 887,625 | |
| | senior note, 5.75%, 8/15/22 | | | United States | | | | 1,500,000 | | | | 1,573,125 | |
| | HCA Inc., | | | | | | | | | | | | |
| | senior bond, 5.875%, 5/01/23 | | | United States | | | | 1,500,000 | | | | 1,597,500 | |
| | senior note, 7.50%, 2/15/22 | | | United States | | | | 700,000 | | | | 796,250 | |
| | senior secured bond, first lien, 5.875%, 3/15/22 | | | United States | | | | 450,000 | | | | 486,000 | |
| | senior secured bond, first lien, 5.25%, 4/15/25 | | | United States | | | | 600,000 | | | | 627,750 | |
| f | | MPH Acquisition Holdings LLC, senior note, 144A, 7.125%, 6/01/24 | | | United States | | | | 900,000 | | | | 949,590 | |
| | Stryker Corp., senior bond, 3.50%, 3/15/26 | | | United States | | | | 500,000 | | | | 504,979 | |
| | Tenet Healthcare Corp., | | | | | | | | | | | | |
| | senior note, 5.00%, 3/01/19 | | | United States | �� | | | 500,000 | | | | 490,000 | |
| | senior note, 5.50%, 3/01/19 | | | United States | | | | 1,200,000 | | | | 1,185,000 | |
| | senior note, 8.125%, 4/01/22 | | | United States | | | | 1,000,000 | | | | 948,500 | |
| | | | | | | | | | | | | | |
| | | | | | | | | | | | | 12,078,507 | |
| | | | | | | | | | | | | | |
| | | Household & Personal Products 0.2% | | | | | | | | | |
| | The Procter & Gamble Co., senior note, 2.45%, 11/03/26 | | | United States | | | | 1,800,000 | | | | 1,724,396 | |
| | | | | | | | | | | | | | |
| | | Insurance 1.1% | | | | | | | | | |
| | MetLife Inc., | | | | | | | | | | | | |
| | senior note, 3.60%, 4/10/24 | | | United States | | | | 2,400,000 | | | | 2,463,146 | |
| | senior note, 3.00%, 3/01/25 | | | United States | | | | 300,000 | | | | 294,255 | |
| f | | Nippon Life Insurance Co., sub. bond, 144A, 5.10% to 10/16/24, FRN thereafter, 10/16/44 | | | Japan | | | | 3,500,000 | | | | 3,616,200 | |
| | Prudential Financial Inc., 3.50%, 5/15/24 | | | United States | | | | 800,000 | | | | 816,908 | |
| | | | | | | | | | | | | | |
| | | | | | | | | | | | | 7,190,509 | |
| | | | | | | | | | | | | | |
| | | Materials 4.9% | | | | | | | | | |
| | ArcelorMittal, | | | | | | | | | | | | |
| | senior note, 6.50%, 3/01/21 | | | France | | | | 1,800,000 | | | | 1,967,130 | |
| | senior note, 6.125%, 6/01/25 | | | France | | | | 300,000 | | | | 330,000 | |
| f | | Ardagh Packaging Finance PLC/Ardagh MP Holdings USA Inc., | | | | | | | | | | | | |
| | senior note, 144A, 6.75%, 1/31/21 | | | Luxembourg | | | | 200,000 | | | | 206,500 | |
| | senior note, 144A, 6.00%, 6/30/21 | | | Luxembourg | | | | 1,300,000 | | | | 1,327,625 | |
| f | | Barminco Finance Pty. Ltd., senior note, 144A, 9.00%, 6/01/18 | | | Australia | | | | 1,500,000 | | | | 1,531,875 | |
| f | | Cemex Finance LLC, senior secured note, first lien, 144A, 6.00%, 4/01/24 | | | Mexico | | | | 1,000,000 | | | | 1,033,875 | |
| f | | Cemex SAB de CV, first lien, 144A, 5.70%, 1/11/25 | | | Mexico | | | | 1,500,000 | | | | 1,521,877 | |
| f | | Ceramtec Group GmbH, senior note, 144A, 8.25%, 8/15/21 | | | Germany | | | | 1,200,000 | EUR | | | 1,351,883 | |
| | The Chemours Co., senior note, 6.625%, 5/15/23 | | | United States | | | | 2,000,000 | | | | 1,990,000 | |
| f | | First Quantum Minerals Ltd., | | | | | | | | | | | | |
| | senior note, 144A, 6.75%, 2/15/20 | | | Canada | | | | 700,000 | | | | 701,750 | |
| | senior note, 144A, 7.00%, 2/15/21 | | | Canada | | | | 825,000 | | | | 824,670 | |
| | Freeport-McMoRan Inc., senior note, 4.55%, 11/14/24 | | | United States | | | | 2,500,000 | | | | 2,356,250 | |
| f | | Glencore Finance Canada Ltd., senior bond, 144A, 4.95%, 11/15/21 | | | Switzerland | | | | 1,000,000 | | | | 1,071,158 | |
| f | | Glencore Funding LLC, | | | | | | | | | | | | |
| | senior note, 144A, 4.125%, 5/30/23 | | | Switzerland | | | | 600,000 | | | | 604,648 | |
| | senior note, 144A, 4.625%, 4/29/24 | | | Switzerland | | | | 250,000 | | | | 256,563 | |
FRANKLIN TEMPLETON VARIABLE INSURANCE PRODUCTS TRUST
CONSOLIDATED STATEMENT OF INVESTMENTS
Franklin Strategic Income VIP Fund (continued)
| | | | | | | | | | | | | | |
| | | | | Country | | | Principal Amount* | | | Value | |
| | | Corporate Bonds (continued) | | | | | | | | | |
| | | Materials (continued) | | | | | | | | | |
| f | | INVISTA Finance LLC, senior secured note, 144A, 4.25%, 10/15/19 | | | United States | | | | 3,000,000 | | | $ | 2,983,629 | |
| | LYB International Finance BV, senior note, 4.00%, 7/15/23 | | | United States | | | | 2,100,000 | | | | 2,197,692 | |
| f | | Novelis Corp., senior bond, 144A, 5.875%, 9/30/26 | | | United States | | | | 1,200,000 | | | | 1,215,000 | |
| f | | Owens-Brockway Glass Container Inc., | | | | | | | | | | | | |
| | senior note, 144A, 5.00%, 1/15/22 | | | United States | | | | 1,400,000 | | | | 1,436,750 | |
| | senior note, 144A, 5.875%, 8/15/23 | | | United States | | | | 700,000 | | | | 731,062 | |
| | Reynolds Group Issuer Inc./Reynolds Group Issuer LLC/Reynolds Group Issuer Luxembourg SA, | | | | | | | | | | | | |
| | first lien, 5.75%, 10/15/20 | | | United States | | | | 700,000 | | | | 722,750 | |
| | f first lien, 144A, 5.125%, 7/15/23 | | | United States | | | | 700,000 | | | | 712,250 | |
| | senior note, 8.25%, 2/15/21 | | | United States | | | | 346,793 | | | | 358,166 | |
| | f senior note, 144A, 7.00%, 7/15/24 | | | United States | | | | 300,000 | | | | 319,313 | |
| f | | Sealed Air Corp., | | | | | | | | | | | | |
| | senior bond, 144A, 5.125%, 12/01/24 | | | United States | | | | 1,000,000 | | | | 1,032,500 | |
| | senior bond, 144A, 5.50%, 9/15/25 | | | United States | | | | 400,000 | | | | 414,000 | |
| | senior note, 144A, 4.875%, 12/01/22 | | | United States | | | | 1,000,000 | | | | 1,031,250 | |
| | Steel Dynamics Inc., | | | | | | | | | | | | |
| | senior bond, 5.50%, 10/01/24 | | | United States | | | | 1,000,000 | | | | 1,062,500 | |
| | senior note, 5.125%, 10/01/21 | | | United States | | | | 1,000,000 | | | | 1,047,940 | |
| f | | Valvoline Inc., senior note, 144A, 5.50%, 7/15/24 | | | United States | | | | 700,000 | | | | 726,250 | |
| | | | | | | | | | | | | | |
| | | | | | | | | | | | | 33,066,856 | |
| | | | | | | | | | | | | | |
| | | Media 4.4% | | | | | | | | | |
| | 21st Century Fox America Inc., senior note, 3.00%, 9/15/22 | | | United States | | | | 500,000 | | | | 497,743 | |
| f | | Altice U.S. Finance I Corp., senior secured bond, 144A, 5.50%, 5/15/26 | | | United States | | | | 1,200,000 | | | | 1,227,000 | |
| | CCO Holdings LLC/CCO Holdings Capital Corp., | | | | | | | | | | | | |
| | senior bond, 5.25%, 9/30/22 | | | United States | | | | 2,000,000 | | | | 2,075,000 | |
| | f senior bond, 144A, 5.375%, 5/01/25 | | | United States | | | | 900,000 | | | | 929,250 | |
| | Clear Channel Worldwide Holdings Inc., | | | | | | | | | | | | |
| | senior note, 6.50%, 11/15/22 | | | United States | | | | 1,000,000 | | | | 1,027,500 | |
| | senior sub. note, 7.625%, 3/15/20 | | | United States | | | | 200,000 | | | | 193,000 | |
| | senior sub. note, 7.625%, 3/15/20 | | | United States | | | | 500,000 | | | | 501,560 | |
| | CSC Holdings LLC, senior note, 6.75%, 11/15/21 | | | United States | | | | 2,000,000 | | | | 2,155,000 | |
| | DISH DBS Corp., | | | | | | | | | | | | |
| | senior note, 6.75%, 6/01/21 | | | United States | | | | 500,000 | | | | 543,750 | |
| | senior note, 5.875%, 7/15/22 | | | United States | | | | 500,000 | | | | 527,500 | |
| | senior note, 5.875%, 11/15/24 | | | United States | | | | 500,000 | | | | 516,375 | |
| | Gannett Co. Inc., | | | | | | | | | | | | |
| | senior bond, 6.375%, 10/15/23 | | | United States | | | | 1,000,000 | | | | 1,061,900 | |
| | f senior bond, 144A, 5.50%, 9/15/24 | | | United States | | | | 300,000 | | | | 304,125 | |
| | senior note, 5.125%, 7/15/20 | | | United States | | | | 1,000,000 | | | | 1,038,750 | |
| | iHeartCommunications Inc., | | | | | | | | | | | | |
| | senior secured bond, first lien, 9.00%, 3/01/21 | | | United States | | | | 2,400,000 | | | | 1,785,000 | |
| | senior secured note, first lien, 9.00%, 9/15/22 | | | United States | | | | 700,000 | | | | 517,125 | |
| f | | Nextstar Escrow Corp., senior note, 144A, 5.625%, 8/01/24 | | | United States | | | | 600,000 | | | | 597,000 | |
| f | | Sirius XM Radio Inc., | | | | | | | | | | | | |
| | senior bond, 144A, 6.00%, 7/15/24 | | | United States | | | | 1,700,000 | | | | 1,780,750 | |
| | senior bond, 144A, 5.375%, 4/15/25 | | | United States | | | | 800,000 | | | | 798,000 | |
| | Time Warner Cable LLC, senior note, 4.00%, 9/01/21 | | | United States | | | | 1,300,000 | | | | 1,335,206 | |
| | Time Warner Inc., senior bond, 2.95%, 7/15/26 | | | United States | | | | 1,800,000 | | | | 1,677,663 | |
| f | | Unitymedia Hessen GmbH & Co. KG/Unitymedia NRW GmbH, senior secured note, first lien, 144A, 5.625%, 4/15/23 | | | Germany | | | | 640,000 | EUR | | | 724,321 | |
FRANKLIN TEMPLETON VARIABLE INSURANCE PRODUCTS TRUST
CONSOLIDATED STATEMENT OF INVESTMENTS
Franklin Strategic Income VIP Fund (continued)
| | | | | | | | | | | | | | | | | | |
| | | | | Country | | | Principal Amount* | | | | | | Value | |
| | | Corporate Bonds (continued) | | | | | | | | | | | | |
| | | Media (continued) | | | | | | | | | | | | |
| f | | Unitymedia KabelBW GmbH, senior bond, 144A, 6.125%, 1/15/25 | | | Germany | | | | 1,700,000 | | | | | | | $ | 1,755,250 | |
| f | | Univision Communications Inc., senior secured note, first lien, 144A, 5.125%, 2/15/25 | | | United States | | | | 2,500,000 | | | | | | | | 2,400,000 | |
| f | | Virgin Media Finance PLC, senior bond, 144A, 6.375%, 10/15/24 | | | United Kingdom | | | | 900,000 | | | | GBP | | | | 1,173,816 | |
| f | | Virgin Media Secured Finance PLC, senior secured bond, first lien, 144A, 5.50%, 1/15/25 | | | United Kingdom | | | | 1,900,000 | | | | | | | | 1,935,625 | |
| f | | Ziggo Secured Finance BV, senior secured bond, 144A, 4.25%, 1/15/27 | | | Netherlands | | | | 700,000 | | | | EUR | | | | 738,319 | |
| | | | | | | | | | | | | | | | | | |
| | | | | | | | | | | | | | | | | 29,816,528 | |
| | | | | | | | | | | | | | | | | | |
| | | Pharmaceuticals, Biotechnology & Life Sciences 1.6% | | | | | | | | | | | | |
| | Actavis Funding SCS, senior bond, 3.80%, 3/15/25 | | | United States | | | | 2,200,000 | | | | | | | | 2,203,630 | |
| | Baxalta Inc., senior note, 4.00%, 6/23/25 | | | United States | | | | 2,500,000 | | | | | | | | 2,508,475 | |
| | Biogen Inc., senior note, 3.625%, 9/15/22 | | | United States | | | | 1,500,000 | | | | | | | | 1,539,983 | |
| f | | Endo Finance LLC/Endo Ltd./Endo Finco Inc., | | | | | | | | | | | | | | | | |
| | senior bond, 144A, 6.00%, 2/01/25 | | | United States | | | | 1,200,000 | | | | | | | | 1,005,000 | |
| | senior note, 144A, 6.00%, 7/15/23 | | | United States | | | | 400,000 | | | | | | | | 353,000 | |
| f | | Jaguar Holding Co. II/Pharmaceutical Product Development LLC, senior note, 144A, 6.375%, 8/01/23 | | | United States | | | | 1,400,000 | | | | | | | | 1,501,500 | |
| f | | Valeant Pharmaceuticals International, senior note, 144A, 6.375%, 10/15/20 | | | United States | | | | 1,500,000 | | | | | | | | 1,296,090 | |
| f | | Valeant Pharmaceuticals International Inc., | | | | | | | | | | | | | | | | |
| | senior bond, 144A, 6.125%, 4/15/25 | | | United States | | | | 300,000 | | | | | | | | 226,500 | |
| | senior note, 144A, 5.50%, 3/01/23 | | | United States | | | | 400,000 | | | | | | | | 302,000 | |
| | | | | | | | | | | | | | | | | | |
| | | | | | | | | | | | | | | | | 10,936,178 | |
| | | | | | | | | | | | | | | | | | |
| | | Real Estate 0.8% | | | | | | | | | | | | |
| | American Tower Corp., senior bond, 3.375%, 10/15/26 | | | United States | | | | 2,400,000 | | | | | | | | 2,273,314 | |
| | Equinix Inc., senior bond, 5.375%, 4/01/23 | | | United States | | | | 2,500,000 | | | | | | | | 2,606,250 | |
| | MPT Operating Partnership LP/MPT Finance Corp., senior bond, 5.25%, 8/01/26 | | | United States | | | | 400,000 | | | | | | | | 393,000 | |
| | | | | | | | | | | | | | | | | | |
| | | | | | | | | | | | | | | | | 5,272,564 | |
| | | | | | | | | | | | | | | | | | |
| | | Retailing 0.6% | | | | | | | | | | | | |
| f,i | | Edcon Ltd., secured note, 144A, 9.50%, 3/01/18 | | | South Africa | | | | 1,800,000 | | | | EUR | | | | 293,564 | |
| | Home Depot Inc., senior note, 2.125%, 9/15/26 | | | United States | | | | 1,500,000 | | | | | | | | 1,383,220 | |
| | Netflix Inc., senior bond, 5.875%, 2/15/25 | | | United States | | | | 2,300,000 | | | | | | | | 2,486,875 | |
| | | | | | | | | | | | | | | | | | |
| | | | | | | | | | | | | | | | | 4,163,659 | |
| | | | | | | | | | | | | | | | | | |
| | | Semiconductors & Semiconductor Equipment 0.2% | | | | | | | | | | | | |
| | Qorvo Inc., senior bond, 7.00%, 12/01/25 | | | United States | | | | 1,400,000 | | | | | | | | 1,557,500 | |
| | | | | | | | | | | | | | | | | | |
| | | Software & Services 0.9% | | | | | | | | | | | | |
| f | | BMC Software Finance Inc., senior note, 144A, 8.125%, 7/15/21 | | | United States | | | | 2,000,000 | | | | | | | | 1,878,750 | |
| f | | First Data Corp., | | | | | | | | | | | | | | | | |
| | second lien, 144A, 5.75%, 1/15/24. | | | United States | | | | 2,100,000 | | | | | | | | 2,174,823 | |
| | senior note, 144A, 7.00%, 12/01/23 | | | United States | | | | 700,000 | | | | | | | | 747,250 | |
| | Fiserv Inc., senior bond, 3.85%, 6/01/25 | | | United States | | | | 600,000 | | | | | | | | 610,508 | |
| | Infor (U.S.) Inc., senior note, 6.50%, 5/15/22 | | | United States | | | | 1,000,000 | | | | | | | | 1,045,000 | |
| | | | | | | | | | | | | | | | | | |
| | | | | | | | | | | | | | | | | 6,456,331 | |
| | | | | | | | | | | | | | | | | | |
FRANKLIN TEMPLETON VARIABLE INSURANCE PRODUCTS TRUST
CONSOLIDATED STATEMENT OF INVESTMENTS
Franklin Strategic Income VIP Fund (continued)
| | | | | | | | | | | | | | | | | | |
| | | | | Country | | | Principal Amount* | | | | | | Value | |
| | | Corporate Bonds (continued) | | | | | | | | | | | | |
| | | Technology Hardware & Equipment 0.6% | | | | | | | | | | | | |
| f | | CommScope Technologies Finance LLC, senior bond, 144A, 6.00%, 6/15/25 | | | United States | | | | 1,000,000 | | | | | | | $ | 1,065,000 | |
| f | | Diamond 1 Finance Corp./Diamond 2 Finance Corp., | | | | | | | | | | | | | | | | |
| | senior note, 144A, 5.875%, 6/15/21 | | | United States | | | | 300,000 | | | | | | | | 319,194 | |
| | senior note, 144A, 7.125%, 6/15/24 | | | United States | | | | 200,000 | | | | | | | | 222,069 | |
| f | | Western Digital Corp., senior note, 144A, 10.50%, 4/01/24 | | | United States | | | | 2,000,000 | | | | | | | | 2,370,000 | |
| | | | | | | | | | | | | | | | | | |
| | | | | | | | | | | | | | | | | 3,976,263 | |
| | | | | | | | | | | | | | | | | | |
| | | Telecommunication Services 3.6% | | | | | | | | | | | | |
| | AT&T Inc., senior bond, 3.40%, 5/15/25 | | | United States | | | | 1,900,000 | | | | | | | | 1,832,151 | |
| | CenturyLink Inc., | | | | | | | | | | | | | | | | |
| | senior bond, 6.75%, 12/01/23 | | | United States | | | | 700,000 | | | | | | | | 718,375 | |
| | senior bond, 5.625%, 4/01/25 | | | United States | | | | 900,000 | | | | | | | | 858,375 | |
| | senior note, 6.45%, 6/15/21 | | | United States | | | | 500,000 | | | | | | | | 528,750 | |
| f | | Digicel Group Ltd., senior note, 144A, 8.25%, 9/30/20 | | | Bermuda | | | | 1,200,000 | | | | | | | | 1,030,200 | |
| f | | Digicel Ltd., senior note, 144A, 6.00%, 4/15/21 | | | Bermuda | | | | 1,000,000 | | | | | | | | 907,500 | |
| f | | Hughes Satellite Systems Corp., senior bond, 144A, 6.625%, 8/01/26 | | | United States | | | | 1,900,000 | | | | | | | | 1,914,250 | |
| | Intelsat Jackson Holdings SA, | | | | | | | | | | | | | | | | |
| | senior note, 7.25%, 10/15/20 | | | Luxembourg | | | | 1,000,000 | | | | | | | | 780,000 | |
| | senior note, 7.50%, 4/01/21 | | | Luxembourg | | | | 500,000 | | | | | | | | 383,750 | |
| f | | Millicom International Cellular SA, senior note, 144A, 6.625%, 10/15/21 | | | Luxembourg | | | | 2,200,000 | | | | | | | | 2,318,250 | |
| | Sprint Communications Inc., | | | | | | | | | | | | | | | | |
| | senior note, 6.00%, 11/15/22 | | | United States | | | | 500,000 | | | | | | | | 505,000 | |
| | f senior note, 144A, 9.00%, 11/15/18 | | | United States | | | | 400,000 | | | | | | | | 442,000 | |
| | f senior note, 144A, 7.00%, 3/01/20 | | | United States | | | | 800,000 | | | | | | | | 870,000 | |
| | Sprint Corp., senior bond, 7.875%, 9/15/23 | | | United States | | | | 500,000 | | | | | | | | 535,000 | |
| f | | Sprint Spectrum Co. LLC/Sprint Spectrum Co. II LLC, 144A, 3.36%, 3/20/23 | | | United States | | | | 1,800,000 | | | | | | | | 1,807,866 | |
| | T-Mobile USA Inc., | | | | | | | | | | | | | | | | |
| | senior bond, 6.50%, 1/15/24 | | | United States | | | | 500,000 | | | | | | | | 537,500 | |
| | senior bond, 6.375%, 3/01/25 | | | United States | | | | 1,300,000 | | | | | | | | 1,392,625 | |
| | senior note, 6.542%, 4/28/20 | | | United States | | | | 1,400,000 | | | | | | | | 1,443,750 | |
| | senior note, 6.125%, 1/15/22 | | | United States | | | | 200,000 | | | | | | | | 211,500 | |
| | senior note, 6.00%, 4/15/24 | | | United States | | | | 200,000 | | | | | | | | 211,250 | |
| | Verizon Communications Inc., senior note, 5.15%, 9/15/23 | | | United States | | | | 2,000,000 | | | | | | | | 2,212,336 | |
| f | | Wind Acquisition Finance SA, | | | | | | | | | | | | | | | | |
| | senior secured note, 144A, 4.00%, 7/15/20 | | | Italy | | | | 1,200,000 | | | | EUR | | | | 1,289,162 | |
| | senior secured note, 144A, 7.00%, 4/23/21 | | | Italy | | | | 1,500,000 | | | | EUR | | | | 1,645,788 | |
| | | | | | | | | | | | | | | | | | |
| | | | | | | | | | | | | | | | | 24,375,378 | |
| | | | | | | | | | | | | | | | | | |
| | | Transportation 0.6% | | | | | | | | | | | | |
| | FedEx Corp., senior bond, 3.25%, 4/01/26 | | | United States | | | | 1,800,000 | | | | | | | | 1,788,601 | |
| f | | Florida East Coast Holdings Corp., | | | | | | | | | | | | | | | | |
| | secured note, first lien, 144A, 6.75%, 5/01/19 | | | United States | | | | 900,000 | | | | | | | | 933,750 | |
| | senior note, 144A, 9.75%, 5/01/20 | | | United States | | | | 400,000 | | | | | | | | 413,000 | |
| f | | Stena International SA, senior secured bond, first lien, 144A, 5.75%, 3/01/24 | | | Sweden | | | | 300,000 | | | | | | | | 261,885 | |
| | United Airlines Pass Through Trust, second lien, 2016-1, A, 3.45%, 1/07/30 | | | United States | | | | 1,000,000 | | | | | | | | 973,750 | |
| | | | | | | | | | | | | | | | | | |
| | | | | | | | | | | | | | | | | 4,370,986 | |
| | | | | | | | | | | | | | | | | | |
FRANKLIN TEMPLETON VARIABLE INSURANCE PRODUCTS TRUST
CONSOLIDATED STATEMENT OF INVESTMENTS
Franklin Strategic Income VIP Fund (continued)
| | | | | | | | | | | | | | |
| | | | | Country | | | Principal Amount* | | | Value | |
| | | Corporate Bonds (continued) | | | | | | | | | |
| | | Utilities 2.4% | | | | | | | | | |
| | Calpine Corp., | | | | | | | | | | | | |
| | senior bond, 5.75%, 1/15/25 | | | United States | | | | 1,200,000 | | | $ | 1,164,000 | |
| | senior note, 5.375%, 1/15/23 | | | United States | | | | 1,300,000 | | | | 1,277,250 | |
| | Dominion Resources Inc., senior bond, 2.85%, 8/15/26 | | | United States | | | | 1,100,000 | | | | 1,030,428 | |
| f | | Dynegy Inc., senior note, 144A, 8.00%, 1/15/25 | | | United States | | | | 1,700,000 | | | | 1,593,750 | |
| f,h | | EDF SA, sub. note, 144A, 5.25% to 1/29/23, FRN thereafter, Perpetual | | | France | | | | 3,000,000 | | | | 2,841,135 | |
| | Exelon Corp., senior bond, 3.95%, 6/15/25 | | | United States | | | | 1,800,000 | | | | 1,851,336 | |
| f | | InterGen NV, secured bond, 144A, 7.00%, 6/30/23 | | | Netherlands | | | | 2,500,000 | | | | 2,237,500 | |
| | Sempra Energy, | | | | | | | | | | | | |
| | senior bond, 3.55%, 6/15/24 | | | United States | | | | 700,000 | | | | 708,711 | |
| | senior note, 3.75%, 11/15/25 | | | United States | | | | 1,100,000 | | | | 1,111,703 | |
| | The Southern Co., senior bond, 3.25%, 7/01/26 | | | United States | | | | 2,800,000 | | | | 2,726,528 | |
| | | | | | | | | | | | | | |
| | | | | | | | | | | | | 16,542,341 | |
| | | | | | | | | | | | | | |
| | | | |
| | Total Corporate Bonds (Cost $296,091,028) | | | | | | | | | | | 289,280,411 | |
| | | | | | | | | | | | | | |
| | | | |
| l,m | | Senior Floating Rate Interests 10.6% | | | | | | | | | | | | |
| | | Automobiles & Components 0.3% | | | | | | | | | |
| | TI Group Automotive Systems LLC, Initial U.S. Term Loan, 4.50%, 6/25/22 | | | United States | | | | 2,256,567 | | | | 2,290,416 | |
| | | | | | | | | | | | | | |
| | | Capital Goods 0.1% | | | | | | | | | |
| | Doncasters U.S. Finance LLC, Second Lien Term Loan, 9.50%, 10/09/20 | | | United States | | | | 76,701 | | | | 72,866 | |
| | Harsco Corp., Initial Term Loan, 6.00%, 11/02/23 | | | United States | | | | 233,757 | | | | 239,016 | |
| | Leidos (Abacus Innovations Corp.), B Term Loan, 3.52%, 8/16/23 | | | United States | | | | 161,767 | | | | 163,425 | |
| | Ventia Pty. Ltd., 2016 Refinancing Term B Loans, 5.00%, 5/21/22 | | | Australia | | | | 83,582 | | | | 85,045 | |
| | | | | | | | | | | | | | |
| | | | | | | | | | | | | 560,352 | |
| | | | | | | | | | | | | | |
| | | Commercial & Professional Services 0.1% | | | | | | | | | |
| | Kar Auction Services Inc., Tranche B-3 Term Loan, 4.50%, 3/09/23 | | | United States | | | | 884,379 | | | | 897,777 | |
| | | | | | | | | | | | | | |
| | | Consumer Services 0.7% | | | | | | | | | |
| | Aristocrat Technologies Inc., Term B-1 Loans, 3.631%, 10/20/21 | | | United States | | | | 175,670 | | | | 177,734 | |
| | Fitness International LLC, Term B Loan, 6.00%, 7/01/20 | | | United States | | | | 2,949,582 | | | | 2,956,588 | |
| | Prime Security Services Borrower LLC, Term B-1 Loans, 4.25%, 5/02/22 | | | United States | | | | 671,175 | | | | 679,900 | |
| c,j | | Turtle Bay Holdings LLC, Term Loan B, PIK, 3.375%, 6/30/17 | | | United States | | | | 1,116,321 | | | | 1,106,553 | |
| | | | | | | | | | | | | | |
| | | | | | | | | | | | | 4,920,775 | |
| | | | | | | | | | | | | | |
| | | Diversified Financials 0.1% | | | | | | | | | |
| | First Eagle Investment Management, Initial Term Loans, 4.998%, 12/01/22 | | | United States | | | | 497,673 | | | | 503,272 | |
| | Russell Investments US Institutional Holdco Inc., Initial Term Loan, 6.75%, 6/01/23 | | | United States | | | | 332,494 | | | | 336,131 | |
| | | | | | | | | | | | | | |
| | | | | | | | | | | | | 839,403 | |
| | | | | | | | | | | | | | |
| | | Energy 1.7% | | | | | | | | | |
| c | | Bowie Resource Holdings LLC, | | | | | | | | | | | | |
| | First Lien Initial Term Loan, 6.75%, 8/16/20 | | | United States | | | | 2,743,341 | | | | 2,565,023 | |
| | Second Lien Initial Term Loan, 11.75%, 2/16/21 | | | United States | | | | 1,248,332 | | | | 1,104,774 | |
| | Fieldwood Energy LLC, Loans, 3.875%, 10/01/18 | | | United States | | | | 3,706,974 | | | | 3,540,160 | |
| | Foresight Energy LLC, Term Loans, 6.50%, 8/23/20 | | | United States | | | | 1,361,696 | | | | 1,320,845 | |
| | International Seaways Inc., Initial Term Loan, 5.75%, 8/05/19 | | | United States | | | | 1,674,189 | | | | 1,632,335 | |
| | McDermott Finance LLC, Term Loan, 8.484%, 4/16/19 | | | United States | | | | 147,487 | | | | 149,699 | |
| | OSG Bulk Ships Inc., Initial Term Loan, 5.25%, 8/05/19 | | | United States | | | | 990,091 | | | | 965,958 | |
| | | | | | | | | | | | | | |
| | | | | | | | | | | | | 11,278,794 | |
| | | | | | | | | | | | | | |
FRANKLIN TEMPLETON VARIABLE INSURANCE PRODUCTS TRUST
CONSOLIDATED STATEMENT OF INVESTMENTS
Franklin Strategic Income VIP Fund (continued)
| | | | | | | | | | | | | | |
| | | | | Country | | | Principal Amount* | | | Value | |
| l,m | | Senior Floating Rate Interests (continued) | | | | | | | | | |
| | | Health Care Equipment & Services 0.4% | | | | | | | | | |
| | Carestream Health Inc., Term Loan, 5.00%, 6/07/19 | | | United States | | | | 485,294 | | | $ | 473,647 | |
| | Community Health Systems Inc., 2018 Term F Loans, 6.00%, 12/31/18 | | | United States | | | | 1,968,071 | | | | 1,940,086 | |
| | | | | | | | | | | | | | |
| | | | | | | | | | | | | 2,413,733 | |
| | | | | | | | | | | | | | |
| | | Household & Personal Products 0.0%† | | | | | | | | | |
| | Spectrum Brands Inc., Term Loans, 3.313% - 3.368%, 6/23/22 | | | United States | | | | 36,413 | | | | 36,878 | |
| | | | | | | | | | | | | | |
| | | Materials 1.1% | | | | | | | | | |
| | The Chemours Co. LLC, Tranche B Term Loan, 3.77%, 5/12/22 | | | United States | | | | 3,421,536 | | | | 3,420,468 | |
| | Cyanco Intermediate Corp., Initial Term Loan, 5.50%, 5/01/20 | | | United States | | | | 773,633 | | | | 777,985 | |
| | FMG America Finance Inc. (Fortescue Metals Group), Loans, 3.75%, 6/30/19 | | | Australia | | | | 964,493 | | | | 967,628 | |
| | Huntsman International LLC, 2015 Extended Term B Dollar Loan, 3.732% - 3.77%, 4/19/19 | | | United States | | | | 149,602 | | | | 150,474 | |
| | Novelis Inc., Initial Term Loan, 4.02%, 6/02/22 | | | Canada | | | | 790,028 | | | | 795,178 | |
| | OCI Beaumont LLC, Term B-3 Loan, 8.025%, 8/20/19 | | | United States | | | | 942,579 | | | | 961,431 | |
| | | | | | | | | | | | | | |
| | | | | | | | | | | | | 7,073,164 | |
| | | | | | | | | | | | | | |
| | | Media 1.5% | | | | | | | | | |
| | Altice U.S. Finance I Corp., 2016 Refinancing Term Loans, 3.882%, 1/01/25 | | | United States | | | | 200,610 | | | | 203,243 | |
| | AMC Entertainment Holdings Inc., | | | | | | | | | | | | |
| | 2016 Incremental Term Loan, 3.511%, 12/15/23 | | | United States | | | | 77,919 | | | | 78,771 | |
| | Initial Term Loans, 3.399%, 12/15/22 | | | United States | | | | 121,898 | | | | 123,270 | |
| | Charter Communications Operating LLC (CCO Safari), Term A Loan, 2.61%, 5/18/21 | | | United States | | | | 994,500 | | | | 992,842 | |
| | CSC Holdings Inc. (Cablevision), 2016 Extended Term Loans, 3.876%, 10/11/24 | | | United States | | | | 1,237,293 | | | | 1,252,566 | |
| | Lions Gate Entertainment Corp., Term A Loan, 3.145%, 12/08/21 | | | United States | | | | 541,797 | | | | 541,542 | |
| | Live Nation Entertainment Inc., Term B-2 Loans, 3.313%, 10/31/23 | | | United States | | | | 77,724 | | | | 78,599 | |
| | Radio One Inc., Term Loan B, 5.27%, 12/31/18 | | | United States | | | | 6,764,825 | | | | 6,832,473 | |
| | UPC Financing Partnership, Facility AN, 4.08%, 8/31/24 | | | Netherlands | | | | 303,920 | | | | 307,377 | |
| | | | | | | | | | | | | | |
| | | | | | | | | | | | | 10,410,683 | |
| | | | | | | | | | | | | | |
| | | Pharmaceuticals, Biotechnology & Life Sciences 1.5% | | | | | | | | | |
| | Endo Luxembourg Finance Co. I S.A.R.L. and Endo LLC, 2015 Incremental Term B Loans, 3.813%, 9/25/22 | | | United States | | | | 2,773,858 | | | | 2,788,812 | |
| | Grifols Worldwide Operations USA Inc., U.S. Tranche B Term Loan, 3.715%, 2/27/21 | | | United States | | | | 2,724,813 | | | | 2,747,082 | |
| | RPI Finance Trust, Term A-2 Term Loan A, 3.248%, 10/14/20 | | | United States | | | | 369,184 | | | | 370,031 | |
| | Valeant Pharmaceuticals International Inc., | | | | | | | | | | | | |
| | n Series A-3 Tranche A Term Loan, 4.52%, 10/20/18 | | | United States | | | | 2,369,117 | | | | 2,365,663 | |
| | Series C-2 Tranche B Term Loan, 5.25%, 12/11/19 | | | United States | | | | 795,535 | | | | 795,700 | |
| | Series D-2 Tranche B Term Loan, 5.00%, 2/13/19 | | | United States | | | | 1,291,880 | | | | 1,291,880 | |
| | | | | | | | | | | | | | |
| | | | | | | | | | | | | 10,359,168 | |
| | | | | | | | | | | | | | |
| | | Retailing 0.6% | | | | | | | | | |
| | Ascena Retail Group Inc., Tranche B Term Loan, 5.25%, 8/21/22 | | | United States | | | | 3,436,848 | | | | 3,356,656 | |
| | Dollar Tree Inc., Term A-1 Loans, 2.50%, 7/06/20 | | | United States | | | | 550,670 | | | | 550,499 | |
| | PetSmart Inc., Tranche B-2 Loans, 4.00%, 3/11/22 | | | United States | | | | 347,355 | | | | 349,072 | |
| | | | | | | | | | | | | | |
| | | | | | | | | | | | | 4,256,227 | |
| | | | | | | | | | | | | | |
FRANKLIN TEMPLETON VARIABLE INSURANCE PRODUCTS TRUST
CONSOLIDATED STATEMENT OF INVESTMENTS
Franklin Strategic Income VIP Fund (continued)
| | | | | | | | | | | | | | | | | | |
| | | | | Country | | | Principal Amount* | | | | | | Value | |
| l,m | | Senior Floating Rate Interests (continued) | | | | | | | | | | | | |
| | | Semiconductors & Semiconductor Equipment 0.8% | | | | | | | | | | | | |
| | Avago Technologies Cayman Finance Ltd., Term B-3 Loans, 3.704%, 2/01/23 | | | Singapore | | | | 1,913,319 | | | | | | | $ | 1,942,617 | |
| | MACOM Technology Solutions Holdings Inc., Initial Term Loan, 4.628%, 5/07/21 | | | United States | | | | 765,359 | | | | | | | | 773,969 | |
| | MKS Instruments Inc., Tranche B-2 Term Loans, 3.52%, 5/01/23 | | | United States | | | | 471,975 | | | | | | | | 476,302 | |
| | ON Semiconductor Corp., 2016 Replacement Term Loans, 4.02%, 3/31/23 | | | United States | | | | 2,457,908 | | | | | | | | 2,490,338 | |
| | | | | | | | | | | | | | | | | | |
| | | | | | | | | | | | | | | | | 5,683,226 | |
| | | | | | | | | | | | | | | | | | |
| | | Software & Services 0.8% | | | | | | | | | | | | |
| | Global Payments Inc., Delayed Draw Term Loan (A-2), 2.965%, 10/31/21 | | | United States | | | | 1,114,982 | | | | | | | | 1,117,769 | |
| | MoneyGram International Inc., Term Loan, 4.25%, 3/27/20 | | | United States | | | | 4,201,324 | | | | | | | | 4,150,559 | |
| | Rackspace Hosting Inc., Term B Loan, 5.00%, 11/03/23 | | | United States | | | | 389,595 | | | | | | | | 394,660 | |
| | | | | | | | | | | | | | | | | | |
| | | | | | | | | | | | | | | | | 5,662,988 | |
| | | | | | | | | | | | | | | | | | |
| | | Technology Hardware & Equipment 0.4% | | | | | | | | | | | | |
| | Ciena Corp., Term Loan, 3.75%, 7/15/19 | | | United States | | | | 225,222 | | | | | | | | 226,630 | |
| | Dell International LLC, Term A-3 Loan, 2.77%, 12/31/18 | | | United States | | | | 971,147 | | | | | | | | 971,299 | |
| | Western Digital Corp., Term Loan B-1, 4.52%, 4/29/23 | | | United States | | | | 948,699 | | | | | | | | 963,100 | |
| | Zebra Technologies Corp., Second Amendment Refinancing Term Loan, 3.446%, 10/27/21 | | | United States | | | | 329,593 | | | | | | | | 333,146 | |
| | | | | | | | | | | | | | | | | | |
| | | | | | | | | | | | | | | | | 2,494,175 | |
| | | | | | | | | | | | | | | | | | |
| | | Telecommunication Services 0.1% | | | | | | | | | | | | |
| | Consolidated Communications Inc., Initial Term Loan, 4.00%, 10/05/23 | | | United States | | | | 239,662 | | | | | | | | 241,535 | |
| | Global Tel*Link Corp., Term Loan, 5.00%, 5/23/20 | | | United States | | | | 280,668 | | | | | | | | 279,264 | |
| | | | | | | | | | | | | | | | | | |
| | | | | | | | | | | | | | | | | 520,799 | |
| | | | | | | | | | | | | | | | | | |
| | | Transportation 0.2% | | | | | | | | | | | | |
| | Air Canada, Term Loan, 3.614%, 10/06/23 | | | Canada | | | | 49,550 | | | | | | | | 49,943 | |
| | Navios Maritime Midstream Partners LP, Initial Term Loan, 5.50%, 6/18/20 | | | Marshall Islands | | | | 1,285,559 | | | | | | | | 1,279,131 | |
| | Navios Maritime Partners LP, Initial Term Loan, 5.25%, 6/27/18 | | | Marshall Islands | | | | 61,049 | | | | | | | | 59,370 | |
| | XPO Logistics Inc., Refinancing Term Loans, 4.25%, 10/30/21 | | | United States | | | | 93,651 | | | | | | | | 94,962 | |
| | | | | | | | | | | | | | | | | | |
| | | | | | | | | | | | | | | | | 1,483,406 | |
| | | | | | | | | | | | | | | | | | |
| | | Utilities 0.2% | | | | | | | | | | | | |
| | EFS Cogen Holdings I LLC (Linden), Term B Advance, 4.50%, 6/28/23 | | | United States | | | | 175,698 | | | | | | | | 177,638 | |
| | NRG Energy Inc., Term Loans, 3.748%, 6/30/23 | | | United States | | | | 865,650 | | | | | | | | 875,659 | |
| | | | | | | | | | | | | | | | | | |
| | | | | | | | | | | | | | | | | 1,053,297 | |
| | | | | | | | | | | | | | | | | | |
| | | | | |
| | Total Senior Floating Rate Interests (Cost $71,699,738) | | | | | | | | | | | | | | | 72,235,261 | |
| | | | | | | | | | | | | | | | | | |
| | | | | |
| | Foreign Government and Agency Securities 9.7% | | | | | | | | | | | | | | | | |
| | Government of Hungary, senior note, 6.25%, 1/29/20 | | | Hungary | | | | 1,500,000 | | | | | | | | 1,643,895 | |
| | Government of Indonesia, | | | | | | | | | | | | | | | | |
| | 6.125%, 5/15/28 | | | Indonesia | | | | 34,000,000,000 | | | | IDR | | | | 2,132,494 | |
| | FR34, 12.80%, 6/15/21 | | | Indonesia | | | | 17,235,000,000 | | | | IDR | | | | 1,523,071 | |
| | senior bond, FR53, 8.25%, 7/15/21 | | | Indonesia | | | | 46,000,000,000 | | | | IDR | | | | 3,508,259 | |
| | senior bond, FR70, 8.375%, 3/15/24 | | | Indonesia | | | | 26,500,000,000 | | | | IDR | | | | 2,016,144 | |
| | Government of Malaysia, | | | | | | | | | | | | | | | | |
| | 3.80%, 8/17/23 | | | Malaysia | | | | 21,100,000 | | | | MYR | | | | 4,626,290 | |
| | senior bond, 3.814%, 2/15/17 | | | Malaysia | | | | 2,500,000 | | | | MYR | | | | 557,863 | |
| | senior bond, 4.24%, 2/07/18 | | | Malaysia | | | | 1,800,000 | | | | MYR | | | | 405,405 | |
| | senior note, 3.394%, 3/15/17 | | | Malaysia | | | | 16,000,000 | | | | MYR | | | | 3,569,719 | |
FRANKLIN TEMPLETON VARIABLE INSURANCE PRODUCTS TRUST
CONSOLIDATED STATEMENT OF INVESTMENTS
Franklin Strategic Income VIP Fund (continued)
| | | | | | | | | | | | | | | | | | |
| | | | | Country | | | Principal Amount* | | | | | | Value | |
| | | Foreign Government and Agency Securities (continued) | | | | | | | |
| | Government of Malaysia, (continued) | | | | | | | | | | | | | | | | |
| | senior note, 4.012%, 9/15/17 | | | Malaysia | | | | 23,400,000 | | | | MYR | | | $ | 5,247,891 | |
| | Government of Mexico, | | | | | | | | | | | | | | | | |
| | 7.75%, 12/14/17 | | | Mexico | | | | 345,000 | o | | | MXN | | | | 1,685,802 | |
| | senior note, 8.50%, 12/13/18 | | | Mexico | | | | 1,405,000 | o | | | MXN | | | | 6,977,910 | |
| | senior note, M, 5.00%, 6/15/17 | | | Mexico | | | | 750,000 | o | | | MXN | | | | 3,597,005 | |
| f | | Government of Serbia, | | | | | | | | | | | | | | | | |
| | senior note, 144A, 4.875%, 2/25/20 | | | Serbia | | | | 4,000,000 | | | | | | | | 4,073,260 | |
| | senior note, 144A, 7.25%, 9/28/21 | | | Serbia | | | | 200,000 | | | | | | | | 223,529 | |
| | Government of the Philippines, senior note, 3-21, 2.875%, 5/22/17 | | | Philippines | | | | 77,000,000 | | | | PHP | | | | 1,554,067 | |
| f | | Government of Ukraine, | | | | | | | | | | | | | | | | |
| | 144A, 7.75%, 9/01/22 | | | Ukraine | | | | 200,000 | | | | | | | | 194,000 | |
| | 144A, 7.75%, 9/01/23 | | | Ukraine | | | | 369,000 | | | | | | | | 354,240 | |
| | 144A, 7.75%, 9/01/24 | | | Ukraine | | | | 369,000 | | | | | | | | 350,550 | |
| | 144A, 7.75%, 9/01/25 | | | Ukraine | | | | 369,000 | | | | | | | | 347,369 | |
| | 144A, 7.75%, 9/01/26 | | | Ukraine | | | | 369,000 | | | | | | | | 346,860 | |
| | 144A, 7.75%, 9/01/27 | | | Ukraine | | | | 369,000 | | | | | | | | 344,724 | |
| | a,p 144A, VRI, GDP Linked Securities, 5/31/40 | | | Ukraine | | | | 1,952,000 | | | | | | | | 595,360 | |
| q | | Government of Uruguay, senior bond, Index Linked, 4.375%, 12/15/28 | | | Uruguay | | | | 197,375,446 | | | | UYU | | | | 6,189,748 | |
| | Nota Do Tesouro Nacional, | | | | | | | | | | | | | | | | |
| | 10.00%, 1/01/21 | | | Brazil | | | | 5,000 | r | | | BRL | | | | 1,480,379 | |
| | 10.00%, 1/01/23 | | | Brazil | | | | 4,000 | r | | | BRL | | | | 1,158,715 | |
| | s Index Linked, 6.00%, 8/15/18 | | | Brazil | | | | 5,525 | r | | | BRL | | | | 5,024,597 | |
| | s Index Linked, 6.00%, 5/15/23 | | | Brazil | | | | 3,350 | r | | | BRL | | | | 3,055,753 | |
| | senior note, 10.00%, 1/01/17 | | | Brazil | | | | 7,500 | r | | | BRL | | | | 2,303,925 | |
| q | | Uruguay Notas del Tesoro, 18, Index Linked, 2.25%, 8/23/17 | | | Uruguay | | | | 30,972,991 | | | | UYU | | | | 1,029,793 | |
| | | | | | | | | | | | | | | | | | |
| | | | | |
| | Total Foreign Government and Agency Securities (Cost $75,561,243) | | | | | | | | | | | | | | | 66,118,617 | |
| | | | | | | | | | | | | | | | | | |
| | | | | |
| | U.S. Government and Agency Securities 5.3% | | | | | | | | | | | | | | | | |
| | U.S. Treasury Bond, | | | | | | | | | | | | | | | | |
| | 7.875%, 2/15/21 | | | United States | | | | 900,000 | | | | | | | | 1,115,959 | |
| | 6.50%, 11/15/26 | | | United States | | | | 2,400,000 | | | | | | | | 3,246,336 | |
| | q Index Linked, 0.625%, 1/15/24 | | | United States | | | | 4,931,132 | | | | | | | | 5,021,248 | |
| | q Index Linked, 2.375%, 1/15/25 | | | United States | | | | 3,077,647 | | | | | | | | 3,535,715 | |
| | U.S. Treasury Note, | | | | | | | | | | | | | | | | |
| | 4.625%, 2/15/17 | | | United States | | | | 600,000 | | | | | | | | 602,952 | |
| | 3.75%, 11/15/18 | | | United States | | | | 7,000,000 | | | | | | | | 7,333,809 | |
| | 2.75%, 2/15/24 | | | United States | | | | 4,000,000 | | | | | | | | 4,126,956 | |
| | q Index Linked, 0.125%, 7/15/24 | | | United States | | | | 8,673,336 | | | | | | | | 8,526,748 | |
| | q Index Linked, 0.625%, 7/15/21 | | | United States | | | | 1,715,965 | | | | | | | | 1,771,776 | |
| | q Index Linked, 2.125%, 1/15/19 | | | United States | | | | 788,094 | | | | | | | | 832,948 | |
| | | | | | | | | | | | | | | | | | |
| | | | | |
| | Total U.S. Government and Agency Securities
(Cost $36,391,662) | | | | | | | | | | | | | | | 36,114,447 | |
| | | | | | | | | | | | | | | | | | |
FRANKLIN TEMPLETON VARIABLE INSURANCE PRODUCTS TRUST
CONSOLIDATED STATEMENT OF INVESTMENTS
Franklin Strategic Income VIP Fund (continued)
| | | | | | | | | | | | | | |
| | | | | Country | | | Principal Amount* | | | Value | |
| | Asset-Backed Securities and Commercial Mortgage- Backed Securities 9.7% | | | | | | | | | | | | |
| | | Banks 1.7% | | | | | | | | | |
| | Banc of America Commercial Mortgage Trust, 2006-4, AJ, 5.695%, 7/10/46 | | | United States | | | | 798,617 | | | $ | 797,306 | |
| l | | Bear Stearns ARM Trust, 2004-4, A6, FRN, 3.122%, 6/25/34 | | | United States | | | | 1,442,429 | | | | 1,458,740 | |
| | Bear Stearns Commercial Mortgage Securities Trust, | | | | | | | | | | | | |
| | l 2006-PW11, AJ, FRN, 5.436%, 3/11/39 | | | United States | | | | 1,000,000 | | | | 961,650 | |
| | 2006-PW13, AJ, 5.611%, 9/11/41 | | | United States | | | | 244,126 | | | | 243,958 | |
| l | | Citibank Credit Card Issuance Trust, | | | | | | | | | | | | |
| | 2013-A2, A2, FRN, 1.036%, 5/26/20 | | | United States | | | | 650,000 | | | | 650,839 | |
| | 2013-A4, A4, FRN, 1.176%, 7/24/20 | | | United States | | | | 710,000 | | | | 712,500 | |
| | Citigroup Commercial Mortgage Trust, | | | | | | | | | | | | |
| | 2006-C5, AJ, 5.482%, 10/15/49 | | | United States | | | | 1,408,176 | | | | 1,321,959 | |
| | l 2007-C6, AM, FRN, 5.714%, 12/10/49 | | | United States | | | | 1,700,000 | | | | 1,724,557 | |
| l | | Commercial Mortgage Trust, 2006-GG7, AJ, FRN, 5.774%, 7/10/38 | | | United States | | | | 1,215,000 | | | | 1,127,435 | |
| | CSAIL Commercial Mortgage Trust, 2015-C1, A4, 3.505%, 4/15/50 | | | United States | | | | 915,000 | | | | 940,723 | |
| l | | CWABS Asset-Backed Certificates Trust, 2005-11, AF4, FRN, 4.724%, 3/25/34 | | | United States | | | | 1,275,000 | | | | 1,288,685 | |
| l | | Merrill Lynch Mortgage Investors Trust, 2005-A6, 2A3, FRN, 1.136%, 8/25/35 | | | United States | | | | 219,441 | | | | 212,300 | |
| l | | Morgan Stanley Capital I Trust, 2006-HQ8, AJ, FRN, 5.46%, 3/12/44 | | | United States | | | | 47,700 | | | | 47,930 | |
| | | | | | | | | | | | | | |
| | | | | | | | | | | | | 11,488,582 | |
| | | | | | | | | | | | | | |
| | | Diversified Financials 8.0% | | | | | | | | | |
| f,l | | Ares Enhanced Loan Investment Strategy IR Ltd., 2013-IRAR, A2A, 144A, FRN, 2.782%, 7/23/25 | | | Cayman Islands | | | | 740,000 | | | | 740,466 | |
| f,l | | Atrium VIII, | | | | | | | | | | | | |
| | 8A, BR, 144A, FRN, 2.764%, 10/23/24 | | | Cayman Islands | | | | 350,000 | | | | 350,479 | |
| | 8A, CR, 144A, FRN, 3.364%, 10/23/24 | | | Cayman Islands | | | | 470,000 | | | | 470,324 | |
| f,l | | Atrium X, 10A, C, 144A, FRN, 3.48%, 7/16/25 | | | United States | | | | 1,400,000 | | | | 1,398,040 | |
| f,l | | Atrium XI, 11A, C, 144A, FRN, 4.082%, 10/23/25 | | | Cayman Islands | | | | 1,820,000 | | | | 1,820,601 | |
| | Banc of America Commercial Mortgage Trust, | | | | | | | | | | | | |
| | 2015-UBS7, A3, 3.441%, 9/15/48 | | | United States | | | | 1,050,000 | | | | 1,075,799 | |
| | 2015-UBS7, A4, 3.705%, 9/15/48 | | | United States | | | | 1,170,000 | | | | 1,219,669 | |
| l | | Bank of America Credit Card Trust, 2005-A1, A, FRN, 1.034%, 6/15/20 | | | United States | | | | 800,000 | | | | 801,245 | |
| f,l | | BCAP LLC Trust, 2009-RR1, 2A2, 144A, FRN, 3.059%, 5/26/35 | | | United States | | | | 440,000 | | | | 416,095 | |
| f | | BlueMountain CLO Ltd., | | | | | | | | | | | | |
| | l 2012-2A, BR, 144A, FRN, 2.784%, 11/20/28 | | | Cayman Islands | | | | 510,000 | | | | 510,699 | |
| | 2012-2A, CR, 144A, 3.484%, 11/20/28 | | | Cayman Islands | | | | 270,000 | | | | 270,640 | |
| f,l | | Burnham Park CLO Ltd., | | | | | | | | | | | | |
| | 2016-1A, A, 144A, FRN, 2.318%, 10/20/29 | | | Cayman Islands | | | | 350,000 | | | | 349,951 | |
| | 2016-1A, B, 144A, FRN, 2.658%, 10/20/29 | | | Cayman Islands | | | | 460,000 | | | | 458,261 | |
| | 2016-1A, C, 144A, FRN, 3.258%, 10/20/29 | | | Cayman Islands | | | | 460,000 | | | | 456,605 | |
| l | | Capital One Multi-Asset Execution Trust, | | | | | | | | | | | | |
| | 2014-A3, A3, FRN, 1.084%, 1/18/22 | | | United States | | | | 370,000 | | | | 370,334 | |
| | 2016-A1, A1, FRN, 1.154%, 2/15/22 | | | United States | | | | 2,950,000 | | | | 2,963,397 | |
| | 2016-A2, A2, FRN, 1.334%, 2/15/24 | | | United States | | | | 3,990,000 | | | | 4,018,260 | |
| f,l | | Carlyle Global Market Strategies CLO Ltd., | | | | | | | | | | | | |
| | 2012-4A, BR, 144A, FRN, 2.78%, 1/20/29 | | | United States | | | | 500,000 | | | | 493,552 | |
| | 2012-4A, C1R, 144A, FRN, 3.48%, 1/20/29 | | | United States | | | | 480,000 | | | | 481,363 | |
| f,l | | Catamaran CLO Ltd., | | | | | | | | | | | | |
| | 2013-1A, C, 144A, FRN, 3.486%, 1/27/25 | | | United States | | | | 1,130,000 | | | | 1,121,344 | |
| | 2014-2A, BR, 144A, FRN, 3.658%, 10/18/26 | | | Cayman Islands | | | | 1,550,000 | | | | 1,554,557 | |
FRANKLIN TEMPLETON VARIABLE INSURANCE PRODUCTS TRUST
CONSOLIDATED STATEMENT OF INVESTMENTS
Franklin Strategic Income VIP Fund (continued)
| | | | | | | | | | | | | | |
| | | | | Country | | | Principal Amount* | | | Value | |
| | | Asset-Backed Securities and Commercial Mortgage-
Backed Securities (continued) | | | | | | | | | |
| | | Diversified Financials (continued) | | | | | | | | | |
| f,l | | Cent CDO Ltd., 2007-15A, A2B, 144A, FRN, 1.293%, 3/11/21 | | | United States | | | | 1,251,000 | | | $ | 1,219,700 | |
| f,l | | Cent CLO LP, | | | | | | | | | | | | |
| | 2013-17A, B, 144A, FRN, 3.887%, 1/30/25 | | | United States | | | | 784,314 | | | | 786,824 | |
| | 2014-22A, A2AR, 144A, FRN, 2.831%, 11/07/26 | | | Cayman Islands | | | | 392,000 | | | | 391,963 | |
| | 2014-22A, BR, 144A, FRN, 3.831%, 11/07/26 | | | Cayman Islands | | | | 340,000 | | | | 337,309 | |
| l | | Chase Issuance Trust, | | | | | | | | | | | | |
| | 2012-A10, A10, FRN, 0.964%, 12/16/19 | | | United States | | | | 470,000 | | | | 470,593 | |
| | 2013-A6, A6, FRN, 1.124%, 7/15/20 | | | United States | | | | 1,090,000 | | | | 1,094,032 | |
| f,l | | CIFC Funding Ltd., 2007-3A, A1J, 144A, FRN, 1.284%, 7/26/21 | | | United States | | | | 669,704 | | | | 669,228 | |
| f,l | | Cole Park CLO Ltd., 15-1A, B, 144A, FRN, 3.131%, 10/20/28 | | | Cayman Islands | | | | 270,000 | | | | 270,873 | |
| f | | Core Industrial Trust, 2015-CALW, A, 144A, 3.04%, 2/10/34 | | | United States | | | | 1,410,000 | | | | 1,438,804 | |
| f,l | | Cumberland Park CLO Ltd., | | | | | | | | | | | | |
| | 2015-2A, B, 144A, FRN, 2.981%, 7/20/26 | | | United States | | | | 1,080,000 | | | | 1,084,396 | |
| | 2015-2A, C, 144A, FRN, 3.731%, 7/20/26 | | | United States | | | | 190,000 | | | | 189,683 | |
| l | | Discover Card Execution Note Trust, 2016-A2, A2, FRN, 1.244%, 9/15/21 | | | United States | | | | 2,950,000 | | | | 2,968,834 | |
| f,l | | Dryden 33 Senior Loan Fund, | | | | | | | | | | | | |
| | 2014-33A, BR, 144A, FRN, 2.636%, 10/15/28 | | | Cayman Islands | | | | 535,000 | | | | 535,455 | |
| | 2014-33A, CR, 144A, FRN, 3.286%, 10/15/28 | | | United States | | | | 270,000 | | | | 270,543 | |
| f,l | | Dryden 34 Senior Loan Fund, 2014-34A, B, 144A, FRN, 2.78%, 10/15/26 | | | Cayman Islands | | | | 500,000 | | | | 501,035 | |
| f,l | | Dryden XXV Senior Loan Fund, 2012-25A, CR, 144A, FRN, 3.354%, 1/15/25 | | | Cayman Islands | | | | 378,000 | | | | 377,951 | |
| f,l | | Dryden XXVIII Senior Loan Fund, 2013-28A, A3L, 144A, FRN, 3.606%, 8/15/25 | | | Cayman Islands | | | | 1,000,000 | | | | 996,640 | |
| f,l | | Eaton Vance CDO Ltd., | | | | | | | | | | | | |
| | 2014-1A, B, 144A, FRN, 2.93%, 7/15/26 | | | United States | | | | 426,000 | | | | 425,003 | |
| | 2014-1A, C, 144A, FRN, 3.88%, 7/15/26 | | | United States | | | | 167,100 | | | | 167,927 | |
| f,l | | Eleven Madison Trust Mortgage Trust, 2015-11MD, A, 144A, FRN, 3.555%, 9/10/35 | | | United States | | | | 1,350,000 | | | | 1,390,775 | |
| l | | FHLMC Structured Agency Credit Risk Debt Notes, | | | | | | | | | | | | |
| | 2014-DN1, M2, FRN, 2.956%, 2/25/24 | | | United States | | | | 1,500,000 | | | | 1,535,060 | |
| | 2014-HQ2, M2, FRN, 2.956%, 9/25/24 | | | United States | | | | 1,000,000 | | | | 1,021,480 | |
| | 2015-HQ1, M2, FRN, 2.956%, 3/25/25 | | | United States | | | | 853,365 | | | | 861,145 | |
| f,l | | Flagship CLO VIII Ltd., 2014-8A, A, 144A, FRN, 2.44%, 1/16/26 | | | Cayman Islands | | | | 540,000 | | | | 539,233 | |
| f | | Flatiron CLO Ltd., 2014-1A, A1, 144A, 2.26%, 7/17/26 | | | Cayman Islands | | | | 1,640,000 | | | | 1,638,491 | |
| f,l | | Galaxy CLO Ltd., | | | | | | | | | | | | |
| | 2014-17A, AR, 144A, FRN, 2.28%, 7/15/26 | | | Cayman Islands | | | | 720,000 | | | | 719,888 | |
| | 2014-17A, BR, 144A, FRN, 2.68%, 7/15/26 | | | Cayman Islands | | | | 470,000 | | | | 466,647 | |
| | 2014-17A, C1R, 144A, FRN, 3.28%, 7/15/26 | | | Cayman Islands | | | | 250,000 | | | | 248,249 | |
| f | | G-Force LLC, 2005-RRA, C, 144A, 5.20%, 8/22/36 | | | United States | | | | 2,000,000 | | | | 1,936,180 | |
| l | | Impac Secured Assets Trust, 2007-2, FRN, 1.006%, 4/25/37 | | | United States | | | | 237,129 | | | | 216,380 | |
| f,l | | Invitation Homes Trust, 2015-SFR1, A, 144A, FRN, 2.186%, 3/17/32 | | | United States | | | | 1,437,567 | | | | 1,441,014 | |
| | JP Morgan Chase Commercial Mortgage Securities Trust, 2006-CB17, AM, 5.464%, 12/12/43 | | | United States | | | | 136,387 | | | | 136,347 | |
| f,l | | LCM XVI LP, 16A, B, 144A, FRN, 2.88%, 7/15/26 | | | Cayman Islands | | | | 670,000 | | | | 668,389 | |
| f,l | | LCM XVII LP, | | | | | | | | | | | | |
| | 2017A, BR, 144A, FRN, 2.74%, 10/15/26 | | | United States | | | | 350,000 | | | | 350,332 | |
| | 2017A, CR, 144A, FRN, 3.39%, 10/15/26 | | | United States | | | | 320,000 | | | | 320,576 | |
FRANKLIN TEMPLETON VARIABLE INSURANCE PRODUCTS TRUST
CONSOLIDATED STATEMENT OF INVESTMENTS
Franklin Strategic Income VIP Fund (continued)
| | | | | | | | | | | | | | |
| | | | | Country | | | Principal Amount* | | | Value | |
| | | Asset-Backed Securities and Commercial Mortgage-
Backed Securities (continued) | | | | | | | | | |
| | | Diversified Financials (continued) | | | | | | | | | |
| l | | MortgageIT Trust, 2004-1, A2, FRN, 1.656%, 11/25/34 | | | United States | | | | 276,494 | | | $ | 263,740 | |
| f,l | | Octagon Investment Partners XVII Ltd., 2013-1A, B1, 144A, FRN, 2.582%, 10/25/25 | | | Cayman Islands | | | | 430,000 | | | | 429,942 | |
| f,l | | Octagon Investment Partners XXIII Ltd., 2015-1A, B, 144A, FRN, 2.88%, 7/15/27 | | | Cayman Islands | | | | 400,000 | | | | 400,504 | |
| l | | Opteum Mortgage Acceptance Corp. Trust, 2005-4, 1APT, FRN, 1.066%, 11/25/35 | | | United States | | | | 434,466 | | | | 412,960 | |
| l | | Structured Asset Securities Corp., 2005-2XS, 2A2, FRN, 2.256%, 2/25/35 | | | United States | | | | 280,867 | | | | 269,446 | |
| l | | Thornburg Mortgage Securities Trust, 2005-1, A3, FRN, 2.817%, 4/25/45 | | | United States | | | | 228,918 | | | | 230,041 | |
| f,l | | Voya CLO Ltd., | | | | | | | | | | | | |
| | 2013-1A, B, 144A, FRN, 3.78%, 4/15/24 | | | United States | | | | 270,000 | | | | 270,610 | |
| | 2013-2A, B, 144A, FRN, 3.562%, 4/25/25 | | | United States | | | | 1,080,000 | | | | 1,080,756 | |
| �� | 2015-2A, B, 144A, FRN, 2.862%, 7/23/27 | | | Cayman Islands | | | | 820,000 | | | | 821,443 | |
| | Wells Fargo Mortgage Backed Securities Trust, | | | | | | | | | | | | |
| | l 2004-W, A9, FRN, 3.004%, 11/25/34 | | | United States | | | | 721,260 | | | | 731,543 | |
| | 2007-3, 3A1, 5.50%, 4/25/22 | | | United States | | | | 167,326 | | | | 171,446 | |
| | | | | | | | | | | | | | |
| | | | | | | | | | | | | 54,111,091 | |
| | | | | | | | | | | | | | |
| | | | |
| | Total Asset-Backed Securities and Commercial Mortgage-Backed Securities (Cost $64,628,234) | | | | | | | | | | | 65,599,673 | |
| | | | | | | | | | | | | | |
| | | | |
| | Mortgage-Backed Securities 9.9% | | | | | | | | | | | | |
| l | | Federal Home Loan Mortgage Corp. (FHLMC) Adjustable Rate 0.0%† | | | | | | | | | |
| | FHLMC, 2.681%, 1/01/33 | | | United States | | | | 39,158 | | | | 40,781 | |
| | | | | | | | | | | | | | |
| | | Federal Home Loan Mortgage Corp. (FHLMC) Fixed Rate 4.8% | | | | | | | | | |
| | FHLMC Gold 15 Year, 5.50%, 7/01/17 - 7/01/19 | | | United States | | | | 32,642 | | | | 33,674 | |
| | FHLMC Gold 15 Year, 6.00%, 5/01/17 | | | United States | | | | 406 | | | | 409 | |
| t | | FHLMC Gold 30 Year, 3.00%, 1/01/46 | | | United States | | | | 10,250,000 | | | | 10,171,876 | |
| t | | FHLMC Gold 30 Year, 3.50%, 1/01/46 | | | United States | | | | 3,000,000 | | | | 3,070,135 | |
| | FHLMC Gold 30 Year, 3.50%, 8/01/46 | | | United States | | | | 5,285,858 | | | | 5,415,820 | |
| | FHLMC Gold 30 Year, 4.00%, 6/01/46 | | | United States | | | | 11,874,118 | | | | 12,479,804 | |
| | FHLMC Gold 30 Year, 4.00%, 8/01/46 | | | United States | | | | 613,375 | | | | 644,635 | |
| | FHLMC Gold 30 Year, 5.00%, 4/01/34 - 8/01/35 | | | United States | | | | 298,175 | | | | 326,711 | |
| | FHLMC Gold 30 Year, 5.50%, 3/01/33 - 1/01/35 | | | United States | | | | 232,060 | | | | 258,870 | |
| | FHLMC Gold 30 Year, 6.00%, 4/01/33 - 2/01/36 | | | United States | | | | 209,946 | | | | 239,419 | |
| | FHLMC Gold 30 Year, 6.50%, 11/01/27 - 6/01/36 | | | United States | | | | 40,913 | | | | 46,549 | |
| | FHLMC Gold 30 Year, 7.00%, 9/01/21 - 4/01/30 | | | United States | | | | 18,753 | | | | 20,723 | |
| | FHLMC Gold 30 Year, 7.50%, 8/01/30 - 7/01/31 | | | United States | | | | 1,078 | | | | 1,157 | |
| | | | | | | | | | | | | | |
| | | | | | | | | | | | | 32,709,782 | |
| | | | | | | | | | | | | | |
| l | | Federal National Mortgage Association (FNMA) Adjustable Rate 0.0%† | | | | | | | | | |
| | FNMA, 2.785% - 2.792%, 4/01/20 - 12/01/34 | | | United States | | | | 130,868 | | | | 137,604 | |
| | | | | | | | | | | | | | |
| | | Federal National Mortgage Association (FNMA) Fixed Rate 3.2% | | | | | | | | | |
| | FNMA 15 Year, 2.50%, 7/01/22 - 6/01/27 | | | United States | | | | 411,467 | | | | 413,131 | |
| | FNMA 15 Year, 4.50%, 6/01/19 - 3/01/20 | | | United States | | | | 50,150 | | | | 51,590 | |
| | FNMA 15 Year, 5.00%, 10/01/17 - 6/01/18 | | | United States | | | | 25,296 | | | | 25,902 | |
| | FNMA 15 Year, 5.50%, 2/01/17 - 11/01/18 | | | United States | | | | 88,424 | | | | 89,971 | |
| t | | FNMA 30 Year, 3.00%, 1/01/46 | | | United States | | | | 10,750,000 | | | | 10,672,365 | |
| t | | FNMA 30 Year, 3.50%, 1/01/46 | | | United States | | | | 2,800,000 | | | | 2,868,259 | |
FRANKLIN TEMPLETON VARIABLE INSURANCE PRODUCTS TRUST
CONSOLIDATED STATEMENT OF INVESTMENTS
Franklin Strategic Income VIP Fund (continued)
| | | | | | | | | | | | | | |
| | | | | Country | | | Principal Amount* | | | Value | |
| | | Mortgage-Backed Securities (continued) | | | | | | | | | |
| | | Federal National Mortgage Association (FNMA) Fixed Rate (continued) | | | | | | | | | |
| | FNMA 30 Year, 3.50%, 7/01/46 | | | United States | | | | 7,099,600 | | | $ | 7,281,341 | |
| | FNMA 30 Year, 5.00%, 4/01/30 | | | United States | | | | 79,075 | | | | 86,303 | |
| | FNMA 30 Year, 6.50%, 6/01/28 - 10/01/37 | | | United States | | | | 218,481 | | | | 250,044 | |
| | | | | | | | | | | | | | |
| | | | | | | | | | | | | 21,738,906 | |
| | | | | | | | | | | | | | |
| | | Government National Mortgage Association (GNMA) Fixed Rate 1.9% | | | | | | | | | |
| | GNMA I SF 30 Year, 5.00%, 11/15/33 - 7/15/34 | | | United States | | | | 288,044 | | | | 317,140 | |
| | GNMA I SF 30 Year, 6.50%, 2/15/32 | | | United States | | | | 1,042 | | | | 1,190 | |
| | GNMA I SF 30 Year, 7.00%, 10/15/28 - 6/15/32 | | | United States | | | | 17,249 | | | | 17,604 | |
| | GNMA I SF 30 Year, 7.50%, 9/15/30 | | | United States | | | | 1,321 | | | | 1,526 | |
| t | | GNMA II SF 30 Year, 3.00%, 1/01/46 | | | United States | | | | 7,400,000 | | | | 7,487,898 | |
| | GNMA II SF 30 Year, 3.50%, 8/20/46 | | | United States | | | | 4,623,002 | | | | 4,809,551 | |
| | GNMA II SF 30 Year, 5.00%, 9/20/33 - 11/20/33 | | | United States | | | | 84,791 | | | | 94,512 | |
| | GNMA II SF 30 Year, 6.00%, 11/20/34 | | | United States | | | | 103,534 | | | | 120,754 | |
| | GNMA II SF 30 Year, 6.50%, 4/20/31 - 2/20/34 | | | United States | | | | 50,743 | | | | 58,745 | |
| | GNMA II SF 30 Year, 7.50%, 1/20/28 - 4/20/32 | | | United States | | | | 12,002 | | | | 13,805 | |
| | | | | | | | | | | | | | |
| | | | | | | | | | | | | 12,922,725 | |
| | | | | | | | | | | | | | |
| | | | |
| | Total Mortgage-Backed Securities (Cost $68,265,737) | | | | | | | | | | | 67,549,798 | |
| | | | | | | | | | | | | | |
| | Municipal Bonds 1.9% | | | | | | | | | | | | |
| | California State GO, Refunding, 5.00%, 9/01/29 | | | United States | | | | 1,650,000 | | | | 1,964,424 | |
| | Clark County School District GO, Refunding, Series D, 5.00%, 6/15/23 | | | United States | | | | 1,500,000 | | | | 1,750,065 | |
| | Denver City and County Airport System Revenue, Refunding, Series A, 5.00%, 11/15/25 | | | United States | | | | 210,000 | | | | 248,558 | |
| | Illinois State GO, Build America Bonds, 7.35%, 7/01/35 | | | United States | | | | 1,000,000 | | | | 1,083,180 | |
| | Minnesota State GO, Refunding, Series D, 5.00%, 8/01/25 | | | United States | | | | 830,000 | | | | 1,009,197 | |
| | New York City HDC Capital Fund Grant Program Revenue, New York City Housing Authority Program, Series B1, 5.00%, 7/01/33 | | | United States | | | | 500,000 | | | | 563,590 | |
| | New York State Dormitory Authority State Personal Income Tax Revenue, General Purpose, Refunding, Series A, 5.00%, 2/15/25 | | | United States | | | | 930,000 | | | | 1,088,509 | |
| | Port Authority of New York and New Jersey Revenue, Consolidated, One Hundred Ninety-First Series, 4.823%, 6/01/45 | | | United States | | | | 1,490,000 | | | | 1,569,075 | |
| | Puerto Rico Electric Power Authority Power Revenue, | | | | | | | | | | | | |
| | Series A, 6.75%, 7/01/36 | | | United States | | | | 3,465,000 | | | | 2,291,231 | |
| | Series XX, 5.25%, 7/01/40 | | | United States | | | | 165,000 | | | | 109,106 | |
| u | | University of Texas Revenue, Series J, 5.00%, 8/15/25 | | | United States | | | | 960,000 | | | | 1,159,747 | |
| | | | | | | | | | | | | | |
| | | | |
| | Total Municipal Bonds (Cost $13,563,769) | | | | | | | | | | | 12,836,682 | |
| | | | | | | | | | | | | | |
| | | | |
| | | | | | | | Shares | | | | |
| | Escrows and Litigation Trusts 0.0%† | | | | | | | | | | | | |
| a,e | | Midstates Petroleum Co. Inc./Midstates Petroleum Co. LLC, Litigation Trust | | | United States | | | | 1,500,000 | | | | — | |
| a,e | | NewPage Corp., Litigation Trust | | | United States | | | | 2,500,000 | | | | — | |
| a | | Penn Virginia Corp., Litigation Trust | | | United States | | | | 1,500,000 | | | | 37,500 | |
| a,e | | Vistra Energy Corp., Litigation Trust | | | United States | | | | 3,000,000 | | | | 34,800 | |
FRANKLIN TEMPLETON VARIABLE INSURANCE PRODUCTS TRUST
CONSOLIDATED STATEMENT OF INVESTMENTS
Franklin Strategic Income VIP Fund (continued)
| | | | | | | | | | | | | | |
| | | | | Country | | | Shares | | | Value | |
| | | Escrows and Litigation Trusts (continued) | | | | | | | | | |
| a | | Vistra Energy Corp., Litigation Trust, TRA | | | United States | | | | 51,378 | | | $ | 74,498 | |
| | | | | | | | | | | | | | |
| | | | |
| | Total Escrows and Litigation Trusts (Cost $279,110) | | | | | | | | | | | 146,798 | |
| | | | | | | | | | | | | | |
| | | | |
| | Total Investments before Short Term Investments (Cost $691,731,245) | | | | | | | | | | | 672,449,278 | |
| | | | | | | | | | | | | | |
| | | | |
| | | | | | | | Principal Amount* | | | | |
| | Short Term Investments 4.1% | | | | | | | | | | | | |
| | | U.S. Government and Agency Securities (Cost $579,573) 0.1% | | | | | | | | | |
| v,w | | U.S. Treasury Bill, 3/02/17 | | | United States | | | | 580,000 | | | | 579,556 | |
| | | | | | | | | | | | | | |
| | | | |
| | Total Investments before Money Market Funds (Cost $692,310,818) | | | | | | | | | | | 673,028,834 | |
| | | | | | | | | | | | | | |
| | | | |
| | | | | | | | Shares | | | | |
| | | Money Market Funds (Cost $27,288,407) 4.0% | | | | | | | | | |
| g,x | | Institutional Fiduciary Trust Money Market Portfolio, 0.09% | | | United States | | | | 27,288,407 | | | | 27,288,407 | |
| | | | | | | | | | | | | | |
| | | | |
| | Total Investments (Cost $719,599,225) 103.0% | | | | | | | | | | | 700,317,241 | |
| | Other Assets, less Liabilities (3.0)% | | | | | | | | | | | (20,553,977 | ) |
| | | | | | | | | | | | | | |
| | Net Assets 100.0% | | | | | | | | | | $ | 679,763,264 | |
| | | | | | | | | | | | | | |
FRANKLIN TEMPLETON VARIABLE INSURANCE PRODUCTS TRUST
CONSOLIDATED STATEMENT OF INVESTMENTS
Franklin Strategic Income VIP Fund (continued)
†Rounds to less than 0.1% of net assets.
*The principal amount is stated in U.S. dollars unless otherwise indicated.
aNon-income producing.
bThe security is owned by FT Holdings Corporation lll, a wholly-owned subsidiary of the Fund. See Note 1(g).
cAt December 31, 2016, pursuant to the Fund’s policies and the requirements of applicable securities law, the Fund is restricted from trading these securities at year end.
dSee Note 8 regarding restricted securities.
eSecurity has been deemed illiquid because it may not be able to be sold within seven days. At December 31, 2016, the aggregate value of these securities was $168,418, representing less than 0.1% of net assets.
fSecurity was purchased pursuant to Rule 144A under the Securities Act of 1933 and may be sold in transactions exempt from registration only to qualified institutional buyers or in a public offering registered under the Securities Act of 1933. These securities have been deemed liquid under guidelines approved by the Trust’s Board of Trustees. At December 31, 2016, the aggregate value of these securities was $148,191,073, representing 21.8% of net assets.
gSee Note 3(e) regarding investments in affiliated management investment companies.
hPerpetual security with no stated maturity date.
iSee Note 7 regarding defaulted securities.
jIncome may be received in additional securities and/or cash.
kSee Note 1(f) regarding loan participation notes.
lThe coupon rate shown represents the rate at period end.
mSee Note 1(i) regarding senior floating rate interests.
nA portion or all of the security purchased on a delayed delivery basis. See Note 1(c).
oPrincipal amount is stated in 100 Mexican Peso Units.
pThe principal represents the notional amount. See Note 1(d) regarding value recovery instruments.
qPrincipal amount of security is adjusted for inflation. See Note 1(k).
rPrincipal amount is stated in 1,000 Brazilian Real Units.
sRedemption price at maturity is adjusted for inflation. See Note 1(k).
tSecurity purchased on a to-be-announced (TBA) basis. See Note 1(c).
uSecurity purchased on a when-issued basis. See Note 1(c).
vThe security was issued on a discount basis with no stated coupon rate.
wA portion or all of the security has been segregated as collateral for open future contracts. At December 31, 2016, the value of this security and/or cash pledged amounted to $498,521, representing 0.1% of net assets.
xThe rate shown is the annualized seven-day yield at period end.
FRANKLIN TEMPLETON VARIABLE INSURANCE PRODUCTS TRUST
CONSOLIDATED STATEMENT OF INVESTMENTS
Franklin Strategic Income VIP Fund (continued)
At December 31, 2016, the Fund had the following financial futures contracts outstanding. See Note 1(d).
Financial Futures Contracts
| | | | | | | | | | | | | | | | | | | | | | | | |
| Description | | Type | | | Number of
Contracts | | | Notional
Value | | | Expiration
Date | | | Unrealized
Appreciation | | | Unrealized
Depreciation | |
| Interest Rate Contracts | | | | | | | | | | | | | | | | | | | | | | | | |
CME Ultra Long Term U.S. Treasury Bond | | | Long | | | | 45 | | | $ | 7,211,250 | | | | 3/22/17 | | | $ | — | | | $ | (93,746 | ) |
Euro-Bund | | | Long | | | | 13 | | | | 2,245,342 | | | | 3/08/17 | | | | 30,475 | | | | — | |
Long Gilt | | | Long | | | | 46 | | | | 7,130,170 | | | | 3/29/17 | | | | 181,827 | | | | — | |
U.S. 10 Yr. Ultra | | | Long | | | | 33 | | | | 4,424,063 | | | | 3/22/17 | | | | — | | | | (33,087 | ) |
| | | | | | | | | | | | | | | | | | | | |
Total Financial Futures Contracts | | | $ | 212,302 | | | $ | (126,833 | ) |
| | | | | | | | | | | | | | | | | | | | |
Net unrealized appreciation (depreciation) | | | $ | 85,469 | | | | | |
| | | | | | | | | | | | | | | | | | | | | | | | |
At December 31, 2016, the Fund had the following forward exchange contracts outstanding. See Note 1(d).
| | | | | | | | | | | | | | | | | | | | | | | | | | | | |
| Forward Exchange Contracts | |
| Currency | | Counterpartya | | | Type | | | Quantity | | | Contract
Amount | | | Settlement
Date | | | Unrealized
Appreciation | | | Unrealized
Depreciation | |
| OTC Forward Exchange Contracts | | | | | | | | | | | | | |
Australian Dollar | | | DBAB | | | | Sell | | | | 8,308,345 | | | $ | 6,262,000 | | | | 5/18/17 | | | $ | 286,649 | | | $ | — | |
Australian Dollar | | | JPHQ | | | | Sell | | | | 7,050,000 | | | | 5,260,905 | | | | 5/18/17 | | | | 190,554 | | | | — | |
British Pound | | | JPHQ | | | | Buy | | | | 600,000 | | | | 747,702 | | | | 5/18/17 | | | | — | | | | (5,986 | ) |
British Pound | | | JPHQ | | | | Sell | | | | 937,472 | | | | 1,146,373 | | | | 5/18/17 | | | | — | | | | (12,524 | ) |
Canadian Dollar | | | JPHQ | | | | Sell | | | | 4,600,000 | | | | 3,497,673 | | | | 5/18/17 | | | | 66,102 | | | | — | |
Euro | | | BZWS | | | | Sell | | | | 2,561,255 | | | | 2,847,151 | | | | 5/18/17 | | | | 132,730 | | | | — | |
Euro | | | CITI | | | | Sell | | | | 2,131,200 | | | | 2,323,162 | | | | 5/18/17 | | | | 64,515 | | | | — | |
Euro | | | DBAB | | | | Buy | | | | 1,250,000 | | | | 1,374,750 | | | | 5/18/17 | | | | — | | | | (49,999 | ) |
Euro | | | DBAB | | | | Sell | | | | 2,242,876 | | | | 2,517,584 | | | | 5/18/17 | | | | 140,581 | | | | — | |
Euro | | | GSCO | | | | Sell | | | | 369,000 | | | | 409,590 | | | | 5/18/17 | | | | 18,523 | | | | — | |
Euro | | | HSBK | | | | Sell | | | | 142,717 | | | | 160,333 | | | | 5/18/17 | | | | 9,081 | | | | — | |
Euro | | | JPHQ | | | | Sell | | | | 22,278,207 | | | | 24,630,056 | | | | 5/18/17 | | | | 1,019,585 | | | | — | |
Indian Rupee | | | CITI | | | | Buy | | | | 4,537,000 | | | | 65,299 | | | | 5/18/17 | | | | 394 | | | | — | |
Indian Rupee | | | DBAB | | | | Buy | | | | 44,375,000 | | | | 647,243 | | | | 5/18/17 | | | | — | | | | (4,721 | ) |
Indian Rupee | | | DBAB | | | | Buy | | | | 301,181,000 | | | | 4,333,540 | | | | 5/18/17 | | | | 27,372 | | | | — | |
Indian Rupee | | | HSBK | | | | Buy | | | | 144,338,000 | | | | 2,074,418 | | | | 5/18/17 | | | | 15,505 | | | | — | |
Japanese Yen | | | BZWS | | | | Sell | | | | 60,047,000 | | | | 583,109 | | | | 5/18/17 | | | | 65,743 | | | | — | |
Japanese Yen | | | CITI | | | | Sell | | | | 42,830,000 | | | | 419,067 | | | | 5/18/17 | | | | 50,044 | | | | — | |
Japanese Yen | | | DBAB | | | | Sell | | | | 540,993,500 | | | | 4,931,345 | | | | 5/18/17 | | | | 270,138 | | | | — | |
Japanese Yen | | | HSBK | | | | Sell | | | | 147,626,000 | | | | 1,433,540 | | | | 5/18/17 | | | | 161,593 | | | | — | |
Japanese Yen | | | JPHQ | | | | Sell | | | | 1,136,286,000 | | | | 10,808,894 | | | | 5/18/17 | | | | 1,018,639 | | | | — | |
British Pound | | | JPHQ | | | | Sell | | | | 1,250,000 | | | | 1,649,375 | | | | 8/15/18 | | | | 82,386 | | | | — | |
| | | | | | | | | | | | | | | | | | | | | | | | |
Total Forward Exchange Contracts | | | $ | 3,620,134 | | | $ | (73,230 | ) |
| | | | | | | | | | | | | | | | | | | | | | | | |
Net unrealized appreciation (depreciation) | | | $ | 3,546,904 | | | | | |
| | | | | | | | | | | | | | | | | | | | | | | | | | | | |
aMay be comprised of multiple contracts with the same counterparty, currency and settlement date.
FRANKLIN TEMPLETON VARIABLE INSURANCE PRODUCTS TRUST
CONSOLIDATED STATEMENT OF INVESTMENTS
Franklin Strategic Income VIP Fund (continued)
At December 31, 2016, the Fund had the following credit default swap contracts outstanding. See Note 1(d).
Credit Default Swap Contracts
| | | | | | | | | | | | | | | | | | | | | | | | | | | | | | | | | | | | |
| Description | | Periodic
Payment
Rate | | | Counter-
party/
Exchange | | | Notional
Amounta | | | Expiration
Date | | | Unamortized
Upfront
Payments
(Receipts) | | | Unrealized
Appreciation | | | Unrealized
Depreciation | | | Value | | | Ratingb | |
| Centrally Cleared Swap Contract | | | | | | | | | | | | | | | | | | | | | | | | | | | | | | | | | | | | |
| | | | | | | | | |
| Contracts to Buy Protection | | | | | | | | | | | | | | | | | | | | | | | | | | | | | | | | | | | | |
| | | | | | | | | |
| Traded Index | | | | | | | | | | | | | | | | | | | | | | | | | | | | | | | | | | | | |
CDX.NA.HY.27 | | | 5.00 | % | | | ICE | | | $ | 1,900,000 | | | | 12/20/21 | | | $ | (59,696 | ) | | $ | — | | | $ | (60,858 | ) | | $ | (120,554 | ) | | | | |
| | | | | | | | | | | | | | | | | | | | | | | | |
| | | | | | | | | |
| OTC Swap Contracts | | | | | | | | | | | | | | | | | | | | | | | | | | | | | | | | | | | | |
| | | | | | | | | |
| Contracts to Buy Protection | | | | | | | | | | | | | | | | | | | | | | | | | | | | | | | | | | | | |
| | | | | | | | | |
| Single Name | | | | | | | | | | | | | | | | | | | | | | | | | | | | | | | | | | | | |
The Royal Bank of Scotland PLC | | | 1.00 | % | | | JPHQ | | |
| 250,000
EUR |
| | | 6/20/21 | | | | 27,850 | | | | — | | | | (8,919 | ) | | | 18,931 | | | | | |
| | | | | | | | | |
| Contracts to Sell Protectionc | | | | | | | | | | | | | | | | | | | | | | | | | | | | | | | | | | | | |
| | | | | | | | | |
| Traded Index | | | | | | | | | | | | | | | | | | | | | | | | | | | | | | | | | | | | |
MCDX.NA.27 | | | 1.00 | % | | | CITI | | | | 6,035,000 | | | | 12/20/21 | | | | 59,917 | | | | 32,665 | | | | — | | | | 92,582 | | | | Investment | |
| | | | | | | | | | | | | | | | | | | | | | | | |
| | | | | | | | | | | | | | | | | | | | | | | | | | | | | | | | | | | Grade | |
Total OTC Swap Contracts | | | | | | | | | | | | | | | | | | $ | 87,767 | | | $ | 32,665 | | | $ | (8,919 | ) | | $ | 111,513 | | | | | |
| | | | | | | | | | | | | | | | | | | | | | | | |
Total Credit Default Swap Contracts | | | | | | | | | | | | | | | | | | $ | 28,071 | | | $ | 32,665 | | | $ | (69,777 | ) | | $ | (9,041 | ) | | | | |
| | | | | | | | | | | | | | | | | | | | | | | | |
Net unrealized appreciation (depreciation) | | | | | | | | | | | | | | | | | | | | | | | | | | $ | (37,112 | ) | | | | | | | | |
| | | | | | | | | | | | | | | | | | | | | | | | | | | | | | | | | | | | |
aIn U.S. dollars unless otherwise indicated. For contracts to sell protection, the notional amount is equal to the maximum potential amount of the future payments and no recourse provisions have been entered into in association with the contracts.
bBased on Standard and Poor’s (S&P) Rating for single name swaps and internal ratings for index swaps. Internal ratings based on mapping into equivalent ratings from external vendors.
cThe fund enters contracts to sell protection to create a long credit position. Performance triggers include failure to pay or bankruptcy of the underlying securities for traded index swaps.
See Note 9 regarding other derivative information.
See Abbreviations on page FSI- 49.
| | | | |
| FSI-30 | | Annual Report | The accompanying notes are an integral part of these consolidated financial statements. |
FRANKLIN TEMPLETON VARIABLE INSURANCE PRODUCTS TRUST
Consolidated Financial Statements
Consolidated Statement of Assets and Liabilities
December 31, 2016
| | | | |
| | | Franklin Strategic
Income VIP Fund | |
Assets: | | | | |
Investments in securities: | | | | |
Cost - Unaffiliated issuers | | $ | 645,200,742 | |
Cost - Non-controlled affiliates (Note 3e) | | | 74,398,483 | |
| | | | |
Total cost of investments | | $ | 719,599,225 | |
| | | | |
Value - Unaffiliated issuers | | $ | 623,792,421 | |
Value - Non-controlled affiliates (Note 3e) | | | 76,524,820 | |
| | | | |
Total value of investments | | | 700,317,241 | |
Cash | | | 717,472 | |
Restricted Cash (Note 1e) | | | 720,000 | |
Foreign currency, at value (cost $4,638,976) | | | 4,635,999 | |
Receivables: | | | | |
Investment securities sold | | | 845,828 | |
Capital shares sold | | | 166,263 | |
Dividends and interest | | | 5,627,733 | |
Due from brokers | | | 983,753 | |
Variation margin | | | 55,107 | |
OTC swap contracts (upfront payments $93,641) | | | 87,767 | |
Unrealized appreciation on OTC forward exchange contracts | | | 3,620,134 | |
Unrealized appreciation on OTC swap contracts | | | 32,665 | |
Other assets | | | 60 | |
| | | | |
Total assets | | | 717,810,022 | |
| | | | |
Liabilities: | | | | |
Payables: | | | | |
Investment securities purchased | | | 35,561,305 | |
Capital shares redeemed | | | 717,562 | |
Management fees | | | 313,490 | |
Distribution fees | | | 131,900 | |
Due to brokers | | | 980,000 | |
Unrealized depreciation on OTC forward exchange contracts | | | 73,230 | |
Unrealized depreciation on OTC swap contracts | | | 8,919 | |
Deferred tax | | | 28,103 | |
Accrued expenses and other liabilities | | | 232,249 | |
| | | | |
Total liabilities | | | 38,046,758 | |
| | | | |
Net assets, at value | | $ | 679,763,264 | |
| | | | |
Net assets consist of: | | | | |
Paid-in capital | | $ | 706,388,136 | |
Undistributed net investment income | | | 13,825,422 | |
Net unrealized appreciation (depreciation) | | | (15,755,553 | ) |
Accumulated net realized gain (loss) | | | (24,694,741 | ) |
| | | | |
Net assets, at value | | $ | 679,763,264 | |
| | | | |
| | | | | | |
| The accompanying notes are an integral part of these consolidated financial statements. | Annual Report | | | FSI-31 | |
FRANKLIN TEMPLETON VARIABLE INSURANCE PRODUCTS TRUST
CONSOLIDATED FINANCIAL STATEMENTS
Consolidated Statement of Assets and Liabilities (continued)
December 31, 2016
| | | | |
| | | Franklin Strategic
Income VIP Fund | |
| |
| Class 1: | | | | |
Net assets, at value | | $ | 396,170,096 | |
| | | | |
Shares outstanding | | | 35,998,783 | |
| | | | |
Net asset value and maximum offering price per share | | $ | 11.01 | |
| | | | |
| |
| Class 2: | | | | |
Net assets, at value | | $ | 203,418,291 | |
| | | | |
Shares outstanding | | | 19,119,344 | |
| | | | |
Net asset value and maximum offering price per share | | $ | 10.64 | |
| | | | |
| |
| Class 4: | | | | |
Net assets, at value | | $ | 80,174,877 | |
| | | | |
Shares outstanding | | | 7,354,843 | |
| | | | |
Net asset value and maximum offering price per share | | $ | 10.90 | |
| | | | |
| | | | |
| FSI-32 | | Annual Report | The accompanying notes are an integral part of these consolidated financial statements. |
FRANKLIN TEMPLETON VARIABLE INSURANCE PRODUCTS TRUST
CONSOLIDATED FINANCIAL STATEMENTS
Consolidated Statement of Operations
for the year ended December 31, 2016
| | | | |
| | | Franklin Strategic
Income VIP Fund | |
Investment income: | | | | |
Dividends: | | | | |
Unaffiliated issuers | | $ | 415,265 | |
Non-controlled affiliates (Note 3e) | | | 4,802,450 | |
Interest | | | 30,139,739 | |
| | | | |
Total investment income | | | 35,357,454 | |
| | | | |
Expenses: | | | | |
Management fees (Note 3a) | | | 4,201,327 | |
Distribution fees: (Note 3c) | | | | |
Class 2 | | | 503,589 | |
Class 4 | | | 302,193 | |
Custodian fees (Note 4) | | | 54,548 | |
Reports to shareholders | | | 174,100 | |
Registration and filing fees | | | 299 | |
Professional fees | | | 114,829 | |
Trustees’ fees and expenses | | | 3,362 | |
Other | | | 170,014 | |
| | | | |
Total expenses. | | | 5,524,261 | |
Expense reductions (Note 4) | | | (4,690 | ) |
Expenses waived/paid by affiliates (Note 3e) | | | (491,961 | ) |
| | | | |
Net expenses | | | 5,027,610 | |
| | | | |
Net investment income | | | 30,329,844 | |
| | | | |
Realized and unrealized gains (losses): | | | | |
Net realized gain (loss) from: | | | | |
Investments: | | | | |
Unaffiliated issuers | | | (19,047,111 | ) |
Non-controlled affiliates (Note 3e) | | | 259,876 | |
Foreign currency transactions | | | (3,761,386 | ) |
Futures contracts | | | (887,479 | ) |
Swap contracts | | | 400,409 | |
| | | | |
Net realized gain (loss) | | | (23,035,691 | ) |
| | | | |
Net change in unrealized appreciation (depreciation) on: | | | | |
Investments | | | 44,473,027 | |
Translation of other assets and liabilities denominated in foreign currencies | | | 2,947,140 | |
Futures contracts | | | 85,469 | |
Swap contracts | | | (79,720 | ) |
Change in deferred taxes on unrealized appreciation | | | (21,917 | ) |
| | | | |
Net change in unrealized appreciation (depreciation) | | | 47,403,999 | |
| | | | |
Net realized and unrealized gain (loss) | | | 24,368,308 | |
| | | | |
Net increase (decrease) in net assets resulting from operations | | $ | 54,698,152 | |
| | | | |
| | | | | | |
| The accompanying notes are an integral part of these consolidated financial statements. | Annual Report | | | | FSI-33 | |
FRANKLIN TEMPLETON VARIABLE INSURANCE PRODUCTS TRUST
CONSOLIDATED FINANCIAL STATEMENTS
Consolidated Statements of Changes in Net Assets
| | | | | | | | |
| | | Franklin Strategic Income VIP Fund | |
| | | Year Ended December 31, | |
| | | 2016 | | | 2015 | |
Increase (decrease) in net assets: | | | | | | | | |
Operations: | | | | | | | | |
Net investment income | | $ | 30,329,844 | | | $ | 38,231,958 | |
Net realized gain (loss) | | | (23,035,691 | ) | | | (17,216,764 | ) |
Net change in unrealized appreciation (depreciation) | | | 47,403,999 | | | | (50,067,930 | ) |
| | | | |
Net increase (decrease) in net assets resulting from operations | | | 54,698,152 | | | | (29,052,736 | ) |
| | | | |
Distributions to shareholders from: | | | | | | | | |
Net investment income and net foreign currency gains: | | | | | | | | |
Class 1 | | | (15,028,686 | ) | | | (33,228,366 | ) |
Class 2 | | | (6,934,919 | ) | | | (13,693,486 | ) |
Class 4 | | | (2,790,452 | ) | | | (6,782,412 | ) |
Net realized gains: | | | | | | | | |
Class 1 | | | — | | | | (8,524,986 | ) |
Class 2 | | | — | | | | (3,636,551 | ) |
Class 4 | | | — | | | | (1,855,841 | ) |
| | | | |
Total distributions to shareholders | | | (24,754,057 | ) | | | (67,721,642 | ) |
| | | | |
Capital share transactions: (Note 2) | | | | | | | | |
Class 1 | | | (63,348,838 | ) | | | (74,671,750 | ) |
Class 2 | | | (7,135,423 | ) | | | 21,200,703 | |
Class 4 | | | (16,512,240 | ) | | | (8,346,246 | ) |
| | | | |
Total capital share transactions | | | (86,996,501 | ) | | | (61,817,293 | ) |
| | | | |
Net increase (decrease) in net assets | | | (57,052,406 | ) | | | (158,591,671 | ) |
Net assets: | | | | | | | | |
Beginning of year | | | 736,815,670 | | | | 895,407,341 | |
| | | | |
End of year | | $ | 679,763,264 | | | $ | 736,815,670 | |
| | | | |
Undistributed net investment income included in net assets: | | | | | | | | |
End of year | | $ | 13,825,422 | | | $ | 22,545,872 | |
| | | | |
| | | | |
| FSI-34 | | Annual Report | The accompanying notes are an integral part of these consolidated financial statements. |
FRANKLIN TEMPLETON VARIABLE INSURANCE PRODUCTS TRUST
Notes to Consolidated Financial Statements
Franklin Strategic Income VIP Fund
1. Organization and Significant Accounting Policies
Franklin Templeton Variable Insurance Products Trust (Trust) is registered under the Investment Company Act of 1940 (1940 Act) as an open-end management investment company, consisting of nineteen separate funds and applies the specialized accounting and reporting guidance in U.S. Generally Accepted Accounting Principles (U.S. GAAP). Franklin Strategic Income VIP Fund (Fund) is included in this report. The financial statements of the remaining funds in the Trust are presented separately. Shares of the Fund are generally sold only to insurance company separate accounts to fund the benefits of variable life insurance policies or variable annuity contracts. At December 31, 2016, 70.8% of the Fund’s shares were held through one insurance company. Investment activities of these insurance company separate accounts could have a material impact on the Fund. The Fund offers three classes of shares: Class 1, Class 2 and Class 4. Each class of shares differs by its distribution fees, voting rights on matters affecting a single class and its exchange privilege.
The following summarizes the Fund’s significant
accounting policies.
a. Financial Instrument Valuation
The Fund’s investments in financial instruments are carried at fair value daily. Fair value is the price that would be received to sell an asset or paid to transfer a liability in an orderly transaction between market participants on the measurement date. The Fund calculates the net asset value (NAV) per share as of 4 p.m. Eastern time each day the New York Stock Exchange (NYSE) is open for trading. Under compliance policies and procedures approved by the Trust’s Board of Trustees (the Board), the Fund’s administrator has responsibility for oversight of valuation, including leading the cross-functional Valuation Committee (VC). The VC provides administration and oversight of the Fund’s valuation policies and procedures, which are approved annually by the Board. Among other things, these procedures allow the Fund to utilize independent pricing services, quotations from securities and financial instrument dealers, and other market sources to determine fair value.
Equity securities and derivative financial instruments listed on an exchange or on the NASDAQ National Market System are valued at the last quoted sale price or the official closing price of the day, respectively. Foreign equity securities are valued as
of the close of trading on the foreign stock exchange on which the security is primarily traded, or as of 4 p.m. Eastern time. The value is then converted into its U.S. dollar equivalent at the foreign exchange rate in effect at 4 p.m. Eastern time on the day that the value of the security is determined. Over-the-counter (OTC) securities are valued within the range of the most recent quoted bid and ask prices. Securities that trade in multiple markets or on multiple exchanges are valued according to the broadest and most representative market. Certain equity securities are valued based upon fundamental characteristics or relationships to similar securities.
Debt securities generally trade in the OTC market rather than on a securities exchange. The Fund’s pricing services use multiple valuation techniques to determine fair value. In instances where sufficient market activity exists, the pricing services may utilize a market-based approach through which quotes from market makers are used to determine fair value. In instances where sufficient market activity may not exist or is limited, the pricing services also utilize proprietary valuation models which may consider market characteristics such as benchmark yield curves, credit spreads, estimated default rates, anticipated market interest rate volatility, coupon rates, anticipated timing of principal repayments, underlying collateral, and other unique security features in order to estimate the relevant cash flows, which are then discounted to calculate the fair value. Securities denominated in a foreign currency are converted into their U.S. dollar equivalent at the foreign exchange rate in effect at 4 p.m. Eastern time on the date that the values of the foreign debt securities are determined.
Investments in open-end mutual funds are valued at the closing NAV.
Certain derivative financial instruments trade in the OTC market. The Fund’s pricing services use various techniques including industry standard option pricing models and proprietary discounted cash flow models to determine the fair value of those instruments. The Fund’s net benefit or obligation under the derivative contract, as measured by the fair value of the contract, is included in net assets.
The Fund has procedures to determine the fair value of financial instruments for which market prices are not reliable or readily available. Under these procedures, the VC convenes on a regular basis to review such financial instruments and considers a number of factors, including significant unobservable valuation inputs, when arriving at fair value. The VC primarily
FRANKLIN TEMPLETON VARIABLE INSURANCE PRODUCTS TRUST
NOTES TO CONSOLIDATED FINANCIAL STATEMENTS
Franklin Strategic Income VIP Fund (continued)
1. Organization and Significant Accounting
Policies (continued)
a. Financial Instrument Valuation (continued)
employs a market-based approach which may use related or comparable assets or liabilities, recent transactions, market multiples, book values, and other relevant information for the investment to determine the fair value of the investment. An income-based valuation approach may also be used in which the anticipated future cash flows of the investment are discounted to calculate fair value. Discounts may also be applied due to the nature or duration of any restrictions on the disposition of the investments. Due to the inherent uncertainty of valuations of such investments, the fair values may differ significantly from the values that would have been used had an active market existed. The VC employs various methods for calibrating these valuation approaches including a regular review of key inputs and assumptions, transactional
back-testing or disposition analysis, and reviews of any related market activity.
Trading in securities on foreign securities stock exchanges and OTC markets may be completed before 4 p.m. Eastern time. In addition, trading in certain foreign markets may not take place on every Fund’s business day. Occasionally, events occur between the time at which trading in a foreign security is completed and 4 p.m. Eastern time that might call into question the reliability of the value of a portfolio security held by the Fund. As a result, differences may arise between the value of the Fund’s portfolio securities as determined at the foreign market close and the latest indications of value at 4 p.m. Eastern time. In order to minimize the potential for these differences, the VC monitors price movements following the close of trading in foreign stock markets through a series of country specific market proxies (such as baskets of American Depositary Receipts, futures contracts and exchange traded funds). These price movements are measured against established trigger thresholds for each specific market proxy to assist in determining if an event has occurred that may call into question the reliability of the values of the foreign securities held by the Fund. If such an event occurs, the securities may be valued using fair value procedures, which may include the use of independent pricing services.
When the last day of the reporting period is a non-business day, certain foreign markets may be open on those days that the Fund’s NAV is not calculated, which could result in differences between the value of the Fund’s portfolio securities on the last
business day and the last calendar day of the reporting period. Any significant security valuation changes due to an open foreign market are adjusted and reflected by the Fund for financial reporting purposes.
b. Foreign Currency Translation
Portfolio securities and other assets and liabilities denominated in foreign currencies are translated into U.S. dollars based on the exchange rate of such currencies against U.S. dollars on the date of valuation. The Fund may enter into foreign currency exchange contracts to facilitate transactions denominated in a foreign currency. Purchases and sales of securities, income and expense items denominated in foreign currencies are translated into U.S. dollars at the exchange rate in effect on the transaction date. Portfolio securities and assets and liabilities denominated in foreign currencies contain risks that those currencies will decline in value relative to the U.S. dollar. Occasionally, events may impact the availability or reliability of foreign exchange rates used to convert the U.S. dollar equivalent value. If such an event occurs, the foreign exchange rate will be valued at fair value using procedures established and approved by the Board.
The Fund does not separately report the effect of changes in foreign exchange rates from changes in market prices on securities held. Such changes are included in net realized and unrealized gain or loss from investments in the Consolidated Statement of Operations.
Realized foreign exchange gains or losses arise from sales of foreign currencies, currency gains or losses realized between the trade and settlement dates on securities transactions and the difference between the recorded amounts of dividends, interest, and foreign withholding taxes and the U.S. dollar equivalent of the amounts actually received or paid. Net unrealized foreign exchange gains and losses arise from changes in foreign exchange rates on foreign denominated assets and liabilities other than investments in securities held at the end of the reporting period.
c. Securities Purchased on a When-Issued or Delayed Delivery and TBA Basis
The Fund purchases securities on a when-issued or delayed delivery and to-be-announced (TBA) basis, with payment and delivery scheduled for a future date. These transactions are subject to market fluctuations and are subject to the risk that the value at delivery may be more or less than the trade date purchase price. Although the Fund will generally purchase these
FRANKLIN TEMPLETON VARIABLE INSURANCE PRODUCTS TRUST
NOTES TO CONSOLIDATED FINANCIAL STATEMENTS
Franklin Strategic Income VIP Fund (continued)
securities with the intention of holding the securities, it may sell the securities before the settlement date. Sufficient assets have been segregated for these securities and collateral has been pledged and/or received for open TBA trades.
d. Derivative Financial Instruments
The Fund invested in derivative financial instruments in order to manage risk or gain exposure to various other investments or markets. Derivatives are financial contracts based on an underlying or notional amount, require no initial investment or an initial net investment that is smaller than would normally be required to have a similar response to changes in market factors, and require or permit net settlement. Derivatives contain various risks including the potential inability of the counterparty to fulfill their obligations under the terms of the contract, the potential for an illiquid secondary market, and/or the potential for market movements which expose the Fund to gains or losses in excess of the amounts shown in the Consolidated Statement of Assets and Liabilities. Realized gain and loss and unrealized appreciation and depreciation on these contracts for the period are included in the Consolidated Statement of Operations.
Derivative counterparty credit risk is managed through a formal evaluation of the creditworthiness of all potential counterparties The Fund attempts to reduce its exposure to counterparty credit risk on OTC derivatives, whenever possible, by entering into International Swaps and Derivatives Association (ISDA) master agreements with certain counterparties. These agreements contain various provisions, including but not limited to collateral requirements, events of default, or early termination. Termination events applicable to the counterparty include certain deteriorations in the credit quality of the counterparty. Termination events applicable to the Fund include failure of the Fund to maintain certain net asset levels and/or limit the decline in net assets over various periods of time. In the event of default or early termination, the ISDA master agreement gives the non-defaulting party the right to net and close-out all transactions traded, whether or not arising under the ISDA agreement, to one net amount payable by one counterparty to the other. However, absent an event of default or early termination, OTC derivative assets and liabilities are presented gross and not offset in the Consolidated Statement of Assets and Liabilities. Early termination by the counterparty may result in an immediate payment by the Fund of any net liability owed to that counterparty under the ISDA agreement.
Collateral requirements differ by type of derivative. Collateral or initial margin requirements are set by the broker or exchange clearing house for exchange traded and centrally cleared derivatives. Initial margin deposited is held at the exchange and can be in the form of cash and/or securities. For OTC derivatives traded under an ISDA master agreement, posting of collateral is required by either the Fund or the applicable counterparty if the total net exposure of all OTC derivatives with the applicable counterparty exceeds the minimum transfer amount, which typically ranges from $100,000 to $250,000, and can vary depending on the counterparty and the type of the agreement. Generally, collateral is determined at the close of Fund business each day and any additional collateral required due to changes in derivative values may be delivered by the Fund or the counterparty within a few business days. Collateral pledged and/or received by the Fund for OTC derivatives, if any, is held in segregated accounts with the Fund’s custodian/counterparty broker and can be in the form of cash and/or securities. Unrestricted cash may be invested according to the Fund’s investment objectives. To the extent that the amounts due to the Fund from its counterparties are not subject to collateralization or are not fully collateralized, the Fund bears the risk of loss from counterparty non-performance.
The Fund entered into exchange traded financial futures contracts primarily to manage and/or gain exposure to interest rate risk. A futures contract is an agreement between the Fund and a counterparty to buy or sell an asset at a specified price on a future date. Required initial margins are pledged by the Fund, and the daily change in fair value is accounted for as a variation margin payable or receivable.
The Fund entered into OTC forward exchange contracts primarily to manage and/or gain exposure to certain foreign currencies. A forward exchange contract is an agreement between the Fund and a counterparty to buy or sell a foreign currency at a specific exchange rate on a future date.
The Fund entered into credit default swap contracts primarily to manage exposure to credit risk. A credit default swap is an agreement between the Fund and a counterparty whereby the buyer of the contract receives credit protection and the seller of the contract guarantees the credit worthiness of a referenced debt obligation. These agreements may be privately negotiated in the over-the-counter market (OTC credit default swaps) or may be executed in a multilateral trade facility platform, such as a registered exchange (centrally cleared credit default swaps). The underlying referenced debt obligation may be a single
FRANKLIN TEMPLETON VARIABLE INSURANCE PRODUCTS TRUST
NOTES TO CONSOLIDATED FINANCIAL STATEMENTS
Franklin Strategic Income VIP Fund (continued)
1. Organization and Significant Accounting
Policies (continued)
d. Derivative Financial Instruments (continued)
issuer of corporate or sovereign debt, a credit index, a basket of issuers or indices, or a tranche of a credit index or basket of issuers or indices. In the event of a default of the underlying referenced debt obligation, the buyer is entitled to receive the notional amount of the credit default swap contract from the seller in exchange for the referenced debt obligation, a net settlement amount equal to the notional amount of the credit default swap less the recovery value of the referenced debt obligation, or other agreed upon amount. For centrally cleared credit default swaps, required initial margins are pledged by the Fund, and the daily change in fair value is accounted for as a variation margin payable or receivable in the Consolidated Statement of Assets and Liabilities. Over the term of the contract, the buyer pays the seller a periodic stream of payments, provided that no event of default has occurred. Such periodic payments are accrued daily as an unrealized appreciation or depreciation until the payments are made, at which time they are realized. Upfront payments and receipts are reflected in the Consolidated Statement of Assets and Liabilities and represent compensating factors between stated terms of the credit default swap agreement and prevailing market conditions (credit spreads and other relevant factors). These upfront payments and receipts are amortized over the term of the contract as a realized gain or loss in the Consolidated Statement
of Operations.
The Fund invests in value recovery instruments (VRI) primarily to gain exposure to growth risk. Periodic payments from VRI are dependent on established benchmarks for underlying variables. VRI has a notional amount, which is used to calculate amounts of payments to holders. Payments are recorded upon receipt as realized gains in the Consolidated Statement of Operations. The risks of investing in VRI include growth risk, liquidity, and the potential loss of investment.
See Note 9 regarding other derivative information.
e. Restricted Cash
At December 31, 2016, the Fund held restricted cash in connection with investments in certain derivative securities. Restricted cash is held in a segregated account with the Fund’s custodian and is reflected in the Consolidated Statement of Assets and Liabilities.
f. Loan Participation Notes
The Fund invests in loan participation notes (Participations). Participations are loans originally issued to a borrower by one or more financial institutions (the Lender) and subsequently sold to other investors, such as the Fund. Participations typically result in the Fund having a contractual relationship only with the Lender and not with the borrower. The Fund has the right to receive from the Lender any payments of principal, interest and fees which the Lender received from the borrower. The Fund generally has no rights to either enforce compliance by the borrower with the terms of the loan agreement or to any collateral relating to the original loan. As a result, the Fund assumes the credit risk of both the borrower and the Lender that is selling the Participation. The Participations may also involve interest rate risk and liquidity risk, including the potential default or insolvency of the borrower and/or the Lender.
g. Investments in FT Holdings Corporation III (FT Subsidiary)
The Fund invests in certain financial instruments through its investment in FT Subsidiary. FT Subsidiary is a Delaware Corporation, is a wholly-owned subsidiary of the Fund, and is able to invest in certain financial instruments consistent with the investment objective of the Fund. At December 31, 2016, FT Subsidiary’s investment, Turtle Bay Resort, as well as any other assets and liabilities of FT Subsidiary are reflected in the Fund’s Consolidated Statement of Investments and Consolidated Statement of Assets and Liabilities. The financial statements have been consolidated and include the accounts of the Fund and FT Subsidiary. All intercompany transactions and balances have been eliminated. At December 31, 2016, the net assets of FT Subsidiary were $8,911,760, representing 1.3% of the Fund’s consolidated net assets. The Fund’s investment in FT Subsidiary is limited to 25% of consolidated assets.
h. Mortgage Dollar Rolls
The Fund enters into mortgage dollar rolls, typically on a TBA basis. Mortgage dollar rolls are agreements between the Fund and a financial institution where the Fund sells (or buys) mortgage-backed securities for delivery on a specified date and simultaneously contracts to repurchase (or sell) substantially similar (same type, coupon, and maturity) securities at a future date and at a predetermined price. Gains or losses are realized on the initial sale, and the difference between the repurchase price and the sale price is recorded as an unrealized gain or loss to the Fund upon entering into the mortgage dollar roll. In
FRANKLIN TEMPLETON VARIABLE INSURANCE PRODUCTS TRUST
NOTES TO CONSOLIDATED FINANCIAL STATEMENTS
Franklin Strategic Income VIP Fund (continued)
addition, the Fund may invest the cash proceeds that are received from the initial sale. During the period between the sale and repurchase, the Fund is not entitled to principal and interest paid on the mortgage backed securities. Transactions in mortgage dollar rolls are accounted for as purchases and sales and may result in an increase to the Fund’s portfolio turnover rate. The risks of mortgage dollar roll transactions include the potential inability of the counterparty to fulfill its obligations.
i. Senior Floating Rate Interests
The Fund invests in senior secured corporate loans that pay interest at rates which are periodically reset by reference to a base lending rate plus a spread. These base lending rates are generally the prime rate offered by a designated U.S. bank or the London InterBank Offered Rate (LIBOR). Senior secured corporate loans often require prepayment of principal from excess cash flows or at the discretion of the borrower. As a result, actual maturity may be substantially less than the stated maturity. Senior secured corporate loans in which the Fund invests are generally readily marketable, but may be subject to certain restrictions on resale.
j. Income and Deferred Taxes
It is the Fund’s policy to qualify as a regulated investment company under the Internal Revenue Code. The Fund intends to distribute to shareholders substantially all of its taxable income and net realized gains to relieve it from federal income and if applicable, excise taxes. As a result, no provision for U.S. federal income taxes is required.
The Fund may be subject to foreign taxation related to income received, capital gains on the sale of securities and certain foreign currency transactions in the foreign jurisdictions in which it invests. Foreign taxes, if any, are recorded based on the tax regulations and rates that exist in the foreign markets in which the Fund invests. When a capital gain tax is determined to apply, the Fund records an estimated deferred tax liability in an amount that would be payable if the securities were disposed of on the valuation date.
The Fund may recognize an income tax liability related to its uncertain tax positions under U.S. GAAP when the uncertain tax position has a less than 50% probability that it will be sustained upon examination by the tax authorities based on its technical merits. As of December 31, 2016, the Fund has determined that no tax liability is required in its financial statements related to uncertain tax positions for any open tax
years (or expected to be taken in future tax years). Open tax years are those that remain subject to examination and are based on each tax jurisdiction’s statute of limitation.
k. Security Transactions, Investment Income, Expenses and Distributions
Security transactions are accounted for on trade date. Realized gains and losses on security transactions are determined on a specific identification basis. Interest income and estimated expenses are accrued daily. Amortization of premium and accretion of discount on debt securities are included in interest income. Paydown gains and losses are recorded as an adjustment to interest income. Facility fees are recognized as income over the expected term of the loan. Dividend income is recorded on the ex-dividend date. Distributions to shareholders are recorded on the ex-dividend date and are determined according to income tax regulations (tax basis). Distributable earnings determined on a tax basis may differ from earnings recorded in accordance with U.S. GAAP. These differences may be permanent or temporary. Permanent differences are reclassified among capital accounts to reflect their tax character. These reclassifications have no impact on net assets or the results of operations. Temporary differences are not reclassified, as they may reverse in subsequent periods.
Common expenses incurred by the Trust are allocated among the Funds based on the ratio of net assets of each Fund to the combined net assets of the Trust. Fund specific expenses are charged directly to the Fund that incurred the expense.
Realized and unrealized gains and losses and net investment income, not including class specific expenses, are allocated daily to each class of shares based upon the relative proportion of net assets of each class. Differences in per share distributions, by class, are generally due to differences in class specific expenses.
Inflation-indexed bonds are adjusted for inflation through periodic increases or decreases in the security’s interest accruals, face amount, or principal redemption value, by amounts corresponding to the rate of inflation as measured by an index. Any increase or decrease in the face amount or principal redemption value will be included as interest income in the Consolidated Statement of Operations.
FRANKLIN TEMPLETON VARIABLE INSURANCE PRODUCTS TRUST
NOTES TO CONSOLIDATED FINANCIAL STATEMENTS
Franklin Strategic Income VIP Fund (continued)
1. Organization and Significant Accounting
Policies (continued)
l. Accounting Estimates
The preparation of financial statements in accordance with U.S. GAAP requires management to make estimates and assumptions that affect the reported amounts of assets and liabilities at the date of the financial statements and the amounts of income and expenses during the reporting period. Actual results could differ from those estimates.
m. Guarantees and Indemnifications
Under the Trust’s organizational documents, its officers and trustees are indemnified by the Trust against certain liabilities arising out of the performance of their duties to the Trust.
Additionally, in the normal course of business, the Trust, on behalf of the Fund, enters into contracts with service providers that contain general indemnification clauses. The Trust’s maximum exposure under these arrangements is unknown as this would involve future claims that may be made against the Trust that have not yet occurred. Currently, the Trust expects the risk of loss to be remote.
2. Shares of Beneficial Interest
At December 31, 2016, there were an unlimited number of shares authorized (without par value). Transactions in the Fund’s shares were as follows:
| | | | | | | | | | | | | | | | | | | | |
| | | Year Ended December 31, | |
| | | 2016 | | | | | | 2015 | |
| | | Shares | | | Amount | | | | | | Shares | | | Amount | |
| | | | | |
| Class 1 Shares: | | | | | | | | | | | | | | | | | | | | |
Shares sold | | | 468,712 | | | $ | 5,060,377 | | | | | | | | 342,063 | | | $ | 3,944,392 | |
Shares issued in reinvestment of distributions | | | 1,427,226 | | | | 15,028,686 | | | | | | | | 3,778,584 | | | | 41,753,352 | |
Shares redeemed | | | (7,769,695 | ) | | | (83,437,901 | ) | | | | | | | (10,556,150 | ) | | | (120,369,494 | ) |
| | | | |
Net increase (decrease) | | | (5,873,757 | ) | | $ | (63,348,838 | ) | | | | | | | (6,435,503 | ) | | $ | (74,671,750 | ) |
| | | | |
| | | | | |
| Class 2 Shares: | | | | | | | | | | | | | | | | | | | | |
Shares sold | | | 2,848,537 | | | $ | 29,648,040 | | | | | | | | 4,486,606 | | | $ | 49,551,393 | |
Shares issued in reinvestment of distributions | | | 679,894 | | | | 6,934,919 | | | | | | | | 1,618,117 | | | | 17,330,037 | |
Shares redeemed | | | (4,217,745 | ) | | | (43,718,382 | ) | | | | | | | (4,183,880 | ) | | | (45,680,727 | ) |
| | | | |
Net increase (decrease) | | | (689,314 | ) | | $ | (7,135,423 | ) | | | | | | | 1,920,843 | | | $ | 21,200,703 | |
| | | | |
| | | | | |
| Class 4 Shares: | | | | | | | | | | | | | | | | | | | | |
Shares sold | | | 197,446 | | | $ | 2,112,111 | | | | | | | | 512,101 | | | $ | 6,000,051 | |
Shares issued in reinvestment of distributions | | | 267,029 | | | | 2,790,452 | | | | | | | | 788,162 | | | | 8,638,253 | |
Shares redeemed | | | (2,012,761 | ) | | | (21,414,803 | ) | | | | | | | (2,071,680 | ) | | | (22,984,550 | ) |
| | | | |
Net increase (decrease) | | | (1,548,286 | ) | | $ | (16,512,240 | ) | | | | | | | (771,417 | ) | | $ | (8,346,246 | ) |
| | | | |
FRANKLIN TEMPLETON VARIABLE INSURANCE PRODUCTS TRUST
NOTES TO CONSOLIDATED FINANCIAL STATEMENTS
Franklin Strategic Income VIP Fund (continued)
3. Transactions with Affiliates
Franklin Resources, Inc. is the holding company for various subsidiaries that together are referred to as Franklin Templeton Investments. Certain officers and trustees of the Fund are also officers and/or directors of the following subsidiaries:
| | |
| Subsidiary | | Affiliation |
Franklin Advisers, Inc. (Advisers) | | Investment manager |
Franklin Templeton Services, LLC (FT Services) | | Administrative manager |
Franklin Templeton Distributors, Inc. (Distributors) | | Principal underwriter |
Franklin Templeton Investor Services, LLC (Investor Services) | | Transfer agent |
a. Management Fees
The Fund pays an investment management fee to Advisers based on the average daily net assets of the Fund as follows:
| | |
| Annualized Fee Rate | | Net Assets |
0.625% | | Up to and including $500 million |
0.525% | | Over $500 million, up to and including $1 billion |
0.480% | | Over $1 billion, up to and including $1.5 billion |
0.435% | | Over $1.5 billion, up to and including $6.5 billion |
0.415% | | Over $6.5 billion, up to and including $11.5 billion |
0.400% | | Over $11.5 billion, up to and including $16.5 billion |
0.390% | | Over $16.5 billion, up to and including $19 billion |
0.380% | | Over $19 billion, up to and including $21.5 billion |
0.370% | | In excess of $21.5 billion |
For the year ended December 31, 2016, the effective investment management fee rate was 0.596% of the Fund’s average daily net assets.
b. Administrative Fees
Under an agreement with Advisers, FT Services provides administrative services to the Fund. The fee is paid by Advisers based on the Fund’s average daily net assets, and is not an additional expense of the Fund.
c. Distribution Fees
The Board has adopted distribution plans for Class 2 and Class 4 shares pursuant to Rule 12b-1 under the 1940 Act. Under the Fund’s compensation distribution plans, the Fund pays Distributors for costs incurred in connection with the servicing, sale and distribution of the Fund’s shares up to 0.25% and 0.35% per year of its average daily net assets of Class 2 and Class 4, respectively. The plan year, for purposes of monitoring compliance with the maximum annual plan rates, is February 1 through January 31.
d. Transfer Agent Fees
Investor Services, under terms of an agreement, performs shareholder servicing for the Fund and is not paid by the Fund for the services.
FRANKLIN TEMPLETON VARIABLE INSURANCE PRODUCTS TRUST
NOTES TO CONSOLIDATED FINANCIAL STATEMENTS
Franklin Strategic Income VIP Fund (continued)
3. Transactions with Affiliates (continued)
e. Investments in Affiliated Management Investment Companies
The Fund invests in one or more affiliated management investment companies for purposes other than exercising a controlling influence over the management or policies. Management fees paid by the Fund are waived on assets invested in the affiliated management investment companies, as noted in the Consolidated Statement of Operations, in an amount not to exceed the management and administrative fees paid directly or indirectly by each affiliate. Prior to January 1, 2014, the waiver was accounted for as a reduction to management fees. During the year ended December 31, 2016, the Fund held investments in affiliated management investment companies as follows:
| | | | | | | | | | | | | | | | | | | | | | | | | | | | | | | | |
| | | Number of Shares Held at Beginning of Year | | | Gross Additions | | | Gross
Reductions | | | Number of Shares Held at End of Year | | | Value at End of Year | | | Investment
Income | | | Realized
Gain (Loss) | | | % of Affiliated
Fund Shares
Outstanding
Held at End
of Year | |
| Non-Controlled Affiliates | | | | | | | | | | | | | | | | | | | | | | | | | | | | | | | | |
Franklin Lower Tier Floating Rate Fund | | | 3,135,765 | | | | 46,063 | | | | (591,424 | ) | | | 2,590,404 | | | $ | 27,173,334 | | | $ | 3,129,524 | | | $ | 237,411 | | | | 6.9 | % |
Franklin Middle Tier Floating Rate Fund | | | 2,704,835 | | | | 26,387 | | | | (555,376 | ) | | | 2,175,846 | | | | 22,063,079 | | | | 1,672,138 | | | | 22,465 | | | | 7.2 | % |
Institutional Fiduciary Trust Money Market Portfolio, 0.09% | | | 63,296,131 | | | | 169,709,349 | | | | (205,717,073 | ) | | | 27,288,407 | | | | 27,288,407 | | | | 788 | | | | — | | | | 0.2 | % |
| | | | | | | | | | | | | | | | | | | | | | | | |
Total | | | | | | | | | | | | | | | | | | $ | 76,524,820 | | | $ | 4,802,450 | | | $ | 259,876 | | | | | |
| | | | | | | | | | | | | | | | | | | | | | | | |
f. Interfund Transactions
The Fund engaged in purchases and sales of investments with funds or other accounts that have common investment managers (or affiliated investment managers), directors, trustees or officers. During the year ended December 31, 2016, the purchase and sale transactions aggregated $0 and $699,750, respectively.
4. Expense Offset Arrangement
The Fund has entered into an arrangement with its custodian whereby credits realized as a result of uninvested cash balances are used to reduce a portion of the Fund’s custodian expenses. During the year ended December 31, 2016, the custodian fees were reduced as noted in the Consolidated Statement of Operations.
5. Income Taxes
For tax purposes, capital losses may be carried over to offset future capital gains, if any. At December 31, 2016, the capital loss carryforwards were as follows:
| | | | |
Capital loss carryforwards: | | | | |
Short term | | $ | 1,731,758 | |
Long term | | | 22,864,360 | |
| | | | |
Total capital loss carryforwards | | $ | 24,596,118 | |
| | | | |
The tax character of distributions paid during the years ended December 31, 2016 and 2015, was as follows:
FRANKLIN TEMPLETON VARIABLE INSURANCE PRODUCTS TRUST
NOTES TO CONSOLIDATED FINANCIAL STATEMENTS
Franklin Strategic Income VIP Fund (continued)
| | | | | | | | |
| | | 2016 | | | 2015 | |
Distributions paid from: | | | | | | | | |
Ordinary income | | $ | 24,754,057 | | | $ | 55,458,219 | |
Long term capital gain | | | — | | | | 12,263,423 | |
| | | | |
| | $ | 24,754,057 | | | $ | 67,721,642 | |
| | | | |
At December 31, 2016, the cost of investments, net unrealized appreciation (depreciation), and undistributed ordinary income for income tax purposes were as follows:
| | | | |
Cost of investments | | $ | 721,358,254 | |
| | | | |
Unrealized appreciation | | $ | 21,689,711 | |
Unrealized depreciation | | | (42,730,724 | ) |
| | | | |
Net unrealized appreciation (depreciation) | | $ | (21,041,013 | ) |
| | | | |
Distributable earnings - undistributed ordinary income | | $ | 19,991,284 | |
| | | | |
Differences between income and/or capital gains as determined on a book basis and a tax basis are primarily due to differing treatments of foreign currency transactions and bond discounts and premiums.
6. Investment Transactions
Purchases and sales of investments (excluding short term securities) for the year ended December 31, 2016, aggregated $860,729,603 and $950,352,701, respectively.
7. Credit Risk and Defaulted Securities
At December 31, 2016, the Fund had 39.6% of its portfolio invested in high yield, senior secured floating rate notes, or other securities rated below investment grade and unrated securities, if any. These securities may be more sensitive to economic conditions causing greater price volatility and are potentially subject to a greater risk of loss due to default than higher rated securities.
The Fund held defaulted securities and/or other securities for which the income has been deemed uncollectible. At December 31, 2016, the aggregate value of these securities was $3,500,719, representing 0.5% of the Fund’s net assets. The Fund discontinues accruing income on securities for which income has been deemed uncollectible and provides an estimate for losses on interest receivable. The securities have been identified in the accompanying Consolidated Statement of Investments.
8. Restricted Securities
The Fund invests in securities that are restricted under the Securities Act of 1933 (1933 Act) or which are subject to legal, contractual, or other agreed upon restrictions on resale. Restricted securities are often purchased in private placement transactions, and cannot be sold without prior registration unless the sale is pursuant to an exemption under the 1933 Act. Disposal of these securities may require greater effort and expense, and prompt sale at an acceptable price may be difficult. The Fund may have registration rights for restricted securities. The issuer generally incurs all registration costs.
FRANKLIN TEMPLETON VARIABLE INSURANCE PRODUCTS TRUST
NOTES TO CONSOLIDATED FINANCIAL STATEMENTS
Franklin Strategic Income VIP Fund (continued)
8. Restricted Securities (continued)
At December 31, 2016, the Fund held investments in restricted securities, excluding certain securities exempt from registration under the 1933 Act deemed to be liquid, as follows:
| | | | | | | | | | | | | | |
Shares/
Units | | Issuer | | Acquisition Dates | | | Cost | | | Value | |
| 97,655 | | a Halcon Resources Corp | | | 10/23/12 - 11/19/15 | | | $ | 2,672,353 | | | $ | 818,368 | |
| 1,499 | | Warrior Met Coal LLC, A | | | 5/29/14 - 11/13/14 | | | | 2,911,694 | | | | 487,175 | |
| | | | | | | | | | |
| | Total Restricted Securities (Value is 0.2% of Net Assets) | | | | | | $ | 5,584,047 | | | $ | 1,305,543 | |
| | | | | | | | | | |
aThe Fund also invests in unrestricted securities or other investments in the issuer, valued at $16,881 as of December 31, 2016.
9. Other Derivative Information
At December 31, 2016, the Fund’s investments in derivative contracts are reflected in the Consolidated Statement of Assets and Liabilities as follows:
| | | | | | | | | | | | |
| | | Asset Derivatives | | | Liability Derivatives | |
| | | |
Derivative Contracts Not Accounted for as Hedging Instruments | | Consolidated Statement of
Assets and Liabilities
Location | | Fair Value | | | Consolidated Statement of
Assets and Liabilities
Location | | Fair Value | |
Interest rate contracts | | Variation margin | | $ | 85,469 | a | | Variation margin | | | — | |
Foreign exchange contracts | | Unrealized appreciation on OTC forward exchange contracts | | | 3,620,134 | | | Unrealized depreciation on OTC forward exchange contracts | | | 73,230 | |
Credit contracts | | Variation margin | | | — | | | Variation margin | | | 60,858 | a |
| | OTC swap contracts (upfront payments) | | | 87,767 | | | OTC swap contracts (upfront receipts) | | | — | |
| | Unrealized appreciation on OTC swap contracts | | | 32,665 | | | Unrealized depreciation on OTC swap contracts | | | 8,919 | |
Value recovery instruments | | Investments in securities,at value | | | 595,360 | | | | | | — | |
| | | | | | | | | | | | |
Totals | | | | $ | 4,421,395 | | | | | $ | 143,007 | |
| | | | | | | | | | | | |
aThis amount reflects the cumulative appreciation (depreciation) of futures contracts and centrally cleared swap contracts as reported in the Consolidated Statement of Investments. Only the variation margin receivable/payable at period end is separately reported within the Consolidated Statement of Assets and Liabilities. Prior variation margin movements were recorded to cash upon receipt or payment.
For the year ended December 31, 2016, the effect of derivative contracts in the Fund’s Consolidated Statement of Operations was as follows:
| | | | | | | | | | | | |
Derivative Contracts Not Accounted for as Hedging Instruments | | Consolidated Statement of
Operations Locations | | Net Realized
Gain (Loss) for the Year | | | Consolidated Statement of
Operations Locations | | Net Change in
Unrealized
Appreciation
(Depreciation)
for the Year | |
Net realized gain (loss) from: | | | | | | | | Net change in unrealized appreciation (depreciation) on: | | | | |
Interest rate contracts | | Futures Contracts | | $ | (887,479 | ) | | Futures contracts | | $ | 85,469 | |
Foreign exchange contracts | | Foreign currency transactions | | | (3,738,298 | )a | | Translation of other assets and liabilities denominated in foreign currencies | | | 3,003,064 | a |
Credit contracts | | Swap contracts | | | 400,409 | | | Swap contracts | | | (79,720 | ) |
Value recovery instruments | | Investments | | | — | | | Investments | | | (192,760 | ) |
| | | | | | | | | | | | |
Totals | | | | $ | (4,225,368 | ) | | | | $ | 2,816,053 | |
| | | | | | | | | | | | |
aForward exchange contracts are included in net realized gain (loss) from foreign currency transactions and net change in unrealized appreciation (depreciation) on translation of other assets and liabilities denominated in foreign currencies in the Consolidated Statement of Operations.
FRANKLIN TEMPLETON VARIABLE INSURANCE PRODUCTS TRUST
NOTES TO CONSOLIDATED FINANCIAL STATEMENTS
Franklin Strategic Income VIP Fund (continued)
At December 31, 2016, the Fund’s OTC derivative assets and liabilities are as follows:
| | | | | | | | |
| | | Gross Amounts
of Assets and Liabilities
Presented in the
Consolidated Statement of Assets and
Liabilities | |
| | | | Assets | a | | | Liabilities | a |
| Derivatives | | | | | | | | |
Forward exchange contracts | | $ | 3,620,134 | | | $ | 73,230 | |
Swap Contracts | | | 120,432 | | | | 8,919 | |
| | | | |
Total | | $ | 3,740,566 | | | $ | 82,149 | |
| | | | |
aAbsent an event of default or early termination, OTC derivative assets and liabilities are presented gross and not offset in the Consolidated Statement of Assets and Liabilities.
At December 31, 2016, the Fund’s OTC derivative assets, which may be offset against the Fund’s OTC derivative liabilities and collateral received from the counterparty, are as follows:
| | | | | | | | | | | | | | | | | | | | |
| | | | | | Amounts Not Offset in the Consolidated Statement of Assets and Liabilities | | | | |
| | |
| Gross
Amounts of Assets Presented in the Consolidated Statement of
Assets and Liabilities |
| |
| Financial
Instruments
Available for Offset |
| |
| Financial
Instruments
Collateral
Received |
a,b | |
| Cash Collateral
Received |
a | |
| Net Amount (Not
less than zero) |
|
| Counterparty | | | | | | | | | | | | | | | | | | | | |
BZWS | | $ | 198,473 | | | $ | — | | | $ | — | | | $ | — | | | $ | 198,473 | |
CITI | | | 207,534 | | | | — | | | | — | | | | (207,534 | ) | | | — | |
DBAB | | | 724,740 | | | | (54,720 | ) | | | — | | | | (670,020 | ) | | | — | |
GSCO | | | 18,523 | | | | — | | | | — | | | | — | | | | 18,523 | |
HSBK | | | 186,179 | | | | — | | | | — | | | | — | | | | 186,179 | |
JPHQ | | | 2,405,117 | | | | (27,429 | ) | | | (2,377,688 | ) | | | — | | | | — | |
| | | | |
Total | | $ | 3,740,566 | | | $ | (82,149 | ) | | $ | (2,377,688 | ) | | $ | (877,554 | ) | | $ | 403,175 | |
| | | | |
aIn some instances, the collateral amount disclosed in the table above was adjusted due to the requirement to limit collateral amounts to avoid the effect of overcollateralization. Actual collateral received and/or pledged may be more than the amounts disclosed herein.
bAt December 31, 2016, the Fund received U.S. Government Agency Securities as collateral for derivatives.
At December 31, 2016, the Fund’s OTC derivative liabilities, which may be offset against the Fund’s OTC derivative assets and collateral pledged to the counterparty, are as follows:
| | | | | | | | | | | | | | | | | | | | |
| | | | | | Amounts Not Offset in the Consolidated Statement of Assets and Liabilities | | | | |
| | | Gross Amounts of Liabilities Presented in the Consolidated Statement of
Assets and Liabilities | | | Financial
Instruments
Available for Offset | | | Financial
Instruments
Collateral
Pledged | | | Cash Collateral
Pledged | | | Net Amount (Not less than zero) | |
| Counterparty | | | | | | | | | | | | | | | | | | | | |
BZWS | | $ | — | | | $ | — | | | $ | — | | | $ | — | | | $ | — | |
CITI | | | — | | | | — | | | | — | | | | — | | | | — | |
DBAB | | | 54,720 | | | | (54,720 | ) | | | — | | | | — | | | | — | |
GSCO | | | — | | | | — | | | | — | | | | — | | | | — | |
HSBK | | | — | | | | — | | | | — | | | | — | | | | — | |
JPHQ | | | 27,429 | | | | (27,429 | ) | | | — | | | | — | | | | — | |
| | | | |
Total | | $ | 82,149 | | | $ | (82,149 | ) | | $ | — | | | $ | — | | | $ | — | |
| | | | |
FRANKLIN TEMPLETON VARIABLE INSURANCE PRODUCTS TRUST
NOTES TO CONSOLIDATED FINANCIAL STATEMENTS
Franklin Strategic Income VIP Fund (continued)
9. Other Derivative Information (continued)
For the year ended December, 31 2016, the average month end fair value of derivatives represented 0.6% of average month end net assets. The average month end number of open derivative contracts for the period was 56.
See Note 1(d) regarding derivative financial instruments.
See Abbreviations on page FSI-44.
10. Credit Facility
The Fund, together with other U.S. registered and foreign investment funds (collectively, Borrowers), managed by Franklin Templeton Investments, are borrowers in a joint syndicated senior unsecured credit facility totaling $2 billion (Global Credit Facility) which matured on February 10, 2017. This Global Credit Facility provides a source of funds to the Borrowers for temporary and emergency purposes, including the ability to meet future unanticipated or unusually large redemption requests. Effective February 10, 2017, the Borrowers renewed the Global Credit Facility for a one year term, maturing February 9, 2018, for a total of $2 billion.
Under the terms of the Global Credit Facility, the Fund shall, in addition to interest charged on any borrowings made by the Fund and other costs incurred by the Fund, pay its share of fees and expenses incurred in connection with the implementation and maintenance of the Global Credit Facility, based upon its relative share of the aggregate net assets of all of the Borrowers, including an annual commitment fee of 0.15% based upon the unused portion of the Global Credit Facility. These fees are reflected in other expenses in the Consolidated Statement of Operations. During the year ended December 31, 2016, the Fund did not use the Global Credit Facility.
11. Fair Value Measurements
The Fund follows a fair value hierarchy that distinguishes between market data obtained from independent sources (observable inputs) and the Fund’s own market assumptions (unobservable inputs). These inputs are used in determining the value of the Fund’s financial instruments and are summarized in the following fair value hierarchy:
| | • | | Level 1 – quoted prices in active markets for identical financial instruments |
| | • | | Level 2 – other significant observable inputs (including quoted prices for similar financial instruments, interest rates, prepayment speed, credit risk, etc.) |
| | • | | Level 3 – significant unobservable inputs (including the Fund’s own assumptions in determining the fair value of financial instruments) |
The input levels are not necessarily an indication of the risk or liquidity associated with financial instruments at that level.
For movements between the levels within the fair value hierarchy, the Fund has adopted a policy of recognizing the transfers as of the date of the underlying event which caused the movement.
FRANKLIN TEMPLETON VARIABLE INSURANCE PRODUCTS TRUST
NOTES TO CONSOLIDATED FINANCIAL STATEMENTS
Franklin Strategic Income VIP Fund (continued)
A summary of inputs used as of December 31, 2016, in valuing the Fund’s assets and liabilities carried at fair value, is as follows:
| | | | | | | | | | | | | | | | |
| | | Level 1 | | | Level 2 | | | Level 3 | | | Total | |
| Assets: | | | | | | | | | | | | | | | | |
Investments in Securities: | | | | | | | | | | | | | | | | |
Equity Investments:a | | | | | | | | | | | | | | | | |
Consumer Services | | $ | — | | | $ | — | | | $ | 8,913,040 | | | $ | 8,913,040 | |
Energy. | | | 1,416,183 | | | | 717,077 | b | | | 1,305,543 | b | | | 3,438,803 | |
Transportation | | | — | | | | 133,618 | | | | — | | | | 133,618 | |
All Other Equity Investmentsc | | | 50,082,130 | | | | — | b | | | — | | | | 50,082,130 | |
Corporate Bonds | | | — | | | | 289,280,411 | | | | — | | | | 289,280,411 | |
Senior Floating Rate Interests | | | — | | | | 72,235,261 | | | | — | | | | 72,235,261 | |
Foreign Government and Agency Securities | | | — | | | | 66,118,617 | | | | — | | | | 66,118,617 | |
U.S. Government and Agency Securities | | | — | | | | 36,114,447 | | | | — | | | | 36,114,447 | |
Asset-Backed Securities and Commercial Mortgage-Backed Securities | | | — | | | | 65,599,673 | | | | — | | | | 65,599,673 | |
Mortgage-Backed Securities | | | — | | | | 67,549,798 | | | | — | | | | 67,549,798 | |
Municipal Bonds | | | — | | | | 12,836,682 | | | | — | | | | 12,836,682 | |
Escrows and Litigation Trusts | | | — | | | | 74,498 | | | | 72,300 | b | | | 146,798 | |
Short Term Investments | | | 27,867,963 | | | | — | | | | — | | | | 27,867,963 | |
| | | | |
Total Investments in Securities | | $ | 79,366,276 | | | $ | 610,660,082 | | | $ | 10,290,883 | | | $ | 700,317,241 | |
| | | | |
Other Financial Instruments: | | | | | | | | | | | | | | | | |
Futures Contracts | | $ | 212,302 | | | $ | — | | | $ | — | | | $ | 212,302 | |
Forward Exchange Contracts | | | — | | | | 3,620,134 | | | | — | | | | 3,620,134 | |
Swap Contracts. | | | — | | | | 32,665 | | | | — | | | | 32,665 | |
| | | | |
Total Other Financial Instruments | | $ | 212,302 | | | $ | 3,652,799 | | | $ | — | | | $ | 3,865,101 | |
| | | | |
| Liabilities: | | | | | | | | | | | | | | | | |
Other Financial Instruments: | | | | | | | | | | | | | | | | |
Futures Contracts | | $ | 126,833 | | | $ | — | | | $ | — | | | $ | 126,833 | |
Forward Exchange Contracts | | | — | | | | 73,230 | | | | — | | | | 73,230 | |
Swap Contracts. | | | — | | | | 69,777 | | | | — | | | | 69,777 | |
| | | | |
Total Other Financial Instruments | | $ | 126,833 | | | $ | 143,007 | | | $ | — | | | $ | 269,840 | |
| | | | |
aIncludes common and convertible preferred stocks and management investment companies as well as other equity interests.
bIncludes securities determined to have no value at December 31, 2016.
cFor detailed categories, see the accompanying Consolidated Statement of Investments.
FRANKLIN TEMPLETON VARIABLE INSURANCE PRODUCTS TRUST
NOTES TO CONSOLIDATED FINANCIAL STATEMENTS
Franklin Strategic Income VIP Fund (continued)
A reconciliation of assets in which Level 3 inputs are used in determining fair value is presented when there are significant Level 3 financial instruments at the end of the year. At December 31, 2016, the reconciliation of assets is as follows:
| | | | | | | | | | | | | | | | | | | | | | | | | | | | | | | | | | | | | | | | |
| | | Balance at
Beginning of
Year | | | Purchases | | | Sales | | | Transfers
Into Level 3a | | | Transfers
Out of
Level 3 | | | Cost Basis
Adjustments | | | Net
Realized
Gain
(Loss) | | | Net
Unrealized
Appreciation
(Depreciation) | | | Balance at
End of
Year | | | Net Change in
Unrealized
Appreciation
(Depreciation)
on Assets
Held at Year End | |
Assets: | | | | | | | | | | | | | | | | | | | | | | | | | | | | | | | | | | | | | | | | |
Investments in Securities: | | | | | | | | | | | | | | | | | | | | | | | | | | | | | | | | | | | | | | | | |
Equity Investments:b | | | | | | | | | | | | | | | | | | | | | | | | | | | | | | | | | | | | | | | | |
Consumer Services | | $ | — | | | $ | — | | | $ | — | | | $ | 6,593,125 | | | $ | — | | | $ | — | | | $ | — | | | $ | 2,319,915 | | | $ | 8,913,040 | | | $ | 2,319,915 | |
Energy | | | — | | | | — | | | | — | | | | 1,109,267 | c | | | — | | | | — | | | | — | | | | 196,276 | | | | 1,305,543 | c | | | 196,276 | |
Corporate Bonds | | | 190,928 | | | | — | | | | (109,890 | ) | | | — | | | | — | | | | — | | | | (296,994 | ) | | | 215,956 | | | | — | | | | — | |
Escrow and Litigation Trusts | | | — | c | | | — | | | | (8,876 | ) | | | 85,500 | c | | | — | | | | — | | | | 8,876 | | | | (13,200 | ) | | | 72,300 | c | | | (13,200 | ) |
| | | | |
Total Investments in Securities | | $ | 190,928 | | | $ | — | | | $ | (118,766 | ) | | $ | 7,787,892 | | | $ | — | | | $ | — | | | $ | (288,118 | ) | | $ | 2,718,947 | | | $ | 10,290,883 | | | $ | 2,502,991 | |
| | | | |
aThe investments were transferred into Level 3 as result of the unavailability of other significant observable valuation inputs. May include amounts related to a corporate action.
bIncludes common stocks.
cIncludes securities determined to have no value.
Significant unobservable valuation inputs developed by the VC for material Level 3 financial instruments and impact to fair value as a result of changes in unobservable valuation inputs as of December 31, 2016, are as follows:
| | | | | | | | | | | | | | | | |
| Description | | Fair Value at
End of Year | | | Valuation Technique | | Unobservable Input | | Amount | | | Impact to Fair
Value if Input Increasesa | |
| Assets: | | | | | | | | | | | | | | | | |
| | | | | |
Investments in Securities: | | | | | | | | | | | | | | | | |
| | | | | |
Equity Investmentsb: | | | | | | | | | | | | | | | | |
Energy | | $ | 818,368 | | | Market Comparables | | Discount for lack of
marketability | | | 10.3% | | | | Decreasec | |
All Other Investments:d | | | 9,472,515 | | | | | | | | | | | | | |
Total | | $ | 10,290,883 | | | | | | | | | | | | | |
aRepresents the directional change in the fair value of the Level 3 financial instruments that would result from a significant and reasonable increase in the corresponding input. A significant and reasonable decrease in the input would have the opposite effect. Significant impacts, if any, to fair value and/or net assets have been indicated.
bIncludes common stocks.
cRepresents a significant impact to fair value but not net assets.
dIncludes financial instruments with values derived using prior transaction prices or third party pricing information without adjustment for which such inputs are unobservable. May also include fair value of immaterial financial instruments developed using various valuation techniques and unobservable inputs.
12. Investment Company Reporting Modernization
In October 2016, the U.S. Securities and Exchange Commission adopted new rules and amended existing rules (together, final rules) intended to modernize the reporting and disclosure of information by registered investment companies. In part, the final rules amend Regulation S-X and require standardized, enhanced disclosures about derivatives in investment company financial statements, as well as other amendments. The compliance date for the amendments to Regulation S-X is August 1, 2017. Management is currently evaluating the impact that the adoption of the amendments to Regulation S-X will have on the Fund’s financial statements and related disclosures.
FRANKLIN TEMPLETON VARIABLE INSURANCE PRODUCTS TRUST
NOTES TO CONSOLIDATED FINANCIAL STATEMENTS
Franklin Strategic Income VIP Fund (continued)
13. Subsequent Events
The Fund has evaluated subsequent events through the issuance of the financial statements and determined that no events have occurred that require disclosure other than those already disclosed in the financial statements.
Abbreviations
| | | | | | | | | | |
| Counterparty/Exchange | | Currency | | Selected Portfolio |
| | | | | |
| BZWS | | Barclays Bank PLC | | BRL | | Brazilian Real | | ARM | | Adjustable Rate Mortgage |
| | | | | |
| CITI | | Citigroup, Inc. | | EUR | | Euro | | CDO | | Collateralized Debt Obligation |
| | | | | |
| DBAB | | Deutsche Bank AG | | GBP | | British Pound | | CLO | | Collateralized Loan Obligation |
| | | | | |
| GSCO | | The Goldman Sachs Group, Inc. | | IDR | | Indonesian Rupiah | | FRN | | Floating Rate Note |
| | | | | |
| HSBK | | HSBC Bank PLC | | LKR | | Sri Lankan Rupee | | GDP | | Gross Domestic Product |
| | | | | |
| ICE | | Intercontinental Exchange | | MXN | | Mexican Peso | | GO | | General Obligation |
| | | | | |
| JPHQ | | JP Morgan Chase & Co. | | MYR | | Malaysian Ringgit | | HDC | | Housing Development Corp. |
| | | | | |
| | | | PHP | | Philippine Peso | | PIK | | Payment-In-Kind |
| | | | | |
| | | | UYU | | Uruguayan Peso | | SF | | Single Family |
| | | | | |
| | | | | | | | TRA | | Tax Receivable Agreement Right |
| | | | | |
| | | | | | | | VRI | | Value Recovery Instruments |
| | |
| Index Abbreviation |
| |
| CDX.NA.HY.27 | | CDX North America High Yield Index |
| |
| MCDX.NA.27 | | MCDX North America Index |
FRANKLIN TEMPLETON VARIABLE INSURANCE PRODUCTS TRUST
Report of Independent Registered Public Accounting Firm
To the Board of Trustees and Shareholders of Franklin Strategic Income VIP Fund
In our opinion, the accompanying consolidated statement of assets and liabilities, including the consolidated statement of investments, and the related consolidated statements of operations and of changes in net assets and the financial highlights present fairly, in all material respects, the financial position of Franklin Strategic Income VIP Fund (the “Fund”) as of December 31, 2016, the results of its operations for the year then ended, the changes in its net assets for each of the two years in the period then ended and the financial highlights for the periods presented, in conformity with accounting principles generally accepted in the United States of America. These financial statements and financial highlights (hereafter referred to as “financial statements”) are the responsibility of the Fund’s management. Our responsibility is to express an opinion on these financial statements based on our audits. We conducted our audits as of these financial statements in accordance with the standards of the Public Company Accounting Oversight Board (United States). Those standards require that we plan and perform the audit to obtain reasonable assurance about whether the financial statements are free of material misstatement. An audit includes examining, on a test basis, evidence supporting the amounts and disclosures in the financial statements, assessing the accounting principles used and significant estimates made by management, and evaluating the overall financial statement presentation. We believe that our audits, which included confirmation of securities as of December 31, 2016 by correspondence with the custodian, transfer agent and brokers, provide a reasonable basis for our opinion.
PricewaterhouseCoopers LLP
San Francisco, California
February 15, 2017
Franklin U.S. Government Securities VIP Fund
This annual report for Franklin U.S. Government Securities VIP Fund covers the fiscal year ended December 31, 2016.
Class 2 Performance Summary as of December 31, 2016
Average annual total return of Class 2 shares represents the average annual change in value, assuming reinvestment of dividends and capital gains. Average returns smooth out variations in returns, which can be significant; they are not the same as year-by-year results.
| | | | | | | | | | | | |
| Periods ended 12/31/16 | | 1-Year | | | 5-Year | | | 10-Year | |
Average Annual Total Return | | | +0.66% | | | | +0.82% | | | | +3.20% | |
Performance reflects the Fund’s Class 2 operating expenses, but does not include any contract fees, expenses or sales charges. If they had been included, performance would be lower. These charges and deductions, particularly for variable life policies, can have a significant effect on contract values and insurance benefits. See the contract prospectus for a complete description of these expenses, including sales charges.
Performance data represent past performance, which does not guarantee future results. Investment return and principal value will fluctuate, and you may have a gain or loss when you sell your shares. Current performance may differ from figures shown.
Total Return Index Comparison for a Hypothetical $10,000 Investment (1/1/07–12/31/16)
The graph below shows the change in value of a hypothetical $10,000 investment in the Fund over the indicated period and includes reinvestment of any income or distributions. The Fund’s performance is compared to the performance of the Bloomberg Barclays U.S. Government Index: Intermediate Component, the Lipper VIP General U.S. Government Funds Classification Average and the Consumer Price Index. One cannot invest directly in an index, and an index is not representative of the Fund’s portfolio. Please see Important Notes to Performance Information preceding the Fund Summaries.
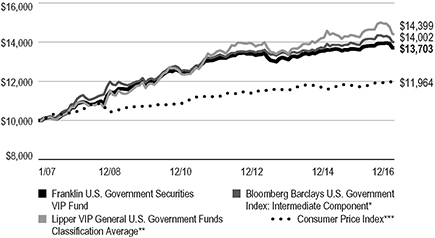
*Source: Morningstar. Please see Index Descriptions following the Fund Summaries.
**Source: Lipper, a Thomson Reuters Company. Please see Index Descriptions following the Fund Summaries.
***Source: Bureau of Labor Statistics, bls.gov/cpi. Please see Index Descriptions following the Fund Summaries.
FRANKLIN U.S. GOVERNMENT SECURITIES VIP FUND
Fund Goal and Main Investments
The Fund seeks income. Under normal market conditions, the Fund invests at least 80% of its net assets in U.S. government securities.
Fund Risks
All investments involve risks, including possible loss of principal. The Fund’s share price and yield will be affected by interest rate movements and mortgage prepayments. Bond prices generally move in the opposite direction of interest rates. Thus, as prices of bonds in the Fund adjust to a rise in interest rates, the Fund’s share price may decline. Changes in the financial strength of a bond issuer or in a bond’s credit rating may affect its value. The Fund is actively managed but there is no guarantee that the manager’s investment decisions will produce the desired results. The Fund’s prospectus also includes a description of the main investment risks.
Performance Overview
You can find the Fund’s one-year total return in the Performance Summary. In comparison, the Fund’s primary benchmark, the Bloomberg Barclays U.S. Government Index: Intermediate Component, produced a +1.05% total return.1 The Fund’s secondary benchmark, the Lipper VIP General U.S. Government Funds Classification Average, posted a +0.93% total return.2 Funds in the Lipper average may allocate as much as 35% of their investments in asset types other than U.S. government and agency mortgage-backed securities.
Economic and Market Overview
The U.S. economy expanded during the 12 months under review. The economy grew at a faster pace in 2016’s third quarter than in the second and first quarters, mainly due to personal consumption expenditures, exports, private inventory investment, federal government spending and nonresidential fixed investment. Manufacturing conditions remained volatile but generally expanded, and the services sector also continued to grow for most of the period. The unemployment rate decreased from 5.0% in December 2015 to 4.7% at period-end.3 Monthly retail sales grew for most of the review period, and rose to its highest level in April in more than a year,
Portfolio Composition
Based on Total Net Assets as of 12/31/16
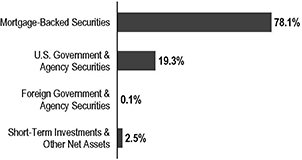
due to a broad-based increase across most retail categories. Inflation, as measured by the Consumer Price Index, remained relatively subdued for most of the period, but rose in 2016’s fourth quarter.
After maintaining its target interest rate in the 0.25%–0.50% range for nearly a year, the U.S. Federal Reserve (Fed), at its December meeting, increased its target range for the federal funds rate to 0.50%–0.75%, as policymakers noted improvement in U.S. labor market and inflation. The Federal Open Market Committee also hinted at three additional hikes in 2017. Furthermore, the Fed raised its forecast for 2017 U.S. economic growth, and lowered its unemployment projections.
The 10-year U.S. Treasury yield, which moves inversely to price, ended the period slightly higher than where it started and shifted significantly during the period. At the beginning of the period, negative global interest rates, continued accommodative central bank policies and a general risk-averse sentiment boosted safe haven buying by investors. These factors drove the 10-year yield to a period low of 1.37% in early July, down from 2.27% on December 31, 2015. Near period-end, rates moved higher based on improved economic data, expectations for the Fed to raise interest rates at its December 2016 meeting and a sentiment shift among investors that held that possible expansionary fiscal policies under the new U.S. president Donald Trump could lead to a stronger economy and higher inflation.
1. Source: Morningstar.
2. Source: Lipper, a Thomson Reuters Company.
One cannot invest directly in an index, and an index is not representative of the Fund’s portfolio. Please see Index Descriptions following the Fund Summaries.
3. Source: Bureau of Labor Statistics.
The dollar value, number of shares or principal amount, and names of all portfolio holdings are listed in the Fund’s Statement of Investments (SOI).
FRANKLIN U.S. GOVERNMENT SECURITIES VIP FUND
Investment Strategy
Using our straightforward investment approach, we seek to produce current income with a high degree of credit safety from a conservatively managed portfolio of U.S. government securities. Analyzing securities using proprietary and nonproprietary research, we seek to identify attractive investment opportunities.
Manager’s Discussion
The overall mortgage market provided mixed results during the period as Treasuries outperformed mortgage-backed securities (MBS). In contrast, commercial MBS, asset-backed securities and U.S. agency securities outpaced Treasuries. The Fed’s continued reinvestment of principal proceeds back into agency MBS and moderate supply have provided positive technical support for the sector. Without the Fed’s support, MBS is more vulnerable to supply shocks until alternative demand sources emerge. Banks, mortgage real estate investment trusts, overseas investors and domestic money managers are possible sources, but would need to increase their allocation to the sector to compensate for the Fed’s reduced presence in the MBS sector. As we move closer to the Fed ceasing reinvestment, coupled with tight spreads, we believe MBS could experience higher volatility. Although recent lower mortgage rates could increase prepayment speeds, our overall prepayment expectations remained anchored and we feel they could moderate with mortgage rates staying range bound and underwriting standards remaining tight.
The Fund maintains a consistent and disciplined approach to our investment strategy. The Fund’s investment process and strategy have not changed, and the team continues to look for strong cash flow fundamentals and valuations seeking to uncover opportunities across the agency mortgage and agency debenture universe. The Fund emphasizes agency pass-throughs and invests in other agency securities for diversification purposes.
Within the agency mortgage pass-through sector, Ginnie Mae (GNMA) MBS, Freddie Mac MBS and Fannie Mae MBS had negative excess returns but positive total returns during the period.
During the period, we were more weighted toward GNMA IIs (pools of mortgages from multiple issuers) than GNMA Is (pools of mortgages from single issuers). Over the period, we increased exposure to GNMA II 3.0% and 3.5% coupons, while reducing the exposure to 4.0% and 4.5% coupons. At period-end, our heaviest exposures were in 3.5% and 4.0% coupons. Based on excess returns over Treasuries, GNMAs
produced negative returns, with lower-coupon GNMAs providing better performance than higher coupon securities.
The Fund’s selection within fixed-rate agency mortgage-backed securities was a contributor during the period, as were the Fund’s positions in Treasury inflation protected securities and U.S. agency securities. In contrast, our defensive U.S. yield curve positioning was a detractor as yield curve movements had a negative impact relative to the benchmark.
Thank you for your participation in Franklin U.S. Government Securities VIP Fund. We look forward to serving your future investment needs.
FRANKLIN U.S. GOVERNMENT SECURITIES VIP FUND
The foregoing information reflects our analysis, opinions and portfolio holdings as of December 31, 2016, the end of the reporting period. The way we implement our main investment strategies and the resulting portfolio holdings may change depending on factors such as market and economic conditions. These opinions may not be relied upon as investment advice or an offer for a particular security. The information is not a complete analysis of every aspect of any market, country, industry, security or the Fund. Statements of fact are from sources considered reliable, but the investment manager makes no representation or warranty as to their completeness or accuracy. Although historical performance is no guarantee of future results, these insights may help you understand our investment management philosophy.
FRANKLIN U.S. GOVERNMENT SECURITIES VIP FUND
Class 2 Fund Expenses
As an investor in a variable insurance contract (Contract) that indirectly provides for investment in an underlying mutual fund, you can incur transaction and/or ongoing expenses at both the Fund level and the Contract Level: (1) transaction expenses can include sales charges (loads) on purchases, surrender fees, transfer fees and premium taxes; and (2) ongoing expenses can include management fees, distribution and service (12b-1) fees, contract fees, annual maintenance fees, mortality and expense risk fees and other fees and expenses. All mutual funds and Contracts have some types of ongoing expenses. The table below shows Fund-level ongoing expenses and can help you understand these costs and compare them with those of other mutual funds offered through the Contract. The table assumes a $1,000 investment held for the six months indicated. Please refer to the Fund prospectus for additional information on operating expenses.
Actual Fund Expenses
The table below provides information about the actual account values and actual expenses in the columns under the heading “Actual.” In these columns the Fund’s actual return, which includes the effect of ongoing Fund expenses but does not include the effect of ongoing Contract expenses, is used to calculate the “Ending Account Value.” You can estimate the Fund-level expenses you paid during the period by following these steps (of course, your account value and expenses will differ from those in this illustration):
| | Divide your account value by $1,000 |
(if your account had an $8,600 value, then $8,600 ÷ $1,000 = 8.6).
| | Then multiply the result by the number under the headings “Actual” and “Fund-Level Expenses Paid During Period” |
(if Fund-Level Expenses Paid During Period were $ 7.50, then
8.6 × $7.50 = $64.50). In this illustration, the estimated expenses paid this period at the Fund level are $64.50.
Hypothetical Example for Comparison with Other Mutual Funds
Under the heading “Hypothetical” in the table, information is provided about hypothetical account values and hypothetical expenses based on the Fund’s actual expense ratio and an assumed rate of return of 5% per year before expenses, which is not the Fund’s actual return. This information may not be used to estimate the actual ending account balance or expenses you paid for the period, but it can help you compare ongoing costs of investing in the Fund with those of other mutual funds offered through the Contract. To do so, compare this 5% hypothetical example with the 5% hypothetical examples that appear in the shareholder reports of other funds offered through the Contract.
Please note that expenses shown in the table are meant to highlight ongoing costs at the Fund level only and do not reflect any ongoing expenses at the Contract level, or transaction expenses at either the Fund or Contract levels. In addition, while the Fund does not have transaction expenses, if the transaction and ongoing expenses at the Contract level were included, the expenses shown below would be higher. You should consult your Contract prospectus or disclosure document for more information.
| | | | | | | | | | | | | | | | | | | | | | | | |
| | | | | | Actual
(actual return after expenses) | | | Hypothetical
(5% annual return before expenses) | | | | |
| Share Class | |
| Beginning Account
Value 7/1/16 |
| |
| Ending Account
Value 12/31/16 |
| |
| Fund-Level
Expenses Paid During Period 7/1/16–12/31/16 |
1 | |
| Ending Account
Value 12/31/16 |
| |
| Fund-Level
Expenses Paid During Period 7/1/16–12/31/16 |
1 | |
| Annualized
Expense
Ratio |
|
Class 2 | | | $1,000 | | | | $983.90 | | | | $3.74 | | | | $1,021.37 | | | | $3.81 | | | | 0.75% | |
1. Expenses are equal to the annualized expense ratio for the six-month period as indicated above — in the far right column — multiplied by the simple average account value over the period indicated, and then multiplied by 184/366 to reflect the one-half year period.
FRANKLIN TEMPLETON VARIABLE INSURANCE PRODUCTS TRUST
Financial Highlights
Franklin U.S. Government Securities VIP Fund
| | | | | | | | | | | | | | | | | | | | |
| | | Year Ended December 31, | |
| | | 2016 | | | 2015 | | | 2014 | | | 2013 | | | 2012 | |
| Class 1 | | | | | | | | | | | | | | | | | | | | |
Per share operating performance
(for a share outstanding throughout the year) | | | | | | | | | | | | | | | | | | | | |
| | | | | |
Net asset value, beginning of year | | | $12.74 | | | | $13.00 | | | | $12.91 | | | | $13.57 | | | | $13.67 | |
| | | | |
| | | | | |
| Income from investment operationsa: | | | | | | | | | | | | | | | | | | | | |
| | | | | |
Net investment incomeb | | | 0.22 | | | | 0.21 | | | | 0.24 | | | | 0.24 | | | | 0.32 | |
| | | | | |
Net realized and unrealized gains (losses) | | | (0.10 | ) | | | (0.12 | ) | | | 0.22 | | | | (0.51 | ) | | | (0.03 | ) |
| | | | |
Total from investment operations | | | 0.12 | | | | 0.09 | | | | 0.46 | | | | (0.27 | ) | | | 0.29 | |
| | | | |
| | | | | |
| Less distributions from net investment income | | | (0.35 | ) | | | (0.35 | ) | | | (0.37 | ) | | | (0.39 | ) | | | (0.39 | ) |
| | | | |
Net asset value, end of year | | | $12.51 | | | | $12.74 | | | | $13.00 | | | | $12.91 | | | | $13.57 | |
| | | | |
| | | | | |
Total returnc | | | 0.90% | | | | 0.71% | | | | 3.64% | | | | (1.99)% | | | | 2.12% | |
| | | | | |
| Ratios to average net assets | | | | | | | | | | | | | | | | | | | | |
| | | | | |
Expenses | | | 0.50% | d | | | 0.50% | d | | | 0.49% | d | | | 0.49% | d | | | 0.50% | |
| | | | | |
Net investment income | | | 1.75% | | | | 1.64% | | | | 1.84% | | | | 1.84% | | | | 2.36% | |
| | | | | |
| Supplemental data | | | | | | | | | | | | | | | | | | | | |
| | | | | |
Net assets, end of year (000’s) | | | $73,695 | | | | $79,620 | | | | $90,656 | | | | $99,947 | | | | $126,536 | |
| | | | | |
Portfolio turnover rate | | | 86.28% | | | | 61.91% | | | | 42.88% | | | | 69.47% | | | | 45.89% | |
| | | | | |
| Portfolio turnover rate excluding mortgage dollar rollse | | | 86.28% | | | | 61.91% | | | | 42.88% | | | | 67.80% | | | | 45.89% | |
aThe amount shown for a share outstanding throughout the period may not correlate with the Statement of Operations for the period due to the timing of sales and repurchases of the Fund’s shares in relation to income earned and/or fluctuating fair value of the investments of the Fund.
bBased on average daily shares outstanding.
cTotal return does not include fees, charges or expenses imposed by the variable annuity and life insurance contracts for which Franklin Templeton Variable Insurance Products Trust serves as an underlying investment vehicle.
dBenefit of expense reduction rounds to less than 0.01%.
eSee Note 1(c) regarding mortgage dollar rolls.
| | | | |
| 6 | | Annual Report | The accompanying notes are an integral part of these financial statements. | | |
FRANKLIN TEMPLETON VARIABLE INSURANCE PRODUCTS TRUST
FINANCIAL HIGHLIGHTS
Franklin U.S. Government Securities VIP Fund (continued)
| | | | | | | | | | | | | | | | | | | | |
| | | Year Ended December 31, | |
| | | 2016 | | | 2015 | | | 2014 | | | 2013 | | | 2012 | |
| Class 2 | | | | | | | | | | | | | | | | | | | | |
Per share operating performance
(for a share outstanding throughout the year) | | | | | | | | | | | | | | | | | | | | |
| | | | | |
Net asset value, beginning of year | | | $12.47 | | | | $12.73 | | | | $12.65 | | | | $13.31 | | | | $13.42 | |
| | | | |
| | | | | |
| Income from investment operationsa: | | | | | | | | | | | | | | | | | | | | |
| | | | | |
Net investment incomeb | | | 0.19 | | | | 0.18 | | | | 0.20 | | | | 0.21 | | | | 0.28 | |
| | | | | |
Net realized and unrealized gains (losses) | | | (0.10 | ) | | | (0.12 | ) | | | 0.22 | | | | (0.50 | ) | | | (0.03 | ) |
| | | | |
Total from investment operations | | | 0.09 | | | | 0.06 | | | | 0.42 | | | | (0.29 | ) | | | 0.25 | |
| | | | |
| | | | | |
| Less distributions from net investment income | | | (0.32 | ) | | | (0.32 | ) | | | (0.34 | ) | | | (0.37 | ) | | | (0.36 | ) |
| | | | |
Net asset value, end of year | | | $12.24 | | | | $12.47 | | | | $12.73 | | | | $12.65 | | | | $13.31 | |
| | | | |
| | | | | |
Total returnc | | | 0.66% | | | | 0.47% | | | | 3.38% | | | | (2.24)% | | | | 1.89% | |
| | | | | |
| Ratios to average net assets | | | | | | | | | | | | | | | | | | | | |
| | | | | |
Expenses | | | 0.75%d | | | | 0.75% | d | | | 0.74% | d | | | 0.74% | d | | | 0.75% | |
| | | | | |
Net investment income | | | 1.50% | | | | 1.39% | | | | 1.59% | | | | 1.59% | | | | 2.11% | |
| | | | | |
| Supplemental data | | | | | | | | | | | | | | | | | | | | |
| | | | | |
Net assets, end of year (000’s) | | | $1,268,963 | | | | $1,311,974 | | | | $1,369,037 | | | | $1,267,994 | | | | $1,206,089 | |
| | | | | |
Portfolio turnover rate | | | 86.28% | | | | 61.91% | | | | 42.88% | | | | 69.47% | | | | 45.89% | |
| | | | | |
| Portfolio turnover rate excluding mortgage dollar rollse | | | 86.28% | | | | 61.91% | | | | 42.88% | | | | 67.80% | | | | 45.89% | |
aThe amount shown for a share outstanding throughout the period may not correlate with the Statement of Operations for the period due to the timing of sales and repurchases of the Fund’s shares in relation to income earned and/or fluctuating fair value of the investments of the Fund.
bBased on average daily shares outstanding.
cTotal return does not include fees, charges or expenses imposed by the variable annuity and life insurance contracts for which Franklin Templeton Variable Insurance Products Trust serves as an underlying investment vehicle.
dBenefit of expense reduction rounds to less than 0.01%.
eSee Note 1(c) regarding mortgage dollar rolls.
| | | | | | |
| | | The accompanying notes are an integral part of these financial statements. | Annual Report | | | FUS-7 | |
FRANKLIN TEMPLETON VARIABLE INSURANCE PRODUCTS TRUST
Statement of Investments, December 31, 2016
| | | | | | | | | | |
Franklin U.S. Government Securities VIP Fund | |
| | | | | Principal Amount* | | | Value | |
| | | | | | | | | | |
| | | Mortgage-Backed Securities 78.1% | | | | | | |
| a | | Federal Home Loan Mortgage Corp. (FHLMC) Adjustable Rate 1.9% | | | | | | |
| | FHLMC, 2.783%, 6/01/37 | | $ | 7,618,636 | | | $ | 8,018,735 | |
| | FHLMC, 2.971%, 4/01/40 | | | 10,157,970 | | | | 10,779,346 | |
| | FHLMC, 2.71% - 3.035%, 3/01/36 - 5/01/38 | | | 5,887,564 | | | | 6,235,208 | |
| | | | | | | | | | |
| | | | | | | | | 25,033,289 | |
| | | | | | | | | | |
| | | Federal Home Loan Mortgage Corp. (FHLMC) Fixed Rate 8.3% | | | | | | |
| | FHLMC Gold 15 Year, 4.50%, 3/01/25 - 4/01/25 | | | 1,489,304 | | | | 1,564,515 | |
| | FHLMC Gold 30 Year, 3.00%, 5/01/43 | | | 550,196 | | | | 549,777 | |
| | FHLMC Gold 30 Year, 3.00%, 6/01/46 | | | 42,361,127 | | | | 42,092,905 | |
| | FHLMC Gold 30 Year, 3.00%, 10/01/46 | | | 29,698,164 | | | | 29,509,736 | |
| | FHLMC Gold 30 Year, 3.50%, 3/01/32 - 5/01/43 | | | 4,834,458 | | | | 5,004,223 | |
| | FHLMC Gold 30 Year, 3.50%, 9/01/46 | | | 8,659,510 | | | | 8,872,580 | |
| | FHLMC Gold 30 Year, 4.00%9/01/40 - 12/01/41 | | | 8,593,456 | | | | 9,066,996 | |
| | FHLMC Gold 30 Year, 4.50%, 5/01/40 - 7/01/41 | | | 3,580,503 | | | | 3,862,132 | |
| | FHLMC Gold 30 Year, 5.00%, 9/01/33 - 4/01/40 | | | 5,734,943 | | | | 6,262,987 | |
| | FHLMC Gold 30 Year, 5.50%7/01/33 - 5/01/38 | | | 1,692,772 | | | | 1,897,376 | |
| | FHLMC Gold 30 Year, 6.00%, 1/01/24 - 8/01/35 | | | 1,112,861 | | | | 1,266,321 | |
| | FHLMC Gold 30 Year, 6.50%, 12/01/23 - 5/01/35 | | | 562,398 | | | | 635,620 | |
| | FHLMC Gold 30 Year, 7.00%4/01/24 - 6/01/32 | | | 228,983 | | | | 251,964 | |
| | FHLMC Gold 30 Year, , 7.50%, 12/01/22 - 5/01/24 | | | 3,914 | | | | 4,000 | |
| | FHLMC Gold 30 Year, 8.00%, 9/01/21 - 5/01/22 | | | 4,119 | | | | 4,568 | |
| | FHLMC Gold 30 Year, 8.50%, 10/01/21 - 7/01/31 | | | 401,452 | | | | 495,499 | |
| | FHLMC PC 30 Year, 8.00%, 1/01/17 | | | 161 | | | | 161 | |
| | FHLMC PC 30 Year, 8.50%, 9/01/20 | | | 197 | | | | 199 | |
| | | | | | | | | | |
| | | | | | | | | 111,341,559 | |
| | | | | | | | | | |
| a | | Federal National Mortgage Association (FNMA) Adjustable Rate 6.0% | | | | | | | | |
| | FNMA, 1.774% - 2.711%, 3/01/17 - 10/01/44 | | | 11,440,526 | | | | 11,991,459 | |
| | FNMA, 2.713%, 7/01/38 | | | 6,854,307 | | | | 7,236,355 | |
| | FNMA, 2.718%, 7/01/38 | | | 6,485,600 | | | | 6,821,750 | |
| | FNMA, 2.88%, 10/01/35 | | | 8,167,263 | | | | 8,652,327 | |
| | FNMA, 2.935%, 8/01/36 | | | 8,194,165 | | | | 8,636,040 | |
| | FNMA, 3.136%, 9/01/37 | | | 23,204,878 | | | | 24,536,779 | |
| | FNMA, 2.712% - 7.22%, 8/01/18 - 3/01/47 | | | 11,736,375 | | | | 12,301,770 | |
| | | | | | | | | | |
| | | | | | | | | 80,176,480 | |
| | | | | | | | | | |
| | | Federal National Mortgage Association (FNMA) Fixed Rate 7.5% | | | | | | |
| | FNMA 15 Year, 2.64%, 7/01/25 | | | 2,500,000 | | | | 2,454,911 | |
| | FNMA 15 Year, 2.77%, 4/01/25 | | | 3,500,000 | | | | 3,466,062 | |
| | FNMA 15 Year, 2.99%, 11/01/24 | | | 3,000,000 | | | | 3,032,615 | |
| | FNMA 15 Year, 3.14%, 10/01/25 | | | 4,000,000 | | | | 4,036,342 | |
| | FNMA 15 Year, 3.28%, 7/01/27 | | | 4,000,000 | | | | 3,961,843 | |
| | FNMA 15 Year, 3.51%, 8/01/23 | | | 3,000,000 | | | | 3,134,484 | |
| | FNMA 15 Year, 5.50%, 11/01/17 - 1/01/25 | | | 1,673,417 | | | | 1,800,209 | |
| | FNMA 15 Year, 6.00%, 8/01/17 - 9/01/17 | | | 16,708 | | | | 16,821 | |
| | FNMA 30 Year, 3.00%, 12/01/42 | | | 240,681 | | | | 240,074 | |
| | FNMA 30 Year, 3.50%, 7/01/45 | | | 41,661,183 | | | | 42,720,048 | |
| | FNMA 30 Year, 4.00%, 1/01/41 - 8/01/41 | | | 10,105,087 | | | | 10,637,847 | |
| | FNMA 30 Year, 4.50%, 8/01/40 - 6/01/41 | | | 9,776,835 | | | | 10,538,134 | |
| | FNMA 30 Year, 5.00%, 3/01/34 - 7/01/41 | | | 6,486,913 | | | | 7,082,710 | |
| | FNMA 30 Year, 5.50%, 12/01/32 - 8/01/35 | | | 2,363,475 | | | | 2,642,547 | |
| | FNMA 30 Year, 6.00%, 1/01/24 - 8/01/38 | | | 2,804,322 | | | | 3,174,855 | |
| | FNMA 30 Year, 6.50%, 1/01/24 - 9/01/36 | | | 576,604 | | | | 657,857 | |
FRANKLIN TEMPLETON VARIABLE INSURANCE PRODUCTS TRUST
STATEMENT OF INVESTMENTS
Franklin U.S. Government Securities VIP Fund (continued)
| | | | | | | | | | |
| | | | | Principal Amount* | | | Value | |
| | | | | | | | | | |
| | | Mortgage-Backed Securities (continued) | | | | | | |
| | | Federal National Mortgage Association (FNMA) Fixed Rate (continued) | | | | | | |
| | FNMA 30 Year, 7.50%, 4/01/23 - 8/01/25 | | $ | 20,044 | | | $ | 21,017 | |
| | FNMA 30 Year, 8.00%, 3/01/22 - 2/01/25 | | | 99,177 | | | | 102,213 | |
| | FNMA 30 Year, 8.50%, 3/01/20 - 6/01/21 | | | 534 | | | | 563 | |
| | FNMA 30 Year, 9.00%, 10/01/26 | | | 89,182 | | | | 95,666 | |
| | FNMA GL 30 Year, 8.00%, 8/01/19. | | | 4,624 | | | | 4,651 | |
| | FNMA PL 30 Year, 5.50%, 4/01/34 | | | 1,436,252 | | | | 1,559,673 | |
| | | | | | | | | | |
| | | | | | | | | 101,381,142 | |
| | | | | | | | | | |
| | | Government National Mortgage Association (GNMA) Fixed Rate 54.4% | | | | | | |
| | GNMA I SF 30 Year, 3.00%, 7/15/42 | | | 652,186 | | | | 661,500 | |
| | GNMA I SF 30 Year, 4.00%, 10/15/40 - 4/15/45 | | | 12,521,917 | | | | 13,415,427 | |
| | GNMA I SF 30 Year, 4.00%, 5/15/45 - 8/15/46 | | | 2,168,591 | | | | 2,324,112 | |
| | GNMA I SF 30 Year, 4.50%, 1/15/39 - 4/15/40 | | | 11,519,744 | | | | 12,560,989 | |
| | GNMA I SF 30 Year, 4.50%, 4/15/40 - 6/15/41 | | | 9,663,128 | | | | 10,520,009 | |
| | GNMA I SF 30 Year, 5.00%, 6/15/30 - 10/15/39 | | | 12,095,687 | | | | 13,362,469 | |
| | GNMA I SF 30 Year, 5.00%, 10/15/39 - 3/15/40 | | | 12,014,012 | | | | 13,364,743 | |
| | GNMA I SF 30 Year, 5.00%, 3/15/40 - 9/15/40 | | | 7,255,099 | | | | 8,049,940 | |
| | GNMA I SF 30 Year, 5.50%, 12/15/28 - 10/15/39 | | | 7,352,938 | | | | 8,282,363 | |
| | GNMA I SF 30 Year, 6.00%, 11/15/23 - 11/15/38 | | | 3,930,965 | | | | 4,506,389 | |
| | GNMA I SF 30 Year, 6.50%, 6/15/23 - 9/15/38 | | | 2,031,143 | | | | 2,325,195 | |
| | GNMA I SF 30 Year, 7.00%, 9/15/22 - 1/15/32 | | | 534,465 | | | | 564,324 | |
| | GNMA I SF 30 Year, 7.50%, 2/15/17 - 8/15/33 | | | 568,561 | | | | 643,928 | |
| | GNMA I SF 30 Year, 8.00%, 3/15/17 - 5/15/24 | | | 142,329 | | | | 147,165 | |
| | GNMA I SF 30 Year, 8.50%, 6/15/22 - 12/15/24 | | | 50,463 | | | | 51,734 | |
| | GNMA I SF 30 Year, 9.00%, 4/15/17 - 5/15/20 | | | 9,144 | | | | 9,184 | |
| | GNMA I SF 30 Year, 9.50%, 9/15/17 - 12/15/20 | | | 30,400 | | | | 31,038 | |
| | GNMA I SF 30 Year, 10.00%, 11/15/17 - 8/15/21 | | | 15,319 | | | | 15,721 | |
| | GNMA II SF 30 Year, 3.00%, 12/20/42 - 2/20/45 | | | 3,360,896 | | | | 3,407,181 | |
| | GNMA II SF 30 Year, 3.00%, 9/20/45 | | | 12,841,762 | | | | 13,015,966 | |
| | GNMA II SF 30 Year, 3.00%, 8/20/46 | | | 12,953,585 | | | | 13,129,305 | |
| | GNMA II SF 30 Year, 3.00%, 10/20/46 | | | 12,572,917 | | | | 12,743,473 | |
| | GNMA II SF 30 Year, 3.50%, 12/20/40 - 8/20/43 | | | 3,476,941 | | | | 3,628,694 | |
| | GNMA II SF 30 Year, 3.50%, 8/20/42 | | | 9,621,596 | | | | 10,044,274 | |
| | GNMA II SF 30 Year, 3.50%, 9/20/42 | | | 27,620,613 | | | | 28,834,003 | |
| | GNMA II SF 30 Year, 3.50%, 10/20/42 | | | 8,413,173 | | | | 8,782,770 | |
| | GNMA II SF 30 Year, 3.50%, 11/20/42 | | | 16,446,683 | | | | 17,169,205 | |
| | GNMA II SF 30 Year, 3.50%, 12/20/42 | | | 12,384,469 | | | | 12,928,539 | |
| | GNMA II SF 30 Year, 3.50%, 1/20/43 | | | 20,688,201 | | | | 21,597,070 | |
| | GNMA II SF 30 Year, 3.50%, 3/20/43 | | | 7,574,382 | | | | 7,904,343 | |
| | GNMA II SF 30 Year, 3.50%, 4/20/43 | | | 9,583,660 | | | | 10,001,155 | |
| | GNMA II SF 30 Year, 3.50%, 5/20/43 | | | 17,375,202 | | | | 18,137,635 | |
| | GNMA II SF 30 Year, 3.50%, 6/20/43 | | | 7,974,541 | | | | 8,324,693 | |
| | GNMA II SF 30 Year, 3.50%, 7/20/46 | | | 70,416,781 | | | | 73,250,927 | |
| | GNMA II SF 30 Year, 3.50%, 8/20/46 | | | 42,694,839 | | | | 44,417,674 | |
| | GNMA II SF 30 Year, 3.50%, 9/20/46 | | | 11,600,303 | | | | 12,069,841 | |
| | GNMA II SF 30 Year, 3.50%, 10/20/46 | | | 142,470,831 | | | | 148,231,675 | |
| | GNMA II SF 30 Year, 4.00%, 11/20/39 - 2/20/41 | | | 12,107,408 | | | | 12,977,229 | |
| | GNMA II SF 30 Year, 4.00%, 3/20/41 - 2/20/44 | | | 9,247,054 | | | | 9,873,627 | |
| | GNMA II SF 30 Year, 4.00%, 11/20/41 | | | 9,653,830 | | | | 10,284,705 | |
| | GNMA II SF 30 Year, 4.00%, 2/20/46 | | | 8,213,235 | | | | 8,729,044 | |
| | GNMA II SF 30 Year, 4.00%, 5/20/46 | | | 48,924,266 | | | | 51,996,812 | |
| | GNMA II SF 30 Year, 4.50%, 10/20/39 - 5/20/41 | | | 10,509,294 | | | | 11,340,181 | |
FRANKLIN TEMPLETON VARIABLE INSURANCE PRODUCTS TRUST
STATEMENT OF INVESTMENTS
Franklin U.S. Government Securities VIP Fund (continued)
| | | | | | | | | | |
| | | | | Principal Amount* | | | Value | |
| | | | | | | | | | |
| | | Mortgage-Backed Securities (continued) | | | | | | |
| | | Government National Mortgage Association (GNMA) Fixed Rate (continued) | | | | | | |
| | GNMA II SF 30 Year, 4.50%, 6/20/41 - 10/20/41 | | $ | 11,540,756 | | | $ | 12,423,341 | |
| | GNMA II SF 30 Year, 4.50%, 9/20/41 | | | 7,737,918 | | | | 8,340,395 | |
| | GNMA II SF 30 Year, 4.50%, 3/20/42 - 2/20/44 | | | 8,545,809 | | | | 9,186,075 | |
| | GNMA II SF 30 Year, 4.50%, 10/20/44 | | | 4,522,707 | | | | 4,832,151 | |
| | GNMA II SF 30 Year, 5.00%, 9/20/33 - 9/20/41 | | | 12,027,826 | | | | 13,277,376 | |
| | GNMA II SF 30 Year, 5.00%, 10/20/42 - 6/20/44 | | | 5,491,838 | | | | 5,924,893 | |
| | GNMA II SF 30 Year, 5.50%, 5/20/34 - 6/20/38 | | | 6,343,469 | | | | 7,095,085 | |
| | GNMA II SF 30 Year, 6.00%, 11/20/23 - 7/20/39 | | | 3,988,877 | | | | 4,592,995 | |
| | GNMA II SF 30 Year, 6.50%, 12/20/27 - 4/20/34 | | | 600,025 | | | | 685,598 | |
| | GNMA II SF 30 Year, 7.00%, 5/20/32 | | | 9,953 | | | | 11,521 | |
| | GNMA II SF 30 Year, 7.50%, 11/20/17 - 5/20/33 | | | 109,847 | | | | 122,541 | |
| | GNMA II SF 30 Year, 8.00%, 8/20/26 | | | 7,292 | | | | 8,718 | |
| | GNMA II SF 30 Year, 9.50%, 4/20/25 | | | 2,290 | | | | 2,301 | |
| | | | | | | | | | |
| | | | | | | | | 730,159,241 | |
| | | | | | | | | | |
| | | |
| | Total Mortgage-Backed Securities (Cost $1,056,586,074) | | | | | | | 1,048,091,711 | |
| | | | | | | | | | |
| | Foreign Government and Agency Securities (Cost $1,749,958) 0.1% | | | | | | | | |
| b | | International Bank for Reconstruction and Development, Principal Strip, 7/15/17 (Supranational) | | | 1,761,000 | | | | 1,753,062 | |
| | | | | | | | | | |
| | | U.S. Government and Agency Securities 19.3% | | | | | | |
| | Federal Agricultural Mortgage Corp., | | | | | | | | |
| | 4.30%, 5/13/19. | | | 1,010,000 | | | | 1,075,661 | |
| | 1.41%, 3/06/20. | | | 10,000,000 | | | | 9,907,410 | |
| | 2.66%, 4/12/22. | | | 7,000,000 | | | | 7,111,013 | |
| c | | Federal Agricultural Mortgage Corp. Guaranteed Trust 07-1, 144A, 5.125%, 4/19/17 | | | 13,000,000 | | | | 13,173,056 | |
| | FHLB, | | | | | | | | |
| | 5.25%, 6/05/17. | | | 9,000,000 | | | | 9,170,739 | |
| | 2.625%, 9/12/25 | | | 20,000,000 | | | | 19,906,060 | |
| | FICO, | | | | | | | | |
| | 1P, Strip, 5/11/18 | | | 10,000,000 | | | | 9,824,380 | |
| | 12, Strip, 6/06/18 | | | 4,627,000 | | | | 4,547,809 | |
| | 13P, Strip, 12/27/18 | | | 2,500,000 | | | | 2,420,903 | |
| | 15P, Strip, 3/07/19 | | | 1,798,000 | | | | 1,742,267 | |
| | 16, Strip, 4/05/17 | | | 12,367,000 | | | | 12,342,093 | |
| | A-P, Strip, 2/08/18 | | | 1,000,000 | | | | 986,313 | |
| | B-P, Strip, 4/06/18 | | | 1,405,000 | | | | 1,383,363 | |
| | D-P, Strip, 9/26/19 | | | 7,605,000 | | | | 7,281,194 | |
| | E-P, Strip, 11/02/18 | | | 8,896,000 | | | | 8,702,218 | |
| | Israel Government Agency for International Development Bond, | | | | | | | | |
| | 5.50%, 9/18/23. | | | 12,000,000 | | | | 14,199,468 | |
| | 7-Z, U.S. Government Guaranteed, Strip, 8/15/22 | | | 5,619,000 | | | | 4,853,102 | |
| | U.S. Government Guaranteed, Strip, 5/01/17 | | | 5,000,000 | | | | 4,989,230 | |
| | New Valley Generation IV, secured bond, 4.687%, 1/15/22 | | | 2,253,572 | | | | 2,397,861 | |
| | Overseas Private Investment Corp., | | | | | | | | |
| | A, zero cpn., 2/19/18 | | | 682,174 | | | | 719,238 | |
| | A, zero cpn., 11/15/20 | | | 2,575,000 | | | | 3,062,280 | |
| | Private Export Funding Corp., | | | | | | | | |
| | secured bond, 2.80%, 5/15/22 | | | 9,000,000 | | | | 9,186,057 | |
| | secured note, 4.30%, 12/15/21. | | | 1,865,000 | | | | 2,051,912 | |
| | secured note, LL, 2.25%, 3/15/20 | | | 1,700,000 | | | | 1,726,495 | |
| | senior secured note, MM, 2.30%, 9/15/20 | | | 3,500,000 | | | | 3,568,414 | |
FRANKLIN TEMPLETON VARIABLE INSURANCE PRODUCTS TRUST
STATEMENT OF INVESTMENTS
Franklin U.S. Government Securities VIP Fund (continued)
| | | | | | | | | | |
| | | | | Principal Amount* | | | Value | |
| | | | | | | | | | |
| | | U.S. Government and Agency Securities (continued) | | | | | | |
| | SBA, | | | | | | | | |
| | a FRN, 3.375%, 3/25/18 | | $ | 93,636 | | | $ | 93,787 | |
| | PC, 1997-20G, 1, 6.85%, 7/01/17 | | | 24,758 | | | | 25,068 | |
| | PC, 1998-20I, 1, 6.00%, 9/01/18 | | | 147,761 | | | | 150,236 | |
| | Tunisia Government Agency for International Development Bonds, 1.686%, 7/16/19 | | | 7,000,000 | | | | 7,012,558 | |
| | TVA, | | | | | | | | |
| | 1.875%, 8/15/22 | | | 6,000,000 | | | | 5,911,122 | |
| | 5.88%, 4/01/36 | | | 5,000,000 | | | | 6,598,000 | |
| | Strip, 11/01/18 | | | 2,644,000 | | | | 2,585,853 | |
| | Strip, 6/15/19 | | | 5,973,000 | | | | 5,741,218 | |
| | Strip, 6/15/20 | | | 6,138,000 | | | | 5,681,658 | |
| | U.S. Treasury Bond, | | | | | | | | |
| | 2.50%, 2/15/46 | | | 4,000,000 | | | | 3,546,672 | |
| | d Index Linked, 2.00%, 1/15/26 | | | 13,396,547 | | | | 15,102,625 | |
| | d Index Linked, 1.75%, 1/15/28 | | | 9,230,487 | | | | 10,314,220 | |
| | d Index Linked, 3.625%, 4/15/28 | | | 7,472,465 | | | | 9,834,294 | |
| d | | U.S. Treasury Note, | | | | | | | | |
| | Index Linked, 0.125%, 4/15/19 | | | 10,315,792 | | | | 10,446,978 | |
| | Index Linked, 0.125%, 7/15/24 | | | 15,778,956 | | | | 15,512,276 | |
| | Ukraine Government Agency for International Development Bonds, 1.844%, 5/16/19 | | | 5,000,000 | | | | 5,006,130 | |
| | | | | | | | | | |
| | | |
| | Total U.S. Government and Agency Securities (Cost $260,012,680) | | | | | | | 259,891,231 | |
| | | | | | | | | | |
| | | |
| | Total Investments before Short Term Investments (Cost $1,318,348,712) | | | | | | | 1,309,736,004 | |
| | | | | | | | | | |
| | Short Term Investments (Cost $19,525,258) 1.5% | | | | | | | | |
| | Repurchase Agreements 1.5% | | | | | | | | |
| e | | Joint Repurchase Agreement, 0.437%, 1/03/17 (Maturity Value $19,526,207) | | | | | | | | |
| | BNP Paribas Securities Corp. (Maturity Value $8,207,841) | | | | | | | | |
| | Deutsche Bank Securities Inc. (Maturity Value $1,025,712) | | | | | | | | |
| | HSBC Securities (USA) Inc. (Maturity Value $8,207,841) | | | | | | | | |
| | Merrill Lynch, Pierce, Fenner & Smith Inc. (Maturity Value $2,084,813)
| | | | | | | | |
| | Collateralized by U.S. Government Agency Securities, 0.00% - 1.75%, 6/09/17 - 2/26/19;
fU.S. Treasury Bill, 5/04/17 - 5/25/17;
U.S. Treasury Note, 0.50% - 3.50%, 12/31/16 - 8/31/21; and
U.S. Treasury Note, Index Linked, 1.375%, 7/15/18 (valued at $19,920,300) | | | 19,525,258 | | | | 19,525,258 | |
| | | | | | | | | | |
| | Total Investments (Cost $1,337,873,970) 99.0% | | | | | | | 1,329,261,262 | |
| | Other Assets, less Liabilities 1.0% | | | | | | | 13,396,552 | |
| | | | | | | | | | |
| | Net Assets 100.0% | | | | | | $ | 1,342,657,814 | |
| | | | | | | | | | |
FRANKLIN TEMPLETON VARIABLE INSURANCE PRODUCTS TRUST
STATEMENT OF INVESTMENTS
Franklin U.S. Government Securities VIP Fund (continued)
See Abbreviations on page FUS- 22.
*The principal amount is stated in U.S. dollars unless otherwise indicated.
aThe coupon rate shown represents the rate at period end.
bA supranational organization is an entity formed by two or more central governments through international treaties.
cSecurity was purchased pursuant to Rule 144A under the Securities Act of 1933 and may be sold in transactions exempt from registration only to qualified institutional buyers or in a public offering registered under the Securities Act of 1933. This security has been deemed liquid under guidelines approved by the Trust’s Board of Trustees. At December 31, 2016, the value of this security was $13,173,056, representing 1.0% of net assets.
dPrincipal amount of security is adjusted for inflation. See Note 1(e).
eSee Note 1(b) regarding joint repurchase agreement.
fThe security was issued on a discount basis with no stated coupon rate.
| | | | |
| FUS-12 | | Annual Report | The accompanying notes are an integral part of these financial statements. |
FRANKLIN TEMPLETON VARIABLE INSURANCE PRODUCTS TRUST
Financial Statements
Statement of Assets and Liabilities
December 31, 2016
| | | | |
| | | Franklin U.S.
Government
Securities VIP Fund | |
Assets: | | | | |
Investments in securities: | | | | |
Cost - Unaffiliated issuers | | $ | 1,318,348,712 | |
Cost - Repurchase agreements | | | 19,525,258 | |
| | | | |
Total cost of investments | | $ | 1,337,873,970 | |
| | | | |
Value - Unaffiliated issuers | | $ | 1,309,736,004 | |
Value - Repurchase agreements | | | 19,525,258 | |
| | | | |
Total value of investments | | | 1,329,261,262 | |
Cash | | | 9,950,464 | |
Receivables: | | | | |
Investment securities sold | | | 807,176 | |
Capital shares sold | | | 158,199 | |
Interest | | | 4,240,888 | |
Other assets | | | 122 | |
| | | | |
Total assets | | | 1,344,418,111 | |
| | | | |
Liabilities: | | | | |
Payables: | | | | |
Capital shares redeemed | | | 499,933 | |
Management fees | | | 535,582 | |
Distribution fees | | | 540,330 | |
Reports to shareholders | | | 108,886 | |
Accrued expenses and other liabilities | | | 75,566 | |
| | | | |
Total liabilities | | | 1,760,297 | |
| | | | |
Net assets, at value | | $ | 1,342,657,814 | |
| | | | |
Net assets consist of: | | | | |
Paid-in capital | | $ | 1,384,785,385 | |
Undistributed net investment income | | | 30,162,856 | |
Net unrealized appreciation (depreciation) | | | (8,612,708 | ) |
Accumulated net realized gain (loss) | | | (63,677,719 | ) |
| | | | |
Net assets, at value | | $ | 1,342,657,814 | |
| | | | |
| |
| Class 1: | | | | |
Net assets, at value | | $ | 73,694,612 | |
| | | | |
Shares outstanding | | | 5,889,365 | |
| | | | |
Net asset value and maximum offering price per share | | $ | 12.51 | |
| | | | |
| |
| Class 2: | | | | |
Net assets, at value | | $ | 1,268,963,202 | |
| | | | |
Shares outstanding | | | 103,685,701 | |
| | | | |
Net asset value and maximum offering price per share | | $ | 12.24 | |
| | | | |
| | | | | | |
| | | The accompanying notes are an integral part of these financial statements. | Annual Report | | | FUS-13 | |
FRANKLIN TEMPLETON VARIABLE INSURANCE PRODUCTS TRUST
FINANCIAL STATEMENTS
Statement of Operations
for the year ended December 31, 2016
| | | | |
| | | Franklin U.S.
Government
Securities VIP Fund | |
Investment income: | | | | |
Interest | | $ | 43,246,081 | |
Paydown gain (loss) | | | (11,518,641 | ) |
| | | | |
Total investment income | | | 31,727,440 | |
| | | | |
Expenses: | | | | |
Management fees (Note 3a) | | | 6,611,850 | |
Distribution fees - Class 2 (Note 3c) | | | 3,339,846 | |
Custodian fees (Note 4) | | | 11,596 | |
Reports to shareholders | | | 158,927 | |
Professional fees | | | 67,795 | |
Trustees’ fees and expenses | | | 7,241 | |
Other | | | 173,881 | |
| | | | |
Total expenses | | | 10,371,136 | |
Expense reductions (Note 4) | | | (100 | ) |
| | | | |
Net expenses | | | 10,371,036 | |
| | | | |
Net investment income | | | 21,356,404 | |
| | | | |
Realized and unrealized gains (losses): | | | | |
Net realized gain (loss) from investments | | | 3,288,253 | |
Net change in unrealized appreciation (depreciation) on investments | | | (15,237,134 | ) |
| | | | |
Net realized and unrealized gain (loss) | | | (11,948,881 | ) |
| | | | |
Net increase (decrease) in net assets resulting from operations | | $ | 9,407,523 | |
| | | | |
| | | | |
| FUS-14 | | Annual Report | The accompanying notes are an integral part of these financial statements. | | |
FRANKLIN TEMPLETON VARIABLE INSURANCE PRODUCTS TRUST
FINANCIAL STATEMENTS
Statements of Changes in Net Assets
| | | | | | | | |
| | | Franklin U.S. Government
Securities VIP Fund | |
| | | Year Ended December 31, | |
| | | 2016 | | | 2015 | |
Increase (decrease) in net assets: | | | | | | | | |
Operations: | | | | | | | | |
Net investment income | | $ | 21,356,404 | | | $ | 20,148,189 | |
Net realized gain (loss) | | | 3,288,253 | | | | (225,412 | ) |
Net change in unrealized appreciation (depreciation) | | | (15,237,134 | ) | | | (12,815,304 | ) |
| | | | |
Net increase (decrease) in net assets resulting from operations | | | 9,407,523 | | | | 7,107,473 | |
| | | | |
Distributions to shareholders from: | | | | | | | | |
Net investment income: | | | | | | | | |
Class 1 | | | (2,105,837 | ) | | | (2,296,272 | ) |
Class 2 | | | (33,509,223 | ) | | | (33,598,882 | ) |
| | | | |
Total distributions to shareholders | | | (35,615,060 | ) | | | (35,895,154 | ) |
| | | | |
Capital share transactions: (Note 2) | | | | | | | | |
Class 1 | | | (4,571,855 | ) | | | (9,377,525 | ) |
Class 2 | | | (18,157,380 | ) | | | (29,933,456 | ) |
| | | | |
Total capital share transactions | | | (22,729,235 | ) | | | (39,310,981 | ) |
| | | | |
Net increase (decrease) in net assets | | | (48,936,772 | ) | | | (68,098,662 | ) |
Net assets: | | | | | | | | |
Beginning of year | | | 1,391,594,586 | | | | 1,459,693,248 | |
| | | | |
End of year | | $ | 1,342,657,814 | | | $ | 1,391,594,586 | |
| | | | |
Undistributed net investment income included in net assets: | | | | | | | | |
End of year | | $ | 30,162,856 | | | $ | 29,896,893 | |
| | | | |
| | | | | | |
| | | The accompanying notes are an integral part of these financial statements. | Annual Report | | | FUS-15 | |
FRANKLIN TEMPLETON VARIABLE INSURANCE PRODUCTS TRUST
Notes to Financial Statements
Franklin U.S. Government Securities VIP Fund
1. Organization and Significant Accounting Policies
Franklin Templeton Variable Insurance Products Trust (Trust) is registered under the Investment Company Act of 1940 (1940 Act) as an open-end management investment company, consisting of nineteen separate funds and applies the specialized accounting and reporting guidance in U.S. Generally Accepted Accounting Principles (U.S. GAAP). Franklin U.S. Government Securities VIP Fund (Fund) is included in this report. The financial statements of the remaining funds in the Trust are presented separately. Shares of the Fund are generally sold only to insurance company separate accounts to fund the benefits of variable life insurance policies or variable annuity contracts. At December 31, 2016, 41.1% of the Fund’s shares were held through one insurance company. Investment activities of these insurance company separate accounts could have a material impact on the Fund. The Fund offers two classes of shares: Class 1 and Class 2. Each class of shares differs by its distribution fees, voting rights on matters affecting a single class and its exchange privilege.
The following summarizes the Fund’s significant
accounting policies.
a. Financial Instrument Valuation
The Fund’s investments in financial instruments are carried at fair value daily. Fair value is the price that would be received to sell an asset or paid to transfer a liability in an orderly transaction between market participants on the measurement date. The Fund calculates the net asset value (NAV) per share as of 4 p.m. Eastern time each day the New York Stock Exchange (NYSE) is open for trading. Under compliance policies and procedures approved by the Trust’s Board of Trustees (the Board), the Fund’s administrator has responsibility for oversight of valuation, including leading the cross-functional Valuation Committee (VC). The VC provides administration and oversight of the Fund’s valuation policies and procedures, which are approved annually by the Board. Among other things, these procedures allow the Fund to utilize independent pricing services, quotations from securities and financial instrument dealers, and other market sources to determine fair value.
Debt securities generally trade in the over-the-counter market rather than on a securities exchange. The Fund’s pricing services use multiple valuation techniques to determine fair value. In instances where sufficient market activity exists, the
pricing services may utilize a market-based approach through which quotes from market makers are used to determine fair value. In instances where sufficient market activity may not exist or is limited, the pricing services also utilize proprietary valuation models which may consider market characteristics such as benchmark yield curves, credit spreads, estimated default rates, anticipated market interest rate volatility, coupon rates, anticipated timing of principal repayments, underlying collateral, and other unique security features in order to estimate the relevant cash flows, which are then discounted to calculate the fair value.
Investments in repurchase agreements are valued at cost, which approximates fair value.
The Fund has procedures to determine the fair value of financial instruments for which market prices are not reliable or readily available. Under these procedures, the VC convenes on a regular basis to review such financial instruments and considers a number of factors, including significant unobservable valuation inputs, when arriving at fair value. The VC primarily employs a market-based approach which may use related or comparable assets or liabilities, recent transactions, market multiples, book values, and other relevant information for the investment to determine the fair value of the investment. An income-based valuation approach may also be used in which the anticipated future cash flows of the investment are discounted to calculate fair value. Discounts may also be applied due to the nature or duration of any restrictions on the disposition of the investments. Due to the inherent uncertainty of valuations of such investments, the fair values may differ significantly from the values that would have been used had an active market existed. The VC employs various methods for calibrating these valuation approaches including a regular review of key inputs and assumptions, transactional back-testing or disposition analysis, and reviews of any related market activity.
b. Joint Repurchase Agreement
The Fund enters into a joint repurchase agreement whereby its uninvested cash balance is deposited into a joint cash account with other funds managed by the investment manager or an affiliate of the investment manager and is used to invest in one or more repurchase agreements. The value and face amount of the joint repurchase agreement are allocated to the funds based on their pro-rata interest. A repurchase agreement is accounted for as a loan by the Fund to the seller, collateralized by securities which are delivered to the Fund’s custodian. The fair
FRANKLIN TEMPLETON VARIABLE INSURANCE PRODUCTS TRUST
NOTES TO FINANCIAL STATEMENTS
Franklin U.S. Government Securities VIP Fund (continued)
value, including accrued interest, of the initial collateralization is required to be at least 102% of the dollar amount invested by the funds, with the value of the underlying securities marked to market daily to maintain coverage of at least 100%. Repurchase agreements are subject to the terms of Master Repurchase Agreements (MRAs) with approved counterparties (sellers). The MRAs contain various provisions, including but not limited to events of default and maintenance of collateral for repurchase agreements. In the event of default by either the seller or the Fund, certain MRAs may permit the non-defaulting party to net and close-out all transactions, if any, traded under such agreements. The Fund may sell securities it holds as collateral and apply the proceeds towards the repurchase price and any other amounts owed by the seller to the Fund in the event of default by the seller. This could involve costs or delays in addition to a loss on the securities if their value falls below the repurchase price owed by the seller. The joint repurchase agreement held by the Fund at year end, as indicated in the Statement of Investments, had been entered into on December 30, 2016.
c. Mortgage Dollar Rolls
The Fund enters into mortgage dollar rolls, typically on a TBA basis. Mortgage dollar rolls are agreements between the Fund and a financial institution where the Fund sells (or buys) mortgage-backed securities for delivery on a specified date and simultaneously contracts to repurchase (or sell) substantially similar (same type, coupon, and maturity) securities at a future date and at a predetermined price. Gains or losses are realized on the initial sale, and the difference between the repurchase price and the sale price is recorded as an unrealized gain or loss to the Fund upon entering into the mortgage dollar roll. In addition, the Fund may invest the cash proceeds that are received from the initial sale. During the period between the sale and repurchase, the Fund is not entitled to principal and interest paid on the mortgage backed securities. Transactions in mortgage dollar rolls are accounted for as purchases and sales and may result in an increase to the Fund’s portfolio turnover rate. The risks of mortgage dollar roll transactions include the potential inability of the counterparty to fulfill its obligations.
d. Income Taxes
It is the Fund’s policy to qualify as a regulated investment company under the Internal Revenue Code. The Fund intends to distribute to shareholders substantially all of its taxable income
and net realized gains to relieve it from federal income and if applicable, excise taxes. As a result, no provision for U.S. federal income taxes is required.
The Fund may recognize an income tax liability related to its uncertain tax positions under U.S. GAAP when the uncertain tax position has a less than 50% probability that it will be sustained upon examination by the tax authorities based on its technical merits. As of December 31, 2016, the Fund has determined that no tax liability is required in its financial statements related to uncertain tax positions for any open tax years (or expected to be taken in future tax years). Open tax years are those that remain subject to examination and are based on each tax jurisdiction’s statute of limitation.
e. Security Transactions, Investment Income, Expenses and Distributions
Security transactions are accounted for on trade date. Realized gains and losses on security transactions are determined on a specific identification basis. Interest income and estimated expenses are accrued daily. Amortization of premium and accretion of discount on debt securities are included in interest income. Paydown gains and losses are recorded separately in the Statement of Operations. Distributions to shareholders are recorded on the ex-dividend date and are determined according to income tax regulations (tax basis). Distributable earnings determined on a tax basis may differ from earnings recorded in accordance with U.S. GAAP. These differences may be permanent or temporary. Permanent differences are reclassified among capital accounts to reflect their tax character. These reclassifications have no impact on net assets or the results of operations. Temporary differences are not reclassified, as they may reverse in subsequent periods.
Common expenses incurred by the Trust are allocated among the Funds based on the ratio of net assets of each Fund to the combined net assets of the Trust. Fund specific expenses are charged directly to the Fund that incurred the expense.
Realized and unrealized gains and losses and net investment income, not including class specific expenses, are allocated daily to each class of shares based upon the relative proportion of net assets of each class. Differences in per share distributions, by class, are generally due to differences in class specific expenses.
FRANKLIN TEMPLETON VARIABLE INSURANCE PRODUCTS TRUST
NOTES TO FINANCIAL STATEMENTS
Franklin U.S. Government Securities VIP Fund (continued)
1. Organization and Significant Accounting
Policies (continued)
e. Security Transactions, Investment Income, Expenses and Distributions (continued)
Inflation-indexed bonds are adjusted for inflation through periodic increases or decreases in the security’s interest accruals, face amount, or principal redemption value, by amounts corresponding to the rate of inflation as measured by an index. Any increase or decrease in the face amount or principal redemption value will be included as interest income in the Statement of Operations.
f. Accounting Estimates
The preparation of financial statements in accordance with U.S. GAAP requires management to make estimates and assumptions that affect the reported amounts of assets and
liabilities at the date of the financial statements and the amounts of income and expenses during the reporting period. Actual results could differ from those estimates.
g. Guarantees and Indemnifications
Under the Trust’s organizational documents, its officers and trustees are indemnified by the Trust against certain liabilities arising out of the performance of their duties to the Trust. Additionally, in the normal course of business, the Trust, on behalf of the Fund, enters into contracts with service providers that contain general indemnification clauses. The Trust’s maximum exposure under these arrangements is unknown as this would involve future claims that may be made against the Trust that have not yet occurred. Currently, the Trust expects the risk of loss to be remote.
2. Shares of Beneficial Interest
At December 31, 2016, there were an unlimited number of shares authorized (without par value). Transactions in the Fund’s shares were
as follows:
| | | | | | | | | | | | | | | | | | | | |
| | | Year Ended December 31, | |
| | | 2016 | | | | | | 2015 | |
| | | Shares | | | Amount | | | | | | Shares | | | Amount | |
| | | | | |
| Class 1 Shares: | | | | | | | | | | | | | | | | | | | | |
Shares sold | | | 351,919 | | | $ | 4,501,949 | | | | | | | | 250,539 | | | $ | 3,217,512 | |
Shares issued in reinvestment of distributions | | | 166,207 | | | | 2,105,837 | | | | | | | | 181,380 | | | | 2,296,272 | |
Shares redeemed | | | (876,092 | ) | | | (11,179,641 | ) | | | | | | | (1,156,708 | ) | | | (14,891,309 | ) |
| | | | |
Net increase (decrease) | | | (357,966 | ) | | $ | (4,571,855 | ) | | | | | | | (724,789 | ) | | $ | (9,377,525 | ) |
| | | | |
| Class 2 Shares: | | | | | | | | | | | | | | | | | | | | |
Shares sold | | | 17,880,837 | | | $ | 224,111,450 | | | | | | | | 11,683,320 | | | $ | 147,121,730 | |
Shares issued in reinvestment of distributions | | | 2,700,179 | | | | 33,509,223 | | | | | | | | 2,709,587 | | | | 33,598,882 | |
Shares redeemed | | | (22,088,516 | ) | | | (275,778,053 | ) | | | | | | | (16,725,979 | ) | | | (210,654,068 | ) |
| | | | |
Net increase (decrease) | | | (1,507,500 | ) | | $ | (18,157,380 | ) | | | | | | | (2,333,072 | ) | | $ | (29,933,456 | ) |
| | | | |
3. Transactions with Affiliates
Franklin Resources, Inc. is the holding company for various subsidiaries that together are referred to as Franklin Templeton Investments. Certain officers and trustees of the Fund are also officers and/or directors of the following subsidiaries:
| | |
| Subsidiary | | Affiliation |
Franklin Advisers, Inc. (Advisers) | | Investment manager |
Franklin Templeton Services, LLC (FT Services) | | Administrative manager |
Franklin Templeton Distributors, Inc. (Distributors) | | Principal underwriter |
Franklin Templeton Investor Services, LLC (Investor Services) | | Transfer agent |
FRANKLIN TEMPLETON VARIABLE INSURANCE PRODUCTS TRUST
NOTES TO FINANCIAL STATEMENTS
Franklin U.S. Government Securities VIP Fund (continued)
a. Management Fees
The Fund pays an investment management fee to Advisers based on the average daily net assets of the Fund as follows:
| | |
| Annualized Fee Rate | | Net Assets |
0.625% | | Up to and including $100 million |
0.500% | | Over $100 million, up to and including $250 million |
0.450% | | Over $250 million, up to and including $7.5 billion |
0.440% | | Over $7.5 billion, up to and including $10 billion |
0.430% | | Over $10 billion, up to and including $12.5 billion |
0.420% | | Over $12.5 billion, up to and including $15 billion |
0.400% | | In excess of $15 billion |
For the year ended December 31, 2016, the effective investment management fee rate was 0.468% of the Fund’s average daily net assets.
b. Administrative Fees
Under an agreement with Advisers, FT Services provides administrative services to the Fund. The fee is paid by Advisers based on the Fund’s average daily net assets, and is not an additional expense of the Fund.
c. Distribution Fees
The Board has adopted a distribution plan for Class 2 shares pursuant to Rule 12b-1 under the 1940 Act. Under the Fund’s compensation distribution plan, the Fund pays Distributors for costs incurred in connection with the servicing, sale and distribution of the Fund’s shares up to 0.35% per year of its average daily net assets. The Board has agreed to limit the current rate to 0.25% per year for Class 2. The plan year, for purposes of monitoring compliance with the maximum annual plan rate, is February 1 through January 31.
d. Transfer Agent Fees
Investor Services, under terms of an agreement, performs shareholder servicing for the Fund and is not paid by the Fund for the services.
4. Expense Offset Arrangement
The Fund has entered into an arrangement with its custodian whereby credits realized as a result of uninvested cash balances are used to reduce a portion of the Fund’s custodian expenses. During the year ended December 31, 2016, the custodian fees were reduced as noted in the Statement of Operations.
5. Income Taxes
For tax purposes, capital losses may be carried over to offset future capital gains. Capital loss carryforwards with no expiration, if any, must be fully utilized before those losses with expiration dates.
FRANKLIN TEMPLETON VARIABLE INSURANCE PRODUCTS TRUST
NOTES TO FINANCIAL STATEMENTS
Franklin U.S. Government Securities VIP Fund (continued)
5. Income Taxes (continued)
At December 31, 2016, capital loss carryforwards were as follows:
| | | | |
Capital loss carryforwards subject to expiration: | | | | |
2017 | | $ | 401,851 | |
2018 | | | 426,637 | |
| |
| Capital loss carryforwards not subject to expiration: | | | | |
Short term | | | 22,594,468 | |
Long term | | | 40,093,383 | |
| | | | |
Total capital loss carryforwards | | $ | 63,516,339 | |
| | | | |
On December 31, 2016, the Fund had expired capital loss carryforwards of $841,479, which were reclassified to paid-in capital.
The tax character of distributions paid during the years ended December 31, 2016 and 2015, was as follows:
| | | | | | | | |
| | | 2016 | | | 2015 | |
Distributions paid from ordinary income | | $ | 35,615,060 | | | $ | 35,895,154 | |
| | | | |
At December 31, 2016, the cost of investments, net unrealized appreciation (depreciation), and undistributed ordinary income for income tax purposes were as follows:
| | | | |
Cost of investments | | $ | 1,342,996,613 | |
| | | | |
Unrealized appreciation | | $ | 11,991,013 | |
Unrealized depreciation | | | (25,726,364 | ) |
| | | | |
Net unrealized appreciation (depreciation) | | $ | (13,735,351 | ) |
| | | | |
Distributable earnings - undistributed ordinary income | | $ | 35,124,137 | |
| | | | |
Differences between income and/or capital gains as determined on a book basis and a tax basis are primarily due to differing treatments of paydown losses and bond discounts and premiums.
6. Investment Transactions
Purchases and sales of investments (excluding short term securities) for the year ended December 31, 2016, aggregated $1,184,432,499 and $1,198,184,128, respectively.
7. Credit Facility
The Fund, together with other U.S. registered and foreign investment funds (collectively, Borrowers), managed by Franklin Templeton Investments, are borrowers in a joint syndicated senior unsecured credit facility totaling $2 billion (Global Credit Facility) which matured on February 10, 2017. This Global Credit Facility provides a source of funds to the Borrowers for temporary and emergency purposes, including the ability to meet future unanticipated or unusually large redemption requests. Effective February 10, 2017, the Borrowers renewed the Global Credit Facility for a one year term, maturing February 9, 2018, for a total of $2 billion.
FRANKLIN TEMPLETON VARIABLE INSURANCE PRODUCTS TRUST
NOTES TO FINANCIAL STATEMENTS
Franklin U.S. Government Securities VIP Fund (continued)
Under the terms of the Global Credit Facility, the Fund shall, in addition to interest charged on any borrowings made by the Fund and other costs incurred by the Fund, pay its share of fees and expenses incurred in connection with the implementation and maintenance of the Global Credit Facility, based upon its relative share of the aggregate net assets of all of the Borrowers, including an annual commitment fee of 0.15% based upon the unused portion of the Global Credit Facility. These fees are reflected in other expenses in the Statement of Operations. During the year ended December 31, 2016, the Fund did not use the Global Credit Facility.
8. Fair Value Measurements
The Fund follows a fair value hierarchy that distinguishes between market data obtained from independent sources (observable inputs) and the Fund’s own market assumptions (unobservable inputs). These inputs are used in determining the value of the Fund’s financial instruments and are summarized in the following fair value hierarchy:
| | • | | Level 1 – quoted prices in active markets for identical financial instruments |
| | • | | Level 2 – other significant observable inputs (including quoted prices for similar financial instruments, interest rates, prepayment speed, credit risk, etc.) |
| | • | | Level 3 – significant unobservable inputs (including the Fund’s own assumptions in determining the fair value of financial instruments) |
The input levels are not necessarily an indication of the risk or liquidity associated with financial instruments at that level.
For movements between the levels within the fair value hierarchy, the Fund has adopted a policy of recognizing the transfers as of the date of the underlying event which caused the movement.
At December 31, 2016, all of the Fund’s investments in financial instruments carried at fair value were valued using Level 2 inputs.
9. Investment Company Reporting Modernization
In October 2016, the U.S. Securities and Exchange Commission adopted new rules and amended existing rules (together, final rules) intended to modernize the reporting and disclosure of information by registered investment companies. In part, the final rules amend Regulation S-X and require standardized, enhanced disclosures about derivatives in investment company financial statements, as well as other amendments. The compliance date for the amendments to Regulation S-X is August 1, 2017. Management is currently evaluating the impact that the adoption of the amendments to Regulation S-X will have on the Fund’s financial statements and related disclosures.
10. Subsequent Events
The Fund has evaluated subsequent events through the issuance of the financial statements and determined that no events have occurred that require disclosure other than those already disclosed in the financial statements.
FRANKLIN TEMPLETON VARIABLE INSURANCE PRODUCTS TRUST
NOTES TO FINANCIAL STATEMENTS
Franklin U.S. Government Securities VIP Fund (continued)
Abbreviations
| | |
|
| Selected Portfolio |
| |
| FHLB | | Federal Home Loan Bank |
| |
| FHLMC | | Federal Home Loan Mortgage Corp. |
| |
| FICO | | Financing Corp. |
| |
| FRN | | Floating Rate Note |
| |
| GL | | Government Loan |
| |
| PC | | Participation Certificate |
| |
| PL | | Project Loan |
| |
| SBA | | Small Business Administration |
| |
| SF | | Single Family |
| |
| TVA | | Tennessee Valley Authority |
FRANKLIN TEMPLETON VARIABLE INSURANCE PRODUCTS TRUST
Report of Independent Registered Public Accounting Firm
Franklin U.S. Government Securities VIP Fund
To the Board of Trustees and Shareholders of Franklin Templeton Variable Insurance Products Trust
In our opinion, the accompanying statement of assets and liabilities, including the statement of investments, and the related statements of operations and of changes in net assets and the financial highlights present fairly, in all material respects, the financial position of Franklin U.S. Government Securities VIP Fund (the “Fund”) as of December 31, 2016, the results of its operations for the year then ended, the changes in its net assets for each of the two years in the period then ended and the financial highlights for each of the periods presented, in conformity with accounting principles generally accepted in the United States of America. These financial statements and financial highlights (hereafter referred to as “financial statements”) are the responsibility of the Fund’s management. Our responsibility is to express an opinion on these financial statements based on our audits. We conducted our audits of these financial statements in accordance with the standards of the Public Company Accounting Oversight Board (United States). Those standards require that we plan and perform the audit to obtain reasonable assurance about whether the financial statements are free of material misstatement. An audit includes examining, on a test basis, evidence supporting the amounts and disclosures in the financial statements, assessing the accounting principles used and significant estimates made by management, and evaluating the overall financial statement presentation. We believe that our audits, which included confirmation of securities as of December 31, 2016 by correspondence with the custodian and brokers, provide a reasonable basis for our opinion.
PricewaterhouseCoopers LLP
San Francisco, California
February 15, 2017
Franklin VolSmart Allocation VIP Fund
This annual report for Franklin VolSmart Allocation VIP Fund covers the fiscal year ended December 31, 2016.
Class 2 Performance Summary as of December 31, 2016
Average annual total return of Class 2 shares* represents the average annual change in value, assuming reinvestment of dividends and capital gains. Average returns smooth out variations in returns, which can be significant; they are not the same as year-by-year results.
| | | | | | | | |
| Periods ended 12/31/16 | | 1-Year | | | Since Inception (4/1/13) | |
Average Annual Total Return | | | +4.39% | | | | +1.94% | |
*Prior to 5/1/15, the Fund followed different investment strategies, had different subadvisory arrangements, allocated its core portfolio differently, had a different current target volatility goal and made different use of derivative instruments. As a result, the Fund generally held different investments and had a different investment profile. The Fund has an expense reduction contractually guaranteed through at least 7/25/17. The Fund also has a fee waiver associated with any investments it makes in a Franklin Templeton money fund and/or other Franklin Templeton fund, contractually guaranteed through its current fiscal year-end. Fund investment results reflect the expense reduction and fee waiver; without these reductions, the results would have been lower.
Performance reflects the Fund’s Class 2 operating expenses, but does not include any contract fees, expenses or sales charges. If they had been included, performance would be lower. These charges and deductions, particularly for variable life policies, can have a significant effect on contract values and insurance benefits. See the contract prospectus for a complete description of these expenses, including sales charges.
Performance data represent past performance, which does not guarantee future results. Investment return and principal value will fluctuate, and you may have a gain or loss when you sell your shares. Current performance may differ from figures shown.
Total Return Index Comparison for a Hypothetical $10,000 Investment (4/1/13–12/31/16)
The graph below shows the change in value of a hypothetical $10,000 investment in the Fund over the indicated period and includes reinvestment of any income or distributions. The Fund’s performance* is compared to the performance of the Standard & Poor’s® 500 Index (S&P 500®) and the Bloomberg Barclays U.S. Aggregate Bond Index. One cannot invest directly in an index, and an index is not representative of the Fund’s portfolio. Please see Important Notes to Performance Information preceding the Fund Summaries.
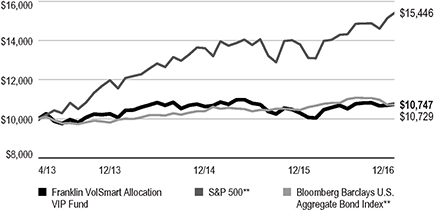
**Source: Morningstar. Please see Index Descriptions following the Fund Summaries.
FRANKLIN VOLSMART ALLOCATION VIP FUND
Fund Goal and Main Investments
The Fund seeks total return (including income and capital gains) while seeking to manage volatility.
Fund Risks
All investments involve risks, including possible loss of principal. There can be no guarantee that the Fund will stay within its target volatility. Also, the managed volatility and tail risk protection strategies could negatively impact the Fund’s return and expose the Fund to additional costs. Generally, investors should be comfortable with fluctuation in the value of their investments, especially over the short term. Stock prices fluctuate, sometimes rapidly and dramatically, due to factors affecting individual companies, particular industries or sectors, or general market conditions. Bond prices generally move in the opposite direction of interest rates. Derivatives involve costs and can create economic leverage in the portfolio, which may result in significant volatility and cause the Fund to participate in losses on an amount that exceeds the Fund’s initial investment. The Fund may not achieve the anticipated benefits, and may realize losses when a counterparty fails to perform. Because the Fund allocates assets to a variety of investment strategies, ETFs and other mutual funds, which involve certain risks, it may be subject to those same risks. The Fund is actively managed but there is no guarantee that the manager’s investment decisions will produce the desired results. The Fund’s prospectus also includes a description of the main investment risks.
Performance Overview
You can find the Fund’s one-year total return in the Performance Summary. For comparison, the Fund’s benchmarks, the S&P 500 and the Bloomberg Barclays U.S. Aggregate Bond Index, returned +11.96% and +2.65%, respectively, for the period under review.1 The Fund’s blended benchmark, a combination of leading stock and bond indexes that better reflects the asset allocation of the Fund’s portfolio, returned +8.11% for the same period.2 Prior to May 1, 2015, the Fund followed different investment strategies, had different subadvisory arrangements, allocated its core portfolio differently, had a different current target volatility goal and
made different use of derivative instruments. As a result, the Fund generally held different investments and had a different investment profile.
Economic and Market Overview
The U.S. economy expanded during the 12 months under review. The economy grew at a faster pace in 2016’s third quarter than in the second and first quarters. However, the economy moderated in the fourth quarter as higher consumer spending, private inventory investment, residential investment, business investment, and state and local government spending were partially offset by lower exports and federal government spending. Manufacturing conditions remained volatile but generally expanded, and the services sector also continued to grow for most of the period. The unemployment rate decreased from 5.0% in December 2015 to 4.7% at period-end.3 Monthly retail sales grew for most of the review period, and rose to its highest level in April in more than a year, due to a broad-based increase across most retail categories. Inflation, as measured by the Consumer Price Index, remained relatively subdued for most of the period, but rose in 2016’s fourth quarter.
After maintaining its target interest rate in the 0.25%–0.50% range for nearly a year, the U.S. Federal Reserve (Fed), at its December meeting, increased its target range for the federal funds rate to 0.50%–0.75%, as policymakers noted improvement in U.S. labor market and inflation. The Federal Open Market Committee also hinted at three additional hikes in 2017. Furthermore, the Fed raised its forecast for 2017 U.S. economic growth, and lowered its unemployment projections.
The 10-year U.S. Treasury yield, which moves inversely to price, ended the period slightly higher than where it started and shifted significantly during the period. At the beginning of the period, negative global interest rates, continued accommodative central bank policies and a general risk-averse sentiment boosted safe haven buying by investors. These factors drove the 10-year yield to a period low of 1.37% in early July, down from 2.27% on December 31, 2015. Near period-end, rates moved higher based on improved economic data, expectations for the Fed to raise interest rates at its December 2016 meeting and a sentiment shift among investors that held that possible
1. Source: Morningstar.
2. The Fund’s blended benchmark was calculated internally and rebalanced monthly and was composed of 60% S&P 500, 30% Bloomberg Barclays U.S. Aggregate Bond Index and 10% Barclays 1-3 Month U.S. Treasury Bill Index.
One cannot invest directly in an index, and an index is not representative of the Fund’s portfolio. Please see Index Descriptions following the Fund Summaries.
3. Source: Bureau of Labor Statistics.
The dollar value, number of shares or principal amount, and names of all portfolio holdings are listed in the Fund’s Statement of Investments (SOI).
FRANKLIN VOLSMART ALLOCATION VIP FUND
expansionary fiscal policies under the new U.S. president Donald Trump could lead to a stronger economy and higher inflation.
Investment Strategy
Under normal market conditions, the Fund seeks to achieve its investment goal by allocating its assets across certain asset classes, sectors and strategies in an attempt to produce a diversified portfolio that will generate returns while minimizing the expected volatility of the Fund’s returns so that volatility does not exceed a target of 10% per year. (Volatility within the 10% target is referred to as “Target Volatility.”) The Fund’s assets are primarily invested in its “core portfolio,” which is principally composed of various U.S. equity and fixed income investments and strategies, including other mutual funds.
In addition, the Fund employs a volatility management strategy, which is designed to manage the expected volatility of the Fund’s returns so that volatility remains within the Fund’s Target Volatility. Thus, the Fund may utilize certain derivative instruments (such as futures contracts on indexes) in an effort to adjust the Fund’s expected volatility to within the Target Volatility. There is no guarantee that the Fund will stay within its Target Volatility. The Fund also employs a “tail risk protection strategy,” designed to protect the Fund from risks related to extreme short-term market downturns (tail risk). Thus, the Fund may utilize certain derivatives (such as total return swap agreements) in an effort to hedge the tail risk of the Fund. There is no guarantee that the Fund’s volatility management or tail risk protection strategies will be successful.
What is a futures contract?
A futures contract is an agreement between the Fund and a counterparty made through a U.S. or foreign futures exchange to buy or sell an underlying instrument or asset at a specific price on a future date.
What is a total return swap agreement?
A swap agreement, such as an equity total return swap, is a contract between the Fund and a counterparty to exchange on a future date the returns, or differentials in rates of return, that would have been earned or realized if a notional amount were invested in specific instruments.
Manager’s Discussion
At the end of the 12-month period, at the asset allocation level, the Fund held approximately 65% in equities, 27% in fixed income and 8% in cash. In comparison, the Fund’s blended benchmark was composed of 60% equities, 30% fixed income and 10% cash.2
| | | | |
| Portfolio Composition* | | | |
| 12/31/16 | | | |
| | | % of Total
Net Assets | |
| Stocks | | | 49.2% | |
| Capital Goods | | | 10.4% | |
| Health Care Equipment & Services | | | 5.7% | |
| Materials | | | 5.7% | |
| Energy | | | 3.8% | |
| Food, Beverage & Tobacco | | | 3.4% | |
| Software & Services | | | 3.3% | |
| Pharmaceuticals, Biotechnology & Life Sciences | | | 2.6% | |
| Semiconductors & Semiconductor Equipment | | | 2.5% | |
| Retailing | | | 2.4% | |
| Food & Staples Retailing | | | 2.0% | |
| Household & Personal Products | | | 1.7% | |
| Consumer Services | | | 1.3% | |
| Commercial & Professional Services | | | 1.0% | |
| Consumer Durables & Apparel | | | 1.0% | |
| Insurance | | | 0.9% | |
| Transportation | | | 0.7% | |
| Media | | | 0.5% | |
| Diversified Financials | | | 0.2% | |
| Automobiles & Components | | | 0.1% | |
| Underlying Funds – Equity | | | 15.7% | |
| Franklin DynaTech Fund – Class R6 | | | 9.9% | |
| Franklin Income Fund – Class R6 | | | 5.8% | |
| Underlying Funds – Fixed Income | | | 27.0% | |
| Franklin Low Duration Total Return Fund – Class R6 | | | 12.8% | |
| Franklin Strategic Income Fund – Class R6 | | | 10.7% | |
| Franklin Income Fund – Class R6 | | | 3.5% | |
| Hedge Strategy | | | -0.3% | |
| Short-Term Investments & Other Net Assets | | | 8.4% | |
*Figures are stated as a percentage of total and may not equal 100% or may be negative due to rounding, use of any derivatives, unsettled trades or other factors. The breakdown may not match the SOI.
Equities
We maintained a modest equity overweighting relative to the Fund’s blended benchmark index during the period under review. The Fund’s equity component was primarily invested in the Franklin Rising Dividends Strategy, which invests in U.S.-domiciled, large-capitalization, dividend-paying equities. Our overweighted equity allocation benefited relative performance as U.S. equity markets proved resilient and reached record highs several times in 2016. The equity
FRANKLIN VOLSMART ALLOCATION VIP FUND
component of the Franklin Income Fund strategy also bolstered relative performance in the review period, with solid returns. Although the growth- and technology-focused Franklin DynaTech Fund strategy contributed to absolute performance, it detracted from relative results as investors tended to be cautious with these areas relative to other areas of the equity market. With corporate revenues and profit margins strengthening in recent months and expectations for heightened fiscal stimulus from incoming U.S. President Donald Trump, the Franklin VolSmart Allocation VIP Fund’s equity component was positioned at period-end to seek to capture potential equity market appreciation amid these tailwinds.
| | | | |
| Portfolio Strategy Holdings* | | | |
| 12/31/16 | | | |
| | | % of Total
Net Assets | |
| Franklin Rising Dividends Strategy | | | 49.2% | |
| Franklin Low Duration Total Return Fund | | | 12.8% | |
| Franklin Strategic Income Fund | | | 10.7% | |
| Franklin DynaTech Fund | | | 9.9% | |
| Franklin Income Fund | | | 9.3% | |
| Hedge Strategy | | | -0.3% | |
| Short-Term Investments & Other Net Assets | | | 8.4% | |
*The breakdown may not match the SOI.
Fixed Income
The Fund’s selection of fixed income strategies strengthened relative returns, as all three bond strategies outperformed the fixed income benchmark index. Relative results were particularly robust for the Franklin Strategic Income Fund and Franklin Income Fund strategies, as both provided substantial exposure to high-yield bonds compared with the benchmark index’s negligible exposure. The high-yield bond sector rebounded strongly after a drawdown in the beginning of 2016. Investor risk appetite was generally strong between February and December, which, combined with a low-yield environment, supported the high-yield bond sector. The fixed income component of the Franklin VolSmart Allocation VIP Fund also had shorter U.S. Treasury duration than the index’s, which helped relative results. U.S. Treasury yields climbed in the second half of 2016 after beginning the calendar year with a precipitous decline. The Fund’s modest underweighting in fixed income also benefited relative performance.
Hedging
The Fund’s tactical hedging comprised two strategies during the 12-month review period. We employed a tail risk protection strategy, mainly through a market volatility index, designed to protect the Fund from risks related to short-term market
downturns. We also employed a volatility management strategy, mainly through S&P index futures, designed to minimize the expected volatility of the Fund’s returns so that volatility does not exceed a target of 10% per year.
Despite a year that included economic events such as a large, yet quick, drawdown following the Brexit result, uncertainty surrounding the U.S. presidential election and the Fed’s timing on raising interest rates, U.S. equity markets advanced as investor risk appetite remained generally undeterred. As a result, both hedges notably weighed on performance during the review period.
Thank you for your participation in Franklin VolSmart Allocation VIP Fund. We look forward to serving your future investment needs.
The foregoing information reflects our analysis, opinions and portfolio holdings as of December 31, 2016, the end of the reporting period. The way we implement our main investment strategies and the resulting portfolio holdings may change depending on factors such as market and economic conditions. These opinions may not be relied upon as investment advice or an offer for a particular security. The information is not a complete analysis of every aspect of any market, country, industry, security or the Fund. Statements of fact are from sources considered reliable, but the investment manager makes no representation or warranty as to their completeness or accuracy. Although historical performance is no guarantee of future results, these insights may help you understand our investment management philosophy.
FRANKLIN VOLSMART ALLOCATION VIP FUND
Class 2 Fund Expenses
As an investor in a variable insurance contract (Contract) that indirectly provides for investment in an underlying mutual fund, you can incur transaction and/or ongoing expenses at both the Fund level and the Contract Level: (1) transaction expenses can include sales charges (loads) on purchases, surrender fees, transfer fees and premium taxes; and (2) ongoing expenses can include management fees, distribution and service (12b-1) fees, contract fees, annual maintenance fees, mortality and expense risk fees and other fees and expenses. All mutual funds and Contracts have some types of ongoing expenses. The table below shows Fund-level ongoing expenses and can help you understand these costs and compare them with those of other mutual funds offered through the Contract. The table assumes a $1,000 investment held for the six months indicated. Please refer to the Fund prospectus for additional information on operating expenses.
Actual Fund Expenses
The table below provides information about the actual account values and actual expenses in the columns under the heading “Actual.” In these columns the Fund’s actual return, which includes the effect of ongoing Fund expenses but does not include the effect of ongoing Contract expenses, is used to calculate the “Ending Account Value.”
You can estimate the Fund-level expenses you paid during the period by following these steps (of course, your account value and expenses will differ from those in this illustration):
| | Divide your account value by $1,000 (if your account had an $8,600 value, then $8,600 ÷ $1,000 = 8.6). |
| | Then multiply the result by the number under the headings “Actual” and “Fund-Level Expenses Paid During Period” (if Fund-Level Expenses Paid During Period were $ 7.50, then
8.6 x $7.50 = $64.50). |
In this illustration, the estimated expenses paid this period at the Fund level are $64.50.
Hypothetical Example for Comparison with Other Mutual Funds
Under the heading “Hypothetical” in the table, information is provided about hypothetical account values and hypothetical expenses based on the Fund’s actual expense ratio and an assumed rate of return of 5% per year before expenses, which is not the Fund’s actual return. This information may not be used to estimate the actual ending account balance or expenses you paid for the period, but it can help you compare ongoing costs of investing in the Fund with those of other mutual funds offered through the Contract. To do so, compare this 5% hypothetical example with the 5% hypothetical examples that appear in the shareholder reports of other funds offered through the Contract.
Please note that expenses shown in the table are meant to highlight ongoing costs at the Fund level only and do not reflect any ongoing expenses at the Contract level, or transaction expenses at either the Fund or Contract levels. In addition, while the Fund does not have transaction expenses, if the transaction and ongoing expenses at the Contract level were included, the expenses shown below would be higher. You should consult your Contract prospectus or disclosure document for more information.
| | | | | | | | | | | | | | | | | | | | | | | | |
| | | | | | Actual
(actual return after expenses) | | | Hypothetical
(5% annual return before expenses) | | | | |
| Share Class | |
| Beginning Account
Value 7/1/16 |
| |
| Ending Account
Value 12/31/16 |
| |
| Fund-Level
Expenses Paid
During Period
7/1/16–12/31/16 |
1,2 | |
| Ending Account
Value 12/31/16 |
| |
| Fund-Level
Expenses Paid
During Period
7/1/16–12/31/16 |
1,2 | |
| Net
Annualized
Expense
Ratio |
2 |
Class 2 | | | $1,000 | | | | $1,022.30 | | | | $3.76 | | | | $1,021.42 | | | | $3.76 | | | | 0.74 | % |
1. Expenses are equal to the annualized expense ratio for the six-month period as indicated above–in the far right column–multiplied by the simple average account value over the period indicated, and then multiplied by 184/366 to reflect the one-half year period.
2. Reflects expenses after fee waivers and expense reimbursements. Does not include any ongoing expenses of the Contract for which the Fund is an investment option or acquired fund fees and expenses.
FRANKLIN TEMPLETON VARIABLE INSURANCE PRODUCTS TRUST
Financial Highlights
Franklin VolSmart Allocation VIP Fund
| | | | | | | | | | | | | | | | |
| | | Year Ended December 31, | |
| | | 2016 | | | 2015 | | | 2014 | | | 2013a | |
| Class 2 | | | | | | | | | | | | | | | | |
Per share operating performance (for a share outstanding throughout the year) | | | | | | | | | | | | | | | | |
| | | | |
Net asset value, beginning of year | | | $9.68 | | | | $10.20 | | | | $10.07 | | | | $10.00 | |
| | | | |
| | | | |
| Income from investment operationsb: | | | | | | | | | | | | | | | | |
| | | | |
Net investment incomec,d | | | 0.16 | | | | 0.10 | | | | 0.11 | | | | 0.09 | |
| | | | |
Net realized and unrealized gains (losses) | | | 0.28 | | | | (0.42 | ) | | | 0.25 | | | | 0.17 | |
| | | | |
Total from investment operations | | | 0.44 | | | | (0.32 | ) | | | 0.36 | | | | 0.26 | |
| | | | |
| | | | |
| Less distributions from: | | | | | | | | | | | | | | | | |
| | | | |
Net investment income and net foreign currency gains | | | (— | )e | | | (0.05 | ) | | | (0.23 | ) | | | (0.19 | ) |
| | | | |
Net realized gains | | | (0.02 | ) | | | (0.15 | ) | | | (— | )e | | | — | |
| | | | |
Total distributions | | | (0.02 | ) | | | (0.20 | ) | | | (0.23 | ) | | | (0.19 | ) |
| | | | |
Net asset value, end of year | | | $10.10 | | | | $9.68 | | | | $10.20 | | | | $10.07 | |
| | | | |
| | | | |
Total returnf | | | 4.39% | | | | (3.12)% | | | | 3.60% | | | | 2.56% | |
| | | | |
| Ratios to average net assetsg | | | | | | | | | | | | | | | | |
| | | | |
Expenses before waiver and payments by affiliatesh | | | 1.25% | | | | 1.77% | | | | 1.97% | | | | 2.97% | |
| | | | |
Expenses net of waiver and payments by affiliatesh | | | 0.73%i | | | | 0.93% | | | | 1.08%i | | | | 1.08%i | |
| | | | |
Net investment incomed | | | 1.50% | | | | 1.30% | | | | 1.07% | | | | 1.21% | |
| | | | |
| Supplemental data | | | | | | | | | | | | | | | | |
| | | | |
Net assets, end of year (000’s) | | | $31 | | | | $8,703 | | | | $10,201 | | | | $10,065 | |
| | | | |
Portfolio turnover rate | | | 1.00% | | | | 95.15% | | | | 22.04% | | | | 8.12% | |
aFor the period April 1, 2013 (commencement of operations) to December 31, 2013.
bThe amount shown for a share outstanding throughout the period may not correlate with the Statement of Operations for the period due to the timing of sales and repurchases of the Fund’s shares in relation to income earned and/or fluctuating fair value of the investments of the Fund.
cBased on average daily shares outstanding.
dRecognition of net investment income by the Fund is affected by the timing of declaration of dividends by the Underlying Funds and exchange traded funds in which the Fund invests.
eAmount rounds to less than $0.01 per share.
fTotal return does not include fees, charges or expenses imposed by the variable annuity and life insurance contracts for which Franklin Templeton Variable Insurance Products Trust serves as an underlying investment vehicle. Total return is not annualized for periods less than one year.
gRatios are annualized for periods less than one year.
hDoes not include expenses of the Underlying Funds and exchange traded funds in which the Fund invests. The weighted average indirect expenses of the Underlying Funds was 0.20% for the year ended December 31, 2016.
iBenefit of expense reduction rounds to less than 0.01%.
| | | | |
| FVA-6 | | Annual Report | The accompanying notes are an integral part of these financial statements. | | |
FRANKLIN TEMPLETON VARIABLE INSURANCE PRODUCTS TRUST
FINANCIAL HIGHLIGHTS
Franklin VolSmart Allocation VIP Fund (continued)
| | | | | | | | | | | | | | | | |
| | | Year Ended December 31, | |
| | | 2016 | | | 2015 | | | 2014 | | | 2013a | |
| Class 5 | | | | | | | | | | | | | | | | |
Per share operating performance (for a share outstanding throughout the year) | | | | | | | | | | | | | | | | |
| | | | |
Net asset value, beginning of year | | | $9.67 | | | | $10.20 | | | | $10.07 | | | | $10.00 | |
| | | | |
| | | | |
| Income from investment operationsb: | | | | | | | | | | | | | | | | |
| | | | |
Net investment incomec,d | | | 0.16 | | | | 0.16 | | | | 0.13 | | | | 0.10 | |
| | | | |
Net realized and unrealized gains (losses) | | | 0.29 | | | | (0.47 | ) | | | 0.25 | | | | 0.17 | |
| | | | |
Total from investment operations | | | 0.45 | | | | (0.31 | ) | | | 0.38 | | | | 0.27 | |
| | | | |
| | | | |
| Less distributions from: | | | | | | | | | | | | | | | | |
| | | | |
Net investment income and net foreign currency gains | | | (0.03 | ) | | | (0.07 | ) | | | (0.25 | ) | | | (0.20 | ) |
| | | | |
Net realized gains | | | (0.02 | ) | | | (0.15 | ) | | | (— | )e | | | — | |
| | | | |
Total distributions | | | (0.05 | ) | | | (0.22 | ) | | | (0.25 | ) | | | (0.20 | ) |
| | | | |
Net asset value, end of year | | | $10.07 | | | | $9.67 | | | | $10.20 | | | | $10.07 | |
| | | | |
| | | | |
Total returnf | | | 4.59% | | | | (3.10)% | | | | 3.75% | | | | 2.68% | |
| | | | |
| Ratios to average net assetsg | | | | | | | | | | | | | | | | |
| | | | |
Expenses before waiver and payments by affiliatesh | | | 1.15% | | | | 1.66% | | | | 1.82% | | | | 2.82% | |
| | | | |
Expenses net of waiver and payments by affiliatesh | | | 0.63%i | | | | 0.82% | | | | 0.93%i | | | | 0.93%i | |
| | | | |
Net investment incomed | | | 1.60% | | | | 1.41% | | | | 1.22% | | | | 1.36% | |
| | | | |
| Supplemental data | | | | | | | | | | | | | | | | |
| | | | |
Net assets, end of year (000’s) | | | $124,581 | | | | $54,816 | | | | $10,201 | | | | $10,065 | |
| | | | |
Portfolio turnover rate | | | 1.00% | | | | 95.15% | | | | 22.04% | | | | 8.12% | |
aFor the period April 1, 2013 (commencement of operations) to December 31, 2013.
bThe amount shown for a share outstanding throughout the period may not correlate with the Statement of Operations for the period due to the timing of sales and repurchases of the Fund’s shares in relation to income earned and/or fluctuating fair value of the investments of the Fund.
cBased on average daily shares outstanding.
dRecognition of net investment income by the Fund is affected by the timing of declaration of dividends by the Underlying Funds and exchange traded funds in which the Fund invests.
eAmount rounds to less than $0.01 per share.
fTotal return does not include fees, charges or expenses imposed by the variable annuity and life insurance contracts for which Franklin Templeton Variable Insurance Products Trust serves as an underlying investment vehicle. Total return is not annualized for periods less than one year.
gRatios are annualized for periods less than one year.
hDoes not include expenses of the Underlying Funds and exchange traded funds in which the Fund invests. The weighted average indirect expenses of the Underlying Funds was 0.20% for the year ended December 31, 2016.
iBenefit of expense reduction rounds to less than 0.01%.
| | | | | | |
| | | The accompanying notes are an integral part of these financial statements. | Annual Report | | | FVA-7 | |
FRANKLIN TEMPLETON VARIABLE INSURANCE PRODUCTS TRUST
Statement of Investments, December 31, 2016
Franklin VolSmart Allocation VIP Fund
| | | | | | | | | | |
| | | | | Shares | | | Value | |
| | | Common Stocks 49.2% | | | | | | |
| | | Automobiles & Components 0.1% | | | | | | |
a | | Adient PLC | | | 2,905 | | | $ | 170,233 | |
| | | | | | | | | | |
| | Capital Goods 10.4% | | | | | | | | |
| | Carlisle Cos. Inc. | | | 5,760 | | | | 635,270 | |
| | Donaldson Co. Inc. | | | 10,030 | | | | 422,062 | |
| | Dover Corp. | | | 19,030 | | | | 1,425,918 | |
| | General Dynamics Corp. | | | 7,750 | | | | 1,338,115 | |
| | Honeywell International Inc. | | | 15,410 | | | | 1,785,248 | |
| | Johnson Controls International PLC | | | 29,552 | | | | 1,217,247 | |
| | Pentair PLC (United Kingdom) | | | 25,280 | | | | 1,417,450 | |
| | Roper Technologies Inc. | | | 12,880 | | | | 2,358,070 | |
| | United Technologies Corp. | | | 15,930 | | | | 1,746,247 | |
| | W.W. Grainger Inc. | | | 2,450 | | | | 569,013 | |
| | | | | | | | | | |
| | | | | | | | | 12,914,640 | |
| | | | | | | | | | |
| | Commercial & Professional Services 1.0% | | | | | | | | |
| | Cintas Corp. | | | 5,760 | | | | 665,626 | |
| | Matthews International Corp., A | | | 7,670 | | | | 589,439 | |
| | | | | | | | | | |
| | | | | | | | | 1,255,065 | |
| | | | | | | | | | |
| | Consumer Durables & Apparel 1.0% | | | | | | | | |
| | Leggett & Platt Inc. | | | 7,590 | | | | 370,999 | |
| | NIKE Inc., B | | | 16,550 | | | | 841,237 | |
| | | | | | | | | | |
| | | | | | | | | 1,212,236 | |
| | | | | | | | | | |
| | Consumer Services 1.3% | | | | | | | | |
| | McDonald’s Corp. | | | 7,580 | | | | 922,638 | |
a | | Yum China Holdings Inc. (China) | | | 6,900 | | | | 180,228 | |
| | Yum! Brands Inc. | | | 7,400 | | | | 468,642 | |
| | | | | | | | | | |
| | | | | | | | | 1,571,508 | |
| | | | | | | | | | |
| | Diversified Financials 0.2% | | | | | | | | |
| | State Street Corp. | | | 3,150 | | | | 244,818 | |
| | | | | | | | | | |
| | Energy 3.8% | | | | | | | | |
| | Chevron Corp. | | | 6,990 | | | | 822,723 | |
| | EOG Resources Inc. | | | 4,630 | | | | 468,093 | |
| | Exxon Mobil Corp. | | | 11,830 | | | | 1,067,776 | |
| | Occidental Petroleum Corp. | | | 13,210 | | | | 940,948 | |
| | Schlumberger Ltd. | | | 17,320 | | | | 1,454,014 | |
| | | | | | | | | | |
| | | | | | | | | 4,753,554 | |
| | | | | | | | | | |
| | Food & Staples Retailing 2.0% | | | | | | | | |
| | CVS Health Corp. | | | 9,250 | | | | 729,917 | |
| | Wal-Mart Stores Inc. | | | 10,690 | | | | 738,893 | |
| | Walgreens Boots Alliance Inc. | | | 11,780 | | | | 974,913 | |
| | | | | | | | | | |
| | | | | | | | | 2,443,723 | |
| | | | | | | | | | |
| | Food, Beverage & Tobacco 3.4% | | | | | | | | |
| | Archer-Daniels-Midland Co. | | | 22,780 | | | | 1,039,907 | |
| | Bunge Ltd. | | | 17,140 | | | | 1,238,194 | |
| | McCormick & Co. Inc. | | | 8,150 | | | | 760,640 | |
| | PepsiCo Inc. | | | 11,050 | | | | 1,156,161 | |
| | | | | | | | | | |
| | | | | | | | | 4,194,902 | |
| | | | | | | | | | |
FRANKLIN TEMPLETON VARIABLE INSURANCE PRODUCTS TRUST
STATEMENT OF INVESTMENTS
Franklin VolSmart Allocation VIP Fund (continued)
| | | | | | | | | | |
| | | | | Shares | | | Value | |
| | | Common Stocks (continued) | | | | | | |
| | | Health Care Equipment & Services 5.7% | | | | | | |
| | Abbott Laboratories | | | 20,960 | | | $ | 805,074 | |
| | Becton, Dickinson and Co. | | | 10,350 | | | | 1,713,442 | |
| | DENTSPLY SIRONA Inc. | | | 6,780 | | | | 391,409 | |
| | Medtronic PLC | | | 21,690 | | | | 1,544,979 | |
| | Stryker Corp. | | | 15,130 | | | | 1,812,725 | |
| | West Pharmaceutical Services Inc. | | | 10,660 | | | | 904,288 | |
| | | | | | | | | | |
| | | | | | | | | 7,171,917 | |
| | | | | | | | | | |
| | Household & Personal Products 1.7% | | | | | | | | |
| | Colgate-Palmolive Co. | | | 13,810 | | | | 903,726 | |
| | The Procter & Gamble Co. | | | 14,880 | | | | 1,251,111 | |
| | | | | | | | | | |
| | | | | | | | | 2,154,837 | |
| | | | | | | | | | |
| | Insurance 0.9% | | | | | | | | |
| | Aflac Inc. | | | 6,820 | | | | 474,672 | |
| | Chubb Ltd. | | | 3,081 | | | | 407,062 | |
| | Erie Indemnity Co., A | | | 2,720 | | | | 305,864 | |
| | | | | | | | | | |
| | | | | | | | | 1,187,598 | |
| | | | | | | | | | |
| | Materials 5.7% | | | | | | | | |
| | Air Products and Chemicals Inc. | | | 12,690 | | | | 1,825,076 | |
| | Albemarle Corp. | | | 24,790 | | | | 2,133,923 | |
| | Bemis Co. Inc. | | | 5,250 | | | | 251,055 | |
| | Ecolab Inc. | | | 5,960 | | | | 698,631 | |
| | Nucor Corp. | | | 6,530 | | | | 388,666 | |
| | Praxair Inc. | | | 15,490 | | | | 1,815,273 | |
| | | | | | | | | | |
| | | | | | | | | 7,112,624 | |
| | | | | | | | | | |
| | Media 0.5% | | | | | | | | |
| | John Wiley & Sons Inc., A | | | 11,270 | | | | 614,215 | |
| | | | | | | | | | |
| | Pharmaceuticals, Biotechnology & Life Sciences 2.6% | | | | | | | | |
| | AbbVie Inc. | | | 7,340 | | | | 459,631 | |
| | Johnson & Johnson | | | 13,640 | | | | 1,571,464 | |
| | Perrigo Co. PLC | | | 6,040 | | | | 502,709 | |
| | Pfizer Inc. | | | 12,510 | | | | 406,325 | |
| | Roche Holding AG, ADR (Switzerland) | | | 8,900 | | | | 253,917 | |
| | | | | | | | | | |
| | | | | | | | | 3,194,046 | |
| | | | | | | | | | |
| | Retailing 2.4% | | | | | | | | |
| | The Gap Inc. | | | 15,720 | | | | 352,757 | |
| | Ross Stores Inc. | | | 16,890 | | | | 1,107,984 | |
| | Target Corp. | | | 13,440 | | | | 970,771 | |
| | Tiffany & Co. | | | 6,980 | | | | 540,461 | |
| | | | | | | | | | |
| | | | | | | | | 2,971,973 | |
| | | | | | | | | | |
| | Semiconductors & Semiconductor Equipment 2.5% | | | | | | | | |
| | Analog Devices Inc. | | | 2,970 | | | | 215,681 | |
| | Linear Technology Corp. | | | 12,470 | | | | 777,504 | |
| | QUALCOMM Inc. | | | 8,780 | | | | 572,456 | |
| | Texas Instruments Inc. | | | 18,880 | | | | 1,377,674 | |
a | | Versum Materials Inc. | | | 5,495 | | | | 154,245 | |
| | | | | | | | | | |
| | | | | | | | | 3,097,560 | |
| | | | | | | | | | |
FRANKLIN TEMPLETON VARIABLE INSURANCE PRODUCTS TRUST
STATEMENT OF INVESTMENTS
Franklin VolSmart Allocation VIP Fund (continued)
| | | | | | | | | | |
| | | | | Shares | | | Value | |
| | | Common Stocks (continued) | | | | | | |
| | | Software & Services 3.3% | | | | | | |
| | Accenture PLC, A | | | 12,860 | | | $ | 1,506,292 | |
| | Microsoft Corp. | | | 37,680 | | | | 2,341,435 | |
| | Visa Inc., A | | | 3,610 | | | | 281,652 | |
| | | | | | | | | | |
| | | | | | | | | 4,129,379 | |
| | | | | | | | | | |
| | Transportation 0.7% | | | | | | | | |
| | United Parcel Service Inc., B | | | 7,760 | | | | 889,606 | |
| | | | | | | | | | |
| | Total Common Stocks (Cost $56,648,068) | | | | | | | 61,284,434 | |
| | | | | | | | | | |
b | | Investments in Underlying Funds 42.7% | | | | | | | | |
| | Domestic Equity 9.9% | | | | | | | | |
a | | Franklin DynaTech Fund, Class R6 | | | 251,990 | | | | 12,413,003 | |
| | | | | | | | | | |
| | Domestic Fixed Income 23.5% | | | | | | | | |
| | Franklin Low Duration Total Return Fund, Class R6 | | | 1,612,689 | | | | 15,933,371 | |
| | Franklin Strategic Income Fund, Class R6 | | | 1,380,378 | | | | 13,306,843 | |
| | | | | | | | | | |
| | | | | | | | | 29,240,214 | |
| | | | | | | | | | |
| | Domestic Hybrid 9.3% | | | | | | | | |
| | Franklin Income Fund, Class R6 | | | 5,053,596 | | | | 11,572,735 | |
| | | | | | | | | | |
| | | |
| | Total Investments in Underlying Funds (Cost $52,540,308) | | | | | | | 53,225,952 | |
| | | | | | | | | | |
| | Total Investments before Short Term Investments (Cost $109,188,376) | | | | | | | 114,510,386 | |
| | | | | | | | | | |
| | | |
| | Short Term Investments (Cost $9,750,824) 7.8% | | | | | | | | |
| | Money Market Funds 7.8% | | | 9,750,824 | | | | 9,750,824 | |
b,c | | Institutional Fiduciary Trust Money Market Portfolio, 0.09% | | | | | | | | |
| | | | | | | | | | |
| | Total Investments (Cost $118,939,200) 99.7% | | | | | | | 124,261,210 | |
| | Other Assets, less Liabilities 0.3% | | | | | | | 350,734 | |
| | | | | | | | | | |
| | Net Assets 100.0% | | | | | | $ | 124,611,944 | |
| | | | | | | | | | |
aNon-income producing.
bSee Note 3(e) regarding investments in Underlying Funds.
cThe rate shown is the annualized seven-day yield at period end.
At December 31, 2016, the Fund had the following total return swap contracts outstanding. See Note 1(c).
Total Return Swap Contracts
| | | | | | | | | | | | | | | | | | | | | | | | |
| Underlying Instruments | | Financing
Rate | | | Counterparty | | | Notional
Value | | | Expiration
Date | | | Unrealized
Appreciation | | | Unrealized
Depreciation | |
| OTC Swap Contracts Long | | | | | | | | | | | | | | | | | | | | | | | | |
Dynamic VIX Backwardation (BEFSDVB1) | | | 0.25 | % | | | BZWS | | | $ | 21,600,000 | | | | 5/25/17 | | | $ | — | | | $ | (5,038 | ) |
| | | | | | | | | | | | | | | | | | | | |
See Note 7 regarding other derivative information.
See Abbreviations on page FVA- 22.
| | | | |
| FVA-10 | | Annual Report | The accompanying notes are an integral part of these financial statements. | | |
FRANKLIN TEMPLETON VARIABLE INSURANCE PRODUCTS TRUST
Financial Statements
Statement of Assets and Liabilities
December 31, 2016
| | | | |
| | | Franklin VolSmart
Allocation VIP
Fund | |
Assets: | | | | |
Investments in securities: | | | | |
Cost - Unaffiliated issuers | | $ | 56,648,068 | |
Cost - Non-controlled affiliates (Note 3e) | | | 62,291,132 | |
| | | | |
Total cost of investments | | $ | 118,939,200 | |
| | | | |
Value - Unaffiliated issuers | | $ | 61,284,434 | |
Value - Non-controlled affiliates (Note 3e) | | | 62,976,776 | |
| | | | |
Total value of investments | | | 124,261,210 | |
Receivables: | | | | |
Capital shares sold | | | 543,063 | |
Dividends | | | 99,477 | |
Due from brokers | | | 10,000 | |
Other assets | | | 7 | |
| | | | |
Total assets | | | 124,913,757 | |
| | | | |
Liabilities: | | | | |
Payables: | | | | |
Investment securities purchased | | | 165,309 | |
Capital shares redeemed | | | 39,148 | |
Distribution fees | | | 29,359 | |
Professional fees | | | 55,345 | |
Unrealized depreciation on OTC swap contracts | | | 5,038 | |
Accrued expenses and other liabilities | | | 7,614 | |
| | | | |
Total liabilities | | | 301,813 | |
| | | | |
Net assets, at value | | $ | 124,611,944 | |
| | | | |
Net assets consist of: | | | | |
Paid-in capital | | $ | 122,789,823 | |
Distributions in excess of net investment income | | | (1,374,219 | ) |
Net unrealized appreciation (depreciation) | | | 5,316,972 | |
Accumulated net realized gain (loss) | | | (2,120,632 | ) |
| | | | |
Net assets, at value | | $ | 124,611,944 | |
| | | | |
| |
| Class 2: | | | | |
Net assets, at value | | $ | 30,931 | |
| | | | |
Shares outstanding | | | 3,061 | |
| | | | |
Net asset value and maximum offering price per share | | $ | 10.10 | |
| | | | |
| |
| Class 5: | | | | |
Net assets, at value | | $ | 124,581,013 | |
| | | | |
Shares outstanding | | | 12,365,880 | |
| | | | |
Net asset value and maximum offering price per share | | $ | 10.07 | |
| | | | |
| | | | | | |
| | | The accompanying notes are an integral part of these financial statements. | Annual Report | | | FVA-11 | |
FRANKLIN TEMPLETON VARIABLE INSURANCE PRODUCTS TRUST
FINANCIAL STATEMENTS
Statement of Operations
for the year ended December 31, 2016
| | | | |
| | | Franklin VolSmart
Allocation VIP
Fund | |
Investment income: | | | | |
Dividends: | | | | |
Unaffiliated issuers | | $ | 983,854 | |
Non-controlled affiliates (Note 3e) | | | 1,001,846 | |
| | | | |
Total investment income | | | 1,985,700 | |
| | | | |
Expenses: | | | | |
Management fees (Note 3a) | | | 709,923 | |
Distribution fees: (Note 3c) | | | | |
Class 2 | | | 9,700 | |
Class 5 | | | 127,589 | |
Custodian fees (Note 4) | | | 556 | |
Reports to shareholders | | | 30,832 | |
Registration and filing fees | | | 258 | |
Professional fees | | | 129,831 | |
Trustees’ fees and expenses | | | 358 | |
Other | | | 14,066 | |
| | | | |
Total expenses | | | 1,023,113 | |
Expense reductions (Note 4) | | | (127 | ) |
Expenses waived/paid by affiliates (Note 3e and 3f) | | | (456,318 | ) |
| | | | |
Net expenses | | | 566,668 | |
| | | | |
Net investment income | | | 1,419,032 | |
| | | | |
Realized and unrealized gains (losses): | | | | |
Net realized gain (loss) from: | | | | |
Sale of investments: | | | | |
Unaffiliated issuers | | | 51,881 | |
Futures contracts | | | (2,310,094 | ) |
Swap contracts | | | (2,442,610 | ) |
Realized gain distributions: | | | | |
Non-controlled affiliates (Note 3e) | | | 389,602 | |
| | | | |
Net realized gain (loss) | | | (4,311,221 | ) |
| | | | |
Net change in unrealized appreciation (depreciation) on: | | | | |
Investments | | | 6,282,398 | |
Futures contracts | | | 29,372 | |
Swap contracts | | | 139,419 | |
| | | | |
Net change in unrealized appreciation (depreciation) | | | 6,451,189 | |
| | | | |
Net realized and unrealized gain (loss) | | | 2,139,968 | |
| | | | |
Net increase (decrease) in net assets resulting from operations | | $ | 3,559,000 | |
| | | | |
| | | | |
| FVA-12 | | Annual Report | The accompanying notes are an integral part of these financial statements. | | |
FRANKLIN TEMPLETON VARIABLE INSURANCE PRODUCTS TRUST
FINANCIAL STATEMENTS
Statements of Changes in Net Assets
| | | | | | | | |
| | | Franklin VolSmart Allocation VIP Fund | |
| | | Year Ended December 31, | |
| | | 2016 | | | 2015 | |
Increase (decrease) in net assets: | | | | | | | | |
Operations: | | | | | | | | |
Net investment income | | $ | 1,419,032 | | | $ | 454,836 | |
Net realized gain (loss) | | | (4,311,221 | ) | | | 519,512 | |
Net change in unrealized appreciation (depreciation) | | | 6,451,189 | | | | (1,827,553 | ) |
| | | | |
Net increase (decrease) in net assets resulting from operations | | | 3,559,000 | | | | (853,205 | ) |
| | | | |
Distributions to shareholders from: | | | | | | | | |
Net investment income: | | | | | | | | |
Class 2 | | | (294 | ) | | | (44,460 | ) |
Class 5 | | | (354,685 | ) | | | (238,720 | ) |
Net realized gains: | | | | | | | | |
Class 2 | | | (7,355 | ) | | | (133,455 | ) |
Class 5 | | | (116,711 | ) | | | (815,447 | ) |
| | | | |
Total distributions to shareholders | | | (479,045 | ) | | | (1,232,082 | ) |
| | | | |
Capital share transactions: (Note 2) | | | | | | | | |
Class 2 | | | (8,888,134 | ) | | | (1,003,000 | ) |
Class 5 | | | 66,900,840 | | | | 46,206,241 | |
| | | | |
Total capital share transactions | | | 58,012,706 | | | | 45,203,241 | |
| | | | |
Net increase (decrease) in net assets | | | 61,092,661 | | | | 43,117,954 | |
Net assets: | | | | | | | | |
Beginning of year | | | 63,519,283 | | | | 20,401,329 | |
| | | | |
End of year | | | $124,611,944 | | | | $63,519,283 | |
| | | | |
Undistributed net investment income included in net assets: | | | | | | | | |
End of year | | | $— | | | | $4,682 | |
| | | | |
Distributions in excess of net investment income included in net assets: | | | | | | | | |
End of year | | | $(1,374,219 | ) | | | $— | |
| | | | |
| | | | | | |
| | | The accompanying notes are an integral part of these financial statements. | Annual Report | | | FVA-13 | |
FRANKLIN TEMPLETON VARIABLE INSURANCE PRODUCTS TRUST
Notes to Financial Statements
Franklin VolSmart Allocation VIP Fund
1. Organization and Significant Accounting Policies
Franklin Templeton Variable Insurance Products Trust (Trust) is registered under the Investment Company Act of 1940 (1940 Act) as an open-end management investment company, consisting of nineteen separate funds and applies the specialized accounting and reporting guidance in U.S. Generally Accepted Accounting Principles (U.S. GAAP). Franklin VolSmart Allocation VIP Fund (Fund) is included in this report. The financial statements of the remaining funds in the Trust are presented separately. The Fund invests in affiliated funds managed by Franklin Templeton (Underlying Funds). Shares of the Fund are generally sold only to insurance company separate accounts to fund the benefits of variable life insurance policies or variable annuity contracts. At December 31, 2016, 98.4% of the Fund’s shares were held through one insurance company. Investment activities of these insurance company separate accounts could have a material impact on the Fund. The Fund offers two classes of shares: Class 2 and Class 5. Each class of shares differs by its distribution fees, voting rights on matters affecting a single class and its exchange privilege.
The accounting policies of the Underlying Funds are outlined in their respective shareholder reports. A copy of the Underlying Funds’ shareholder reports is available on the U.S. Securities and Exchange Commission (SEC) website at sec.gov or at the SEC’s Public Reference Room in Washington, D.C. The Underlying Funds’ shareholder reports are not covered by this report.
The following summarizes the Fund’s significant accounting policies.
a. Financial Instrument Valuation
The Fund’s investments in financial instruments are carried at fair value daily. Fair value is the price that would be received to sell an asset or paid to transfer a liability in an orderly transaction between market participants on the measurement date. The Fund calculates the net asset value (NAV) per share as of 4 p.m. Eastern time each day the New York Stock Exchange (NYSE) is open for trading. Under compliance policies and procedures approved by the Trust’s Board of Trustees (the Board), the Fund’s administrator has responsibility for oversight of valuation, including leading the cross-functional Valuation Committee (VC). The VC provides administration and oversight of the Fund’s valuation policies and procedures, which are approved annually by the Board.
Among other things, these procedures allow the Fund to utilize independent pricing services, quotations from securities and financial instrument dealers, and other market sources to determine fair value.
Investments in the Underlying Funds are valued at their closing NAV each trading day.
Equity securities and derivative financial instruments listed on an exchange or on the NASDAQ National Market System are valued at the last quoted sale price or the official closing price of the day, respectively. Foreign equity securities are valued as of the close of trading on the foreign stock exchange on which the security is primarily traded, or as of 4 p.m. Eastern time. The value is then converted into its U.S. dollar equivalent at the foreign exchange rate in effect at 4 p.m. Eastern time on the day that the value of the security is determined. Over-the-counter (OTC) securities are valued within the range of the most recent quoted bid and ask prices. Securities that trade in multiple markets or on multiple exchanges are valued according to the broadest and most representative market. Certain equity securities are valued based upon fundamental characteristics or relationships to similar securities.
Certain derivative financial instruments trade in the OTC market. The Fund’s pricing services use various techniques including industry standard option pricing models and proprietary discounted cash flow models to determine the fair value of those instruments. The Fund’s net benefit or obligation under the derivative contract, as measured by the fair value of the contract, is included in net assets.
The Fund has procedures to determine the fair value of financial instruments for which market prices are not reliable or readily available. Under these procedures, the VC convenes on a regular basis to review such financial instruments and considers a number of factors, including significant unobservable valuation inputs, when arriving at fair value. The VC primarily employs a market-based approach which may use related or comparable assets or liabilities, recent transactions, market multiples, book values, and other relevant information for the investment to determine the fair value of the investment. An income-based valuation approach may also be used in which the anticipated future cash flows of the investment are discounted to calculate fair value. Discounts may also be applied due to the nature or duration of any restrictions on the disposition of the investments. Due to the inherent uncertainty of valuations of such investments, the fair values may differ significantly from
FRANKLIN TEMPLETON VARIABLE INSURANCE PRODUCTS TRUST
NOTES TO FINANCIAL STATEMENTS
Franklin VolSmart Allocation VIP Fund (continued)
the values that would have been used had an active market existed. The VC employs various methods for calibrating these valuation approaches including a regular review of key inputs and assumptions, transactional back-testing or disposition analysis, and reviews of any related market activity.
Trading in securities on foreign securities stock exchanges and OTC markets may be completed before 4 p.m. Eastern time. In addition, trading in certain foreign markets may not take place on every Fund’s business day. Occasionally, events occur between the time at which trading in a foreign security is completed and 4 p.m. Eastern time that might call into question the reliability of the value of a portfolio security held by the Fund. As a result, differences may arise between the value of the Fund’s portfolio securities as determined at the foreign market close and the latest indications of value at 4 p.m. Eastern time. In order to minimize the potential for these differences, the VC monitors price movements following the close of trading in foreign stock markets through a series of country specific market proxies (such as baskets of American Depositary Receipts, futures contracts and exchange traded funds). These price movements are measured against established trigger thresholds for each specific market proxy to assist in determining if an event has occurred that may call into question the reliability of the values of the foreign securities held by the Fund. If such an event occurs, the securities may be valued using fair value procedures, which may include the use of independent pricing services.
When the last day of the reporting period is a non-business day, certain foreign markets may be open on those days that the Fund’s NAV is not calculated, which could result in differences between the value of the Fund’s portfolio securities on the last business day and the last calendar day of the reporting period. Any significant security valuation changes due to an open foreign market are adjusted and reflected by the Fund for financial reporting purposes.
b. Foreign Currency Translation
Portfolio securities and other assets and liabilities denominated in foreign currencies are translated into U.S. dollars based on the exchange rate of such currencies against U.S. dollars on the date of valuation. The Fund may enter into foreign currency exchange contracts to facilitate transactions denominated in a foreign currency. Purchases and sales of securities, income and expense items denominated in foreign currencies are translated into U.S. dollars at the exchange rate in effect on the transaction
date. Portfolio securities and assets and liabilities denominated in foreign currencies contain risks that those currencies will decline in value relative to the U.S. dollar. Occasionally, events may impact the availability or reliability of foreign exchange rates used to convert the U.S. dollar equivalent value. If such an event occurs, the foreign exchange rate will be valued at fair value using procedures established and approved by the Board.
The Fund does not separately report the effect of changes in foreign exchange rates from changes in market prices on securities held. Such changes are included in net realized and unrealized gain or loss from investments in the Statement of Operations.
Realized foreign exchange gains or losses arise from sales of foreign currencies, currency gains or losses realized between the trade and settlement dates on securities transactions and the difference between the recorded amounts of dividends, interest, and foreign withholding taxes and the U.S. dollar equivalent of the amounts actually received or paid. Net unrealized foreign exchange gains and losses arise from changes in foreign exchange rates on foreign denominated assets and liabilities other than investments in securities held at the end of the reporting period.
c. Derivative Financial Instruments
The Fund invested in derivative financial instruments in order to manage risk or gain exposure to various other investments or markets. Derivatives are financial contracts based on an underlying or notional amount, require no initial investment or an initial net investment that is smaller than would normally be required to have a similar response to changes in market factors, and require or permit net settlement. Derivatives contain various risks including the potential inability of the counterparty to fulfill their obligations under the terms of the contract, the potential for an illiquid secondary market, and/or the potential for market movements which expose the Fund to gains or losses in excess of the amounts shown in the Statement of Assets and Liabilities. Realized gain and loss and unrealized appreciation and depreciation on these contracts for the period are included in the Statement of Operations.
Derivative counterparty credit risk is managed through a formal evaluation of the creditworthiness of all potential counterparties. The Fund attempts to reduce its exposure to counterparty credit risk on OTC derivatives, whenever possible, by entering into International Swaps and Derivatives
FRANKLIN TEMPLETON VARIABLE INSURANCE PRODUCTS TRUST
NOTES TO FINANCIAL STATEMENTS
Franklin VolSmart Allocation VIP Fund (continued)
1. Organization and Significant Accounting
Policies (continued)
c. Derivative Financial Instruments (continued)
Association (ISDA) master agreements with certain counterparties. These agreements contain various provisions, including but not limited to collateral requirements, events of default, or early termination. Termination events applicable to the counterparty include certain deteriorations in the credit quality of the counterparty. Termination events applicable to the Fund include failure of the Fund to maintain certain net asset levels and/or limit the decline in net assets over various periods of time. In the event of default or early termination, the ISDA master agreement gives the non-defaulting party the right to net and close-out all transactions traded, whether or not arising under the ISDA agreement, to one net amount payable by one counterparty to the other. However, absent an event of default or early termination, OTC derivative assets and liabilities are presented gross and not offset in the Statement of Assets and Liabilities. Early termination by the counterparty may result in an immediate payment by the Fund of any net liability owed to that counterparty under the ISDA agreement. At December 31, 2016, the Fund had OTC derivatives in a net liability position of $5,038 and the aggregate value of collateral pledged for such contracts was $10,000.
Collateral requirements differ by type of derivative. Collateral terms are contract specific for OTC derivatives. For OTC derivatives traded under an ISDA master agreement, posting of collateral is required by either the Fund or the applicable counterparty if the total net exposure of all OTC derivatives with the applicable counterparty exceeds the minimum transfer amount, which typically ranges from $100,000 to $250,000, and can vary depending on the counterparty and the type of the agreement. Generally, collateral is determined at the close of Fund business each day and any additional collateral required due to changes in derivative values may be delivered by the Fund or the counterparty within a few business days. Collateral pledged and/or received by the Fund, if any, is held in segregated accounts with the Fund’s custodian/counterparty broker and can be in the form of cash and/or securities. Unrestricted cash may be invested according to the Fund’s investment objectives. To the extent that the amounts due to the Fund from its counterparties are not subject to collateralization or are not fully collateralized, the Fund bears the risk of loss from counterparty non-performance.
The Fund entered into exchange traded futures contracts primarily to manage and/or gain exposure to equity price. A futures contract is an agreement between the Fund and a counterparty to buy or sell an asset at a specified price on a future date. Required initial margins are pledged by the Fund, and the daily change in fair value is accounted for as a variation margin payable or receivable in the Statement of Assets and Liabilities.
The Fund entered into OTC total return swap contracts primarily to manage and/or gain exposure to equity price risk of an underlying instrument such as a stock, bond, index or basket of securities or indices. A total return swap is an agreement between the Fund and a counterparty to exchange a return linked to an underlying instrument for a floating or fixed rate payment, both based upon a notional amount. Over the term of the contract, contractually required payments to be paid or received are accrued daily and recorded as unrealized appreciation or depreciation until the payments are made, at which time they are recognized as realized gain or loss.
See Note 7 regarding other derivative information.
d. Income and Deferred Taxes
It is the Fund’s policy to qualify as a regulated investment company under the Internal Revenue Code. The Fund intends to distribute to shareholders substantially all of its taxable income and net realized gains to relieve it from federal income and if applicable, excise taxes. As a result, no provision for U.S. federal income taxes is required.
The Fund may be subject to foreign taxation related to income received, capital gains on the sale of securities and certain foreign currency transactions in the foreign jurisdictions in which it invests. Foreign taxes, if any, are recorded based on the tax regulations and rates that exist in the foreign markets in which the Fund invests. When a capital gain tax is determined to apply, the Fund records an estimated deferred tax liability in an amount that would be payable if the securities were disposed of on the valuation date.
The Fund may recognize an income tax liability related to its uncertain tax positions under U.S. GAAP when the uncertain tax position has a less than 50% probability that it will be sustained upon examination by the tax authorities based on its technical merits. As of December 31, 2016, the Fund has determined that no tax liability is required in its financial statements related to uncertain tax positions for any open tax
FRANKLIN TEMPLETON VARIABLE INSURANCE PRODUCTS TRUST
NOTES TO FINANCIAL STATEMENTS
Franklin VolSmart Allocation VIP Fund (continued)
years (or expected to be taken in future tax years). Open tax years are those that remain subject to examination and are based on each tax jurisdiction’s statute of limitation.
e. Security Transactions, Investment Income, Expenses and Distributions
Security transactions are accounted for on trade date. Realized gains and losses on security transactions are determined on a specific identification basis. Estimated expenses are accrued daily. Dividend income and realized gain distributions are recorded on the ex-dividend date except for certain dividends from securities where the dividend rate is not available. In such cases, the dividend is recorded as soon as the information is received by the Fund. Distributions to shareholders are recorded on the ex-dividend date and are determined according to income tax regulations (tax basis). Distributable earnings determined on a tax basis may differ from earnings recorded in accordance with U.S. GAAP. These differences may be permanent or temporary. Permanent differences are reclassified among capital accounts to reflect their tax character. These reclassifications have no impact on net assets or the results of operations. Temporary differences are not reclassified, as they may reverse in subsequent periods.
Common expenses incurred by the Trust are allocated among the Funds based on the ratio of net assets of each Fund to the combined net assets of the Trust. Fund specific expenses are charged directly to the Fund that incurred the expense.
The Fund indirectly bears its proportionate share of expenses from the Underlying Funds. Since the Underlying Funds have varied expense levels and the Fund may own different proportions of the Underlying Funds at different times, the amount of expenses incurred indirectly by the Fund will vary.
Realized and unrealized gains and losses and net investment income, not including class specific expenses, are allocated daily to each class of shares based upon the relative proportion of net assets of each class. Differences in per share distributions, by class, are generally due to differences in class specific expenses.
f. Accounting Estimates
The preparation of financial statements in accordance with U.S. GAAP requires management to make estimates and assumptions that affect the reported amounts of assets and liabilities at the date of the financial statements and the amounts of income and expenses during the reporting period. Actual results could differ from those estimates.
g. Guarantees and Indemnifications
Under the Trust’s organizational documents, its officers and trustees are indemnified by the Trust against certain liabilities arising out of the performance of their duties to the Trust. Additionally, in the normal course of business, the Trust, on behalf of the Fund, enters into contracts with service providers that contain general indemnification clauses. The Trust’s maximum exposure under these arrangements is unknown as this would involve future claims that may be made against the Trust that have not yet occurred. Currently, the Trust expects the risk of loss to be remote.
2. Shares of Beneficial Interest
At December 31, 2016, there were an unlimited number of shares authorized (without par value). Transactions in the Fund’s shares were as follows:
| | | | | | | | | | | | | | | | | | | | |
| | | Year Ended December 31, | |
| | | 2016 | | | | | | 2015 | |
| | | Shares | | | Amount | | | | | | Shares | | | Amount | |
| | | | | |
| Class 2 Shares: | | | | | | | | | | | | | | | | | | | | |
Shares redeemed | | | (895,626 | ) | | $ | (8,888,134 | ) | | | | | | | (101,313 | ) | | $ | (1,003,000 | ) |
| | | | |
FRANKLIN TEMPLETON VARIABLE INSURANCE PRODUCTS TRUST
NOTES TO FINANCIAL STATEMENTS
Franklin VolSmart Allocation VIP Fund (continued)
2. Shares of Beneficial Interest (continued)
| | | | | | | | | | | | | | | | | | | | |
| | | Year Ended December 31, | |
| | | 2016 | | | | | | 2015 | |
| | | Shares | | | Amount | | | | | | Shares | | | Amount | |
| | | | | |
| Class 5 Shares: | | | | | | | | | | | | | | | | | | | | |
Shares sold | | | 8,177,643 | | | $ | 81,628,729 | | | | | | | | 5,758,678 | | | $ | 57,072,466 | |
Shares issued in reinvestment of distributions | | | 46,757 | | | | 471,396 | | | | | | | | 105,163 | | | | 1,023,367 | |
Shares redeemed | | | (1,525,885 | ) | | | (15,199,285 | ) | | | | | | | (1,196,476 | ) | | | (11,889,592 | ) |
| | | | |
Net increase (decrease) | | | 6,698,515 | | | $ | 66,900,840 | | | | | | | | 4,667,365 | | | $ | 46,206,241 | |
| | | | |
3. Transactions with Affiliates
Franklin Resources, Inc. is the holding company for various subsidiaries that together are referred to as Franklin Templeton Investments. Certain officers and trustees of the Fund are also officers, directors and/or trustees of certain of the Underlying Funds and of the following subsidiaries:
| | |
| Subsidiary | | Affiliation |
Franklin Advisers, Inc. (Advisers) | | Investment manager |
Franklin Advisory Services, LLC (Advisory Services) | | Investment manager |
K2/D&S Management Co., LLC (K2 Advisors) | | Investment manager |
Franklin Templeton Services, LLC (FT Services) | | Administrative manager |
Franklin Templeton Distributors, Inc. (Distributors) | | Principal underwriter |
Franklin Templeton Investor Services, LLC (Investor Services) | | Transfer agent |
a. Management Fees
The Fund pays an investment management fee to Advisers of 0.80% per year of the average daily net assets of the Fund.
Under a subadvisory agreement, Advisory Services and K2 Advisors, affiliates of Advisers, provide subadvisory services to the Fund. The subadvisory fee is paid by Advisers based on the Fund’s average daily net assets, and is not an additional expense of the Fund.
b. Administrative Fees
Under an agreement with Advisers, FT Services provides administrative services to the Fund. The fee is paid by Advisers based on the Fund’s average daily net assets, and is not an additional expense of the Fund.
c. Distribution Fees
The Board has adopted distribution plans for Class 2 and Class 5 shares pursuant to Rule 12b-1 under the 1940 Act. Under the Fund’s compensation distribution plans, the Fund pays Distributors for costs incurred in connection with the servicing, sale and distribution of the Fund’s shares up to 0.35% and 0.15% per year of its average daily net assets of Class 2 and Class 5, respectively. The Board has agreed to limit the current rate to 0.25% per year for Class 2. The plan year, for purposes of monitoring compliance with the maximum annual plan rates, is February 1 through January 31.
d. Transfer Agent Fees
Investor Services, under terms of an agreement, performs shareholder servicing for the Fund and is not paid by the Fund for the services.
FRANKLIN TEMPLETON VARIABLE INSURANCE PRODUCTS TRUST
NOTES TO FINANCIAL STATEMENTS
Franklin VolSmart Allocation VIP Fund (continued)
e. Investments in Underlying Funds
The Fund invests in Underlying Funds which are managed by Advisers or an affiliate of Advisers. The Fund does not invest in Underlying Funds for the purpose of exercising a controlling influence over the management or policies. Management fees paid by the Fund are waived on assets invested in the Underlying Funds, as noted in the Statement of Operations, in an amount not to exceed the management and administrative fees paid directly or indirectly by the Underlying Funds.
Investments in Underlying Funds for the year ended December 31, 2016, were as follows:
| | | | | | | | | | | | | | | | | | | | | | | | | | | | | | | | |
| Underlying Funds | | Number
of Shares
Held at
Beginning
of Year | | | Gross
Additions | | | Gross
Reductions | | | Number
of Shares
Held at
End of
Year | | | Value at
End of
Year | | | Investment
Income | | | Realized
Gain (Loss) | | | % of Underlying
Fund Shares
Outstanding
Held at End
of Year | |
| Non-Controlled Affiliates | | | | | | | | | | | | | | | | | | | | | | | | | | | | | | | | |
Franklin DynaTech Fund, Class R6 | | | 177,994 | | | | 73,996 | | | | — | | | | 251,990 | | | $ | 12,413,003 | | | $ | — | | | $ | 389,602a | | | | 0.4% | |
Franklin Income Fund, Class R6 | | | 3,330,823 | | | | 1,722,773 | | | | — | | | | 5,053,596 | | | | 11,572,735 | | | | 482,053 | | | | — | | | | –%b | |
Franklin Low Duration Total Return Fund, Class R6 | | | 881,451 | | | | 731,238 | | | | — | | | | 1,612,689 | | | | 15,933,371 | | | | 243,201 | | | | — | | | | 0.6% | |
Franklin Strategic Income Fund, Class R6 | | | 796,192 | | | | 584,186 | | | | — | | | | 1,380,378 | | | | 13,306,843 | | | | 276,245 | | | | — | | | | 0.2% | |
Institutional Fiduciary Trust Money Market Portfolio, 0.09% | | | 1,582,659 | | | | 61,692,720 | | | | (53,524,555 | ) | | | 9,750,824 | | | | 9,750,824 | | | | 347 | | | | — | | | | 0.1% | |
| | | | | | | | | | | | | | | | | | | | | | | | |
Total | | | | | | | | | | | | | | | | | | $ | 62,976,776 | | | $ | 1,001,846 | | | $ | 389,602 | | | | | |
| | | | | | | | | | | | | | | | | | | | | | | | |
aIncludes realized gain distributions received.
bRounds to less than 0.1%
f. Waiver and Expense Reimbursements
Advisers has contractually agreed in advance to waive or limit its fees and to assume as its own expense certain expenses otherwise payable by the Fund so that the expenses (excluding distribution fees and acquired fund fees and expenses) for each class of the Fund do not exceed 0.65%, based on the average net assets of each class (other than certain non-routine expenses or costs, including those relating to litigation, indemnification, reorganizations, and liquidations) until July 25, 2017. Total expenses waived or paid are not subject to recapture subsequent to the Fund’s fiscal year end.
4. Expense Offset Arrangement
The Fund has entered into an arrangement with its custodian whereby credits realized as a result of uninvested cash balances are used to reduce a portion of the Fund’s custodian expenses. During the year ended December 31, 2016, the custodian fees were reduced as noted in the Statement of Operations.
5. Income Taxes
For tax purposes, capital losses may be carried over to offset future capital gains, if any.
At December 31, 2016, the capital loss carryforwards were as follows:
| | | | |
Capital loss carryforwards: | | | | |
Short term | | $ | 809,159 | |
Long term | | | 1,009,574 | |
| | | | |
Total capital loss carryforwards | | $ | 1,818,733 | |
| | | | |
FRANKLIN TEMPLETON VARIABLE INSURANCE PRODUCTS TRUST
NOTES TO FINANCIAL STATEMENTS
Franklin VolSmart Allocation VIP Fund (continued)
5. Income Taxes (continued)
For tax purposes, the Fund may elect to defer any portion of a late-year ordinary loss to the first day of the following fiscal year. At December 31, 2016, the Fund deferred late-year ordinary losses of $1,237,675.
The tax character of distributions paid during the years ended December 31, 2016 and 2015, was as follows:
| | | | | | | | |
| | | 2016 | | | 2015 | |
Distributions paid from: | | | | | | | | |
Ordinary income | | $ | 355,325 | | | $ | 283,180 | |
Long term capital gain | | | 123,720 | | | | 948,902 | |
| | | | |
| | $ | 479,045 | | | $ | 1,232,082 | |
| | | | |
At December 31, 2016, the cost of investments and net unrealized appreciation (depreciation) for income tax purposes were as follows:
| | | | |
Cost of investments | | $ | 119,377,641 | |
Unrealized appreciation | | $ | 6,399,465 | |
Unrealized depreciation | | | (1,515,896 | ) |
| | | | |
Net unrealized appreciation (depreciation) | | $ | 4,883,569 | |
| | | | |
Differences between income and/or capital gains as determined on a book basis and a tax basis are primarily due to differing treatment of swaps.
6. Investment Transactions
Purchases and sales of investments (excluding short term securities) for the year ended December 31, 2016, aggregated $46,776,742 and $829,965, respectively.
7. Other Derivative Information
At December 31, 2016, the Fund’s investments in derivative contracts are reflected in the Statement of Assets and Liabilities as follows:
| | | | | | | | | | | | |
| | | Asset Derivatives | | | Liability Derivatives | |
Derivative Contracts
Not Accounted for
as Hedging Instruments | | Statement of Assets and
Liabilities Location | | Fair Value | | | Statement of Assets and
Liabilities Location | | Fair Value | |
Equity contracts | | Unrealized appreciation on OTC swap contracts | | $ | — | | | Unrealized depreciation on OTC swap contracts | | $ | 5,038 | |
| | | | | | | | | | | | |
FRANKLIN TEMPLETON VARIABLE INSURANCE PRODUCTS TRUST
NOTES TO FINANCIAL STATEMENTS
Franklin VolSmart Allocation VIP Fund (continued)
For the year ended December 31, 2016, the effect of derivative contracts in the Fund’s Statement of Operations was as follows:
| | | | | | | | | | | | |
Derivative Contracts Not Accounted for as Hedging Instruments | | Statement of Operations
Locations | | Net
Realized
Gain
(Loss) for
the Year | | | Statement of Operations
Locations | | Net Change in
Unrealized
Appreciation
(Depreciation)
for the Year | |
| | Net realized gain (loss) from: | | | | | | Net change in unrealized appreciation (depreciation) on: | | | | |
Equity contracts | | Futures contracts | | $ | (2,310,094 | ) | | Futures contracts | | $ | 29,372 | |
| | Swap contracts | | | (2,442,610 | ) | | Swap contracts | | | 139,419 | |
| | | | | | | | | | | | |
Totals | | | | $ | (4,752,704 | ) | | | | $ | 168,791 | |
| | | | | | | | | | | | |
For the year ended December 31, 2016, the average month end fair value of derivatives represented 0.4% of average month end net assets. The average month end number of open derivative contracts for the year was 4.
See Note 1(c) regarding derivative financial instruments.
8. Credit Facility
The Fund, together with other U.S. registered and foreign investment funds (collectively, Borrowers), managed by Franklin Templeton Investments, are borrowers in a joint syndicated senior unsecured credit facility totaling $2 billion (Global Credit Facility) which matured on February 10, 2017. This Global Credit Facility provides a source of funds to the Borrowers for temporary and emergency purposes, including the ability to meet future unanticipated or unusually large redemption requests. Effective February 10, 2017, the Borrowers renewed the Global Credit Facility for a one year term, maturing February 9, 2018, for a total of $2 billion.
Under the terms of the Global Credit Facility, the Fund shall, in addition to interest charged on any borrowings made by the Fund and other costs incurred by the Fund, pay its share of fees and expenses incurred in connection with the implementation and maintenance of the Global Credit Facility, based upon its relative share of the aggregate net assets of all of the Borrowers, including an annual commitment fee of 0.15% based upon the unused portion of the Global Credit Facility. These fees are reflected in other expenses in the Statement of Operations. During the year ended December 31, 2016, the Fund did not use the Global Credit Facility.
9. Fair Value Measurements
The Fund follows a fair value hierarchy that distinguishes between market data obtained from independent sources (observable inputs) and the Fund’s own market assumptions (unobservable inputs). These inputs are used in determining the value of the Fund’s financial instruments and are summarized in the following fair value hierarchy:
| | • | | Level 1 – quoted prices in active markets for identical financial instruments |
| | • | | Level 2 – other significant observable inputs (including quoted prices for similar financial instruments, interest rates, prepayment speed, credit risk, etc.) |
| | • | | Level 3 – significant unobservable inputs (including the Fund’s own assumptions in determining the fair value of financial instruments) |
The input levels are not necessarily an indication of the risk or liquidity associated with financial instruments at that level.
For movements between the levels within the fair value hierarchy, the Fund has adopted a policy of recognizing the transfers as of the date of the underlying event which caused the movement.
FRANKLIN TEMPLETON VARIABLE INSURANCE PRODUCTS TRUST
NOTES TO FINANCIAL STATEMENTS
Franklin VolSmart Allocation VIP Fund (continued)
9. Fair Value Measurements (continued)
A summary of inputs used as of December 31, 2016, in valuing the Fund’s assets and liabilites carried at fair value, is as follows:
| | | | | | | | | | | | | | | | |
| | | Level 1 | | | Level 2 | | | Level 3 | | | Total | |
| | | | |
| Assets: | | | | | | | | | | | | | | | | |
Investments in Securities: | | | | | | | | | | | | | | | | |
Equity Investmentsa | | $ | 61,284,434 | | | $ | — | | | $ | — | | | $ | 61,284,434 | |
Investments in Underlying Fundsa | | | 53,225,952 | | | | — | | | | — | | | | 53,225,952 | |
Short Term Investments | | | 9,750,824 | | | | — | | | | — | | | | 9,750,824 | |
| | | | |
Total Investments in Securities | | $ | 124,261,210 | | | $ | — | | | $ | — | | | $ | 124,261,210 | |
| | | | |
| | | | |
| Liabilities: | | | | | | | | | | | | | | | | |
Other Financial Instruments: | | | | | | | | | | | | | | | | |
Swap Contracts. | | $ | — | | | $ | 5,038 | | | $ | — | | | $ | 5,038 | |
| | | | |
aFor detailed categories, see the accompanying Statement of Investments.
10. Investment Company Reporting Modernization
In October 2016, the U.S. Securities and Exchange Commission adopted new rules and amended existing rules (together, final rules) intended to modernize the reporting and disclosure of information by registered investment companies. In part, the final rules amend Regulation S-X and require standardized, enhanced disclosures about derivatives in investment company financial statements, as well as other amendments. The compliance date for the amendments to Regulation S-X is August 1, 2017. Management is currently evaluating the impact that the adoption of the amendments to Regulation S-X will have on the Fund’s financial statements and related disclosures.
11. Subsequent Events
The Fund has evaluated subsequent events through the issuance of the financial statements and determined that no events have occurred that require disclosure other than those already disclosed in the financial statements.
Abbreviations
| | | | | | |
| |
| Counterparty | | Selected Portfolio |
| | | |
| BZWS | | Barclays Bank PLC | | ADR | | American Depositary Receipt |
| | | |
| | | | VIX | | Market Volatility Index |
FRANKLIN TEMPLETON VARIABLE INSURANCE PRODUCTS TRUST
Report of Independent Registered Public Accounting Firm
Franklin VolSmart Allocation VIP Fund
To the Board of Trustees and Shareholders of Franklin Templeton Variable Insurance Products Trust
In our opinion, the accompanying statement of assets and liabilities, including the statement of investments, and the related statements of operations and of changes in net assets and the financial highlights present fairly, in all material respects, the financial position of Franklin VolSmart Allocation VIP Fund (the “Fund”) as of December 31, 2016, the results of its operations for the year then ended, the changes in its net assets for each of the two years in the period then ended and the financial highlights for the periods presented, in conformity with accounting principles generally accepted in the United States of America. These financial statements and financial highlights (hereafter referred to as “financial statements”) are the responsibility of the Fund’s management. Our responsibility is to express an opinion on these financial statements based on our audits. We conducted our audits of these financial statements in accordance with the standards of the Public Company Accounting Oversight Board (United States). Those standards require that we plan and perform the audit to obtain reasonable assurance about whether the financial statements are free of material misstatement. An audit includes examining, on a test basis, evidence supporting the amounts and disclosures in the financial statements, assessing the accounting principles used and significant estimates made by management, and evaluating the overall financial statement presentation. We believe that our audits, which included confirmation of securities as of December 31, 2016 by correspondence with the custodian, transfer agent and brokers, provide a reasonable basis for our opinion.
PricewaterhouseCoopers LLP
San Francisco, California
February 15, 2017
FRANKLIN TEMPLETON VARIABLE INSURANCE PRODUCTS TRUST
Tax Information (unaudited)
Franklin VolSmart Allocation VIP Fund
Under Section 852(b)(3)(C) of the Internal Revenue Code (Code), the Fund hereby reports the maximum amount allowable but no less than $123,720 as a long term capital gain dividend for the fiscal year ended December 31, 2016.
Under Section 854(b)(1)(A) of the Code, the Fund hereby reports 100% of the ordinary income dividends as income qualifying for the dividends received deduction for the fiscal year ended December 31, 2016.
Templeton Developing Markets VIP Fund
We are pleased to bring you Templeton Developing Markets VIP Fund’s annual report for the fiscal year ended December 31, 2016.
Class 2 Performance Summary as of December 31, 2016
Average annual total return of Class 2 shares* represents the average annual change in value, assuming reinvestment of dividends and capital gains. Average returns smooth out variations in returns, which can be significant; they are not the same as year-by-year results.
| | | | | | | | | | | | |
| Periods ended 12/31/16 | | 1-Year | | | 5-Year | | | 10-Year | |
Average Annual Total Return | | | +17.44% | | | | -0.61% | | | | +0.09% | |
*The Fund has a fee waiver associated with any investment it makes in a Franklin Templeton money fund and/or other Franklin Templeton fund, contractually guaranteed through its current fiscal year-end. Fund investment results reflect the fee waiver; without this waiver, the results would have been lower.
Performance reflects the Fund’s Class 2 operating expenses, but does not include any contract fees, expenses or sales charges. If they had been included, performance would be lower. These charges and deductions, particularly for variable life policies, can have a significant effect on contract values and insurance benefits. See the contract prospectus for a complete description of these expenses, including sales charges.
Performance data represent past performance, which does not guarantee future results. Investment return and principal value will fluctuate, and you may have a gain or loss when you sell your shares. Current performance may differ from figures shown.
Total Return Index Comparison for a Hypothetical $10,000 Investment (1/1/07–12/31/16)
The graph below shows the change in value of a hypothetical $10,000 investment in the Fund over the indicated period and includes reinvestment of any income or distributions. The Fund’s performance* is compared to the performance of MSCI Emerging Markets (EM) Index and the Standard & Poor’s®/ International Finance Corporation Investable (S&P®/IFCI) Composite Index. One cannot invest directly in an index, and an index is not representative of the Fund’s portfolio. Please see Important Notes to Performance Information preceding the Fund Summaries.
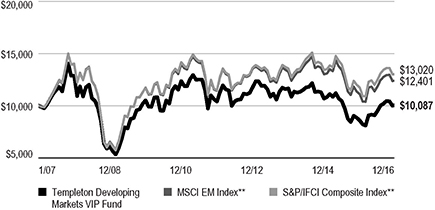
**Source: Morningstar. Please see Index Descriptions following the Fund Summaries.
TEMPLETON DEVELOPING MARKETS VIP FUND
Fund Goal and Main Investments
The Fund seeks long-term capital appreciation. Under normal market conditions, the Fund invests at least 80% of its net assets in emerging market investments.
Fund Risks
All investments involve risks, including possible loss of principal. Special risks are associated with foreign investing, including currency fluctuations, economic instability and political developments. Investments in developing markets, of which frontier markets are a subset, involve heightened risks related to the same factors, in addition to those associated with these markets’ smaller size, lesser liquidity and lack of established legal, political, business and social frameworks to support securities markets. Because these frameworks are typically even less developed in frontier markets, as well as various factors including the increased potential for extreme price volatility, illiquidity, trade barriers and exchange controls, the risks associated with developing markets are magnified in frontier markets. The Fund is designed for the aggressive portion of a well-diversified portfolio. The Fund is actively managed but there is no guarantee that the manager’s investment decisions will produce the desired results. The Fund’s prospectus also includes a description of the main investment risks.
Performance Overview
You can find the Fund’s one-year total return in the Performance Summary. In comparison, the MSCI EM Index generated a total return of +11.60% and the S&P/IFCI Composite Index posted a +10.78% total return for the same period.1 Please note, index performance numbers are for reference and we do not attempt to track an index but rather undertake investments on the basis of fundamental research.
Economic and Market Overview
The global economy grew moderately during the 12 months under review amid a generally modest recovery in developed markets and slowing growth in emerging markets. Nonetheless, emerging market economies in general continued to grow faster than developed market economies. China’s economy grew at a stable rate in the first three quarters of 2016 and expanded slightly faster in the fourth quarter, as full-year 2016 growth
Geographic Composition
Based on Total Net Assets as of 12/31/16
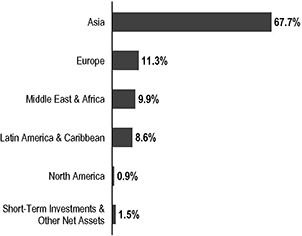
remained within the government’s targeted range. After growing strongly in the March 2016 quarter, India’s economy cooled in the June quarter, due to slower private consumption growth and declining fixed investment, but improved slightly in the September quarter. Russia’s economic contraction eased in 2016, following a rebound in oil prices and an improvement in industrial production. Brazil’s economy continued to be in recession due to weak domestic demand and slower export growth. Among other emerging markets, South Africa’s economy showed signs of improvement, while Mexico’s, South Korea’s and the Czech Republic’s economies moderated.
Several central banks, including those of Mexico, Turkey and South Africa, raised their benchmark interest rates to control inflation and support their currencies, while some, including those of South Korea, Hungary and Indonesia, lowered their benchmark interest rates to promote economic growth. The Reserve Bank of India cut its benchmark interest rate to a six-year low and increased monetary liquidity. The Bank of Russia reduced its key interest rates in June and September, citing lower inflation expectations amid an economic recession. Brazil’s central bank cut its benchmark interest rate in October and November to spur economic growth. The People’s Bank of China (PBOC) left its benchmark interest rate unchanged in 2016, but employed other monetary easing measures that included cutting the cash reserve requirement ratio for the country’s banks and effectively devaluing the renminbi against the U.S. dollar.
1. Source: Morningstar. One cannot invest directly in an index, and an index is not representative of the Fund’s portfolio. Please see Index Descriptions following the Fund Summaries.
The dollar value, number of shares or principal amount, and names of all portfolio holdings are listed in the Fund’s Statement of Investments (SOI).
TEMPLETON DEVELOPING MARKETS VIP FUND
Emerging market stocks recovered from a weak start to 2016 caused by investor concerns about the direction of the U.S. Federal Reserve’s (Fed’s) monetary policy, a plunge in China’s domestic equity market in January 2016, a collapse in crude oil prices and moderating global economic growth. Equity markets generally trended higher beginning in late January as prices of many commodities rose, the PBOC implemented further monetary stimulus measures, Greece finalized a new debt deal with its creditors and Brazil impeached President Dilma Rousseff. The U.K.’s referendum to leave the European Union, volatile commodity prices, U.S. President Donald Trump’s potential protectionist trade policies, and the Fed’s decision to raise the federal funds target rate in December weighed on market sentiment. However, emerging market stocks overall rebounded by period-end amid additional monetary easing by major central banks, notably the Bank of Japan, the Bank of England and the European Central Bank, and subsiding concerns about global economic growth. The agreement by members of the Organization of the Petroleum Exporting Countries (OPEC) to curb production, followed by commitments of 11 non-OPEC members, including Russia, to curb oversupply, also supported stocks. In this environment, emerging market stocks, as measured by the MSCI EM Index, generated a +11.60% total return for the 12 months ended December 31, 2016.1
Investment Strategy
We employ a fundamental research, value-oriented, long-term investment approach. We focus on the market price of a company’s securities relative to our evaluation of its long-term earnings, asset value and cash flow potential. We also consider a company’s profit and loss outlook, balance sheet strength, cash flow trends and asset value in relation to the current price. Our analysis considers the company’s corporate governance behavior as well as its position in its sector, the economic framework and political environment. We invest in securities without regard to benchmark comparisons.
Manager’s Discussion
During the 12 months under review, key contributors to the Fund’s absolute performance included Banco Bradesco, Taiwan Semiconductor Manufacturing Co. (TSMC) and Samsung Electronics.
Banco Bradesco is one of Brazil’s largest financial conglomerates. It operates across a wide range of segments, including asset management, insurance, wholesale banking, full retail operations, credit cards, and general corporate and personal lending. Banco Bradesco announced above-consensus third-quarter results and also benefited from improved
sentiment in Brazil as investors cheered the impeachment of Dilma Rousseff and welcomed Michel Temer as the country’s official president. Investors were also encouraged by the approval of key reforms and the central bank’s monetary easing efforts to stimulate economic growth.
Top 10 Countries
12/31/16
| | | | |
| | | % of Total
Net Assets | |
| China | | | 20.4% | |
| South Korea | | | 14.8% | |
| Taiwan | | | 10.5% | |
| India | | | 8.2% | |
| South Africa | | | 7.8% | |
| Brazil | | | 6.2% | |
| Russia | | | 4.5% | |
| U.K. | | | 4.1% | |
| Thailand | | | 4.1% | |
| Indonesia | | | 3.7% | |
TSMC is the world’s largest independent integrated circuit foundry. Based in Taiwan, it produces a wide variety of semiconductors on an outsourced basis for other companies in the technology hardware industry. Its products are used in computers and other consumer electronics. Early in the period, the company announced better-than-expected results, aided by low- and mid-end smartphone demand. Development in new areas, such as computing, also led investors to adopt a positive view on the company.
Samsung Electronics is a major South Korea-based manufacturer of consumer electronics. It is one of the world’s largest manufacturers of mobile phones, smartphones, tablets and televisions. Its shares rose over the period, helped by the company’s solid earnings. However, the company suffered a setback during the year after implementing a global recall and ultimately discontinuing production of Galaxy Note 7 smartphones. Despite the anticipated costs associated with the incident, its shares recovered in late 2016 amid investor expectations that fourth-quarter earnings would grow significantly compared to a year earlier, due to strong demand for memory chips and a rebound in display and smartphone operations. Further supporting investor sentiment were share buybacks, expectations for higher dividends and the company’s efforts to improve its governance structure.
In contrast, key detractors from the Fund’s absolute performance included China Life Insurance, Fila Korea and Baidu.
TEMPLETON DEVELOPING MARKETS VIP FUND
Top 10 Holdings
12/31/16
| | | | |
Company Sector/Industry, Country | | % of Total Net Assets | |
Samsung Electronics Co. Ltd. Technology Hardware, Storage & Peripherals, South Korea | | | 6.5% | |
Taiwan Semiconductor Manufacturing Co. Ltd. Semiconductors & Semiconductor Equipment, Taiwan | | | 5.9% | |
Naspers Ltd. Media, South Africa | | | 4.9% | |
Tencent Holdings Ltd. Internet Software & Services, China | | | 4.3% | |
Brilliance China Automotive Holdings Ltd. Automobiles, China | | | 4.2% | |
Unilever PLC Personal Products, U.K. | | | 4.1% | |
Itau Unibanco Holding SA Banks, Brazil | | | 3.3% | |
Hon Hai Precision Industry Co. Ltd. Electronic Equipment, Instruments & Components, Taiwan | | | 2.4% | |
Astra International Tbk PT Automobiles, Indonesia | | | 2.1% | |
ICICI Bank Ltd. Banks, India | | | 2.1% | |
China Life Insurance is one of China’s largest life insurance companies. Disappointing first-half 2016 earnings, mainly due to lower investment income and a change in the discount rate of traditional portfolio reserve calculation, combined with investor concerns about a lower interest-rate environment and the Chinese renminbi’s depreciation, impacted the company’s share price in the first half of the reporting period. However, share price performance rebounded in the latter part of 2016, supported by solid third-quarter earnings growth, resulting from better investment performance, especially domestic A-share equity investment. However, the late recovery was insufficient to fully offset the earlier decline.
Fila Korea is a South Korean sporting goods manufacturer that produces a wide variety of products, including footwear, clothing and accessories. The company reported disappointing
third-quarter results, driven by losses in its South Korean operations. A major driver of Fila’s share price was its stake in Acushnet, which makes golf equipment and accessories under the Titleist and FootJoy brands. In late 2016, Acushnet listed its shares in the U.S., but the lower-than-expected initial public offering price had a negative impact on Fila’s shares. During this process, Fila added to its existing holding in Acushnet.
Baidu is China’s leading Internet search platform and provider of online marketing solutions. The company also operates an e-commerce platform with an online payment tool, develops and markets web application software, provides entertainment products, and provides human resources-related services. Its shares fell early in the period after the company was criticized for misleading users with search results, leading the Chinese government to institute new Internet regulations. Third-quarter earnings exceeded market expectations, but weaker-than-expected fourth-quarter guidance weighed on investor sentiment. Chinese Internet stocks also generally corrected late in the year following the U.S. presidential election, as many investors were concerned that the incoming president’s potential anti-globalization stance could hamper the operating environment for Chinese technology companies.
During the period, our continued search for what we considered undervalued investments with attractive fundamentals led us to increase the Fund’s investments in South Korea, Russia, Saudi Arabia2 and Mexico. Additionally, we initiated exposure to Peru and made some purchases in Taiwan and Hungary. In sector terms, we initiated exposure to utilities and increased holdings largely in consumer discretionary, materials, energy and information technology (IT).3 Key purchases included additional investment in the aforementioned Samsung Electronics and new positions in Alibaba Group Holding, China’s biggest e-commerce company, and Saudi Basic Industries,2 one of the world’s largest petrochemical producers.
Conversely, we made some sales in Brazil and reduced the Fund’s holdings in India, South Africa and Thailand, as well as in emerging market companies listed in Belgium and the U.S., to focus on opportunities we considered to be more attractively valued within our investment universe. In sector terms, we
2. Investments were made through participatory notes, which are equity access products structured as debt obligations and are issued or backed by banks and broker-dealers and designed to replicate equity market exposure in markets where direct investment is either impossible or difficult due to local investment restrictions.
3. The utilities sector comprises gas utilities in the SOI. The consumer discretionary sector comprises auto components; automobiles; distributors; hotels, restaurants and leisure; Internet and direct marketing retail; media; and textiles, apparel and luxury goods in the SOI. The materials sector comprises chemicals, construction materials, and metals and mining in the SOI. The energy sector comprises oil, gas and consumable fuels in the SOI. The IT sector comprises electronic equipment, instruments and components; Internet software and services; IT services; semiconductors and semiconductor equipment; software; and technology hardware, storage and peripherals in the SOI.
TEMPLETON DEVELOPING MARKETS VIP FUND
made some sales in financials and reduced holdings in consumer staples, health care and telecommunication services.4 Key sales included trimming the Fund’s positions in the aforementioned Banco Bradesco; Tata Consultancy Services, an Indian IT consulting and services company; and Anheuser-Busch InBev, a Belgium-listed global brewer with significant emerging markets operations.
Thank you for your participation in Templeton Developing Markets VIP Fund. We look forward to serving your future investment needs.
The foregoing information reflects our analysis, opinions and portfolio holdings as of December 31, 2016, the end of the reporting period. The way we implement our main investment strategies and the resulting portfolio holdings may change depending on factors such as market and economic conditions. These opinions may not be relied upon as investment advice or an offer for a particular security. The information is not a complete analysis of every aspect of any market, country, industry, security or the Fund. Statements of fact are from sources considered reliable, but the investment manager makes no representation or warranty as to their completeness or accuracy. Although historical performance is no guarantee of future results, these insights may help you understand our investment management philosophy.
4. The financials sector comprises banks, diversified financial services and insurance in the SOI. The consumer staples sector comprises beverages, food and staples retailing, food products and personal products in the SOI. The health care sector comprises biotechnology and pharmaceuticals in the SOI. The telecommunication services sector comprises diversified telecommunication services and wireless telecommunication services in the SOI.
TEMPLETON DEVELOPING MARKETS VIP FUND
Class 2 Fund Expenses
As an investor in a variable insurance contract (Contract) that indirectly provides for investment in an underlying mutual fund, you can incur transaction and/or ongoing expenses at both the Fund level and the Contract Level: (1) transaction expenses can include sales charges (loads) on purchases, surrender fees, transfer fees and premium taxes; and (2) ongoing expenses can include management fees, distribution and service (12b-1) fees, contract fees, annual maintenance fees, mortality and expense risk fees and other fees and expenses. All mutual funds and Contracts have some types of ongoing expenses. The table below shows Fund-level ongoing expenses and can help you understand these costs and compare them with those of other mutual funds offered through the Contract. The table assumes a $1,000 investment held for the six months indicated. Please refer to the Fund prospectus for additional information on operating expenses.
Actual Fund Expenses
The table below provides information about the actual account values and actual expenses in the columns under the heading “Actual.” In these columns the Fund’s actual return, which includes the effect of ongoing Fund expenses but does not include the effect of ongoing Contract expenses, is used to calculate the “Ending Account Value.”
You can estimate the Fund-level expenses you paid during the period by following these steps (of course, your account value and expenses will differ from those in this illustration):
| | Divide your account value by $1,000 |
| | (if | your account had an $8,600 value, |
| | then | $8,600 ÷ $1,000 = 8.6). |
| | Then multiply the result by the number under the headings “Actual” and “Fund-Level Expenses Paid During Period” (if Fund-Level Expenses Paid During Period were $ 7.50, then
8.6 x $7.50 = $64.50). |
In this illustration, the estimated expenses paid this period at the Fund level are $64.50.
Hypothetical Example for Comparison with Other Mutual Funds
Under the heading “Hypothetical” in the table, information is provided about hypothetical account values and hypothetical expenses based on the Fund’s actual expense ratio and an assumed rate of return of 5% per year before expenses, which is not the Fund’s actual return. This information may not be used to estimate the actual ending account balance or expenses you paid for the period, but it can help you compare ongoing costs of investing in the Fund with those of other mutual funds offered through the Contract. To do so, compare this 5% hypothetical example with the 5% hypothetical examples that appear in the shareholder reports of other funds offered through the Contract.
Please note that expenses shown in the table are meant to highlight ongoing costs at the Fund level only and do not reflect any ongoing expenses at the Contract level, or transaction expenses at either the Fund or Contract levels. In addition, while the Fund does not have transaction expenses, if the transaction and ongoing expenses at the Contract level were included, the expenses shown below would be higher. You should consult your Contract prospectus or disclosure document for more information.
| | | | | | | | | | | | | | | | | | | | | | | | |
| | | | | | Actual
(actual return after expenses) | | | Hypothetical
(5% annual return before expenses) | | | | |
| Share Class | |
| Beginning Account
Value 7/1/16 |
| |
| Ending Account
Value 12/31/16 |
| |
| Fund-Level
Expenses Paid
During Period7/1/16–12/31/16 |
1,2 | |
| Ending Account
Value 12/31/16 |
| |
| Fund-Level
Expenses Paid
During Period7/1/16–12/31/16 |
1,2 | |
| Net
Annualized
Expense
Ratio |
2 |
Class 2 | | | $1,000 | | | | $1,062.00 | | | | $8.34 | | | | $1,017.04 | | | | $8.16 | | | | 1.61% | |
1. Expenses are equal to the annualized expense ratio for the six-month period as indicated above — in the far right column — multiplied by the simple average account value over the period indicated, and then multiplied by 184/366 to reflect the one-half year period.
2. Reflects expenses after fee waivers and expense reimbursements. Does not include any ongoing expenses of the Contract for which the Fund is an investment option or acquired fund fees and expenses.
FRANKLIN TEMPLETON VARIABLE INSURANCE PRODUCTS TRUST
Financial Highlights
Templeton Developing Markets VIP Fund
| | | | | | | | | | | | | | | | | | | | |
| | | Year Ended December 31, | |
| | | 2016 | | | 2015 | | | 2014 | | | 2013 | | | 2012 | |
| Class 1 | | | | | | | | | | | | | | | | | | | | |
Per share operating performance
(for a share outstanding throughout the year) | | | | | | | | | | | | | | | | | | | | |
| | | | | |
Net asset value, beginning of year | | | $6.37 | | | | $9.27 | | | | $10.26 | | | | $10.58 | | | | $9.50 | |
| | | | |
| | | | | |
| Income from investment operationsa: | | | | | | | | | | | | | | | | | | | | |
| | | | | |
Net investment incomeb | | | 0.05 | | | | 0.06 | | | | 0.15c | | | | 0.13 | | | | 0.19 | |
| | | | | |
Net realized and unrealized gains (losses) | | | 1.08 | | | | (1.63 | ) | | | (0.97 | ) | | | (0.22 | ) | | | 1.06 | |
| | | | |
Total from investment operations | | | 1.13 | | | | (1.57 | ) | | | (0.82 | ) | | | (0.09 | ) | | | 1.25 | |
| | | | |
| | | | | |
| Less distributions from: | | | | | | | | | | | | | | | | | | | | |
| | | | | |
Net investment income | | | (0.08 | ) | | | (0.20 | ) | | | (0.17 | ) | | | (0.23 | ) | | | (0.17 | ) |
| | | | | |
Net realized gains | | | — | | | | (1.13 | ) | | | — | | | | — | | | | — | |
| | | | |
Total distributions | | | (0.08 | ) | | | (1.33 | ) | | | (0.17 | ) | | | (0.23 | ) | | | (0.17 | ) |
| | | | |
Redemption fees | | | — | | | | — | | | | — | d | | | — | d | | | — | d |
| | | | |
Net asset value, end of year | | | $7.42 | | | | $6.37 | | | | $9.27 | | | | $10.26 | | | | $10.58 | |
| | | | |
| | | | | |
Total returne | | | 17.79% | | | | (19.42 | )% | | | (8.09 | )% | | | (0.73 | )% | | | 13.40% | |
| | | | | |
| Ratios to average net assets | | | | | | | | | | | | | | | | | | | | |
| | | | | |
Expenses before waiver and payments by affiliates | | | 1.38% | | | | 1.33% | | | | 1.36% | | | | 1.35% | | | | 1.35% | |
| | | | | |
Expenses net of waiver and payments by affiliates | | | 1.36% | | | | 1.32% | | | | 1.36%f | | | | 1.35% | | | | 1.35% | |
| | | | | |
Net investment income | | | 0.79% | | | | 0.74% | | | | 1.51%c | | | | 1.25% | | | | 1.93% | |
| | | | | |
| Supplemental data | | | | | | | | | | | | | | | | | | | | |
| | | | | |
Net assets, end of year (000’s) | | | $82,596 | | | | $77,000 | | | | $114,487 | | | | $145,707 | | | | $203,568 | |
| | | | | |
Portfolio turnover rate | | | 26.78% | | | | 71.69% | | | | 82.87% | | | | 44.59% | | | | 24.45% | |
aThe amount shown for a share outstanding throughout the period may not correlate with the Statement of Operations for the period due to the timing of sales and repurchases of the Fund’s shares in relation to income earned and/or fluctuating fair value of the investments of the Fund.
bBased on average daily shares outstanding.
cNet investment income per share includes approximately $0.04 per share related to income received in the form of special dividends in connection with certain Fund holdings. Excluding this amount, the ratio of net investment income to average net assets would have been 1.11%.
dAmount rounds to less than $0.01 per share.
eTotal return does not include fees, charges or expenses imposed by the variable annuity and life insurance contracts for which Franklin Templeton Variable Insurance Products Trust serves as an underlying investment vehicle.
fBenefit of waiver and payments by affiliates rounds to less than 0.01%.
| | | | | | |
| The accompanying notes are an integral part of these financial statements. | Annual Report | | | TD-7 | |
FRANKLIN TEMPLETON VARIABLE INSURANCE PRODUCTS TRUST
FINANCIAL HIGHLIGHTS
Templeton Developing Markets VIP Fund (continued)
| | | | | | | | | | | | | | | | | | | | |
| | | Year Ended December 31, | |
| | | 2016 | | | 2015 | | | 2014 | | | 2013 | | | 2012 | |
| Class 2 | | | | | | | | | | | | | | | | | | | | |
Per share operating performance (for a share outstanding throughout the year) | | | | | | | | | | | | | | | | | | | | |
| | | | | |
Net asset value, beginning of year | | | $6.32 | | | | $9.20 | | | | $10.19 | | | | $10.50 | | | | $9.42 | |
| | | | |
| | | | | |
| Income from investment operationsa: | | | | | | | | | | | | | | | | | | | | |
| | | | | |
Net investment incomeb | | | 0.04 | | | | 0.04 | | | | 0.12 | c | | | 0.10 | | | | 0.17 | |
| | | | | |
Net realized and unrealized gains (losses) | | | 1.06 | | | | (1.61 | ) | | | (0.96 | ) | | | (0.21 | ) | | | 1.05 | |
| | | | |
Total from investment operations | | | 1.10 | | | | (1.57 | ) | | | (0.84 | ) | | | (0.11 | ) | | | 1.22 | |
| | | | |
| | | | | |
| Less distributions from: | | | | | | | | | | | | | | | | | | | | |
| | | | | |
Net investment income | | | (0.06 | ) | | | (0.18 | ) | | | (0.15 | ) | | | (0.20 | ) | | | (0.14 | ) |
| | | | | |
Net realized gains | | | — | | | | (1.13 | ) | | | — | | | | — | | | | — | |
| | | | |
Total distributions | | | (0.06 | ) | | | (1.31 | ) | | | (0.15 | ) | | | (0.20 | ) | | | (0.14 | ) |
| | | | |
Redemption fees | | | — | | | | — | | | | — | d | | | — | d | | | — | d |
| | | | |
Net asset value, end of year. | | | $7.36 | | | | $6.32 | | | | $9.20 | | | | $10.19 | | | | $10.50 | |
| | | | |
| | | | | |
Total returne | | | 17.44% | | | | (19.60 | )% | | | (8.39 | )% | | | (0.92 | )% | | | 13.16% | |
| | | | | |
| Ratios to average net assets | | | | | | | | | | | | | | | | | | | | |
| | | | | |
Expenses before waiver and payments by affiliates | | | 1.63% | | | | 1.58% | | | | 1.61% | | | | 1.60% | | | | 1.60% | |
| | | | | |
Expenses net of waiver and payments by affiliates | | | 1.61% | | | | 1.57% | | | | 1.61%f | | | | 1.60% | | | | 1.60% | |
| | | | | |
Net investment income | | | 0.54% | | | | 0.49% | | | | 1.26%c | | | | 1.00% | | | | 1.68% | |
| | | | | |
| Supplemental data | | | | | | | | | | | | | | | | | | | | |
| | | | | |
Net assets, end of year (000’s) | | | $205,151 | | | | $192,120 | | | | $250,813 | | | | $274,683 | | | | $291,638 | |
| | | | | |
Portfolio turnover rate | | | 26.78% | | | | 71.69% | | | | 82.87% | | | | 44.59% | | | | 24.45% | |
aThe amount shown for a share outstanding throughout the period may not correlate with the Statement of Operations for the period due to the timing of sales and repurchases of the Fund’s shares in relation to income earned and/or fluctuating fair value of the investments of the Fund.
bBased on average daily shares outstanding.
cNet investment income per share includes approximately $0.04 per share related to income received in the form of special dividends in connection with certain Fund holdings. Excluding this amount, the ratio of net investment income to average net assets would have been 0.86%.
dAmount rounds to less than $0.01 per share.
eTotal return does not include fees, charges or expenses imposed by the variable annuity and life insurance contracts for which Franklin Templeton Variable Insurance Products Trust serves as an underlying investment vehicle.
fBenefit of waiver and payments by affiliates rounds to less than 0.01%.
| | | | |
| TD-8 | | Annual Report | The accompanying notes are an integral part of these financial statements. | | |
FRANKLIN TEMPLETON VARIABLE INSURANCE PRODUCTS TRUST
FINANCIAL STATEMENTS
Templeton Developing Markets VIP Fund (continued)
| | | | | | | | | | | | | | | | | | | | |
| | | Year Ended December 31, | |
| | | 2016 | | | 2015 | | | 2014 | | | 2013 | | | 2012 | |
| Class 4 | | | | | | | | | | | | | | | | | | | | |
Per share operating performance (for a share outstanding throughout the year) | | | | | | | | | | | | | | | | | | | | |
| | | | | |
Net asset value, beginning of year | | | $6.34 | | | | $9.22 | | | | $10.20 | | | | $10.50 | | | | $9.42 | |
| | | | |
| | | | | |
| Income from investment operationsa: | | | | | | | | | | | | | | | | | | | | |
| | | | | |
Net investment incomeb | | | 0.03 | | | | 0.03 | | | | 0.12 | c | | | 0.10 | | | | 0.16 | |
| | | | | |
Net realized and unrealized gains (losses) | | | 1.06 | | | | (1.62 | ) | | | (0.97 | ) | | | (0.21 | ) | | | 1.04 | |
| | | | |
Total from investment operations | | | 1.09 | | | | (1.59 | ) | | | (0.85 | ) | | | (0.11 | ) | | | 1.20 | |
| | | | |
| | | | | |
| Less distributions from: | | | | | | | | | | | | | | | | | | | | |
| | | | | |
Net investment income | | | (0.04 | ) | | | (0.16 | ) | | | (0.13 | ) | | | (0.19 | ) | | | (0.12 | ) |
| | | | | |
Net realized gains | | | — | | | | (1.13 | ) | | | — | | | | — | | | | — | |
| | | | |
Total distributions | | | (0.04 | ) | | | (1.29 | ) | | | (0.13 | ) | | | (0.19 | ) | | | (0.12 | ) |
| | | | |
Redemption fees | | | — | | | | — | | | | — | d | | | — | d | | | — | d |
| | | | |
Net asset value, end of year | | | $7.39 | | | | $6.34 | | | | $9.22 | | | | $10.20 | | | | $10.50 | |
| | | | |
| | | | | |
Total returne | | | 17.32% | | | | (19.70 | )% | | | (8.48 | )% | | | (1.07 | )% | | | 13.06% | |
| | | | | |
| Ratios to average net assets | | | | | | | | | | | | | | | | | | | | |
| | | | | |
Expenses before waiver and payments by affiliates | | | 1.73% | | | | 1.68% | | | | 1.71% | | | | 1.70% | | | | 1.70% | |
| | | | | |
Expenses net of waiver and payments by affiliates | | | 1.71% | | | | 1.67% | | | | 1.71%f | | | | 1.70% | | | | 1.70% | |
| | | | | |
Net investment income | | | 0.44% | | | | 0.39% | | | | 1.16%c | | | | 0.90% | | | | 1.58% | |
| | | | | |
| Supplemental data | | | | | | | | | | | | | | | | | | | | |
| | | | | |
Net assets, end of year (000’s) | | | $6,377 | | | | $7,109 | | | | $11,106 | | | | $15,225 | | | | $23,341 | |
| | | | | |
Portfolio turnover rate | | | 26.78% | | | | 71.69% | | | | 82.87% | | | | 44.59% | | | | 24.45% | |
aThe amount shown for a share outstanding throughout the period may not correlate with the Statement of Operations for the period due to the timing of sales and repurchases of the Fund’s shares in relation to income earned and/or fluctuating fair value of the investments of the Fund.
bBased on average daily shares outstanding.
cNet investment income per share includes approximately $0.04 per share related to income received in the form of special dividends in connection with certain Fund holdings. Excluding this amount, the ratio of net investment income to average net assets would have been 0.76%.
dAmount rounds to less than $0.01 per share.
eTotal return does not include fees, charges or expenses imposed by the variable annuity and life insurance contracts for which Franklin Templeton Variable Insurance Products Trust serves as an underlying investment vehicle
fBenefit of waiver and payments by affiliates rounds to less than 0.01%.
| | | | | | |
| | | The accompanying notes are an integral part of these financial statements. | Annual Report | | | TD-9 | |
FRANKLIN TEMPLETON VARIABLE INSURANCE PRODUCTS TRUST
Statement of Investments, December 31, 2016
| | | | | | | | | | | | | | |
| Templeton Developing Markets VIP Fund | |
| | | | | Industry | | | Shares | | | Value | |
| | | Common Stocks 91.8% | | | | | | | | | |
| | | Argentina 0.3% | | | | | | | | | |
| a | | Grupo Clarin SA, B, GDR, Reg S | | | Media | | | | 9,190 | | | $ | 207,694 | |
| | MercadoLibre Inc. | | | Internet Software & Services | | | | 3,500 | | | | 546,490 | |
| | | | | | | | | | | | | | |
| | | | | | | | | | | | | 754,184 | |
| | | | | | | | | | | | | | |
| | | Belgium 1.1% | | | | | | | | | |
| | Anheuser-Busch InBev SA/NV | | | Beverages | | | | 31,970 | | | | 3,382,385 | |
| | | | | | | | | | | | | | |
| | | Brazil 1.2% | | | | | | | | | |
| | M Dias Branco SA | | | Food Products | | | | 45,400 | | | | 1,604,281 | |
| | Mahle-Metal Leve SA | | | Auto Components | | | | 136,600 | | | | 871,299 | |
| | Totvs SA | | | Software | | | | 139,400 | | | | 1,029,642 | |
| | | | | | | | | | | | | | |
| | | | | | | | | | | | | 3,505,222 | |
| | | | | | | | | | | | | | |
| | | Cambodia 0.9% | | | | | | | | | |
| | NagaCorp Ltd. | | | Hotels, Restaurants & Leisure | | | | 4,824,000 | | | | 2,780,744 | |
| | | | | | | | | | | | | | |
| | | China 20.4% | | | | | | | | | |
| b | | Alibaba Group Holding Ltd., ADR | | | Internet Software & Services | | | | 62,770 | | | | 5,511,834 | |
| b | | Baidu Inc., ADR | | | Internet Software & Services | | | | 24,400 | | | | 4,011,604 | |
| | Bloomage Biotechnology Corp. Ltd. | | | Chemicals | | | | 772,000 | | | | 1,162,804 | |
| | Brilliance China Automotive Holdings Ltd. | | | Automobiles | | | | 8,909,300 | | | | 12,270,465 | |
| | China Life Insurance Co. Ltd., H | | | Insurance | | | | 610,000 | | | | 1,589,013 | |
| | China Mobile Ltd. | | | Wireless Telecommunication Services | | | | 490,500 | | | | 5,199,445 | |
| | China Petroleum and Chemical Corp., H | | | Oil, Gas & Consumable Fuels | | | | 8,024,000 | | | | 5,691,147 | |
| | COSCO Shipping Ports Ltd. | | | Transportation Infrastructure | | | | 1,069,334 | | | | 1,074,229 | |
| | Dah Chong Hong Holdings Ltd. | | | Distributors | | | | 1,746,100 | | | | 666,511 | |
| | Inner Mongolia Yitai Coal Co. Ltd., B | | | Oil, Gas & Consumable Fuels | | | | 1,309,700 | | | | 1,216,711 | |
| | NetEase Inc., ADR | | | Internet Software & Services | | | | 16,771 | | | | 3,611,467 | |
| | Ping An Insurance Group Co. of China Ltd., A | | | Insurance | | | | 308,395 | | | | 1,573,281 | |
| | Poly Culture Group Corp. Ltd., H | | | Media | | | | 229,200 | | | | 559,219 | |
| | Tencent Holdings Ltd. | | | Internet Software & Services | | | | 522,100 | | | | 12,772,244 | |
| | Uni-President China Holdings Ltd. | | | Food Products | | | | 3,563,300 | | | | 2,513,541 | |
| | Weifu High-Technology Co. Ltd., B | | | Auto Components | | | | 219,000 | | | | 521,059 | |
| | | | | | | | | | | | | | |
| | | | | | | | | | | | | 59,944,574 | |
| | | | | | | | | | | | | | |
| | | Czech Republic 0.3% | | | | | | | | | |
| b | | Moneta Money Bank AS | | | Banks | | | | 303,100 | | | | 977,552 | |
| | | | | | | | | | | | | | |
| | | Hong Kong 3.2% | | | | | | | | | |
| | Dairy Farm International Holdings Ltd. | | | Food & Staples Retailing | | | | 202,333 | | | | 1,454,774 | |
| | MGM China Holdings Ltd. | | | Hotels, Restaurants & Leisure | | | | 2,156,400 | | | | 4,471,586 | |
| | Sands China Ltd. | | | Hotels, Restaurants & Leisure | | | | 807,600 | | | | 3,509,720 | |
| | | | | | | | | | | | | | |
| | | | | | | | | | | | | 9,436,080 | |
| | | | | | | | | | | | | | |
| | | Hungary 1.3% | | | | | | | | | |
| | Richter Gedeon Nyrt | | | Pharmaceuticals | | | | 177,170 | | | | 3,743,155 | |
| | | | | | | | | | | | | | |
| | | India 8.2% | | | | | | | | | |
| | Bajaj Holdings & Investment Ltd. | | | Diversified Financial Services | | | | 33,990 | | | | 910,016 | |
| | Biocon Ltd. | | | Biotechnology | | | | 322,743 | | | | 4,511,213 | |
| | Coal India Ltd. | | | Oil, Gas & Consumable Fuels | | | | 338,475 | | | | 1,494,271 | |
| | Glenmark Pharmaceuticals Ltd. | | | Pharmaceuticals | | | | 91,248 | | | | 1,192,993 | |
| | ICICI Bank Ltd. | | | Banks | | | | 1,642,190 | | | | 6,169,581 | |
| | Infosys Ltd. | | | IT Services | | | | 183,099 | | | | 2,722,994 | |
| | Oil & Natural Gas Corp. Ltd. | | | Oil, Gas & Consumable Fuels | | | | 302,100 | | | | 850,669 | |
| | Reliance Industries Ltd. | | | Oil, Gas & Consumable Fuels | | | | 128,900 | | | | 2,053,157 | |
| | Tata Chemicals Ltd. | | | Chemicals | | | | 238,500 | | | | 1,765,378 | |
FRANKLIN TEMPLETON VARIABLE INSURANCE PRODUCTS TRUST
STATEMENT OF INVESTMENTS
| | | | | | | | | | | | | | |
| Templeton Developing Markets VIP Fund (continued) | |
| | | | | Industry | | | Shares | | | Value | |
| | | Common Stocks (continued) | | | | | | | | | |
| | India (continued) | | | | | | | | | | | | |
| | Tata Consultancy Services Ltd. | | | IT Services | | | | 22,980 | | | $ | 799,951 | |
| | Tata Motors Ltd., A | | | Automobiles | | | | 346,107 | | | | 1,523,380 | |
| | | | | | | | | | | | | | |
| | | | | | | | | | | | | 23,993,603 | |
| | | | | | | | | | | | | | |
| | | Indonesia 3.7% | | | | | | | | | |
| | Astra International Tbk PT | | | Automobiles | | | | 10,115,100 | | | | 6,212,838 | |
| | Bank Danamon Indonesia Tbk PT | | | Banks | | | | 5,707,000 | | | | 1,571,570 | |
| | Perusahaan Gas Negara (Persero) Tbk PT | | | Gas Utilities | | | | 6,697,400 | | | | 1,342,214 | |
| | Semen Indonesia (Persero) Tbk PT | | | Construction Materials | | | | 2,764,700 | | | | 1,882,807 | |
| | | | | | | | | | | | | | |
| | | | | | | | | | | | | 11,009,429 | |
| | | | | | | | | | | | | | |
| | | Kenya 0.4% | | | | | | | | | |
| | Equity Group Holdings Ltd. | | | Banks | | | | 3,712,900 | | | | 1,096,079 | |
| | | | | | | | | | | | | | |
| | | Mexico 1.2% | | | | | | | | | |
| | America Movil SAB de CV, L, ADR | | | Wireless Telecommunication Services | | | | 82,991 | | | | 1,043,197 | |
| | Grupo Financiero Santander Mexico SAB de CV, B, ADR | | | Banks | | | | 171,410 | | | | 1,232,438 | |
| | Nemak SAB de CV | | | Auto Components | | | | 1,426,300 | | | | 1,273,875 | |
| b | | Telesites SAB de CV | | | Diversified Telecommunication Services | | | | 82,000 | | | | 44,448 | |
| | | | | | | | | | | | | | |
| | | | | | | | | | | | | 3,593,958 | |
| | | | | | | | | | | | | | |
| | | Nigeria 0.0%† | | | | | | | | | |
| | Nigerian Breweries PLC | | | Beverages | | | | 167,352 | | | | 78,543 | |
| | | | | | | | | | | | | | |
| | | Pakistan 1.4% | | | | | | | | | |
| | Habib Bank Ltd. | | | Banks | | | | 1,550,000 | | | | 4,042,994 | |
| | | | | | | | | | | | | | |
| | | Peru 0.9% | | | | | | | | | |
| | Compania de Minas Buenaventura SA, ADR | | | Metals & Mining | | | | 243,390 | | | | 2,745,439 | |
| | | | | | | | | | | | | | |
| | | Philippines 0.5% | | | | | | | | | |
| | BDO Unibank Inc. | | | Banks | | | | 272,900 | | | | 616,782 | |
| b | | Bloomberry Resorts Corp. | | | Hotels, Restaurants & Leisure | | | | 6,177,500 | | | | 765,968 | |
| | | | | | | | | | | | | | |
| | | | | | | | | | | | | 1,382,750 | |
| | | | | | | | | | | | | | |
| | | Russia 4.5% | | | | | | | | | |
| | LUKOIL PJSC, ADR | | | Oil, Gas & Consumable Fuels | | | | 41,300 | | | | 2,316,930 | |
| | LUKOIL PJSC, ADR (London Stock Exchange) | | | Oil, Gas & Consumable Fuels | | | | 38,600 | | | | 2,165,460 | |
| a,b | | Mail.ru Group Ltd., GDR, Reg S | | | Internet Software & Services | | | | 179,485 | | | | 3,293,550 | |
| | MMC Norilsk Nickel PJSC, ADR | | | Metals & Mining | | | | 137,400 | | | | 2,306,946 | |
| b | | Yandex NV, A | | | Internet Software & Services | | | | 150,078 | | | | 3,021,070 | |
| | | | | | | | | | | | | | |
| | | | | | | | | | | | | 13,103,956 | |
| | | | | | | | | | | | | | |
| | | Singapore 0.1% | | | | | | | | | |
| | DBS Group Holdings Ltd. | | | Banks | | | | 25,706 | | | | 307,854 | |
| | | | | | | | | | | | | | |
| | South Africa 7.8% | | | | | | | | | | | | |
| | Massmart Holdings Ltd. | | | Food & Staples Retailing | | | | 190,769 | | | | 1,751,810 | |
| | MTN Group Ltd. | | | Wireless Telecommunication Services | | | | 276,096 | | | | 2,535,559 | |
| | Naspers Ltd., N | | | Media | | | | 97,448 | | | | 14,285,956 | |
| | Remgro Ltd. | | | Diversified Financial Services | | | | 272,238 | | | | 4,419,860 | |
| | | | | | | | | | | | | | |
| | | | | | | | | | | | | 22,993,185 | |
| | | | | | | | | | | | | | |
| | | South Korea 14.8% | | | | | | | | | |
| | Daelim Industrial Co. Ltd. | | | Construction & Engineering | | | | 50,285 | | | | 3,627,919 | |
| | Fila Korea Ltd. | | | Textiles, Apparel & Luxury Goods | | | | 33,470 | | | | 1,954,546 | |
| | Hankook Tire Co. Ltd. | | | Auto Components | | | | 21,600 | | | | 1,037,726 | |
| | Hanon Systems | | | Auto Components | | | | 206,051 | | | | 1,757,976 | |
| | Hite Jinro Co. Ltd. | | | Beverages | | | | 64,320 | | | | 1,124,163 | |
FRANKLIN TEMPLETON VARIABLE INSURANCE PRODUCTS TRUST
STATEMENT OF INVESTMENTS
Templeton Developing Markets VIP Fund (continued)
| | | | | | | | | | | | | | |
| | | | | Industry | | | Shares | | | Value | |
| | | Common Stocks (continued) | | | | | | | | | |
| | South Korea (continued) | | | | | | | | | | | | |
| | Hyundai Development Co-Engineering & Construction | | | Construction & Engineering | | | | 132,630 | | | $ | 4,938,243 | |
| | Hyundai Wia Corp. | | | Auto Components | | | | 17,000 | | | | 1,027,952 | |
| | iMarketkorea Inc. | | | Trading Companies & Distributors | | | | 70,490 | | | | 607,242 | |
| | Interpark Holdings Corp. | | | Internet & Direct Marketing Retail | | | | 142,053 | | | | 590,684 | |
| | KT Skylife Co. Ltd. | | | Media | | | | 176,060 | | | | 2,522,945 | |
| | POSCO | | | Metals & Mining | | | | 2,900 | | | | 618,552 | |
| | Samsung Electronics Co. Ltd. | | | Technology Hardware, Storage & Peripherals | | | | 12,767 | | | | 19,056,566 | |
| | SK Hynix Inc. | | | Semiconductors & Semiconductor Equipment | | | | 113,860 | | | | 4,215,797 | |
| | Youngone Corp. | | | Textiles, Apparel & Luxury Goods | | | | 22,200 | | | | 563,617 | |
| | | | | | | | | | | | | | |
| | | | | | | | | | | | | 43,643,928 | |
| | | | | | | | | | | | | | |
| | | Taiwan 10.5% | | | | | | | | | |
| | Catcher Technology Co. Ltd. | | | Technology Hardware, Storage & Peripherals | | | | 357,000 | | | | 2,464,003 | |
| | Hon Hai Precision Industry Co. Ltd. | | | Electronic Equipment, Instruments | | | | | | | | | |
| | | | | & Components | | | | 2,700,500 | | | | 7,006,181 | |
| | Largan Precision Co. Ltd. | | | Electronic Equipment, Instruments | | | | | | | | | |
| | | | | & Components | | | | 14,000 | | | | 1,634,904 | |
| | Pegatron Corp. | | | Technology Hardware, Storage & Peripherals | | | | 973,800 | | | | 2,310,392 | |
| | Taiwan Semiconductor Manufacturing Co. Ltd. | | | Semiconductors & Semiconductor Equipment | | | | 3,100,000 | | | | 17,336,579 | |
| | | | | | | | | | | | | | |
| | | | | | | | | | | | | 30,752,059 | |
| | | | | | | | | | | | | | |
| | | Thailand 4.1% | | | | | | | | | |
| | Kasikornbank PCL, fgn | | | Banks | | | | 604,100 | | | | 2,991,011 | |
| | Kiatnakin Bank PCL, fgn | | | Banks | | | | 1,009,800 | | | | 1,661,875 | |
| | Land and Houses PCL, fgn | | | Real Estate Management & Development | | | | 4,853,900 | | | | 1,320,098 | |
| | PTT Exploration and Production PCL, fgn | | | Oil, Gas & Consumable Fuels | | | | 584,500 | | | | 1,569,264 | |
| | Siam Commercial Bank PCL, fgn | | | Banks | | | | 306,400 | | | | 1,303,375 | |
| | Thai Beverage PCL, fgn | | | Beverages | | | | 5,290,600 | | | | 3,105,885 | |
| | | | | | | | | | | | | | |
| | | | | | | | | | | | | 11,951,508 | |
| | | | | | | | | | | | | | |
| | | United Kingdom 4.1% | | | | | | | | | |
| | Unilever PLC | | | Personal Products | | | | 299,133 | | | | 12,132,435 | |
| | | | | | | | | | | | | | |
| | | United States 0.9% | | | | | | | | | |
| b | | IMAX Corp. | | | Media | | | | 84,117 | | | | 2,641,274 | |
| | | | | | | | | | | | | | |
| | | Total Common Stocks (Cost $242,885,354) | | | | | | 269,992,890 | |
| | | | | | | | | | | | | | |
| c | | Participatory Notes 1.7% | | | | | | | | | |
| | | Saudi Arabia 1.7% | | | | | | | | | |
| | Deutsche Bank AG/London, Samba Financial Group, 8/03/20 | | | Banks | | | | 143,055 | | | | 928,458 | |
| | HSBC Bank PLC, | | | | | | | | | | | | |
| | Saudi Basic Industries Corp., 1/22/18 | | | Chemicals | | | | 167,110 | | | | 4,075,528 | |
| | d Savola Al-Azizia United Co., 144A, 2/06/17 | | | Food Products | | | | 2,500 | | | | 26,720 | |
| | | | | | | | | | | | | | |
| | | Total Participatory Notes (Cost $4,463,391) | | | | | | 5,030,706 | |
| | | | | | | | | | | | | | |
FRANKLIN TEMPLETON VARIABLE INSURANCE PRODUCTS TRUST
STATEMENT OF INVESTMENTS
| | | | | | | | | | | | | | |
| Templeton Developing Markets VIP Fund (continued) | |
| | | | | Industry | | | Shares | | | Value | |
| | | Preferred Stocks 5.0% | | | | | | | | | |
| | | Brazil 5.0% | | | | | | | | | |
| e | | Banco Bradesco SA, 4.637%, ADR, pfd | | | Banks | | | | 570,650 | | | $ | 4,970,362 | |
| e | | Itau Unibanco Holding SA, 4.696%, ADR, pfd | | | Banks | | | | 953,162 | | | | 9,798,505 | |
| | | | | | | | | | | | | | |
| | Total Preferred Stocks (Cost $9,722,435) | | | | | | | | | | | 14,768,867 | |
| | | | | | | | | | | | | | |
| | Total Investments before Short Term Investments
(Cost $257,071,180) | | | | | | | | | | | 289,792,463 | |
| | | | | | | | | | | | | | |
| | Short Term Investments (Cost $4,395,622) 1.5% | | | | | | | | | | | | |
| | Money Market Funds 1.5% | | | | | | | | | | | | |
| | | United States 1.5% | | | | | | | | | |
| f,g | | Institutional Fiduciary Trust Money Market Portfolio, 0.09% | | | | | | | 4,395,622 | | | | 4,395,622 | |
| | | | | | | | | | | | | | |
| | Total Investments (Cost $261,466,802) 100.0% | | | | | | | | | | | 294,188,085 | |
| | Other Assets, less Liabilities (0.0)%† | | | | | | | | | | | (64,264 | ) |
| | | | | | | | | | | | | | |
| | Net Assets 100.0% | | | | | | | | | | $ | 294,123,821 | |
| | | | | | | | | | | | | | |
See Abbreviations on page TD- 24.
†Rounds to less than 0.1% of net assets.
aSecurity was purchased pursuant to Regulation S under the Securities Act of 1933, which exempts from registration securities offered and sold outside of the United States. Such a security cannot be sold in the United States without either an effective registration statement filed pursuant to the Securities Act of 1933, or pursuant to an exemption from registration. These securities have been deemed liquid under guidelines approved by the Trust’s Board of Trustees. At December 31, 2016, the aggregate value of these securities was $3,501,244, representing 1.2% of net assets.
bNon-income producing.
cSee Note 1(c) regarding Participatory Notes
dSecurity was purchased pursuant to Rule 144A under the Securities Act of 1933 and may be sold in transactions exempt from registration only to qualified institutional buyers or in a public offering registered under the Securities Act of 1933. This security has been deemed liquid under guidelines approved by the Trust’s Board of Trustees. At December 31, 2016, value of this security was $26,720, representing less than 0.1% of net assets
eVariable rate security. The rate shown represents the yield at period end.
fSee Note 3(e) regarding investments in affiliated management investment companies.
gThe rate shown is the annualized seven-day yield at period end.
| | | | | | |
| | | The accompanying notes are an integral part of these financial statements. | Annual Report | | | TD-13 | |
FRANKLIN TEMPLETON VARIABLE INSURANCE PRODUCTS TRUST
Financial Statements
Statement of Assets and Liabilities
December 31, 2016
| | | | |
| | | Templeton Developing Markets VIP Fund | |
Assets: | | | | |
Investments in securities: | | | | |
Cost - Unaffiliated issuers | | $ | 257,071,180 | |
Cost - Non-controlled affiliates (Note 3e) | | | 4,395,622 | |
| | | | |
Total cost of investments | | $ | 261,466,802 | |
| | | | |
Value - Unaffiliated issuers | | $ | 289,792,463 | |
Value - Non-controlled affiliates (Note 3e) | | | 4,395,622 | |
| | | | |
Total value of investments | | | 294,188,085 | |
Receivables: | | | | |
Capital shares sold | | | 160,123 | |
Dividends | | | 646,727 | |
Foreign tax | | | 22,570 | |
Other assets | | | 21 | |
| | | | |
Total assets | | | 295,017,526 | |
| | | | |
Liabilities: | | | | |
Payables: | | | | |
Capital shares redeemed | | | 63,709 | |
Management fees | | | 309,863 | |
Distribution fees | | | 92,496 | |
Reports to shareholders | | | 83,535 | |
Professional fees | | | 53,828 | |
Deferred tax | | | 269,393 | |
Accrued expenses and other liabilities | | | 20,881 | |
| | | | |
Total liabilities | | | 893,705 | |
| | | | |
Net assets, at value | | $ | 294,123,821 | |
| | | | |
Net assets consist of: | | | | |
Paid-in capital | | $ | 302,780,927 | |
Distributions in excess of net investment income | | | (1,674,192 | ) |
Net unrealized appreciation (depreciation) | | | 32,418,311 | |
Accumulated net realized gain (loss) | | | (39,401,225 | ) |
| | | | |
Net assets, at value | | $ | 294,123,821 | |
| | | | |
| |
| Class 1: | | | | |
Net assets, at value | | $ | 82,595,941 | |
| | | | |
Shares outstanding | | | 11,135,294 | |
| | | | |
Net asset value and maximum offering price per share | | $ | 7.42 | |
| | | | |
| |
| Class 2: | | | | |
Net assets, at value | | $ | 205,150,888 | |
| | | | |
Shares outstanding | | | 27,880,292 | |
| | | | |
Net asset value and maximum offering price per share | | $ | 7.36 | |
| | | | |
| |
| Class 4: | | | | |
Net assets, at value | | $ | 6,376,992 | |
| | | | |
Shares outstanding | | | 862,798 | |
| | | | |
Net asset value and maximum offering price per share | | $ | 7.39 | |
| | | | |
| | | | |
| TD-14 | | Annual Report | The accompanying notes are an integral part of these financial statements. | | |
FRANKLIN TEMPLETON VARIABLE INSURANCE PRODUCTS TRUST
FINANCIAL STATEMENTS
Statement of Operations
for the year ended December 31, 2016
| | | | |
| | | Templeton Developing Markets VIP Fund | |
Investment income: | | | | |
Dividends: (net of foreign taxes of $850,906) | | | | |
Unaffiliated issuers | | $ | 6,304,961 | |
Non-controlled affiliates (Note 3e) | | | 140 | |
| | | | |
Total investment income | | | 6,305,101 | |
| | | | |
Expenses: | | | | |
Management fees (Note 3a) | | | 3,651,393 | |
Distribution fees: (Note 3c) | | | | |
Class 2 | | | 515,612 | |
Class 4 | | | 23,971 | |
Custodian fees (Note 4) | | | 92,891 | |
Reports to shareholders | | | 205,239 | |
Registration and filing fees | | | 84 | |
Professional fees | | | 71,498 | |
Trustees’ fees and expenses | | | 1,326 | |
Other. | | | 24,698 | |
| | | | |
Total expenses | | | 4,586,712 | |
Expenses waived/paid by affiliates (Note 3e) | | | (58,372 | ) |
| | | | |
Net expenses | | | 4,528,340 | |
| | | | |
Net investment income | | | 1,776,761 | |
| | | | |
Realized and unrealized gains (losses): | | | | |
Net realized gain (loss) from: | | | | |
Investments | | | 10,061,016 | |
Foreign currency transactions | | | 31,103 | |
| | | | |
Net realized gain (loss) | | | 10,092,119 | |
| | | | |
Net change in unrealized appreciation (depreciation) on: | | | | |
Investments | | | 34,571,875 | |
Translation of other assets and liabilities denominated in foreign currencies | | | 5,893 | |
Change in deferred taxes on unrealized appreciation | | | (149,541 | ) |
| | | | |
Net change in unrealized appreciation (depreciation) | | | 34,428,227 | |
| | | | |
Net realized and unrealized gain (loss) | | | 44,520,346 | |
| | | | |
Net increase (decrease) in net assets resulting from operations | | $ | 46,297,107 | |
| | | | |
| | | | | | |
| | | The accompanying notes are an integral part of these financial statements. | Annual Report | | | TD-15 | |
FRANKLIN TEMPLETON VARIABLE INSURANCE PRODUCTS TRUST
FINANCIAL STATEMENTS
Statements of Changes in Net Assets
| | | | | | | | |
| | | Templeton Developing
Markets VIP Fund | |
| | | Year Ended December 31, | |
| | | 2016 | | | 2015 | |
Increase (decrease) in net assets: | | | | | | | | |
Operations: | | | | | | | | |
Net investment income | | $ | 1,776,761 | | | $ | 1,869,006 | |
Net realized gain (loss) | | | 10,092,119 | | | | (40,238,876 | ) |
Net change in unrealized appreciation (depreciation) | | | 34,428,227 | | | | (29,184,006 | ) |
| | | | |
Net increase (decrease) in net assets resulting from operations | | | 46,297,107 | | | | (67,553,876 | ) |
| | | | |
Distributions to shareholders from: | | | | | | | | |
Net investment income: | | | | | | | | |
Class 1 | | | (875,959 | ) | | | (2,280,023 | ) |
Class 2 | | | (1,674,699 | ) | | | (4,605,588 | ) |
Class 4 | | | (44,436 | ) | | | (178,865 | ) |
Net realized gains: | | | | | | | | |
Class 1 | | | — | | | | (12,555,712 | ) |
Class 2 | | | — | | | | (29,329,089 | ) |
Class 4 | | | — | | | | (1,242,906 | ) |
| | | | |
Total distributions to shareholders | | | (2,595,094 | ) | | | (50,192,183 | ) |
| | | | |
Capital share transactions: (Note 2) | | | | | | | | |
Class 1 | | | (6,421,627 | ) | | | (3,228,881 | ) |
Class 2 | | | (17,591,736 | ) | | | 21,548,017 | |
Class 4 | | | (1,794,556 | ) | | | (748,959 | ) |
| | | | |
Total capital share transactions | | | (25,807,919 | ) | | | 17,570,177 | |
| | | | |
Net increase (decrease) in net assets | | | 17,894,094 | | | | (100,175,882 | ) |
Net assets: | | | | | | | | |
Beginning of year | | | 276,229,727 | | | | 376,405,609 | |
| | | | |
End of year | | $ | 294,123,821 | | | $ | 276,229,727 | |
| | | | |
Distributions in excess of net investment income included in net assets: | | | | | | | | |
End of year | | $ | (1,674,192 | ) | | $ | (3,021,032 | ) |
| | | | |
| | | | |
| TD-16 | | Annual Report | The accompanying notes are an integral part of these financial statements. | | |
FRANKLIN TEMPLETON VARIABLE INSURANCE PRODUCTS TRUST
Notes to Financial Statements
Templeton Developing Markets VIP Fund
1. Organization and Significant Accounting Policies
Franklin Templeton Variable Insurance Products Trust (Trust) is registered under the Investment Company Act of 1940 (1940 Act) as an open-end management investment company, consisting of nineteen separate funds and applies the specialized accounting and reporting guidance in U.S. Generally Accepted Accounting Principles (U.S. GAAP). Templeton Developing Markets VIP Fund (Fund) is included in this report. The financial statements of the remaining funds in the Trust are presented separately. Shares of the Fund are generally sold only to insurance company separate accounts to fund the benefits of variable life insurance policies or variable annuity contracts. The Fund offers three classes of shares: Class 1, Class 2 and Class 4. Each class of shares differs by its distribution fees, voting rights on matters affecting a single class and its exchange privilege.
The following summarizes the Fund’s significant accounting policies.
a. Financial Instrument Valuation
The Fund’s investments in financial instruments are carried at fair value daily. Fair value is the price that would be received to sell an asset or paid to transfer a liability in an orderly transaction between market participants on the measurement date. The Fund calculates the net asset value (NAV) per share as of 4 p.m. Eastern time each day the New York Stock Exchange (NYSE) is open for trading. Under compliance policies and procedures approved by the Trust’s Board of Trustees (the Board), the Fund’s administrator has responsibility for oversight of valuation, including leading the cross-functional Valuation Committee (VC). The VC provides administration and oversight of the Fund’s valuation policies and procedures, which are approved annually by the Board. Among other things, these procedures allow the Fund to utilize independent pricing services, quotations from securities and financial instrument dealers, and other market sources to determine fair value.
Equity securities listed on an exchange or on the NASDAQ National Market System are valued at the last quoted sale price or the official closing price of the day, respectively. Foreign equity securities are valued as of the close of trading on the foreign stock exchange on which the security is primarily traded, or as of 4 p.m. Eastern time. The value is then converted into its U.S. dollar equivalent at the foreign exchange rate in
effect at 4 p.m. Eastern time on the day that the value of the security is determined. Over-the-counter (OTC) securities are valued within the range of the most recent quoted bid and ask prices. Securities that trade in multiple markets or on multiple exchanges are valued according to the broadest and most representative market. Certain equity securities are valued based upon fundamental characteristics or relationships to similar securities.
Investments in open-end mutual funds are valued at the closing NAV.
The Fund has procedures to determine the fair value of financial instruments for which market prices are not reliable or readily available. Under these procedures, the VC convenes on a regular basis to review such financial instruments and considers a number of factors, including significant unobservable valuation inputs, when arriving at fair value. The VC primarily employs a market-based approach which may use related or comparable assets or liabilities, recent transactions, market multiples, book values, and other relevant information for the investment to determine the fair value of the investment. An income-based valuation approach may also be used in which the anticipated future cash flows of the investment are discounted to calculate fair value. Discounts may also be applied due to the nature or duration of any restrictions on the disposition of the investments. Due to the inherent uncertainty of valuations of such investments, the fair values may differ significantly from the values that would have been used had an active market existed. The VC employs various methods for calibrating these valuation approaches including a regular review of key inputs and assumptions, transactional back-testing or disposition analysis, and reviews of any related market activity.
Trading in securities on foreign securities stock exchanges and OTC markets may be completed before 4 p.m. Eastern time. In addition, trading in certain foreign markets may not take place on every Fund’s business day. Occasionally, events occur between the time at which trading in a foreign security is completed and 4 p.m. Eastern time that might call into question the reliability of the value of a portfolio security held by the Fund. As a result, differences may arise between the value of the Fund’s portfolio securities as determined at the foreign market close and the latest indications of value at 4 p.m. Eastern time. In order to minimize the potential for these differences, the VC monitors price movements following the close of trading in foreign stock markets through a series of country specific market proxies (such as baskets of American
FRANKLIN TEMPLETON VARIABLE INSURANCE PRODUCTS TRUST
NOTES TO FINANCIAL STATEMENTS
Templeton Developing Markets VIP Fund (continued)
1. Organization and Significant Accounting
Policies (continued)
a. Financial Instrument Valuation (continued)
Depositary Receipts, futures contracts and exchange traded funds). These price movements are measured against established trigger thresholds for each specific market proxy to assist in determining if an event has occurred that may call into question the reliability of the values of the foreign securities held by the Fund. If such an event occurs, the securities may be valued using fair value procedures, which may include the use of independent pricing services.
When the last day of the reporting period is a non-business day, certain foreign markets may be open on those days that the Fund’s NAV is not calculated, which could result in differences between the value of the Fund’s portfolio securities on the last business day and the last calendar day of the reporting period. Any significant security valuation changes due to an open foreign market are adjusted and reflected by the Fund for financial reporting purposes.
b. Foreign Currency Translation
Portfolio securities and other assets and liabilities denominated in foreign currencies are translated into U.S. dollars based on the exchange rate of such currencies against U.S. dollars on the date of valuation. The Fund may enter into foreign currency exchange contracts to facilitate transactions denominated in a foreign currency. Purchases and sales of securities, income and expense items denominated in foreign currencies are translated into U.S. dollars at the exchange rate in effect on the transaction date. Portfolio securities and assets and liabilities denominated in foreign currencies contain risks that those currencies will decline in value relative to the U.S. dollar. Occasionally, events may impact the availability or reliability of foreign exchange rates used to convert the U.S. dollar equivalent value. If such an event occurs, the foreign exchange rate will be valued at fair value using procedures established and approved by the Board.
The Fund does not separately report the effect of changes in foreign exchange rates from changes in market prices on securities held. Such changes are included in net realized and unrealized gain or loss from investments in the Statement of Operations.
Realized foreign exchange gains or losses arise from sales of foreign currencies, currency gains or losses realized between the trade and settlement dates on securities transactions and the
difference between the recorded amounts of dividends, interest, and foreign withholding taxes and the U.S. dollar equivalent of the amounts actually received or paid. Net unrealized foreign exchange gains and losses arise from changes in foreign exchange rates on foreign denominated assets and liabilities other than investments in securities held at the end of the reporting period.
c. Participatory Notes
The Fund invests in Participatory Notes (P-Notes). P-Notes are promissory notes that are designed to offer a return linked to the performance of a particular underlying equity security or market. P-Notes are issued by banks or broker-dealers and allow the Fund to gain exposure to common stocks in markets where direct investment is not allowed. Income received from P-Notes is recorded as dividend income in the Statement of Operations. P-Notes may contain various risks including the potential inability of the counterparty to fulfill their obligations under the terms of the contract. These securities may be more volatile and less liquid than other investments held by the Fund.
d. Securities Lending
The Fund participates in an agency based securities lending program to earn additional income. The Fund receives cash collateral against the loaned securities in an amount equal to at least 102% of the fair value of the loaned securities. Collateral is maintained over the life of the loan in an amount not less than 100% of the fair value of loaned securities, as determined at the close of Fund business each day; any additional collateral required due to changes in security values is delivered to the Fund on the next business day. The collateral is deposited into a joint cash account with other funds and is used to invest in a money market fund managed by Franklin Advisers, Inc., an affiliate of the Fund. The Fund may receive income from the investment of cash collateral, in addition to lending fees and rebates paid by the borrower. Income from securities loaned, net of fees paid to the securities lending agent and/or third-party vendor, is reported separately in the Statement of Operations. The Fund bears the market risk with respect to the collateral investment, securities loaned, and the risk that the agent may default on its obligations to the Fund. If the borrower defaults on its obligation to return the securities loaned, the Fund has the right to repurchase the securities in the open market using the
FRANKLIN TEMPLETON VARIABLE INSURANCE PRODUCTS TRUST
NOTES TO FINANCIAL STATEMENTS
Templeton Developing Markets VIP Fund (continued)
collateral received. The securities lending agent has agreed to indemnify the Fund in the event of default by a third party borrower. At December 31, 2016, the Fund had no securities on loan.
e. Income and Deferred Taxes
It is the Fund’s policy to qualify as a regulated investment company under the Internal Revenue Code. The Fund intends to distribute to shareholders substantially all of its taxable income and net realized gains to relieve it from federal income and if applicable, excise taxes. As a result, no provision for U.S. federal income taxes is required.
The Fund may be subject to foreign taxation related to income received, capital gains on the sale of securities and certain foreign currency transactions in the foreign jurisdictions in which it invests. Foreign taxes, if any, are recorded based on the tax regulations and rates that exist in the foreign markets in which the Fund invests. When a capital gain tax is determined to apply, the Fund records an estimated deferred tax liability in an amount that would be payable if the securities were disposed of on the valuation date.
The Fund may recognize an income tax liability related to its uncertain tax positions under U.S. GAAP when the uncertain tax position has a less than 50% probability that it will be sustained upon examination by the tax authorities based on its technical merits. As of December 31, 2016, the Fund has determined that no tax liability is required in its financial statements related to uncertain tax positions for any open tax years (or expected to be taken in future tax years). Open tax years are those that remain subject to examination and are based on each tax jurisdiction’s statute of limitation.
f. Security Transactions, Investment Income, Expenses and Distributions
Security transactions are accounted for on trade date. Realized gains and losses on security transactions are determined on a specific identification basis. Estimated expenses are accrued daily. Dividend income is recorded on the ex-dividend date except for certain dividends from securities where the dividend rate is not available. In such cases, the dividend is recorded as soon as the information is received by the Fund. Distributions to
shareholders are recorded on the ex-dividend date and are determined according to income tax regulations (tax basis). Distributable earnings determined on a tax basis may differ from earnings recorded in accordance with U.S. GAAP. These differences may be permanent or temporary. Permanent differences are reclassified among capital accounts to reflect their tax character. These reclassifications have no impact on net assets or the results of operations. Temporary differences are not reclassified, as they may reverse in subsequent periods.
Common expenses incurred by the Trust are allocated among the Funds based on the ratio of net assets of each Fund to the combined net assets of the Trust. Fund specific expenses are charged directly to the Fund that incurred the expense.
Realized and unrealized gains and losses and net investment income, not including class specific expenses, are allocated daily to each class of shares based upon the relative proportion of net assets of each class. Differences in per share distributions, by class, are generally due to differences in class specific expenses.
g. Accounting Estimates
The preparation of financial statements in accordance with U.S. GAAP requires management to make estimates and assumptions that affect the reported amounts of assets and liabilities at the date of the financial statements and the amounts of income and expenses during the reporting period. Actual results could differ from those estimates.
h. Guarantees and Indemnifications
Under the Trust’s organizational documents, its officers and trustees are indemnified by the Trust against certain liabilities arising out of the performance of their duties to the Trust. Additionally, in the normal course of business, the Trust, on behalf of the Fund, enters into contracts with service providers that contain general indemnification clauses. The Trust’s maximum exposure under these arrangements is unknown as this would involve future claims that may be made against the Trust that have not yet occurred. Currently, the Trust expects the risk of loss to be remote.
FRANKLIN TEMPLETON VARIABLE INSURANCE PRODUCTS TRUST
NOTES TO FINANCIAL STATEMENTS
Templeton Developing Markets VIP Fund (continued)
2. Shares of Beneficial Interest
At December 31, 2016, there were an unlimited number of shares authorized (without par value). Transactions in the Fund’s shares were as follows:
| | | | | | | | | | | | | | | | | | | | |
| | | Year Ended December 31, | |
| | | 2016 | | | | | | 2015 | |
| | | Shares | | | Amount | | | | | | Shares | | | Amount | |
| | | | | |
| Class 1 Shares: | | | | | | | | | | | | | | | | | | | | |
Shares sold | | | 1,670,412 | | | $ | 11,807,302 | | | | | | | | 1,121,738 | | | $ | 9,288,141 | |
Shares issued in reinvestment of distributions | | | 130,351 | | | | 875,960 | | | | | | | | 1,921,727 | | | | 14,835,735 | |
Shares redeemed | | | (2,747,707 | ) | | | (19,104,889 | ) | | | | | | | (3,309,863 | ) | | | (27,352,757 | ) |
| | | | |
Net increase (decrease) | | | (946,944 | ) | | $ | (6,421,627 | ) | | | | | | | (266,398 | ) | | $ | (3,228,881 | ) |
| | | | |
| | | | | |
| Class 2 Shares: | | | | | | | | | | | | | | | | | | | | |
Shares sold | | | 6,851,485 | | | $ | 48,325,937 | | | | | | | | 4,635,193 | | | $ | 35,599,642 | |
Shares issued in reinvestment of distributions | | | 251,080 | | | | 1,674,699 | | | | | | | | 4,430,114 | | | | 33,934,677 | |
Shares redeemed | | | (9,617,120 | ) | | | (67,592,372 | ) | | | | | | | (5,930,164 | ) | | | (47,986,302 | ) |
| | | | |
Net increase (decrease) | | | (2,514,555 | ) | | $ | (17,591,736 | ) | | | | | | | 3,135,143 | | | $ | 21,548,017 | |
| | | | |
| | | | | |
| Class 4 Shares: | | | | | | | | | | | | | | | | | | | | |
Shares sold | | | 84,033 | | | $ | 595,503 | | | | | | | | 96,241 | | | $ | 723,497 | |
Shares issued in reinvestment of distributions | | | 6,622 | | | | 44,436 | | | | | | | | 184,886 | | | | 1,421,771 | |
Shares redeemed | | | (348,788 | ) | | | (2,434,495 | ) | | | | | | | (364,639 | ) | | | (2,894,227 | ) |
| | | | |
Net increase (decrease) | | | (258,133 | ) | | $ | (1,794,556 | ) | | | | | | | (83,512 | ) | | $ | (748,959 | ) |
| | | | |
3. Transactions with Affiliates
Franklin Resources, Inc. is the holding company for various subsidiaries that together are referred to as Franklin Templeton Investments. Certain officers and trustees of the Fund are also officers and/or trustees of the following subsidiaries:
| | |
| Subsidiary | | Affiliation |
Templeton Asset Management Ltd. (TAML) | | Investment manager |
Franklin Templeton Services, LLC (FT Services) | | Administrative manager |
Franklin Templeton Distributors, Inc. (Distributors) | | Principal underwriter |
Franklin Templeton Investor Services, LLC (Investor Services) | | Transfer agent |
FRANKLIN TEMPLETON VARIABLE INSURANCE PRODUCTS TRUST
NOTES TO FINANCIAL STATEMENTS
Templeton Developing Markets VIP Fund (continued)
a. Management Fees
The Fund pays an investment management fee to TAML based on the average daily net assets of the Fund as follows:
| | |
| Annualized Fee Rate | | Net Assets |
1.250% | | Up to and including $200 million |
1.235% | | Over $200 million, up to and including $700 million |
1.200% | | Over $700 million, up to and including $1 billion |
1.150% | | Over $1 billion, up to and including $1.2 billion |
1.125% | | Over $1.2 billion, up to and including $5 billion |
1.075% | | Over $5 billion, up to and including $10 billion |
1.025% | | Over $10 billion, up to and including $15 billion |
0.975% | | Over $15 billion, up to and including $20 billion |
0.925% | | In excess of $20 billion |
For the year ended December 31, 2016, the effective investment management fee rate was 1.244% of the Fund’s average daily net assets.
b. Administrative Fees
Under an agreement with TAML, FT Services provides administrative services to the Fund. The fee is paid by TAML based on the Fund’s average daily net assets, and is not an additional expense of the Fund.
c. Distribution Fees
The Board has adopted distribution plans for Class 2 and Class 4 shares pursuant to Rule 12b-1 under the 1940 Act. Under the Fund’s compensation distribution plans, the Fund pays Distributors for costs incurred in connection with the servicing, sale and distribution of the Fund’s shares up to 0.25% and 0.35% per year of its average daily net assets of Class 2 and Class 4, respectively. The plan year, for purposes of monitoring compliance with the maximum annual plan rates, is February 1 through January 31.
d. Transfer Agent Fees
Investor Services, under terms of an agreement, performs shareholder servicing for the Fund and is not paid by the Fund for the services.
FRANKLIN TEMPLETON VARIABLE INSURANCE PRODUCTS TRUST
NOTES TO FINANCIAL STATEMENTS
Templeton Developing Markets VIP Fund (continued)
3. Transactions with Affiliates (continued)
e. Investments in Affiliated Management Investment Companies
The Fund invests in one or more affiliated management investment companies for purposes other than exercising a controlling influence over the management or policies. Management fees paid by the Fund are waived on assets invested in the affiliated management investment companies, as noted in the Statements of Operations, in an amount not to exceed the management and administrative fees paid directly or indirectly by each affiliate. Prior to January 1, 2014, the waiver was accounted for as a reduction to management fees. During the year ended December 31, 2016, the Fund held investments in affiliated management investment companies as follows:
| | | | | | | | | | | | | | | | | | | | | | | | | | | | | | | | |
| | | Number
of Shares
Held at
Beginning
of Year | | | Gross
Additions | | | Gross
Reductions | | | Number
of Shares
Held at
End of
Year | | | Value at
End of
Year | | | Investment
Income | | | Realized
Gain
(Loss) | | | % of Affiliated Fund Shares
Outstanding
Held at End
of Year | |
| Non-Controlled Affiliates | | | | | | | | | | | | | | | | | | | | | | | | | | | | | | | | |
Institutional Fiduciary Trust Money Market Portfolio, 0.09% | | | 36,108,301 | | | | 58,316,358 | | | | (90,029,037 | ) | | | 4,395,622 | | | $ | 4,395,622 | | | $ | 140 | | | $ | — | | | | 0.0%a | |
| | | | | | | | | | | | | | | | | | | | | | | | |
aRounds to less than 0.1%. | | | | | | | | | | | | | | | | | | | | | | | | | | | | | | | | |
4. Expense Offset Arrangement
The Fund has entered into an arrangement with its custodian whereby credits realized as a result of uninvested cash balances are used to reduce a portion of the Fund’s custodian expenses. During the year ended December 31, 2016, there were no credits earned.
5. Income Taxes
For tax purposes, capital losses may be carried over to offset future capital gains, if any. At December 31, 2016, the capital loss carryforwards were as follows:
| | | | |
Capital loss carryforwards not subject to expiration: | | | | |
Short term | | $ | 19,728,638 | |
Long term | | | 13,677,912 | |
| | | | |
Total capital loss carryforwards | | $ | 33,406,550 | |
| | | | |
The tax character of distributions paid during the years ended December 31, 2016 and 2015, was as follows:
| | | | | | | | |
| | | 2016 | | | 2015 | |
Distributions paid from: | | | | | | | | |
Ordinary income. | | $ | 2,595,094 | | | $ | 7,065,009 | |
Long term capital gain. | | | — | | | | 43,127,174 | |
| | | | |
| | $ | 2,595,094 | | | $ | 50,192,183 | |
| | | | |
FRANKLIN TEMPLETON VARIABLE INSURANCE PRODUCTS TRUST
NOTES TO FINANCIAL STATEMENTS
Templeton Developing Markets VIP Fund (continued)
At December 31, 2016, the cost of investments, net unrealized appreciation (depreciation) and undistributed ordinary income for income tax purposes were as follows:
| | | | |
Cost of investments | | $ | 272,758,152 | |
| | | | |
Unrealized appreciation | | $ | 55,012,459 | |
Unrealized depreciation | | | (33,582,526 | ) |
| | | | |
Net unrealized appreciation (depreciation) | | $ | 21,429,933 | |
| | | | |
Distributable earnings - undistributed ordinary income | | $ | 3,622,485 | |
| | | | |
Differences between income and/or capital gains as determined on a book basis and a tax basis are primarily due to differing treatment of corporate actions and wash sales.
6. Investment Transactions
Purchases and sales of investments (excluding short term securities) for the year ended December 31, 2016, aggregated $77,363,215 and $73,221,623, respectively.
7. Concentration of Risk
Investing in foreign securities may include certain risks and considerations not typically associated with investing in U.S. securities, such as fluctuating currency values and changing local and regional economic, political and social conditions, which may result in greater market volatility. In addition, certain foreign securities may not be as liquid as U.S. securities.
8. Credit Facility
The Fund, together with other U.S. registered and foreign investment funds (collectively, Borrowers), managed by Franklin Templeton Investments, are borrowers in a joint syndicated senior unsecured credit facility totaling $2 billion (Global Credit Facility) which matured on February 10, 2017. This Global Credit Facility provides a source of funds to the Borrowers for temporary and emergency purposes, including the ability to meet future unanticipated or unusually large redemption requests. Effective February 10, 2017, the Borrowers renewed the Global Credit Facility for a one year term, maturing February 9, 2018, for a total of $2 billion.
Under the terms of the Global Credit Facility, the Fund shall, in addition to interest charged on any borrowings made by the Fund and other costs incurred by the Fund, pay its share of fees and expenses incurred in connection with the implementation and maintenance of the Global Credit Facility, based upon its relative share of the aggregate net assets of all of the Borrowers, including an annual commitment fee of 0.15% based upon the unused portion of the Global Credit Facility. These fees are reflected in other expenses in the Statement of Operations. During the year ended December 31, 2016, the Fund did not use the Global Credit Facility.
9. Fair Value Measurements
The Fund follows a fair value hierarchy that distinguishes between market data obtained from independent sources (observable inputs) and the Fund’s own market assumptions (unobservable inputs). These inputs are used in determining the value of the Fund’s financial instruments and are summarized in the following fair value hierarchy:
| | • | | Level 1 – quoted prices in active markets for identical financial instruments |
| | • | | Level 2 – other significant observable inputs (including quoted prices for similar financial instruments, interest rates, prepayment speed, credit risk, etc.) |
FRANKLIN TEMPLETON VARIABLE INSURANCE PRODUCTS TRUST
NOTES TO FINANCIAL STATEMENTS
Templeton Developing Markets VIP Fund (continued)
9. Fair Value Measurements (continued)
| | • | | Level 3 – significant unobservable inputs (including the Fund’s own assumptions in determining the fair value of financial instruments) |
The input levels are not necessarily an indication of the risk or liquidity associated with financial instruments at that level.
For movements between the levels within the fair value hierarchy, the Fund has adopted a policy of recognizing the transfers as of the date of the underlying event which caused the movement.
A summary of inputs used as of December 31, 2016, in valuing the Fund’s assets carried at fair value, is as follows:
| | | | | | | | | | | | | | | | |
| | | Level 1 | | | Level 2 | | | Level 3 | | | Total | |
| | | | |
| Assets: | | | | | | | | | | | | | | | | |
Investments in Securities: | | | | | | | | | | | | | | | | |
Equity Investments:a | | | | | | | | | | | | | | | | |
Energy. | | $ | 15,040,680 | | | $ | 2,316,930 | | | $ | — | | | $ | 17,357,610 | |
Materials | | | 8,174,981 | | | | 2,306,946 | | | | — | | | | 10,481,927 | |
All Other Equity Investmentsb | | | 256,922,220 | | | | — | | | | — | | | | 256,922,220 | |
Participatory Notes | | | — | | | | 5,030,706 | | | | — | | | | 5,030,706 | |
Short Term Investments | | | 4,395,622 | | | | — | | | | — | | | | 4,395,622 | |
| | | | |
Total Investments in Securities | | $ | 284,533,503 | | | $ | 9,654,582 | | | $ | — | | | $ | 294,188,085 | |
| | | | |
aIncludes common and preferred stocks.
bFor detailed categories, see the accompanying Statement of Investments.
10. Investment Company Reporting Modernization
In October 2016, the U.S. Securities and Exchange Commission adopted new rules and amended existing rules (together, final rules) intended to modernize the reporting and disclosure of information by registered investment companies. In part, the final rules amend Regulation S-X and require standardized, enhanced disclosures about derivatives in investment company financial statements, as well as other amendments. The compliance date for the amendments to Regulation S-X is August 1, 2017. Management is currently evaluating the impact that the adoption of the amendments to Regulation S-X will have on the Fund’s financial statements and related disclosures.
11. Subsequent Events
The Fund has evaluated subsequent events through the issuance of the financial statements and determined that no events have occurred that require disclosure.
Abbreviations
| | | | |
| Selected Portfolio |
| | |
| ADR | | American Depositary Receipt | | |
| | |
| GDR | | Global Depositary Receipt | | |
FRANKLIN TEMPLETON VARIABLE INSURANCE PRODUCTS TRUST
Report of Independent Registered Public Accounting Firm
Templeton Developing Markets VIP Fund
To the Board of Trustees and Shareholders of The Franklin Templeton Variable Insurance Products Trust
In our opinion, the accompanying statements of assets and liabilities, including the statements of investments, and the related statements of operations and of changes in net assets and the financial highlights present fairly, in all material respects, the financial position of Templeton Developing Markets VIP Fund (the “Fund”) at December 31, 2016, the results of each of their operations for the year then ended, the changes in each of their net assets for each of the two years in the period then ended and the financial highlights for each of the five years in the period then ended, in conformity with accounting principles generally accepted in the United States of America. These financial statements and financial highlights (hereafter referred to as “financial statements”) are the responsibility of the Fund’s management. Our responsibility is to express an opinion on these financial statements based on our audits. We conducted our audits of these financial statements in accordance with the standards of the Public Company Accounting Oversight Board (United States). Those standards require that we plan and perform the audit to obtain reasonable assurance about whether the financial statements are free of material misstatement. An audit includes examining, on a test basis, evidence supporting the amounts and disclosures in the financial statements, assessing the account principles used and significant estimates made by management, and evaluating the overall financial statement presentation. We believe that our audits, which included confirmation of securities at December 31, 2016 by correspondence with the custodian and brokers, provide a reasonable basis for our opinion.
PricewaterhouseCoopers LLP
San Francisco, California
February 15, 2017
FRANKLIN TEMPLETON VARIABLE INSURANCE PRODUCTS TRUST
Tax Information (unaudited)
Templeton Developing Markets VIP Fund
At December 31, 2016, more than 50% of the Fund’s total assets were invested in securities of foreign issuers. In most instances, foreign taxes were withheld from income paid to the Fund on these investments. The Fund elects to treat foreign taxes paid as allowed under Section 853 of the Internal Revenue Code (Code). This election will allow shareholders of record as of the 2017 distribution date, to treat their proportionate share of foreign taxes paid by the Fund as having been paid directly by them. The shareholder shall consider these amounts as foreign taxes paid in the tax year in which they receive the Fund distribution.
Templeton Foreign VIP Fund
We are pleased to bring you Templeton Foreign VIP Fund’s annual report for the fiscal year ended December 31, 2016.
Class 2 Performance Summary as of December 31, 2016
Average annual total return of Class 2 shares* represents the average annual change in value, assuming reinvestment of dividends and capital gains. Average returns smooth out variations in returns, which can be significant; they are not the same as year-by-year results.
| | | | | | | | | | | | |
| Periods ended 12/31/16 | | 1-Year | | | 5-Year | | | 10-Year | |
Average Annual Total Return | | | +7.18% | | | | +5.30% | | | | +1.70% | |
*The Fund has a fee waiver associated with any investment it makes in a Franklin Templeton money fund and/or other Franklin Templeton fund, contractually guaranteed through its current fiscal year-end. Fund investment results reflect the fee waiver; without this waiver, the results would have been lower.
Performance reflects the Fund’s Class 2 operating expenses, but does not include any contract fees, expenses or sales charges. If they had been included, performance would be lower. These charges and deductions, particularly for variable life policies, can have a significant effect on contract values and insurance benefits. See the contract prospectus for a complete description of these expenses, including sales charges.
Performance data represent past performance, which does not guarantee future results. Investment return and principal value will fluctuate, and you may have a gain or loss when you sell your shares. Current performance may differ from figures shown.
Total Return Index Comparison for a Hypothetical $10,000 Investment (1/1/07–12/31/16)
The graph below shows the change in value of a hypothetical $10,000 investment in the Fund over the indicated period and includes reinvestment of any income or distributions. The Fund’s performance* is compared to the performance of its new benchmark, the MSCI All Country World Index (ACWI) ex USA, and its old benchmark, the MSCI Europe, Australasia, Far East (EAFE) Index. We believe the new index better represents the Fund’s investable universe and is more in line with the Fund’s mandates. One cannot invest directly in an index, and an index is not representative of the Fund’s portfolio. Please see Important Notes to Performance Information preceding the Fund Summaries.
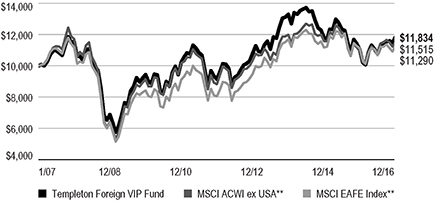
**Source: Morningstar. Please see Index Descriptions following the Fund Summaries.
TEMPLETON FOREIGN VIP FUND
Fund Goal and Main Investments
The Fund seeks long-term capital growth. Under normal market conditions, the Fund invests at least 80% of its net assets in investments of issuers located outside the U.S., including those in emerging markets.
Fund Risks
All investments involve risks, including possible loss of principal. Special risks are associated with foreign investing, including currency fluctuations, economic instability and political developments; investments in emerging markets involve heightened risks related to the same factors. In addition, smaller company stocks have historically experienced more price volatility than larger company stocks, especially over the short term. To the extent the Fund focuses on particular countries, regions, industries, sectors or types of investment from time to time, it may be subject to greater risks of adverse developments in such areas of focus than a fund that invests in a wider variety of countries, regions, industries, sectors or investments. The Fund is actively managed but there is no guarantee that the manager’s investment decisions will produce the desired results. The Fund’s prospectus also includes a description of the main investment risks.
Performance Overview
You can find the Fund’s one-year total return in the Performance Summary. In comparison, the Fund’s new benchmark, the MSCI ACWI ex USA, generated a +5.01% total return for the same period, while its old benchmark, the MSCI EAFE Index, posted a +1.51% total return.1 We believe the new index better represents the Fund’s investable universe and is more in line with the Fund’s mandates. Please note, index performance information is provided for reference and we do not attempt to track the index but rather undertake investments on the basis of fundamental research.
Economic and Market Overview
The global economy grew moderately during the 12-month period despite slower growth in some countries. In this environment, global developed and emerging market stocks, as measured by the MSCI ACWI, rose.2 Global markets were aided by accommodative monetary policies of various global
Geographic Composition
Based on Total Net Assets as of 12/31/16
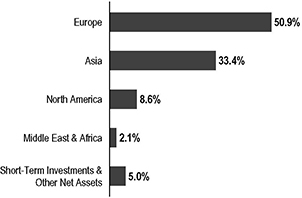
central banks, improved commodity prices after 2016’s first quarter, finalization of Greece’s new debt deal and generally encouraging global economic data. Further supporting markets were expectations of higher interest rates and inflation in the U.S., driven by talk of expansionary fiscal policies under new U.S. president Donald Trump, and an Organization of the Petroleum Exporting Countries deal to curb oil production. However, these factors were partially offset by a slowdown in China’s economy and declining commodity prices early in the period, geopolitical tensions in certain regions, uncertainty about the U.S. Federal Reserve’s (Fed’s) timing for raising interest rates and worries about the health of European banks. In addition, global economic concerns and the U.K.’s historic referendum to leave the European Union (also known as “Brexit”) contributed to volatility in global stock markets.
The U.S. economy grew in 2016 despite a general decline in private inventory and business investments, which partly offset strength in consumer spending, residential investment and government spending. Manufacturing conditions remained volatile but generally expanded. The services sector also grew for most of the period, contributing to new jobs that helped the unemployment rate decrease from 5.0% in December 2015 to 4.7% at period-end.3 Retail sales generally rose, as did home sales and prices amid declining mortgage rates. At its December meeting, the Fed increased its target range for the federal funds rate to 0.50%–0.75%, as policymakers cited an improvement in U.S. labor markets and higher inflation. The Federal Open Market Committee also hinted at three additional
1. Source: Morningstar. One cannot invest directly in an index, and an index is not representative of the Fund’s portfolio. Please see Index Descriptions following the Fund Summaries.
2. Please see Index Descriptions following the Fund Summaries.
3. Source: Bureau of Labor Statistics.
The dollar value, number of shares or principal amount, and names of all portfolio holdings are listed in the Fund’s Statement of Investments (SOI).
TEMPLETON FOREIGN VIP FUND
hikes in 2017, and the Fed raised its 2017 U.S. economic growth forecast, while lowering its unemployment projections.
In Europe, the U.K.’s annualized economic growth accelerated in 2016’s second half, driven by gross fixed capital formation in the third quarter and manufacturing and services in the fourth quarter. Immediate effects of the Brexit vote in June materialized as U.K. stocks declined significantly, the British pound hit a three-decade low amid intensified selling and the U.K.’s credit rating was downgraded. In the eurozone, despite investor concerns about banking sector weakness, low corporate earnings and post-Brexit politics, some regions benefited from rising consumer spending, resulting from a cheaper euro, low inflation and signs of sustained economic growth. The eurozone grew slightly early in the period, aided by lower oil prices, improved exports and the European Central Bank’s (ECB’s) accommodative monetary policy. However, growth moderated in 2016’s second quarter and improved in the third and fourth quarters. After declining in the beginning of 2016, the eurozone’s annual inflation rate increased gradually to reach its highest reading in three years toward period-end, ending at an estimated 1.1% in December. The ECB cut its benchmark interest rate and expanded its massive bond-buying program in March and August 2016 to boost the region’s slowing growth. Furthermore, at its December meeting, the ECB extended the continuation of its monthly asset purchases from March to December of 2017, but it agreed to scale back the purchase amount beginning in April 2017.
In Asia, Japan’s quarterly gross domestic product grew slower in the third quarter than in the second and first quarters, mainly due to declines in private non-residential and public investments. In January 2016, the Bank of Japan (BOJ) introduced negative interest rates on excess reserves held by financial institutions with the central bank to boost lending and help achieve its inflation target. In July 2016, Japan’s Prime Minister Shinzo Abe announced a
higher-than-expected fiscal stimulus to revive the economy, followed by an additional monetary stimulus announcement by the BOJ. The BOJ kept its interest rates unchanged toward period-end; however, it overhauled its monetary policy in September to focus on yield-curve control. The bank further announced that it adjusted its Japanese government bond purchases to maintain the 10-year rate for these bonds near 0%.
In emerging markets, economic growth generally moderated during the period. Brazil’s economy continued to be in
recession and the country’s central bank cut its benchmark interest rate in October and November 2016 to spur economic growth. Russia’s economic contraction eased in 2016, following a rebound in oil prices and improved industrial production. The Bank of Russia reduced its key interest rates in June and September of 2016 to revive its economy. China’s economy grew at a stable rate in the first three quarters of 2016 and expanded slightly faster in the fourth quarter, as full-year 2016 growth remained within the government’s targeted range. However, the People’s Bank of China employed monetary easing measures that included cutting the cash reserve requirement ratio for the country’s banks and effectively devaluing the Chinese currency against the U.S. dollar. In India, economic growth marginally increased from July through September 2016 due to slower private consumption growth and increased government spending. Overall, emerging market stocks, as measured by the MSCI Emerging Markets Index, rose during the period.2
Investment Strategy
Our investment philosophy is bottom up, value oriented and long term. In choosing investments, we generally focus on the market price of a company’s securities relative to our evaluation of the company’s potential long-term earnings, asset value and cash flow. Among factors we consider are a company’s historical value measures, including price/earnings ratio, profit margins and liquidation value. We do in-depth research to construct a bargain list from which we buy.
Manager’s Discussion
During the 12-month period, the Fund outperformed its benchmark, the MSCI ACWI ex USA. An overweighting in the energy sector,4 especially in energy equipment and services, contributed significantly to relative results. Notably, our positions in offshore oil and gas production company Subsea 75 (U.K.) and oil and gas company Royal Dutch Shell (U.K.) helped Fund performance. Royal Dutch Shell’s share price rose to the highest level in over a year as oil prices recovered and the firm reported quarterly earnings that exceeded analysts’ estimates, helped by higher production from its recent acquisition of BG Group.
Stock selection in the materials sector also supported relative performance, particularly our investments in metals and mining
4. The energy sector comprises energy equipment and services and oil, gas and consumable fuels in the SOI.
5. Not part of the index.
TEMPLETON FOREIGN VIP FUND
companies Glencore6 (Switzerland), Silver Wheaton (Canada) and Barrick Gold (Canada).7 Stock selection in the information technology (IT) sector also aided relative results, notably our positions in electronic equipment company Kingboard Chemical Holdings5,6 (Hong Kong) and multinational electronics company Samsung Electronics (South Korea).8 Samsung’s share price rose to a record high during the period as the firm recovered from a
high-profile product recall and company management partially capitulated to shareholder demands in a strategic update.
Key individual contributors included banking firms Hana Financial Group (South Korea), KB Financial Group (South Korea) and wireless telecommunications services provider Softbank Group (Japan).
In contrast, an overweighting in the health care sector weighed on relative results.9 Within health care, our positions in pharmaceutical companies Teva Pharmaceutical Industries (Israel) and UCB (Belgium), as well as health care equipment and supplies firm Getinge (Sweden), hurt relative returns. Teva’s shares declined after analysts downgraded earnings forecasts amid concerns about the sustainability of key drug sales, as well as delays to product launches and the completion of a major acquisition.
Stock selection in the financials sector also hampered relative results, notably our positions in financial services company Credit Suisse Group (Switzerland) and commercial bank UniCredit5,6 (Italy), as well as insurance company Aviva (U.K.).10 UniCredit’s shares fell amid a chief executive officer transition and ongoing capital concerns, as well as general investor concerns related to asset quality in Italy.
Key individual detractors included multiline retail firm Marks and Spencer5,6 (U.K.), semiconductor equipment manufacturer
GCL-Poly Energy Holdings (China), and construction and engineering firm Carillion (U.K.).
From a geographic perspective, stock selection in Asia contributed to the Fund’s performance, particularly investments in South Korea, Hong Kong, Japan and India, although positions in China and Taiwan hindered results. Stock selection in Europe, mainly in France, the U.K., the Netherlands and Ireland, aided relative returns, but holdings in Sweden and Germany detracted. Stock selection in North America,
Top 10 Holdings
12/31/16
| | | | |
Company Sector/Industry, Country | | % of Total Net Assets | |
Samsung Electronics Co. Ltd. Technology Hardware, Storage & Peripherals, South Korea | | | 4.0% | |
BNP Paribas SA Banks, France | | | 2.8% | |
BP PLC Oil, Gas & Consumable Fuels, U.K. | | | 2.7% | |
Hana Financial Group Inc. Banks, South Korea | | | 2.6% | |
Royal Dutch Shell PLC Oil, Gas & Consumable Fuels, U.K. | | | 2.5% | |
SoftBank Group Corp. Wireless Telecommunication Services, Japan | | | 2.4% | |
SBM Offshore NV Energy Equipment & Services, Netherlands | | | 2.2% | |
Nissan Motor Co. Ltd. Automobiles, Japan | | | 2.2% | |
KB Financial Group Inc. Banks, South Korea | | | 2.1% | |
Teva Pharmaceutical Industries Ltd. Pharmaceuticals, Israel | | | 2.1% | |
particularly in Canada, also contributed to the Fund’s performance. In contrast, an overweighting in Israel and an underweighting in Brazil hindered the Fund’s relative performance.
Thank you for your participation in Templeton Foreign VIP Fund. We look forward to serving your future investment needs.
6. Not held at period-end.
7. The materials sector comprises chemicals and metals and mining in the SOI.
8. The IT sector comprises Internet software and services; semiconductor and semiconductor equipment; and techonology hardware, storage and peripherals in the SOI.
9. The health care sector comprises health care equipment and supplies, health care providers and services, and pharmaceuticals in the SOI.
10. The financials sector comprises banks, capital markets and insurance in the SOI.
TEMPLETON FOREIGN VIP FUND
The foregoing information reflects our analysis, opinions and portfolio holdings as of December 31, 2016, the end of the reporting period. The way we implement our main investment strategies and the resulting portfolio holdings may change depending on factors such as market and economic conditions. These opinions may not be relied upon as investment advice or an offer for a particular security. The information is not a complete analysis of every aspect of any market, country, industry, security or the Fund. Statements of fact are from sources considered reliable, but the investment manager makes no representation or warranty as to their completeness or accuracy. Although historical performance is no guarantee of future results, these insights may help you understand our investment management philosophy.
TEMPLETON FOREIGN VIP FUND
Class 2 Fund Expenses
As an investor in a variable insurance contract (Contract) that indirectly provides for investment in an underlying mutual fund, you can incur transaction and/or ongoing expenses at both the Fund level and the Contract Level: (1) transaction expenses can include sales charges (loads) on purchases, surrender fees, transfer fees and premium taxes; and (2) ongoing expenses can include management fees, distribution and service (12b-1) fees, contract fees, annual maintenance fees, mortality and expense risk fees and other fees and expenses. All mutual funds and Contracts have some types of ongoing expenses. The table below shows Fund-level ongoing expenses and can help you understand these costs and compare them with those of other mutual funds offered through the Contract. The table assumes a $1,000 investment held for the six months indicated. Please refer to the Fund prospectus for additional information on operating expenses.
Actual Fund Expenses
The table below provides information about the actual account values and actual expenses in the columns under the heading “Actual.” In these columns the Fund’s actual return, which includes the effect of ongoing Fund expenses but does not include the effect of ongoing Contract expenses, is used to calculate the “Ending Account Value.” You can estimate the Fund-level expenses you paid during the period by following these steps (of course, your account value and expenses will differ from those in this illustration):
| | Divide your account value by $1,000
(if your account had an $8,600 value,
then $8,600 ÷ $1,000 = 8.6). |
| | Then multiply the result by the number under the headings “Actual” and “Fund-Level Expenses Paid During Period”
(if Fund-Level Expenses Paid During Period were $ 7.50,
then 8.6 x $7.50 = $64.50). |
In this illustration, the estimated expenses paid this period at the Fund level are $64.50.
Hypothetical Example for Comparison with Other Mutual Funds
Under the heading “Hypothetical” in the table, information is provided about hypothetical account values and hypothetical expenses based on the Fund’s actual expense ratio and an assumed rate of return of 5% per year before expenses, which is not the Fund’s actual return. This information may not be used to estimate the actual ending account balance or expenses you paid for the period, but it can help you compare ongoing costs of investing in the Fund with those of other mutual funds offered through the Contract. To do so, compare this 5% hypothetical example with the 5% hypothetical examples that appear in the shareholder reports of other funds offered through the Contract.
Please note that expenses shown in the table are meant to highlight ongoing costs at the Fund level only and do not reflect any ongoing expenses at the Contract level, or transaction expenses at either the Fund or Contract levels. In addition, while the Fund does not have transaction expenses, if the transaction and ongoing expenses at the Contract level were included, the expenses shown below would be higher. You should consult your Contract prospectus or disclosure document for more information.
| | | | | | | | | | | | | | | | | | | | | | | | |
| | | | Actual
(actual return after expenses) | | | Hypothetical
(5% annual return before expenses) | | | | |
| Share Class | |
| Beginning Account
Value 7/1/16 |
| |
| Ending Account
Value 12/31/16 |
| |
| Fund-Level
Expenses Paid
During Period 7/1/16–12/31/16 |
1,2 | |
| Ending Account
Value 12/31/16 |
| |
| Fund-Level
Expenses Paid
During Period 7/1/16–12/31/16 |
1,2 | |
| Net
Annualized Expense Ratio |
2 |
Class 2 | | | $1,000 | | | | $1,099.40 | | | | $5.44 | | | | $1,019.96 | | | | $5.23 | | | | 1.03% | |
1. Expenses are equal to the annualized expense ratio for the six-month period as indicated above–in the far right column–multiplied by the simple average account value over the period indicated, and then multiplied by 184/366 to reflect the one-half year period.
2. Reflects expenses after fee waivers and expense reimbursements. Does not include any ongoing expenses of the Contract for which the Fund is an investment option or acquired fund fees and expenses.
VIP-1 P1, P2, P4 06/16
SUPPLEMENT DATED JUNE 27, 2016
TO THE PROSPECTUSES DATED MAY 1, 2016
OF
TEMPLETON FOREIGN VIP FUND
TEMPLETON GROWTH VIP FUND
(Series of Franklin Templeton Variable Insurance Products Trust)
Effective June 30, 2016, the prospectus is amended as follows:
I. The benchmark for the Templeton Foreign VIP Fund has changed from the MSCI EAFE Index to the MSCI ACWI EX USA Index. The “Fund Summary – Performance – Average Annual Total Returns” table on page TF-S4 is revised to add the following:
| | | | | | | | | | | | |
| | | 1 Year | | | 5 Years | | | 10 Years | |
MSCI All Country World ex-US Index (index reflects no deduction for fees, expenses or taxes)1 | | | -5.25% | | | | 1.51% | | | | 3.38% | |
1. Performance figures as of December 31, 2015. The MSCI All Country World ex-US Index is replacing the MSCI EAFE Index as the Fund’s benchmark. The investment manager believes the composition of the MSCI All Country World ex-US Index more accurately reflects the Fund’s holdings.
II. The benchmark for the Templeton Growth VIP Fund has changed from the MSCI World Index to the MSCI ACWI Index. The “Fund Summary – Performance – Average Annual Total Returns” table on page TG-S3 is revised to add the following:
| | | | | | | | | | | | |
| | | 1 Year | | | 5 Years | | | 10 Years | |
MSCI All Country World Index (Index reflects no deduction for fees, expenses or taxes)1 | | | -1.84% | | | | 6.66% | | | | 5.31% | |
1. Performance figures as of December 31, 2015. The MSCI All Country World Index is replacing the MSCI World Index as the Fund’s benchmark. The investment manager believes the composition of the MSCI All Country World Index more accurately reflects the Fund’s holdings.
Please keep this supplement with your prospectus for future reference.
VIP3 P1_P2_P4 09/16
SUPPLEMENT DATED SEPTEMBER 28, 2016
TO THE PROSPECTUSES
DATED MAY 1, 2016
OF
FRANKLIN GLOBAL REAL ESTATE VIP FUND
FRANKLIN INCOME VIP FUND
FRANKLIN MUTUAL GLOBAL DISCOVERY VIP FUND
FRANKLIN MUTUAL SHARES VIP FUND
TEMPLETON FOREIGN VIP FUND
TEMPLETON GROWTH VIP FUND
(Series of Franklin Templeton Variable Insurance Products Trust)
The Prospectus is amended as follows:
I. For the Franklin Mutual Global Discovery VIP Fund, Templeton Foreign VIP Fund and Templeton Growth VIP Fund, the following is added to the “Fund Summary – Principal Risks” section:
Regional Focus Because the Fund may invest at least a significant portion of its assets in companies in a specific region, including Europe, the Fund is subject to greater risks of adverse developments in that region and/or the surrounding regions than a fund that is more broadly diversified geographically. Political, social or economic disruptions in the region, even in countries in which the Fund is not invested, may adversely affect the value of securities values held by the Fund. Current political uncertainty surrounding the European Union (EU) and its membership, including the 2016 referendum in which the United Kingdom voted to exit the EU, may increase market volatility. The financial instability of some countries in the EU, including Greece, Italy and Spain, together with the risk of that impacting other more stable countries may increase the economic risk of investing in companies in Europe.
II. For all funds (excluding the Franklin Mutual Global Discovery VIP Fund and Franklin Mutual Shares VIP Fund), the “Fund Details – Principal Risks – Foreign Securities” section is revised to add the following as a second paragraph to the “Regional” sub-section:
The risk of investments in Europe may be heightened due to the 2016 referendum in which the United Kingdom voted to exit the European Union (EU). Political, economic and legal uncertainty may cause increased market volatility. In addition, if one or more countries were to exit the EU or abandon the use of the Euro as a currency, the value of investments associated with those countries or the Euro could decline significantly and unpredictably and it would likely cause additional market disruption globally and introduce new legal and regulatory uncertainties.
III. For the Franklin Mutual Global Discovery VIP Fund and Franklin Mutual Shares VIP Fund, the “Fund Details – Principal Risks – Foreign Securities” section is revised to add the following:
Regional. Adverse conditions in a certain region or country can adversely affect securities of issuers in other countries whose economies appear to be unrelated. To the extent that the Fund invests a significant portion of its assets in a specific geographic region or a particular country, the Fund will generally have more exposure to the specific regional or country economic risks. In the event of economic or political turmoil or a deterioration of diplomatic relations in a region or country where a substantial portion of the Fund’s assets are invested, the Fund may experience substantial illiquidity or reduction in the value of the Fund’s investments.
The risk of investments in Europe may be heightened due to the 2016 referendum in which the United Kingdom voted to exit the European Union (EU). Political, economic and legal uncertainty may cause increased market volatility. In addition, if one or more countries were to exit the EU or abandon the use of the Euro as a currency, the value of investments associated with those countries or the Euro could decline significantly and unpredictably and it would likely cause additional market disruption globally and introduce new legal and regulatory uncertainties.
Please keep this supplement with your prospectus for future reference.
FRANKLIN TEMPLETON VARIABLE INSURANCE PRODUCTS TRUST
Financial Highlights
Templeton Foreign VIP Fund
| | | | | | | | | | | | | | | | | | | | |
| | | Year Ended December 31, | |
| | | 2016 | | | 2015 | | | 2014 | | | 2013 | | | 2012 | |
| Class 1 | | | | | | | | | | | | | | | | | | | | |
Per share operating performance
(for a share outstanding throughout the year) | | | | | | | | | | | | | | | | | | | | |
| | | | | |
Net asset value, beginning of year | | | $13.46 | | | | $15.34 | | | | $17.56 | | | | $14.63 | | | | $12.78 | |
| | | | |
| | | | | |
| Income from investment operationsa: | | | | | | | | | | | | | | | | | | | | |
| | | | | |
Net investment incomeb | | | 0.33 | | | | 0.31 | | | | 0.53 | c | | | 0.34 | | | | 0.38 | |
| | | | | |
Net realized and unrealized gains (losses) | | | 0.62 | | | | (1.16 | ) | | | (2.39 | ) | | | 3.00 | | | | 1.91 | |
| | | | |
Total from investment operations | | | 0.95 | | | | (0.85 | ) | | | (1.86 | ) | | | 3.34 | | | | 2.29 | |
| | | | |
| | | | | |
| Less distributions from: | | | | | | | | | | | | | | | | | | | | |
| | | | | |
Net investment income | | | (0.29 | ) | | | (0.53 | ) | | | (0.36 | ) | | | (0.41 | ) | | | (0.44 | ) |
| | | | | |
Net realized gains | | | (0.23 | ) | | | (0.50 | ) | | | — | | | | — | | | | — | |
| | | | |
Total distributions | | | (0.52 | ) | | | (1.03 | ) | | | (0.36 | ) | | | (0.41 | ) | | | (0.44 | ) |
| | | | |
Redemption fees | | | — | | | | — | | | | — | d | | | — | d | | | — | d |
| | | | |
Net asset value, end of year | | | $13.89 | | | | $13.46 | | | | $15.34 | | | | $17.56 | | | | $14.63 | |
| | | | |
| | | | | |
Total returne | | | 7.49% | | | | (6.31)% | | | | (10.89)% | | | | 23.27% | | | | 18.60% | |
| | | | | |
| Ratios to average net assets | | | | | | | | | | | | | | | | | | | | |
| | | | | |
Expenses before waiver and payments by affiliates | | | 0.80% | | | | 0.78% | | | | 0.77% | | | | 0.78% | | | | 0.79% | |
| | | | | |
Expenses net of waiver and payments by affiliates | | | 0.78% | | | | 0.78% | f | | | 0.77% | f | | | 0.78% | | | | 0.79% | |
| | | | | |
| Net investment income | | | 2.38% | | | | 2.05% | | | | 3.11% | c | | | 2.16% | | | | 2.84% | |
| | | | | |
Supplemental data | | | | | | | | | | | | | | | | | | | | |
| | | | | |
Net assets, end of year (000’s) | | | $133,218 | | | | $214,172 | | | | $248,355 | | | | $298,468 | | | | $265,924 | |
| | | | | |
Portfolio turnover rate | | | 20.93% | | | | 15.15% | | | | 25.71% | | | | 23.61% | | | | 12.53% | |
aThe amount shown for a share outstanding throughout the period may not correlate with the Statement of Operations for the period due to the timing of sales and repurchases of the Fund’s shares in relation to income earned and/or fluctuating fair value of the investments of the Fund.
bBased on average daily shares outstanding.
cNet investment income per share includes approximately $0.16 per share related to income received in the form of special dividends in connection with certain Fund holdings. Excluding these amounts, the ratio of net investment income to average net assets would have been 2.13%.
dAmount rounds to less than $0.01 per share.
eTotal return does not include fees, charges or expenses imposed by the variable annuity and life insurance contracts for which Franklin Templeton Variable Insurance Products Trust serves as an underlying investment vehicle.
fBenefit of waiver and payments by affiliates rounds to less than 0.01%.
| | | | | | |
| | | The accompanying notes are an integral part of these financial statements. | Annual Report | | | TF-9 | |
FRANKLIN TEMPLETON VARIABLE INSURANCE PRODUCTS TRUST
FINANCIAL HIGHLIGHTS
Templeton Foreign VIP Fund (continued)
| | | | | | | | | | | | | | | | | | | | |
| | | Year Ended December 31, | |
| | | 2016 | | | 2015 | | | 2014 | | | 2013 | | | 2012 | |
| Class 2 | | | | | | | | | | | | | | | | | | | | |
Per share operating performance
(for a share outstanding throughout the year) | | | | | | | | | | | | | | | | | | | | |
| | | | | |
Net asset value, beginning of year | | | $13.20 | | | | $15.05 | | | | $17.24 | | | | $14.37 | | | | $12.56 | |
| | | | |
| | | | | |
| Income from investment operationsa: | | | | | | | | | | | | | | | | | | | | |
| | | | | |
Net investment incomeb | | | 0.28 | | | | 0.27 | | | | 0.48 | c | | | 0.30 | | | | 0.34 | |
| | | | | |
Net realized and unrealized gains (losses) | | | 0.62 | | | | (1.13 | ) | | | (2.35 | ) | | | 2.94 | | | | 1.87 | |
| | | | |
Total from investment operations | | | 0.90 | | | | (0.86 | ) | | | (1.87 | ) | | | 3.24 | | | | 2.21 | |
| | | | |
| | | | | |
| Less distributions from: | | | | | | | | | | | | | | | | | | | | |
| | | | | |
Net investment income | | | (0.26 | ) | | | (0.49 | ) | | | (0.32 | ) | | | (0.37 | ) | | | (0.40 | ) |
| | | | | |
Net realized gains | | | (0.23 | ) | | | (0.50 | ) | | | — | | | | — | | | | — | |
| | | | |
Total distributions | | | (0.49 | ) | | | (0.99 | ) | | | (0.32 | ) | | | (0.37 | ) | | | (0.40 | ) |
| | | | |
Redemption fees | | | — | | | | — | | | | — | d | | | — | d | | | — | d |
| | | | |
Net asset value, end of year | | | $13.61 | | | | $13.20 | | | | $15.05 | | | | $17.24 | | | | $14.37 | |
| | | | |
| | | | | |
Total returne | | | 7.18% | | | | (6.49)% | | | | (11.13)% | | | | 22.97% | | | | 18.23% | |
| | | | | |
| Ratios to average net assets | | | | | | | | | | | | | | | | | | | | |
| | | | | |
Expenses before waiver and payments by affiliates | | | 1.05% | | | | 1.03% | | | | 1.02% | | | | 1.03% | | | | 1.04% | |
| | | | | |
Expenses net of waiver and payments by affiliates | | | 1.03% | | | | 1.03% | f | | | 1.02% | f | | | 1.03% | | | | 1.04% | |
| | | | | |
Net investment income | | | 2.13% | | | | 1.80% | | | | 2.86% | c | | | 1.91% | | | | 2.59% | |
| | | | | |
| Supplemental data | | | | | | | | | | | | | | | | | | | | |
| | | | | |
Net assets, end of year (000’s) | | | $1,436,518 | | | | $1,456,854 | | | | $1,645,571 | | | | $1,873,586 | | | | $1,744,231 | |
| | | | | |
Portfolio turnover rate | | | 20.93% | | | | 15.15% | | | | 25.71% | | | | 23.61% | | | | 12.53% | |
aThe amount shown for a share outstanding throughout the period may not correlate with the Statement of Operations for the period due to the timing of sales and repurchases of the Fund’s shares in relation to income earned and/or fluctuating fair value of the investments of the Fund.
bBased on average daily shares outstanding.
cNet investment income per share includes approximately $0.16 per share related to income received in the form of special dividends in connection with certain Fund holdings. Excluding these amounts, the ratio of net investment income to average net assets would have been 1.88%.
dAmount rounds to less than $0.01 per share.
eTotal return does not include fees, charges or expenses imposed by the variable annuity and life insurance contracts for which Franklin Templeton Variable Insurance Products Trust serves as an underlying investment vehicle.
fBenefit of waiver and payments by affiliates rounds to less than 0.01%.
| | | | |
| TF-10 | | Annual Report | The accompanying notes are an integral part of these financial statements. | | |
FRANKLIN TEMPLETON VARIABLE INSURANCE PRODUCTS TRUST
FINANCIAL HIGHLIGHTS
Templeton Foreign VIP Fund (continued)
| | | | | | | | | | | | | | | | | | | | |
| | | Year Ended December 31, | |
| | | 2016 | | | 2015 | | | 2014 | | | 2013 | | | 2012 | |
| Class 4 | | | | | | | | | | | | | | | | | | | | |
Per share operating performance
(for a share outstanding throughout the year) | | | | | | | | | | | | | | | | | | | | |
| | | | | |
Net asset value, beginning of year | | | $13.29 | | | | $15.16 | | | | $17.37 | | | | $14.48 | | | | $12.66 | |
| | | | |
| | | | | |
| Income from investment operationsa: | | | | | | | | | | | | | | | | | | | | |
| | | | | |
Net investment incomeb | | | 0.26 | | | | 0.25 | | | | 0.46 | c | | | 0.28 | | | | 0.33 | |
| | | | | |
Net realized and unrealized gains (losses) | | | 0.63 | | | | (1.14 | ) | | | (2.36 | ) | | | 2.97 | | | | 1.89 | |
| | | | |
Total from investment operations | | | 0.89 | | | | (0.89 | ) | | | (1.90 | ) | | | 3.25 | | | | 2.22 | |
| | | | |
| | | | | |
| Less distributions from: | | | | | | | | | | | | | | | | | | | | |
| | | | | |
Net investment income | | | (0.24 | ) | | | (0.48 | ) | | | (0.31 | ) | | | (0.36 | ) | | | (0.40 | ) |
| | | | | |
Net realized gains | | | (0.23 | ) | | | (0.50 | ) | | | — | | | | — | | | | — | |
| | | | |
Total distributions | | | (0.47 | ) | | | (0.98 | ) | | | (0.31 | ) | | | (0.36 | ) | | | (0.40 | ) |
| | | | |
Redemption fees | | | — | | | | — | | | | — | d | | | — | d | | | — | d |
| | | | |
Net asset value, end of year | | | $13.71 | | | | $13.29 | | | | $15.16 | | | | $17.37 | | | | $14.48 | |
| | | | |
| | | | | |
Total returne | | | 7.09% | | | | (6.65)% | | | | (11.22)% | | | | 22.86% | | | | 18.14% | |
| | | | | |
| Ratios to average net assets | | | | | | | | | | | | | | | | | | | | |
| | | | | |
Expenses before waiver and payments by affiliates | | | 1.15% | | | | 1.13% | | | | 1.12% | | | | 1.13% | | | | 1.14% | |
| | | | | |
Expenses net of waiver and payments by affiliates | | | 1.13% | | | | 1.13% | f | | | 1.12% | f | | | 1.13% | | | | 1.14% | |
| | | | | |
Net investment income | | | 2.03% | | | | 1.70% | | | | 2.76% | c | | | 1.81% | | | | 2.49% | |
| | | | | |
| Supplemental data | | | | | | | | | | | | | | | | | | | | |
| | | | | |
Net assets, end of year (000’s) | | | $484,763 | | | | $472,189 | | | | $503,143 | | | | $513,098 | | | | $416,277 | |
| | | | | |
Portfolio turnover rate | | | 20.93% | | | | 15.15% | | | | 25.71% | | | | 23.61% | | | | 12.53% | |
aThe amount shown for a share outstanding throughout the period may not correlate with the Statement of Operations for the period due to the timing of sales and repurchases of the Fund’s shares in relation to income earned and/or fluctuating fair value of the investments of the Fund.
bBased on average daily shares outstanding.
cNet investment income per share includes approximately $0.16 per share related to income received in the form of special dividends in connection with certain Fund holdings. Excluding these amounts, the ratio of net investment income to average net assets would have been 1.78%.
dAmount rounds to less than $0.01 per share.
eTotal return does not include fees, charges or expenses imposed by the variable annuity and life insurance contracts for which Franklin Templeton Variable Insurance Products Trust serves as an underlying investment vehicle.
fBenefit of waiver and payments by affiliates rounds to less than 0.01%.
| | | | | | |
| | | The accompanying notes are an integral part of these financial statements. | Annual Report | | | TF-11 | |
FRANKLIN TEMPLETON VARIABLE INSURANCE PRODUCTS TRUST
Statement of Investments, December 31, 2016
| | | | | | | | | | | | | | |
Templeton Foreign VIP Fund | | | | |
| | | | | Country | | | Shares | | | Value | |
| | | | | | | | | | | | | | |
| | | Common Stocks 95.0% | | | | | | | | | |
| | | Aerospace & Defense 1.2% | | | | | | | | | |
| | BAE Systems PLC | | | United Kingdom | | | | 3,520,780 | | | $ | 25,653,787 | |
| | | | | | | | | | | | | | |
| | Airlines 0.8% | | | | | | | | | | | | |
| | Deutsche Lufthansa AG | | | Germany | | | | 1,235,150 | | | | 15,946,396 | |
| | | | | | | | | | | | | | |
| | Auto Components 3.0% | | | | | | | | | | | | |
| | Cie Generale des Etablissements Michelin, B | | | France | | | | 190,160 | | | | 21,149,127 | |
| | Hyundai Mobis Co. Ltd. | | | South Korea | | | | 121,198 | | | | 26,503,325 | |
| | Sumitomo Rubber Industries Ltd. | | | Japan | | | | 921,700 | | | | 14,634,289 | |
| | | | | | | | | | | | | | |
| | | | | | | | | | | | | 62,286,741 | |
| | | | | | | | | | | | | | |
| | Automobiles 4.2% | | | | | | | | | | | | |
| | Hero Motocorp Ltd. | | | India | | | | 199,386 | | | | 8,930,398 | |
| | Hyundai Motor Co. | | | South Korea | | | | 140,566 | | | | 16,999,421 | |
| | Nissan Motor Co. Ltd. | | | Japan | | | | 4,424,800 | | | | 44,495,936 | |
| | Toyota Motor Corp., ADR | | | Japan | | | | 136,317 | | | | 15,976,352 | |
| | | | | | | | | | | | | | |
| | | | | | | | | | | | | 86,402,107 | |
| | | | | | | | | | | | | | |
| | Banks 15.6% | | | | | | | | | | | | |
| | Bangkok Bank PCL, fgn | | | Thailand | | | | 3,563,500 | | | | 16,053,145 | |
| | Barclays PLC | | | United Kingdom | | | | 11,120,080 | | | | 30,608,787 | |
| | BNP Paribas SA | | | France | | | | 918,660 | | | | 58,528,478 | |
| | Hana Financial Group Inc. | | | South Korea | | | | 2,065,805 | | | | 53,473,712 | |
| | HSBC Holdings PLC | | | United Kingdom | | | | 4,928,400 | | | | 39,563,209 | |
| | ING Groep NV | | | Netherlands | | | | 1,678,194 | | | | 23,608,688 | |
| | KB Financial Group Inc., ADR | | | South Korea | | | | 1,216,406 | | | | 42,926,968 | |
| a | | Standard Chartered PLC | | | United Kingdom | | | | 4,009,011 | | | | 32,771,889 | |
| | United Overseas Bank Ltd. | | | Singapore | | | | 1,574,400 | | | | 22,182,306 | |
| | | | | | | | | | | | | | |
| | | | | | | | | | | | | 319,717,182 | |
| | | | | | | | | | | | | | |
| | Beverages 1.5% | | | | | | | | | | | | |
| | Kirin Holdings Co. Ltd. | | | Japan | | | | 918,400 | | | | 14,939,370 | |
| | Suntory Beverage & Food Ltd. | | | Japan | | | | 386,100 | | | | 16,035,891 | |
| | | | | | | | | | | | | | |
| | | | | | | | | | | | | 30,975,261 | |
| | | | | | | | | | | | | | |
| | Capital Markets 2.3% | | | | | | | | | | | | |
| | Credit Suisse Group AG | | | Switzerland | | | | 1,208,852 | | | | 17,342,231 | |
| | GAM Holding AG | | | Switzerland | | | | 654,050 | | | | 7,578,348 | |
| | UBS Group AG | | | Switzerland | | | | 1,372,270 | | | | 21,492,249 | |
| | | | | | | | | | | | | | |
| | | | | | | | | | | | | 46,412,828 | |
| | | | | | | | | | | | | | |
| | Chemicals 1.5% | | | | | | | | | | | | |
| | Johnson Matthey PLC | | | United Kingdom | | | | 420,711 | | | | 16,490,807 | |
| | Yara International ASA | | | Norway | | | | 341,290 | | | | 13,431,948 | |
| | | | | | | | | | | | | | |
| | | | | | | | | | | | | 29,922,755 | |
| | | | | | | | | | | | | | |
| | Construction & Engineering 1.5% | | | | | | | | | | | | |
| b | | Carillion PLC | | | United Kingdom | | | | 3,835,100 | | | | 11,153,997 | |
| | Sinopec Engineering Group Co. Ltd. | | | China | | | | 22,639,500 | | | | 18,889,363 | |
| | | | | | | | | | | | | | |
| | | | | | | | | | | | | 30,043,360 | |
| | | | | | | | | | | | | | |
| | Diversified Telecommunication Services 2.0% | | | | | | | | | | | | |
| | China Telecom Corp. Ltd., H | | | China | | | | 53,618,357 | | | | 24,753,849 | |
| | Telenor ASA | | | Norway | | | | 1,138,704 | | | | 17,003,451 | |
| | | | | | | | | | | | | | |
| | | | | | | | | | | | | 41,757,300 | |
| | | | | | | | | | | | | | |
| | Electrical Equipment 1.3% | | | | | | | | | | | | |
| | ABB Ltd. | | | Switzerland | | | | 1,255,890 | | | | 26,489,117 | |
| | | | | | | | | | | | | | |
FRANKLIN TEMPLETON VARIABLE INSURANCE PRODUCTS TRUST
STATEMENT OF INVESTMENTS
Templeton Foreign VIP Fund (continued)
| | | | | | | | | | | | | | |
| | | | | Country | | | Shares | | | Value | |
| | | | | | | | | | | | | | |
| | | Common Stocks (continued) | | | | | | | | | |
| | | Energy Equipment & Services 6.5% | | | | | | | | | |
| | Ensign Energy Services Inc. | | | Canada | | | | 2,009,500 | | | $ | 14,037,169 | |
| | Petrofac Ltd. | | | United Kingdom | | | | 2,312,160 | | | | 24,751,157 | |
| a | | Precision Drilling Corp. | | | Canada | | | | 4,296,000 | | | | 23,418,767 | |
| | SBM Offshore NV | | | Netherlands | | | | 2,879,260 | | | | 45,185,846 | |
| a | | Subsea 7 SA | | | United Kingdom | | | | 137,940 | | | | 1,745,207 | |
| | Tenaris SA | | | Italy | | | | 1,320,175 | | | | 23,572,825 | |
| | | | | | | | | | | | | | |
| | | | | | | | | | | | | 132,710,971 | |
| | | | | | | | | | | | | | |
| | Health Care Equipment & Supplies 0.6% | | | | | | | | | | | | |
| | Getinge AB, B | | | Sweden | | | | 737,270 | | | | 11,824,875 | |
| | | | | | | | | | | | | | |
| | Health Care Providers & Services 1.8% | | | | | | | | | | | | |
| | Shanghai Pharmaceuticals Holding Co. Ltd., H | | | China | | | | 6,579,500 | | | | 15,085,887 | |
| | Sinopharm Group Co. Ltd. | | | China | | | | 5,173,200 | | | | 21,314,558 | |
| | | | | | | | | | | | | | |
| | | | | | | | | | | | | 36,400,445 | |
| | | | | | | | | | | | | | |
| | Household Durables 0.4% | | | | | | | | | | | | |
| | Haier Electronics Group Co. Ltd. | | | China | | | | 5,826,000 | | | | 9,165,929 | |
| | | | | | | | | | | | | | |
| | Industrial Conglomerates 2.1% | | | | | | | | | | | | |
| | CK Hutchison Holdings Ltd. | | | Hong Kong | | | | 1,309,500 | | | | 14,843,645 | |
| | Siemens AG | | | Germany | | | | 238,364 | | | | 29,294,210 | |
| | | | | | | | | | | | | | |
| | | | | | | | | | | | | 44,137,855 | |
| | | | | | | | | | | | | | |
| | Insurance 6.8% | | | | | | | | | | | | |
| | Aegon NV | | | Netherlands | | | | 6,240,240 | | | | 34,326,945 | |
| | Aviva PLC | | | United Kingdom | | | | 3,272,090 | | | | 19,605,443 | |
| | AXA SA | | | France | | | | 1,317,458 | | | | 33,248,709 | |
| | China Life Insurance Co. Ltd., H | | | China | | | | 6,004,000 | | | | 15,640,054 | |
| | Chubb Ltd. | | | United States | | | | 190,979 | | | | 25,232,145 | |
| | Swiss Re AG | | | Switzerland | | | | 133,120 | | | | 12,613,983 | |
| | | | | | | | | | | | | | |
| | | | | | | | | | | | | 140,667,279 | |
| | | | | | | | | | | | | | |
| | Internet Software & Services 1.8% | | | | | | | | | | | | |
| a | | Baidu Inc., ADR | | | China | | | | 229,120 | | | | 37,669,619 | |
| | | | | | | | | | | | | | |
| | | Life Sciences Tools & Services 1.8% | | | | | | | | | |
| a | | MorphoSys AG | | | Germany | | | | 261,670 | | | | 13,422,297 | |
| a | | QIAGEN NV | | | Netherlands | | | | 829,071 | | | | 23,274,257 | |
| | | | | | | | | | | | | | |
| | | | | | | | | | | | | 36,696,554 | |
| | | | | | | | | | | | | | |
| | Metals & Mining 3.0% | | | | | | | | | | | | |
| | Barrick Gold Corp. | | | Canada | | | | 1,328,790 | | | | 21,234,064 | |
| | Silver Wheaton Corp. | | | Canada | | | | 2,037,100 | | | | 39,352,379 | |
| | | | | | | | | | | | | | |
| | | | | | | | | | | | | 60,586,443 | |
| | | | | | | | | | | | | | |
| | | Multi-Utilities 0.9% | | | | | | | | | |
| a | | innogy SE | | | Germany | | | | 526,260 | | | | 18,278,652 | |
| | | | | | | | | | | | | | |
| | | Oil, Gas & Consumable Fuels 11.8% | | | | | | | | | |
| | BP PLC | | | United Kingdom | | | | 8,823,445 | | | | 55,389,247 | |
| | Cenovus Energy Inc. | | | Canada | | | | 1,518,400 | | | | 22,954,662 | |
| | Eni SpA | | | Italy | | | | 1,817,847 | | | | 29,590,065 | |
| | Kunlun Energy Co. Ltd. | | | China | | | | 9,276,000 | | | | 6,938,010 | |
| | PTT Exploration and Production PCL, fgn | | | Thailand | | | | 4,120,100 | | | | 11,061,635 | |
| | Royal Dutch Shell PLC, A | | | United Kingdom | | | | 16,803 | | | | 464,170 | |
| | Royal Dutch Shell PLC, B | | | United Kingdom | | | | 1,720,573 | | | | 49,892,747 | |
| | Suncor Energy Inc. | | | Canada | | | | 922,000 | | | | 30,142,836 | |
FRANKLIN TEMPLETON VARIABLE INSURANCE PRODUCTS TRUST
STATEMENT OF INVESTMENTS
Templeton Foreign VIP Fund (continued)
| | | | | | | | | | | | | | |
| | | | | Country | | | Shares | | | Value | |
| | | | | | | | | | | | | | |
| | | Common Stocks (continued) | | | | | | | | | |
| | | Oil, Gas & Consumable Fuels (continued) | | | | | | | | | |
| | Total SA, B | | | France | | | | 695,596 | | | $ | 35,658,464 | |
| | | | | | | | | | | | | | |
| | | | | | | | | | | | | 242,091,836 | |
| | | | | | | | | | | | | | |
| | Pharmaceuticals 10.2% | | | | | | | | | | | | |
| | Bayer AG | | | Germany | | | | 216,810 | | | | 22,614,276 | |
| | GlaxoSmithKline PLC | | | United Kingdom | | | | 1,043,675 | | | | 20,081,871 | |
| | Merck KGaA | | | Germany | | | | 238,710 | | | | 24,903,570 | |
| | Novartis AG | | | Switzerland | | | | 166,850 | | | | 12,140,205 | |
| | Roche Holding AG | | | Switzerland | | | | 163,230 | | | | 37,281,322 | |
| | Sanofi | | | France | | | | 455,845 | | | | 36,884,323 | |
| | Teva Pharmaceutical Industries Ltd., ADR | | | Israel | | | | 1,178,668 | | | | 42,726,715 | |
| | UCB SA | | | Belgium | | | | 211,980 | | | | 13,585,692 | |
| | | | | | | | | | | | | | |
| | | | | | | | | | | | | 210,217,974 | |
| | | | | | | | | | | | | | |
| | Semiconductors & Semiconductor Equipment 1.5% | | | | | | | | | | | | |
| a,b | | GCL-Poly Energy Holdings Ltd. | | | China | | | | 141,417,000 | | | | 16,960,192 | |
| | Infineon Technologies AG | | | Germany | | | | 764,445 | | | | 13,279,802 | |
| | | | | | | | | | | | | | |
| | | | | | | | | | | | | 30,239,994 | |
| | | | | | | | | | | | | | |
| | Specialty Retail 0.5% | | | | | | | | | | | | |
| | Kingfisher PLC | | | United Kingdom | | | | 2,345,266 | | | | 10,120,223 | |
| | | | | | | | | | | | | | |
| | Technology Hardware, Storage & Peripherals 5.8% | | | | | | | | | | | | |
| | Catcher Technology Co. Ltd. | | | Taiwan | | | | 2,280,000 | | | | 15,736,493 | |
| | Konica Minolta Inc. | | | Japan | | | | 883,700 | | | | 8,776,900 | |
| | Quanta Computer Inc. | | | Taiwan | | | | 7,299,000 | | | | 13,561,438 | |
| | Samsung Electronics Co. Ltd. | | | South Korea | | | | 54,612 | | | | 81,516,187 | |
| | | | | | | | | | | | | | |
| | | | | | | | | | | | | 119,591,018 | |
| | | | | | | | | | | | | | |
| | Trading Companies & Distributors 0.9% | | | | | | | | | | | | |
| | Posco Daewoo Corp. | | | South Korea | | | | 869,005 | | | | 19,435,111 | |
| | | | | | | | | | | | | | |
| | Wireless Telecommunication Services 3.7% | | | | | | | | | | | | |
| | China Mobile Ltd. | | | China | | | | 1,370,500 | | | | 14,527,706 | |
| | SoftBank Group Corp. | | | Japan | | | | 731,300 | | | | 48,578,164 | |
| | Vodafone Group PLC, ADR | | | United Kingdom | | | | 562,353 | | | | 13,738,284 | |
| | | | | | | | | | | | | | |
| | | | | | | | | | | | | 76,844,154 | |
| | | | | | | | | | | | | | |
| | | | |
| | Total Common Stocks (Cost $1,848,252,809) | | | | | | | | | | | 1,952,285,766 | |
| | | | | | | | | | | | | | |
| | Short Term Investments 5.4% | | | | | | | | | | | | |
| | | | |
| | Money Market Funds (Cost $98,211,700) 4.8% | | | | | | | | | | | | |
| c,d | | Institutional Fiduciary Trust Money Market Portfolio, 0.09% | | | United States | | | | 98,211,700 | | | | 98,211,700 | |
| | | | | | | | | | | | | | |
| | | | |
| e | | Investments from Cash Collateral Received for Loaned Securities (Cost $12,924,082) 0.6% | | | | | | | | | | | | |
| | Money Market Funds 0.6% | | | | | | | | | | | | |
| c,d | | Institutional Fiduciary Trust Money Market Portfolio, 0.09% | | | United States | | | | 12,924,082 | | | | 12,924,082 | |
| | | | | | | | | | | | | | |
| | Total Investments (Cost $1,959,388,591) 100.4% | | | | | | | | | | | 2,063,421,548 | |
| | Other Assets, less Liabilities (0.4)% | | | | | | | | | | | (8,922,317 | ) |
| | | | | | | | | | | | | | |
| | Net Assets 100.0% | | | | | | | | | | $ | 2,054,499,231 | |
| | | | | | | | | | | | | | |
FRANKLIN TEMPLETON VARIABLE INSURANCE PRODUCTS TRUST
STATEMENT OF INVESTMENTS
Templeton Foreign VIP Fund (continued)
See Abbreviations on page TF- 26.
aNon-income producing.
bA portion or all of the security is on loan at December 31, 2016. See Note 1(c).
cSee Note 3(e) regarding investments in affiliated management investment companies
dThe rate shown is the annualized seven-day yield at period end.
eSee Note 1(c) regarding securities on loan.
| | | | | | |
| | | The accompanying notes are an integral part of these financial statements. | Annual Report | | | TF-15 | |
FRANKLIN TEMPLETON VARIABLE INSURANCE PRODUCTS TRUST
Financial Statements
Statement of Assets and Liabilities
December 31, 2016
| | | | |
| | | Templeton
Foreign VIP Fund | |
Assets: | | | | |
Investments in securities: | | | | |
Cost - Unaffiliated issuers | | $ | 1,848,252,809 | |
Cost - Non-controlled affiliates (Note 3e) | | | 111,135,782 | |
| | | | |
Total cost of investments | | $ | 1,959,388,591 | |
| | | | |
Value - Unaffiliated issuers | | $ | 1,952,285,766 | |
Value - Non-controlled affiliates (Note 3e) | | | 111,135,782 | |
| | | | |
Total value of investments (includes securities loaned in the amount of $11,556,951) | | | 2,063,421,548 | |
Foreign currency, at value (cost $23,651) | | | 23,651 | |
Receivables: | | | | |
Investment securities sold | | | 577,450 | |
Capital shares sold | | | 232,993 | |
Dividends | | | 3,978,667 | |
European Union tax reclaims | | | 2,616,879 | |
Other assets | | | 170 | |
| | | | |
Total assets | | | 2,070,851,358 | |
| | | | |
Liabilities: | | | | |
Payables: | | | | |
Investment securities purchased | | | 84,734 | |
Capital shares redeemed | | | 746,932 | |
Management fees | | | 1,283,677 | |
Distribution fees | | | 874,723 | |
Payable upon return of securities loaned | | | 12,924,082 | |
Accrued expenses and other liabilities | | | 437,979 | |
| | | | |
Total liabilities | | | 16,352,127 | |
| | | | |
Net assets, at value | | $ | 2,054,499,231 | |
| | | | |
Net assets consist of: | | | | |
Paid-in capital | | $ | 1,979,824,450 | |
Undistributed net investment income | | | 44,764,301 | |
Net unrealized appreciation (depreciation) | | | 103,805,149 | |
Accumulated net realized gain (loss) | | | (73,894,669 | ) |
| | | | |
Net assets, at value | | $ | 2,054,499,231 | |
| | | | |
| |
| Class 1: | | | | |
Net assets, at value | | $ | 133,217,894 | |
| | | | |
Shares outstanding. | | | 9,593,674 | |
| | | | |
Net asset value and maximum offering price per share | | $ | 13.89 | |
| | | | |
| |
| Class 2: | | | | |
Net assets, at value | | $ | 1,436,518,447 | |
| | | | |
Shares outstanding | | | 105,562,018 | |
| | | | |
Net asset value and maximum offering price per share | | $ | 13.61 | |
| | | | |
| |
| Class 4: | | | | |
Net assets, at value | | $ | 484,762,890 | |
| | | | |
Shares outstanding | | | 35,358,829 | |
| | | | |
Net asset value and maximum offering price per share | | $ | 13.71 | |
| | | | |
| | | | |
| TF-16 | | Annual Report | The accompanying notes are an integral part of these financial statements. | | |
FRANKLIN TEMPLETON VARIABLE INSURANCE PRODUCTS TRUST
FINANCIAL STATEMENTS
Statement of Operations
for the year ended December 31, 2016
| | | | |
| | | Templeton
Foreign
VIP Fund | |
Investment income: | | | | |
Dividends: (net of foreign taxes of $6,584,939) | | | | |
Unaffiliated issuers | | $ | 63,329,253 | |
Non-controlled affiliates (Note 3e) | | | 3,987 | |
Interest | | | 82,846 | |
Income from securities loaned (net of fees and rebates) | | | 1,045,650 | |
Other income (Note 1d) | | | 1,711,255 | |
| | | | |
Total investment income | | | 66,172,991 | |
| | | | |
Expenses: | | | | |
Management fees (Note 3a) | | | 15,827,068 | |
Distribution fees: (Note 3c) | | | | |
Class 2 | | | 3,585,761 | |
Class 4 | | | 1,642,637 | |
Custodian fees (Note 4) | | | 261,824 | |
Reports to shareholders | | | 335,885 | |
Professional fees | | | 126,051 | |
Trustees’ fees and expenses | | | 9,911 | |
Other | | | 127,801 | |
| | | | |
Total expenses | | | 21,916,938 | |
Expenses waived/paid by affiliates (Note 3e) | | | (374,909 | ) |
| | | | |
Net expenses | | | 21,542,029 | |
| | | | |
Net investment income | | | 44,630,962 | |
| | | | |
Realized and unrealized gains (losses): | | | | |
Net realized gain (loss) from: | | | | |
Investments | | | (69,234,118 | ) |
Foreign currency transactions | | | (662,839 | ) |
| | | | |
Net realized gain (loss) | | | (69,896,957 | ) |
| | | | |
Net change in unrealized appreciation (depreciation) on: | | | | |
Investments. | | | 170,495,015 | |
Translation of other assets and liabilities denominated in foreign currencies | | | (94,760 | ) |
Change in deferred taxes on unrealized appreciation | | | 88,494 | |
| | | | |
Net change in unrealized appreciation (depreciation) | | | 170,488,749 | |
| | | | |
Net realized and unrealized gain (loss) | | | 100,591,792 | |
| | | | |
Net increase (decrease) in net assets resulting from operations | | $ | 145,222,754 | |
| | | | |
| | | | | | |
| | | The accompanying notes are an integral part of these financial statements. | Annual Report | | | TF-17 | |
FRANKLIN TEMPLETON VARIABLE INSURANCE PRODUCTS TRUST
FINANCIAL STATEMENTS
Statements of Changes in Net Assets
| | | | | | | | |
| | | Templeton Foreign VIP Fund | |
| | | Year Ended December 31, | |
| | | 2016 | | | 2015 | |
Increase (decrease) in net assets: | | | | | | | | |
Operations: | | | | | | | | |
Net investment income | | $ | 44,630,962 | | | $ | 42,572,642 | |
Net realized gain (loss) | | | (69,896,957 | ) | | | 36,800,340 | |
Net change in unrealized appreciation (depreciation) | | | 170,488,749 | | | | (219,790,040 | ) |
| | | | |
Net increase (decrease) in net assets resulting from operations | | | 145,222,754 | | | | (140,417,058 | ) |
| | | | |
Distributions to shareholders from: | | | | | | | | |
Net investment income: | | | | | | | | |
Class 1 | | | (4,469,747 | ) | | | (8,346,614 | ) |
Class 2 | | | (28,417,976 | ) | | | (51,791,116 | ) |
Class 4 | | | (8,605,853 | ) | | | (15,312,865 | ) |
Net realized gains: | | | | | | | | |
Class 1 | | | (3,504,221 | ) | | | (7,826,999 | ) |
Class 2 | | | (25,453,391 | ) | | | (52,898,439 | ) |
Class 4 | | | (8,118,929 | ) | | | (16,028,658 | ) |
| | | | |
Total distributions to shareholders | | | (78,570,117 | ) | | | (152,204,691 | ) |
| | | | |
Capital share transactions: (Note 2) | | | | | | | | |
Class 1 | | | (85,110,427 | ) | | | (4,016,954 | ) |
Class 2 | | | (66,083,288 | ) | | | 11,936,472 | |
Class 4 | | | (4,174,320 | ) | | | 30,848,243 | |
| | | | |
Total capital share transactions | | | (155,368,035 | ) | | | 38,767,761 | |
| | | | |
Net increase (decrease) in net assets | | | (88,715,398 | ) | | | (253,853,988 | ) |
Net assets: | | | | | | | | |
Beginning of year | | | 2,143,214,629 | | | | 2,397,068,617 | |
| | | | |
End of year | | $ | 2,054,499,231 | | | $ | 2,143,214,629 | |
| | | | |
Undistributed net investment income included in net assets: | | | | | | | | |
End of year | | $ | 44,764,301 | | | $ | 42,293,744 | |
| | | | |
| | | | |
| TF-18 | | Annual Report | The accompanying notes are an integral part of these financial statements. | | |
FRANKLIN TEMPLETON VARIABLE INSURANCE PRODUCTS TRUST
Notes to Financial Statements
Templeton Foreign VIP Fund
1. Organization and Significant Accounting Policies
Franklin Templeton Variable Insurance Products Trust (Trust) is registered under the Investment Company Act of 1940 (1940 Act) as an open-end management investment company, consisting of nineteen separate funds and applies the specialized accounting and reporting guidance in U.S. Generally Accepted Accounting Principles (U.S. GAAP). Templeton Foreign VIP Fund (Fund) is included in this report. The financial statements of the remaining funds in the Trust are presented separately. Shares of the Fund are generally sold only to insurance company separate accounts to fund the benefits of variable life insurance policies or variable annuity contracts. The Fund offers three classes of shares: Class 1, Class 2 and Class 4. Each class of shares differs by its distribution fees, voting rights on matters affecting a single class and its exchange privilege.
The following summarizes the Fund’s significant accounting policies.
a. Financial Instrument Valuation
The Fund’s investments in financial instruments are carried at fair value daily. Fair value is the price that would be received to sell an asset or paid to transfer a liability in an orderly transaction between market participants on the measurement date. The Fund calculates the net asset value (NAV) per share as of 4 p.m. Eastern time each day the New York Stock Exchange (NYSE) is open for trading. Under compliance policies and procedures approved by the Trust’s Board of Trustees (the Board), the Fund’s administrator has responsibility for oversight of valuation, including leading the cross-functional Valuation Committee (VC). The VC provides administration and oversight of the Fund’s valuation policies and procedures, which are approved annually by the Board. Among other things, these procedures allow the Fund to utilize independent pricing services, quotations from securities and financial instrument dealers, and other market sources to determine fair value.
Equity securities listed on an exchange or on the NASDAQ National Market System are valued at the last quoted sale price or the official closing price of the day, respectively. Foreign equity securities are valued as of the close of trading on the foreign stock exchange on which the security is primarily traded, or as of 4 p.m. Eastern time. The value is then converted into its U.S. dollar equivalent at the foreign exchange rate in effect at 4 p.m. Eastern time on the day that the value of the
security is determined. Over-the-counter (OTC) securities are valued within the range of the most recent quoted bid and ask prices. Securities that trade in multiple markets or on multiple exchanges are valued according to the broadest and most representative market. Certain equity securities are valued based upon fundamental characteristics or relationships to similar securities.
Investments in open-end mutual funds are valued at the closing NAV.
The Fund has procedures to determine the fair value of financial instruments for which market prices are not reliable or readily available. Under these procedures, the VC convenes on a regular basis to review such financial instruments and considers a number of factors, including significant unobservable valuation inputs, when arriving at fair value. The VC primarily employs a market-based approach which may use related or comparable assets or liabilities, recent transactions, market multiples, book values, and other relevant information for the investment to determine the fair value of the investment. An income-based valuation approach may also be used in which the anticipated future cash flows of the investment are discounted to calculate fair value. Discounts may also be applied due to the nature or duration of any restrictions on the disposition of the investments. Due to the inherent uncertainty of valuations of such investments, the fair values may differ significantly from the values that would have been used had an active market existed. The VC employs various methods for calibrating these valuation approaches including a regular review of key inputs and assumptions, transactional back-testing or disposition analysis, and reviews of any related market activity.
Trading in securities on foreign securities stock exchanges and OTC markets may be completed before 4 p.m. Eastern time. In addition, trading in certain foreign markets may not take place on every Fund’s business day. Occasionally, events occur between the time at which trading in a foreign security is completed and 4 p.m. Eastern time that might call into question the reliability of the value of a portfolio security held by the Fund. As a result, differences may arise between the value of the Fund’s portfolio securities as determined at the foreign market close and the latest indications of value at 4 p.m. Eastern time. In order to minimize the potential for these differences, the VC monitors price movements following the close of trading in foreign stock markets through a series of country specific market proxies (such as baskets of American Depositary Receipts, futures contracts and exchange traded
FRANKLIN TEMPLETON VARIABLE INSURANCE PRODUCTS TRUST
NOTES TO FINANCIAL STATEMENTS
Templeton Foreign VIP Fund (continued)
1. Organization and Significant Accounting Policies (continued)
a. Financial Instrument Valuation (continued)
funds). These price movements are measured against established trigger thresholds for each specific market proxy to assist in determining if an event has occurred that may call into question the reliability of the values of the foreign securities held by the Fund. If such an event occurs, the securities may be valued using fair value procedures, which may include the use of independent pricing services.
When the last day of the reporting period is a non-business day, certain foreign markets may be open on those days that the Fund’s NAV is not calculated, which could result in differences between the value of the Fund’s portfolio securities on the last business day and the last calendar day of the reporting period. Any significant security valuation changes due to an open foreign market are adjusted and reflected by the Fund for financial reporting purposes.
b. Foreign Currency Translation
Portfolio securities and other assets and liabilities denominated in foreign currencies are translated into U.S. dollars based on the exchange rate of such currencies against U.S. dollars on the date of valuation. The Fund may enter into foreign currency exchange contracts to facilitate transactions denominated in a foreign currency. Purchases and sales of securities, income and expense items denominated in foreign currencies are translated into U.S. dollars at the exchange rate in effect on the transaction date. Portfolio securities and assets and liabilities denominated in foreign currencies contain risks that those currencies will decline in value relative to the U.S. dollar. Occasionally, events may impact the availability or reliability of foreign exchange rates used to convert the U.S. dollar equivalent value. If such an event occurs, the foreign exchange rate will be valued at fair value using procedures established and approved by the Board.
The Fund does not separately report the effect of changes in foreign exchange rates from changes in market prices on securities held. Such changes are included in net realized and unrealized gain or loss from investments in the Statement of Operations.
Realized foreign exchange gains or losses arise from sales of foreign currencies, currency gains or losses realized between the trade and settlement dates on securities transactions and the difference between the recorded amounts of dividends, interest,
and foreign withholding taxes and the U.S. dollar equivalent of the amounts actually received or paid. Net unrealized foreign exchange gains and losses arise from changes in foreign exchange rates on foreign denominated assets and liabilities other than investments in securities held at the end of the reporting period.
c. Securities Lending
The Fund participates in an agency based securities lending program to earn additional income. The Fund receives cash collateral against the loaned securities in an amount equal to at least 102% of the fair value of the loaned securities. Collateral is maintained over the life of the loan in an amount not less than 100% of the fair value of loaned securities, as determined at the close of Fund business each day; any additional collateral required due to changes in security values is delivered to the Fund on the next business day. The collateral is deposited into a joint cash account with other funds and is used to invest in a money market fund managed by Franklin Advisers, Inc., an affiliate of the Fund. The Fund may receive income from the investment of cash collateral, in addition to lending fees and rebates paid by the borrower. Income from securities loaned, net of fees paid to the securities lending agent and/or third-party vendor, is reported separately in the Statement of Operations. The Fund bears the market risk with respect to the collateral investment, securities loaned, and the risk that the agent may default on its obligations to the Fund. If the borrower defaults on its obligation to return the securities loaned, the Fund has the right to repurchase the securities in the open market using the collateral received. The securities lending agent has agreed to indemnify the Fund in the event of default by a third party borrower.
d. Income and Deferred Taxes
It is the Fund’s policy to qualify as a regulated investment company under the Internal Revenue Code. The Fund intends to distribute to shareholders substantially all of its taxable income and net realized gains to relieve it from federal income and if applicable, excise taxes. As a result, no provision for U.S. federal income taxes is required.
The Fund may be subject to foreign taxation related to income received, capital gains on the sale of securities and certain foreign currency transactions in the foreign jurisdictions in which it invests. Foreign taxes, if any, are recorded based on the tax regulations and rates that exist in the foreign markets in which the Fund invests. When a capital gain tax is determined
FRANKLIN TEMPLETON VARIABLE INSURANCE PRODUCTS TRUST
NOTES TO FINANCIAL STATEMENTS
Templeton Foreign VIP Fund (continued)
to apply, the Fund records an estimated deferred tax liability in an amount that would be payable if the securities were disposed of on the valuation date. As a result of several court cases, in certain countries across the European Union, the Fund filed additional tax reclaims for previously withheld taxes on dividends earned in those countries (EU reclaims). These additional filings are subject to various administrative proceedings by the local jurisdictions’ tax authorities within the European Union, as well as a number of related judicial proceedings. Income recognized, if any, for EU reclaims is reflected as other income in the Statement of Operations and any related receivable, if any, is reflected as European Union tax reclaims in the Statement of Assets and Liabilities. When uncertainty exists as to the ultimate resolution of these proceedings, the likelihood of receipt of these EU reclaims, and the potential timing of payment, no amounts are reflected in the financial statements. For U.S. income tax purposes, when EU reclaims are received by the Fund and the Fund previously passed foreign tax credit on to its shareholders, the Fund must either amend historic tax reporting to shareholders or enter into a closing agreement with the Internal Revenue Service (IRS) in order to pay the associated tax liability on behalf of the Fund’s shareholders.
The Fund may recognize an income tax liability related to its uncertain tax positions under U.S. GAAP when the uncertain tax position has a less than 50% probability that it will be sustained upon examination by the tax authorities based on its technical merits. As of December 31, 2016, the Fund has determined that no tax liability is required in its financial statements related to uncertain tax positions for any open tax years (or expected to be taken in future tax years). Open tax years are those that remain subject to examination and are based on each tax jurisdiction’s statute of limitation.
e. Security Transactions, Investment Income, Expenses and Distributions
Security transactions are accounted for on trade date. Realized gains and losses on security transactions are determined on a specific identification basis. Estimated expenses are accrued daily. Dividend income is recorded on the ex-dividend date except for certain dividends from securities where the dividend rate is not available. In such cases, the dividend is recorded as soon as the information is received by the Fund. Distributions to shareholders are recorded on the ex-dividend date and are determined according to income tax regulations (tax basis). Distributable earnings determined on a tax basis may differ
from earnings recorded in accordance with U.S. GAAP. These differences may be permanent or temporary. Permanent differences are reclassified among capital accounts to reflect their tax character. These reclassifications have no impact on net assets or the results of operations. Temporary differences are not reclassified, as they may reverse in subsequent periods.
Common expenses incurred by the Trust are allocated among the Funds based on the ratio of net assets of each Fund to the combined net assets of the Trust. Fund specific expenses are charged directly to the Fund that incurred the expense.
Realized and unrealized gains and losses and net investment income, not including class specific expenses, are allocated daily to each class of shares based upon the relative proportion of net assets of each class. Differences in per share distributions, by class, are generally due to differences in class specific expenses.
f. Accounting Estimates
The preparation of financial statements in accordance with U.S. GAAP requires management to make estimates and assumptions that affect the reported amounts of assets and liabilities at the date of the financial statements and the amounts of income and expenses during the reporting period. Actual results could differ from those estimates.
g. Redemption Fees
Redemptions and exchanges of interests in an insurance company subaccount that invested in Class 3 shares of the Fund were subject to a 1.0% short term trading fee if the interest in the subaccount had been held for less than 60 days. Such fees were retained by the Fund and accounted for as an addition to paid-in capital, allocated to each class of shares based upon the relative proportion of net assets of each class. There were no redemption fees for the year.
h. Guarantees and Indemnifications
Under the Trust’s organizational documents, its officers and trustees are indemnified by the Trust against certain liabilities arising out of the performance of their duties to the Trust. Additionally, in the normal course of business, the Trust, on behalf of the Fund, enters into contracts with service providers that contain general indemnification clauses. The Trust’s maximum exposure under these arrangements is unknown as
FRANKLIN TEMPLETON VARIABLE INSURANCE PRODUCTS TRUST
NOTES TO FINANCIAL STATEMENTS
Templeton Foreign VIP Fund (continued)
1. Organization and Significant Accounting Policies (continued)
h. Guarantees and Indemnifications (continued)
this would involve future claims that may be made against the Trust that have not yet occurred. Currently, the Trust expects the risk of loss to be remote.
2. Shares of Beneficial Interest
At December 31, 2016, there were an unlimited number of shares authorized (without par value). Transactions in the Fund’s shares were as follows:
| | | | | | | | | | | | | | | | | | | | |
| | | Year Ended December 31, | |
| | | 2016 | | | | | | 2015 | |
| | | Shares | | | Amount | | | | | | Shares | | | Amount | |
| | | | | |
| Class 1 Shares: | | | | | | | | | | | | | | | | | | | | |
Shares sold | | | 398,476 | | | $ | 5,247,673 | | | | | | | | 454,466 | | | $ | 6,842,816 | |
Shares issued in reinvestment of distributions | | | 633,861 | | | | 7,973,968 | | | | | | | | 1,057,790 | | | | 16,173,612 | |
Shares redeemed | | | (7,350,785 | ) | | | (98,332,068 | ) | | | | | | | (1,792,103 | ) | | | (27,033,382 | ) |
| | | | |
Net increase (decrease) | | | (6,318,448 | ) | | $ | (85,110,427 | ) | | | | | | | (279,847 | ) | | $ | (4,016,954 | ) |
| | | | |
| | | | | |
| Class 2 Shares: | | | | | | | | | | | | | | | | | | | | |
Shares sold | | | 12,602,852 | | | $ | 163,261,270 | | | | | | | | 14,594,828 | | | $ | 213,082,680 | |
Shares issued in reinvestment of distributions | | | 4,365,589 | | | | 53,871,367 | | | | | | | | 6,974,654 | | | | 104,689,555 | |
Shares redeemed | | | (21,800,082 | ) | | | (283,215,925 | ) | | | | | | | (20,492,400 | ) | | | (305,835,763 | ) |
| | | | |
Net increase (decrease) | | | (4,831,641 | ) | | $ | (66,083,288 | ) | | | | | | | 1,077,082 | | | $ | 11,936,472 | |
| | | | |
| Class 4 Shares: | | | | | | | | | | | | | | | | | | | | |
Shares sold | | | 4,242,533 | | | $ | 54,403,633 | | | | | | | | 5,690,434 | | | $ | 80,692,209 | |
Shares issued in reinvestment of distributions | | | 1,344,436 | | | | 16,724,782 | | | | | | | | 2,072,852 | | | | 31,341,523 | |
Shares redeemed | | | (5,754,548 | ) | | | (75,302,735 | ) | | | | | | | (5,429,602 | ) | | | (81,185,489 | ) |
| | | | |
Net increase (decrease) | | | (167,579 | ) | | $ | (4,174,320 | ) | | | | | | | 2,333,684 | | | $ | 30,848,243 | |
| | | | |
3. Transactions with Affiliates
Franklin Resources, Inc. is the holding company for various subsidiaries that together are referred to as Franklin Templeton Investments. Certain officers and trustees of the Fund are also officers and/or directors of the following subsidiaries:
| | |
| Subsidiary | | Affiliation |
Templeton Investment Counsel, LLC (TIC) | | Investment manager |
Franklin Templeton Services, LLC (FT Services) | | Administrative manager |
Franklin Templeton Distributors, Inc. (Distributors) | | Principal underwriter |
Franklin Templeton Investor Services, LLC (Investor Services) | | Transfer agent |
FRANKLIN TEMPLETON VARIABLE INSURANCE PRODUCTS TRUST
NOTES TO FINANCIAL STATEMENTS
Templeton Foreign VIP Fund (continued)
a. Management Fees
The Fund pays an investment management fee to TIC based on the average daily net assets of the Fund as follows:
| | |
| Annualized Fee Rate | | Net Assets |
0.900% | | Up to and including $200 million |
0.810% | | Over $200 million, up to and including $700 million |
0.775% | | Over $700 million, up to and including $1.2 billion |
0.750% | | Over $1.2 billion, up to and including $1.3 billion |
0.675% | | Over $1.3 billion, up to and including $10 billion |
0.655% | | Over $10 billion, up to and including $15 billion |
0.635% | | Over $15 billion, up to and including $20 billion |
0.615% | | In excess of $20 billion |
For the year ended December 31, 2016, the effective investment management fee rate was 0.756% of the Fund’s average daily net assets.
b. Administrative Fees
Under an agreement with TIC, FT Services provides administrative services to the Fund. The fee is paid by TIC based on the Fund’s average daily net assets, and is not an additional expense of the Fund.
c. Distribution Fees
The Board has adopted distribution plans for Class 2 and Class 4 shares pursuant to Rule 12b-1 under the 1940 Act. Under the Fund’s compensation distribution plans, the Fund pays Distributors for costs incurred in connection with the servicing, sale and distribution of the Fund’s shares up to 0.25% and 0.35% per year of its average daily net assets of Class 2 and Class 4, respectively. The plan year, for purposes of monitoring compliance with the maximum annual plan rates, is February 1 through January 31.
d. Transfer Agent Fees
Investor Services, under terms of an agreement, performs shareholder servicing for the Fund and is not paid by the Fund for the services.
e. Investments in Affiliated Management Investment Companies
The Fund invests in one or more affiliated management investment companies for purposes other than exercising a controlling influence over the management or policies. Management fees paid by the Fund are waived on assets invested in the affiliated management investment companies, as noted in the Statement of Operations, in an amount not to exceed the management and administrative fees paid directly or indirectly by each affiliate. Prior to January 1, 2014, the waiver was accounted for as a reduction to management fees. During the year ended December 31, 2016, the Fund held investments in affiliated management investment companies as follows:
| | | | | | | | | | | | | | | | | | | | | | | | | | | | | | | | |
| | | Number of Shares
Held at
Beginning
of Year | | | Gross Additions | | | Gross Reductions | | | Number of Shares Held at End of Year | | | Value at End of Year | | | Investment
Income | | | Realized
Gain
(Loss) | | | % of Affiliated Fund Shares
Outstanding
Held at End
of Year | |
| Non-Controlled Affiliates | | | | | | | | | | | | | | | | | | | | | | | | | | | | | | | | |
Institutional Fiduciary Trust Money Market Portfolio, 0.09% | | | 71,421,269 | | | | 1,482,277,293 | | | | (1,442,562,780 | ) | | | 111,135,782 | | | $ | 111,135,782 | | | $ | 3,987 | | | $ | — | | | | 0.7% | |
| | | | | | | | | | | | | | | | | | | | | | | | |
FRANKLIN TEMPLETON VARIABLE INSURANCE PRODUCTS TRUST
NOTES TO FINANCIAL STATEMENTS
Templeton Foreign VIP Fund (continued)
4. Expense Offset Arrangement
The Fund has entered into an arrangement with its custodian whereby credits realized as a result of uninvested cash balances are used to reduce a portion of the Fund’s custodian expenses. During the year ended December 31, 2016, there were no credits earned.
5. Income Taxes
For tax purposes, capital losses may be carried over to offset future capital gains, if any. At December 31, 2016, the capital loss carryforwards were as follows:
| | | | |
Capital loss carryforwards: | | | | |
Short term | | $ | 1,095,327 | |
Long term | | | 68,138,792 | |
| | | | |
Total capital loss carryforwards | | $ | 69,234,119 | |
| | | | |
The tax character of distributions paid during the years ended December 31, 2016 and 2015, was as follows:
| | | | | | | | |
| | | 2016 | | | 2015 | |
Distributions paid from: | | | | | | | | |
Ordinary income | | $ | 41,497,565 | | | $ | 75,450,595 | |
Long term capital gain | | | 37,072,552 | | | | 76,754,096 | |
| | | | |
| | $ | 78,570,117 | | | $ | 152,204,691 | |
| | | | |
At December 31, 2016, the cost of investments, net unrealized appreciation (depreciation), and undistributed ordinary income for income tax purposes were as follows:
| | | | |
Cost of investments | | $ | 1,964,119,109 | |
| | | | |
Unrealized appreciation | | $ | 317,848,202 | |
Unrealized depreciation | | | (218,545,763 | ) |
| | | | |
Net unrealized appreciation (depreciation) | | $ | 99,302,439 | |
| | | | |
Distributable earnings - undistributed ordinary income | | $ | 42,252,085 | |
| | | | |
Differences between income and/or capital gains as determined on a book basis and a tax basis are primarily due to differing treatments of EU reclaims and foreign capital gains tax.
6. Investment Transactions
Purchases and sales of investments (excluding short term securities) for the year ended December 31, 2016, aggregated $420,041,077 and $631,996,510, respectively.
At December 31, 2016, in connection with securities lending transactions, the Fund loaned equity investments and received $12,924,082 of cash collateral. The gross amount of recognized liability for such transactions is included in payable upon return of securities loaned in the Statement of Assets and Liabilities. The agreements can be terminated at any time.
FRANKLIN TEMPLETON VARIABLE INSURANCE PRODUCTS TRUST
NOTES TO FINANCIAL STATEMENTS
Templeton Foreign VIP Fund (continued)
7. Concentration of Risk
Investing in foreign securities may include certain risks and considerations not typically associated with investing in U.S. securities, such as fluctuating currency values and changing local and regional economic, political and social conditions, which may result in greater market volatility. In addition, certain foreign securities may not be as liquid as U.S. securities.
8. Credit Facility
The Fund, together with other U.S. registered and foreign investment funds (collectively, Borrowers), managed by Franklin Templeton Investments, are borrowers in a joint syndicated senior unsecured credit facility totaling $2 billion (Global Credit Facility) which matured on February 10, 2017. This Global Credit Facility provides a source of funds to the Borrowers for temporary and emergency purposes, including the ability to meet future unanticipated or unusually large redemption requests. Effective February 10, 2017, the Borrowers renewed the Global Credit Facility for a one year term, maturing February 9, 2018, for a total of $2 billion.
Under the terms of the Global Credit Facility, the Fund shall, in addition to interest charged on any borrowings made by the Fund and other costs incurred by the Fund, pay its share of fees and expenses incurred in connection with the implementation and maintenance of the Global Credit Facility, based upon its relative share of the aggregate net assets of all of the Borrowers, including an annual commitment fee of 0.15% based upon the unused portion of the Global Credit Facility. These fees are reflected in other expenses in the Statement of Operations. During the year ended December 31, 2016, the Fund did not use the Global Credit Facility.
9. Fair Value Measurements
The Fund follows a fair value hierarchy that distinguishes between market data obtained from independent sources (observable inputs) and the Fund’s own market assumptions (unobservable inputs). These inputs are used in determining the value of the Fund’s financial instruments and are summarized in the following fair value hierarchy:
| | • | | Level 1 – quoted prices in active markets for identical financial instruments |
| | • | | Level 2 – other significant observable inputs (including quoted prices for similar financial instruments, interest rates, prepayment speed, credit risk, etc.) |
| | • | | Level 3 – significant unobservable inputs (including the Fund’s own assumptions in determining the fair value of financial instruments) |
The input levels are not necessarily an indication of the risk or liquidity associated with financial instruments at that level.
For movements between the levels within the fair value hierarchy, the Fund has adopted a policy of recognizing the transfers as of the date of the underlying event which caused the movement.
At December 31, 2016, all of the Fund’s investments in financial instruments carried at fair value were valued using Level 1 inputs. For detailed categories, see the accompanying Statement of Investments.
FRANKLIN TEMPLETON VARIABLE INSURANCE PRODUCTS TRUST
NOTES TO FINANCIAL STATEMENTS
Templeton Foreign VIP Fund (continued)
10. Investment Company Reporting Modernization
In October 2016, the U.S. Securities and Exchange Commission adopted new rules and amended existing rules (together, final rules) intended to modernize the reporting and disclosure of information by registered investment companies. In part, the final rules amend Regulation S-X and require standardized, enhanced disclosures about derivatives in investment company financial statements, as well as other amendments. The compliance date for the amendments to Regulation S-X is August 1, 2017. Management is currently evaluating the impact that the adoption of the amendments to Regulation S-X will have on the Fund’s financial statements and related disclosures.
11. Subsequent Events
The Fund has evaluated subsequent events through the issuance of the financial statements and determined that no events have occurred that require disclosure other than those already disclosed in the financial statements.
Abbreviations
| | |
| Selected Portfolio |
| |
| ADR | | American Depositary Receipt |
FRANKLIN TEMPLETON VARIABLE INSURANCE PRODUCTS TRUST
Report of Independent Registered Public Accounting Firm
Templeton Foreign VIP Fund
To the Board of Trustees and Shareholders of Franklin Templeton Variable Insurance Products Trust
In our opinion, the accompanying statement of assets and liabilities, including the statement of investments, and the related statements of operations and of changes in net assets and the financial highlights present fairly, in all material respects, the financial position of Templeton Foreign VIP Fund (the “Fund”) as of December 31, 2016, the results of its operations for the year then ended, the changes in its net assets for each of the two years in the period then ended and the financial highlights for the periods presented, in conformity with accounting principles generally accepted in the United States of America. These financial statements and financial highlights (hereafter referred to as “financial statements”) are the responsibility of the Fund’s management. Our responsibility is to express an opinion on these financial statements based on our audits. We conducted our audits of these financial statements in accordance with the standards of the Public Company Accounting Oversight Board (United States). Those standards require that we plan and perform the audit to obtain reasonable assurance about whether the financial statements are free of material misstatement. An audit includes examining, on a test basis, evidence supporting the amounts and disclosures in the financial statements, assessing the accounting principles used and significant estimates made by management, and evaluating the overall financial statement presentation. We believe that our audits, which included confirmation of securities as of December 31, 2016 by correspondence with the custodian, transfer agent and brokers, provide a reasonable basis for our opinion.
PricewaterhouseCoopers LLP
San Francisco, California
February 15, 2017
FRANKLIN TEMPLETON VARIABLE INSURANCE PRODUCTS TRUST
Tax Information (unaudited)
Templeton Foreign VIP Fund
Under Section 852(b)(3)(C) of the Internal Revenue Code (Code), the Fund hereby reports the maximum amount allowable but no less than $37,072,552 as a long term capital gain dividend for the fiscal year ended December 31, 2016.
At December 31, 2016, more than 50% of the Fund’s total assets were invested in securities of foreign issuers. In most instances, foreign taxes were withheld from income paid to the Fund on these investments. The Fund elects to treat foreign taxes paid as allowed under Section 853 of the Code. This election will allow shareholders of record as of the 2017 distribution date, to treat their proportionate share of foreign taxes paid by the Fund as having been paid directly by them. The shareholder shall consider these amounts as foreign taxes paid in the tax year in which they receive the Fund distribution.
Templeton Global Bond VIP Fund
We are pleased to bring you Templeton Global Bond VIP Fund’s annual report for the fiscal year ended December 31, 2016.
Class 2 Performance Summary as of December 31, 2016
Average annual total return of Class 2 shares* represents the average annual change in value, assuming reinvestment of dividends and capital gains. Average returns smooth out variations in returns, which can be significant; they are not the same as year-by-year results.
| | | | | | | | | | | | |
| Periods ended 12/31/16 | | 1-Year | | | 5-Year | | | 10-Year | |
Average Annual Total Return | | | +2.94% | | | | +3.24% | | | | +6.41% | |
*The Fund has a fee waiver associated with any investment it makes in a Franklin Templeton money fund and/or other Franklin Templeton fund, contractually guaranteed through its current fiscal year-end. Fund investment results reflect the fee waiver; without this waiver, the results would have been lower.
Performance reflects the Fund’s Class 2 operating expenses, but does not include any contract fees, expenses or sales charges. If they had been included, performance would be lower. These charges and deductions, particularly for variable life policies, can have a significant effect on contract values and insurance benefits. See the contract prospectus for a complete description of these expenses, including sales charges.
Performance data represent past performance, which does not guarantee future results. Investment return and principal value will fluctuate, and you may have a gain or loss when you sell your shares. Current performance may differ from figures shown.
Total Return Index Comparison for a Hypothetical $10,000 Investment (1/1/07–12/31/16)
The graph below shows the change in value of a hypothetical $10,000 investment in the Fund over the indicated period and includes reinvestment of any income or distributions. The Fund’s performance* is compared to the performance of the J.P. Morgan (JPM) Global Government Bond Index (GGBI), the Citigroup World Government Bond Index (WGBI) and the Consumer Price Index. One cannot invest directly in an index, and an index is not representative of the Fund’s portfolio. Please see Important Notes to Performance Information preceding the Fund Summaries.
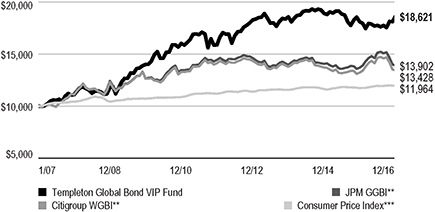
**Source: Morningstar. Please see Index Descriptions following the Fund Summaries.
***Source: Bureau of Labor Statistics, bls.gov/cpi. Please see Index Descriptions following the Fund Summaries.
TEMPLETON GLOBAL BOND VIP FUND
Fund Goal and Main Investments
The Fund seeks high current income, consistent with preservation of capital, with capital appreciation as a secondary consideration. Under normal market conditions, the Fund invests at least 80% of its net assets in bonds, which include debt securities of any maturity, such as bonds, notes, bills and debentures.
Fund Risks
All investments involve risks, including possible loss of principal. Currency rates may fluctuate significantly over short periods of time, and can reduce returns. Derivatives, including currency management strategies, involve costs and can create economic leverage in the portfolio that may result in significant volatility and cause the Fund to participate in losses (as well as enable gains) on an amount that exceeds the Fund’s initial investment. The Fund may not achieve the anticipated benefits and may realize losses when a counterparty fails to perform as promised. Foreign securities involve special risks, including currency fluctuations and economic and political uncertainties. Investments in emerging markets involve heightened risks related to the same factors, in addition to those associated with these markets’ smaller size and lesser liquidity. Sovereign debt securities are subject to various risks in addition to those relating to debt securities and foreign securities generally, including, but not limited to, the risk that a governmental entity may be unwilling or unable to pay interest and repay principal on its sovereign debt, or otherwise meet its obligations when due. Investments in lower rated bonds include higher risk of default and loss of principal. Changes in interest rates will affect the value of the Fund’s portfolio and its share price and yield. Bond prices generally move in the opposite direction of interest rates. As prices of bonds in the Fund adjust to a rise in interest rates, the Fund’s share price may decline. The Fund is also nondiversified, which involves the risk of greater price fluctuation than a more diversified portfolio. Changes in the financial strength of a bond issuer or in a bond’s credit rating may affect its value. The Fund is actively managed but there is no guarantee that the manager’s investment decisions will produce the desired results. The Fund’s prospectus also includes a description of the main investment risks.
Geographic Composition*
Based on Total Net Assets as of 12/31/16
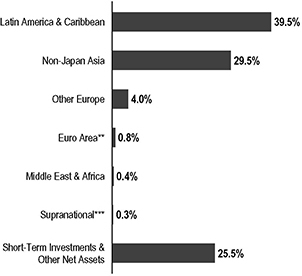
*Figures represent the net Fund exposure and include certain derivatives held in the portfolio (or their underlying reference assets) and may not total 100% or may be negative due to rounding, use of any derivatives or other factors.
**The Fund’s euro area investments were in Portugal.
***The Fund’s supranational investment was denominated in the Mexican peso.
Performance Overview
You can find the Fund’s one-year total return in the Performance Summary. For comparison, the JPM GGBI produced a +1.56% total return and the Citigroup WGBI posted a +1.60% total return for the same period.1
Economic and Market Overview
The calendar year of 2016 started off with a sharp escalation in global risk aversion, as oil prices dropped below US$30 per barrel, and markets appeared to price in worst case scenarios on fears of a global recession and a potential collapse of growth in China. However, we believed that the fears were unwarranted. In our opinion, markets appeared to overestimate the extent to which lower headline inflation reflected structurally weaker global demand; however, we believed that supply factors were the main driver behind falling energy and commodity prices, not a collapse in demand. We expected the effects to be short term and the disinflationary impact to wane as commodity prices stabilized. However, the belief that inflation had become structurally lower appeared to lead some investors to take a complacent view on interest rates, despite what we viewed as a
1. Source: Morningstar. One cannot invest directly in an index, and an index is not representative of the Fund’s portfolio. Please see Index Descriptions following the Fund Summaries.
The dollar value, number of shares or principal amount, and names of all portfolio holdings are listed in the Fund’s Statement of Investments (SOI).
TEMPLETON GLOBAL BOND VIP FUND
vulnerable phase of the yield cycle. Underlying inflation in the U.S. was not adequately priced into bond yields during the period, in our assessment, and we were wary of the lack of inflation being priced into bond yields across the globe. We believed there were more risks of inflation moving up than down, yet markets appeared to price in deflation and downside risks.
Additionally, markets appeared to regard emerging economies as being in near-crisis condition, reacting as if conditions were worse than the 2008 global financial crisis or the Asian financial crisis of 1997 and 1998. However, several emerging market economies were in far better shape, by our assessment, with larger foreign reserves and more diversified, growing economies. We were focused on a number of opportunities in emerging market currencies based on our conviction that the broad fears of a systemic crisis across the asset class were exaggerated. Over the final weeks of February, risk appetites returned and several local-currency markets rallied, creating a positive trend for global markets that largely carried into March and April.
In March, the U.S. Federal Reserve (Fed) passed on raising the federal funds target rate and indicated that rate hikes would likely be more gradual than previously envisioned at the end of 2015, reducing the number of projected rate hikes for 2016 from four to two. The effect was an implicit easing of policy as yield expectations had already been priced in by the market, resulting in a subsequent decline in U.S. Treasury yields and weakening of the U.S. dollar. The adjustment in forward guidance was followed during the period by unchanged rates at each of the Fed’s meetings in April, June, July, September and November.
On June 23, the U.K. electorate voted to leave the European Union in the “Brexit” referendum, leading to a sharp escalation in risk aversion across global bond markets. Consequently, U.S. Treasury yields declined further, with the yield on the 10-year U.S. Treasury note reaching a low of 1.37% in early July on a global flight to quality. However, markets subsequently recovered in mid-July with notable rallies in a number of emerging market currencies and local-currency bonds. The yield on the 10-year U.S. Treasury bond returned to a range around 1.55% in the second half of July, ultimately finishing the reporting period at 1.84%, after starting the period at 2.16%.
In the summer months of July and August, a number of emerging market currencies resumed rallies that had begun in the spring months but were temporarily sidetracked by market volatility after the “Brexit” referendum result. By October, U.S.
dollar strength returned as U.S. Treasury yields rose sharply due to growing expectations for a December rate hike. By November, a sharp correction in U.S. Treasury valuations was fully underway, manifesting quickly after the results of the U.S. election as markets appeared to rapidly move toward our long-held view that inflation pressures were rising. Once those corrections to yields began, they were quite severe in a short period of time, demonstrating just how extreme those valuations had become. Growing rate differentials between the rising yields in the U.S. and the low to negative yields in the eurozone and Japan drove significant depreciations of the euro and the yen against the U.S. dollar. Overall, for the full period, a number of emerging market currencies appreciated against the U.S. dollar, notably the Brazilian real, the Colombian peso, and the Indonesian rupiah, while others depreciated against the U.S. dollar, such as the Mexican peso, Malaysian ringgit and South Korean won. The Fed raised rates by 0.25% at its December meeting and indicated that it expected three rate hikes in 2017.
Investment Strategy
We invest selectively in bonds around the world based upon our assessment of changing market, political and economic conditions. While seeking opportunities, we monitor various factors including changes in interest rates, currency exchange rates and credit risks. We seek to manage the Fund’s exposure to various currencies and regularly utilize currency and cross currency forward contracts and may also use other derivative instruments.
What is a currency forward contract?
A currency forward contract is an agreement between the Fund and a counterparty to buy or sell a foreign currency in exchange for another currency at a specific exchange rate on a future date.
Manager’s Discussion
On the whole, we continued to position the Fund for rising rates by maintaining low portfolio duration and aiming at a negative correlation with U.S. Treasury returns. We also continued to actively seek select duration exposures that we believe can offer positive real yields without taking undue interest-rate risk, favoring countries that we feel have solid underlying fundamentals and prudent fiscal, monetary and financial policies. During the period, we added to some of our strongest investment convictions as prices became cheaper during periods of heightened volatility. We also maintained exposures to a number of emerging market currencies that we believe remained fundamentally undervalued. Overall, we were
TEMPLETON GLOBAL BOND VIP FUND
Currency Composition*
12/31/16
| | | | |
| | | % of Total
Net Assets | |
| Americas | | | 138.7% | |
| U.S. Dollar | | | 96.1% | |
| Mexican Peso | | | 20.5% | |
| Brazilian Real | | | 11.5% | |
| Argentinian Peso | | | 4.1% | |
| Colombian Peso | | | 3.6% | |
| Chilean Peso | | | 2.8% | |
| Peruvian Neuvo Sol | | | 0.1% | |
| Asia Pacific | | | 5.7% | |
| Malaysian Ringgit | | | 13.1% | |
| Indonesian Rupiah | | | 10.7% | |
| Indian Rupee | | | 6.8% | |
| Philippine Peso | | | 3.6% | |
| Sri Lankan Rupee | | | 0.7% | |
| South Korean Won | | | -0.2% | |
| Japanese Yen | | | -29.0% | |
| Middle East & Africa | | | 0.4% | |
| South African Rand | | | 0.4% | |
| Europe | | | -36.0% | |
| Euro | | | -36.0% | |
| Australia & New Zealand | | | -8.8% | |
| Australian Dollar | | | -8.8% | |
*Figures represent the net Fund exposure and include certain derivatives held in the portfolio (or their underlying reference assets) and may not total 100% or may be negative due to rounding, use of any derivatives or other factors.
positioned for depreciation of the euro and the Japanese yen, rising U.S. Treasury yields, and currency appreciation in select emerging markets. During the period, we used currency forward contracts to actively manage currencies. We also used interest-rate swaps to tactically manage duration exposures.
What is duration?
Duration is a measure of a bond’s price sensitivity to interest-rate changes. In general, a portfolio of securities with a lower duration can be expected to be less sensitive to interest-rate changes than a portfolio with a higher duration.
What is an interest-rate swap?
An interest-rate swap is an agreement between two parties to exchange interest rate payment obligations, generally one based on an interest rate fixed to maturity and the other based on an interest rate that changes in accordance with changes in a designated benchmark (for example, LIBOR, prime, commercial paper or other benchmarks).
During the period, the Fund’s positive absolute performance benefited from currency positions and interest-rate strategies. Sovereign credit exposures had a largely neutral effect on absolute return. Among currencies, the Fund’s net-negative position in the euro, achieved through currency forward contracts, contributed to absolute performance, while its net-negative position in the Japanese yen, also through currency forward contracts, detracted. Currency positions in Latin America contributed to absolute return (the Brazilian real contributed, while the Mexican peso detracted), while currency positions in Asia ex-Japan had a largely neutral effect (the Indonesian rupiah contributed, while the South Korean won detracted). The Fund maintained a defensive approach regarding interest rates in developed and emerging markets. Select duration exposures in Latin America (Brazil) and Asia ex-Japan contributed to absolute performance.
Relative to the JPM GGBI benchmark, the Fund’s outperformance benefited from currency positions, while sovereign credit exposures had a largely neutral effect. Interest-rate strategies detracted from relative return. Among currencies, the Fund’s underweighted position in the euro contributed to absolute return as did its lack of exposure to the British pound, while its underweighted position in the Japanese yen detracted. Overweighted currency positions in Latin America contributed to relative performance (the Brazilian real contributed, while the Mexican peso detracted), while overweighted currency positions in Asia ex-Japan had a largely neutral effect (the Indonesian rupiah contributed, while the South Korean won detracted). Select underweighted duration exposures in Europe detracted from relative return as did underweighted duration exposure in Japan. Overweighted duration exposures in Latin America (Brazil) and Asia ex-Japan (Indonesia and India) contributed to relative performance.
Thank you for your participation in Templeton Global Bond VIP Fund. We look forward to serving your future investment needs.
TEMPLETON GLOBAL BOND VIP FUND
The foregoing information reflects our analysis, opinions and portfolio holdings as of December 31, 2016, the end of the reporting period. The way we implement our main investment strategies and the resulting portfolio holdings may change depending on factors such as market and economic conditions. These opinions may not be relied upon as investment advice or an offer for a particular security. The information is not a complete analysis of every aspect of any market, country, industry, security or the Fund. Statements of fact are from sources considered reliable, but the investment manager makes no representation or warranty as to their completeness or accuracy. Although historical performance is no guarantee of future results, these insights may help you understand our investment management philosophy.
TEMPLETON GLOBAL BOND VIP FUND
Class 2 Fund Expenses
As an investor in a variable insurance contract (Contract) that indirectly provides for investment in an underlying mutual fund, you can incur transaction and/or ongoing expenses at both the Fund level and the Contract Level: (1) transaction expenses can include sales charges (loads) on purchases, surrender fees, transfer fees and premium taxes; and (2) ongoing expenses can include management fees, distribution and service (12b-1) fees, contract fees, annual maintenance fees, mortality and expense risk fees and other fees and expenses. All mutual funds and Contracts have some types of ongoing expenses. The table below shows Fund-level ongoing expenses and can help you understand these costs and compare them with those of other mutual funds offered through the Contract. The table assumes a $1,000 investment held for the six months indicated. Please refer to the Fund prospectus for additional information on operating expenses.
Actual Fund Expenses
The table below provides information about the actual account values and actual expenses in the columns under the heading “Actual.” In these columns the Fund’s actual return, which includes the effect of ongoing Fund expenses but does not include the effect of ongoing Contract expenses, is used to calculate the “Ending Account Value.”
You can estimate the Fund-level expenses you paid during the period by following these steps (of course, your account value and expenses will differ from those in this illustration):
| | Divide your account value by $1,000 |
| | (if your account had an $8,600 value, |
| | then $8,600 ÷ $1,000 = 8.6). |
| | Then multiply the result by the number under the headings “Actual” and “Fund-Level Expenses Paid During Period” |
| | (if Fund-Level Expenses Paid During Period were $ 7.50, |
| | then 8.6 x $7.50 = $64.50). |
In this illustration, the estimated expenses paid this period at the Fund level are $64.50.
Hypothetical Example for Comparison with Other Mutual Funds
Under the heading “Hypothetical” in the table, information is provided about hypothetical account values and hypothetical expenses based on the Fund’s actual expense ratio and an assumed rate of return of 5% per year before expenses, which is not the Fund’s actual return. This information may not be used to estimate the actual ending account balance or expenses you paid for the period, but it can help you compare ongoing costs of investing in the Fund with those of other mutual funds offered through the Contract. To do so, compare this 5% hypothetical example with the 5% hypothetical examples that appear in the shareholder reports of other funds offered through the Contract.
Please note that expenses shown in the table are meant to highlight ongoing costs at the Fund level only and do not reflect any ongoing expenses at the Contract level, or transaction expenses at either the Fund or Contract levels. In addition, while the Fund does not have transaction expenses, if the transaction and ongoing expenses at the Contract level were included, the expenses shown below would be higher. You should consult your Contract prospectus or disclosure document for more information.
| | | | | | | | | | | | | | | | | | | | | | | | |
| | | | | | Actual
(actual return after expenses) | | | Hypothetical
(5% annual return before expenses) | | | | |
| Share Class | |
| Beginning Account
Value 7/1/16 |
| |
| Ending Account
Value 12/31/16 |
| |
| Fund-Level
Expenses Paid
During Period
7/1/16–12/31/16 |
1,2 | |
| Ending Account
Value 12/31/16 |
| |
| Fund-Level
Expenses Paid
During Period
7/1/16–12/31/16 |
1,2 | |
| Net
Annualized
Expense
Ratio |
2 |
Class 2 | | $ | 1,000 | | | $ | 1,049.10 | | | $ | 3.76 | | | $ | 1,021.47 | | | $ | 3.71 | | | | 0.73 | % |
1. Expenses are equal to the annualized expense ratio for the six-month period as indicated above—in the far right column—multiplied by the simple average account value over the period indicated, and then multiplied by 184/366 to reflect the one-half year period.
2. Reflects expenses after fee waivers and expense reimbursements. Does not include any ongoing expenses of the Contract for which the Fund is an investment option or acquired fund fees and expenses.
FRANKLIN TEMPLETON VARIABLE INSURANCE PRODUCTS TRUST
Financial Highlights
Templeton Global Bond VIP Fund
| | | | | | | | | | | | | | | | | | | | |
| | | Year Ended December 31, | |
| | | 2016 | | | 2015 | | | 2014 | | | 2013 | | | 2012 | |
| Class 1 | | | | | | | | | | | | | | | | | | | | |
Per share operating performance (for a share outstanding throughout the year) | | | | | | | | | | | | | | | | | | | | |
| | | | | |
Net asset value, beginning of year | | $ | 16.34 | | | $ | 18.56 | | | $ | 19.15 | | | $ | 20.01 | | | $ | 18.61 | |
| | | | |
| | | | | |
| Income from investment operationsa: | | | | | | | | | | | | | | | | | | | | |
| | | | | |
Net investment incomeb | | | 0.62 | | | | 0.52 | | | | 0.58 | | | | 0.64 | | | | 0.72 | |
| | | | | |
Net realized and unrealized gains (losses) | | | (0.10 | ) | | | (1.22 | ) | | | (0.16 | ) | | | (0.30 | ) | | | 1.99 | |
| | | | |
Total from investment operations | | | 0.52 | | | | (0.70 | ) | | | 0.42 | | | | 0.34 | | | | 2.71 | |
| | | | |
| | | | | |
| Less distributions from: | | | | | | | | | | | | | | | | | | | | |
| | | | | |
Net investment income and net foreign currency gains | | | — | | | | (1.43 | ) | | | (1.01 | ) | | | (0.96 | ) | | | (1.28 | ) |
| | | | | |
Net realized gains | | | (0.01 | ) | | | (0.09 | ) | | | — | | | | (0.24 | ) | | | (0.03 | ) |
| | | | |
Total distributions | | | (0.01 | ) | | | (1.52 | ) | | | (1.01 | ) | | | (1.20 | ) | | | (1.31 | ) |
| | | | |
Redemption fees | | | — | | | | — | | | | — | c | | | — | c | | | — | c |
| | | | |
Net asset value, end of year | | $ | 16.85 | | | $ | 16.34 | | | $ | 18.56 | | | $ | 19.15 | | | $ | 20.01 | |
| | | | |
| | | | | |
Total returnd | | | 3.21% | | | | (4.10)% | | | | 2.12% | | | | 1.89% | | | | 15.31% | |
| | | | | |
| Ratios to average net assets | | | | | | | | | | | | | | | | | | | | |
| | | | | |
Expenses before waiver and payments by affiliates | | | 0.53% | | | | 0.52% | | | | 0.51% | | | | 0.51% | | | | 0.55% | |
| | | | | |
Expenses net of waiver and payments by affiliatese | | | 0.48% | | | | 0.52% | f | | | 0.51% | | | | 0.51% | | | | 0.55% | |
| | | | | |
Net investment income | | | 3.88% | | | | 2.99% | | | | 3.08% | | | | 3.26% | | | | 3.71% | |
| | | | | |
| Supplemental data | | | | | | | | | | | | | | | | | | | | |
| | | | | |
Net assets, end of year (000’s) | | $ | 241,792 | | | $ | 292,802 | | | $ | 323,491 | | | $ | 280,963 | | | $ | 307,142 | |
| | | | | |
Portfolio turnover rate | | | 59.00% | | | | 51.58% | | | | 39.14% | | | | 34.39% | | | | 43.26% | |
aThe amount shown for a share outstanding throughout the period may not correlate with the Statement of Operations for the period due to the timing of sales and repurchases of the Fund’s shares in relation to income earned and/or fluctuating fair value of the investments of the Fund.
bBased on average daily shares outstanding.
cAmount rounds to less than $0.01 per share.
dTotal return does not include fees, charges or expenses imposed by the variable annuity and life insurance contracts for which Franklin Templeton Variable Insurance Products Trust serves as an underlying investment vehicle.
eBenefit of expense reduction rounds to less than 0.01%.
fBenefit of waiver and payments by affiliates rounds to less than 0.01%.
| | | | | | |
| | | The accompanying notes are an integral part of these financial statements. | Annual Report | | | TGB-7 | |
FRANKLIN TEMPLETON VARIABLE INSURANCE PRODUCTS TRUST
FINANCIAL HIGHLIGHTS
Templeton Global Bond VIP Fund (continued)
| | | | | | | | | | | | | | | | | | | | |
| | | Year Ended December 31, | |
| | | 2016 | | | 2015 | | | 2014 | | | 2013 | | | 2012 | |
| Class 2 | | | | | | | | | | | | | | | | | | | | |
Per share operating performance (for a share outstanding throughout the year) | | | | | | | | | | | | | | | | | | | | |
| | | | | |
Net asset value, beginning of year | | $ | 15.80 | | | $ | 17.99 | | | $ | 18.60 | | | $ | 19.47 | | | $ | 18.15 | |
| | | | |
| | | | | |
Income from investment operationsa: | | | | | | | | | | | | | | | | | | | | |
| | | | | |
Net investment incomeb | | | 0.56 | | | | 0.46 | | | | 0.52 | | | | 0.57 | | | | 0.65 | |
| | | | | |
Net realized and unrealized gains (losses) | | | (0.10 | ) | | | (1.17 | ) | | | (0.17 | ) | | | (0.27 | ) | | | 1.94 | |
| | | | |
Total from investment operations | | | 0.46 | | | | (0.71 | ) | | | 0.35 | | | | 0.30 | | | | 2.59 | |
| | | | |
Less distributions from: | | | | | | | | | | | | | | | | | | | | |
| | | | | |
Net investment income and net foreign currency gains | | | — | | | | (1.39 | ) | | | (0.96 | ) | | | (0.93 | ) | | | (1.24 | ) |
| | | | | |
Net realized gains | | | (0.01 | ) | | | (0.09 | ) | | | — | | | | (0.24 | ) | | | (0.03 | ) |
| | | | |
Total distributions | | | (0.01 | ) | | | (1.48 | ) | | | (0.96 | ) | | | (1.17 | ) | | | (1.27 | ) |
| | | | |
Redemption fees | | | — | | | | — | | | | — | c | | | — | c | | | — | c |
| | | | |
Net asset value, end of year | | $ | 16.25 | | | $ | 15.80 | | | $ | 17.99 | | | $ | 18.60 | | | $ | 19.47 | |
| | | | |
| | | | | |
Total returnd | | | 2.94% | | | | (4.30)% | | | | 1.83% | | | | 1.63% | | | | 15.07% | |
| | | | | |
| Ratios to average net assets | | | | | | | | | | | | | | | | | | | | |
| | | | | |
Expenses before waiver and payments by affiliates | | | 0.78% | | | | 0.77% | | | | 0.76% | | | | 0.76% | | | | 0.80% | |
| | | | | |
Expenses net of waiver and payments by affiliatese | | | 0.73% | | | | 0.77% | f | | | 0.76% | | | | 0.76% | | | | 0.80% | |
| | | | | |
Net investment income | | | 3.63% | | | | 2.74% | | | | 2.83% | | | | 3.01% | | | | 3.46% | |
| | | | | |
| Supplemental data | | | | | | | | | | | | | | | | | | | | |
| | | | | |
Net assets, end of year (000’s) | | $ | 2,812,535 | | | $ | 2,971,667 | | | $ | 3,177,638 | | | $ | 2,826,039 | | | $ | 2,418,229 | |
| | | | | |
Portfolio turnover rate | | | 59.00% | | | | 51.58% | | | | 39.14% | | | | 34.39% | | | | 43.26% | |
aThe amount shown for a share outstanding throughout the period may not correlate with the Statement of Operations for the period due to the timing of sales and repurchases of the Fund’s shares in relation to income earned and/or fluctuating fair value of the investments of the Fund.
bBased on average daily shares outstanding.
cAmount rounds to less than $0.01 per share.
dTotal return does not include fees, charges or expenses imposed by the variable annuity and life insurance contracts for which Franklin Templeton Variable Insurance Products Trust serves as an underlying investment vehicle.
eBenefit of expense reduction rounds to less than 0.01%.
fBenefit of waiver and payments by affiliates rounds to less than 0.01%.
| | | | |
| TGB-8 | | Annual Report | The accompanying notes are an integral part of these financial statements. | | |
FRANKLIN TEMPLETON VARIABLE INSURANCE PRODUCTS TRUST
FINANCIAL HIGHLIGHTS
Templeton Global Bond VIP Fund (continued)
| | | | | | | | | | | | | | | | | | | | |
| | | Year Ended December 31, | |
| | | 2016 | | | 2015 | | | 2014 | | | 2013 | | | 2012 | |
| Class 4 | | | | | | | | | | | | | | | | | | | | |
Per share operating performance (for a share outstanding throughout the year) | | | | | | | | | | | | | | | | | | | | |
| | | | | |
Net asset value, beginning of year | | $ | 16.18 | | | $ | 18.38 | | | $ | 18.97 | | | $ | 19.82 | | | $ | 18.44 | |
| | | | |
| | | | | |
Income from investment operationsa: | | | | | | | | | | | | | | | | | | | | |
| | | | | |
Net investment incomeb | | | 0.56 | | | | 0.46 | | | | 0.51 | | | | 0.56 | | | | 0.64 | |
| | | | | |
Net realized and unrealized gains (losses) | | | (0.11 | ) | | | (1.21 | ) | | | (0.18 | ) | | | (0.28 | ) | | | 1.98 | |
| | | | |
Total from investment operations | | | 0.45 | | | | (0.75 | ) | | | 0.33 | | | | 0.28 | | | | 2.62 | |
| | | | |
Less distributions from: | | | | | | | | | | | | | | | | | | | | |
| | | | | |
Net investment income and net foreign currency gains | | | — | | | | (1.36 | ) | | | (0.92 | ) | | | (0.89 | ) | | | (1.21 | ) |
| | | | | |
Net realized gains | | | (0.01 | ) | | | (0.09 | ) | | | — | | | | (0.24 | ) | | | (0.03 | ) |
| | | | |
Total distributions | | | (0.01 | ) | | | (1.45 | ) | | | (0.92 | ) | | | (1.13 | ) | | | (1.24 | ) |
| | | | |
Redemption fees | | | — | | | | — | | | | — | c | | | — | c | | | — | c |
| | | | |
Net asset value, end of year | | $ | 16.62 | | | $ | 16.18 | | | $ | 18.38 | | | $ | 18.97 | | | $ | 19.82 | |
| | | | |
| | | | | |
Total returnd | | | 2.87% | | | | (4.39)% | | | | 1.69% | | | | 1.54% | | | | 14.97% | |
| | | | | |
| Ratios to average net assets | | | | | | | | | | | | | | | | | | | | |
| | | | | |
Expenses before waiver and payments by affiliates | | | 0.88% | | | | 0.87% | | | | 0.86% | | | | 0.86% | | | | 0.90% | |
| | | | | |
Expenses net of waiver and payments by affiliatese | | | 0.83% | | | | 0.87% | f | | | 0.86% | | | | 0.86% | | | | 0.90% | |
| | | | | |
Net investment income | | | 3.53% | | | | 2.64% | | | | 2.73% | | | | 2.91% | | | | 3.36% | |
| | | | | |
| Supplemental data | | | | | | | | | | | | | | | | | | | | |
| | | | | |
Net assets, end of year (000’s) | | $ | 96,798 | | | $ | 103,045 | | | $ | 111,199 | | | $ | 118,145 | | | $ | 163,241 | |
| | | | | |
Portfolio turnover rate | | | 59.00% | | | | 51.58% | | | | 39.14% | | | | 34.39% | | | | 43.26% | |
aThe amount shown for a share outstanding throughout the period may not correlate with the Statement of Operations for the period due to the timing of sales and repurchases of the Fund’s shares in relation to income earned and/or fluctuating fair value of the investments of the Fund.
bBased on average daily shares outstanding.
cAmount rounds to less than $0.01 per share.
dTotal return does not include fees, charges or expenses imposed by the variable annuity and life insurance contracts for which Franklin Templeton Variable Insurance Products Trust serves as an underlying investment vehicle.
eBenefit of expense reduction rounds to less than 0.01%.
fBenefit of waiver and payments by affiliates rounds to less than 0.01%.
| | | | | | |
| | | The accompanying notes are an integral part of these financial statements. | Annual Report | | | TGB-9 | |
FRANKLIN TEMPLETON VARIABLE INSURANCE PRODUCTS TRUST
Statement of Investments, December 31, 2016
Templeton Global Bond VIP Fund
| | | | | | | | | | | | | | |
| | | | | Principal Amount* | | | | | | Value | |
| | | Foreign Government and Agency Securities 70.5% | | | | | | | | | |
| | | Argentina 4.1% | | | | | | | | | |
| | Argentine Bonos del Tesoro, | | | | | | | | | | | | |
| | 18.20%, 10/03/21 | | | 747,561,000 | | | | ARS | | | $ | 47,911,859 | |
| | 16.00%, 10/17/23 | | | 175,692,000 | | | | ARS | | | | 10,629,519 | |
| | senior note, 15.50%, 10/17/26 | | | 1,151,967,000 | | | | ARS | | | | 69,917,836 | |
| | | | | | | | | | | | | | |
| | | | | | | | | | | | | 128,459,214 | |
| | | | | | | | | | | | | | |
| | | Brazil 11.5% | | | | | | | | | |
| | Letra Tesouro Nacional, | | | | | | | | | | | | |
| | Strip, 1/01/19 | | | 38,960 | a | | | BRL | | | | 9,726,319 | |
| | Strip, 7/01/19 | | | 102,840 | a | | | BRL | | | | 24,367,159 | |
| | Strip, 7/01/20 | | | 197,661 | a | | | BRL | | | | 41,837,546 | |
| | Nota Do Tesouro Nacional, | | | | | | | | | | | | |
| | 10.00%, 1/01/21 | | | 6,620 | a | | | BRL | | | | 1,960,022 | |
| | 10.00%, 1/01/23 | | | 512,345 | a | | | BRL | | | | 148,415,470 | |
| | 10.00%, 1/01/25 | | | 69,029 | a | | | BRL | | | | 19,769,830 | |
| | 10.00%, 1/01/27 | | | 260,633 | a | | | BRL | | | | 73,945,715 | |
| | b Index Linked, 6.00%, 5/15/19 | | | 2,087 | a | | | BRL | | | | 1,898,107 | |
| | b Index Linked, 6.00%, 8/15/22 | | | 18,002 | a | | | BRL | | | | 16,306,082 | |
| | b Index Linked, 6.00%, 5/15/23 | | | 4,510 | a | | | BRL | | | | 4,113,865 | |
| | b Index Linked, 6.00%, 8/15/24 | | | 3,110 | a | | | BRL | | | | 2,829,865 | |
| | b Index Linked, 6.00%, 5/15/45 | | | 10,825 | a | | | BRL | | | | 9,972,508 | |
| | senior note, 10.00%, 1/01/19 | | | 21,390 | a | | | BRL | | | | 6,472,816 | |
| | | | | | | | | | | | | | |
| | | | | | | | | | | | | 361,615,304 | |
| | | | | | | | | | | | | | |
| | | Colombia 3.6% | | | | | | | | | |
| | Government of Colombia, | | | | | | | | | | | | |
| | senior bond, 7.75%, 4/14/21 | | | 2,386,000,000 | | | | COP | | | | 830,539 | |
| | senior bond, 4.375%, 3/21/23 | | | 362,000,000 | | | | COP | | | | 105,646 | |
| | senior bond, 9.85%, 6/28/27 | | | 576,000,000 | | | | COP | | | | 226,639 | |
| | Titulos de Tesoreria, | | | | | | | | | | | | |
| | B, 5.00%, 11/21/18. | | | 2,882,000,000 | | | | COP | | | | 940,481 | |
| | B, 7.75%, 9/18/30 | | | 138,510,200,000 | | | | COP | | | | 47,932,978 | |
| | senior bond, B, 11.25%, 10/24/18 | | | 5,135,000,000 | | | | COP | | | | 1,848,737 | |
| | senior bond, B, 11.00%, 7/24/20 | | | 9,167,000,000 | | | | COP | | | | 3,471,077 | |
| | senior bond, B, 7.00%, 5/04/22 | | | 7,908,000,000 | | | | COP | | | | 2,672,348 | |
| | senior bond, B, 10.00%, 7/24/24 | | | 38,884,000,000 | | | | COP | | | | 15,271,232 | |
| | senior bond, B, 7.50%, 8/26/26 | | | 73,673,200,000 | | | | COP | | | | 25,222,396 | |
| | senior bond, B, 6.00%, 4/28/28 | | | 42,303,600,000 | | | | COP | | | | 12,670,859 | |
| | senior note, B, 7.00%, 9/11/19 | | | 4,056,000,000 | | | | COP | | | | 1,370,089 | |
| | | | | | | | | | | | | | |
| | | | | | | | | | | | | 112,563,021 | |
| | | | | | | | | | | | | | |
| | | India 4.5% | | | | | | | | | |
| | Government of India, | | | | | | | | | | | | |
| | senior bond, 7.80%, 5/03/20 | | | 270,800,000 | | | | INR | | | | 4,128,875 | |
| | senior bond, 8.35%, 5/14/22 | | | 212,700,000 | | | | INR | | | | 3,355,740 | |
| | senior bond, 9.15%, 11/14/24 | | | 2,409,000,000 | | | | INR | | | | 40,495,964 | |
| | senior note, 7.28%, 6/03/19 | | | 28,000,000 | | | | INR | | | | 420,240 | |
| | senior note, 8.27%, 6/09/20 | | | 1,222,000,000 | | | | INR | | | | 18,974,996 | |
| | senior note, 8.12%, 12/10/20 | | | 844,000,000 | | | | INR | | | | 13,113,603 | |
| | senior note, 7.80%, 4/11/21 | | | 1,980,300,000 | | | | INR | | | | 30,460,919 | |
| | senior note, 7.16%, 5/20/23 | | | 133,700,000 | | | | INR | | | | 2,017,702 | |
| | senior note, 8.83%, 11/25/23 | | | 1,805,900,000 | | | | INR | | | | 29,529,604 | |
| | | | | | | | | | | | | | |
| | | | | | | | | | | | | 142,497,643 | |
| | | | | | | | | | | | | | |
FRANKLIN TEMPLETON VARIABLE INSURANCE PRODUCTS TRUST
STATEMENT OF INVESTMENTS
Templeton Global Bond VIP Fund (continued)
| | | | | | | | | | | | | | |
| | | | | Principal Amount* | | | | | | Value | |
| | | Foreign Government and Agency Securities (continued) | | | | | | | | | |
| | | Indonesia 5.8% | | | | | | | | | |
| | Government of Indonesia, | | | | | | | | | | | | |
| | 6.125%, 5/15/28 | | | 37,000,000 | | | | IDR | | | $ | 2,321 | |
| | 8.375%, 3/15/34 | | | 81,180,000,000 | | | | IDR | | | | 6,070,803 | |
| | FR34, 12.80%, 6/15/21 | | | 392,506,000,000 | | | | IDR | | | | 34,686,069 | |
| | FR35, 12.90%, 6/15/22 | | | 71,229,000,000 | | | | IDR | | | | 6,489,781 | |
| | FR43, 10.25%, 7/15/22 | | | 147,832,000,000 | | | | IDR | | | | 12,207,316 | |
| | FR52, 10.50%, 8/15/30 | | | 6,960,000,000 | | | | IDR | | | | 609,419 | |
| | senior bond, 9.00%, 3/15/29 | | | 51,222,000,000 | | | | IDR | | | | 4,039,592 | |
| | senior bond, 8.75%, 5/15/31 | | | 85,845,000,000 | | | | IDR | | | | 6,674,535 | |
| | senior bond, FR39, 11.75%, 8/15/23 | | | 5,491,000,000 | | | | IDR | | | | 489,085 | |
| | senior bond, FR40, 11.00%, 9/15/25 | | | 46,856,000,000 | | | | IDR | | | | 4,103,920 | |
| | senior bond, FR44, 10.00%, 9/15/24 | | | 4,454,000,000 | | | | IDR | | | | 367,468 | |
| | senior bond, FR46, 9.50%, 7/15/23 | | | 226,780,000,000 | | | | IDR | | | | 18,263,591 | |
| | senior bond, FR47, 10.00%, 2/15/28 | | | 12,000,000 | | | | IDR | | | | 1,006 | |
| | senior bond, FR56, 8.375%, 9/15/26 | | | 525,219,000,000 | | | | IDR | | | | 40,056,615 | |
| | senior bond, FR59, 7.00%, 5/15/27 | | | 47,752,000,000 | | | | IDR | | | | 3,358,322 | |
| | senior bond, FR61, 7.00%, 5/15/22 | | | 244,849,000,000 | | | | IDR | | | | 17,765,068 | |
| | senior bond, FR63, 5.625%, 5/15/23 | | | 258,951,000,000 | | | | IDR | | | | 17,183,315 | |
| | senior bond, FR70, 8.375%, 3/15/24 | | | 136,475,000,000 | | | | IDR | | | | 10,383,141 | |
| | | | | | | | | | | | | | |
| | | | | | | | | | | | | 182,751,367 | |
| | | | | | | | | | | | | | |
| | | Malaysia 3.8% | | | | | | | | | |
| | Government of Malaysia, | | | | | | | | | | | | |
| | senior bond, 3.814%, 2/15/17 | | | 63,785,000 | | | | MYR | | | | 14,233,326 | |
| | senior bond, 4.24%, 2/07/18 | | | 44,360,000 | | | | MYR | | | | 9,990,988 | |
| | senior note, 3.394%, 3/15/17 | | | 125,470,000 | | | | MYR | | | | 27,993,291 | |
| | senior note, 4.012%, 9/15/17 | | | 147,790,000 | | | | MYR | | | | 33,144,691 | |
| | senior note, 3.314%, 10/31/17 | | | 153,634,000 | | | | MYR | | | | 34,286,821 | |
| | | | | | | | | | | | | | |
| | | | | | | | | | | | | 119,649,117 | |
| | | | | | | | | | | | | | |
| | | Mexico 18.0% | | | | | | | | | |
| | Government of Mexico, | | | | | | | | | | | | |
| | 7.75%, 12/14/17 | | | 33,461,300c | | | | MXN | | | | 163,504,666 | |
| | M, 4.75%, 6/14/18 | | | 3,886,300c | | | | MXN | | | | 18,239,053 | |
| | senior note, 8.50%, 12/13/18 | | | 60,159,700c | | | | MXN | | | | 298,782,171 | |
| | d senior note, M, 5.00%, 12/11/19 | | | 17,235,500c | | | | MXN | | | | 78,926,637 | |
| e | | Mexican Udibonos, | | | | | | | | | | | | |
| | Index Linked, 3.50%, 12/14/17 | | | 627,549f | | | | MXN | | | | 3,098,628 | |
| | Index Linked, 4.00%, 6/13/19 | | | 430,734f | | | | MXN | | | | 2,164,430 | |
| | Index Linked, 2.50%, 12/10/20 | | | 339,224f | | | | MXN | | | | 1,640,322 | |
| | | | | | | | | | | | | | |
| | | | | | | | | | | | | 566,355,907 | |
| | | | | | | | | | | | | | |
| | | Peru 0.1% | | | | | | | | | |
| | Government of Peru, senior bond, 7.84%, 8/12/20 | | | 11,090,000 | | | | PEN | | | | 3,597,302 | |
| | | | | | | | | | | | | | |
| | | Philippines 1.8% | | | | | | | | | |
| | Government of the Philippines, | | | | | | | | | | | | |
| | senior note, 5.875%, 1/31/18 | | | 81,610,000 | | | | PHP | | | | 1,692,338 | |
| | senior note, 3.375%, 8/20/20 | | | 1,102,110,000 | | | | PHP | | | | 21,912,910 | |
| | senior note, 3-21, 2.875%, 5/22/17 | | | 151,740,000 | | | | PHP | | | | 3,062,521 | |
| | senior note, 5-72, 2.125%, 5/23/18 | | | 686,978,000 | | | | PHP | | | | 13,673,954 | |
| | senior note, 7-51, 5.00%, 8/18/18 | | | 64,060,000 | | | | PHP | | | | 1,309,914 | |
FRANKLIN TEMPLETON VARIABLE INSURANCE PRODUCTS TRUST
STATEMENT OF INVESTMENTS
Templeton Global Bond VIP Fund (continued)
| | | | | | | | | | | | | | |
| | | | | Principal Amount* | | | | | | Value | |
| | | Foreign Government and Agency Securities (continued) | | | | | | | | | |
| | | Philippines (continued) | | | | | | | | | |
| | Government of the Philippines, (continued) | | | | | | | | | | | | |
| | senior note, 7-56, 3.875%, 11/22/19 | | | 813,510,000 | | | | PHP | | | $ | 16,530,608 | |
| | | | | | | | | | | | | | |
| | | | | | | | | | | | | 58,182,245 | |
| | | | | | | | | | | | | | |
| | | Portugal 0.8% | | | | | | | | | |
| g | | Government of Portugal, 144A, 5.125%, 10/15/24 | | | 27,830,000 | | | | | | | | 27,113,377 | |
| | | | | | | | | | | | | | |
| | | South Africa 0.4% | | | | | | | | | |
| | Government of South Africa, | | | | | | | | | | | | |
| | 8.00%, 1/31/30 | | | 45,070,000 | | | | ZAR | | | | 2,953,489 | |
| | 7.00%, 2/28/31 | | | 9,230,000 | | | | ZAR | | | | 549,557 | |
| | 8.25%, 3/31/32 | | | 31,580,000 | | | | ZAR | | | | 2,072,645 | |
| | 8.875%, 2/28/35 | | | 28,160,000 | | | | ZAR | | | | 1,925,709 | |
| | R186, 10.50%, 12/21/26 | | | 69,652,000 | | | | ZAR | | | | 5,594,477 | |
| | | | | | | | | | | | | | |
| | | | | | | | | | | | | 13,095,877 | |
| | | | | | | | | | | | | | |
| | | South Korea 11.1% | | | | | | | | | |
| | Korea Monetary Stabilization Bond, | | | | | | | | | | | | |
| | senior note, 1.70%, 8/02/17 | | | 9,221,100,000 | | | | KRW | | | | 7,647,062 | |
| | senior note, 1.56%, 10/02/17 | | | 54,756,600,000 | | | | KRW | | | | 45,365,038 | |
| | senior note, 1.49%, 2/02/18 | | | 11,176,000,000 | | | | KRW | | | | 9,249,320 | |
| | senior note, 1.25%, 8/02/18 | | | 18,933,000,000 | | | | KRW | | | | 15,596,352 | |
| | Korea Treasury Bond, | | | | | | | | | | | | |
| | senior bond, 4.25%, 6/10/21 | | | 9,492,600,000 | | | | KRW | | | | 8,669,214 | |
| | senior note, 2.00%, 12/10/17 | | | 49,196,500,000 | | | | KRW | | | | 40,907,603 | |
| | senior note, 1.75%, 12/10/18 | | | 12,303,900,000 | | | | KRW | | | | 10,219,853 | |
| | senior note, 1.50%, 6/10/19 | | | 62,818,800,000 | | | | KRW | | | | 51,881,010 | |
| | senior note, 2.75%, 9/10/19 | | | 1,850,000,000 | | | | KRW | | | | 1,575,547 | |
| | senior note, 2.00%, 3/10/21 | | | 105,581,810,000 | | | | KRW | | | | 88,150,845 | |
| | senior note, 1.375%, 9/10/21 | | | 85,398,200,000 | | | | KRW | | | | 69,457,926 | |
| | | | | | | | | | | | | | |
| | | | | | | | | | | | | 348,719,770 | |
| | | | | | | | | | | | | | |
| | | Sri Lanka 0.7% | | | | | | | | | |
| | Government of Sri Lanka, | | | | | | | | | | | | |
| | 10.60%, 7/01/19 | | | 964,930,000 | | | | LKR | | | | 6,305,090 | |
| | 8.00%, 11/01/19 | | | 40,210,000 | | | | LKR | | | | 244,217 | |
| | 11.20%, 7/01/22 | | | 69,990,000 | | | | LKR | | | | 449,828 | |
| | A, 8.00%, 11/15/18 | | | 320,500,000 | | | | LKR | | | | 2,011,480 | |
| | A, 9.00%, 5/01/21 | | | 828,720,000 | | | | LKR | | | | 4,973,924 | |
| | A, 11.00%, 8/01/21 | | | 575,640,000 | | | | LKR | | | | 3,702,445 | |
| | B, 8.50%, 7/15/18 | | | 146,350,000 | | | | LKR | | | | 940,601 | |
| | D, 8.50%, 6/01/18 | | | 395,000,000 | | | | LKR | | | | 2,553,762 | |
| | | | | | | | | | | | | | |
| | | | | | | | | | | | | 21,181,347 | |
| | | | | | | | | | | | | | |
| h | | Supranational 0.3% | | | | | | | | | |
| | Inter-American Development Bank, senior bond, 7.50%, 12/05/24 | | | 200,000,000 | | | | MXN | | | | 9,573,254 | |
| | | | | | | | | | | | | | |
| | | Ukraine 4.0% | | | | | | | | | |
| g | | Government of Ukraine, | | | | | | | | | | | | |
| | 144A, 7.75%, 9/01/19 | | | 4,249,000 | | | | | | | | 4,280,868 | |
| | 144A, 7.75%, 9/01/20 | | | 14,822,000 | | | | | | | | 14,710,835 | |
| | 144A, 7.75%, 9/01/21 | | | 14,769,000 | | | | | | | | 14,473,620 | |
| | 144A, 7.75%, 9/01/22 | | | 14,769,000 | | | | | | | | 14,325,930 | |
| | 144A, 7.75%, 9/01/23 | | | 14,769,000 | | | | | | | | 14,178,240 | |
| | 144A, 7.75%, 9/01/24 | | | 14,769,000 | | | | | | | | 14,030,550 | |
FRANKLIN TEMPLETON VARIABLE INSURANCE PRODUCTS TRUST
STATEMENT OF INVESTMENTS
Templeton Global Bond VIP Fund (continued)
| | | | | | | | | | | | | | |
| | | | | Principal Amount* | | | | | | Value | |
| | | Foreign Government and Agency Securities (continued) | | | | | | | | | |
| | | Ukraine (continued) | | | | | | | | | |
| g | | Government of Ukraine, (continued) | | | | | | | | | | | | |
| | 144A, 7.75%, 9/01/25 | | | 14,769,000 | | | | | | | $ | 13,903,241 | |
| | 144A, 7.75%, 9/01/26 | | | 14,658,000 | | | | | | | | 13,778,520 | |
| | 144A, 7.75%, 9/01/27 | | | 14,658,000 | | | | | | | | 13,693,650 | |
| | i,j144A, VRI, GDP Linked Securities, 5/31/40 | | | 29,978,000 | | | | | | | | 9,143,290 | |
| | | | | | | | | | | | | | |
| | | | | | | | | | | | | 126,518,744 | |
| | | | | | | | | | | | | | |
| | | Total Foreign Government and Agency Securities
(Cost $2,356,822,885) | | | | | | | | 2,221,873,489 | |
| | | | | | | | | | | | | | |
| | | Quasi-Sovereign and Corporate Bonds (Cost $291,224) 0.0%† | | | | | | | | | |
| | | South Korea 0.0%† | | | | | | | | | |
| | The Export-Import Bank of Korea, senior note, 4.625%, 2/20/17 | | | 230,000 | | | | EUR | | | | 243,115 | |
| | | | | | | | | | | | | | |
| | | Total Investments before Short Term Investments
(Cost $2,357,114,109) | | | | | | | | 2,222,116,604 | |
| | | | | | | | | | | | | | |
| | | Short Term Investments 23.3% | | | | | | | | | |
| | | Foreign Government and Agency Securities 4.0% | | | | | | | | | |
| | | Colombia 0.0%† | | | | | | | | | |
| | Colombian Tes Corto Plazo, Strip, 3/14/17 - 9/12/17 | | | 6,196,000,000 | | | | COP | | | | 1,991,591 | |
| | | | | | | | | | | | | | |
| | | Malaysia 0.2% | | | | | | | | | |
| k | | Bank of Negara Monetary Note, 6/22/17 - 9/19/17 | | | 15,860,000 | | | | MYR | | | | 3,465,835 | |
| k | | Malaysia Treasury Bill, 1/20/17 | | | 16,710,000 | | | | MYR | | | | 3,719,707 | |
| | | | | | | | | | | | | | |
| | | | | | | | | | | | | 7,185,542 | |
| | | | | | | | | | | | | | |
| | | Mexico 2.2% | | | | | | | | | |
| k | | Mexico Treasury Bill, 2/16/17 - 11/09/17 | | | 148,933,020 | l | | | MXN | | | | 69,285,916 | |
| | | | | | | | | | | | | | |
| | | Philippines 1.5% | | | | | | | | | |
| k | | Philippine Treasury Bill, 1/18/17 - 9/27/17 | | | 2,341,700,000 | | | | PHP | | | | 46,958,274 | |
| | | | | | | | | | | | | | |
| | | South Korea 0.1% | | | | | | | | | |
| | Korea Monetary Stabilization Bond, senior note, 1.57%, 1/09/17 | | | 2,940,100,000 | | | | KRW | | | | 2,435,433 | |
| | | | | | | | | | | | | | |
| | | Total Foreign Government and Agency Securities
(Cost $138,588,843) | | | | | | | | 127,856,756 | |
| | | | | | | | | | | | | | |
| | | Total Investment before Money Market Funds and
Repurchase
Agreement (Cost $2,495,702,952) | | | | | | | | 2,349,973,360 | |
| | | | | | | | | | | | | | |
| | | | | Shares | | | | | | | |
| | | Money Market Funds (Cost $436,780,215) 13.9% | | | | | | | | | |
| | | United States 13.9% | | | | | | | | | |
| m,n | | Institutional Fiduciary Trust Money Market Portfolio, 0.09% | | | 436,780,215 | | | | | | | | 436,780,215 | |
| | | | | | | | | | | | | | |
FRANKLIN TEMPLETON VARIABLE INSURANCE PRODUCTS TRUST
STATEMENT OF INVESTMENTS
Templeton Global Bond VIP Fund (continued)
| | | | | | | | | | |
| | | | | Principal Amount* | | | Value | |
| | Repurchase Agreements (Cost $170,127,507) 5.4% | | | | | | | | |
| | | United States 5.4% | | | | | | |
o | | Joint Repurchase Agreement, 0.437%, 1/03/17 (Maturity Value $170,135,774) | | | | | | | | |
| | BNP Paribas Securities Corp. (Maturity Value $71,516,573) | | | | | | | | |
| | Deutsche Bank Securities Inc. (Maturity Value $8,937,232) | | | | | | | | |
| | HSBC Securities (USA) Inc. (Maturity Value $71,516,573) | | | | | | | | |
| | Merrill Lynch, Pierce, Fenner & Smith Inc. (Maturity Value $18,165,396) | | | | | | | | |
| | Collateralized by U.S. Government Agency Securities, 0.00% - 1.75%, 6/09/17 - 2/26/19;
kU.S. Treasury Bill, 5/04/17 - 5/25/17; U.S. Treasury Note, 0.50% - 3.50%, 12/31/16 - 8/31/21; and U.S. Treasury Note, Index Linked, 1.375%, 7/15/18 (valued at $173,569,581) | | | 170,127,507 | | | $ | 170,127,507 | |
| | | | | | | | | | |
| | Total Investments (Cost $3,102,610,674) 93.8% | | | | | | | 2,956,881,082 | |
| | Other Assets, less Liabilities 6.2% | | | | | | | 194,243,524 | |
| | | | | | | | | | |
| | Net Assets 100.0% | | | | | | $ | 3,151,124,606 | |
| | | | | | | | | | |
†Rounds to less than 0.1% of net assets.
*The principal amount is stated in U.S. dollars unless otherwise indicated.
aPrincipal amount is stated in 1,000 Brazilian Real Units.
bRedemption price at maturity is adjusted for inflation. See Note 1(h).
cPrincipal amount is stated in 100 Mexican Peso Units.
dA portion or all of the security purchased on a delayed delivery basis. See Note 1(d).
ePrincipal amount of security is adjusted for inflation. See Note 1(h).
fPrincipal amount is stated in 100 Unidad de Inversion Units.
gSecurity was purchased pursuant to Rule 144A under the Securities Act of 1933 and may be sold in transactions exempt from registration only to qualified institutional buyers or in a public offering registered under the Securities Act of 1933. These securities have been deemed liquid under guidelines approved by the Trust’s Board of Trustees. At December 31, 2016, the aggregate value of these securities was $153,632,121, representing 4.8% of net assets.
hA supranational organization is an entity formed by two or more central governments through international treaties.
iNon-income producing.
jThe principal represents the notional amount. See Note 1(e) regarding value recovery instruments.
kThe security was issued on a discount basis with no stated coupon rate.
lPrincipal amount is stated in 10 Mexican Peso Units.
mSee Note 3(e) regarding investments in affiliated management investment companies.
nThe rate shown is the annualized seven-day yield at period end.
oSee Note 1(c) regarding joint repurchase agreement.
FRANKLIN TEMPLETON VARIABLE INSURANCE PRODUCTS TRUST
STATEMENT OF INVESTMENTS
Templeton Global Bond VIP Fund (continued)
At December 31, 2016, the Fund had the following forward exchange contracts outstanding. See Note 1(e).
| | | | | | | | | | | | | | | | | | | | | | | | | | | | |
| Forward Exchange Contracts | |
| Currency | | | Counterparty | a | | | Type | | | | Quantity | | |
| Contract
Amount |
* | |
| Settlement
Date |
| |
| Unrealized
Appreciation |
| |
| Unrealized
Depreciation |
|
| OTC Forward Exchange Contracts | | | | | | | | | | | | | | | | | | | | | |
Malaysian Ringgit | | | JPHQ | | | | Buy | | | | 5,661,200 | | | | 1,373,578 | | | | 1/05/17 | | | $ | — | | | $ | (112,113 | ) |
Chilean Peso | | | MSCO | | | | Buy | | | | 4,857,290,000 | | | | 7,316,849 | | | | 1/09/17 | | | | — | | | | (73,667 | ) |
Euro | | | HSBK | | | | Sell | | | | 11,263,000 | | | | 12,679,322 | | | | 1/09/17 | | | | 821,865 | | | | — | |
Euro | | | JPHQ | | | | Sell | | | | 32,859,900 | | | | 36,993,093 | | | | 1/09/17 | | | | 2,398,857 | | | | — | |
Malaysian Ringgit | | | HSBK | | | | Buy | | | | 3,317,000 | | | | 748,758 | | | | 1/09/17 | | | | — | | | | (9,841 | ) |
Japanese Yen | | | DBAB | | | | Sell | | | | 770,370,000 | | | | 7,640,513 | | | | 1/10/17 | | | | 1,045,907 | | | | — | |
Japanese Yen | | | GSCO | | | | Sell | | | | 329,010,000 | | | | 2,808,307 | | | | 1/10/17 | | | | — | | | | (8,121 | ) |
Japanese Yen | | | JPHQ | | | | Sell | | | | 1,415,975,000 | | | | 12,041,525 | | | | 1/10/17 | | | | — | | | | (79,659 | ) |
Japanese Yen | | | JPHQ | | | | Sell | | | | 1,415,975,000 | | | | 14,047,371 | | | | 1/10/17 | | | | 1,926,186 | | | | — | |
Chilean Peso | | | JPHQ | | | | Buy | | | | 1,792,000,000 | | | | 2,668,056 | | | | 1/11/17 | | | | 3,528 | | | | — | |
Euro | | | BZWS | | | | Sell | | | | 6,181,000 | | | | 6,804,230 | | | | 1/11/17 | | | | 296,282 | | | | — | |
Euro | | | GSCO | | | | Sell | | | | 5,023,100 | | | | 5,636,571 | | | | 1/11/17 | | | | 347,771 | | | | — | |
Euro | | | HSBK | | | | Sell | | | | 3,999,292 | | | | 4,493,125 | | | | 1/11/17 | | | | 282,287 | | | | — | |
Euro | | | MSCO | | | | Sell | | | | 5,225,000 | | | | 5,862,189 | | | | 1/11/17 | | | | 360,809 | | | | — | |
Euro | | | SCNY | | | | Sell | | | | 2,400,751 | | | | 2,698,444 | | | | 1/11/17 | | | | 170,704 | | | | — | |
Japanese Yen | | | BZWS | | | | Sell | | | | 1,689,110,000 | | | | 16,913,256 | | | | 1/11/17 | | | | 2,453,087 | | | | — | |
Malaysian Ringgit | | | HSBK | | | | Buy | | | | 4,010,000 | | | | 1,001,624 | | | | 1/11/17 | | | | — | | | | (108,448 | ) |
Chilean Peso | | | DBAB | | | | Buy | | | | 1,148,389,500 | | | | 1,707,515 | | | | 1/12/17 | | | | 4,343 | | | | — | |
Euro | | | BOFA | | | | Sell | | | | 2,643,000 | | | | 2,958,653 | | | | 1/12/17 | | | | 175,697 | | | | — | |
Euro | | | CITI | | | | Buy | | | | 5,040,000 | | | | 5,431,709 | | | | 1/13/17 | | | | — | | | | (124,530 | ) |
Euro | | | CITI | | | | Sell | | | | 5,040,000 | | | | 5,555,718 | | | | 1/13/17 | | | | 248,539 | | | | — | |
Euro | | | GSCO | | | | Sell | | | | 8,105,300 | | | | 8,587,160 | | | | 1/13/17 | | | | 52,184 | | | | — | |
Euro | | | HSBK | | | | Sell | | | | 8,692,000 | | | | 9,671,241 | | | | 1/13/17 | | | | 518,463 | | | | — | |
Euro | | | SCNY | | | | Sell | | | | 15,572,000 | | | | 17,132,314 | | | | 1/13/17 | | | | 734,816 | | | | — | |
Japanese Yen | | | BZWS | | | | Sell | | | | 1,089,820,000 | | | | 10,711,242 | | | | 1/13/17 | | | | 1,380,372 | | | | — | |
Chilean Peso | | | DBAB | | | | Buy | | | | 1,148,389,500 | | | | 1,705,867 | | | | 1/17/17 | | | | 4,963 | | | | — | |
Euro | | | BZWS | | | | Sell | | | | 1,161,439 | | | | 1,268,512 | | | | 1/17/17 | | | | 45,234 | | | | — | |
Euro | | | JPHQ | | | | Sell | | | | 36,882,000 | | | | 40,209,337 | | | | 1/17/17 | | | | 1,363,596 | | | | — | |
Japanese Yen | | | CITI | | | | Sell | | | | 138,680,000 | | | | 1,190,938 | | | | 1/17/17 | | | | 3,298 | | | | — | |
Japanese Yen | | | SCNY | | | | Sell | | | | 415,980,000 | | | | 3,561,503 | | | | 1/17/17 | | | | — | | | | (905 | ) |
Malaysian Ringgit | | | DBAB | | | | Buy | | | | 60,000,000 | | | | 12,862,288 | EUR | | | 1/17/17 | | | | — | | | | (188,263 | ) |
Chilean Peso | | | DBAB | | | | Buy | | | | 1,231,460,000 | | | | 1,832,257 | | | | 1/18/17 | | | | 2,108 | | | | — | |
Chilean Peso | | | GSCO | | | | Buy | | | | 4,809,568,000 | | | | 7,124,125 | | | | 1/18/17 | | | | 40,138 | | | | — | |
Euro | | | GSCO | | | | Sell | | | | 3,095,000 | | | | 3,426,413 | | | | 1/18/17 | | | | 166,443 | | | | — | |
Indian Rupee | | | JPHQ | | | | Buy | | | | 82,107,000 | | | | 1,213,109 | | | | 1/18/17 | | | | — | | | | (7,043 | ) |
Euro | | | BZWS | | | | Sell | | | | 7,066,000 | | | | 7,539,895 | | | | 1/19/17 | | | | 96,854 | | | | — | |
Euro | | | JPHQ | | | | Sell | | | | 27,973,000 | | | | 30,980,237 | | | | 1/19/17 | | | | 1,514,597 | | | | — | |
Japanese Yen | | | HSBK | | | | Sell | | | | 536,380,000 | | | | 5,115,201 | | | | 1/19/17 | | | | 521,151 | | | | — | |
Japanese Yen | | | JPHQ | | | | Sell | | | | 652,895,000 | | | | 5,639,417 | | | | 1/19/17 | | | | 47,425 | | | | — | |
Japanese Yen | | | SCNY | | | | Sell | | | | 707,660,000 | | | | 6,755,220 | | | | 1/19/17 | | | | 694,171 | | | | — | |
Malaysian Ringgit | | | JPHQ | | | | Buy | | | | 25,688,213 | | | | 6,491,840 | | | | 1/19/17 | | | | — | | | | (773,182 | ) |
Chilean Peso | | | DBAB | | | | Buy | | | | 1,757,372,000 | | | | 2,598,778 | | | | 1/20/17 | | | | 18,349 | | | | — | |
Indian Rupee | | | DBAB | | | | Buy | | | | 491,655,000 | | | | 7,274,962 | | | | 1/20/17 | | | | — | | | | (54,442 | ) |
Euro | | | DBAB | | | | Sell | | | | 14,940,282 | | | | 16,473,421 | | | | 1/23/17 | | | | 732,455 | | | | — | |
Euro | | | JPHQ | | | | Sell | | | | 300,000 | | | | 331,089 | | | | 1/23/17 | | | | 15,011 | | | | — | |
Japanese Yen | | | DBAB | | | | Sell | | | | 858,140,000 | | | | 7,434,611 | | | | 1/23/17 | | | | 82,956 | | | | — | |
Malaysian Ringgit | | | DBAB | | | | Buy | | | | 12,933,000 | | | | 2,893,742 | EUR | | | 1/23/17 | | | | — | | | | (170,475 | ) |
Malaysian Ringgit | | | JPHQ | | | | Buy | | | | 16,628,000 | | | | 3,703,753 | EUR | | | 1/23/17 | | | | — | | | | (201,543 | ) |
FRANKLIN TEMPLETON VARIABLE INSURANCE PRODUCTS TRUST
STATEMENT OF INVESTMENTS
Templeton Global Bond VIP Fund (continued)
| | | | | | | | | | | | | | | | | | | | | | | | | | | | |
| Forward Exchange Contracts (continued) | | | | |
| Currency | | | Counterparty | a | | | Type | | | | Quantity | | |
| Contract
Amount |
* | |
| Settlement
Date |
| |
| Unrealized
Appreciation |
| |
| Unrealized
Depreciation |
|
| OTC Forward Exchange Contracts (continued) | | | | | | | | | | | | | | | | | |
Malaysian Ringgit | | | JPHQ | | | | Buy | | | | 26,736,000 | | | | 6,609,642 | | | | 1/23/17 | | | $ | — | | | $ | (659,316 | ) |
Chilean Peso | | | DBAB | | | | Buy | | | | 1,801,070,000 | | | | 2,675,784 | | | | 1/24/17 | | | | 5,131 | | | | — | |
Chilean Peso | | | JPHQ | | | | Buy | | | | 337,685,000 | | | | 502,694 | | | | 1/24/17 | | | | — | | | | (46 | ) |
Indian Rupee | | | DBAB | | | | Buy | | | | 79,271,000 | | | | 1,170,236 | | | | 1/25/17 | | | | — | | | | (6,607 | ) |
Japanese Yen | | | JPHQ | | | | Sell | | | | 1,407,000,000 | | | | 13,348,006 | | | | 1/25/17 | | | | 1,292,843 | | | | — | |
Malaysian Ringgit | | | HSBK | | | | Buy | | | | 21,822,825 | | | | 5,416,437 | | | | 1/25/17 | | | | — | | | | (560,230 | ) |
Chilean Peso | | | MSCO | | | | Buy | | | | 3,098,316,750 | | | | 4,695,131 | | | | 1/27/17 | | | | — | | | | (84,908 | ) |
Euro | | | GSCO | | | | Sell | | | | 4,711,000 | | | | 5,169,804 | | | | 1/27/17 | | | | 205,236 | | | | — | |
Indian Rupee | | | DBAB | | | | Buy | | | | 838,950,988 | | | | 12,392,607 | | | | 1/27/17 | | | | — | | | | (79,894 | ) |
Indian Rupee | | | JPHQ | | | | Buy | | | | 358,075,000 | | | | 5,293,835 | | | | 1/27/17 | | | | — | | | | (38,612 | ) |
Japanese Yen | | | GSCO | | | | Sell | | | | 944,420,000 | | | | 8,062,147 | | | | 1/27/17 | | | | — | | | | (30,604 | ) |
Japanese Yen | | | JPHQ | | | | Sell | | | | 490,100,000 | | | | 4,183,918 | | | | 1/27/17 | | | | — | | | | (15,756 | ) |
Malaysian Ringgit | | | DBAB | | | | Buy | | | | 16,628,000 | | | | 3,719,910 | EUR | | | 1/27/17 | | | | — | | | | (220,419 | ) |
Chilean Peso | | | DBAB | | | | Buy | | | | 3,122,089,000 | | | | 4,643,547 | | | | 1/30/17 | | | | 623 | | | | — | |
Euro | | | CITI | | | | Sell | | | | 132,315,770 | | | | 145,074,980 | | | | 1/30/17 | | | | 5,616,139 | | | | — | |
Euro | | | DBAB | | | | Sell | | | | 27,189,556 | | | | 29,826,671 | | | | 1/30/17 | | | | 1,169,286 | | | | — | |
Japanese Yen | | | DBAB | | | | Sell | | | | 8,368,505,770 | | | | 71,452,406 | | | | 1/30/17 | | | | — | | | | (268,716 | ) |
Chilean Peso | | | DBAB | | | | Buy | | | | 4,683,134,000 | | | | 7,021,041 | | | | 1/31/17 | | | | — | | | | (55,250 | ) |
Euro | | | BOFA | | | | Sell | | | | 65,140,400 | | | | 71,452,505 | | | | 1/31/17 | | | | 2,792,631 | | | | — | |
Euro | | | BZWS | | | | Sell | | | | 44,246,134 | | | | 48,521,284 | | | | 1/31/17 | | | | 1,884,574 | | | | — | |
Euro | | | GSCO | | | | Sell | | | | 41,639,000 | | | | 45,642,747 | | | | 1/31/17 | | | | 1,754,032 | | | | — | |
Indian Rupee | | | HSBK | | | | Buy | | | | 679,529,000 | | | | 10,062,311 | | | | 1/31/17 | | | | — | | | | (93,281 | ) |
Japanese Yen | | | HSBK | | | | Sell | | | | 1,162,462,488 | | | | 9,927,092 | | | | 1/31/17 | | | | — | | | | (36,004 | ) |
Malaysian Ringgit | | | HSBK | | | | Buy | | | | 3,005,000 | | | | 734,037 | | | | 1/31/17 | | | | — | | | | (65,561 | ) |
Malaysian Ringgit | | | JPHQ | | | | Buy | | | | 7,468,000 | | | | 1,796,272 | | | | 1/31/17 | | | | — | | | | (134,981 | ) |
Euro | | | HSBK | | | | Sell | | | | 25,974,891 | | | | 28,500,819 | | | | 2/01/17 | | | | 1,121,386 | | | | — | |
Euro | | | JPHQ | | | | Sell | | | | 11,263,000 | | | | 12,360,354 | | | | 2/01/17 | | | | 488,329 | | | | — | |
Euro | | | BOFA | | | | Sell | | | | 32,701,000 | | | | 36,220,936 | | | | 2/03/17 | | | | 1,748,813 | | | | — | |
Euro | | | DBAB | | | | Sell | | | | 12,156,556 | | | | 13,458,280 | | | | 2/03/17 | | | | 643,311 | | | | — | |
Indian Rupee | | | JPHQ | | | | Buy | | | | 60,607,000 | | | | 898,148 | | | | 2/03/17 | | | | — | | | | (9,286 | ) |
Chilean Peso | | | JPHQ | | | | Buy | | | | 612,933,000 | | | | 932,416 | | | | 2/06/17 | | | | — | | | | (21,091 | ) |
Chilean Peso | | | MSCO | | | | Buy | | | | 4,089,449,500 | | | | 6,216,858 | | | | 2/06/17 | | | | — | | | | (136,559 | ) |
Malaysian Ringgit | | | DBAB | | | | Buy | | | | 143,249,150 | | | | 31,213,045 | EUR | | | 2/06/17 | | | | — | | | | (1,047,653 | ) |
Malaysian Ringgit | | | JPHQ | | | | Buy | | | | 1,100,000 | | | | 270,084 | | | | 2/06/17 | | | | — | | | | (25,433 | ) |
Indian Rupee | | | HSBK | | | | Buy | | | | 240,033,500 | | | | 3,560,578 | | | | 2/07/17 | | | | — | | | | (41,696 | ) |
Chilean Peso | | | DBAB | | | | Buy | | | | 3,166,824,000 | | | | 4,823,799 | | | | 2/08/17 | | | | — | | | | (115,910 | ) |
Euro | | | BZWS | | | | Sell | | | | 7,003,000 | | | | 7,935,274 | | | | 2/08/17 | | | | 551,442 | | | | — | |
Euro | | | CITI | | | | Buy | | | | 9,440,554 | | | | 10,186,075 | | | | 2/08/17 | | | | — | | | | (232,131 | ) |
Euro | | | CITI | | | | Sell | | | | 9,440,554 | | | | 10,529,995 | | | | 2/08/17 | | | | 576,050 | | | | — | |
Indian Rupee | | | DBAB | | | | Buy | | | | 457,757,494 | | | | 6,787,123 | | | | 2/08/17 | | | | — | | | | (77,104 | ) |
Japanese Yen | | | JPHQ | | | | Sell | | | | 1,719,500,000 | | | | 14,857,666 | | | | 2/08/17 | | | | 115,970 | | | | — | |
Japanese Yen | | | SCNY | | | | Sell | | | | 1,720,000,000 | | | | 14,894,096 | | | | 2/08/17 | | | | 148,113 | | | | — | |
Malaysian Ringgit | | | HSBK | | | | Buy | | | | 21,208,085 | | | | 5,220,709 | | | | 2/08/17 | | | | — | | | | (504,132 | ) |
Chilean Peso | | | DBAB | | | | Buy | | | | 760,285,000 | | | | 1,152,122 | | | | 2/09/17 | | | | — | | | | (21,936 | ) |
Euro | | | CITI | | | | Buy | | | | 6,572,000 | | | | 7,091,319 | | | | 2/09/17 | | | | — | | | | (161,636 | ) |
Euro | | | CITI | | | | Sell | | | | 6,572,000 | | | | 7,450,118 | | | | 2/09/17 | | | | 520,434 | | | | — | |
Euro | | | DBAB | | | | Sell | | | | 11,745,000 | | | | 13,061,849 | | | | 2/09/17 | | | | 677,624 | | | | — | |
Euro | | | GSCO | | | | Sell | | | | 2,045,000 | | | | 2,308,396 | | | | 2/09/17 | | | | 152,096 | | | | — | |
Japanese Yen | | | BZWS | | | | Sell | | | | 1,720,220,000 | | | | 14,916,280 | | | | 2/09/17 | | | | 167,859 | | | | — | |
FRANKLIN TEMPLETON VARIABLE INSURANCE PRODUCTS TRUST
STATEMENT OF INVESTMENTS
Templeton Global Bond VIP Fund (continued)
| | | | | | | | | | | | | | | | | | | | | | | | | | | | |
| Forward Exchange Contracts (continued) | | | | |
| Currency | | | Counterparty | a | | | Type | | | | Quantity | | |
| Contract
Amount |
* | |
| Settlement
Date |
| |
| Unrealized
Appreciation |
| |
| Unrealized
Depreciation |
|
OTC Forward Exchange Contracts (continued) | | | | | | | | | | | | | | | | | |
Japanese Yen | | | CITI | | | | Sell | | | | 366,860,000 | | | | 3,181,787 | | | | 2/09/17 | | | $ | 36,488 | | | $ | — | |
Japanese Yen | | | JPHQ | | | | Sell | | | | 1,723,960,000 | | | | 14,912,633 | | | | 2/09/17 | | | | 132,147 | | | | — | |
Euro | | | DBAB | | | | Sell | | | | 1,738,000 | | | | 1,957,544 | | | | 2/10/17 | | | | 124,876 | | | | — | |
Euro | | | HSBK | | | | Sell | | | | 1,800,000 | | | | 2,025,432 | | | | 2/10/17 | | | | 127,387 | | | | — | |
Indian Rupee | | | DBAB | | | | Buy | | | | 39,609,000 | | | | 586,452 | | | | 2/10/17 | | | | — | | | | (5,965 | ) |
Japanese Yen | | | CITI | | | | Sell | | | | 751,731,000 | | | | 7,386,640 | | | | 2/10/17 | | | | 941,383 | | | | — | |
Euro | | | BZWS | | | | Sell | | | | 6,341,000 | | | | 7,266,152 | | | | 2/13/17 | | | | 578,923 | | | | — | |
Malaysian Ringgit | | | HSBK | | | | Buy | | | | 9,650,000 | | | | 2,385,087 | | | | 2/13/17 | | | | — | | | | (239,331 | ) |
Euro | | | BZWS | | | | Sell | | | | 8,485,276 | | | | 9,377,231 | | | | 2/14/17 | | | | 428,272 | | | | — | |
Euro | | | CITI | | | | Sell | | | | 37,063,039 | | | | 40,908,329 | | | | 2/14/17 | | | | 1,819,957 | | | | — | |
Euro | | | DBAB | | | | Sell | | | | 50,881,000 | | | | 55,797,749 | | | | 2/14/17 | | | | 2,136,324 | | | | — | |
Euro | | | GSCO | | | | Sell | | | | 2,279,000 | | | | 2,512,711 | | | | 2/14/17 | | | | 109,174 | | | | — | |
Euro | | | JPHQ | | | | Sell | | | | 15,313,111 | | | | 16,881,480 | | | | 2/14/17 | | | | 731,574 | | | | — | |
Euro | | | SCNY | | | | Sell | | | | 4,975,000 | | | | 5,452,481 | | | | 2/14/17 | | | | 205,619 | | | | — | |
Chilean Peso | | | MSCO | | | | Buy | | | | 2,572,200,000 | | | | 3,882,566 | | | | 2/15/17 | | | | — | | | | (60,445 | ) |
Australian Dollar | | | JPHQ | | | | Sell | | | | 100,287,000 | | | | 75,349,635 | | | | 2/16/17 | | | | 3,070,726 | | | | — | |
Euro | | | GSCO | | | | Sell | | | | 3,797,000 | | | | 4,202,598 | | | | 2/16/17 | | | | 197,774 | | | | — | |
Euro | | | SCNY | | | | Sell | | | | 657,000 | | | | 748,606 | | | | 2/16/17 | | | | 55,645 | | | | — | |
Indian Rupee | | | DBAB | | | | Buy | | | | 239,338,000 | | | | 3,525,940 | | | | 2/16/17 | | | | — | | | | (20,492 | ) |
Indian Rupee | | | HSBK | | | | Buy | | | | 402,232,000 | | | | 5,999,881 | | | | 2/16/17 | | | | — | | | | (108,616 | ) |
Japanese Yen | | | CITI | | | | Sell | | | | 2,056,230,000 | | | | 18,507,416 | | | | 2/16/17 | | | | 873,575 | | | | — | |
Japanese Yen | | | GSCO | | | | Sell | | | | 1,205,250,280 | | | | 10,779,075 | | | | 2/16/17 | | | | 443,076 | | | | — | |
Japanese Yen | | | HSBK | | | | Sell | | | | 1,035,240,000 | | | | 9,188,657 | | | | 2/16/17 | | | | 310,634 | | | | — | |
Japanese Yen | | | JPHQ | | | | Sell | | | | 2,553,380,000 | | | | 24,153,898 | | | | 2/16/17 | | | | 2,256,593 | | | | — | |
Malaysian Ringgit | | | HSBK | | | | Buy | | | | 4,326,000 | | | | 989,252 | | | | 2/16/17 | | | | — | | | | (27,427 | ) |
Chilean Peso | | | DBAB | | | | Buy | | | | 2,509,219,500 | | | | 3,717,362 | | | | 2/17/17 | | | | 10,677 | | | | — | |
Euro | | | DBAB | | | | Sell | | | | 5,008,730 | | | | 5,399,778 | | | | 2/17/17 | | | | 116,680 | | | | — | |
Euro | | | MSCO | | | | Sell | | | | 11,641,500 | | | | 12,541,224 | | | | 2/17/17 | | | | 262,027 | | | | — | |
Australian Dollar | | | CITI | | | | Sell | | | | 13,307,000 | | | | 10,034,822 | | | | 2/21/17 | | | | 445,258 | | | | — | |
Chilean Peso | | | JPHQ | | | | Buy | | | | 462,964,638 | | | | 680,280 | | | | 2/21/17 | | | | 7,380 | | | | — | |
Euro | | | DBAB | | | | Sell | | | | 5,073,398 | | | | 5,465,368 | | | | 2/21/17 | | | | 113,166 | | | | — | |
Euro | | | HSBK | | | | Sell | | | | 19,488,000 | | | | 21,014,300 | | | | 2/21/17 | | | | 455,353 | | | | — | |
Euro | | | UBSW | | | | Sell | | | | 3,245,000 | | | | 3,497,721 | | | | 2/21/17 | | | | 74,394 | | | | — | |
Indian Rupee | | | JPHQ | | | | Buy | | | | 378,455,000 | | | | 5,514,425 | | | | 2/21/17 | | | | 25,751 | | | | — | |
Malaysian Ringgit | | | HSBK | | | | Buy | | | | 4,899,000 | | | | 1,146,904 | | | | 2/21/17 | | | | — | | | | (57,862 | ) |
Chilean Peso | | | JPHQ | | | | Buy | | | | 468,520,362 | | | | 689,508 | | | | 2/22/17 | | | | 6,359 | | | | — | |
Euro | | | BZWS | | | | Sell | | | | 23,759,728 | | | | 25,925,318 | | | | 2/22/17 | | | | 858,845 | | | | — | |
Euro | | | DBAB | | | | Sell | | | | 3,964,000 | | | | 4,218,727 | | | | 2/22/17 | | | | 36,713 | | | | — | |
Euro | | | JPHQ | | | | Sell | | | | 23,160,581 | | | | 24,675,283 | | | | 2/22/17 | | | | 240,909 | | | | — | |
Euro | | | DBAB | | | | Sell | | | | 3,887,000 | | | | 4,149,761 | | | | 2/23/17 | | | | 48,811 | | | | — | |
Euro | | | JPHQ | | | | Sell | | | | 28,236,000 | | | | 30,161,695 | | | | 2/23/17 | | | | 371,518 | | | | — | |
Euro | | | UBSW | | | | Sell | | | | 678,250 | | | | 724,388 | | | | 2/23/17 | | | | 8,805 | | | | — | |
Chilean Peso | | | DBAB | | | | Buy | | | | 3,444,155,000 | | | | 5,065,679 | | | | 2/27/17 | | | | 48,022 | | | | — | |
Chilean Peso | | | MSCO | | | | Buy | | | | 3,098,316,750 | | | | 4,570,463 | | | | 2/27/17 | | | | 29,755 | | | | — | |
Euro | | | BOFA | | | | Sell | | | | 2,680,925 | | | | 2,857,893 | | | | 2/27/17 | | | | 28,930 | | | | — | |
Euro | | | BZWS | | | | Sell | | | | 744,197 | | | | 793,973 | | | | 2/27/17 | | | | 8,683 | | | | — | |
Euro | | | DBAB | | | | Sell | | | | 837,570 | | | | 893,775 | | | | 2/27/17 | | | | 9,956 | | | | — | |
Euro | | | GSCO | | | | Sell | | | | 4,454,000 | | | | 4,747,430 | | | | 2/27/17 | | | | 47,485 | | | | — | |
Euro | | | JPHQ | | | | Sell | | | | 4,730,771 | | | | 5,044,681 | | | | 2/27/17 | | | | 52,683 | | | | — | |
FRANKLIN TEMPLETON VARIABLE INSURANCE PRODUCTS TRUST
STATEMENT OF INVESTMENTS
Templeton Global Bond VIP Fund (continued)
| | | | | | | | | | | | | | | | | | | | | | | | | | | | |
| Forward Exchange Contracts (continued) | | | | |
| Currency | | | Counterparty | a | | | Type | | | | Quantity | | |
| Contract
Amount |
* | |
| Settlement
Date |
| |
| Unrealized
Appreciation |
| |
| Unrealized
Depreciation |
|
OTC Forward Exchange Contracts (continued) | | | | | | | | | | | | | | | | | |
Euro | | | SCNY | | | | Sell | | | | 13,581,483 | | | | 14,482,750 | | | | 2/27/17 | | | $ | 151,313 | | | $ | — | |
Indian Rupee | | | JPHQ | | | | Buy | | | | 139,661,000 | | | | 2,028,040 | | | | 2/27/17 | | | | 15,191 | | | | — | |
Japanese Yen | | | BZWS | | | | Sell | | | | 343,460,000 | | | | 3,106,268 | | | | 2/27/17 | | | | 159,607 | | | | — | |
Japanese Yen | | | HSBK | | | | Sell | | | | 1,131,678,000 | | | | 10,219,095 | | | | 2/27/17 | | | | 510,043 | | | | — | |
Chilean Peso | | | CITI | | | | Buy | | | | 3,039,493,000 | | | | 4,445,068 | | | | 2/28/17 | | | | 67,512 | | | | — | |
Chilean Peso | | | DBAB | | | | Buy | | | | 2,915,416,000 | | | | 4,263,239 | | | | 2/28/17 | | | | 65,130 | | | | — | |
Euro | | | BOFA | | | | Sell | | | | 2,694,506 | | | | 3,004,590 | | | | 2/28/17 | | | | 161,177 | | | | — | |
Euro | | | DBAB | | | | Sell | | | | 1,530,900 | | | | 1,708,714 | | | | 2/28/17 | | | | 93,212 | | | | — | |
Euro | | | SCNY | | | | Sell | | | | 11,263,000 | | | | 11,963,953 | | | | 2/28/17 | | | | 78,526 | | | | — | |
Japanese Yen | | | BZWS | | | | Sell | | | | 1,576,550,000 | | | | 15,548,290 | | | | 2/28/17 | | | | 2,022,023 | | | | — | |
Japanese Yen | | | JPHQ | | | | Sell | | | | 372,662,000 | | | | 3,675,530 | | | | 2/28/17 | | | | 478,216 | | | | — | |
Malaysian Ringgit | | | JPHQ | | | | Buy | | | | 8,340,000 | | | | 2,067,786 | | | | 2/28/17 | | | | — | | | | (214,246 | ) |
Euro | | | DBAB | | | | Sell | | | | 2,579,651 | | | | 2,881,651 | | | | 3/01/17 | | | | 159,279 | | | | — | |
Euro | | | HSBK | | | | Sell | | | | 18,537,726 | | | | 19,713,760 | | | | 3/01/17 | | | | 150,419 | | | | — | |
Japanese Yen | | | DBAB | | | | Sell | | | | 229,660,000 | | | | 2,063,933 | | | | 3/01/17 | | | | 93,415 | | | | — | |
Euro | | | GSCO | | | | Sell | | | | 463,000 | | | | 493,007 | | | | 3/02/17 | | | | 4,362 | | | | — | |
Japanese Yen | | | JPHQ | | | | Sell | | | | 848,300,000 | | | | 7,609,846 | | | | 3/03/17 | | | | 330,468 | | | | — | |
Chilean Peso | | | DBAB | | | | Buy | | | | 1,271,380,000 | | | | 1,871,052 | | | | 3/06/17 | | | | 15,758 | | | | — | |
Euro | | | BZWS | | | | Sell | | | | 8,311,299 | | | | 8,868,530 | | | | 3/06/17 | | | | 94,790 | | | | — | |
Japanese Yen | | | HSBK | | | | Sell | | | | 400,800,000 | | | | 3,569,012 | | | | 3/06/17 | | | | 129,101 | | | | — | |
Euro | | | BZWS | | | | Sell | | | | 6,231,299 | | | | 6,695,063 | | | | 3/07/17 | | | | 116,663 | | | | — | |
Euro | | | DBAB | | | | Sell | | | | 1,536,000 | | | | 1,702,687 | | | | 3/07/17 | | | | 81,127 | | | | — | |
South Korean Won | | | GSCO | | | | Sell | | | | 44,346,000,000 | | | | 37,918,769 | | | | 3/07/17 | | | | 1,197,054 | | | | — | |
Japanese Yen | | | BZWS | | | | Sell | | | | 1,712,605,900 | | | | 17,026,370 | | | | 3/09/17 | | | | 2,325,215 | | | | — | |
Australian Dollar | | | CITI | | | | Sell | | | | 28,906,000 | | | | 22,089,098 | | | | 3/13/17 | | | | 1,267,679 | | | | — | |
Australian Dollar | | | JPHQ | | | | Sell | | | | 43,169,000 | | | | 32,234,724 | | | | 3/13/17 | | | | 1,139,456 | | | | — | |
Chilean Peso | | | DBAB | | | | Buy | | | | 1,866,989,500 | | | | 2,801,185 | | | | 3/13/17 | | | | — | | | | (31,722 | ) |
Japanese Yen | | | DBAB | | | | Sell | | | | 595,700,000 | | | | 5,192,009 | | | | 3/13/17 | | | | 77,298 | | | | — | |
Australian Dollar | | | CITI | | | | Sell | | | | 29,097,000 | | | | 21,738,951 | | | | 3/14/17 | | | | 780,430 | | | | — | |
Australian Dollar | | | JPHQ | | | | Sell | | | | 43,804,000 | | | | 32,445,623 | | | | 3/14/17 | | | | 893,675 | | | | — | |
Euro | | | MSCO | | | | Sell | | | | 7,946,500 | | | | 8,480,983 | | | | 3/14/17 | | | | 88,341 | | | | — | |
Indian Rupee | | | DBAB | | | | Buy | | | | 258,123,000 | | | | 3,776,489 | | | | 3/14/17 | | | | — | | | | (8,013 | ) |
Malaysian Ringgit | | | HSBK | | | | Buy | | | | 796,554,000 | | | | 194,613,731 | | | | 3/14/17 | | | | — | | | | (17,728,826 | ) |
Euro | | | BOFA | | | | Sell | | | | 17,769,000 | | | | 18,947,973 | | | | 3/15/17 | | | | 180,247 | | | | — | |
Euro | | | JPHQ | | | | Sell | | | | 5,636,000 | | | | 6,008,963 | | | | 3/15/17 | | | | 56,186 | | | | — | |
Euro | | | JPHQ | | | | Sell | | | | 17,833,294 | | | | 19,075,383 | | | | 3/16/17 | | | | 238,626 | | | | — | |
Euro | | | MSCO | | | | Sell | | | | 17,573,000 | | | | 18,775,816 | | | | 3/16/17 | | | | 214,000 | | | | — | |
Indian Rupee | | | CITI | | | | Buy | | | | 69,318,000 | | | | 1,015,053 | | | | 3/17/17 | | | | — | | | | (3,471 | ) |
Malaysian Ringgit | | | JPHQ | | | | Buy | | | | 14,772,000 | | | | 3,578,142 | | | | 3/20/17 | | | | — | | | | (298,997 | ) |
South Korean Won | | | CITI | | | | Sell | | | | 11,790,000,000 | | | | 10,762,700 | | | | 3/20/17 | | | | 1,000,073 | | | | — | |
South Korean Won | | | HSBK | | | | Buy | | | | 16,500,000,000 | | | | 14,076,096 | | | | 3/20/17 | | | | — | | | | (413,386 | ) |
South Korean Won | | | HSBK | | | | Sell | | | | 23,507,000,000 | | | | 21,532,472 | | | | 3/20/17 | | | | 2,067,664 | | | | — | |
Japanese Yen | | | BZWS | | | | Sell | | | | 981,707,504 | | | | 9,651,077 | | | | 3/21/17 | | | | 1,218,221 | | | | — | |
Malaysian Ringgit | | | HSBK | | | | Buy | | | | 36,880,000 | | | | 8,974,328 | | | | 3/22/17 | | | | — | | | | (788,535 | ) |
Japanese Yen | | | CITI | | | | Sell | | | | 1,866,452,000 | | | | 18,480,638 | | | | 3/23/17 | | | | 2,445,999 | | | | — | |
Japanese Yen | | | DBAB | | | | Sell | | | | 725,287,000 | | | | 7,183,905 | | | | 3/23/17 | | | | 952,984 | | | | — | |
Japanese Yen | | | MSCO | | | | Sell | | | | 575,230,000 | | | | 5,696,587 | | | | 3/23/17 | | | | 754,802 | | | | — | |
Japanese Yen | | | BZWS | | | | Sell | | | | 983,714,840 | | | | 9,740,667 | | | | 3/24/17 | | | | 1,289,115 | | | | — | |
Japanese Yen | | | JPHQ | | | | Sell | | | | 285,510,329 | | | | 2,593,756 | | | | 3/24/17 | | | | 140,804 | | | | — | |
FRANKLIN TEMPLETON VARIABLE INSURANCE PRODUCTS TRUST
STATEMENT OF INVESTMENTS
Templeton Global Bond VIP Fund (continued)
| | | | | | | | | | | | | | | | | | | | | | | | | | | | |
| Forward Exchange Contracts (continued) | |
| Currency | | | Counterparty | a | | | Type | | | | Quantity | | |
| Contract
Amount |
* | |
| Settlement
Date |
| |
| Unrealized
Appreciation |
| |
| Unrealized
Depreciation |
|
OTC Forward Exchange Contracts (continued) | | | | | | | | | | | | | | | | | |
South Korean Won | | | HSBK | | | | Sell | | | | 35,125,000,000 | | | | 31,371,411 | | | | 3/27/17 | | | $ | 2,286,960 | | | $ | — | |
Malaysian Ringgit | | | HSBK | | | | Buy | | | | 20,347,000 | | | | 4,889,930 | | | | 3/28/17 | | | | — | | | | (375,364 | ) |
Philippine Peso | | | JPHQ | | | | Buy | | | | 123,740,000 | | | | 2,532,024 | | | | 3/28/17 | | | | — | | | | (68,376 | ) |
South Korean Won | | | HSBK | | | | Sell | | | | 35,292,000,000 | | | | 31,856,298 | | | | 3/28/17 | | | | 2,633,648 | | | | — | |
Philippine Peso | | | JPHQ | | | | Buy | | | | 17,950,000 | | | | 377,061 | | | | 3/29/17 | | | | — | | | | (19,728 | ) |
Japanese Yen | | | JPHQ | | | | Sell | | | | 172,207,000 | | | | 1,537,617 | | | | 3/31/17 | | | | 57,522 | | | | — | |
Malaysian Ringgit | | | HSBK | | | | Buy | | | | 7,790,000 | | | | 1,927,979 | | | | 3/31/17 | | | | — | | | | (199,849 | ) |
Australian Dollar | | | GSCO | | | | Sell | | | | 127,700,540 | | | | 97,740,716 | | | | 4/06/17 | | | | 5,807,074 | | | | — | |
Japanese Yen | | | JPHQ | | | | Sell | | | | 1,415,975,000 | | | | 13,860,841 | | | | 4/07/17 | | | | 1,686,375 | | | | — | |
Japanese Yen | | | HSBK | | | | Sell | | | | 2,816,800,000 | | | | 27,393,450 | | | | 4/11/17 | | | | 3,169,819 | | | | — | |
Malaysian Ringgit | | | JPHQ | | | | Buy | | | | 3,956,000 | | | | 1,010,447 | | | | 4/11/17 | | | | — | | | | (133,408 | ) |
Japanese Yen | | | BZWS | | | | Sell | | | | 1,426,300,000 | | | | 13,870,331 | | | | 4/13/17 | | | | 1,603,325 | | | | — | |
Japanese Yen | | | CITI | | | | Sell | | | | 261,800,000 | | | | 2,460,526 | | | | 4/13/17 | | | | 208,895 | | | | — | |
Japanese Yen | | | DBAB | | | | Sell | | | | 1,406,600,000 | | | | 13,687,007 | | | | 4/13/17 | | | | 1,589,432 | | | | — | |
Japanese Yen | | | BOFA | | | | Sell | | | | 700,840,000 | | | | 6,516,817 | | | | 4/18/17 | | | | 487,644 | | | | — | |
South Korean Won | | | HSBK | | | | Buy | | | | 55,000,000,000 | | | | 47,271,165 | | | | 4/18/17 | | | | — | | | | (1,725,276 | ) |
South Korean Won | | | HSBK | | | | Sell | | | | 60,991,000,000 | | | | 53,665,640 | | | | 4/18/17 | | | | 3,158,563 | | | | — | |
Japanese Yen | | | JPHQ | | | | Sell | | | | 1,886,055,000 | | | | 17,832,975 | | | | 4/20/17 | | | | 1,605,996 | | | | — | |
Japanese Yen | | | JPHQ | | | | Sell | | | | 917,650,000 | | | | 8,509,247 | | | | 4/21/17 | | | | 613,693 | | | | — | |
Japanese Yen | | | BZWS | | | | Sell | | | | 735,200,000 | | | | 7,130,011 | | | | 4/24/17 | | | | 803,303 | | | | — | |
South Korean Won | | | HSBK | | | | Sell | | | | 46,898,000,000 | | | | 41,144,010 | | | | 4/25/17 | | | | 2,305,945 | | | | — | |
South Korean Won | | | HSBK | | | | Sell | | | | 13,067,000,000 | | | | 11,402,766 | | | | 4/26/17 | | | | 581,413 | | | | — | |
South Korean Won | | | HSBK | | | | Sell | | | | 15,755,000,000 | | | | 13,758,023 | | | | 5/02/17 | | | | 710,188 | | | | — | |
Indonesian Rupiah | | | JPHQ | | | | Buy | | | | 1,721,000,000,000 | | | | 122,316,986 | | | | 5/03/17 | | | | 2,334,947 | | | | — | |
Japanese Yen | | | GSCO | | | | Sell | | | | 490,555,000 | | | | 4,734,858 | | | | 5/15/17 | | | | 508,880 | | | | — | |
Japanese Yen | | | HSBK | | | | Sell | | | | 413,563,000 | | | | 3,992,306 | | | | 5/15/17 | | | | 429,590 | | | | — | |
Japanese Yen | | | SCNY | | | | Sell | | | | 366,681,000 | | | | 3,555,539 | | | | 5/15/17 | | | | 396,697 | | | | — | |
South Korean Won | | | CITI | | | | Sell | | | | 11,823,000,000 | | | | 10,319,455 | | | | 5/15/17 | | | | 527,286 | | | | — | |
Japanese Yen | | | MSCO | | | | Sell | | | | 300,000,000 | | | | 2,790,386 | | | | 5/16/17 | | | | 205,848 | | | | — | |
Japanese Yen | | | SCNY | | | | Sell | | | | 340,600,700 | | | | 3,172,510 | | | | 5/16/17 | | | | 238,191 | | | | — | |
South Korean Won | | | CITI | | | | Sell | | | | 13,902,000,000 | | | | 12,090,798 | | | | 5/16/17 | | | | 576,674 | | | | — | |
South Korean Won | | | HSBK | | | | Sell | | | | 48,866,000,000 | | | | 41,781,882 | | | | 5/17/17 | | | | 1,309,123 | | | | — | |
Japanese Yen | | | BOFA | | | | Sell | | | | 1,105,661,700 | | | | 10,312,085 | | | | 5/18/17 | | | | 785,690 | | | | — | |
Japanese Yen | | | CITI | | | | Sell | | | | 3,198,607,000 | | | | 29,629,701 | | | | 5/18/17 | | | | 2,070,465 | | | | — | |
South Korean Won | | | HSBK | | | | Sell | | | | 26,952,000,000 | | | | 23,029,992 | | | | 5/18/17 | | | | 707,154 | | | | — | |
Japanese Yen | | | BOFA | | | | Sell | | | | 1,102,846,375 | | | | 10,244,741 | | | | 5/19/17 | | | | 742,116 | | | | — | |
Japanese Yen | | | HSBK | | | | Sell | | | | 1,106,730,400 | | | | 10,280,821 | | | | 5/19/17 | | | | 744,730 | | | | — | |
Japanese Yen | | | BOFA | | | | Sell | | | | 1,105,842,500 | | | | 10,234,033 | | | | 5/22/17 | | | | 704,126 | | | | — | |
Japanese Yen | | | JPHQ | | | | Sell | | | | 715,709,000 | | | | 6,644,716 | | | | 5/22/17 | | | | 476,894 | | | | — | |
South Korean Won | | | DBAB | | | | Sell | | | | 13,920,000,000 | | | | 11,855,183 | | | | 5/22/17 | | | | 325,768 | | | | — | |
Malaysian Ringgit | | | HSBK | | | | Buy | | | | 298,500 | | | | 72,224 | | | | 5/23/17 | | | | — | | | | (6,207 | ) |
Japanese Yen | | | BOFA | | | | Sell | | | | 1,085,075,000 | | | | 9,866,830 | | | | 5/25/17 | | | | 514,454 | | | | — | |
Japanese Yen | | | HSBK | | | | Sell | | | | 207,909,000 | | | | 1,896,807 | | | | 5/25/17 | | | | 104,817 | | | | — | |
South Korean Won | | | HSBK | | | | Sell | | | | 35,277,000,000 | | | | 30,000,000 | | | | 5/25/17 | | | | 780,899 | | | | — | |
South Korean Won | | | HSBK | | | | Sell | | | | 42,561,000,000 | | | | 36,423,620 | | | | 6/02/17 | | | | 1,169,797 | | | | — | |
Japanese Yen | | | CITI | | | | Sell | | | | 1,370,500,000 | | | | 12,982,646 | | | | 6/08/17 | | | | 1,161,673 | | | | — | |
Japanese Yen | | | HSBK | | | | Sell | | | | 2,052,400,000 | | | | 18,162,832 | | | | 6/09/17 | | | | 459,360 | | | | — | |
Japanese Yen | | | HSBK | | | | Sell | | | | 1,798,900,000 | | | | 15,786,749 | | | | 6/13/17 | | | | 266,716 | | | | — | |
South Korean Won | | | CITI | | | | Sell | | | | 8,844,000,000 | | | | 7,633,351 | | | | 6/15/17 | | | | 307,226 | | | | — | |
FRANKLIN TEMPLETON VARIABLE INSURANCE PRODUCTS TRUST
STATEMENT OF INVESTMENTS
Templeton Global Bond VIP Fund (continued)
| | | | | | | | | | | | | | | | | | | | | | | | | | | | |
| Forward Exchange Contracts (continued) | |
| Currency | | | Counterparty | a | | | Type | | | | Quantity | | |
| Contract
Amount |
* | |
| Settlement
Date |
| |
| Unrealized
Appreciation |
| |
| Unrealized
Depreciation |
|
OTC Forward Exchange Contracts (continued) | | | | | | | | | | | | | | | | | |
Japanese Yen | | | CITI | | | | Sell | | | | 310,702,000 | | | | 2,980,098 | | | | 6/16/17 | | | $ | 299,099 | | | $ | — | |
Japanese Yen | | | HSBK | | | | Sell | | | | 1,455,540,000 | | | | 12,767,895 | | | | 6/16/17 | | | | 208,270 | | | | — | |
Japanese Yen | | | JPHQ | | | | Sell | | | | 702,800,000 | | | | 6,738,029 | | | | 6/16/17 | | | | 673,679 | | | | — | |
Japanese Yen | | | DBAB | | | | Sell | | | | 1,453,310,000 | | | | 13,915,662 | | | | 6/19/17 | | | | 1,373,348 | | | | — | |
Japanese Yen | | | CITI | | | | Sell | | | | 1,086,780,000 | | | | 10,588,528 | | | | 6/20/17 | | | | 1,208,948 | | | | — | |
South Korean Won | | | DBAB | | | | Sell | | | | 13,919,000,000 | | | | 11,923,077 | | | | 6/20/17 | | | | 392,644 | | | | — | |
Philippine Peso | | | JPHQ | | | | Buy | | | | 251,010,000 | | | | 5,332,696 | | | | 6/21/17 | | | | — | | | | (374,702 | ) |
Japanese Yen | | | DBAB | | | | Sell | | | | 1,455,820,000 | | | | 14,145,161 | | | | 6/22/17 | | | | 1,579,249 | | | | — | |
Japanese Yen | | | JPHQ | | | | Sell | | | | 708,450,000 | | | | 6,923,866 | | | | 7/14/17 | | | | 801,627 | | | | — | |
Malaysian Ringgit | | | JPHQ | | | | Buy | | | | 1,700,000 | | | | 421,094 | | | | 7/17/17 | | | | — | | | | (46,234 | ) |
Malaysian Ringgit | | | DBAB | | | | Buy | | | | 11,455,000 | | | | 2,543,408 | EUR | | | 7/20/17 | | | | — | | | | (179,006 | ) |
Japanese Yen | | | CITI | | | | Sell | | | | 913,412,000 | | | | 8,748,319 | | | | 7/25/17 | | | | 850,086 | | | | — | |
Indonesian Rupiah | | | HSBK | | | | Buy | | | | 424,000,000,000 | | | | 30,372,493 | | | | 7/31/17 | | | | — | | | | (264,773 | ) |
Japanese Yen | | | BZWS | | | | Sell | | | | 1,079,470,000 | | | | 10,393,060 | | | | 7/31/17 | | | | 1,055,857 | | | | — | |
Japanese Yen | | | DBAB | | | | Sell | | | | 897,860,782 | | | | 8,648,745 | | | | 7/31/17 | | | | 882,425 | | | | — | |
Japanese Yen | | | DBAB | | | | Sell | | | | 838,612,000 | | | | 8,491,414 | | | | 8/18/17 | | | | 1,230,409 | | | | — | |
Japanese Yen | | | HSBK | | | | Sell | | | | 1,621,372,000 | | | | 16,443,935 | | | | 8/22/17 | | | | 2,402,427 | | | | — | |
Japanese Yen | | | JPHQ | | | | Sell | | | | 1,135,828,000 | | | | 11,520,313 | | | | 8/22/17 | | | | 1,683,744 | | | | — | |
Japanese Yen | | | BZWS | | | | Sell | | | | 376,247,000 | | | | 3,809,267 | | | | 8/24/17 | | | | 550,511 | | | | — | |
Japanese Yen | | | DBAB | | | | Sell | | | | 371,821,000 | | | | 3,769,933 | | | | 8/24/17 | | | | 549,512 | | | | — | |
Japanese Yen | | | JPHQ | | | | Sell | | | | 1,135,833,000 | | | | 11,497,158 | | | | 8/28/17 | | | | 1,657,301 | | | | — | |
Japanese Yen | | | DBAB | | | | Sell | | | | 685,950,000 | | | | 6,961,027 | | | | 8/30/17 | | | | 1,017,906 | | | | — | |
Japanese Yen | | | JPHQ | | | | Sell | | | | 751,903,000 | | | | 7,614,979 | | | | 8/30/17 | | | | 1,100,436 | | | | — | |
Japanese Yen | | | HSBK | | | | Sell | | | | 1,247,125,000 | | | | 12,384,558 | | | | 9/01/17 | | | | 1,578,188 | | | | — | |
Japanese Yen | | | CITI | | | | Sell | | | | 286,112,008 | | | | 2,830,200 | | | | 9/19/17 | | | | 348,576 | | | | — | |
Japanese Yen | | | JPHQ | | | | Sell | | | | 1,415,975,000 | | | | 13,988,392 | | | | 10/10/17 | | | | 1,690,856 | | | | — | |
Japanese Yen | | | CITI | | | | Sell | | | | 341,992,119 | | | | 3,332,412 | | | | 11/09/17 | | | | 356,456 | | | | — | |
Japanese Yen | | | CITI | | | | Sell | | | | 796,524,000 | | | | 7,765,057 | | | | 11/14/17 | | | | 831,584 | | | | — | |
Japanese Yen | | | JPHQ | | | | Sell | | | | 335,950,000 | | | | 3,280,714 | | | | 11/14/17 | | | | 356,382 | | | | — | |
Japanese Yen | | | CITI | | | | Sell | | | | 366,680,000 | | | | 3,461,825 | | | | 11/16/17 | | | | 269,583 | | | | — | |
Japanese Yen | | | DBAB | | | | Sell | | | | 796,770,000 | | | | 7,427,429 | | | | 11/21/17 | | | | 488,649 | | | | — | |
Japanese Yen | | | SCNY | | | | Sell | | | | 937,086,000 | | | | 8,601,459 | | | | 11/27/17 | | | | 437,525 | | | | — | |
Japanese Yen | | | CITI | | | | Sell | | | | 2,595,800,000 | | | | 23,180,822 | | | | 12/12/17 | | | | 543,951 | | | | — | |
Japanese Yen | | | JPHQ | | | | Sell | | | | 1,666,680,000 | | | | 14,772,782 | | | | 12/13/17 | | | | 237,423 | | | | — | |
| | | | | | | | | | | | | | | | | | | | | | | | |
Total Forward Exchange Contracts | | | | | | | | | | | $ | 155,211,443 | | | $ | (30,057,241 | ) |
| | | | | | | | | | | | | | | | | | | | | | | | |
Net unrealized appreciation (depreciation) | | | | | | | | | | | $ | 125,154,202 | | | | | |
| | | | | | | | | | | | | | | | | | | | | | | | | | | | |
*In U.S. dollars unless otherwise indicated.
aMay be comprised of multiple contracts with the same counterparty, currency and settlement date.
FRANKLIN TEMPLETON VARIABLE INSURANCE PRODUCTS TRUST
STATEMENT OF INVESTMENTS
Templeton Global Bond VIP Fund (continued)
At December 31, 2016, the Fund had the following interest rate swap contracts outstanding. See Note 1(e).
| | | | | | | | | | | | | | | | | | | | |
| Interest Rate Swap Contracts | | | | | | | | | | | | | | | |
| Description | | Counterparty / Exchange | | | Notional
Amount | | | Expiration
Date | | | Unrealized
Appreciation | | | Unrealized
Depreciation | |
| Centrally Cleared Swap Contracts | | | | | | | | | | | | | | | | | | | | |
Receive Floating rate 3-month USD BBA LIBOR
Pay Fixed rate 0.926% | | | LCH | | | $ | 183,490,000 | | | | 10/17/17 | | | $ | 292,135 | | | $ | — | |
Receive Floating rate 3-month USD BBA LIBOR
Pay Fixed rate 3.558% | | | LCH | | | | 3,240,000 | | | | 3/04/21 | | | | — | | | | (257,024 | ) |
Receive Floating rate 3-month USD BBA LIBOR
Pay Fixed rate 2.775% | | | CME | | | | 13,090,000 | | | | 10/04/23 | | | | — | | | | (594,280 | ) |
Receive Floating rate 3-month USD BBA LIBOR
Pay Fixed rate 2.795% | | | CME | | | | 13,090,000 | | | | 10/04/23 | | | | — | | | | (611,648 | ) |
Receive Floating rate 3-month USD BBA LIBOR
Pay Fixed rate 2.765% | | | CME | | | | 13,090,000 | | | | 10/07/23 | | | | — | | | | (582,888 | ) |
Receive Floating rate 3-month USD BBA LIBOR
Pay Fixed rate 2.731% | | | LCH | | | | 34,000,000 | | | | 7/07/24 | | | | — | | | | (1,671,177 | ) |
Receive Floating rate 3-month USD BBA LIBOR
Pay Fixed rate 1.914% | | | LCH | | | | 114,670,000 | | | | 1/22/25 | | | | 1,922,698 | | | | — | |
Receive Floating rate 3-month USD BBA LIBOR
Pay Fixed rate 1.970% | | | LCH | | | | 143,340,000 | | | | 1/23/25 | | | | 1,798,218 | | | | — | |
Receive Floating rate 3-month USD BBA LIBOR
Pay Fixed rate 1.973% | | | LCH | | | | 84,590,000 | | | | 1/27/25 | | | | 1,048,684 | | | | — | |
Receive Floating rate 3-month USD BBA LIBOR
Pay Fixed rate 1.937% | | | LCH | | | | 21,150,000 | | | | 1/29/25 | | | | 323,554 | | | | — | |
Receive Floating rate 3-month USD BBA LIBOR
Pay Fixed rate 1.942% | | | LCH | | | | 17,910,000 | | | | 1/30/25 | | | | 270,280 | | | | — | |
Receive Floating rate 3-month USD BBA LIBOR
Pay Fixed rate 1.817% | | | LCH | | | | 28,210,000 | | | | 2/03/25 | | | | 708,802 | | | | — | |
Receive Floating rate 3-month USD BBA LIBOR
Pay Fixed rate 4.349% | | | LCH | | | | 7,460,000 | | | | 2/25/41 | | | | — | | | | (2,588,077 | ) |
Receive Floating rate 3-month USD BBA LIBOR
Pay Fixed rate 4.320% | | | LCH | | | | 5,600,000 | | | | 2/28/41 | | | | — | | | | (1,918,726 | ) |
Receive Floating rate 3-month USD BBA LIBOR
Pay Fixed rate 4.299% | | | LCH | | | | 1,870,000 | | | | 3/01/41 | | | | — | | | | (630,072 | ) |
Receive Floating rate 3-month USD BBA LIBOR
Pay Fixed rate 3.668% | | | CME | | | | 6,370,000 | | | | 10/04/43 | | | | — | | | | (1,439,760 | ) |
Receive Floating rate 3-month USD BBA LIBOR
Pay Fixed rate 3.687% | | | CME | | | | 6,370,000 | | | | 10/04/43 | | | | — | | | | (1,464,106 | ) |
Receive Floating rate 3-month USD BBA LIBOR
Pay Fixed rate 3.675% | | | CME | | | | 6,370,000 | | | | 10/07/43 | | | | — | | | | (1,447,319 | ) |
Receive Floating rate 3-month USD BBA LIBOR
Pay Fixed rate 2.378% | | | LCH | | | | 122,400,000 | | | | 11/18/46 | | | | 5,541,734 | | | | — | |
| | | | | | | | | | | | | | | | |
Total Centrally Cleared Swap Contracts | | | | | | | | | | | | | | | 11,906,105 | | | | (13,205,077 | ) |
| | | | | | | | | | | | | | | | |
| OTC Swap Contracts | | | | | | | | | | | | | | | | | | | | |
Receive Floating rate 3-month USD BBA LIBOR
Pay Fixed rate 3.523% | | | DBAB | | | | 14,630,000 | | | | 3/28/21 | | | | — | | | | (1,127,581 | ) |
FRANKLIN TEMPLETON VARIABLE INSURANCE PRODUCTS TRUST
STATEMENT OF INVESTMENTS
Templeton Global Bond VIP Fund (continued)
| | | | | | | | | | | | | | | | | | | | |
| Interest Rate Swap Contracts (continued) | | | | | | | | | | | | | | | |
| Description | | Counterparty /
Exchange | | | Notional
Amount | | | Expiration
Date | | | Unrealized
Appreciation | | | Unrealized
Depreciation | |
OTC Swap Contracts (continued) | | | | | | | | | | | | | | | | | | | | |
Receive Floating rate 3-month USD BBA LIBOR
Pay Fixed rate 4.347% | | | CITI | | | $ | 7,460,000 | | | | 2/25/41 | | | $ | — | | | $ | (2,584,274 | ) |
| | | | | | | | | | | | | | | | |
Total OTC Swap Contracts | | | | — | | | | (3,711,855 | ) |
| | | | | | | | | | | | | | | | |
Total Interest Rate Swap Contracts | | | $ | 11,906,105 | | | $ | (16,916,932 | ) |
| | | | | | | | | | | | | | | | |
Net unrealized appreciation (depreciation) | | | $ | (5,010,827 | ) |
| | | | | | | | | | | | | | | | | | | | |
See Note 9 regarding other derivative information.
See Abbreviations on page TGB-38.
| | | | |
| TGB-22 | | Annual Report | | The accompanying notes are an integral part of these financial statements. |
FRANKLIN TEMPLETON VARIABLE INSURANCE PRODUCTS TRUST
Financial Statements
Statement of Assets and Liabilities
December 31, 2016
| | | | |
| | | Templeton
Global Bond
VIP Fund | |
Assets: | | | | |
Investments in securities: | | | | |
Cost - Unaffiliated issuers | | $ | 2,495,702,952 | |
Cost - Non-controlled affiliates (Note 3e) | | | 436,780,215 | |
Cost - Repurchase agreements | | | 170,127,507 | |
| | | | |
Total cost of investments | | $ | 3,102,610,674 | |
| | | | |
Value - Unaffiliated issuers | | $ | 2,349,973,360 | |
Value - Non-controlled affiliates (Note 3e) | | | 436,780,215 | |
Value - Repurchase agreements | | | 170,127,507 | |
| | | | |
Total value of investments | | | 2,956,881,082 | |
Cash | | | 25,640,000 | |
Restricted Cash (Note 1f) | | | 62,331,000 | |
Foreign currency, at value (cost $1,600,413) | | | 1,598,191 | |
Receivables: | | | | |
Capital shares sold | | | 4,560,611 | |
Interest | | | 35,561,015 | |
Due from brokers | | | 43,895,644 | |
Unrealized appreciation on OTC forward exchange contracts | | | 155,211,443 | |
Other assets | | | 580 | |
| | | | |
Total assets | | | 3,285,679,566 | |
| | | | |
Liabilities: | | | | |
Payables: | | | | |
Investment securities purchased | | | 1,118,691 | |
Capital shares redeemed | | | 2,829,129 | |
Management fees | | | 1,099,080 | |
Distribution fees | | | 1,218,304 | |
Variation margin | | | 2,875,032 | |
Due to brokers | | | 87,971,000 | |
Unrealized depreciation on OTC forward exchange contracts | | | 30,057,241 | |
Unrealized depreciation on OTC swap contracts | | | 3,711,855 | |
Deferred tax | | | 2,657,526 | |
Accrued expenses and other liabilities | | | 1,017,102 | |
| | | | |
Total liabilities | | | 134,554,960 | |
| | | | |
Net assets, at value | | $ | 3,151,124,606 | |
| | | | |
Net assets consist of: | | | | |
Paid-in capital | | $ | 3,339,837,284 | |
Accumulated net investment loss | | | (170,378,447 | ) |
Net unrealized appreciation (depreciation) | | | (28,438,533 | ) |
Accumulated net realized gain (loss) | | | 10,104,302 | |
| | | | |
Net assets, at value | | $ | 3,151,124,606 | |
| | | | |
| | | | | | |
| | | The accompanying notes are an integral part of these financial statements. | Annual Report | | | TGB-23 | |
FRANKLIN TEMPLETON VARIABLE INSURANCE PRODUCTS TRUST
FINANCIAL STATEMENTS
Statement of Assets and Liabilities (continued)
December 31, 2016
| | | | |
| | | Templeton Global Bond
VIP Fund | |
| |
| Class 1: | | | | |
Net assets, at value | | $ | 241,792,463 | |
| | | | |
Shares outstanding | | | 14,348,712 | |
| | | | |
Net asset value and maximum offering price per share | | $ | 16.85 | |
| | | | |
| |
| Class 2: | | | | |
Net assets, at value | | $ | 2,812,534,558 | |
| | | | |
Shares outstanding | | | 173,093,423 | |
| | | | |
Net asset value and maximum offering price per share | | $ | 16.25 | |
| | | | |
| |
| Class 4: | | | | |
Net assets, at value | | $ | 96,797,585 | |
| | | | |
Shares outstanding | | | 5,822,448 | |
| | | | |
Net asset value and maximum offering price per share | | $ | 16.62 | |
| | | | |
| | | | |
| TGB-24 | | Annual Report | The accompanying notes are an integral part of these financial statements. | | |
FRANKLIN TEMPLETON VARIABLE INSURANCE PRODUCTS TRUST
FINANCIAL STATEMENTS
Statement of Operations
for the year ended December 31, 2016
| | | | |
| | | Templeton
Global Bond
VIP Fund | |
Investment income: | | | | |
Dividends from non-controlled affliates (Note 3e) | | $ | 16,647 | |
Interest | | | 139,355,209 | |
| | | | |
Total investment income | | | 139,371,856 | |
| | | | |
Expenses: | | | | |
Management fees (Note 3a) | | | 14,620,677 | |
Distribution fees: (Note 3c) | | | | |
Class 2 | | | 7,065,822 | |
Class 4 | | | 339,872 | |
Custodian fees (Note 4) | | | 1,283,404 | |
Reports to shareholders | | | 398,819 | |
Professional fees | | | 183,363 | |
Trustees’ fees and expenses | | | 15,218 | |
Other | | | 274,362 | |
| | | | |
Total expenses | | | 24,181,537 | |
Expense reductions (Note 4) | | | (203,225 | ) |
Expenses waived/paid by affiliates (Note 3e) | | | (1,239,931 | ) |
| | | | |
Net expenses | | | 22,738,381 | |
| | | | |
Net investment income | | | 116,633,475 | |
| | | | |
Realized and unrealized gains (losses): | | | | |
Net realized gain (loss) from: | | | | |
Investments | | | (185,101,644 | ) |
Foreign currency transactions | | | (93,091,116 | ) |
Swap contracts | | | (9,757,184 | ) |
| | | | |
Net realized gain (loss) | | | (287,949,944 | ) |
| | | | |
Net change in unrealized appreciation (depreciation) on: | | | | |
Investments | | | 145,927,386 | |
Translation of other assets and liabilities denominated in foreign currencies | | | 103,543,749 | |
Swap contracts | | | 10,315,812 | |
Change in deferred taxes on unrealized appreciation | | | (1,271,174 | ) |
| | | | |
Net change in unrealized appreciation (depreciation) | | | 258,515,773 | |
| | | | |
Net realized and unrealized gain (loss) | | | (29,434,171 | ) |
| | | | |
Net increase (decrease) in net assets resulting from operations | | $ | 87,199,304 | |
| | | | |
| | | | | | |
| | | The accompanying notes are an integral part of these financial statements. | Annual Report | | | TGB-25 | |
FRANKLIN TEMPLETON VARIABLE INSURANCE PRODUCTS TRUST
FINANCIAL STATEMENTS
Statements of Changes in Net Assets
| | | | | | | | |
| | | Templeton Global Bond VIP Fund | |
| | | Year Ended December 31, | |
| | | 2016 | | | 2015 | |
Increase (decrease) in net assets: | | | | | | | | |
Operations: | | | | | | | | |
Net investment income | | $ | 116,633,475 | | | $ | 97,606,372 | |
Net realized gain (loss) | | | (287,949,944 | ) | | | 69,448,149 | |
Net change in unrealized appreciation (depreciation) | | | 258,515,773 | | | | (322,119,799 | ) |
| | | | |
Net increase (decrease) in net assets resulting from operations | | | 87,199,304 | | | | (155,065,278 | ) |
| | | | |
Distributions to shareholders from: | | | | | | | | |
Net investment income and net foreign currency gains: | | | | | | | | |
Class 1 | | | — | | | | (24,254,176 | ) |
Class 2 | | | — | | | | (245,964,961 | ) |
Class 4 | | | — | | | | (8,346,133 | ) |
Net realized gains: | | | | | | | | |
Class 1 | | | (230,624 | ) | | | (1,526,914 | ) |
Class 2 | | | (2,445,769 | ) | | | (15,975,209 | ) |
Class 4 | | | (81,295 | ) | | | (550,981 | ) |
| | | | |
Total distributions to shareholders | | | (2,757,688 | ) | | | (296,618,374 | ) |
| | | | |
Capital share transactions: (Note 2) | | | | | | | | |
Class 1 | | | (58,117,212 | ) | | | 8,052,024 | |
Class 2 | | | (233,957,681 | ) | | | 193,114,598 | |
Class 4 | | | (8,756,905 | ) | | | 5,703,235 | |
| | | | |
Total capital share transactions | | | (300,831,798 | ) | | | 206,869,857 | |
| | | | |
Net increase (decrease) in net assets | | | (216,390,182 | ) | | | (244,813,795 | ) |
Net assets: | | | | | | | | |
Beginning of year | | | 3,367,514,788 | | | | 3,612,328,583 | |
| | | | |
End of year | | $ | 3,151,124,606 | | | $ | 3,367,514,788 | |
| | | | |
Accumulated net investments loss included in net assets: | | | | | | | | |
End of year | | $ | (170,378,447 | ) | | $ | — | |
| | | | |
Distributions in excess of net investment income included in net assets: | | | | | | | | |
End of year | | $ | — | | | $ | (39,413,185 | ) |
| | | | |
| | | | |
| TGB-26 | | Annual Report | The accompanying notes are an integral part of these financial statements. | | |
FRANKLIN TEMPLETON VARIABLE INSURANCE PRODUCTS TRUST
Notes to Financial Statements
Templeton Global Bond VIP Fund
1. Organization and Significant Accounting Policies
Franklin Templeton Variable Insurance Products Trust (Trust) is registered under the Investment Company Act of 1940 (1940 Act) as an open-end management investment company, consisting of nineteen separate funds and applies the specialized accounting and reporting guidance in U.S. Generally Accepted Accounting Principles (U.S. GAAP). Templeton Global Bond VIP Fund (Fund) is included in this report. The financial statements of the remaining funds in the Trust are presented separately. Shares of the Fund are generally sold only to insurance company separate accounts to fund the benefits of variable life insurance policies or variable annuity contracts. The Fund offers three classes of shares: Class 1, Class 2 and Class 4. Each class of shares differs by its distribution fees, voting rights on matters affecting a single class and its exchange privilege.
The following summarizes the Fund’s significant accounting policies.
a. Financial Instrument Valuation
The Fund’s investments in financial instruments are carried at fair value daily. Fair value is the price that would be received to sell an asset or paid to transfer a liability in an orderly transaction between market participants on the measurement date. The Fund calculates the net asset value (NAV) per share as of 4 p.m. Eastern time each day the New York Stock Exchange (NYSE) is open for trading. Under compliance policies and procedures approved by the Trust’s Board of Trustees (the Board), the Fund’s administrator has responsibility for oversight of valuation, including leading the cross-functional Valuation Committee (VC). The VC provides administration and oversight of the Fund’s valuation policies and procedures, which are approved annually by the Board. Among other things, these procedures allow the Fund to utilize independent pricing services, quotations from securities and financial instrument dealers, and other market sources to determine fair value.
Debt securities generally trade in the over-the-counter (OTC) market rather than on a securities exchange. The Fund’s pricing services use multiple valuation techniques to determine fair value. In instances where sufficient market activity exists, the pricing services may utilize a market-based approach through which quotes from market makers are used to determine fair value. In instances where sufficient market activity may not
exist or is limited, the pricing services also utilize proprietary valuation models which may consider market characteristics such as benchmark yield curves, credit spreads, estimated default rates, anticipated market interest rate volatility, coupon rates, anticipated timing of principal repayments, underlying collateral, and other unique security features in order to estimate the relevant cash flows, which are then discounted to calculate the fair value. Securities denominated in a foreign currency are converted into their U.S. dollar equivalent at the foreign exchange rate in effect at 4 p.m. Eastern time on the date that the values of the foreign debt securities are determined.
Investments in open-end mutual funds are valued at the closing NAV. Investments in repurchase agreements are valued at cost, which approximates fair value.
Derivative financial instruments listed on an exchange are valued at the official closing price of the day. Certain derivative financial instruments trade in the OTC market. The Fund’s pricing services use various techniques including industry standard option pricing models and proprietary discounted cash flow models to determine the fair value of those instruments. The Fund’s net benefit or obligation under the derivative contract, as measured by the fair value of the contract, is included in net assets.
The Fund has procedures to determine the fair value of financial instruments for which market prices are not reliable or readily available. Under these procedures, the VC convenes on a regular basis to review such financial instruments and considers a number of factors, including significant unobservable valuation inputs, when arriving at fair value. The VC primarily employs a market-based approach which may use related or comparable assets or liabilities, recent transactions, market multiples, book values, and other relevant information for the investment to determine the fair value of the investment. An income-based valuation approach may also be used in which the anticipated future cash flows of the investment are discounted to calculate fair value. Discounts may also be applied due to the nature or duration of any restrictions on the disposition of the investments. Due to the inherent uncertainty of valuations of such investments, the fair values may differ significantly from the values that would have been used had an active market existed. The VC employs various methods for calibrating these valuation approaches including a regular review of key inputs and assumptions, transactional back-testing or disposition analysis, and reviews of any related market activity.
FRANKLIN TEMPLETON VARIABLE INSURANCE PRODUCTS TRUST
NOTES TO FINANCIAL STATEMENTS
Templeton Global Bond VIP Fund (continued)
1. Organization and Significant Accounting
Policies (continued)
b. Foreign Currency Translation
Portfolio securities and other assets and liabilities denominated in foreign currencies are translated into U.S. dollars based on the exchange rate of such currencies against U.S. dollars on the date of valuation. The Fund may enter into foreign currency exchange contracts to facilitate transactions denominated in a foreign currency. Purchases and sales of securities, income and expense items denominated in foreign currencies are translated into U.S. dollars at the exchange rate in effect on the transaction date. Portfolio securities and assets and liabilities denominated in foreign currencies contain risks that those currencies will decline in value relative to the U.S. dollar. Occasionally, events may impact the availability or reliability of foreign exchange rates used to convert the U.S. dollar equivalent value. If such an event occurs, the foreign exchange rate will be valued at fair value using procedures established and approved by the Board.
The Fund does not separately report the effect of changes in foreign exchange rates from changes in market prices on securities held. Such changes are included in net realized and unrealized gain or loss from investments in the Statement of Operations.
Realized foreign exchange gains or losses arise from sales of foreign currencies, currency gains or losses realized between the trade and settlement dates on securities transactions and the difference between the recorded amounts of dividends, interest, and foreign withholding taxes and the U.S. dollar equivalent of the amounts actually received or paid. Net unrealized foreign exchange gains and losses arise from changes in foreign exchange rates on foreign denominated assets and liabilities other than investments in securities held at the end of the reporting period.
c. Joint Repurchase Agreement
The Fund enters into a joint repurchase agreement whereby its uninvested cash balance is deposited into a joint cash account with other funds managed by the investment manager or an affiliate of the investment manager and is used to invest in one or more repurchase agreements. The value and face amount of the joint repurchase agreement are allocated to the funds based on their pro-rata interest. A repurchase agreement is accounted for as a loan by the Fund to the seller, collateralized by securities which are delivered to the Fund’s custodian. The fair value, including accrued interest, of the initial collateralization
is required to be at least 102% of the dollar amount invested by the funds, with the value of the underlying securities marked to market daily to maintain coverage of at least 100%. Repurchase agreements are subject to the terms of Master Repurchase Agreements (MRAs) with approved counterparties (sellers). The MRAs contain various provisions, including but not limited to events of default and maintenance of collateral for repurchase agreements. In the event of default by either the seller or the Fund, certain MRAs may permit the non-defaulting party to net and close-out all transactions, if any, traded under such agreements. The Fund may sell securities it holds as collateral and apply the proceeds towards the repurchase price and any other amounts owed by the seller to the Fund in the event of default by the seller. This could involve costs or delays in addition to a loss on the securities if their value falls below the repurchase price owed by the seller. The joint repurchase agreement held by the Fund at year end, as indicated in the Statement of Investments, had been entered into on December 30, 2016.
d. Securities Purchased on a Delayed Delivery Basis
The Fund purchases securities on a delayed delivery basis, with payment and delivery scheduled for a future date. These transactions are subject to market fluctuations and are subject to the risk that the value at delivery may be more or less than the trade date purchase price. Although the Fund will generally purchase these securities with the intention of holding the securities, it may sell the securities before the settlement date. Sufficient assets have been segregated for these securities.
e. Derivative Financial Instruments
The Fund invested in derivative financial instruments in order to manage risk or gain exposure to various other investments or markets. Derivatives are financial contracts based on an underlying or notional amount, require no initial investment or an initial net investment that is smaller than would normally be required to have a similar response to changes in market factors, and require or permit net settlement. Derivatives contain various risks including the potential inability of the counterparty to fulfill their obligations under the terms of the contract, the potential for an illiquid secondary market, and/or the potential for market movements which expose the Fund to gains or losses in excess of the amounts shown in the Statement of Assets and Liabilities. Realized gain and loss and unrealized appreciation and depreciation on these contracts for the period are included in the Statement of Operations.
FRANKLIN TEMPLETON VARIABLE INSURANCE PRODUCTS TRUST
NOTES TO FINANCIAL STATEMENTS
Templeton Global Bond VIP Fund (continued)
Derivative counterparty credit risk is managed through a formal evaluation of the creditworthiness of all potential counterparties. The Fund attempts to reduce its exposure to counterparty credit risk on OTC derivatives, whenever possible, by entering into International Swaps and Derivatives Association (ISDA) master agreements with certain counterparties. These agreements contain various provisions, including but not limited to collateral requirements, events of default, or early termination. Termination events applicable to the counterparty include certain deteriorations in the credit quality of the counterparty. Termination events applicable to the Fund include failure of the Fund to maintain certain net asset levels and/or limit the decline in net assets over various periods of time. In the event of default or early termination, the ISDA master agreement gives the non-defaulting party the right to net and close-out all transactions traded, whether or not arising under the ISDA agreement, to one net amount payable by one counterparty to the other. However, absent an event of default or early termination, OTC derivative assets and liabilities are presented gross and not offset in the Statement of Assets and Liabilities. Early termination by the counterparty may result in an immediate payment by the Fund of any net liability owed to that counterparty under the ISDA agreement.
Collateral requirements differ by type of derivative. Collateral or initial margin requirements are set by the broker or exchange clearing house for exchange traded and centrally cleared derivatives. Initial margin deposited is held at the exchange and can be in the form of cash and/or securities. For OTC derivatives traded under an ISDA master agreement, posting of collateral is required by either the Fund or the applicable counterparty if the total net exposure of all OTC derivatives with the applicable counterparty exceeds the minimum transfer amount, which typically ranges from $100,000 to $250,000, and can vary depending on the counterparty and the type of the agreement. Generally, collateral is determined at the close of Fund business each day and any additional collateral required due to changes in derivative values may be delivered by the Fund or the counterparty within a few business days. Collateral pledged and/or received by the Fund for OTC derivatives, if any, is held in segregated accounts with the Fund’s custodian/counterparty broker and can be in the form of cash and/or securities. Unrestricted cash may be invested according to the Fund’s investment objectives. To the extent that the amounts due to the Fund from its counterparties are not subject to collateralization or are not fully collateralized, the Fund bears the risk of loss from counterparty non-performance.
The Fund entered into OTC forward exchange contracts primarily to manage and/or gain exposure to certain foreign currencies. A forward exchange contract is an agreement between the Fund and a counterparty to buy or sell a foreign currency at a specific exchange rate on a future date.
The Fund entered into interest rate swap contracts primarily to manage interest rate risk. An interest rate swap is an agreement between the Fund and a counterparty to exchange cash flows based on the difference between two interest rates, applied to a notional amount. These agreements may be privately negotiated in the over-the-counter market (OTC interest rate swaps) or may be executed on a registered exchange (centrally cleared interest rate swaps). For centrally cleared interest rate swaps, required initial margins are pledged by the Fund, and the daily change in fair value is accounted for as a variation margin payable or receivable in the Statement of Assets and Liabilities. Over the term of the contract, contractually required payments to be paid and to be received are accrued daily and recorded as unrealized depreciation and appreciation until the payments are made, at which time they are realized.
The Fund invests in value recovery instruments (VRI) primarily to gain exposure to growth risk. Periodic payments from VRI are dependent on established benchmarks for underlying variables. VRI has a notional amount, which is used to calculate amounts of payments to holders. Payments are recorded upon receipt as realized gains in the Statement of Operations. The risks of investing in VRI include growth risk, liquidity, and the potential loss of investment.
See Note 9 regarding other derivative information.
f. Restricted Cash
At December 31, 2016, the Fund held restricted cash in connection with investments in certain derivative securities. Restricted cash is held in a segregated account with the Fund’s counterparty broker and is reflected in the Statement of Assets and Liabilities.
g. Income and Deferred Taxes
It is the Fund’s policy to qualify as a regulated investment company under the Internal Revenue Code. The Fund intends to distribute to shareholders substantially all of its taxable income and net realized gains to relieve it from federal income and if applicable, excise taxes. As a result, no provision for U.S. federal income taxes is required.
FRANKLIN TEMPLETON VARIABLE INSURANCE PRODUCTS TRUST
NOTES TO FINANCIAL STATEMENTS
Templeton Global Bond VIP Fund (continued)
1. Organization and Significant Accounting
Policies (continued)
g. Income and Deferred Taxes (continued)
The Fund may be subject to foreign taxation related to income received, capital gains on the sale of securities and certain foreign currency transactions in the foreign jurisdictions in which it invests. Foreign taxes, if any, are recorded based on the tax regulations and rates that exist in the foreign markets in which the Fund invests. When a capital gain tax is determined to apply, the Fund records an estimated deferred tax liability in an amount that would be payable if the securities were disposed of on the valuation date.
The Fund may recognize an income tax liability related to its uncertain tax positions under U.S. GAAP when the uncertain tax position has a less than 50% probability that it will be sustained upon examination by the tax authorities based on its technical merits. As of December 31, 2016, the Fund has determined that no tax liability is required in its financial statements related to uncertain tax positions for any open tax years (or expected to be taken in future tax years). Open tax years are those that remain subject to examination and are based on each tax jurisdiction’s statute of limitation.
h. Security Transactions, Investment Income, Expenses and Distributions
Security transactions are accounted for on trade date. Realized gains and losses on security transactions are determined on a specific identification basis. Interest income and estimated expenses are accrued daily. Amortization of premium and accretion of discount on debt securities are included in interest income. Dividend income is recorded on the ex-dividend date. Distributions to shareholders are recorded on the ex-dividend date and are determined according to income tax regulations (tax basis). Distributable earnings determined on a tax basis may differ from earnings recorded in accordance with U.S. GAAP. These differences may be permanent or temporary. Permanent differences are reclassified among capital accounts to reflect their tax character. These reclassifications have no impact on net assets or the results of operations. Temporary differences are not reclassified, as they may reverse in subsequent periods.
Common expenses incurred by the Trust are allocated among the Funds based on the ratio of net assets of each Fund to the combined net assets of the Trust. Fund specific expenses are charged directly to the Fund that incurred the expense.
Realized and unrealized gains and losses and net investment income, not including class specific expenses, are allocated daily to each class of shares based upon the relative proportion of net assets of each class. Differences in per share distributions, by class, are generally due to differences in class specific expenses.
Inflation-indexed bonds are adjusted for inflation through periodic increases or decreases in the security’s interest accruals, face amount, or principal redemption value, by amounts corresponding to the rate of inflation as measured by an index. Any increase or decrease in the face amount or principal redemption value will be included as interest income in the Statement of Operations.
i. Accounting Estimates
The preparation of financial statements in accordance with U.S. GAAP requires management to make estimates and assumptions that affect the reported amounts of assets and liabilities at the date of the financial statements and the amounts of income and expenses during the reporting period. Actual results could differ from those estimates.
j. Guarantees and Indemnifications
Under the Trust’s organizational documents, its officers and trustees are indemnified by the Trust against certain liabilities arising out of the performance of their duties to the Trust. Additionally, in the normal course of business, the Trust, on behalf of the Fund, enters into contracts with service providers that contain general indemnification clauses. The Trust’s maximum exposure under these arrangements is unknown as this would involve future claims that may be made against the Trust that have not yet occurred. Currently, the Trust expects the risk of loss to be remote.
FRANKLIN TEMPLETON VARIABLE INSURANCE PRODUCTS TRUST
NOTES TO FINANCIAL STATEMENTS
Templeton Global Bond VIP Fund (continued)
2. Shares of Beneficial Interest
At December 31, 2016, there were an unlimited number of shares authorized (without par value). Transactions in the Fund’s shares were as follows:
| | | | | | | | | | | | | | | | | | | | |
| | | Year Ended December 31, | |
| | | 2016 | | | | | | 2015 | |
| | | Shares | | | Amount | | | | | | Shares | | | Amount | |
| | | | | |
| Class 1 Shares: | | | | | | | | | | | | | | | | | | | | |
Shares sold | | | 2,249,431 | | | | $36,190,152 | | | | | | | | 3,348,667 | | | | $58,944,948 | |
Shares issued in reinvestment of distributions | | | 14,671 | | | | 230,624 | | | | | | | | 1,514,753 | | | | 25,781,090 | |
Shares redeemed | | | (5,831,060 | ) | | | (94,537,988 | ) | | | | | | | (4,380,221 | ) | | | (76,674,014 | ) |
| | | | |
Net increase (decrease) | | | (3,566,958 | ) | | | $(58,117,212 | ) | | | | | | | 483,199 | | | | $8,052,024 | |
| | | | |
| Class 2 Shares: | | | | | | | | | | | | | | | | | | | | |
Shares sold | | | 12,422,365 | | | | $192,901,752 | | | | | | | | 15,666,500 | | | | $268,873,539 | |
Shares issued in reinvestment of distributions | | | 161,118 | | | | 2,445,769 | | | | | | | | 15,904,078 | | | | 261,940,170 | |
Shares redeemed | | | (27,589,750 | ) | | | (429,305,202 | ) | | | | | | | (20,123,134 | ) | | | (337,699,111 | ) |
| | | | |
Net increase (decrease) | | | (15,006,267 | ) | | | $(233,957,681 | ) | | | | | | | 11,447,444 | | | | $193,114,598 | |
| | | | |
| Class 4 Shares: | | | | | | | | | | | | | | | | | | | | |
Shares sold | | | 793,050 | | | | $12,575,365 | | | | | | | | 1,068,838 | | | | $18,598,516 | |
Shares issued in reinvestment of distributions | | | 5,231 | | | | 81,295 | | | | | | | | 527,080 | | | | 8,897,114 | |
Shares redeemed | | | (1,344,557 | ) | | | (21,413,565 | ) | | | | | | | (1,276,578 | ) | | | (21,792,395 | ) |
| | | | |
Net increase (decrease) | | | (546,276 | ) | | | $(8,756,905 | ) | | | | | | | 319,340 | | | | $5,703,235 | |
| | | | |
3. Transactions with Affiliates
Franklin Resources, Inc. is the holding company for various subsidiaries that together are referred to as Franklin Templeton Investments. Certain officers and trustees of the Fund are also officers and/or directors of the following subsidiaries:
| | |
| Subsidiary | | Affiliation |
Franklin Advisers, Inc. (Advisers) | | Investment manager |
Franklin Templeton Services, LLC (FT Services) | | Administrative manager |
Franklin Templeton Distributors, Inc. (Distributors) | | Principal underwriter |
Franklin Templeton Investor Services, LLC (Investor Services) | | Transfer agent |
a. Management Fees
The Fund pays an investment management fee to Advisers based on the average daily net assets of the Fund as follows:
| | |
| Annualized Fee Rate | | Net Assets |
0.625% | | Up to and including $100 million |
0.500% | | Over $100 million, up to and including $250 million |
0.450% | | Over $250 million, up to and including $7.5 billion |
0.440% | | Over $7.5 billion, up to and including $10 billion |
0.430% | | Over $10 billion, up to and including $12.5 billion |
0.420% | | Over $12.5 billion, up to and including $15 billion |
0.400% | | In excess of $15 billion |
FRANKLIN TEMPLETON VARIABLE INSURANCE PRODUCTS TRUST
NOTES TO FINANCIAL STATEMENTS
Templeton Global Bond VIP Fund (continued)
3. Transactions with Affiliates (continued)
a. Management Fees (continued)
For the year ended December 31, 2016, the effective investment management fee rate was 0.458% of the Fund’s average daily net assets.
b. Administrative Fees
Under an agreement with Advisers, FT Services provides administrative services to the Fund. The fee is paid by Advisers based on the Fund’s average daily net assets, and is not an additional expense of the Fund.
c. Distribution Fees
The Board has adopted distribution plans for Class 2 and Class 4 shares pursuant to Rule 12b-1 under the 1940 Act. Under the Fund’s compensation distribution plans, the Fund pays Distributors for costs incurred in connection with the servicing, sale and distribution of the Fund’s shares up to 0.25% and 0.35% per year of its average daily net assets of Class 2 and Class 4, respectively. The plan year, for purposes of monitoring compliance with the maximum annual plan rates, is February 1 through January 31.
d. Transfer Agent Fees
Investor Services, under terms of an agreement, performs shareholder servicing for the Fund and is not paid by the Fund for the services.
e. Investments in Affiliated Management Investment Companies
The Fund invests in one or more affiliated management investment companies for purposes other than exercising a controlling influence over the management or policies. Management fees paid by the Fund are waived on assets invested in the affiliated management investment companies, as noted in the Statement of Operations, in an amount not to exceed the management and administrative fees paid directly or indirectly by each affiliate. During the year ended December 31, 2016, the Fund held investments in affiliated management investment companies as follows:
| | | | | | | | | | | | | | | | | | | | | | | | | | | | | | | | |
| | | Number of Shares Held at Beginning of Year | | | Gross Additions | | | Gross Reductions | | | Number of Shares Held at End of Year | | | Value at End of Year | | | Investment Income | | | Realized Gain (Loss) | | | % of Affiliated Fund Shares Outstanding Held at End of Year | |
| Non-Controlled Affiliates | | | | | | | | | | | | | | | | | | | | | | | | | | | | | | | | |
Institutional Fiduciary Trust Money Market Portfolio, 0.09% | | | 420,632,565 | | | | 588,176,207 | | | | (572,028,557 | ) | | | 436,780,215 | | | $ | 436,780,215 | | | $ | 16,647 | | | $ | — | | | | 2.7% | |
4. Expense Offset Arrangement
The Fund has entered into an arrangement with its custodian whereby credits realized as a result of uninvested cash balances are used to reduce a portion of the Fund’s custodian expenses. During the year ended December 31, 2016, the custodian fees were reduced as noted in the Statement of Operations.
FRANKLIN TEMPLETON VARIABLE INSURANCE PRODUCTS TRUST
NOTES TO FINANCIAL STATEMENTS
Templeton Global Bond VIP Fund (continued)
5. Income Taxes
The tax character of distributions paid during the years ended December 31, 2016 and 2015, was as follows:
| | | | | | | | |
| | | 2016 | | | 2015 | |
Distributions paid from: | | | | | | | | |
Ordinary income | | $ | — | | | $ | 296,603,607 | |
Long term capital gain | | | 2,757,688 | | | | 14,767 | |
| | | | |
| | $ | 2,757,688 | | | $ | 296,618,374 | |
| | | | |
At December 31, 2016, the cost of investments, net unrealized appreciation (depreciation) and undistributed long term capital gains for income tax purposes were as follows:
| | | | |
Cost of investments | | $ | 3,125,211,194 | |
| | | | |
Unrealized appreciation | | $ | 69,477,846 | |
Unrealized depreciation | | | (237,807,958 | ) |
| | | | |
Net unrealized appreciation (depreciation) | | $ | (168,330,112 | ) |
| | | | |
Distributable earnings - undistributed long term capital gains | | $ | 10,104,461 | |
| | | | |
Differences between income and/or capital gains as determined on a book basis and a tax basis are primarily due to differing treatments of foreign currency transactions and bond discounts and premiums.
6. Investment Transactions
Purchases and sales of investments (excluding short term securities) for the year ended December 31, 2016, aggregated $1,566,014,165 and $1,337,674,687, respectively.
7. Credit Risk
At December 31, 2016, the Fund had 22.5% of its portfolio invested in high yield or other securities rated below investment grade and unrated securities, if any. These securities may be more sensitive to economic conditions causing greater price volatility and are potentially subject to a greater risk of loss due to default than higher rated securities.
8. Concentration of Risk
Investing in foreign securities may include certain risks and considerations not typically associated with investing in U.S. securities, such as fluctuating currency values and changing local and regional economic, political and social conditions, which may result in greater market volatility. In addition, certain foreign securities may not be as liquid as U.S. securities.
FRANKLIN TEMPLETON VARIABLE INSURANCE PRODUCTS TRUST
NOTES TO FINANCIAL STATEMENTS
Templeton Global Bond VIP Fund (continued)
9. Other Derivative Information
At December 31, 2016, the Fund’s investments in derivative contracts are reflected in the Statement of Assets and Liabilities as follows:
| | | | | | | | | | | | |
| | | Asset Derivatives | | | Liability Derivatives | |
Derivative Contracts
Not Accounted for
as Hedging Instruments | | Statement of Assets and
Liabilities Location | | Fair Value | | | Statement of Assets and
Liabilities Location | | Fair Value | |
Interest rate contracts | | Variation margin | | $ | 11,906,105 | a | | Variation margin | | $ | 13,205,077 | a |
| | Unrealized appreciation on OTC swap contracts | | | — | | | Unrealized depreciation on OTC swap contracts | | | 3,711,855 | |
Foreign exchange contracts | | Unrealized appreciation on OTC forward exchange contracts | | | 155,211,443 | | | Unrealized depreciation on OTC forward exchange contracts | | | 30,057,241 | |
Value recovery instruments | | Investments in securities, at value | | | 9,143,290 | | | | | | | |
| | | | | | | | | | | | |
Totals | | | | $ | 176,260,838 | | | | | $ | 46,974,173 | |
| | | | | | | | | | | | |
aThis amount reflects the cumulative appreciation (depreciation) of centrally cleared swap contracts as reported in the Statement of Investments. Only the variation margin receivable/payable at year end is separately reported within the Statement of Assets and Liabilities. Prior variation margin movements were recorded to cash upon receipt or payment.
For the year ended December 31, 2016, the effect of derivative contracts in the Fund’s Statement of Operations was as follows:
| | | | | | | | | | | | |
Derivative Contracts Not Accounted for as Hedging Instruments | | Statement of Operations Locations | | Net Realized Gain (Loss) for the Year | | | Statement of Operations Locations | | Net Change in Unrealized Appreciation (Depreciation) for the Year | |
| | Net realized gain (loss) from: | | | | | | Net change in unrealized appreciation (depreciation) on: | | | | |
Interest rate contracts | | Swap contracts | | $ | (9,757,184 | ) | | Swap contracts | | $ | 10,315,812 | |
Foreign exchange contracts | | Foreign currency transactions | | | (84,790,754 | )a | | Translation of other assets and liabilities denominated in foreign currencies | | | 103,430,602 | a |
Value recovery instruments | | Investments | | | — | | | Investments | | | (2,960,329 | ) |
| | | | | | | | | | | | |
Totals | | | | $ | (94,547,938 | ) | | | | $ | 110,786,085 | |
| | | | | | | | | | | | |
aForward exchange contracts are included in net realized gain (loss) from foreign currency transactions and net change in unrealized appreciation (depreciation) on translation of other assets and liabilities denominated in foreign currencies in the Statement of Operations.
For the year ended December, 31 2016, the average month end fair value of derivatives represented 5.9% of average month end net assets. The average month end number of open derivative contracts for the year was 377.
FRANKLIN TEMPLETON VARIABLE INSURANCE PRODUCTS TRUST
NOTES TO FINANCIAL STATEMENTS
Templeton Global Bond VIP Fund (continued)
At December 31, 2016, the Fund’s OTC derivative assets and liabilities are as follows:
| | | | | | | | |
| | | Gross Amounts
of Assets and Liabilities
Presented in the
Statement of Assets and
Liabilities | |
| | | | Assets | a | | | Liabilities | a |
| Derivatives | | | | | | | | |
Forward exchange contracts | | $ | 155,211,443 | | | $ | 30,057,241 | |
Swap contracts | | | — | | | | 3,711,855 | |
| | | | |
Total | | $ | 155,211,443 | | | $ | 33,769,096 | |
| | | | |
aAbsent an event of default or early termination, OTC derivative assets and liabilities are presented gross and not offset in the Statement of Assets and Liabilities.
At December 31, 2016, the Fund’s OTC derivative assets, which may be offset against the Fund’s OTC derivative liabilities and collateral received from the counterparty, are as follows:
| | | | | | | | | | | | | | | | | | | | |
| | | | | | Amounts Not Offset in the Statement of Assets and Liabilities | | | | |
| | |
| Gross
Amounts of Assets
Presented in the Statement of
Assets and Liabilities |
| |
| Financial
Instruments
Available for Offset |
| |
| Financial
Instruments
Collateral
Received |
a,b | |
| Cash Collateral
Received |
b | |
| Net Amount (Not
less than zero) |
|
| Counterparty | | | | | | | | | | | | | | | | | | | | |
BOFA | | $ | 8,321,525 | | | $ | — | | | $ | — | | | $ | (8,321,525 | ) | | $ | — | |
BZWS | | | 19,989,057 | | | | — | | | | — | | | | (19,989,057 | ) | | | — | |
CITI | | | 26,203,316 | | | | (3,106,042 | ) | | | — | | | | (23,097,274 | ) | | | — | |
DBAB | | | 17,999,826 | | | | (3,679,448 | ) | | | — | | | | (14,320,378 | ) | | | — | |
GSCO | | | 11,032,779 | | | | (38,725 | ) | | | — | | | | (10,994,054 | ) | | | — | |
HSBK | | | 32,023,360 | | | | (23,354,645 | ) | | | (6,961,447 | ) | | | — | | | | 1,707,268 | |
JPHQ | | | 34,331,479 | | | | (3,233,752 | ) | | | (31,097,727 | ) | | | — | | | | — | |
MSCO | | | 1,915,582 | | | | (355,579 | ) | | | — | | | | (1,560,003 | ) | | | — | |
SCNY | | | 3,311,320 | | | | (905 | ) | | | (2,993,691 | ) | | | (316,724 | ) | | | — | |
UBSW | | | 83,199 | | | | — | | | | — | | | | — | | | | 83,199 | |
| | | | |
Total | | $ | 155,211,443 | | | $ | (33,769,096 | ) | | $ | (41,052,865 | ) | | $ | (78,599,015 | ) | | $ | 1,790,467 | |
| | | | |
aAt December 31, 2016, the Fund received U.K. Treasury Bonds and U.S. Government and Agency securities as collateral for derivatives.
bIn some instances, the collateral amounts disclosed in the table above were adjusted due to the requirement to limit collateral amounts to avoid the effect of overcollateralization. Actual collateral received and/or pledged may be more than the amounts disclosed herein.
FRANKLIN TEMPLETON VARIABLE INSURANCE PRODUCTS TRUST
NOTES TO FINANCIAL STATEMENTS
Templeton Global Bond VIP Fund (continued)
9. Other Derivative Information (continued)
At December 31, 2016, the Fund’s OTC derivative liabilities, which may be offset against the Fund’s OTC derivative assets and collateral pledged to the counterparty, are as follows:
| | | | | | | | | | | | | | | | | | | | |
| | | | | | Amounts Not Offset in the Statement of
Assets and Liabilities | | | | |
| | | Gross Amounts of Liabilities Presented in the Statement of Assets and Liabilities | | | Financial
Instruments
Available for Offset | | | Financial
Instruments
Collateral Pledged | | | Cash Collateral Pledged | | | Net Amount (Not
less than zero) | |
| Counterparty | | | | | | | | | | | | | | | | | | | | |
BOFA | | $ | — | | | $ | — | | | $ | — | | | $ | — | | | $ | — | |
BZWS | | | — | | | | — | | | | — | | | | — | | | | — | |
CITI | | | 3,106,042 | | | | (3,106,042 | ) | | | — | | | | — | | | | — | |
DBAB | | | 3,679,448 | | | | (3,679,448 | ) | | | — | | | | — | | | | — | |
GSCO | | | 38,725 | | | | (38,725 | ) | | | — | | | | — | | | | — | |
HSBK | | | 23,354,645 | | | | (23,354,645 | ) | | | — | | | | — | | | | — | |
JPHQ | | | 3,233,752 | | | | (3,233,752 | ) | | | — | | | | — | | | | — | |
MSCO | | | 355,579 | | | | (355,579 | ) | | | — | | | | — | | | | — | |
SCNY | | | 905 | | | | (905 | ) | | | — | | | | — | | | | — | |
UBSW | | | — | | | | — | | | | — | | | | — | | | | — | |
| | | | |
Total | | $ | 33,769,096 | | | $ | (33,769,096 | ) | | $ | — | | | $ | — | | | $ | — | |
| | | | |
See Note 1(e) regarding derivative financial instruments.
See Abbreviations on page TGB- 38.
10. Credit Facility
The Fund, together with other U.S. registered and foreign investment funds (collectively, Borrowers), managed by Franklin Templeton Investments, are borrowers in a joint syndicated senior unsecured credit facility totaling $2 billion (Global Credit Facility) which matured on February 10, 2017. This Global Credit Facility provides a source of funds to the Borrowers for temporary and emergency purposes, including the ability to meet future unanticipated or unusually large redemption requests. Effective February 10, 2017, the Borrowers renewed the Global Credit Facility for a one year term, maturing February 9, 2018, for a total of $2 billion
Under the terms of the Global Credit Facility, the Fund shall, in addition to interest charged on any borrowings made by the Fund and other costs incurred by the Fund, pay its share of fees and expenses incurred in connection with the implementation and maintenance of the Global Credit Facility, based upon its relative share of the aggregate net assets of all of the Borrowers, including an annual commitment fee of 0.15% based upon the unused portion of the Global Credit Facility. These fees are reflected in other expenses in the Statement of Operations. During the year ended December 31, 2016, the Fund did not use the Global Credit Facility.
11. Fair Value Measurements
The Fund follows a fair value hierarchy that distinguishes between market data obtained from independent sources (observable inputs) and the Fund’s own market assumptions (unobservable inputs). These inputs are used in determining the value of the Fund’s financial instruments and are summarized in the following fair value hierarchy:
| | • | | Level 1 – quoted prices in active markets for identical financial instruments |
FRANKLIN TEMPLETON VARIABLE INSURANCE PRODUCTS TRUST
NOTES TO FINANCIAL STATEMENTS
Templeton Global Bond VIP Fund (continued)
| | • | | Level 2 – other significant observable inputs (including quoted prices for similar financial instruments, interest rates, prepayment speed, credit risk, etc.) |
| | • | | Level 3 – significant unobservable inputs (including the Fund’s own assumptions in determining the fair value of financial instruments) |
The input levels are not necessarily an indication of the risk or liquidity associated with financial instruments at that level.
For movements between the levels within the fair value hierarchy, the Fund has adopted a policy of recognizing the transfers as of the date of the underlying event which caused the movement.
A summary of inputs used as of December 31, 2016, in valuing the Fund’s assets and liabilities carried at fair value, is as follows:
| | | | | | | | | | | | | | | | |
| | | Level 1 | | | Level 2 | | | Level 3 | | | Total | |
| | | | |
| Assets: | | | | | | | | | | | | | | | | |
Investments in Securities: | | | | | | | | | | | | | | | | |
Foreign Government and Agency Securitiesa | | $ | — | | | $ | 2,221,873,489 | | | $ | — | | | $ | 2,221,873,489 | |
Quasi-Sovereign and Corporate Bondsa | | | — | | | | 243,115 | | | | — | | | | 243,115 | |
Short Term Investments | | | 436,780,215 | | | | 297,984,263 | | | | — | | | | 734,764,478 | |
| | | | |
Total Investments in Securities | | $ | 436,780,215 | | | $ | 2,520,100,867 | | | $ | — | | | $ | 2,956,881,082 | |
| | | | |
Other Financial Instruments: | | | | | | | | | | | | | | | | |
Forward Exchange Contracts | | $ | — | | | $ | 155,211,443 | | | $ | — | | | $ | 155,211,443 | |
Swap Contracts | | | — | | | | 11,906,105 | | | | — | | | | 11,906,105 | |
| | | | |
Total Other Financial Instruments | | $ | — | | | $ | 167,117,548 | | | $ | — | | | $ | 167,117,548 | |
| | | | |
| | | | |
| Liabilities: | | | | | | | | | | | | | | | | |
Other Financial Instruments: | | | | | | | | | | | | | | | | |
Forward Exchange Contracts | | $ | — | | | $ | 30,057,241 | | | $ | — | | | $ | 30,057,241 | |
Swap Contracts | | | — | | | | 16,916,932 | | | | — | | | | 16,916,932 | |
| | | | |
Total Other Financial Instruments | | $ | — | | | $ | 46,974,173 | | | $ | — | | | $ | 46,974,173 | |
| | | | |
aFor detailed categories, see the accompanying Statement of Investments.
12. Investment Company Reporting Modernization
In October 2016, the U.S. Securities and Exchange Commission adopted new rules and amended existing rules (together, final rules) intended to modernize the reporting and disclosure of information by registered investment companies. In part, the final rules amend Regulation S-X and require standardized, enhanced disclosures about derivatives in investment company financial statements, as well as other amendments. The compliance date for the amendments to Regulation S-X is August 1, 2017. Management is currently evaluating the impact that the adoption of the amendments to Regulation S-X will have on the Fund’s financial statements and related disclosures.
13. Subsequent Events
The Fund has evaluated subsequent events through the issuance of the financial statements and determined that no events have occurred that require disclosure other than those already disclosed in the financial statements.
FRANKLIN TEMPLETON VARIABLE INSURANCE PRODUCTS TRUST
NOTES TO FINANCIAL STATEMENTS
Templeton Global Bond VIP Fund (continued)
Abbreviations
| | | | | | | | | | |
| Counterparty/Exchange | | Currency | | Selected Portfolio |
| | | | | |
| BOFA | | Bank of America Corp. | | ARS | | Argentine Peso | | BBA | | British Bankers Association |
| | | | | |
| BZWS | | Barclays Bank PLC | | BRL | | Brazilian Real | | GDP | | Gross Domestic Product |
| | | | | |
| CITI | | Citigroup, N.A. | | COP | | Colombian Peso | | LIBOR | | London InterBank Offered Rate |
| | | | | |
| CME | | Chicago Mercantile Exchange | | EUR | | Euro | | VRI | | Value Recovery Instruments |
| | | | | |
| DBAB | | Deutsche Bank AG | | IDR | | Indonesian Rupiah | | | | |
| | | | | |
| GSCO | | Goldman Sachs Group, Inc. | | INR | | Indian Rupee | | | | |
| | | | | |
| HSBK | | HSBC Bank PLC | | KRW | | South Korean Won | | | | |
| | | | | |
| JPHQ | | JPMorgan Chase N.A. | | LKR | | Sri Lankan Rupee | | | | |
| | | | | |
| LCH | | London Clearing House | | MXN | | Mexican Peso | | | | |
| | | | | |
| MSCO | | Morgan Stanley | | MYR | | Malaysian Ringgit | | | | |
| | | | | |
| SCNY | | Standard Chartered Bank | | PEN | | Peruvian Nuevo Sol | | | | |
| | | | | |
| UBSW | | UBS AG | | PHP | | Philippine Peso | | | | |
| | | | | |
| | | | USD | | United States Dollar | | | | |
| | | | | |
| | | | ZAR | | South African Rand | | | | |
FRANKLIN TEMPLETON VARIABLE INSURANCE PRODUCTS TRUST
Report of Independent Registered Public Accounting Firm
Templeton Global Bond VIP Fund
To the Board of Trustees and Shareholders of Franklin Templeton Variable Insurance Products Trust
In our opinion, the accompanying statement of assets and liabilities, including the statement of investments, and the related statements of operations and of changes in net assets and the financial highlights present fairly, in all material respects, the financial position of Templeton Global Bond VIP Fund (the “Fund”) as of December 31, 2016, the results of its operations for the year then ended, the changes in its net assets for each of the two years in the period then ended and the financial highlights for the periods presented, in conformity with accounting principles generally accepted in the United States of America. These financial statements and financial highlights (hereafter referred to as “financial statements”) are the responsibility of the Fund’s management. Our responsibility is to express an opinion on these financial statements based on our audits. We conducted our audits of these financial statements in accordance with the standards of the Public Company Accounting Oversight Board (United States). Those standards require that we plan and perform the audit to obtain reasonable assurance about whether the financial statements are free of material misstatement. An audit includes examining, on a test basis, evidence supporting the amounts and disclosures in the financial statements, assessing the accounting principles used and significant estimates made by management, and evaluating the overall financial statement presentation. We believe that our audits, which included confirmation of securities as of December 31, 2016 by correspondence with the custodian, transfer agent and brokers, provide a reasonable basis for our opinion.
PricewaterhouseCoopers LLP
San Francisco, California
February 15, 2017
FRANKLIN TEMPLETON VARIABLE INSURANCE PRODUCTS TRUST
Tax Information (unaudited)
Templeton Global Bond VIP Fund
Under Section 852(b)(3)(C) of the Internal Revenue Code, the Fund hereby reports the maximum amount allowable but no less than $2,757,688 as a long term capital gain dividend for the fiscal year ended December 31, 2016.
Templeton Growth VIP Fund
We are pleased to bring you Templeton Growth VIP Fund’s annual report for the fiscal year ended December 31, 2016.
Class 2 Performance Summary as of December 31, 2016
Average annual total return of Class 2 shares* represents the average annual change in value, assuming reinvestment of dividends and capital gains. Average returns smooth out variations in returns, which can be significant; they are not the same as year-by-year results.
| | | | | | | | | | | | |
| Periods ended 12/31/16 | | 1-Year | | | 5-Year | | | 10-Year | |
Average Annual Total Return | | | +9.62% | | | | +9.55% | | | | +2.01% | |
*The Fund has a fee waiver associated with any investment it makes in a Franklin Templeton money fund and/or other Franklin Templeton fund, contractually guaranteed through its current fiscal year-end. Fund investment results reflect the fee waiver; without this waiver, the results would have been lower.
Performance reflects the Fund’s Class 2 operating expenses, but does not include any contract fees, expenses or sales charges. If they had been included, performance would be lower. These charges and deductions, particularly for variable life policies, can have a significant effect on contract values and insurance benefits. See the contract prospectus for a complete description of these expenses, including sales charges.
Performance data represent past performance, which does not guarantee future results. Investment return and principal value will fluctuate, and you may have a gain or loss when you sell your shares. Current performance may differ from figures shown.
Total Return Index Comparison for a Hypothetical $10,000 Investment (1/1/07–12/31/16)
The graph below shows the change in value of a hypothetical $10,000 investment in the Fund over the indicated period and includes reinvestment of any income or distributions. The Fund’s performance* is compared to the performance of its new benchmark, the MSCI All Country World Index (ACWI), and its old benchmark, the MSCI World Index. We believe the new index better represents the Fund’s investable universe and is more in line with the Fund’s mandates. One cannot invest directly in an index, and an index is not representative of the Fund’s portfolio. Please see Important Notes to Performance Information preceding the Fund Summaries.
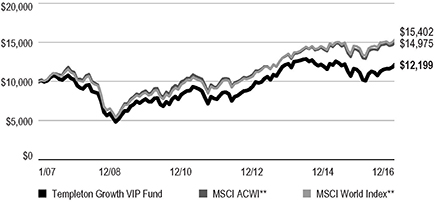
**Source: Morningstar. Please see Index Descriptions following the Fund Summaries.
TEMPLETON GROWTH VIP FUND
Fund Goal and Main Investments
The Fund seeks long-term capital growth. Under normal market conditions, the Fund invests predominantly in equity securities of companies located anywhere in the world, including developing markets.
Fund Risks
All investments involve risks, including possible loss of principal. Special risks are associated with foreign investing, including currency fluctuations, economic instability and political developments; investments in emerging markets involve heightened risks related to the same factors. In addition, smaller and midsized-company stocks have historically experienced more price volatility than larger company stocks, especially over the short term. Value securities may not increase in price as anticipated or may decline further in value. To the extent the Fund focuses on particular countries, regions, industries, sectors or types of investments from time to time, it may be subject to greater risks of adverse developments in such areas of focus than a fund that invests in a wider variety of countries, regions, industries, sectors or investments. Derivatives, including currency management strategies, involve costs and can create economic leverage in the portfolio, which may result in significant volatility and cause the Fund to participate in losses (as well as enable gains) on an amount that exceeds the Fund’s initial investment. The Fund is actively managed but there is no guarantee that the manager’s investment decisions will produce the desired results. The Fund’s prospectus also includes a description of the main investment risks.
Performance Overview
You can find the Fund’s one-year total return in the Performance Summary. For comparison, the Fund’s new benchmark, the MSCI ACWI, returned +8.48%, while its old benchmark, the MSCI World Index, returned +8.15% for the period under review.1 We believe the new index better represents the Fund’s investable universe and is more in line with the Fund’s mandates.
Economic and Market Overview
The global economy grew moderately during the 12-month period despite slower growth in some countries. In this
Geographic Composition
Based on Total Net Assets as of 12/31/16
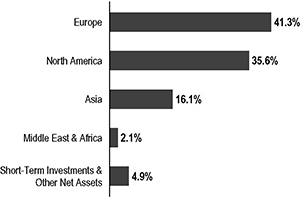
environment, global developed and emerging market stocks, as measured by the MSCI ACWI, rose. Global markets were aided by accommodative monetary policies of various global central banks, improved commodity prices after 2016’s first quarter, finalization of Greece’s new debt deal and generally encouraging global economic data. Further supporting markets were expectations of higher interest rates and inflation in the U.S., driven by talk of expansionary fiscal policies under new U.S. president Donald Trump, and an Organization of the Petroleum Exporting Countries (OPEC) deal to curb oil production. However, these factors were partially offset by a slowdown in China’s economy and declining commodity prices early in the period, geopolitical tensions in certain regions, uncertainty about the U.S. Federal Reserve’s (Fed’s) timing for raising interest rates and worries about the health of European banks. In addition, global economic concerns and the U.K.’s historic referendum to leave the European Union (also known as “Brexit”) contributed to volatility in global stock markets.
The U.S. economy grew in 2016 despite a general decline in private inventory and business investments, which partly offset strength in consumer spending, residential investment and government spending. Manufacturing conditions remained volatile but generally expanded. The services sector also grew for most of the period, contributing to new jobs that helped the unemployment rate decrease from 5.0% in December 2015 to 4.7% at period-end.2 Retail sales generally rose, as did home sales and prices amid declining mortgage rates. At its December meeting, the Fed increased its target range for the federal funds rate to 0.50%–0.75%, as policymakers cited an
1. Source: Morningstar. One cannot invest directly in an index, and an index is not representative of the Fund’s portfolio. Please see Index Descriptions following the Fund Summaries.
2. Source: Bureau of Labor Statistics.
The dollar value, number of shares or principal amount, and names of all portfolio holdings are listed in the Fund’s Statement of Investments (SOI).
TEMPLETON GROWTH VIP FUND
improvement in U.S. labor markets and higher inflation. The Federal Open Market Committee also hinted at three additional hikes in 2017, and the Fed raised its 2017 U.S. economic growth forecast, while lowering its unemployment projections.
In Europe, the U.K.’s annualized economic growth accelerated in 2016’s second half, driven by gross fixed capital formation in the third quarter and manufacturing and services in the fourth quarter. Immediate effects of the Brexit vote in June materialized as U.K. stocks declined significantly, the British pound hit a three-decade low amid intensified selling and the U.K.’s credit rating was downgraded. In the eurozone, despite investor concerns about banking sector weakness, low corporate earnings and post-Brexit politics, some regions benefited from rising consumer spending, resulting from a cheaper euro, low inflation and signs of sustained economic growth. The eurozone grew slightly early in the period, aided by lower oil prices, improved exports and the European Central Bank’s (ECB’s) accommodative monetary policy. However, growth moderated in 2016’s second quarter and improved in the third and fourth quarters. After declining in the beginning of 2016, the eurozone’s annual inflation rate increased gradually to reach its highest reading in three years toward period-end, ending at an estimated 1.1% in December. The ECB cut its benchmark interest rate and expanded its massive bond-buying program in March and August 2016 to boost the region’s slowing growth. Furthermore, at its December meeting, the ECB extended the continuation of its monthly asset purchases from March to December of 2017, but it agreed to scale back the purchase amount beginning in April 2017.
In Asia, Japan’s quarterly gross domestic product grew slower in the third quarter than in the second and first quarters, mainly due to declines in private non-residential and public investments. In January 2016, the Bank of Japan (BOJ) introduced negative interest rates on excess reserves held by financial institutions with the central bank to boost lending and help achieve its inflation target. In July 2016, Japan’s Prime Minister Shinzo Abe announced a higher-than-expected fiscal stimulus to revive the economy, followed by an additional monetary stimulus announcement by the BOJ. The BOJ kept its interest rates unchanged toward period-end; however, it overhauled its monetary policy in September to focus on yield-curve control. The bank further announced that it adjusted its Japanese government bond purchases to maintain the 10-year rate for these bonds near 0%.
In emerging markets, economic growth generally moderated during the period. Brazil’s economy continued to be in recession and the country’s central bank cut its benchmark interest rate in October and November 2016 to spur economic growth. Russia’s economic contraction eased in 2016, following a rebound in oil prices and improved industrial production. The Bank of Russia reduced its key interest rates in June and September of 2016 to revive its economy. China’s economy grew at a stable rate in the first three quarters of 2016 and expanded slightly faster in the fourth quarter, as full-year 2016 growth remained within the government’s targeted range. However, the People’s Bank of China employed monetary easing measures that included cutting the cash reserve requirement ratio for the country’s banks and effectively devaluing the Chinese currency against the U.S. dollar. In India, economic growth marginally increased from July through September 2016 due to slower private consumption growth and increased government spending. Overall, emerging market stocks, as measured by the MSCI Emerging Markets Index, rose during the period.3
Investment Strategy
Our investment philosophy is bottom up, value oriented and long term. In choosing investments, we will focus on the market price of a company’s securities relative to our evaluation of the company’s potential long-term earnings, asset value and cash flow. Among factors we may consider are a company’s historical value measures, including price/earnings ratio, profit margins and liquidation value. We do in-depth research to construct a bargain list from which we buy.
Manager’s Discussion
The Fund overcame significant currency-related headwinds and outperformed its benchmark, the MSCI ACWI, over the course of the year, propelled by decisive strength late in the period. The sharp recovery in Fund performance as the year progressed reflected, in our view, a theme that we have been anticipating and discussing in recent quarters: the growing likelihood of a strong rebound in historically depressed value stocks. Indeed, value delivered one of its best rallies on record toward the end of 2016 as interest rates rose and the market began discounting reflationary expectations following the U.S. presidential election outcome. Many investors were left scrambling to reduce defensive exposure in sectors that we have long argued were expensive, such as consumer staples and utilities, and rotate into depressed cyclical sectors, such as energy and
3. Please see Index Descriptions following the Fund Summaries.
TEMPLETON GROWTH VIP FUND
Top 10 Holdings
12/31/16
| | | | |
Company Sector/Industry, Country | | % of Total
Net Assets | |
Samsung Electronics Co. Ltd. Technology Hardware, Storage & Peripherals, South Korea | | | 3.1% | |
Royal Dutch Shell PLC Oil, Gas & Consumable Fuels, U.K. | | | 2.8% | |
Citigroup Inc. Banks, U.S. | | | 2.4% | |
Microsoft Corp. Software, U.S. | | | 2.1% | |
Teva Pharmaceutical Industries Ltd. Pharmaceuticals, Israel | | | 2.1% | |
Oracle Corp. Software, U.S. | | | 2.0% | |
Amgen Inc. Biotechnology, U.S. | | | 1.9% | |
JPMorgan Chase & Co. Banks, U.S. | | | 1.9% | |
SunTrust Banks Inc. Banks, U.S. | | | 1.8% | |
BP PLC Oil, Gas & Consumable Fuels, U.K. | | | 1.8% | |
financials, where we feel we have been finding good value opportunities for some time.4
The Fund’s significantly overweighted energy position strongly outperformed in this environment, buoyed also by stock selection. Energy stocks accounted for half of the Fund’s top 10 contributors, led by U.K. oil major Royal Dutch Shell and U.S. oilfield services firm Halliburton. Shell rose to the highest level in over a year as oil prices recovered and the firm reported quarterly earnings that significantly exceeded analysts’ estimates, helped by higher production from its recent acquisition of BG Group. Meanwhile, Halliburton recovered from a failed bid for a domestic rival and finished the period at a two-year high as firmer oil prices revived earnings expectations. With the price of oil up over 100% from its low in February 2016, we have seen the most anticipatory parts of the energy sector — namely, the early cycle oilfield services firms (such as Halliburton) and exploration and production companies — outperform the integrated oil producers. This is particularly the case in North America, one of the world’s higher cost oil producers and the region that has benefited most from OPEC’s supply cuts, as well as from the election of a U.S.
administration expected to have a light environmental regulatory touch. Our current strategy, therefore, involves selectively reducing exposure to some of the earlier cycle energy stocks with fuller valuations and rotating into opportunities among global oil majors we feel are more modestly valued, as well as a few exploration and production firms and service providers outside of North America. The net result is a slightly lower energy allocation going into 2017 than we had during most of 2016, though the broader overweighting remains and is consistent with our expectation for higher oil prices given the vast reductions in industry capital expenditures, a significant decline in the U.S. rig count and OPEC’s recent agreement to curtail a larger-than-expected amount of production.
Elsewhere among resource sectors, stock selection and a modest overweighting in materials outperformed, led by Swiss miner and commodities trader Glencore.5 Its shares rebounded from all-time lows during the period as company management restructured and deleveraged against a backdrop of rising commodity prices. At period-end, management announced a lucrative oil deal as well as plans to reinstate the suspended dividend, capping a remarkable turnaround from acutely distressed levels, in our view. We were actively acquiring the stock amid the turmoil in late 2015, confident in the counter-cyclical characteristics of the firm’s trading business and management’s overall ability to use Glencore’s vast resources and attractive assets to deleverage and appease rating agencies. The company’s shares have quadrupled off the bottom and are now closer to fair value, in our analysis, as the market more fully prices in both the successful balance sheet repair and improving operating fundamentals amid a recovery in key commodities, such as zinc, coal and copper. Among resource sectors, we continue to favor energy over mining; however, among the miners, we note that industrial metals producers have experienced a full cycle of profit and valuation recovery in less than a year. We have begun to take profits in industrial miners vulnerable to a Chinese demand slowdown and reinvest proceeds into depressed precious metals miners with uncorrelated risk and return characteristics.
Stock selection also benefited the Fund’s modestly underweighted information technology (IT) position, led by South Korean semiconductor and consumer electronics
4. The consumer staples sector comprises food and staples retailing in the SOI. The utilities sector comprises multi-utilities in the SOI. The energy sector comprises energy equipment and services and oil, gas and consumable fuels in the SOI. The financials sector comprises banks, capital markets, consumer finance and insurance in the SOI.
5. The materials sector comprises chemicals, construction materials, and metals and mining in the SOI.
TEMPLETON GROWTH VIP FUND
manufacturer Samsung Electronics.6 Its shares rose to a record high in the fourth quarter as the firm recovered from a high-profile product recall and company management partially capitulated to shareholder demands in a strategic update. Samsung remains fundamentally attractive, in our view, with ongoing strength in memory and display, technical and manufacturing leadership across business lines, and a growing cash balance to help fund the company’s new, shareholder-friendly capital allocation strategy. The Fund’s underweighted industrials holdings helped extend outperformance, led by U.S. truck manufacturer Navistar International, whose shares rallied after German carmaker Volkswagen agreed to a strategic alliance and an equity stake.7 Volkswagen’s vote of confidence, combined with demonstrably better profitability and a strong market position in the healthy medium-duty truck and bus segments, suggest to us that Navistar’s shares may be finding a bottom, and we remain holders in anticipation of an ongoing recovery. The Fund also benefited from its significant underweighting in consumer staples. As we have recently noted, the ownership of consumer staples stocks had become the most crowded in the sector’s history and 2016 price-to-earnings ratios relative to the market were expensive and near historical highs. At such extreme price and valuation levels, we argued that assets prized for their perceived “safety” may actually be among the market’s riskiest given their historically high and inverse correlations to interest-rate movement. Such caution proved warranted as the period progressed and consumer staples sold off alongside other equity market bond proxies. At approximately one-fifth of the benchmark’s exposure, our underweighted allocation notably contributed.
Among traditionally defensive sectors, we have seen far better opportunities in health care, though our overweighted allocation and isolated stock-level weakness pressured Fund performance during a period when election-cycle political rhetoric led to a sharp and sustained sector sell-off.8 Israeli generic drug maker Teva Pharmaceutical Industries was the Fund’s biggest laggard, as its shares declined after analysts downgraded earnings forecasts amid concerns about the sustainability of key drug sales, as well as delays to product launches and the completion of a major acquisition. Yet, our analysis indicates to us that Teva will remain a steady cash flow generator throughout this transition period, with the ability to pay down debt and support a solid dividend yield. The
combination of yield and modest growth as its acquisition of Allergan’s generic business is absorbed offers an attractive organic return profile, in our view, even before considering any upside from the expansion of valuation multiples from current, single-digit levels. Regarding broader health care sector concerns, we believe the Republican repeal of the Affordable Care Act could actually do more to help drug makers (by removing taxes and regulation) than hurt them in the near-term. Furthermore, we feel pricing is unlikely to be addressed in standalone legislation, and comprehensive reform will require Congressional approval and take time. While pricing in the U.S. market will continue to be a well-recognized risk, industry fundamentals continue to impress us, characterized by high returns on equity, solid cash flow and earnings growth, and low leverage. Although the broader sector has sold off significantly and features valuations more than one standard deviation below average, both realized operating profits and forward earnings estimates are down only slightly from their peak, and we believe the trend over the course of 2016 actually improved.
Financials is another sector where we have seen compelling value in recent years. Although the Fund’s financials holdings rebounded strongly toward the end of the period as interest rates rose and economic growth expectations improved, the late recovery failed to overcome earlier weakness, and our overweighted sector allocation underperformed in 2016. Weakness was concentrated among the Fund’s European financials holdings, with Italian lender UniCredit, and Swiss diversified financials firm Credit Suisse Group, both finishing among the bottom laggards. UniCredit hit historic valuation lows relative to tangible book value during the year amid a chief executive officer transition and ongoing capital concerns, as well as general fears related to asset quality in Italy. Yet, we feel the company has made solid progress bolstering capital, managing non-performing loans, and improving income from interest and fees, as demonstrated by recent results showing solid operational performance. Meanwhile, Credit Suisse declined amid lower capital markets activity, elevated restructuring and litigation charges, and capital adequacy concerns. Yet, we feel company management has laid out a sensible plan to alleviate cost and capital concerns through a multi-year restructuring program, while also repositioning ancillary businesses to maximize profitability.
6. The IT sector comprises Internet software and services; semiconductors and semiconductor equipment; software; and technology hardware, storage and peripherals in the SOI.
7. The industrials sector comprises aerospace and defense, air freight and logistics, airlines, commercial services and supplies, industrial conglomerates and machinery in the SOI.
8. The health care sector comprises biotechnology, health care equipment and supplies, health care providers and services, life sciences tools and services, and pharmaceuticals in the SOI.
TEMPLETON GROWTH VIP FUND
The broader European banking sector remains exceedingly cheap, in our assessment, trading at a greater than one-standard deviation discount to U.S. peers on a price-to-tangible book basis. Yet, despite little fanfare, economic conditions in Europe are actually improving, with year-on-year gross domestic product growth in the first two quarters of 2016 exceeding that of the U.S. in real terms for the first time since 2009. Private loan growth has turned positive, the flagging euro is becoming a competitive tailwind, and manufacturing indicators are expanding at a level consistent with future earnings upgrades. Interest rates could recover from record lows as the economy improves and the ECB eases its monthly bond purchases, offering prospective upside for European bank shares. Falling loan-loss provisions, which have accounted for most of U.S. bank profit growth since 2009, are another potential catalyst, as is fading regulatory zeal after eight years of aggressive re-regulation. Finally, we have seen the beginnings of self-help measures at European banks; if they continue to develop tighter cost control and more fee- and commission-based profit streams, longer term earnings expectations look underpriced to us. To this end, we are encouraged to note that earnings momentum in the sector just turned positive for only the second time in seven years. Even after a significant rally off the bottom in the second half of 2016, select European bank shares remain cheap, in our view, and we feel they have improving earnings catalysts and scope for additional upside over a long-term investment horizon. We also continue to find opportunities we see as attractive in undervalued Asian banks with significant scope for return on equity (ROE) improvement as organic growth opportunities unfold, as well as in select U.S. banks we believe are well-positioned to benefit from a steeper yield curve and diminishing regulatory burden.
From a regional standpoint, stock selection drove outperformance in all major regions, notably overcoming an underweighted allocation in North America and an overweighted allocation in Europe. We continue to find what we consider compelling bargains in the eurozone, which in our view remains in the early stages of an expansionary economic cycle and geared to a continued value recovery given high operating leverage, an undervalued currency and low starting-point valuations. Politics and policy have been major headwinds, but they seem to us excessively discounted given continued broad support for the euro and recent gains by political moderates, as well as the strengthening of the ECB as a credible bond market backstop. In Asia, we believe China’s economy remains imbalanced and vulnerable to turmoil, though
political imperatives and unique safety valves could help maintain stability. We see bottom-up values as concentrated among cheap China H-share companies operating in consumer-oriented growth industries, while we largely avoid the vulnerable and opaque banking sector, state-owned enterprises and the oversupplied industrial complex.9 Elsewhere in the region, we feel Japan and South Korea both remain stockpickers’ markets. South Korea in particular looks attractive to us, trading at a lower price-to-book value compared with Japan’s, while offering a higher average ROE than Japan. An underweighting in the U.S. detracted, though we continue to find relatively limited bargains in a market we believe has priced in a lot of good news in a short period of time. There is no guarantee that a new U.S. presidential administration will be able to successfully engineer the type of reflationary environment that’s becoming increasingly discounted by U.S. stocks, and if it does, it won’t happen overnight. Risks associated with untested leadership may not yet be fully appreciated, and the market looks expensive to us on most major valuation metrics.
It is important to recognize the effect of currency movements on the Fund’s performance. In general, if the value of the U.S. dollar goes up compared with a foreign currency, an investment traded in that foreign currency will go down in value because it will be worth fewer U.S. dollars. This can have a negative effect on Fund performance. Conversely, when the U.S. dollar weakens in relation to a foreign currency, an investment traded in that foreign currency will increase in value, which can contribute to Fund performance. For the 12 months ended December 31, 2016, the U.S. dollar rose in value relative to most currencies. As a result, the Fund’s performance was negatively affected by the portfolio’s significant investment in securities with non-U.S. currency exposure.
As we enter 2017, we note that value has now taken on some of the characteristics of a momentum trade, leaving it potentially vulnerable to near-term consolidation should the stocks run ahead of themselves. Such concerns notwithstanding, value is bouncing off an extremely low base, and we believe longer term prospects for our investment philosophy remain attractive. We are watching specifically for any meaningful improvements in the earnings of value stocks, which could drive the next leg of outperformance for a style that has thus far benefited primarily from higher valuation multiples. Conversely, economic and interest-rate normalization represent significant challenges for bondholders with nominally fixed returns. Real assets that can adjust for, or pass through, price increases and
9. “China H” denotes shares of China-incorporated, Hong Kong Stock Exchange-listed companies with most businesses in China.
TEMPLETON GROWTH VIP FUND
sustainably generate cash flows—such as equities—appear to us far better positioned. As the market refocuses on fundamentals, we are confident that this next cycle will again prove the virtue of value-oriented active investors capable of identifying selective bargains and mitigating downside risk over the long term.
Thank you for your participation in Templeton Growth VIP Fund. We look forward to serving your future investment needs.
The foregoing information reflects our analysis, opinions and portfolio holdings as of December 31, 2016, the end of the reporting period. The way we implement our main investment strategies and the resulting portfolio holdings may change depending on factors such as market and economic conditions. These opinions may not be relied upon as investment advice or an offer for a particular security. The information is not a complete analysis of every aspect of any market, country, industry, security or the Fund. Statements of fact are from sources considered reliable, but the investment manager makes no representation or warranty as to their completeness or accuracy. Although historical performance is no guarantee of future results, these insights may help you understand our investment management philosophy.
TEMPLETON GROWTH VIP FUND
Class 2 Fund Expenses
As an investor in a variable insurance contract (Contract) that indirectly provides for investment in an underlying mutual fund, you can incur transaction and/or ongoing expenses at both the Fund level and the Contract Level: (1) transaction expenses can include sales charges (loads) on purchases, surrender fees, transfer fees and premium taxes; and (2) ongoing expenses can include management fees, distribution and service (12b-1) fees, contract fees, annual maintenance fees, mortality and expense risk fees and other fees and expenses. All mutual funds and Contracts have some types of ongoing expenses. The table below shows Fund-level ongoing expenses and can help you understand these costs and compare them with those of other mutual funds offered through the Contract. The table assumes a $1,000 investment held for the six months indicated. Please refer to the Fund prospectus for additional information on operating expenses.
Actual Fund Expenses
The table below provides information about the actual account values and actual expenses in the columns under the heading “Actual.” In these columns the Fund’s actual return, which includes the effect of ongoing Fund expenses but does not include the effect of ongoing Contract expenses, is used to calculate the “Ending Account Value.”
You can estimate the Fund-level expenses you paid during the period by following these steps (of course, your account value and expenses will differ from those in this illustration):
| | Divide your account value by $1,000 (if your account had an $8,600 value, then $8,600 ÷ $1,000 = 8.6). |
| | Then multiply the result by the number under the headings “Actual” and “Fund-Level Expenses Paid During Period”
(if Fund-Level Expenses Paid During Period were $ 7.50, then 8.6 x $7.50 = $64.50). |
In this illustration, the estimated expenses paid this period at the Fund level are $64.50.
Hypothetical Example for Comparison with Other Mutual Funds
Under the heading “Hypothetical” in the table, information is provided about hypothetical account values and hypothetical expenses based on the Fund’s actual expense ratio and an assumed rate of return of 5% per year before expenses, which is not the Fund’s actual return. This information may not be used to estimate the actual ending account balance or expenses you paid for the period, but it can help you compare ongoing costs of investing in the Fund with those of other mutual funds offered through the Contract. To do so, compare this 5% hypothetical example with the 5% hypothetical examples that appear in the shareholder reports of other funds offered through the Contract.
Please note that expenses shown in the table are meant to highlight ongoing costs at the Fund level only and do not reflect any ongoing expenses at the Contract level, or transaction expenses at either the Fund or Contract levels. In addition, while the Fund does not have transaction expenses, if the transaction and ongoing expenses at the Contract level were included, the expenses shown below would be higher. You should consult your Contract prospectus or disclosure document for more information.
| | | | | | | | | | | | | | | | | | | | | | | | |
| | | | | | Actual
(actual return after expenses) | | | Hypothetical
(5% annual return before expenses) | | | | |
| Share Class | |
| Beginning Account
Value 7/1/16 |
| |
| Ending Account
Value 12/31/16 |
| |
| Fund-Level
Expenses Paid
During Period7/1/16–12/31/16 |
1,2 | |
| Ending Account
Value 12/31/16 |
| |
| Fund-Level
Expenses Paid
During Period7/1/16–12/31/16 |
1,2 | |
| Net
Annualized
Expense
Ratio |
2 |
Class 2 | | | $1,000 | | | | $1,133.20 | | | | $5.74 | | | | $1,019.76 | | | | $5.43 | | | | 1.07% | |
1. Expenses are equal to the annualized expense ratio for the six-month period as indicated above — in the far right column — multiplied by the simple average account value over the period indicated, and then multiplied by 184/366 to reflect the one-half year period.
2. Reflects expenses after fee waivers and expense reimbursements. Does not include any ongoing expenses of the Contract for which the Fund is an investment option or acquired fund fees and expenses.
VIP-1 P1, P2, P4 06/16
SUPPLEMENT DATED JUNE 27, 2016
TO THE PROSPECTUSES DATED MAY 1, 2016
OF
TEMPLETON FOREIGN VIP FUND
TEMPLETON GROWTH VIP FUND
(Series of Franklin Templeton Variable Insurance Products Trust)
Effective June 30, 2016, the prospectus is amended as follows:
I. The benchmark for the Templeton Foreign VIP Fund has changed from the MSCI EAFE Index to the MSCI ACWI EX USA Index. The “Fund Summary – Performance – Average Annual Total Returns” table on page TF-S4 is revised to add the following:
| | | | | | |
| | | 1 Year | | 5 Years | | 10 Years |
| MSCI All Country World ex-US Index (index reflects no deduction for fees, expenses or taxes)1 | | -5.25% | | 1.51% | | 3.38% |
1. Performance figures as of December 31, 2015. The MSCI All Country World ex-US Index is replacing the MSCI EAFE Index as the Fund’s benchmark. The investment manager believes the composition of the MSCI All Country World ex-US Index more accurately reflects the Fund’s holdings.
II. The benchmark for the Templeton Growth VIP Fund has changed from the MSCI World Index to the MSCI ACWI Index. The “Fund Summary – Performance – Average Annual Total Returns” table on page TG-S3 is revised to add the following:
| | | | | | |
| | | 1 Year | | 5 Years | | 10 Years |
| MSCI All Country World Index (index reflects no deduction for fees, expenses or taxes)1 | | -1.84% | | 6.66% | | 5.31% |
1. Performance figures as of December 31, 2015. The MSCI All Country World Index is replacing the MSCI World Index as the Fund’s benchmark. The investment manager believes the composition of the MSCI All Country World Index more accurately reflects the Fund’s holdings.
Please keep this supplement with your prospectus for future reference.
VIP3 P1_P2_P4 09/16
SUPPLEMENT DATED SEPTEMBER 28, 2016
TO THE PROSPECTUSES
DATED MAY 1, 2016
OF
FRANKLIN GLOBAL REAL ESTATE VIP FUND
FRANKLIN INCOME VIP FUND
FRANKLIN MUTUAL GLOBAL DISCOVERY VIP FUND
FRANKLIN MUTUAL SHARES VIP FUND
TEMPLETON FOREIGN VIP FUND
TEMPLETON GROWTH VIP FUND
(Series of Franklin Templeton Variable Insurance Products Trust)
The Prospectus is amended as follows:
I. For the Franklin Mutual Global Discovery VIP Fund, Templeton Foreign VIP Fund and Templeton Growth VIP Fund, the following is added to the “Fund Summary – Principal Risks” section:
Regional Focus Because the Fund may invest at least a significant portion of its assets in companies in a specific region, including Europe, the Fund is subject to greater risks of adverse developments in that region and/or the surrounding regions than a fund that is more broadly diversified geographically. Political, social or economic disruptions in the region, even in countries in which the Fund is not invested, may adversely affect the value of securities values held by the Fund. Current political uncertainty surrounding the European Union (EU) and its membership, including the 2016 referendum in which the United Kingdom voted to exit the EU, may increase market volatility. The financial instability of some countries in the EU, including Greece, Italy and Spain, together with the risk of that impacting other more stable countries may increase the economic risk of investing in companies in Europe.
II. For all funds (excluding the Franklin Mutual Global Discovery VIP Fund and Franklin Mutual Shares VIP Fund), the “Fund Details – Principal Risks – Foreign Securities” section is revised to add the following as a second paragraph to the “Regional” sub-section:
The risk of investments in Europe may be heightened due to the 2016 referendum in which the United Kingdom voted to exit the European Union (EU). Political, economic and legal uncertainty may cause increased market volatility. In addition, if one or more countries were to exit the EU or abandon the use of the Euro as a currency, the value of investments associated with those countries or the Euro could decline significantly and unpredictably and it would likely cause additional market disruption globally and introduce new legal and regulatory uncertainties.
III. For the Franklin Mutual Global Discovery VIP Fund and Franklin Mutual Shares VIP Fund, the “Fund Details – Principal Risks – Foreign Securities” section is revised to add the following:
Regional. Adverse conditions in a certain region or country can adversely affect securities of issuers in other countries whose economies appear to be unrelated. To the extent that the Fund invests a significant portion of its assets in a specific geographic region or a particular country, the Fund will generally have more exposure to the specific regional or country economic risks. In the event of economic or political turmoil or a deterioration of diplomatic relations in a region or country where a substantial portion of the Fund’s assets are invested, the Fund may experience substantial illiquidity or reduction in the value of the Fund’s investments.
The risk of investments in Europe may be heightened due to the 2016 referendum in which the United Kingdom voted to exit the European Union (EU). Political, economic and legal uncertainty may cause increased market volatility. In addition, if one or more countries were to exit the EU or abandon the use of the Euro as a currency, the value of investments associated with those countries or the Euro could decline significantly and unpredictably and it would likely cause additional market disruption globally and introduce new legal and regulatory uncertainties.
FRANKLIN TEMPLETON VARIABLE INSURANCE PRODUCTS TRUST
Financial Highlights
Templeton Growth VIP Fund
| | | | | | | | | | | | | | | | | | | | |
| | | Year Ended December 31, | |
| | | 2016 | | | 2015 | | | 2014 | | | 2013 | | | 2012 | |
| Class 1 | | | | | | | | | | | | | | | | | | | | |
Per share operating performance (for a share outstanding throughout the year) | | | | | | | | | | | | | | | | | | | | |
| | | | | |
Net asset value, beginning of year | | | $13.54 | | | | $14.85 | | | | $15.47 | | | | $12.16 | | | | $10.27 | |
| | | | |
| | | | | |
| Income from investment operationsa: | | | | | | | | | | | | | | | | | | | | |
| | | | | |
Net investment incomeb | | | 0.26 | | | | 0.28 | | | | 0.38 | c | | | 0.22 | | | | 0.27 | |
| | | | | |
Net realized and unrealized gains (losses) | | | 0.96 | | | | (1.17 | ) | | | (0.75 | ) | | | 3.49 | | | | 1.88 | |
| | | | |
Total from investment operations | | | 1.22 | | | | (0.89 | ) | | | (0.37 | ) | | | 3.71 | | | | 2.15 | |
| | | | |
| | | | | |
| Less distributions from: | | | | | | | | | | | | | | | | | | | | |
| | | | | |
Net investment income | | | (0.31 | ) | | | (0.42 | ) | | | (0.25 | ) | | | (0.40 | ) | | | (0.26 | ) |
| | | | | |
Net realized gains | | | (0.52 | ) | | | — | | | | — | | | | — | | | | — | |
| | | | |
Total distributions | | | (0.83 | ) | | | (0.42 | ) | | | (0.25 | ) | | | (0.40 | ) | | | (0.26 | ) |
| | | | |
Net asset value, end of year | | | $13.93 | | | | $13.54 | | | | $14.85 | | | | $15.47 | | | | $12.16 | |
| | | | |
| | | | | |
Total returnd | | | 9.90% | | | | (6.24)% | | | | (2.53)% | | | | 31.05% | | | | 21.40% | |
| | | | | |
| Ratios to average net assets | | | | | | | | | | | | | | | | | | | | |
| | | | | |
Expenses | | | 0.82% | e | | | 0.80% | e | | | 0.78% | | | | 0.78% | f | | | 0.78% | f |
| | | | | |
Net investment income | | | 2.01% | | | | 1.96% | | | | 2.46% | c | | | 1.62% | | | | 2.31% | |
| | | | | |
| Supplemental data | | | | | | | | | | | | | | | | | | | | |
| | | | | |
Net assets, end of year (000’s) | | | $453,997 | | | | $468,548 | | | | $572,860 | | | | $588,409 | | | | $476,954 | |
| | | | | |
Portfolio turnover rate | | | 22.88% | | | | 20.92% | | | | 17.46% | | | | 11.60% | | | | 18.73% | g |
aThe amount shown for a share outstanding throughout the period may not correlate with the Statement of Operations for the period due to the timing of sales and repurchases of the Fund’s shares in relation to income earned and/or fluctuating fair value of the investments of the Fund.
bBased on average daily shares outstanding.
cNet investment income per share includes approximately $0.09 per share related to income received in the form of special dividends in connection with certain Fund holdings. Excluding this amount, the ratio of net investment income to average net assets would have been 1.88%.
dTotal return does not include fees, charges or expenses imposed by the variable annuity and life insurance contracts for which Franklin Templeton Variable Insurance Products Trust serves as an underlying investment vehicle.
eBenefit of waiver and payments by affiliates rounds to less than 0.01%.
fBenefit of expense reduction rounds to less than 0.01%.
gExcludes the value of portfolio securities delivered as a result of redemption in-kind.
| | | | | | |
| | | The accompanying notes are an integral part of these financial statements. | Annual Report | | | TG-11 | |
FRANKLIN TEMPLETON VARIABLE INSURANCE PRODUCTS TRUST
FINANCIAL HIGHLIGHTS
Templeton Growth VIP Fund (continued)
| | | | | | | | | | | | | | | | | | | | |
| | | Year Ended December 31, | |
| | | 2016 | | | 2015 | | | 2014 | | | 2013 | | | 2012 | |
| Class 2 | | | | | | | | | | | | | | | | | | | | |
Per share operating performance (for a share outstanding throughout the year) | | | | | | | | | | | | | | | | | | | | |
| | | | | |
Net asset value, beginning of year | | | $13.32 | | | | $14.61 | | | | $15.23 | | | | $11.97 | | | | $10.11 | |
| | | | |
| | | | | |
| Income from investment operationsa: | | | | | | | | | | | | | | | | | | | | |
| | | | | |
Net investment incomeb | | | 0.23 | | | | 0.25 | | | | 0.34 | c | | | 0.19 | | | | 0.21 | |
| | | | | |
Net realized and unrealized gains (losses) | | | 0.94 | | | | (1.16 | ) | | | (0.75 | ) | | | 3.44 | | | | 1.88 | |
| | | | |
Total from investment operations | | | 1.17 | | | | (0.91 | ) | | | (0.41 | ) | | | 3.63 | | | | 2.09 | |
| | | | |
| | | | | |
| Less distributions from: | | | | | | | | | | | | | | | | | | | | |
| | | | | |
Net investment income | | | (0.27 | ) | | | (0.38 | ) | | | (0.21 | ) | | | (0.37 | ) | | | (0.23 | ) |
| | | | | |
Net realized gains | | | (0.52 | ) | | | — | | | | — | | | | — | | | | — | |
| | | | |
Total distributions | | | (0.79 | ) | | | (0.38 | ) | | | (0.21 | ) | | | (0.37 | ) | | | (0.23 | ) |
| | | | |
Net asset value, end of year | | | $13.70 | | | | $13.32 | | | | $14.61 | | | | $15.23 | | | | $11.97 | |
| | | | |
| | | | | |
Total returnd | | | 9.62% | | | | (6.49)% | | | | (2.81)% | | | | 30.82% | | | | 21.07% | |
| | | | | |
| Ratios to average net assets | | | | | | | | | | | | | | | | | | | | |
| | | | | |
Expenses | | | 1.07% | e | | | 1.05% | e | | | 1.03% | | | | 1.03% | f | | | 1.03% | f |
| | | | | |
Net investment income | | | 1.76% | | | | 1.71% | | | | 2.21% | c | | | 1.37% | | | | 2.06% | |
| | | | | |
| Supplemental data | | | | | | | | | | | | | | | | | | | | |
| | | | | |
Net assets, end of year (000’s) | | | $876,128 | | | | $921,895 | | | | $1,171,896 | | | | $1,450,304 | | | | $1,352,554 | |
| | | | | |
Portfolio turnover rate | | | 22.88% | | | | 20.92% | | | | 17.46% | | | | 11.60% | | | | 18.73% | g |
aThe amount shown for a share outstanding throughout the period may not correlate with the Statement of Operations for the period due to the timing of sales and repurchases of the Fund’s shares in relation to income earned and/or fluctuating fair value of the investments of the Fund.
bBased on average daily shares outstanding.
cNet investment income per share includes approximately $0.09 per share related to income received in the form of special dividends in connection with certain Fund holdings. Excluding this amount, the ratio of net investment income to average net assets would have been 1.63%.
dTotal return does not include fees, charges or expenses imposed by the variable annuity and life insurance contracts for which Franklin Templeton Variable Insurance Products Trust serves as an underlying investment vehicle.
eBenefit of waiver and payments by affiliates rounds to less than 0.01%.
fBenefit of expense reduction rounds to less than 0.01%.
gExcludes the value of portfolio securities delivered as a result of redemption in-kind.
| | | | |
| TG-12 | | Annual Report | The accompanying notes are an integral part of these financial statements. | | |
FRANKLIN TEMPLETON VARIABLE INSURANCE PRODUCTS TRUST
FINANCIAL HIGHLIGHTS
Templeton Growth VIP Fund (continued)
| | | | | | | | | | | | | | | | | | | | |
| | | Year Ended December 31, | |
| | | 2016 | | | 2015 | | | 2014 | | | 2013 | | | 2012 | |
| Class 4 | | | | | | | | | | | | | | | | | | | | |
Per share operating performance (for a share outstanding throughout the year) | | | | | | | | | | | | | | | | | | | | |
| | | | | |
Net asset value, beginning of year | | | $13.44 | | | | $14.73 | | | | $15.35 | | | | $12.07 | | | | $10.19 | |
| | | | |
| | | | | |
| Income from investment operationsa: | | | | | | | | | | | | | | | | | | | | |
| | | | | |
Net investment incomeb | | | 0.22 | | | | 0.23 | | | | 0.33 | c | | | 0.17 | | | | 0.20 | |
| | | | | |
Net realized and unrealized gains (losses) | | | 0.94 | | | | (1.16 | ) | | | (0.76 | ) | | | 3.47 | | | | 1.90 | |
| | | | |
Total from investment operations | | | 1.16 | | | | (0.93 | ) | | | (0.43 | ) | | | 3.64 | | | | 2.10 | |
| | | | |
| | | | | |
| Less distributions from: | | | | | | | | | | | | | | | | | | | | |
| | | | | |
Net investment income | | | (0.25 | ) | | | (0.36 | ) | | | (0.19 | ) | | | (0.36 | ) | | | (0.22 | ) |
| | | | | |
Net realized gains | | | (0.52 | ) | | | — | | | | — | | | | — | | | | — | |
| | | | |
Total distributions | | | (0.77 | ) | | | (0.36 | ) | | | (0.19 | ) | | | (0.36 | ) | | | (0.22 | ) |
| | | | |
Net asset value, end of year | | | $13.83 | | | | $13.44 | | | | $14.73 | | | | $15.35 | | | | $12.07 | |
| | | | |
| | | | | |
Total returnd | | | 9.47% | | | | (6.54)% | | | | (2.88)% | | | | 30.64% | | | | 21.02% | |
| | | | | |
| Ratios to average net assets | | | | | | | | | | | | | | | | | | | | |
| | | | | |
Expenses | | | 1.17% | e | | | 1.15% | e | | | 1.13% | | | | 1.13% | f | | | 1.13% | f |
| | | | | |
Net investment income | | | 1.66% | | | | 1.61% | | | | 2.11% | c | | | 1.27% | | | | 1.96% | |
| | | | | |
| Supplemental data | | | | | | | | | | | | | | | | | | | | |
| | | | | |
Net assets, end of year (000’s) | | | $43,286 | | | | $47,777 | | | | $59,989 | | | | $72,683 | | | | $67,158 | |
| | | | | |
Portfolio turnover rate | | | 22.88% | | | | 20.92% | | | | 17.46% | | | | 11.60% | | | | 18.73% | g |
aThe amount shown for a share outstanding throughout the period may not correlate with the Statement of Operations for the period due to the timing of sales and repurchases of the Fund’s shares in relation to income earned and/or fluctuating fair value of the investments of the Fund.
bBased on average daily shares outstanding.
cNet investment income per share includes approximately $0.09 per share related to income received in the form of special dividends in connection with certain Fund holdings. Excluding this amount, the ratio of net investment income to average net assets would have been 1.53%.
dTotal return does not include fees, charges or expenses imposed by the variable annuity and life insurance contracts for which Franklin Templeton Variable Insurance Products Trust serves as an underlying investment vehicle.
eBenefit of waiver and payments by affiliates rounds to less than 0.01%.
fBenefit of expense reduction rounds to less than 0.01%.
gExcludes the value of portfolio securities delivered as a result of redemption in-kind.
| | | | | | |
| | | The accompanying notes are an integral part of these financial statements. | Annual Report | | | TG-13 | |
FRANKLIN TEMPLETON VARIABLE INSURANCE PRODUCTS TRUST
Statement of Investments, December 31, 2016
| | | | | | | | | | | | | | |
| Templeton Growth VIP Fund | |
| | | | | Country | | | Shares | | | Value | |
| | Common Stocks 93.9% | | | | | | | | | | | | |
| | | Aerospace & Defense 1.0% | | | | | | | | | |
| | BAE Systems PLC | | | United Kingdom | | | | 1,928,802 | | | $ | 14,054,010 | |
| | | | | | | | | | | | | | |
| | | Air Freight & Logistics 0.6% | | | | | | | | | |
| | United Parcel Service Inc., B | | | United States | | | | 69,960 | | | | 8,020,214 | |
| | | | | | | | | | | | | | |
| | | Airlines 1.7% | | | | | | | | | |
| | Deutsche Lufthansa AG | | | Germany | | | | 1,766,172 | | | | 22,802,152 | |
| | | | | | | | | | | | | | |
| | | Auto Components 1.0% | | | | | | | | | |
| | Cie Generale des Etablissements Michelin, B | | | France | | | | 122,432 | | | | 13,616,585 | |
| | | | | | | | | | | | | | |
| | | Automobiles 3.5% | | | | | | | | | |
| | Hero Motocorp Ltd. | | | India | | | | 220,820 | | | | 9,890,416 | |
| | Hyundai Motor Co. | | | South Korea | | | | 178,330 | | | | 21,566,430 | |
| | Nissan Motor Co. Ltd. | | | Japan | | | | 1,696,510 | | | | 17,060,161 | |
| | | | | | | | | | | | | | |
| | | | | | | | | | | | | 48,517,007 | |
| | | | | | | | | | | | | | |
| | | Banks 17.1% | | | | | | | | | |
| | Bangkok Bank PCL, fgn | | | Thailand | | | | 153,600 | | | | 691,950 | |
| | Bangkok Bank PCL, NVDR | | | Thailand | | | | 913,600 | | | | 4,064,692 | |
| | Barclays PLC | | | United Kingdom | | | | 5,731,140 | | | | 15,775,358 | |
| | BNP Paribas SA | | | France | | | | 306,307 | | | | 19,515,036 | |
| | Citigroup Inc. | | | United States | | | | 554,790 | | | | 32,971,170 | |
| | Credit Agricole SA | | | France | | | | 1,427,146 | | | | 17,689,354 | |
| | DBS Group Holdings Ltd. | | | Singapore | | | | 932,690 | | | | 11,169,863 | |
| | HSBC Holdings PLC | | | United Kingdom | | | | 2,523,754 | | | | 20,259,680 | |
| | ING Groep NV | | | Netherlands | | | | 1,057,806 | | | | 14,881,123 | |
| | JPMorgan Chase & Co. | | | United States | | | | 297,430 | | | | 25,665,235 | |
| | KB Financial Group Inc. | | | South Korea | | | | 657,984 | | | | 23,327,064 | |
| a | | Standard Chartered PLC | | | United Kingdom | | | | 2,584,883 | | | | 21,130,274 | |
| | SunTrust Banks Inc. | | | United States | | | | 443,410 | | | | 24,321,038 | |
| | UniCredit SpA | | | Italy | | | | 1,175,661 | | | | 3,382,041 | |
| | | | | | | | | | | | | | |
| | | | | | | | | | | | | 234,843,878 | |
| | | | | | | | | | | | | | |
| | | Biotechnology 3.7% | | | | | | | | | |
| | Amgen Inc. | | | United States | | | | 181,730 | | | | 26,570,743 | |
| a | | Celgene Corp. | | | United States | | | | 32,720 | | | | 3,787,340 | |
| | Gilead Sciences Inc. | | | United States | | | | 283,260 | | | | 20,284,249 | |
| | | | | | | | | | | | | | |
| | | | | | | | | | | | | 50,642,332 | |
| | | | | | | | | | | | | | |
| | | Capital Markets 1.5% | | | | | | | | | |
| | Credit Suisse Group AG | | | Switzerland | | | | 899,480 | | | | 12,903,970 | |
| | UBS Group AG | | | Switzerland | | | | 451,380 | | | | 7,069,433 | |
| | | | | | | | | | | | | | |
| | | | | | | | | | | | | 19,973,403 | |
| | | | | | | | | | | | | | |
| | | Chemicals 0.9% | | | | | | | | | |
| | Akzo Nobel NV | | | Netherlands | | | | 204,762 | | | | 12,795,609 | |
| | | | | | | | | | | | | | |
| | | Commercial Services & Supplies 0.2% | | | | | | | | | |
| a | | Serco Group PLC | | | United Kingdom | | | | 1,791,878 | | | | 3,163,097 | |
| | | | | | | | | | | | | | |
| | | Communications Equipment 3.0% | | | | | | | | | |
| | Cisco Systems Inc. | | | United States | | | | 734,510 | | | | 22,196,892 | |
| | Ericsson, B | | | Sweden | | | | 2,683,002 | | | | 15,757,762 | |
| a | | NetScout Systems Inc. | | | United States | | | | 86,600 | | | | 2,727,900 | |
| | | | | | | | | | | | | | |
| | | | | | | | | | | | | 40,682,554 | |
| | | | | | | | | | | | | | |
| | | Construction Materials 0.9% | | | | | | | | | |
| | CRH PLC | | | Ireland | | | | 372,411 | | | | 12,913,444 | |
| | | | | | | | | | | | | | |
FRANKLIN TEMPLETON VARIABLE INSURANCE PRODUCTS TRUST
STATEMENT OF INVESTMENTS
| | | | | | | | | | | | | | |
| Templeton Growth VIP Fund (continued) | |
| | | | | Country | | | Shares | | | Value | |
| | Common Stocks (continued) | | | | | | | | | | | | |
| | | Consumer Finance 1.2% | | | | | | | | | |
| | Capital One Financial Corp. | | | United States | | | | 187,470 | | | $ | 16,354,883 | |
| | | | | | | | | | | | | | |
| | | Diversified Telecommunication Services 2.5% | | | | | | | | | |
| | China Telecom Corp. Ltd., ADR | | | China | | | | 179,195 | | | | 8,266,265 | |
| | China Telecom Corp. Ltd., H | | | China | | | | 2,006,000 | | | | 926,105 | |
| | Singapore Telecommunications Ltd. | | | Singapore | | | | 3,601,250 | | | | 9,078,364 | |
| | Telefonica SA | | | Spain | | | | 1,656,335 | | | | 15,371,457 | |
| | | | | | | | | | | | | | |
| | | | | | | | | | | | | 33,642,191 | |
| | | | | | | | | | | | | | |
| | | Energy Equipment & Services 0.9% | | | | | | | | | |
| | Halliburton Co. | | | United States | | | | 217,950 | | | | 11,788,915 | |
| | | | | | | | | | | | | | |
| | | Food & Staples Retailing 1.9% | | | | | | | | | |
| | Metro AG | | | Germany | | | | 587,740 | | | | 19,532,796 | |
| a | | Tesco PLC | | | United Kingdom | | | | 2,775,078 | | | | 7,071,126 | |
| | | | | | | | | | | | | | |
| | | | | | | | | | | | | 26,603,922 | |
| | | | | | | | | | | | | | |
| | | Health Care Equipment & Supplies 1.5% | | | | | | | | | |
| | Getinge AB, B | | | Sweden | | | | 925,050 | | | | 14,836,627 | |
| | Medtronic PLC | | | United States | | | | 74,440 | | | | 5,302,361 | |
| | | | | | | | | | | | | | |
| | | | | | | | | | | | | 20,138,988 | |
| | | | | | | | | | | | | | |
| | | Health Care Providers & Services 0.6% | | | | | | | | | |
| | AmerisourceBergen Corp. | | | United States | | | | 38,558 | | | | 3,014,850 | |
| | Cardinal Health Inc. | | | United States | | | | 80,400 | | | | 5,786,388 | |
| | | | | | | | | | | | | | |
| | | | | | | | | | | | | 8,801,238 | |
| | | | | | | | | | | | | | |
| | | Household Durables 0.8% | | | | | | | | | |
| | Panasonic Corp. | | | Japan | | | | 1,087,070 | | | | 11,061,806 | |
| | | | | | | | | | | | | | |
| | | Industrial Conglomerates 2.0% | | | | | | | | | |
| | Siemens AG | | | Germany | | | | 146,852 | | | | 18,047,664 | |
| a | | Toshiba Corp. | | | Japan | | | | 3,807,380 | | | | 9,220,833 | |
| | | | | | | | | | | | | | |
| | | | | | | | | | | | | 27,268,497 | |
| | | | | | | | | | | | | | |
| | | Insurance 4.4% | | | | | | | | | |
| | Aegon NV | | | Netherlands | | | | 2,761,456 | | | | 15,190,497 | |
| | American International Group Inc. | | | United States | | | | 312,040 | | | | 20,379,333 | |
| | AXA SA | | | France | | | | 376,478 | | | | 9,501,181 | |
| | China Life Insurance Co. Ltd., H | | | China | | | | 6,041,230 | | | | 15,737,036 | |
| | | | | | | | | | | | | | |
| | | | | | | | | | | | | 60,808,047 | |
| | | | | | | | | | | | | | |
| | | Internet Software & Services 1.7% | | | | | | | | | |
| a | | Alphabet Inc., A | | | United States | | | | 25,760 | | | | 20,413,512 | |
| a | | Baidu Inc., ADR | | | China | | | | 20,820 | | | | 3,423,016 | |
| | | | | | | | | | | | | | |
| | | | | | | | | | | | | 23,836,528 | |
| | | | | | | | | | | | | | |
| | | Life Sciences Tools & Services 0.8% | | | | | | | | | |
| a | | QIAGEN NV | | | Netherlands | | | | 385,000 | | | | 10,807,987 | |
| | | | | | | | | | | | | | |
| | | Machinery 1.4% | | | | | | | | | |
| a | | Navistar International Corp. | | | United States | | | | 598,440 | | | | 18,773,063 | |
| | | | | | | | | | | | | | |
| | | Media 4.0% | | | | | | | | | |
| | Comcast Corp., A | | | United States | | | | 297,202 | | | | 20,521,798 | |
| | Sky PLC | | | United Kingdom | | | | 1,499,257 | | | | 18,302,381 | |
| | Twenty-First Century Fox Inc., A | | | United States | | | | 591,972 | | | | 16,598,895 | |
| | | | | | | | | | | | | | |
| | | | | | | | | | | | | 55,423,074 | |
| | | | | | | | | | | | | | |
FRANKLIN TEMPLETON VARIABLE INSURANCE PRODUCTS TRUST
STATEMENT OF INVESTMENTS
| | | | | | | | | | | | | | |
| Templeton Growth VIP Fund (continued) | |
| | | | | Country | | | Shares | | | Value | |
| | Common Stocks (continued) | | | | | | | | | | | | |
| | | Metals & Mining 2.0% | | | | | | | | | |
| a | | Glencore PLC | | | Switzerland | | | | 2,260,420 | | | $ | 7,722,807 | |
| | MMC Norilsk Nickel PJSC, ADR | | | Russia | | | | 948,070 | | | | 15,918,095 | |
| | Silver Wheaton Corp. | | | Canada | | | | 182,700 | | | | 3,529,370 | |
| | | | | | | | | | | | | | |
| | | | | | | | | | | | | 27,170,272 | |
| | | | | | | | | | | | | | |
| | | Multi-Utilities 1.0% | | | | | | | | | |
| a | | innogy SE | | | Germany | | | | 410,700 | | | | 14,264,893 | |
| | | | | | | | | | | | | | |
| | | Oil, Gas & Consumable Fuels 10.9% | | | | | | | | | |
| | Apache Corp. | | | United States | | | | 262,650 | | | | 16,670,396 | |
| | BP PLC | | | United Kingdom | | | | 3,841,161 | | | | 24,112,919 | |
| | ConocoPhillips | | | United States | | | | 210,520 | | | | 10,555,473 | |
| | Eni SpA | | | Italy | | | | 1,331,279 | | | | 21,669,938 | |
| | Galp Energia SGPS SA, B | | | Portugal | | | | 1,013,670 | | | | 15,134,820 | |
| | Kunlun Energy Co. Ltd. | | | China | | | | 17,103,030 | | | | 12,792,259 | |
| | Royal Dutch Shell PLC, A | | | United Kingdom | | | | 15,359 | | | | 424,281 | |
| | Royal Dutch Shell PLC, B | | | United Kingdom | | | | 1,303,219 | | | | 37,790,420 | |
| | Total SA, B | | | France | | | | 206,699 | | | | 10,596,048 | |
| | | | | | | | | | | | | | |
| | | | | | | | | | | | | 149,746,554 | |
| | | | | | | | | | | | | | |
| | | Pharmaceuticals 7.8% | | | | | | | | | |
| a | | Allergan PLC | | | United States | | | | 106,454 | | | | 22,356,404 | |
| | Eli Lilly & Co. | | | United States | | | | 192,470 | | | | 14,156,168 | |
| | Merck KGaA | | | Germany | | | | 127,234 | | | | 13,273,767 | |
| | Roche Holding AG | | | Switzerland | | | | 45,563 | | | | 10,406,475 | |
| | Sanofi | | | France | | | | 227,717 | | | | 18,425,534 | |
| | Teva Pharmaceutical Industries Ltd., ADR | | | Israel | | | | 785,880 | | | | 28,488,150 | |
| | | | | | | | | | | | | | |
| | | | | | | | | | | | | 107,106,498 | |
| | | | | | | | | | | | | | |
| | | Semiconductors & Semiconductor Equipment 0.6% | | | | | | | | | |
| a | | First Solar Inc. | | | United States | | | | 267,320 | | | | 8,578,299 | |
| | | | | | | | | | | | | | |
| | | Software 4.0% | | | | | | | | | |
| | Microsoft Corp. | | | United States | | | | 459,469 | | | | 28,551,404 | |
| | Oracle Corp. | | | United States | | | | 699,970 | | | | 26,913,846 | |
| | | | | | | | | | | | | | |
| | | | | | | | | | | | | 55,465,250 | |
| | | | | | | | | | | | | | |
| | | Specialty Retail 0.8% | | | | | | | | | |
| | Kingfisher PLC | | | United Kingdom | | | | 871,388 | | | | 3,760,188 | |
| | Tiffany & Co. | | | United States | | | | 91,210 | | | | 7,062,390 | |
| | | | | | | | | | | | | | |
| | | | | | | | | | | | | 10,822,578 | |
| | | | | | | | | | | | | | |
| | | Technology Hardware, Storage & Peripherals 5.2% | | | | | | | | | |
| | Apple Inc. | | | United States | | | | 164,980 | | | | 19,107,984 | |
| | Hewlett Packard Enterprise Co. | | | United States | | | | 417,670 | | | | 9,664,884 | |
| | Samsung Electronics Co. Ltd. | | | South Korea | | | | 28,310 | | | | 42,256,706 | |
| | | | | | | | | | | | | | |
| | | | | | | | | | | | | 71,029,574 | |
| | | | | | | | | | | | | | |
| | | Wireless Telecommunication Services 2.8% | | | | | | | | | |
| | SoftBank Group Corp. | | | Japan | | | | 324,800 | | | | 21,575,533 | |
| a | | Turkcell Iletisim Hizmetleri AS, ADR | | | Turkey | | | | 1,565,743 | | | | 10,803,627 | |
| | Vodafone Group PLC | | | United Kingdom | | | | 2,681,677 | | | | 6,601,893 | |
| | | | | | | | | | | | | | |
| | | | | | | | | | | | | 38,981,053 | |
| | | | | | | | | | | | | | |
| | | | |
| | Total Common Stocks (Cost $1,097,251,263) | | | | | | | | | | | 1,290,498,395 | |
| | | | | | | | | | | | | | |
FRANKLIN TEMPLETON VARIABLE INSURANCE PRODUCTS TRUST
STATEMENT OF INVESTMENTS
| | | | | | | | | | | | | | |
| Templeton Growth VIP Fund (continued) | |
| | | | | Country | | | Principal Amount | | | Value | |
| | Corporate Bonds (Cost $14,052,720) 1.2% | | | | | | | | | | | | |
| | | Oil, Gas & Consumable Fuels 1.2% | | | | | | | | | |
| b | | Chesapeake Energy Corp., secured note, second lien, 144A, 8.00%, 12/15/22 | | | United States | | | $ | 14,998,000 | | | $ | 16,261,582 | |
| | | | | | | | | | | | | | |
| | Total Investments before Short Term Investments
(Cost $1,111,303,983) | | | | | | | | | | | 1,306,759,977 | |
| | | | | | | | | | | | | | |
| | | | |
| | Short Term Investments 4.9% | | | | | | | | | | | | |
| | | U.S. Government and Agency Securities
(Cost $4,999,854) 0.4% | | | | | | | | | |
| c | | FFCB, 1/03/17 | | | United States | | | | 5,000,000 | | | | 5,000,000 | |
| | | | | | | | | | | | | | |
| | | Time Deposits 4.5% | | | | | | | | | |
| | Bank of Montreal, 0.42%, 1/03/17 | | | United States | | | | 26,000,000 | | | | 26,000,000 | |
| | Royal Bank of Canada, 0.48%, 1/03/17 | | | United States | | | | 35,700,000 | | | | 35,700,000 | |
| | | | | | | | | | | | | | |
| | Total Time Deposits (Cost $61,700,000) | | | | | | | | | | | 61,700,000 | |
| | | | | | | | | | | | | | |
| | Total Investments (Cost $1,178,003,837) 100.0% | | | | | | | | | | | 1,373,459,977 | |
| | Other Assets, less Liabilities (0.0)%† | | | | | | | | | | | (48,308 | ) |
| | | | | | | | | | | | | | |
| | Net Assets 100.0% | | | | | | | | | | $ | 1,373,411,669 | |
| | | | | | | | | | | | | | |
See Abbreviations on page TG- 28.
†Rounds to less than 0.1% of net assets.
aNon-income producing.
bSecurity was purchased pursuant to Rule 144A under the Securities Act of 1933 and may be sold in transactions exempt from registration only to qualified institutional buyers or in a public offering registered under the Securities Act of 1933. This security has been deemed liquid under guidelines approved by the Trust’s Board of Trustees.
cThe security was issued on a discount basis with no stated coupon rate.
| | | | | | |
| The accompanying notes are an integral part of these financial statements. | Annual Report | | | | TG-17 | |
FRANKLIN TEMPLETON VARIABLE INSURANCE PRODUCTS TRUST
Financial Statements
Statement of Assets and Liabilities
December 31, 2016
| | | | |
| | | Templeton Growth | |
| | | VIP Fund | |
Assets: | | | | |
Investments in securities: | | | | |
Cost | | $ | 1,178,003,837 | |
| | | | |
Value | | $ | 1,373,459,977 | |
Cash | | | 162,108 | |
Receivables: | | | | |
Investment securities sold | | | 216,979 | |
Capital shares sold | | | 19,086 | |
Dividends and interest | | | 2,636,229 | |
European Union tax reclaims | | | 1,804,891 | |
Other assets | | | 113 | |
| | | | |
Total assets | | | 1,378,299,383 | |
| | | | |
Liabilities: | | | | |
Payables: | | | | |
Investment securities purchased | | | 2,869,794 | |
Capital shares redeemed | | | 371,150 | |
Management fees | | | 911,653 | |
Distribution fees | | | 387,466 | |
Accrued expenses and other liabilities | | | 347,651 | |
| | | | |
Total liabilities | | | 4,887,714 | |
| | | | |
Net assets, at value | | $ | 1,373,411,669 | |
| | | | |
Net assets consist of: | | | | |
Paid-in capital | | $ | 1,171,044,807 | |
Undistributed net investment income | | | 25,406,323 | |
Net unrealized appreciation (depreciation) | | | 195,287,906 | |
Accumulated net realized gain (loss) | | | (18,327,367 | ) |
| | | | |
Net assets, at value | | $ | 1,373,411,669 | |
| | | | |
| |
| Class 1: | | | | |
Net assets, at value | | $ | 453,996,895 | |
| | | | |
Shares outstanding | | | 32,593,048 | |
| | | | |
Net asset value and maximum offering price per share | | $ | 13.93 | |
| | | | |
| |
| Class 2: | | | | |
Net assets, at value | | $ | 876,128,293 | |
| | | | |
Shares outstanding | | | 63,936,215 | |
| | | | |
Net asset value and maximum offering price per share | | $ | 13.70 | |
| | | | |
| |
| Class 4: | | | | |
Net assets, at value | | $ | 43,286,481 | |
| | | | |
Shares outstanding | | | 3,129,489 | |
| | | | |
Net asset value and maximum offering price per share | | $ | 13.83 | |
| | | | |
| | | | |
| TG-18 | | Annual Report | The accompanying notes are an integral part of these financial statements. | | |
FRANKLIN TEMPLETON VARIABLE INSURANCE PRODUCTS TRUST
FINANCIAL STATEMENTS
Statement of Operations
for the year ended December 31, 2016
| | | | |
| | | Templeton Growth VIP Fund | |
Investment income: | | | | |
Dividends (net of foreign taxes of $3,131,315) | | $ | 35,778,256 | |
Interest | | | 598,330 | |
Income from securities loaned (net of fees and rebates) | | | 808,807 | |
Other income (Note 1d) | | | 1,048,397 | |
| | | | |
Total investment income. | | | 38,233,790 | |
| | | | |
Expenses: | | | | |
Management fees (Note 3a) | | | 10,554,428 | |
Distribution fees: (Note 3c) | | | | |
Class 2 | | | 2,153,527 | |
Class 4 | | | 156,712 | |
Custodian fees (Note 4) | | | 107,549 | |
Reports to shareholders | | | 196,485 | |
Registration and filing fees | | | 4,139 | |
Professional fees | | | 136,370 | |
Trustees’ fees and expenses | | | 6,460 | |
Other | | | 110,053 | |
| | | | |
Total expenses | | | 13,425,723 | |
Expenses waived/paid by affiliates (Note 3e) | | | (45,133 | ) |
| | | | |
Net expenses | | | 13,380,590 | |
| | | | |
Net investment income | | | 24,853,200 | |
| | | | |
Realized and unrealized gains (losses): | | | | |
Net realized gain (loss) from: | | | | |
Investments | | | (7,306,737 | ) |
Foreign currency transactions | | | (212,524 | ) |
| | | | |
Net realized gain (loss) | | | (7,519,261 | ) |
| | | | |
Net change in unrealized appreciation (depreciation) on: | | | | |
Investments | | | 105,996,349 | |
Translation of other assets and liabilities denominated in foreign currencies | | | (91,779 | ) |
Change in deferred taxes on unrealized appreciation | | | 95,682 | |
| | | | |
Net change in unrealized appreciation (depreciation) | | | 106,000,252 | |
| | | | |
Net realized and unrealized gain (loss) | | | 98,480,991 | |
| | | | |
Net increase (decrease) in net assets resulting from operations | | $ | 123,334,191 | |
| | | | |
| | | | | | |
| | | The accompanying notes are an integral part of these financial statements. | Annual Report | | | TG-19 | |
FRANKLIN TEMPLETON VARIABLE INSURANCE PRODUCTS TRUST
FINANCIAL STATEMENTS
Statements of Changes in Net Assets
| | | | | | | | |
| | | Templeton Growth VIP Fund | |
| | Year Ended December 31, | |
| | 2016 | | | 2015 | |
Increase (decrease) in net assets: | | | | | | | | |
Operations: | | | | | | | | |
Net investment income | | $ | 24,853,200 | | | $ | 29,759,073 | |
Net realized gain (loss) | | | (7,519,261 | ) | | | 131,046,091 | |
Net change in unrealized appreciation (depreciation) | | | 106,000,252 | | | | (259,448,984 | ) |
| | | | | | | | |
Net increase (decrease) in net assets resulting from operations | | | 123,334,191 | | | | (98,643,820 | ) |
| | | | | | | | |
Distributions to shareholders from: | | | | | | | | |
Net investment income: | | | | | | | | |
Class 1 | | | (10,324,588 | ) | | | (15,123,132 | ) |
Class 2 | | | (17,569,556 | ) | | | (28,110,279 | ) |
Class 4 | | | (854,329 | ) | | | (1,358,156 | ) |
Net realized gains: | | | | | | | | |
Class 1 | | | (17,221,955 | ) | | | — | |
Class 2 | | | (33,791,595 | ) | | | — | |
Class 4 | | | (1,749,580 | ) | | | — | |
| | | | | | | | |
Total distributions to shareholders | | | (81,511,603 | ) | | | (44,591,567 | ) |
| | | | | | | | |
Capital share transactions: (Note 2) | | | | | | | | |
Class 1 | | | (29,290,497 | ) | | | (58,388,439 | ) |
Class 2 | | | (71,266,569 | ) | | | (157,221,222 | ) |
Class 4 | | | (6,073,422 | ) | | | (7,679,959 | ) |
| | | | | | | | |
Total capital share transactions | | | (106,630,488 | ) | | | (223,289,620 | ) |
| | | | | | | | |
Net increase (decrease) in net assets | | | (64,807,900 | ) | | | (366,525,007 | ) |
Net assets: | | | | | | | | |
Beginning of year | | | 1,438,219,569 | | | | 1,804,744,576 | |
| | | | | | | | |
End of year | | $ | 1,373,411,669 | | | $ | 1,438,219,569 | |
| | | | | | | | |
Undistributed net investment income included in net assets: | | | | | | | | |
End of year | | $ | 25,406,323 | | | $ | 28,729,403 | |
| | | | | | | | |
| | | | |
| TG-20 | | Annual Report | The accompanying notes are an integral part of these financial statements. | | |
FRANKLIN TEMPLETON VARIABLE INSURANCE PRODUCTS TRUST
Notes to Financial Statements
Templeton Growth VIP Fund
1. Organization and Significant Accounting Policies
Franklin Templeton Variable Insurance Products Trust (Trust) is registered under the Investment Company Act of 1940 (1940 Act) as an open-end management investment company, consisting of nineteen separate funds and applies the specialized accounting and reporting guidance in U.S. Generally Accepted Accounting Principles (U.S. GAAP). Templeton Growth VIP Fund (Fund) is included in this report. The financial statements of the remaining funds in the Trust are presented separately. Shares of the Fund are generally sold only to insurance company separate accounts to fund the benefits of variable life insurance policies or variable annuity contracts. The Fund offers three classes of shares: Class 1, Class 2 and Class 4. Each class of shares differs by its distribution fees, voting rights on matters affecting a single class and its exchange privilege.
The following summarizes the Fund’s significant accounting policies.
a. Financial Instrument Valuation
The Fund’s investments in financial instruments are carried at fair value daily. Fair value is the price that would be received to sell an asset or paid to transfer a liability in an orderly transaction between market participants on the measurement date. The Fund calculates the net asset value (NAV) per share as of 4 p.m. Eastern time each day the New York Stock Exchange (NYSE) is open for trading. Under compliance policies and procedures approved by the Trust’s Board of Trustees (the Board), the Fund’s administrator has responsibility for oversight of valuation, including leading the cross-functional Valuation Committee (VC). The VC provides administration and oversight of the Fund’s valuation policies and procedures, which are approved annually by the Board. Among other things, these procedures allow the Fund to utilize independent pricing services, quotations from securities and financial instrument dealers, and other market sources to determine fair value.
Equity securities listed on an exchange or on the NASDAQ National Market System are valued at the last quoted sale price or the official closing price of the day, respectively. Foreign equity securities are valued as of the close of trading on the foreign stock exchange on which the security is primarily traded or as of 4 p.m. Eastern time. The value is then converted into its U.S. dollar equivalent at the foreign exchange rate in effect at 4 p.m. Eastern time on the day that the value of the security is
determined. Over-the-counter (OTC) securities are valued within the range of the most recent quoted bid and ask prices. Securities that trade in multiple markets or on multiple exchanges are valued according to the broadest and most representative market. Certain equity securities are valued based upon fundamental characteristics or relationships to similar securities.
Debt securities generally trade in the OTC market rather than on a securities exchange. The Fund’s pricing services use multiple valuation techniques to determine fair value. In instances where sufficient market activity exists, the pricing services may utilize a market-based approach through which quotes from market makers are used to determine fair value. In instances where sufficient market activity may not exist or is limited, the pricing services also utilize proprietary valuation models which may consider market characteristics such as benchmark yield curves, credit spreads, estimated default rates, anticipated market interest rate volatility, coupon rates, anticipated timing of principal repayments, underlying collateral, and other unique security features in order to estimate the relevant cash flows, which are then discounted to calculate the fair value.
Investments in open-end mutual funds are valued at the closing NAV. Investments in time deposits are valued at cost, which approximates fair value.
The Fund has procedures to determine the fair value of financial instruments for which market prices are not reliable or readily available. Under these procedures, the VC convenes on a regular basis to review such financial instruments and considers a number of factors, including significant unobservable valuation inputs, when arriving at fair value. The VC primarily employs a market-based approach which may use related or comparable assets or liabilities, recent transactions, market multiples, book values, and other relevant information for the investment to determine the fair value of the investment. An income-based valuation approach may also be used in which the anticipated future cash flows of the investment are discounted to calculate fair value. Discounts may also be applied due to the nature or duration of any restrictions on the disposition of the investments. Due to the inherent uncertainty of valuations of such investments, the fair values may differ significantly from the values that would have been used had an active market existed. The VC employs various methods for calibrating these valuation approaches including a regular review of key inputs and assumptions, transactional back-testing or disposition analysis, and reviews of any related market activity.
FRANKLIN TEMPLETON VARIABLE INSURANCE PRODUCTS TRUST
NOTES TO FINANCIAL STATEMENTS
Templeton Growth VIP Fund (continued)
1. Organization and Significant Accounting
Policies (continued)
a. Financial Instrument Valuation (continued)
Trading in securities on foreign securities stock exchanges and OTC markets may be completed before 4 p.m. Eastern time. In addition, trading in certain foreign markets may not take place on every Fund’s business day. Occasionally, events occur between the time at which trading in a foreign security is completed and 4 p.m. Eastern time that might call into question the reliability of the value of a portfolio security held by the Fund. As a result, differences may arise between the value of the Fund’s portfolio securities as determined at the foreign market close and the latest indications of value at 4 p.m. Eastern time. In order to minimize the potential for these differences, the VC monitors price movements following the close of trading in foreign stock markets through a series of country specific market proxies (such as baskets of American Depositary Receipts, futures contracts and exchange traded funds). These price movements are measured against established trigger thresholds for each specific market proxy to assist in determining if an event has occurred that may call into question the reliability of the values of the foreign securities held by the Fund. If such an event occurs, the securities may be valued using fair value procedures, which may include the use of independent pricing services.
When the last day of the reporting period is a non-business day, certain foreign markets may be open on those days that the Fund’s NAV is not calculated, which could result in differences between the value of the Fund’s portfolio securities on the last business day and the last calendar day of the reporting period. Any significant security valuation changes due to an open foreign market are adjusted and reflected by the Fund for financial reporting purposes.
b. Foreign Currency Translation
Portfolio securities and other assets and liabilities denominated in foreign currencies are translated into U.S. dollars based on the exchange rate of such currencies against U.S. dollars on the date of valuation. The Fund may enter into foreign currency exchange contracts to facilitate transactions denominated in a foreign currency. Purchases and sales of securities, income and expense items denominated in foreign currencies are translated into U.S. dollars at the exchange rate in effect on the transaction date. Portfolio securities and assets and liabilities denominated in foreign currencies contain risks that those currencies will
decline in value relative to the U.S. dollar. Occasionally, events may impact the availability or reliability of foreign exchange rates used to convert the U.S. dollar equivalent value. If such an event occurs, the foreign exchange rate will be valued at fair value using procedures established and approved by the Board.
The Fund does not separately report the effect of changes in foreign exchange rates from changes in market prices on securities held. Such changes are included in net realized and unrealized gain or loss from investments in the Statement of Operations.
Realized foreign exchange gains or losses arise from sales of foreign currencies, currency gains or losses realized between the trade and settlement dates on securities transactions and the difference between the recorded amounts of dividends, interest, and foreign withholding taxes and the U.S. dollar equivalent of the amounts actually received or paid. Net unrealized foreign exchange gains and losses arise from changes in foreign exchange rates on foreign denominated assets and liabilities other than investments in securities held at the end of the reporting period.
c. Securities Lending
The Fund participates in an agency based securities lending program to earn additional income. The Fund receives cash collateral against the loaned securities in an amount equal to at least 102% of the fair value of the loaned securities. Collateral is maintained over the life of the loan in an amount not less than 100% of the fair value of loaned securities, as determined at the close of Fund business each day; any additional collateral required due to changes in security values is delivered to the Fund on the next business day. The collateral is deposited into a joint cash account with other funds and is used to invest in a money market fund managed by Franklin Advisers, Inc., an affiliate of the Fund. The Fund may receive income from the investment of cash collateral, in addition to lending fees and rebates paid by the borrower. Income from securities loaned, net of fees paid to the securities lending agent and/or third-party vendor, is reported separately in the Statement of Operations. The Fund bears the market risk with respect to the collateral investment, securities loaned, and the risk that the agent may default on its obligations to the Fund. If the borrower defaults on its obligation to return the securities loaned, the Fund has the right to repurchase the securities in the open market using the
FRANKLIN TEMPLETON VARIABLE INSURANCE PRODUCTS TRUST
NOTES TO FINANCIAL STATEMENTS
Templeton Growth VIP Fund (continued)
collateral received. The securities lending agent has agreed to indemnify the Fund in the event of default by a third party borrower. At December 31, 2016, the Fund had no securities on loan.
d. Income and Deferred Taxes
It is the Fund’s policy to qualify as a regulated investment company under the Internal Revenue Code. The Fund intends to distribute to shareholders substantially all of its taxable income and net realized gains to relieve it from federal income and if applicable, excise taxes. As a result, no provision for U.S. federal income taxes is required.
The Fund may be subject to foreign taxation related to income received, capital gains on the sale of securities and certain foreign currency transactions in the foreign jurisdictions in which it invests. Foreign taxes, if any, are recorded based on the tax regulations and rates that exist in the foreign markets in which the Fund invests. When a capital gain tax is determined to apply, the Fund records an estimated deferred tax liability in an amount that would be payable if the securities were disposed of on the valuation date. As a result of several court cases, in certain countries across the European Union, the Fund filed additional tax reclaims for previously withheld taxes on dividends earned in those countries (EU reclaims). These additional filings are subject to various administrative proceedings by the local jurisdictions’ tax authorities within the European Union, as well as a number of related judicial proceedings. Income recognized, if any, for EU reclaims is reflected as other income in the Statement of Operations and any related receivable, if any, is reflected as European Union tax reclaims in the Statement of Assets and Liabilities. When uncertainty exists as to the ultimate resolution of these proceedings, the likelihood of receipt of these EU reclaims, and the potential timing of payment, no amounts are reflected in the financial statements. For U.S. income tax purposes, when EU reclaims are received by the Fund and the Fund previously passed foreign tax credit on to its shareholders, the Fund must either amend historic tax reporting to shareholders or enter into a closing agreement with the Internal Revenue Service (IRS) in order to pay the associated tax liability on behalf of the Fund’s shareholders.
The Fund may recognize an income tax liability related to its uncertain tax positions under U.S. GAAP when the uncertain tax position has a less than 50% probability that it will be sustained upon examination by the tax authorities based on its
technical merits. As of December 31, 2016, the Fund has determined that no tax liability is required in its financial statements related to uncertain tax positions for any open tax years (or expected to be taken in future tax years). Open tax years are those that remain subject to examination and are based on each tax jurisdiction’s statute of limitation.
e. Security Transactions, Investment Income, Expenses and Distributions
Security transactions are accounted for on trade date. Realized gains and losses on security transactions are determined on a specific identification basis. Interest income and estimated expenses are accrued daily. Amortization of premium and accretion of discount on debt securities are included in interest income. Dividend income is recorded on the ex-dividend date except for certain dividends from securities where the dividend rate is not available. In such cases, the dividend is recorded as soon as the information is received by the Fund. Distributions to shareholders are recorded on the ex-dividend date and are determined according to income tax regulations (tax basis). Distributable earnings determined on a tax basis may differ from earnings recorded in accordance with U.S. GAAP. These differences may be permanent or temporary. Permanent differences are reclassified among capital accounts to reflect their tax character. These reclassifications have no impact on net assets or the results of operations. Temporary differences are not reclassified, as they may reverse in subsequent periods.
Common expenses incurred by the Trust are allocated among the Funds based on the ratio of net assets of each Fund to the combined net assets of the Trust. Fund specific expenses are charged directly to the Fund that incurred the expense.
Realized and unrealized gains and losses and net investment income, not including class specific expenses, are allocated daily to each class of shares based upon the relative proportion of net assets of each class. Differences in per share distributions, by class, are generally due to differences in class specific expenses.
f. Accounting Estimates
The preparation of financial statements in accordance with U.S. GAAP requires management to make estimates and assumptions that affect the reported amounts of assets and liabilities at the date of the financial statements and the amounts of income and expenses during the reporting period. Actual results could differ from those estimates.
FRANKLIN TEMPLETON VARIABLE INSURANCE PRODUCTS TRUST
NOTES TO FINANCIAL STATEMENTS
Templeton Growth VIP Fund (continued)
1. Organization and Significant Accounting
Policies (continued)
g. Guarantees and Indemnifications
Under the Trust’s organizational documents, its officers and trustees are indemnified by the Trust against certain liabilities arising out of the performance of their duties to the Trust. Additionally, in the normal course of business, the Trust, on
behalf of the Fund, enters into contracts with service providers that contain general indemnification clauses. The Trust’s maximum exposure under these arrangements is unknown as this would involve future claims that may be made against the Trust that have not yet occurred. Currently, the Trust expects the risk of loss to be remote.
2. Shares of Beneficial Interest
At December 31, 2016, there were an unlimited number of shares authorized (without par value). Transactions in the Fund’s shares were as follows:
| | | | | | | | | | | | | | | | | | | | |
| | | Year Ended December 31, | |
| | | 2016 | | | | | | 2015 | |
| | | Shares | | | Amount | | | | | | Shares | | | Amount | |
| | | | | |
| Class 1 Shares: | | | | | | | | | | | | | | | | | | | | |
Shares sold | | | 110,663 | | | $ | 1,440,832 | | | | | | | | 326,516 | | | $ | 4,799,095 | |
Shares issued in reinvestment of distributions | | | 2,252,375 | | | | 27,546,543 | | | | | | | | 1,016,340 | | | | 15,123,132 | |
Shares redeemed | | | (4,377,350 | ) | | | (58,277,872 | ) | | | | | | | (5,310,550 | ) | | | (78,310,666 | ) |
| | | | |
Net increase (decrease) | | | (2,014,312 | ) | | $ | (29,290,497 | ) | | | | | | | (3,967,694 | ) | | $ | (58,388,439 | ) |
| | | | |
| | | | | |
| Class 2 Shares: | | | | | | | | | | | | | | | | | | | | |
Shares sold | | | 3,935,051 | | | $ | 50,119,612 | | | | | | | | 2,945,698 | | | $ | 42,909,317 | |
Shares issued in reinvestment of distributions | | | 4,262,336 | | | | 51,361,152 | | | | | | | | 1,917,482 | | | | 28,110,279 | |
Shares redeemed | | | (13,462,698 | ) | | | (172,747,333 | ) | | | | | | | (15,863,936 | ) | | | (228,240,818 | ) |
| | | | |
Net increase (decrease) | | | (5,265,311 | ) | | $ | (71,266,569 | ) | | | | | | | (11,000,756 | ) | | $ | (157,221,222 | ) |
| | | | |
| | | | | |
| Class 4 Shares: | | | | | | | | | | | | | | | | | | | | |
Shares sold | | | 280,303 | | | $ | 3,402,727 | | | | | | | | 307,977 | | | $ | 4,289,876 | |
Shares issued in reinvestment of distributions | | | 213,961 | | | | 2,603,908 | | | | | | | | 91,767 | | | | 1,358,156 | |
Shares redeemed | | | (920,832 | ) | | | (12,080,057 | ) | | | | | | | (916,167 | ) | | | (13,327,991 | ) |
| | | | |
Net increase (decrease) | | | (426,568 | ) | | $ | (6,073,422 | ) | | | | | | | (516,423 | ) | | $ | (7,679,959 | ) |
| | | | |
3. Transactions with Affiliates
Franklin Resources, Inc. is the holding company for various subsidiaries that together are referred to as Franklin Templeton Investments. Certain officers and trustees of the Fund are also officers and/or directors of the following subsidiaries:
| | |
| Subsidiary | | Affiliation |
Templeton Global Advisors Limited (TGAL) | | Investment manager |
Franklin Templeton Services, LLC (FT Services) | | Administrative manager |
Franklin Templeton Distributors, Inc. (Distributors) | | Principal underwriter |
Franklin Templeton Investor Services, LLC (Investor Services) | | Transfer agent |
FRANKLIN TEMPLETON VARIABLE INSURANCE PRODUCTS TRUST
NOTES TO FINANCIAL STATEMENTS
Templeton Growth VIP Fund (continued)
a. Management Fees
The Fund pays an investment management fee to TGAL based on the average daily net assets of the Fund as follows:
| | |
| Annualized Fee Rate | | Net Assets |
1.000% | | Up to and including $100 million |
0.900% | | Over $100 million, up to and including $250 million |
0.800% | | Over $250 million, up to and including $500 million |
0.750% | | Over $500 million, up to and including $1 billion |
0.700% | | Over $1 billion, up to and including $5 billion |
0.675% | | Over $5 billion, up to and including $10 billion |
0.655% | | Over $10 billion, up to and including $15 billion |
0.635% | | Over $15 billion, up to and including $20 billion |
0.615% | | In excess of $20 billion |
For the year ended December 31, 2016, the effective investment management fee rate was 0.781% of the Fund’s average daily net assets.
b. Administrative Fees
Under an agreement with TGAL, FT Services provides administrative services to the Fund. The fee is paid by TGAL based on the Fund’s average daily net assets, and is not an additional expense of the Fund.
c. Distribution Fees
The Board has adopted distribution plans for Class 2 and Class 4 shares pursuant to Rule 12b-1 under the 1940 Act. Under the Fund’s compensation distribution plans, the Fund pays Distributors for costs incurred in connection with the servicing, sale and distribution of the Fund’s shares up to 0.35% per year of its average daily net assets of each class. The Board has agreed to limit the current rate to 0.25% per year for Class 2. The plan year, for purposes of monitoring compliance with the maximum annual plan rates, is February 1 through January 31.
d. Transfer Agent Fees
Investor Services, under terms of an agreement, performs shareholder servicing for the Fund and is not paid by the Fund for the services.
e. Investments in Affiliated Management Investment Companies
The Fund invests in one or more affiliated management investment companies for purposes other than exercising a controlling influence over the management or policies. Management fees paid by the Fund are waived on assets invested in the affiliated management investment companies, as noted in the Statement of Operations, in an amount not to exceed the management and administrative fees paid directly or indirectly by each affiliate. During the year ended December 31, 2016, the Fund held investments in affiliated management investment companies as follows:
| | | | | | | | | | | | | | | | | | | | | | | | | | | | | | | | |
| | | Number of Shares
Held at Beginning
of Year | | | Gross Additions | | | Gross Reductions | | | Number
of Shares
Held at End of
Year | | | Value at End of Year | | | Investment
Income | | | Realized
Gain
(Loss) | | | % of Affiliated
Fund Shares
Outstanding
Held at End
of Year | |
| Non-Controlled Affiliates | | | | | | | | | | | | | | | | | | | | | | | | | | | | | | | | |
Institutional Fiduciary Trust Money Market Portfolio, 0.09% | | | 8,864,598 | | | | 460,533,608 | | | | (469,398,206 | ) | | | — | | | $ | — | | | $ | — | | | $ | — | | | | —% | |
| | | | | | | | | | | | | | | | | | | | | | | | | | | | | | | | |
FRANKLIN TEMPLETON VARIABLE INSURANCE PRODUCTS TRUST
NOTES TO FINANCIAL STATEMENTS
Templeton Growth VIP Fund (continued)
3. Transactions with Affiliates (continued)
f. Other Affiliated Transactions
At December 31, 2016, Franklin Templeton Variable Insurance Products Trust - Franklin Founding Funds Allocation VIP Fund owned 23.8% of the Fund’s outstanding shares.
4. Expense Offset Arrangement
The Fund has entered into an arrangement with its custodian whereby credits realized as a result of uninvested cash balances are used to reduce a portion of the Fund’s custodian expenses. During the year ended December 31, 2016, there were no credits earned.
5. Income Taxes
For tax purposes, capital losses may be carried over to offset future capital gains, if any. At December 31, 2016, the Fund had long-term capital loss carryforwards of $11,285,978.
The tax character of distributions paid during the years ended December 31, 2016 and 2015, was as follows:
| | | | | | | | |
| | | 2016 | | | 2015 | |
Distributions paid from: | | | | | | | | |
Ordinary income | | $ | 28,757,144 | | | $ | 44,591,567 | |
Long term capital gain | | | 52,754,459 | | | | — | |
| | | | |
| | $ | 81,511,603 | | | $ | 44,591,567 | |
| | | | |
At December 31, 2016, the cost of investments, net unrealized appreciation (depreciation), and undistributed ordinary income for income tax purposes were as follows:
| | | | |
Cost of investments | | $ | 1,185,059,474 | |
| | | | |
Unrealized appreciation | | $ | 293,583,077 | |
Unrealized depreciation | | | (105,182,574 | ) |
| | | | |
Net unrealized appreciation (depreciation) | | $ | 188,400,503 | |
| | | | |
Distributable earnings - undistributed ordinary income | | $ | 23,668,064 | |
| | | | |
Differences between income and/or capital gains as determined on a book basis and a tax basis are primarily due to differing treatment of wash sales.
6. Investment Transactions
Purchases and sales of investments (excluding short term securities) for the year ended December 31, 2016, aggregated $303,650,533 and $514,036,205, respectively.
7. Concentration of Risk
Investing in foreign securities may include certain risks and considerations not typically associated with investing in U.S. securities, such as fluctuating currency values and changing local and regional economic, political and social conditions, which may result in greater market volatility. In addition, certain foreign securities may not be as liquid as U.S. securities.
FRANKLIN TEMPLETON VARIABLE INSURANCE PRODUCTS TRUST
NOTES TO FINANCIAL STATEMENTS
Templeton Growth VIP Fund (continued)
8. Credit Facility
The Fund, together with other U.S. registered and foreign investment funds (collectively, Borrowers), managed by Franklin Templeton Investments, are borrowers in a joint syndicated senior unsecured credit facility totaling $2 billion (Global Credit Facility) which matured on February 10, 2017. This Global Credit Facility provides a source of funds to the Borrowers for temporary and emergency purposes, including the ability to meet future unanticipated or unusually large redemption requests. Effective February 10, 2017, the Borrowers renewed the Global Credit Facility for a one year term, maturing February 9, 2018, for a total of $2 billion.
Under the terms of the Global Credit Facility, the Fund shall, in addition to interest charged on any borrowings made by the Fund and other costs incurred by the Fund, pay its share of fees and expenses incurred in connection with the implementation and maintenance of the Global Credit Facility, based upon its relative share of the aggregate net assets of all of the Borrowers, including an annual commitment fee of 0.15% based upon the unused portion of the Global Credit Facility. These fees are reflected in other expenses in the Statement of Operations. During the year ended December 31, 2016, the Fund did not use the Global Credit Facility.
9. Fair Value Measurements
The Fund follows a fair value hierarchy that distinguishes between market data obtained from independent sources (observable inputs) and the Fund’s own market assumptions (unobservable inputs). These inputs are used in determining the value of the Fund’s financial instruments and are summarized in the following fair value hierarchy:
| | • | | Level 1 – quoted prices in active markets for identical financial instruments |
| | • | | Level 2 – other significant observable inputs (including quoted prices for similar financial instruments, interest rates, prepayment speed, credit risk, etc.) |
| | • | | Level 3 – significant unobservable inputs (including the Fund’s own assumptions in determining the fair value of financial instruments) |
The input levels are not necessarily an indication of the risk or liquidity associated with financial instruments at that level.
For movements between the levels within the fair value hierarchy, the Fund has adopted a policy of recognizing the transfers as of the date of the underlying event which caused the movement.
A summary of inputs used as of December 31, 2016, in valuing the Fund’s assets carried at fair value, is as follows:
| | | | | | | | | | | | | | | | |
| | | Level 1 | | | Level 2 | | | Level 3 | | | Total | |
| Assets: | | | | | | | | | | | | | | | | |
Investments in Securities: | | | | | | | | | | | | | | | | |
Equity Investmentsa | | $ | 1,290,498,395 | | | $ | — | | | $ | — | | | $ | 1,290,498,395 | |
Corporate Bonds | | | — | | | | 16,261,582 | | | | — | | | | 16,261,582 | |
Short Term Investments | | | — | | | | 66,700,000 | | | | — | | | | 66,700,000 | |
| | | | |
Total Investments in Securities | | $ | 1,290,498,395 | | | $ | 82,961,582 | | | $ | — | | | $ | 1,373,459,977 | |
| | | | |
aFor detailed categories, see the accompanying Statement of Investments.
FRANKLIN TEMPLETON VARIABLE INSURANCE PRODUCTS TRUST
NOTES TO FINANCIAL STATEMENTS
Templeton Growth VIP Fund (continued)
10. Investment Company Reporting Modernization
In October 2016, the U.S. Securities and Exchange Commission adopted new rules and amended existing rules (together, final rules) intended to modernize the reporting and disclosure of information by registered investment companies. In part, the final rules amend Regulation S-X and require standardized, enhanced disclosures about derivatives in investment company financial statements, as well as other amendments. The compliance date for the amendments to Regulation S-X is August 1, 2017. Management is currently evaluating the impact that the adoption of the amendments to Regulation S-X will have on the Fund’s financial statements and related disclosures.
11. Subsequent Events
The Fund has evaluated subsequent events through the issuance of the financial statements and determined that no events have occurred that require disclosure other than those already disclosed in the financial statements.
Abbreviations
| | | | |
| Selected Portfolio | | |
| | |
| ADR | | American Depositary Receipt | | |
| | |
| FFCB | | Federal Farm Credit Bank | | |
FRANKLIN TEMPLETON VARIABLE INSURANCE PRODUCTS TRUST
Report of Independent Registered Public Accounting Firm
Templeton Growth VIP Fund
To the Board of Trustees and Shareholders of Franklin Templeton Variable Insurance Products Trust
In our opinion, the accompanying statement of assets and liabilities, including the statement of investments, and the related statements of operations and of changes in net assets and the financial highlights present fairly, in all material respects, the financial position of Templeton Growth VIP Fund (the “Fund”) as of December 31, 2016, the results of its operations for the year then ended, the changes in its net assets for each of the two years in the period then ended and the financial highlights for the periods presented, in conformity with accounting principles generally accepted in the United States of America. These financial statements and financial highlights (hereafter referred to as “financial statements”) are the responsibility of the Fund’s management. Our responsibility is to express an opinion on these financial statements based on our audits. We conducted our audits of these financial statements in accordance with the standards of the Public Company Accounting Oversight Board (United States). Those standards require that we plan and perform the audit to obtain reasonable assurance about whether the financial statements are free of material misstatement. An audit includes examining, on a test basis, evidence supporting the amounts and disclosures in the financial statements, assessing the accounting principles used and significant estimates made by management, and evaluating the overall financial statement presentation. We believe that our audits, which included confirmation of securities as of December 31, 2016 by correspondence with the custodian and brokers, provide a reasonable basis for our opinion.
PricewaterhouseCoopers LLP
San Francisco, California
February 15, 2017
FRANKLIN TEMPLETON VARIABLE INSURANCE PRODUCTS TRUST
Tax Information (unaudited)
Templeton Growth VIP Fund
Under Section 852(b)(3)(C) of the Internal Revenue Code (Code), the Fund hereby reports the maximum amount allowable but no less than $52,754,459 as a long term capital gain dividend for the fiscal year ended December 31, 2016.
Under Section 854(b)(1)(A) of the Code, the Fund hereby reports 29.54% of the ordinary income dividends as income qualifying for the dividends received deduction for the fiscal year ended December 31, 2016.
At December 31, 2016, more than 50% of the Fund’s total assets were invested in securities of foreign issuers. In most instances, foreign taxes were withheld from income paid to the Fund on these investments. The Fund elects to treat foreign taxes paid as allowed under Section 853 of the Code. This election will allow shareholders of record as of the 2017 distribution date, to treat their proportionate share of foreign taxes paid by the Fund as having been paid directly by them. The shareholder shall consider these amounts as foreign taxes paid in the tax year in which they receive the Fund distribution.
FRANKLIN TEMPLETON VARIABLE INSURANCE PRODUCTS TRUST
Index Descriptions
The indexes are unmanaged and include reinvestment of any income or distributions. They do not reflect any fees, expenses or sales charges.
For Russell Indexes: Russell Investment Group is the source and owner of the trademarks, service marks and copyrights related to the Russell Indexes. Russell® is a trademark of Russell Investment Group.
See www.franklintempletondatasources.com for additional data provider information.
Bloomberg Barclays U.S. Aggregate Bond Index is a market capitalization-weighted index representing the U.S. investment-grade, fixed-rate, taxable bond market with index components for government and corporate, mortgage pass-through and asset-backed securities. All issues included are SEC registered, taxable, dollar denominated and nonconvertible, must have at least one year to final maturity and must be rated investment grade (Baa3/BBB-/BBB- or higher) using the middle rating of Moody’s, Standard & Poor’s and Fitch, respectively.
Bloomberg Barclays U.S. Government Index: Intermediate Component is the intermediate component of the Barclays U.S. Government Index, which includes public obligations of the U.S. Treasury with at least one year to final maturity and publicly issued debt of U.S. government agencies, quasi-federal corporations, and corporate or foreign debt guaranteed by the U.S. government.
Bloomberg Commodity Index comprises exchange-traded futures on physical commodities, which are weighted to account for economic significance and market liquidity.
Citigroup World Government Bond Index is a market capitalization-weighted index consisting of investment-grade world government bond markets.
Consumer Price Index (CPI) is a commonly used measure of the inflation rate.
Credit Suisse (CS) High Yield Index is designed to mirror the investable universe of the U.S. dollar-denominated high yield debt market.
FTSE® EPRA®/NAREIT® Developed Index is a free float-adjusted index designed to measure the performance of publicly traded real estate securities in the North American, European and Asian real estate markets.
J.P. Morgan (JPM) Global Government Bond Index (GGBI) tracks total returns for liquid, fixed-rate, domestic government bonds with maturities greater than one year issued by developed countries globally.
Lipper Multi-Sector Income Funds Classification Average is calculated by averaging the total returns of all funds within the Lipper Multi-Sector Income Funds classification in the Lipper Open-End underlying funds universe. Lipper Multi-Sector Income Funds are defined as funds that seek current income by allocation assets among different fixed income securities sectors (not primarily in one sector except for defensive purposes), including U.S. and foreign governments, with a significant portion rated below investment grade. For the 12-month period ended 12/31/16, there were 305 funds in this category. Lipper calculations do not include contract fees, expenses or sales charges, and may have been different if such charges had been considered.
Lipper VIP Equity Income Funds Classification Average is an equally weighted average calculation of performance figures for all funds within the Lipper Equity Income Funds classification in the Lipper VIP underlying funds universe. Lipper Equity Income Funds seek relatively high current income and growth of income through investing 60% or more of their portfolios in equities. For the 12-month period ended 12/31/16, there were 69 funds in this category. Lipper calculations do not include contract fees, expenses or sales charges, and may have been different if such charges had been considered.
Lipper VIP General U.S. Government Funds Classification Average is an equally weighted average calculation of performance figures for all funds within the Lipper General U.S. Government Funds classification in the Lipper VIP underlying funds universe. Lipper General U.S. Government Funds invest primarily in U.S. government and agency issues. For the 12-month period ended 12/31/16, there were 55 funds in this category. Lipper calculations do not include contract fees, expenses or sales charges, and may have been different if such charges had been considered.
Lipper VIP High Yield Funds Classification Average is an equally weighted average calculation of performance figures for all funds within the Lipper High Yield Funds Classification in the Lipper VIP underlying funds universe. Lipper High Yield Funds aim at high (relative) current yield from fixed income securities, have no quality or maturity restrictions, and
FRANKLIN TEMPLETON VARIABLE INSURANCE PRODUCTS TRUST
INDEX DESCRIPTIONS
tend to invest in lower grade debt issues. For the 12-month period ended 12/31/16, there were 109 funds in this category. Lipper calculations do not include contract fees, expenses or sales charges, and may have been different if such charges had been considered.
MSCI All Country World Index (ACWI) is a free float-adjusted, market capitalization-weighted index designed to measure equity market performance in global developed and emerging markets.
MSCI All Country World Index (ACWI) ex USA Index captures large- and mid-capitalization representation across 22 of 23 developed markets countries (excluding the U.S.) and 23 emerging markets countries. The index covers approximately 85% of the global equity opportunity set outside the U.S.
MSCI Emerging Markets (EM) Index is a free float-adjusted, market capitalization-weighted index designed to measure equity market performance in global emerging markets.
MSCI Europe, Australasia, Far East (EAFE) Index is a free float-adjusted, market capitalization-weighted index designed to measure equity market performance in global developed markets excluding the U.S. and Canada.
MSCI World Index is a free float-adjusted, market capitalization-weighted index designed to measure equity market performance in global developed markets.
Russell 1000® Growth Index is market capitalization weighted and measures performance of those Russell 1000® Index companies with higher price-to-book ratios and higher forecasted growth values.
Russell 1000® Index is market capitalization weighted and measures performance of the largest companies in the Russell 3000® Index, which represents the majority of the U.S. market’s total capitalization.
Russell 2000® Index is market capitalization weighted and measures performance of the 2,000 smallest companies in the Russell 3000® Index, which represent a small amount of the total market capitalization of the Russell 3000® Index.
Russell 2000TM Value Index is market capitalization weighted and measures performance of those Russell 2000TM Index companies with lower price-to-book ratios and lower forecasted growth values.
Russell 2500® Index is market capitalization weighted and measures performance of the smallest companies in the Russell 3000® Index, which represent a modest amount of the Russell 3000® Index’s total market capitalization.
Russell 2500TM Value Index is market capitalization weighted and measures performance of those Russell 2500TM Index companies with lower price-to-book ratios and lower forecasted growth values.
Russell 3000® Growth Index is market capitalization weighted and measures performance of those Russell 3000® Index companies with higher price-to-book ratios and higher forecasted growth values.
Russell Midcap® Growth Index is market capitalization weighted and measures performance of those Russell Midcap® Index companies with higher price-to-book ratios and higher forecasted growth values.
Russell Midcap® Index is market capitalization weighted and measures performance of the smallest companies in the Russell 1000® Index, which represents a modest amount of the Russell 1000® Index’s total market capitalization.
Standard & Poor’s® 500 Index (S&P 500®) is a market capitalization-weighted index of 500 stocks designed to measure total U.S. equity market performance.
Standard & Poor’s®/International Finance Corporation Investable (S&P/IFCI) Composite Index is a free float-adjusted, market capitalization-weighted index designed to measure equity performance in global emerging markets.
Board Members and Officers
The name, year of birth and address of the officers and board members, as well as their affiliations, positions held with the Trust, principal occupations during at least the past five years and number of U.S. registered portfolios overseen in the Franklin Templeton Investments fund complex, are shown below. Generally, each board member serves until that person’s successor is elected and qualified.
Independent Board Members
| | | | | | | | |
Name, Year of Birth
and Address | | Position | | Length of
Time Served | | Number of Portfolios in
Fund Complex Overseen
by Board Member* | | Other Directorships Held During
at Least the Past 5 Years |
| | | | |
Harris J. Ashton (1932)
One Franklin Parkway
San Mateo, CA 94403-1906 | | Trustee | | Since 1988 | | 142 | | Bar-S Foods (meat packing company) (1981-2010). |
|
| Principal Occupation During at Least the Past 5 Years: |
| Director of various companies; and formerly, Director, RBC Holdings, Inc. (bank holding company) (until 2002); and President, Chief Executive Officer and Chairman of the Board, General Host Corporation (nursery and craft centers) (until 1998). |
| | | | |
Mary C. Choksi (1950)
One Franklin Parkway
San Mateo, CA 94403-1906 | | Trustee | | Since 2014 | | 136 | | Avis Budget Group Inc. (car rental) (2007-present), Omnicom Group Inc. (advertising and marketing communications services) (2011-present) and H.J. Heinz Company (processed foods and allied products) (1998-2006). |
|
| Principal Occupation During at Least the Past 5 Years: |
| Senior Advisor, Strategic Investment Group (investment management group) (2015-present); director of various companies; and formerly, Founding Partner and Senior Managing Director, Strategic Investment Group (1987–2015); Founding Partner and Managing Director, Emerging Markets Management LLC (investment management firm) (1987-2011); and Loan Officer/Senior Loan Officer/Senior Pension Investment Officer, World Bank Group (international financial institution) (1977-1987). |
| | | | |
Edith E. Holiday (1952)
One Franklin Parkway
San Mateo, CA 94403-1906 | | Trustee | | Since 2005 | | 142 | | Hess Corporation (exploration and refining of oil and gas) (1993-present), Canadian National Railway (railroad) (2001-present), White Mountains Insurance Group, Ltd. (holding company) (2004-present), Santander Consumer USA Holdings, Inc. (consumer finance) (November 2016), RTI International Metals, Inc. (manufacture and distribution of titanium) (1999-2015) and H.J. Heinz Company (processed foods and allied products) (1994-2013). |
|
| Principal Occupation During at Least the Past 5 Years: |
| Director or Trustee of various companies and trusts; and formerly, Assistant to the President of the United States and Secretary of the Cabinet (1990-1993); General Counsel to the United States Treasury Department (1989-1990); and Counselor to the Secretary and Assistant Secretary for Public Affairs and Public Liaison – United States Treasury Department (1988-1989). |
| | | | |
J. Michael Luttig (1954)
One Franklin Parkway
San Mateo, CA 94403-1906 | | Trustee | | Since 2009 | | 142 | | Boeing Capital Corporation (aircraft financing) (2006-2013). |
|
| Principal Occupation During at Least the Past 5 Years: |
| Executive Vice President, General Counsel and member of the Executive Council, The Boeing Company (aerospace company) (2006-present);and formerly, Federal Appeals Court Judge, U.S. Court of Appeals for the Fourth Circuit (1991-2006). |
Independent Board Members (continued)
| | | | | | | | |
Name, Year of Birth
and Address | | Position | | Length of
Time Served | | Number of Portfolios in
Fund Complex Overseen
by Board Member* | | Other Directorships Held During
at Least the Past 5 Years |
| | | | |
Larry D. Thompson (1945)
One Franklin Parkway
San Mateo, CA 94403-1906 | | Trustee | | Since 2007 | | 142 | | The Southern Company (energy company) (2014-present; previously 2010-2012), Graham Holdings Company (education and media organization) (2011-present) and Cbeyond, Inc. (business communications provider) (2010-2012). |
|
| Principal Occupation During at Least the Past 5 Years: |
| Director of various companies; John A. Sibley Professor of Corporate and Business Law, University of Georgia School of Law (January 2015; previously 2011-2012); and formerly, Executive Vice President – Government Affairs, General Counsel and Corporate Secretary, PepsiCo, Inc. (consumer products) (2012-2014); Senior Vice President – Government Affairs, General Counsel and Secretary, PepsiCo, Inc. (2004-2011); Senior Fellow of The Brookings Institution (2003-2004); Visiting Professor, (2003-2004); Visiting Professor, University of Georgia School of Law (2004); and Deputy Attorney General, U.S. Department of Justice (2001-2003). |
| | | | |
John B. Wilson (1959)
One Franklin Parkway
San Mateo, CA 94403-1906 | | Lead Independent Trustee | | Trustee since 2007 and Lead Independent Trustee since 2008 | | 116 | | None |
|
| Principal Occupation During at Least the Past 5 Years: |
| President, Staples Europe (office supplies) (2012-present); President and Founder, Hyannis Port Capital, Inc. (real estate and private equity investing); serves on private and non-profit boards; and formerly, Chief Operating Officer and Executive Vice President, Gap, Inc. (retail) (1996-2000); Chief Financial Officer and Executive Vice President – Finance and Strategy, Staples, Inc. (1992-1996); Senior Vice President – Corporate Planning, Northwest Airlines, Inc. (airlines) (1990-1992); and Vice President and Partner, Bain & Company (consulting firm) (1986-1990). |
|
| Interested Board Members and Officers |
Name, Year of Birth
and Address | | Position | | Length of
Time Served | | Number of Portfolios in
Fund Complex Overseen
by Board Member* | | Other Directorships Held During
at Least the Past 5 Years |
| | | | |
**Gregory E. Johnson (1961) One Franklin Parkway San Mateo, CA 94403-1906 | | Trustee | | Since 2013 | | 158 | | None |
|
| Principal Occupation During at Least the Past 5 Years: |
| Chairman of the Board, Member – Office of the Chairman, Director and Chief Executive Officer, Franklin Resources, Inc.; officer and/or director or trustee, as the case may be, of some of the other subsidiaries of Franklin Resources, Inc. and of 44 of the investment companies in Franklin Templeton Investments; Vice Chairman, Investment Company Institute; and formerly, President, Franklin Resources, Inc. (1994-2015). |
| | | | |
**Rupert H. Johnson, Jr. (1940) One Franklin Parkway
San Mateo, CA 94403-1906 | | Chairman of the Board, and Trustee | | Chairman of the Board since 2013, and Trustee since 1988 | | 142 | | None |
|
| Principal Occupation During at Least the Past 5 Years: |
| Vice Chairman, Member – Office of the Chairman and Director, Franklin Resources, Inc.; Director, Franklin Advisers, Inc.; Senior Vice President, Franklin Advisory Services, LLC; and officer and/or director or trustee, as the case may be, of some of the other subsidiaries of Franklin Resources, Inc. and of 42 of the investment companies in Franklin Templeton Investments. |
| | | | |
Alison E. Baur (1964) One Franklin Parkway San Mateo, CA 94403-1906 | | Vice President | | Since 2012 | | Not Applicable | | Not Applicable |
|
| Principal Occupation During at Least the Past 5 Years: |
| Deputy General Counsel, Franklin Templeton Investments; and officer of some of the other subsidiaries of Franklin Resources, Inc. and of 45 of the investment companies in Franklin Templeton Investments. |
Interested Board Members and Officers (continued)
| | | | | | | | |
Name, Year of Birth
and Address | | Position | | Length of
Time Served | | Number of Portfolios in
Fund Complex Overseen
by Board Member* | | Other Directorships Held During
at Least the Past 5 Years |
| | | | |
Laura F. Fergerson (1962)
One Franklin Parkway
San Mateo, CA 94403-1906 | | Chief Executive Officer – Finance and Administration | | Since 2009 | | Not Applicable | | Not Applicable |
|
| Principal Occupation During at Least the Past 5 Years: |
| Senior Vice President, Franklin Templeton Services, LLC; Vice President, Franklin Advisers, Inc. and Franklin Templeton Institutional, LLC; and officer of 45 of the investment companies in Franklin Templeton Investments. |
| | | | |
Gaston Gardey (1967)
One Franklin Parkway
San Mateo, CA 94403-1906 | | Treasurer, Chief Financial Officer and Chief Accounting Officer | | Since 2009 | | Not Applicable | | Not Applicable |
|
| Principal Occupation During at Least the Past 5 Years: |
| Treasurer, U.S. Fund Administration & Reporting, Franklin Templeton Investments; and officer of 27 of the investment companies in Franklin Templeton Investments. |
| | | | |
Aliya S. Gordon (1973)
One Franklin Parkway
San Mateo, CA 94403-1906 | | Vice President | | Since 2009 | | Not Applicable | | Not Applicable |
|
| Principal Occupation During at Least the Past 5 Years: |
| Senior Associate General Counsel, Franklin Templeton Investments; and officer of 45 of the investment companies in Franklin Templeton Investments. |
| | | | |
Steven J. Gray (1955)
One Franklin Parkway
San Mateo, CA 94403-1906 | | Vice President | | Since 2009 | | Not Applicable | | Not Applicable |
|
| Principal Occupation During at Least the Past 5 Years: |
| Senior Associate General Counsel, Franklin Templeton Investments; Vice President, Franklin Templeton Distributors, Inc. and Franklin Alternative Strategies Advisers, LLC; and officer of 45 of the investment companies in Franklin Templeton Investments. |
| | | | |
Edward B. Jamieson (1948)
One Franklin Parkway
San Mateo, CA 94403-1906 | | President and Chief Executive Officer – Investment Management | | Since 2010 | | Not Applicable | | Not Applicable |
|
| Principal Occupation During at Least the Past 5 Years: |
| President, Chief Investment Officer and Director, Franklin Advisers, Inc.; Executive Vice President, Franklin Templeton Institutional, LLC; and officer and/or trustee, as the case may be, of some of the other subsidiaries of Franklin Resources, Inc. and of 10 of the investment companies in Franklin Templeton Investments. |
| | | | |
Robert Lim (1948)
One Franklin Parkway
San Mateo, CA 94403-1906 | | Vice President – AML Compliance | | Since May 2016 | | Not Applicable | | Not Applicable |
|
| Principal Occupation During at Least the Past 5 Years: |
| Vice President, Franklin Templeton Companies, LLC; Chief Compliance Officer, Franklin Templeton Distributors, Inc. and Franklin Templeton Investor Services, LLC; and officer of 45 of the investment companies in Franklin Templeton Investments. |
| | | | |
Kimberly H. Novotny (1972)
300 S.E. 2nd Street
Fort Lauderdale, FL 33301-1923 | | Vice President | | Since 2013 | | Not Applicable | | Not Applicable |
|
| Principal Occupation During at Least the Past 5 Years: |
| Associate General Counsel, Franklin Templeton Investments; Vice President and Corporate Secretary, Fiduciary Trust International of the South; Vice President, Templeton Investment Counsel, LLC; Assistant Secretary, Franklin Resources, Inc.; and officer of 45 of the investment companies in Franklin Templeton Investments. |
Interested Board Members and Officers (continued)
| | | | | | | | |
Name, Year of Birth
and Address | | Position | | Length of
Time Served | | Number of Portfolios in
Fund Complex Overseen
by Board Member* | | Other Directorships Held During
at Least the Past 5 Years |
| | | | |
Robert C. Rosselot (1960)
300 S.E. 2nd Street
Fort Lauderdale, FL 33301-1923 | | Chief Compliance Officer | | Since 2013 | | Not Applicable | | Not Applicable |
|
| Principal Occupation During at Least the Past 5 Years: |
| Director, Global Compliance, Franklin Templeton Investments; Vice President, Franklin Templeton Companies, LLC; officer of 45 of the investment companies in Franklin Templeton Investments; and formerly, Senior Associate General Counsel, Franklin Templeton Investments (2007-2013); and Secretary and Vice President, Templeton Group of Funds (2004-2013). |
| | | | |
Karen L. Skidmore (1952)
One Franklin Parkway
San Mateo, CA 94403-1906 | | Vice President and Secretary | | Since 2006 | | Not Applicable | | Not Applicable |
|
| Principal Occupation During at Least the Past 5 Years: |
| Senior Associate General Counsel, Franklin Templeton Investments; and officer of 45 of the investment companies in Franklin Templeton Investments |
| | | | |
Navid J. Tofigh (1972)
One Franklin Parkway
San Mateo, CA 94403-1906 | | Vice President | | Since 2015 | | Not Applicable | | Not Applicable |
|
| Principal Occupation During at Least the Past 5 Years: |
| Associate General Counsel, Franklin Templeton Investments; and officer of 45 of the investment companies in Franklin Templeton Investments. |
| | | | |
Craig S. Tyle (1960)
One Franklin Parkway
San Mateo, CA 94403-1906 | | Vice President | | Since 2005 | | Not Applicable | | Not Applicable |
|
| Principal Occupation During at Least the Past 5 Years: |
| General Counsel and Executive Vice President, Franklin Resources, Inc.; and officer of some of the other subsidiaries of Franklin Resources, Inc. and of 45 of the investment companies in Franklin Templeton Investments. |
| | | | |
Lori A. Weber (1964)
300 S.E. 2nd Street
Fort Lauderdale, FL 33301-1923 | | Vice President | | Since 2011 | | Not Applicable | | Not Applicable |
|
| Principal Occupation During at Least the Past 5 Years: |
| Senior Associate General Counsel, Franklin Templeton Investments; Assistant Secretary, Franklin Resources, Inc.; Vice President and Secretary, Templeton Investment Counsel, LLC; and officer of 45 of the investment companies in Franklin Templeton Investments. |
*We base the number of portfolios on each separate series of the U.S. registered investment companies within the Franklin Templeton Investments fund complex. These portfolios have a common investment manager or affiliated investment managers.
**Gregory E. Johnson is considered to be an interested person of the Fund under the federal securities laws due to his position as an officer and director of Franklin Resources, Inc. (Resources), which is the parent company of the Fund’s investment manager and distributor. Rupert H. Johnson, Jr. is considered to be an interested person of the Fund under the federal securities laws due to his position as officer and director and major shareholder of Resources.
Note 1: Rupert H. Johnson, Jr. is the uncle of Gregory E. Johnson.
Note 2: Officer information is current as of the date of this report. It is possible that after this date, information about officers may change.
Note 3: Effective May 13, 2016, Frank J. Crothers ceased to be a trustee of the Trust.
The Sarbanes-Oxley Act of 2002 and Rules adopted by the Securities and Exchange Commission require the Fund to disclose whether the Fund’s Audit Committee includes at least one member who is an audit committee financial expert within the meaning of such Act and Rules. The Fund’s Board has determined that there is at least one such financial expert on the Audit Committee and has designated John B. Wilson as its audit committee financial expert. The Board believes that Mr. Wilson qualifies as such an expert in view of his extensive business background and experience, including service as chief financial officer of Staples, Inc. from 1992 to 1996. Mr. Wilson has been a Member and Chairman of the Fund’s Audit Committee since 2007. As a result of such background and experience, the Board believes that Mr. Wilson has acquired an understanding of generally accepted accounting principles and financial statements, the general application of such principles in connection with the accounting estimates, accruals and reserves, and analyzing and evaluating financial statements that present a breadth and level of complexity of accounting issues generally comparable to those of the Fund, as well as an understanding of internal controls and procedures for financial reporting and an understanding of audit committee functions. Mr. Wilson is an independent Board member as that term is defined under the relevant Securities and Exchange Commission Rules and Releases.
The Statement of Additional Information (SAI) includes additional information about the board members and is available, without charge, upon request. Shareholders may call (800) DIAL BEN/342-5236 to request the SAI.
FRANKLIN TEMPLETON VARIABLE INSURANCE PRODUCTS TRUST
Shareholder Information
Proxy Voting Policies and Procedures
The Trust’s investment manager has established Proxy Voting Policies and Procedures (Policies) that the Trust uses to determine how to vote proxies relating to portfolio securities. Shareholders may view the Trust’s complete Policies online at franklintempleton.com. Alternatively, shareholders may request copies of the Policies free of charge by calling the Proxy Group collect at (954) 527-7678 or by sending a written request to: Franklin Templeton Companies, LLC, 300 S.E. 2nd Street, Fort Lauderdale, FL 33301, Attention: Proxy Group. Copies of the Trust’s proxy voting records are also made available online at franklintempleton.com and posted on the U.S. Securities and Exchange Commission’s website at sec.gov and reflect the most recent 12-month period ended June 30.
Quarterly Statement of Investments
The Trust files a complete statement of investments with the U.S. Securities and Exchange Commission for the first and third quarters for each fiscal year on Form N-Q. Shareholders may view the filed Form N-Q by visiting the Commission’s website at sec.gov. The filed form may also be viewed and copied at the Commission’s Public Reference Room in Washington, DC. Information regarding the operations of the Public Reference Room may be obtained by calling (800) SEC-0330.
Annual Report
Franklin Templeton
Variable Insurance Products Trust
Investment Managers
Franklin Advisers, Inc.
Franklin Advisory Services, LLC
Franklin Mutual Advisers, LLC
Franklin Templeton Institutional, LLC
Templeton Asset Management Ltd.
Templeton Global Advisors Limited
Templeton Investment Counsel, LLC
Fund Administrator
Franklin Templeton Services, LLC
Distributor
Franklin Templeton Distributors, Inc.
Franklin Templeton Variable Insurance Products Trust (FTVIP) shares are not offered to the public; they are offered and sold only to: (1) insurance company separate accounts (Separate Account) to serve as the underlying investment vehicle for variable contracts; (2) certain qualified plans; and (3) other mutual funds (funds of funds).
Authorized for distribution to investors in Separate Accounts only when accompanied or preceded by the current prospectus for the applicable contract, which includes the Separate Account and the FTVIP prospectuses. Investors should carefully consider a fund’s investment goals, risks, charges and expenses before investing. The prospectus contains this and other information; please read it carefully before investing.
To help ensure we provide you with quality service, all calls to and from our service areas are monitored and/or recorded.
| | |
| ©2017 Franklin Templeton Investments. All rights reserved. | | VIP2 A 02/17 |
| (a) | The Registrant has adopted a code of ethics that applies to its principal executive officers and principal financial and accounting officer. |
| (f) | Pursuant to Item 12(a)(1), the Registrant is attaching as an exhibit a copy of its code of ethics that applies to its principal executive officers and principal financial and accounting officer. |
| Item 3. | Audit Committee Financial Expert. |
| (a) (1) | The Registrant has an audit committee financial expert serving on its audit committee. |
| (2) | The audit committee financial expert is John B. Wilson and he is “independent” as defined under the relevant Securities and Exchange Commission Rules and Releases. |
| Item 4. | Principal Accountant Fees and Services. |
(a) Audit Fees
The aggregate fees paid to the principal accountant for professional services rendered by the principal accountant for the audit of the registrant’s annual financial statements or for services that are normally provided by the principal accountant in connection with statutory and regulatory filings or engagements were $876,835 for the fiscal year ended December 31, 2016 and $897,776 for the fiscal year ended December 31, 2015.
(b) Audit-Related Fees
The aggregate fees paid to the principal accountant for assurance and related services rendered by the principal accountant to the registrant that are reasonably related to the performance of the audit of the registrant’s financial statements and are not reported under paragraph (a) of Item 4 were $4,682 for the fiscal year ended December 31, 2016 and $4,590 for the fiscal year ended December 31, 2015. The services for which these fees were paid included attestation services.
There were no fees paid to the principal accountant for assurance and related services rendered by the principal accountant to the registrant’s investment adviser and any entity controlling, controlled by or under common control with the investment adviser that provides ongoing services to the registrant that are reasonably related to the performance of the audit of their financial statements.
(c) Tax Fees
There were no fees paid to the principal accountant for professional services rendered by the principal accountant to the registrant for tax compliance, tax advice and tax planning.
There were no fees paid to the principal accountant for professional services rendered by the principal accountant to the registrant’s investment adviser and any entity controlling, controlled by or under common control with the investment adviser that provides ongoing services to the registrant for tax compliance, tax advice and tax planning.
(d) All Other Fees
The aggregate fees paid to the principal accountant for products and services rendered by the principal accountant to the registrant not reported in paragraphs (a)-(c) of Item 4 were $0 for the fiscal year ended December 31, 2016 and $8,791 for the fiscal year ended December 31, 2015. The services for which these fees were paid include review of materials provided to the fund Board in connection with the investment management contract renewal process.
The aggregate fees paid to the principal accountant for products and services rendered by the principal accountant to the registrant’s investment adviser and any entity controlling, controlled by or under common control with the investment adviser that provides ongoing services to the registrant other than services reported in paragraphs (a)-(c) of Item 4 were $349,307 for the fiscal year ended December 31, 2016 and $595,846 for the fiscal year ended December 31, 2015. The services for which these fees were paid included review of materials provided to the fund Board in connection with the investment management contract renewal process and derivatives assessments, review of system processes related to fixed income securities, and compliance examination for Investment Advisor Act rule 204-2 and 206-4(2).
(e) (1) The registrant’s audit committee is directly responsible for approving the services to be provided by the auditors, including:
(i) pre-approval of all audit and audit related services;
(ii) pre-approval of all non-audit related services to be provided to the Fund by the auditors;
(iii) pre-approval of all non-audit related services to be provided to the registrant by the auditors to the registrant’s investment adviser or to any entity that controls, is controlled by or is under common control with the registrant’s investment adviser and that provides ongoing services to the registrant where the non-audit services relate directly to the operations or financial reporting of the registrant; and
(iv) establishment by the audit committee, if deemed necessary or appropriate, as an alternative to committee pre-approval of services to be provided by the auditors, as required by paragraphs (ii) and (iii) above, of policies and procedures to permit such services to be pre-approved by other means, such as through establishment of guidelines or by action of a designated member or members of the committee; provided the policies and procedures are detailed as to the particular service and the committee is informed of each service and such policies and procedures do not include delegation of audit committee responsibilities, as contemplated under the Securities Exchange Act of 1934, to management; subject, in the case of (ii)
through (iv), to any waivers, exceptions or exemptions that may be available under applicable law or rules.
(e) (2) None of the services provided to the registrant described in paragraphs (b)-(d) of Item 4 were approved by the audit committee pursuant to paragraph (c)(7)(i)(C) of Rule 2-01 of regulation S-X.
| (f) | No disclosures are required by this Item 4(f). |
(g) The aggregate non-audit fees paid to the principal accountant for services rendered by the principal accountant to the registrant and the registrant’s investment adviser and any entity controlling, controlled by or under common control with the investment adviser that provides ongoing services to the registrant were $353,989 for the fiscal year ended December 31, 2016 and $609,227 for the fiscal year ended December 31, 2015.
(h) The registrant’s audit committee of the board has considered whether the provision of non-audit services that were rendered to the registrant’s investment adviser (not including any sub-adviser whose role is primarily portfolio management and is subcontracted with or overseen by another investment adviser), and any entity controlling, controlled by, or under common control with the investment adviser that provides ongoing services to the registrant that were not pre-approved pursuant to paragraph (c)(7)(ii) of Rule 2-01 of Regulation S-X is compatible with maintaining the principal accountant’s independence.
| Item 5. | Audit Committee of Listed Registrants. N/A |
| Item 6. | Schedule of Investments. N/A |
| Item 7. | Disclosure of Proxy Voting Policies and Procedures for Closed-End Management Investment Companies. N/A |
| Item 8. | Portfolio Managers of Closed-End Management Investment Companies. N/A |
| Item 9. | Purchases of Equity Securities by Closed-End Management Investment Company and Affiliated Purchasers. N/A |
| Item 10. | Submission of Matters to a Vote of Security Holders. |
There have been no changes to the procedures by which shareholders may recommend nominees to the Registrant’s Board of Trustees that would require disclosure herein.
| Item 11. | Controls and Procedures. |
(a) Evaluation of Disclosure Controls and Procedures. The Registrant maintains disclosure controls and procedures that are designed to
ensure that information required to be disclosed in the Registrant’s filings under the Securities Exchange Act of 1934 and the Investment Company Act of 1940 is recorded, processed, summarized and reported within the periods specified in the rules and forms of the Securities and Exchange Commission. Such information is accumulated and communicated to the Registrant’s management, including its principal executive officer and principal financial officer, as appropriate, to allow timely decisions regarding required disclosure. The Registrant’s management, including the principal executive officer and the principal financial officer, recognizes that any set of controls and procedures, no matter how well designed and operated, can provide only reasonable assurance of achieving the desired control objectives.
Within 90 days prior to the filing date of this Shareholder Report on Form N-CSR, the Registrant had carried out an evaluation, under the supervision and with the participation of the Registrant’s management, including the Registrant’s principal executive officer and the Registrant’s principal financial officer, of the effectiveness of the design and operation of the Registrant’s disclosure controls and procedures. Based on such evaluation, the Registrant’s principal executive officer and principal financial officer concluded that the Registrant’s disclosure controls and procedures are effective.
(b) Changes in Internal Controls. There have been no changes in the Registrant’s internal controls or in other factors that could materially affect the internal controls over financial reporting subsequent to the date of their evaluation in connection with the preparation of this Shareholder Report on Form N-CSR.
(a)(1) Code of Ethics
(a)(2) Certifications pursuant to Section 302 of the Sarbanes-Oxley Act of 2002 of Laura F. Fergerson, Chief Executive Officer - Finance and Administration, and Gaston Gardey, Chief Financial Officer and Chief Accounting Officer
(b) Certifications pursuant to Section 906 of the Sarbanes-Oxley Act of 2002 of Laura F. Fergerson, Chief Executive Officer - Finance and Administration, and Gaston Gardey, Chief Financial Officer and Chief Accounting Officer
SIGNATURES
Pursuant to the requirements of the Securities Exchange Act of 1934 and the Investment Company Act of 1940, the registrant has duly caused this report to be signed on its behalf by the undersigned, thereunto duly authorized.
Franklin Templeton Variable Insurance Products Trust
| | |
| By | | /s/ LAURA F. FERGERSON |
| | Laura F. Fergerson |
| | Chief Executive Officer – |
| | Finance and Administration |
| Date February 24, 2017 |
Pursuant to the requirements of the Securities Exchange Act of 1934 and the Investment Company Act of 1940, this report has been signed below by the following persons on behalf of the registrant and in the capacities and on the dates indicated.
| | |
| By | | /s/ LAURA F. FERGERSON |
| | Laura F. Fergerson |
| | Chief Executive Officer – |
| | Finance and Administration |
Date February 24, 2017 |
| | |
| By | | /s/ GASTON GARDEY |
| | Gaston Gardey |
| | Chief Financial Officer and |
| | Chief Accounting Officer |
| Date February 24, 2017 |