UNITED STATES
SECURITIES AND EXCHANGE COMMISSION
Washington, DC 20549
FORM N-CSR
CERTIFIED SHAREHOLDER REPORT OF REGISTERED
MANAGEMENT INVESTMENT COMPANIES
Investment Company Act file number 811-05583
Franklin Templeton Variable Insurance Products Trust
(Exact name of registrant as specified in charter)
One Franklin Parkway, San Mateo, CA 94403-1906
(Address of principal executive offices) (Zip code)
Craig S. Tyle, One Franklin Parkway, San Mateo, CA 94403-1906
(Name and address of agent for service)
Registrant’s telephone number, including area code: (650) 312-2000
Date of fiscal year end: 12/31
Date of reporting period: 12/31/15
| Item 1. | Reports to Stockholders. |
| | |
 | | Annual Report December 31, 2015 |
Franklin Templeton
Variable Insurance Products Trust

Franklin Templeton Variable Insurance
Products Trust Annual Report
*Not part of the annual report. Retain for your records.
| | | | | | | | |
| Not FDIC Insured | | | | | May Lose Value | | | | | No Bank Guarantee |
MASTER CLASS – 5
FRANKLIN TEMPLETON VARIABLE INSURANCE PRODUCTS TRUST
Important Notes to
Performance Information
Performance data is historical and cannot predict or guarantee future results. Principal value and investment return will fluctuate with market conditions, and you may have a gain or loss when you withdraw your money. Inception dates of the funds may have preceded the effective dates of the subaccounts, contracts or their availability in all states.
When reviewing the index comparisons, please keep in mind that indexes have a number of inherent performance differentials over the funds. First, unlike the funds, which must hold a minimum amount of cash to maintain liquidity, indexes do
not have a cash component. Second, the funds are actively managed and, thus, are subject to management fees to cover salaries of securities analysts or portfolio managers in addition to other expenses. Indexes are unmanaged and do not include any commissions or other expenses typically associated with investing in securities. Third, indexes often contain a different mix of securities than the fund to which they are compared. Additionally, please remember that indexes are simply a measure of performance and cannot be invested in directly.
SUPPLEMENT DATED FEBRUARY 8, 2016
TO THE STATEMENT OF ADDITIONAL INFORMATION DATED MAY 1, 2015
OF
FRANKLIN TEMPLETON VARIABLE INSURANCE PRODUCTS TRUST
The statement of additional information (SAI) is amended as follows:
The section under the heading “Dealer Compensation” beginning on page 99 is replaced with the following:
In addition to the payments above, Distributors and/or its affiliates may make the following payments out of its own assets to certain dealers who sell shares of Franklin Templeton funds, or participate in the offering of variable insurance products that invest directly or indirectly in the Trust (VIP Qualifying Dealers):
Marketing support payments. Distributors may make payments to VIP Qualifying Dealers out of its own resources. A VIP Qualifying Dealer’s marketing support services may include business planning assistance, marketing and advertising, training and ongoing education and support for dealer personnel about the Franklin Templeton funds (including the Trust) and financial planning needs of shareholders of the Franklin Templeton funds or contract owners that allocate contract value indirectly to one or more Franklin Templeton funds, placement on the VIP Qualifying Dealer’s list of offered funds, access to sales meetings, sales representatives and management representatives of the dealer, and contract owner assistance in allocating contract value directly or indirectly to the Trust. Distributors compensates VIP Qualifying Dealers differently depending upon, among other factors, whether the VIP Qualifying Dealer is directly selling Franklin Templeton funds, or participating in the offering of variable insurance products that invest directly or indirectly in the Trust, sales and asset levels, redemption rates and the level and/or type of marketing and educational activities provided by the VIP Qualifying Dealer. Such compensation may include financial assistance to such dealers that enable Distributors to develop, manage or participate in and/or present at conferences or seminars, sales or training programs for invited registered representatives and other employees, client and investor events, and other dealer-sponsored events. These payments may vary depending upon the nature of the event. Distributors will, on an annual basis, determine whether to continue such payments. Currently, Distributors does not make marketing support payments in connection with the Trust except under limited circumstances for certain Funds of the Trust offered through a special product. Marketing support payments will not exceed 0.20% of the relevant Fund’s or Funds’ average daily net assets attributable to an insurance company, on an annual basis.
Other payments. From time to time, Distributors, at its expense, may provide additional compensation to VIP Qualifying Dealers which sell or arrange for the direct or indirect sale of shares of Franklin Templeton funds, including the Trust. Such compensation may include financial assistance to VIP Qualifying Dealers that enable Distributors to participate in and/or present at conferences or seminars, sales or training programs for invited registered representatives and other employees, client and investor events and other dealer-sponsored events. These payments may vary depending upon the nature of the event.
Distributors routinely sponsors due diligence meetings for registered representatives during which they receive updates on various Franklin Templeton funds and are afforded the
opportunity to speak with portfolio managers. Invitation to these meetings is not conditioned on selling a specific number of shares. Those who have shown an interest in Franklin Templeton funds, however, are more likely to be considered. To the extent permitted by their firm’s policies and procedures, registered representatives’ expenses in attending these meetings may be covered by Distributors.
Other compensation may be offered to the extent not prohibited by federal or state laws or any self-regulatory agency, such as FINRA. Distributors makes payments for events it deems appropriate, subject to Distributors’ guidelines and applicable law. Distributors and/or its affiliates may also reimburse VIP Qualifying Dealers and/or their affiliates for certain costs associated with obtaining voting instructions from contract owners and the solicitation process in connection with Trust-sponsored proxy statements.
You can ask your insurance company and VIP Qualifying Dealer for information about any payments they receive from Distributors and any services provided. Additional disclosure may be included in the insurance contract prospectus.
Please keep this supplement with your statement of additional information for future reference.
Franklin VolSmart Allocation VIP Fund
(Formerly, Franklin Managed Volatility Global Allocation VIP Fund)
This annual report for Franklin VolSmart Allocation VIP Fund covers the fiscal year ended December 31, 2015.
Class 5 Performance Summary as of December 31, 2015
Average annual total return of Class 5 shares* represents the average annual change in value, assuming reinvestment of dividends and capital gains. Average returns smooth out variations in returns, which can be significant; they are not the same as year-by-year results.
| | | | | | | | |
| Periods ended 12/31/15 | | 1-Year | | | Since Inception (4/1/13) | |
Average Annual Total Return | | | -3.10% | | | | +1.16% | |
*Prior to 5/1/15, the Fund followed different investment strategies, had different subadvisory arrangements, allocated its core portfolio differently, had a different current target volatility goal and made different use of derivative instruments. As a result, the Fund generally held different investments and had a different investment profile. The Fund has an expense reduction contractually guaranteed through at least 4/30/16 and a fee waiver associated with any investment in a Franklin Templeton money fund, contractually guaranteed through at least its current fiscal year-end. Fund investment results reflect the expense reduction and fee waiver, to the extent applicable; without these reductions, the results would have been lower.
Performance reflects the Fund’s Class 5 operating expenses, but does not include any contract fees, expenses or sales charges. If they had been included, performance would be lower. These charges and deductions, particularly for variable life policies, can have a significant effect on contract values and insurance benefits. See the contract prospectus for a complete description of these expenses, including sales charges.
Performance data represent past performance, which does not guarantee future results. Investment return and principal value will fluctuate, and you may have a gain or loss when you sell your shares. Current performance may differ from figures shown.
Total Return Index Comparison for a Hypothetical $10,000 Investment (4/1/13–12/31/15)
The graph below shows the change in value of a hypothetical $10,000 investment in the Fund over the indicated period and includes reinvestment of any income or distributions. The Fund’s performance* is compared to the performance of the MSCI All Country World Index (ACWI), the Citigroup World Government Bond Index (WGBI), the Bloomberg Commodity Index, and its new benchmarks, the Standard & Poor’s® 500 Index (S&P 500®) and the Barclays U.S. Aggregate Bond Index. One cannot invest directly in an index, and an index is not representative of the Fund’s portfolio. Please see Important Notes to Performance Information preceding the Fund Summaries.
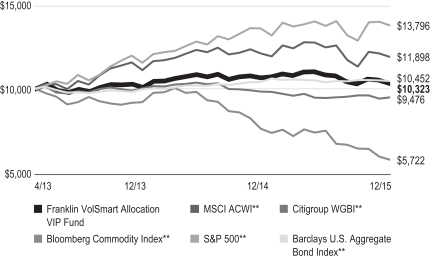
**Source: Morningstar. Please see Index Descriptions following the Fund Summaries.
FRANKLIN VOLSMART ALLOCATION VIP FUND
Fund Goals and Main Investments
The Fund seeks total return (including income and capital gains) while seeking to manage volatility.
Fund Risks
All investments involve risks, including possible loss of principal. There can be no guarantee that the Fund will stay within its target volatility. Also, the managed volatility and tail risk protection strategies could negatively impact the Fund’s return and expose the Fund to additional costs. Generally, investors should be comfortable with fluctuation in the value of their investments, especially over the short term. Stock prices fluctuate, sometimes rapidly and dramatically, due to factors affecting individual companies, particular industries or sectors, or general market conditions. Bond prices generally move in the opposite direction of interest rates. Derivatives involve costs and can create economic leverage in the portfolio, which may result in significant volatility and cause the Fund to participate in losses on an amount that exceeds the Fund’s initial investment. The Fund may not achieve the anticipated benefits, and may realize losses when a counterparty fails to perform. Because the Fund allocates assets to a variety of investment strategies, ETFs and other mutual funds, which involve certain risks, it may be subject to those same risks. The Fund is actively managed but there is no guarantee that the manager’s investment decisions will produce the desired results. The Fund’s prospectus also includes a description of the main investment risks.
Performance Overview
You can find the Fund’s one-year total return in the Performance Summary. For comparison, the Fund’s benchmarks, the S&P 500, returned +1.38%, and the Barclays U.S. Aggregate Bond Index posted a +0.55% total return for the period under review.1 The Fund’s blended benchmark, a combination of leading stock and bond indexes that better reflects the asset allocation of the Fund’s portfolio, returned +3.33% for the same period.2 Prior to May 1, 2015, the Fund followed different investment strategies, had different subadvisory arrangements, allocated its core portfolio differently, had a different current target volatility goal and made different use of derivative instruments. As a result, the Fund generally held different investments and had a different investment profile.
Economic and Market Overview
The U.S. economy grew moderately during the 12 months under review amid healthy consumer spending. After starting 2015 with modest growth, the economy strengthened in the second quarter but moderated in the third and fourth quarters as exports slowed and state and local governments reduced their spending. Manufacturing activities expanded for most of the period but contracted toward period-end. Non-manufacturing activities, however, expanded throughout the 12-month period, contributing to new jobs and helping drive down the unemployment rate to 5.0% from October through period-end, the lowest level in more than seven years.3 The housing market improved at period-end as existing and new home sales increased and home prices rose despite slightly higher mortgage rates. Retail sales grew modestly, led by automobile and auto component sales. Annual inflation, as measured by the Consumer Price Index, remained subdued largely due to low energy prices.
After maintaining its target interest rate at a range of 0%–0.25% for seven years to support the U.S. economy’s recovery, the Federal Reserve (Fed) raised its target range for the federal funds rate to 0.25%–0.50% at its December meeting. Policymakers cited the labor market’s considerable improvement and were reasonably confident that inflation would move back to the Fed’s 2.0% medium-term objective. The Fed indicated that its process of normalizing interest rates would be data dependent and would likely be gradual. Furthermore, the Fed raised its 2016 U.S. economic growth forecast and lowered its unemployment rate projection.
U.S. stock markets experienced sell-offs at times during the year, resulting from investor concerns about the timing of the Fed’s interest rate increases, slower global economic growth, geopolitical tensions in certain regions and a plunge in crude oil prices. Investors generally remained confident, however, as the Fed maintained an accommodative monetary policy stance despite the rate increase, the eurozone economy improved and China implemented more stimulus measures to support its economy. Despite periods of volatility, the broad U.S. stock market, as measured by the S&P 500, generated a modest positive total return for 2015. The energy and materials sectors were among the worst performers, while consumer discretionary, health care, consumer staples and information technology outperformed.
1. Source: Morningstar.
2. The Fund’s blended benchmark was calculated internally and rebalanced monthly and was composed of 60% S&P 500, 30% Barclays U.S. Aggregate Bond Index and 10% Barclays 1-3 Month U.S. Treasury Bill Index.
One cannot invest directly in an index, and an index is not representative of the Fund’s portfolio. Please see Index Descriptions following the Fund Summaries.
3. Bureau of Labor Statistics.
FRANKLIN VOLSMART ALLOCATION VIP FUND
The 10-year Treasury yield, which moves inversely to price, fluctuated throughout the period. It began the period at 2.17%, declined to a period low of 1.68% in late January 2015 and ended the period at 2.27%. For much of the year, the yield movements appeared to reflect investor uncertainty given concerns about domestic data, geopolitical tensions, the Fed’s timing for raising interest rates and events in China. However, near period-end, decreasing concerns over China’s economy and the Fed’s decision to increase interest rates supported Treasury yields.
Investment Strategy
Under normal market conditions, the Fund seeks to achieve its investment goal by allocating its assets across certain asset classes, sectors and strategies in an attempt to produce a diversified portfolio that will generate returns while minimizing the expected volatility of the Fund’s returns so that volatility does not exceed a target of 10% per year. (Volatility within the 10% target is referred to as “Target Volatility.”) The Fund’s assets are primarily invested in its “core portfolio,” which is principally composed of various U.S. equity and fixed income investments and strategies.
In addition, the Fund employs a volatility management strategy, which is designed to manage the expected volatility of the Fund’s returns so that volatility remains within the Fund’s Target Volatility. Thus, the Fund may utilize certain derivative instruments (such as futures contracts on indexes) to adjust the Fund’s expected volatility to within the Target Volatility. There is no guarantee that the Fund will stay within its Target Volatility. The Fund also employs a “tail risk protection strategy,” designed to protect the Fund from risks related to extreme short-term market downturns (tail risk). Thus, the Fund may utilize certain derivatives (such as total return swap agreements) to hedge the tail risk of the Fund. There is no guarantee that the Fund’s volatility management or tail risk protection strategies will be successful.
What is a futures contract?
A futures contract is an agreement between the Fund and a counterparty made through a U.S. or foreign futures exchange to buy or sell an underlying instrument or asset at a specific price on a future date.
What is a total return swap agreement?
A swap agreement, such as an equity total return swap, is a contract between the Fund and a counterparty to exchange on a future date the returns, or differentials in return, that would have been earned or realized if a notional amount were invested in specific instruments.
4. Please see Index descriptions following the Fund Summaries.
| | | | |
| Portfolio Breakdown* | | | |
| 12/31/15 | | | |
| | | % of Total
Net Assets | |
| Stocks | | | 45.8% | |
| Capital Goods | | | 8.5% | |
| Health Care Equipment & Services | | | 5.9% | |
| Materials | | | 4.9% | |
| Food, Beverage & Tobacco | | | 3.4% | |
| Energy | | | 3.0% | |
| Pharmaceuticals, Biotechnology & Life Sciences | | | 2.7% | |
| Retailing | | | 2.7% | |
| Food & Staples Retailing | | | 2.5% | |
| Software & Services | | | 2.4% | |
| Other | | | 9.8% | |
| Underlying Funds | | | 50.0% | |
| Franklin DynaTech Fund – Class R6 | | | 14.0% | |
| Franklin Low Duration Total Return Fund – Class R6 | | | 13.6% | |
| Franklin Strategic Income Fund – Class R6 | | | 11.5% | |
| Franklin Income Fund – Class R6 | | | 10.9% | |
| Hedge Strategy | | | 0.6% | |
| Short-Term Investments & Other Net Assets | | | 3.6% | |
*Figures are stated as a percentage of total and may not equal 100% or may be negative due to rounding, use of any derivatives, unsettled trades or other factors.
The breakdown may not match the Statement of Investments (SOI).
Manager’s Discussion
From January 1, 2015, through April 30, 2015, the Fund followed its original investment strategies, seeking to diversify the portfolio across global asset classes, regions and sectors while seeking to limit volatility of the Fund’s returns. For this period, the Fund’s benchmark was a combination of the MSCI ACWI, the Citigroup WGBI and the Bloomberg Commodity Index (combined index).4 Performance for these four months is discussed in the following five paragraphs.
Tactical Hedging
For the first four months of the year, volatility remained subdued, and our forward-looking risk estimates of expected volatility remained within our tolerance. Thus, we did not implement tactical hedging during this period.
Developed Low Volatility Equities
Our analysis shows that the Fund’s exposure to low volatility strategies reduced the Fund’s volatility as evidenced by relatively low daily changes in share price. The equities held as part of our low volatility strategies outperformed the broad equity markets,
FRANKLIN VOLSMART ALLOCATION VIP FUND
and our outperformance of European markets offset our underperformance of the U.S. market. Please keep in mind that, although the Fund had a passive exposure to certain low-volatility stocks through the Fund’s allocation process, other stock investments were employed to gain country or sector exposure and were based on expectations of low volatility, not capital appreciation.
Emerging Equities
Relative to the combined index, we maintained an underweighting in emerging market equities, as we sought to limit what we viewed as a potential source of volatility. Although this decision detracted as emerging market stocks performed well, the decline was somewhat offset by gains from stock selection within these markets. Selections in China contributed, while selections in India and Egypt detracted. Overweightings in China and Thailand added to returns, as did underweightings in Brazil and Colombia. Conversely, an underweighted allocation in Russia, which was a particularly strong performer, detracted.
Fixed Income
Country selection detracted from results, led by overweighted positions in Europe as well as positions in several emerging debt markets, including Poland and Malaysia. However, the decision to hedge out a significant portion of the currency exposure in several of these issues, most notably to the euro, contributed as the U.S. dollar strengthened relative to these currencies. However, an underweighting to U.S. Treasuries, which performed well, limited gains.
Commodities
We maintained a small underweighting in commodities relative to the combined index primarily due to our outlook for slower global growth and expectations for a stronger U.S. dollar. This strategy contributed to results as commodity prices weakened over the period.
Because of its change in investment strategy, the Fund generally held different investments and had a different investment profile starting on May 1, 2015. The following discussion covers the performance for the remaining eight months of the year. On May 1, 2015, the Fund’s benchmark was revised to a combination of the S&P 500 and the Barclays U.S. Aggregate Bond Index because the investment manager believed the compositions of these indexes better reflected the Fund’s holdings. Nevertheless, the Fund’s broad investment strategies remained the same throughout the full 12-month period — to allocate its assets across certain asset classes, sectors and strategies in an
attempt to produce a diversified portfolio that will generate returns while minimizing the expected volatility of the Fund’s returns; and, in addition, to employ a volatility management strategy designed to further manage the expected volatility of the Fund’s returns.
| | | | |
| Portfolio Strategy Holdings* | | | |
| 12/31/15 | | | |
| | | % of Total Net Assets | |
| Franklin Rising Dividends Strategy | | | 45.8% | |
| Franklin DynaTech Fund | | | 14.0% | |
| Franklin Low Duration Total Return Fund | | | 13.6% | |
| Franklin Strategic Income Fund | | | 11.5% | |
| Franklin Income Fund | | | 10.9% | |
| Hedge Strategy | | | 0.6% | |
| Short-Term Investments & Other Net Assets | | | 3.6% | |
*The breakdown may not match the SOI.
The dollar value, number of shares or principal amount, and names of all portfolio holdings are listed in the Fund’s SOI.
Tactical Hedging
The Fund’s tactical hedging comprised two hedges during the remaining eight months of the year under review. We held a swap contract with Barclays Capital which systematically trades the Chicago Board Options Exchange’s CBOE Volatility Index® (VIX®). This VIX-linked hedge is designed for tail risk protection during periods of market downturn and was additive to performance in the review period. The Fund also used an independent volatility management hedge strategy (implemented using S&P futures). This strategy was engaged during the period as market volatility increased. Although the strategy weighed on returns, it helped constrain Fund volatility.
Equities
Relative to the combined index, we maintained a small overweighting in equities, although our positioning was largely defensive as we sought to limit potential volatility. The overweighting in stocks modestly hindered relative results. Stock returns and volatility were challenged in the third quarter by investor concerns surrounding the impact of China’s slowing economy on global growth. Within the Fund’s equity holdings, the rising dividend strategy and the equity component of the income strategy hurt relative results. In contrast, the technology strategy added value as the sector rallied substantially in October and November after a challenging third quarter. At period-end, stock market volatility was trending higher compared to mid-October and November levels, and the Fund remained positioned to potentially mitigate this impact.
FRANKLIN VOLSMART ALLOCATION VIP FUND
Fixed Income
The Fund’s slight underweighting in fixed income modestly benefited returns, although security selection detracted from relative results. In particular, the strategic income and income strategies impaired relative performance. The low duration strategy, representing the largest strategy allocation in the Fund’s fixed income component, was more resilient in terms of relative performance, although it was detractive. We applied our low duration strategy seeking less interest rate sensitivity in what we view as a rising-rate environment. Overall, volatility in fixed income markets resurfaced in December, reversing some of the stabilizing trends that developed during October and November.
Thank you for your participation in Franklin VolSmart Allocation VIP Fund. We look forward to serving your future investment needs.
The foregoing information reflects our analysis, opinions and portfolio holdings as of December 31, 2015, the end of the reporting period. The way we implement our main investment strategies and the resulting portfolio holdings may change depending on factors such as market and economic conditions. These opinions may not be relied upon as investment advice or an offer for a particular security. The information is not a complete analysis of every aspect of any market, country, industry, security or the Fund. Statements of fact are from sources considered reliable, but the investment manager makes no representation or warranty as to their completeness or accuracy. Although historical performance is no guarantee of future results, these insights may help you understand our investment management philosophy.
FRANKLIN VOLSMART ALLOCATION VIP FUND
Class 5 Fund Expenses
As an investor in a variable insurance contract (Contract) that indirectly provides for investment in an underlying mutual fund, you can incur transaction and/or ongoing expenses at both the Fund level and the Contract level.
| • | | Transaction expenses can include sales charges (loads) on purchases, surrender fees, transfer fees and premium taxes. |
| • | | Ongoing expenses can include management fees, distribution and service (12b-1) fees, contract fees, annual maintenance fees, mortality and expense risk fees and other fees and expenses. All mutual funds and Contracts have some types of ongoing expenses. |
The expenses shown in the table are meant to highlight ongoing expenses at the Fund level only and do not include ongoing expenses at the Contract level, or transaction expenses at either the Fund or Contract levels. While the Fund does not have transaction expenses, if the transaction and ongoing expenses at the Contract level were included, the expenses shown below would be higher. You should consult your Contract prospectus or disclosure document for more information.
The table shows Fund-level ongoing expenses and can help you understand these expenses and compare them with those of other mutual funds offered through the Contract. The table assumes a $1,000 investment held for the six months indicated. Please refer to the Fund prospectus for additional information on operating expenses.
Actual Fund Expenses
The first line (Actual) of the table provides actual account values and expenses. The “Ending Account Value” is derived from the Fund’s actual return, which includes the effect of ongoing Fund expenses, but does not include the effect of ongoing Contract expenses.
You can estimate the Fund-level expenses you incurred during the period by following these steps. Of course, your account value and expenses will differ from those in this illustration:
| 1. | Divide your account value by $1,000. |
If an account had an $8,600 value, then $8,600 ÷ $1,000 = 8.6.
| 2. | Multiply the result by the number under the heading “Fund-Level Expenses Incurred During Period.” |
If Fund-Level Expenses Incurred During Period were $7.50, then 8.6 × $7.50 = $64.50.
In this illustration, the estimated expenses incurred this period at the Fund level are $64.50.
Hypothetical Example for Comparison with Other Mutual Funds
Information in the second line (Hypothetical) of the table can help you compare ongoing expenses of the Fund with those of other mutual funds offered through the Contract. This information may not be used to estimate the actual ending account balance or expenses you incurred during the period. The hypothetical “Ending Account Value” is based on the Fund’s actual expense ratio and an assumed 5% annual rate of return before expenses, which does not represent the Fund’s actual return. The figure under the heading “Fund-Level Expenses Incurred During Period” shows the hypothetical expenses your account would have incurred under this scenario. You can compare this figure with the 5% hypothetical examples that appear in shareholder reports of other funds offered through a Contract.
| | | | | | | | | | | | | | | | |
| Class 5 | | Beginning Account
Value 7/1/15 | | | Ending Account
Value 12/31/15 | | | Expenses Paid
During Period* 7/1/15–12/31/15 | | | Expenses Paid
During Period** 7/1/15–12/31/15 | |
Actual | | | $1,000 | | | | $ 954.00 | | | | $3.94 | | | | $4.83 | |
Hypothetical (5% return before expenses) | | | $1,000 | | | | $1,021.17 | | | | $4.08 | | | | $4.99 | |
*Expenses are calculated using the most recent six-month annualized expense ratio excluding expenses of the underlying funds, net of expense waivers, for the Fund’s Class 5 shares (0.80%), which does not include any ongoing expenses of the Contract for which the Fund is an investment option, multiplied by the average account value over the period, multiplied by 184/365 to reflect the one-half year period.
**Expenses are calculated using the most recent six-month annualized expense ratio including expenses of the underlying funds, net of expense waivers, for the Fund’s Class 5 shares (0.98%), which does not include any ongoing expenses of the Contract for which the Fund is an investment option, multiplied by the average account value over the period, multiplied by 184/365 to reflect the one-half year period.
FRANKLIN TEMPLETON VARIABLE INSURANCE PRODUCTS TRUST
Consolidated Financial Highlights
Franklin VolSmart Allocation VIP Fund
| | | | | | | | | | | | |
| | | Year Ended December 31, | |
| | | 2015 | | | 2014 | | | 2013a | |
| Class 2 | | | | | | | | | | | | |
Per share operating performance
(for a share outstanding throughout the year) | | | | | | | | | | | | |
| | | |
Net asset value, beginning of year | | | $10.20 | | | | $10.07 | | | | $10.00 | |
| | | | |
| | | |
| Income from investment operationsb: | | | | | | | | | | | | |
| | | |
Net investment incomec,d | | | 0.10 | | | | 0.11 | | | | 0.09 | |
| | | |
Net realized and unrealized gains (losses) | | | (0.42 | ) | | | 0.25 | | | | 0.17 | |
| | | | |
Total from investment operations | | | (0.32 | ) | | | 0.36 | | | | 0.26 | |
| | | | |
| | | |
| Less distributions from: | | | | | | | | | | | | |
| | | |
Net investment income and net foreign currency gains | | | (0.05 | ) | | | (0.23 | ) | | | (0.19 | ) |
| | | |
Net realized gains | | | (0.15 | ) | | | (— | )e | | | — | |
| | | | |
Total distributions | | | (0.20 | ) | | | (0.23 | ) | | | (0.19 | ) |
| | | | |
Net asset value, end of year | | | $9.68 | | | | $10.20 | | | | $10.07 | |
| | | | |
| | | |
Total returnf | | | (3.12)% | | | | 3.60% | | | | 2.56% | |
| | | |
| Ratios to average net assetsg | | | | | | | | | | | | |
| | | |
Expenses before waiver and payments by affiliatesh | | | 1.77% | | | | 1.97% | | | | 2.97% | |
| | | |
Expenses net of waiver and payments by affiliatesh | | | 0.93% | | | | 1.08% | i | | | 1.08% | i |
| | | |
Net investment incomed | | | 1.30% | | | | 1.07% | | | | 1.21% | |
| | | |
| Supplemental data | | | | | | | | | | | | |
| | | |
Net assets, end of year (000’s) | | | $8,703 | | | | $10,201 | | | | $10,065 | |
| | | |
Portfolio turnover rate | | | 95.15% | | | | 22.04% | | | | 8.12% | |
aFor the period April 1, 2013 (commencement of operations) to December 31, 2013.
bThe amount shown for a share outstanding throughout the period may not correlate with the Consolidated Statement of Operations for the period due to the timing of sales and repurchases of the Fund’s shares in relation to income earned and/or fluctuating fair value of the investments of the Fund.
cBased on average daily shares outstanding.
dRecognition of net investment income by the Fund is affected by the timing of declaration of dividends by the Underlying Funds and exchange traded funds in which the Fund invests.
eAmount rounds to less than $0.01 per share.
fTotal return does not include fees, charges or expenses imposed by the variable annuity and life insurance contracts for which Franklin Templeton Variable Insurance Products Trust serves as an underlying investment vehicle. Total return is not annualized for periods less than one year.
gRatios are annualized for periods less than one year.
hDoes not include expenses of the Underlying Funds and exchange traded funds in which the Fund invests. The weighted average indirect expenses of the Underlying Funds and exchange traded funds was 0.18% for the year ended December 31, 2015.
iBenefit of expense reduction rounds to less than 0.01%.
| | | | | | |
| | | The accompanying notes are an integral part of these consolidated financial statements. | Annual Report | | | FVA-7 | |
FRANKLIN TEMPLETON VARIABLE INSURANCE PRODUCTS TRUST
CONSOLIDATED FINANCIAL HIGHLIGHTS
Franklin VolSmart Allocation VIP Fund (continued)
| | | | | | | | | | | | |
| | | Year Ended December 31, | |
| | | 2015 | | | 2014 | | | 2013a | |
| Class 5 | | | | | | | | | | | | |
Per share operating performance
(for a share outstanding throughout the year) | | | | | | | | | | | | |
| | | |
Net asset value, beginning of year | | | $10.20 | | | | $10.07 | | | | $10.00 | |
| | | | |
| | | |
| Income from investment operationsb: | | | | | | | | | | | | |
| | | |
Net investment incomec,d | | | 0.16 | | | | 0.13 | | | | 0.10 | |
| | | |
Net realized and unrealized gains (losses) | | | (0.47 | ) | | | 0.25 | | | | 0.17 | |
| | | | |
Total from investment operations | | | (0.31 | ) | | | 0.38 | | | | 0.27 | |
| | | | |
| | | |
| Less distributions from: | | | | | | | | | | | | |
| | | |
Net investment income and net foreign currency gains | | | (0.07 | ) | | | (0.25 | ) | | | (0.20 | ) |
| | | |
Net realized gains | | | (0.15 | ) | | | (— | )e | | | — | |
| | | | |
Total distributions | | | (0.22 | ) | | | (0.25 | ) | | | (0.20 | ) |
| | | | |
Net asset value, end of year | | | $9.67 | | | | $10.20 | | | | $10.07 | |
| | | | |
| | | |
Total returnf | | | (3.10)% | | | | 3.75% | | | | 2.68% | |
| | | |
| Ratios to average net assetsg | | | | | | | | | | | | |
| | | |
Expenses before waiver and payments by affiliatesh | | | 1.66% | | | | 1.82% | | | | 2.82% | |
| | | |
Expenses net of waiver and payments by affiliatesh | | | 0.82% | | | | 0.93% | i | | | 0.93% | i |
| | | |
Net investment incomed | | | 1.41% | | | | 1.22% | | | | 1.36% | |
| | | |
| Supplemental data | | | | | | | | | | | | |
| | | |
Net assets, end of year (000’s) | | | $54,816 | | | | $10,201 | | | | $10,065 | |
| | | |
Portfolio turnover rate | | | 95.15% | | | | 22.04% | | | | 8.12% | |
aFor the period April 1, 2013 (commencement of operations) to December 31, 2013.
bThe amount shown for a share outstanding throughout the period may not correlate with the Consolidated Statement of Operations for the period due to the timing of sales and repurchases of the Fund’s shares in relation to income earned and/or fluctuating fair value of the investments of the Fund.
cBased on average daily shares outstanding.
dRecognition of net investment income by the Fund is affected by the timing of declaration of dividends by the Underlying Funds and exchange traded funds in which the Fund invests.
eAmount rounds to less than $0.01 per share.
fTotal return does not include fees, charges or expenses imposed by the variable annuity and life insurance contracts for which Franklin Templeton Variable Insurance Products Trust serves as an underlying investment vehicle. Total return is not annualized for periods less than one year.
gRatios are annualized for periods less than one year.
hDoes not include expenses of the Underlying Funds and exchange traded funds in which the Fund invests. The weighted average indirect expenses of the Underlying Funds and exchange traded funds was 0.18% for the year ended December 31, 2015.
iBenefit of expense reduction rounds to less than 0.01%.
| | | | | | |
| | FVA-8 | | | Annual Report | The accompanying notes are an integral part of these consolidated financial statements. | | |
FRANKLIN TEMPLETON VARIABLE INSURANCE PRODUCTS TRUST
Consolidated Statement of Investments, December 31, 2015
| | | | | | | | | | |
| Franklin VolSmart Allocation VIP Fund | |
| | | | | Shares | | | Value | |
| | Common Stocks 45.8% | | | | | | | | |
| | Automobiles & Components 1.1% | | | | | | | | |
| | Johnson Controls Inc. | | | 18,000 | | | $ | 710,820 | |
| | | | | | | | | | |
| | Capital Goods 8.5% | | | | | | | | |
| | Carlisle Cos. Inc. | | | 3,300 | | | | 292,677 | |
| | Donaldson Co. Inc. | | | 7,000 | | | | 200,620 | |
| | Dover Corp. | | | 10,900 | | | | 668,279 | |
| | General Dynamics Corp. | | | 4,100 | | | | 563,176 | |
| | Honeywell International Inc. | | | 9,400 | | | | 973,558 | |
| | Pentair PLC (United Kingdom) | | | 14,000 | | | | 693,420 | |
| | Roper Technologies Inc. | | | 4,700 | | | | 892,013 | |
| | United Technologies Corp. | | | 7,000 | | | | 672,490 | |
| | W.W. Grainger Inc. | | | 2,100 | | | | 425,439 | |
| | | | | | | | | | |
| | | | | | | | | 5,381,672 | |
| | | | | | | | | | |
| | Commercial & Professional Services 0.8% | | | | | | | | |
| | Cintas Corp. | | | 2,800 | | | | 254,940 | |
| | Matthews International Corp., A | | | 4,300 | | | | 229,835 | |
| | | | | | | | | | |
| | | | | | | | | 484,775 | |
| | | | | | | | | | |
| | Consumer Durables & Apparel 1.1% | | | | | | | | |
| | Leggett & Platt Inc. | | | 2,500 | | | | 105,050 | |
| | NIKE Inc., B | | | 9,200 | | | | 575,000 | |
| | | | | | | | | | |
| | | | | | | | | 680,050 | |
| | | | | | | | | | |
| | Consumer Services 1.1% | | | | | | | | |
| | McDonald’s Corp. | | | 4,200 | | | | 496,188 | |
| | Yum! Brands Inc. | | | 2,800 | | | | 204,540 | |
| | | | | | | | | | |
| | | | | | | | | 700,728 | |
| | | | | | | | | | |
| | Diversified Financials 0.2% | | | | | | | | |
| | State Street Corp. | | | 1,900 | | | | 126,084 | |
| | | | | | | | | | |
| | Energy 3.0% | | | | | | | | |
| | Chevron Corp. | | | 3,300 | | | | 296,868 | |
| | EOG Resources Inc. | | | 1,600 | | | | 113,264 | |
| | Exxon Mobil Corp. | | | 4,630 | | | | 360,909 | |
| | Occidental Petroleum Corp. | | | 6,700 | | | | 452,987 | |
| | Schlumberger Ltd. | | | 10,100 | | | | 704,475 | |
| | | | | | | | | | |
| | | | | | | | | 1,928,503 | |
| | | | | | | | | | |
| | Food & Staples Retailing 2.5% | | | | | | | | |
| | CVS Health Corp. | | | 5,200 | | | | 508,404 | |
| | Wal-Mart Stores Inc. | | | 8,600 | | | | 527,180 | |
| | Walgreens Boots Alliance Inc. | | | 6,800 | | | | 579,054 | |
| | | | | | | | | | |
| | | | | | | | | 1,614,638 | |
| | | | | | | | | | |
| | Food, Beverage & Tobacco 3.4% | | | | | | | | |
| | Archer-Daniels-Midland Co. | | | 15,500 | | | | 568,540 | |
| | Bunge Ltd. | | | 10,200 | | | | 696,456 | |
| | McCormick & Co. Inc. | | | 3,000 | | | | 256,680 | |
| | PepsiCo Inc. | | | 6,300 | | | | 629,496 | |
| | | | | | | | | | |
| | | | | | | | | 2,151,172 | |
| | | | | | | | | | |
| | Health Care Equipment & Services 5.9% | | | | | | | | |
| | Abbott Laboratories | | | 8,400 | | | | 377,244 | |
FRANKLIN TEMPLETON VARIABLE INSURANCE PRODUCTS TRUST
CONSOLIDATED STATEMENT OF INVESTMENTS
Franklin VolSmart Allocation VIP Fund (continued)
| | | | | | | | | | |
| | | | | Shares | | | Value | |
| | Common Stocks (continued) | | | | | | | | |
| | Health Care Equipment & Services (continued) | | | | | | | | |
| | Becton, Dickinson and Co. | | | 6,100 | | | $ | 939,949 | |
| | DENTSPLY International Inc. | | | 3,100 | | | | 188,635 | |
| | Medtronic PLC | | | 12,600 | | | | 969,192 | |
| | Stryker Corp. | | | 9,500 | | | | 882,930 | |
| | West Pharmaceutical Services Inc. | | | 6,000 | | | | 361,320 | |
| | | | | | | | | | |
| | | | | | | | | 3,719,270 | |
| | | | | | | | | | |
| | Household & Personal Products 2.0% | | | | | | | | |
| | Colgate-Palmolive Co. | | | 8,200 | | | | 546,284 | |
| | The Procter & Gamble Co. | | | 8,700 | | | | 690,867 | |
| | | | | | | | | | |
| | | | | | | | | 1,237,151 | |
| | | | | | | | | | |
| | Insurance 0.8% | | | | | | | | |
| | Aflac Inc. | | | 2,600 | | | | 155,740 | |
| | The Chubb Corp. | | | 1,000 | | | | 132,640 | |
| | Erie Indemnity Co., A | | | 2,300 | | | | 219,972 | |
| | | | | | | | | | |
| | | | | | | | | 508,352 | |
| | | | | | | | | | |
| | Materials 4.9% | | | | | | | | |
| | Air Products and Chemicals Inc. | | | 6,800 | | | | 884,748 | |
| | Albemarle Corp. | | | 14,500 | | | | 812,145 | |
| | Bemis Co. Inc. | | | 2,900 | | | | 129,601 | |
| | Ecolab Inc. | | | 3,200 | | | | 366,016 | |
| | Nucor Corp. | | | 2,700 | | | | 108,810 | |
| | Praxair Inc. | | | 7,900 | | | | 808,960 | |
| | | | | | | | | | |
| | | | | | | | | 3,110,280 | |
| | | | | | | | | | |
| | Media 0.5% | | | | | | | | |
| | John Wiley & Sons Inc., A | | | 6,400 | | | | 288,192 | |
| | | | | | | | | | |
| | Pharmaceuticals, Biotechnology & Life Sciences 2.7% | | | | | | | | |
| | AbbVie Inc. | | | 6,000 | | | | 355,440 | |
| | Johnson & Johnson | | | 8,600 | | | | 883,392 | |
| | Perrigo Co. PLC | | | 1,100 | | | | 159,170 | |
| | Pfizer Inc. | | | 5,900 | | | | 190,452 | |
| | Roche Holding AG, ADR (Switzerland) | | | 4,200 | | | | 144,774 | |
| | | | | | | | | | |
| | | | | | | | | 1,733,228 | |
| | | | | | | | | | |
| | Retailing 2.7% | | | | | | | | |
| | The Gap Inc. | | | 9,900 | | | | 244,530 | |
| | Ross Stores Inc. | | | 10,800 | | | | 581,148 | |
| | Target Corp. | | | 8,500 | | | | 617,185 | |
| | Tiffany & Co. | | | 3,200 | | | | 244,128 | |
| | | | | | | | | | |
| | | | | | | | | 1,686,991 | |
| | | | | | | | | | |
| | Semiconductors & Semiconductor Equipment 1.3% | | | | | | | | |
| | Linear Technology Corp. | | | 8,100 | | | | 344,007 | |
| | Texas Instruments Inc. | | | 9,000 | | | | 493,290 | |
| | | | | | | | | | |
| | | | | | | | | 837,297 | |
| | | | | | | | | | |
| | Software & Services 2.4% | | | | | | | | |
| | Accenture PLC, A | | | 6,500 | | | | 679,250 | |
| | Microsoft Corp. | | | 15,700 | | | | 871,036 | |
| | | | | | | | | | |
| | | | | | | | | 1,550,286 | |
| | | | | | | | | | |
FRANKLIN TEMPLETON VARIABLE INSURANCE PRODUCTS TRUST
CONSOLIDATED STATEMENT OF INVESTMENTS
Franklin VolSmart Allocation VIP Fund (continued)
| | | | | | | | | | |
| | | | | Shares | | | Value | |
| | Common Stocks (continued) | | | | | | | | |
| | Technology Hardware & Equipment 0.3% | | | | | | | | |
| | QUALCOMM Inc. | | | 4,400 | | | $ | 219,934 | |
| | | | | | | | | | |
| | Transportation 0.6% | | | | | | | | |
| | United Parcel Service Inc., B | | | 4,200 | | | | 404,166 | |
| | | | | | | | | | |
| | | |
| | Total Common Stocks (Cost $29,505,629) | | | | | | | 29,073,589 | |
| | | | | | | | | | |
| | Investments in Underlying Funds 50.0% | | | | | | | | |
| | Domestic Equity 14.0% | | | | | | | | |
| a,b | | Franklin DynaTech Fund, Class R6 | | | 177,994 | | | | 8,922,827 | |
| | | | | | | | | | |
| | Domestic Fixed Income 25.1% | | | | | | | | |
| b | | Franklin Low Duration Total Return Fund, Class R6 | | | 881,451 | | | | 8,620,590 | |
| b | | Franklin Strategic Income Fund, Class R6 | | | 796,192 | | | | 7,293,115 | |
| | | | | | | | | | |
| | | | | | | | | 15,913,705 | |
| | | | | | | | | | |
| | Domestic Hybrid 10.9% | | | | | | | | |
| b | | Franklin Income Fund, Class R6 | | | 3,330,823 | | | | 6,928,111 | |
| | | | | | | | | | |
| | | |
| | Total Investments in Underlying Funds (Cost $32,292,992) | | | | | | | 31,764,643 | |
| | | | | | | | | | |
| | | |
| | Total Investments before Short Term Investments (Cost $61,798,621) | | | | | | | 60,838,232 | |
| | | | | | | | | | |
| | Short Term Investments (Cost $1,582,659) 2.5% | | | | | | | | |
| | Money Market Funds 2.5% | | | | | | | | |
| a,b | | Institutional Fiduciary Trust Money Market Portfolio | | | 1,582,659 | | | | 1,582,659 | |
| | | | | | | | | | |
| | Total Investments (Cost $63,381,280) 98.3% | | | | | | | 62,420,891 | |
| | Other Assets, less Liabilities 1.7% | | | | | | | 1,098,392 | |
| | | | | | | | | | |
| | Net Assets 100.0% | | | | | | $ | 63,519,283 | |
| | | | | | | | | | |
aNon-income producing.
bSee Note 3(e) regarding investments in Underlying Funds.
FRANKLIN TEMPLETON VARIABLE INSURANCE PRODUCTS TRUST
CONSOLIDATED STATEMENT OF INVESTMENTS
Franklin VolSmart Allocation VIP Fund (continued)
At December 31, 2015, the Fund had the following futures contracts outstanding. See Note 1(c).
| | | | | | | | | | | | | | | | | | | | | | | | |
| Futures Contracts | | | | | | | | | | | | | | | | | | |
| Description | | Type | | | Number of
Contracts | | | Notional
Value | | | Expiration Date | | | Unrealized
Appreciation | | | Unrealized
Depreciation | |
| Equity Contracts | | | | | | | | | | | | | | | | | | | | | | | | |
E-mini S&P 500 | | | Short | | | | 76 | | | $ | 7,734,520 | | | | 3/08/16 | | | $ | — | | | $ | (29,372 | ) |
| | | | | | | | | | | | | | | | | | | | |
At December 31, 2015, the Fund had the following total return swap contracts outstanding. See Note 1(c).
| | | | | | | | | | | | | | | | | | | | | | | | |
| Total Return Swap Contracts | | | | | | | | | | | | | |
| Underlying Instrument | | Financing Rate | | | Counterparty | | | Notional
Value | | | Expiration
Date | | | Unrealized
Appreciation | | | Unrealized
Depreciation | |
Dynamic VIX Backwardation (BEFSDVB1) | | | 0.25 | % | | | BZWS | | | $ | 12,120,000 | | | | 5/12/16 | | | $ | — | | | $ | (144,457 | ) |
| | | | | | | | | | | | | | | | | | | | |
See Abbreviations on page FVA-25.
| | | | | | |
| | FVA-12 | | | Annual Report | The accompanying notes are an integral part of these consolidated financial statements. | | |
FRANKLIN TEMPLETON VARIABLE INSURANCE PRODUCTS TRUST
Consolidated Financial Statements
Consolidated Statement of Assets and Liabilities
December 31, 2015
| | | | |
| | | Franklin VolSmart
Allocation VIP
Fund | |
Assets: | | | | |
Investments in securities: | | | | |
Cost - Unaffiliated issuers | | $ | 29,505,629 | |
Cost - Underlying Funds (Note 3e) | | | 33,875,651 | |
| | | | |
Total cost of investments | | $ | 63,381,280 | |
| | | | |
Value - Unaffiliated issuers | | $ | 29,073,589 | |
Value - Underlying Funds (Note 3e) | | | 33,347,302 | |
| | | | |
Total value of investments | | | 62,420,891 | |
Cash | | | 105,977 | |
Receivables: | | | | |
Capital shares sold | | | 698,899 | |
Dividends | | | 54,060 | |
Affiliates | | | 19,302 | |
Due from brokers | | | 349,600 | |
Variation margin | | | 105,874 | |
| | | | |
Total assets | | | 63,754,603 | |
| | | | |
Liabilities: | | | | |
Payables: | | | | |
Capital shares redeemed | | | 9,595 | |
Distribution fees | | | 17,970 | |
Professional fees | | | 54,212 | |
Unrealized depreciation on OTC swap contracts | | | 144,457 | |
Accrued expenses and other liabilities | | | 9,086 | |
| | | | |
Total liabilities | | | 235,320 | |
| | | | |
Net assets, at value | | $ | 63,519,283 | |
| | | | |
Net assets consist of: | | | | |
Paid-in capital | | $ | 64,777,117 | |
Undistributed net investment income | | | 4,682 | |
Net unrealized appreciation (depreciation) | | | (1,134,217 | ) |
Accumulated net realized gain (loss) | | | (128,299 | ) |
| | | | |
Net assets, at value | | $ | 63,519,283 | |
| | | | |
| |
| Class 2: | | | | |
Net assets, at value | | $ | 8,703,170 | |
| | | | |
Shares outstanding | | | 898,687 | |
| | | | |
Net asset value and maximum offering price per share | | $ | 9.68 | |
| | | | |
| |
| Class 5: | | | | |
Net assets, at value | | $ | 54,816,113 | |
| | | | |
Shares outstanding | | | 5,667,365 | |
| | | | |
Net asset value and maximum offering price per share | | $ | 9.67 | |
| | | | |
| | | | | | |
| | | The accompanying notes are an integral part of these consolidated financial statements. | Annual Report | | | FVA-13 | |
FRANKLIN TEMPLETON VARIABLE INSURANCE PRODUCTS TRUST
CONSOLIDATED FINANCIAL STATEMENTS
Consolidated Statement of Operations
for the year ended December 31, 2015
| | | | |
| | | Franklin VolSmart
Allocation VIP
Fund | |
Investment income: | | | | |
Dividends: | | | | |
Unaffiliated issuers | | $ | 355,822 | |
Underlying Funds (Note 3e) | | | 349,864 | |
Interest | | | 33,118 | |
| | | | |
Total investment income | | | 738,804 | |
| | | | |
Expenses: | | | | |
Management fees (Note 3a) | | | 276,770 | |
Distribution fees: (Note 3c) | | | | |
Class 2 | | | 25,389 | |
Class 5 | | | 32,617 | |
Custodian fees (Note 4) | | | 895 | |
Reports to shareholders | | | 15,345 | |
Registration and filing fees | | | 1,740 | |
Professional fees | | | 191,191 | |
Other | | | 14,744 | |
| | | | |
Total expenses | | | 558,691 | |
Expenses waived/paid by affiliates (Note 3e and 3f) | | | (274,723 | ) |
| | | | |
Net expenses | | | 283,968 | |
| | | | |
Net investment income | | | 454,836 | |
| | | | |
Realized and unrealized gains (losses): | | | | |
Net realized gain (loss) from: | | | | |
Sale of Investments: | | | | |
Unaffiliated issuers | | | 1,156,376 | |
Underlying Funds (Note 3e) | | | (277,348 | ) |
Foreign currency transactions | | | 188,525 | |
Futures contracts | | | (1,124,702 | ) |
Swap contracts | | | 361,467 | |
Realized gain distributions: | | | | |
Underlying Funds (Note 3e) | | | 215,194 | |
| | | | |
Net realized gain (loss) | | | 519,512 | |
| | | | |
Net change in unrealized appreciation (depreciation) on: | | | | |
Investments | | | (1,656,335 | ) |
Translation of other assets and liabilities denominated in foreign currencies | | | 2,611 | |
Futures contracts | | | (29,372 | ) |
Swap contracts | | | (144,457 | ) |
| | | | |
Net change in unrealized appreciation (depreciation) | | | (1,827,553 | ) |
| | | | |
Net realized and unrealized gain (loss) | | | (1,308,041 | ) |
| | | | |
Net increase (decrease) in net assets resulting from operations | | $ | (853,205 | ) |
| | | | |
| | | | | | |
| | FVA-14 | | | Annual Report | The accompanying notes are an integral part of these consolidated financial statements. | | |
FRANKLIN TEMPLETON VARIABLE INSURANCE PRODUCTS TRUST
CONSOLIDATED FINANCIAL STATEMENTS
Consolidated Statements of Changes in Net Assets
| | | | | | | | |
| | | Franklin VolSmart Allocation VIP Fund | |
| | | Year Ended December 31, | |
| | | 2015 | | | 2014 | |
Increase (decrease) in net assets: | | | | | | | | |
Operations: | | | | | | | | |
Net investment income | | $ | 454,836 | | | $ | 236,957 | |
Net realized gain (loss) | | | 519,512 | | | | 223,319 | |
Net change in unrealized appreciation (depreciation) | | | (1,827,553 | ) | | | 293,294 | |
| | | | |
Net increase (decrease) in net assets resulting from operations | | | (853,205 | ) | | | 753,570 | |
| | | | |
Distributions to shareholders from: | | | | | | | | |
Net investment income and net foreign currency gains: | | | | | | | | |
Class 2 | | | (44,460 | ) | | | (230,300 | ) |
Class 5 | | | (238,720 | ) | | | (245,900 | ) |
Net realized gains: | | | | | | | | |
Class 2 | | | (133,455 | ) | | | (3,400 | ) |
Class 5 | | | (815,447 | ) | | | (3,400 | ) |
| | | | |
Total distributions to shareholders | | | (1,232,082 | ) | | | (483,000 | ) |
| | | | |
Capital share transactions: (Note 2) | | | | | | | | |
Class 2 | | | (1,003,000 | ) | | | — | |
Class 5 | | | 46,206,241 | | | | — | |
| | | | |
Total capital share transactions | | | 45,203,241 | | | | — | |
| | | | |
Net increase (decrease) in net assets | | | 43,117,954 | | | | 270,570 | |
Net assets: | | | | | | | | |
Beginning of year | | | 20,401,329 | | | | 20,130,759 | |
| | | | |
End of year | | $ | 63,519,283 | | | $ | 20,401,329 | |
| | | | |
Undistributed net investment income (distributions in excess of net investment income) included in net assets: | | | | | | | | |
End of year | | $ | 4,682 | | | $ | (69,150 | ) |
| | | | |
| | | | | | |
| | | The accompanying notes are an integral part of these consolidated financial statements. | Annual Report | | | FVA-15 | |
FRANKLIN TEMPLETON VARIABLE INSURANCE PRODUCTS TRUST
Notes to Consolidated Financial Statements
Franklin VolSmart Allocation VIP Fund
1. Organization and Significant Accounting Policies
Franklin Templeton Variable Insurance Products Trust (Trust) is registered under the Investment Company Act of 1940 (1940 Act) as an open-end management investment company, consisting of nineteen separate funds and applies the specialized accounting and reporting guidance in U.S. Generally Accepted Accounting Principles (U.S. GAAP). Franklin VolSmart Allocation VIP Fund (Fund) is included in this report. The financial statements of the remaining funds in the Trust are presented separately. The Fund invests in Franklin Templeton mutual funds (Underlying Funds). Shares of the Fund are generally sold only to insurance company separate accounts to fund the benefits of variable life insurance policies or variable annuity contracts. At December 31, 2015, 86.31% of the Fund’s shares were held through one insurance company. Investment activities of these insurance company separate accounts could have a material impact on the Fund. The Fund offers two classes of shares: Class 2 and Class 5. Each class of shares differs by its distribution fees, voting rights on matters affecting a single class and its exchange privilege.
The accounting policies of the Underlying Funds are outlined in their respective shareholder reports. A copy of the Underlying Funds’ shareholder reports is available on the U.S. Securities and Exchange Commission (SEC) website at sec.gov or at the SEC’s Public Reference Room in Washington, D.C. The Underlying Funds’ shareholder reports are not covered by this report.
Effective May 1, 2015, Franklin Managed Volatility Global Allocation VIP Fund was renamed Franklin VolSmart Allocation VIP Fund and implemented changes to the investment strategies.
The following summarizes the Fund’s significant accounting policies.
a. Financial Instrument Valuation
The Fund’s investments in financial instruments are carried at fair value daily. Fair value is the price that would be received to sell an asset or paid to transfer a liability in an orderly transaction between market participants on the measurement date. The Fund calculates the net asset value (NAV) per share as of 4 p.m. Eastern time each day the New York Stock Exchange (NYSE) is open for trading. Under compliance policies and procedures approved by the Trust’s Board of Trustees (the Board), the Fund’s administrator has responsibility for oversight of valuation, including leading the cross-functional Valuation
and Liquidity Oversight Committee (VLOC). The VLOC provides administration and oversight of the Fund’s valuation policies and procedures, which are approved annually by the Board. Among other things, these procedures allow the Fund to utilize independent pricing services, quotations from securities and financial instrument dealers, and other market sources to determine fair value.
Investments in the Underlying Funds are valued at their closing NAV each trading day.
Equity securities and derivative financial instruments (derivatives) listed on an exchange or on the NASDAQ National Market System are valued at the last quoted sale price or the official closing price of the day, respectively. Foreign equity securities are valued as of the close of trading on the foreign stock exchange on which the security is primarily traded or as of 4 p.m. Eastern time whichever is earlier. The value is then converted into its U.S. dollar equivalent at the foreign exchange rate in effect at 4 p.m. Eastern time on the day that the value of the security is determined. Over-the-counter (OTC) securities are valued within the range of the most recent quoted bid and ask prices. Securities that trade in multiple markets or on multiple exchanges are valued according to the broadest and most representative market. Certain equity securities are valued based upon fundamental characteristics or relationships to similar securities.
Certain derivatives trade in the OTC market. The Fund’s pricing services use various techniques including industry standard option pricing models and proprietary discounted cash flow models to determine the fair value of those instruments. The Fund’s net benefit or obligation under the derivative contract, as measured by the fair value of the contract, is included in net assets.
The Fund has procedures to determine the fair value of financial instruments for which market prices are not reliable or readily available. Under these procedures, the VLOC convenes on a regular basis to review such financial instruments and considers a number of factors, including significant unobservable valuation inputs, when arriving at fair value. The VLOC primarily employs a market-based approach which may use related or comparable assets or liabilities, recent transactions, market multiples, book values, and other relevant information for the investment to determine the fair value of the investment. An income-based valuation approach may also be used in which the
FRANKLIN TEMPLETON VARIABLE INSURANCE PRODUCTS TRUST
NOTES TO CONSOLIDATED FINANCIAL STATEMENTS
Franklin VolSmart Allocation VIP Fund (continued)
anticipated future cash flows of the investment are discounted to calculate fair value. Discounts may also be applied due to the nature or duration of any restrictions on the disposition of the investments. Due to the inherent uncertainty of valuations of such investments, the fair values may differ significantly from the values that would have been used had an active market existed. The VLOC employs various methods for calibrating these valuation approaches including a regular review of key inputs and assumptions, transactional back-testing or disposition analysis, and reviews of any related market activity.
Trading in securities on foreign securities stock exchanges and OTC markets may be completed before 4 p.m. Eastern time. In addition, trading in certain foreign markets may not take place on every NYSE business day. Occasionally, events occur between the time at which trading in a foreign security is completed and the close of the NYSE that might call into question the reliability of the value of a portfolio security held by the Fund. As a result, differences may arise between the value of the Fund’s portfolio securities as determined at the foreign market close and the latest indications of value at the close of the NYSE. In order to minimize the potential for these differences, the VLOC monitors price movements following the close of trading in foreign stock markets through a series of country specific market proxies (such as baskets of American Depositary Receipts, futures contracts and exchange traded funds). These price movements are measured against established trigger thresholds for each specific market proxy to assist in determining if an event has occurred that may call into question the reliability of the values of the foreign securities held by the Fund. If such an event occurs, the securities may be valued using fair value procedures, which may include the use of independent pricing services.
When the last day of the reporting period is a non-business day, certain foreign markets may be open on those days that the NYSE is closed, which could result in differences between the value of the Fund’s portfolio securities on the last business day and the last calendar day of the reporting period. Any significant security valuation changes due to an open foreign market are adjusted and reflected by the Fund for financial reporting purposes.
b. Foreign Currency Translation
Portfolio securities and other assets and liabilities denominated in foreign currencies are translated into U.S. dollars based on
the exchange rate of such currencies against U.S. dollars on the date of valuation. The Fund may enter into foreign currency exchange contracts to facilitate transactions denominated in a foreign currency. Purchases and sales of securities, income and expense items denominated in foreign currencies are translated into U.S. dollars at the exchange rate in effect on the transaction date. Portfolio securities and assets and liabilities denominated in foreign currencies contain risks that those currencies will decline in value relative to the U.S. dollar. Occasionally, events may impact the availability or reliability of foreign exchange rates used to convert the U.S. dollar equivalent value. If such an event occurs, the foreign exchange rate will be valued at fair value using procedures established and approved by the Board.
The Fund does not separately report the effect of changes in foreign exchange rates from changes in market prices on securities held. Such changes are included in net realized and unrealized gain or loss from investments in the Consolidated Statement of Operations.
Realized foreign exchange gains or losses arise from sales of foreign currencies, currency gains or losses realized between the trade and settlement dates on securities transactions and the difference between the recorded amounts of dividends, interest, and foreign withholding taxes and the U.S. dollar equivalent of the amounts actually received or paid. Net unrealized foreign exchange gains and losses arise from changes in foreign exchange rates on foreign denominated assets and liabilities other than investments in securities held at the end of the reporting period.
c. Derivative Financial Instruments
The Fund invested in derivatives in order to manage risk or gain exposure to various other investments or markets. Derivatives are financial contracts based on an underlying or notional amount, require no initial investment or an initial net investment that is smaller than would normally be required to have a similar response to changes in market factors, and require or permit net settlement. Derivatives contain various risks including the potential inability of the counterparty to fulfill their obligations under the terms of the contract, the potential for an illiquid secondary market, and/or the potential for market movements which expose the Fund to gains or losses in excess of the amounts shown in the Consolidated Statement of Assets and Liabilities. Realized gain and loss and unrealized appreciation and depreciation on these contracts for the period are included in the Consolidated Statement of Operations.
FRANKLIN TEMPLETON VARIABLE INSURANCE PRODUCTS TRUST
NOTES TO CONSOLIDATED FINANCIAL STATEMENTS
Franklin VolSmart Allocation VIP Fund (continued)
1. Organization and Significant Accounting Policies (continued)
c. Derivative Financial Instruments (continued)
Derivative counterparty credit risk is managed through a formal evaluation of the creditworthiness of all potential counterparties. The Fund attempts to reduce its exposure to counterparty credit risk on OTC derivatives, whenever possible, by entering into International Swaps and Derivatives Association (ISDA) master agreements with certain counterparties. These agreements contain various provisions, including but not limited to collateral requirements, events of default, or early termination. Termination events applicable to the counterparty include certain deteriorations in the credit quality of the counterparty. Termination events applicable to the Fund include failure of the Fund to maintain certain net asset levels and/or limit the decline in net assets over various periods of time. In the event of default or early termination, the ISDA master agreement gives the non-defaulting party the right to net and close-out all transactions traded, whether or not arising under the ISDA agreement, to one net amount payable by one counterparty to the other. However, absent an event of default or early termination, OTC derivative assets and liabilities are presented gross and not offset in the Consolidated Statement of Assets and Liabilities. Early termination by the counterparty may result in an immediate payment by the Fund of any net liability owed to that counterparty under the ISDA agreement. At December 31, 2015, the Fund had OTC derivatives in a net liability position for such contracts of $144,457.
Collateral requirements differ by type of derivative. Collateral or initial margin requirements are set by the broker or exchange clearing house for exchange traded and centrally cleared derivatives. Initial margin deposited is held at the exchange and can be in the form of cash and/or securities. For OTC derivatives traded under an ISDA master agreement, posting of collateral is required by either the Fund or the applicable counterparty if the total net exposure of all OTC derivatives with the applicable counterparty exceeds the minimum transfer amount, which typically ranges from $100,000 to $250,000, and can vary depending on the counterparty and the type of the agreement. Generally, collateral is determined at the close of Fund business each day and any additional collateral required due to changes in derivative values may be delivered by the Fund or the counterparty within a few business days. Collateral pledged and/or received by the Fund for OTC derivatives, if any, is held in
segregated accounts with the Fund’s custodian/counterparty broker and can be in the form of cash and/or securities. Unrestricted cash may be invested according to the Fund’s investment objectives. To the extent that the amounts due to the Fund from its counterparties are not subject to collateralization or are not fully collateralized, the Fund bears the risk of loss from counterparty non-performance.
The Fund entered into exchange traded financial futures contracts primarily to manage and/or gain exposure to equity price risk. A futures contract is an agreement between the Fund and a counterparty to buy or sell an asset for a specified price on a future date. Required initial margins are pledged by the Fund, and the daily change in fair value is accounted for as a variation margin payable or receivable in the Consolidated Statement of Assets and Liabilities.
The Fund entered into OTC forward exchange contracts primarily to manage and/or gain exposure to certain foreign currencies. A forward exchange contract is an agreement between the Fund and a counterparty to buy or sell a foreign currency at a specific exchange rate on a future date.
The Fund entered into OTC total return swap contracts primarily to manage and/or gain exposure to equity price risk of an underlying instrument such as a stock, bond, index or basket of securities or indices. A total return swap is an agreement between the Fund and a counterparty to exchange a return linked to an underlying instrument for a floating or fixed rate payment, both based upon a notional amount. Over the term of the contract, contractually required payments to be paid or received are accrued daily and recorded as unrealized appreciation or depreciation until the payments are made, at which time they are recognized as realized gain or loss.
See Note 7 regarding other derivative information.
d. Investments in MVGAF Holdings Corp. (MVGAF Subsidiary)
The Fund invested in certain financial instruments through its investment in the MVGAF Subsidiary. The MVGAF Subsidiary, a Cayman Islands exempted company with limited liability, was a wholly-owned subsidiary of the Fund, and was able to invest in certain financial instruments consistent with the investment objective of the Fund. On April 24, 2015, the Fund liquidated its position in the MVGAF Subsidiary. The financial statements have been consolidated and include the accounts of the Fund and the MVGAF Subsidiary for activity prior to the liquidation. All intercompany transactions and balances have been eliminated.
FRANKLIN TEMPLETON VARIABLE INSURANCE PRODUCTS TRUST
NOTES TO CONSOLIDATED FINANCIAL STATEMENTS
Franklin VolSmart Allocation VIP Fund (continued)
e. Income and Deferred Taxes
It is the Fund’s policy to qualify as a regulated investment company under the Internal Revenue Code. The Fund intends to distribute to shareholders substantially all of its taxable income and net realized gains to relieve it from federal income and if applicable, excise taxes. As a result, no provision for U.S. federal income taxes is required.
The Fund may be subject to foreign taxation related to income received, capital gains on the sale of securities and certain foreign currency transactions in the foreign jurisdictions in which it invests. Foreign taxes, if any, are recorded based on the tax regulations and rates that exist in the foreign markets in which the Fund invests. When a capital gain tax is determined to apply, the Fund records an estimated deferred tax liability in an amount that would be payable if the securities were disposed of on the valuation date.
The Fund may recognize an income tax liability related to its uncertain tax positions under U.S. GAAP when the uncertain tax position has a less than 50% probability that it will be sustained upon examination by the tax authorities based on its technical merits. As of December 31, 2015, the Fund has determined that no tax liability is required in its financial statements related to uncertain tax positions for any open tax years (or expected to be taken on future tax returns).
f. Security Transactions, Investment Income, Expenses and Distributions
Security transactions are accounted for on trade date. Realized gains and losses on security transactions are determined on a specific identification basis. Interest income and estimated expenses are accrued daily. Amortization of premium and accretion of discount on debt securities are included in interest income. Dividend income and realized gain distributions are recorded on the ex-dividend date except for certain dividends from foreign securities where the dividend rate is not available. In such cases, the dividend is recorded as soon as the information is received by the Fund. Distributions to shareholders are recorded on the ex-dividend date and are determined according to income tax regulations (tax basis). Distributable earnings determined on a tax basis may differ from earnings recorded in accordance with U.S. GAAP. These differences may be permanent or temporary. Permanent differences are reclassified among capital accounts to reflect their tax character. These reclassifications have no impact on net assets or the
results of operations. Temporary differences are not reclassified, as they may reverse in subsequent periods.
Common expenses incurred by the Trust are allocated among the Funds based on the ratio of net assets of each Fund to the combined net assets of the Trust. Fund specific expenses are charged directly to the fund that incurred the expense.
The Fund indirectly bears its proportionate share of expenses from the Underlying Funds and exchange traded funds. Since the Underlying Funds and exchange traded funds have varied expense levels and the Fund may own different proportions of the Underlying Funds and exchange traded funds at different times, the amount of expenses incurred indirectly by the Fund will vary.
Realized and unrealized gains and losses and net investment income, not including class specific expenses, are allocated daily to each class of shares based upon the relative proportion of net assets of each class. Differences in per share distributions, by class, are generally due to differences in class specific expenses.
g. Accounting Estimates
The preparation of financial statements in accordance with U.S. GAAP requires management to make estimates and assumptions that affect the reported amounts of assets and liabilities at the date of the financial statements and the amounts of income and expenses during the reporting period. Actual results could differ from those estimates.
h. Guarantees and Indemnifications
Under the Trust’s organizational documents, its officers and trustees are indemnified by the Trust against certain liabilities arising out of the performance of their duties to the Trust. Additionally, in the normal course of business, the Trust, on behalf of the Fund, enters into contracts with service providers that contain general indemnification clauses. The Trust’s maximum exposure under these arrangements is unknown as this would involve future claims that may be made against the Trust that have not yet occurred. Currently, the Trust expects the risk of loss to be remote.
FRANKLIN TEMPLETON VARIABLE INSURANCE PRODUCTS TRUST
NOTES TO CONSOLIDATED FINANCIAL STATEMENTS
Franklin VolSmart Allocation VIP Fund (continued)
2. Shares of Beneficial Interest
At December 31, 2015, there were an unlimited number of shares authorized (without par value). Transactions in the Fund’s shares were as follows:
| | | | | | | | | | | | | | | | | | |
| | | Year Ended December 31, | |
| | | 2015 | | | | | 2014 | |
| | | Shares | | | Amount | | | | | Shares | | | Amount | |
| | | | | |
| Class 2 Shares: | | | | | | | | | | | | | | | | | | |
Shares redeemed | | | (101,313 | ) | | $ | (1,003,000 | ) | | | | | — | | | $ | — | |
| | | | |
| Class 5 Shares: | | | | | | | | | | | | | | | | | | |
Shares sold | | | 5,758,678 | | | $ | 57,072,466 | | | | | | — | | | $ | — | |
Shares issued in reinvestment of distributions | | | 105,163 | | | | 1,023,367 | | | | | | — | | | | — | |
Shares redeemed | | | (1,196,476 | ) | | | (11,889,592 | ) | | | | | — | | | | — | |
| | | | |
Net increase (decrease) | | | 4,667,365 | | | $ | 46,206,241 | | | | | | — | | | $ | — | |
| | | | |
3. Transactions With Affiliates
Franklin Resources, Inc. is the holding company for various subsidiaries that together are referred to as Franklin Templeton Investments. Certain officers and trustees of the Fund are also officers and trustees of the following subsidiaries:
| | |
| Subsidiary | | Affiliation |
Franklin Advisers, Inc. (Advisers) | | Investment manager |
Franklin Advisory Services, LLC (Advisory Services) | | Investment manager |
K2/D&S Management Co., L.L.C. (K2 Advisors) | | Investment manager |
Franklin Alternative Strategies Advisors, LLC (FASA) | | Investment manager |
Franklin Templeton Investment Management Limited (FTIML) | | Investment manager |
Templeton Asset Management Ltd. (TAML) | | Investment manager |
Franklin Templeton Services, LLC (FT Services) | | Administrative manager |
Franklin Templeton Distributors, Inc. (Distributors) | | Principal underwriter |
Franklin Templeton Investor Services, LLC (Investor Services) | | Transfer agent |
Effective May 1, 2015, the Fund’s investment manager is Advisers. Prior to May 1, 2015, FASA was the Fund’s investment manager.
a. Management Fees
The Fund pays an investment management fee to Advisers of 0.80% per year of the average daily net assets of the Fund.
Prior to May 1, 2015, the Fund paid fees to FASA based on the average daily net assets of the Fund as follows:
| | |
| Annualized Fee Rate | | Net Assets |
1.000% | | Up to and including $1 billion |
0.980% | | Over $1 billion, up to and including $5 billion |
0.960% | | Over $5 billion, up to and including $10 billion |
0.940% | | Over $10 billion, up to and including $15 billion |
0.920% | | Over $15 billion, up to and including $20 billion |
0.900% | | In excess of $20 billion |
FRANKLIN TEMPLETON VARIABLE INSURANCE PRODUCTS TRUST
NOTES TO CONSOLIDATED FINANCIAL STATEMENTS
Franklin VolSmart Allocation VIP Fund (continued)
Effective May 1, 2015, under a subadvisory agreement, Advisory Services and K2 Advisors, affiliates of Advisers, provide subadvisory services to the Fund. The subadvisory fee is paid by Advisers based on the Fund’s average daily net assets, and is not an additional expense of the Fund. Prior to May 1, 2015, FTIML and TAML provided subadvisory services to the Fund.
b. Administrative Fees
Effective May 1, 2015, under an agreement with Advisers, FT Services provides administrative services to the Fund. The fee is paid by Advisers based on the Fund’s average daily net assets, and is not an additional expense of the Fund. Prior to May 1, 2015, the fees were paid by FASA.
c. Distribution Fees
The Board has adopted distribution plans for Class 2 and Class 5 shares pursuant to Rule 12b-1 under the 1940 Act. Under the Fund’s compensation distribution plans, the Fund pays Distributors for costs incurred in connection with the servicing, sale and distribution of the Fund’s shares up to 0.35%, and 0.15% per year of its average daily net assets of Class 2 and Class 5, respectively. The Board has agreed to limit the current rate to 0.25% per year for Class 2. The plan year, for purposes of monitoring compliance with the maximum annual plan rates, is February 1 through January 31. Prior to May 1, 2015, the rate for Class 5 shares was 0.10%.
d. Transfer Agent Fees
Investor Services, under terms of an agreement, performs shareholder servicing for the Fund and is not paid by the Fund for the services.
e. Investments in Underlying Funds
The Fund invests in the Underlying Funds which are managed by Advisers or an affiliate of Advisers. The Fund does not invest in the Underlying Funds for the purpose of exercising a controlling influence over the management or policies. Management fees paid by the Fund are waived on assets invested in the Underlying Funds, as noted in the Consolidated Statement of Operations, in an amount not to exceed the management and administrative fees paid directly or indirectly by the Underlying Funds.
Investments in Underlying Funds for the year ended December 31, 2015 were as follows:
| | | | | | | | | | | | | | | | | | | | | | | | | | | | | | | | |
| Underlying Funds | | Number
of Shares
Held at
Beginning
of Year | | | Gross
Additions | | | Gross
Reductions | | | Number
of Shares
Held at
End of
Year | | | Value at
End of
Year | | | Investment
Income | | | Realized
Gain
(Loss) | | | % of
Underlying
Fund Shares
Outstanding
Held at End
of Year | |
Franklin DynaTech Fund, Class R6 | | | — | | | | 226,685 | | | | (48,691 | ) | | | 177,994 | | | $ | 8,922,827 | | | $ | — | | | $ | 174,290 | a | | | 0.28% | |
Franklin Income Fund, Class R6 | | | — | | | | 3,926,154 | | | | (595,331 | ) | | | 3,330,823 | | | | 6,928,111 | | | | 123,279 | | | | (153,795 | ) | | | 0.01% | |
Franklin Low Duration Total Return Fund, Class R6 | | | — | | | | 977,411 | | | | (95,960 | ) | | | 881,451 | | | | 8,620,590 | | | | 90,774 | | | | (16,313 | ) | | | 0.35% | |
Franklin Strategic Income Fund, Class R6 | | | — | | | | 894,931 | | | | (98,739 | ) | | | 796,192 | | | | 7,293,115 | | | | 135,811 | | | | (66,336 | ) | | | 0.09% | |
Institutional Fiduciary Trust Money Market Portfolio | | | 74,160 | | | | 76,981,059 | | | | (75,472,560 | ) | | | 1,582,659 | | | | 1,582,659 | | | | — | | | | — | | | | 0.01% | |
| | | | | | | | | | | | | | | | | | | | | | | | |
Total | | | | | | | | | | | | | | | | | | $ | 33,347,302 | | | $ | 349,864 | | | $ | (62,154 | ) | | | | |
| | | | | | | | | | | | | | | | | | | | | | | | |
aIncludes realized gain distributions received.
f. Waiver and Expense Reimbursements
Advisers has contractually agreed in advance to waive or limit its fees and to assume as its own expense certain expenses otherwise payable by the Fund so that the expenses (excluding distribution fees, and acquired fund fees and expenses), for each class of the Fund do not exceed 0.65%, based on the average net assets of each class (other than certain non-routine expenses or costs, including those relating to litigation, indemnification, reorganizations, and liquidations) until April 30, 2016. Prior to May 1, 2015, the Fund’s contractual cap, for each class of the Fund, was 0.83%.
FRANKLIN TEMPLETON VARIABLE INSURANCE PRODUCTS TRUST
NOTES TO CONSOLIDATED FINANCIAL STATEMENTS
Franklin VolSmart Allocation VIP Fund (continued)
3. Transactions With Affiliates (continued)
g. Other Affiliated Transactions
At December 31, 2015, Advisers owned 13.69% of the Fund’s outstanding shares. Investment activities of this shareholder could have a material impact on the Fund.
4. Expense Offset Arrangement
The Fund has entered into an arrangement with its custodian whereby credits realized as a result of uninvested cash balances are used to reduce a portion of the Fund’s custodian expenses. During the year ended December 31, 2015, there were no credits earned.
5. Income Taxes
The tax character of distributions paid during the years ended December 31, 2015 and 2014, was as follows:
| | | | | | | | |
| | | 2015 | | | 2014 | |
Distributions paid from: | | | | | | | | |
Ordinary income | | $ | 283,180 | | | $ | 476,326 | |
Long term capital gain | | | 948,902 | | | | 6,674 | |
| | | | |
| | $ | 1,232,082 | | | $ | 483,000 | |
| | | | |
At December 31, 2015, the cost of investments, net unrealized appreciation (depreciation), undistributed ordinary income and undistributed long term capital gains for income tax purposes were as follows:
| | | | |
Cost of investments | | $ | 63,662,671 | |
| | | | |
Unrealized appreciation | | $ | 1,180,784 | |
Unrealized depreciation | | | (2,422,564 | ) |
| | | | |
Net unrealized appreciation (depreciation) | | $ | (1,241,780 | ) |
| | | | |
Undistributed ordinary income | | $ | 4,685 | |
Undistributed long term capital gains | | | 123,720 | |
| | | | |
Distributable earnings | | $ | 128,405 | |
| | | | |
Differences between income and/or capital gains as determined on a book basis and a tax basis are primarily due to differing treatments of foreign currency transactions, swaps, investments in the MVGAF Subsidiary and wash sales.
6. Investment Transactions
Purchases and sales of investments (excluding short term securities) for the year ended December 31, 2015, aggregated $68,602,761 and $27,154,199, respectively.
FRANKLIN TEMPLETON VARIABLE INSURANCE PRODUCTS TRUST
NOTES TO CONSOLIDATED FINANCIAL STATEMENTS
Franklin VolSmart Allocation VIP Fund (continued)
7. Other Derivative Information
At December 31, 2015, the Fund’s investments in derivative contracts are reflected in the Consolidated Statement of Assets and Liabilities as follows:
| | | | | | | | | | | | |
| | | Asset Derivatives | | | Liability Derivatives | |
Derivative Contracts
Not Accounted for
as Hedging Instruments | | Consolidated
Statement of Assets and
Liabilities Location | | Fair Value | | | Consolidated
Statement of Assets and
Liabilities Location | | Fair Value | |
Equity contracts | | Variation margin | | $ | — | | | Variation margin | | $ | 29,372 | a |
| | | | |
| | Unrealized appreciation on OTC swap contracts | | | — | | | Unrealized depreciation on OTC swap contracts | | | 144,457 | |
| | | | | | | | | | | | |
Totals | | | | $ | — | | | | | $ | 173,829 | |
| | | | | | | | | | | | |
aThis amount reflects the cumulative appreciation (depreciation) of futures contracts as reported in the Consolidated Statement of Investments. Only the variation margin receivable/payable at year end is separately reported within the Consolidated Statement of Assets and Liabilities. Prior variation margin movements were recorded to cash upon receipt or payment.
For the year ended December 31, 2015, the effect of derivative contracts in the Fund’s Consolidated Statement of Operations was as follows:
| | | | | | | | | | | | |
Derivative Contracts
Not Accounted for
as Hedging Instruments | | Consolidated
Statement of Operations
Locations | | Net Realized
Gain (Loss)
for the Year | | | Consolidated
Statement of Operations
Locations | | Net Change in
Unrealized
Appreciation
(Depreciation)
for the Year | |
| | Net realized gain (loss) from: | | | | | | Net change in unrealized appreciation (depreciation) on: | | | | |
Foreign exchange contracts | | Foreign currency transactions | | $ | 181,984 | a | | Translation of other assets and liabilities denominated in foreign currencies | | $ | (36,425 | )a |
| | | | |
Equity contracts | | Futures contracts | | | (1,124,702 | ) | | Futures contracts | | | (29,372 | ) |
| | | | |
| | Swap contracts | | | 361,467 | | | Swap contracts | | | (144,457 | ) |
| | | | | | | | | | | | |
Totals | | | | $ | (581,251 | ) | | | | $ | (210,254 | ) |
| | | | | | | | | | | | |
aForward exchange contracts are included in net realized gain (loss) from foreign currency transactions and net change in unrealized appreciation (depreciation) on translation of other assets and liabilities denominated in foreign currencies in the Consolidated Statement of Operations.
For the year ended December 31, 2015, the average month end fair value of derivatives represented 0.60% of average month end net assets. The average month end number of open derivative contracts for the year was 6.
See Note 1(c) regarding derivative financial instruments.
8. Credit Facility
The Fund, together with other U.S. registered and foreign investment funds (collectively, Borrowers), managed by Franklin Templeton Investments, are borrowers in a joint syndicated senior unsecured credit facility totaling $2 billion (Global Credit Facility) which matured on February 12, 2016. This Global Credit Facility provides a source of funds to the Borrowers for temporary and emergency purposes, including the ability to meet future unanticipated or unusually large redemption requests. Effective February 12, 2016, the Borrowers renewed the Global Credit Facility for a one year term, maturing February 10, 2017, for a total of $2 billion.
FRANKLIN TEMPLETON VARIABLE INSURANCE PRODUCTS TRUST
NOTES TO CONSOLIDATED FINANCIAL STATEMENTS
Franklin VolSmart Allocation VIP Fund (continued)
8. Credit Facility (continued)
Under the terms of the Global Credit Facility, the Fund shall, in addition to interest charged on any borrowings made by the Fund and other costs incurred by the Fund, pay its share of fees and expenses incurred in connection with the implementation and maintenance of the Global Credit Facility, based upon its relative share of the aggregate net assets of all of the Borrowers, including an annual commitment fee of 0.07% based upon the unused portion of the Global Credit Facility. Effective February 12, 2016, the annual commitment fee is 0.15%. These fees are reflected in other expenses in the Statement of Operations. During the year ended December 31, 2015, the Fund did not use the Global Credit Facility.
9. Fair Value Measurements
The Fund follows a fair value hierarchy that distinguishes between market data obtained from independent sources (observable inputs) and the Fund’s own market assumptions (unobservable inputs). These inputs are used in determining the value of the Fund’s financial instruments and are summarized in the following fair value hierarchy:
| | • | | Level 1 – quoted prices in active markets for identical financial instruments |
| | • | | Level 2 – other significant observable inputs (including quoted prices for similar financial instruments, interest rates, prepayment speed, credit risk, etc.) |
| | • | | Level 3 – significant unobservable inputs (including the Fund’s own assumptions in determining the fair value of financial instruments) |
The input levels are not necessarily an indication of the risk or liquidity associated with financial instruments at that level.
For movements between the levels within the fair value hierarchy, the Fund has adopted a policy of recognizing the transfers as of the date of the underlying event which caused the movement.
A summary of inputs used as of December 31, 2015, in valuing the Fund’s assets and liabilities carried at fair value, is as follows:
| | | | | | | | | | | | | | | | |
| | | Level 1 | | | Level 2 | | | Level 3 | | | Total | |
| | | | |
| Assets: | | | | | | | | | | | | | | | | |
Investments in Securities: | | | | | | | | | | | | | | | | |
Equity Investmentsa | | $ | 29,073,589 | | | $ | — | | | $ | — | | | $ | 29,073,589 | |
Investments in Underlying Fundsa | | | 31,764,643 | | | | — | | | | — | | | | 31,764,643 | |
Short Term Investments | | | 1,582,659 | | | | — | | | | — | | | | 1,582,659 | |
| | | | |
Total Investments in Securities | | $ | 62,420,891 | | | $ | — | | | $ | — | �� | | $ | 62,420,891 | |
| | | | |
| | | | |
| Liabilities: | | | | | | | | | | | | | | | | |
Other Financial Instruments | | | | | | | | | | | | | | | | |
Futures Contracts | | $ | 29,372 | | | $ | — | | | $ | — | | | $ | 29,372 | |
Swap Contracts | | | — | | | | 144,457 | | | | — | | | | 144,457 | |
| | | | |
Total Other Financial Instruments | | $ | 29,372 | | | $ | 144,457 | | | $ | — | | | $ | 173,829 | |
| | | | |
aFor detailed categories, see the accompanying Consolidated Statement of Investments.
10. Subsequent Events
The Fund has evaluated subsequent events through the issuance of the financial statements and determined that no events have occurred that require disclosure other than those already disclosed in the financial statements.
FRANKLIN TEMPLETON VARIABLE INSURANCE PRODUCTS TRUST
NOTES TO CONSOLIDATED FINANCIAL STATEMENTS
Franklin VolSmart Allocation VIP Fund (continued)
Abbreviations
| | | | | | |
| Counterparty | | Selected Portfolio |
| | | |
| BZWS | | Barclays Bank PLC | | ADR | | American Depositary Receipt |
| | | |
| | | | VIX | | Market Volatility Index |
FRANKLIN TEMPLETON VARIABLE INSURANCE PRODUCTS TRUST
Report of Independent Registered Public Accounting Firm
Franklin VolSmart Allocation VIP Fund
To the Board of Trustees and Shareholders of Franklin Templeton Variable Insurance Products Trust
In our opinion, the accompanying consolidated statement of assets and liabilities, including the consolidated statement of investments, and the related consolidated statements of operations and of changes in net assets and the consolidated financial highlights present fairly, in all material respects, the financial position of Franklin VolSmart Allocation VIP Fund and its subsidiary (collectively, the “Fund”) (formerly known as The Franklin Managed Volatility Global Allocation Fund) at December 31, 2015, the results of their consolidated operations for the year then ended, the changes in their consolidated net assets for each of the two years in the period then ended and the consolidated financial highlights for the periods presented, in conformity with accounting principles generally accepted in the United States of America. These consolidated financial statements and consolidated financial highlights (hereafter referred to as “financial statements”) are the responsibility of the Fund’s management. Our responsibility is to express an opinion on these financial statements based on our audit. We conducted our audit of these financial statements in accordance with the standards of the Public Company Accounting Oversight Board (United States). Those standards require that we plan and perform the audit to obtain reasonable assurance about whether the financial statements are free of material misstatement. An audit includes examining, on a test basis, evidence supporting the amounts and disclosures in the financial statements, assessing the accounting principles used and significant estimates made by management, and evaluating the overall financial statement presentation. We believe that our audit, which included confirmation of securities at December 31, 2015 by correspondence with the custodian, transfer agent and brokers, provides a reasonable basis for our opinion.
PricewaterhouseCoopers LLP
San Francisco, California
February 16, 2016
FRANKLIN TEMPLETON VARIABLE INSURANCE PRODUCTS TRUST
Tax Information (unaudited)
Franklin VolSmart Allocation VIP Fund
Under Section 852(b)(3)(C) of the Internal Revenue Code (Code), the Fund hereby reports the maximum amount allowable but no less than $948,902 as a long term capital gain dividend for the fiscal year ended December 31, 2015.
Under Section 854(b)(1)(A) of the Code, the Fund hereby reports 87.76% of the ordinary income dividends as income qualifying for the dividends received deduction for the fiscal year ended December 31, 2015.
FRANKLIN TEMPLETON VARIABLE INSURANCE PRODUCTS TRUST
Index Descriptions
The indexes are unmanaged and include reinvestment of any income or distributions.
For Russell Indexes: Russell Investment Group is the source and owner of the trademarks, service marks and copyrights related to the Russell Indexes. Russell® is a trademark of Russell Investment Group.
See www.franklintempletondatasources.com for additional data provider information.
Barclays 1-3 Month U.S. Treasury Bill Index includes all publicly issued zero-coupon U.S. Treasury bills that have a remaining maturity between one month and three months and are investment-grade rated, U.S. dollar denominated, fixed rate and nonconvertible.
Barclays U.S. Aggregate Bond Index is a market capitalization-weighted index representing the U.S. investment-grade, fixed-rate, taxable bond market with index components for government and corporate, mortgage pass-through and asset-backed securities. All issues included are SEC registered, taxable, dollar denominated and nonconvertible, must have at least one year to final maturity and must be rated investment grade (Baa3/BBB-/BBB- or higher) using the middle rating of Moody’s, Standard & Poor’s and Fitch, respectively.
Barclays U.S. Government Index: Intermediate Component is the intermediate component of the Barclays U.S. Government Index, which includes public obligations of the U.S. Treasury with at least one year to final maturity and publicly issued debt of U.S. government agencies, quasi-federal corporations, and corporate or foreign debt guaranteed by the U.S. government.
Bloomberg Commodity Index comprises exchange-traded futures on physical commodities, which are weighted to account for economic significance and market liquidity.
Citigroup World Government Bond Index is a market capitalization-weighted index consisting of investment-grade world government bond markets.
Consumer Price Index (CPI) is a commonly used measure of the inflation rate.
Credit Suisse (CS) High Yield Index is designed to mirror the investable universe of the U.S. dollar-denominated high yield debt market.
FTSE® EPRA®/NAREIT® Developed Index is a free float-adjusted index designed to measure the performance of publicly traded real estate securities in the North American, European and Asian real estate markets.
J.P. Morgan (JPM) Global Government Bond Index (GGBI) tracks total returns for liquid, fixed-rate, domestic government bonds with maturities greater than one year issued by developed countries globally.
Lipper Multi-Sector Income Funds Classification Average is calculated by averaging the total returns of all funds within the Lipper Multi-Sector Income Funds classification in the Lipper Open-End underlying funds universe. Lipper Multi-Sector Income Funds are defined as funds that seek current income by allocating assets among different fixed income securities sectors (not primarily in one sector except for defensive purposes), including U.S. and foreign governments, with a significant portion rated below investment grade. For the 12-month period ended 12/31/15, there were 286 funds in this category. Lipper calculations do not include contract fees, expenses or sales charges, and may have been different if such charges had been considered.
Lipper VIP Equity Income Funds Classification Average is an equally weighted average calculation of performance figures for all funds within the Lipper Equity Income Funds classification in the Lipper VIP underlying funds universe. Lipper Equity Income Funds seek relatively high current income and growth of income through investing 60% or more of their portfolios in equities. For the 12-month period ended 12/31/15, there were 71 funds in this category. Lipper calculations do not include contract fees, expenses or sales charges, and may have been different if such charges had been considered.
Lipper VIP General U.S. Government Funds Classification Average is an equally weighted average calculation of performance figures for all funds within the Lipper General U.S. Government Funds classification in the Lipper VIP underlying funds universe. Lipper General U.S. Government Funds invest primarily in U.S. government and agency issues. For the 12-month period ended 12/31/15, there were 55 funds in this category. Lipper calculations do not include contract fees, expenses or sales charges, and may have been different if such charges had been considered.
FRANKLIN TEMPLETON VARIABLE INSURANCE PRODUCTS TRUST
INDEX DESCRIPTIONS
Lipper VIP High Yield Funds Classification Average is an equally weighted average calculation of performance figures for all funds within the Lipper High Yield Funds Classification in the Lipper VIP underlying funds universe. Lipper High Yield Funds aim at high (relative) current yield from fixed income securities, have no quality or maturity restrictions, and tend to invest in lower grade debt issues. For the 12-month period ended 12/31/15, there were 111 funds in this category. Lipper calculations do not include contract fees, expenses or sales charges, and may have been different if such charges had been considered.
MSCI All Country World Index (ACWI) is a free float-adjusted, market capitalization-weighted index designed to measure equity market performance in global developed and emerging markets.
MSCI Emerging Markets (EM) Index is a free float-adjusted, market capitalization-weighted index designed to measure equity market performance in global emerging markets.
MSCI Europe, Australasia, Far East (EAFE) Index is a free float-adjusted, market capitalization-weighted index designed to measure equity market performance in global developed markets excluding the U.S. and Canada.
MSCI World Index is a free float-adjusted, market capitalization-weighted index designed to measure equity market performance in global developed markets.
Russell 1000® Growth Index is market capitalization weighted and measures performance of those Russell 1000® Index companies with higher price-to-book ratios and higher forecasted growth values.
Russell 1000® Index is market capitalization weighted and measures performance of the largest companies in the Russell 3000® Index, which represents the majority of the U.S. market’s total capitalization.
Russell 2500TM Index is market capitalization weighted and measures performance of the smallest companies in the Russell 3000® Index, which represent a modest amount of the Russell 3000® Index’s total market capitalization.
Russell 2500 TM Value Index is market capitalization weighted and measures performance of those Russell 2500 TM Index companies with lower price-to-book ratios and lower forecasted growth values.
Russell 3000® Growth Index is market capitalization weighted and measures performance of those Russell 3000® Index companies with higher price-to-book ratios and higher forecasted growth values.
Russell 3000® Index is market capitalization weighted and measures performance of the largest U.S. companies based on total market capitalization and represents the majority of the investable U.S. equity market.
Russell Midcap® Growth Index is market capitalization weighted and measures performance of those Russell Midcap® Index companies with higher price-to-book ratios and higher forecasted growth values.
Russell Midcap® Index is market capitalization weighted and measures performance of the smallest companies in the Russell 1000® Index, which represent a modest amount of the Russell 1000® Index’s total market capitalization.
Standard & Poor’s® 500 Index (S&P 500®) is a market capitalization-weighted index of 500 stocks designed to measure total U.S. equity market performance.
Standard & Poor’s®/International Finance Corporation Investable (S&P/IFCI) Composite Index is a free float-adjusted, market capitalization-weighted index designed to measure equity performance in global emerging markets.
Board Members and Officers
The name, year of birth and address of the officers and board members, as well as their affiliations, positions held with the Trust, principal occupation during at least the past five years and number of portfolios overseen in the Franklin Templeton Investments fund complex, are shown below. Generally, each board member serves until that person’s successor is elected and qualified.
Independent Board Members
| | | | | | | | |
Name, Year of Birth
and Address | | Position | | Length of
Time Served | | Number of Portfolios in
Fund Complex Overseen
by Board Member* | | Other Directorships Held During
at Least the Past 5 Years |
| | | | |
Harris J. Ashton (1932) One Franklin Parkway San Mateo, CA 94403-1906 | | Trustee | | Since 1988 | | 147 | | Bar-S Foods (meat packing company) (1981-2010). |
|
| Principal Occupation During at Least the Past 5 Years: |
| Director of various companies; and formerly, Director, RBC Holdings, Inc. (bank holding company) (until 2002); and President, Chief Executive Officer and Chairman of the Board, General Host Corporation (nursery and craft centers) (until 1998). |
| | | | |
Mary C. Choksi (1950) One Franklin Parkway San Mateo, CA 94403-1906 | | Trustee | | Since 2014 | | 123 | | Avis Budget Group Inc. (car rental) (2007-present), Omnicom Group Inc. (advertising and marketing communications services) (2011-present) and H.J. Heinz Company (processed foods and allied products) (1998-2006). |
|
| Principal Occupation During at Least the Past 5 Years: |
| Senior Advisor, Strategic Investment Group (investment management group) (August 2015-present); director of various companies; and formerly, Founding Partner and Senior Managing Director, Strategic Investment Group (1987-2015); Founding Partner and Managing Director, Emerging Markets Management LLC (investment management firm) (1987-2011); and Loan Officer/Senior Loan Officer/Senior Pension Investment Officer, World Bank Group (international financial institution) (1977-1987). |
| | | | |
Edith E. Holiday (1952) One Franklin Parkway San Mateo, CA 94403-1906 | | Trustee | | Since 2005 | | 147 | | Hess Corporation (exploration and refining of oil and gas) (1993-present), Canadian National Railway (railroad) (2001-present), White Mountains Insurance Group, Ltd. (holding company) (2004-present), RTI International Metals, Inc. (manufacture and distribution of titanium) (1999-2015) and H.J. Heinz Company (processed foods and allied products) (1994-2013). |
|
| Principal Occupation During at Least the Past 5 Years: |
| Director or Trustee of various companies and trusts; and formerly, Assistant to the President of the United States and Secretary of the Cabinet (1990-1993); General Counsel to the United States Treasury Department (1989-1990); and Counselor to the Secretary and Assistant Secretary for Public Affairs and Public Liaison-United States Treasury Department (1988-1989). |
| | | | |
J. Michael Luttig (1954) One Franklin Parkway San Mateo, CA 94403-1906 | | Trustee | | Since 2009 | | 147 | | Boeing Capital Corporation (aircraft financing) (2006-2013). |
|
| Principal Occupation During at Least the Past 5 Years: |
| Executive Vice President, General Counsel and member of the Executive Council, The Boeing Company (aerospace company); and formerly, Federal Appeals Court Judge, U.S. Court of Appeals for the Fourth Circuit (1991-2006). |
Independent Board Members (continued)
| | | | | | | | |
Name, Year of Birth
and Address | | Position | | Length of
Time Served | | Number of Portfolios in
Fund Complex Overseen
by Board Member* | | Other Directorships Held During
at Least the Past 5 Years |
| | | | |
Frank A. Olson (1932) One Franklin Parkway
San Mateo, CA 94403-1906 | | Trustee | | Since 2005 | | 147 | | Hess Corporation (exploration and refining of oil and gas) (1998-2013). |
|
| Principal Occupation During at Least the Past 5 Years: |
| Director of various companies; and formerly, Chairman of the Board, The Hertz Corporation (car rental) (1980-2000) and Chief Executive Officer (1977-1999); and Chairman of the Board, President and Chief Executive Officer, UAL Corporation (airlines) (June – December 1987). |
| | | | |
Larry D. Thompson (1945) One Franklin Parkway San Mateo, CA 94403-1906 | | Trustee | | Since 2007 | | 147 | | The Southern Company (energy company) (2014-present; previously 2010-2012), Graham Holdings Company (education and media organization) (2011-present) and Cbeyond, Inc. (business communications provider) (2010-2012). |
|
| Principal Occupation During at Least the Past 5 Years: |
| Director of various companies; John A. Sibley Professor of Corporate and Business Law, University of Georgia School of Law (January 2015; previously 2011-2012); and formerly, Executive Vice President – Government Affairs, General Counsel and Corporate Secretary, PepsiCo, Inc. (consumer products) (2012-2014); Senior Vice President – Government Affairs, General Counsel and Secretary, PepsiCo, Inc. (2004-2011); Senior Fellow of The Brookings Institution (2003-2004); Visiting Professor, University of Georgia School of Law (2004); and Deputy Attorney General, U.S. Department of Justice (2001-2003). |
| | | | |
John B. Wilson (1959)
One Franklin Parkway San Mateo, CA 94403-1906 | | Lead Independent Trustee | | Trustee since 2007 and Lead Independent Trustee since 2008 | | 123 | | None |
|
| Principal Occupation During at Least the Past 5 Years: |
| President, Staples Europe (office supplies) (2012-present); President and Founder, Hyannis Port Capital, Inc. (real estate and private equity investing); serves on private and non-profit boards; and formerly, Chief Operating Officer and Executive Vice President, Gap, Inc. (retail) (1996-2000); Chief Financial Officer and Executive Vice President – Finance and Strategy, Staples, Inc. (1992-1996); Senior Vice President – Corporate Planning, Northwest Airlines, Inc. (airlines) (1990-1992); and Vice President and Partner, Bain & Company (consulting firm) (1986-1990). |
Interested Board Members and Officers
| | | | | | | | |
Name, Year of Birth
and Address | | Position | | Length of
Time Served | | Number of Portfolios in
Fund Complex Overseen
by Board Member* | | Other Directorships Held During
at Least the Past 5 Years |
| | | | |
**Gregory E. Johnson (1961)
One Franklin Parkway
San Mateo, CA 94403-1906 | | Trustee | | Since 2013 | | 164 | | None |
|
| Principal Occupation During at Least the Past 5 Years: |
| Chairman of the Board, Member – Office of the Chairman, Director and Chief Executive Officer, Franklin Resources, Inc.; officer and/or director or trustee, as the case may be, of some of the other subsidiaries of Franklin Resources, Inc. and of 44 of the investment companies in Franklin Templeton Investments; Vice Chairman, Investment Company Institute; and formerly, President, Franklin Resources, Inc. (1994-2015). |
Interested Board Members and Officers (continued)
| | | | | | | | |
Name, Year of Birth
and Address | | Position | | Length of
Time Served | | Number of Portfolios in
Fund Complex Overseen
by Board Member* | | Other Directorships Held During
at Least the Past 5 Years |
| | | | |
**Rupert H. Johnson, Jr. (1940) One Franklin Parkway San Mateo, CA 94403-1906 | | Chairman of the Board and Trustee | | Chairman of the Board since 2013 and Trustee since 1988 | | 147 | | None |
|
| Principal Occupation During at Least the Past 5 Years: |
| Vice Chairman, Member – Office of the Chairman and Director, Franklin Resources, Inc.; Director, Franklin Advisers, Inc.; Senior Vice President, Franklin Advisory Services, LLC; and officer and/or director or trustee, as the case may be, of some of the other subsidiaries of Franklin Resources, Inc. and of 42 of the investment companies in Franklin Templeton Investments. |
| | | | |
Alison E. Baur (1964) One Franklin Parkway San Mateo, CA 94403-1906 | | Vice President | | Since 2012 | | Not Applicable | | Not Applicable |
|
| Principal Occupation During at Least the Past 5 Years: |
| Deputy General Counsel, Franklin Templeton Investments; and officer of some of the other subsidiaries of Franklin Resources, Inc. and of 44 of the investment companies in Franklin Templeton Investments. |
| | | | |
Laura F. Fergerson (1962) One Franklin Parkway San Mateo, CA 94403-1906 | | Chief Executive Officer – Finance and Administration | | Since 2009 | | Not Applicable | | Not Applicable |
|
| Principal Occupation During at Least the Past 5 Years: |
| Senior Vice President, Franklin Templeton Services, LLC; Vice President, Franklin Advisers, Inc. and Franklin Templeton Institutional, LLC; and officer of 44 of the investment companies in Franklin Templeton Investments. |
| | | | |
Gaston Gardey (1967) One Franklin Parkway San Mateo, CA 94403-1906 | | Treasurer, Chief Financial Officer and Chief Accounting Officer | | Since 2009 | | Not Applicable | | Not Applicable |
|
| Principal Occupation During at Least the Past 5 Years: |
| Treasurer, U.S. Fund Administration & Reporting, Franklin Templeton Investments; and officer of 27 of the investment companies in Franklin Templeton Investments. |
| | | | |
Aliya S. Gordon (1973) One Franklin Parkway San Mateo, CA 94403-1906 | | Vice President | | Since 2009 | | Not Applicable | | Not Applicable |
|
| Principal Occupation During at Least the Past 5 Years: |
| Senior Associate General Counsel, Franklin Templeton Investments; and officer of 44 of the investment companies in Franklin Templeton Investments. |
| | | | |
Steven J. Gray (1955) One Franklin Parkway San Mateo, CA 94403-1906 | | Vice President | | Since 2009 | | Not Applicable | | Not Applicable |
|
| Principal Occupation During at Least the Past 5 Years: |
| Senior Associate General Counsel, Franklin Templeton Investments; Vice President, Franklin Templeton Distributors, Inc. and Franklin Alternative Strategies Advisers, LLC; and officer of 44 of the investment companies in Franklin Templeton Investments. |
Interested Board Members and Officers (continued)
| | | | | | | | |
Name, Year of Birth
and Address | | Position | | Length of
Time Served | | Number of Portfolios in
Fund Complex Overseen
by Board Member* | | Other Directorships Held During
at Least the Past 5 Years |
| | | | |
Selena L. Holmes (1965) 100 Fountain Parkway St. Petersburg, FL 33716-1205 | | Vice President – AML Compliance | | Since 2012 | | Not Applicable | | Not Applicable |
|
| Principal Occupation During at Least the Past 5 Years: |
| Director, Global Compliance Monitoring; Chief Compliance Officer, Franklin Alternative Strategies Advisers, LLC; Vice President, Franklin Templeton Companies, LLC; and officer of 44 of the investment companies in Franklin Templeton Investments. |
| | | | |
Edward B. Jamieson (1948) One Franklin Parkway San Mateo, CA 94403-1906 | | President and Chief Executive Officer – Investment Management | | Since 2010 | | Not Applicable | | Not Applicable |
|
| Principal Occupation During at Least the Past 5 Years: |
| President, Chief Investment Officer and Director, Franklin Advisers, Inc.; Executive Vice President, Franklin Templeton Institutional, LLC; and officer and/or trustee, as the case may be, of some of the other subsidiaries of Franklin Resources, Inc. and of 10 of the investment companies in Franklin Templeton Investments. |
| | | | |
Kimberly H. Novotny (1972)
300 S.E. 2nd Street
Fort Lauderdale, FL 33301-1923 | | Vice President | | Since 2013 | | Not Applicable | | Not Applicable |
|
| Principal Occupation During at Least the Past 5 Years: |
| Associate General Counsel, Franklin Templeton Investments; Vice President, Fiduciary Trust International of the South and Templeton Investment Counsel, LLC; Assistant Secretary, Franklin Resources, Inc.; and officer of 44 of the investment companies in Franklin Templeton Investments. |
| | | | |
Robert C. Rosselot (1960)
300 S.E. 2nd Street
Fort Lauderdale, FL 33301-1923 | | Chief Compliance Officer | | Since 2013 | | Not Applicable | | Not Applicable |
|
| Principal Occupation During at Least the Past 5 Years: |
| Director, Global Compliance, Franklin Templeton Investments; Vice President, Franklin Templeton Companies, LLC; officer of 44 of the investment companies in Franklin Templeton Investments; and formerly, Senior Associate General Counsel, Franklin Templeton Investments (2007-2013); and Secretary and Vice President, Templeton Group of Funds (2004-2013). |
| | | | |
Karen L. Skidmore (1952)
One Franklin Parkway
San Mateo, CA 94403-1906 | | Vice President and Secretary | | Since 2006 | | Not Applicable | | Not Applicable |
|
| Principal Occupation During at Least the Past 5 Years: |
| Senior Associate General Counsel, Franklin Templeton Investments; and officer of 44 of the investment companies in Franklin Templeton Investments. |
| | | | |
Navid Tofigh (1972) One Franklin Parkway San Mateo, CA 94403-1906 | | Vice President | | Since November 2015 | | Not Applicable | | Not Applicable |
|
| Principal Occupation During at Least the Past 5 Years: |
| Associate General Counsel, Franklin Templeton Investments; and officer of 44 of the investment companies in Franklin Templeton Investments. |
Interested Board Members and Officers (continued)
| | | | | | | | |
Name, Year of Birth
and Address | | Position | | Length of
Time Served | | Number of Portfolios in
Fund Complex Overseen
by Board Member* | | Other Directorships Held During
at Least the Past 5 Years |
| | | | |
Craig S. Tyle (1960) One Franklin Parkway San Mateo, CA 94403-1906 | | Vice President | | Since 2005 | | Not Applicable | | Not Applicable |
|
| Principal Occupation During at Least the Past 5 Years: |
| General Counsel and Executive Vice President, Franklin Resources, Inc.; and officer of some of the other subsidiaries of Franklin Resources, Inc. and of 44 of the investment companies in Franklin Templeton Investments. |
| | | | |
Lori A. Weber (1964) 300 S.E. 2nd Street Fort Lauderdale, FL 33301-1923 | | Vice President | | Since 2011 | | Not Applicable | | Not Applicable |
|
| Principal Occupation During at Least the Past 5 Years: |
| Senior Associate General Counsel, Franklin Templeton Investments; Assistant Secretary, Franklin Resources, Inc.; Vice President and Secretary, Templeton Investment Counsel, LLC; and officer of 44 of the investment companies in Franklin Templeton Investments. |
*We base the number of portfolios on each separate series of the U.S. registered investment companies within the Franklin Templeton Investments fund complex. These portfolios have a common investment manager or affiliated investment managers.
**Gregory E. Johnson is considered to be an interested person of the Fund under the federal securities laws due to his position as an officer and director of Franklin Resources, Inc. (Resources), which is the parent company of the Fund’s investment manager and distributor. Rupert H. Johnson, Jr. is considered to be an interested person of the Fund under the federal securities laws due to his position as officer and director and major shareholder of Resources.
Note 1: Rupert H. Johnson, Jr. is the uncle of Gregory E. Johnson.
Note 2: Officer information is current as of the date of this report. It is possible that after this date, information about officers may change.
Note 3: Effective April 30, 2015, Sam Ginn ceased to be a trustee of the Trust.
The Sarbanes-Oxley Act of 2002 and Rules adopted by the Securities and Exchange Commission require the Fund to disclose whether the Fund’s Audit Committee includes at least one member who is an audit committee financial expert within the meaning of such Act and Rules. The Fund’s Board has determined that there is at least one such financial expert on the Audit Committee and has designated John B. Wilson as its audit committee financial expert. The Board believes that Mr. Wilson qualifies as such an expert in view of his extensive business background and experience, including service as chief financial officer of Staples, Inc. from 1992 to 1996. Mr. Wilson has been a Member and Chairman of the Fund’s Audit Committee since 2007. As a result of such background and experience, the Board believes that Mr. Wilson has acquired an understanding of generally accepted accounting principles and financial statements, the general application of such principles in connection with the accounting estimates, accruals and reserves, and analyzing and evaluating financial statements that present a breadth and level of complexity of accounting issues generally comparable to those of the Fund, as well as an understanding of internal controls and procedures for financial reporting and an understanding of audit committee functions. Mr. Wilson is an independent Board member as that term is defined under the relevant Securities and Exchange Commission Rules and Releases.
The Statement of Additional Information (SAI) includes additional information about the board members and is available, without charge, upon request. Shareholders may call (800) 321-8563 or their insurance companies to request the SAI.
FRANKLIN TEMPLETON VARIABLE INSURANCE PRODUCTS TRUST
Shareholder Information
Proxy Voting Policies and Procedures
The Trust’s investment manager has established Proxy Voting Policies and Procedures (Policies) that the Trust uses to determine how to vote proxies relating to portfolio securities. Shareholders may view the Trust’s complete Policies online at franklintempleton.com. Alternatively, shareholders may request copies of the Policies free of charge by calling the Proxy Group collect at (954) 527-7678 or by sending a written request to: Franklin Templeton Companies, LLC, 300 S.E. 2nd Street, Fort Lauderdale, FL 33301, Attention: Proxy Group. Copies of the Trust’s proxy voting records are also made available online at franklintempleton.com and posted on the U.S. Securities and Exchange Commission’s website at sec.gov and reflect the most recent 12-month period ended June 30.
Quarterly Statement of Investments
The Trust files a complete statement of investments with the U.S. Securities and Exchange Commission for the first and third quarters for each fiscal year on Form N-Q. Shareholders may view the filed Form N-Q by visiting the Commission’s website at sec.gov. The filed form may also be viewed and copied at the Commission’s Public Reference Room in Washington, DC. Information regarding the operations of the Public Reference Room may be obtained by calling (800) SEC-0330.
Annual Report
Franklin Templeton
Variable Insurance Products Trust
Investment Managers
Franklin Advisers, Inc.
Franklin Advisory Services, LLC
Franklin Mutual Advisers, LLC
Franklin Templeton Institutional, LLC
Templeton Asset Management Ltd.
Templeton Global Advisors Limited
Templeton Investment Counsel, LLC
Fund Administrator
Franklin Templeton Services, LLC
Distributor
Franklin Templeton Distributors, Inc.
Franklin Templeton Variable Insurance Products Trust (FTVIP) shares are not offered to the public; they are offered and sold only to:
(1) insurance company separate accounts (Separate Account) to serve as the underlying investment vehicle for variable contracts;
(2) certain qualified plans; and (3) other mutual funds (funds of funds).
Authorized for distribution to investors in Separate Accounts only when accompanied or preceded by the current prospectus for the applicable contract, which includes the Separate Account and the FTVIP prospectuses. Investors should carefully consider a fund’s investment goals, risks, charges and expenses before investing. The prospectus contains this and other information; please read it carefully before investing.
To help ensure we provide you with quality service, all calls to and from our service areas are monitored and/or recorded.
| | |
| ©2016 Franklin Templeton Investments. All rights reserved. | | VIP5 A 02/16 |
| (a) | The Registrant has adopted a code of ethics that applies to its principal executive officers and principal financial and accounting officer. |
| (f) | Pursuant to Item 12(a)(1), the Registrant is attaching as an exhibit a copy of its code of ethics that applies to its principal executive officers and principal financial and accounting officer. |
| Item 3. | Audit Committee Financial Expert. |
| (a) (1) | The Registrant has an audit committee financial expert serving on its audit committee. |
| (2) | The audit committee financial expert is John B. Wilson and he is “independent” as defined under the relevant Securities and Exchange Commission Rules and Releases. |
| Item 4. | Principal Accountant Fees and Services. |
(a) Audit Fees
The aggregate fees paid to the principal accountant for professional services rendered by the principal accountant for the audit of the registrant’s annual financial statements or for services that are normally provided by the principal accountant in connection with statutory and regulatory filings or engagements were $870,366 for the fiscal year ended December 31, 2015 and $903,163 for the fiscal year ended December 31, 2014.
(b) Audit-Related Fees
There were no fees paid to the principal accountant for assurance and related services rendered by the principal accountant to the registrant that are reasonably related to the performance of the audit of the registrant’s financial statements and are not reported under paragraph (a) of Item 4.
There were no fees paid to the principal accountant for assurance and related services rendered by the principal accountant to the registrant’s investment adviser and any entity controlling, controlled by or under common control with the investment adviser that provides ongoing services to the registrant that are reasonably related to the performance of the audit of their financial statements.
(c) Tax Fees
There were no fees paid to the principal accountant for professional services rendered by the principal accountant to the registrant for tax compliance, tax advice and tax planning.
There were no fees paid to the principal accountant for professional services rendered by the principal accountant to the registrant’s
investment adviser and any entity controlling, controlled by or under common control with the investment adviser that provides ongoing services to the registrant for tax compliance, tax advice and tax planning.
The aggregate fees paid to the principal accountant for products and services rendered by the principal accountant to the registrant not reported in paragraphs (a)-(c) of Item 4 were $0 for the fiscal year ended December 31, 2015 and $9,566 for the fiscal year ended December 31, 2014. The services for which these fees were paid include review of materials provided to the fund Board in connection with the investment management contract renewal process.
The aggregate fees paid to the principal accountant for products and services rendered by the principal accountant to the registrant’s investment adviser and any entity controlling, controlled by or under common control with the investment adviser that provides ongoing services to the registrant other than services reported in paragraphs (a)-(c) of Item 4 were $595,846 for the fiscal year ended December 31, 2015 and $195,213 for the fiscal year ended December 31, 2014. The services for which these fees were paid include preparation and review of materials provided to the fund Board in connection with the investment management contract renewal process and derivatives assessment, certifying assets under management, and XBRL tagging on financial statements. Other services include compliance examination for Investment Advisor Act rule 204-2 and 206-4(2) and review of system processes related to fixed income securities.
(e) (1) The registrant’s audit committee is directly responsible for approving the services to be provided by the auditors, including:
(i) pre-approval of all audit and audit related services;
(ii) pre-approval of all non-audit related services to be provided to the Fund by the auditors;
(iii) pre-approval of all non-audit related services to be provided to the registrant by the auditors to the registrant’s investment adviser or to any entity that controls, is controlled by or is under common control with the registrant’s investment adviser and that provides ongoing services to the registrant where the non-audit services relate directly to the operations or financial reporting of the registrant; and
(iv) establishment by the audit committee, if deemed necessary or appropriate, as an alternative to committee pre-approval of services to be provided by the auditors, as required by paragraphs (ii) and (iii) above, of policies and procedures to permit such services to be pre-approved by other means, such as through establishment of guidelines or by action of a designated member or members of the committee; provided the policies and procedures are detailed as to the particular service and the committee is informed of each service and such policies and procedures do not include delegation of audit committee responsibilities, as contemplated under the Securities Exchange Act of 1934, to management; subject, in the case of (ii) through (iv), to any waivers, exceptions or exemptions that may be available under applicable law or rules.
(e) (2) None of the services provided to the registrant described in paragraphs (b)-(d) of Item 4 were approved by the audit committee pursuant to paragraph (c)(7)(i)(C) of Rule 2-01 of regulation S-X.
| (f) | No disclosures are required by this Item 4(f). |
(g) The aggregate non-audit fees paid to the principal accountant for services rendered by the principal accountant to the registrant and the registrant’s investment adviser and any entity controlling, controlled by or under common control with the investment adviser that provides ongoing services to the registrant were $595,846 for the fiscal year ended December 31, 2015 and $204,779 for the fiscal year ended December 31, 2014.
(h) The registrant’s audit committee of the board has considered whether the provision of non-audit services that were rendered to the registrant’s investment adviser (not including any sub-adviser whose role is primarily portfolio management and is subcontracted with or overseen by another investment adviser), and any entity controlling, controlled by, or under common control with the investment adviser that provides ongoing services to the registrant that were not pre-approved pursuant to paragraph (c)(7)(ii) of Rule 2-01 of Regulation S-X is compatible with maintaining the principal accountant’s independence.
| Item 5. | Audit Committee of Listed Registrants. N/A |
| Item 6. | Schedule of Investments. N/A |
| Item 7. | Disclosure of Proxy Voting Policies and Procedures for Closed-End Management Investment Companies. N/A |
| Item 8. | Portfolio Managers of Closed-End Management Investment Companies. N/A |
| Item 9. | Purchases of Equity Securities by Closed-End Management Investment Company and Affiliated Purchasers. N/A |
| Item 10. | Submission of Matters to a Vote of Security Holders. |
There have been no changes to the procedures by which shareholders may recommend nominees to the Registrant’s Board of Trustees that would require disclosure herein.
| Item 11. | Controls and Procedures. |
(a) Evaluation of Disclosure Controls and Procedures. The Registrant maintains disclosure controls and procedures that are designed to ensure that information required to be disclosed in the Registrant’s filings under the Securities Exchange Act of 1934 and the Investment Company Act of 1940 is recorded, processed, summarized and reported within the periods specified in the rules and forms of the Securities and Exchange Commission. Such information is accumulated and communicated to the Registrant’s management, including its principal executive officer and principal financial officer, as appropriate, to allow timely decisions regarding required disclosure. The Registrant’s management, including the principal executive officer and the principal financial officer, recognizes that any set of controls and procedures, no matter how well designed and operated, can provide only reasonable assurance of achieving the desired control objectives.
Within 90 days prior to the filing date of this Shareholder Report on Form N-CSR, the Registrant had carried out an evaluation, under the supervision and with the participation of the Registrant’s management, including the Registrant’s principal executive officer and the Registrant’s principal financial officer, of the effectiveness of the design and operation of the Registrant’s disclosure controls and procedures. Based on such evaluation, the Registrant’s principal executive officer and principal financial officer concluded that the Registrant’s disclosure controls and procedures are effective.
(b) Changes in Internal Controls. There have been no changes in the Registrant’s internal controls or in other factors that could materially affect the internal controls over financial reporting subsequent to the date of their evaluation in connection with the preparation of this Shareholder Report on Form N-CSR.
Item 12. Exhibits.
(a)(1) Code of Ethics
(a)(2) Certifications pursuant to Section 302 of the Sarbanes-Oxley Act of 2002 of Laura F. Fergerson, Chief Executive Officer - Finance and Administration, and Gaston Gardey, Chief Financial Officer and Chief Accounting Officer
(b) Certifications pursuant to Section 906 of the Sarbanes-Oxley Act of 2002 of Laura F. Fergerson, Chief Executive Officer - Finance and Administration, and Gaston Gardey, Chief Financial Officer and Chief Accounting Officer
SIGNATURES
Pursuant to the requirements of the Securities Exchange Act of 1934 and the Investment Company Act of 1940, the registrant has duly caused this report to be signed on its behalf by the undersigned, thereunto duly authorized.
Franklin Templeton Variable Insurance Products Trust
| | |
| By | | /s/ LAURA F. FERGERSON |
| | Laura F. Fergerson |
| | Chief Executive Officer – |
| | Finance and Administration |
| Date February 26, 2016 |
Pursuant to the requirements of the Securities Exchange Act of 1934 and the Investment Company Act of 1940, this report has been signed below by the following persons on behalf of the registrant and in the capacities and on the dates indicated.
| | |
| By | | /s/ LAURA F. FERGERSON |
| | Laura F. Fergerson |
| | Chief Executive Officer – |
| | Finance and Administration |
| Date February 26, 2016 |
| |
| By | | /s/ GASTON GARDEY |
| | Gaston Gardey |
| | Chief Financial Officer and |
| | Chief Accounting Officer |
| Date February 26, 2016 |