UNITED STATES
SECURITIES AND EXCHANGE COMMISSION
Washington, DC 20549
FORM N-CSRS
CERTIFIED SHAREHOLDER REPORT OF REGISTERED
MANAGEMENT INVESTMENT COMPANIES
Investment Company Act file number 811-05583
Franklin Templeton
Variable Insurance Products Trust
(Exact name of registrant as specified in charter)
One Franklin Parkway,
San Mateo, CA 94403-1906
(Address of principal executive offices) (Zip code)
Craig S. Tyle,
One Franklin Parkway,
San Mateo, CA 94403-1906
(Name and address of agent for service)
Registrant’s telephone number, including area code: (650) 312-2000
Date of fiscal year end: 12/31
Date of reporting period: 06/30/15
| Item 1. | Reports to Stockholders. |
 | Semiannual Report June 30, 2015 |
Franklin Templeton
Variable Insurance Products Trust

Franklin Templeton Variable Insurance
Products Trust Semiannual Report
| Table of Contents | ||||
| Important Notes to Performance Information | i | |||
| *Statement of Additional Information Supplements for all Funds | SAI-1 | |||
| Fund Summaries | ||||
| FFA-1 | ||||
| FGR-1 | ||||
| FGI-1 | ||||
| FH-1 | ||||
| FI-1 | ||||
| FLG-1 | ||||
| MGD-1 | ||||
| MGD-8 | ||||
| MS-1 | ||||
| FRD-1 | ||||
| FSV-1 | ||||
| FSC-1 | ||||
| FSI-1 | ||||
| FUS-1 | ||||
| TD-1 | ||||
| TF-1 | ||||
| TGB-1 | ||||
| TG-1 | ||||
| TG-8 | ||||
| Index Descriptions | I-1 | |||
| Shareholder Information | SI-1 | |||
*Not part of the semiannual report. Retain for your records.
| Not FDIC Insured | | | May Lose Value | | | No Bank Guarantee |
MASTER CLASS – 1
FRANKLIN TEMPLETON VARIABLE INSURANCE PRODUCTS TRUST
Performance Information
Performance data is historical and cannot predict or guarantee future results. Principal value and investment return will fluctuate with market conditions, and you may have a gain or loss when you withdraw your money. Inception dates of the funds may have preceded the effective dates of the subaccounts, contracts or their availability in all states.
When reviewing the index comparisons, please keep in mind that indexes have a number of inherent performance differentials over the funds. First, unlike the funds, which must hold a minimum amount of cash to maintain liquidity, indexes do not have a cash component. Second, the funds are actively managed and, thus, are subject to management fees to cover salaries of securities analysts or portfolio managers in addition to other expenses. Indexes are unmanaged and do not include any commissions or other expenses typically associated with investing in securities. Third, indexes often contain a different mix of securities than the fund to which they are compared. Additionally, please remember that indexes are simply a measure of performance and cannot be invested in directly.
| i |
SUPPLEMENT DATED JUNE 30, 2015
TOTHE STATEMENTOF ADDITIONAL INFORMATION
DATED MAY 1, 2015
OF FRANKLIN TEMPLETON VARIABLE INSURANCE PRODUCTS TRUST
The statement of additional information (SAI) is amended as follows:
In the section “Glossary of Investments, Techniques, Strategies and Their Risks” under the heading “Foreign securities” the following is added before the paragraph on page 40 that begins with “Developing markets or emerging markets:”
Investing through Stock Connect. Foreign investors may now invest in eligible China A shares (“Stock Connect Securities”) listed and traded on the Shanghai Stock Exchange (“SSE”) through the Shanghai – Hong Kong Stock Connect (“Stock Connect”) program. Stock Connect is a securities trading and clearing program developed by The Stock Exchange of Hong Kong Limited (“SEHK”), SSE, Hong Kong Securities Clearing Company Limited and China Securities Depository and Clearing Corporation Limited for the establishment of mutual market access between SEHK and SSE. In contrast to certain other regimes for foreign investment in Chinese securities, no individual investment quotas or licensing requirements apply to investors in Stock Connect Securities through Stock Connect. In addition, there are no lock-up periods or restrictions on the repatriation of principal and profits.
However, trading through Stock Connect is subject to a number of restrictions that may affect a Fund’s investments and returns. For example, a primary feature of the Stock Connect program is the application of the home market’s laws and rules to investors in a security. Thus, investors in Stock Connect Securities are generally subject to PRC securities regulations and SSE listing rules, among other restrictions. In addition, Stock Connect Securities generally may not be sold, purchased or otherwise transferred other than through Stock Connect in accordance with applicable rules. While Stock Connect is not subject to individual investment quotas, daily and aggregate investment quotas apply to all Stock Connect participants, which may restrict or preclude a Fund’s ability to invest in Stock Connect Securities. For example, an investor cannot purchase and sell the same security on the same trading day. Stock Connect also is generally available only on business days when both the SSE and the SEHK are open. Trading in the Stock Connect Program is subject to trading, clearance and settlement procedures that are untested in the PRC, which could pose risks to a Fund. Finally, the withholding tax treatment of dividends and capital gains payable to overseas investors currently is unsettled.
Stock Connect is in its initial stages. Further developments are likely and there can be no assurance as to whether or how such developments may restrict or affect a Fund’s investments or returns. In addition, the application and interpretation of the laws and regulations of Hong Kong and the PRC, and the rules, policies or guidelines published or applied by relevant regulators and exchanges in respect of the Stock Connect program, are uncertain, and they may have a detrimental effect on a Fund’s investments and returns.
Please keep this supplement with your Statement of Additional Information for future reference.
| SAI-1 |
SUPPLEMENT DATED MAY 1, 2015
TOTHE STATEMENTOF ADDITIONAL INFORMATION
DATED MAY 1, 2015
OF FRANKLIN TEMPLETON VARIABLE INSURANCE PRODUCTS TRUST
The statement of additional information (SAI) is amended as follows:
I. The section entitled “Calculation of Net Asset Value” in the SAI is removed in its entirety.
Please keep this supplement with your statement of additional information for future reference.
| SAI-2 |
Franklin Founding Funds Allocation VIP Fund
This semiannual report for Franklin Founding Funds Allocation VIP Fund covers the period ended June 30, 2015.
Class 1 Performance Summary as of June 30, 2015
The Fund’s Class 1 shares delivered a +0.72% total return* for the six-month period ended June 30, 2015.
*The Fund has an expense reduction contractually guaranteed through at least 4/30/16. Fund investment results reflect the expense reduction, to the extent applicable; without this reduction, the results would have been lower.
Performance reflects the Fund’s Class 1 operating expenses, but does not include any contract fees, expenses or sales charges. If they had been included, performance would be lower. These charges and deductions, particularly for variable life policies, can have a significant effect on contract values and insurance benefits. See the contract prospectus for a complete description of these expenses, including sales charges.
Performance data represent past performance, which does not guarantee future results. Investment return and principal value will fluctuate, and you may have a gain or loss when you sell your shares. Current performance may differ from figures shown.
| Semiannual Report | FFA-1 |
FRANKLIN FOUNDING FUNDS ALLOCATION VIP FUND
Fund Goals and Main Investments
Franklin Founding Funds Allocation VIP Fund seeks capital appreciation, with income as a secondary goal. Under normal market conditions, the Fund invests equal portions in Class 1 shares of Franklin Income VIP Fund, Franklin Mutual Shares VIP Fund and Templeton Growth VIP Fund.
Fund Risks
All investments involve risks, including possible loss of principal. Because the Fund invests in underlying funds that may engage in a variety of investment strategies involving certain risks, the Fund may be subject to these same risks. Stock prices fluctuate, sometimes rapidly and dramatically, due to factors affecting individual companies, particular industries or sectors, or general market conditions. Bonds are affected by changes in interest rates and the creditworthiness of their issuers. Bond prices generally move in the opposite direction of interest rates. Thus, as prices of bonds adjust to a rise in interest rates, the Fund’s share price may decline. Higher yielding, lower rated corporate bonds entail a greater degree of credit risk compared to investment-grade securities. Foreign investing carries additional risks such as currency and market volatility and political or social instability, risks that are heightened in developing countries. Value securities may not increase in price as anticipated or may decline further in value. The Fund’s prospectus also includes a description of the main investment risks.
Performance Overview
You can find the Fund’s six-month total return in the Performance Summary. In comparison, the Standard & Poor’s® 500 Index (S&P 500®) generated a +1.23% total return and the MSCI World Index produced a +2.95% total return for the same period.1
Economic and Market Overview
The global economy expanded moderately during the six months under review despite slowing growth in some countries. As measured by the MSCI World Index, stocks in global developed markets advanced overall during the six-month period amid a generally accommodative monetary policy environment and signs of economic improvement in Europe and Japan. Oil prices rebounded from earlier lows as demand picked up despite rising inventories and strong global supply, while gold prices declined marginally during the period under review.
U.S. economic growth was mixed during the six months under review. In 2015’s first quarter, U.S. dollar strength, low energy prices, and a labor dispute at West Coast ports led exports to decline. In the second quarter, business capital spending rebounded and manufacturing and non-manufacturing activities increased, contributing to strong job gains. During the six-month period, the U.S. Federal Reserve Board (Fed) kept its target interest rate at 0%–0.25% while considering when an increase would be appropriate, based on labor market and inflation data.
Outside the U.S., the U.K. economy slowed in 2015’s first quarter as the mining and agriculture sectors contracted. In the eurozone, economic growth improved somewhat during the six-month period. The region avoided deflation as the annual inflation rate rose in May. The European Central Bank (ECB) maintained its benchmark interest rates during the period and also expanded its asset purchases to boost inflation and the economy. The region generally benefited from a weaker euro that helped exports, the ECB’s accommodative policy and an improved 2015 eurozone growth forecast, which helped limit fears about Greece’s debt situation.
The Japanese economy continued to grow in 2015’s first quarter after exiting recession in the previous quarter, driven by an increase in private demand as business investment and private consumption rose. The Bank of Japan maintained its monetary policy during the review period but lowered its economic growth and inflation forecasts at its April meeting.
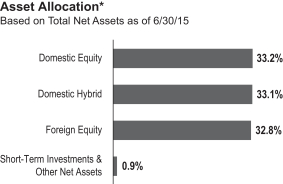
*The asset allocation is based on the Statement of Investments (SOI), which classifies each underlying fund into a broad asset class.
The dollar value, number of shares or principal amount, and names of all portfolio holdings are listed in the Fund’s SOI.
1. Source: Morningstar.
One cannot invest directly in an index, and an index is not representative of the Fund’s portfolio. Please see Index Descriptions following the Fund Summaries.
| FFA-2 | Semiannual Report |
FRANKLIN FOUNDING FUNDS ALLOCATION VIP FUND
In emerging markets, economic growth generally moderated. Greece’s credit default due to the lack of progress in negotiations weighed on emerging market stocks toward period-end. China’s government implemented market-friendly policies to support new economic drivers that could help steer the economy toward more sustainable growth. Lower interest rates there fueled massive stock market speculation and a 60% price gain up to mid-June 2015 for the domestic A-share market.2 Concerned the market was overheated, the People’s Bank of China reduced liquidity, which led to a market panic in the last two weeks of June, exacerbated by certain government intervention measures. Central bank actions varied across emerging markets, as some banks raised interest rates in response to rising inflation and weakening currencies, while others lowered interest rates to promote economic growth. In the recent global environment, emerging market stocks, as measured by the MSCI Emerging Markets Index, rose for the six-month period.3
Investment Strategy
The Fund normally invests its assets in an equally weighted combination of Class 1 shares of Franklin Income VIP Fund, Franklin Mutual Shares VIP Fund and Templeton Growth VIP Fund. These underlying funds, in turn, invest in a variety of U.S. and foreign equity securities and, to a lesser extent, fixed income and money market securities. As market conditions affect the underlying funds, we rebalance the Fund’s allocations seeking to maintain equal weightings of approximately 33 1⁄3% of total net assets in each underlying fund whenever the actual allocations exceed plus or minus 3% of the fixed allocation percentages.
Manager’s Discussion
The Fund’s performance can be attributed largely to its allocation among the underlying funds and their investments in domestic and foreign equities, fixed income securities, and short-term investments and other net assets.
During the six months under review, Franklin Income VIP Fund – Class 1 underperformed the S&P 500, while Franklin Mutual Shares VIP Fund – Class 1 outperformed the S&P 500. Templeton Growth VIP Fund – Class 1 underperformed the MSCI World Index.
Thank you for your participation in Franklin Founding Funds Allocation VIP Fund. We look forward to serving your future investment needs.
The foregoing information reflects our analysis, opinions and portfolio holdings as of June 30, 2015, the end of the reporting period. The way we implement our main investment strategies and the resulting portfolio holdings may change depending on factors such as market and economic conditions. These opinions may not be relied upon as investment advice or an offer for a particular security. The information is not a complete analysis of every aspect of any market, country, industry, security or the Fund. Statements of fact are from sources considered reliable, but the investment manager makes no representation or warranty as to their completeness or accuracy. Although historical performance is no guarantee of future results, these insights may help you understand our investment management philosophy.
2. Source: MSCI. Please see Index Descriptions following the Fund Summaries.
3. Please see Index Descriptions following the Fund Summaries.
| Semiannual Report | FFA-3 |
FRANKLIN FOUNDING FUNDS ALLOCATION VIP FUND
Class 1 Fund Expenses
As an investor in a variable insurance contract (Contract) that indirectly provides for investment in an underlying mutual fund, you can incur transaction and/or ongoing expenses at both the Fund level and the Contract level.
| • | Transaction expenses can include sales charges (loads) on purchases, surrender fees, transfer fees and premium taxes. |
| • | Ongoing expenses can include management fees, distribution and service (12b-1) fees, contract fees, annual maintenance fees, mortality and expense risk fees and other fees and expenses. All mutual funds and Contracts have some types of ongoing expenses. |
The expenses shown in the table are meant to highlight ongoing expenses at the Fund level only and do not include ongoing expenses at the Contract level, or transaction expenses at either the Fund or Contract levels. While the Fund does not have transaction expenses, if the transaction and ongoing expenses at the Contract level were included, the expenses shown below would be higher. You should consult your Contract prospectus or disclosure document for more information.
The table shows Fund-level ongoing expenses and can help you understand these expenses and compare them with those of other mutual funds offered through the Contract. The table assumes a $1,000 investment held for the six months indicated. Please refer to the Fund prospectus for additional information on operating expenses.
Actual Fund Expenses
The first line (Actual) of the table provides actual account values and expenses. The “Ending Account Value” is derived from the Fund’s actual return, which includes the effect of ongoing Fund expenses, but does not include the effect of ongoing Contract expenses.
You can estimate the Fund-level expenses you incurred during the period by following these steps. Of course, your account value and expenses will differ from those in this illustration:
| 1. | Divide your account value by $1,000. |
If an account had an $8,600 value,
then $8,600 ÷ $1,000 = 8.6.
| 2. | Multiply the result by the number under the heading “Fund-Level Expenses Incurred During Period.” |
If Fund-Level Expenses Incurred During Period were $7.50, then 8.6 × $7.50 = $64.50.
In this illustration, the estimated expenses incurred this period at the Fund level are $64.50.
Hypothetical Example for Comparison with Other Mutual Funds
Information in the second line (Hypothetical) of the table can help you compare ongoing expenses of the Fund with those of other mutual funds offered through the Contract. This information may not be used to estimate the actual ending account balance or expenses you incurred during the period. The hypothetical “Ending Account Value” is based on the Fund’s actual expense ratio and an assumed 5% annual rate of return before expenses, which does not represent the Fund’s actual return. The figure under the heading “Fund-Level Expenses Incurred During Period” shows the hypothetical expenses your account would have incurred under this scenario. You can compare this figure with the 5% hypothetical examples that appear in shareholder reports of other funds offered through a Contract.
| Class 1 | Beginning Account Value 1/1/15 | Ending Account Value 6/30/15 | Fund-Level Expenses 1/1/15–6/30/15 | Fund-Level Expenses 1/1/15–6/30/15 | ||||||||||||
Actual | $ | 1,000 | $ | 1,007.20 | $ | 0.50 | $ | 3.78 | ||||||||
Hypothetical (5% return before expenses) | $ | 1,000 | $ | 1,024.30 | $ | 0.50 | $ | 3.81 | ||||||||
*Expenses are calculated using the most recent six-month annualized expense ratio excluding expenses of the underlying funds, net of expense waivers, for the Fund’s Class 1 shares (0.10%), which does not include any ongoing expenses of the Contract for which the Fund is an investment option, multiplied by the average account value over the period, multiplied by 181/365 to reflect the one-half year period.
**Expenses are calculated using the most recent six-month annualized expense ratio including expenses of the underlying funds, net of expense waivers, for the Fund’s Class 1 shares (0.76%), which does not include any ongoing expenses of the Contract for which the Fund is an investment option, multiplied by the average account value over the period, multiplied by 181/365 to reflect the one-half year period.
| FFA-4 | Semiannual Report |
FRANKLIN TEMPLETON VARIABLE INSURANCE PRODUCTS TRUST
Financial Highlights
Franklin Founding Funds Allocation VIP Fund
Six Months Ended June 30, 2015 | Year Ended December 31, | |||||||||||||||||||||||
| 2014 | 2013 | 2012 | 2011 | 2010 | ||||||||||||||||||||
| Class 1 | ||||||||||||||||||||||||
| Per share operating performance (for a share outstanding throughout the period) | ||||||||||||||||||||||||
Net asset value, beginning of period | $7.47 | $7.47 | $8.55 | $7.63 | $7.73 | $7.15 | ||||||||||||||||||
|
| |||||||||||||||||||||||
| Income from investment operationsa: | ||||||||||||||||||||||||
Net investment incomeb,c | 0.19 | 0.22 | 0.30 | 0.26 | 0.25 | 0.24 | ||||||||||||||||||
Net realized and unrealized gains (losses) | (0.13 | ) | 0.02 | 1.42 | 0.90 | (0.35 | ) | 0.52 | ||||||||||||||||
|
| |||||||||||||||||||||||
Total from investment operations | 0.06 | 0.24 | 1.72 | 1.16 | (0.10 | ) | 0.76 | |||||||||||||||||
|
| |||||||||||||||||||||||
| Less distributions from: | ||||||||||||||||||||||||
Net investment income | (0.24 | ) | (0.23 | ) | (1.15 | ) | (0.24 | ) | (— | )d | (0.18 | ) | ||||||||||||
Net realized gains | (0.01 | ) | (0.01 | ) | (1.65 | ) | — | — | (— | )d | ||||||||||||||
|
| |||||||||||||||||||||||
Total distributions | (0.25 | ) | (0.24 | ) | (2.80 | ) | (0.24 | ) | (— | )d | (0.18 | ) | ||||||||||||
|
| |||||||||||||||||||||||
Net asset value, end of period | $7.28 | $7.47 | $7.47 | $8.55 | $7.63 | $7.73 | ||||||||||||||||||
|
| |||||||||||||||||||||||
Total returne | 0.72% | 3.05% | 24.14% | 15.56% | (1.28)% | 10.64% | ||||||||||||||||||
| Ratios to average net assetsf | ||||||||||||||||||||||||
Expenses before waiver and payments by affiliatesg | 0.11% | 0.11% | 0.11% | 0.11% | 0.11% | 0.11% | ||||||||||||||||||
Expenses net of waiver and payments by affiliatesg | 0.10% | 0.10% | 0.10% | 0.10% | 0.10% | 0.10% | ||||||||||||||||||
Net investment incomec | 4.72% | 2.88% | 3.67% | 4.06% | 3.44% | 3.04% | ||||||||||||||||||
| Supplemental data | ||||||||||||||||||||||||
Net assets, end of period (000’s) | $1,165 | $1,114 | $952 | $767 | $470 | $437 | ||||||||||||||||||
Portfolio turnover rate | 2.50% | 4.80% | 3.91% | 28.46% | h | 58.42% | 17.81% | |||||||||||||||||
aThe amount shown for a share outstanding throughout the period may not correlate with the Statement of Operations for the period due to the timing of sales and repurchases of the Fund’s shares in relation to income earned and/or fluctuating fair value of the investments of the Fund.
bBased on average daily shares outstanding.
cRecognition of net investment income by the Fund is affected by the timing of declaration of dividends by the Underlying Funds in which the Fund invests.
dAmount rounds to less than $0.01 per share.
eTotal return does not include fees, charges or expenses imposed by the variable annuity and life insurance contracts for which Franklin Templeton Variable Insurance Products Trust serves as an underlying investment vehicle. Total return is not annualized for periods less than one year.
fRatios are annualized for periods less than one year.
gDoes not include expenses of the Underlying Funds in which the Fund invests. The weighted average indirect expenses of the Underlying Funds was 0.66% for the period ended June 30, 2015.
hExcludes the value of portfolio securities delivered as a result of a redemption in-kind.
| The accompanying notes are an integral part of these financial statements. | Semiannual Report | FFA-5 |
FRANKLIN TEMPLETON VARIABLE INSURANCE PRODUCTS TRUST
FINANCIAL HIGHLIGHTS
Franklin Founding Funds Allocation VIP Fund (continued)
Six Months Ended June 30, 2015 (unaudited) | Year Ended December 31, | |||||||||||||||||||||||
| 2014 | 2013 | 2012 | 2011 | 2010 | ||||||||||||||||||||
| Class 2 | ||||||||||||||||||||||||
Per share operating performance (for a share outstanding throughout the period) | ||||||||||||||||||||||||
Net asset value, beginning of period | $7.42 | $7.42 | $8.51 | $7.59 | $7.71 | $7.14 | ||||||||||||||||||
|
| |||||||||||||||||||||||
| Income from investment operationsa: | ||||||||||||||||||||||||
Net investment incomeb,c | 0.17 | 0.20 | 0.27 | 0.25 | 0.23 | 0.21 | ||||||||||||||||||
Net realized and unrealized gains (losses) | (0.12 | ) | 0.02 | 1.42 | 0.89 | (0.35 | ) | 0.52 | ||||||||||||||||
|
| |||||||||||||||||||||||
Total from investment operations | 0.05 | 0.22 | 1.69 | 1.14 | (0.12 | ) | 0.73 | |||||||||||||||||
|
| |||||||||||||||||||||||
| Less distributions from: | ||||||||||||||||||||||||
Net investment income | (0.22 | ) | (0.21 | ) | (1.13 | ) | (0.22 | ) | (— | )d | (0.16 | ) | ||||||||||||
Net realized gains | (0.01 | ) | (0.01 | ) | (1.65 | ) | — | — | (— | )d | ||||||||||||||
|
| |||||||||||||||||||||||
Total distributions | (0.23 | ) | (0.22 | ) | (2.78 | ) | (0.22 | ) | (— | )d | (0.16 | ) | ||||||||||||
|
| |||||||||||||||||||||||
Net asset value, end of period | $7.24 | $7.42 | $7.42 | $8.51 | $7.59 | $7.71 | ||||||||||||||||||
|
| |||||||||||||||||||||||
Total returne | 0.60% | 2.85% | 23.77% | 15.33% | (1.54)% | 10.25% | ||||||||||||||||||
| Ratios to average net assetsf | ||||||||||||||||||||||||
Expenses before waiver and payments by affiliatesg | 0.36% | 0.36% | 0.36% | 0.36% | 0.36% | 0.36% | ||||||||||||||||||
Expenses net of waiver and payments by affiliatesg | 0.35% | 0.35% | 0.35% | 0.35% | 0.35% | 0.35% | ||||||||||||||||||
Net investment incomec | 4.47% | 2.63% | 3.42% | 3.81% | 3.19% | 2.79% | ||||||||||||||||||
| Supplemental data | ||||||||||||||||||||||||
Net assets, end of period (000’s) | $536,039 | $557,704 | $547,506 | $472,686 | $448,101 | $488,057 | ||||||||||||||||||
Portfolio turnover rate | 2.50% | 4.80% | 3.91% | 28.46% | h | 58.42% | 17.81% | |||||||||||||||||
aThe amount shown for a share outstanding throughout the period may not correlate with the Statement of Operations for the period due to the timing of sales and repurchases of the Fund’s shares in relation to income earned and/or fluctuating fair value of the investments of the Fund.
bBased on average daily shares outstanding.
cRecognition of net investment income by the Fund is affected by the timing of declaration of dividends by the Underlying Funds in which the Fund invests.
dAmount rounds to less than $0.01 per share.
eTotal return does not include fees, charges or expenses imposed by the variable annuity and life insurance contracts for which Franklin Templeton Variable Insurance Products Trust serves as an underlying investment vehicle. Total return is not annualized for periods less than one year.
fRatios are annualized for periods less than one year.
gDoes not include expenses of the Underlying Funds in which the Fund invests. The weighted average indirect expenses of the Underlying Funds was 0.66% for the period ended June 30, 2015.
hExcludes the value of portfolio securities delivered as a result of a redemption in-kind.
| FFA-6 | Semiannual Report | The accompanying notes are an integral part of these financial statements. |
FRANKLIN TEMPLETON VARIABLE INSURANCE PRODUCTS TRUST
FINANCIAL HIGHLIGHTS
Franklin Founding Funds Allocation VIP Fund (continued)
Six Months Ended June 30, 2015 (unaudited) | Year Ended December 31, | |||||||||||||||||||||||
| 2014 | 2013 | 2012 | 2011 | 2010 | ||||||||||||||||||||
| Class 4 | ||||||||||||||||||||||||
Per share operating performance (for a share outstanding throughout the period) | ||||||||||||||||||||||||
Net asset value, beginning of period | $7.54 | $7.54 | $8.49 | $7.58 | $7.71 | $7.14 | ||||||||||||||||||
|
| |||||||||||||||||||||||
| Income from investment operationsa: | ||||||||||||||||||||||||
Net investment incomeb,c | 0.17 | 0.20 | 0.26 | 0.30 | 0.24 | 0.19 | ||||||||||||||||||
Net realized and unrealized gains (losses) | (0.13 | ) | 0.02 | 1.43 | 0.83 | (0.37 | ) | 0.54 | ||||||||||||||||
|
| |||||||||||||||||||||||
Total from investment operations | 0.04 | 0.22 | 1.69 | 1.13 | (0.13 | ) | 0.73 | |||||||||||||||||
|
| |||||||||||||||||||||||
| Less distributions from: | ||||||||||||||||||||||||
Net investment income | (0.21 | ) | (0.21 | ) | (0.99 | ) | (0.22 | ) | (— | )d | (0.16 | ) | ||||||||||||
Net realized gains | (0.01 | ) | (0.01 | ) | (1.65 | ) | — | — | (— | )d | ||||||||||||||
|
| |||||||||||||||||||||||
Total distributions | (0.22 | ) | (0.22 | ) | (2.64 | ) | (0.22 | ) | (— | )d | (0.16 | ) | ||||||||||||
|
| |||||||||||||||||||||||
Net asset value, end of period | $7.36 | $7.54 | $7.54 | $8.49 | $7.58 | $7.71 | ||||||||||||||||||
|
| |||||||||||||||||||||||
Total returne | 0.45% | 2.75% | 23.68% | 15.17% | (1.67)% | 10.24% | ||||||||||||||||||
| Ratios to average net assetsf | ||||||||||||||||||||||||
Expenses before waiver and payments by affiliatesg | 0.46% | 0.46% | 0.46% | 0.46% | 0.46% | 0.46% | ||||||||||||||||||
Expenses net of waiver and payments by affiliatesg | 0.45% | 0.45% | 0.45% | 0.45% | 0.45% | 0.45% | ||||||||||||||||||
Net investment incomec | 4.37% | 2.53% | 3.32% | 3.71% | 3.09% | 2.69% | ||||||||||||||||||
| Supplemental data | ||||||||||||||||||||||||
Net assets, end of period (000’s) | $649,348 | $702,324 | $676,781 | $493,813 | $2,860,928 | $3,036,272 | ||||||||||||||||||
Portfolio turnover rate | 2.50% | 4.80% | 3.91% | 28.46% | h | 58.42% | 17.81% | |||||||||||||||||
aThe amount shown for a share outstanding throughout the period may not correlate with the Statement of Operations for the period due to the timing of sales and repurchases of the Fund’s shares in relation to income earned and/or fluctuating fair value of the investments of the Fund.
bBased on average daily shares outstanding.
cRecognition of net investment income by the Fund is affected by the timing of declaration of dividends by the Underlying Funds in which the Fund invests.
dAmount rounds to less than $0.01 per share.
eTotal return does not include fees, charges or expenses imposed by the variable annuity and life insurance contracts for which Franklin Templeton Variable Insurance Products Trust serves as an underlying investment vehicle. Total return is not annualized for periods less than one year.
fRatios are annualized for periods less than one year.
gDoes not include expenses of the Underlying Funds in which the Fund invests. The weighted average indirect expenses of the Underlying Funds was 0.66% for the period ended June 30, 2015.
hExcludes the value of portfolio securities delivered as a result of a redemption in-kind.
| The accompanying notes are an integral part of these financial statements. | Semiannual Report | FFA-7 |
FRANKLIN TEMPLETON VARIABLE INSURANCE PRODUCTS TRUST
Statement of Investments, June 30, 2015 (unaudited)
Franklin Founding Funds Allocation VIP Fund
| Shares | Value | |||||||||
Investments in Underlying Fundsa | ||||||||||
Domestic Equity 33.2% | ||||||||||
Franklin Mutual Shares VIP Fund, Class 1 | 16,815,586 | $ | 393,652,857 | |||||||
|
| |||||||||
Domestic Hybrid 33.1% | ||||||||||
Franklin Income VIP Fund, Class 1 | 25,231,943 | 392,609,031 | ||||||||
|
| |||||||||
Foreign Equity 32.8% | ||||||||||
Templeton Growth VIP Fund, Class 1 | 26,663,630 | 389,555,629 | ||||||||
|
| |||||||||
Total Investments in Underlying Funds (Cost $851,373,690) 99.1% | 1,175,817,517 | |||||||||
Other Assets, less Liabilities 0.9% | 10,734,917 | |||||||||
|
| |||||||||
Net Assets 100.0% | $ | 1,186,552,434 | ||||||||
|
| |||||||||
aSee Note 3(d) regarding investments in Underlying Funds.
| FFA-8 | Semiannual Report | The accompanying notes are an integral part of these financial statements. | |||||
FRANKLIN TEMPLETON VARIABLE INSURANCE PRODUCTS TRUST
Financial Statements
Statement of Assets and Liabilities
June 30, 2015 (unaudited)
Franklin Founding Funds Allocation VIP Fund | ||||
Assets: | ||||
Investments in Underlying Funds: (Note 3d) | ||||
Cost | $ | 851,373,690 | ||
|
| |||
Value | $ | 1,175,817,517 | ||
Cash | 11,312,261 | |||
Receivables from capital shares sold | 406,389 | |||
Other assets | 513 | |||
|
| |||
Total assets | 1,187,536,680 | |||
|
| |||
Liabilities: | ||||
Payables: | ||||
Capital shares redeemed | 197,514 | |||
Administrative fees | 87,135 | |||
Distribution fees | 625,786 | |||
Reports to shareholders | 53,990 | |||
Accrued expenses and other liabilities | 19,821 | |||
|
| |||
Total liabilities | 984,246 | |||
|
| |||
Net assets, at value | $ | 1,186,552,434 | ||
|
| |||
Net assets consist of: | ||||
Paid-in capital | $ | 885,970,754 | ||
Undistributed net investment income | 25,499,289 | |||
Net unrealized appreciation (depreciation) | 324,443,827 | |||
Accumulated net realized gain (loss) | (49,361,436 | ) | ||
|
| |||
Net assets, at value | $ | 1,186,552,434 | ||
|
| |||
| Class 1: | ||||
Net assets, at value | $ | 1,165,136 | ||
|
| |||
Shares outstanding | 159,986 | |||
|
| |||
Net asset value and maximum offering price per share | $ | 7.28 | ||
|
| |||
| Class 2: | ||||
Net assets, at value | $ | 536,038,874 | ||
|
| |||
Shares outstanding | 74,026,307 | |||
|
| |||
Net asset value and maximum offering price per share | $ | 7.24 | ||
|
| |||
| Class 4: | ||||
Net assets, at value | $ | 649,348,424 | ||
|
| |||
Shares outstanding | 88,168,720 | |||
|
| |||
Net asset value and maximum offering price per share | $ | 7.36 | ||
|
| |||
| The accompanying notes are an integral part of these financial statements. | Semiannual Report | FFA-9 |
FRANKLIN TEMPLETON VARIABLE INSURANCE PRODUCTS TRUST
FINANCIAL STATEMENTS
Statement of Operations
for the six months ended June 30, 2015 (unaudited)
Franklin Founding Funds Allocation VIP Fund | ||||
Investment income: | ||||
Dividends from Underlying Funds (Note 3d) | $ | 29,569,903 | ||
|
| |||
Expenses: | ||||
Administrative fees (Note 3a) | 613,189 | |||
Distribution fees: (Note 3b) | ||||
Class 2 | 686,069 | |||
Class 4 | 1,181,615 | |||
Reports to shareholders | 47,392 | |||
Professional fees | 16,338 | |||
Trustees’ fees and expenses | 2,696 | |||
Other | 6,362 | |||
|
| |||
Total expenses | 2,553,661 | |||
Expenses waived/paid by affiliates (Note 3e) | (72,792 | ) | ||
|
| |||
Net expenses | 2,480,869 | |||
|
| |||
Net investment income | 27,089,034 | |||
|
| |||
Realized and unrealized gains (losses): | ||||
Net realized gain (loss) from sale of investments in Underlying Funds (Note 3d) | 5,867,736 | |||
Net change in unrealized appreciation (depreciation) on investments in Underlying Funds | (24,727,651 | ) | ||
|
| |||
Net realized and unrealized gain (loss) | (18,859,915 | ) | ||
|
| |||
Net increase (decrease) in net assets resulting from operations | $ | 8,229,119 | ||
|
| |||
| FFA-10 | Semiannual Report | The accompanying notes are an integral part of these financial statements. |
FRANKLIN TEMPLETON VARIABLE INSURANCE PRODUCTS TRUST
FINANCIAL STATEMENTS
Statements of Changes in Net Assets
| Franklin Founding Funds Allocation VIP Fund | ||||||||
Six Months June 30, 2015 | Year December 31, | |||||||
Increase (decrease) in net assets: | ||||||||
Operations: | ||||||||
Net investment income | $ | 27,089,034 | $ | 33,255,768 | ||||
Net realized gain (loss) | 5,867,736 | 1,584,965 | ||||||
Net change in unrealized appreciation (depreciation) | (24,727,651 | ) | (1,653,471 | ) | ||||
|
| |||||||
Net increase (decrease) in net assets resulting from operations | 8,229,119 | 33,187,262 | ||||||
|
| |||||||
Distributions to shareholders from: | ||||||||
Net investment income: | ||||||||
Class 1 | (36,795 | ) | (32,764 | ) | ||||
Class 2 | (15,525,526 | ) | (15,578,364 | ) | ||||
Class 4 | (17,645,320 | ) | (19,895,877 | ) | ||||
Net realized gains: | ||||||||
Class 1 | (1,845 | ) | (924 | ) | ||||
Class 2 | (848,940 | ) | (475,173 | ) | ||||
Class 4 | (1,013,211 | ) | (618,180 | ) | ||||
|
| |||||||
Total distributions to shareholders | (35,071,637 | ) | (36,601,282 | ) | ||||
|
| |||||||
Capital share transactions: (Note 2) | ||||||||
Class 1 | 82,435 | 164,958 | ||||||
Class 2 | (9,093,407 | ) | 11,105,994 | |||||
Class 4 | (38,735,289 | ) | 28,046,285 | |||||
|
| |||||||
Total capital share transactions | (47,746,261 | ) | 39,317,237 | |||||
|
| |||||||
Net increase (decrease) in net assets | (74,588,779 | ) | 35,903,217 | |||||
Net assets: | ||||||||
Beginning of period | 1,261,141,213 | 1,225,237,996 | ||||||
|
| |||||||
End of period | $ | 1,186,552,434 | $ | 1,261,141,213 | ||||
|
| |||||||
Undistributed net investment income included in net assets: | ||||||||
End of period | $ | 25,499,289 | $ | 31,617,896 | ||||
|
| |||||||
| The accompanying notes are an integral part of these financial statements. | Semiannual Report | FFA-11 |
FRANKLIN TEMPLETON VARIABLE INSURANCE PRODUCTS TRUST
Notes to Financial Statements (unaudited)
Franklin Founding Funds Allocation VIP Fund
1. Organization and Significant Accounting Policies
Franklin Templeton Variable Insurance Products Trust (Trust) is registered under the Investment Company Act of 1940 (1940 Act) as an open-end management investment company, consisting of nineteen separate funds and applies the specialized accounting and reporting guidance in U.S. Generally Accepted Accounting Principles (U.S. GAAP). Franklin Founding Funds Allocation VIP Fund (Fund) is included in this report. The financial statements of the remaining funds in the Trust are presented separately. The Fund invests primarily in other funds of the Trust (Underlying Funds). Shares of the Fund are generally sold only to insurance company separate accounts to fund the benefits of variable life insurance policies or variable annuity contracts. The Fund offers three classes of shares: Class 1, Class 2 and Class 4. Each class of shares differs by its distribution fees, voting rights on matters affecting a single class and its exchange privilege.
The accounting policies of the Underlying Funds are outlined in their respective shareholder reports. A copy of the Underlying Funds’ shareholder reports is available on the U.S. Securities and Exchange Commission (SEC) website at sec.gov or at the SEC’s Public Reference Room in Washington, D.C. The Underlying Funds’ shareholder reports are not covered by this report.
The following summarizes the Fund’s significant accounting policies.
a. Financial Instrument Valuation
The Fund’s investments in financial instruments are carried at fair value daily. Fair value is the price that would be received to sell an asset or paid to transfer a liability in an orderly transaction between market participants on the measurement date. The Fund calculates the net asset value (NAV) per share at the close of the New York Stock Exchange (NYSE), generally at 4 p.m. Eastern time (NYSE close) on each day the NYSE is open for trading. Under compliance policies and procedures approved by the Trust’s Board of Trustees (the Board), the Fund’s administrator has responsibility for oversight of valuation, including leading the cross-functional Valuation and Liquidity Oversight Committee (VLOC). The VLOC provides administration and oversight of the Fund’s valuation policies and procedures, which are approved annually by the Board. Investments in the Underlying Funds are valued at their closing NAV each trading day.
b. Income Taxes
It is the Fund’s policy to qualify as a regulated investment company under the Internal Revenue Code. The Fund intends to distribute to shareholders substantially all of its taxable income and net realized gains to relieve it from federal income and if applicable, excise taxes. As a result, no provision for U.S. federal income taxes is required.
The Fund recognizes the tax benefits of uncertain tax positions only when the position is “more likely than not” to be sustained upon examination by the tax authorities based on the technical merits of the tax position. As of June 30, 2015, and for all open tax years, the Fund has determined that no liability for unrecognized tax benefits is required in the Fund’s financial statements related to uncertain tax positions taken on a tax return (or expected to be taken on future tax returns). Open tax years are those that remain subject to examination and are based on each tax jurisdiction’s statute of limitation.
c. Security Transactions, Investment Income, Expenses and Distributions
Security transactions are accounted for on trade date. Realized gains and losses on security transactions are determined on a specific identification basis. Estimated expenses are accrued daily. Dividend income and realized gain distributions by Underlying Funds are recorded on the ex-dividend date. Distributions to shareholders are recorded on the ex-dividend date and are determined according to income tax regulations (tax basis). Distributable earnings determined on a tax basis may differ from earnings recorded in accordance with U.S. GAAP. These differences may be permanent or temporary. Permanent differences are reclassified among capital accounts to reflect their tax character. These reclassifications have no impact on net assets or the results of operations. Temporary differences are not reclassified, as they may reverse in subsequent periods.
Common expenses incurred by the Trust are allocated among the funds based on the ratio of net assets of each fund to the combined net assets of the Trust. Fund specific expenses are charged directly to the fund that incurred the expense.
The Fund indirectly bears its proportionate share of expenses from the Underlying Funds. Since the Underlying Funds have varied expense levels and the Fund may own different proportions of the Underlying Funds at different times, the amount of expenses incurred indirectly by the Fund will vary.
| FFA-12 | Semiannual Report |
FRANKLIN TEMPLETON VARIABLE INSURANCE PRODUCTS TRUST
NOTES TO FINANCIAL STATEMENTS
Franklin Founding Funds Allocation VIP Fund (continued)
Realized and unrealized gains and losses and net investment income, not including class specific expenses, are allocated daily to each class of shares based upon the relative proportion of net assets of each class. Differences in per share distributions, by class, are generally due to differences in class specific expenses.
d. Accounting Estimates
The preparation of financial statements in accordance with U.S. GAAP requires management to make estimates and assumptions that affect the reported amounts of assets and liabilities at the date of the financial statements and the amounts of income and
expenses during the reporting period. Actual results could differ from those estimates.
e. Guarantees and Indemnifications
Under the Trust’s organizational documents, its officers and trustees are indemnified by the Trust against certain liabilities arising out of the performance of their duties to the Trust. Additionally, in the normal course of business, the Trust, on behalf of the Fund, enters into contracts with service providers that contain general indemnification clauses. The Trust’s maximum exposure under these arrangements is unknown as this would involve future claims that may be made against the Trust that have not yet occurred. Currently, the Trust expects the risk of loss to be remote.
2. Shares of Beneficial Interest
At June 30, 2015, there were an unlimited number of shares authorized (without par value). Transactions in the Fund’s shares were as follows:
| Six Months Ended June 30, 2015 | Year Ended December 31, 2014 | |||||||||||||||||
| Shares | Amount | Shares | Amount | |||||||||||||||
| Class 1 Shares: | ||||||||||||||||||
Shares sold | 13,554 | $ | 103,680 | 37,779 | $ | 289,740 | ||||||||||||
Shares issued in reinvestment of distributions | 5,229 | 38,640 | 4,341 | 33,688 | ||||||||||||||
Shares redeemed | (7,884 | ) | (59,885 | ) | (20,435 | ) | (158,470 | ) | ||||||||||
|
| |||||||||||||||||
Net increase (decrease) | 10,899 | $ | 82,435 | 21,685 | $ | 164,958 | ||||||||||||
|
| |||||||||||||||||
| Class 2 Shares: | ||||||||||||||||||
Shares sold | 3,221,994 | $ | 24,332,577 | 11,044,608 | $ | 83,657,513 | ||||||||||||
Shares issued in reinvestment of distributions | 2,227,819 | 16,374,466 | 2,082,171 | 16,053,537 | ||||||||||||||
Shares redeemed | (6,598,388 | ) | (49,800,450 | ) | (11,722,596 | ) | (88,605,056 | ) | ||||||||||
|
| |||||||||||||||||
Net increase (decrease) | (1,148,575 | ) | $ | (9,093,407 | ) | 1,404,183 | $ | 11,105,994 | ||||||||||
|
| |||||||||||||||||
| Class 4 Shares: | ||||||||||||||||||
Shares sold | 1,873,838 | $ | 14,361,530 | 13,809,688 | $ | 106,773,129 | ||||||||||||
Shares issued in reinvestment of distributions | 2,494,456 | 18,658,531 | 2,616,589 | 20,514,057 | ||||||||||||||
Shares redeemed | (9,404,929 | ) | (71,755,350 | ) | (12,995,650 | ) | (99,240,901 | ) | ||||||||||
|
| |||||||||||||||||
Net increase (decrease) | (5,036,635 | ) | $ | (38,735,289 | ) | 3,430,627 | $ | 28,046,285 | ||||||||||
|
| |||||||||||||||||
| Semiannual Report | FFA-13 |
FRANKLIN TEMPLETON VARIABLE INSURANCE PRODUCTS TRUST
NOTES TO FINANCIAL STATEMENTS (UNAUDITED)
Franklin Founding Funds Allocation VIP Fund (continued)
3. Transactions With Affiliates
Franklin Resources, Inc. is the holding company for various subsidiaries that together are referred to as Franklin Templeton Investments. Certain officers and trustees of the Fund are also officers and/or directors/trustees of certain of the Underlying Funds and of the following subsidiaries:
| Subsidiary | Affiliation | |
Franklin Templeton Services, LLC (FT Services) | Administrative manager | |
Franklin Templeton Distributors, Inc. (Distributors) | Principal underwriter | |
Franklin Templeton Investor Services, LLC (Investor Services) | Transfer agent |
a. Administrative Fees
The Fund pays an administrative fee to FT Services of 0.10% per year of the average daily net assets of the Fund for administrative services including monitoring and rebalancing the percentage of the Fund’s investments in the Underlying Funds.
b. Distribution Fees
The Board has adopted distribution plans for Class 2 and Class 4 shares pursuant to Rule 12b-1 under the 1940 Act. Under the Fund’s compensation distribution plans, the Fund pays Distributors for costs incurred in connection with the servicing, sale and distribution of the Fund’s shares up to 0.35% per year of its average daily net assets of each class. Some distribution fees are not charged on shares held by affiliates. The Board has agreed to limit the current rate to 0.25% per year for Class 2. The plan year, for purposes of monitoring compliance with the maximum annual plan rates, is February 1 through January 31.
c. Transfer Agent Fees
Investor Services, under terms of an agreement, performs shareholder servicing for the Fund and is not paid by the Fund for the services.
d. Investments in Underlying Funds
The Fund invests primarily in the Underlying Funds which are managed by affiliates of the Fund’s administrative manager, FT Services. The Fund does not invest in the Underlying Funds for the purpose of exercising a controlling influence over the management or policies. Investments in Underlying Funds for the period ended June 30, 2015, were as follows:
| Underlying Funds | Number of Shares Held at Beginning of Period | Gross Additions | Gross Reductions | Number of Shares Held at End of Period | Value at End of Period | Investment Income | Realized Gain (Loss) | % of Underlying Fund Shares Outstanding Held at End of Period | ||||||||||||||||||||||||
Franklin Income VIP Fund, Class 1 | 25,395,586 | 1,180,811 | (1,344,454 | ) | 25,231,943 | $ | 392,609,031 | $ | 18,633,204 | $ | (648,417 | ) | 5.73% | |||||||||||||||||||
Franklin Mutual Shares VIP Fund, Class 1 | 18,222,604 | — | (1,407,018 | ) | 16,815,586 | 393,652,857 | — | 6,924,148 | 7.97% | |||||||||||||||||||||||
Templeton Growth VIP Fund, Class 1 | 28,094,843 | 802,743 | (2,233,956 | ) | 26,663,630 | 389,555,629 | 10,936,699 | (407,995 | ) | 22.86% | ||||||||||||||||||||||
|
| |||||||||||||||||||||||||||||||
Total | $ | 1,175,817,517 | $ | 29,569,903 | $ | 5,867,736 | ||||||||||||||||||||||||||
|
| |||||||||||||||||||||||||||||||
e. Waiver and Expense Reimbursements
FT Services contractually agreed in advance to waive or limit its fees and to assume as its own expense certain expenses otherwise payable by the Fund so that the expenses (excluding distribution fees, and acquired fund fees and expenses) for each class of the Fund do not exceed 0.10% based on the average net assets of each class (other than certain non-routine expenses or costs, including those relating to litigation, indemnification, reorganizations, and liquidations) until April 30, 2016.
| FFA-14 | Semiannual Report |
FRANKLIN TEMPLETON VARIABLE INSURANCE PRODUCTS TRUST
NOTES TO FINANCIAL STATEMENTS (UNAUDITED)
Franklin Founding Funds Allocation VIP Fund (continued)
4. Expense Offset Arrangement
The Fund has entered into an arrangement with its custodian whereby credits realized as a result of uninvested cash balances are used to reduce a portion of the Fund’s custodian expenses. During the period ended June 30, 2015, there were no credits earned.
5. Income Taxes
At June 30, 2015, the cost of investments and net unrealized appreciation (depreciation) for income tax purposes were as follows:
Cost of investments | $ | 905,033,651 | ||
|
| |||
Unrealized appreciation | $ | 270,783,866 | ||
Unrealized depreciation | — | |||
|
| |||
Net unrealized appreciation (depreciation) | $ | 270,783,866 | ||
|
|
Differences between income and/or capital gains as determined on a book basis and a tax basis are primarily due to differing treatment of wash sales.
6. Investment Transactions
Purchases and sales of Underlying Funds (excluding short term securities) for the period ended June 30, 2015, aggregated $30,569,903 and $89,100,000, respectively.
7. Credit Facility
The Fund, together with other U.S. registered and foreign investment funds (collectively, Borrowers), managed by Franklin Templeton Investments, are borrowers in a joint syndicated senior unsecured credit facility totaling $2 billion (Global Credit Facility) which matures on February 12, 2016. This Global Credit Facility provides a source of funds to the Borrowers for temporary and emergency purposes, including the ability to meet future unanticipated or unusually large redemption requests.
Under the terms of the Global Credit Facility, the Fund shall, in addition to interest charged on any borrowings made by the Fund and other costs incurred by the Fund, pay its share of fees and expenses incurred in connection with the implementation and maintenance of the Global Credit Facility, based upon its relative share of the aggregate net assets of all of the Borrowers, including an annual commitment fee of 0.07% based upon the unused portion of the Global Credit Facility. These fees are reflected in other expenses in the Statement of Operations. During the period ended June 30, 2015, the Fund did not use the Global Credit Facility.
8. Fair Value Measurements
The Fund follows a fair value hierarchy that distinguishes between market data obtained from independent sources (observable inputs) and the Fund’s own market assumptions (unobservable inputs). These inputs are used in determining the value of the Fund’s financial instruments and are summarized in the following fair value hierarchy:
| • | Level 1 – quoted prices in active markets for identical financial instruments |
| • | Level 2 – other significant observable inputs (including quoted prices for similar financial instruments, interest rates, prepayment speed, credit risk, etc.) |
| • | Level 3 – significant unobservable inputs (including the Fund’s own assumptions in determining the fair value of financial instruments) |
The input levels are not necessarily an indication of the risk or liquidity associated with financial instruments at that level.
| Semiannual Report | FFA-15 |
FRANKLIN TEMPLETON VARIABLE INSURANCE PRODUCTS TRUST
NOTES TO FINANCIAL STATEMENTS (UNAUDITED)
Franklin Founding Funds Allocation VIP Fund (continued)
For movements between the levels within the fair value hierarchy, the Fund has adopted a policy of recognizing the transfers as of the date of the underlying event which caused the movement.
At June 30, 2015, all of the Fund’s investments in financial instruments carried at fair value were valued using Level 1. For detailed categories, see the accompanying Statement of Investments.
9. Subsequent Events
The Fund has evaluated subsequent events through the issuance of the financial statements and determined that no events have occurred that require disclosure.
| FFA-16 | Semiannual Report |
FRANKLIN TEMPLETON VARIABLE INSURANCE PRODUCTS TRUST
Tax Information (unaudited)
Franklin Founding Funds Allocation VIP Fund
During the fiscal year ended December 31, 2014, the Fund, a qualified fund of funds under Section 852(g)(2) of Internal Revenue Code (Code), received an allocation of foreign taxes paid from one or more of its underlying funds. As shown in the table below, the Fund hereby reports to shareholders the foreign source income and foreign taxes paid by underlying funds, pursuant to Section 853 of the Code. This written statement will allow shareholders of record on June 12, 2015, to treat their proportionate share of foreign taxes paid by the underlying funds as having been paid directly by them. The shareholder shall consider these amounts as foreign taxes paid in the tax year in which they receive the Fund distribution.
The following table provides a detailed analysis of foreign tax paid, and foreign source income as reported by the Fund, to Class 1, Class 2, and Class 4 shareholders of record.
| Class | Foreign Tax Paid Per Share | Foreign Source Income Per Share | ||
Class 1 | $0.0026 | $0.0353 | ||
Class 2 | $0.0026 | $0.0353 | ||
Class 4 | $0.0026 | $0.0353 |
Foreign Tax Paid Per Share (Column 1) is the amount per share available to you, as a tax credit (assuming you held your shares in the Fund for a minimum of 16 days during the 31-day period beginning 15 days before the ex-dividend date of the Fund’s distribution to which the foreign taxes relate), or, as a tax deduction.
Foreign Source Income Per Share (Column 2) is the amount per share of income dividends attributable to foreign securities held by the Fund, plus any foreign taxes withheld on these dividends.
| Semiannual Report | FFA-17 |
Franklin Global Real Estate VIP Fund
This semiannual report for Franklin Global Real Estate VIP Fund covers the period ended June 30, 2015.
Class 1 Performance Summary as of June 30, 2015
The Fund’s Class 1 shares had a -2.85% total return for the six-month period ended June 30, 2015.
Performance reflects the Fund’s Class 1 operating expenses, but does not include any contract fees, expenses or sales charges. If they had been included, performance would be lower. These charges and deductions, particularly for variable life policies, can have a significant effect on contract values and insurance benefits. See the contract prospectus for a complete description of these expenses, including sales charges.
Performance data represent past performance, which does not guarantee future results. Investment return and principal value will fluctuate, and you may have a gain or loss when you sell your shares. Current performance may differ from figures shown.
| Semiannual Report | FGR-1 |
FRANKLIN GLOBAL REAL ESTATE VIP FUND
Fund Goal and Main Investments
Franklin Global Real Estate VIP Fund seeks high total return. Under normal market conditions, the Fund invests at least 80% of its net assets in investments of companies located anywhere in the world that operate in the real estate sector.
Fund Risks
All investments involve risks, including possible loss of principal. The Fund concentrates in real estate securities, which involve special risks, such as declines in the value of real estate and increased susceptibility to adverse economic or regulatory developments affecting the sector. The Fund’s investments in REITs involve additional risks; since REITs typically are invested in a limited number of projects or in a particular market segment, they are more susceptible to adverse developments affecting a single project or market segment than more broadly diversified investments. Foreign investing, especially in emerging markets, involves additional risks such as currency and market volatility, as well as political and social instability. The Fund is actively managed but there is no guarantee that the manager’s investment decisions will produce the desired results. The Fund’s prospectus also includes a description of the main investment risks.
What is a REIT?
A REIT is a type of real estate company that is dedicated to owning and usually operating income-producing real estate properties such as apartments, hotels, industrial properties, office buildings or shopping centers. Equity REITs generally receive income from rents received, are generally operated by experienced property management teams and typically concentrate on a specific geographic region or property type.
Performance Overview
You can find the Fund’s six-month total return in the Performance Summary. In comparison, the FTSE EPRA/NAREIT Developed Index had a -2.78% total return for the same period.1
Economic and Market Overview
The global economy expanded moderately during the six months under review despite slowing growth in some countries. As measured by the MSCI World Index, stocks in global developed markets advanced overall during the six-month period amid a generally accommodative monetary policy environment and signs of economic improvement in Europe and Japan. Oil prices rebounded from earlier lows as demand picked up despite
rising inventories and strong global supply, while gold prices declined marginally during the period under review.
U.S. economic growth was mixed during the six months under review. In 2015’s first quarter, U.S. dollar strength, low energy prices, and a labor dispute at West Coast ports led exports to decline. In the second quarter, business capital spending rebounded and manufacturing and non-manufacturing activities increased, contributing to strong job gains. During the six-month period, the U.S. Federal Reserve Board (Fed) kept its target interest rate at 0%–0.25% while considering when an
1. Source: Morningstar.
One cannot invest directly in an index, and an index is not representative of the Fund’s portfolio. Please see Index Descriptions following the Fund Summaries.
| FGR-2 | Semiannual Report |
FRANKLIN GLOBAL REAL ESTATE VIP FUND
increase would be appropriate, based on labor market and inflation data. In its June meeting, the Fed lowered its economic growth forecast for 2015 and raised unemployment estimates given the weak start to the year.
Outside the U.S., the U.K. economy slowed in 2015’s first quarter as the mining and agriculture sectors contracted. Near period-end, the Conservative Party’s unexpected victory in the U.K. general elections supported investor sentiment. In the eurozone, economic growth improved somewhat during the six-month period. Spain expanded at a solid pace, and France and Italy returned to growth in 2015’s first quarter. However, Germany, the region’s largest economy, slowed during the first quarter amid sluggish exports. The region avoided deflation as the annual inflation rate rose in May. The European Central Bank (ECB) maintained its benchmark interest rates during the period and also expanded its asset purchases to boost inflation and the economy. The region generally benefited from a weaker euro that helped exports, the ECB’s accommodative policy and an improved 2015 eurozone growth forecast, but Greece’s debt situation remained a major concern.
The Japanese economy continued to grow in 2015’s first quarter after exiting recession in the previous quarter, driven by an increase in private demand as business investment and private consumption rose. The Bank of Japan maintained its monetary policy during the review period but lowered its economic growth and inflation forecasts at its April meeting.
In emerging markets, economic growth generally moderated. A ceasefire agreement between Russia and Ukraine helped emerging market stocks early in the period. However, Greece’s credit default due to the lack of progress in negotiations weighed on emerging market stocks toward period-end. China’s government implemented market-friendly policies to support new economic drivers that could help steer the economy toward more sustainable growth. Lower interest rates there fueled massive stock market speculation and a 60% price gain up to mid-June 2015 for the domestic A-share market.2 Concerned the market was overheated, the People’s Bank of China reduced liquidity, which led to a market panic in the last two weeks of June, exacerbated by certain government intervention measures. Central bank actions varied across emerging markets, as some banks raised interest rates in response to rising inflation and weakening currencies, while others lowered interest rates to promote economic growth. In the recent global environment, emerging market stocks, as measured by the MSCI Emerging Markets Index, rose for the six-month period.3
Global Real Estate Market Overview
Overall, global real estate markets declined modestly during the six months under review. According to the FTSE EPRA/NAREIT Developed Index, in U.S. dollar terms, China and Spain far outpaced the index and led global real estate markets. The U.K., Hong Kong and Singapore also posted solid results. In contrast, some markets represented in the index lost value, including the Netherlands, Canada, Germany, Sweden and the U.S., the index’s largest country weighting.
Investment Strategy
We seek to limit price volatility by investing across markets and property types and seek to provide a consistently high level of income in our pursuit of high total return. When selecting investments for the Fund’s portfolio, we apply a “bottom-up” stock selection process that incorporates macro-level views in the evaluation process. Our portfolio construction process combines bottom-up analysis of individual stock and real estate market fundamentals and top-down macro overlays to provide country/regional, property type, and company size perspectives in identifying international/local cyclical and thematic trends that highlight investment opportunities.
Manager’s Discussion
During the six months under review, key contributors to the Fund’s performance relative to the FTSE EPRA/NAREIT Developed Index included stock selection in the office space sector, notably our position in Derwent London. Shares of the
| Top 10 Countries | ||||
| 6/30/15 | ||||
| % of Total Net Assets | ||||
| U.S. | 51.8% | |||
| Japan | 11.9% | |||
| Hong Kong | 7.5% | |||
| U.K. | 7.1% | |||
| Australia | 5.5% | |||
| France | 4.2% | |||
| Singapore | 3.2% | |||
| Germany | 2.3% | |||
| Sweden | 1.4% | |||
| China | 1.2% | |||
2. Source: MSCI. Please see Index Descriptions following the Fund Summaries.
3. Please see Index Descriptions following the Fund Summaries.
| Semiannual Report | FGR-3 |
FRANKLIN GLOBAL REAL ESTATE VIP FUND
U.K.-based office REIT outperformed many European peers, as the central London office market continued to show strength. Derwent acquired assets early in the period, and the company maintained a solid development pipeline and significant potential for rental reversions (rental renewals with amendments) in its portfolio. In our analysis, the company has strong potential growth from portfolio properties with fundamentals that are favorable compared to many peers. Company management expected healthy rental growth in 2015 amid robust tenant demand, as the overall market’s vacancy levels remained low.
The Fund’s investment in U.S.-based Extra Space Storage also enhanced relative performance for the first half of 2015. Among self-storage REITs, Extra Space Storage performed exceptionally well and outperformed the benchmark index, reflecting strong self-storage operating fundamentals.4 In the past few years, the company sought to take advantage of consolidation opportunities within the self-storage sector by acquiring portfolios it believed had the potential to contribute to its revenues and earnings. As a result, the company continued to generate robust core operational results with accelerating revenue growth.
Shares of U.K.-based, student housing REIT Unite Group outperformed many European peers during the period, supporting relative Fund performance. Student-housing investment transactions in the U.K. reached record volumes in the first quarter of 2015. Market transactions are expected to have a positive impact on Unite’s 2015 valuation and development pipeline, as property yields compressed, especially in London. On the operational side, Unite expected solid rental growth as student demand continued to strengthen and reservations outpaced those in prior years.
In contrast, key detractors from the Fund’s relative performance included stock selection in the industrial property sector, particulary Nippon Prologis REIT. Shares of the Japanese REIT underperformed the benchmark index during the six-month period, resulting from investor concerns about the upcoming influx of supply in the Tokyo logistics market in late 2015 and 2016. Overall, Nippon Prologis’s occupancy rate continued to be high, as the company has a high-quality portfolio, and demand for class-A logistics facilities remained healthy. We believe the company will continue to pursue external growth by leveraging the ample pipeline of its sponsor, U.S.-based REIT Prologis, but the pace may slow given the longer lease-up time for newly built properties.
Security selection in the diversified sector also hampered relative results, notably our position in Wereldhave. Shares of the Netherlands REIT underperformed many European peers, as investors anticipated the company would sell new shares to finance acquisitions. Near period-end, the company completed an equity offering to finance the acquisition of a portfolio of medium-sized Dutch shopping centers from French REIT Klepierre (also a Fund holding). We reduced our position in Wereldhave during the period. The company’s 2014 operational performance was stable, with healthy year-over-year rental growth. We expect Wereldhave to focus on property management to improve occupancy levels and tenant mix and to integrate its latest acquisitions to its shopping center platform.
Although stock selection in the hotel/resort sector contributed to relative performance, the Fund’s investment in U.S.-based Host Hotels & Resorts hurt results. Shares underperformed the benchmark index primarily due to the hotel operator’s weaker-than-expected first-quarter earnings report and the lower-than-expected full-year earnings guidance the company provided in early 2015. Notwithstanding the industry’s overall healthy
Top 10 Holdings | ||||
| 6/30/15 | ||||
| Company Sector/Industry, Country | % of Total Net Assets | |||
| Simon Property Group Inc. Retail REITs, U.S. | 4.8% | |||
| Mitsui Fudosan Co. Ltd. Diversified Real Estate Activities, Japan | 3.6% | |||
| Unibail-Rodamco SE Retail REITs, France | 3.1% | |||
| Equity Residential Residential REITs, U.S. | 2.7% | |||
| Mitsubishi Estate Co. Ltd. Diversified Real Estate Activities, Japan | 2.6% | |||
| Hong Kong Land Holdings Ltd. Real Estate Operating Companies, Hong Kong | 2.0% | |||
| Boston Properties Inc. Office REITs, U.S. | 2.0% | |||
| Prologis Inc. Industrial REITs, U.S. | 1.9% | |||
| Vornado Realty Trust Office REITs, U.S. | 1.9% | |||
| Health Care REIT Inc. Health Care REITs, U.S. | 1.9% | |||
The dollar value, number of shares or principal amount, and names of all portfolio holdings are listed in the Fund’s Statement of Investments (SOI).
4. Self-storage REITs are in specialized REITs in the SOI.
| FGR-4 | Semiannual Report |
FRANKLIN GLOBAL REAL ESTATE VIP FUND
lodging fundamentals, the company’s earnings results were negatively affected by ongoing renovations at some properties, as well as by soft market fundamentals in New York City, the company’s largest market, where room rate growth slowed because of new supply in this market.
It is important to recognize the effect of currency movements on the Fund’s performance. In general, if the value of the U.S. dollar goes up compared with a foreign currency, an investment traded in that foreign currency will go down in value because it will be worth fewer U.S. dollars. This can have a negative effect on Fund performance. Conversely, when the U.S. dollar weakens in relation to a foreign currency, an investment traded in that foreign currency will increase in value, which can contribute to Fund performance. For the six months ended June 30, 2015, the U.S. dollar rose in value relative to most currencies. As a result, the Fund’s performance was negatively affected by the portfolio’s substantial investment in securities with non-U.S. currency exposure.
Thank you for your participation in Franklin Global Real Estate VIP Fund. We look forward to serving your future investment needs.
The foregoing information reflects our analysis, opinions and portfolio holdings as of June 30, 2015, the end of the reporting period. The way we implement our main investment strategies and the resulting portfolio holdings may change depending on factors such as market and economic conditions. These opinions may not be relied upon as investment advice or an offer for a particular security. The information is not a complete analysis of every aspect of any market, country, industry, security or the Fund. Statements of fact are from sources considered reliable, but the investment manager makes no representation or warranty as to their completeness or accuracy. Although historical performance is no guarantee of future results, these insights may help you understand our investment management philosophy.
| Semiannual Report | FGR-5 |
FRANKLIN GLOBAL REAL ESTATE VIP FUND
Class 1 Fund Expenses
As an investor in a variable insurance contract (Contract) that indirectly provides for investment in an underlying mutual fund, you can incur transaction and/or ongoing expenses at both the Fund level and the Contract level.
| • | Transaction expenses can include sales charges (loads) on purchases, surrender fees, transfer fees and premium taxes. |
| • | Ongoing expenses can include management fees, distribution and service (12b-1) fees, contract fees, annual maintenance fees, mortality and expense risk fees and other fees and expenses. All mutual funds and Contracts have some types of ongoing expenses. |
The expenses shown in the table are meant to highlight ongoing expenses at the Fund level only and do not include ongoing expenses at the Contract level, or transaction expenses at either the Fund or Contract levels. While the Fund does not have transaction expenses, if the transaction and ongoing expenses at the Contract level were included, the expenses shown below would be higher. You should consult your Contract prospectus or disclosure document for more information.
The table shows Fund-level ongoing expenses and can help you understand these expenses and compare them with those of other mutual funds offered through the Contract. The table assumes a $1,000 investment held for the six months indicated. Please refer to the Fund prospectus for additional information on operating expenses.
Actual Fund Expenses
The first line (Actual) of the table provides actual account values and expenses. The “Ending Account Value” is derived from the Fund’s actual return, which includes the effect of ongoing Fund expenses, but does not include the effect of ongoing Contract expenses.
You can estimate the Fund-level expenses you incurred during the period by following these steps. Of course, your account value and expenses will differ from those in this illustration:
| 1. | Divide your account value by $1,000. |
If an account had an $8,600 value, then $8,600 ÷ $1,000 = 8.6.
| 2. | Multiply the result by the number under the heading “Fund-Level Expenses Incurred During Period.” |
If Fund-Level Expenses Incurred During Period were $7.50, then 8.6 × $7.50 = $64.50.
In this illustration, the estimated expenses incurred this period at the Fund level are $64.50.
Hypothetical Example for Comparison with Other Mutual Funds
Information in the second line (Hypothetical) of the table can help you compare ongoing expenses of the Fund with those of other mutual funds offered through the Contract. This information may not be used to estimate the actual ending account balance or expenses you incurred during the period. The hypothetical “Ending Account Value” is based on the Fund’s actual expense ratio and an assumed 5% annual rate of return before expenses, which does not represent the Fund’s actual return. The figure under the heading “Fund-Level Expenses Incurred During Period” shows the hypothetical expenses your account would have incurred under this scenario. You can compare this figure with the 5% hypothetical examples that appear in shareholder reports of other funds offered through a Contract.
| Class 1 | Beginning Account Value 1/1/15 | Ending Account Value 6/30/15 | Fund-Level Expenses Incurred During Period* 1/1/15–6/30/15 | |||||||||
Actual | $ | 1,000 | $ | 971.50 | $ | 5.43 | ||||||
Hypothetical (5% return before expenses) | $ | 1,000 | $ | 1,019.29 | $ | 5.56 | ||||||
*Expenses are calculated using the most recent six-month annualized expense ratio for the Fund’s Class 1 shares (1.11%), which does not include any ongoing expenses of the Contract for which the Fund is an investment option, multiplied by the average account value over the period, multiplied by 181/365 to reflect the one-half year period.
| FGR-6 | Semiannual Report |
FRANKLIN TEMPLETON VARIABLE INSURANCE PRODUCTS TRUST
Financial Highlights
Franklin Global Real Estate VIP Fund
| Six Months Ended June 30, 2015 (unaudited) | Year Ended December 31, | |||||||||||||||||||||||
| 2014 | 2013 | 2012 | 2011 | 2010 | ||||||||||||||||||||
| Class 1 | ||||||||||||||||||||||||
| Per share operating performance (for a share outstanding throughout the period) | ||||||||||||||||||||||||
Net asset value, beginning of period | $16.36 | $14.29 | $14.66 | $11.47 | $13.12 | $11.16 | ||||||||||||||||||
|
| |||||||||||||||||||||||
| Income from investment operationsa: | ||||||||||||||||||||||||
Net investment incomeb | 0.09 | 0.26 | 0.24 | 0.25 | 0.21 | 0.38 | ||||||||||||||||||
Net realized and unrealized gains (losses) | (0.55 | ) | 1.92 | 0.13 | 2.94 | (0.83 | ) | 1.94 | ||||||||||||||||
|
| |||||||||||||||||||||||
Total from investment operations | (0.46 | ) | 2.18 | 0.37 | 3.19 | (0.62 | ) | 2.32 | ||||||||||||||||
|
| |||||||||||||||||||||||
Less distributions from net investment income and net foreign currency gains | (0.55 | ) | (0.11 | ) | (0.74 | ) | — | (1.03 | ) | (0.36 | ) | |||||||||||||
|
| |||||||||||||||||||||||
Net asset value, end of period | $15.35 | $16.36 | $14.29 | $14.66 | $11.47 | $13.12 | ||||||||||||||||||
|
| |||||||||||||||||||||||
Total returnc | (2.85)% | 15.27% | 2.61% | 27.81% | (5.45)% | 21.24% | ||||||||||||||||||
| Ratios to average net assetsd | ||||||||||||||||||||||||
Expenses before waiver and payments by affiliates | 1.11% | 1.10% | 1.10% | 1.11% | 1.12% | 1.11% | ||||||||||||||||||
Expenses net of waiver and payments by affiliates | 1.11% | 1.10% | e | 1.10% | 1.07% | 0.98% | 0.86% | |||||||||||||||||
Net investment income | 1.06% | 1.66% | 1.62% | 1.92% | 1.64% | 3.24% | ||||||||||||||||||
| Supplemental data | ||||||||||||||||||||||||
Net assets, end of period (000’s) | $33,250 | $35,686 | $34,276 | $38,329 | $33,670 | $40,430 | ||||||||||||||||||
Portfolio turnover rate | 12.22% | 16.67% | 21.29% | 22.29% | 28.95% | 76.52% | ||||||||||||||||||
aThe amount shown for a share outstanding throughout the period may not correlate with the Statement of Operations for the period due to the timing of sales and repurchases of the Fund’s shares in relation to income earned and/or fluctuating fair value of the investments of the Fund.
bBased on average daily shares outstanding.
cTotal return does not include fees, charges or expenses imposed by the variable annuity and life insurance contracts for which Franklin Templeton Variable Insurance Products Trust serves as an underlying investment vehicle. Total return is not annualized for periods less than one year.
dRatios are annualized for periods less than one year.
eBenefit of expense reduction rounds to less than 0.01%.
| The accompanying notes are an integral part of these financial statements. | Semiannual Report | FGR-7 |
FRANKLIN TEMPLETON VARIABLE INSURANCE PRODUCTS TRUST
FINANCIAL HIGHLIGHTS
Franklin Global Real Estate VIP Fund (continued)
Six Months Ended (unaudited) | Year Ended December 31, | |||||||||||||||||||||||
| 2014 | 2013 | 2012 | 2011 | 2010 | ||||||||||||||||||||
| Class 2 | ||||||||||||||||||||||||
Per share operating performance (for a share outstanding throughout the period) | ||||||||||||||||||||||||
Net asset value, beginning of period | $15.95 | $13.93 | $14.27 | $11.20 | $12.83 | $10.92 | ||||||||||||||||||
|
| |||||||||||||||||||||||
| Income from investment operationsa: | ||||||||||||||||||||||||
Net investment incomeb | 0.07 | 0.21 | 0.20 | 0.21 | 0.17 | 0.34 | ||||||||||||||||||
Net realized and unrealized gains (losses) | (0.53 | ) | 1.88 | 0.13 | 2.86 | (0.81 | ) | 1.90 | ||||||||||||||||
|
| |||||||||||||||||||||||
Total from investment operations | (0.46 | ) | 2.09 | 0.33 | 3.07 | (0.64 | ) | 2.24 | ||||||||||||||||
|
| |||||||||||||||||||||||
Less distributions from net investment income and net foreign currency gains | (0.51 | ) | (0.07 | ) | (0.67 | ) | — | (0.99 | ) | (0.33 | ) | |||||||||||||
|
| |||||||||||||||||||||||
Net asset value, end of period | $14.98 | $15.95 | $13.93 | $14.27 | $11.20 | $12.83 | ||||||||||||||||||
|
| |||||||||||||||||||||||
Total returnc | (2.93)% | 15.01% | 2.32% | 27.41% | (5.65)% | 20.97% | ||||||||||||||||||
| Ratios to average net assetsd | ||||||||||||||||||||||||
Expenses before waiver and payments by affiliates | 1.36% | 1.35% | 1.35% | 1.36% | 1.37% | 1.36% | ||||||||||||||||||
Expenses net of waiver and payments by affiliates | 1.36% | 1.35% | e | 1.35% | 1.32% | 1.23% | 1.11% | |||||||||||||||||
Net investment income | 0.81% | 1.41% | 1.37% | 1.67% | 1.39% | 2.99% | ||||||||||||||||||
| Supplemental data | ||||||||||||||||||||||||
Net assets, end of period (000’s) | $304,371 | $333,554 | $328,825 | $344,044 | $292,356 | $352,854 | ||||||||||||||||||
Portfolio turnover rate | 12.22% | 16.67% | 21.29% | 22.29% | 28.95% | 76.52% | ||||||||||||||||||
aThe amount shown for a share outstanding throughout the period may not correlate with the Statement of Operations for the period due to the timing of sales and repurchases of the Fund’s shares in relation to income earned and/or fluctuating fair value of the investments of the Fund.
bBased on average daily shares outstanding.
cTotal return does not include fees, charges or expenses imposed by the variable annuity and life insurance contracts for which Franklin Templeton Variable Insurance Products Trust serves as an underlying investment vehicle. Total return is not annualized for periods less than one year.
dRatios are annualized for periods less than one year.
eBenefit of expense reduction rounds to less than 0.01%.
| FGR-8 | Semiannual Report | The accompanying notes are an integral part of these financial statements. |
FRANKLIN TEMPLETON VARIABLE INSURANCE PRODUCTS TRUST
Statement of Investments, June 30, 2015 (unaudited)
Franklin Global Real Estate VIP Fund
| ||||||||||||||
| Country | Shares/Warrants | Value | ||||||||||||
Common Stocks and Other Equity Interests 99.1% | ||||||||||||||
Diversified Real Estate Activities 10.8% | ||||||||||||||
CapitaLand Ltd. | Singapore | 1,527,462 | $ | 3,969,201 | ||||||||||
Mitsubishi Estate Co. Ltd. | Japan | 404,360 | 8,710,639 | |||||||||||
Mitsui Fudosan Co. Ltd. | Japan | 434,857 | 12,176,280 | |||||||||||
Sun Hung Kai Properties Ltd. | Hong Kong | 338,533 | 5,498,353 | |||||||||||
Sun Hung Kai Properties Ltd., wts., 4/22/16 | Hong Kong | 30,644 | 108,911 | |||||||||||
Tokyo Tatemono Co. Ltd. | Japan | 183,408 | 2,547,535 | |||||||||||
The Wharf Holdings Ltd. | Hong Kong | 509,906 | 3,394,264 | |||||||||||
|
| |||||||||||||
| 36,405,183 | ||||||||||||||
|
| |||||||||||||
Diversified REITs 10.6% | ||||||||||||||
| a | Activia Properties Inc., 144A | Japan | 235 | 1,991,135 | ||||||||||
American Assets Trust Inc. | United States | 63,039 | 2,471,759 | |||||||||||
British Land Co. PLC | United Kingdom | 366,131 | 4,564,147 | |||||||||||
Canadian REIT | Canada | 52,814 | 1,794,999 | |||||||||||
Duke Realty Corp. | United States | 116,000 | 2,154,120 | |||||||||||
Hulic REIT Inc. | Japan | 537 | 765,200 | |||||||||||
| a | Hulic REIT Inc., 144A | Japan | 1,101 | 1,568,873 | ||||||||||
Kenedix Office Investment Corp. | Japan | 533 | 2,673,928 | |||||||||||
Land Securities Group PLC | United Kingdom | 316,181 | 5,980,513 | |||||||||||
Mirvac Group | Australia | 1,517,712 | 2,165,631 | |||||||||||
Stockland | Australia | 1,126,314 | 3,561,777 | |||||||||||
Suntec REIT | Singapore | 1,410,030 | 1,805,852 | |||||||||||
Wereldhave N.V. | Netherlands | 30,388 | 1,724,791 | |||||||||||
WP Carey Inc. | United States | 43,626 | 2,571,316 | |||||||||||
|
| |||||||||||||
| 35,794,041 | ||||||||||||||
|
| |||||||||||||
Health Care REITs 6.0% | ||||||||||||||
HCP Inc. | United States | 127,141 | 4,636,832 | |||||||||||
Health Care REIT Inc. | United States | 96,264 | 6,317,807 | |||||||||||
OMEGA Healthcare Investors Inc. | United States | 46,000 | 1,579,180 | |||||||||||
Sabra Health Care REIT Inc. | United States | 68,626 | 1,766,433 | |||||||||||
Ventas Inc. | United States | 95,487 | 5,928,788 | |||||||||||
|
| |||||||||||||
| 20,229,040 | ||||||||||||||
|
| |||||||||||||
Hotel & Resort REITs 3.7% | ||||||||||||||
Hoshino Resorts REIT Inc. | Japan | 83 | 917,551 | |||||||||||
Host Hotels & Resorts Inc. | United States | 199,967 | 3,965,346 | |||||||||||
Pebblebrook Hotel Trust | United States | 84,222 | 3,611,439 | |||||||||||
Summit Hotel Properties Inc. | United States | 110,600 | 1,438,906 | |||||||||||
Sunstone Hotel Investors Inc. | United States | 159,537 | 2,394,650 | |||||||||||
|
| |||||||||||||
| 12,327,892 | ||||||||||||||
|
| |||||||||||||
Hotels, Resorts & Cruise Lines 0.9% | ||||||||||||||
| b | Hilton Worldwide Holdings Inc. | United States | 62,190 | 1,713,334 | ||||||||||
Melia Hotels International SA | Spain | 113,533 | 1,498,078 | |||||||||||
|
| |||||||||||||
| 3,211,412 | ||||||||||||||
|
| |||||||||||||
Industrial REITs 5.4% | ||||||||||||||
First Industrial Realty Trust Inc. | United States | 96,300 | 1,803,699 | |||||||||||
Goodman Group | Australia | 873,626 | 4,224,900 | |||||||||||
Mapletree Logistics Trust | Singapore | 1,756,030 | 1,473,245 | |||||||||||
Nippon Prologis REIT Inc. | Japan | 1,498 | 2,758,797 | |||||||||||
PLA Administradora Industrial S de RL de CV | Mexico | 383,400 | 750,065 | |||||||||||
| Semiannual Report | FGR-9 |
FRANKLIN TEMPLETON VARIABLE INSURANCE PRODUCTS TRUST
STATEMENT OF INVESTMENTS (UNAUDITED)
Franklin Global Real Estate VIP Fund (continued)
| Country | Shares/Warrants | Value | ||||||||||||
Common Stocks and Other Equity Interests (continued) | ||||||||||||||
Industrial REITs (continued) | ||||||||||||||
| a | PLA Administradora Industrial S de RL de CV, 144A | Mexico | 354,370 | $ | 693,272 | |||||||||
Prologis Inc. | United States | 175,664 | 6,517,134 | |||||||||||
|
| |||||||||||||
| 18,221,112 | ||||||||||||||
|
| |||||||||||||
Office REITs 14.0% | ||||||||||||||
Alexandria Real Estate Equities Inc. | United States | 49,907 | 4,364,866 | |||||||||||
Boston Properties Inc. | United States | 55,380 | 6,703,195 | |||||||||||
Brandywine Realty Trust | United States | 85,546 | 1,136,051 | |||||||||||
Coresite Realty Corp. | United States | 30,887 | 1,403,505 | |||||||||||
CyrusOne Inc. | United States | 45,400 | 1,337,030 | |||||||||||
Daiwa Office Investment Corp. | Japan | 70 | 335,158 | |||||||||||
| a | Daiwa Office Investment Corp., 144A | Japan | 198 | 948,019 | ||||||||||
Derwent London PLC | United Kingdom | 74,799 | 3,997,664 | |||||||||||
Digital Realty Trust Inc. | United States | 22,443 | 1,496,499 | |||||||||||
Great Portland Estates PLC | United Kingdom | 310,426 | 3,784,391 | |||||||||||
Highwoods Properties Inc. | United States | 55,217 | 2,205,919 | |||||||||||
Japan Real Estate Investment Corp. | Japan | 466 | 2,116,971 | |||||||||||
Kilroy Realty Corp. | United States | 72,018 | 4,836,009 | |||||||||||
Paramount Group Inc. | United States | 97,590 | 1,674,645 | |||||||||||
SL Green Realty Corp. | United States | 41,493 | 4,559,666 | |||||||||||
Vornado Realty Trust | United States | 66,568 | 6,319,300 | |||||||||||
|
| |||||||||||||
| 47,218,888 | ||||||||||||||
|
| |||||||||||||
Real Estate Development 1.8% | ||||||||||||||
China Overseas Land & Investment Ltd. | China | 500,657 | 1,772,917 | |||||||||||
China Resources Land Ltd. | China | 268,000 | 869,518 | |||||||||||
KWG Property Holdings Ltd. | China | 1,513,000 | 1,274,553 | |||||||||||
Sino Land Co. Ltd. | Hong Kong | 1,332,288 | 2,230,893 | |||||||||||
|
| |||||||||||||
| 6,147,881 | ||||||||||||||
|
| |||||||||||||
Real Estate Operating Companies 8.5% | ||||||||||||||
Brookfield Property Partners LP | United States | 106,100 | 2,346,263 | |||||||||||
Castellum AB | Sweden | 93,920 | 1,319,491 | |||||||||||
Deutsche Annington Immobilien SE | Germany | 117,513 | 3,313,348 | |||||||||||
Deutsche Euroshop AG | Germany | 34,187 | 1,500,747 | |||||||||||
| a | Deutsche Euroshop AG, 144A | Germany | 8,259 | 362,555 | ||||||||||
Global Logistic Properties Ltd. | Singapore | 1,486,170 | 2,791,603 | |||||||||||
Hemfosa Fastigheter AB | Sweden | 74,730 | 761,507 | |||||||||||
| a | Hemfosa Fastigheter AB, 144A | Sweden | 77,200 | 786,677 | ||||||||||
| a,b | Hispania Activos Inmobiliarios SAU, 144A | Spain | 34,316 | 503,284 | ||||||||||
Hong Kong Land Holdings Ltd. | Hong Kong | 828,943 | 6,797,332 | |||||||||||
Hufvudstaden AB, A | Sweden | 157,946 | 1,921,862 | |||||||||||
Hysan Development Co. Ltd. | Hong Kong | 500,347 | 2,165,557 | |||||||||||
LEG Immobilien AG | Germany | 5,690 | 395,185 | |||||||||||
| a | LEG Immobilien AG, 144A | Germany | 33,110 | 2,299,573 | ||||||||||
Unite Group PLC | United Kingdom | 167,585 | 1,504,623 | |||||||||||
| a | Unite Group PLC, 144A | United Kingdom | 9,344 | 83,893 | ||||||||||
|
| |||||||||||||
| 28,853,500 | ||||||||||||||
|
| |||||||||||||
Residential REITs 9.8% | ||||||||||||||
Apartment Investment & Management Co., A | United States | 94,705 | 3,497,456 | |||||||||||
AvalonBay Communities Inc. | United States | 33,467 | 5,350,369 | |||||||||||
Equity Lifestyle Properties Inc. | United States | 56,400 | 2,965,512 | |||||||||||
| FGR-10 | Semiannual Report |
FRANKLIN TEMPLETON VARIABLE INSURANCE PRODUCTS TRUST
STATEMENT OF INVESTMENTS (UNAUDITED)
Franklin Global Real Estate VIP Fund (continued)
| Country | Shares/Warrants | Value | ||||||||||||
Common Stocks and Other Equity Interests (continued) | ||||||||||||||
Residential REITs (continued) | ||||||||||||||
Equity Residential | United States | 128,928 | $ | 9,046,878 | ||||||||||
Essex Property Trust Inc. | United States | 28,005 | 5,951,062 | |||||||||||
Invincible Investment Corp. | Japan | 3,538 | 1,887,666 | |||||||||||
UDR Inc. | United States | 136,131 | 4,360,276 | |||||||||||
|
| |||||||||||||
| 33,059,219 | ||||||||||||||
|
| |||||||||||||
Retail REITs 23.9% | ||||||||||||||
Brixmor Property Group Inc. | United States | 73,400 | 1,697,742 | |||||||||||
CapitaLand Mall Trust | Singapore | 384,879 | 614,366 | |||||||||||
Eurocommercial Properties NV, IDR | Netherlands | 34,695 | 1,446,296 | |||||||||||
Federal Realty Investment Trust | United States | 24,409 | 3,126,549 | |||||||||||
General Growth Properties Inc. | United States | 225,617 | 5,789,332 | |||||||||||
Hammerson PLC | United Kingdom | 409,353 | 3,958,241 | |||||||||||
| a,b | Kenedix Retail REIT Corp., 144A | Japan | 360 | 854,482 | ||||||||||
Kimco Realty Corp. | United States | 76,869 | 1,732,627 | |||||||||||
Klepierre | France | 83,400 | 3,667,150 | |||||||||||
The Link REIT | Hong Kong | 866,788 | 5,082,210 | |||||||||||
The Macerich Co. | United States | 44,164 | 3,294,635 | |||||||||||
Realty Income Corp. | United States | 86,303 | 3,830,990 | |||||||||||
Regency Centers Corp. | United States | 63,193 | 3,727,123 | |||||||||||
RioCan REIT | Canada | 92,026 | 1,972,407 | |||||||||||
Scentre Group | Australia | 1,303,403 | 3,769,930 | |||||||||||
Simon Property Group Inc. | United States | 93,608 | 16,196,056 | |||||||||||
Taubman Centers Inc. | United States | 34,582 | 2,403,449 | |||||||||||
Unibail-Rodamco SE | France | 40,804 | 10,308,960 | |||||||||||
Weingarten Realty Investors | United States | 73,510 | 2,403,042 | |||||||||||
Westfield Corp. | Australia | 680,562 | 4,787,247 | |||||||||||
|
| |||||||||||||
| 80,662,834 | ||||||||||||||
|
| |||||||||||||
Specialized REITs 3.7% | ||||||||||||||
CubeSmart | United States | 128,484 | 2,975,689 | |||||||||||
Extra Space Storage Inc. | United States | 57,504 | 3,750,411 | |||||||||||
Public Storage | United States | 30,614 | 5,644,303 | |||||||||||
|
| |||||||||||||
| 12,370,403 | ||||||||||||||
|
| |||||||||||||
Total Common Stocks and Other Equity Interests (Cost $222,863,443) | 334,501,405 | |||||||||||||
|
| |||||||||||||
| Semiannual Report | FGR-11 |
FRANKLIN TEMPLETON VARIABLE INSURANCE PRODUCTS TRUST
STATEMENT OF INVESTMENTS (UNAUDITED)
Franklin Global Real Estate VIP Fund (continued)
| Country | Principal Amount | Value | ||||||||||||
Short Term Investments (Cost $2,739,889) 0.8% | ||||||||||||||
Repurchase Agreements 0.8% | ||||||||||||||
| c | Joint Repurchase Agreement, 0.095%, 7/01/15 | | United States | | $ | 2,739,889 | | $ | 2,739,889 | | ||||
BNP Paribas Securities Corp. (Maturity Value $672,371) | ||||||||||||||
HSBC Securities (USA) Inc. (Maturity Value $1,411,978) | ||||||||||||||
Merrill Lynch, Pierce, Fenner & Smith Inc. (Maturity Value $655,548) | ||||||||||||||
Collateralized by U.S. Government Agency Securities, | ||||||||||||||
|
| |||||||||||||
Total Investments (Cost $225,603,332) 99.9% | 337,241,294 | |||||||||||||
Other Assets, less Liabilities 0.1% | 380,057 | |||||||||||||
|
| |||||||||||||
Net Assets 100.0% | $ | 337,621,351 | ||||||||||||
|
| |||||||||||||
See Abbreviations on page FGR-22.
aSecurity was purchased pursuant to Rule 144A under the Securities Act of 1933 and may be sold in transactions exempt from registration only to qualified institutional buyers or in a public offering registered under the Securities Act of 1933. These securities have been deemed liquid under guidelines approved by the Trust’s Board of Trustees. At June 30, 2015, the aggregate value of these securities was $10,091,763, representing 2.99% of net assets.
bNon-income producing.
cSee Note 1(c) regarding joint repurchase agreement.
dThe security is traded on a discount basis with no stated coupon rate.
| FGR-12 | Semiannual Report | The accompanying notes are an integral part of these financial statements. |
FRANKLIN TEMPLETON VARIABLE INSURANCE PRODUCTS TRUST
Financial Statements
Statement of Assets and Liabilities
June 30, 2015 (unaudited)
| Franklin Global Real Estate VIP Fund | ||||
Assets: | ||||
Investments in securities: | ||||
Cost - Unaffiliated issuers | $ | 222,863,443 | ||
Cost - Repurchase agreements | 2,739,889 | |||
|
| |||
Total cost of investments | $ | 225,603,332 | ||
|
| |||
Value - Unaffiliated issuers | $ | 334,501,405 | ||
Value - Repurchase agreements | 2,739,889 | |||
|
| |||
Total value of investments | 337,241,294 | |||
Foreign currency, at value (cost $56,736) | 56,685 | |||
Receivables: | ||||
Capital shares sold | 24,225 | |||
Dividends | 1,218,028 | |||
Other assets | 163 | |||
|
| |||
Total assets | 338,540,395 | |||
|
| |||
Liabilities: | ||||
Payables: | ||||
Capital shares redeemed | 359,002 | |||
Management fees | 299,646 | |||
Distribution fees | 133,668 | |||
Reports to shareholders | 84,873 | |||
Accrued expenses and other liabilities | 41,855 | |||
|
| |||
Total liabilities | 919,044 | |||
|
| |||
Net assets, at value | $ | 337,621,351 | ||
|
| |||
Net assets consist of: | ||||
Paid-in capital | $ | 549,021,184 | ||
Distributions in excess of net investment income | (5,741,120 | ) | ||
Net unrealized appreciation (depreciation) | 111,633,545 | |||
Accumulated net realized gain (loss) | (317,292,258 | ) | ||
|
| |||
Net assets, at value | $ | 337,621,351 | ||
|
| |||
| Class 1: | ||||
Net assets, at value | $ | 33,249,888 | ||
|
| |||
Shares outstanding | 2,165,712 | |||
|
| |||
Net asset value and maximum offering price per share | $ | 15.35 | ||
|
| |||
| Class 2: | ||||
Net assets, at value | $ | 304,371,463 | ||
|
| |||
Shares outstanding | 20,322,711 | |||
|
| |||
Net asset value and maximum offering price per share | $ | 14.98 | ||
|
| |||
| The accompanying notes are an integral part of these financial statements. | Semiannual Report | FGR-13 |
FRANKLIN TEMPLETON VARIABLE INSURANCE PRODUCTS TRUST
FINANCIAL STATEMENTS
Statement of Operations
for the six months ended June 30, 2015 (unaudited)
| Franklin Global Real Estate VIP Fund | ||||
Investment income: | ||||
Dividends (net of foreign taxes of $216,802) | $ | 3,980,100 | ||
Interest | 872 | |||
|
| |||
Total investment income | 3,980,972 | |||
|
| |||
Expenses: | ||||
Management fees (Note 3a) | 1,927,989 | |||
Distribution fees - Class 2 (Note 3c) | 413,535 | |||
Custodian fees (Note 4) | 15,644 | |||
Reports to shareholders | 43,179 | |||
Professional fees | 34,088 | |||
Trustees’ fees and expenses | 789 | |||
Other | 8,389 | |||
|
| |||
Total expenses | 2,443,613 | |||
|
| |||
Net investment income | 1,537,359 | |||
|
| |||
Realized and unrealized gains (losses): | ||||
Net realized gain (loss) from: | ||||
Investments | 15,141,287 | |||
Realized gain distributions from REITs | 1,431,733 | |||
Foreign currency transactions | 2,393 | |||
|
| |||
Net realized gain (loss) | 16,575,413 | |||
|
| |||
Net change in unrealized appreciation (depreciation) on: | ||||
Investments | (27,627,670 | ) | ||
Translation of other assets and liabilities denominated in foreign currencies | 3,433 | |||
|
| |||
Net change in unrealized appreciation (depreciation) | (27,624,237 | ) | ||
|
| |||
Net realized and unrealized gain (loss) | (11,048,824 | ) | ||
|
| |||
Net increase (decrease) in net assets resulting from operations | $ | (9,511,465 | ) | |
|
| |||
| FGR-14 | Semiannual Report | The accompanying notes are an integral part of these financial statements. |
FRANKLIN TEMPLETON VARIABLE INSURANCE PRODUCTS TRUST
FINANCIAL STATEMENTS
Statements of Changes in Net Assets
| Franklin Global Real Estate VIP Fund | ||||||||
| Six Months Ended June 30, 2015 (unaudited) | Year Ended December 31, 2014 | |||||||
Increase (decrease) in net assets: | ||||||||
Operations: | ||||||||
Net investment income | $ | 1,537,359 | $ | 5,302,835 | ||||
Net realized gain (loss) | 16,575,413 | 19,806,993 | ||||||
Net change in unrealized appreciation (depreciation) | (27,624,237 | ) | 26,399,081 | |||||
|
| |||||||
Net increase (decrease) in net assets resulting from operations | (9,511,465 | ) | 51,508,909 | |||||
|
| |||||||
Distributions to shareholders from: | ||||||||
Net investment income: | ||||||||
Class 1 | (1,164,404 | ) | (245,080 | ) | ||||
Class 2 | (10,130,962 | ) | (1,512,651 | ) | ||||
|
| |||||||
Total distributions to shareholders | (11,295,366 | ) | (1,757,731 | ) | ||||
|
| |||||||
Capital share transactions: (Note 2) | ||||||||
Class 1 | (356,624 | ) | (3,375,482 | ) | ||||
Class 2 | (10,455,273 | ) | (40,236,768 | ) | ||||
|
| |||||||
Total capital share transactions | (10,811,897 | ) | (43,612,250 | ) | ||||
|
| |||||||
Net increase (decrease) in net assets | (31,618,728 | ) | 6,138,928 | |||||
Net assets: | ||||||||
Beginning of period | 369,240,079 | 363,101,151 | ||||||
|
| |||||||
End of period | $ | 337,621,351 | $ | 369,240,079 | ||||
|
| |||||||
Undistributed net investment income (distributions in excess of net investment income) included in net assets: | ||||||||
End of period | $ | (5,741,120 | ) | $ | 4,016,887 | |||
|
| |||||||
| The accompanying notes are an integral part of these financial statements. | Semiannual Report | FGR-15 |
FRANKLIN TEMPLETON VARIABLE INSURANCE PRODUCTS TRUST
Notes to Financial Statements (unaudited)
Franklin Global Real Estate VIP Fund
1. Organization and Significant Accounting Policies
Franklin Templeton Variable Insurance Products Trust (Trust) is registered under the Investment Company Act of 1940 (1940 Act) as an open-end management investment company, consisting of nineteen separate funds and applies the specialized accounting and reporting guidance in U.S. Generally Accepted Accounting Principles (U.S. GAAP). Franklin Global Real Estate VIP Fund (Fund) is included in this report. The financial statements of the remaining funds in the Trust are presented separately. Shares of the Fund are generally sold only to insurance company separate accounts to fund the benefits of variable life insurance policies or variable annuity contracts. At June 30, 2015, 59.81% of the Fund’s shares were held through one insurance company. Investment activities of these insurance company separate accounts could have a material impact on the Fund. The Fund offers two classes of shares: Class 1 and Class 2. Each class of shares differs by its distribution fees, voting rights on matters affecting a single class and its exchange privilege.
The following summarizes the Fund’s significant accounting policies.
a. Financial Instrument Valuation
The Fund’s investments in financial instruments are carried at fair value daily. Fair value is the price that would be received to sell an asset or paid to transfer a liability in an orderly transaction between market participants on the measurement date. The Fund calculates the net asset value per share at the close of the New York Stock Exchange (NYSE), generally at 4 p.m. Eastern time (NYSE close) on each day the NYSE is open for trading. Under compliance policies and procedures approved by the Trust’s Board of Trustees (the Board), the Fund’s administrator has responsibility for oversight of valuation, including leading the cross-functional Valuation and Liquidity Oversight Committee (VLOC). The VLOC provides administration and oversight of the Fund’s valuation policies and procedures, which are approved annually by the Board. Among other things, these procedures allow the Fund to utilize independent pricing services, quotations from securities and financial instrument dealers, and other market sources to determine fair value.
Equity securities listed on an exchange or on the NASDAQ National Market System are valued at the last quoted sale price or the official closing price of the day, respectively. Foreign equity securities are valued as of the close of trading on the
foreign stock exchange on which the security is primarily traded or as of the NYSE close, whichever is earlier. The value is then converted into its U.S. dollar equivalent at the foreign exchange rate in effect at the NYSE close on the day that the value of the security is determined. Over-the-counter (OTC) securities are valued within the range of the most recent quoted bid and ask prices. Securities that trade in multiple markets or on multiple exchanges are valued according to the broadest and most representative market. Certain equity securities are valued based upon fundamental characteristics or relationships to similar securities. Repurchase agreements are valued at cost, which approximates fair value.
The Fund has procedures to determine the fair value of financial instruments for which market prices are not reliable or readily available. Under these procedures, the VLOC convenes on a regular basis to review such financial instruments and considers a number of factors, including significant unobservable valuation inputs, when arriving at fair value. The VLOC primarily employs a market-based approach which may use related or comparable assets or liabilities, recent transactions, market multiples, book values, and other relevant information for the investment to determine the fair value of the investment. An income-based valuation approach may also be used in which the anticipated future cash flows of the investment are discounted to calculate fair value. Discounts may also be applied due to the nature or duration of any restrictions on the disposition of the investments. Due to the inherent uncertainty of valuations of such investments, the fair values may differ significantly from the values that would have been used had an active market existed. The VLOC employs various methods for calibrating these valuation approaches including a regular review of key inputs and assumptions, transactional back-testing or disposition analysis, and reviews of any related market activity.
Trading in securities on foreign securities stock exchanges and OTC markets may be completed before the daily NYSE close. In addition, trading in certain foreign markets may not take place on every NYSE business day. Occasionally, events occur between the time at which trading in a foreign security is completed and the close of the NYSE that might call into question the reliability of the value of a portfolio security held by the Fund. As a result, differences may arise between the value of the Fund’s portfolio securities as determined at the foreign market close and the latest indications of value at the close of the NYSE. In order to minimize the potential for these differences, the VLOC monitors price movements following the close
| FGR-16 | Semiannual Report |
FRANKLIN TEMPLETON VARIABLE INSURANCE PRODUCTS TRUST
NOTES TO FINANCIAL STATEMENTS (UNAUDITED)
Franklin Global Real Estate VIP Fund (continued)
of trading in foreign stock markets through a series of country specific market proxies (such as baskets of American Depositary Receipts, futures contracts and exchange traded funds). These price movements are measured against established trigger thresholds for each specific market proxy to assist in determining if an event has occurred that may call into question the reliability of the values of the foreign securities held by the Fund. If such an event occurs, the securities may be valued using fair value procedures, which may include the use of independent pricing services.
When the last day of the reporting period is a non-business day, certain foreign markets may be open on those days that the NYSE is closed, which could result in differences between the value of the Fund’s portfolio securities on the last business day and the last calendar day of the reporting period. Any significant security valuation changes due to an open foreign market are adjusted and reflected by the Fund for financial reporting purposes.
b. Foreign Currency Translation
Portfolio securities and other assets and liabilities denominated in foreign currencies are translated into U.S. dollars based on the exchange rate of such currencies against U.S. dollars on the date of valuation. The Fund may enter into foreign currency exchange contracts to facilitate transactions denominated in a foreign currency. Purchases and sales of securities, income and expense items denominated in foreign currencies are translated into U.S. dollars at the exchange rate in effect on the transaction date. Portfolio securities and assets and liabilities denominated in foreign currencies contain risks that those currencies will decline in value relative to the U.S. dollar. Occasionally, events may impact the availability or reliability of foreign exchange rates used to convert the U.S. dollar equivalent value. If such an event occurs, the foreign exchange rate will be valued at fair value using procedures established and approved by the Board.
The Fund does not separately report the effect of changes in foreign exchange rates from changes in market prices on securities held. Such changes are included in net realized and unrealized gain or loss from investments in the Statement of Operations.
Realized foreign exchange gains or losses arise from sales of foreign currencies, currency gains or losses realized between the trade and settlement dates on securities transactions and the difference between the recorded amounts of dividends, interest,
and foreign withholding taxes and the U.S. dollar equivalent of the amounts actually received or paid. Net unrealized foreign exchange gains and losses arise from changes in foreign exchange rates on foreign denominated assets and liabilities other than investments in securities held at the end of the reporting period.
c. Joint Repurchase Agreement
The Fund enters into a joint repurchase agreement whereby its uninvested cash balance is deposited into a joint cash account with other funds managed by the investment manager or an affiliate of the investment manager and is used to invest in one or more repurchase agreements. The value and face amount of the joint repurchase agreement are allocated to the funds based on their pro-rata interest. A repurchase agreement is accounted for as a loan by the Fund to the seller, collateralized by securities which are delivered to the Fund’s custodian. The fair value, including accrued interest, of the initial collateralization is required to be at least 102% of the dollar amount invested by the funds, with the value of the underlying securities marked to market daily to maintain coverage of at least 100%. Repurchase agreements are subject to the terms of Master Repurchase Agreements (MRAs) with approved counterparties (sellers). The MRAs contain various provisions, including but not limited to events of default and maintenance of collateral for repurchase agreements. In the event of default by either the seller or the Fund, certain MRAs may permit the non-defaulting party to net and close-out all transactions, if any, traded under such agreements. The Fund may sell securities it holds as collateral and apply the proceeds towards the repurchase price and any other amounts owed by the seller to the Fund in the event of default by the seller. This could involve costs or delays in addition to a loss on the securities if their value falls below the repurchase price owed by the seller. The joint repurchase agreement held by the Fund at period end, as indicated in the Statement of Investments, had been entered into on June 30, 2015.
d. Income and Deferred Taxes
It is the Fund’s policy to qualify as a regulated investment company under the Internal Revenue Code. The Fund intends to distribute to shareholders substantially all of its taxable income and net realized gains to relieve it from federal income and if applicable, excise taxes. As a result, no provision for U.S. federal income taxes is required.
The Fund may be subject to foreign taxation related to income received, capital gains on the sale of securities and certain for-
| Semiannual Report | FGR-17 |
FRANKLIN TEMPLETON VARIABLE INSURANCE PRODUCTS TRUST
NOTES TO FINANCIAL STATEMENTS (UNAUDITED)
Franklin Global Real Estate VIP Fund (continued)
1. Organization and Significant Accounting Policies (continued)
d. Income and Deferred Taxes (continued)
eign currency transactions in the foreign jurisdictions in which it invests. Foreign taxes, if any, are recorded based on the tax regulations and rates that exist in the foreign markets in which the Fund invests. When a capital gain tax is determined to apply, the Fund records an estimated deferred tax liability in an amount that would be payable if the securities were disposed of on the valuation date. As a result of several court cases, in certain countries across the European Union, the Fund has filed additional tax reclaims for previously withheld taxes on dividends earned in those countries. These additional filings are subject to various administrative proceedings by the local jurisdictions’ tax authorities within the European Union, as well as a number of related judicial proceedings. At this time, uncertainty exists as to the ultimate resolution of these proceedings, the likelihood of receipt of these reclaims, and the potential timing of payment, and accordingly, no amounts are reflected in the financial statements.
The Fund recognizes the tax benefits of uncertain tax positions only when the position is “more likely than not” to be sustained upon examination by the tax authorities based on the technical merits of the tax position. As of June 30, 2015, and for all open tax years, the Fund has determined that no liability for unrecognized tax benefits is required in the Fund’s financial statements related to uncertain tax positions taken on a tax return (or expected to be taken on future tax returns). Open tax years are those that remain subject to examination and are based on each tax jurisdiction’s statute of limitation.
e. Security Transactions, Investment Income, Expenses and Distributions
Security transactions are accounted for on trade date. Realized gains and losses on security transactions are determined on a specific identification basis. Interest income and estimated expenses are accrued daily. Dividend income is recorded on the ex-dividend date except for certain dividends from foreign securities where the dividend rate is not available. In such cases, the dividend is recorded as soon as the information is received by the Fund. Distributions to shareholders are recorded on the ex-dividend date and are determined according to income tax regulations (tax basis). Distributable earnings determined on a tax basis may differ from earnings recorded in accordance with U.S. GAAP. These differences may be permanent or temporary.
Permanent differences are reclassified among capital accounts to reflect their tax character. These reclassifications have no impact on net assets or the results of operations. Temporary differences are not reclassified, as they may reverse in subsequent periods.
Common expenses incurred by the Trust are allocated among the funds based on the ratio of net assets of each fund to the combined net assets of the Trust. Fund specific expenses are charged directly to the fund that incurred the expense.
Realized and unrealized gains and losses and net investment income, not including class specific expenses, are allocated daily to each class of shares based upon the relative proportion of net assets of each class. Differences in per share distributions, by class, are generally due to differences in class specific expenses.
Distributions received by the Trust from certain securities may be a return of capital (ROC). Such distributions reduce the cost basis of the securities, and any distributions in excess of the cost basis are recognized as capital gains. For Real Estate Investment Trust (REIT) securities, the Fund records ROC estimates, if any, on the ex-dividend date and are adjusted once actual tax designations are known.
f. Accounting Estimates
The preparation of financial statements in accordance with U.S. GAAP requires management to make estimates and assumptions that affect the reported amounts of assets and liabilities at the date of the financial statements and the amounts of income and expenses during the reporting period. Actual results could differ from those estimates.
g. Guarantees and Indemnifications
Under the Trust’s organizational documents, its officers and trustees are indemnified by the Trust against certain liabilities arising out of the performance of their duties to the Trust. Additionally, in the normal course of business, the Trust, on behalf of the Fund, enters into contracts with service providers that contain general indemnification clauses. The Trust’s maximum exposure under these arrangements is unknown as this would involve future claims that may be made against the Trust that have not yet occurred. Currently, the Trust expects the risk of loss to be remote.
| FGR-18 | Semiannual Report |
FRANKLIN TEMPLETON VARIABLE INSURANCE PRODUCTS TRUST
NOTES TO FINANCIAL STATEMENTS (UNAUDITED)
Franklin Global Real Estate VIP Fund (continued)
2. Shares of Beneficial Interest
At June 30, 2015, there were an unlimited number of shares authorized (without par value). Transactions in the Fund’s shares were as follows:
| Six Months Ended June 30, 2015 | Year Ended December 31, 2014 | |||||||||||||||||
| Shares | Amount | Shares | Amount | |||||||||||||||
| Class 1 Shares: | ||||||||||||||||||
Shares sold | 15,913 | $ | 268,745 | 35,637 | $ | 504,194 | ||||||||||||
Shares issued in reinvestment of distributions | 74,498 | 1,164,404 | 15,710 | 245,080 | ||||||||||||||
Shares redeemed | (106,370 | ) | (1,789,773 | ) | (268,861 | ) | (4,124,756 | ) | ||||||||||
|
| |||||||||||||||||
Net increase (decrease) | (15,959 | ) | $ | (356,624 | ) | (217,514 | ) | $ | (3,375,482 | ) | ||||||||
|
| |||||||||||||||||
| Class 2 Shares: | ||||||||||||||||||
Shares sold | 334,853 | $ | 5,495,453 | 356,475 | $ | 5,291,990 | ||||||||||||
Shares issued in reinvestment of distributions | 664,325 | 10,130,962 | 99,321 | 1,512,651 | ||||||||||||||
Shares redeemed | (1,592,442 | ) | (26,081,688 | ) | (3,144,492 | ) | (47,041,409 | ) | ||||||||||
|
| |||||||||||||||||
Net increase (decrease) | (593,264 | ) | $ | (10,455,273 | ) | (2,688,696 | ) | $ | (40,236,768 | ) | ||||||||
|
| |||||||||||||||||
3. Transactions With Affiliates
Franklin Resources, Inc. is the holding company for various subsidiaries that together are referred to as Franklin Templeton Investments. Certain officers and trustees of the Fund are also officers and/or directors of the following subsidiaries:
| Subsidiary | Affiliation | |
Franklin Templeton Institutional, LLC (FT Institutional) | Investment manager | |
Franklin Templeton Services, LLC (FT Services) | Administrative manager | |
Franklin Templeton Distributors, Inc. (Distributors) | Principal underwriter | |
Franklin Templeton Investor Services, LLC (Investor Services) | Transfer agent |
a. Management Fees
The Fund pays an investment management fee to FT Institutional based on the average daily net assets of the Fund as follows:
| Annualized Fee Rate | Net Assets | |
1.050% | Up to and including $500 million | |
0.950% | Over $500 million, up to and including $1 billion | |
0.900% | Over $1 billion, up to and including $1.5 billion | |
0.850% | Over $1.5 billion, up to and including $6.5 billion | |
0.830% | Over $6.5 billion, up to and including $11.5 billion | |
0.810% | Over $11.5 billion, up to and including $16.5 billion | |
0.790% | Over $16.5 billion, up to and including $19 billion | |
0.780% | Over $19 billion, up to and including $21.5 billion | |
0.770% | In excess of $21.5 billion |
| Semiannual Report | FGR-19 |
FRANKLIN TEMPLETON VARIABLE INSURANCE PRODUCTS TRUST
NOTES TO FINANCIAL STATEMENTS (UNAUDITED)
Franklin Global Real Estate VIP Fund (continued)
3. Transactions With Affiliates (continued)
b. Administrative Fees
Under an agreement with FT Institutional, FT Services provides administrative services to the Fund. The fee is paid by FT Institutional based on the Fund’s average daily net assets, and is not an additional expense of the Fund.
c. Distribution Fees
The Board has adopted distribution plans for Class 2 shares pursuant to Rule 12b-1 under the 1940 Act. Under the Fund’s compensation distribution plan, the Fund pays Distributors for costs incurred in connection with the servicing, sale and distribution of the Fund’s shares up to 0.35% per year of its average daily net assets of Class 2. Some distribution fees are not charged on shares held by affiliates. The Board has agreed to limit the current rate to 0.25% per year for Class 2. The plan year, for purposes of monitoring compliance with the maximum annual plan rates, is February 1 through January 31.
d. Transfer Agent Fees
Investor Services, under terms of an agreement, performs shareholder servicing for the Fund and is not paid by the Fund for the services.
4. Expense Offset Arrangement
The Fund has entered into an arrangement with its custodian whereby credits realized as a result of uninvested cash balances are used to reduce a portion of the Fund’s custodian expenses. During the period ended June 30, 2015, there were no credits earned.
5. Income Taxes
For tax purposes, capital losses may be carried over to offset future capital gains. Capital loss carryforwards with no expiration, if any, must be fully utilized before those losses with expiration dates.
At December 31, 2014, capital loss carryforwards were as follows:
Capital loss carryforwards subject to expiration: | ||||
2016 | $ | 112,838,568 | ||
2017 | 207,448,609 | |||
2018 | 2,192,369 | |||
|
| |||
Total capital loss carryforwards | $ | 322,479,546 | ||
|
|
At June 30, 2015, the cost of investments and net unrealized appreciation (depreciation) for income tax purposes were as follows:
Cost of investments | $ | 243,680,938 | ||
|
| |||
Unrealized appreciation | $ | 100,805,074 | ||
Unrealized depreciation | (7,244,718 | ) | ||
|
| |||
Net unrealized appreciation (depreciation) | $ | 93,560,356 | ||
|
|
Differences between income and/or capital gains as determined on a book basis and a tax basis are primarily due to differing treatment of passive foreign investment company shares and wash sales.
6. Investment Transactions
Purchases and sales of investments (excluding short term securities) for the period ended June 30, 2015, aggregated $44,280,823 and $61,670,928, respectively.
| FGR-20 | Semiannual Report |
FRANKLIN TEMPLETON VARIABLE INSURANCE PRODUCTS TRUST
NOTES TO FINANCIAL STATEMENTS (UNAUDITED)
Franklin Global Real Estate VIP Fund (continued)
7. Concentration of Risk
Investing in foreign securities may include certain risks and considerations not typically associated with investing in U.S. securities, such as fluctuating currency values and changing local and regional economic, political and social conditions, which may result in greater market volatility. In addition, certain foreign securities may not be as liquid as U.S. securities.
The Fund invests a large percentage of its total assets in REIT securities. Such concentration may subject the Fund to special risks associated with real estate securities. These securities may be more sensitive to economic or regulatory developments due to a variety of factors such as local, regional, national and global economic conditions, interest rates and tax considerations.
8. Credit Facility
The Fund, together with other U.S. registered and foreign investment funds (collectively, Borrowers), managed by Franklin Templeton Investments, are borrowers in a joint syndicated senior unsecured credit facility totaling $2 billion (Global Credit Facility) which matures on February 12, 2016. This Global Credit Facility provides a source of funds to the Borrowers for temporary and emergency purposes, including the ability to meet future unanticipated or unusually large redemption requests.
Under the terms of the Global Credit Facility, the Fund shall, in addition to interest charged on any borrowings made by the Fund and other costs incurred by the Fund, pay its share of fees and expenses incurred in connection with the implementation and maintenance of the Global Credit Facility, based upon its relative share of the aggregate net assets of all of the Borrowers, including an annual commitment fee of 0.07% based upon the unused portion of the Global Credit Facility. These fees are reflected in other expenses in the Statement of Operations. During the period ended June 30, 2015, the Fund did not use the Global Credit Facility.
9. Fair Value Measurements
The Fund follows a fair value hierarchy that distinguishes between market data obtained from independent sources (observable inputs) and the Fund’s own market assumptions (unobservable inputs). These inputs are used in determining the value of the Fund’s financial instruments and are summarized in the following fair value hierarchy:
| • | Level 1 – quoted prices in active markets for identical financial instruments |
| • | Level 2 – other significant observable inputs (including quoted prices for similar financial instruments, interest rates, prepayment speed, credit risk, etc.) |
| • | Level 3 – significant unobservable inputs (including the Fund’s own assumptions in determining the fair value of financial instruments) |
The input levels are not necessarily an indication of the risk or liquidity associated with financial instruments at that level.
For movements between the levels within the fair value hierarchy, the Fund has adopted a policy of recognizing the transfers as of the date of the underlying event which caused the movement.
A summary of inputs used as of June 30, 2015, in valuing the Fund’s assets carried at fair value, is as follows:
| Level 1 | Level 2 | Level 3 | Total | |||||||||||||
| Assets: | ||||||||||||||||
Investments in Securities: | ||||||||||||||||
Equity Investmentsa | $ | 334,501,405 | $ | — | $ | — | $ | 334,501,405 | ||||||||
Short Term Investments | — | 2,739,889 | — | 2,739,889 | ||||||||||||
|
| |||||||||||||||
Total Investments in Securities | $ | 334,501,405 | $ | 2,739,889 | $ | — | $ | 337,241,294 | ||||||||
|
| |||||||||||||||
aFor detailed categories, see the accompanying Statement of Investments.
| Semiannual Report | FGR-21 |
FRANKLIN TEMPLETON VARIABLE INSURANCE PRODUCTS TRUST
NOTES TO FINANCIAL STATEMENTS (UNAUDITED)
Franklin Global Real Estate VIP Fund (continued)
10. New Accounting Pronouncement
In June 2014, the Financial Accounting Standards Board issued Accounting Standards Update (ASU) No. 2014-11, Transfers and Servicing (Topic 860), Repurchase-to-Maturity Transactions, Repurchase Financings, and Disclosures. The ASU changes the accounting for certain repurchase agreements and expands disclosure requirements related to repurchase agreements, securities lending, repurchase-to-maturity and similar transactions. The ASU is effective for certain transactions accounted for as a sale for interim and annual reporting periods beginning after December 15, 2014, and transactions accounted for as secured borrowings for annual periods beginning after December 15, 2014, and for interim periods beginning after March 15, 2015. Management has reviewed the requirements and believes the adoption of this ASU will not have a material impact on the financial statements.
11. Subsequent Events
The Fund has evaluated subsequent events through the issuance of the financial statements and determined that no events have occurred that require disclosure.
Abbreviations
| Selected Portfolio | ||
| IDR | International Depositary Receipt | |
| REIT | Real Estate Investment Trust | |
| FGR-22 | Semiannual Report |
Franklin Growth and Income VIP Fund
This semiannual report for Franklin Growth and Income VIP Fund covers the period ended June 30, 2015.
Class 1 Performance Summary as of June 30, 2015
The Fund’s Class 1 shares had a -0.62% total return for the six-month period ended June 30, 2015.
Performance reflects the Fund’s Class 1 operating expenses, but does not include any contract fees, expenses or sales charges. If they had been included, performance would be lower. These charges and deductions, particularly for variable life policies, can have a significant effect on contract values and insurance benefits. See the contract prospectus for a complete description of these expenses, including sales charges.
Performance data represent past performance, which does not guarantee future results. Investment return and principal value will fluctuate, and you may have a gain or loss when you sell your shares. Current performance may differ from figures shown.
| Semiannual Report | FGI-1 |
FRANKLIN GROWTH AND INCOME VIP FUND
Fund Goals and Main Investments
Franklin Growth and Income VIP Fund seeks capital appreciation with current income as a secondary goal. Under normal market conditions, the Fund invests predominantly in equity securities, including securities convertible into common stock.
Fund Risks
All investments involve risks, including possible loss of principal. Stock prices fluctuate, sometimes rapidly and dramatically, due to factors affecting individual companies, particular industries or sectors, or general market conditions. Convertible securities are subject to the risks of stocks when the underlying stock price is high relative to the conversion price and debt securities when the underlying stock price is low relative to the conversion price. The Fund’s investment in foreign securities also involves special risks, including currency fluctuations and economic as well as political uncertainty. The Fund is actively managed but there is no guarantee that the manager’s investment decisions will produce the desired results. The Fund’s prospectus also includes a description of the main investment risks.
Performance Overview
You can find the Fund’s six-month total return in the Performance Summary. In comparison, the Fund’s benchmark, the Standard & Poor’s® 500 Index (S&P 500®), produced a +1.23% total return.1 The Fund’s peers as measured by the Lipper VIP Equity Income Funds Classification Average posted a +1.41% return for the same period.2
Economic and Market Overview
U.S. economic growth was mixed during the six months under review. In 2015’s first quarter, U.S. dollar strength, low energy price, and a labor dispute at West Coast ports led exports to decline. Lower business investment and state and local government spending also weighed on the economy, while increases in consumer spending, residential investment and private inventory investment offered some support. In the second quarter, business capital spending rebounded and manufacturing and non-manufacturing activities increased, contributing to strong job gains that helped the unemployment rate decline from 5.6% in December 2014 to 5.3% in June 2015.3 Housing market data were generally encouraging as home sales and prices rose. After a brief, winter slump, retail
sales rebounded in the spring as strong employment gains led to broad-based improvement, especially for auto and gasoline sales. Inflation, as measured by the Consumer Price Index, rose during the six months amid generally higher energy prices bouncing from recent lows.
During the six-month period, the Federal Reserve Board (Fed) kept its target interest rate at 0%–0.25% while considering when an increase would be appropriate. The Fed anticipated raising its target rate when it saw further labor market progress and was reasonably confident that inflation would move back to 2% over the medium term. In its June meeting, the Fed lowered its 2015 economic growth forecast and raised unemployment estimates given the weak start to the year.
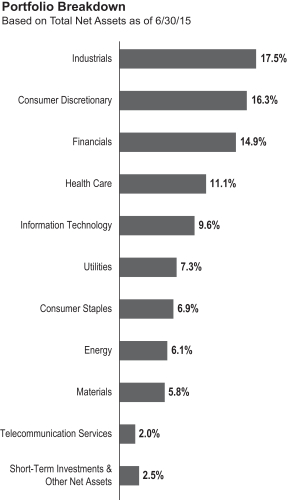
1. Source: Morningstar.
2. Source: Lipper, a Thomson Reuters Company.
One cannot invest directly in an index, and an index is not representative of the Fund’s portfolio. Please see Index Descriptions following the Fund Summaries.
3. Source: Bureau of Labor Statistics.
| FGI-2 | Semiannual Report |
FRANKLIN GROWTH AND INCOME VIP FUND
Investor confidence grew during the period as corporate profits remained healthy, the Fed showed caution about raising interest rates, economic data in Europe and Japan improved and China introduced more stimulus measures. However, the stock markets endured some sell-offs when many investors reacted to debt negotiations between Greece and its creditors, geopolitical tensions in certain regions, and less robust growth in China. For the six months under review, U.S. stocks, as measured by the S&P 500 and the Dow Jones Industrial Average, rose marginally after both reached all-time highs in May.4
Investment Strategy
We seek to invest in a broadly diversified portfolio of equity securities that we consider to be financially strong, with a focus on “blue chip” companies. We apply a bottom-up approach to investing in individual securities. We will assess the market price of a company’s securities relative to our evaluation of the company’s long-term earnings, asset value and cash flow potential. We also consider a company’s price/earnings ratio, profit margins, balance sheet and liquidation value. We consider dividend yield in selecting stocks for the Fund because we believe that, over time, dividend income can contribute significantly to total return and can be a more consistent source of investment return than capital appreciation. We seek to take advantage of price dislocations that result from the market’s short-term focus and choose to invest in those companies that, in our opinion, offer the best trade-off between growth opportunity, business and financial risk, and valuation.
Manager’s Discussion
During the period under review, several sectors the Fund invested in rose in value, including consumer discretionary and health care. In contrast, many other sectors the Fund invested in declined in value. Key detracting sectors included information technology (IT), utilities and energy.
In consumer discretionary, key contributors included our equity-linked security in Internet retailer Amazon.com and our stock position in sports footwear, apparel, equipment, accessories and services company NIKE. Amazon.com helped relative results, as the Internet retailer generated year-over-year margin expansion in 2014’s fourth quarter and in 2015’s first quarter. In its first-quarter earnings report, Amazon.com announced a loss that investors appeared to overlook as the company disclosed the revenues and profitability of Amazon Web Services (AWS), its cloud computing platform, for the first time. With
robust annual revenue growth and a high profit margin, AWS was more profitable than many analysts had estimated. The company’s core retail business generated strong revenue growth in North America and internationally. NIKE continued to benefit from the strong growth trend in global athletic participation. Additionally, factors including the company’s strong brand, innovation and geographic expansion spurred growth exceeding that of its peers. NIKE’s margins expanded as a result of its premium price product mix and a shift in distribution channels. NIKE generated strong free cash flow and had a favorable capital return strategy that consistently raised dividends and implemented share buybacks. The company’s balance sheet was healthy, in our view, and allowed for further capital returns opportunities.
In health care, pharmaceutical companies Eli Lilly & Co. and Sanofi and pharmaceuticals and diagnostics developer Roche Holding5 were key contributors. Eli Lilly experienced a strong first quarter that suggested to us that it was moving past a challenging period in which a number of its patents expired. The company announced that phase III results for its experimental Alzheimer’s drug would become available earlier than
| Top 10 Holdings | ||||
| 6/30/15 | ||||
| Company Sector/Industry | % of Total Net Assets | |||
| Eli Lilly & Co. Health Care | 2.4% | |||
| NIKE Inc., B Consumer Discretionary | 2.4% | |||
| Barclays Bank PLC into Amazon.com Inc., 144A Consumer Discretionary | 2.3% | |||
| Target Corp. Consumer Discretionary | 2.2% | |||
| JPMorgan Chase & Co. Financials | 2.2% | |||
| Cisco Systems Inc. Information Technology | 2.2% | |||
| Ford Motor Co. Consumer Discretionary | 2.2% | |||
| BlackRock Inc. Financials | 2.2% | |||
| Microsoft Corp. Information Technology | 2.1% | |||
| L Brands Inc. Consumer Discretionary | 2.1% | |||
The dollar value, number of shares or principal amount, and names of all portfolio holdings are listed in the Fund’s Statement of Investments.
4. Please see Index Descriptions following the Fund Summaries.
5. Sold by period-end.
| Semiannual Report | FGI-3 |
FRANKLIN GROWTH AND INCOME VIP FUND
expected. Sanofi benefited from the appointment of a new chief executive officer. Roche showed promising results from its product pipeline, particularly among its non-cancer drugs. The company announced that in clinical trials, its experimental multiple sclerosis drug met expectations and outperformed a competitor’s medication.
In contrast, among IT holdings, top detractors included data storage company Seagate Technology, semiconductor maker Intel and software firm Microsoft. The personal computer (PC) market struggled during the period owing largely to unfavorable currency exchange rates in overseas markets, which delayed demand. Additionally, Microsoft terminated support of its Windows XP operating system during late 2014, effectively ending a PC replacement cycle. Finally, distributors reduced PC inventories in advance of the Windows 10 operating system launch. Seagate suffered from weak revenue levels in its first quarter driven by a slowdown in the PC market, which accounts for nearly half of Seagate’s revenue. Shares of Intel, the world’s leading microprocessor supplier, were hurt by weak global desktop and notebook computer sales during the period. The company also struggled to execute and gain market share in the smartphone market. Intel shares also were pressured after the announcement of its intention to acquire Altera, a leading programmable logic semiconductor company. Microsoft was also hurt by weakness in the PC market, which accounts for a considerable portion of the company’s gross profit. Microsoft had low earnings in its first quarter as sales from its devices and consumer business, licensing, phone and hardware divisions declined.
Within utilities, electric power company Duke Energy and power and energy company Dominion Resources were major detractors. Duke Energy lagged the utility average during the period as U.S. dollar strength weighed on translated earnings of the company’s international operations. Our position in Dominion Resources was hurt by falling power prices in New England.
In the energy sector, significant detractors included a convertible preferred stock holding in oil and natural gas exploration and production company Chesapeake Energy as well as stocks of oil and natural gas producer Royal Dutch Shell and multinational energy corporation Chevron. Energy stocks underperformed the broader markets despite a modest recovery in crude oil prices by period-end, which helped offset a drop in
natural gas prices. U.S. crude oil inventory levels rapidly increased during the first half of the reporting period and sparked fears of the U.S. reaching full oil storage capacity, which could have led to further price weakness. Yet these fears were fleeting as crude oil inventories resumed their normal seasonal withdrawal in May and into June, helped by strong demand for gasoline and resumption in refinery runs following maintenance.
Investors then turned their attention to broader economic events such as the Greek debt crisis, the possibility of the United Nations lifting Iranian export sanctions and the Chinese stock market collapse. These events at period-end stoked fears that strong oil demand growth could fade in the second half of the calendar year and increase the oil surplus as production in the U.S. and Middle East continued to grow. In this environment, Royal Dutch Shell and Chevron suffered losses. Chesapeake Energy declined as natural gas prices fell because of warm winter weather, which also negatively affected natural gas liquid prices as propane inventories surged above export demand. These factors weighed on prices for a considerable amount of the company’s output. Chesapeake was also burdened by contracts designed to support a midstream business the company sold off. These contracts carried substantial long-term commitments that limited operational flexibility and resulted in natural gas prices that were lower than those of Chesapeake’s peers.
Thank you for your participation in Franklin Growth and Income VIP Fund. We look forward to serving your future investment needs.
The foregoing information reflects our analysis, opinions and portfolio holdings as of June 30, 2015, the end of the reporting period. The way we implement our main investment strategies and the resulting portfolio holdings may change depending on factors such as market and economic conditions. These opinions may not be relied upon as investment advice or an offer for a particular security. The information is not a complete analysis of every aspect of any market, country, industry, security or the Fund. Statements of fact are from sources considered reliable, but the investment manager makes no representation or warranty as to their completeness or accuracy. Although historical performance is no guarantee of future results, these insights may help you understand our investment management philosophy.
| FGI-4 | Semiannual Report |
FRANKLIN GROWTH AND INCOME VIP FUND
Class 1 Fund Expenses
As an investor in a variable insurance contract (Contract) that indirectly provides for investment in an underlying mutual fund, you can incur transaction and/or ongoing expenses at both the Fund level and the Contract level.
| • | Transaction expenses can include sales charges (loads) on purchases, surrender fees, transfer fees and premium taxes. |
| • | Ongoing expenses can include management fees, distribution and service (12b-1) fees, contract fees, annual maintenance fees, mortality and expense risk fees and other fees and expenses. All mutual funds and Contracts have some types of ongoing expenses. |
The expenses shown in the table are meant to highlight ongoing expenses at the Fund level only and do not include ongoing expenses at the Contract level, or transaction expenses at either the Fund or Contract levels. While the Fund does not have transaction expenses, if the transaction and ongoing expenses at the Contract level were included, the expenses shown below would be higher. You should consult your Contract prospectus or disclosure document for more information.
The table shows Fund-level ongoing expenses and can help you understand these expenses and compare them with those of other mutual funds offered through the Contract. The table assumes a $1,000 investment held for the six months indicated. Please refer to the Fund prospectus for additional information on operating expenses.
Actual Fund Expenses
The first line (Actual) of the table provides actual account values and expenses. The “Ending Account Value” is derived from the Fund’s actual return, which includes the effect of ongoing Fund expenses, but does not include the effect of ongoing Contract expenses.
You can estimate the Fund-level expenses you incurred during the period by following these steps. Of course, your account value and expenses will differ from those in this illustration:
| 1. | Divide your account value by $1,000. |
If an account had an $8,600 value, then $8,600 ÷ $1,000 = 8.6.
| 2. | Multiply the result by the number under the heading “Fund-Level Expenses Incurred During Period.” |
If Fund-Level Expenses Incurred During Period were $7.50, then 8.6 × $7.50 = $64.50.
In this illustration, the estimated expenses incurred this period at the Fund level are $64.50.
Hypothetical Example for Comparison with Other Mutual Funds
Information in the second line (Hypothetical) of the table can help you compare ongoing expenses of the Fund with those of other mutual funds offered through the Contract. This information may not be used to estimate the actual ending account balance or expenses you incurred during the period. The hypothetical “Ending Account Value” is based on the Fund’s actual expense ratio and an assumed 5% annual rate of return before expenses, which does not represent the Fund’s actual return. The figure under the heading “Fund-Level Expenses Incurred During Period” shows the hypothetical expenses your account would have incurred under this scenario. You can compare this figure with the 5% hypothetical examples that appear in shareholder reports of other funds offered through a Contract.
| Class 1 | Beginning Account Value 1/1/15 | Ending Account Value 6/30/15 | Fund-Level Expenses 1/1/15–6/30/15 | |||||||||
Actual | $ | 1,000 | $ | 993.80 | $ | 2.87 | ||||||
Hypothetical (5% return before expenses) | $ | 1,000 | $ | 1,021.92 | $ | 2.91 | ||||||
*Expenses are calculated using the most recent six-month annualized expense ratio for the Fund’s Class 1 shares (0.58%), which does not include any ongoing expenses of the Contract for which the Fund is an investment option, multiplied by the average account value over the period, multiplied by 181/365 to reflect the one-half year period.
| Semiannual Report | FGI-5 |
FRANKLIN TEMPLETON VARIABLE INSURANCE PRODUCTS TRUST
Financial Highlights
Franklin Growth and Income VIP Fund
| Six Months Ended June 30, 2015 (unaudited) | Year Ended December 31, | |||||||||||||||||||||||
| 2014 | 2013 | 2012 | 2011 | 2010 | ||||||||||||||||||||
| Class 1 | ||||||||||||||||||||||||
Per share operating performance (for a share outstanding throughout the period) | ||||||||||||||||||||||||
Net asset value, beginning of period | $17.02 | $15.97 | $12.64 | $11.60 | $11.76 | $10.47 | ||||||||||||||||||
|
| |||||||||||||||||||||||
| Income from investment operationsa: | ||||||||||||||||||||||||
Net investment incomeb | 0.26 | 0.53 | c | 0.33 | 0.35 | 0.33 | 0.38 | |||||||||||||||||
Net realized and unrealized gains (losses) | (0.35 | ) | 0.95 | 3.40 | 1.08 | (0.03 | ) | 1.32 | ||||||||||||||||
|
| |||||||||||||||||||||||
Total from investment operations | (0.09 | ) | 1.48 | 3.73 | 1.43 | 0.30 | 1.70 | |||||||||||||||||
|
| |||||||||||||||||||||||
| Less distributions from: | ||||||||||||||||||||||||
Net investment income | (0.61 | ) | (0.43 | ) | (0.40 | ) | (0.39 | ) | (0.46 | ) | (0.41 | ) | ||||||||||||
Net realized gains | (0.38 | ) | — | — | — | — | — | |||||||||||||||||
|
| |||||||||||||||||||||||
Total distributions | (0.99 | ) | (0.43 | ) | (0.40 | ) | (0.39 | ) | (0.46 | ) | (0.41 | ) | ||||||||||||
|
| |||||||||||||||||||||||
Net asset value, end of period | $15.94 | $17.02 | $15.97 | $12.64 | $11.60 | $11.76 | ||||||||||||||||||
|
| |||||||||||||||||||||||
Total returnd | (0.62)% | 9.40% | 29.96% | 12.53% | 2.64% | 16.93% | ||||||||||||||||||
| Ratios to average net assetse | ||||||||||||||||||||||||
Expenses | 0.58% | 0.57% | f | 0.58% | f | 0.60% | 0.59% | 0.59% | ||||||||||||||||
Net investment income | 3.01% | 3.26% | c | 2.29% | 2.86% | 2.80% | 3.62% | |||||||||||||||||
| Supplemental data | ||||||||||||||||||||||||
Net assets, end of period (000’s) | $156,243 | $168,961 | $175,860 | $154,463 | $156,830 | $176,590 | ||||||||||||||||||
Portfolio turnover rate | 13.45% | 20.54% | 35.16% | 30.00% | 32.93% | 26.83% | ||||||||||||||||||
aThe amount shown for a share outstanding throughout the period may not correlate with the Statement of Operations for the period due to the timing of sales and repurchases of the Fund’s shares in relation to income earned and/or fluctuating fair value of the investments of the Fund.
bBased on average daily shares outstanding.
cNet investment income per share includes approximately $0.12 per share received in the form of special dividends paid in connection with certain Fund holdings. Excluding these amounts, the ratio of net investment income to average net assets would have been 2.53%.
dTotal return does not include fees, charges or expenses imposed by the variable annuity and life insurance contracts for which Franklin Templeton Variable Insurance Products Trust serves as an underlying investment vehicle. Total return is not annualized for periods less than one year.
eRatios are annualized for periods less than one year.
fBenefit of expense reduction rounds to less than 0.01%.
| FGI-6 | Semiannual Report | The accompanying notes are an integral part of these financial statements. |
FRANKLIN TEMPLETON VARIABLE INSURANCE PRODUCTS TRUST
FINANCIAL HIGHLIGHTS
Franklin Growth and Income VIP Fund (continued)
| Six Months Ended June 30, 2015 (unaudited) | Year Ended December 31, | |||||||||||||||||||||||
| 2014 | 2013 | 2012 | 2011 | 2010 | ||||||||||||||||||||
| Class 2 | ||||||||||||||||||||||||
Per share operating performance (for a share outstanding throughout the period) | ||||||||||||||||||||||||
Net asset value, beginning of period | $16.76 | $15.73 | $12.46 | $11.44 | $11.60 | $10.33 | ||||||||||||||||||
|
| |||||||||||||||||||||||
| Income from investment operationsa: | ||||||||||||||||||||||||
Net investment incomeb | 0.23 | 0.48 | c | 0.29 | 0.32 | 0.29 | 0.35 | |||||||||||||||||
Net realized and unrealized gains (losses) | (0.34 | ) | 0.94 | 3.35 | 1.05 | (0.02 | ) | 1.31 | ||||||||||||||||
|
| |||||||||||||||||||||||
Total from investment operations | (0.11 | ) | 1.42 | 3.64 | 1.37 | 0.27 | 1.66 | |||||||||||||||||
|
| |||||||||||||||||||||||
| Less distributions from: | ||||||||||||||||||||||||
Net investment income | (0.56 | ) | (0.39 | ) | (0.37 | ) | (0.35 | ) | (0.43 | ) | (0.39 | ) | ||||||||||||
Net realized gains | (0.38 | ) | — | — | — | — | — | |||||||||||||||||
|
| |||||||||||||||||||||||
Total distributions | (0.94 | ) | (0.39 | ) | (0.37 | ) | (0.35 | ) | (0.43 | ) | (0.39 | ) | ||||||||||||
|
| |||||||||||||||||||||||
Net asset value, end of period | $15.71 | $16.76 | $15.73 | $12.46 | $11.44 | $11.60 | ||||||||||||||||||
|
| |||||||||||||||||||||||
Total returnd | (0.72)% | 9.14% | 29.60% | 12.23% | 2.41% | 16.68% | ||||||||||||||||||
| Ratios to average net assetse | ||||||||||||||||||||||||
Expenses | 0.83% | 0.82% | f | 0.83% | f | 0.85% | 0.84% | 0.84% | ||||||||||||||||
Net investment income | 2.76% | 3.01% | c | 2.04% | 2.61% | 2.55% | 3.37% | |||||||||||||||||
| Supplemental data | ||||||||||||||||||||||||
Net assets, end of period (000’s) | $129,417 | $138,191 | $150,966 | $131,400 | $129,309 | $151,481 | ||||||||||||||||||
Portfolio turnover rate | 13.45% | 20.54% | 35.16% | 30.00% | 32.93% | 26.83% | ||||||||||||||||||
aThe amount shown for a share outstanding throughout the period may not correlate with the Statement of Operations for the period due to the timing of sales and repurchases of the Fund’s shares in relation to income earned and/or fluctuating fair value of the investments of the Fund.
bBased on average daily shares outstanding.
cNet investment income per share includes approximately $0.12 per share received in the form of special dividends paid in connection with certain Fund holdings. Excluding these amounts, the ratio of net investment income to average net assets would have been 2.28%.
dTotal return does not include fees, charges or expenses imposed by the variable annuity and life insurance contracts for which Franklin Templeton Variable Insurance Products Trust serves as an underlying investment vehicle. Total return is not annualized for periods less than one year.
eRatios are annualized for periods less than one year.
fBenefit of expense reduction rounds to less than 0.01%.
| The accompanying notes are an integral part of these financial statements. | Semiannual Report | FGI-7 |
FRANKLIN TEMPLETON VARIABLE INSURANCE PRODUCTS TRUST
Statement of Investments, June 30, 2015 (unaudited)
Franklin Growth and Income VIP Fund
| ||||||||||||||
| Country | Shares | Value | ||||||||||||
Common Stocks 86.7% | ||||||||||||||
Consumer Discretionary 14.0% | ||||||||||||||
Ford Motor Co. | United States | 413,000 | $ | 6,199,130 | ||||||||||
L Brands Inc. | United States | 70,100 | 6,009,673 | |||||||||||
Las Vegas Sands Corp. | United States | 63,600 | 3,343,452 | |||||||||||
Lowe’s Cos. Inc. | United States | 81,700 | 5,471,449 | |||||||||||
NIKE Inc., B | United States | 62,900 | 6,794,458 | |||||||||||
Starwood Hotels & Resorts Worldwide Inc. | United States | 70,000 | 5,676,300 | |||||||||||
Target Corp. | United States | 78,500 | 6,407,955 | |||||||||||
|
| |||||||||||||
| 39,902,417 | ||||||||||||||
|
| |||||||||||||
Consumer Staples 6.9% | ||||||||||||||
Anheuser-Busch InBev NV, ADR | Belgium | 35,000 | 4,223,450 | |||||||||||
Mead Johnson Nutrition Co., A | United States | 45,400 | 4,095,988 | |||||||||||
Nestle SA | Switzerland | 44,700 | 3,226,660 | |||||||||||
PepsiCo Inc. | United States | 61,500 | 5,740,410 | |||||||||||
The Procter & Gamble Co. | United States | 31,600 | 2,472,384 | |||||||||||
|
| |||||||||||||
| 19,758,892 | ||||||||||||||
|
| |||||||||||||
Energy 5.5% | ||||||||||||||
Chevron Corp. | United States | 42,700 | 4,119,269 | |||||||||||
Exxon Mobil Corp. | United States | 49,744 | 4,138,701 | |||||||||||
HollyFrontier Corp. | United States | 81,600 | 3,483,504 | |||||||||||
Royal Dutch Shell PLC, A, ADR | United Kingdom | 69,100 | 3,939,391 | |||||||||||
|
| |||||||||||||
| 15,680,865 | �� | |||||||||||||
|
| |||||||||||||
Financials 13.7% | ||||||||||||||
Aflac Inc. | United States | 72,300 | 4,497,060 | |||||||||||
Arthur J. Gallagher & Co. | United States | 94,400 | 4,465,120 | |||||||||||
Bank of America Corp. | United States | 128,300 | 2,183,666 | |||||||||||
BlackRock Inc. | United States | 17,900 | 6,193,042 | |||||||||||
JPMorgan Chase & Co. | United States | 93,370 | 6,326,751 | |||||||||||
MetLife Inc. | United States | 93,778 | 5,250,630 | |||||||||||
T. Rowe Price Group Inc. | United States | 61,100 | 4,749,303 | |||||||||||
Wells Fargo & Co. | United States | 98,300 | 5,528,392 | |||||||||||
|
| |||||||||||||
| 39,193,964 | ||||||||||||||
|
| |||||||||||||
Health Care 9.6% | ||||||||||||||
Bristol-Myers Squibb Co. | United States | 89,900 | 5,981,946 | |||||||||||
Eli Lilly & Co. | United States | 81,400 | 6,796,086 | |||||||||||
Johnson & Johnson | United States | 44,600 | 4,346,716 | |||||||||||
Pfizer Inc. | United States | 132,400 | 4,439,372 | |||||||||||
Sanofi, ADR | France | 120,000 | 5,943,600 | |||||||||||
|
| |||||||||||||
| 27,507,720 | ||||||||||||||
|
| |||||||||||||
Industrials 15.3% | ||||||||||||||
Caterpillar Inc. | United States | 58,800 | 4,987,416 | |||||||||||
General Electric Co. | United States | 166,200 | 4,415,934 | |||||||||||
Honeywell International Inc. | United States | 58,100 | 5,924,457 | |||||||||||
Lockheed Martin Corp. | United States | 30,500 | 5,669,950 | |||||||||||
Nielsen NV | United States | 95,500 | 4,275,535 | |||||||||||
Raytheon Co. | United States | 39,800 | 3,808,064 | |||||||||||
Republic Services Inc. | United States | 146,200 | 5,726,654 | |||||||||||
United Parcel Service Inc., B | United States | 41,200 | 3,992,692 | |||||||||||
United Technologies Corp. | United States | 44,800 | 4,969,664 | |||||||||||
|
| |||||||||||||
| 43,770,366 | ||||||||||||||
|
| |||||||||||||
| FGI-8 | Semiannual Report |
FRANKLIN TEMPLETON VARIABLE INSURANCE PRODUCTS TRUST
STATEMENT OF INVESTMENTS (UNAUDITED)
Franklin Growth and Income VIP Fund (continued)
| Country | Shares | Value | ||||||||||||
Common Stocks (continued) | ||||||||||||||
Information Technology 9.6% | ||||||||||||||
Cisco Systems Inc. | United States | 229,208 | $ | 6,294,052 | ||||||||||
Intel Corp. | United States | 182,800 | 5,559,862 | |||||||||||
Maxim Integrated Products Inc. | United States | 168,200 | 5,815,515 | |||||||||||
Microsoft Corp. | United States | 137,800 | 6,083,870 | |||||||||||
Seagate Technology PLC | United States | 78,800 | 3,743,000 | |||||||||||
|
| |||||||||||||
| 27,496,299 | ||||||||||||||
|
| |||||||||||||
Materials 4.6% | ||||||||||||||
BHP Billiton PLC | Australia | 111,700 | 2,191,754 | |||||||||||
The Dow Chemical Co. | United States | 111,500 | 5,705,455 | |||||||||||
Freeport-McMoRan Inc., B | United States | 82,788 | 1,541,513 | |||||||||||
Potash Corp. of Saskatchewan Inc. | Canada | 115,500 | 3,577,035 | |||||||||||
|
| |||||||||||||
| 13,015,757 | ||||||||||||||
|
| |||||||||||||
Telecommunication Services 2.0% | ||||||||||||||
Rogers Communications Inc., B | Canada | 159,100 | 5,652,823 | |||||||||||
|
| |||||||||||||
Utilities 5.5% | ||||||||||||||
Dominion Resources Inc. | United States | 52,600 | 3,517,362 | |||||||||||
Duke Energy Corp. | United States | 56,703 | 4,004,366 | |||||||||||
PG&E Corp. | United States | 110,500 | 5,425,550 | |||||||||||
Xcel Energy Inc. | United States | 89,800 | 2,889,764 | |||||||||||
|
| |||||||||||||
| 15,837,042 | ||||||||||||||
|
| |||||||||||||
Total Common Stocks (Cost $189,609,733) | 247,816,145 | |||||||||||||
|
| |||||||||||||
| a | Equity-Linked Securities (Cost $5,125,650) 2.3% | |||||||||||||
Consumer Discretionary 2.3% | ||||||||||||||
| b | Barclays Bank PLC into Amazon.com Inc., 3.00%, 144A | United States | 15,000 | 6,441,570 | ||||||||||
|
| |||||||||||||
Convertible Preferred Stocks 8.5% | ||||||||||||||
Energy 0.6% | ||||||||||||||
Chesapeake Energy Corp., 5.75%, cvt. pfd. | United States | 2,700 | 1,856,282 | |||||||||||
|
| |||||||||||||
Financials 1.2% | ||||||||||||||
Bank of America Corp., 7.25%, cvt. pfd., L | United States | 3,100 | 3,447,200 | |||||||||||
|
| |||||||||||||
Health Care 1.5% | ||||||||||||||
Allergan PLC, 5.50%, cvt. pfd. | United States | 4,000 | 4,170,320 | |||||||||||
|
| |||||||||||||
Industrials 2.2% | ||||||||||||||
Genesee & Wyoming Inc., 5.00%, cvt. pfd. | United States | 9,200 | 931,500 | |||||||||||
Stanley Black & Decker Inc., 6.25%, cvt. pfd. | United States | 45,300 | 5,402,025 | |||||||||||
|
| |||||||||||||
| 6,333,525 | ||||||||||||||
|
| |||||||||||||
Materials 1.2% | ||||||||||||||
Alcoa Inc., 5.375%, cvt. pfd. | United States | 84,800 | 3,352,144 | |||||||||||
|
| |||||||||||||
Utilities 1.8% | ||||||||||||||
NextEra Energy Inc., 5.799%, cvt. pfd. | United States | 62,000 | 3,317,000 | |||||||||||
NextEra Energy Inc., 5.889%, cvt. pfd. | United States | 28,100 | 1,734,051 | |||||||||||
|
| |||||||||||||
| 5,051,051 | ||||||||||||||
|
| |||||||||||||
Total Convertible Preferred Stocks | 24,210,522 | |||||||||||||
|
| |||||||||||||
Total Investments before Short Term Investments | 278,468,237 | |||||||||||||
|
| |||||||||||||
| Semiannual Report | FGI-9 |
FRANKLIN TEMPLETON VARIABLE INSURANCE PRODUCTS TRUST
STATEMENT OF INVESTMENTS (UNAUDITED)
Franklin Growth and Income VIP Fund (continued)
| Country | Principal Amount | Value | ||||||||||||
Short Term Investments (Cost $7,036,215) 2.4% | ||||||||||||||
Repurchase Agreements 2.4% | ||||||||||||||
| c | Joint Repurchase Agreement, 0.095%, 7/01/15 (Maturity Value $7,036,234) | United States | $ | 7,036,215 | $ | 7,036,215 | ||||||||
BNP Paribas Securities Corp. (Maturity Value $1,726,692) | ||||||||||||||
HSBC Securities (USA) Inc. (Maturity Value $3,626,053) Merrill Lynch, Pierce, Fenner & Smith Inc. (Maturity Value $1,683,489) | ||||||||||||||
Collateralized by U.S. Government Agency Securities, 0.000% - 5.50%, 12/01/15 - 6/12/20; U.S. Government Agency Securities, Strips, 6/01/17; dU.S. Treasury Bills, 3/31/16; U.S. Treasury Bonds, 3.125%, 8/15/44; and U.S. Treasury Notes, 1.25% - 1.75%, 1/31/19 - 9/30/19 (valued at $7,178,379) | ||||||||||||||
|
| |||||||||||||
Total Investments (Cost $224,592,095) 99.9% | 285,504,452 | |||||||||||||
Other Assets, less Liabilities 0.1% | 155,801 | |||||||||||||
|
| |||||||||||||
Net Assets 100.0% | $ | 285,660,253 | ||||||||||||
|
| |||||||||||||
See Abbreviations on page FGI-19.
aSee Note 1(d) regarding equity-linked securities.
bSecurity was purchased pursuant to Rule 144A under the Securities Act of 1933 and may be sold in transactions exempt from registration only to qualified institutional buyers or in a public offering registered under the Securities Act of 1933. This security has been deemed liquid under guidelines approved by the Trust’s Board of Trustees.
cSee Note 1(c) regarding joint repurchase agreement.
dThe security is traded on a discount basis with no stated coupon rate.
| FGI-10 | Semiannual Report | The accompanying notes are an integral part of these financial statements. |
FRANKLIN TEMPLETON VARIABLE INSURANCE PRODUCTS TRUST
Financial Statements
Statement of Assets and Liabilities
June 30, 2015 (unaudited)
| Franklin Growth and Income VIP Fund | ||||
Assets: | ||||
Investments in securities: | ||||
Cost - Unaffiliated issuers | $ | 217,555,880 | ||
Cost - Repurchase agreements | 7,036,215 | |||
|
| |||
Total cost of investments | $ | 224,592,095 | ||
|
| |||
Value - Unaffiliated issuers | $ | 278,468,237 | ||
Value - Repurchase agreements | 7,036,215 | |||
|
| |||
Total value of investments | 285,504,452 | |||
Receivables: | ||||
Capital shares sold | 16,181 | |||
Dividends | 508,253 | |||
Other assets | 125 | |||
|
| |||
Total assets | 286,029,011 | |||
|
| |||
Liabilities: | ||||
Payables: | ||||
Capital shares redeemed | 128,662 | |||
Management fees | 128,423 | |||
Distribution fees | 55,662 | |||
Reports to shareholders | 37,575 | |||
Accrued expenses and other liabilities | 18,436 | |||
|
| |||
Total liabilities | 368,758 | |||
|
| |||
Net assets, at value | $ | 285,660,253 | ||
|
| |||
Net assets consist of: | ||||
Paid-in capital | $ | 205,562,325 | ||
Undistributed net investment income | 4,290,886 | |||
Net unrealized appreciation (depreciation) | 60,913,719 | |||
Accumulated net realized gain (loss) | 14,893,323 | |||
|
| |||
Net assets, at value | $ | 285,660,253 | ||
|
| |||
| Class 1: | ||||
Net assets, at value | $ | 156,243,156 | ||
|
| |||
Shares outstanding | 9,799,719 | |||
|
| |||
Net asset value and maximum offering price per share | $ | 15.94 | ||
|
| |||
| Class 2: | ||||
Net assets, at value | $ | 129,417,097 | ||
|
| |||
Shares outstanding | 8,239,365 | |||
|
| |||
Net asset value and maximum offering price per share | $ | 15.71 | ||
|
| |||
| The accompanying notes are an integral part of these financial statements. | Semiannual Report | FGI-11 |
FRANKLIN TEMPLETON VARIABLE INSURANCE PRODUCTS TRUST
FINANCIAL STATEMENTS
Statement of Operations
for the six months ended June 30, 2015 (unaudited)
| Franklin Growth and Income VIP Fund | ||||
Investment income: | ||||
Dividends | $ | 5,335,452 | ||
Interest | 1,468 | |||
|
| |||
Total investment income | 5,336,920 | |||
|
| |||
Expenses: | ||||
Management fees (Note 3a) | 792,872 | |||
Distribution fees - Class 2 (Note 3c) | 167,095 | |||
Custodian fees (Note 4) | 1,913 | |||
Reports to shareholders | 38,749 | |||
Professional fees | 19,087 | |||
Trustees’ fees and expenses | 650 | |||
Other | 5,374 | |||
|
| |||
Total expenses | 1,025,740 | |||
|
| |||
Net investment income | 4,311,180 | |||
|
| |||
Realized and unrealized gains (losses): | ||||
Net realized gain (loss) from: | ||||
Investments | 14,825,984 | |||
Foreign currency transactions | 39,480 | |||
|
| |||
Net realized gain (loss) | 14,865,464 | |||
|
| |||
Net change in unrealized appreciation (depreciation) on: | ||||
Investments | (20,930,878 | ) | ||
Translation of other assets and liabilities denominated in foreign currencies | 10,477 | |||
|
| |||
Net change in unrealized appreciation (depreciation) | (20,920,401 | ) | ||
|
| |||
Net realized and unrealized gain (loss) | (6,054,937 | ) | ||
|
| |||
Net increase (decrease) in net assets resulting from operations | $ | (1,743,757 | ) | |
|
| |||
| FGI-12 | Semiannual Report | The accompanying notes are an integral part of these financial statements. |
FRANKLIN TEMPLETON VARIABLE INSURANCE PRODUCTS TRUST
FINANCIAL STATEMENTS
Statements of Changes in Net Assets
| Franklin Growth and Income VIP Fund | ||||||||
| Six Months Ended June 30, 2015 (unaudited) | Year Ended December 31, 2014 | |||||||
Increase (decrease) in net assets: | ||||||||
Operations: | ||||||||
Net investment income | $ | 4,311,180 | $ | 9,837,662 | ||||
Net realized gain (loss) | 14,865,464 | 23,764,024 | ||||||
Net change in unrealized appreciation (depreciation) | (20,920,401 | ) | (6,144,449 | ) | ||||
|
| |||||||
Net increase (decrease) in net assets resulting from operations | (1,743,757 | ) | 27,457,237 | |||||
|
| |||||||
Distributions to shareholders from: | ||||||||
Net investment income: | ||||||||
Class 1 | (5,633,682 | ) | (4,441,593 | ) | ||||
Class 2 | (4,366,077 | ) | (3,421,107 | ) | ||||
Net realized gains: | ||||||||
Class 1 | (3,526,285 | ) | — | |||||
Class 2 | (2,955,426 | ) | — | |||||
|
| |||||||
Total distributions to shareholders | (16,481,470 | ) | (7,862,700 | ) | ||||
|
| |||||||
Capital share transactions: (Note 2) | ||||||||
Class 1 | (2,717,964 | ) | (17,675,242 | ) | ||||
Class 2 | (548,885 | ) | (21,593,267 | ) | ||||
|
| |||||||
Total capital share transactions | (3,266,849 | ) | (39,268,509 | ) | ||||
|
| |||||||
Net increase (decrease) in net assets | (21,492,076 | ) | (19,673,972 | ) | ||||
Net assets: | ||||||||
Beginning of period | 307,152,329 | 326,826,301 | ||||||
|
| |||||||
End of period | $ | 285,660,253 | $ | 307,152,329 | ||||
|
| |||||||
Undistributed net investment income included in net assets: | ||||||||
End of period | $ | 4,290,886 | $ | 9,979,465 | ||||
|
| |||||||
| The accompanying notes are an integral part of these financial statements. | Semiannual Report | FGI-13 |
FRANKLIN TEMPLETON VARIABLE INSURANCE PRODUCTS TRUST
Notes to Financial Statements (unaudited)
Franklin Growth and Income VIP Fund
1. Organization and Significant Accounting Policies
Franklin Templeton Variable Insurance Products Trust (Trust) is registered under the Investment Company Act of 1940 (1940 Act) as an open-end management investment company, consisting of nineteen separate funds and applies the specialized accounting and reporting guidance in U.S. Generally Accepted Accounting Principles (U.S. GAAP). Franklin Growth and Income VIP Fund (Fund) is included in this report. The financial statements of the remaining funds in the Trust are presented separately. Shares of the Fund are generally sold only to insurance company separate accounts to fund the benefits of variable life insurance policies or variable annuity contracts. At June 30, 2015, 77.93% of the Fund’s shares were held through one insurance company. Investment activities of these insurance company separate accounts could have a material impact on the Fund. The Fund offers two classes of shares: Class 1 and Class 2. Each class of shares differs by its distribution fees, voting rights on matters affecting a single class and its exchange privilege.
The following summarizes the Fund’s significant accounting policies.
a. Financial Instrument Valuation
The Fund’s investments in financial instruments are carried at fair value daily. Fair value is the price that would be received to sell an asset or paid to transfer a liability in an orderly transaction between market participants on the measurement date. The Fund calculates the net asset value per share at the close of the New York Stock Exchange (NYSE), generally at 4 p.m. Eastern time (NYSE close) on each day the NYSE is open for trading. Under compliance policies and procedures approved by the Trust’s Board of Trustees (the Board), the Fund’s administrator has responsibility for oversight of valuation, including leading the cross-functional Valuation and Liquidity Oversight Committee (VLOC). The VLOC provides administration and oversight of the Fund’s valuation policies and procedures, which are approved annually by the Board. Among other things, these procedures allow the Fund to utilize independent pricing services, quotations from securities and financial instrument dealers, and other market sources to determine fair value.
Equity securities listed on an exchange or on the NASDAQ National Market System are valued at the last quoted sale price or the official closing price of the day, respectively. Foreign
equity securities are valued as of the close of trading on the foreign stock exchange on which the security is primarily traded or as of the NYSE close, whichever is earlier. The value is then converted into its U.S. dollar equivalent at the foreign exchange rate in effect at the NYSE close on the day that the value of the security is determined. Over-the-counter (OTC) securities are valued within the range of the most recent quoted bid and ask prices. Securities that trade in multiple markets or on multiple exchanges are valued according to the broadest and most representative market. Certain equity securities are valued based upon fundamental characteristics or relationships to similar securities. Repurchase agreements are valued at cost, which approximates fair value.
The Fund has procedures to determine the fair value of financial instruments for which market prices are not reliable or readily available. Under these procedures, the VLOC convenes on a regular basis to review such financial instruments and considers a number of factors, including significant unobservable valuation inputs, when arriving at fair value. The VLOC primarily employs a market-based approach which may use related or comparable assets or liabilities, recent transactions, market multiples, book values, and other relevant information for the investment to determine the fair value of the investment. An income-based valuation approach may also be used in which the anticipated future cash flows of the investment are discounted to calculate fair value. Discounts may also be applied due to the nature or duration of any restrictions on the disposition of the investments. Due to the inherent uncertainty of valuations of such investments, the fair values may differ significantly from the values that would have been used had an active market existed. The VLOC employs various methods for calibrating these valuation approaches including a regular review of key inputs and assumptions, transactional back-testing or disposition analysis, and reviews of any related market activity.
Trading in securities on foreign securities stock exchanges and OTC markets may be completed before the daily NYSE close. In addition, trading in certain foreign markets may not take place on every NYSE business day. Occasionally, events occur between the time at which trading in a foreign security is completed and the close of the NYSE that might call into question the reliability of the value of a portfolio security held by the Fund. As a result, differences may arise between the value of the Fund’s portfolio securities as determined at the foreign market close and the latest indications of value at the close of the NYSE. In order to minimize the potential for these
| FGI-14 | Semiannual Report |
FRANKLIN TEMPLETON VARIABLE INSURANCE PRODUCTS TRUST
NOTES TO FINANCIAL STATEMENTS (UNAUDITED)
Franklin Growth and Income VIP Fund (continued)
differences, the VLOC monitors price movements following the close of trading in foreign stock markets through a series of country specific market proxies (such as baskets of American Depositary Receipts, futures contracts and exchange traded funds). These price movements are measured against established trigger thresholds for each specific market proxy to assist in determining if an event has occurred that may call into question the reliability of the values of the foreign securities held by the Fund. If such an event occurs, the securities may be valued using fair value procedures, which may include the use of independent pricing services.
When the last day of the reporting period is a non-business day, certain foreign markets may be open on those days that the NYSE is closed, which could result in differences between the value of the Fund’s portfolio securities on the last business day and the last calendar day of the reporting period. Any significant security valuation changes due to an open foreign market are adjusted and reflected by the Fund for financial reporting purposes.
b. Foreign Currency Translation
Portfolio securities and other assets and liabilities denominated in foreign currencies are translated into U.S. dollars based on the exchange rate of such currencies against U.S. dollars on the date of valuation. The Fund may enter into foreign currency exchange contracts to facilitate transactions denominated in a foreign currency. Purchases and sales of securities, income and expense items denominated in foreign currencies are translated into U.S. dollars at the exchange rate in effect on the transaction date. Portfolio securities and assets and liabilities denominated in foreign currencies contain risks that those currencies will decline in value relative to the U.S. dollar. Occasionally, events may impact the availability or reliability of foreign exchange rates used to convert the U.S. dollar equivalent value. If such an event occurs, the foreign exchange rate will be valued at fair value using procedures established and approved by the Board.
The Fund does not separately report the effect of changes in foreign exchange rates from changes in market prices on securities held. Such changes are included in net realized and unrealized gain or loss from investments in the Statement of Operations.
Realized foreign exchange gains or losses arise from sales of foreign currencies, currency gains or losses realized between the trade and settlement dates on securities transactions and the
difference between the recorded amounts of dividends, interest, and foreign withholding taxes and the U.S. dollar equivalent of the amounts actually received or paid. Net unrealized foreign exchange gains and losses arise from changes in foreign exchange rates on foreign denominated assets and liabilities other than investments in securities held at the end of the reporting period.
c. Joint Repurchase Agreement
The Fund enters into a joint repurchase agreement whereby its uninvested cash balance is deposited into a joint cash account with other funds managed by the investment manager or an affiliate of the investment manager and is used to invest in one or more repurchase agreements. The value and face amount of the joint repurchase agreement are allocated to the funds based on their pro-rata interest. A repurchase agreement is accounted for as a loan by the Fund to the seller, collateralized by securities which are delivered to the Fund’s custodian. The fair value, including accrued interest, of the initial collateralization is required to be at least 102% of the dollar amount invested by the funds, with the value of the underlying securities marked to market daily to maintain coverage of at least 100%. Repurchase agreements are subject to the terms of Master Repurchase Agreements (MRAs) with approved counterparties (sellers). The MRAs contain various provisions, including but not limited to events of default and maintenance of collateral for repurchase agreements. In the event of default by either the seller or the Fund, certain MRAs may permit the non-defaulting party to net and close-out all transactions, if any, traded under such agreements. The Fund may sell securities it holds as collateral and apply the proceeds towards the repurchase price and any other amounts owed by the seller to the Fund in the event of default by the seller. This could involve costs or delays in addition to a loss on the securities if their value falls below the repurchase price owed by the seller. The joint repurchase agreement held by the Fund at period end, as indicated in the Statement of Investments, had been entered into on June 30, 2015.
d. Equity-Linked Securities
The Fund invests in equity-linked securities. Equity-linked securities are hybrid financial instruments that generally combine both debt and equity characteristics into a single note form. Income received from equity-linked securities is recorded as realized gains in the Statement of Operations and may be based on the performance of an underlying equity security, an equity index, or an option position. The risks of investing in
| Semiannual Report | FGI-15 |
FRANKLIN TEMPLETON VARIABLE INSURANCE PRODUCTS TRUST
NOTES TO FINANCIAL STATEMENTS (UNAUDITED)
Franklin Growth and Income VIP Fund (continued)
1. Organization and Significant Accounting Policies (continued)
d. Equity-Linked Securities (continued)
equity-linked securities include unfavorable price movements in the underlying security and the credit risk of the issuing financial institution. There may be no guarantee of a return of principal with equity-linked securities and the appreciation potential may be limited. Equity-linked securities may be more volatile and less liquid than other investments held by the Fund.
e. Income and Deferred Taxes
It is the Fund’s policy to qualify as a regulated investment company under the Internal Revenue Code. The Fund intends to distribute to shareholders substantially all of its taxable income and net realized gains to relieve it from federal income and if applicable, excise taxes. As a result, no provision for U.S. federal income taxes is required.
The Fund may be subject to foreign taxation related to income received, capital gains on the sale of securities and certain foreign currency transactions in the foreign jurisdictions in which it invests. Foreign taxes, if any, are recorded based on the tax regulations and rates that exist in the foreign markets in which the Fund invests. When a capital gain tax is determined to apply, the Fund records an estimated deferred tax liability in an amount that would be payable if the securities were disposed of on the valuation date. As a result of several court cases, in certain countries across the European Union, the Fund has filed additional tax reclaims for previously withheld taxes on dividends earned in those countries. These additional filings are subject to various administrative proceedings by the local jurisdictions’ tax authorities within the European Union, as well as a number of related judicial proceedings. At this time, uncertainty exists as to the ultimate resolution of these proceedings, the likelihood of receipt of these reclaims, and the potential timing of payment, and accordingly, no amounts are reflected in the financial statements.
The Fund recognizes the tax benefits of uncertain tax positions only when the position is “more likely than not” to be sustained upon examination by the tax authorities based on the technical merits of the tax position. As of June 30, 2015, and for all open tax years, the Fund has determined that no liability for unrecognized tax benefits is required in the Fund’s financial statements related to uncertain tax positions taken on a tax return (or
expected to be taken on future tax returns). Open tax years are those that remain subject to examination and are based on each tax jurisdiction’s statute of limitation.
f. Security Transactions, Investment Income, Expenses and Distributions
Security transactions are accounted for on trade date. Realized gains and losses on security transactions are determined on a specific identification basis. Interest income and estimated expenses are accrued daily. Dividend income is recorded on the ex-dividend date except for certain dividends from foreign securities where the dividend rate is not available. In such cases, the dividend is recorded as soon as the information is received by the Fund. Distributions to shareholders are recorded on the ex-dividend date and are determined according to income tax regulations (tax basis). Distributable earnings determined on a tax basis may differ from earnings recorded in accordance with U.S. GAAP. These differences may be permanent or temporary. Permanent differences are reclassified among capital accounts to reflect their tax character. These reclassifications have no impact on net assets or the results of operations. Temporary differences are not reclassified, as they may reverse in subsequent periods.
Common expenses incurred by the Trust are allocated among the funds based on the ratio of net assets of each fund to the combined net assets of the Trust. Fund specific expenses are charged directly to the fund that incurred the expense.
Realized and unrealized gains and losses and net investment income, not including class specific expenses, are allocated daily to each class of shares based upon the relative proportion of net assets of each class. Differences in per share distributions, by class, are generally due to differences in class specific expenses.
g. Accounting Estimates
The preparation of financial statements in accordance with U.S. GAAP requires management to make estimates and assumptions that affect the reported amounts of assets and liabilities at the date of the financial statements and the amounts of income and expenses during the reporting period. Actual results could differ from those estimates.
h. Guarantees and Indemnifications
Under the Trust’s organizational documents, its officers and trustees are indemnified by the Trust against certain liabilities
| FGI-16 | Semiannual Report |
FRANKLIN TEMPLETON VARIABLE INSURANCE PRODUCTS TRUST
NOTES TO FINANCIAL STATEMENTS (UNAUDITED)
Franklin Growth and Income VIP Fund (continued)
arising out of the performance of their duties to the Trust. Additionally, in the normal course of business, the Trust, on behalf of the Fund, enters into contracts with service providers that contain general indemnification clauses. The Trust’s maximum
exposure under these arrangements is unknown as this would involve future claims that may be made against the Trust that have not yet occurred. Currently, the Trust expects the risk of loss to be remote.
2. Shares of Beneficial Interest
At June 30, 2015, there were an unlimited number of shares authorized (without par value). Transactions in the Fund’s shares were as follows:
| Six Months Ended June 30, 2015 | Year Ended December 31, 2014 | |||||||||||||||||
| Shares | Amount | Shares | Amount | |||||||||||||||
| Class 1 Shares: | ||||||||||||||||||
Shares sold | 5,479 | $ | 91,968 | 1,787 | $ | 29,600 | ||||||||||||
Shares issued in reinvestment of distributions | 568,589 | 9,159,967 | 273,329 | 4,441,593 | ||||||||||||||
Shares redeemed | (701,563 | ) | (11,969,899 | ) | (1,356,798 | ) | (22,146,435 | ) | ||||||||||
|
| |||||||||||||||||
Net increase (decrease) | (127,495 | ) | $ | (2,717,964 | ) | (1,081,682 | ) | $ | (17,675,242 | ) | ||||||||
|
| |||||||||||||||||
| Class 2 Shares: | ||||||||||||||||||
Shares sold | 266,953 | $ | 4,486,108 | 349,345 | $ | 5,677,772 | ||||||||||||
Shares issued in reinvestment of distributions | 461,342 | 7,321,503 | 213,552 | 3,421,107 | ||||||||||||||
Shares redeemed | (735,360 | ) | (12,356,496 | ) | (1,911,427 | ) | (30,692,146 | ) | ||||||||||
|
| |||||||||||||||||
Net increase (decrease) | (7,065 | ) | $ | (548,885 | ) | (1,348,530 | ) | $ | (21,593,267 | ) | ||||||||
|
| |||||||||||||||||
3. Transactions With Affiliates
Franklin Resources, Inc. is the holding company for various subsidiaries that together are referred to as Franklin Templeton Investments. Certain officers and trustees of the Fund are also officers and/or directors of the following subsidiaries:
| Subsidiary | Affiliation | |
Franklin Advisers, Inc. (Advisers) | Investment manager | |
Franklin Templeton Services, LLC (FT Services) | Administrative manager | |
Franklin Templeton Distributors, Inc. (Distributors) | Principal underwriter | |
Franklin Templeton Investor Services, LLC (Investor Services) | Transfer agent |
a. Management Fees
The Fund pays an investment management fee to Advisers based on the average daily net assets of the Fund as follows:
| Annualized Fee Rate | Net Assets | |
0.625% | Up to and including $100 million | |
0.500% | Over $100 million, up to and including $250 million | |
0.450% | Over $250 million, up to and including $7.5 billion | |
0.440% | Over $7.5 billion, up to and including $10 billion | |
0.430% | Over $10 billion, up to and including $12.5 billion | |
0.420% | Over $12.5 billion, up to and including $15 billion | |
0.400% | In excess of $15 billion |
| Semiannual Report | FGI-17 |
FRANKLIN TEMPLETON VARIABLE INSURANCE PRODUCTS TRUST
NOTES TO FINANCIAL STATEMENTS (UNAUDITED)
Franklin Growth and Income VIP Fund (continued)
3. Transactions With Affiliates (continued)
b. Administrative Fees
Under an agreement with Advisers, FT Services provides administrative services to the Fund. The fee is paid by Advisers based on the Fund’s average daily net assets, and is not an additional expense of the Fund.
c. Distribution Fees
The Board has adopted a distribution plan for Class 2 shares pursuant to Rule 12b-1 under the 1940 Act. Under the Fund’s compensation distribution plan, the Fund pays Distributors for costs incurred in connection with the servicing, sale and distribution of the Fund’s shares up to 0.35% per year of its average daily net assets. Some distribution fees are not charged on shares held by affiliates. The Board has agreed to limit the current rate to 0.25% per year for Class 2. The plan year, for purposes of monitoring compliance with the maximum annual plan rate, is February 1 through January 31.
d. Transfer Agent Fees
Investor Services, under terms of an agreement, performs shareholder servicing for the Fund and is not paid by the Fund for the services.
4. Expense Offset Arrangement
The Fund has entered into an arrangement with its custodian whereby credits realized as a result of uninvested cash balances are used to reduce a portion of the Fund’s custodian expenses. During the period ended June 30, 2015, there were no credits earned.
5. Income Taxes
At June 30, 2015, the cost of investments and net unrealized appreciation (depreciation) for income tax purposes were as follows:
Cost of investments | $ | 224,694,756 | ||
|
| |||
Unrealized appreciation | $ | 69,763,391 | ||
Unrealized depreciation | (8,953,695 | ) | ||
|
| |||
Net unrealized appreciation (depreciation) | $ | 60,809,696 | ||
|
|
Differences between income and/or capital gains as determined on a book basis and a tax basis are primarily due to differing treatments of equity-linked securities, corporate actions, bond discounts and premiums, and wash sales.
6. Investment Transactions
Purchases and sales of investments (excluding short term securities) for the period ended June 30, 2015, aggregated $39,375,004 and $59,848,156, respectively.
7. Credit Facility
The Fund, together with other U.S. registered and foreign investment funds (collectively, Borrowers), managed by Franklin Templeton Investments, are borrowers in a joint syndicated senior unsecured credit facility totaling $2 billion (Global Credit Facility) which matures on February 12, 2016. This Global Credit Facility provides a source of funds to the Borrowers for temporary and emergency purposes, including the ability to meet future unanticipated or unusually large redemption requests.
Under the terms of the Global Credit Facility, the Fund shall, in addition to interest charged on any borrowings made by the Fund and other costs incurred by the Fund, pay its share of fees and expenses incurred in connection with the implementation and maintenance of the Global Credit Facility, based upon its relative share of the aggregate net assets of all of the Borrowers, including an
| FGI-18 | Semiannual Report |
FRANKLIN TEMPLETON VARIABLE INSURANCE PRODUCTS TRUST
NOTES TO FINANCIAL STATEMENTS (UNAUDITED)
Franklin Growth and Income VIP Fund (continued)
annual commitment fee of 0.07% based upon the unused portion of the Global Credit Facility. These fees are reflected in other expenses in the Statement of Operations. During the period ended June 30, 2015, the Fund did not use the Global Credit Facility.
8. Fair Value Measurements
The Fund follows a fair value hierarchy that distinguishes between market data obtained from independent sources (observable inputs) and the Fund’s own market assumptions (unobservable inputs). These inputs are used in determining the value of the Fund’s financial instruments and are summarized in the following fair value hierarchy:
| • | Level 1 – quoted prices in active markets for identical financial instruments |
| • | Level 2 – other significant observable inputs (including quoted prices for similar financial instruments, interest rates, prepayment speed, credit risk, etc.) |
| • | Level 3 – significant unobservable inputs (including the Fund’s own assumptions in determining the fair value of financial instruments) |
The input levels are not necessarily an indication of the risk or liquidity associated with financial instruments at that level.
For movements between the levels within the fair value hierarchy, the Fund has adopted a policy of recognizing the transfers as of the date of the underlying event which caused the movement.
A summary of inputs used as of June 30, 2015, in valuing the Fund’s assets carried at fair value, is as follows:
| Level 1 | Level 2 | Level 3 | Total | |||||||||||||
| Assets: | ||||||||||||||||
Investments in Securities: | ||||||||||||||||
Equity Investments:a | ||||||||||||||||
Energy | $ | 15,680,865 | $ | 1,856,282 | $ | — | $ | 17,537,147 | ||||||||
All Other Equity Investmentsb | 254,489,520 | — | — | 254,489,520 | ||||||||||||
Equity-Linked Securities | — | 6,441,570 | — | 6,441,570 | ||||||||||||
Short Term Investments | — | 7,036,215 | — | 7,036,215 | ||||||||||||
|
| |||||||||||||||
Total Investments in Securities | $ | 270,170,385 | $ | 15,334,067 | $ | — | $ | 285,504,452 | ||||||||
|
| |||||||||||||||
aIncludes common and convertible preferred stocks.
bFor detailed categories, see the accompanying Statement of Investments.
9. Subsequent Events
The Fund has evaluated subsequent events through the issuance of the financial statements and determined that no events have occurred that require disclosure.
Abbreviations
| Selected Portfolio | ||
| ADR | American Depositary Receipt | |
| Semiannual Report | FGI-19 |
Franklin High Income VIP Fund
This semiannual report for Franklin High Income VIP Fund covers the period ended June 30, 2015.
Class 1 Performance Summary as of June 30, 2015
The Fund’s Class 1 shares delivered a +1.48% total return for the six-month period ended June 30, 2015.
Performance reflects the Fund’s Class 1 operating expenses, but does not include any contract fees, expenses or sales charges. If they had been included, performance would be lower. These charges and deductions, particularly for variable life policies, can have a significant effect on contract values and insurance benefits. See the contract prospectus for a complete description of these expenses, including sales charges.
Performance data represent past performance, which does not guarantee future results. Investment return and principal value will fluctuate, and you may have a gain or loss when you sell your shares. Current performance may differ from figures shown.
| Semiannual Report | FH-1 |
FRANKLIN HIGH INCOME VIP FUND
Fund Goals and Main Investments
Franklin High Income VIP Fund seeks a high level of current income with capital appreciation as a secondary goal. Under normal market conditions, the Fund invests predominantly in high yield, lower rated debt securities and preferred stocks.
Fund Risks
All investments involve risks, including possible loss of principal. The risks associated with higher yielding, lower rated securities include higher risk of default and loss of principal. Changes in the financial strength of a bond issuer or in a bond’s credit rating may affect its value. In addition, interest rate movements will affect the Fund’s share price and yield. Bond prices generally move in the opposite direction of interest rates. Thus, as prices of bonds in the Fund adjust to a rise in interest rates, the Fund’s share price may decline. Investment in foreign securities also involves special risks, including currency fluctuations, and political and economic uncertainty. The Fund is actively managed but there is no guarantee that the manager’s investment decisions will produce the desired results. The Fund’s prospectus also includes a description of the main investment risks.
Performance Overview
You can find the Fund’s six-month total return in the Performance Summary. In comparison, the Fund’s benchmark, the Credit Suisse (CS) High Yield Index, posted a +2.90% total return for the period under review.1 The Fund’s peers, as measured by the Lipper VIP High Yield Funds Classification Average, delivered a +2.49% total return.2
Economic and Market Overview
U.S. economic growth was mixed during the six-months under review. In 2015’s first quarter, U.S. dollar strength, low energy prices and a labor dispute at West Coast ports led exports to decline. Lower business investment and state and local government spending also weighed on the economy, while increases in consumer spending, residential investment and private inventory investment offered some support. In the second quarter, business capital spending rebounded and manufacturing and non-manufacturing activities increased, contributing to strong job gains that helped the unemployment rate decline from 5.6% in December 2014 to 5.3% in June
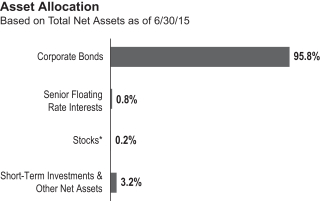
*Includes common and convertible preferred shares.
2015.3 Housing market data were generally encouraging as home sales and prices rose. After a brief, winter slump, retail sales rebounded in the spring as strong employment gains led to broad-based improvement, especially for auto and gasoline sales. Inflation, as measured by the Consumer Price Index, rose during the six months amid generally higher energy prices bouncing from recent lows.
During the six-month period, the Federal Reserve Board (Fed) kept its target interest rate at 0%–0.25% while considering when an increase might be appropriate. The Fed anticipated raising its target rate when it saw further labor market progress and was reasonably confident that inflation would move back to 2% over the medium term. In its June meeting, the Fed lowered its 2015 economic growth forecast and raised unemployment estimates given the weak start to the year.
The 10-year Treasury yield, which moves inversely to price, declined from 2.17% at the start of the period to a six-month low of 1.68% in early February as investors sought less risky assets given concerns about soft domestic data, Greece’s debt negotiations, less robust growth in China and the Fed’s cautious tone on raising interest rates. At period-end, the yield rose to 2.35% based partly on upbeat domestic and eurozone economic data and expectations of an agreement between Greece and its international creditors.
Investment Strategy
We are research-driven, fundamental investors who rely on a team of analysts to provide in-depth industry expertise and use
1. Source: Credit Suisse Group.
2. Source: Lipper, a Thomson Reuters Company.
One cannot invest directly in an index, and an index is not representative of the Fund’s portfolio. Please see Index Descriptions following the Fund Summaries.
3. Source: Bureau of Labor Statistics.
| FH-2 | Semiannual Report |
FRANKLIN HIGH INCOME VIP FUND
qualitative and quantitative analyses to evaluate companies. As bottom-up investors, we focus primarily on individual securities. We also consider sectors when choosing investments. In selecting securities for the Fund’s investment portfolio, we do not rely principally on ratings assigned by rating agencies, but perform our own independent analysis to evaluate an issuer’s creditworthiness. We consider a variety of factors, including an issuer’s experience and managerial strength, its sensitivity to economic conditions and its current financial condition.
| Top 10 Sectors/Industries | ||||
| 6/30/15 | ||||
| % of Total Net Assets | ||||
| Energy | 17.3% | |||
| Materials | 13.1% | |||
| Telecommunication Services | 9.1% | |||
| Media | 8.9% | |||
| Health Care Equipment & Services | 6.4% | |||
| Banks | 5.5% | |||
| Software & Services | 4.4% | |||
| Consumer Services | 4.0% | |||
| Pharmaceuticals, Biotechnology & Life Sciences | 3.7% | |||
| Utilities | 3.5% | |||
The dollar value, number of shares or principal amount, and names of all portfolio holdings are listed in the Fund’s Statement of Investments (SOI).
Manager’s Discussion
The high yield corporate bond market was impacted by conflicting market trends during the first half of 2015. Concerns about slower economic growth and deflationary fears prompted quantitative easing in Japan and the eurozone, while conversely in the U.S. the Federal Reserve provided guidance toward an increase in its short-term target rate before year-end given healthy employment gains and an expectation for stronger domestic economic growth. The general market’s outlook for Chinese economic growth became more downbeat, which continued to pressure the global commodities markets, while ongoing Greek negotiations weighed on the financial markets at period-end.
More specifically in the high yield market, the energy sector, which suffered in the fourth quarter of 2014, recovered some of its losses as oil prices rose from their early 2015 lows. U.S. producers initiated significant cutbacks in their drilling activity,
which contributed to the price increase. Although investor risk appetite for high yield bonds fluctuated during the period in conjunction with overall financial market volatility, by period-end a slowdown in new-issue supply relative to 2014 helped support high yield bond prices. Overall, high yield spreads relative to Treasuries narrowed modestly during the period, allowing the market to generate a positive total return. In terms of Fund performance, Fund returns underperformed the CS High Yield Index due to certain individual energy issues that did not participate in the energy rebound, as well as other commodity-related holdings that came under pressure with the slowdown in Chinese demand. At period-end, the Fund was positioned with a higher relative risk stance, primarily given its positioning in the energy and metals and mining industries.4
As is typical, during the period we drew on our fundamental research process to make individual investment decisions and to position our industry exposure relative to the CS High Yield Index. Overall, our industry exposures had a negative impact on relative returns during the period. For instance, our overweighting of the metals and mining sector compared with the CS High Yield Index dragged on performance. Although the sector’s bond valuations appeared attractive to us, the sector was affected by weak demand fundamentals out of China and Europe combined with increasing supply that continued to pressure pricing for commodities such as coal and iron ore. Correspondingly, bond prices suffered and the sector underperformed the benchmark. In contrast, bonds in the retailing industry outperformed the benchmark despite tepid consumer spending. We remained underweighted in the industry given what we considered the generally bondholder-unfriendly balance sheets of retailers as well as concerns about continued margin pressures and long-term challenges for certain retail concepts. However, positive company-specific events helped drive strong returns for certain large issuers in this rather small sector. Our overweighted positioning in cable television also hampered relative performance as the industry underperformed.5 The satellite television subindustry suffered from a delay in satellite launches and a perceived broader decline trend, while pay television faced a competitive environment.5 Potential consolidation in the pay television industry also added volatility to the sector, as did the prospect of possible new-issue supply coming into the market.
Conversely, certain industry exposures positively impacted relative Fund returns. As mentioned earlier, the energy sector partially rebounded in the first half of 2015 and was one of the
4. Metals and mining is part of materials in the SOI.
5. Cable, satellite and pay television are in media in the SOI.
| Semiannual Report | FH-3 |
FRANKLIN HIGH INCOME VIP FUND
high yield market’s top performing industries. We had maintained a sector overweighting relative to the CS High Yield Index and so the recovery aided relative returns. At the same time, security selection within energy hampered the Fund as it was more aggressively positioned and some of the more leveraged energy issues did not participate in the rally. Along the same lines, our modest overweighting in the gaming industry, which outperformed the benchmark, benefited the Fund.6 Stabilization of regional gaming markets and healthy demand in Las Vegas helped buoy the sector as did the recovery in the bond prices of Caesars Entertainment Operating Co., a large gaming issuer that filed for bankruptcy during the period. Finally, our overweighting in the wireless sector also aided relative performance.7 Some operators benefited from improving results, and the potential for consolidation in the industry also supported bond prices. For instance, the bonds of Wind Acquisition Finance gained due to expectations of a potential merger or partnership with a competitor in the Italian mobile market.
Thank you for your participation in Franklin High Income VIP Fund. We look forward to serving your future investment needs.
The foregoing information reflects our analysis, opinions and portfolio holdings as of June 30, 2015, the end of the reporting period. The way we implement our main investment strategies and the resulting portfolio holdings may change depending on factors such as market and economic conditions. These opinions may not be relied upon as investment advice or an offer for a particular security. The information is not a complete analysis of every aspect of any market, country, industry, security or the Fund. Statements of fact are from sources considered reliable, but the investment manager makes no representation or warranty as to their completeness or accuracy. Although historical performance is no guarantee of future results, these insights may help you understand our investment management philosophy.
6. Gaming is part of consumer services in the SOI.
7. Wireless is part of telecommunication services in the SOI.
| FH-4 | Semiannual Report |
FRANKLIN HIGH INCOME VIP FUND
Class 1 Fund Expenses
As an investor in a variable insurance contract (Contract) that indirectly provides for investment in an underlying mutual fund, you can incur transaction and/or ongoing expenses at both the Fund level and the Contract level.
| • | Transaction expenses can include sales charges (loads) on purchases, surrender fees, transfer fees and premium taxes. |
| • | Ongoing expenses can include management fees, distribution and service (12b-1) fees, contract fees, annual maintenance fees, mortality and expense risk fees and other fees and expenses. All mutual funds and Contracts have some types of ongoing expenses. |
The expenses shown in the table are meant to highlight ongoing expenses at the Fund level only and do not include ongoing expenses at the Contract level, or transaction expenses at either the Fund or Contract levels. While the Fund does not have transaction expenses, if the transaction and ongoing expenses at the Contract level were included, the expenses shown below would be higher. You should consult your Contract prospectus or disclosure document for more information.
The table shows Fund-level ongoing expenses and can help you understand these expenses and compare them with those of other mutual funds offered through the Contract. The table assumes a $1,000 investment held for the six months indicated. Please refer to the Fund prospectus for additional information on operating expenses.
Actual Fund Expenses
The first line (Actual) of the table provides actual account values and expenses. The “Ending Account Value” is derived from the Fund’s actual return, which includes the effect of ongoing Fund expenses, but does not include the effect of ongoing Contract expenses.
You can estimate the Fund-level expenses you incurred during the period by following these steps. Of course, your account value and expenses will differ from those in this illustration:
| 1. | Divide your account value by $1,000. |
If an account had an $8,600 value, then $8,600 ÷ $1,000 = 8.6.
| 2. | Multiply the result by the number under the heading “Fund-Level Expenses Incurred During Period.” |
If Fund-Level Expenses Incurred During Period were $7.50, then 8.6 × $7.50 = $64.50.
In this illustration, the estimated expenses incurred this period at the Fund level are $64.50.
Hypothetical Example for Comparison with Other Mutual Funds
Information in the second line (Hypothetical) of the table can help you compare ongoing expenses of the Fund with those of other mutual funds offered through the Contract. This information may not be used to estimate the actual ending account balance or expenses you incurred during the period. The hypothetical “Ending Account Value” is based on the Fund’s actual expense ratio and an assumed 5% annual rate of return before expenses, which does not represent the Fund’s actual return. The figure under the heading “Fund-Level Expenses Incurred During Period” shows the hypothetical expenses your account would have incurred under this scenario. You can compare this figure with the 5% hypothetical examples that appear in shareholder reports of other funds offered through a Contract.
| Class 1 | Beginning Account Value 1/1/15 | Ending Account Value 6/30/15 | Fund-Level Expenses 1/1/15–6/30/15 | |||||||||
Actual | $1,000 | $1,014.80 | $2.90 | |||||||||
Hypothetical (5% return before expenses) | $1,000 | $1,021.92 | $2.91 | |||||||||
*Expenses are calculated using the most recent six-month annualized expense ratio for the Fund’s Class 1 shares (0.58%), which does not include any ongoing expenses of the Contract for which the Fund is an investment option, multiplied by the average account value over the period, multiplied by 181/365 to reflect the one-half year period.
| Semiannual Report | FH-5 |
FRANKLIN TEMPLETON VARIABLE INSURANCE PRODUCTS TRUST
Financial Highlights
Franklin High Income VIP Fund
Six Months Ended (unaudited) | Year Ended December 31, | |||||||||||||||||||||||
| 2014 | 2013 | 2012 | 2011 | 2010 | ||||||||||||||||||||
| Class 1 | ||||||||||||||||||||||||
Per share operating performance (for a share outstanding throughout the period) | ||||||||||||||||||||||||
Net asset value, beginning of period | $6.62 | $7.02 | $7.01 | $6.52 | $6.63 | $6.26 | ||||||||||||||||||
|
| |||||||||||||||||||||||
| Income from investment operationsa: | ||||||||||||||||||||||||
Net investment incomeb | 0.20 | 0.42 | 0.46 | 0.48 | 0.50 | 0.49 | ||||||||||||||||||
Net realized and unrealized gains (losses) | (0.10 | ) | (0.38 | ) | 0.09 | 0.51 | (0.19 | ) | 0.32 | |||||||||||||||
|
| |||||||||||||||||||||||
Total from investment operations | 0.10 | 0.04 | 0.55 | 0.99 | 0.31 | 0.81 | ||||||||||||||||||
|
| |||||||||||||||||||||||
Less distributions from net investment income | (0.45 | ) | (0.44 | ) | (0.54 | ) | (0.50 | ) | (0.42 | ) | (0.44 | ) | ||||||||||||
|
| |||||||||||||||||||||||
Net asset value, end of period | $6.27 | $6.62 | $7.02 | $7.01 | $6.52 | $6.63 | ||||||||||||||||||
|
| |||||||||||||||||||||||
Total returnc | 1.48% | 0.21% | 8.17% | 15.94% | 4.63% | 13.71% | ||||||||||||||||||
| Ratios to average net assetsd | ||||||||||||||||||||||||
Expenses | 0.58% | 0.57% | e | 0.58% | e | 0.58% | 0.58% | 0.61% | ||||||||||||||||
Net investment income | 6.02% | 6.00% | 6.63% | 7.15% | 7.52% | 7.71% | ||||||||||||||||||
| Supplemental data | ||||||||||||||||||||||||
Net assets, end of period (000’s) | $32,257 | $34,552 | $39,300 | $42,166 | $41,971 | $48,051 | ||||||||||||||||||
Portfolio turnover rate | 18.68% | 39.46% | 30.78% | 37.03% | 45.11% | 60.80% | ||||||||||||||||||
aThe amount shown for a share outstanding throughout the period may not correlate with the Statement of Operations for the period due to the timing of sales and repurchases of the Fund’s shares in relation to income earned and/or fluctuating fair value of the investments of the Fund.
bBased on average daily shares outstanding.
cTotal return does not include fees, charges or expenses imposed by the variable annuity and life insurance contracts for which Franklin Templeton Variable Insurance Products Trust serves as an underlying investment vehicle. Total return is not annualized for periods less than one year.
dRatios are annualized for periods less than one year.
eBenefit of expense reduction rounds to less than 0.01%.
| FH-6 | Semiannual Report | The accompanying notes are an integral part of these financial statements. |
FRANKLIN TEMPLETON VARIABLE INSURANCE PRODUCTS TRUST
FINANCIAL HIGHLIGHTS
Franklin High Income VIP Fund (continued)
Six Months Ended (unaudited) | Year Ended December 31, | |||||||||||||||||||||||
| 2014 | 2013 | 2012 | 2011 | 2010 | ||||||||||||||||||||
| Class 2 | ||||||||||||||||||||||||
Per share operating performance (for a share outstanding throughout the period) | ||||||||||||||||||||||||
Net asset value, beginning of period | $6.41 | $6.81 | $6.82 | $6.36 | $6.47 | $6.13 | ||||||||||||||||||
|
| |||||||||||||||||||||||
| Income from investment operationsa: | ||||||||||||||||||||||||
Net investment incomeb | 0.19 | 0.39 | 0.43 | 0.46 | 0.47 | 0.47 | ||||||||||||||||||
Net realized and unrealized gains (losses) | (0.10 | ) | (0.37 | ) | 0.08 | 0.48 | (0.18 | ) | 0.30 | |||||||||||||||
|
| |||||||||||||||||||||||
Total from investment operations | 0.09 | 0.02 | 0.51 | 0.94 | 0.29 | 0.77 | ||||||||||||||||||
|
| |||||||||||||||||||||||
Less distributions from net investment income | (0.43 | ) | (0.42 | ) | (0.52 | ) | (0.48 | ) | (0.40 | ) | (0.43 | ) | ||||||||||||
|
| |||||||||||||||||||||||
Net asset value, end of period | $6.07 | $6.41 | $6.81 | $6.82 | $6.36 | $6.47 | ||||||||||||||||||
|
| |||||||||||||||||||||||
Total returnc | 1.40% | (0.02)% | 7.83% | 15.56% | 4.56% | 13.26% | ||||||||||||||||||
| Ratios to average net assetsd | ||||||||||||||||||||||||
Expenses | 0.83% | 0.82% | e | 0.83% | e | 0.83% | 0.83% | 0.86% | ||||||||||||||||
Net investment income | 5.77% | 5.75% | 6.38% | 6.90% | 7.27% | 7.46% | ||||||||||||||||||
| Supplemental data | ||||||||||||||||||||||||
Net assets, end of period (000’s) | $247,407 | $261,944 | $291,826 | $281,851 | $249,452 | $239,824 | ||||||||||||||||||
Portfolio turnover rate | 18.68% | 39.46% | 30.78% | 37.03% | 45.11% | 60.80% | ||||||||||||||||||
aThe amount shown for a share outstanding throughout the period may not correlate with the Statement of Operations for the period due to the timing of sales and repurchases of the Fund’s shares in relation to income earned and/or fluctuating fair value of the investments of the Fund.
bBased on average daily shares outstanding.
cTotal return does not include fees, charges or expenses imposed by the variable annuity and life insurance contracts for which Franklin Templeton Variable Insurance Products Trust serves as an underlying investment vehicle. Total return is not annualized for periods less than one year.
dRatios are annualized for periods less than one year.
eBenefit of expense reduction rounds to less than 0.01%.
| The accompanying notes are an integral part of these financial statements. | Semiannual Report | FH-7 |
FRANKLIN TEMPLETON VARIABLE INSURANCE PRODUCTS TRUST
FINANCIAL HIGHLIGHTS
Franklin High Income VIP Fund (continued)
Six Months Ended (unaudited) | Year Ended December 31, | |||||||||||||||||||||||
| 2014 | 2013 | 2012 | 2011 | 2010 | ||||||||||||||||||||
| Class 4 | ||||||||||||||||||||||||
| Per share operating performance (for a share outstanding throughout the period) | ||||||||||||||||||||||||
Net asset value, beginning of period | $6.54 | $6.94 | $6.94 | $6.46 | $6.57 | $6.22 | ||||||||||||||||||
|
| |||||||||||||||||||||||
| Income from investment operationsa: | ||||||||||||||||||||||||
Net investment incomeb | 0.19 | 0.39 | 0.43 | 0.46 | 0.47 | 0.47 | ||||||||||||||||||
Net realized and unrealized gains (losses) | (0.10 | ) | (0.38 | ) | 0.08 | 0.49 | (0.18 | ) | 0.31 | |||||||||||||||
|
| |||||||||||||||||||||||
Total from investment operations | 0.09 | 0.01 | 0.51 | 0.95 | 0.29 | 0.78 | ||||||||||||||||||
|
| |||||||||||||||||||||||
Less distributions from net investment income | (0.43 | ) | (0.41 | ) | (0.51 | ) | (0.47 | ) | (0.40 | ) | (0.43 | ) | ||||||||||||
|
| |||||||||||||||||||||||
Net asset value, end of period | $6.20 | $6.54 | $6.94 | $6.94 | $6.46 | $6.57 | ||||||||||||||||||
|
| |||||||||||||||||||||||
Total returnc | 1.25% | (0.15)% | 7.72% | 15.50% | 4.39% | 13.31% | ||||||||||||||||||
| Ratios to average net assetsd | ||||||||||||||||||||||||
Expenses | 0.93% | 0.92% | e | 0.93% | e | 0.93% | 0.93% | 0.96% | ||||||||||||||||
Net investment income | 5.67% | 5.65% | 6.28% | 6.80% | 7.17% | 7.36% | ||||||||||||||||||
| Supplemental data | ||||||||||||||||||||||||
Net assets, end of period (000’s) | $25,001 | $25,740 | $27,789 | $27,664 | $27,055 | $25,934 | ||||||||||||||||||
Portfolio turnover rate | 18.68% | 39.46% | 30.78% | 37.03% | 45.11% | 60.80% | ||||||||||||||||||
aThe amount shown for a share outstanding throughout the period may not correlate with the Statement of Operations for the period due to the timing of sales and repurchases of the Fund’s shares in relation to income earned and/or fluctuating fair value of the investments of the Fund.
bBased on average daily shares outstanding.
cTotal return does not include fees, charges or expenses imposed by the variable annuity and life insurance contracts for which Franklin Templeton Variable Insurance Products Trust serves as an underlying investment vehicle. Total return is not annualized for periods less than one year.
dRatios are annualized for periods less than one year.
eBenefit of expense reduction rounds to less than 0.01%.
| FH-8 | Semiannual Report | The accompanying notes are an integral part of these financial statements. |
FRANKLIN TEMPLETON VARIABLE INSURANCE PRODUCTS TRUST
Statement of Investments, June 30, 2015 (unaudited)
Franklin High Income VIP Fund
| ||||||||||||||
| Country | Shares | Value | ||||||||||||
Common Stocks 0.1% | ||||||||||||||
Materials 0.0%† | ||||||||||||||
| a | Verso Corp. | United States | 9,431 | $ | 6,225 | |||||||||
|
| |||||||||||||
Transportation 0.1% | ||||||||||||||
| a | CEVA Holdings LLC | United Kingdom | 224 | 165,967 | ||||||||||
|
| |||||||||||||
Total Common Stocks (Cost $366,150) | 172,192 | |||||||||||||
|
| |||||||||||||
Convertible Preferred Stocks 0.1% | ||||||||||||||
Transportation 0.1% | ||||||||||||||
| a | CEVA Holdings LLC, cvt. pfd., A-1 | United Kingdom | 6 | 6,000 | ||||||||||
| a | CEVA Holdings LLC, cvt. pfd., A-2 | United Kingdom | 486 | 359,277 | ||||||||||
|
| |||||||||||||
Total Convertible Preferred Stocks | 365,277 | |||||||||||||
|
| |||||||||||||
| Principal Amount* | ||||||||||||||
Corporate Bonds 95.8% | ||||||||||||||
Automobiles & Components 1.7% | ||||||||||||||
| b | Fiat Chrysler Automobiles NV, senior note, 144A, 5.25%, 4/15/23 | United Kingdom | 3,000,000 | 2,943,750 | ||||||||||
The Goodyear Tire & Rubber Co., senior note, 6.50%, 3/01/21 | United States | 2,200,000 | 2,337,500 | |||||||||||
|
| |||||||||||||
| 5,281,250 | ||||||||||||||
|
| |||||||||||||
Banks 5.5% | ||||||||||||||
| c | Bank of America Corp., junior sub. bond, M, 8.125% to 5/15/18, FRN thereafter, Perpetual | United States | 2,500,000 | 2,656,250 | ||||||||||
CIT Group Inc., senior note, | ||||||||||||||
5.375%, 5/15/20 | United States | 1,700,000 | 1,776,500 | |||||||||||
5.00%, 8/15/22 | United States | 2,700,000 | 2,679,750 | |||||||||||
| c | Citigroup Inc., junior sub. bond, M, 6.30% to 5/15/24, FRN thereafter, Perpetual | United States | 2,800,000 | 2,737,000 | ||||||||||
| c | JPMorgan Chase & Co., junior sub. bond, | |||||||||||||
R, 6.00% to 8/01/23, FRN thereafter, Perpetual | United States | 2,500,000 | 2,487,500 | |||||||||||
V, 5.00% to 7/30/19, FRN thereafter, Perpetual | United States | 1,400,000 | 1,372,000 | |||||||||||
Royal Bank of Scotland Group PLC, sub. note, | ||||||||||||||
6.125%, 12/15/22 | United Kingdom | 2,000,000 | 2,147,500 | |||||||||||
5.125%, 5/28/24 | United Kingdom | 900,000 | 900,563 | |||||||||||
|
| |||||||||||||
| 16,757,063 | ||||||||||||||
|
| |||||||||||||
Capital Goods 2.8% | ||||||||||||||
| b | Abengoa Finance SAU, senior note, 144A, | |||||||||||||
8.875%, 11/01/17 | Spain | 1,300,000 | 1,356,062 | |||||||||||
7.75%, 2/01/20 | Spain | 250,000 | 249,844 | |||||||||||
| b | Bombardier Inc., senior bond, 144A, 7.50%, 3/15/25 | Canada | 3,000,000 | 2,737,500 | ||||||||||
Navistar International Corp., senior note, 8.25%, 11/01/21 | United States | 1,500,000 | 1,432,500 | |||||||||||
TransDigm Inc., | ||||||||||||||
senior sub. bond, 6.50%, 7/15/24 | United States | 1,000,000 | 992,500 | |||||||||||
b senior sub. bond, 144A, 6.50%, 5/15/25 | United States | 200,000 | 198,750 | |||||||||||
senior sub. note, 6.00%, 7/15/22 | United States | 500,000 | 496,250 | |||||||||||
| b | Zachry Holdings Inc., senior note, 144A, 7.50%, 2/01/20 | United States | 1,100,000 | 1,100,000 | ||||||||||
|
| |||||||||||||
| 8,563,406 | ||||||||||||||
|
| |||||||||||||
| Semiannual Report | FH-9 |
FRANKLIN TEMPLETON VARIABLE INSURANCE PRODUCTS TRUST
STATEMENT OF INVESTMENTS (UNAUDITED)
Franklin High Income VIP Fund (continued)
| Country | Principal Amount* | Value | ||||||||||||
| Corporate Bonds (continued) | ||||||||||||||
Commercial & Professional Services 1.6% | ||||||||||||||
| b | Algeco Scotsman Global Finance PLC, senior secured note, first lien, 144A, 8.50%, 10/15/18 | United Kingdom | 300,000 | $ | 290,813 | |||||||||
| b | Anna Merger Sub Inc., senior note, 144A, 7.75%, 10/01/22 | United States | 1,600,000 | 1,616,000 | ||||||||||
| d,e | Goss Graphic Systems Inc., senior sub. note, 12.25%, 11/19/05 | United States | 1,912,374 | 191 | ||||||||||
| b | IHS Inc., senior note, 144A, 5.00%, 11/01/22 | United States | 600,000 | 598,500 | ||||||||||
United Rentals North America Inc., senior bond, 5.75%, 11/15/24 | United States | 2,500,000 | 2,475,000 | |||||||||||
|
| |||||||||||||
| 4,980,504 | ||||||||||||||
|
| |||||||||||||
Consumer Durables & Apparel 2.6% | ||||||||||||||
KB Home, | ||||||||||||||
senior bond, 7.50%, 9/15/22 | United States | 2,100,000 | 2,194,500 | |||||||||||
senior note, 4.75%, 5/15/19 | United States | 600,000 | 598,500 | |||||||||||
senior note, 7.00%, 12/15/21 | United States | 700,000 | 726,250 | |||||||||||
| b | Taylor Morrison Communities Inc./Monarch Communities Inc., senior note, 144A, | |||||||||||||
5.25%, 4/15/21 | United States | 900,000 | 891,000 | |||||||||||
5.875%, 4/15/23 | United States | 600,000 | 592,500 | |||||||||||
5.625%, 3/01/24 | United States | 1,500,000 | 1,451,250 | |||||||||||
Visant Corp., senior note, 10.00%, 10/01/17 | United States | 1,900,000 | 1,541,375 | |||||||||||
|
| |||||||||||||
| 7,995,375 | ||||||||||||||
|
| |||||||||||||
Consumer Services 4.0% | ||||||||||||||
| b | 1011778 BC ULC/New Red Finance Inc., | |||||||||||||
secured note, second lien, 144A, 6.00%, 4/01/22 | Canada | 2,000,000 | 2,060,000 | |||||||||||
senior secured note, first lien, 144A, 4.625%, 1/15/22 | Canada | 900,000 | 888,750 | |||||||||||
| b | 24 Hour Holdings III LLC, senior note, 144A, 8.00%, 6/01/22 | United States | 2,500,000 | 2,034,375 | ||||||||||
| d | Caesars Entertainment Operating Co. Inc., senior secured note, first lien, 11.25%, 6/01/17 | United States | 2,000,000 | 1,580,000 | ||||||||||
| b,d | Fontainebleau Las Vegas, senior secured note, first lien, 144A, 11.00%, 6/15/15 | United States | 1,700,000 | 8,585 | ||||||||||
| b | International Game Technology PLC, senior secured bond, 144A, 6.50%, 2/15/25 | United States | 3,000,000 | 2,791,875 | ||||||||||
| b | Sabre GLBL Inc., first lien, 144A, 5.375%, 4/15/23 | United States | 2,000,000 | 1,980,000 | ||||||||||
| b | Wynn Macau Ltd., senior note, 144A, 5.25%, 10/15/21 | Macau | 1,000,000 | 949,375 | ||||||||||
|
| |||||||||||||
| 12,292,960 | ||||||||||||||
|
| |||||||||||||
Diversified Financials 2.3% | ||||||||||||||
E*TRADE Financial Corp., senior note, | ||||||||||||||
5.375%, 11/15/22 | United States | 1,300,000 | 1,335,750 | |||||||||||
4.625%, 9/15/23 | United States | 600,000 | 591,000 | |||||||||||
Navient Corp., senior note, 5.50%, 1/15/19 | United States | 3,500,000 | 3,577,420 | |||||||||||
| b | OneMain Financial Holdings Inc., senior note, 144A, 7.25%, 12/15/21 | United States | 1,500,000 | 1,556,250 | ||||||||||
|
| |||||||||||||
| 7,060,420 | ||||||||||||||
|
| |||||||||||||
Energy 17.3% | ||||||||||||||
California Resources Corp., | ||||||||||||||
senior bond, 6.00%, 11/15/24 | United States | 2,000,000 | 1,727,500 | |||||||||||
senior note, 5.50%, 9/15/21 | United States | 800,000 | 697,000 | |||||||||||
| b | Calumet Specialty Products Partners LP/Finance Co., senior note, 144A, 7.75%, 4/15/23 | United States | 1,500,000 | 1,548,750 | ||||||||||
| FH-10 | Semiannual Report |
FRANKLIN TEMPLETON VARIABLE INSURANCE PRODUCTS TRUST
STATEMENT OF INVESTMENTS (UNAUDITED)
Franklin High Income VIP Fund (continued)
| Country | Principal Amount* | Value | ||||||||||||
| Corporate Bonds (continued) | ||||||||||||||
Energy (continued) | ||||||||||||||
CGG SA, senior note, 6.875%, 1/15/22 | France | 2,300,000 | $ | 1,927,688 | ||||||||||
CHC Helicopter SA, | ||||||||||||||
senior note, 9.375%, 6/01/21 | Canada | 260,000 | 156,000 | |||||||||||
senior secured note, first lien, 9.25%, 10/15/20 | Canada | 2,700,000 | 1,969,312 | |||||||||||
Chesapeake Energy Corp., senior note, 6.625%, 8/15/20 | United States | 3,000,000 | 2,940,000 | |||||||||||
| b | Compressco Partners LP/Finance Corp., senior note, 144A, 7.25%, 8/15/22 | United States | 700,000 | 672,000 | ||||||||||
CONSOL Energy Inc., senior note, | ||||||||||||||
5.875%, 4/15/22 | United States | 1,100,000 | 939,532 | |||||||||||
b 144A, 8.00%, 4/01/23 | United States | 1,800,000 | 1,714,500 | |||||||||||
| b | Drill Rigs Holdings Inc., secured note, 144A, 6.50%, 10/01/17 | United States | 2,000,000 | 1,765,000 | ||||||||||
Energy Transfer Equity LP, | ||||||||||||||
senior bond, 5.875%, 1/15/24 | United States | 400,000 | 416,800 | |||||||||||
senior note, first lien, 7.50%, 10/15/20 | United States | 2,600,000 | 2,944,500 | |||||||||||
senior secured bond, first lien, 5.50%, 6/01/27 | United States | 500,000 | 498,750 | |||||||||||
Energy XXI Gulf Coast Inc., senior note, | ||||||||||||||
7.50%, 12/15/21 | United States | 1,000,000 | 330,000 | |||||||||||
6.875%, 3/15/24 | United States | 1,200,000 | 396,000 | |||||||||||
| b | EnQuest PLC, senior note, 144A, 7.00%, 4/15/22 | United Kingdom | 2,000,000 | 1,611,250 | ||||||||||
EPL Oil & Gas Inc., senior note, 8.25%, 2/15/18 | United States | 1,400,000 | 850,500 | |||||||||||
Goodrich Petroleum Corp., senior note, 8.875%, 3/15/19 | United States | 2,500,000 | 1,087,500 | |||||||||||
Halcon Resources Corp., senior note, | ||||||||||||||
8.875%, 5/15/21 | United States | 2,500,000 | 1,656,250 | |||||||||||
9.25%, 2/15/22 | United States | 1,100,000 | 717,750 | |||||||||||
Linn Energy LLC/Finance Corp., senior note, | ||||||||||||||
8.625%, 4/15/20 | United States | 2,000,000 | 1,650,420 | |||||||||||
7.75%, 2/01/21 | United States | 700,000 | 547,750 | |||||||||||
6.50%, 9/15/21 | United States | 300,000 | 225,000 | |||||||||||
Martin Midstream Partners LP/Martin Midstream Finance Corp., senior note, 7.25%, 2/15/21 | United States | 1,100,000 | 1,086,250 | |||||||||||
Memorial Resource Development Corp., senior note, 5.875%, 7/01/22 | United States | 1,100,000 | 1,067,770 | |||||||||||
Midstates Petroleum Co. Inc./LLC, senior note, 9.25%, 6/01/21 | United States | 1,500,000 | 630,000 | |||||||||||
| b | Murray Energy Corp., secured note, second lien, 144A, 11.25%, 4/15/21 | United States | 1,200,000 | 1,014,000 | ||||||||||
| b | Ocean Rig UDW Inc., senior note, 144A, 7.25%, 4/01/19 | United States | 2,700,000 | 2,104,312 | ||||||||||
Offshore Group Investment Ltd., | ||||||||||||||
senior bond, first lien, 7.125%, 4/01/23 | United States | 1,000,000 | 615,000 | |||||||||||
senior secured note, first lien, 7.50%, 11/01/19 | United States | 2,000,000 | 1,236,250 | |||||||||||
PBF Holding Co. LLC, first lien, 8.25%, 2/15/20 | United States | 2,000,000 | 2,123,000 | |||||||||||
Peabody Energy Corp., senior note, | ||||||||||||||
6.50%, 9/15/20 | United States | 1,700,000 | 586,500 | |||||||||||
6.25%, 11/15/21 | United States | 1,700,000 | 552,500 | |||||||||||
Penn Virginia Corp., senior note, 8.50%, 5/01/20 | United States | 1,200,000 | 1,083,000 | |||||||||||
Penn Virginia Resource Partners LP/Penn Virginia Resource Finance Corp., senior note, 6.50%, 5/15/21 | United States | 600,000 | 635,250 | |||||||||||
QEP Resources Inc., senior note, | ||||||||||||||
5.375%, 10/01/22 | United States | 1,500,000 | 1,456,050 | |||||||||||
5.25%, 5/01/23 | United States | 1,500,000 | 1,443,750 | |||||||||||
| Semiannual Report | FH-11 |
FRANKLIN TEMPLETON VARIABLE INSURANCE PRODUCTS TRUST
STATEMENT OF INVESTMENTS (UNAUDITED)
Franklin High Income VIP Fund (continued)
| Country | Principal Amount* | Value | ||||||||||||
| Corporate Bonds (continued) | ||||||||||||||
Energy (continued) | ||||||||||||||
| b,d,f | Quicksilver Resources Inc., secured note, second lien, 144A, FRN, 7.00%, 6/21/19 | United States | 600,000 | $ | 367,500 | |||||||||
Sabine Pass Liquefaction LLC, | ||||||||||||||
first lien, 5.625%, 2/01/21 | United States | 2,400,000 | 2,460,000 | |||||||||||
first lien, 5.625%, 4/15/23 | United States | 900,000 | 901,404 | |||||||||||
senior secured note, first lien, 5.75%, 5/15/24 | United States | 200,000 | 200,250 | |||||||||||
Sanchez Energy Corp., senior note, | ||||||||||||||
7.75%, 6/15/21 | United States | 1,800,000 | 1,800,000 | |||||||||||
6.125%, 1/15/23 | United States | 700,000 | 630,000 | |||||||||||
| b | Ultra Petroleum Corp., senior bond, 144A, 6.125%, 10/01/24 | United States | 2,100,000 | 1,853,250 | ||||||||||
|
| |||||||||||||
| 52,835,788 | ||||||||||||||
|
| |||||||||||||
Food, Beverage & Tobacco 3.4% | ||||||||||||||
| b | Cott Beverages Inc., senior note, 144A, 6.75%, 1/01/20 | United States | 1,100,000 | 1,144,000 | ||||||||||
| b | Dole Food Co. Inc., senior secured note, 144A, 7.25%, 5/01/19 | United States | 1,500,000 | 1,518,750 | ||||||||||
| b | JBS USA LLC/Finance Inc., | |||||||||||||
senior bond, 144A, 5.875%, 7/15/24 | United States | 600,000 | 606,375 | |||||||||||
senior note, 144A, 8.25%, 2/01/20 | United States | 2,600,000 | 2,769,000 | |||||||||||
Post Holdings Inc., senior note, | ||||||||||||||
7.375%, 2/15/22 | United States | 1,600,000 | 1,634,000 | |||||||||||
b 144A, 6.75%, 12/01/21 | United States | 1,100,000 | 1,102,750 | |||||||||||
b 144A, 6.00%, 12/15/22 | United States | 300,000 | 289,875 | |||||||||||
WhiteWave Foods Co., senior note, 5.375%, 10/01/22 | United States | 1,100,000 | 1,166,000 | |||||||||||
|
| |||||||||||||
| 10,230,750 | ||||||||||||||
|
| |||||||||||||
Health Care Equipment & Services 6.4% | ||||||||||||||
Alere Inc., | ||||||||||||||
senior note, 7.25%, 7/01/18 | United States | 2,200,000 | 2,312,750 | |||||||||||
senior sub. note, 6.50%, 6/15/20 | United States | 300,000 | 312,000 | |||||||||||
CHS/Community Health Systems Inc., senior note, | ||||||||||||||
8.00%, 11/15/19 | United States | 1,200,000 | 1,267,500 | |||||||||||
7.125%, 7/15/20 | United States | 700,000 | 743,400 | |||||||||||
6.875%, 2/01/22 | United States | 2,000,000 | 2,117,500 | |||||||||||
DaVita HealthCare Partners Inc., senior bond, 5.125%, 7/15/24 | United States | 2,000,000 | 1,970,000 | |||||||||||
HCA Inc., | ||||||||||||||
senior bond, 5.375%, 2/01/25 | United States | 1,500,000 | 1,518,750 | |||||||||||
senior note, 5.875%, 5/01/23 | United States | 2,000,000 | 2,130,000 | |||||||||||
senior secured note, first lien, 5.00%, 3/15/24 | United States | 2,300,000 | 2,346,000 | |||||||||||
| b,g | Hologic Inc., senior note, 144A, 5.25%, 7/15/22 | United States | 900,000 | 921,375 | ||||||||||
Tenet Healthcare Corp., senior note, | ||||||||||||||
8.125%, 4/01/22 | United States | 3,000,000 | 3,292,500 | |||||||||||
b 144A, 5.00%, 3/01/19 | United States | 200,000 | 200,750 | |||||||||||
| b | Tenet Healthcare Corp. II, senior note, 144A, 6.75%, 6/15/23 | United States | 300,000 | 306,563 | ||||||||||
|
| |||||||||||||
| 19,439,088 | ||||||||||||||
|
| |||||||||||||
Materials 13.1% | ||||||||||||||
ArcelorMittal, senior note, | ||||||||||||||
6.25%, 3/01/21 | Luxembourg | 1,900,000 | 2,004,395 | |||||||||||
6.125%, 6/01/25 | Luxembourg | 700,000 | 700,875 | |||||||||||
| b | Ardagh Packaging Finance PLC, senior note, 144A, 9.125%, 10/15/20 | Luxembourg | 600,000 | 637,500 | ||||||||||
| FH-12 | Semiannual Report |
FRANKLIN TEMPLETON VARIABLE INSURANCE PRODUCTS TRUST
STATEMENT OF INVESTMENTS (UNAUDITED)
Franklin High Income VIP Fund (continued)
| Country | Principal Amount* | Value | ||||||||||||
| Corporate Bonds (continued) | ||||||||||||||
Materials (continued) | ||||||||||||||
| b | Ardagh Packaging Finance PLC/Ardagh MP Holdings USA Inc., senior note, 144A, | |||||||||||||
7.00%, 11/15/20 | Luxembourg | 176,471 | $ | 180,551 | ||||||||||
6.75%, 1/31/21 | Luxembourg | 300,000 | 308,250 | |||||||||||
6.00%, 6/30/21 | Luxembourg | 1,900,000 | 1,914,250 | |||||||||||
| b | Barminco Finance Pty. Ltd., senior note, 144A, 9.00%, 6/01/18 | Australia | 1,900,000 | 1,806,188 | ||||||||||
| b | BlueScope Steel Ltd./BlueScope Steel Finance, senior note, 144A, 7.125%, 5/01/18 | Australia | 2,000,000 | 2,050,000 | ||||||||||
| b | Cemex Finance LLC, senior secured note, first lien, 144A, 6.00%, 4/01/24 | Mexico | 1,700,000 | 1,685,125 | ||||||||||
| b | Cemex SAB de CV, senior secured bond, first lien, 144A, 6.125%, 5/05/25 | Mexico | 1,400,000 | 1,383,375 | ||||||||||
| b | The Chemours Co., | |||||||||||||
senior bond, 144A, 7.00%, 5/15/25 | United States | 500,000 | 486,250 | |||||||||||
senior note, 144A, 6.625%, 5/15/23 | United States | 1,800,000 | 1,748,250 | |||||||||||
| b | Eldorado Gold Corp., senior note, 144A, 6.125%, 12/15/20 | Canada | 3,100,000 | 3,080,625 | ||||||||||
| b | First Quantum Minerals Ltd., senior note, 144A, | |||||||||||||
6.75%, 2/15/20 | Canada | 2,000,000 | 1,945,000 | |||||||||||
7.00%, 2/15/21 | Canada | 1,836,000 | 1,764,855 | |||||||||||
| b | FMG Resources (August 2006) Pty. Ltd., senior secured note, 144A, 9.75%, 3/01/22 | Australia | 3,500,000 | 3,611,562 | ||||||||||
| b | NOVA Chemicals Corp., senior bond, 144A, 5.00%, 5/01/25 | Canada | 2,000,000 | 2,012,500 | ||||||||||
| b | Owens-Brockway Glass Container Inc., senior note, 144A, 5.00%, 1/15/22 | United States | 1,400,000 | 1,387,750 | ||||||||||
| b | Platform Specialty Products Corp., senior note, 144A, 6.50%, 2/01/22 | United States | 600,000 | 622,500 | ||||||||||
| b | Polymer Group Inc., senior note, 144A, 6.875%, 6/01/19 | United States | 1,500,000 | 1,385,625 | ||||||||||
| b | Rain CII Carbon LLC/CII Carbon Corp., second lien, 144A, 8.25%, 1/15/21 | United States | 1,200,000 | 1,173,000 | ||||||||||
Reynolds Group Issuer Inc./LLC/SA, | ||||||||||||||
first lien, 5.75%, 10/15/20 | United States | 1,000,000 | 1,027,500 | |||||||||||
senior note, 8.50%, 5/15/18 | United States | 2,800,000 | 2,859,500 | |||||||||||
senior note, 9.00%, 4/15/19 | United States | 1,200,000 | 1,246,500 | |||||||||||
| b | Sealed Air Corp., senior bond, 144A, 5.50%, 9/15/25 | United States | 1,000,000 | 1,010,000 | ||||||||||
Steel Dynamics Inc., | ||||||||||||||
senior bond, 5.50%, 10/01/24 | United States | 800,000 | 802,000 | |||||||||||
senior note, 5.125%, 10/01/21 | United States | 800,000 | 805,600 | |||||||||||
Verso Paper Holdings LLC/Inc., senior secured note, first lien, 11.75%, 1/15/19 | United States | 451,000 | 264,963 | |||||||||||
|
| |||||||||||||
| 39,904,489 | ||||||||||||||
|
| |||||||||||||
Media 8.9% | ||||||||||||||
CCO Holdings LLC/CCO Holdings Capital Corp., | ||||||||||||||
senior bond, 5.25%, 9/30/22 | United States | 1,000,000 | 987,500 | |||||||||||
b senior bond, 144A, 5.375%, 5/01/25 | United States | 800,000 | 781,000 | |||||||||||
senior note, 6.50%, 4/30/21 | United States | 1,500,000 | 1,573,125 | |||||||||||
Clear Channel Worldwide Holdings Inc., | ||||||||||||||
senior note, 6.50%, 11/15/22 | United States | 1,000,000 | 1,045,000 | |||||||||||
senior sub. note, 7.625%, 3/15/20 | United States | 1,100,000 | 1,150,875 | |||||||||||
CSC Holdings LLC, senior note, | ||||||||||||||
6.75%, 11/15/21 | United States | 1,500,000 | 1,586,250 | |||||||||||
5.25%, 6/01/24 | United States | 1,000,000 | 965,000 | |||||||||||
| Semiannual Report | FH-13 |
FRANKLIN TEMPLETON VARIABLE INSURANCE PRODUCTS TRUST
STATEMENT OF INVESTMENTS (UNAUDITED)
Franklin High Income VIP Fund (continued)
| Country | Principal Amount* | Value | ||||||||||||
| Corporate Bonds (continued) | ||||||||||||||
Media (continued) | ||||||||||||||
DISH DBS Corp., senior note, 5.875%, 11/15/24 | United States | 3,500,000 | $ | 3,370,937 | ||||||||||
Gannett Co. Inc., | ||||||||||||||
senior bond, 6.375%, 10/15/23 | United States | 2,000,000 | 2,090,000 | |||||||||||
senior note, 5.125%, 7/15/20 | United States | 1,400,000 | 1,440,250 | |||||||||||
iHeartCommunications Inc., | ||||||||||||||
senior secured bond, first lien, 9.00%, 3/01/21 | United States | 2,500,000 | 2,287,500 | |||||||||||
senior secured note, first lien, 9.00%, 9/15/22 | United States | 700,000 | 637,000 | |||||||||||
| b | Nielsen Finance LLC/Co., senior note, 144A, 5.00%, 4/15/22 | United States | 100,000 | 98,188 | ||||||||||
| b | Radio One Inc., senior sub. note, 144A, 9.25%, 2/15/20 | United States | 800,000 | 732,000 | ||||||||||
| b | Sirius XM Radio Inc., senior bond, 144A, | |||||||||||||
6.00%, 7/15/24 | United States | 2,500,000 | 2,531,250 | |||||||||||
5.375%, 4/15/25 | United States | 400,000 | 388,000 | |||||||||||
| b | Virgin Media Finance PLC, senior bond, 144A, 6.375%, 4/15/23 | United Kingdom | 1,700,000 | 1,763,750 | ||||||||||
| b | Virgin Media Secured Finance PLC, senior secured bond, first lien, 144A, 5.50%, 1/15/25 | United Kingdom | 1,100,000 | 1,106,187 | ||||||||||
| b | WMG Acquisition Corp., senior note, 144A, 5.625%, 4/15/22 | United States | 2,500,000 | 2,512,500 | ||||||||||
|
| |||||||||||||
| 27,046,312 | ||||||||||||||
|
| |||||||||||||
Pharmaceuticals, Biotechnology & Life Sciences 3.7% | ||||||||||||||
| b | Concordia Healthcare Corp., senior note, 144A, 7.00%, 4/15/23 | Canada | 1,000,000 | 1,002,500 | ||||||||||
| b | Endo Finance LLC/Endo Ltd./Endo Finco Inc., | |||||||||||||
senior bond, 144A, 6.00%, 2/01/25 | United States | 1,000,000 | 1,021,250 | |||||||||||
g senior note, 144A, 6.00%, 7/15/23 | United States | 700,000 | 717,500 | |||||||||||
| b | Horizon Pharma Financing Inc., senior note, 144A, 6.625%, 5/01/23 | United States | 500,000 | 521,875 | ||||||||||
Par Pharmaceutical Cos. Inc., senior note, 7.375%, 10/15/20 | United States | 3,300,000 | 3,531,000 | |||||||||||
| b | Valeant Pharmaceuticals International Inc., | |||||||||||||
senior bond, 144A, 6.125%, 4/15/25 | United States | 700,000 | 722,750 | |||||||||||
senior note, 144A, 7.50%, 7/15/21 | United States | 200,000 | 216,750 | |||||||||||
senior note, 144A, 5.625%, 12/01/21 | United States | 300,000 | 309,030 | |||||||||||
| b | VPI Escrow Corp., senior note, 144A, 6.375%, 10/15/20 | United States | 3,000,000 | 3,166,875 | ||||||||||
|
| |||||||||||||
| 11,209,530 | ||||||||||||||
|
| |||||||||||||
Real Estate 0.9% | ||||||||||||||
| b | Felcor Lodging LP, senior secured bond, 144A, 6.00%, 6/01/25 | United States | 700,000 | 714,000 | ||||||||||
| b | Ferrellgas LP/Ferrellgas Finance Corp., senior note, 144A, 6.75%, 6/15/23 | United States | 1,900,000 | 1,919,000 | ||||||||||
|
| |||||||||||||
| 2,633,000 | ||||||||||||||
|
| |||||||||||||
Retailing 1.8% | ||||||||||||||
| b | American Builders & Contractors Supply Co. Inc., senior note, 144A, 5.625%, 4/15/21 | United States | 2,100,000 | 2,147,250 | ||||||||||
| b | Argos Merger Sub Inc., senior note, 144A, 7.125%, 3/15/23 | United States | 600,000 | 630,000 | ||||||||||
| b | Family Tree Escrow LLC, senior note, 144A, 5.75%, 3/01/23 | United States | 800,000 | 840,000 | ||||||||||
| b | Netflix Inc., senior bond, 144A, 5.875%, 2/15/25 | United States | 1,900,000 | 1,976,209 | ||||||||||
|
| |||||||||||||
| 5,593,459 | ||||||||||||||
|
| |||||||||||||
Software & Services 4.4% | ||||||||||||||
| b | BMC Software Finance Inc., senior note, 144A, 8.125%, 7/15/21 | United States | 3,000,000 | 2,441,250 | ||||||||||
Equinix Inc., senior bond, 5.375%, 4/01/23 | United States | 3,300,000 | 3,316,500 | |||||||||||
First Data Corp., | ||||||||||||||
senior bond, 12.625%, 1/15/21 | United States | 1,000,000 | 1,157,500 | |||||||||||
senior note, 11.25%, 1/15/21 | United States | 646,000 | 718,675 | |||||||||||
b senior secured bond, second lien, 144A, 8.25%, 1/15/21 | United States | 2,500,000 | 2,643,750 | |||||||||||
| FH-14 | Semiannual Report |
FRANKLIN TEMPLETON VARIABLE INSURANCE PRODUCTS TRUST
STATEMENT OF INVESTMENTS (UNAUDITED)
Franklin High Income VIP Fund (continued)
| Country | Principal Amount* | Value | ||||||||||||
| Corporate Bonds (continued) | ||||||||||||||
Software & Services (continued) | ||||||||||||||
| b | Infor (U.S.) Inc., senior note, 144A, 6.50%, 5/15/22 | United States | 1,900,000 | $ | 1,942,750 | |||||||||
Sterling International Inc., senior note, 11.00%, 10/01/19 | United States | 1,200,000 | 1,278,000 | |||||||||||
|
| |||||||||||||
| 13,498,425 | ||||||||||||||
|
| |||||||||||||
Technology Hardware & Equipment 1.5% | ||||||||||||||
| b | Alcatel-Lucent USA Inc., senior note, 144A, 6.75%, 11/15/20 | France | 1,500,000 | 1,591,875 | ||||||||||
| b | Blackboard Inc., senior note, 144A, 7.75%, 11/15/19 | United States | 2,000,000 | 1,890,000 | ||||||||||
| b | CommScope Technologies Finance LLC, senior bond, 144A, 6.00%, 6/15/25 | United States | 1,100,000 | 1,098,625 | ||||||||||
|
| |||||||||||||
| 4,580,500 | ||||||||||||||
|
| |||||||||||||
Telecommunication Services 9.1% | ||||||||||||||
CenturyLink Inc., | ||||||||||||||
senior bond, 6.75%, 12/01/23 | United States | 100,000 | 100,688 | |||||||||||
senior note, 6.45%, 6/15/21 | United States | 400,000 | 405,000 | |||||||||||
senior note, 5.80%, 3/15/22 | United States | 2,500,000 | 2,396,875 | |||||||||||
| b | Digicel Group Ltd., senior note, 144A, 8.25%, 9/30/20 | Bermuda | 1,500,000 | 1,507,500 | ||||||||||
| b | Digicel Ltd., senior note, 144A, 6.00%, 4/15/21 | Bermuda | 2,200,000 | 2,128,500 | ||||||||||
Frontier Communications Corp., senior note, | ||||||||||||||
8.50%, 4/15/20 | United States | 100,000 | 104,800 | |||||||||||
8.75%, 4/15/22 | United States | 300,000 | 298,500 | |||||||||||
7.875%, 1/15/27 | United States | 200,000 | 186,000 | |||||||||||
Intelsat Jackson Holdings SA, | ||||||||||||||
senior bond, 5.50%, 8/01/23 | Luxembourg | 1,500,000 | 1,328,437 | |||||||||||
senior note, 7.50%, 4/01/21 | Luxembourg | 3,800,000 | 3,771,500 | |||||||||||
Sprint Communications Inc., senior note, | ||||||||||||||
8.375%, 8/15/17 | United States | 2,000,000 | 2,170,000 | |||||||||||
b 144A, 9.00%, 11/15/18 | United States | 3,000,000 | 3,395,280 | |||||||||||
Sprint Corp., senior bond, | ||||||||||||||
7.875%, 9/15/23 | United States | 500,000 | 488,750 | |||||||||||
7.125%, 6/15/24 | United States | 500,000 | 465,050 | |||||||||||
T-Mobile USA Inc., | ||||||||||||||
senior bond, 6.50%, 1/15/24 | United States | 900,000 | 931,500 | |||||||||||
senior bond, 6.375%, 3/01/25 | United States | 1,600,000 | 1,646,000 | |||||||||||
senior note, 6.542%, 4/28/20 | United States | 1,600,000 | 1,679,184 | |||||||||||
senior note, 6.125%, 1/15/22 | United States | 200,000 | 207,000 | |||||||||||
| b | Wind Acquisition Finance SA, | |||||||||||||
senior note, 144A, 7.375%, 4/23/21 | Italy | 3,500,000 | 3,539,375 | |||||||||||
senior secured note, first lien, 144A, 4.75%, 7/15/20 | Italy | 1,000,000 | 995,000 | |||||||||||
|
| |||||||||||||
| 27,744,939 | ||||||||||||||
|
| |||||||||||||
Transportation 1.3% | ||||||||||||||
| b | Florida East Coast Holdings Corp., | |||||||||||||
secured note, first lien, 144A, 6.75%, 5/01/19 | United States | 900,000 | 904,500 | |||||||||||
senior note, 144A, 9.75%, 5/01/20 | United States | 500,000 | 476,250 | |||||||||||
| b | Stena AB, senior bond, 144A, 7.00%, 2/01/24 | Sweden | 1,000,000 | 970,000 | ||||||||||
| b | Stena International SA, secured bond, 144A, 5.75%, 3/01/24 | Sweden | 1,500,000 | 1,436,235 | ||||||||||
|
| |||||||||||||
| 3,786,985 | ||||||||||||||
|
| |||||||||||||
Utilities 3.5% | ||||||||||||||
Calpine Corp., | ||||||||||||||
senior bond, 5.75%, 1/15/25 | United States | 1,200,000 | 1,171,500 | |||||||||||
senior note, 5.375%, 1/15/23 | United States | 1,300,000 | 1,283,750 | |||||||||||
| Semiannual Report | FH-15 |
FRANKLIN TEMPLETON VARIABLE INSURANCE PRODUCTS TRUST
STATEMENT OF INVESTMENTS (UNAUDITED)
Franklin High Income VIP Fund (continued)
| Country | Principal Amount* | Value | ||||||||||||
| Corporate Bonds (continued) | ||||||||||||||
Utilities (continued) | ||||||||||||||
Calpine Corp. (continued) | ||||||||||||||
b senior secured bond, first lien, 144A, 7.875%, 1/15/23 | United States | 698,000 | $ | 757,330 | ||||||||||
b senior secured bond, first lien, 144A, 5.875%, 1/15/24 | United States | 400,000 | 425,000 | |||||||||||
b senior secured note, first lien, 144A, 6.00%, 1/15/22 | United States | 100,000 | 106,250 | |||||||||||
| b | InterGen NV, secured bond, 144A, 7.00%, 6/30/23 | Netherlands | 2,500,000 | 2,237,500 | ||||||||||
NGL Energy Partners LP/NGL Energy Finance Corp., senior note, 5.125%, 7/15/19 | United States | 300,000 | 300,750 | |||||||||||
| b | NRG Yield Operating LLC, senior bond, 144A, 5.375%, 8/15/24 | United States | 2,000,000 | 2,025,000 | ||||||||||
| b | PPL Energy Supply LLC, senior bond, 144A, 6.50%, 6/01/25 | United States | 700,000 | 700,875 | ||||||||||
| b,d | Texas Competitive Electric Holdings Co. LLC/Texas Competitive Electric Holdings Finance Inc., senior secured note, first lien, 144A, 11.50%, 10/01/20 | United States | 2,500,000 | 1,531,250 | ||||||||||
|
| |||||||||||||
| 10,539,205 | ||||||||||||||
|
| |||||||||||||
Total Corporate Bonds (Cost $307,357,878) | 291,973,448 | |||||||||||||
|
| |||||||||||||
| f,h | Senior Floating Rate Interests (Cost $2,312,723) 0.8% | |||||||||||||
Household & Personal Products 0.8% | ||||||||||||||
Sun Products Corp., Tranche B Term Loan, 5.50%, 3/23/20 | United States | 2,329,592 | 2,265,529 | |||||||||||
|
| |||||||||||||
| Shares | ||||||||||||||
Escrows and Litigation Trusts (Cost $ —) 0.0% | ||||||||||||||
| a,e | NewPage Corp., Litigation Trust | United States | 2,500,000 | — | ||||||||||
|
| |||||||||||||
Total Investments before Short Term Investments (Cost $310,768,607) | 294,776,446 | |||||||||||||
|
| |||||||||||||
| Principal Amount* | ||||||||||||||
Short Term Investments (Cost $3,309,658) 1.0% | ||||||||||||||
Repurchase Agreements 1.0% | ||||||||||||||
| i | Joint Repurchase Agreement, 0.095%, 7/01/15 |
| United States |
|
| 3,309,658 |
|
| 3,309,658 |
| ||||
BNP Paribas Securities Corp. (Maturity Value $812,192) | ||||||||||||||
Collateralized by U.S. Government Agency Securities, 0.000% - 5.50%, 12/01/15 - 6/12/20; U.S. Government Agency Securities, Strips, 6/01/17; jU.S. Treasury Bills, 3/31/16; U.S. Treasury Bonds, 3.125%, 8/15/44; and U.S. Treasury Notes, 1.25% -1.75%, 1/31/19 - 9/30/19 (valued at $3,376,528) | ||||||||||||||
|
| |||||||||||||
Total Investments (Cost $314,078,265) 97.8% | 298,086,104 | |||||||||||||
Other Assets, less Liabilities 2.2% | 6,579,449 | |||||||||||||
|
| |||||||||||||
Net Assets 100.0% | $ | 304,665,553 | ||||||||||||
|
| |||||||||||||
See Abbreviations on page FH-28.
†Rounds to less than 0.1% of net assets.
*The principal amount is stated in U.S. dollars unless otherwise indicated.
| FH-16 | Semiannual Report |
FRANKLIN TEMPLETON VARIABLE INSURANCE PRODUCTS TRUST
STATEMENT OF INVESTMENTS (UNAUDITED)
Franklin High Income VIP Fund (continued)
aNon-income producing.
bSecurity was purchased pursuant to Rule 144A under the Securities Act of 1933 and may be sold in transactions exempt from registration only to qualified institutional buyers or in a public offering registered under the Securities Act of 1933. These securities have been deemed liquid under guidelines approved by the Trust’s Board of Trustees. At June 30, 2015, the aggregate value of these securities was $138,560,294, representing 45.48% of net assets.
cPerpetual security with no stated maturity date.
dSee Note 7 regarding defaulted securities.
eSecurity has been deemed illiquid because it may not be able to be sold within seven days. At June 30, 2015, the aggregate value of these securities was $191, representing less than 0.01% of net assets.
fThe coupon rate shown represents the rate at period end.
gSecurity purchased on a when-issued basis. See Note 1(d).
hSee Note 1(e) regarding senior floating rate interests.
iSee Note 1(c) regarding joint repurchase agreement.
jThe security is traded on a discount basis with no stated coupon rate.
| The accompanying notes are an integral part of these financial statements. | Semiannual Report | FH-17 |
FRANKLIN TEMPLETON VARIABLE INSURANCE PRODUCTS TRUST
Financial Statements
Statement of Assets and Liabilities
June 30, 2015 (unaudited)
| Franklin High Income VIP Fund | ||||
Assets: | ||||
Investments in securities: | ||||
Cost - Unaffiliated issuers | $ | 310,768,607 | ||
Cost - Repurchase agreements | 3,309,658 | |||
|
| |||
Total cost of investments | $ | 314,078,265 | ||
|
| |||
Value - Unaffiliated issuers | $ | 294,776,446 | ||
Value - Repurchase agreements | 3,309,658 | |||
|
| |||
Total value of investments | 298,086,104 | |||
Receivables: | ||||
Investment securities sold | 5,503,446 | |||
Capital shares sold | 400,078 | |||
Interest | 5,078,925 | |||
Other assets | 134 | |||
|
| |||
Total assets | 309,068,687 | |||
|
| |||
Liabilities: | ||||
Payables: | ||||
Investment securities purchased | 1,893,084 | |||
Capital shares redeemed | 2,173,157 | |||
Management fees | 138,543 | |||
Distribution fees | 125,716 | |||
Accrued expenses and other liabilities | 72,634 | |||
|
| |||
Total liabilities | 4,403,134 | |||
|
| |||
Net assets, at value | $ | 304,665,553 | ||
|
| |||
Net assets consist of: | ||||
Paid-in capital | $ | 330,901,206 | ||
Undistributed net investment income | 7,320,091 | |||
Net unrealized appreciation (depreciation) | (15,992,161 | ) | ||
Accumulated net realized gain (loss) | (17,563,583 | ) | ||
|
| |||
Net assets, at value | $ | 304,665,553 | ||
|
| |||
| Class 1: | ||||
Net assets, at value | $ | 32,257,029 | ||
|
| |||
Shares outstanding | 5,148,141 | |||
|
| |||
Net asset value and maximum offering price per share | $ | 6.27 | ||
|
| |||
| Class 2: | ||||
Net assets, at value | $ | 247,407,089 | ||
|
| |||
Shares outstanding | 40,787,799 | |||
|
| |||
Net asset value and maximum offering price per share | $ | 6.07 | ||
|
| |||
| Class 4: | ||||
Net assets, at value | $ | 25,001,435 | ||
|
| |||
Shares outstanding | 4,030,587 | |||
|
| |||
Net asset value and maximum offering price per share | $ | 6.20 | ||
|
| |||
| FH-18 | Semiannual Report | The accompanying notes are an integral part of these financial statements. |
FRANKLIN TEMPLETON VARIABLE INSURANCE PRODUCTS TRUST
FINANCIAL STATEMENTS
Statement of Operations
for the six months ended June 30, 2015 (unaudited)
| Franklin High Income VIP Fund | ||||
Investment income: | ||||
Interest | $ | 10,525,915 | ||
|
| |||
Expenses: | ||||
Management fees (Note 3a) | 841,555 | |||
Distribution fees: (Note 3c) | ||||
Class 2 | 324,706 | |||
Class 4 | 44,304 | |||
Custodian fees (Note 4) | 1,550 | |||
Reports to shareholders | 46,090 | |||
Professional fees | 24,783 | |||
Trustees’ fees and expenses | 742 | |||
Other | 14,333 | |||
|
| |||
Total expenses | 1,298,063 | |||
|
| |||
Net investment income | 9,227,852 | |||
|
| |||
Realized and unrealized gains (losses): | ||||
Net realized gain (loss) from investments | (1,804,631 | ) | ||
Net change in unrealized appreciation (depreciation) on investments | (3,305,681 | ) | ||
|
| |||
Net realized and unrealized gain (loss) | (5,110,312 | ) | ||
|
| |||
Net increase (decrease) in net assets resulting from operations | $ | 4,117,540 | ||
|
| |||
| The accompanying notes are an integral part of these financial statements. | Semiannual Report | FH-19 |
FRANKLIN TEMPLETON VARIABLE INSURANCE PRODUCTS TRUST
FINANCIAL STATEMENTS
Statements of Changes in Net Assets
| Franklin High Income VIP Fund | ||||||||
| Six Months Ended June 30, 2015 (unaudited) | Year Ended December 31, 2014 | |||||||
Increase (decrease) in net assets: | ||||||||
Operations: | ||||||||
Net investment income | $ | 9,227,852 | $ | 20,625,453 | ||||
Net realized gain (loss) | (1,804,631 | ) | 7,929,816 | |||||
Net change in unrealized appreciation (depreciation) | (3,305,681 | ) | (26,631,956 | ) | ||||
|
| |||||||
Net increase (decrease) in net assets resulting from operations | 4,117,540 | 1,923,313 | ||||||
|
| |||||||
Distributions to shareholders from: | ||||||||
Net investment income: | ||||||||
Class 1 | (2,177,640 | ) | (2,292,485 | ) | ||||
Class 2 | (17,219,440 | ) | (18,595,621 | ) | ||||
Class 4 | (1,604,998 | ) | (1,613,962 | ) | ||||
|
| |||||||
Total distributions to shareholders | (21,002,078 | ) | (22,502,068 | ) | ||||
|
| |||||||
Capital share transactions: (Note 2) | ||||||||
Class 1 | (617,816 | ) | (2,696,242 | ) | ||||
Class 2 | (614,424 | ) | (12,927,786 | ) | ||||
Class 4 | 545,925 | (475,860 | ) | |||||
|
| |||||||
Total capital share transactions | (686,315 | ) | (16,099,888 | ) | ||||
|
| |||||||
Net increase (decrease) in net assets | (17,570,853 | ) | (36,678,643 | ) | ||||
Net assets: | ||||||||
Beginning of period | 322,236,406 | 358,915,049 | ||||||
|
| |||||||
End of period | $ | 304,665,553 | $ | 322,236,406 | ||||
|
| |||||||
Undistributed net investment income included in net assets: | ||||||||
End of period | $ | 7,320,091 | $ | 19,094,317 | ||||
|
| |||||||
| FH-20 | Semiannual Report | The accompanying notes are an integral part of these financial statements. |
FRANKLIN TEMPLETON VARIABLE INSURANCE PRODUCTS TRUST
Notes to Financial Statements (unaudited)
Franklin High Income VIP Fund
1. Organization and Significant Accounting Policies
Franklin Templeton Variable Insurance Products Trust (Trust) is registered under the Investment Company Act of 1940 (1940 Act) as an open-end management investment company, consisting of nineteen separate funds and applies the specialized accounting and reporting guidance in U.S. Generally Accepted Accounting Principles (U.S. GAAP). Franklin High Income VIP Fund (Fund) is included in this report. The financial statements of the remaining funds in the Trust are presented separately. Shares of the Fund are generally sold only to insurance company separate accounts to fund the benefits of variable life insurance policies or variable annuity contracts. At June 30, 2015, 84.88% of the Fund’s shares were held through one insurance company. Investment activities of these insurance company separate accounts could have a material impact on the Fund. The Fund offers three classes of shares: Class 1, Class 2 and Class 4. Each class of shares differs by its distribution fees, voting rights on matters affecting a single class and its exchange privilege.
The following summarizes the Fund’s significant accounting policies.
a. Financial Instrument Valuation
The Fund’s investments in financial instruments are carried at fair value daily. Fair value is the price that would be received to sell an asset or paid to transfer a liability in an orderly transaction between market participants on the measurement date. The Fund calculates the net asset value per share at the close of the New York Stock Exchange (NYSE), generally at 4 p.m. Eastern time (NYSE close) on each day the NYSE is open for trading. Under compliance policies and procedures approved by the Trust’s Board of Trustees (the Board), the Fund’s administrator has responsibility for oversight of valuation, including leading the cross-functional Valuation and Liquidity Oversight Committee (VLOC). The VLOC provides administration and oversight of the Fund’s valuation policies and procedures, which are approved annually by the Board. Among other things, these procedures allow the Fund to utilize independent pricing services, quotations from securities and financial instrument dealers, and other market sources to determine fair value.
Equity securities listed on an exchange or on the NASDAQ National Market System are valued at the last quoted sale price or the official closing price of the day, respectively. Foreign equity securities are valued as of the close of trading on the
foreign stock exchange on which the security is primarily traded or as of the NYSE close, whichever is earlier. The value is then converted into its U.S. dollar equivalent at the foreign exchange rate in effect at the NYSE close on the day that the value of the security is determined. Over-the-counter (OTC) securities are valued within the range of the most recent quoted bid and ask prices. Securities that trade in multiple markets or on multiple exchanges are valued according to the broadest and most representative market. Certain equity securities are valued based upon fundamental characteristics or relationships to similar securities.
Debt securities generally trade in the OTC market rather than on a securities exchange. The Fund’s pricing services use multiple valuation techniques to determine fair value. In instances where sufficient market activity exists, the pricing services may utilize a market-based approach through which quotes from market makers are used to determine fair value. In instances where sufficient market activity may not exist or is limited, the pricing services also utilize proprietary valuation models which may consider market characteristics such as benchmark yield curves, credit spreads, estimated default rates, anticipated market interest rate volatility, coupon rates, anticipated timing of principal repayments, underlying collateral, and other unique security features in order to estimate the relevant cash flows, which are then discounted to calculate the fair value. Securities denominated in a foreign currency are converted into their U.S. dollar equivalent at the foreign exchange rate in effect at the NYSE close on the date that the values of the foreign debt securities are determined. Repurchase agreements are valued at cost, which approximates fair value.
The Fund has procedures to determine the fair value of financial instruments for which market prices are not reliable or readily available. Under these procedures, the VLOC convenes on a regular basis to review such financial instruments and considers a number of factors, including significant unobservable valuation inputs, when arriving at fair value. The VLOC primarily employs a market-based approach which may use related or comparable assets or liabilities, recent transactions, market multiples, book values, and other relevant information for the investment to determine the fair value of the investment. An income-based valuation approach may also be used in which the anticipated future cash flows of the investment are discounted to calculate fair value. Discounts may also be applied due to the nature or duration of any restrictions on the disposition of the investments. Due to the inherent uncertainty of valuations of
| Semiannual Report | FH-21 |
FRANKLIN TEMPLETON VARIABLE INSURANCE PRODUCTS TRUST
NOTES TO FINANCIAL STATEMENTS (UNAUDITED)
Franklin High Income VIP Fund (continued)
1. Organization and Significant Accounting Policies (continued)
a. Financial Instrument Valuation (continued)
such investments, the fair values may differ significantly from the values that would have been used had an active market existed. The VLOC employs various methods for calibrating these valuation approaches including a regular review of key inputs and assumptions, transactional back-testing or disposition analysis, and reviews of any related market activity.
Trading in securities on foreign securities stock exchanges and OTC markets may be completed before the daily NYSE close. In addition, trading in certain foreign markets may not take place on every NYSE business day. Occasionally, events occur between the time at which trading in a foreign security is completed and the close of the NYSE that might call into question the reliability of the value of a portfolio security held by the Fund. As a result, differences may arise between the value of the Fund’s portfolio securities as determined at the foreign market close and the latest indications of value at the close of the NYSE. In order to minimize the potential for these differences, the VLOC monitors price movements following the close of trading in foreign stock markets through a series of country specific market proxies (such as baskets of American Depositary Receipts, futures contracts and exchange traded funds). These price movements are measured against established trigger thresholds for each specific market proxy to assist in determining if an event has occurred that may call into question the reliability of the values of the foreign securities held by the Fund. If such an event occurs, the securities may be valued using fair value procedures, which may include the use of independent pricing services.
When the last day of the reporting period is a non-business day, certain foreign markets may be open on those days that the NYSE is closed, which could result in differences between the value of the Fund’s portfolio securities on the last business day and the last calendar day of the reporting period. Any significant security valuation changes due to an open foreign market are adjusted and reflected by the Fund for financial reporting purposes.
b. Foreign Currency Translation
Portfolio securities and other assets and liabilities denominated in foreign currencies are translated into U.S. dollars based on the exchange rate of such currencies against U.S. dollars on the
date of valuation. The Fund may enter into foreign currency exchange contracts to facilitate transactions denominated in a foreign currency. Purchases and sales of securities, income and expense items denominated in foreign currencies are translated into U.S. dollars at the exchange rate in effect on the transaction date. Portfolio securities and assets and liabilities denominated in foreign currencies contain risks that those currencies will decline in value relative to the U.S. dollar. Occasionally, events may impact the availability or reliability of foreign exchange rates used to convert the U.S. dollar equivalent value. If such an event occurs, the foreign exchange rate will be valued at fair value using procedures established and approved by the Board.
The Fund does not separately report the effect of changes in foreign exchange rates from changes in market prices on securities held. Such changes are included in net realized and unrealized gain or loss from investments in the Statement of Operations.
Realized foreign exchange gains or losses arise from sales of foreign currencies, currency gains or losses realized between the trade and settlement dates on securities transactions and the difference between the recorded amounts of dividends, interest, and foreign withholding taxes and the U.S. dollar equivalent of the amounts actually received or paid. Net unrealized foreign exchange gains and losses arise from changes in foreign exchange rates on foreign denominated assets and liabilities other than investments in securities held at the end of the reporting period.
c. Joint Repurchase Agreement
The Fund enters into a joint repurchase agreement whereby its uninvested cash balance is deposited into a joint cash account with other funds managed by the investment manager or an affiliate of the investment manager and is used to invest in one or more repurchase agreements. The value and face amount of the joint repurchase agreement are allocated to the funds based on their pro-rata interest. A repurchase agreement is accounted for as a loan by the Fund to the seller, collateralized by securities which are delivered to the Fund’s custodian. The fair value, including accrued interest, of the initial collateralization is required to be at least 102% of the dollar amount invested by the funds, with the value of the underlying securities marked to market daily to maintain coverage of at least 100%. Repurchase agreements are subject to the terms of Master Repurchase Agreements (MRAs) with approved counterparties (sellers). The MRAs contain various provisions, including but not limited to
| FH-22 | Semiannual Report |
FRANKLIN TEMPLETON VARIABLE INSURANCE PRODUCTS TRUST
NOTES TO FINANCIAL STATEMENTS (UNAUDITED)
Franklin High Income VIP Fund (continued)
events of default and maintenance of collateral for repurchase agreements. In the event of default by either the seller or the Fund, certain MRAs may permit the non-defaulting party to net and close-out all transactions, if any, traded under such agreements. The Fund may sell securities it holds as collateral and apply the proceeds towards the repurchase price and any other amounts owed by the seller to the Fund in the event of default by the seller. This could involve costs or delays in addition to a loss on the securities if their value falls below the repurchase price owed by the seller. The joint repurchase agreement held by the Fund at period end, as indicated in the Statement of Investments, had been entered into on June 30, 2015.
d. Securities Purchased on a When-Issued Basis
The Fund purchases securities on a when-issued basis, with payment and delivery scheduled for a future date. These transactions are subject to market fluctuations and are subject to the risk that the value at delivery may be more or less than the trade date purchase price. Although the Fund will generally purchase these securities with the intention of holding the securities, it may sell the securities before the settlement date. Sufficient assets have been segregated for these securities.
e. Senior Floating Rate Interests
The Fund invests in senior secured corporate loans that pay interest at rates which are periodically reset by reference to a base lending rate plus a spread. These base lending rates are generally the prime rate offered by a designated U.S. bank or the London InterBank Offered Rate (LIBOR). Senior secured corporate loans often require prepayment of principal from excess cash flows or at the discretion of the borrower. As a result, actual maturity may be substantially less than the stated maturity. Senior secured corporate loans in which the Fund invests are generally readily marketable, but may be subject to certain restrictions on resale.
f. Income and Deferred Taxes
It is the Fund’s policy to qualify as a regulated investment company under the Internal Revenue Code. The Fund intends to distribute to shareholders substantially all of its taxable income and net realized gains to relieve it from federal income and if applicable, excise taxes. As a result, no provision for U.S. federal income taxes is required.
The Fund may be subject to foreign taxation related to income received, capital gains on the sale of securities and certain
foreign currency transactions in the foreign jurisdictions in which it invests. Foreign taxes, if any, are recorded based on the tax regulations and rates that exist in the foreign markets in which the Fund invests. When a capital gain tax is determined to apply, the Fund records an estimated deferred tax liability in an amount that would be payable if the securities were disposed of on the valuation date
The Fund recognizes the tax benefits of uncertain tax positions only when the position is “more likely than not” to be sustained upon examination by the tax authorities based on the technical merits of the tax position. As of June 30, 2015, and for all open tax years, the Fund has determined that no liability for unrecognized tax benefits is required in the Fund’s financial statements related to uncertain tax positions taken on a tax return (or expected to be taken on future tax returns). Open tax years are those that remain subject to examination and are based on each tax jurisdiction’s statute of limitation.
g. Security Transactions, Investment Income, Expenses and Distributions
Security transactions are accounted for on trade date. Realized gains and losses on security transactions are determined on a specific identification basis. Interest income and estimated expenses are accrued daily. Amortization of premium and accretion of discount on debt securities are included in interest income. Facility fees are recognized as income over the expected term of the loan. Distributions to shareholders are recorded on the ex-dividend date and are determined according to income tax regulations (tax basis). Distributable earnings determined on a tax basis may differ from earnings recorded in accordance with U.S. GAAP. These differences may be permanent or temporary. Permanent differences are reclassified among capital accounts to reflect their tax character. These reclassifications have no impact on net assets or the results of operations. Temporary differences are not reclassified, as they may reverse in subsequent periods.
Common expenses incurred by the Trust are allocated among the funds based on the ratio of net assets of each fund to the combined net assets of the Trust. Fund specific expenses are charged directly to the fund that incurred the expense.
Realized and unrealized gains and losses and net investment income, not including class specific expenses, are allocated daily to each class of shares based upon the relative proportion
| Semiannual Report | FH-23 |
FRANKLIN TEMPLETON VARIABLE INSURANCE PRODUCTS TRUST
NOTES TO FINANCIAL STATEMENTS (UNAUDITED)
Franklin High Income VIP Fund (continued)
1. Organization and Significant Accounting Policies (continued)
g. Security Transactions, Investment Income, Expenses and Distributions (continued)
of net assets of each class. Differences in per share distributions, by class, are generally due to differences in class specific expenses.
h. Accounting Estimates
The preparation of financial statements in accordance with U.S. GAAP requires management to make estimates and assumptions that affect the reported amounts of assets and liabilities at the date of the financial statements and the amounts of income and expenses during the reporting period. Actual results could differ from those estimates.
i. Guarantees and Indemnifications
Under the Trust’s organizational documents, its officers and trustees are indemnified by the Trust against certain liabilities arising out of the performance of their duties to the Trust. Additionally, in the normal course of business, the Trust, on behalf of the Fund, enters into contracts with service providers that contain general indemnification clauses. The Trust’s maximum exposure under these arrangements is unknown as this would involve future claims that may be made against the Trust that have not yet occurred. Currently, the Trust expects the risk of loss to be remote.
2. Shares of Beneficial Interest
At June 30, 2015, there were an unlimited number of shares authorized (without par value). Transactions in the Fund’s shares were as follows:
| Six Months Ended June 30, 2015 | Year Ended December 31, 2014 | |||||||||||||||||
| Shares | Amount | Shares | Amount | |||||||||||||||
| Class 1 Shares: | ||||||||||||||||||
Shares sold | 48,657 | $ | 329,274 | 120,684 | $ | 836,723 | ||||||||||||
Shares issued in reinvestment of distributions | 345,109 | 2,177,640 | 329,854 | 2,292,485 | ||||||||||||||
Shares redeemed | (464,818 | ) | (3,124,730 | ) | (832,231 | ) | (5,825,450 | ) | ||||||||||
|
| |||||||||||||||||
Net increase (decrease) | (71,052 | ) | $ | (617,816 | ) | (381,693 | ) | $ | (2,696,242 | ) | ||||||||
|
| |||||||||||||||||
| Class 2 Shares: | ||||||||||||||||||
Shares sold | 4,672,453 | $ | 30,532,189 | 13,791,290 | $ | 93,795,388 | ||||||||||||
Shares issued in reinvestment of distributions | 2,818,239 | 17,219,440 | 2,754,907 | 18,595,621 | ||||||||||||||
Shares redeemed | (7,548,880 | ) | (48,366,053 | ) | (18,545,301 | ) | (125,318,795 | ) | ||||||||||
|
| |||||||||||||||||
Net increase (decrease) | (58,188 | ) | $ | (614,424 | ) | (1,999,104 | ) | $ | (12,927,786 | ) | ||||||||
|
| |||||||||||||||||
| Class 4 Shares: | ||||||||||||||||||
Shares sold | 70,940 | $ | 470,373 | 276,687 | $ | 1,933,896 | ||||||||||||
Shares issued in reinvestment of distributions | 256,800 | 1,604,998 | 234,247 | 1,613,962 | ||||||||||||||
Shares redeemed | (230,491 | ) | (1,529,446 | ) | (581,606 | ) | (4,023,718 | ) | ||||||||||
|
| |||||||||||||||||
Net increase (decrease) | 97,249 | $ | 545,925 | (70,672 | ) | $ | (475,860 | ) | ||||||||||
|
| |||||||||||||||||
| FH-24 | Semiannual Report |
FRANKLIN TEMPLETON VARIABLE INSURANCE PRODUCTS TRUST
NOTES TO FINANCIAL STATEMENTS (UNAUDITED)
Franklin High Income VIP Fund (continued)
3. Transactions With Affiliates
Franklin Resources, Inc. is the holding company for various subsidiaries that together are referred to as Franklin Templeton Investments. Certain officers and trustees of the Fund are also officers and/or directors of the following subsidiaries:
| Subsidiary | Affiliation | |
Franklin Advisers, Inc. (Advisers) | Investment manager | |
Franklin Templeton Services, LLC (FT Services) | Administrative manager | |
Franklin Templeton Distributors, Inc. (Distributors) | Principal underwriter | |
Franklin Templeton Investor Services, LLC (Investor Services) | Transfer agent |
a. Management Fees
The Fund pays an investment management fee to Advisers based on the average daily net assets of the Fund as follows:
| Annualized Fee Rate | Net Assets | |
0.625% | Up to and including $100 million | |
0.500% | Over $100 million, up to and including $250 million | |
0.450% | Over $250 million, up to and including $7.5 billion | |
0.440% | Over $7.5 billion, up to and including $10 billion | |
0.430% | Over $10 billion, up to and including $12.5 billion | |
0.420% | Over $12.5 billion, up to and including $15 billion | |
0.400% | In excess of $15 billion |
b. Administrative Fees
Under an agreement with Advisers, FT Services provides administrative services to the Fund. The fee is paid by Advisers based on the Fund’s average daily net assets, and is not an additional expense of the Fund.
c. Distribution Fees
The Board has adopted distribution plans for Class 2 and Class 4 shares pursuant to Rule 12b-1 under the 1940 Act. Under the Fund’s compensation distribution plans, the Fund pays Distributors for costs incurred in connection with the servicing, sale and distribution of the Fund’s shares up to 0.35% per year of its average daily net assets of each class. Some distribution fees are not charged on shares held by affiliates. The Board has agreed to limit the current rate to 0.25% per year for Class 2. The plan year, for purposes of monitoring compliance with the maximum annual plan rates, is February 1 through January 31.
d. Transfer Agent Fees
Investor Services, under terms of an agreement, performs shareholder servicing for the Fund and is not paid by the Fund for the services.
4. Expense Offset Arrangement
The Fund has entered into an arrangement with its custodian whereby credits realized as a result of uninvested cash balances are used to reduce a portion of the Fund’s custodian expenses. During the period ended June 30, 2015, there were no credits earned.
| Semiannual Report | FH-25 |
FRANKLIN TEMPLETON VARIABLE INSURANCE PRODUCTS TRUST
NOTES TO FINANCIAL STATEMENTS (UNAUDITED)
Franklin High Income VIP Fund (continued)
5. Income Taxes
For tax purposes, capital losses may be carried over to offset future capital gains. Capital loss carryforwards with no expiration, if any, must be fully utilized before those losses with expiration dates.
At December 31, 2014, capital loss carryforwards were as follows:
| Capital loss carryforwards subject to expiration: | ||||
2016 | $ | 5,101,475 | ||
2017 | 10,621,353 | |||
|
| |||
Total capital loss carryforwards | $ | 15,722,828 | ||
|
|
At June 30, 2015, the cost of investments and net unrealized appreciation (depreciation) for income tax purposes were as follows:
Cost of investments | $ | 314,881,126 | ||
|
| |||
Unrealized appreciation | $ | 5,389,678 | ||
Unrealized depreciation | (22,184,700 | ) | ||
|
| |||
Net unrealized appreciation (depreciation) | $ | (16,795,022 | ) | |
|
|
Differences between income and/or capital gains as determined on a book basis and a tax basis are primarily due to differing treatments of defaulted securities and bond discounts and premiums.
6. Investment Transactions
Purchases and sales of investments (excluding short term securities) for the period ended June 30, 2015, aggregated $57,297,117 and $59,147,628, respectively.
7. Credit Risk and Defaulted Securities
At June 30, 2015, the Fund had 97.33% of its portfolio invested in high yield, senior secured floating rate notes, or other securities rated below investment grade. These securities may be more sensitive to economic conditions causing greater price volatility and are potentially subject to a greater risk of loss due to default than higher rated securities.
The Fund held defaulted securities and/or other securities for which the income has been deemed uncollectible. At June 30, 2015, the aggregate value of these securities was $3,487,526, representing 1.14% of the Fund’s net assets. The Fund discontinues accruing income on securities for which income has been deemed uncollectible and provides an estimate for losses on interest receivable. The securities have been identified in the accompanying Statement of Investments.
8. Credit Facility
The Fund, together with other U.S. registered and foreign investment funds (collectively, Borrowers), managed by Franklin Templeton Investments, are borrowers in a joint syndicated senior unsecured credit facility totaling $2 billion (Global Credit Facility) which matures on February 12, 2016. This Global Credit Facility provides a source of funds to the Borrowers for temporary and emergency purposes, including the ability to meet future unanticipated or unusually large redemption requests.
Under the terms of the Global Credit Facility, the Fund shall, in addition to interest charged on any borrowings made by the Fund and other costs incurred by the Fund, pay its share of fees and expenses incurred in connection with the implementation and maintenance of the Global Credit Facility, based upon its relative share of the aggregate net assets of all of the Borrowers, including an annual commitment fee of 0.07% based upon the unused portion of the Global Credit Facility. These fees are reflected in other expenses in the Statement of Operations. During the period ended June 30, 2015, the Fund did not use the Global Credit Facility.
| FH-26 | Semiannual Report |
FRANKLIN TEMPLETON VARIABLE INSURANCE PRODUCTS TRUST
NOTES TO FINANCIAL STATEMENTS (UNAUDITED)
Franklin High Income VIP Fund (continued)
9. Fair Value Measurements
The Fund follows a fair value hierarchy that distinguishes between market data obtained from independent sources (observable inputs) and the Fund’s own market assumptions (unobservable inputs). These inputs are used in determining the value of the Fund’s financial instruments and are summarized in the following fair value hierarchy:
| • | Level 1 – quoted prices in active markets for identical financial instruments |
| • | Level 2 – other significant observable inputs (including quoted prices for similar financial instruments, interest rates, prepayment speed, credit risk, etc.) |
| • | Level 3 – significant unobservable inputs (including the Fund’s own assumptions in determining the fair value of financial instruments) |
The input levels are not necessarily an indication of the risk or liquidity associated with financial instruments at that level.
For movements between the levels within the fair value hierarchy, the Fund has adopted a policy of recognizing the transfers as of the date of the underlying event which caused the movement.
A summary of inputs used as of June 30, 2015, in valuing the Fund’s assets carried at fair value, is as follows:
| Level 1 | Level 2 | Level 3 | Total | |||||||||||||
| Assets: | ||||||||||||||||
Investments in Securities: | ||||||||||||||||
Equity Investments:a | ||||||||||||||||
Transportation | $ | — | $ | 531,244 | $ | — | $ | 531,244 | ||||||||
All Other Equity Investmentsb | 6,225 | — | — | 6,225 | ||||||||||||
Corporate Bonds | — | 291,808,672 | 164,776 | 291,973,448 | ||||||||||||
Senior Floating Rate Interests | — | 2,265,529 | — | 2,265,529 | ||||||||||||
Escrows and Litigation Trusts | — | — | — | c | — | |||||||||||
Short Term Investments | — | 3,309,658 | — | 3,309,658 | ||||||||||||
|
| |||||||||||||||
Total Investments in Securities | $ | 6,225 | $ | 297,915,103 | $ | 164,776 | $ | 298,086,104 | ||||||||
|
| |||||||||||||||
aIncludes common and convertible preferred stocks.
bFor detailed categories, see the accompanying Statement of Investments.
cIncludes securities determined to have no value at June 30, 2015.
A reconciliation of assets in which Level 3 inputs are used in determining fair value is presented when there are significant Level 3 financial instruments at the end of the period.
10. New Accounting Pronouncements
In June 2014, the Financial Accounting Standards Board issued Accounting Standards Update (ASU) No. 2014-11, Transfers and Servicing (Topic 860), Repurchase-to-Maturity Transactions, Repurchase Financings, and Disclosures. The ASU changes the accounting for certain repurchase agreements and expands disclosure requirements related to repurchase agreements, securities lending, repurchase-to-maturity and similar transactions. The ASU is effective for certain transactions accounted for as a sale for interim and annual reporting periods beginning after December 15, 2014, and transactions accounted for as secured borrowings for annual periods beginning after December 15, 2014, and for interim periods beginning after March 15, 2015. Management has reviewed the requirements and believes the adoption of this ASU will not have a material impact on the financial statements.
| Semiannual Report | FH-27 |
FRANKLIN TEMPLETON VARIABLE INSURANCE PRODUCTS TRUST
NOTES TO FINANCIAL STATEMENTS
Franklin High Income VIP Fund (continued)
11. Subsequent Events
The Fund has evaluated subsequent events through the issuance of the financial statements and determined that no events have occurred that require disclosure.
Abbreviations
| Selected Portfolio | ||
| FRN | Floating Rate Note | |
| FH-28 | Semiannual Report |
Franklin Income VIP Fund
This semiannual report for Franklin Income VIP Fund covers the period ended June 30, 2015.
Class 1 Performance Summary as of June 30, 2015
The Fund’s Class 1 shares had a -0.98% total return* for the six-month period ended June 30, 2015.
*The Fund has a fee waiver associated with any investment in a Franklin Templeton money fund, contractually guaranteed through at least its current fiscal year-end. Fund investment results reflect the fee waiver, to the extent applicable; without this reduction, the results would have been lower.
Performance reflects the Fund’s Class 1 operating expenses, but does not include any contract fees, expenses or sales charges. If they had been included, performance would be lower. These charges and deductions, particularly for variable life policies, can have a significant effect on contract values and insurance benefits. See the contract prospectus for a complete description of these expenses, including sales charges.
Performance data represent past performance, which does not guarantee future results. Investment return and principal value will fluctuate, and you may have a gain or loss when you sell your shares. Current performance may differ from figures shown.
| Semiannual Report | FI-1 |
FRANKLIN INCOME VIP FUND
Fund Goal and Main Investments
Franklin Income VIP Fund seeks to maximize income while maintaining prospects for capital appreciation. Under normal market conditions, the Fund invests in both equity and debt securities.
Fund Risks
All investments involve risks, including possible loss of principal. Stock prices fluctuate, sometimes rapidly and dramatically, due to factors affecting individual companies, particular industries or sectors, or general market conditions. The Fund’s share price and yield will be affected by interest rate movements. Bond prices generally move in the opposite direction of interest rates. Thus, as prices of bonds in the Fund adjust to a rise in interest rates, the Fund’s share price may decline. Changes in the financial strength of a bond issuer or in a bond’s credit rating may affect its value. The Fund’s portfolio includes a substantial portion of higher yielding, lower rated corporate bonds because of the relatively higher yields they offer. Floating rate loans are lower rated, higher yielding instruments, which are subject to increased risk of default and can potentially result in loss of principal. These securities carry a greater degree of credit risk relative to investment-grade securities. The Fund is actively managed but there is no guarantee that the manager’s investment decisions will produce the desired results. The Fund’s prospectus also includes a description of the main investment risks.
Performance Overview
You can find the Fund’s six-month total return in the Performance Summary. For comparison, the Fund’s equity benchmark, the Standard & Poor’s® (S&P 500®) 500 Index, produced a +1.23% total return, and its fixed income benchmark, the Barclays U.S. Aggregate Bond Index, had a -0.10% total return for the same period.1
Economic and Market Overview
U.S. economic growth was mixed during the six months under review. In 2015’s first quarter, U.S. dollar strength, low energy prices, and a labor dispute at West Coast ports led exports to decline. Lower business investment and state and local government spending also weighed on the economy, while increases in consumer spending, residential investment and private inventory investment offered some support. In the
second quarter, business capital spending rebounded and manufacturing and non-manufacturing activities increased, contributing to strong job gains that helped the unemployment rate decline from 5.6% in December 2014 to 5.3% in June 2015.2 Housing market data were generally encouraging as home sales and prices rose. After a brief, winter slump, retail sales rebounded in the spring as strong employment gains led to broad-based improvement, especially for auto and gasoline sales. Inflation, as measured by the Consumer Price Index, rose during the six months amid generally higher energy prices bouncing from recent lows.
During the six-month period, the Federal Reserve Board (Fed) kept its target interest rate at 0%–0.25% while considering when an increase would be appropriate. The Fed anticipated raising its target rate when it saw further labor market progress and was reasonably confident that inflation would move back to 2% over the medium term. In its June meeting, the Fed lowered its 2015 economic growth forecast and raised unemployment estimates given the weak start to the year.
Investor confidence grew during the period as corporate profits remained healthy, the Fed showed caution about raising interest rates, economic data in Europe and Japan improved and China introduced more stimulus measures. However, the stock markets endured some sell-offs when many investors reacted to debt negotiations between Greece and its creditors, geopolitical tensions in certain regions, and less robust growth in China. For the six months under review, U.S. stocks, as measured by S&P 500 and the Dow Jones Industrial Average, rose marginally after both reached all-time highs in May.3
The 10-year Treasury yield, which moves inversely to price, declined from 2.17% at the start of the period to a six-month low of 1.68% in early February as investors sought less risky assets given concerns about soft domestic data, Greece’s debt negotiations, less robust growth in China and the Fed’s cautious tone on raising interest rates. At period-end, the yield rose to 2.35% based partly on upbeat domestic and eurozone economic data and expectations of an agreement between Greece and its international creditors.
Investment Strategy
We search for undervalued or out-of-favor securities we believe offer opportunities for income today and growth tomorrow. We
1. Source: Morningstar.
One cannot invest directly in an index, and an index is not representative of the Fund’s portfolio. Please see Index Descriptions following the Fund Summaries.
2. Source: Bureau of Labor Statistics.
3. Please see Index Description following the Fund Summaries.
| FI-2 | Semiannual Report |
FRANKLIN INCOME VIP FUND
generally perform independent analysis of the debt securities being considered for the Fund’s portfolio, rather than relying principally on ratings assigned by rating agencies. In analyzing debt and equity securities, we consider a variety of factors, including: a security’s relative value based on such factors as anticipated cash flow, interest or dividend coverage, asset coverage, and earnings prospects; the experience and strength of a company’s management; a company’s sensitivity to changes in interest rates and business conditions; a company’s debt maturity schedules and borrowing requirements; and a company’s changing financial condition and market recognition of the change.
Manager’s Discussion
During the six months under review, we continued to strategically shift the Fund’s asset mix seeking to manage risks, and our equity and fixed income holdings declined. The Fund’s equity weighting fell to 56.5% from 57.4% of total net assets, and the Fund’s fixed income weighting fell to 33.3% from 34.5%. Our cash position rose during the period to 10.2% from 8.1% of total net assets.
The Fund’s equity portion had a slight negative return compared with the overall market’s slight positive return for the period. Equity gains largely came from continued strength in the health care sector and advances in financials and materials, while the utilities, energy and information technology sectors pressured Fund results. We continued to see what we considered strength in the operations of many U.S. and multinational companies and believed the strong cash flow generation and capital allocation strategies many employed could, in our opinion, support the payment of attractive dividends.
In equities, the health care sector delivered strong absolute returns across Fund holdings. Several large pharmaceutical companies including Pfizer, Eli Lilly & Co. and Sanofi generated impressive gains as they benefited from better-than-expected operating results amid a positive outlook for new drug development. Our analysis led us to maintain a positive outlook for the sector despite its strong absolute returns in recent years.
Although the Fund’s result in financials stocks was largely positive, individual positions we held had divergent performances during the period. Investor speculation about the possibility and timing of potential interest rate hikes contributed to sector volatility. Gains in capital markets activities helped JPMorgan Chase & Co., and Wells Fargo & Co. continue to benefit from a diverse business and an improving credit profile. In contrast, Bank of America was negatively affected by additional profit margin pressure and less robust trading results.
| Portfolio Breakdown | ||||
| 6/30/15 | ||||
| % of Total Net Assets | ||||
| Equity* | 56.5% | |||
| Utilities | 11.2% | |||
| Energy | 9.1% | |||
| Materials | 8.3% | |||
| Health Care | 5.3% | |||
| Industrials | 5.0% | |||
| Information Technology | 4.9% | |||
| Financials | 4.9% | |||
| Consumer Discretionary | 4.5% | |||
| Telecommunication Services | 2.2% | |||
| Consumer Staples | 1.1% | |||
| Fixed Income | 33.3% | |||
| Energy | 6.8% | |||
| Consumer Discretionary | 6.3% | |||
| Information Technology | 4.4% | |||
| Telecommunication Services | 3.8% | |||
| Financials | 3.1% | |||
| Health Care | 2.5% | |||
| Materials | 2.2% | |||
| Other | 4.2% | |||
| Short-Term Investments & Other Net Assets | 10.2% | |||
*Includes convertible bonds.
The equity materials sector generated modest gains. Chemical conglomerates The Dow Chemical Co. and LyondellBasell Industries produced strong absolute returns, as did agricultural chemical producer Agrium. Performance was negatively affected, however, by several base metal companies including Freeport-McMoRan and E. I. du Pont de Nemours and Co. They gave disappointing guidance resulting from weaker-than-expected pricing and volumes as well as unfavorable foreign currency exchange rates.
Stocks in the utilities sector were major detractors during the period, as nearly all positions fell in value. Exelon, Duke Energy, The Southern Co., Entergy4 and Dominion Resources were among the Fund’s worst detractors. Utilities fell out of favor with investors during the period as the likelihood of future interest rate increases rose and the market viewed sector valuations as elevated early in the period. The Fund’s weighting in utilities was below historical levels, but we continued to find
4. Sold by period-end.
| Semiannual Report | FI-3 |
FRANKLIN INCOME VIP FUND
| Top Five Equity Holdings | ||||
| 6/30/15 | ||||
| Company Sector/Industry | % of Total Net Assets | |||
| The Dow Chemical Co. Materials | 1.9% | |||
| Royal Dutch Shell PLC, A, ADR (U.K.) Energy | 1.7% | |||
| Pfizer Inc. Health Care | 1.6% | |||
| General Electric Co. Industrials | 1.5% | |||
| Target Corp. Consumer Discretionary | 1.4% | |||
The dollar value, number of shares or principal amount, and names of all portfolio holdings are listed in the Fund’s Statement of Investments (SOI).
opportunities across the sector, particularly among non-regulated, higher growth companies.
The Fund’s negative performance in energy stocks was largely driven by uncertainty and volatility in crude oil prices. Most of the Fund’s energy exposure remained in large, global energy conglomerates that we felt had solid balance sheets and could pay attractive dividends. Although we believe they are able to lower costs and production goals to better navigate oil market gyrations, companies such as Royal Dutch Shell and Chevron were not immune to the energy price decline, and their share prices fell. Many investors continued to fear that some independent producers, such as SandRidge Energy5 and Halcon Resources, would need to restructure their balance sheets or seek to sell assets in the recent environment, and that sentiment significantly pressured their share prices. In contrast, BP was a notable contributor to Fund performance as the company continued to focus on cash generation and lowering costs in advance of the completion of its Gulf of Mexico legal settlement.
Treasury yields rose significantly during the period after initially dropping during the beginning of the calendar year. The rise in rates was spurred by improvement in many economic indicators and investor concerns about future Fed interest rate hikes. The Fed has not raised rates since 2006.
Rising rates led to a slightly negative return for investment-grade fixed income securities. Below-investment-grade bonds outperformed the fixed income index as yields fell slightly
during the period. High yield corporate bonds remained relatively attractive to many investors in comparison to investment-grade bonds as their yield advantage helped offset concerns over potential rate advances. This low-return environment tended to favor the below-investment-grade corporate debt that is prevalent in the Fund’s fixed income portfolio.
In fixed income, the consumer non-cyclical sector was a major contributor, including our positions in HCA, JBS USA and Valeant Pharmaceuticals International.6 Capital goods also delivered positive returns, and our bond positions in Abengoa, Cemex and Reynolds Group notably helped results.7 The fixed income technology sector also produced solid returns, particularly our investments in First Data, Freescale Semiconductor and NCR.
In contrast, fixed income returns were negatively affected by our positions in the coal industry within the basic industry8 sector, which included Walter Energy,4 Peabody Energy and Arch Coal. Depressed coal prices and weak volumes pressured industry cash flows, which resulted in weak performance for these securities. Although the Fund’s fixed income energy sector holdings as a group had a negative return, performance varied widely. Investors rewarded companies that they viewed as capable of navigating the sector downturn but sold off others they perceived to have a higher risk of restructuring. SandRidge Energy, Energy XXI Gulf Coast and Quicksilver Resources4
| Top Five Fixed Income and Senior Floating Rate Interests Holdings* | ||||
| 6/30/15 | ||||
| Issuer Sector/Industry | % of Total Net Assets | |||
| First Data Corp. Information Technology | 3.0% | |||
| iHeartCommunications Inc. Consumer Discretionary | 1.8% | |||
| JPMorgan Chase & Co. Financials | 1.2% | |||
| Sprint Communications Inc. Telecommunication Services | 1.2% | |||
| Citigroup Inc. Financials | 1.0% | |||
*Does not include convertible bonds.
The dollar value, number of shares or principal amount, and names of all portfolio holdings are listed in the Fund’s SOI.
5. Stock position sold by period-end.
6. Consumer non-cyclical holdings are in consumer discretionary, consumer staples, health care and information technology in the fixed income section of the SOI.
7. Capital goods holdings are in consumer discretionary, industrials, information technology and materials in the fixed income section of the SOI.
8. Basic industry holdings are in energy and materials in the fixed income section of the SOI.
| FI-4 | Semiannual Report |
FRANKLIN INCOME VIP FUND
were major detractors during the period. We actively repositioned the Fund’s energy sector holdings to seek what we considered the best risk-adjusted returns from a sector that experienced significant change. Many energy companies altered their capital structures, looking to sell assets or potentially participate in a merger or acquisition.
The Fund’s fixed income communications9 holdings also had a negative total return largely due to weak performance from Dex Media,4 Frontier Communications and Intelsat Jackson Holdings.
Thank you for your participation in Franklin Income VIP Fund. We look forward to serving your future investment needs.
The foregoing information reflects our analysis, opinions and portfolio holdings as of June 30, 2015, the end of the reporting period. The way we implement our main investment strategies and the resulting portfolio holdings may change depending on factors such as market and economic conditions. These opinions may not be relied upon as investment advice or an offer for a particular security. The information is not a complete analysis of every aspect of any market, country, industry, security or the Fund. Statements of fact are from sources considered reliable, but the investment manager makes no representation or warranty as to their completeness or accuracy. Although historical performance is no guarantee of future results, these insights may help you understand our investment management philosophy.
9. Communications companies are in consumer discretionary and telecommunication services in the fixed income section of the SOI.
| Semiannual Report | FI-5 |
FRANKLIN INCOME VIP FUND
Class 1 Fund Expenses
As an investor in a variable insurance contract (Contract) that indirectly provides for investment in an underlying mutual fund, you can incur transaction and/or ongoing expenses at both the Fund level and the Contract level.
| • | Transaction expenses can include sales charges (loads) on purchases, surrender fees, transfer fees and premium taxes. |
| • | Ongoing expenses can include management fees, distribution and service (12b-1) fees, contract fees, annual maintenance fees, mortality and expense risk fees and other fees and expenses. All mutual funds and Contracts have some types of ongoing expenses. |
The expenses shown in the table are meant to highlight ongoing expenses at the Fund level only and do not include ongoing expenses at the Contract level, or transaction expenses at either the Fund or Contract levels. While the Fund does not have transaction expenses, if the transaction and ongoing expenses at the Contract level were included, the expenses shown below would be higher. You should consult your Contract prospectus or disclosure document for more information.
The table shows Fund-level ongoing expenses and can help you understand these expenses and compare them with those of other mutual funds offered through the Contract. The table assumes a $1,000 investment held for the six months indicated. Please refer to the Fund prospectus for additional information on operating expenses.
Actual Fund Expenses
The first line (Actual) of the table provides actual account values and expenses. The “Ending Account Value” is derived from the Fund’s actual return, which includes the effect of ongoing Fund expenses, but does not include the effect of ongoing Contract expenses.
You can estimate the Fund-level expenses you incurred during the period by following these steps. Of course, your account value and expenses will differ from those in this illustration:
| 1. | Divide your account value by $1,000. |
If an account had an $8,600 value,
then $8,600 ÷ $1,000 = 8.6.
| 2. | Multiply the result by the number under the heading “Fund-Level Expenses Incurred During Period.” |
If Fund-Level Expenses Incurred During Period were $7.50, then 8.6 × $7.50 = $64.50.
In this illustration, the estimated expenses incurred this period at the Fund level are $64.50.
Hypothetical Example for Comparison with Other Mutual Funds
Information in the second line (Hypothetical) of the table can help you compare ongoing expenses of the Fund with those of other mutual funds offered through the Contract. This information may not be used to estimate the actual ending account balance or expenses you incurred during the period. The hypothetical “Ending Account Value” is based on the Fund’s actual expense ratio and an assumed 5% annual rate of return before expenses, which does not represent the Fund’s actual return. The figure under the heading “Fund-Level Expenses Incurred During Period” shows the hypothetical expenses your account would have incurred under this scenario. You can compare this figure with the 5% hypothetical examples that appear in shareholder reports of other funds offered through a Contract.
| Class 1 | Beginning Account Value 1/1/15 | Ending Account Value 6/30/15 | Fund-Level Expenses Incurred During Period* 1/1/15–6/30/15 | |||||||||
Actual | $1,000 | $ 990.20 | $2.32 | |||||||||
Hypothetical (5% return before expenses) | $1,000 | $1,022.46 | $2.36 | |||||||||
*Expenses are calculated using the most recent six-month annualized expense ratio, net of expense waivers, for the Fund’s Class 1 shares (0.47%), which does not include any ongoing expenses of the Contract for which the Fund is an investment option, multiplied by the average account value over the period, multiplied by 181/365 to reflect the one-half year period.
| FI-6 | Semiannual Report |
FRANKLIN TEMPLETON VARIABLE INSURANCE PRODUCTS TRUST
Financial Highlights
Franklin Income VIP Fund
Six Months Ended (unaudited) | Year Ended December 31, | |||||||||||||||||||||||
| 2014 | 2013 | 2012 | 2011 | 2010 | ||||||||||||||||||||
| Class 1 | ||||||||||||||||||||||||
Per share operating performance (for a share outstanding throughout the period) | ||||||||||||||||||||||||
Net asset value, beginning of period | $16.48 | $16.53 | $15.47 | $14.68 | $15.16 | $14.43 | ||||||||||||||||||
|
| |||||||||||||||||||||||
| Income from investment operationsa: | ||||||||||||||||||||||||
Net investment incomeb | 0.37 | 0.72 | 0.81 | 0.91 | 0.96 | 0.89 | ||||||||||||||||||
Net realized and unrealized gains (losses) | (0.52 | ) | 0.11 | 1.31 | 0.90 | (0.54 | ) | 0.85 | ||||||||||||||||
|
| |||||||||||||||||||||||
Total from investment operations | (0.15 | ) | 0.83 | 2.12 | 1.81 | 0.42 | 1.74 | |||||||||||||||||
|
| |||||||||||||||||||||||
Less distributions from net investment income | (0.77 | ) | (0.88 | ) | (1.06 | ) | (1.02 | ) | (0.90 | ) | (1.01 | ) | ||||||||||||
|
| |||||||||||||||||||||||
Net asset value, end of period | $15.56 | $16.48 | $16.53 | $15.47 | $14.68 | $15.16 | ||||||||||||||||||
|
| |||||||||||||||||||||||
Total returnc | (0.98)% | 4.92% | 14.18% | 12.91% | 2.71% | 12.87% | ||||||||||||||||||
| Ratios to average net assetsd | ||||||||||||||||||||||||
Expenses | 0.47% | e,f | 0.47%e | 0.47% | e | 0.47% | 0.47%e | 0.47%e | ||||||||||||||||
Net investment income | 4.52% | 4.26% | 5.07% | 6.03% | 6.35% | 6.28% | ||||||||||||||||||
| Supplemental data | ||||||||||||||||||||||||
Net assets, end of period (000’s) | $680,656 | $714,664 | $695,004 | $584,391 | $1,300,935 | $1,449,028 | ||||||||||||||||||
Portfolio turnover rate | 11.39% | 24.77% | 21.71% | 26.66% | g | 28.65% | 41.65% | |||||||||||||||||
aThe amount shown for a share outstanding throughout the period may not correlate with the Statement of Operations for the period due to the timing of sales and repurchases of the Fund’s shares in relation to income earned and/or fluctuating fair value of the investments of the Fund.
bBased on average daily shares outstanding.
cTotal return does not include fees, charges or expenses imposed by the variable annuity and life insurance contracts for which Franklin Templeton Variable Insurance Products Trust serves as an underlying investment vehicle. Total return is not annualized for periods less than one year.
dRatios are annualized for periods less than one year.
eBenefit of expense reduction rounds to less than 0.01%.
fBenefit of waiver and payments by affiliates rounds to less than 0.01%.
gExcludes the value of portfolio securities delivered as a result of a redemption in-kind.
| The accompanying notes are an integral part of these financial statements. | Semiannual Report | FI-7 |
FRANKLIN TEMPLETON VARIABLE INSURANCE PRODUCTS TRUST
FINANCIAL HIGHLIGHTS
Franklin Income VIP Fund (continued)
| Six Months Ended June 30, 2015 (unaudited) | Year Ended December 31, | |||||||||||||||||||||||
| 2014 | 2013 | 2012 | 2011 | 2010 | ||||||||||||||||||||
| Class 2 | ||||||||||||||||||||||||
Per share operating performance (for a share outstanding throughout the period) | ||||||||||||||||||||||||
Net asset value, beginning of period | $16.00 | $16.07 | $15.07 | $14.32 | $14.82 | $14.12 | ||||||||||||||||||
|
| |||||||||||||||||||||||
| Income from investment operationsa: | ||||||||||||||||||||||||
Net investment incomeb | 0.34 | 0.66 | 0.75 | 0.85 | 0.90 | 0.86 | ||||||||||||||||||
Net realized and unrealized gains (losses) | (0.51 | ) | 0.11 | 1.27 | 0.88 | (0.53 | ) | 0.82 | ||||||||||||||||
|
| |||||||||||||||||||||||
Total from investment operations | (0.17 | ) | 0.77 | 2.02 | 1.73 | 0.37 | 1.68 | |||||||||||||||||
|
| |||||||||||||||||||||||
Less distributions from net investment income | (0.72 | ) | (0.84 | ) | (1.02 | ) | (0.98 | ) | (0.87 | ) | (0.98 | ) | ||||||||||||
|
| |||||||||||||||||||||||
Net asset value, end of period | $15.11 | $16.00 | $16.07 | $15.07 | $14.32 | $14.82 | ||||||||||||||||||
|
| |||||||||||||||||||||||
Total returnc | (1.10)% | 4.62% | 13.94% | 12.65% | 2.38% | 12.67% | ||||||||||||||||||
| Ratios to average net assetsd | ||||||||||||||||||||||||
Expenses | 0.72% | e,f | 0.72% | e | 0.72% | e | 0.72% | 0.72% | e | 0.72% | e | |||||||||||||
Net investment income | 4.27% | 4.01% | 4.82% | 5.78% | 6.10% | 6.03% | ||||||||||||||||||
| Supplemental data | ||||||||||||||||||||||||
Net assets, end of period (000’s) | $5,637,834 | $6,022,804 | $6,188,045 | $6,182,997 | $5,915,637 | $6,309,207 | ||||||||||||||||||
Portfolio turnover rate | 11.39% | 24.77% | 21.71% | 26.66% | g | 28.65% | 41.65% | |||||||||||||||||
aThe amount shown for a share outstanding throughout the period may not correlate with the Statement of Operations for the period due to the timing of sales and repurchases of the Fund’s shares in relation to income earned and/or fluctuating fair value of the investments of the Fund.
bBased on average daily shares outstanding.
cTotal return does not include fees, charges or expenses imposed by the variable annuity and life insurance contracts for which Franklin Templeton Variable Insurance Products Trust serves as an underlying investment vehicle. Total return is not annualized for periods less than one year.
dRatios are annualized for periods less than one year.
eBenefit of expense reduction rounds to less than 0.01%.
fBenefit of waiver and payments by affiliates rounds to less than 0.01%.
gExcludes the value of portfolio securities delivered as a result of a redemption in-kind.
| FI-8 | Semiannual Report | The accompanying notes are an integral part of these financial statements. |
FRANKLIN TEMPLETON VARIABLE INSURANCE PRODUCTS TRUST
FINANCIAL STATEMENTS
Franklin Income VIP Fund (continued)
| Six Months Ended June 30, 2015 (unaudited) | Year Ended December 31, | |||||||||||||||||||||||
| 2014 | 2013 | 2012 | 2011 | 2010 | ||||||||||||||||||||
| Class 4 | ||||||||||||||||||||||||
Per share operating performance (for a share outstanding throughout the period) | ||||||||||||||||||||||||
Net asset value, beginning of period | $16.31 | $16.36 | $15.32 | $14.54 | $15.04 | $14.33 | ||||||||||||||||||
|
| |||||||||||||||||||||||
| Income from investment operationsa: | ||||||||||||||||||||||||
Net investment incomeb | 0.34 | 0.66 | 0.75 | 0.85 | 0.90 | 0.85 | ||||||||||||||||||
Net realized and unrealized gains (losses) | (0.52 | ) | 0.11 | 1.30 | 0.90 | (0.54 | ) | 0.84 | ||||||||||||||||
|
| |||||||||||||||||||||||
Total from investment operations | (0.18 | ) | 0.77 | 2.05 | 1.75 | 0.36 | 1.69 | |||||||||||||||||
|
| |||||||||||||||||||||||
Less distributions from net investment income | (0.71 | ) | (0.82 | ) | (1.01 | ) | (0.97 | ) | (0.86 | ) | (0.98 | ) | ||||||||||||
|
| |||||||||||||||||||||||
Net asset value, end of period | $15.42 | $16.31 | $16.36 | $15.32 | $14.54 | $15.04 | ||||||||||||||||||
|
| |||||||||||||||||||||||
Total returnc | (1.19)% | 4.52% | 13.85% | 12.56% | 2.29% | 12.54% | ||||||||||||||||||
| Ratios to average net assetsd | ||||||||||||||||||||||||
Expenses | 0.82% | e,f | 0.82% | e | 0.82% | e | 0.82% | 0.82% | e | 0.82% | e | |||||||||||||
Net investment income | 4.17% | 3.91% | 4.72% | 5.68% | 6.00% | 5.93% | ||||||||||||||||||
| Supplemental data | ||||||||||||||||||||||||
Net assets, end of period (000’s) | $358,166 | $378,545 | $397,652 | $436,405 | $431,435 | $415,541 | ||||||||||||||||||
Portfolio turnover rate | 11.39% | 24.77% | 21.71% | 26.66% | g | 28.65% | 41.65% | |||||||||||||||||
aThe amount shown for a share outstanding throughout the period may not correlate with the Statement of Operations for the period due to the timing of sales and repurchases of the Fund’s shares in relation to income earned and/or fluctuating fair value of the investments of the Fund.
bBased on average daily shares outstanding.
cTotal return does not include fees, charges or expenses imposed by the variable annuity and life insurance contracts for which Franklin Templeton Variable Insurance Products Trust serves as an underlying investment vehicle. Total return is not annualized for periods less than one year.
dRatios are annualized for periods less than one year.
eBenefit of expense reduction rounds to less than 0.01%.
fBenefit of waiver and payments by affiliates rounds to less than 0.01%.
gExcludes the value of portfolio securities delivered as a result of a redemption in-kind.
| The accompanying notes are an integral part of these financial statements. | Semiannual Report | FI-9 |
FRANKLIN TEMPLETON VARIABLE INSURANCE PRODUCTS TRUST
Statement of Investments, June 30, 2015 (unaudited)
Franklin Income VIP Fund
| ||||||||||||||
| Country | Shares/Warrants | Value | ||||||||||||
Common Stocks and Other Equity Interests 47.7% | ||||||||||||||
Consumer Discretionary 2.9% | ||||||||||||||
| a | Dex Media Inc. | United States | 458,876 | $ | 334,980 | |||||||||
Ford Motor Co. | United States | 2,500,000 | 37,525,000 | |||||||||||
General Motors Co. | United States | 1,454,100 | 48,465,153 | |||||||||||
Las Vegas Sands Corp. | United States | 200,000 | 10,514,000 | |||||||||||
Target Corp. | United States | 1,181,100 | 96,413,193 | |||||||||||
|
| |||||||||||||
| 193,252,326 | ||||||||||||||
|
| |||||||||||||
Consumer Staples 0.8% | ||||||||||||||
PepsiCo Inc. | United States | 584,000 | 54,510,560 | |||||||||||
|
| |||||||||||||
Energy 7.6% | ||||||||||||||
Anadarko Petroleum Corp. | United States | 170,000 | 13,270,200 | |||||||||||
BP PLC, ADR | United Kingdom | 2,000,000 | 79,920,000 | |||||||||||
Chevron Corp. | United States | 800,000 | 77,176,000 | |||||||||||
Devon Energy Corp. | United States | 650,000 | 38,668,500 | |||||||||||
Exxon Mobil Corp. | United States | 283,000 | 23,545,600 | |||||||||||
| a | Halcon Resources Corp. | United States | 12,071,393 | 14,002,816 | ||||||||||
Halliburton Co. | United States | 435,000 | 18,735,450 | |||||||||||
Occidental Petroleum Corp. | United States | 150,000 | 11,665,500 | |||||||||||
Royal Dutch Shell PLC, A, ADR | United Kingdom | 1,951,748 | 111,269,153 | |||||||||||
Schlumberger Ltd. | United States | 450,000 | 38,785,500 | |||||||||||
Spectra Energy Corp. | United States | 600,000 | 19,560,000 | |||||||||||
Total SA, B, ADR | France | 1,192,900 | 58,654,893 | |||||||||||
|
| |||||||||||||
| 505,253,612 | ||||||||||||||
|
| |||||||||||||
Financials 2.5% | ||||||||||||||
Bank of America Corp. | United States | 1,100,000 | 18,722,000 | |||||||||||
JPMorgan Chase & Co. | United States | 735,100 | 49,810,376 | |||||||||||
MetLife Inc. | United States | 761,108 | 42,614,437 | |||||||||||
Wells Fargo & Co. | United States | 1,000,000 | 56,240,000 | |||||||||||
|
| |||||||||||||
| 167,386,813 | ||||||||||||||
|
| |||||||||||||
Health Care 5.2% | ||||||||||||||
Bristol-Myers Squibb Co. | United States | 275,000 | 18,298,500 | |||||||||||
Eli Lilly & Co. | United States | 689,800 | 57,591,402 | |||||||||||
Johnson & Johnson | United States | 417,800 | 40,718,788 | |||||||||||
Merck & Co. Inc. | United States | 1,023,200 | 58,250,776 | |||||||||||
Pfizer Inc. | United States | 3,138,975 | 105,249,832 | |||||||||||
Sanofi, ADR | France | 1,368,292 | 67,771,503 | |||||||||||
|
| |||||||||||||
| 347,880,801 | ||||||||||||||
|
| |||||||||||||
Industrials 4.4% | ||||||||||||||
The Boeing Co. | United States | 231,800 | 32,155,296 | |||||||||||
| a | CEVA Holdings LLC | United Kingdom | 13,012 | 9,629,072 | ||||||||||
General Electric Co. | United States | 3,756,200 | 99,802,234 | |||||||||||
Lockheed Martin Corp. | United States | 253,200 | 47,069,880 | |||||||||||
Raytheon Co. | United States | 340,000 | 32,531,200 | |||||||||||
Republic Services Inc. | United States | 527,300 | 20,654,341 | |||||||||||
United Technologies Corp. | United States | 75,000 | 8,319,750 | |||||||||||
Waste Management Inc. | United States | 928,200 | 43,022,070 | |||||||||||
|
| |||||||||||||
| 293,183,843 | ||||||||||||||
|
| |||||||||||||
Information Technology 3.3% | ||||||||||||||
Cisco Systems Inc. | United States | 1,400,000 | 38,444,000 | |||||||||||
| a,b | First Data Holdings Inc., B | United States | 4,929,600 | 24,855,965 | ||||||||||
| FI-10 | Semiannual Report |
FRANKLIN TEMPLETON VARIABLE INSURANCE PRODUCTS TRUST
STATEMENT OF INVESTMENTS (UNAUDITED)
Franklin Income VIP Fund (continued)
| Country | Shares/Warrants | Value | ||||||||||||
Common Stocks and Other Equity Interests (continued) | ||||||||||||||
Information Technology (continued) | ||||||||||||||
Intel Corp. | United States | 1,500,000 | $ | 45,622,500 | ||||||||||
Microsoft Corp. | United States | 1,022,500 | 45,143,375 | |||||||||||
QUALCOMM Inc. | United States | 260,000 | 16,283,800 | |||||||||||
Texas Instruments Inc. | United States | 924,800 | 47,636,448 | |||||||||||
|
| |||||||||||||
| 217,986,088 | ||||||||||||||
|
| |||||||||||||
Materials 8.0% | ||||||||||||||
Agrium Inc. | Canada | 500,000 | 52,975,000 | |||||||||||
BASF SE | Germany | 250,000 | 21,960,237 | |||||||||||
BHP Billiton PLC | Australia | 2,784,192 | 54,630,834 | |||||||||||
The Dow Chemical Co. | United States | 2,525,700 | 129,240,069 | |||||||||||
E. I. du Pont de Nemours and Co. | United States | 1,247,500 | 79,777,625 | |||||||||||
Freeport-McMoRan Inc., B | United States | 1,500,000 | 27,930,000 | |||||||||||
Goldcorp Inc. | Canada | 1,508,600 | 24,439,320 | |||||||||||
LyondellBasell Industries NV, A | United States | 500,000 | 51,760,000 | |||||||||||
The Mosaic Co. | United States | 300,000 | 14,055,000 | |||||||||||
Rio Tinto PLC, ADR | United Kingdom | 1,845,100 | 76,036,571 | |||||||||||
| a | South32 Ltd. | Australia | 2,784,192 | 3,761,611 | ||||||||||
|
| |||||||||||||
| 536,566,267 | ||||||||||||||
|
| |||||||||||||
Telecommunication Services 2.2% | ||||||||||||||
AT&T Inc. | United States | 1,621,000 | 57,577,920 | |||||||||||
CenturyLink Inc. | United States | 500,000 | 14,690,000 | |||||||||||
Telstra Corp. Ltd. | Australia | 3,446,331 | 16,321,072 | |||||||||||
Verizon Communications Inc. | United States | 1,123,892 | 52,384,606 | |||||||||||
Vodafone Group PLC | United Kingdom | 2,115,279 | 7,638,154 | |||||||||||
|
| |||||||||||||
| 148,611,752 | ||||||||||||||
|
| |||||||||||||
Utilities 10.8% | ||||||||||||||
AGL Resources Inc. | United States | 290,732 | 13,536,482 | |||||||||||
American Electric Power Co. Inc. | United States | 400,000 | 21,188,000 | |||||||||||
Dominion Resources Inc. | United States | 750,000 | 50,152,500 | |||||||||||
Duke Energy Corp. | United States | 1,302,500 | 91,982,550 | |||||||||||
| a | Dynegy Inc. | United States | 330,800 | 9,675,900 | ||||||||||
| a | Dynegy Inc., wts., 10/02/17 | United States | 242,666 | 981,584 | ||||||||||
Exelon Corp. | United States | 2,877,200 | 90,401,624 | |||||||||||
FirstEnergy Corp. | United States | 845,900 | 27,534,045 | |||||||||||
NextEra Energy Inc. | United States | 651,300 | 63,846,939 | |||||||||||
PG&E Corp. | United States | 1,435,300 | 70,473,230 | |||||||||||
Pinnacle West Capital Corp. | United States | 260,500 | 14,819,845 | |||||||||||
PPL Corp. | United States | 1,365,400 | 40,238,338 | |||||||||||
Public Service Enterprise Group Inc. | United States | 923,500 | 36,275,080 | |||||||||||
Sempra Energy | United States | 368,300 | 36,439,602 | |||||||||||
The Southern Co. | United States | 1,888,200 | 79,115,580 | |||||||||||
TECO Energy Inc. | United States | 1,253,700 | 22,140,342 | |||||||||||
Xcel Energy Inc. | United States | 1,510,964 | 48,622,821 | |||||||||||
|
| |||||||||||||
| 717,424,462 | ||||||||||||||
|
| |||||||||||||
Total Common Stocks and Other Equity Interests (Cost $2,720,022,839) | 3,182,056,524 | |||||||||||||
|
| |||||||||||||
| Semiannual Report | FI-11 |
FRANKLIN TEMPLETON VARIABLE INSURANCE PRODUCTS TRUST
STATEMENT OF INVESTMENTS (UNAUDITED)
Franklin Income VIP Fund (continued)
| Country | Shares/Warrants | Value | ||||||||||||
| c | Equity-Linked Securities 4.9% | |||||||||||||
Consumer Discretionary 0.9% | ||||||||||||||
| d | Citigroup Global Markets Inc. into Ford Motor Co., 7.00%, 144A | United States | 1,700,000 | $ | 26,184,080 | |||||||||
| d | Deutsche Bank AG/London into General Motors Co., 8.00%, 144A | United States | 500,000 | 16,973,400 | ||||||||||
| d | The Goldman Sachs Group Inc. into General Motors Co., 6.50%, 144A | United States | 500,000 | 16,919,100 | ||||||||||
|
| |||||||||||||
| 60,076,580 | ||||||||||||||
|
| |||||||||||||
Consumer Staples 0.3% | ||||||||||||||
| d | Citigroup Inc. into Whole Foods Market Inc., 7.00%, 144A | United States | 485,000 | 19,284,376 | ||||||||||
|
| |||||||||||||
Energy 1.1% | ||||||||||||||
| d | Citigroup Inc. into Cabot Oil & Gas Corp., 6.00%, 144A | United States | 696,000 | 22,545,876 | ||||||||||
| d | Credit Suisse New York into Baker Hughes Inc., 6.00%, 144A | United States | 200,000 | 11,910,500 | ||||||||||
| d | JPMorgan Chase & Co. into Anadarko Petroleum Corp., 7.00%, 144A | United States | 470,000 | 37,836,880 | ||||||||||
|
| |||||||||||||
| 72,293,256 | ||||||||||||||
|
| |||||||||||||
Financials 0.6% | ||||||||||||||
| d | The Goldman Sachs Group into Bank of America Corp., 6.00%, 144A | United States | 2,150,000 | 37,051,165 | ||||||||||
|
| |||||||||||||
Industrials 0.4% | ||||||||||||||
| d | The Goldman Sachs Group Inc. into General Electric Co., 5.50%, 144A | United States | 1,000,000 | 26,746,100 | ||||||||||
|
| |||||||||||||
Information Technology 1.6% | ||||||||||||||
| d | Bank of America Corp. into Freescale Semiconductor Ltd., 7.00%, 144A | United States | 950,000 | 24,891,805 | ||||||||||
| d | Bank of America Corp. into Intel Corp., 6.50%, 144A | United States | 1,045,000 | 32,570,351 | ||||||||||
| d | Citigroup Inc. into Apple Inc., 7.00%, 144A | United States | 415,000 | 52,346,855 | ||||||||||
|
| |||||||||||||
| 109,809,011 | ||||||||||||||
|
| |||||||||||||
Total Equity-Linked Securities (Cost $328,702,244) | 325,260,488 | |||||||||||||
|
| |||||||||||||
Convertible Preferred Stocks 2.9% | ||||||||||||||
Consumer Discretionary 0.2% | ||||||||||||||
| a | Fiat Chrysler Automobiles NV, 7.875%, cvt. pfd. | United Kingdom | 100,000 | 12,800,900 | ||||||||||
|
| |||||||||||||
Energy 0.1% | ||||||||||||||
Sanchez Energy Corp., 6.50%, cvt. pfd., B | United States | 200,000 | 6,240,000 | |||||||||||
|
| |||||||||||||
Financials 1.6% | ||||||||||||||
Bank of America Corp., 7.25%, cvt. pfd., L | United States | 66,600 | 74,059,200 | |||||||||||
FelCor Lodging Trust Inc., 7.80%, cvt. pfd., A | United States | 167,325 | 4,127,908 | |||||||||||
| a | FNMA, 5.375%, cvt. pfd. | United States | 475 | 6,175,000 | ||||||||||
Wells Fargo & Co., 7.50%, cvt. pfd., A | United States | 20,000 | 23,500,000 | |||||||||||
|
| |||||||||||||
| 107,862,108 | ||||||||||||||
|
| |||||||||||||
Health Care 0.1% | ||||||||||||||
Allergan PLC, 5.50%, cvt. pfd. | United States | 7,500 | 7,819,350 | |||||||||||
|
| |||||||||||||
Industrials 0.2% | ||||||||||||||
| a | CEVA Holdings LLC, cvt. pfd., A-1 | United Kingdom | 397 | 397,000 | ||||||||||
| a | CEVA Holdings LLC, cvt. pfd., A-2 | United Kingdom | 14,711 | 10,886,066 | ||||||||||
|
| |||||||||||||
| 11,283,066 | ||||||||||||||
|
| |||||||||||||
| FI-12 | Semiannual Report |
FRANKLIN TEMPLETON VARIABLE INSURANCE PRODUCTS TRUST
STATEMENT OF INVESTMENTS (UNAUDITED)
Franklin Income VIP Fund (continued)
| Country | Shares/Warrants | Value | ||||||||||||
Convertible Preferred Stocks (continued) | ||||||||||||||
Materials 0.3% | ||||||||||||||
Alcoa Inc., 5.375%, cvt. pfd. | United States | 500,000 | $ | 19,765,000 | ||||||||||
ArcelorMittal, 6.00%, cvt. pfd. | Luxembourg | 160,000 | 2,497,600 | |||||||||||
|
| |||||||||||||
| 22,262,600 | ||||||||||||||
|
| |||||||||||||
Utilities 0.4% | ||||||||||||||
Dominion Resources Inc., 6.125%, cvt. pfd., A | United States | 145,000 | 7,770,550 | |||||||||||
Dominion Resources Inc., 6.375%, cvt. pfd., A | United States | 162,000 | 7,565,400 | |||||||||||
Dominion Resources Inc., 6.00%, cvt. pfd., B | United States | 145,000 | 7,805,350 | |||||||||||
NextEra Energy Inc., 5.889%, cvt. pfd. | United States | 83,100 | 5,128,101 | |||||||||||
|
| |||||||||||||
| 28,269,401 | ||||||||||||||
|
| |||||||||||||
Total Convertible Preferred Stocks (Cost $217,749,403) | 196,537,425 | |||||||||||||
|
| |||||||||||||
Preferred Stocks 0.2% | ||||||||||||||
Financials 0.2% | ||||||||||||||
| a | FNMA, 8.25%, pfd. | United States | 633,375 | 2,375,156 | ||||||||||
Morgan Stanley, 6.375%, pfd., I | United States | 350,000 | 8,911,000 | |||||||||||
|
| |||||||||||||
Total Preferred Stocks (Cost $24,584,375) | 11,286,156 | |||||||||||||
|
| |||||||||||||
| Principal Amount* | ||||||||||||||
Convertible Bonds 0.8% | ||||||||||||||
Consumer Discretionary 0.5% | ||||||||||||||
| d | Volkswagen International Finance, cvt., sub. note, 144A, 5.50%, 11/09/15 | Germany | 25,000,000 | EUR | 34,144,101 | |||||||||
|
| |||||||||||||
Energy 0.3% | ||||||||||||||
| d,e | American Energy-Permian Basin LLC, cvt., 144A, PIK, 8.00%, 5/01/22 | United States | 5,000,000 | 2,775,000 | ||||||||||
Cobalt International Energy Inc., cvt., senior bond, 3.125%, 5/15/24 | United States | 25,000,000 | 18,234,375 | |||||||||||
|
| |||||||||||||
| 21,009,375 | ||||||||||||||
|
| |||||||||||||
Total Convertible Bonds (Cost $61,855,714) | 55,153,476 | |||||||||||||
|
| |||||||||||||
Corporate Bonds 31.1% | ||||||||||||||
Consumer Discretionary 5.4% | ||||||||||||||
| d | 1011778 BC ULC/New Red Finance Inc., secured note, second lien, 144A, 6.00%, 4/01/22 | Canada | 10,000,000 | 10,300,000 | ||||||||||
| d | Academy Ltd./Finance Corp., senior note, 144A, 9.25%, 8/01/19 | United States | 5,300,000 | 5,595,210 | ||||||||||
| d | Altice SA, senior secured note, 144A, 7.75%, 5/15/22 | Luxembourg | 3,000,000 | 2,904,375 | ||||||||||
| d | Argos Merger Sub Inc., senior note, 144A, 7.125%, 3/15/23 | United States | 3,000,000 | 3,150,000 | ||||||||||
Cablevision Systems Corp., senior note, 7.75%, 4/15/18 | United States | 10,000,000 | 10,825,000 | |||||||||||
CCO Holdings LLC/CCO Holdings Capital Corp., | ||||||||||||||
senior bond, 5.25%, 9/30/22 | United States | 2,700,000 | 2,666,250 | |||||||||||
senior bond, 5.125%, 2/15/23 | United States | 10,000,000 | 9,775,000 | |||||||||||
senior note, 6.50%, 4/30/21 | United States | 15,000,000 | 15,731,250 | |||||||||||
Chrysler Group LLC/CG Co-Issuer Inc., senior secured note, 8.25%, 6/15/21 | United States | 15,400,000 | 16,824,500 | |||||||||||
Clear Channel Worldwide Holdings Inc., senior sub. note, 7.625%, 3/15/20 | United States | 8,750,000 | 9,154,687 | |||||||||||
CSC Holdings LLC, senior note, 6.75%, 11/15/21 | United States | 15,400,000 | 16,285,500 | |||||||||||
| Semiannual Report | FI-13 |
FRANKLIN TEMPLETON VARIABLE INSURANCE PRODUCTS TRUST
STATEMENT OF INVESTMENTS (UNAUDITED)
Franklin Income VIP Fund (continued)
| Country | Principal Amount* | Value | ||||||||||||
Corporate Bonds (continued) | ||||||||||||||
Consumer Discretionary (continued) | ||||||||||||||
| f | Cumulus Media Holdings Inc., senior note, 7.75%, 5/01/19 | United States | 10,000,000 | $ | 9,212,500 | |||||||||
DISH DBS Corp., | ||||||||||||||
senior bond, 5.00%, 3/15/23 | United States | 15,000,000 | 13,950,000 | |||||||||||
senior note, 5.875%, 11/15/24 | United States | 8,300,000 | 7,993,937 | |||||||||||
Dollar General Corp., senior bond, 3.25%, 4/15/23 | United States | 5,000,000 | 4,765,715 | |||||||||||
| d | Family Tree Escrow LLC, senior note, 144A, 5.75%, 3/01/23 | United States | 4,000,000 | 4,200,000 | ||||||||||
| d | Fiat Chrysler Automobiles NV, senior note, 144A, 5.25%, 4/15/23 | United Kingdom | 11,300,000 | 11,088,125 | ||||||||||
The Goodyear Tire & Rubber Co., senior note, 6.50%, 3/01/21 | United States | 12,600,000 | 13,387,500 | |||||||||||
HD Supply Inc., | ||||||||||||||
d first lien, 144A, 5.25%, 12/15/21 | United States | 6,000,000 | 6,105,000 | |||||||||||
senior note, 7.50%, 7/15/20 | United States | 10,000,000 | 10,625,000 | |||||||||||
iHeartCommunications Inc., | ||||||||||||||
e senior note, PIK, 14.00%, 2/01/21 | United States | 13,599,973 | 9,706,981 | |||||||||||
senior secured bond, first lien, 9.00%, 3/01/21 | United States | 24,100,000 | 22,051,500 | |||||||||||
senior secured note, first lien, 9.00%, 12/15/19 | United States | 18,000,000 | 17,221,500 | |||||||||||
senior secured note, first lien, 9.00%, 9/15/22 | United States | 14,600,000 | 13,286,000 | |||||||||||
| d | International Game Technology PLC, | |||||||||||||
senior secured bond, 144A, 6.50%, 2/15/25 | United States | 8,500,000 | 7,910,313 | |||||||||||
senior secured note, 144A, 6.25%, 2/15/22 | United States | 8,500,000 | 8,255,625 | |||||||||||
KB Home, | ||||||||||||||
senior bond, 7.50%, 9/15/22 | United States | 6,500,000 | 6,792,500 | |||||||||||
senior note, 7.25%, 6/15/18 | United States | 10,600,000 | 11,554,000 | |||||||||||
MGM Resorts International, senior note, | ||||||||||||||
10.00%, 11/01/16 | United States | 10,000,000 | 10,900,000 | |||||||||||
5.25%, 3/31/20 | United States | 5,000,000 | 5,062,500 | |||||||||||
6.75%, 10/01/20 | United States | 5,500,000 | 5,842,650 | |||||||||||
| d | Numericable Group SA, senior note, first lien, 144A, 6.00%, 5/15/22 | France | 10,000,000 | 9,831,250 | ||||||||||
Outfront Media Capital LLC/Corp., | ||||||||||||||
senior bond, 5.625%, 2/15/24 | United States | 1,600,000 | 1,642,000 | |||||||||||
senior note, 5.25%, 2/15/22 | United States | 1,600,000 | 1,624,000 | |||||||||||
| d | Sirius XM Radio Inc., | |||||||||||||
senior bond, 144A, 6.00%, 7/15/24 | United States | 14,600,000 | 14,782,500 | |||||||||||
senior note, 144A, 5.75%, 8/01/21 | United States | 5,000,000 | 5,156,250 | |||||||||||
| d | Univision Communications Inc., senior secured note, first lien, 144A, 5.125%, | |||||||||||||
5/15/23 | United States | 10,000,000 | 9,750,000 | |||||||||||
2/15/25 | United States | 5,100,000 | 4,921,500 | |||||||||||
| d | Virgin Media Secured Finance PLC, senior secured bond, first lien, 144A, 5.50%, 1/15/25 | United Kingdom | 7,000,000 | 7,039,375 | ||||||||||
Visant Corp., senior note, 10.00%, 10/01/17 | United States | 4,000,000 | 3,245,000 | |||||||||||
|
| |||||||||||||
| 361,114,993 | ||||||||||||||
|
| |||||||||||||
Consumer Staples 0.6% | ||||||||||||||
Cott Beverages Inc., senior note, 5.375%, 7/01/22 | United States | 2,500,000 | 2,437,500 | |||||||||||
| d | JBS USA LLC/Finance Inc., senior note, 144A, | |||||||||||||
8.25%, 2/01/20 | United States | 10,000,000 | 10,650,000 | |||||||||||
7.25%, 6/01/21 | United States | 17,400,000 | 18,422,250 | |||||||||||
U.S. Foods Inc., 8.50%, 6/30/19 | United States | 10,000,000 | 10,450,000 | |||||||||||
|
| |||||||||||||
| 41,959,750 | ||||||||||||||
|
| |||||||||||||
| FI-14 | Semiannual Report |
FRANKLIN TEMPLETON VARIABLE INSURANCE PRODUCTS TRUST
STATEMENT OF INVESTMENTS (UNAUDITED)
Franklin Income VIP Fund (continued)
| Country | Principal Amount* | Value | ||||||||||||
Corporate Bonds (continued) | ||||||||||||||
Energy 6.5% | ||||||||||||||
Alpha Natural Resources Inc., | ||||||||||||||
d second lien, 144A, 7.50%, 8/01/20 | United States | 2,200,000 | $ | 561,000 | ||||||||||
senior note, 6.00%, 6/01/19 | United States | 8,000,000 | 560,000 | |||||||||||
| d,e | American Energy-Woodford LLC/AEW Finance Corp., senior secured note, second lien, 144A, PIK, 12.00%, 12/30/20 | United States | 3,500,000 | 2,520,000 | ||||||||||
Antero Resources Corp., senior note, 5.375%, 11/01/21 | United States | 2,200,000 | 2,145,000 | |||||||||||
Arch Coal Inc., senior note, | ||||||||||||||
7.00%, 6/15/19 | United States | 5,500,000 | 825,000 | |||||||||||
7.25%, 6/15/21 | United States | 2,500,000 | 362,500 | |||||||||||
Bill Barrett Corp., senior note, | ||||||||||||||
7.625%, 10/01/19 | United States | 6,630,000 | 6,364,800 | |||||||||||
7.00%, 10/15/22 | United States | 10,000,000 | 9,100,000 | |||||||||||
California Resources Corp., | ||||||||||||||
senior bond, 6.00%, 11/15/24 | United States | 5,500,000 | 4,750,625 | |||||||||||
senior note, 5.50%, 9/15/21 | United States | 12,500,000 | 10,890,625 | |||||||||||
Calumet Specialty Products Partners LP/Calumet Finance Corp., senior note, 6.50%, 4/15/21 | United States | 5,000,000 | 4,950,000 | |||||||||||
CGG SA, senior note, 6.50%, 6/01/21 | France | 11,100,000 | 9,268,500 | |||||||||||
CHC Helicopter SA, senior secured note, first lien, 9.25%, 10/15/20 | Canada | 14,400,000 | 10,503,000 | |||||||||||
Chesapeake Energy Corp., senior note, 5.375%, 6/15/21 | United States | 15,000,000 | 13,650,000 | |||||||||||
CONSOL Energy Inc., senior note, 5.875%, 4/15/22 | United States | 11,500,000 | 9,822,380 | |||||||||||
Denbury Resources Inc., senior note, 5.50%, 5/01/22 | United States | 17,000,000 | 15,257,500 | |||||||||||
Energy XXI Gulf Coast Inc., | ||||||||||||||
senior note, 9.25%, 12/15/17 | United States | 23,264,000 | 12,388,080 | |||||||||||
senior note, 6.875%, 3/15/24 | United States | 37,310,000 | 12,312,300 | |||||||||||
d senior secured note, second lien, 144A, 11.00%, 3/15/20 | United States | 7,100,000 | 6,265,750 | |||||||||||
| d | EnQuest PLC, senior note, 144A, 7.00%, 4/15/22 | United Kingdom | 15,000,000 | 12,084,375 | ||||||||||
EXCO Resources Inc., senior note, 7.50%, 9/15/18 | United States | 2,500,000 | 1,600,000 | |||||||||||
Halcon Resources Corp., senior note, | ||||||||||||||
9.75%, 7/15/20 | United States | 1,700,000 | 1,151,750 | |||||||||||
8.875%, 5/15/21 | United States | 5,500,000 | 3,643,750 | |||||||||||
9.25%, 2/15/22 | United States | 5,800,000 | 3,784,500 | |||||||||||
Kinder Morgan Inc., | ||||||||||||||
senior note, MTN, 7.75%, 1/15/32 | United States | 22,000,000 | 25,278,550 | |||||||||||
d senior secured bond, first lien, 144A, 5.625%, 11/15/23 | United States | 9,800,000 | 10,428,788 | |||||||||||
Linn Energy LLC/Finance Corp., senior note, | ||||||||||||||
6.50%, 5/15/19 | United States | 5,000,000 | 4,062,500 | |||||||||||
6.25%, 11/01/19 | United States | 7,500,000 | 5,906,250 | |||||||||||
8.625%, 4/15/20 | United States | 20,000,000 | 16,504,200 | |||||||||||
Magnum Hunter Resources Corp., senior note, 9.75%, 5/15/20 | United States | 5,000,000 | 4,500,000 | |||||||||||
Midstates Petroleum Co. Inc./LLC, senior note, 10.75%, 10/01/20 | United States | 1,200,000 | 510,000 | |||||||||||
| d | NGPL PipeCo LLC, secured note, 144A, 7.119%, 12/15/17 | United States | 3,750,000 | 3,862,500 | ||||||||||
| d | Ocean Rig UDW Inc., senior note, 144A, 7.25%, 4/01/19 | United States | 6,000,000 | 4,676,250 | ||||||||||
Offshore Group Investment Ltd., senior secured note, first lien, 7.50%, 11/01/19 | United States | 6,500,000 | 4,017,813 | |||||||||||
Peabody Energy Corp., | ||||||||||||||
d second lien, 144A, 10.00%, 3/15/22 | United States | 17,500,000 | 10,893,750 | |||||||||||
senior note, 6.25%, 11/15/21 | United States | 10,000,000 | 3,250,000 | |||||||||||
Penn Virginia Corp., senior note, 8.50%, 5/01/20 | United States | 9,300,000 | 8,393,250 | |||||||||||
Rex Energy Corp., senior note, 8.875%, 12/01/20 | United States | 5,000,000 | 4,525,000 | |||||||||||
Rice Energy Inc., senior note, 6.25%, 5/01/22 | United States | 6,831,000 | 6,813,922 | |||||||||||
| Semiannual Report | FI-15 |
FRANKLIN TEMPLETON VARIABLE INSURANCE PRODUCTS TRUST
STATEMENT OF INVESTMENTS (UNAUDITED)
Franklin Income VIP Fund (continued)
| Country | Principal Amount* | Value | ||||||||||||
Corporate Bonds (continued) | ||||||||||||||
Energy (continued) | ||||||||||||||
Sabine Pass Liquefaction LLC, | ||||||||||||||
first lien, 5.625%, 2/01/21 | United States | 15,100,000 | $ | 15,477,500 | ||||||||||
senior secured note, first lien, 5.75%, 5/15/24 | United States | 9,900,000 | 9,912,375 | |||||||||||
d senior secured note, first lien, 144A, 5.625%, 3/01/25 | United States | 15,000,000 | 14,906,250 | |||||||||||
Sabine Pass LNG LP, | ||||||||||||||
first lien, 6.50%, 11/01/20 | United States | 10,000,000 | 10,400,000 | |||||||||||
senior secured note, 7.50%, 11/30/16 | United States | 10,000,000 | 10,575,100 | |||||||||||
Sanchez Energy Corp., senior note, | ||||||||||||||
7.75%, 6/15/21 | United States | 10,000,000 | 10,000,000 | |||||||||||
6.125%, 1/15/23 | United States | 13,000,000 | 11,700,000 | |||||||||||
SandRidge Energy Inc., | ||||||||||||||
d second lien, 144A, 8.75%, 6/01/20 | United States | 15,000,000 | 13,856,250 | |||||||||||
senior note, 8.75%, 1/15/20 | United States | 20,000,000 | 10,150,000 | |||||||||||
senior note, 7.50%, 3/15/21 | United States | 15,000,000 | 6,675,000 | |||||||||||
senior note, 8.125%, 10/15/22 | United States | 10,000,000 | 4,325,000 | |||||||||||
senior note, 7.50%, 2/15/23 | United States | 6,600,000 | 2,822,820 | |||||||||||
Stone Energy Corp., senior bond, 7.50%, 11/15/22 | United States | 20,000,000 | 17,500,000 | |||||||||||
W&T Offshore Inc., senior note, 8.50%, 6/15/19 | United States | 40,500,000 | 28,299,375 | |||||||||||
|
| |||||||||||||
| 434,983,878 | ||||||||||||||
|
| |||||||||||||
Financials 3.1% | ||||||||||||||
| g | Bank of America Corp., junior sub. bond, | |||||||||||||
AA, 6.10% to 3/17/25, FRN thereafter, Perpetual | United States | 8,000,000 | 7,950,000 | |||||||||||
M, 8.125% to 5/15/18, FRN thereafter, Perpetual | United States | 5,000,000 | 5,312,500 | |||||||||||
| g | Citigroup Inc., | |||||||||||||
junior sub. bond, 5.35% to 5/15/23, FRN thereafter, Perpetual | United States | 10,000,000 | 9,427,500 | |||||||||||
junior sub. bond, 5.95% to 1/30/23, FRN thereafter, Perpetual | United States | 4,500,000 | 4,438,125 | |||||||||||
junior sub. bond, M, 6.30% to 5/15/24, FRN thereafter, Perpetual | United States | 16,800,000 | 16,422,000 | |||||||||||
junior sub. bond, O, 5.875% to 3/27/20, FRN thereafter, Perpetual | United States | 25,000,000 | 25,086,250 | |||||||||||
junior sub. note, 5.90% to 2/15/23, FRN thereafter, Perpetual | United States | 12,500,000 | 12,343,750 | |||||||||||
International Lease Finance Corp., senior note, 8.75%, 3/15/17 | United States | 10,000,000 | 10,966,100 | |||||||||||
| g | JPMorgan Chase & Co., | |||||||||||||
junior sub. bond, R, 6.00% to 8/01/23, FRN thereafter, Perpetual | United States | 3,200,000 | 3,184,000 | |||||||||||
junior sub. bond, V, 5.00% to 7/30/19, FRN thereafter, Perpetual | United States | 10,000,000 | 9,800,000 | |||||||||||
junior sub. note, I, 7.90% to 4/30/19, FRN thereafter, Perpetual | United States | 65,000,000 | 68,835,000 | |||||||||||
| g | Morgan Stanley, junior sub. bond, 5.55% to 7/15/20, FRN thereafter, Perpetual | United States | 7,300,000 | 7,256,200 | ||||||||||
Navient Corp., senior note, 6.125%, 3/25/24 | United States | 5,000,000 | 4,800,000 | |||||||||||
| d | OneMain Financial Holdings Inc., senior note, 144A, | |||||||||||||
6.75%, 12/15/19 | United States | 10,000,000 | 10,450,000 | |||||||||||
7.25%, 12/15/21 | United States | 5,000,000 | 5,187,500 | |||||||||||
| g | Wells Fargo & Co., junior sub. bond, S, 5.90% to 6/15/24, FRN thereafter, Perpetual | United States | 7,900,000 | 7,939,500 | ||||||||||
|
| |||||||||||||
| 209,398,425 | ||||||||||||||
|
| |||||||||||||
Health Care 2.5% | ||||||||||||||
CHS/Community Health Systems Inc., | ||||||||||||||
senior note, 6.875%, 2/01/22 | United States | 6,400,000 | 6,776,000 | |||||||||||
senior secured note, 5.125%, 8/01/21 | United States | 2,600,000 | 2,655,250 | |||||||||||
DaVita HealthCare Partners Inc., senior bond, 5.125%, 7/15/24 | United States | 5,000,000 | 4,925,000 | |||||||||||
| FI-16 | Semiannual Report |
FRANKLIN TEMPLETON VARIABLE INSURANCE PRODUCTS TRUST
STATEMENT OF INVESTMENTS (UNAUDITED)
Franklin Income VIP Fund (continued)
| Country | Principal Amount* | Value | ||||||||||||
Corporate Bonds (continued) | ||||||||||||||
Health Care (continued) | ||||||||||||||
HCA Inc., | ||||||||||||||
senior note, 7.50%, 2/15/22 | United States | 25,000,000 | $ | 28,750,000 | ||||||||||
senior note, 5.875%, 5/01/23 | United States | 7,500,000 | 7,987,500 | |||||||||||
senior secured bond, first lien, 5.25%, 4/15/25 | United States | 5,000,000 | 5,196,875 | |||||||||||
senior secured note, 6.50%, 2/15/20 | United States | 7,100,000 | 7,952,000 | |||||||||||
senior secured note, first lien, 5.00%, 3/15/24 | United States | 10,400,000 | 10,608,000 | |||||||||||
| d,e | Jaguar Holding Co. I, senior note, 144A, PIK, 9.375%, 10/15/17 | United States | 10,200,000 | 10,442,250 | ||||||||||
Tenet Healthcare Corp., senior note, | ||||||||||||||
8.00%, 8/01/20 | United States | 10,426,000 | 10,882,138 | |||||||||||
8.125%, 4/01/22 | United States | 22,500,000 | 24,693,750 | |||||||||||
d 144A, 5.00%, 3/01/19 | United States | 3,400,000 | 3,412,750 | |||||||||||
| d | Tenet Healthcare Corp. II, senior note, 144A, 6.75%, 6/15/23 | United States | 8,200,000 | 8,379,375 | ||||||||||
| d | Valeant Pharmaceuticals International Inc., | |||||||||||||
senior bond, 144A, 6.125%, 4/15/25 | United States | 9,400,000 | 9,705,500 | |||||||||||
senior note, 144A, 7.50%, 7/15/21 | United States | 7,700,000 | 8,344,875 | |||||||||||
senior note, 144A, 5.875%, 5/15/23 | United States | 12,500,000 | 12,828,125 | |||||||||||
|
| |||||||||||||
| 163,539,388 | ||||||||||||||
|
| |||||||||||||
Industrials 1.5% | ||||||||||||||
| d | Abengoa Finance SAU, senior note, 144A, 8.875%, 11/01/17 | Spain | 12,900,000 | 13,456,312 | ||||||||||
| d | Abengoa Greenfield SA, senior note, 144A, 6.50%, 10/01/19 | Spain | 5,000,000 | 4,650,000 | ||||||||||
| d | Algeco Scotsman Global Finance PLC, | |||||||||||||
senior note, 144A, 10.75%, 10/15/19 | United Kingdom | 5,000,000 | 3,884,375 | |||||||||||
senior secured note, first lien, 144A, 8.50%, 10/15/18 | United Kingdom | 9,900,000 | 9,596,813 | |||||||||||
| d | Bombardier Inc., senior bond, 144A, | |||||||||||||
6.125%, 1/15/23 | Canada | 7,500,000 | 6,693,750 | |||||||||||
7.50%, 3/15/25 | Canada | 11,000,000 | 10,037,500 | |||||||||||
| d | CEVA Group PLC, senior note, first lien, 144A, 4.00%, 5/01/18 | United Kingdom | 12,691,882 | 11,700,329 | ||||||||||
Hertz Corp., senior note, 6.75%, 4/15/19 | United States | 9,500,000 | 9,826,800 | |||||||||||
Navistar International Corp., senior note, 8.25%, 11/01/21 | United States | 7,075,000 | 6,756,625 | |||||||||||
| d | Stena AB, senior bond, 144A, 7.00%, 2/01/24 | Sweden | 5,800,000 | 5,626,000 | ||||||||||
TransDigm Inc., | ||||||||||||||
senior sub. bond, 6.50%, 7/15/24 | United States | 2,700,000 | 2,679,750 | |||||||||||
senior sub. note, 6.00%, 7/15/22 | United States | 2,700,000 | 2,679,750 | |||||||||||
| d | XPO Logistics Inc., senior note, 144A, 6.50%, 6/15/22 | United States | 10,000,000 | 9,812,500 | ||||||||||
|
| |||||||||||||
| 97,400,504 | ||||||||||||||
|
| |||||||||||||
Information Technology 4.0% | ||||||||||||||
| d | BMC Software Finance Inc., senior note, 144A, 8.125%, 7/15/21 | United States | 16,500,000 | 13,426,875 | ||||||||||
| d,e | Boxer Parent Co. Inc., senior note, 144A, PIK, 9.00%, 10/15/19 | United States | 10,000,000 | 7,137,500 | ||||||||||
| d,e | CommScope Holdings Co. Inc., senior note, 144A, PIK, 6.625%, 6/01/20 | United States | 11,200,000 | 11,662,000 | ||||||||||
First Data Corp., | ||||||||||||||
senior bond, 12.625%, 1/15/21 | United States | 80,000,000 | 92,600,000 | |||||||||||
d senior secured bond, second lien, 144A, 8.25%, 1/15/21 | United States | 45,000,000 | 47,587,500 | |||||||||||
d,e senior secured note, 144A, PIK, 8.75%, 1/15/22 | United States | 33,188,000 | 35,365,962 | |||||||||||
Freescale Semiconductor Inc., senior note, 10.75%, 8/01/20 | United States | 35,202,000 | 37,314,120 | |||||||||||
NCR Corp., senior note, | ||||||||||||||
5.00%, 7/15/22 | United States | 5,000,000 | 5,087,500 | |||||||||||
6.375%, 12/15/23 | United States | 7,000,000 | 7,446,250 | |||||||||||
Sterling International Inc., senior note, 11.00%, 10/01/19 | United States | 6,800,000 | 7,242,000 | |||||||||||
|
| |||||||||||||
| 264,869,707 | ||||||||||||||
|
| |||||||||||||
| Semiannual Report | FI-17 |
FRANKLIN TEMPLETON VARIABLE INSURANCE PRODUCTS TRUST
STATEMENT OF INVESTMENTS (UNAUDITED)
Franklin Income VIP Fund (continued)
| Country | Principal Amount* | Value | ||||||||||||
Corporate Bonds (continued) | ||||||||||||||
Materials 2.2% | ||||||||||||||
| d | Ardagh Packaging Finance PLC/Ardagh MP Holdings USA Inc., senior note, 144A, | |||||||||||||
6.25%, 1/31/19 | Luxembourg | 2,800,000 | $ | 2,863,000 | ||||||||||
6.75%, 1/31/21 | Luxembourg | 3,000,000 | 3,082,500 | |||||||||||
| d | Cemex Finance LLC, senior secured note, | |||||||||||||
144A, 9.375%, 10/12/22 | Mexico | 7,100,000 | 7,943,125 | |||||||||||
first lien, 144A, 6.00%, 4/01/24 | Mexico | 14,700,000 | 14,571,375 | |||||||||||
| d | Cemex SAB de CV, senior secured note, 144A, 9.50%, 6/15/18 | Mexico | 12,000,000 | 13,312,500 | ||||||||||
| d | Consolidated Minerals Ltd., senior secured note, 144A, 8.00%, 5/15/20 | Jersey Islands | 5,000,000 | 4,000,000 | ||||||||||
| d | First Quantum Minerals Ltd., senior note, 144A, | |||||||||||||
6.75%, 2/15/20 | Canada | 2,300,000 | 2,236,750 | |||||||||||
7.00%, 2/15/21 | Canada | 2,300,000 | 2,210,875 | |||||||||||
| d | FMG Resources (August 2006) Pty. Ltd., | |||||||||||||
senior note, 144A, 8.25%, 11/01/19 | Australia | 4,500,000 | 3,813,750 | |||||||||||
senior secured note, 144A, 9.75%, 3/01/22 | Australia | 25,500,000 | 26,312,812 | |||||||||||
| d | Kerling PLC, senior secured note, 144A, 10.625%, 2/01/17 | United Kingdom | 9,400,000 | EUR | 10,733,012 | |||||||||
| d | Platform Specialty Products Corp., senior note, 144A, 6.50%, 2/01/22 | United States | 3,000,000 | 3,112,500 | ||||||||||
Reynolds Group Issuer Inc./LLC/SA, | ||||||||||||||
first lien, 5.75%, 10/15/20 | United States | 14,200,000 | 14,590,500 | |||||||||||
senior note, 9.00%, 4/15/19 | United States | 5,000,000 | 5,193,750 | |||||||||||
senior note, 9.875%, 8/15/19 | United States | 16,800,000 | 17,671,500 | |||||||||||
senior note, 8.25%, 2/15/21 | United States | 5,200,000 | 5,421,000 | |||||||||||
senior secured note, 6.875%, 2/15/21 | United States | 10,000,000 | 10,475,000 | |||||||||||
|
| |||||||||||||
| 147,543,949 | ||||||||||||||
|
| |||||||||||||
Telecommunication Services 3.8% | ||||||||||||||
| d | Consolidated Communications Inc., senior note, 144A, 6.50%, 10/01/22 | United States | 15,000,000 | 14,531,250 | ||||||||||
Frontier Communications Corp., senior note, | ||||||||||||||
8.50%, 4/15/20 | United States | 8,700,000 | 9,117,600 | |||||||||||
9.25%, 7/01/21 | United States | 7,400,000 | 7,779,250 | |||||||||||
7.125%, 1/15/23 | United States | 7,800,000 | 6,961,500 | |||||||||||
Intelsat Jackson Holdings SA, senior bond, 5.50%, 8/01/23 | Luxembourg | 13,400,000 | 11,867,375 | |||||||||||
Sprint Communications Inc., | ||||||||||||||
11.50%, 11/15/21 | United States | 30,000,000 | 35,400,000 | |||||||||||
senior note, 9.125%, 3/01/17 | United States | 13,300,000 | 14,430,500 | |||||||||||
senior note, 7.00%, 8/15/20 | United States | 7,500,000 | 7,462,500 | |||||||||||
d senior note, 144A, 9.00%, 11/15/18 | United States | 20,000,000 | 22,635,200 | |||||||||||
Sprint Corp., | ||||||||||||||
senior bond, 7.875%, 9/15/23 | United States | 37,500,000 | 36,656,250 | |||||||||||
senior bond, 7.125%, 6/15/24 | United States | 8,200,000 | 7,626,820 | |||||||||||
senior note, 7.625%, 2/15/25 | United States | 15,000,000 | 14,175,000 | |||||||||||
T-Mobile USA Inc., | ||||||||||||||
senior bond, 6.625%, 4/01/23 | United States | 15,000,000 | 15,618,750 | |||||||||||
senior note, 6.542%, 4/28/20 | United States | 11,200,000 | 11,754,288 | |||||||||||
senior note, 6.633%, 4/28/21 | United States | 5,000,000 | 5,200,000 | |||||||||||
senior note, 6.731%, 4/28/22 | United States | 5,000,000 | 5,225,000 | |||||||||||
| d | Telecom Italia SpA, senior note, 144A, 5.303%, 5/30/24 | Italy | 5,000,000 | 5,028,125 | ||||||||||
Verizon Communications Inc., senior note, 5.15%, 9/15/23 | United States | 6,900,000 | 7,572,791 | |||||||||||
| FI-18 | Semiannual Report |
FRANKLIN TEMPLETON VARIABLE INSURANCE PRODUCTS TRUST
STATEMENT OF INVESTMENTS (UNAUDITED)
Franklin Income VIP Fund (continued)
| Country | Principal Amount* | Value | ||||||||||||
Corporate Bonds (continued) | ||||||||||||||
Telecommunication Services (continued) | ||||||||||||||
| d | Wind Acquisition Finance SA, senior note, 144A, 7.375%, 4/23/21 | Italy | 15,000,000 | $ | 15,168,750 | |||||||||
|
| |||||||||||||
| 254,210,949 | ||||||||||||||
|
| |||||||||||||
Utilities 1.5% | ||||||||||||||
Calpine Corp., | ||||||||||||||
senior bond, 5.75%, 1/15/25 | United States | 10,000,000 | 9,762,500 | |||||||||||
senior note, 5.375%, 1/15/23 | United States | 14,500,000 | 14,318,750 | |||||||||||
d senior secured bond, first lien, 144A, 7.875%, 1/15/23 | United States | 3,936,000 | 4,270,560 | |||||||||||
| d | Dynegy Inc., senior note, 144A, | |||||||||||||
6.75%, 11/01/19 | United States | 25,000,000 | 26,137,500 | |||||||||||
7.375%, 11/01/22 | United States | 18,300,000 | 19,260,750 | |||||||||||
| d | InterGen NV, secured bond, 144A, 7.00%, 6/30/23 | Netherlands | 25,000,000 | 22,375,000 | ||||||||||
| d | NRG Yield Operating LLC, senior bond, 144A, 5.375%, 8/15/24 | United States | 6,600,000 | 6,682,500 | ||||||||||
|
| |||||||||||||
| 102,807,560 | ||||||||||||||
|
| |||||||||||||
Total Corporate Bonds (Cost $2,111,539,313) | 2,077,829,103 | |||||||||||||
|
| |||||||||||||
| h,i | Senior Floating Rate Interests 2.2% | |||||||||||||
Consumer Discretionary 0.9% | ||||||||||||||
iHeartCommunications Inc., | ||||||||||||||
Tranche D Term Loan, 6.937%, 1/30/19 | United States | 50,864,664 | 47,092,184 | |||||||||||
Tranche E Term Loan, 7.687%, 7/30/19 | United States | 13,142,769 | 12,345,988 | |||||||||||
|
| |||||||||||||
| 59,438,172 | ||||||||||||||
|
| |||||||||||||
Consumer Staples 0.2% | ||||||||||||||
U.S. Foods Inc., Term Loan, 4.50%, 3/31/19 | United States | 14,700,000 | 14,745,938 | |||||||||||
|
| |||||||||||||
Energy 0.3% | ||||||||||||||
Drillships Financing Holding Inc., Tranche B-1 Term Loan, 6.00%, 3/31/21 | Marshall Islands | 14,811,558 | 12,115,854 | |||||||||||
Fieldwood Energy LLC, Second Lien Loans, 8.375%, 9/30/20 | United States | 10,000,000 | 7,675,000 | |||||||||||
|
| |||||||||||||
| 19,790,854 | ||||||||||||||
|
| |||||||||||||
Industrials 0.4% | ||||||||||||||
CEVA Group PLC, Pre-Funded L/C, 6.50%, 3/19/21 | United States | 5,418,719 | 5,080,049 | |||||||||||
CEVA Intercompany BV, Dutch BV Term Loan, 6.50%, 3/19/21 | Netherlands | 5,642,857 | 5,290,179 | |||||||||||
CEVA Logistics Canada ULC, Canadian Term Loan, 6.50%, 3/19/21 | Canada | 972,906 | 912,100 | |||||||||||
CEVA Logistics U.S. Holdings Inc., U.S. Term Loan, 6.50%, 3/19/21 | United States | 7,783,251 | 7,296,798 | |||||||||||
Navistar Inc., Tranche B Term Loan, 5.75%, 8/17/17 | United States | 6,081,022 | 6,100,025 | |||||||||||
|
| |||||||||||||
| 24,679,151 | ||||||||||||||
|
| |||||||||||||
Information Technology 0.4% | ||||||||||||||
First Data Corp., 2018 New Dollar Term Loan, 3.687%, 3/23/18 | United States | 22,436,455 | 22,392,636 | |||||||||||
SRA International Inc., Term Loan, 6.50%, 7/20/18 | United States | 7,469,520 | 7,497,531 | |||||||||||
|
| |||||||||||||
| 29,890,167 | ||||||||||||||
|
| |||||||||||||
Total Senior Floating Rate Interests (Cost $154,454,175) | 148,544,282 | |||||||||||||
|
| |||||||||||||
| Semiannual Report | FI-19 |
FRANKLIN TEMPLETON VARIABLE INSURANCE PRODUCTS TRUST
STATEMENT OF INVESTMENTS (UNAUDITED)
Franklin Income VIP Fund (continued)
| Country | Shares | Value | ||||||||||||
Escrows and Litigation Trusts 0.0% | ||||||||||||||
| a,j | Motors Liquidation Co., Escrow Account, cvt. pfd., C | United States | 1,400,000 | $ | — | |||||||||
| a,j | SuperMedia Inc., Litigation Trust | United States | 3,472,135 | — | ||||||||||
|
| |||||||||||||
Total Escrows and Litigation Trusts (Cost $101,664) | — | |||||||||||||
|
| |||||||||||||
Total Investments before Short Term Investments (Cost $5,619,009,727) | 5,996,667,454 | |||||||||||||
|
| |||||||||||||
| Principal Amount* | ||||||||||||||
Short Term Investments 7.0% | ||||||||||||||
U.S. Government and Agency Securities 6.9% | ||||||||||||||
| k | FHLB, | |||||||||||||
7/08/15 | United States | 68,600,000 | 68,599,863 | |||||||||||
7/15/15 | United States | 20,000,000 | 19,999,920 | |||||||||||
| k | FHLMC, 7/01/15 | United States | 375,000,000 | 374,999,896 | ||||||||||
|
| |||||||||||||
Total U.S. Government and Agency Securities (Cost $463,598,653) | 463,599,679 | |||||||||||||
|
| |||||||||||||
Total Investments before Repurchase Agreements (Cost $6,082,608,380) | 6,460,267,133 | |||||||||||||
|
| |||||||||||||
Repurchase Agreements (Cost $3,651,357) 0.1% | ||||||||||||||
| l | Joint Repurchase Agreement, 0.095%, 7/01/15 (Maturity Value $3,651,367) | United States | 3,651,357 | 3,651,357 | ||||||||||
BNP Paribas Securities Corp. (Maturity Value $896,045) | ||||||||||||||
HSBC Securities (USA) Inc. (Maturity Value $1,881,696) Merrill Lynch, Pierce, Fenner & Smith Inc. (Maturity Value $873,626) | ||||||||||||||
Collateralized by U.S. Government Agency Securities, 0.000% - 5.50%, 12/01/15 - 6/12/20; U.S. Government Agency Securities, Strips, 6/01/17; kU.S. Treasury Bills, 3/31/16; U.S. Treasury Bonds, 3.125%, 8/15/44; and U.S. Treasury Notes, 1.25% - 1.75%, 1/31/19 - 9/30/19 (valued at $3,725,132) | ||||||||||||||
| m | Investments from Cash Collateral Received for Loaned Securities 0.0%† | |||||||||||||
Repurchase Agreements 0.0%† | ||||||||||||||
| l | Joint Repurchase Agreement, 0.10%, 7/01/15 (Maturity Value $366,478) | United States | 366,477 | 366,477 | ||||||||||
HSBC Securities (USA) Inc., | ||||||||||||||
Collateralized by U.S. Government and Agency Securities, 0.000% - 5.375%, 2/22/17 - 7/15/32; and U.S. Government Agency Strips, 7/15/15 - 1/15/37 (valued at $373,808) | ||||||||||||||
| l | Joint Repurchase Agreement, 0.11%, 7/01/15 (Maturity Value $1,000,003) | United States | 1,000,000 | 1,000,000 | ||||||||||
RBS Securities Inc., | ||||||||||||||
Collateralized by U.S. Treasury Bonds, 3.625%, 2/15/44; and U.S. Treasury Notes, 1.00% - 3.625%, 9/30/15 - 2/15/24 (valued at $1,020,003) | ||||||||||||||
| FI-20 | Semiannual Report |
FRANKLIN TEMPLETON VARIABLE INSURANCE PRODUCTS TRUST
STATEMENT OF INVESTMENTS (UNAUDITED)
Franklin Income VIP Fund (continued)
| Country | Principal Amount* | Value | ||||||||||||
| m | Investments from Cash Collateral Received | |||||||||||||
Repurchase Agreements (continued) | ||||||||||||||
| l | Joint Repurchase Agreement, 0.20%, 7/01/15 (Maturity Value $176,577) | United States | 176,576 | $ | 176,576 | |||||||||
Barclays Capital Inc., | ||||||||||||||
Collateralized by U.S. Treasury Bonds, 3.375%, 5/15/44; U.S. Treasury Notes, 0.50% - 2.75%, 2/28/17 - 2/15/24 (valued at $180,108) | ||||||||||||||
|
| |||||||||||||
Total Investments from Cash Collateral Received for Loaned Securities (Cost $1,543,053) | 1,543,053 | |||||||||||||
|
| |||||||||||||
Total Investments (Cost $6,087,802,790) 96.8% | 6,465,461,543 | |||||||||||||
Other Assets, less Liabilities 3.2% | 211,194,731 | |||||||||||||
|
| |||||||||||||
Net Assets 100.0% | $ | 6,676,656,274 | ||||||||||||
|
| |||||||||||||
See Abbreviations on page FI-33.
*The principal amount is stated in U.S. dollars unless otherwise indicated.
†Rounds to less than 0.1% of net assets.
aNon-income producing.
bSee Note 8 regarding restricted securities.
cSee Note 1(d) regarding equity-linked securities.
dSecurity was purchased pursuant to Rule 144A under the Securities Act of 1933 and may be sold in transactions exempt from registration only to qualified institutional buyers or in a public offering registered under the Securities Act of 1933. These securities have been deemed liquid under guidelines approved by the Trust’s Board of Trustees. At June 30, 2015, the aggregate value of these securities was $1,071,965,900, representing 16.07% of net assets.
eIncome may be received in additional securities and/or cash.
fA portion or all of the security is on loan at June 30, 2015. See Note 1(e).
gPerpetual security with no stated maturity date.
hSee Note 1(f) regarding senior floating rate interests.
iThe coupon rate shown represents the rate at period end.
jSecurity has been deemed illiquid because it may not be able to be sold within seven days.
kThe security is traded on a discount basis with no stated coupon rate.
lSee Note 1(c) regarding joint repurchase agreement.
mSee Note 1(e) regarding securities on loan.
| The accompanying notes are an integral part of these financial statements. | Semiannual Report | FI-21 |
FRANKLIN TEMPLETON VARIABLE INSURANCE PRODUCTS TRUST
Financial Statements
Statement of Assets and Liabilities
June 30, 2015 (unaudited)
| Franklin Income VIP Fund | ||||
Assets: | ||||
Investments in securities: | ||||
Cost - Unaffiliated issuers | $ | 6,084,151,433 | ||
Cost - Repurchase agreements | 3,651,357 | |||
|
| |||
Total cost of investments | $ | 6,087,802,790 | ||
|
| |||
Value - Unaffiliated issuers | $ | 6,461,810,186 | ||
Value - Repurchase agreements | 3,651,357 | |||
|
| |||
Total value of investments (includes securities loaned in the amount of $1,480,449) | 6,465,461,543 | |||
Cash | 125,653,540 | |||
Receivables: | ||||
Investment securities sold | 42,948,261 | |||
Capital shares sold | 2,583,288 | |||
Dividends and interest | 52,715,408 | |||
Other assets | 4,533,261 | |||
|
| |||
Total assets | 6,693,895,301 | |||
|
| |||
Liabilities: | ||||
Payables: | ||||
Capital shares redeemed | 9,679,344 | |||
Management fees | 2,552,363 | |||
Distribution fees | 2,668,999 | |||
Payable upon return of securities loaned | 1,543,053 | |||
Accrued expenses and other liabilities | 795,268 | |||
|
| |||
Total liabilities | 17,239,027 | |||
|
| |||
Net assets, at value | $ | 6,676,656,274 | ||
|
| |||
Net assets consist of: | ||||
Paid-in capital | $ | 6,938,792,614 | ||
Undistributed net investment income | 126,713,749 | |||
Net unrealized appreciation (depreciation) | 377,667,816 | |||
Accumulated net realized gain (loss) | (766,517,905 | ) | ||
|
| |||
Net assets, at value | $ | 6,676,656,274 | ||
|
| |||
| Class 1: | ||||
Net assets, at value | $ | 680,655,927 | ||
|
| |||
Shares outstanding | 43,748,316 | |||
|
| |||
Net asset value and maximum offering price per share | $ | 15.56 | ||
|
| |||
| Class 2: | ||||
Net assets, at value | $ | 5,637,834,126 | ||
|
| |||
Shares outstanding | 373,218,457 | |||
|
| |||
Net asset value and maximum offering price per share | $ | 15.11 | ||
|
| |||
| Class 4: | ||||
Net assets, at value | $ | 358,166,221 | ||
|
| |||
Shares outstanding | 23,227,926 | |||
|
| |||
Net asset value and maximum offering price per share | $ | 15.42 | ||
|
| |||
| FI-22 | Semiannual Report | The accompanying notes are an integral part of these financial statements. |
FRANKLIN TEMPLETON VARIABLE INSURANCE PRODUCTS TRUST
FINANCIAL STATEMENTS
Statement of Operations
for the six months ended June 30, 2015 (unaudited)
| Franklin Income VIP Fund | ||||
Investment income: | ||||
Dividends | $ | 71,180,787 | ||
Interest | 102,322,989 | |||
Income from securities loaned | 298,578 | |||
|
| |||
Total investment income | 173,802,354 | |||
|
| |||
Expenses: | ||||
Management fees (Note 3a) | 15,801,750 | |||
Distribution fees: (Note 3c) | ||||
Class 2 | 7,363,166 | |||
Class 4 | 650,715 | |||
Custodian fees (Note 4) | 47,791 | |||
Reports to shareholders | 278,494 | |||
Professional fees | 67,996 | |||
Trustees’ fees and expenses | 15,022 | |||
Other | 62,928 | |||
|
| |||
Total expenses | 24,287,862 | |||
Expense reductions (Note 4) | (490 | ) | ||
Expenses waived/paid by affiliates (Note 3e) | (2,663 | ) | ||
|
| |||
Net expenses | 24,284,709 | |||
|
| |||
Net investment income | 149,517,645 | |||
|
| |||
Realized and unrealized gains (losses): | ||||
Net realized gain (loss) from: | ||||
Investments | (37,291,402 | ) | ||
Foreign currency transactions | (281,544 | ) | ||
|
| |||
Net realized gain (loss) | (37,572,946 | ) | ||
|
| |||
Net change in unrealized appreciation (depreciation) on: | ||||
Investments | (184,472,641 | ) | ||
Translation of other assets and liabilities denominated in foreign currencies | 248,796 | |||
|
| |||
Net change in unrealized appreciation (depreciation) | (184,223,845 | ) | ||
|
| |||
Net realized and unrealized gain (loss) | (221,796,791 | ) | ||
|
| |||
Net increase (decrease) in net assets resulting from operations | $ | (72,279,146 | ) | |
|
| |||
| The accompanying notes are an integral part of these financial statements. | Semiannual Report | FI-23 |
FRANKLIN TEMPLETON VARIABLE INSURANCE PRODUCTS TRUST
FINANCIAL STATEMENTS
Statements of Changes in Net Assets
| Franklin Income VIP Fund | ||||||||
| Six Months Ended June 30, 2015 (unaudited) | Year Ended December 31, 2014 | |||||||
Increase (decrease) in net assets: | ||||||||
Operations: | ||||||||
Net investment income | $ | 149,517,645 | $ | 300,049,149 | ||||
Net realized gain (loss) | (37,572,946 | ) | 327,875,766 | |||||
Net change in unrealized appreciation (depreciation) | (184,223,845 | ) | (288,670,010 | ) | ||||
|
| |||||||
Net increase (decrease) in net assets resulting from operations | (72,279,146 | ) | 339,254,905 | |||||
|
| |||||||
Distributions to shareholders from: | ||||||||
Net investment income: | ||||||||
Class 1 | (32,196,540 | ) | (37,211,436 | ) | ||||
Class 2 | (260,631,132 | ) | (314,580,044 | ) | ||||
Class 4 | (15,803,892 | ) | (19,237,312 | ) | ||||
|
| |||||||
Total distributions to shareholders | (308,631,564 | ) | (371,028,792 | ) | ||||
|
| |||||||
Capital share transactions: (Note 2) | ||||||||
Class 1 | 5,023,244 | 23,158,016 | ||||||
Class 2 | (62,911,732 | ) | (137,432,835 | ) | ||||
Class 4 | (557,794 | ) | (18,639,257 | ) | ||||
|
| |||||||
Total capital share transactions | (58,446,282 | ) | (132,914,076 | ) | ||||
|
| |||||||
Net increase (decrease) in net assets | (439,356,992 | ) | (164,687,963 | ) | ||||
Net assets: | ||||||||
Beginning of period | 7,116,013,266 | 7,280,701,229 | ||||||
|
| |||||||
End of period | $ | 6,676,656,274 | $ | 7,116,013,266 | ||||
|
| |||||||
Undistributed net investment income included in net assets: | ||||||||
End of period | $ | 126,713,749 | $ | 285,827,668 | ||||
|
| |||||||
| FI-24 | Semiannual Report | The accompanying notes are an integral part of these financial statements. |
FRANKLIN TEMPLETON VARIABLE INSURANCE PRODUCTS TRUST
Notes to Financial Statements (unaudited)
Franklin Income VIP Fund
1. Organization and Significant Accounting Policies
Franklin Templeton Variable Insurance Products Trust (Trust) is registered under the Investment Company Act of 1940 (1940 Act) as an open-end management investment company, consisting of nineteen separate funds and applies the specialized accounting and reporting guidance in U.S. Generally Accepted Accounting Principles (U.S. GAAP). Franklin Income VIP Fund (Fund) is included in this report. The financial statements of the remaining funds in the Trust are presented separately. Shares of the Fund are generally sold only to insurance company separate accounts to fund the benefits of variable life insurance policies or variable annuity contracts. The Fund offers three classes of shares: Class 1, Class 2 and Class 4. Each class of shares differs by its distribution fees, voting rights on matters affecting a single class and its exchange privilege.
The following summarizes the Fund’s significant accounting policies.
a. Financial Instrument Valuation
The Fund’s investments in financial instruments are carried at fair value daily. Fair value is the price that would be received to sell an asset or paid to transfer a liability in an orderly transaction between market participants on the measurement date. The Fund calculates the net asset value (NAV) per share at the close of the New York Stock Exchange (NYSE), generally at 4 p.m. Eastern time (NYSE close) on each day the NYSE is open for trading. Under compliance policies and procedures approved by the Trust’s Board of Trustees (the Board), the Fund’s administrator has responsibility for oversight of valuation, including leading the cross-functional Valuation and Liquidity Oversight Committee (VLOC). The VLOC provides administration and oversight of the Fund’s valuation policies and procedures, which are approved annually by the Board. Among other things, these procedures allow the Fund to utilize independent pricing services, quotations from securities and financial instrument dealers, and other market sources to determine fair value.
Equity securities listed on an exchange or on the NASDAQ National Market System are valued at the last quoted sale price or the official closing price of the day, respectively. Foreign equity securities are valued as of the close of trading on the foreign stock exchange on which the security is primarily traded or as of the NYSE close, whichever is earlier. The value is then converted into its U.S. dollar equivalent at the foreign exchange
rate in effect at the NYSE close on the day that the value of the security is determined. Over-the-counter (OTC) securities are valued within the range of the most recent quoted bid and ask prices. Securities that trade in multiple markets or on multiple exchanges are valued according to the broadest and most representative market. Certain equity securities are valued based upon fundamental characteristics or relationships to similar securities.
Debt securities generally trade in the OTC market rather than on a securities exchange. The Fund’s pricing services use multiple valuation techniques to determine fair value. In instances where sufficient market activity exists, the pricing services may utilize a market-based approach through which quotes from market makers are used to determine fair value. In instances where sufficient market activity may not exist or is limited, the pricing services also utilize proprietary valuation models which may consider market characteristics such as benchmark yield curves, credit spreads, estimated default rates, anticipated market interest rate volatility, coupon rates, anticipated timing of principal repayments, underlying collateral, and other unique security features in order to estimate the relevant cash flows, which are then discounted to calculate the fair value. Securities denominated in a foreign currency are converted into their U.S. dollar equivalent at the foreign exchange rate in effect at the NYSE close on the date that the values of the foreign debt securities are determined. Repurchase agreements are valued at cost, which approximates fair value.
The Fund has procedures to determine the fair value of financial instruments for which market prices are not reliable or readily available. Under these procedures, the VLOC convenes on a regular basis to review such financial instruments and considers a number of factors, including significant unobservable valuation inputs, when arriving at fair value. The VLOC primarily employs a market-based approach which may use related or comparable assets or liabilities, recent transactions, market multiples, book values, and other relevant information for the investment to determine the fair value of the investment. An income-based valuation approach may also be used in which the anticipated future cash flows of the investment are discounted to calculate fair value. Discounts may also be applied due to the nature or duration of any restrictions on the disposition of the investments. Due to the inherent uncertainty of valuations of such investments, the fair values may differ significantly from the values that would have been used had an active market existed. The VLOC employs various methods for calibrating
| Semiannual Report | FI-25 |
FRANKLIN TEMPLETON VARIABLE INSURANCE PRODUCTS TRUST
NOTES TO FINANCIAL STATEMENTS (UNAUDITED)
Franklin Income VIP Fund (continued)
1. Organization and Significant Accounting Policies (continued)
a. Financial Instrument Valuation (continued)
these valuation approaches including a regular review of key inputs and assumptions, transactional back-testing or disposition analysis, and reviews of any related market activity.
Trading in securities on foreign securities stock exchanges and OTC markets may be completed before the daily NYSE close. In addition, trading in certain foreign markets may not take place on every NYSE business day. Occasionally, events occur between the time at which trading in a foreign security is completed and the close of the NYSE that might call into question the reliability of the value of a portfolio security held by the Fund. As a result, differences may arise between the value of the Fund’s portfolio securities as determined at the foreign market close and the latest indications of value at the close of the NYSE. In order to minimize the potential for these differences, the VLOC monitors price movements following the close of trading in foreign stock markets through a series of country specific market proxies (such as baskets of American Depositary Receipts, futures contracts and exchange traded funds). These price movements are measured against established trigger thresholds for each specific market proxy to assist in determining if an event has occurred that may call into question the reliability of the values of the foreign securities held by the Fund. If such an event occurs, the securities may be valued using fair value procedures, which may include the use of independent pricing services.
When the last day of the reporting period is a non-business day, certain foreign markets may be open on those days that the NYSE is closed, which could result in differences between the value of the Fund’s portfolio securities on the last business day and the last calendar day of the reporting period. Any significant security valuation changes due to an open foreign market are adjusted and reflected by the Fund for financial reporting purposes.
b. Foreign Currency Translation
Portfolio securities and other assets and liabilities denominated in foreign currencies are translated into U.S. dollars based on the exchange rate of such currencies against U.S. dollars on the date of valuation. The Fund may enter into foreign currency exchange contracts to facilitate transactions denominated in a foreign currency. Purchases and sales of securities, income and
expense items denominated in foreign currencies are translated into U.S. dollars at the exchange rate in effect on the transaction date. Portfolio securities and assets and liabilities denominated in foreign currencies contain risks that those currencies will decline in value relative to the U.S. dollar. Occasionally, events may impact the availability or reliability of foreign exchange rates used to convert the U.S. dollar equivalent value. If such an event occurs, the foreign exchange rate will be valued at fair value using procedures established and approved by the Board.
The Fund does not separately report the effect of changes in foreign exchange rates from changes in market prices on securities held. Such changes are included in net realized and unrealized gain or loss from investments in the Statement of Operations.
Realized foreign exchange gains or losses arise from sales of foreign currencies, currency gains or losses realized between the trade and settlement dates on securities transactions and the difference between the recorded amounts of dividends, interest, and foreign withholding taxes and the U.S. dollar equivalent of the amounts actually received or paid. Net unrealized foreign exchange gains and losses arise from changes in foreign exchange rates on foreign denominated assets and liabilities other than investments in securities held at the end of the reporting period.
c. Joint Repurchase Agreement
The Fund enters into a joint repurchase agreement whereby its uninvested cash balance is deposited into a joint cash account with other funds managed by the investment manager or an affiliate of the investment manager and is used to invest in one or more repurchase agreements. The value and face amount of the joint repurchase agreement are allocated to the funds based on their pro-rata interest. A repurchase agreement is accounted for as a loan by the Fund to the seller, collateralized by securities which are delivered to the Fund’s custodian. The fair value, including accrued interest, of the initial collateralization is required to be at least 102% of the dollar amount invested by the funds, with the value of the underlying securities marked to market daily to maintain coverage of at least 100%. Repurchase agreements are subject to the terms of Master Repurchase Agreements (MRAs) with approved counterparties (sellers). The MRAs contain various provisions, including but not limited to events of default and maintenance of collateral for repurchase agreements. In the event of default by either the seller or the
| FI-26 | Semiannual Report |
FRANKLIN TEMPLETON VARIABLE INSURANCE PRODUCTS TRUST
NOTES TO FINANCIAL STATEMENTS (UNAUDITED)
Franklin Income VIP Fund (continued)
Fund, certain MRAs may permit the non-defaulting party to net and close-out all transactions, if any, traded under such agreements. The Fund may sell securities it holds as collateral and apply the proceeds towards the repurchase price and any other amounts owed by the seller to the Fund in the event of default by the seller. This could involve costs or delays in addition to a loss on the securities if their value falls below the repurchase price owed by the seller. The joint repurchase agreement held by the Fund at period end, as indicated in the Statement of Investments, had been entered into on June 30, 2015.
d. Equity-Linked Securities
The Fund invests in equity-linked securities. Equity-linked securities are hybrid financial instruments that generally combine both debt and equity characteristics into a single note form. Income received from equity-linked securities is recorded as realized gains in the Statement of Operations and may be based on the performance of an underlying equity security, an equity index, or an option position. The risks of investing in equity-linked securities include unfavorable price movements in the underlying security and the credit risk of the issuing financial institution. There may be no guarantee of a return of principal with equity-linked securities and the appreciation potential may be limited. Equity-linked securities may be more volatile and less liquid than other investments held by the Fund.
e. Securities Lending
The Fund participates in an agency based securities lending program to earn additional income. The Fund receives cash collateral against the loaned securities in an amount equal to at least 102% of the fair value of the loaned securities. Collateral is maintained over the life of the loan in an amount not less than 100% of the fair value of loaned securities, as determined at the close of fund business each day; any additional collateral required due to changes in security values is delivered to the Fund on the next business day. The collateral is deposited into a joint cash account with other funds and is used to invest in a money market fund managed by Franklin Advisers, Inc., an affiliate of the Fund, and/or a joint repurchase agreement. The total cash collateral received at period end was $1,543,053. The Fund may receive income from the investment of cash collateral, in addition to lending fees and rebates paid by the borrower. Income from securities loaned is reported separately in the Statement of Operations. The Fund bears the market risk with respect to the collateral investment, securities loaned, and the risk that the agent may default on its obligations to the Fund. If the borrower defaults on its obligation
to return the securities loaned, the Fund has the right to repurchase the securities in the open market using the collateral received. The securities lending agent has agreed to indemnify the Fund in the event of default by a third party borrower.
f. Senior Floating Rate Interests
The Fund invests in senior secured corporate loans that pay interest at rates which are periodically reset by reference to a base lending rate plus a spread. These base lending rates are generally the prime rate offered by a designated U.S. bank or the London InterBank Offered Rate (LIBOR). Senior secured corporate loans often require prepayment of principal from excess cash flows or at the discretion of the borrower. As a result, actual maturity may be substantially less than the stated maturity. Senior secured corporate loans in which the Fund invests are generally readily marketable, but may be subject to certain restrictions on resale.
g. Income and Deferred Taxes
It is the Fund’s policy to qualify as a regulated investment company under the Internal Revenue Code. The Fund intends to distribute to shareholders substantially all of its taxable income and net realized gains to relieve it from federal income and if applicable, excise taxes. As a result, no provision for U.S. federal income taxes is required.
The Fund may be subject to foreign taxation related to income received, capital gains on the sale of securities and certain foreign currency transactions in the foreign jurisdictions in which it invests. Foreign taxes, if any, are recorded based on the tax regulations and rates that exist in the foreign markets in which the Fund invests. When a capital gain tax is determined to apply, the Fund records an estimated deferred tax liability in an amount that would be payable if the securities were disposed of on the valuation date. As a result of several court cases, in certain countries across the European Union, the Fund has filed additional tax reclaims for previously withheld taxes on dividends earned in those countries. These additional filings are subject to various administrative proceedings by the local jurisdictions’ tax authorities within the European Union, as well as a number of related judicial proceedings. At this time, uncertainty exists as to the ultimate resolution of these proceedings, the likelihood of receipt of these reclaims, and the potential timing of payment, and accordingly, no amounts are reflected in the financial statements.
The Fund recognizes the tax benefits of uncertain tax positions only when the position is “more likely than not” to be sustained
| Semiannual Report | FI-27 |
FRANKLIN TEMPLETON VARIABLE INSURANCE PRODUCTS TRUST
NOTES TO FINANCIAL STATEMENTS (UNAUDITED)
Franklin Income VIP Fund (continued)
1. Organization and Significant Accounting Policies (continued)
g. Income and Deferred Taxes (continued)
upon examination by the tax authorities based on the technical merits of the tax position. As of June 30, 2015, and for all open tax years, the Fund has determined that no liability for unrecognized tax benefits is required in the Fund’s financial statements related to uncertain tax positions taken on a tax return (or expected to be taken on future tax returns). Open tax years are those that remain subject to examination and are based on each tax jurisdiction’s statute of limitation.
h. Security Transactions, Investment Income, Expenses and Distributions
Security transactions are accounted for on trade date. Realized gains and losses on security transactions are determined on a specific identification basis. Interest income and estimated expenses are accrued daily. Amortization of premium and accretion of discount on debt securities are included in interest income. Facility fees are recognized as income over the expected term of the loan. Dividend income is recorded on the ex-dividend date except for certain dividends from foreign securities where the dividend rate is not available. In such cases, the dividend is recorded as soon as the information is received by the Fund. Distributions to shareholders are recorded on the ex-dividend date and are determined according to income tax regulations (tax basis). Distributable earnings determined on a tax basis may differ from earnings recorded in accordance with U.S. GAAP. These differences may be permanent or temporary. Permanent differences are reclassified among capital accounts to reflect their tax character. These reclassifications have no impact on net
assets or the results of operations. Temporary differences are not reclassified, as they may reverse in subsequent periods.
Common expenses incurred by the Trust are allocated among the funds based on the ratio of net assets of each fund to the
combined net assets of the Trust. Fund specific expenses are charged directly to the fund that incurred the expense.
Realized and unrealized gains and losses and net investment income, not including class specific expenses, are allocated daily to each class of shares based upon the relative proportion of net assets of each class. Differences in per share distributions, by class, are generally due to differences in class specific expenses.
i. Accounting Estimates
The preparation of financial statements in accordance with U.S. GAAP requires management to make estimates and assumptions that affect the reported amounts of assets and liabilities at the date of the financial statements and the amounts of income and expenses during the reporting period. Actual results could differ from those estimates.
j. Guarantees and Indemnifications
Under the Trust’s organizational documents, its officers and trustees are indemnified by the Trust against certain liabilities arising out of the performance of their duties to the Trust. Additionally, in the normal course of business, the Trust, on behalf of the Fund, enters into contracts with service providers that contain general indemnification clauses. The Trust’s maximum exposure under these arrangements is unknown as this would involve future claims that may be made against the Trust that have not yet occurred. Currently, the Trust expects the risk of loss to be remote.
2. Shares of Beneficial Interest
At June 30, 2015, there were an unlimited number of shares authorized (without par value). Transactions in the Fund’s shares were as follows:
| Six Months Ended June 30, 2015 | Year Ended December 31, 2014 | |||||||||||||||||
| Shares | Amount | Shares | Amount | |||||||||||||||
| Class 1 Shares: | ||||||||||||||||||
Shares sold | 975,200 | $ | 16,178,567 | 2,465,196 | $ | 42,146,383 | ||||||||||||
Shares issued in reinvestment of distributions | 2,040,338 | 32,196,540 | 2,182,489 | 37,211,436 | ||||||||||||||
Shares redeemed | (2,630,230 | ) | (43,351,863 | ) | (3,341,982 | ) | (56,199,803 | ) | ||||||||||
|
| |||||||||||||||||
Net increase (decrease) | 385,308 | $ | 5,023,244 | 1,305,703 | $ | 23,158,016 | ||||||||||||
|
| |||||||||||||||||
| FI-28 | Semiannual Report |
FRANKLIN TEMPLETON VARIABLE INSURANCE PRODUCTS TRUST
NOTES TO FINANCIAL STATEMENTS (UNAUDITED)
Franklin Income VIP Fund (continued)
| Six Months Ended June 30, 2015 | Year Ended December 31, 2014 | |||||||||||||||||
| Shares | Amount | Shares | Amount | |||||||||||||||
| Class 2 Shares: | ||||||||||||||||||
Shares sold | 13,850,200 | $ | 224,148,778 | 37,540,981 | $ | 619,277,066 | ||||||||||||
Shares issued in reinvestment of distributions | 17,001,378 | 260,631,132 | 18,973,465 | 314,580,044 | ||||||||||||||
Shares redeemed | (34,065,375 | ) | (547,691,642 | ) | (65,224,564 | ) | (1,071,289,945 | ) | ||||||||||
|
| |||||||||||||||||
Net increase (decrease) | (3,213,797 | ) | $ | (62,911,732 | ) | (8,710,118 | ) | $ | (137,432,835 | ) | ||||||||
|
| |||||||||||||||||
| Class 4 Shares: | ||||||||||||||||||
Shares sold | 1,475,765 | $ | 24,222,813 | 3,949,673 | $ | 66,366,931 | ||||||||||||
Shares issued in reinvestment of distributions | 1,010,479 | 15,803,892 | 1,137,629 | 19,237,312 | ||||||||||||||
Shares redeemed | (2,471,651 | ) | (40,584,499 | ) | (6,186,364 | ) | (104,243,500 | ) | ||||||||||
|
| |||||||||||||||||
Net increase (decrease) | 14,593 | $ | (557,794 | ) | (1,099,062 | ) | $ | (18,639,257 | ) | |||||||||
|
| |||||||||||||||||
3. Transactions With Affiliates
Franklin Resources, Inc. is the holding company for various subsidiaries that together are referred to as Franklin Templeton Investments. Certain officers and trustees of the Fund are also officers and/or directors of the following subsidiaries:
| Subsidiary | Affiliation | |
Franklin Advisers, Inc. (Advisers) | Investment manager | |
Franklin Templeton Services, LLC (FT Services) | Administrative manager | |
Franklin Templeton Distributors, Inc. (Distributors) | Principal underwriter | |
Franklin Templeton Investor Services, LLC (Investor Services) | Transfer agent |
a. Management Fees
The Fund pays an investment management fee to Advisers based on the average daily net assets of the Fund as follows:
| Annualized Fee Rate | Net Assets | |
0.625% | Up to and including $100 million | |
0.500% | Over $100 million, up to and including $250 million | |
0.450% | Over $250 million, up to and including $7.5 billion | |
0.440% | Over $7.5 billion, up to and including $10 billion | |
0.430% | Over $10 billion, up to and including $12.5 billion | |
0.420% | Over $12.5 billion, up to and including $15 billion | |
0.400% | In excess of $15 billion |
b. Administrative Fees
Under an agreement with Advisers, FT Services provides administrative services to the Fund. The fee is paid by Advisers based on the Fund’s average daily net assets, and is not an additional expense of the Fund.
c. Distribution Fees
The Board has adopted distribution plans for Class 2 and Class 4 shares pursuant to Rule 12b-1 under the 1940 Act. Under the Fund’s compensation distribution plans, the Fund pays Distributors for costs incurred in connection with the servicing, sale and distribution of the Fund’s shares up to 0.35% per year of its average daily net assets of each class. Some distribution fees are not charged on shares held by affiliates. The Board has agreed to limit the current rate to 0.25% per year for Class 2. The plan year, for purposes of monitoring compliance with the maximum annual plan rates, is February 1 through January 31.
| Semiannual Report | FI-29 |
FRANKLIN TEMPLETON VARIABLE INSURANCE PRODUCTS TRUST
NOTES TO FINANCIAL STATEMENTS (UNAUDITED)
Franklin Income VIP Fund (continued)
3. Transactions With Affiliates (continued)
d. Transfer Agent Fees
Investor Services, under terms of an agreement, performs shareholder servicing for the Fund and is not paid by the Fund for the services.
e. Investments in Institutional Fiduciary Trust Money Market Portfolio
The Fund invests in Institutional Fiduciary Trust Money Market Portfolio (Sweep Money Fund), an affiliated open-end management investment company. Management fees paid by the Fund are waived on assets invested in the Sweep Money Fund, as noted in the Statement of Operations, in an amount not to exceed the management and administrative fees paid directly or indirectly by the Sweep Money Fund.
f. Other Affiliated Transactions
At June 30, 2015, Franklin Templeton Variable Insurance Products Trust – Franklin Founding Funds Allocation VIP Fund owned 5.73% of the Fund’s outstanding shares.
4. Expense Offset Arrangement
The Fund has entered into an arrangement with its custodian whereby credits realized as a result of uninvested cash balances are used to reduce a portion of the Fund’s custodian expenses. During the period ended June 30, 2015, the custodian fees were reduced as noted in the Statement of Operations.
5. Income Taxes
For tax purposes, capital losses may be carried over to offset future capital gains. Capital loss carryforwards with no expiration, if any, must be fully utilized before those losses with expiration dates.
At December 31, 2014, capital loss carryforwards were as follows:
Capital loss carryforwards subject to expiration: | ||||
2016 | $ | 50,251,090 | ||
2017 | 521,405,875 | |||
2018 | 157,561,044 | |||
| �� |
|
| ||
Total capital loss carryforwards | $ | 729,218,009 | ||
|
|
At June 30, 2015, the cost of investments and net unrealized appreciation (depreciation) for income tax purposes were as follows:
Cost of investments | $ | 6,093,599,011 | ||
|
| |||
Unrealized appreciation | $ | 881,755,554 | ||
Unrealized depreciation | (509,893,022 | ) | ||
|
| |||
Net unrealized appreciation (depreciation) | $ | 371,862,532 | ||
|
|
Differences between income and/or capital gains as determined on a book basis and a tax basis are primarily due to differing treatments of bond discounts and premiums and equity-linked securities.
6. Investment Transactions
Purchases and sales of investments (excluding short term securities) for the period ended June 30, 2015, aggregated $723,241,970 and $1,039,264,998, respectively.
| FI-30 | Semiannual Report |
FRANKLIN TEMPLETON VARIABLE INSURANCE PRODUCTS TRUST
NOTES TO FINANCIAL STATEMENTS (UNAUDITED)
Franklin Income VIP Fund (continued)
7. Credit Risk
At June 30, 2015, the Fund had 32.32% of its portfolio invested in high yield, senior secured floating rate notes, or other securities rated below investment grade. These securities may be more sensitive to economic conditions causing greater price volatility and are potentially subject to a greater risk of loss due to default than higher rated securities.
8. Restricted Securities
The Fund invests in securities that are restricted under the Securities Act of 1933 (1933 Act) or which are subject to legal, contractual, or other agreed upon restrictions on resale. Restricted securities are often purchased in private placement transactions, and cannot be sold without prior registration unless the sale is pursuant to an exemption under the 1933 Act. Disposal of these securities may require greater effort and expense, and prompt sale at an acceptable price may be difficult. The Fund may have registration rights for restricted securities. The issuer generally incurs all registration costs.
At June 30, 2015, the Fund held investments in restricted securities, excluding certain securities exempt from registration under the 1933 Act deemed to be liquid, as follows:
| Shares | Issuer | Acquisition Date | Cost | Value | ||||||||||
| 4,929,600 | First Data Holdings Inc., B (Value is 0.37% of Net Assets) | 6/26/14 | $ | 19,718,400 | $ | 24,855,965 | ||||||||
|
| |||||||||||||
9. Credit Facility
The Fund, together with other U.S. registered and foreign investment funds (collectively, Borrowers), managed by Franklin Templeton Investments, are borrowers in a joint syndicated senior unsecured credit facility totaling $2 billion (Global Credit Facility) which matures on February 12, 2016. This Global Credit Facility provides a source of funds to the Borrowers for temporary and emergency purposes, including the ability to meet future unanticipated or unusually large redemption requests.
Under the terms of the Global Credit Facility, the Fund shall, in addition to interest charged on any borrowings made by the Fund and other costs incurred by the Fund, pay its share of fees and expenses incurred in connection with the implementation and maintenance of the Global Credit Facility, based upon its relative share of the aggregate net assets of all of the Borrowers, including an annual commitment fee of 0.07% based upon the unused portion of the Global Credit Facility. These fees are reflected in other expenses in the Statement of Operations. During the period ended June 30, 2015, the Fund did not use the Global Credit Facility.
10. Fair Value Measurements
The Fund follows a fair value hierarchy that distinguishes between market data obtained from independent sources (observable inputs) and the Fund’s own market assumptions (unobservable inputs). These inputs are used in determining the value of the Fund’s financial instruments and are summarized in the following fair value hierarchy:
| • | Level 1 – quoted prices in active markets for identical financial instruments |
| • | Level 2 – other significant observable inputs (including quoted prices for similar financial instruments, interest rates, prepayment speed, credit risk, etc.) |
| • | Level 3 – significant unobservable inputs (including the Fund’s own assumptions in determining the fair value of financial instruments) |
The input levels are not necessarily an indication of the risk or liquidity associated with financial instruments at that level.
For movements between the levels within the fair value hierarchy, the Fund has adopted a policy of recognizing the transfers as of the date of the underlying event which caused the movement.
| Semiannual Report | FI-31 |
FRANKLIN TEMPLETON VARIABLE INSURANCE PRODUCTS TRUST
NOTES TO FINANCIAL STATEMENTS (UNAUDITED)
Franklin Income VIP Fund (continued)
10. Fair Value Measurements (continued)
A summary of inputs used as of June 30, 2015, in valuing the Fund’s assets carried at fair value, is as follows:
| Level 1 | Level 2 | Level 3 | Total | |||||||||||||
| Assets: | ||||||||||||||||
Investments in Securities: | ||||||||||||||||
Equity Investments:a | ||||||||||||||||
Energy | $ | 505,253,612 | $ | 6,240,000 | $ | — | $ | 511,493,612 | ||||||||
Financials | 280,360,077 | 6,175,000 | — | 286,535,077 | ||||||||||||
Industrials | 283,554,771 | 20,912,138 | — | 304,466,909 | ||||||||||||
Information Technology | 193,130,123 | — | 24,855,965 | 217,986,088 | ||||||||||||
All Other Equity Investmentsb | 2,069,398,419 | — | — | 2,069,398,419 | ||||||||||||
Equity-Linked Securities | — | 325,260,488 | — | 325,260,488 | ||||||||||||
Convertible Bonds | — | 55,153,476 | — | 55,153,476 | ||||||||||||
Corporate Bonds | — | 2,077,829,103 | — | 2,077,829,103 | ||||||||||||
Senior Floating Rate Interests | — | 148,544,282 | — | 148,544,282 | ||||||||||||
Escrows and Litigation Trusts | — | — | — | c | — | |||||||||||
Short Term Investments | — | 468,794,089 | — | 468,794,089 | ||||||||||||
|
| |||||||||||||||
Total Investments in Securities | $ | 3,331,697,002 | $ | 3,108,908,576 | $ | 24,855,965 | $ | 6,465,461,543 | ||||||||
|
| |||||||||||||||
aIncludes common, preferred, and convertible preferred stocks as well as other equity investments.
bFor detailed categories, see the accompanying Statement of Investments.
cIncludes securities determined to have no value at June 30, 2015.
A reconciliation of assets in which Level 3 inputs are used in determining fair value is presented when there are significant Level 3 financial instruments at the end of the period.
11. New Accounting Pronouncements
In June 2014, the Financial Accounting Standards Board issued Accounting Standards Update (ASU) No. 2014-11, Transfers and Servicing (Topic 860), Repurchase-to-Maturity Transactions, Repurchase Financings, and Disclosures. The ASU changes the accounting for certain repurchase agreements and expands disclosure requirements related to repurchase agreements, securities lending, repurchase-to-maturity and similar transactions. The ASU is effective for certain transactions accounted for as a sale for interim and annual reporting periods beginning after December 15, 2014, and transactions accounted for as secured borrowings for annual periods beginning after December 15, 2014, and for interim periods beginning after March 15, 2015. Management has reviewed the requirements and believes the adoption of this ASU will not have a material impact on the financial statements.
12. Subsequent Events
The Fund has evaluated subsequent events through the issuance of the financial statements and determined that no events have occurred that require disclosure.
| FI-32 | Semiannual Report |
FRANKLIN TEMPLETON VARIABLE INSURANCE PRODUCTS TRUST
NOTES TO FINANCIAL STATEMENTS (UNAUDITED)
Franklin Income VIP Fund (continued)
Abbreviations
| Currency | Selected Portfolio | |||||||||
| EUR | Euro | ADR | American Depositary Receipt | |||||||
| FHLB | Federal Home Loan Bank | |||||||||
| FHLMC | Federal Home Loan Mortgage Corp. | |||||||||
| FNMA | Federal National Mortgage Association | |||||||||
| FRN | Floating Rate Note | |||||||||
| L/C | Letter of Credit | |||||||||
| MTN | Medium Term Note | |||||||||
| PIK | Payment-In-Kind | |||||||||
| Semiannual Report | FI-33 |
Franklin Large Cap Growth VIP Fund
We are pleased to bring you Franklin Large Cap Growth VIP Fund’s semiannual report for the period ended June 30, 2015.
Class 1 Performance Summary as of June 30, 2015
The Fund’s Class 1 shares delivered a total return of +8.01% for the six-month period ended June 30, 2015.
Performance reflects the Fund’s Class 1 operating expenses, but does not include any contract fees, expenses or sales charges. If they had been included, performance would be lower. These charges and deductions, particularly for variable life policies, can have a significant effect on contract values and insurance benefits. See the contract prospectus for a complete description of these expenses, including sales charges.
Performance data represent past performance, which does not guarantee future results. Investment return and principal value will fluctuate, and you may have a gain or loss when you sell your shares. Current performance may differ from figures shown.
| Semiannual Report | FLG-1 |
FRANKLIN LARGE CAP GROWTH VIP FUND
Fund Goal and Main Investments
Franklin Large Cap Growth VIP Fund seeks capital appreciation. Under normal market conditions, the Fund invests at least 80% of its net assets in investments of large capitalization companies. For this Fund, large capitalization companies are those with market capitalization values within those of the top 50% of companies in the Russell 1000® Index at the time of purchase.1
Fund Risks
All investments involve risks, including possible loss of principal. Stock prices fluctuate, sometimes rapidly and dramatically, due to factors affecting individual companies, particular industries or sectors, or general market conditions. The Fund may focus on particular sectors of the market from time to time, which can carry greater risks of adverse developments in such sectors. Smaller or midsized companies can be particularly sensitive to changing economic conditions, and their prospects for growth are less certain than those of larger, more established companies. Investments in foreign securities may involve special risks including currency fluctuations and economic and political uncertainty. The Fund is actively managed but there is no guarantee that the manager’s investment decisions will produce the desired results. The Fund’s prospectus also includes a description of the main investment risks.
Performance Overview
You can find the Fund’s six-month total return in the Performance Summary. In comparison, the Fund’s benchmark, the Standard & Poor’s® 500 Index (S&P 500®), generated a +1.23% total return.2
Economic and Market Overview
U.S. economic growth was mixed during the six months under review. In 2015’s first quarter, U.S. dollar strength, low energy prices, and a labor dispute at West Coast ports led exports to decline. Lower business investment and state and local government spending also weighed on the economy, while increases in consumer spending, residential investment and private inventory investment offered some support. In the second quarter, business capital spending rebounded and manufacturing and non-manufacturing activities increased, contributing to strong job gains that helped the unemployment rate
decline from 5.6% in December 2014 to 5.3% in June 2015.3 Housing market data were generally encouraging as home sales and prices rose. After a brief, winter slump, retail sales rebounded in the spring as strong employment gains led to broad-based improvement, especially for auto and gasoline sales. Inflation, as measured by the Consumer Price Index, rose during the six months amid generally higher energy prices bouncing from recent lows.
During the six-month period, the Federal Reserve Board (Fed) kept its target interest rate at 0%–0.25% while considering when an increase would be appropriate. The Fed anticipated raising its target rate when it saw further labor market progress and was reasonably confident that inflation would move back to 2% over the medium term. In its June meeting, the Fed lowered
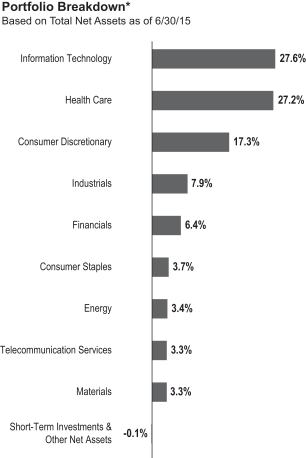
Figures are stated as a percentage of total and may not equal 100% or may be negative due to rounding, use of any derivatives, unsettled trades or other factors.
1. Please see Index Descriptions following the Fund Summaries.
2. Source: Morningstar.
One cannot invest directly in an index, and an index is not representative of the Fund’s portfolio. Please see Index Descriptions following the Fund Summaries.
3. Source: Bureau of Labor Statistics.
| FLG-2 | Semiannual Report |
FRANKLIN LARGE CAP GROWTH VIP FUND
its 2015 economic growth forecast and raised unemployment estimates given the weak start to the year.
Investor confidence grew during the period as corporate profits remained healthy, the Fed showed caution about raising interest rates, economic data in Europe and Japan improved and China introduced more stimulus measures. However, the stock markets endured some sell-offs when many investors reacted to debt negotiations between Greece and its creditors, geopolitical tensions in certain regions, and less robust growth in China. For the six months under review, U.S. stocks, as measured by the S&P 500 and the Dow Jones Industrial Average, rose marginally after both reached all-time highs in May.1
Investment Strategy
We are a research driven, fundamental investor, pursuing a growth strategy. As a “bottom-up” investor focusing primarily on individual securities, we seek companies that have identifiable drivers of future earnings growth and that present, in our opinion, the best trade-off between that potential earnings growth, business and financial risk, and valuation.
Manager’s Discussion
Looking back on the key factors impacting the Fund’s returns during the six months under review, we would like to remind shareholders that our investment strategy is primarily bottom-up and driven by individual stock selection. However, we recognize that a sector-based discussion can be a helpful way to organize a portfolio review of key performance drivers. We employed our long-held strategy: bottom-up, individual-company, fundamental research aimed at opportunistically finding what we believed to be outstanding large-cap companies across all sectors, at valuations we believed understated their fair worth, with future growth potential being a key driver of estimated worth.
During the six months under review, nearly all sectors represented in the Fund’s portfolio contributed to absolute performance. Relative to the S&P 500, key contributors included stock selection and overweightings in health care and consumer discretionary, as well as stock selection in information technology (IT).
Health care was one of the period’s best-performing sectors, driven largely by the biotechnology and pharmaceuticals industries, as many companies received positive responses from the Food and Drug Administration, maintained pricing
| Top 10 Holdings | ||||
| 6/30/15 | ||||
| Company Sector/Industry | % of Total Net Assets | |||
| Allergan PLC Health Care | 4.5% | |||
| Celgene Corp. Health Care | 3.8% | |||
| MasterCard Inc., A Information Technology | 3.8% | |||
| Apple Inc. Information Technology | 3.4% | |||
| SBA Communications Corp. Telecommunication Services | 3.3% | |||
| Amazon.com Inc. Consumer Discretionary | 2.8% | |||
| Facebook Inc., A Information Technology | 2.8% | |||
| Valeant Pharmaceuticals International Inc. Health Care | 2.7% | |||
| Google Inc., A & C Information Technology | 2.6% | |||
| The Walt Disney Co. Consumer Discretionary | 2.6% | |||
The dollar value, number of shares or principal amount, and names of all portfolio holdings are listed in the Fund’s Statement of Investments.
flexibility and generated solid earnings growth. Further benefiting the sector were many companies’ limited exposure to emerging markets, including Greece and China, and consolidation in several industries. Top contributors to Fund performance included Valeant Pharmaceuticals International4 and Allergan PLC (formerly Actavis). Headquartered in Canada, Valeant Pharmaceuticals contributed to relative returns following its report of strong revenue growth in 2015’s first quarter. The company also stated that it expected its acquisition of Salix Pharmaceuticals to expand its product offering in future years. Allergan PLC became one of the world’s top 10 pharmaceutical companies by revenue following its acquisition of Allergan Inc. in March. Allergan PLC reported stronger-than-expected first-quarter earnings, driven by higher generic drug revenues and stronger gross margins across brands. In our view, the company’s broad pipeline, recent and pending launches, and synergies with recent acquisitions could support strong revenue growth.
The Fund’s consumer discretionary holdings performed well overall, as strength in many industries, including athletic apparel, media and Internet retail, more than offset weakness in specialty retail. Amazon.com helped relative results, as the
4. Not part of the index.
| Semiannual Report | FLG-3 |
FRANKLIN LARGE CAP GROWTH VIP FUND
Internet retailer generated year-over-year margin expansion in 2014’s fourth quarter and in 2015’s first quarter. In its first-quarter earnings report, Amazon.com announced a loss that investors appeared to overlook as the company disclosed the revenues and profitability of Amazon Web Services (AWS), its cloud computing platform, for the first time. With robust annual revenue growth and a high profit margin, AWS was more profitable than many analysts had estimated. The company’s core retail business generated strong revenue growth in North America and internationally.
In the IT sector, key contributors included Palo Alto Networks4 and Avago Technologies. Palo Alto Networks, a network security company, demonstrated solid market share gains and fixed operating costs in an environment characterized by cyber attacks and strong enterprise security spending. Avago Technologies is a Singapore-based leading global supplier of high-performance filters for 4G-enabled devices, which is an attractive growth market. The company also supplies high-speed optical communication chips to equipment suppliers.
In contrast, key detractors from the Fund’s relative performance included stock selection in the industrials sector, which underperformed resulting from slower emerging market economic growth, commodity price declines and the negative effects of foreign currency exchange.
Within the industrials sector, key detractors included Precision Castparts,5 American Airlines Group and Kansas City Southern. Precision Castparts continued to struggle amid weak power and energy end markets. Further hurting its shares were a large aerospace customer’s inventory reduction of Precision Castparts’ products and new competitive pressures from Alcoa’s titanium aerospace components business. American Airlines Group suffered from lower airfares as a result of excess capacity, particularly in the Dallas market after the Dallas Love Field Airport opened to national routes. Nonetheless, American Airlines produced record margins and earnings in 2015’s first quarter. We expect the competitive pressure to ease in 2016, allowing further earnings improvement, and believe that many investors would eventually recognize the company’s strong fundamentals. Kansas City Southern was negatively affected by declining coal and oil-related volumes. Additionally, the
company’s Mexico operations were understaffed relative to demand. We believe Kansas City Southern can redeploy assets used for coal and oil transport to the long-term opportunity of transporting more intermodal volumes across the U.S.-Mexico border, a strategy that could potentially help the company grow.
Key individual detractors from relative performance included Las Vegas Sands4,5 and Anadarko Petroleum. Las Vegas Sands is a global gaming company with casino properties in Macau, Singapore and the U.S. The company was hurt primarily by a gaming revenue decline in its largest market, Macau. China’s new government aggressively pursued an anti-corruption campaign and an increasingly restrictive tourist visa program that resulted in lower-than-expected visits and revenue from mainland China. Anadarko Petroleum is an energy exploration and production company with oil and natural gas assets globally. Its shares declined as energy prices fell due to record crude oil and natural gas production levels and weak demand growth in North America and Asia. In our view, Anadarko is a high-quality company with a strong balance sheet, diversified asset base and talented management team. Although it may take time for energy prices to return to 2013 levels, we believe the company is well positioned for long-term growth.
Thank you for your participation in Franklin Large Cap Growth VIP Fund. We look forward to serving your future investment needs.
The foregoing information reflects our analysis, opinions and portfolio holdings as of June 30, 2015, the end of the reporting period. The way we implement our main investment strategies and the resulting portfolio holdings may change depending on factors such as market and economic conditions. These opinions may not be relied upon as investment advice or an offer for a particular security. The information is not a complete analysis of every aspect of any market, country, industry, security or the Fund. Statements of fact are from sources considered reliable, but the investment manager makes no representation or warranty as to their completeness or accuracy. Although historical performance is no guarantee of future results, these insights may help you understand our investment management philosophy.
5. Not held at period-end.
| FLG-4 | Semiannual Report |
FRANKLIN LARGE CAP GROWTH VIP FUND
Class 1 Fund Expenses
As an investor in a variable insurance contract (Contract) that indirectly provides for investment in an underlying mutual fund, you can incur transaction and/or ongoing expenses at both the Fund level and the Contract level.
| • | Transaction expenses can include sales charges (loads) on purchases, surrender fees, transfer fees and premium taxes. |
| • | Ongoing expenses can include management fees, distribution and service (12b-1) fees, contract fees, annual maintenance fees, mortality and expense risk fees and other fees and expenses. All mutual funds and Contracts have some types of ongoing expenses. |
The expenses shown in the table are meant to highlight ongoing expenses at the Fund level only and do not include ongoing expenses at the Contract level, or transaction expenses at either the Fund or Contract levels. While the Fund does not have transaction expenses, if the transaction and ongoing expenses at the Contract level were included, the expenses shown below would be higher. You should consult your Contract prospectus or disclosure document for more information.
The table shows Fund-level ongoing expenses and can help you understand these expenses and compare them with those of other mutual funds offered through the Contract. The table assumes a $1,000 investment held for the six months indicated. Please refer to the Fund prospectus for additional information on operating expenses.
Actual Fund Expenses
The first line (Actual) of the table provides actual account values and expenses. The “Ending Account Value” is derived from the Fund’s actual return, which includes the effect of ongoing Fund expenses, but does not include the effect of ongoing Contract expenses.
You can estimate the Fund-level expenses you incurred during the period by following these steps. Of course, your account value and expenses will differ from those in this illustration:
| 1. | Divide your account value by $1,000. |
If an account had an $8,600 value, then $8,600 ÷ $1,000 = 8.6.
| 2. | Multiply the result by the number under the heading “Fund-Level Expenses Incurred During Period.” |
If Fund-Level Expenses Incurred During Period were $7.50, then 8.6 × $7.50 = $64.50.
In this illustration, the estimated expenses incurred this period at the Fund level are $64.50.
Hypothetical Example for Comparison with Other Mutual Funds
Information in the second line (Hypothetical) of the table can help you compare ongoing expenses of the Fund with those of other mutual funds offered through the Contract. This information may not be used to estimate the actual ending account balance or expenses you incurred during the period. The hypothetical “Ending Account Value” is based on the Fund’s actual expense ratio and an assumed 5% annual rate of return before expenses, which does not represent the Fund’s actual return. The figure under the heading “Fund-Level Expenses Incurred During Period” shows the hypothetical expenses your account would have incurred under this scenario. You can compare this figure with the 5% hypothetical examples that appear in shareholder reports of other funds offered through a Contract.
| Class 1 | Beginning Account Value 1/1/15 | Ending Account Value 6/30/15 | Fund-Level Expenses Incurred During Period* 1/1/15–6/30/15 | |||||||||
Actual | $1,000 | $1,080.10 | $4.07 | |||||||||
Hypothetical (5% return before expenses) | $1,000 | $1,020.88 | $3.96 | |||||||||
*Expenses are calculated using the most recent six-month annualized expense ratio for the Fund’s Class 1 shares (0.79%), which does not include any ongoing expenses of the Contract for which the Fund is an investment option, multiplied by the average account value over the period, multiplied by 181/365 to reflect the one-half year period.
| Semiannual Report | FLG-5 |
FRANKLIN TEMPLETON VARIABLE INSURANCE PRODUCTS TRUST
Financial Highlights
Franklin Large Cap Growth VIP Fund
Six Months Ended (unaudited) | Year Ended December 31, | |||||||||||||||||||||||
| 2014 | 2013 | 2012 | 2011 | 2010 | ||||||||||||||||||||
| Class 1 | ||||||||||||||||||||||||
| Per share operating performance (for a share outstanding throughout the period) | ||||||||||||||||||||||||
Net asset value, beginning of period | $23.26 | $20.91 | $16.43 | $14.75 | $15.07 | $13.62 | ||||||||||||||||||
|
| |||||||||||||||||||||||
| Income from investment operationsa: | ||||||||||||||||||||||||
Net investment income (loss)b | (0.04 | ) | 0.11 | 0.24 | 0.21 | 0.15 | 0.12 | |||||||||||||||||
Net realized and unrealized gains (losses) | 1.92 | 2.54 | 4.48 | 1.65 | (0.33 | ) | 1.48 | |||||||||||||||||
|
| |||||||||||||||||||||||
Total from investment operations | 1.88 | 2.65 | 4.72 | 1.86 | (0.18 | ) | 1.60 | |||||||||||||||||
|
| |||||||||||||||||||||||
| Less distributions from: | ||||||||||||||||||||||||
Net investment income | (0.13 | ) | (0.30 | ) | (0.24 | ) | (0.18 | ) | (0.14 | ) | (0.15 | ) | ||||||||||||
Net realized gains | (6.21 | ) | — | — | — | — | — | |||||||||||||||||
|
| |||||||||||||||||||||||
Total distributions | (6.34 | ) | (0.30 | ) | (0.24 | ) | (0.18 | ) | (0.14 | ) | (0.15 | ) | ||||||||||||
|
| |||||||||||||||||||||||
Net asset value, end of period | $18.80 | $23.26 | $20.91 | $16.43 | $14.75 | $15.07 | ||||||||||||||||||
|
| |||||||||||||||||||||||
Total returnc | 8.01% | 12.74% | 28.92% | 12.65% | (1.22)% | 11.85% | ||||||||||||||||||
| Ratios to average net assetsd | ||||||||||||||||||||||||
Expenses | 0.79% | 0.79% | 0.79% | 0.80% | 0.80% | 0.79% | ||||||||||||||||||
Net investment income (loss) | (0.31)% | 0.50% | 1.27% | 1.31% | 0.99% | 0.86% | ||||||||||||||||||
| Supplemental data | ||||||||||||||||||||||||
Net assets, end of period (000’s) | $54,941 | $54,971 | $54,291 | $46,756 | $48,666 | $58,265 | ||||||||||||||||||
Portfolio turnover rate | 13.05% | 93.53% | 28.27% | 33.88% | 56.61% | 46.75% | ||||||||||||||||||
aThe amount shown for a share outstanding throughout the period may not correlate with the Statement of Operations for the period due to the timing of sales and repurchases of the Fund’s shares in relation to income earned and/or fluctuating fair value of the investments of the Fund.
bBased on average daily shares outstanding.
cTotal return does not include fees, charges or expenses imposed by the variable annuity and life insurance contracts for which Franklin Templeton Variable Insurance Products Trust serves as an underlying investment vehicle. Total return is not annualized for periods less than one year.
dRatios are annualized for periods less than one year.
| FLG-6 | Semiannual Report | The accompanying notes are an integral part of these financial statements. |
FRANKLIN TEMPLETON VARIABLE INSURANCE PRODUCTS TRUST
FINANCIAL HIGHLIGHTS
Franklin Large Cap Growth VIP Fund (continued)
Six Months Ended (unaudited) | Year Ended December 31, | |||||||||||||||||||||||
| 2014 | 2013 | 2012 | 2011 | 2010 | ||||||||||||||||||||
| Class 2 | ||||||||||||||||||||||||
| Per share operating performance (for a share outstanding throughout the period) | ||||||||||||||||||||||||
Net asset value, beginning of period | $22.94 | $20.62 | $16.20 | $14.54 | $14.86 | $13.43 | ||||||||||||||||||
|
| |||||||||||||||||||||||
| Income from investment operationsa: | ||||||||||||||||||||||||
Net investment income (loss)b | (0.07 | ) | 0.06 | 0.19 | 0.17 | 0.11 | 0.08 | |||||||||||||||||
Net realized and unrealized gains (losses) | 1.89 | 2.50 | 4.42 | 1.62 | (0.33 | ) | 1.46 | |||||||||||||||||
|
| |||||||||||||||||||||||
Total from investment operations | 1.82 | 2.56 | 4.61 | 1.79 | (0.22 | ) | 1.54 | |||||||||||||||||
|
| |||||||||||||||||||||||
| Less distributions from: | ||||||||||||||||||||||||
Net investment income | (0.07 | ) | (0.24 | ) | (0.19 | ) | (0.13 | ) | (0.10 | ) | (0.11 | ) | ||||||||||||
Net realized gains | (6.21 | ) | — | — | — | — | — | |||||||||||||||||
|
| |||||||||||||||||||||||
Total distributions | (6.28 | ) | (0.24 | ) | (0.19 | ) | (0.13 | ) | (0.10 | ) | (0.11 | ) | ||||||||||||
|
| |||||||||||||||||||||||
Net asset value, end of period | $18.48 | $22.94 | $20.62 | $16.20 | $14.54 | $14.86 | ||||||||||||||||||
|
| |||||||||||||||||||||||
Total returnc | 7.84% | 12.46% | 28.63% | 12.37% | (1.51)% | 11.59% | ||||||||||||||||||
| Ratios to average net assetsd | ||||||||||||||||||||||||
Expenses | 1.04% | 1.04% | 1.04% | 1.05% | 1.05% | 1.04% | ||||||||||||||||||
Net investment income (loss) | (0.56)% | 0.25% | 1.02% | 1.06% | 0.74% | 0.61% | ||||||||||||||||||
| Supplemental data | ||||||||||||||||||||||||
Net assets, end of period (000’s) | $251,003 | $256,098 | $285,477 | $278,989 | $293,226 | $357,405 | ||||||||||||||||||
Portfolio turnover rate | 13.05% | 93.53% | 28.27% | 33.88% | 56.61% | 46.75% | ||||||||||||||||||
aThe amount shown for a share outstanding throughout the period may not correlate with the Statement of Operations for the period due to the timing of sales and repurchases of the Fund’s shares in relation to income earned and/or fluctuating fair value of the investments of the Fund.
bBased on average daily shares outstanding.
cTotal return does not include fees, charges or expenses imposed by the variable annuity and life insurance contracts for which Franklin Templeton Variable Insurance Products Trust serves as an underlying investment vehicle. Total return is not annualized for periods less than one year.
dRatios are annualized for periods less than one year.
| The accompanying notes are an integral part of these financial statements. | Semiannual Report | FLG-7 |
FRANKLIN TEMPLETON VARIABLE INSURANCE PRODUCTS TRUST
Statement of Investments, June 30, 2015 (unaudited)
Franklin Large Cap Growth VIP Fund
| ||||||||||
| Shares | Value | |||||||||
Common Stocks 99.7% | ||||||||||
Consumer Discretionary 17.3% | ||||||||||
| a | Amazon.com Inc. | 19,938 | $ | 8,654,886 | ||||||
| a | Buffalo Wild Wings Inc. | 9,194 | 1,440,608 | |||||||
| a | Chipotle Mexican Grill Inc. | 3,780 | 2,286,862 | |||||||
| a | DISH Network Corp., A | 25,838 | 1,749,491 | |||||||
Hanesbrands Inc. | 87,380 | 2,911,502 | ||||||||
Harman International Industries Inc. | 28,096 | 3,341,738 | ||||||||
Lowe’s Cos. Inc. | 47,749 | 3,197,751 | ||||||||
NIKE Inc., B | 42,323 | 4,571,730 | ||||||||
| a | The Priceline Group Inc. | 4,665 | 5,371,141 | |||||||
Starbucks Corp. | 123,331 | 6,612,392 | ||||||||
| a | Under Armour Inc., A | 59,625 | 4,975,110 | |||||||
The Walt Disney Co. | 68,827 | 7,855,914 | ||||||||
|
| |||||||||
| 52,969,125 | ||||||||||
|
| |||||||||
Consumer Staples 3.7% | ||||||||||
Constellation Brands Inc., A | 29,101 | 3,376,298 | ||||||||
Mead Johnson Nutrition Co., A | 30,080 | 2,713,818 | ||||||||
| a | Monster Beverage Corp. | 40,358 | 5,408,779 | |||||||
|
| |||||||||
| 11,498,895 | ||||||||||
|
| |||||||||
Energy 3.4% | ||||||||||
Anadarko Petroleum Corp. | 77,163 | 6,023,344 | ||||||||
| a | Diamondback Energy Inc. | 36,566 | 2,756,345 | |||||||
Schlumberger Ltd. | 18,727 | 1,614,080 | ||||||||
|
| |||||||||
| 10,393,769 | ||||||||||
|
| |||||||||
Financials 6.4% | ||||||||||
| a | Affiliated Managers Group Inc. | 16,323 | 3,568,208 | |||||||
American Tower Corp. | 16,834 | 1,570,444 | ||||||||
BlackRock Inc. | 6,585 | 2,278,278 | ||||||||
| a | CBRE Group Inc. | 111,829 | 4,137,673 | |||||||
The Charles Schwab Corp. | 133,409 | 4,355,804 | ||||||||
| a | Signature Bank | 25,314 | 3,705,716 | |||||||
|
| |||||||||
| 19,616,123 | ||||||||||
|
| |||||||||
Health Care 26.8% | ||||||||||
| a | Allergan PLC | 45,768 | 13,888,757 | |||||||
| a | Alnylam Pharmaceuticals Inc. | 12,378 | 1,483,751 | |||||||
| a | Biogen Inc. | 15,792 | 6,379,021 | |||||||
| a | Celgene Corp. | 100,412 | 11,621,183 | |||||||
| a | Celldex Therapeutics Inc. | 74,270 | 1,873,089 | |||||||
| a | Envision Healthcare Holdings Inc. | 83,866 | 3,311,030 | |||||||
Gilead Sciences Inc. | 59,868 | 7,009,345 | ||||||||
| a | HMS Holdings Corp. | 140,695 | 2,415,733 | |||||||
| a | Illumina Inc. | 26,630 | 5,814,927 | |||||||
| a | Impax Laboratories Inc. | 38,707 | 1,777,425 | |||||||
| a | Incyte Corp. | 30,360 | 3,163,816 | |||||||
| a | Jazz Pharmaceuticals PLC | 17,261 | 3,039,144 | |||||||
| a | Karyopharm Therapeutics Inc. | 50,352 | 1,370,078 | |||||||
| a | Medivation Inc. | 20,263 | 2,314,035 | |||||||
Perrigo Co. PLC | 21,036 | 3,888,084 | ||||||||
| a | Puma Biotechnology Inc. | 6,071 | 708,789 | |||||||
| a | Sagent Pharmaceuticals Inc. | 50,504 | 1,227,752 | |||||||
| FLG-8 | Semiannual Report |
FRANKLIN TEMPLETON VARIABLE INSURANCE PRODUCTS TRUST
STATEMENT OF INVESTMENTS (UNAUDITED)
Franklin Large Cap Growth VIP Fund (continued)
| Shares | Value | |||||||||
Common Stocks (continued) | ||||||||||
Health Care (continued) | ||||||||||
| a | Valeant Pharmaceuticals International Inc. | 37,086 | $ | 8,238,655 | ||||||
| a | VWR Corp. | 93,442 | 2,497,705 | |||||||
|
| |||||||||
| 82,022,319 | ||||||||||
|
| |||||||||
Industrials 7.9% | ||||||||||
Allegiant Travel Co. | 13,071 | 2,325,070 | ||||||||
American Airlines Group Inc. | 38,879 | 1,552,633 | ||||||||
| a | DigitalGlobe Inc. | 55,846 | 1,551,960 | |||||||
Flowserve Corp. | 65,412 | 3,444,596 | ||||||||
Hexcel Corp. | 41,475 | 2,062,967 | ||||||||
| a | IHS Inc., A | 31,967 | 4,111,915 | |||||||
Kansas City Southern | 30,696 | 2,799,475 | ||||||||
Union Pacific Corp. | 15,438 | 1,472,322 | ||||||||
| a | United Rentals Inc. | 22,286 | 1,952,699 | |||||||
Univar Inc. | 29,700 | 773,091 | ||||||||
| a | WABCO Holdings Inc. | 16,492 | 2,040,390 | |||||||
|
| |||||||||
| 24,087,118 | ||||||||||
|
| |||||||||
Information Technology 27.6% | ||||||||||
| a | Adobe Systems Inc. | 38,350 | 3,106,734 | |||||||
Apple Inc. | 83,695 | 10,497,445 | ||||||||
Avago Technologies Ltd. (Singapore) | 40,300 | 5,357,079 | ||||||||
| a | BroadSoft Inc. | 64,206 | 2,219,601 | |||||||
| a | Electronic Arts Inc. | 71,876 | 4,779,754 | |||||||
| a | Facebook Inc., A | 98,203 | 8,422,380 | |||||||
| a | FitBit Inc., A | 10,200 | 389,946 | |||||||
| a | Google Inc., A | 8,263 | 4,462,351 | |||||||
| a | Google Inc., C | 6,787 | 3,532,701 | |||||||
| a | LinkedIn Corp., A | 11,489 | 2,373,972 | |||||||
MasterCard Inc., A | 122,762 | 11,475,792 | ||||||||
Microsoft Corp. | 88,971 | 3,928,070 | ||||||||
Mobileye NV | 32,379 | 1,721,591 | ||||||||
| a | NetSuite Inc. | 16,355 | 1,500,571 | |||||||
| a | NXP Semiconductors NV (Netherlands) | 49,376 | 4,848,723 | |||||||
| a | Palo Alto Networks Inc. | 23,413 | 4,090,251 | |||||||
| a | Salesforce.com Inc. | 38,636 | 2,690,225 | |||||||
| a | ServiceNow Inc. | 31,560 | 2,345,224 | |||||||
| a | ViaSat Inc. | 32,752 | 1,973,636 | |||||||
Visa Inc., A | 69,032 | 4,635,499 | ||||||||
|
| |||||||||
| 84,351,545 | ||||||||||
|
| |||||||||
Materials 3.3% | ||||||||||
| a | Axalta Coating Systems Ltd. | 74,389 | 2,460,788 | |||||||
Ecolab Inc. | 21,432 | 2,423,316 | ||||||||
LyondellBasell Industries NV, A | 30,063 | 3,112,122 | ||||||||
Martin Marietta Materials Inc. | 14,267 | 2,018,923 | ||||||||
|
| |||||||||
| 10,015,149 | ||||||||||
|
| |||||||||
Telecommunication Services 3.3% | ||||||||||
| a | SBA Communications Corp. | 88,056 | 10,123,798 | |||||||
|
| |||||||||
Total Common Stocks (Cost $216,355,725) | 305,077,841 | |||||||||
|
| |||||||||
| Semiannual Report | FLG-9 |
FRANKLIN TEMPLETON VARIABLE INSURANCE PRODUCTS TRUST
STATEMENT OF INVESTMENTS (UNAUDITED)
Franklin Large Cap Growth VIP Fund (continued)
| Shares | Value | |||||||||
Convertible Preferred Stocks (Cost $1,250,406) 0.4% | ||||||||||
Health Care 0.4% | ||||||||||
| a,b | Acerta Pharma BV, 8.00%, cvt. pfd., B, 144A (Netherlands) | 108,731 | $ | 1,250,406 | ||||||
|
| |||||||||
Total Investments before Short Term Investments (Cost $217,606,131) | 306,328,247 | |||||||||
|
| |||||||||
| Principal Amount | ||||||||||
Short Term Investments (Cost $427,180) 0.2% | ||||||||||
Repurchase Agreements 0.2% | ||||||||||
| c | Joint Repurchase Agreement, 0.095%, 7/01/15 (Maturity Value $427,181) | $ | 427,180 | 427,180 | ||||||
BNP Paribas Securities Corp. (Maturity Value $104,830) HSBC Securities (USA) Inc. (Maturity Value $220,144) Merrill Lynch, Pierce, Fenner & Smith Inc. (Maturity Value $102,207) | ||||||||||
Collateralized by U.S. Government Agency Securities, 0.000% - 5.50%, 12/01/15 - 6/12/20; U.S. Government Agency Securities, Strips, 6/01/17; | ||||||||||
|
| |||||||||
Total Investments (Cost $218,033,311) 100.3% | 306,755,427 | |||||||||
Other Assets, less Liabilities (0.3)% | (812,141 | ) | ||||||||
|
| |||||||||
Net Assets 100.0% | $ | 305,943,286 | ||||||||
|
| |||||||||
aNon-income producing.
bSee Note 7 regarding restricted securities.
cSee Note 1(c) regarding joint repurchase agreement.
dThe security is traded on a discount basis with no stated coupon rate.
| FLG-10 | Semiannual Report | The accompanying notes are an integral part of these financial statements. |
FRANKLIN TEMPLETON VARIABLE INSURANCE PRODUCTS TRUST
Financial Statements
Statement of Assets and Liabilities
June 30, 2015 (unaudited)
| Franklin Large Cap Growth VIP Fund | ||||
Assets: | ||||
Investments in securities: | ||||
Cost - Unaffiliated issuers | $ | 217,606,131 | ||
Cost - Repurchase agreements | 427,180 | |||
|
| |||
Total cost of investments | $ | 218,033,311 | ||
|
| |||
Value - Unaffiliated issuers | $ | 306,328,247 | ||
Value - Repurchase agreements | 427,180 | |||
|
| |||
Total value of investments | 306,755,427 | |||
Receivables: | ||||
Investment securities sold | 506,142 | |||
Capital shares sold | 36,718 | |||
Dividends | 103,011 | |||
Other assets | 174,359 | |||
|
| |||
Total assets | 307,575,657 | |||
|
| |||
Liabilities: | ||||
Payables: | ||||
Investment securities purchased | 980,355 | |||
Capital shares redeemed | 277,829 | |||
Management fees | 190,427 | |||
Distribution fees | 106,187 | |||
Accrued expenses and other liabilities | 77,573 | |||
|
| |||
Total liabilities | 1,632,371 | |||
|
| |||
Net assets, at value | $ | 305,943,286 | ||
|
| |||
Net assets consist of: | ||||
Paid-in capital | $ | 213,772,103 | ||
Undistributed net investment income (loss) | (781,872 | ) | ||
Net unrealized appreciation (depreciation) | 88,722,116 | |||
Accumulated net realized gain (loss) | 4,230,939 | |||
|
| |||
Net assets, at value | $ | 305,943,286 | ||
|
| |||
| Class 1: | ||||
Net assets, at value | $ | 54,940,570 | ||
|
| |||
Shares outstanding | 2,922,919 | |||
|
| |||
Net asset value and maximum offering price per share | $ | 18.80 | ||
|
| |||
| Class 2: | ||||
Net assets, at value | $ | 251,002,716 | ||
|
| |||
Shares outstanding | 13,582,937 | |||
|
| |||
Net asset value and maximum offering price per share | $ | 18.48 | ||
|
| |||
| The accompanying notes are an integral part of these financial statements. | Semiannual Report | FLG-11 |
FRANKLIN TEMPLETON VARIABLE INSURANCE PRODUCTS TRUST
FINANCIAL STATEMENTS
Statement of Operations
for the six months ended June 30, 2015 (unaudited)
| Franklin Large Cap Growth VIP Fund | ||||
Investment income: | ||||
Dividends | $ | 738,839 | ||
Interest | 624 | |||
|
| |||
Total investment income | 739,463 | |||
|
| |||
Expenses: | ||||
Management fees (Note 3a) | 1,165,330 | |||
Distribution fees - Class 2 (Note 3c) | 318,279 | |||
Custodian fees (Note 4) | 1,593 | |||
Reports to shareholders | 31,142 | |||
Professional fees | 20,264 | |||
Trustees’ fees and expenses | 669 | |||
Other | 5,056 | |||
|
| |||
Total expenses | 1,542,333 | |||
|
| |||
Net investment income (loss) | (802,870 | ) | ||
|
| |||
Realized and unrealized gains (losses): | ||||
Net realized gain (loss) from Investments | 4,509,946 | |||
|
| |||
Net change in unrealized appreciation (depreciation) on investments | 20,221,581 | |||
|
| |||
Net realized and unrealized gain (loss) | 24,731,527 | |||
|
| |||
Net increase (decrease) in net assets resulting from operations | $ | 23,928,657 | ||
|
| |||
| FLG-12 | Semiannual Report | The accompanying notes are an integral part of these financial statements. |
FRANKLIN TEMPLETON VARIABLE INSURANCE PRODUCTS TRUST
FINANCIAL STATEMENTS
Statements of Changes in Net Assets
| Franklin Large Cap Growth VIP Fund | ||||||||
| Six Months Ended June 30, 2015 (unaudited) | Year Ended December 31, 2014 | |||||||
Increase (decrease) in net assets: | ||||||||
Operations: | ||||||||
Net investment income (loss) | $ | (802,870 | ) | $ | 944,121 | |||
Net realized gain (loss) | 4,509,946 | 106,966,453 | ||||||
Net change in unrealized appreciation (depreciation) | 20,221,581 | (70,957,037 | ) | |||||
|
| |||||||
Net increase (decrease) in net assets resulting from operations | 23,928,657 | 36,953,537 | ||||||
|
| |||||||
Distributions to shareholders from: | ||||||||
Net investment income: | ||||||||
Class 1 | (286,901 | ) | (729,509 | ) | ||||
Class 2 | (675,379 | ) | (2,842,675 | ) | ||||
Net realized gains: | ||||||||
Class 1 | (13,634,161 | ) | — | |||||
Class 2 | (63,414,142 | ) | — | |||||
|
| |||||||
Total distributions to shareholders | (78,010,583 | ) | (3,572,184 | ) | ||||
|
| |||||||
Capital share transactions: (Note 2) | ||||||||
Class 1 | 9,613,908 | (5,100,024 | ) | |||||
Class 2 | 39,343,050 | (56,981,465 | ) | |||||
|
| |||||||
Total capital share transactions | 48,956,958 | (62,081,489 | ) | |||||
|
| |||||||
Net increase (decrease) in net assets | (5,124,968 | ) | (28,700,136 | ) | ||||
Net assets: | ||||||||
Beginning of period | 311,068,254 | 339,768,390 | ||||||
|
| |||||||
End of period | $ | 305,943,286 | $ | 311,068,254 | ||||
|
| |||||||
Undistributed net investment income (loss) included in net assets: | ||||||||
End of period | $ | (781,872 | ) | $ | 983,278 | |||
|
| |||||||
| The accompanying notes are an integral part of these financial statements. | Semiannual Report | FLG-13 |
FRANKLIN TEMPLETON VARIABLE INSURANCE PRODUCTS TRUST
Notes to Financial Statements (unaudited)
Franklin Large Cap Growth VIP Fund
1. Organization and Significant Accounting Policies
Franklin Templeton Variable Insurance Products Trust (Trust) is registered under the Investment Company Act of 1940 (1940 Act) as an open-end management investment company, consisting of nineteen separate funds and applies the specialized accounting and reporting guidance in U.S. Generally Accepted Accounting Principles (U.S. GAAP). Franklin Large Cap Growth VIP Fund (Fund) is included in this report. The financial statements of the remaining funds in the Trust are presented separately. Shares of the Fund are generally sold only to insurance company separate accounts to fund the benefits of variable life insurance policies or variable annuity contracts. At June 30, 2015, 46.40% of the Fund’s shares were held through one insurance company. Investment activities of these insurance company separate accounts could have a material impact on the Fund. The Fund offers two classes of shares: Class 1 and Class 2. Each class of shares differs by its distribution fees, voting rights on matters affecting a single class and its exchange privilege.
The following summarizes the Fund’s significant accounting policies.
a. Financial Instrument Valuation
The Fund’s investments in financial instruments are carried at fair value daily. Fair value is the price that would be received to sell an asset or paid to transfer a liability in an orderly transaction between market participants on the measurement date. The Fund calculates the net asset value per share at the close of the New York Stock Exchange (NYSE), generally at 4 p.m. Eastern time (NYSE close) on each day the NYSE is open for trading. Under compliance policies and procedures approved by the Trust’s Board of Trustees (the Board), the Fund’s administrator has responsibility for oversight of valuation, including leading the cross-functional Valuation and Liquidity Oversight Committee (VLOC). The VLOC provides administration and oversight of the Fund’s valuation policies and procedures, which are approved annually by the Board. Among other things, these procedures allow the Fund to utilize independent pricing services, quotations from securities and financial instrument dealers, and other market sources to determine fair value.
Equity securities listed on an exchange or on the NASDAQ National Market System are valued at the last quoted sale price or the official closing price of the day, respectively. Foreign equity securities are valued as of the close of trading on the foreign stock exchange on which the security is primarily traded or
as of the NYSE close, whichever is earlier. The value is then converted into its U.S. dollar equivalent at the foreign exchange rate in effect at the NYSE close on the day that the value of the security is determined. Over-the-counter (OTC) securities are valued within the range of the most recent quoted bid and ask prices. Securities that trade in multiple markets or on multiple exchanges are valued according to the broadest and most representative market. Certain equity securities are valued based upon fundamental characteristics or relationships to similar securities. Repurchase agreements are valued at cost, which approximates fair value.
The Fund has procedures to determine the fair value of financial instruments for which market prices are not reliable or readily available. Under these procedures, the VLOC convenes on a regular basis to review such financial instruments and considers a number of factors, including significant unobservable valuation inputs, when arriving at fair value. The VLOC primarily employs a market-based approach which may use related or comparable assets or liabilities, recent transactions, market multiples, book values, and other relevant information for the investment to determine the fair value of the investment. An income-based valuation approach may also be used in which the anticipated future cash flows of the investment are discounted to calculate fair value. Discounts may also be applied due to the nature or duration of any restrictions on the disposition of the investments. Due to the inherent uncertainty of valuations of such investments, the fair values may differ significantly from the values that would have been used had an active market existed. The VLOC employs various methods for calibrating these valuation approaches including a regular review of key inputs and assumptions, transactional back-testing or disposition analysis, and reviews of any related market activity.
Trading in securities on foreign securities stock exchanges and OTC markets may be completed before the daily NYSE close. In addition, trading in certain foreign markets may not take place on every NYSE business day. Occasionally, events occur between the time at which trading in a foreign security is completed and the close of the NYSE that might call into question the reliability of the value of a portfolio security held by the Fund. As a result, differences may arise between the value of the Fund’s portfolio securities as determined at the foreign market close and the latest indications of value at the close of the NYSE. In order to minimize the potential for these differences, the VLOC monitors price movements following the close of trading in foreign stock markets through a series of country
| FLG-14 | Semiannual Report |
FRANKLIN TEMPLETON VARIABLE INSURANCE PRODUCTS TRUST
NOTES TO FINANCIAL STATEMENTS (UNAUDITED)
Franklin Large Cap Growth VIP Fund (continued)
specific market proxies (such as baskets of American Depositary Receipts, futures contracts and exchange traded funds). These price movements are measured against established trigger thresholds for each specific market proxy to assist in determining if an event has occurred that may call into question the reliability of the values of the foreign securities held by the Fund. If such an event occurs, the securities may be valued using fair value procedures, which may include the use of independent pricing services.
When the last day of the reporting period is a non-business day, certain foreign markets may be open on those days that the NYSE is closed, which could result in differences between the value of the Fund’s portfolio securities on the last business day and the last calendar day of the reporting period. Any significant security valuation changes due to an open foreign market are adjusted and reflected by the Fund for financial reporting purposes.
b. Foreign Currency Translation
Portfolio securities and other assets and liabilities denominated in foreign currencies are translated into U.S. dollars based on the exchange rate of such currencies against U.S. dollars on the date of valuation. The Fund may enter into foreign currency exchange contracts to facilitate transactions denominated in a foreign currency. Purchases and sales of securities, income and expense items denominated in foreign currencies are translated into U.S. dollars at the exchange rate in effect on the transaction date. Portfolio securities and assets and liabilities denominated in foreign currencies contain risks that those currencies will decline in value relative to the U.S. dollar. Occasionally, events may impact the availability or reliability of foreign exchange rates used to convert the U.S. dollar equivalent value. If such an event occurs, the foreign exchange rate will be valued at fair value using procedures established and approved by the Board.
The Fund does not separately report the effect of changes in foreign exchange rates from changes in market prices on securities held. Such changes are included in net realized and unrealized gain or loss from investments in the Statement of Operations.
Realized foreign exchange gains or losses arise from sales of foreign currencies, currency gains or losses realized between the trade and settlement dates on securities transactions and the difference between the recorded amounts of dividends, interest, and foreign withholding taxes and the U.S. dollar equivalent of the amounts actually received or paid. Net unrealized foreign
exchange gains and losses arise from changes in foreign exchange rates on foreign denominated assets and liabilities other than investments in securities held at the end of the reporting period.
c. Joint Repurchase Agreement
The Fund enters into a joint repurchase agreement whereby its uninvested cash balance is deposited into a joint cash account with other funds managed by the investment manager or an affiliate of the investment manager and is used to invest in one or more repurchase agreements. The value and face amount of the joint repurchase agreement are allocated to the funds based on their pro-rata interest. A repurchase agreement is accounted for as a loan by the Fund to the seller, collateralized by securities which are delivered to the Fund’s custodian. The fair value, including accrued interest, of the initial collateralization is required to be at least 102% of the dollar amount invested by the funds, with the value of the underlying securities marked to market daily to maintain coverage of at least 100%. Repurchase agreements are subject to the terms of Master Repurchase Agreements (MRAs) with approved counterparties (sellers). The MRAs contain various provisions, including but not limited to events of default and maintenance of collateral for repurchase agreements. In the event of default by either the seller or the Fund, certain MRAs may permit the non-defaulting party to net and close-out all transactions, if any, traded under such agreements. The Fund may sell securities it holds as collateral and apply the proceeds towards the repurchase price and any other amounts owed by the seller to the Fund in the event of default by the seller. This could involve costs or delays in addition to a loss on the securities if their value falls below the repurchase price owed by the seller. The joint repurchase agreement held by the Fund at period end, as indicated in the Statement of Investments, had been entered into on June 30, 2015.
d. Income and Deferred Taxes
It is the Fund’s policy to qualify as a regulated investment company under the Internal Revenue Code. The Fund intends to distribute to shareholders substantially all of its taxable income and net realized gains to relieve it from federal income and if applicable, excise taxes. As a result, no provision for U.S. federal income taxes is required.
The Fund may be subject to foreign taxation related to income received, capital gains on the sale of securities and certain foreign currency transactions in the foreign jurisdictions in
| Semiannual Report | FLG-15 |
FRANKLIN TEMPLETON VARIABLE INSURANCE PRODUCTS TRUST
NOTES TO FINANCIAL STATEMENTS (UNAUDITED)
Franklin Large Cap Growth VIP Fund (continued)
1. Organization and Significant Accounting Policies (continued)
d. Income and Deferred Taxes (continued)
which it invests. Foreign taxes, if any, are recorded based on the tax regulations and rates that exist in the foreign markets in which the Fund invests. When a capital gain tax is determined to apply the Fund records an estimated deferred tax liability in an amount that would be payable if the securities were disposed of on the valuation date.
The Fund recognizes the tax benefits of uncertain tax positions only when the position is “more likely than not” to be sustained upon examination by the tax authorities based on the technical merits of the tax position. As of June 30, 2015, and for all open tax years, the Fund has determined that no liability for unrecognized tax benefits is required in the Fund’s financial statements related to uncertain tax positions taken on a tax return (or expected to be taken on future tax returns). Open tax years are those that remain subject to examination and are based on each tax jurisdiction’s statute of limitation.
e. Security Transactions, Investment Income, Expenses and Distributions
Security transactions are accounted for on trade date. Realized gains and losses on security transactions are determined on a specific identification basis. Interest income and estimated expenses are accrued daily. Dividend income is recorded on the ex-dividend date except for certain dividends from foreign securities where the dividend rate is not available. In such cases, the dividend is recorded as soon as the information is received by the Fund. Distributions to shareholders are recorded on the ex-dividend date and are determined according to income tax regulations (tax basis). Distributable earnings determined on a tax basis may differ from earnings recorded in accordance with U.S. GAAP. These differences may be permanent or temporary.
Permanent differences are reclassified among capital accounts to reflect their tax character. These reclassifications have no impact on net assets or the results of operations. Temporary differences are not reclassified, as they may reverse in subsequent periods.
Common expenses incurred by the Trust are allocated among the funds based on the ratio of net assets of each fund to the combined net assets of the Trust. Fund specific expenses are charged directly to the fund that incurred the expense.
Realized and unrealized gains and losses and net investment income, not including class specific expenses, are allocated daily to each class of shares based upon the relative proportion of net assets of each class. Differences in per share distributions, by class, are generally due to differences in class specific expenses.
f. Accounting Estimates
The preparation of financial statements in accordance with U.S. GAAP requires management to make estimates and assumptions that affect the reported amounts of assets and liabilities at the date of the financial statements and the amounts of income and expenses during the reporting period. Actual results could differ from those estimates.
g. Guarantees and Indemnifications
Under the Trust’s organizational documents, its officers and trustees are indemnified by the Trust against certain liabilities arising out of the performance of their duties to the Trust. Additionally, in the normal course of business, the Trust, on behalf of the Fund, enters into contracts with service providers that contain general indemnification clauses. The Trust’s maximum exposure under these arrangements is unknown as this would involve future claims that may be made against the Trust that have not yet occurred. Currently, the Trust expects the risk of loss to be remote.
| FLG-16 | Semiannual Report |
FRANKLIN TEMPLETON VARIABLE INSURANCE PRODUCTS TRUST
NOTES TO FINANCIAL STATEMENTS (UNAUDITED)
Franklin Large Cap Growth VIP Fund (continued)
2. Shares of Beneficial Interest
At June 30, 2015, there were an unlimited number of shares authorized (without par value). Transactions in the Fund’s shares were as follows:
| Six Months Ended June 30, 2015 | Year Ended December 31, 2014 | |||||||||||||||||
| Shares | Amount | Shares | Amount | |||||||||||||||
| Class 1 Shares: | ||||||||||||||||||
Shares sold | 3,770 | $ | 92,076 | 23,998 | $ | 507,108 | ||||||||||||
Shares issued in reinvestment of distributions | 740,482 | 13,921,062 | 33,235 | 729,509 | ||||||||||||||
Shares redeemed | (184,249 | ) | (4,399,230 | ) | (290,268 | ) | (6,336,641 | ) | ||||||||||
|
| |||||||||||||||||
Net increase (decrease) | 560,003 | $ | 9,613,908 | (233,035 | ) | $ | (5,100,024 | ) | ||||||||||
|
| |||||||||||||||||
| Class 2 Shares: | ||||||||||||||||||
Shares sold | 349,113 | $ | 8,352,264 | 570,172 | $ | 12,631,684 | ||||||||||||
Shares issued in reinvestment of distributions | 3,468,048 | 64,089,521 | 131,120 | 2,842,675 | ||||||||||||||
Shares redeemed | (1,398,202 | ) | (33,098,735 | ) | (3,381,155 | ) | (72,455,824 | ) | ||||||||||
|
| |||||||||||||||||
Net increase (decrease) | 2,418,959 | $ | 39,343,050 | (2,679,863 | ) | $ | (56,981,465 | ) | ||||||||||
|
| |||||||||||||||||
3. Transactions With Affiliates
Franklin Resources, Inc. is the holding company for various subsidiaries that together are referred to as Franklin Templeton Investments. Certain officers and trustees of the Fund are also officers and/or directors of the following subsidiaries:
| Subsidiary | Affiliation | |
Franklin Advisers, Inc. (Advisers) | Investment manager | |
Franklin Templeton Services, LLC (FT Services) | Administrative manager | |
Franklin Templeton Distributors, Inc. (Distributors) | Principal underwriter | |
Franklin Templeton Investor Services, LLC (Investor Services) | Transfer agent |
a. Management Fees
The Fund pays an investment management fee to Advisers based on the average daily net assets of the Fund as follows:
| Annualized Fee Rate | Net Assets | |
0.750% | Up to and including $500 million | |
0.625% | Over $500 million, up to and including $1 billion | |
0.500% | In excess of $1 billion |
b. Administrative Fees
Under an agreement with Advisers, FT Services provides administrative services to the Fund. The fee is paid by Advisers based on the Fund’s average daily net assets, and is not an additional expense of the Fund.
c. Distribution Fees
The Board has adopted a distribution plan for Class 2 shares pursuant to Rule 12b-1 under the 1940 Act. Under the Fund’s compensation distribution plan, the Fund pays Distributors for costs incurred in connection with the servicing, sale and distribution of the Fund’s shares up to 0.35% per year of its average daily net assets. Some distribution fees are not charged on shares held by affiliates. The Board has agreed to limit the current rate to 0.25% per year for Class 2. The plan year, for purposes of monitoring compliance with the maximum annual plan rate, is February 1 through January 31.
| Semiannual Report | FLG-17 |
FRANKLIN TEMPLETON VARIABLE INSURANCE PRODUCTS TRUST
NOTES TO FINANCIAL STATEMENTS (UNAUDITED)
Franklin Large Cap Growth VIP Fund (continued)
3. Transactions With Affiliates (continued)
d. Transfer Agent Fees
Investor Services, under terms of an agreement, performs shareholder servicing for the Fund and is not paid by the Fund for the services.
4. Expense Offset Arrangement
The Fund has entered into an arrangement with its custodian whereby credits realized as a result of uninvested cash balances are used to reduce a portion of the Fund’s custodian expenses. During the period ended June 30, 2015, there were no credits earned.
5. Income Taxes
At June 30, 2015, the cost of investments and net unrealized appreciation (depreciation) for income tax purposes were as follows:
Cost of investments | $ | 218,371,240 | ||
|
| |||
Unrealized appreciation | $ | 92,695,234 | ||
Unrealized depreciation | (4,311,047 | ) | ||
|
| |||
Net unrealized appreciation (depreciation) | $ | 88,384,187 | ||
|
|
Differences between income and/or capital gains as determined on a book basis and a tax basis are primarily due to differing treatment of wash sales.
6. Investment Transactions
Purchases and sales of investments (excluding short term securities) for the period ended June 30, 2015, aggregated $40,429,745 and $68,095,023, respectively.
7. Restricted Securities
The Fund invests in securities that are restricted under the Securities Act of 1933 (1933 Act) or which are subject to legal, contractual, or other agreed upon restrictions on resale. Restricted securities are often purchased in private placement transactions, and cannot be sold without prior registration unless the sale is pursuant to an exemption under the 1933 Act. Disposal of these securities may require greater effort and expense, and prompt sale at an acceptable price may be difficult. The Fund may have registration rights for restricted securities. The issuer generally incurs all registration costs.
At June 30, 2015, the Fund held investments in restricted securities, excluding certain securities exempt from registration under the 1933 Act deemed to be liquid, as follows:
| Shares | Issuer | Acquisition Date | Cost | Value | ||||||||||
| 108,731 | Acerta Pharma BV, 8.00%, cvt. pfd., B, 144A (Value is 0.41% of Net Assets) | 5/06/15 | $ | 1,250,406 | $ | 1,250,406 | ||||||||
|
| |||||||||||||
8. Credit Facility
The Fund, together with other U.S. registered and foreign investment funds (collectively, Borrowers), managed by Franklin Templeton Investments, are borrowers in a joint syndicated senior unsecured credit facility totaling $2 billion (Global Credit Facility) which matures on February 12, 2016. This Global Credit Facility provides a source of funds to the Borrowers for temporary and emergency purposes, including the ability to meet future unanticipated or unusually large redemption requests.
| FLG-18 | Semiannual Report |
FRANKLIN TEMPLETON VARIABLE INSURANCE PRODUCTS TRUST
NOTES TO FINANCIAL STATEMENTS (UNAUDITED)
Franklin Large Cap Growth VIP Fund (continued)
Under the terms of the Global Credit Facility, the Fund shall, in addition to interest charged on any borrowings made by the Fund and other costs incurred by the Fund, pay its share of fees and expenses incurred in connection with the implementation and maintenance of the Global Credit Facility, based upon its relative share of the aggregate net assets of all of the Borrowers, including an annual commitment fee of 0.07% based upon the unused portion of the Global Credit Facility. These fees are reflected in other expenses in the Statement of Operations. During the period ended June 30, 2015, the Fund did not use the Global Credit Facility.
9. Fair Value Measurements
The Fund follows a fair value hierarchy that distinguishes between market data obtained from independent sources (observable inputs) and the Fund’s own market assumptions (unobservable inputs). These inputs are used in determining the value of the Fund’s financial instruments and are summarized in the following fair value hierarchy:
| • | Level 1 – quoted prices in active markets for identical financial instruments |
| • | Level 2 – other significant observable inputs (including quoted prices for similar financial instruments, interest rates, prepayment speed, credit risk, etc.) |
| • | Level 3 – significant unobservable inputs (including the Fund’s own assumptions in determining the fair value of financial instruments) |
The input levels are not necessarily an indication of the risk or liquidity associated with financial instruments at that level.
For movements between the levels within the fair value hierarchy, the Fund has adopted a policy of recognizing the transfers as of the date of the underlying event which caused the movement.
A summary of inputs used as of June 30, 2015, in valuing the Fund’s assets carried at fair value, is as follows:
| Level 1 | Level 2 | Level 3 | Total | |||||||||||||
| Assets: | ||||||||||||||||
Investments in Securities | ||||||||||||||||
Equity Investments:a | ||||||||||||||||
Health care | $ | 82,022,319 | $ | — | $ | 1,250,406 | $ | 83,272,725 | ||||||||
All Other Equity Investmentsb | 223,055,522 | — | — | 223,055,522 | ||||||||||||
Short Term Investments | — | 427,180 | — | 427,180 | ||||||||||||
|
| |||||||||||||||
Total Investments in Securities | $ | 305,077,841 | $ | 427,180 | $ | 1,250,406 | $ | 306,755,427 | ||||||||
|
| |||||||||||||||
aIncludes common and convertible preferred stocks.
bFor detailed categories, see the accompanying Statement of Investments.
10. Subsequent Events
The Fund has evaluated subsequent events through the issuance of the financial statements and determined that no events have occurred that require disclosure.
| Semiannual Report | FLG-19 |
Franklin Mutual Global Discovery VIP Fund
We are pleased to bring you Franklin Mutual Global Discovery VIP Fund’s semiannual report for the period ended June 30, 2015.
Class 1 Performance Summary as of June 30, 2015
The Fund’s Class 1 shares delivered a +3.18% total return* for the six-month period ended June 30, 2015.
*The Fund has a fee waiver associated with any investment in a Franklin Templeton money fund, contractually guaranteed through at least its current fiscal year-end. Fund investment results reflect the fee waiver, to the extent applicable; without this reduction, the results would have been lower.
Performance reflects the Fund’s Class 1 operating expenses, but does not include any contract fees, expenses or sales charges. If they had been included, performance would be lower. These charges and deductions, particularly for variable life policies, can have a significant effect on contract values and insurance benefits. See the contract prospectus for a complete description of these expenses, including sales charges.
Performance data represent past performance, which does not guarantee future results. Investment return and principal value will fluctuate, and you may have a gain or loss when you sell your shares. Current performance may differ from figures shown.
| Semiannual Report | MGD-1 |
FRANKLIN MUTUAL GLOBAL DISCOVERY VIP FUND
Fund Goal and Main Investments
Franklin Mutual Global Discovery VIP Fund seeks capital appreciation. Under normal market conditions, the Fund invests primarily in U.S. and foreign equity securities that the investment manager believes are undervalued.
Fund Risks
All investments involve risks, including possible loss of principal. Value securities may not increase in price as anticipated, or may decline further in value. The Fund’s investments in foreign securities involve certain risks including currency fluctuations, and economic and political uncertainties. Smaller company stocks have exhibited greater price volatility than larger company stocks, particularly over the short term. The Fund’s investments in companies engaged in mergers, reorganizations or liquidations also involve special risks as pending deals may not be completed on time or on favorable terms. The Fund may invest in lower rated bonds, which entail higher credit risk. The Fund is actively managed but there is no guarantee that the manager’s investment decisions will produce the desired results. The Fund’s prospectus also includes a description of the main investment risks.
Performance Overview
You can find the Fund’s six-month total return in the Performance Summary. In comparison, the Fund’s benchmark, the MSCI World Index, generated a +2.95% total return and the Standard & Poor’s® 500 Index posted a +1.23% total return for the same period.1
Economic and Market Overview
The global economy expanded moderately during the six months under review despite slowing growth in some countries. As measured by the MSCI World Index, stocks in global developed markets advanced overall during the six-month period amid a generally accommodative monetary policy environment and signs of economic improvement in Europe and Japan. Oil prices rebounded from earlier lows as demand picked up despite rising inventories and strong global supply, while gold prices declined marginally during the period under review.
U.S. economic growth was mixed during the six months under review. In 2015’s first quarter, U.S. dollar strength, low energy prices, and a labor dispute at West Coast ports led exports to decline. In the second quarter, business capital spending
rebounded and manufacturing and non-manufacturing activities increased, contributing to strong job gains. During the six-month period, the U.S. Federal Reserve Board (Fed) kept its target interest rate at 0%–0.25% while considering when an increase would be appropriate, based on labor market and inflation data. In its June meeting, the Fed lowered its economic growth forecast for 2015 and raised unemployment estimates given the weak start to the year.
Outside the U.S., the U.K. economy slowed in 2015’s first quarter as the mining and agriculture sectors contracted. Near period-end, the Conservative Party’s unexpected victory in the U.K. general elections supported investor sentiment. In the eurozone, economic growth improved somewhat during the six-month period. Spain expanded at a solid pace, and France and Italy returned to growth in 2015’s first quarter. However, Germany, the region’s largest economy, slowed during the first quarter amid sluggish exports. The region avoided deflation as the annual inflation rate rose in May. The European Central Bank (ECB) maintained its benchmark interest rates during the period and also expanded its asset purchases to boost inflation and the economy. The region generally benefited from a weaker euro that helped exports, the ECB’s accommodative policy and an improved 2015 eurozone growth forecast, but Greece’s debt situation remained a major concern.
The Japanese economy continued to grow in 2015’s first quarter after exiting recession in the previous quarter, driven by an increase in private demand as business investment and private consumption rose. The Bank of Japan maintained its monetary policy during the review period but lowered its economic growth and inflation forecasts at its April meeting.
In emerging markets, economic growth generally moderated. A ceasefire agreement between Russia and Ukraine helped emerging market stocks early in the period. However, Greece’s credit default due to the lack of progress in negotiations weighed on emerging market stocks toward period-end. China’s government implemented market-friendly policies to support new economic drivers that could help steer the economy toward more sustainable growth. Lower interest rates there fueled massive stock market speculation and a 60% price gain up to mid-June 2015 for the domestic A-share market.2 Concerned the market was overheated, the People’s Bank of China reduced liquidity, which led to a market panic in the last two weeks of June, exacerbated by certain government intervention measures. Central bank actions varied across emerging markets, as some
1. Source: Morningstar.
2. Source: MSCI.
One cannot invest directly in an index, and an index is not representative of the Fund’s portfolio. Please see Index Descriptions following the Fund Summaries.
| MGD-2 | Semiannual Report |
FRANKLIN MUTUAL GLOBAL DISCOVERY VIP FUND
banks raised interest rates in response to rising inflation and weakening currencies, while others lowered interest rates to promote economic growth. In the recent global environment, emerging market stocks, as measured by the MSCI Emerging Markets Index, rose for the six-month period.3
Investment Strategy
At Franklin Mutual Series, we are committed to our distinctive value approach to investing. Our major investment strategy is investing in undervalued stocks. When selecting undervalued equities, we are attracted to fundamentally strong companies with healthy balance sheets, high-quality assets, substantial free cash flow and shareholder-oriented management teams and whose stocks are trading at discounts to our assessment of the companies’ intrinsic or business value. We also look for asset-rich companies whose shares may be trading at depressed levels due to concerns over short-term earnings disappointments, litigation, management strategy or other perceived negatives. While the vast majority of our undervalued equity investments are made in publicly traded companies globally, we may invest occasionally in privately held companies as well.
We complement this more traditional investment strategy with two others. One is distressed investing, which is complex and can take many forms. The most common distressed investment the Fund undertakes is the purchase of financially troubled or bankrupt companies’ debt at a substantial discount to face value. After the financially distressed company is reorganized, often in bankruptcy court, the old debt is typically replaced with new securities issued by the financially stronger company.
The other piece of our investment strategy is participating in arbitrage situations, another highly specialized field. When companies announce proposed mergers or takeovers, commonly referred to as “deals,” the target company may trade at a discount to the bid it ultimately accepts. One form of arbitrage involves purchasing the target company’s stock when it is trading below the value we believe it would receive in a deal. In keeping with our commitment to a relatively conservative investment approach, we typically focus our arbitrage efforts on announced deals, and eschew rumored deals or other situations we consider relatively risky.
In addition, it is our practice to hedge the Fund’s currency exposure when we deem it advantageous for our shareholders.
What is meant by “hedge”?
To hedge an investment is to take a position intended to offset potential losses/gains that may be incurred by a companion financial instrument.
Manager’s Discussion
During the six months ended June 30, 2015, European equities rebounded while overall global markets slowed after a three-year ascent. Globally, major central banks remained accommodative while fiscal authorities focused on budgetary discipline. Large companies also remained disciplined about operating costs, with margins at historically high levels in many industries and
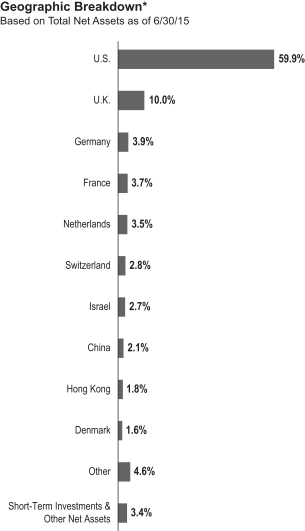
* Figures are stated as a percentage of total and may not equal 100% or may be negative due to rounding, use of any derivatives, unsettled trades or other factors.
3. Please see Index Descriptions following the Fund Summaries.
| Semiannual Report | MGD-3 |
FRANKLIN MUTUAL GLOBAL DISCOVERY VIP FUND
regions — Europe being an exception. To drive further growth, companies started looking externally to mergers and acquisitions, taking advantage of low interest rates to finance deals. In this environment, we saw many opportunities.
Equity prices are typically forward looking, reflecting investors’ beliefs about how various factors and events will play out in the future. Global equity prices at period-end were not at distressed levels, but from our perspective, they reflected a consensus view of a modest global recovery and the persistence of historically high profit margins. Some countries, such as Greece and China, and sectors, such as energy, have been subject to significant market movements, but the global equity market as a whole has been relatively stable. Global quantitative easing has provided a supportive backdrop, and corporations, in general, have built strong balance sheets and focused intensely on improving efficiency.
The acceleration of mergers and acquisitions (M&A) that we have been waiting for is now well under way, with announcements of mega mergers in health care, telecommunications and technology. At the same time, regulatory scrutiny increased, as happened with Comcast’s failed attempt to acquire Time Warner Cable. Environments like this — active M&A combined with regulatory uncertainty and market volatility — have historically been a good combination for us. As we discussed in the 2014 annual report, we seek to use a mixture of merger arbitrage positions — positions constructed solely to benefit from deal completion — and investments in one or both of the companies involved in a deal to benefit from a deal spread and from possible value creation once the deal is completed.
Distressed debt remained a difficult market for us to find compelling new opportunities in. Low interest rates have kept credit widely available, and we saw little real distress. The biggest exception continued to be energy, where lower commodity prices created strain for some issuers. However, the modest recovery in energy prices since the beginning of the year relieved some of the pressure, and in the past six months we found fewer new opportunities in this sector than we expected.
The Fund recently added new positions in Nokia and Holcim. Nokia is a radically different firm from the one that dominated world mobile phone sales 15 years ago. Nokia sold its phone business to Microsoft in 2014 and the Navteq maps business that Nokia acquired in 2007 is for sale. The firm is now focusing on telecommunications network equipment and intellectual property, and enhancing this new focus with a proposed merger with Alcatel-Lucent. The combined company would have a range of products across the telecommunications sector and be one of a
few major suppliers left in the market. The merger is also expected to generate material cost savings, which could make the new company even more competitive. The Fund hopes to benefit from this potentially value-creating project.
Holcim is a Swiss manufacturer of cement, aggregates and other construction products. At period-end, the company was in the process of merging with France’s Lafarge, another major European cement maker, with the deal expected to close in July 2015. The merger would create a global company with a presence in over 90 countries that, in our view, would likely produce significant synergies, help to improve operating profitability and generate strong cash flows.
Turning to Fund performance, many Fund holdings increased in value during the six-month period. Top contributors included bank ING Groep, hotel operator Accor and technology leader Apple.
Shares of Netherlands-based bank ING Groep rallied, particularly in the first quarter of 2015, as the company continued to reduce its ownership of NN Group. This is one of the final steps in the company’s transformation into a simple and well-capitalized bank following the sale of its U.S. insurance operations, Voya Financial, and its stake in Brazil-based insurer SulAmerica. NN Group includes ING’s European and Japanese insurance and investment management businesses. The bank also announced in February the resumption of its regular dividend, and the market anticipated a material special dividend once the disposal of NN Group is completed in 2016. Investors were also encouraged by the company’s positive outlook communicated during its first-quarter earnings call.
| Top 10 Sectors/Industries | ||||
| 6/30/15 | ||||
| % of Total Net Assets | ||||
| Banks | 17.9% | |||
| Insurance | 9.5% | |||
| Pharmaceuticals | 7.4% | |||
| Oil, Gas & Consumable Fuels | 6.9% | |||
| Media | 5.8% | |||
| Software | 4.8% | |||
| Tobacco | 4.4% | |||
| Technology Hardware, Storage & Peripherals | 3.6% | |||
| Food & Staples Retailing | 3.4% | |||
| Health Care Equipment & Supplies | 2.5% | |||
| MGD-4 | Semiannual Report |
FRANKLIN MUTUAL GLOBAL DISCOVERY VIP FUND
Improving economic conditions in Europe benefited France-based hotel operator Accor. In February, Accor’s management stated that it would accelerate its restructuring plan in 2015, an action that we view positively. The plan involved separating the streamlined, asset-heavy hotel property ownership division from the well-run, asset-light hotel management division. In April, the company reported improved demand in France and other important European markets. Finally, we believed Accor would further benefit from the economic stimulus provided by the ECB’s quantitative easing program that could improve consumer confidence and European demand, as well as from a weaker euro that could encourage tourism in the European region.
Apple reported quarterly results in January and April that were ahead of consensus estimates. The company reported ongoing strength in iPhone 6 and iPhone 6 Plus sales that boosted Apple’s product mix in terms of sales and overall average selling price. Growth in China also surged, and the company announced it would more than double the number of stores there by 2016. In April, Apple raised its dividend and increased its share buyback plan over the next two years.
During the period under review, some of the Fund’s investments negatively affected performance. These included publishing paper supplier Verso, document technology and business process solutions company Xerox, and information technology products provider Hewlett-Packard (HP).
Several negative events impacted Verso. Its merger with NewPage took longer than anticipated, and related legal costs, the lack of synergies, and increased costs amid higher wood prices depleted liquidity and weighed on company performance. During a first-quarter conference call in May, Verso announced that future disclosure of cash flow from operations would be summarized on its cash flow statements, making it more difficult to understand, in detail, the sources and uses of cash, as operations and working capital would be combined. Limiting such disclosure is not a positive development, in our view. Additionally, Verso’s chief financial officer (CFO) resigned to join a competitor, and this loss of the company’s CFO at a difficult time shook investor confidence. Although these factors weighed heavily on Verso’s capital structure, we continued to enjoy a high coupon rate, a first lien senior secured position, and the prospects for significant synergies that we think could be realized by year-end if management follows through on its business plan.
Xerox lowered its 2015 earnings guidance in April and reported disappointing quarterly results as margins deteriorated in its services unit. Company management attributed the margin
decline to execution difficulties, particularly with its large health care-related projects. Xerox struggled with its biggest government health care contracts within its services unit for a considerable time, causing a series of cost-driven misses. Outside of services, the company’s document technology unit performed well and its capital management has been favorable as the company continued to repurchase shares.
HP reported a mixed set of quarterly results in February and lowered its 2015 full-year guidance due to a stronger U.S. dollar. HP also lowered its earnings outlook for 2015 and its full-year free cash flow estimate, a result of separation costs from its plan to break into two companies, higher working capital and lower earnings. Although the cost of splitting into two separate companies was viewed as expensive, we believed it would be a positive move with the potential to unlock some value.
| Top 10 Equity Holdings | ||||
| 6/30/15 | ||||
| Company Sector/Industry, Country | % of Total Net Assets | |||
| Microsoft Corp. Software, U.S. | 2.7% | |||
| Merck & Co. Inc. Pharmaceuticals, U.S. | 2.6% | |||
| Wells Fargo & Co. Banks, U.S. | 2.3% | |||
| American International Group Inc. Insurance, U.S. | 2.0% | |||
Apple Inc. Technology Hardware, Storage & Peripherals, U.S. | 2.0% | |||
| Vodafone Group PLC Wireless Telecommunication Services, U.K. | 1.7% | |||
| Citigroup Inc. Banks, U.S. | 1.7% | |||
| ING Groep NV, IDR Banks, Netherlands | 1.7% | |||
| Teva Pharmaceutical Industries Ltd., ADR Pharmaceuticals, Israel | 1.7% | |||
| Royal Dutch Shell PLC, A Oil, Gas & Consumable Fuels, U.K. | 1.6% | |||
The dollar value, number of shares or principal amount, and names of all portfolio holdings are listed in the Fund’s Statement of Investments.
| Semiannual Report | MGD-5 |
FRANKLIN MUTUAL GLOBAL DISCOVERY VIP FUND
During the period, the Fund held currency forwards and futures to somewhat hedge the currency risk of the portfolio’s non-U.S. dollar investments. The hedges had a positive impact on the Fund’s performance during the period.
What is a currency forward contract?
A currency forward contract, or a currency forward, is an agreement between the Fund and a counterparty to buy or sell a foreign currency at a specific exchange rate on a future date.
What is a futures contract?
A futures contract, or a future, is an agreement between the Fund and a counterparty made through a U.S. or foreign futures exchange to buy or sell an underlying instrument or asset at a specific price on a future date.
Thank you for your continued participation in Franklin Mutual Global Discovery VIP Fund. We look forward to serving your future investment needs.
The foregoing information reflects our analysis, opinions and portfolio holdings as of June 30, 2015, the end of the reporting period. The way we implement our main investment strategies and the resulting portfolio holdings may change depending on factors such as market and economic conditions. These opinions may not be relied upon as investment advice or an offer for a particular security. The information is not a complete analysis of every aspect of any market, country, industry, security or the Fund. Statements of fact are from sources considered reliable, but the investment manager makes no representation or warranty as to their completeness or accuracy. Although historical performance is no guarantee of future results, these insights may help you understand our investment management philosophy.
| MGD-6 | Semiannual Report |
FRANKLIN MUTUAL GLOBAL DISCOVERY VIP FUND
Class 1 Fund Expenses
As an investor in a variable insurance contract (Contract) that indirectly provides for investment in an underlying mutual fund, you can incur transaction and/or ongoing expenses at both the Fund level and the Contract level.
| • | Transaction expenses can include sales charges (loads) on purchases, surrender fees, transfer fees and premium taxes. |
| • | Ongoing expenses can include management fees, distribution and service (12b-1) fees, contract fees, annual maintenance fees, mortality and expense risk fees and other fees and expenses. All mutual funds and Contracts have some types of ongoing expenses. |
The expenses shown in the table are meant to highlight ongoing expenses at the Fund level only and do not include ongoing expenses at the Contract level, or transaction expenses at either the Fund or Contract levels. While the Fund does not have transaction expenses, if the transaction and ongoing expenses at the Contract level were included, the expenses shown below would be higher. You should consult your Contract prospectus or disclosure document for more information.
The table shows Fund-level ongoing expenses and can help you understand these expenses and compare them with those of other mutual funds offered through the Contract. The table assumes a $1,000 investment held for the six months indicated. Please refer to the Fund prospectus for additional information on operating expenses.
Actual Fund Expenses
The first line (Actual) of the table provides actual account values and expenses. The “Ending Account Value” is derived from the Fund’s actual return, which includes the effect of ongoing Fund expenses, but does not include the effect of ongoing Contract expenses.
You can estimate the Fund-level expenses you incurred during the period by following these steps. Of course, your account value and expenses will differ from those in this illustration:
| 1. | Divide your account value by $1,000. |
If an account had an $8,600 value, then $8,600 ÷ $1,000 = 8.6.
| 2. | Multiply the result by the number under the heading “Fund-Level Expenses Incurred During Period.” |
If Fund-Level Expenses Incurred During Period were $7.50, then 8.6 × $7.50 = $64.50.
In this illustration, the estimated expenses incurred this period at the Fund level are $64.50.
Hypothetical Example for Comparison with Other Mutual Funds
Information in the second line (Hypothetical) of the table can help you compare ongoing expenses of the Fund with those of other mutual funds offered through the Contract. This information may not be used to estimate the actual ending account balance or expenses you incurred during the period. The hypothetical “Ending Account Value” is based on the Fund’s actual expense ratio and an assumed 5% annual rate of return before expenses, which does not represent the Fund’s actual return. The figure under the heading “Fund-Level Expenses Incurred During Period” shows the hypothetical expenses your account would have incurred under this scenario. You can compare this figure with the 5% hypothetical examples that appear in shareholder reports of other funds offered through a Contract.
| Class 1 | Beginning Account Value 1/1/15 | Ending Account Value 6/30/15 | Fund-Level Expenses Incurred During Period* 1/1/15–6/30/15 | |||||||||
Actual | $1,000 | $1,031.80 | $5.09 | |||||||||
Hypothetical (5% return before expenses) | $1,000 | $1,019.79 | $5.06 | |||||||||
*Expenses are calculated using the most recent six-month annualized expense ratio, net of expense waivers, for the Fund’s Class 1 shares (1.01%), which does not include any ongoing expenses of the Contract for which the Fund is an investment option, multiplied by the average account value over the period, multiplied by 181/365 to reflect the one-half year period.
| Semiannual Report | MGD-7 |
TOTHE CLASS 1, CLASS 2AND CLASS 4 PROSPECTUSES
DATED MAY 1, 2015
OF FRANKLIN MUTUAL GLOBAL DISCOVERY VIP FUND
(a series of Franklin Templeton Variable Insurance Products Trust)
The Class 1, Class 2 and Class 4 prospectuses are amended as follows:
In the Fund Summary, the third paragraph under the heading “Principal Investment Strategies,” and in the Fund Details, the seventh paragraph under the heading “Principal Investment Policies and Practices,” are replaced with the following:
The Fund may invest substantially and potentially up to 100% of its assets in foreign securities, which may include sovereign debt and participations in foreign government debt. The Fund presently does not intend to invest more than a portion (no more than 25%) of its assets in securities of issuers located in emerging market countries.
Please keep this supplement with your prospectus for future reference.
| MGD-8 |
FRANKLIN TEMPLETON VARIABLE INSURANCE PRODUCTS TRUST
Financial Highlights
Franklin Mutual Global Discovery VIP Fund
| Six Months Ended June 30, 2015 (unaudited) | Year Ended December 31, | |||||||||||||||||||||||
| 2014 | 2013 | 2012 | 2011 | 2010 | ||||||||||||||||||||
| Class 1 | ||||||||||||||||||||||||
| Per share operating performance (for a share outstanding throughout the period) | ||||||||||||||||||||||||
Net asset value, beginning of period | $22.61 | $23.31 | $20.55 | $19.66 | $21.16 | $19.14 | ||||||||||||||||||
|
| |||||||||||||||||||||||
| Income from investment operationsa: | ||||||||||||||||||||||||
Net investment incomeb | 0.26 | 0.68 | c | 0.46 | 0.43 | 0.52 | 0.38 | |||||||||||||||||
Net realized and unrealized gains (losses) | 0.46 | 0.76 | 5.03 | 2.21 | (1.09 | ) | 1.94 | |||||||||||||||||
|
| |||||||||||||||||||||||
Total from investment operations | 0.72 | 1.44 | 5.49 | 2.64 | (0.57 | ) | 2.32 | |||||||||||||||||
|
| |||||||||||||||||||||||
| Less distributions from: | ||||||||||||||||||||||||
Net investment income | — | (0.57 | ) | (0.58 | ) | (0.64 | ) | (0.50 | ) | (0.30 | ) | |||||||||||||
Net realized gains | — | (1.57 | ) | (2.15 | ) | (1.11 | ) | (0.43 | ) | — | ||||||||||||||
|
| |||||||||||||||||||||||
Total distributions | — | (2.14 | ) | (2.73 | ) | (1.75 | ) | (0.93 | ) | (0.30 | ) | |||||||||||||
|
| |||||||||||||||||||||||
Net asset value, end of period | $23.33 | $22.61 | $23.31 | $20.55 | $19.66 | $21.16 | ||||||||||||||||||
|
| |||||||||||||||||||||||
Total returnd | 3.18% | 5.98% | 27.95% | 13.63% | (2.73)% | 12.24% | ||||||||||||||||||
| Ratios to average net assetse | ||||||||||||||||||||||||
Expensesf | 1.01% | g,h | 1.00% | g | 0.97% | g | 0.99% | 0.97% | g | 1.00% | g | |||||||||||||
Expenses incurred in connection with securities sold short | 0.04% | 0.03% | —% | i | —%i | —% | i | 0.02% | ||||||||||||||||
Net investment income | 2.22% | 2.85% | c | 2.13% | 2.12% | 2.34% | 1.93% | |||||||||||||||||
| Supplemental data | ||||||||||||||||||||||||
Net assets, end of period (000’s) | $2,658 | $2,313 | $2,465 | $1,136 | $974 | $84,213 | ||||||||||||||||||
Portfolio turnover rate | 12.09% | 22.18% | 15.58% | 25.63% | 26.17% | j | 49.31% | |||||||||||||||||
aThe amount shown for a share outstanding throughout the period may not correlate with the Statement of Operations for the period due to the timing of sales and repurchases of the Fund’s shares in relation to income earned and/or fluctuating fair value of the investments of the Fund.
bBased on average daily shares outstanding.
cNet investment income per share includes approximately $0.34 per share received in the form of special dividends paid in connection with certain Fund’s holdings. Excluding these amounts, the ratio of net investment income to average net assets would have been 1.40%.
dTotal return does not include fees, charges or expenses imposed by the variable annuity and life insurance contracts for which the Franklin Templeton Variable Insurance Products Trust serves as an underlying investment vehicle. Total return is not annualized for periods less than one year.
eRatios are annualized for periods less than one year.
fIncludes dividend expense on securities sold short and security borrowing fees, if any. See below for the ratios of such expenses to average net assets for the periods presented. See Note 1(e).
gBenefit of expense reduction rounds to less than 0.01%.
hBenefit of waiver and payments by affiliates rounds to less than 0.01%.
iRounds to less than 0.01%.
jExcludes the value of portfolio securities delivered as a result of a redemption in-kind.
| The accompanying notes are an integral part of these financial statements. | Semiannual Report | MGD-9 |
FRANKLIN TEMPLETON VARIABLE INSURANCE PRODUCTS TRUST
FINANCIAL HIGHLIGHTS
Franklin Mutual Global Discovery VIP Fund (continued)
| Six Months Ended June 30, 2015 (unaudited) | Year Ended December 31, | |||||||||||||||||||||||
| 2014 | 2013 | 2012 | 2011 | 2010 | ||||||||||||||||||||
| Class 2 | ||||||||||||||||||||||||
| Per share operating performance (for a share outstanding throughout the period) | ||||||||||||||||||||||||
Net asset value, beginning of period | $22.11 | $22.84 | $20.17 | $19.30 | $20.80 | $18.81 | ||||||||||||||||||
|
| |||||||||||||||||||||||
| Income from investment operationsa: | ||||||||||||||||||||||||
Net investment incomeb | 0.22 | 0.60 | c | 0.42 | 0.38 | 0.43 | 0.33 | |||||||||||||||||
Net realized and unrealized gains (losses) | 0.45 | 0.75 | 4.92 | 2.15 | (1.04 | ) | 1.91 | |||||||||||||||||
|
| |||||||||||||||||||||||
Total from investment operations | 0.67 | 1.35 | 5.34 | 2.53 | (0.61 | ) | 2.24 | |||||||||||||||||
|
| |||||||||||||||||||||||
| Less distributions from: | ||||||||||||||||||||||||
Net investment income | — | (0.51 | ) | (0.52 | ) | (0.55 | ) | (0.46 | ) | (0.25 | ) | |||||||||||||
Net realized gains | — | (1.57 | ) | (2.15 | ) | (1.11 | ) | (0.43 | ) | — | ||||||||||||||
|
| |||||||||||||||||||||||
Total distributions | — | (2.08 | ) | (2.67 | ) | (1.66 | ) | (0.89 | ) | (0.25 | ) | |||||||||||||
|
| |||||||||||||||||||||||
Net asset value, end of period | $22.78 | $22.11 | $22.84 | $20.17 | $19.30 | $20.80 | ||||||||||||||||||
|
| |||||||||||||||||||||||
Total returnd | 3.03% | 5.71% | 27.61% | 13.36% | (2.96)% | 11.96% | ||||||||||||||||||
| Ratios to average net assetse | ||||||||||||||||||||||||
Expensesf | 1.26% | g,h | 1.25% | g | 1.22% | g | 1.24% | 1.22% | g | 1.25% | g | |||||||||||||
Expenses incurred in connection with securities sold short | 0.04% | 0.03% | —% | i | —% | i | —% | i | 0.02% | |||||||||||||||
Net investment income | 1.97% | 2.60% | c | 1.88% | 1.87% | 2.09% | 1.68% | |||||||||||||||||
| Supplemental data | ||||||||||||||||||||||||
Net assets, end of period (000’s) | $691,800 | $685,711 | $684,780 | $660,465 | $712,161 | $1,351,223 | ||||||||||||||||||
Portfolio turnover rate | 12.09% | 22.18% | 15.58% | 25.63% | 26.17% | j | 49.31% | |||||||||||||||||
aThe amount shown for a share outstanding throughout the period may not correlate with the Statement of Operations for the period due to the timing of sales and repurchases of the Fund’s shares in relation to income earned and/or fluctuating fair value of the investments of the Fund.
bBased on average daily shares outstanding.
cNet investment income per share includes approximately $0.34 per share received in the form of special dividends paid in connection with certain Fund’s holdings. Excluding these amounts, the ratio of net investment income to average net assets would have been 1.15%.
dTotal return does not include fees, charges or expenses imposed by the variable annuity and life insurance contracts for which the Franklin Templeton Variable Insurance Products Trust serves as an underlying investment vehicle. Total return is not annualized for periods less than one year.
eRatios are annualized for periods less than one year.
fIncludes dividend expense on securities sold short and security borrowing fees, if any. See below for the ratios of such expenses to average net assets for the periods presented. See Note 1(e).
gBenefit of expense reduction rounds to less than 0.01%.
hBenefit of waiver and payments by affiliates rounds to less than 0.01%.
iRounds to less than 0.01%.
jExcludes the value of portfolio securities delivered as a result of a redemption in-kind.
| MGD-10 | Semiannual Report | The accompanying notes are an integral part of these financial statements. |
FRANKLIN TEMPLETON VARIABLE INSURANCE PRODUCTS TRUST
FINANCIAL HIGHLIGHTS
Franklin Mutual Global Discovery VIP Fund (continued)
| Six Months Ended June 30, 2015 (unaudited) | Year Ended December 31, | |||||||||||||||||||||||
| 2014 | 2013 | 2012 | 2011 | 2010 | ||||||||||||||||||||
| Class 4 | ||||||||||||||||||||||||
| Per share operating performance (for a share outstanding throughout the period) | ||||||||||||||||||||||||
Net asset value, beginning of period | $22.39 | $23.10 | $20.38 | $19.50 | $21.02 | $19.02 | ||||||||||||||||||
|
| |||||||||||||||||||||||
| Income from investment operationsa: | ||||||||||||||||||||||||
Net investment incomeb | 0.21 | 0.61 | c | 0.40 | 0.36 | 0.40 | 0.31 | |||||||||||||||||
Net realized and unrealized gains (losses) | 0.46 | 0.73 | 4.97 | 2.19 | (1.05 | ) | 1.94 | |||||||||||||||||
|
| |||||||||||||||||||||||
Total from investment operations | 0.67 | 1.34 | 5.37 | 2.55 | (0.65 | ) | 2.25 | |||||||||||||||||
|
| |||||||||||||||||||||||
| Less distributions from: | ||||||||||||||||||||||||
Net investment income | — | (0.48 | ) | (0.50 | ) | (0.56 | ) | (0.44 | ) | (0.25 | ) | |||||||||||||
Net realized gains | — | (1.57 | ) | (2.15 | ) | (1.11 | ) | (0.43 | ) | — | ||||||||||||||
|
| |||||||||||||||||||||||
Total distributions | — | (2.05 | ) | (2.65 | ) | (1.67 | ) | (0.87 | ) | (0.25 | ) | |||||||||||||
|
| |||||||||||||||||||||||
Net asset value, end of period | $23.06 | $22.39 | $23.10 | $20.38 | $19.50 | $21.02 | ||||||||||||||||||
|
| |||||||||||||||||||||||
Total returnd | 2.99% | 5.60% | 27.52% | 13.27% | (3.08)% | 11.87% | ||||||||||||||||||
| Ratios to average net assetse | ||||||||||||||||||||||||
Expensesf | 1.36% | g,h | 1.35% | g | 1.32% | g | 1.34% | 1.32% | g | 1.35% | g | |||||||||||||
Expenses incurred in connection with securities sold short | 0.04% | 0.03% | —% | i | —% | i | —% | i | 0.02% | |||||||||||||||
Net investment income | 1.87% | 2.50% | c | 1.78% | 1.77% | 1.99% | 1.58% | |||||||||||||||||
| Supplemental data | ||||||||||||||||||||||||
Net assets, end of period (000’s) | $56,596 | $59,961 | $70,354 | $62,346 | $66,695 | $70,613 | ||||||||||||||||||
Portfolio turnover rate | 12.09% | 22.18% | 15.58% | 25.63% | 26.17% | j | 49.31% | |||||||||||||||||
aThe amount shown for a share outstanding throughout the period may not correlate with the Statement of Operations for the period due to the timing of sales and repurchases of the Fund’s shares in relation to income earned and/or fluctuating market value of the investments of the Fund.
bBased on average daily shares outstanding.
cNet investment income per share includes approximately $0.34 per share received in the form of special dividends paid in connection with certain Fund’s holdings. Excluding these amounts, the ratio of investment income to average net assets would have been 1.05%.
dTotal return does not include fees, charges or expenses imposed by the variable annuity and life insurance contracts for which the Franklin Templeton Variable Insurance Products Trust serves as an underlying investment vehicle. Total return is not annualized for periods less than one year.
eRatios are annualized for periods less than one year.
fIncludes dividend expense on securities sold short and security borrowing fees, if any. See below for the ratios of such expenses to average net assets for the periods presented. See Note 1(e).
gBenefit of expense reduction rounds to less than 0.01%.
hBenefit of waiver and payments by affiliates rounds to less than 0.01%.
iRounds to less than 0.01%.
jExcludes the value of portfolio securities delivered as a result of a redemption in-kind.
| The accompanying notes are an integral part of these financial statements. | Semiannual Report | MGD-11 |
FRANKLIN TEMPLETON VARIABLE INSURANCE PRODUCTS TRUST
Statement of Investments, June 30, 2015 (unaudited)
Franklin Mutual Global Discovery VIP Fund
| ||||||||||||||
| Country | Shares/Units | Value | ||||||||||||
Common Stocks and Other Equity Interests 91.1% | ||||||||||||||
Aerospace & Defense 0.7% | ||||||||||||||
B/E Aerospace Inc. | United States | 65,840 | $ | 3,614,616 | ||||||||||
| a | KLX Inc. | United States | 32,920 | 1,452,760 | ||||||||||
|
| |||||||||||||
| 5,067,376 | ||||||||||||||
|
| |||||||||||||
Auto Components 0.9% | ||||||||||||||
Cie Generale des Etablissements Michelin, B | France | 30,800 | 3,226,212 | |||||||||||
| a,b | International Automotive Components Group Brazil LLC | Brazil | 424,073 | 37,011 | ||||||||||
| a,b,c | International Automotive Components Group North America LLC | United States | 4,052,916 | 3,607,152 | ||||||||||
|
| |||||||||||||
| 6,870,375 | ||||||||||||||
|
| |||||||||||||
Automobiles 1.3% | ||||||||||||||
General Motors Co. | United States | 214,110 | 7,136,286 | |||||||||||
Hyundai Motor Co. | South Korea | 20,953 | 2,545,111 | |||||||||||
|
| |||||||||||||
| 9,681,397 | ||||||||||||||
|
| |||||||||||||
Banks 17.9% | ||||||||||||||
Barclays PLC | United Kingdom | 2,052,511 | 8,399,809 | |||||||||||
BNP Paribas SA | France | 117,870 | 7,113,156 | |||||||||||
| a | Capital Bank Financial Corp., A | United States | 78,494 | 2,281,821 | ||||||||||
| a,d | Capital Bank Financial Corp., B, 144A, non-voting | United States | 269,922 | 7,846,632 | ||||||||||
CIT Group Inc. | United States | 168,672 | 7,841,561 | |||||||||||
Citigroup Inc. | United States | 229,050 | 12,652,722 | |||||||||||
Citizens Financial Group Inc. | United States | 249,552 | 6,815,265 | |||||||||||
| a | Commerzbank AG | Germany | 655,995 | 8,381,759 | ||||||||||
HSBC Holdings PLC | United Kingdom | 586,355 | 5,251,555 | |||||||||||
ING Groep NV, IDR | Netherlands | 756,040 | 12,478,444 | |||||||||||
JPMorgan Chase & Co. | United States | 131,280 | 8,895,533 | |||||||||||
KB Financial Group Inc. | South Korea | 56,047 | 1,847,142 | |||||||||||
PNC Financial Services Group Inc. | United States | 112,821 | 10,791,329 | |||||||||||
| a | Seacoast Banking Corp. of Florida | United States | 398,000 | 6,288,400 | ||||||||||
Societe Generale SA | France | 118,614 | 5,534,769 | |||||||||||
SunTrust Banks Inc. | United States | 111,578 | 4,800,085 | |||||||||||
Wells Fargo & Co. | United States | 307,140 | 17,273,554 | |||||||||||
|
| |||||||||||||
| 134,493,536 | ||||||||||||||
|
| |||||||||||||
Beverages 1.1% | ||||||||||||||
PepsiCo Inc. | United States | 90,367 | 8,434,856 | |||||||||||
|
| |||||||||||||
Capital Markets 1.1% | ||||||||||||||
Credit Suisse Group AG | Switzerland | 128,334 | 3,527,092 | |||||||||||
UBS Group AG | Switzerland | 220,850 | 4,683,409 | |||||||||||
|
| |||||||||||||
| 8,210,501 | ||||||||||||||
|
| |||||||||||||
Communications Equipment 2.3% | ||||||||||||||
Cisco Systems Inc. | United States | 359,180 | 9,863,083 | |||||||||||
Nokia Corp., ADR | Finland | 519,486 | 3,558,479 | |||||||||||
Nokia OYJ, A | Finland | 611,269 | 4,148,683 | |||||||||||
|
| |||||||||||||
| 17,570,245 | ||||||||||||||
|
| |||||||||||||
Construction Materials 0.7% | ||||||||||||||
| a | Holcim Ltd., B | Switzerland | 74,930 | 5,529,002 | ||||||||||
|
| |||||||||||||
Consumer Finance 0.5% | ||||||||||||||
| a | Ally Financial Inc. | United States | 151,600 | 3,400,388 | ||||||||||
|
| |||||||||||||
| MGD-12 | Semiannual Report |
FRANKLIN TEMPLETON VARIABLE INSURANCE PRODUCTS TRUST
STATEMENT OF INVESTMENTS (UNAUDITED)
Franklin Mutual Global Discovery VIP Fund (continued)
| Country | Shares/Units | Value | ||||||||||||
Common Stocks and Other Equity Interests (continued) | ||||||||||||||
Diversified Consumer Services 0.1% | ||||||||||||||
Cengage Learning Holdings II LP | United States | 22,762 | $ | 643,026 | ||||||||||
|
| |||||||||||||
Diversified Telecommunication Services 0.4% | ||||||||||||||
China Telecom Corp. Ltd., H | China | 4,976,104 | 2,920,833 | |||||||||||
| a,e,f | Global Crossing Holdings Ltd., Contingent Distribution | United States | 2,236,777 | — | ||||||||||
|
| |||||||||||||
| 2,920,833 | ||||||||||||||
|
| |||||||||||||
Energy Equipment & Services 1.2% | ||||||||||||||
Baker Hughes Inc. | United States | 145,092 | 8,952,176 | |||||||||||
|
| |||||||||||||
Food & Staples Retailing 3.4% | ||||||||||||||
CVS Health Corp. | United States | 46,236 | 4,849,232 | |||||||||||
Empire Co. Ltd., A | Canada | 72,193 | 5,084,722 | |||||||||||
Metro AG | Germany | 226,924 | 7,151,883 | |||||||||||
Walgreens Boots Alliance Inc. | United States | 102,904 | 8,689,214 | |||||||||||
|
| |||||||||||||
| 25,775,051 | ||||||||||||||
|
| |||||||||||||
Health Care Equipment & Supplies 2.5% | ||||||||||||||
Medtronic PLC | United States | 146,350 | 10,844,535 | |||||||||||
Stryker Corp. | United States | 83,662 | 7,995,577 | |||||||||||
|
| |||||||||||||
| 18,840,112 | ||||||||||||||
|
| |||||||||||||
Health Care Providers & Services 0.4% | ||||||||||||||
Cigna Corp. | United States | 20,116 | 3,258,792 | |||||||||||
|
| |||||||||||||
Hotels, Restaurants & Leisure 1.9% | ||||||||||||||
Accor SA | France | 233,913 | 11,801,180 | |||||||||||
Sands China Ltd. | Hong Kong | 648,800 | 2,180,341 | |||||||||||
|
| |||||||||||||
| 13,981,521 | ||||||||||||||
|
| |||||||||||||
Independent Power & Renewable Electricity Producers 0.9% | ||||||||||||||
NRG Energy Inc. | United States | 299,277 | 6,847,458 | |||||||||||
|
| |||||||||||||
Industrial Conglomerates 2.2% | ||||||||||||||
Jardine Strategic Holdings Ltd. | Hong Kong | 371,698 | 11,251,298 | |||||||||||
Koninklijke Philips NV | Netherlands | 192,174 | 4,887,321 | |||||||||||
|
| |||||||||||||
| 16,138,619 | ||||||||||||||
|
| |||||||||||||
Insurance 9.5% | ||||||||||||||
ACE Ltd. | United States | 112,290 | 11,417,647 | |||||||||||
| a | Alleghany Corp. | United States | 2,730 | 1,279,715 | ||||||||||
The Allstate Corp. | United States | 116,387 | 7,550,025 | |||||||||||
American International Group Inc. | United States | 243,553 | 15,056,446 | |||||||||||
China Pacific Insurance (Group) Co. Ltd., H | China | 845,908 | 4,070,407 | |||||||||||
E-L Financial Corp. Ltd. | Canada | 5,378 | 2,823,149 | |||||||||||
MetLife Inc. | United States | 100,526 | 5,628,451 | |||||||||||
NN Group NV | Netherlands | 325,023 | 9,133,425 | |||||||||||
PartnerRe Ltd. | United States | 48,733 | 6,262,190 | |||||||||||
PICC Property and Casualty Co. Ltd., H | China | 180,838 | 411,523 | |||||||||||
XL Group PLC | Ireland | 216,870 | 8,067,564 | |||||||||||
|
| |||||||||||||
| 71,700,542 | ||||||||||||||
|
| |||||||||||||
IT Services 0.9% | ||||||||||||||
Xerox Corp. | United States | 612,817 | 6,520,373 | |||||||||||
|
| |||||||||||||
| Semiannual Report | MGD-13 |
FRANKLIN TEMPLETON VARIABLE INSURANCE PRODUCTS TRUST
STATEMENT OF INVESTMENTS (UNAUDITED)
Franklin Mutual Global Discovery VIP Fund (continued)
| Country | Shares/Units | Value | ||||||||||||
Common Stocks and Other Equity Interests (continued) | ||||||||||||||
Machinery 0.5% | ||||||||||||||
Caterpillar Inc. | United States | 43,225 | $ | 3,666,344 | ||||||||||
|
| |||||||||||||
Marine 1.6% | ||||||||||||||
A.P. Moeller-Maersk AS, B | Denmark | 6,595 | 11,940,575 | |||||||||||
|
| |||||||||||||
Media 5.8% | ||||||||||||||
CBS Corp., B | United States | 91,632 | 5,085,576 | |||||||||||
| a | DIRECTV | United States | 129,180 | 11,986,612 | ||||||||||
Reed Elsevier PLC | United Kingdom | 213,615 | 3,473,348 | |||||||||||
Time Warner Cable Inc. | United States | 62,129 | 11,069,524 | |||||||||||
Time Warner Inc. | United States | 66,132 | 5,780,598 | |||||||||||
Tribune Media Co., A | United States | 4,449 | 237,532 | |||||||||||
Tribune Publishing Co. | United States | 7,747 | 120,389 | |||||||||||
Twenty-First Century Fox Inc., B | United States | 170,160 | 5,482,555 | |||||||||||
|
| |||||||||||||
| 43,236,134 | ||||||||||||||
|
| |||||||||||||
Metals & Mining 1.8% | ||||||||||||||
Anglo American PLC | United Kingdom | 145,724 | 2,102,745 | |||||||||||
Freeport-McMoRan Inc., B | United States | 186,260 | 3,468,161 | |||||||||||
ThyssenKrupp AG | Germany | 295,953 | 7,696,462 | |||||||||||
|
| |||||||||||||
| 13,267,368 | ||||||||||||||
|
| |||||||||||||
Multiline Retail 0.5% | ||||||||||||||
Macy’s Inc. | United States | 58,280 | 3,932,152 | |||||||||||
|
| |||||||||||||
Oil, Gas & Consumable Fuels 6.9% | ||||||||||||||
Anadarko Petroleum Corp. | United States | 41,180 | 3,214,511 | |||||||||||
Apache Corp. | United States | 140,021 | 8,069,410 | |||||||||||
BG Group PLC | United Kingdom | 272,693 | 4,538,906 | |||||||||||
BP PLC | United Kingdom | 1,028,014 | 6,785,465 | |||||||||||
China Shenhua Energy Co. Ltd., H | China | 2,009,534 | 4,583,355 | |||||||||||
CONSOL Energy Inc. | United States | 114,311 | 2,485,121 | |||||||||||
Marathon Oil Corp. | United States | 178,885 | 4,747,608 | |||||||||||
Repsol SA | Spain | 104,221 | 1,829,348 | |||||||||||
Royal Dutch Shell PLC, A | United Kingdom | 435,012 | 12,299,354 | |||||||||||
| a | Whiting Petroleum Corp. | United States | 101,406 | 3,407,241 | ||||||||||
|
| |||||||||||||
| 51,960,319 | ||||||||||||||
|
| |||||||||||||
Paper & Forest Products 0.0%† | ||||||||||||||
| a | Verso Corp. | United States | 36,624 | 24,172 | ||||||||||
|
| |||||||||||||
Personal Products 0.1% | ||||||||||||||
Avon Products Inc. | United States | 174,524 | 1,092,520 | |||||||||||
|
| |||||||||||||
Pharmaceuticals 7.4% | ||||||||||||||
Eli Lilly & Co. | United States | 140,630 | 11,741,199 | |||||||||||
| a | Hospira Inc. | United States | 44,053 | 3,907,941 | ||||||||||
Merck & Co. Inc. | United States | 346,558 | 19,729,547 | |||||||||||
Novartis AG, ADR | Switzerland | 76,830 | 7,555,462 | |||||||||||
Teva Pharmaceutical Industries Ltd., ADR | Israel | 210,898 | 12,464,072 | |||||||||||
|
| |||||||||||||
| 55,398,221 | ||||||||||||||
|
| |||||||||||||
Road & Rail 0.5% | ||||||||||||||
| a | CAR Inc. | China | 1,623,080 | 3,446,479 | ||||||||||
|
| |||||||||||||
| MGD-14 | Semiannual Report |
FRANKLIN TEMPLETON VARIABLE INSURANCE PRODUCTS TRUST
STATEMENT OF INVESTMENTS (UNAUDITED)
Franklin Mutual Global Discovery VIP Fund (continued)
| Country | Shares/Units | Value | ||||||||||||
Common Stocks and Other Equity Interests (continued) | ||||||||||||||
Semiconductors & Semiconductor Equipment 0.3% | ||||||||||||||
SK Hynix Semiconductor Inc. | South Korea | 53,632 | $ | 2,026,217 | ||||||||||
|
| |||||||||||||
Software 5.1% | ||||||||||||||
| a | Check Point Software Technologies Ltd. | Israel | 95,512 | 7,597,980 | ||||||||||
Microsoft Corp. | United States | 452,522 | 19,978,846 | |||||||||||
Open Text Corp. | Canada | 62,541 | 2,534,787 | |||||||||||
Symantec Corp. | United States | 364,800 | 8,481,600 | |||||||||||
|
| |||||||||||||
| 38,593,213 | ||||||||||||||
|
| |||||||||||||
Specialty Retail 1.0% | ||||||||||||||
Kingfisher PLC | United Kingdom | 1,354,320 | 7,389,283 | |||||||||||
|
| |||||||||||||
Technology Hardware, Storage & Peripherals 3.6% | ||||||||||||||
Apple Inc. | United States | 117,767 | 14,770,926 | |||||||||||
EMC Corp. | United States | 257,415 | 6,793,182 | |||||||||||
Hewlett-Packard Co. | United States | 190,760 | 5,724,707 | |||||||||||
|
| |||||||||||||
| 27,288,815 | ||||||||||||||
|
| |||||||||||||
Tobacco 4.4% | ||||||||||||||
Altria Group Inc. | United States | 176,234 | 8,619,605 | |||||||||||
British American Tobacco PLC | United Kingdom | 220,778 | 11,844,663 | |||||||||||
Philip Morris International Inc. | United States | 75,124 | 6,022,691 | |||||||||||
Reynolds American Inc. | United States | 88,705 | 6,622,715 | |||||||||||
|
| |||||||||||||
| 33,109,674 | ||||||||||||||
|
| |||||||||||||
Wireless Telecommunication Services 1.7% | ||||||||||||||
Vodafone Group PLC | United Kingdom | 3,618,505 | 13,066,218 | |||||||||||
|
| |||||||||||||
Total Common Stocks and Other Equity Interests | 684,273,883 | |||||||||||||
|
| |||||||||||||
Preferred Stocks 1.7% | ||||||||||||||
Automobiles 0.8% | ||||||||||||||
Volkswagen AG, pfd. | Germany | 26,396 | 6,118,741 | |||||||||||
|
| |||||||||||||
Diversified Financial Services 0.9% | ||||||||||||||
| a,b | Hightower Holding LLC, pfd., A, Series 2 | United States | 2,172,000 | 6,300,320 | ||||||||||
|
| |||||||||||||
Total Preferred Stocks (Cost $10,942,485) | 12,419,061 | |||||||||||||
|
| |||||||||||||
| Principal Amount* | ||||||||||||||
Corporate Bonds, Notes and Senior Floating Rate Interests 2.5% | ||||||||||||||
| d | Avaya Inc., senior note, 144A, 10.50%, 3/01/21 | United States | 609,000 | 505,470 | ||||||||||
| g,h | Cengage Learning Acquisitions Inc., Original Term Loans, 7.00%, 3/31/20 | United States | 142,374 | 142,907 | ||||||||||
iHeartCommunications Inc., | ||||||||||||||
senior secured note, first lien, 9.00%, 12/15/19 | United States | 5,184,000 | 4,959,792 | |||||||||||
g,h Tranche D Term Loan, 6.937%, 1/30/19 | United States | 6,889,154 | 6,378,206 | |||||||||||
g,h Tranche E Term Loan, 7.687%, 7/30/19 | United States | 2,213,881 | 2,079,664 | |||||||||||
| g,h | JC Penney Corp. Inc., Term Loan, 6.00%, 5/22/18 | United States | 151,324 | 151,135 | ||||||||||
| d,i | NGPL PipeCo LLC, senior secured note, 144A, 9.625%, 6/01/19 | United States | 2,369,000 | 2,410,457 | ||||||||||
Verso Paper Holdings LLC/Inc., senior secured note, first lien, 11.75%, 1/15/19 | United States | 1,749,000 | 1,027,538 | |||||||||||
| Semiannual Report | MGD-15 |
FRANKLIN TEMPLETON VARIABLE INSURANCE PRODUCTS TRUST
STATEMENT OF INVESTMENTS (UNAUDITED)
Franklin Mutual Global Discovery VIP Fund (continued)
| Country | Principal Amount* | Value | ||||||||||||
Corporate Bonds, Notes and Senior Floating Rate Interests (continued) | ||||||||||||||
Walter Energy Inc., | ||||||||||||||
g,h B Term Loan, 7.25%, 4/01/18 | United States | 1,651,867 | $ | 911,281 | ||||||||||
d first lien, 144A, 9.50%, 10/15/19 | United States | 966,000 | 533,715 | |||||||||||
d,j second lien, 144A, PIK, 11.50%, 4/01/20 | United States | 801,340 | 43,429 | |||||||||||
|
| |||||||||||||
Total Corporate Bonds, Notes and Senior Floating Rate Interests (Cost $21,207,664) | 19,143,594 | |||||||||||||
|
| |||||||||||||
Corporate Notes and Senior Floating Rate Interests in Reorganization 1.1% | ||||||||||||||
| b,k | Broadband Ventures III LLC, secured promissory note, 5.00%, 2/01/12 | United States | 595 | — | ||||||||||
| g,h,k | Caesars Entertainment Operating Co. Inc., Term B-7 Loans, 1.50%, 3/01/17 | United States | 1,176,090 | 1,029,667 | ||||||||||
| g,h,k | Texas Competitive Electric Holdings Co. LLC, Term Loans, 4.671%, 10/10/17 | United States | 5,912,264 | 3,417,105 | ||||||||||
| d,k | Texas Competitive Electric Holdings Co. LLC/Texas Competitive Electric Holdings Finance Inc., senior secured note, first lien, 144A, 11.50%, 10/01/20 | United States | 5,895,000 | 3,610,687 | ||||||||||
|
| |||||||||||||
Total Corporate Notes and Senior Floating Rate Interests in Reorganization (Cost $11,703,517) | 8,057,459 | |||||||||||||
|
| |||||||||||||
| Shares | ||||||||||||||
Companies in Liquidation 0.3% | ||||||||||||||
| a | Adelphia Recovery Trust | United States | 5,379,562 | 10,759 | ||||||||||
| a,e | Adelphia Recovery Trust, Arahova Contingent Value Vehicle, Contingent Distribution | United States | 386,774 | 4,293 | ||||||||||
| a,e,f | Century Communications Corp., Contingent Distribution | United States | 1,074,000 | — | ||||||||||
| a,b | FIM Coinvestor Holdings I, LLC | United States | 2,077,368 | — | ||||||||||
| a,l | Lehman Brothers Holdings Inc., Bankruptcy Claim | United States | 17,348,669 | 2,298,699 | ||||||||||
| a,f | NewPage Corp., Litigation Trust | United States | 4,854,000 | — | ||||||||||
| a,e,f | Tribune Media Litigation Trust, Contingent Distribution | United States | 56,925 | — | ||||||||||
|
| |||||||||||||
Total Companies in Liquidation (Cost $3,555,246) | 2,313,751 | |||||||||||||
|
| |||||||||||||
| Principal Amount* | ||||||||||||||
Municipal Bonds (Cost $2,112,494) 0.2% | ||||||||||||||
Puerto Rico Commonwealth GO, Refunding, Series A, 8.00%, 7/01/35 | United States | 2,261,000 | 1,531,828 | |||||||||||
|
| |||||||||||||
Total Investments before Short Term Investments | 727,739,576 | |||||||||||||
|
| |||||||||||||
| MGD-16 | Semiannual Report |
FRANKLIN TEMPLETON VARIABLE INSURANCE PRODUCTS TRUST
STATEMENT OF INVESTMENTS (UNAUDITED)
Franklin Mutual Global Discovery VIP Fund (continued)
| Country | Principal Amount* | Value | ||||||||||||
Short Term Investments 1.7% | ||||||||||||||
U.S. Government and Agency Securities 1.6% | ||||||||||||||
| m | FHLB, 7/01/15 | United States | 2,500,000 | $ | 2,500,000 | |||||||||
| m,n | U.S. Treasury Bills, 7/09/15 - 12/03/15 | United States | 10,000,000 | 9,999,423 | ||||||||||
|
| |||||||||||||
Total U.S. Government and Agency Securities | 12,499,423 | |||||||||||||
|
| |||||||||||||
Total Investments before Repurchase Agreements | 740,238,999 | |||||||||||||
|
| |||||||||||||
| o | Investments from Cash Collateral Received for Loaned Securities 0.1% | |||||||||||||
Repurchase Agreements 0.1% | ||||||||||||||
| p | Joint Repurchase Agreement, 0.10%, 7/01/15 | United States | 105,243 | 105,243 | ||||||||||
HSBC Securities (USA) Inc. | ||||||||||||||
Collateralized by U.S. Government and Agency Securities, | ||||||||||||||
| p | Joint Repurchase Agreement, 0.11%, 7/01/15 | United States | 337,883 | 337,883 | ||||||||||
RBS Securities Inc. | ||||||||||||||
Collateralized by U.S. Treasury Bonds, 3.625%, 2/15/44; and U.S. Treasury Notes, 1.00% - 3.625%, 9/30/15 - 2/15/44 | ||||||||||||||
|
| |||||||||||||
Total Investments from Cash Collateral Received for Loaned Securities (Cost $443,126) | 443,126 | |||||||||||||
|
| |||||||||||||
Total Investments (Cost $589,408,219) 98.6% | 740,682,125 | |||||||||||||
Securities Sold Short (0.3)% | (2,367,202 | ) | ||||||||||||
Other Assets, less Liabilities 1.7% | 12,739,221 | |||||||||||||
|
| |||||||||||||
Net Assets 100.0% | $ | 751,054,144 | ||||||||||||
|
| |||||||||||||
| Shares | ||||||||||||||
| q | Securities Sold Short (0.3)% | |||||||||||||
Common Stocks (0.3)% | ||||||||||||||
Energy Equipment & Services (0.0)%† | ||||||||||||||
Halliburton Co. | United States | 3,677 | $ | (158,368 | ) | |||||||||
|
| |||||||||||||
Software (0.3)% | ||||||||||||||
VMware Inc., A | United States | 25,762 | (2,208,834 | ) | ||||||||||
|
| |||||||||||||
Total Securities Sold Short (Proceeds $2,302,315) | $ | (2,367,202 | ) | |||||||||||
|
| |||||||||||||
| Semiannual Report | MGD-17 |
FRANKLIN TEMPLETON VARIABLE INSURANCE PRODUCTS TRUST
STATEMENT OF INVESTMENTS (UNAUDITED)
Franklin Mutual Global Discovery VIP Fund (continued)
†Rounds to less than 0.1% of net assets.
*The principal amount is stated in U.S. dollars unless otherwise indicated.
aNon-income producing.
bSee Note 8 regarding restricted securities.
cAt June 30, 2015, pursuant to the Fund’s policies and the requirements of applicable securities law, the Fund may be restricted from trading this security for a limited or extended period of time.
dSecurity was purchased pursuant to Rule 144A under the Securities Act of 1933 and may be sold in transactions exempt from registration only to qualified institutional buyers or in a public offering registered under the Securities Act of 1933. These securities have been deemed liquid under guidelines approved by the Trust’s Board of Trustees. At June 30, 2015, the aggregate value of these securities was $14,950,390, representing 1.99% of net assets.
eContingent distributions represent the right to receive additional distributions, if any, during the reorganization of the underlying company. Shares represent total underlying principal of debt securities.
fSecurity has been deemed illiquid because it may not be able to be sold within seven days. At June 30, 2015, the aggregate value of these securities was $—.
gSee Note 1(g) regarding senior floating rate interests.
hThe coupon rate shown represents the rate at period end.
iA portion or all of the security is on loan at June 30, 2015. See Note 1(f).
jIncome may be received in additional securities and/or cash.
kSee Note 7 regarding credit risk and defaulted securities.
lBankruptcy claims represent the right to receive distributions, if any, during the liquidation of the underlying pool of assets. Shares represent amount of allowed unsecured claims.
mThe security is traded on a discount basis with no stated coupon rate.
nSecurity or a portion of the security has been pledged as collateral for securities sold short and forward contracts. At June 30, 2015, the aggregate value of these securities and/or cash pledged as collateral was $6,257,613, representing 0.83% of net assets.
oSee Note 1(f) regarding securities on loan.
pSee Note 1(c) regarding joint repurchase agreement.
qSee Note 1(e) regarding securities sold short.
At June 30, 2015, the Fund had the following futures contracts outstanding. See Note 1(d).
| Futures Contracts | ||||||||||||||||||||||||
| Description | Type | Number of Contracts | Notional Value | Expiration Date | Unrealized Appreciation | Unrealized Depreciation | ||||||||||||||||||
| Currency Contracts | ||||||||||||||||||||||||
CHF/USD | Short | 2 | $ | 268,050 | 9/14/15 | $ | 1,955 | $ | — | |||||||||||||||
EUR/USD | Short | 246 | 34,304,700 | 9/14/15 | 422,449 | — | ||||||||||||||||||
GBP/USD | Short | 219 | 21,523,594 | 9/14/15 | — | (521,950 | ) | |||||||||||||||||
|
|
|
| |||||||||||||||||||||
Totals | $ | 56,096,344 | $ | 424,404 | $ | (521,950 | ) | |||||||||||||||||
|
|
|
| |||||||||||||||||||||
Net unrealized appreciation (depreciation) |
| $ | (97,546 | ) | ||||||||||||||||||||
|
| |||||||||||||||||||||||
At June 30, 2015, the Fund had the following forward exchange contracts outstanding. See Note 1(d).
| Forward Exchange Contracts | ||||||||||||||||||||||||||||
| Currency | Counterpartya | Type | Quantity | Contract Amount | Settlement Date | Unrealized Appreciation | Unrealized Depreciation | |||||||||||||||||||||
| OTC Forward Exchange Contracts | ||||||||||||||||||||||||||||
Euro | BOFA | Buy | 289,021 | $ | 324,130 | 7/20/15 | $ | — | $ | (1,942 | ) | |||||||||||||||||
Euro | BOFA | Sell | 1,669,478 | 1,926,799 | 7/20/15 | 65,737 | — | |||||||||||||||||||||
Euro | BONY | Sell | 69,136 | 80,304 | 7/20/15 | 3,234 | — | |||||||||||||||||||||
Euro | BZWS | Sell | 205,439 | 231,046 | 7/20/15 | 2,031 | — | |||||||||||||||||||||
Euro | DBAB | Buy | 309,252 | 346,685 | 7/20/15 | 47 | (1,991 | ) | ||||||||||||||||||||
Euro | DBAB | Sell | 2,069,221 | 2,396,675 | 7/20/15 | 89,997 | — | |||||||||||||||||||||
Euro | FBCO | Buy | 310,912 | 346,535 | 7/20/15 | 56 | — | |||||||||||||||||||||
Euro | FBCO | Sell | 1,810,153 | 2,083,407 | 7/20/15 | 65,527 | — | |||||||||||||||||||||
Euro | HSBC | Buy | 621,541 | 700,206 | 7/20/15 | — | (7,339 | ) | ||||||||||||||||||||
Euro | HSBC | Sell | 2,333,282 | 2,709,123 | 7/20/15 | 108,082 | — | |||||||||||||||||||||
Euro | SSBT | Buy | 1,345,455 | 1,504,128 | 7/20/15 | — | (4,273 | ) | ||||||||||||||||||||
Euro | SSBT | Sell | 1,935,624 | 2,260,496 | 7/20/15 | 102,746 | — | |||||||||||||||||||||
British Pound | BOFA | Sell | 2,804,423 | 4,239,264 | 7/21/15 | — | (165,824 | ) | ||||||||||||||||||||
| MGD-18 | Semiannual Report |
FRANKLIN TEMPLETON VARIABLE INSURANCE PRODUCTS TRUST
STATEMENT OF INVESTMENTS (UNAUDITED)
Franklin Mutual Global Discovery VIP Fund (continued)
| Forward Exchange Contracts (continued) | ||||||||||||||||||||||||||||
| Currency | Counterpartya | Type | Quantity | Contract Amount | Settlement Date | Unrealized Appreciation | Unrealized Depreciation | |||||||||||||||||||||
| OTC Forward Exchange Contracts (continued) | ||||||||||||||||||||||||||||
British Pound | HSBC | Sell | 2,629,277 | $ | 3,981,081 | 7/21/15 | $ | — | $ | (148,893 | ) | |||||||||||||||||
South Korean Won | BOFA | Buy | 608,663,744 | 559,598 | 8/12/15 | — | (16,551 | ) | ||||||||||||||||||||
South Korean Won | BOFA | Sell | 3,122,744,550 | 2,821,142 | 8/12/15 | 36,286 | (1,242 | ) | ||||||||||||||||||||
South Korean Won | FBCO | Buy | 954,644,063 | 854,542 | 8/12/15 | 1,343 | (4,156 | ) | ||||||||||||||||||||
South Korean Won | FBCO | Sell | 2,822,102,507 | 2,538,864 | 8/12/15 | 20,997 | — | |||||||||||||||||||||
South Korean Won | HSBC | Buy | 1,296,493,481 | 1,185,982 | 8/12/15 | — | (29,257 | ) | ||||||||||||||||||||
South Korean Won | HSBC | Sell | 4,101,330,131 | 3,689,933 | 8/12/15 | 32,493 | (1,747 | ) | ||||||||||||||||||||
Swiss Franc | BOFA | Buy | 214,621 | 222,832 | 8/12/15 | 7,078 | — | |||||||||||||||||||||
Swiss Franc | BOFA | Sell | 85,880 | 92,109 | 8/12/15 | 111 | — | |||||||||||||||||||||
Swiss Franc | DBAB | Buy | 116,655 | 127,054 | 8/12/15 | — | (2,089 | ) | ||||||||||||||||||||
Swiss Franc | DBAB | Sell | 107,251 | 112,410 | 8/12/15 | — | (2,481 | ) | ||||||||||||||||||||
Swiss Franc | FBCO | Buy | 120,705 | 127,994 | 8/12/15 | 1,614 | (304 | ) | ||||||||||||||||||||
Swiss Franc | FBCO | Sell | 133,250 | 139,941 | 8/12/15 | 582 | (3,384 | ) | ||||||||||||||||||||
Swiss Franc | HSBC | Sell | 34,465 | 37,243 | 8/12/15 | 323 | — | |||||||||||||||||||||
Swiss Franc | SSBT | Buy | 60,535 | 65,274 | 8/12/15 | 36 | (463 | ) | ||||||||||||||||||||
Swiss Franc | SSBT | Sell | 2,204,962 | 2,385,950 | 8/12/15 | 33,465 | (9,551 | ) | ||||||||||||||||||||
British Pound | BOFA | Buy | 2,826,178 | 4,374,826 | 8/19/15 | 67,551 | (4,061 | ) | ||||||||||||||||||||
British Pound | BOFA | Sell | 2,074,710 | 3,173,591 | 8/19/15 | — | (84,597 | ) | ||||||||||||||||||||
British Pound | BZWS | Sell | 245,449 | 372,864 | 8/19/15 | — | (12,596 | ) | ||||||||||||||||||||
British Pound | DBAB | Sell | 176,767 | 271,023 | 8/19/15 | — | (6,577 | ) | ||||||||||||||||||||
British Pound | FBCO | Buy | 212,609 | 337,457 | 8/19/15 | — | (3,570 | ) | ||||||||||||||||||||
British Pound | FBCO | Sell | 1,578,762 | 2,414,971 | 8/19/15 | — | (64,365 | ) | ||||||||||||||||||||
British Pound | HSBC | Sell | 1,546,970 | 2,371,251 | 8/19/15 | — | (58,157 | ) | ||||||||||||||||||||
British Pound | SSBT | Buy | 621,978 | 980,668 | 8/19/15 | 1,715 | (5,610 | ) | ||||||||||||||||||||
British Pound | SSBT | Sell | 445,957 | 685,645 | 8/19/15 | — | (14,700 | ) | ||||||||||||||||||||
Euro | BOFA | Sell | 6,938,006 | 7,842,762 | 8/31/15 | 143,773 | (39,890 | ) | ||||||||||||||||||||
Euro | DBAB | Sell | 1,482,650 | 1,600,490 | 8/31/15 | 1,457 | (54,764 | ) | ||||||||||||||||||||
Euro | FBCO | Sell | 2,827,631 | 3,117,687 | 8/31/15 | 29,464 | (65,809 | ) | ||||||||||||||||||||
Euro | HSBC | Sell | 1,299,376 | 1,407,514 | 8/31/15 | 2,085 | (43,937 | ) | ||||||||||||||||||||
Euro | SSBT | Sell | 579,504 | 624,702 | 8/31/15 | 833 | (22,530 | ) | ||||||||||||||||||||
Canadian Dollar | BONY | Buy | 405,718 | 328,722 | 9/18/15 | 1,412 | (5,652 | ) | ||||||||||||||||||||
Canadian Dollar | DBAB | Buy | 181,168 | 149,565 | 9/18/15 | — | (4,672 | ) | ||||||||||||||||||||
Canadian Dollar | DBAB | Sell | 10,309,605 | 8,069,250 | 9/18/15 | 3,409 | (179,482 | ) | ||||||||||||||||||||
Canadian Dollar | HSBC | Sell | 148,443 | 120,263 | 9/18/15 | 1,543 | — | |||||||||||||||||||||
Euro | BOFA | Sell | 6,698,465 | 7,214,264 | 10/16/15 | 2,442 | (265,564 | ) | ||||||||||||||||||||
Euro | DBAB | Sell | 1,178,588 | 1,268,416 | 10/16/15 | — | (47,222 | ) | ||||||||||||||||||||
Euro | FBCO | Sell | 5,408,467 | 5,798,721 | 10/16/15 | 1,130 | (239,792 | ) | ||||||||||||||||||||
Euro | HSBC | Sell | 1,665,998 | 1,819,821 | 10/16/15 | 1,938 | (41,843 | ) | ||||||||||||||||||||
Euro | SSBT | Sell | 416,378 | 445,182 | 10/16/15 | 57 | (19,671 | ) | ||||||||||||||||||||
British Pound | BOFA | Buy | 192,738 | 302,862 | 10/22/15 | — | (315 | ) | ||||||||||||||||||||
British Pound | BOFA | Sell | 8,155,831 | 12,456,636 | 10/22/15 | — | (345,795 | ) | ||||||||||||||||||||
British Pound | DBAB | Buy | 361,273 | 561,278 | 10/22/15 | 6,034 | (212 | ) | ||||||||||||||||||||
British Pound | FBCO | Sell | 2,894,373 | 4,312,615 | 10/22/15 | — | (230,761 | ) | ||||||||||||||||||||
British Pound | HSBC | Buy | 174,957 | 274,745 | 10/22/15 | — | (111 | ) | ||||||||||||||||||||
Euro | BOFA | Sell | 7,590,359 | 8,610,628 | 11/18/15 | 141,785 | (9,395 | ) | ||||||||||||||||||||
Euro | BONY | Sell | 2,743,006 | 3,000,574 | 11/18/15 | — | (63,295 | ) | ||||||||||||||||||||
Euro | DBAB | Sell | 4,192,516 | 4,759,752 | 11/18/15 | 76,818 | — | |||||||||||||||||||||
Euro | FBCO | Sell | 456,607 | 512,659 | 11/18/15 | 2,640 | — | |||||||||||||||||||||
Euro | HSBC | Sell | 5,567,090 | 6,327,377 | 11/18/15 | 109,079 | — | |||||||||||||||||||||
Euro | SSBT | Sell | 2,731,871 | 3,076,916 | 11/18/15 | 26,465 | (979 | ) | ||||||||||||||||||||
|
| |||||||||||||||||||||||||||
Totals Forward Exchange Contracts unrealized appreciation (depreciation) |
| $ | 1,193,415 | $ | (2,337,411 | ) | ||||||||||||||||||||||
|
| |||||||||||||||||||||||||||
Net unrealized appreciation (depreciation) |
| $ | (1,143,996 | ) | ||||||||||||||||||||||||
|
| |||||||||||||||||||||||||||
aMay be comprised of multiple contracts with the same counterparty, currency and settlement date.
See Abbreviations on page MGD-35.
| The accompanying notes are an integral part of these financial statements. | Semiannual Report | MGD-19 |
FRANKLIN TEMPLETON VARIABLE INSURANCE PRODUCTS TRUST
Financial Statements
Statement of Assets and Liabilities
June 30, 2015 (unaudited)
| Franklin Mutual Global Discovery VIP Fund | ||||
Assets: | ||||
Investments in securities: | ||||
Cost - Unaffiliated issuers | $ | 588,965,093 | ||
Cost - Repurchase agreements | 443,126 | |||
|
| |||
Total cost of investments | $ | 589,408,219 | ||
|
| |||
Value - Unaffiliated issuers | $ | 740,238,999 | ||
Value - Repurchase agreements | 443,126 | |||
|
| |||
Total value of investments (includes securities loaned in the amount of $429,385) | 740,682,125 | |||
Cash | 1,675,457 | |||
Foreign currency, at value (cost $8,280,145) | 8,276,099 | |||
Receivables: | ||||
Investment securities sold | 586,761 | |||
Capital shares sold | 346,561 | |||
Dividends and interest | 2,277,706 | |||
Due from brokers | 3,690,133 | |||
Variation margin | 342,081 | |||
Unrealized appreciation on OTC forward exchange contracts | 1,193,415 | |||
Other assets | 116,105 | |||
|
| |||
Total assets | 759,186,443 | |||
|
| |||
Liabilities: | ||||
Payables: | ||||
Investment securities purchased | 1,170,809 | |||
Capital shares redeemed | 775,843 | |||
Management fees | 593,067 | |||
Distribution fees | 333,888 | |||
Securities sold short, at value (proceeds $2,302,315) | 2,367,202 | |||
Payable upon return of securities loaned | 443,126 | |||
Unrealized depreciation on OTC forward exchange contracts | 2,337,411 | |||
Accrued expenses and other liabilities | 110,953 | |||
|
| |||
Total liabilities | 8,132,299 | |||
|
| |||
Net assets, at value | $ | 751,054,144 | ||
|
| |||
Net assets consist of: | ||||
Paid-in capital | $ | 499,088,623 | ||
Undistributed net investment income | 27,978,956 | |||
Net unrealized appreciation (depreciation) | 149,960,317 | |||
Accumulated net realized gain (loss) | 74,026,248 | |||
|
| |||
Net assets, at value | $ | 751,054,144 | ||
|
| |||
| MGD-20 | Semiannual Report | The accompanying notes are an integral part of these financial statements. |
FRANKLIN TEMPLETON VARIABLE INSURANCE PRODUCTS TRUST
FINANCIAL STATEMENTS
Statement of Assets and Liabilities (continued)
June 30, 2015 (unaudited)
| Franklin Mutual Global Discovery VIP Fund | ||||
| Class 1: | ||||
Net assets, at value | $ | 2,658,043 | ||
|
| |||
Shares outstanding | 113,940 | |||
|
| |||
Net asset value and maximum offering price per share | $ | 23.33 | ||
|
| |||
| Class 2: | ||||
Net assets, at value | $ | 691,800,269 | ||
|
| |||
Shares outstanding | 30,363,836 | |||
|
| |||
Net asset value and maximum offering price per share | $ | 22.78 | ||
|
| |||
| Class 4: | ||||
Net assets, at value | $ | 56,595,832 | ||
|
| |||
Shares outstanding | 2,454,689 | |||
|
| |||
Net asset value and maximum offering price per share | $ | 23.06 | ||
|
| |||
| The accompanying notes are an integral part of these financial statements. | Semiannual Report | MGD-21 |
FRANKLIN TEMPLETON VARIABLE INSURANCE PRODUCTS TRUST
FINANCIAL STATEMENTS
Statement of Operations
for the six months ended June 30, 2015 (unaudited)
| Franklin Mutual Global Discovery VIP Fund | ||||
Investment income: | ||||
Dividends (net of foreign taxes of $695,588) | $ | 10,966,688 | ||
Interest | 1,221,161 | |||
Income from securities loaned | 77,474 | |||
|
| |||
Total investment income | 12,265,323 | |||
|
| |||
Expenses: | ||||
Management fees (Note 3a) | 3,550,039 | |||
Distribution fees: (Note 3c) | ||||
Class 2 | 871,516 | |||
Class 4 | 103,085 | |||
Custodian fees (Note 4) | 18,308 | |||
Reports to shareholders | 63,350 | |||
Professional fees | 50,542 | |||
Trustees’ fees and expenses | 1,588 | |||
Dividends on securities sold short | 149,955 | |||
Other | 13,166 | |||
|
| |||
Total expenses | 4,821,549 | |||
Expense reductions (Note 4) | (81 | ) | ||
Expenses waived/paid by affiliates (Note 3e) | (321 | ) | ||
|
| |||
Net expenses | 4,821,147 | |||
|
| |||
Net investment income | 7,444,176 | |||
|
| |||
Realized and unrealized gains (losses): | ||||
Net realized gain (loss) from: | ||||
Investments | 29,728,921 | |||
Foreign currency transactions | 8,949,437 | |||
Futures contracts | 3,784,061 | |||
Securities sold short | (9,633 | ) | ||
|
| |||
Net realized gain (loss) | 42,452,786 | |||
|
| |||
Net change in unrealized appreciation (depreciation) on: | ||||
Investments | (20,359,226 | ) | ||
Translation of other assets and liabilities denominated in foreign currencies | (5,760,740 | ) | ||
Futures contracts | (1,112,771 | ) | ||
|
| |||
Net change in unrealized appreciation (depreciation) | (27,232,737 | ) | ||
|
| |||
Net realized and unrealized gain (loss) | 15,220,049 | |||
|
| |||
Net increase (decrease) in net assets resulting from operations | $ | 22,664,225 | ||
|
| |||
| MGD-22 | Semiannual Report | The accompanying notes are an integral part of these financial statements. |
FRANKLIN TEMPLETON VARIABLE INSURANCE PRODUCTS TRUST
FINANCIAL STATEMENTS
Statements of Changes in Net Assets
| Franklin Mutual Global Discovery VIP Fund | ||||||||
| Six Months Ended June 30, 2015 (unaudited) | Year Ended December 31, 2014 | |||||||
Increase (decrease) in net assets: | ||||||||
Operations: | ||||||||
Net investment income | $ | 7,444,176 | $ | 19,755,011 | ||||
Net realized gain (loss) | 42,452,786 | 33,134,405 | ||||||
Net change in unrealized appreciation (depreciation) | (27,232,737 | ) | (10,653,774 | ) | ||||
|
| |||||||
Net increase (decrease) in net assets resulting from operations | 22,664,225 | 42,235,642 | ||||||
|
| |||||||
Distributions to shareholders from: | ||||||||
Net investment income: | ||||||||
Class 1 | — | (43,196 | ) | |||||
Class 2 | — | (14,775,740 | ) | |||||
Class 4 | — | (1,243,714 | ) | |||||
Net realized gains: | ||||||||
Class 1 | — | (119,891 | ) | |||||
Class 2 | — | (45,727,518 | ) | |||||
Class 4 | — | (4,102,276 | ) | |||||
|
| |||||||
Total distributions to shareholders | — | (66,012,335 | ) | |||||
|
| |||||||
Capital share transactions: (Note 2) | ||||||||
Class 1 | 272,389 | (105,551 | ) | |||||
Class 2 | (14,733,670 | ) | 23,195,730 | |||||
Class 4 | (5,134,455 | ) | (8,926,689 | ) | ||||
|
| |||||||
Total capital share transactions | (19,595,736 | ) | 14,163,490 | |||||
|
| |||||||
Net increase (decrease) in net assets | 3,068,489 | (9,613,203 | ) | |||||
Net assets: | ||||||||
Beginning of period | 747,985,655 | 757,598,858 | ||||||
|
| |||||||
End of period | $ | 751,054,144 | $ | 747,985,655 | ||||
|
| |||||||
Undistributed net investment income included in net assets: | ||||||||
End of period | $ | 27,978,956 | $ | 20,534,780 | ||||
|
| |||||||
| The accompanying notes are an integral part of these financial statements. | Semiannual Report | MGD-23 |
FRANKLIN TEMPLETON VARIABLE INSURANCE PRODUCTS TRUST
Notes to Financial Statements (unaudited)
Franklin Mutual Global Discovery VIP Fund
1. Organization and Significant Accounting Policies
Franklin Templeton Variable Insurance Products Trust (Trust) is registered under the Investment Company Act of 1940 (1940 Act) as an open-end management investment company, consisting of nineteen separate funds and applies the specialized accounting and reporting guidance in U.S. Generally Accepted Accounting Principles (U.S. GAAP). Franklin Mutual Global Discovery VIP Fund (Fund) is included in this report. The financial statements of the remaining funds in the Trust are presented separately. Shares of the Fund are generally sold only to insurance company separate accounts to fund the benefits of variable life insurance policies or variable annuity contracts. At June 30, 2015, 56.59% of the Fund’s shares were held through one insurance company. Investment activities of these insurance company separate accounts could have a material impact on the Fund. The Fund offers three classes of shares: Class 1, Class 2 and Class 4. Each class of shares differs by its distribution fees, voting rights on matters affecting a single class and its exchange privilege.
The following summarizes the Fund’s significant accounting policies.
a. Financial Instrument Valuation
The Fund’s investments in financial instruments are carried at fair value daily. Fair value is the price that would be received to sell an asset or paid to transfer a liability in an orderly transaction between market participants on the measurement date. The Fund calculates the net asset value per share at the close of the New York Stock Exchange (NYSE), generally at 4 p.m. Eastern time (NYSE close) on each day the NYSE is open for trading. Under compliance policies and procedures approved by the Trust’s Board of Trustees (the Board), the Fund’s administrator has responsibility for oversight of valuation, including leading the cross-functional Valuation and Liquidity Oversight Committee (VLOC). The VLOC provides administration and oversight of the Fund’s valuation policies and procedures, which are approved annually by the Board. Among other things, these procedures allow the Fund to utilize independent pricing services, quotations from securities and financial instrument dealers, and other market sources to determine fair value.
Equity securities and derivative financial instruments (derivatives) listed on an exchange or on the NASDAQ National Market System are valued at the last quoted sale price or the official closing price of the day, respectively. Foreign equity
securities are valued as of the close of trading on the foreign stock exchange on which the security is primarily traded or as of the NYSE close, whichever is earlier. The value is then converted into its U.S. dollar equivalent at the foreign exchange rate in effect at the NYSE close on the day that the value of the security is determined. Over-the-counter (OTC) securities are valued within the range of the most recent quoted bid and ask prices. Securities that trade in multiple markets or on multiple exchanges are valued according to the broadest and most representative market. Certain equity securities are valued based upon fundamental characteristics or relationships to similar securities.
Debt securities generally trade in the OTC market rather than on a securities exchange. The Fund’s pricing services use multiple valuation techniques to determine fair value. In instances where sufficient market activity exists, the pricing services may utilize a market-based approach through which quotes from market makers are used to determine fair value. In instances where sufficient market activity may not exist or is limited, the pricing services also utilize proprietary valuation models which may consider market characteristics such as benchmark yield curves, credit spreads, estimated default rates, anticipated market interest rate volatility, coupon rates, anticipated timing of principal repayments, underlying collateral, and other unique security features in order to estimate the relevant cash flows, which are then discounted to calculate the fair value. Securities denominated in a foreign currency are converted into their U.S. dollar equivalent at the foreign exchange rate in effect at the NYSE close on the date that the values of the foreign debt securities are determined. Repurchase agreements are valued at cost, which approximates fair value.
Certain derivatives trade in the OTC market. The Fund’s pricing services use various techniques including industry standard option pricing models and proprietary discounted cash flow models to determine the fair value of those instruments. The Fund’s net benefit or obligation under the derivative contract, as measured by the fair value of the contract, is included in net assets.
The Fund has procedures to determine the fair value of financial instruments for which market prices are not reliable or readily available. Under these procedures, the VLOC convenes on a regular basis to review such financial instruments and considers a number of factors, including significant unobservable valuation inputs, when arriving at fair value. The VLOC primarily
| MGD-24 | Semiannual Report |
FRANKLIN TEMPLETON VARIABLE INSURANCE PRODUCTS TRUST
NOTES TO FINANCIAL STATEMENTS (UNAUDITED)
Franklin Mutual Global Discovery VIP Fund (continued)
employs a market-based approach which may use related or comparable assets or liabilities, recent transactions, market multiples, book values, and other relevant information for the investment to determine the fair value of the investment. An income-based valuation approach may also be used in which the anticipated future cash flows of the investment are discounted to calculate fair value. Discounts may also be applied due to the nature or duration of any restrictions on the disposition of the investments. Due to the inherent uncertainty of valuations of such investments, the fair values may differ significantly from the values that would have been used had an active market existed. The VLOC employs various methods for calibrating these valuation approaches including a regular review of key inputs and assumptions, transactional back-testing or disposition analysis, and reviews of any related market activity.
Trading in securities on foreign securities stock exchanges and OTC markets may be completed before the daily NYSE close. In addition, trading in certain foreign markets may not take place on every NYSE business day. Occasionally, events occur between the time at which trading in a foreign security is completed and the close of the NYSE that might call into question the reliability of the value of a portfolio security held by the Fund. As a result, differences may arise between the value of the Fund’s portfolio securities as determined at the foreign market close and the latest indications of value at the close of the NYSE. In order to minimize the potential for these differences, the VLOC monitors price movements following the close of trading in foreign stock markets through a series of country specific market proxies (such as baskets of American Depositary Receipts, futures contracts and exchange traded funds). These price movements are measured against established trigger thresholds for each specific market proxy to assist in determining if an event has occurred that may call into question the reliability of the values of the foreign securities held by the Fund. If such an event occurs, the securities may be valued using fair value procedures, which may include the use of independent pricing services.
When the last day of the reporting period is a non-business day, certain foreign markets may be open on those days that the NYSE is closed, which could result in differences between the value of the Fund’s portfolio securities on the last business day and the last calendar day of the reporting period. Any significant security valuation changes due to an open foreign market are adjusted and reflected by the Fund for financial reporting purposes.
b. Foreign Currency Translation
Portfolio securities and other assets and liabilities denominated in foreign currencies are translated into U.S. dollars based on the exchange rate of such currencies against U.S. dollars on the date of valuation. The Fund may enter into foreign currency exchange contracts to facilitate transactions denominated in a foreign currency. Purchases and sales of securities, income and expense items denominated in foreign currencies are translated into U.S. dollars at the exchange rate in effect on the transaction date. Portfolio securities and assets and liabilities denominated in foreign currencies contain risks that those currencies will decline in value relative to the U.S. dollar. Occasionally, events may impact the availability or reliability of foreign exchange rates used to convert the U.S. dollar equivalent value. If such an event occurs, the foreign exchange rate will be valued at fair value using procedures established and approved by the Board.
The Fund does not separately report the effect of changes in foreign exchange rates from changes in market prices on securities held. Such changes are included in net realized and unrealized gain or loss from investments in the Statement of Operations.
Realized foreign exchange gains or losses arise from sales of foreign currencies, currency gains or losses realized between the trade and settlement dates on securities transactions and the difference between the recorded amounts of dividends, interest, and foreign withholding taxes and the U.S. dollar equivalent of the amounts actually received or paid. Net unrealized foreign exchange gains and losses arise from changes in foreign exchange rates on foreign denominated assets and liabilities other than investments in securities held at the end of the reporting period.
c. Joint Repurchase Agreement
The Fund enters into a joint repurchase agreement whereby its uninvested cash balance is deposited into a joint cash account with other funds managed by the investment manager or an affiliate of the investment manager and is used to invest in one or more repurchase agreements. The value and face amount of the joint repurchase agreement are allocated to the funds based on their pro-rata interest. A repurchase agreement is accounted for as a loan by the Fund to the seller, collateralized by securities which are delivered to the Fund’s custodian. The fair value, including accrued interest, of the initial collateralization is required to be at least 102% of the dollar amount invested by
| Semiannual Report | MGD-25 |
FRANKLIN TEMPLETON VARIABLE INSURANCE PRODUCTS TRUST
NOTES TO FINANCIAL STATEMENTS (UNAUDITED)
Franklin Mutual Global Discovery VIP Fund (continued)
1. Organization and Significant Accounting Policies (continued)
c. Joint Repurchase Agreement (continued)
the funds, with the value of the underlying securities marked to market daily to maintain coverage of at least 100%. Repurchase agreements are subject to the terms of Master Repurchase Agreements (MRAs) with approved counterparties (sellers). The MRAs contain various provisions, including but not limited to events of default and maintenance of collateral for repurchase agreements. In the event of default by either the seller or the Fund, certain MRAs may permit the non-defaulting party to net and close-out all transactions, if any, traded under such agreements. The Fund may sell securities it holds as collateral and apply the proceeds towards the repurchase price and any other amounts owed by the seller to the Fund in the event of default by the seller. This could involve costs or delays in addition to a loss on the securities if their value falls below the repurchase price owed by the seller. The joint repurchase agreement held by the Fund at period end, as indicated in the Statement of Investments, had been entered into on June 30, 2015.
d. Derivative Financial Instruments
The Fund invested in derivatives in order to manage risk or gain exposure to various other investments or markets. Derivatives are financial contracts based on an underlying or notional amount, require no initial investment or an initial net investment that is smaller than would normally be required to have a similar response to changes in market factors, and require or permit net settlement. Derivatives contain various risks including the potential inability of the counterparty to fulfill their obligations under the terms of the contract, the potential for an illiquid secondary market, and/or the potential for market movements which expose the Fund to gains or losses in excess of the amounts shown in the Statement of Assets and Liabilities. Realized gain and loss and unrealized appreciation and depreciation on these contracts for the period are included in the Statement of Operations.
Derivative counterparty credit risk is managed through a formal evaluation of the creditworthiness of all potential counterparties. The Fund attempts to reduce its exposure to counterparty credit risk on OTC derivatives, whenever possible, by entering into International Swaps and Derivatives Association (ISDA) master agreements with certain counterparties. These agreements contain various provisions, including but not limited to collateral
requirements, events of default, or early termination. Termination events applicable to the counterparty include certain deteriorations in the credit quality of the counterparty. Termination events applicable to the Fund include failure of the Fund to maintain certain net asset levels and/or limit the decline in net assets over various periods of time. In the event of default or early termination, the ISDA master agreement gives the non-defaulting party the right to net and close-out all transactions traded, whether or not arising under the ISDA agreement, to one net amount payable by one counterparty to the other. However, absent an event of default or early termination, OTC derivative assets and liabilities are presented gross and not offset in the Statement of Assets and Liabilities. Early termination by the counterparty may result in an immediate payment by the Fund of any net liability owed to that counterparty under the ISDA agreement. At June 30, 2015, the Fund had OTC derivatives in a net liability position of $1,231,536 and the aggregate value of collateral pledged for such contracts was $1,828,183.
Collateral requirements differ by type of derivative. Collateral or initial margin requirements are set by the broker or exchange clearing house for exchange traded and centrally cleared derivatives. Initial margin deposited is held at the exchange and can be in the form of cash and/or securities. For OTC derivatives traded under an ISDA master agreement, posting of collateral is required by either the fund or the applicable counterparty if the total net exposure of all OTC derivatives with the applicable counterparty exceeds the minimum transfer amount, which typically ranges from $100,000 to $250,000, and can vary depending on the counterparty and the type of the agreement. Generally, collateral is determined at the close of fund business each day and any additional collateral required due to changes in derivative values may be delivered by the fund or the counterparty within a few business days. Collateral pledged and/or received by the fund for OTC derivatives, if any, is held in segregated accounts with the fund’s custodian/counterparty broker and can be in the form of cash and/or securities. Unrestricted cash may be invested according to the Fund’s investment objectives.
The Fund entered into exchange traded futures contracts primarily to manage exposure to certain foreign currencies. A futures contract is an agreement between the Fund and a counterparty to buy or sell an asset for a specified price on a future date. Required initial margins are pledged by the Fund, and the daily change in fair value is accounted for as a variation margin payable or receivable in the Statement of Assets and Liabilities.
| MGD-26 | Semiannual Report |
FRANKLIN TEMPLETON VARIABLE INSURANCE PRODUCTS TRUST
NOTES TO FINANCIAL STATEMENTS (UNAUDITED)
Franklin Mutual Global Discovery VIP Fund (continued)
The Fund entered into OTC forward exchange contracts primarily to manage exposure to certain foreign currencies. A forward exchange contract is an agreement between the Fund and a counterparty to buy or sell a foreign currency at a specific exchange rate on a future date.
See Note 9 regarding other derivative information.
e. Securities Sold Short
The Fund is engaged in selling securities short, which obligates the Fund to replace a borrowed security with the same security at current fair value. The Fund incurs a loss if the price of the security increases between the date of the short sale and the date on which the Fund replaces the borrowed security. The Fund realizes a gain if the price of the security declines between those dates. Gains are limited to the price at which the Fund sold the security short, while losses are potentially unlimited in size.
The Fund is required to establish a margin account with the broker lending the security sold short. While the short sale is outstanding, the broker retains the proceeds of the short sale to the extent necessary to meet margin requirements until the short position is closed out. A deposit must also be maintained with the Fund’s custodian/counterparty broker consisting of cash and/or securities having a value equal to a specified percentage of the value of the securities sold short. The Fund is obligated to pay fees for borrowing the securities sold short and is required to pay the counterparty any dividends and/or interest due on securities sold short. Such dividends and/or interest and any security borrowing fees are recorded as an expense to the Fund.
f. Securities Lending
The Fund participates in an agency based securities lending program to earn additional income. The Fund receives cash collateral against the loaned securities in an amount equal to at least 102% of the fair value of the loaned securities. Collateral is maintained over the life of the loan in an amount not less than 100% of the fair value of loaned securities, as determined at the close of fund business each day; any additional collateral required due to changes in security values is delivered to the Fund on the next business day. The collateral is deposited into a joint cash account with other funds and is used to invest in a money market fund managed by Franklin Advisers, Inc., an affiliate of the Fund, and/or a joint repurchase agreement. The total cash collateral received at period end was $443,126. The Fund may receive income from the investment of cash collateral, in addition to lending fees and
rebates paid by the borrower. Income from securities loaned is reported separately in the Statement of Operations. The Fund bears the market risk with respect to the collateral investment, securities loaned, and the risk that the agent may default on its obligations to the Fund. If the borrower defaults on its obligation to return the securities loaned, the Fund has the right to repurchase the securities in the open market using the collateral received. The securities lending agent has agreed to indemnify the Fund in the event of default by a third party borrower.
g. Senior Floating Rate Interests
The Fund invests in senior secured corporate loans that pay interest at rates which are periodically reset by reference to a base lending rate plus a spread. These base lending rates are generally the prime rate offered by a designated U.S. bank or the London InterBank Offered Rate (LIBOR). Senior secured corporate loans often require prepayment of principal from excess cash flows or at the discretion of the borrower. As a result, actual maturity may be substantially less than the stated maturity. Senior secured corporate loans in which the Fund invests are generally readily marketable, but may be subject to certain restrictions on resale.
h. Income and Deferred Taxes
It is the Fund’s policy to qualify as a regulated investment company under the Internal Revenue Code. The Fund intends to distribute to shareholders substantially all of its taxable income and net realized gains to relieve it from federal income and if applicable, excise taxes. As a result, no provision for U.S. federal income taxes is required.
The Fund may be subject to foreign taxation related to income received, capital gains on the sale of securities and certain foreign currency transactions in the foreign jurisdictions in which it invests. Foreign taxes, if any, are recorded based on the tax regulations and rates that exist in the foreign markets in which the Fund invests. When a capital gain tax is determined to apply, the Fund records an estimated deferred tax liability in an amount that would be payable if the securities were disposed of on the valuation date. As a result of several court cases, in certain countries across the European Union, the Fund has filed additional tax reclaims for previously withheld taxes on dividends earned in those countries. These additional filings are subject to various administrative proceedings by the local jurisdictions’ tax authorities within the European Union, as well as a number of related judicial proceedings. At this time, uncertainty
| Semiannual Report | MGD-27 |
FRANKLIN TEMPLETON VARIABLE INSURANCE PRODUCTS TRUST
NOTES TO FINANCIAL STATEMENTS (UNAUDITED)
Franklin Mutual Global Discovery VIP Fund (continued)
1. Organization and Significant Accounting Policies (continued)
h. Income and Deferred Taxes (continued)
exists as to the ultimate resolution of these proceedings, the likelihood of receipt of these reclaims, and the potential timing of payment, and accordingly, no amounts are reflected in the financial statements.
The Fund recognizes the tax benefits of uncertain tax positions only when the position is “more likely than not” to be sustained upon examination by the tax authorities based on the technical merits of the tax position. As of June 30, 2015, and for all open tax years, the Fund has determined that no liability for unrecognized tax benefits is required in the Fund’s financial statements related to uncertain tax positions taken on a tax return (or expected to be taken on future tax returns). Open tax years are those that remain subject to examination and are based on each tax jurisdiction’s statute of limitation.
i. Security Transactions, Investment Income, Expenses and Distributions
Security transactions are accounted for on trade date. Realized gains and losses on security transactions are determined on a specific identification basis. Interest income and estimated expenses are accrued daily. Amortization of premium and accretion of discount on debt securities are included in interest income. Dividend income and dividends declared on securities sold short are recorded on the ex-dividend date except for certain dividends from foreign securities where the dividend rate is not available. In such cases, the dividend is recorded as soon as the information is received by the Fund. Distributions to shareholders are recorded on the ex-dividend date and are determined according to income tax regulations (tax basis). Distributable earnings determined on a tax basis may differ from earnings recorded in accordance with U.S. GAAP. These differences may
be permanent or temporary. Permanent differences are reclassified among capital accounts to reflect their tax character. These reclassifications have no impact on net assets or the results of operations. Temporary differences are not reclassified, as they may reverse in subsequent periods.
Common expenses incurred by the Trust are allocated among the funds based on the ratio of net assets of each fund to the combined net assets of the Trust. Fund specific expenses are charged directly to the fund that incurred the expense.
Realized and unrealized gains and losses and net investment income, not including class specific expenses, are allocated daily to each class of shares based upon the relative proportion of net assets of each class. Differences in per share distributions, by class, are generally due to differences in class specific expenses.
j. Accounting Estimates
The preparation of financial statements in accordance with U.S. GAAP requires management to make estimates and assumptions that affect the reported amounts of assets and liabilities at the date of the financial statements and the amounts of income and expenses during the reporting period. Actual results could differ from those estimates.
k. Guarantees and Indemnifications
Under the Trust’s organizational documents, its officers and trustees are indemnified by the Trust against certain liabilities arising out of the performance of their duties to the Trust. Additionally, in the normal course of business, the Trust, on behalf of the Fund, enters into contracts with service providers that contain general indemnification clauses. The Trust’s maximum exposure under these arrangements is unknown as this would involve future claims that may be made against the Trust that have not yet occurred. Currently, the Trust expects the risk of loss to be remote.
| MGD-28 | Semiannual Report |
FRANKLIN TEMPLETON VARIABLE INSURANCE PRODUCTS TRUST
NOTES TO FINANCIAL STATEMENTS (UNAUDITED)
Franklin Mutual Global Discovery VIP Fund (continued)
2. Shares of Beneficial Interest
At June 30, 2015, there were an unlimited number of shares authorized (without par value). Transactions in the Fund’s shares were as follows:
| Six Months Ended June 30, 2015 | Year Ended December 31, 2014 | |||||||||||||||||
| Shares | Amount | Shares | Amount | |||||||||||||||
| Class 1 Shares: | ||||||||||||||||||
Shares sold | 17,767 | $ | 417,021 | 31,917 | $ | 725,026 | ||||||||||||
Shares issued in reinvestment of distributions | — | — | 7,051 | 163,086 | ||||||||||||||
Shares redeemed | (6,122 | ) | (144,632 | ) | (42,408 | ) | (993,663 | ) | ||||||||||
|
| |||||||||||||||||
Net increase (decrease) | 11,645 | $ | 272,389 | (3,440 | ) | $ | (105,551 | ) | ||||||||||
|
| |||||||||||||||||
| Class 2 Shares: | ||||||||||||||||||
Shares sold | 1,667,604 | $ | 38,187,668 | 4,023,757 | $ | 92,853,300 | ||||||||||||
Shares issued in reinvestment of distributions | — | — | 2,672,405 | 60,503,258 | ||||||||||||||
Shares redeemed | (2,312,054 | ) | (52,921,338 | ) | (5,665,511 | ) | (130,160,828 | ) | ||||||||||
|
| |||||||||||||||||
Net increase (decrease) | (644,450 | ) | $ | (14,733,670 | ) | 1,030,651 | $ | 23,195,730 | ||||||||||
|
| |||||||||||||||||
| Class 4 Shares: | ||||||||||||||||||
Shares sold | 50,867 | $ | 1,177,675 | 84,657 | $ | 1,961,531 | ||||||||||||
Shares issued in reinvestment of distributions | — | — | 233,144 | 5,345,990 | ||||||||||||||
Shares redeemed | (274,259 | ) | (6,312,130 | ) | (685,719 | ) | (16,234,210 | ) | ||||||||||
|
| |||||||||||||||||
Net increase (decrease) | (223,392 | ) | $ | (5,134,455 | ) | (367,918 | ) | $ | (8,926,689 | ) | ||||||||
|
| |||||||||||||||||
3. Transactions With Affiliates
Franklin Resources, Inc. is the holding company for various subsidiaries that together are referred to as Franklin Templeton Investments. Certain officers and trustees of the Fund are also officers and/or directors of the following subsidiaries:
| Subsidiary | Affiliation | |
Franklin Mutual Advisers, LLC (Franklin Mutual) | Investment manager | |
Franklin Templeton Services, LLC (FT Services) | Administrative manager | |
Franklin Templeton Distributors, Inc. (Distributors) | Principal underwriter | |
Franklin Templeton Investor Services, LLC (Investor Services) | Transfer agent |
a. Management Fees
The Fund pays an investment management fee to Franklin Mutual based on the average daily net assets of the Fund as follows:
| Annualized Fee Rate | Net Assets | |
0.950% | Up to and including $200 million | |
0.935% | Over $200 million, up to and including $700 million | |
0.900% | Over $700 million, up to and including $1.2 billion | |
0.875% | Over $1.2 billion, up to and including $4 billion | |
0.845% | Over $4 billion, up to and including $7 billion | |
0.825% | Over $7 billion, up to and including $10 billion | |
0.805% | In excess of $10 billion |
| Semiannual Report | MGD-29 |
FRANKLIN TEMPLETON VARIABLE INSURANCE PRODUCTS TRUST
NOTES TO FINANCIAL STATEMENTS (UNAUDITED)
Franklin Mutual Global Discovery VIP Fund (continued)
3. Transactions With Affiliates (continued)
b. Administrative Fees
Under an agreement with Franklin Mutual, FT Services provides administrative services to the Fund. The fee is paid by Franklin Mutual based on the Fund’s average daily net assets, and is not an additional expense of the Fund.
c. Distribution Fees
The Board has adopted distribution plans for Class 2 and Class 4 shares pursuant to Rule 12b-1 under the 1940 Act. Under the Fund’s compensation distribution plans, the Fund pays Distributors for costs incurred in connection with the servicing, sale and distribution of the Fund’s shares up to 0.35% per year of its average daily net assets of each class. Some distribution fees are not charged on shares held by affiliates. The Board has agreed to limit the current rate to 0.25% per year for Class 2. The plan year, for purposes of monitoring compliance with the maximum annual plan rates, is February 1 through January 31.
d. Transfer Agent Fees
Investor Services, under terms of an agreement, performs shareholder servicing for the Fund and is not paid by the Fund for the services.
e. Investments in Institutional Fiduciary Trust Money Market Portfolio
The Fund invests in Institutional Fiduciary Trust Money Market Portfolio (Sweep Money Fund), an affiliated open-end management investment company. Management fees paid by the Fund are waived on assets invested in the Sweep Money Fund, as noted in the Statement of Operations, in an amount not to exceed the management and administrative fees paid directly or indirectly by the Sweep Money Fund.
4. Expense Offset Arrangement
The Fund has entered into an arrangement with its custodian whereby credits realized as a result of uninvested cash balances are used to reduce a portion of the Fund’s custodian expenses. During the period ended June 30, 2015, the custodian fees were reduced as noted in the Statement of Operations.
5. Income Taxes
At June 30, 2015, the cost of investments and net unrealized appreciation (depreciation) for income tax purposes were as follows:
Cost of investments | $ | 589,361,122 | ||
|
| |||
Unrealized appreciation | $ | 185,356,220 | ||
Unrealized depreciation | (34,035,217 | ) | ||
|
| |||
Net unrealized appreciation (depreciation) | $ | 151,321,003 | ||
|
|
Differences between income and/or capital gains as determined on a book basis and a tax basis are primarily due to differing treatments of foreign currency transactions, tax straddles and bond discounts and premiums.
6. Investment Transactions
Purchases and sales of investments (excluding short term securities and securities sold short) for the period ended June 30, 2015, aggregated $87,961,711 and $92,054,020, respectively.
7. Credit Risk and Defaulted Securities
The Fund may purchase the pre-default or defaulted debt of distressed companies. Distressed companies are financially troubled and are about to be or are already involved in financial restructuring or bankruptcy. Risks associated with purchasing these securities
| MGD-30 | Semiannual Report |
FRANKLIN TEMPLETON VARIABLE INSURANCE PRODUCTS TRUST
NOTES TO FINANCIAL STATEMENTS (UNAUDITED)
Franklin Mutual Global Discovery VIP Fund (continued)
include the possibility that the bankruptcy or other restructuring process takes longer than expected, or that distributions in restructuring are less than anticipated, either or both of which may result in unfavorable consequences to the Fund. If it becomes probable that the income on debt securities, including those of distressed companies, will not be collected, the Fund discontinues accruing income and recognizes an adjustment for uncollectible interest.
At June 30, 2015, the aggregate long value of distressed company securities for which interest recognition has been discontinued was $8,057,459, representing 1.07% of the Fund’s net assets. For information as to specific securities, see the accompanying Statement of Investments.
8. Restricted Securities
The Fund invests in securities that are restricted under the Securities Act of 1933 (1933 Act) or which are subject to legal, contractual, or other agreed upon restrictions on resale. Restricted securities are often purchased in private placement transactions, and cannot be sold without prior registration unless the sale is pursuant to an exemption under the 1933 Act. Disposal of these securities may require greater effort and expense, and prompt sale at an acceptable price may be difficult. The Fund may have registration rights for restricted securities. The issuer generally incurs all registration costs.
At June 30, 2015, the Fund held investments in restricted securities, excluding certain securities exempt from registration under the 1933 Act deemed to be liquid, as follows:
| Principal Amount/ Shares/ Units | Issuer | Acquisition Dates | Cost | Value | ||||||||||
| 595 | Broadband Ventures III LLC, secured promissory note, 5.00%, 2/01/12 | 7/01/10 - 11/30/12 | $ | 595 | $ | — | ||||||||
| 2,077,368 | FIM Coinvestor Holdings I, LLC | 11/20/06 - 6/02/09 | — | — | ||||||||||
| 2,172,000 | Hightower Holding LLC, pfd., A, Series 2 | 6/10/10 - 5/10/12 | 5,430,000 | 6,300,320 | ||||||||||
| 424,073 | International Automotive Components Group Brazil LLC | 4/13/06 - 12/26/08 | 281,629 | 37,011 | ||||||||||
| 4,052,916 | International Automotive Components Group North America LLC | 1/12/06 - 3/18/13 | 3,247,714 | 3,607,152 | ||||||||||
|
| |||||||||||||
Total Restricted Securities (Value is 1.32% of Net Assets) | $ | 8,959,938 | $ | 9,944,483 | ||||||||||
|
| |||||||||||||
9. Other Derivative Information
At June 30, 2015, the Fund’s investments in derivative contracts are reflected in the Statement of Assets and Liabilities as follows:
Asset Derivatives | Liability Derivatives | |||||||||||
| Derivative Contracts Not Accounted for as Hedging Instruments | Statement of Assets and Liabilities Location | Fair Value | Statement of Assets and Liabilities Location | Fair Value | ||||||||
Foreign exchange contracts | Variation margin | $ | 424,404 | a | Variation margin | $ | 521,950 | a | ||||
Unrealized appreciation on OTC forward exchange contracts | 1,193,415 | Unrealized depreciation on OTC forward exchange contracts | 2,337,411 | |||||||||
|
|
|
| |||||||||
Totals | $ | 1,617,819 | $ | 2,859,361 | ||||||||
|
|
|
| |||||||||
aThis amount reflects the cumulative appreciation (depreciation) of futures contracts as reported in the Statement of Investments. Only the variation margin receivable/payable at period end is separately reported within the Statement of Assets and Liabilities. Prior variation margin movements were recorded to cash upon receipt or payment.
| Semiannual Report | MGD-31 |
FRANKLIN TEMPLETON VARIABLE INSURANCE PRODUCTS TRUST
NOTES TO FINANCIAL STATEMENTS (UNAUDITED)
Franklin Mutual Global Discovery VIP Fund (continued)
9. Other Derivative Information (continued)
For the period ended June 30, 2015, the effect of derivative contracts in the Fund’s Statement of Operations was as follows:
| Derivative Contracts Not Accounted for as Hedging Instruments | Statement of Operations Locations | Net Realized Gain (Loss) for the Period | Statement of Operations Locations | Net Change in Unrealized Appreciation (Depreciation) for the Period | ||||||||
Net realized gain (loss) from: | Net change in unrealized appreciation (depreciation) on: | |||||||||||
Foreign exchange contracts | Foreign currency transactions | $ | 9,013,685 | a | Translation of other assets and liabilities denominated in foreign currencies | $ | (5,760,455 | )a | ||||
Futures contracts | 3,784,061 | Futures contracts | (1,112,771 | ) | ||||||||
|
|
|
| |||||||||
Totals | $ | 12,797,746 | $ | (6,873,226 | ) | |||||||
|
|
|
| |||||||||
aForward exchange contracts are included in net realized gain (loss) from foreign currency transactions and net change in unrealized appreciation (depreciation) on translation of other assets and liabilities denominated in foreign currencies in the Statement of Operations.
For the period ended June 30, 2015, the average month end fair value of derivatives represented 0.99% of average month end net assets. The average month end number of open derivative contracts for the period was 236.
See Note 1(d) regarding derivative financial instruments.
10. Credit Facility
The Fund, together with other U.S. registered and foreign investment funds (collectively, Borrowers), managed by Franklin Templeton Investments, are borrowers in a joint syndicated senior unsecured credit facility totaling $2 billion (Global Credit Facility) which matures on February 12, 2016. This Global Credit Facility provides a source of funds to the Borrowers for temporary and emergency purposes, including the ability to meet future unanticipated or unusually large redemption requests.
Under the terms of the Global Credit Facility, the Fund shall, in addition to interest charged on any borrowings made by the Fund and other costs incurred by the Fund, pay its share of fees and expenses incurred in connection with the implementation and maintenance of the Global Credit Facility, based upon its relative share of the aggregate net assets of all of the Borrowers, including an annual commitment fee of 0.07% based upon the unused portion of the Global Credit Facility. These fees are reflected in other expenses in the Statement of Operations. During the period ended June 30, 2015, the Fund did not use the Global Credit Facility.
11. Fair Value Measurements
The Fund follows a fair value hierarchy that distinguishes between market data obtained from independent sources (observable inputs) and the Fund’s own market assumptions (unobservable inputs). These inputs are used in determining the value of the Fund’s financial instruments and are summarized in the following fair value hierarchy:
| • | Level 1 – quoted prices in active markets for identical financial instruments |
| • | Level 2 – other significant observable inputs (including quoted prices for similar financial instruments, interest rates, prepayment speed, credit risk, etc.) |
| • | Level 3 – significant unobservable inputs (including the Fund’s own assumptions in determining the fair value of financial instruments) |
The input levels are not necessarily an indication of the risk or liquidity associated with financial instruments at that level.
| MGD-32 | Semiannual Report |
FRANKLIN TEMPLETON VARIABLE INSURANCE PRODUCTS TRUST
NOTES TO FINANCIAL STATEMENTS (UNAUDITED)
Franklin Mutual Global Discovery VIP Fund (continued)
For movements between the levels within the fair value hierarchy, the Fund has adopted a policy of recognizing the transfers as of the date of the underlying event which caused the movement.
A summary of inputs used as of June 30, 2015, in valuing the Fund’s assets and liabilities carried at fair value, is as follows:
| Level 1 | Level 2 | Level 3 | Total | |||||||||||||
| Assets: | ||||||||||||||||
Investments in Securities | ||||||||||||||||
Equity Investments:a | ||||||||||||||||
Auto Components | $ | 3,226,212 | $ | — | $ | 3,644,163 | $ | 6,870,375 | ||||||||
Banks | 126,646,904 | 7,846,632 | — | 134,493,536 | ||||||||||||
Diversified Financial Services | — | — | 6,300,320 | 6,300,320 | ||||||||||||
All Other Equity Investmentsb | 549,028,713 | — | — | c | 549,028,713 | |||||||||||
Corporate Bonds, Notes and Senior Floating Rate Interests | — | 19,143,594 | — | 19,143,594 | ||||||||||||
Corporate Notes and Senior Floating Rate Interests in Reorganization | — | 8,057,459 | — | c | 8,057,459 | |||||||||||
Companies in Liquidation | — | 2,313,751 | — | c | 2,313,751 | |||||||||||
Municipal Bonds | — | 1,531,828 | — | 1,531,828 | ||||||||||||
Short Term Investments | 9,999,423 | 2,943,126 | — | 12,942,549 | ||||||||||||
|
| |||||||||||||||
Total Investments in Securities | $ | 688,901,252 | $ | 41,836,390 | $ | 9,944,483 | $ | 740,682,125 | ||||||||
|
| |||||||||||||||
Other Financial Instruments | ||||||||||||||||
Futures Contracts | $ | 424,404 | $ | — | $ | — | $ | 424,404 | ||||||||
Forward Exchange Contracts | — | 1,193,415 | — | 1,193,415 | ||||||||||||
|
| |||||||||||||||
Total Other Financial Instruments | $ | 424,404 | $ | 1,193,415 | $ | — | $ | 1,617,819 | ||||||||
|
| |||||||||||||||
| Liabilities: | ||||||||||||||||
Other Financial Instruments | ||||||||||||||||
Securities Sold Short | $ | 2,367,202 | $ | — | $ | — | $ | 2,367,202 | ||||||||
Futures Contracts | 521,950 | — | — | 521,950 | ||||||||||||
Forward Exchange Contracts | — | 2,337,411 | — | 2,337,411 | ||||||||||||
|
| |||||||||||||||
Total Other Financial Instruments | $ | 2,889,152 | $ | 2,337,411 | $ | — | $ | 5,226,563 | ||||||||
|
| |||||||||||||||
aIncludes common and preferred stocks as well as other equity investments.
bFor detailed categories, see the accompanying Statement of Investments.
cIncludes securities determined to have no value at June 30, 2015.
| Semiannual Report | MGD-33 |
FRANKLIN TEMPLETON VARIABLE INSURANCE PRODUCTS TRUST
NOTES TO FINANCIAL STATEMENTS (UNAUDITED)
Franklin Mutual Global Discovery VIP Fund (continued)
11. Fair Value Measurements (continued)
A reconciliation of assets in which Level 3 inputs are used in determining fair value is presented when there are significant Level 3 financial instruments at the end of the period. At June 30, 2015, the reconciliation of assets is as follows:
| Balance at Beginning of Period | Purchases | Sales | Transfers Into (Out of) Level 3 | Cost Basis Adjustmentsa | Net Realized Gain (Loss) | Net Unrealized Appreciation (Depreciation) | Balance at End of Period | Net Change in Unrealized Appreciation (Depreciation) on Assets Held at Period End | ||||||||||||||||||||||||||||
| Assets: | ||||||||||||||||||||||||||||||||||||
Investments in Securities: | ||||||||||||||||||||||||||||||||||||
Equity Investments:b | ||||||||||||||||||||||||||||||||||||
Auto Components | $ | 3,108,896 | $ | — | $ | — | $ | — | $ | — | $ | — | $ | 535,267 | $ | 3,644,163 | $ | 535,267 | ||||||||||||||||||
Diversified Financial Services | 5,052,941 | — | — | — | — | — | 1,247,379 | 6,300,320 | 1,247,379 | |||||||||||||||||||||||||||
Insurance | — | c | — | (834 | ) | — | — | (199,086 | ) | 199,920 | — | — | ||||||||||||||||||||||||
Real Estate Management & Development | 4,108,670 | — | (4,881,451 | ) | — | — | 2,540,917 | (1,768,136 | ) | — | — | |||||||||||||||||||||||||
|
| |||||||||||||||||||||||||||||||||||
Total Investments in Securities | $ | 12,270,507 | $ | — | $ | (4,882,285 | ) | $ | — | $ | — | $ | 2,341,831 | $ | 214,430 | $ | 9,944,483 | $ | 1,782,646 | |||||||||||||||||
|
| |||||||||||||||||||||||||||||||||||
aMay include accretion, amortization, partnership adjustments, and/or other cost basis adjustments.
bIncludes common and preferred stocks as well as other equity investments.
cIncludes securities determined to have no value.
Significant unobservable valuation inputs developed by the VLOC for material Level 3 financial instruments and impact to fair value as a result of changes in unobservable valuation inputs as of June 30, 2015, are as follows:
| Description | Fair Value at End of Period | Valuation Technique | Unobservable Inputs | Amount/ Range | Impact to Fair Value if Input Increasesa | |||||||||||
| Assets: | ||||||||||||||||
| Investments in Securities: | ||||||||||||||||
Equity Investments:b | ||||||||||||||||
Auto Components | $ | 3,607,152 | Market comparables | Discount for lack of marketability EV / EBITDA multiple |
| 10% 4.1x |
|
| Decrease Increase | c d | ||||||
Diversified Financial Services | 6,300,320 | Discounted Cash Flow Model | Cost of equity Long-term revenue growth rate Adjusted EBITDA margin | | 15% 6.2% - 33.4% 7.0% - 20.1% | |
| Decrease Increase Increase | d d c | |||||||
All Other Investmentse | 37,011 | |||||||||||||||
Total | $ | 9,944,483 | ||||||||||||||
aRepresents the directional change in the fair value of the Level 3 financial instruments that would result from a significant and reasonable increase in the corresponding input. A significant and reasonable decrease in input would have the opposite effect. Significant impacts, if any, to fair value and/or net assets have been indicated.
bIncludes common and preferred stocks.
cRepresents a significant impact to fair value but not net assets.
dRepresents a significant impact to fair value and net assets.
eIncludes fair value of immaterial financial instruments developed using various valuation techniques and unobservable inputs. May also include financial instruments with values derived using prior transaction prices or third party pricing information without adjustment for which such inputs are also unobservable.
Abbreviations List
| EBITDA | Earnings before interest, taxes, depreciation and amortization | |
| EV | Enterprise value | |
| MGD-34 | Semiannual Report |
FRANKLIN TEMPLETON VARIABLE INSURANCE PRODUCTS TRUST
NOTES TO FINANCIAL STATEMENTS (UNAUDITED)
Franklin Mutual Global Discovery VIP Fund (continued)
12. New Accounting Pronouncements
In June 2014, the Financial Accounting Standards Board issued Accounting Standards Update (ASU) No. 2014-11, Transfers and Servicing (Topic 860), Repurchase-to-Maturity Transactions, Repurchase Financings, and Disclosures. The ASU changes the accounting for certain repurchase agreements and expands disclosure requirements related to repurchase agreements, securities lending, repurchase-to-maturity and similar transactions. The ASU is effective for certain transactions accounted for as a sale for interim and annual reporting periods beginning after December 15, 2014, and transactions accounted for as secured borrowings for annual periods beginning after December 15, 2014, and for interim periods beginning after March 15, 2015. Management has reviewed the requirements and believes the adoption of this ASU will not have a material impact on the financial statements.
13. Subsequent Events
The Fund has evaluated subsequent events through the issuance of the financial statements and determined that no events have occurred that require disclosure.
Abbreviations
| Counterparty | Currency | Selected Portfolio | ||||||||
| BOFA | Bank of America N.A. | CHF | Swiss Franc | ADR | American Depositary Receipt | |||||
| BONY | Bank of New York Mellon | EUR | Euro | FHLB | Federal Home Loan Bank | |||||
| BZWS | Barclays Bank PLC | GBP | British Pound | GO | General Obligation | |||||
| DBAB | Deutsche Bank AG | USD | United States Dollar | IDR | International Depositary Receipt | |||||
| FBCO | Credit Suisse Group AG | PIK | Payment-In-Kind | |||||||
| HSBC | HSBC Bank USA, N.A. | |||||||||
| SSBT | State Street Bank and Trust Co. | |||||||||
| Semiannual Report | MGD-35 |
Franklin Mutual Shares VIP Fund
We are pleased to bring you Franklin Mutual Shares VIP Fund’s semiannual report for the period ended June 30, 2015.
Class 1 Performance Summary as of June 30, 2015
The Fund’s Class 1 shares delivered a +2.18% total return* for the six-month period ended June 30, 2015.
*The Fund has a fee waiver associated with any investment in a Franklin Templeton money fund, contractually guaranteed through at least its current fiscal year-end. Fund investment results reflect the fee waiver, to the extent applicable; without this reduction, the results would have been lower.
Performance reflects the Fund’s Class 1 operating expenses, but does not include any contract fees, expenses or sales charges. If they had been included, performance would be lower. These charges and deductions, particularly for variable life policies, can have a significant effect on contract values and insurance benefits. See the contract prospectus for a complete description of these expenses, including sales charges.
Performance data represent past performance, which does not guarantee future results. Investment return and principal value will fluctuate, and you may have a gain or loss when you sell your shares. Current performance may differ from figures shown.
| Semiannual Report | MS-1 |
FRANKLIN MUTUAL SHARES VIP FUND
Fund Goals and Main Investments
Franklin Mutual Shares VIP Fund seeks capital appreciation, with income as a secondary goal. Under normal market conditions, the Fund invests primarily in U.S. and foreign equity securities that the investment manager believes are undervalued.
Fund Risks
All investments involve risks, including possible loss of principal. Value securities may not increase in price as anticipated or may decline further in value. The Fund’s investments in foreign securities involve special risks including currency fluctuations, and economic and political uncertainties. The Fund may also invest in companies engaged in mergers, reorganizations or liquidations, which involve special risks as pending deals may not be completed on time or on favorable terms, as well as lower rated bonds, which entail higher credit risk. The Fund is actively managed but there is no guarantee that the manager’s investment decisions will produce the desired results. The Fund’s prospectus also includes a description of the main investment risks.
Performance Overview
You can find the Fund’s six-month total return in the Performance Summary. In comparison, the Fund’s benchmark, the Standard & Poor’s® 500 Index (S&P 500®), delivered a +1.23% total return for the period under review.1
Economic and Market Overview
The global economy expanded moderately during the six months under review despite slowing growth in some countries. As measured by the MSCI World Index, stocks in global developed markets advanced overall during the six-month period amid a generally accommodative monetary policy environment and signs of economic improvement in Europe and Japan. Oil prices rebounded from earlier lows as demand picked up despite rising inventories and strong global supply, while gold prices declined marginally during the period under review.
U.S. economic growth was mixed during the six months under review. In 2015’s first quarter, U.S. dollar strength, low energy prices, and a labor dispute at West Coast ports led exports to decline. In the second quarter, business capital spending rebounded and manufacturing and non-manufacturing activities
increased, contributing to strong job gains. During the six-month period, the U.S. Federal Reserve Board (Fed) kept its target interest rate at 0%–0.25% while considering when an increase would be appropriate, based on labor market and inflation data.
Outside the U.S., the U.K. economy slowed in 2015’s first quarter as the mining and agriculture sectors contracted. In the eurozone, economic growth improved somewhat during the six-month period. The region avoided deflation as the annual inflation rate rose in May. The European Central Bank (ECB) maintained its benchmark interest rates during the period and also expanded its asset purchases to boost inflation and the economy. The region generally benefited from a weaker euro that helped exports, the ECB’s accommodative policy and an improved 2015 eurozone growth forecast, which helped limit fears about Greece’s debt situation.
The Japanese economy continued to grow in 2015’s first quarter after exiting recession in the previous quarter, driven by an increase in private demand as business investment and private consumption rose. The Bank of Japan maintained its monetary policy during the review period but lowered its economic growth and inflation forecasts at its April meeting.
In emerging markets, economic growth generally moderated. Greece’s credit default due to the lack of progress in negotiations weighed on emerging market stocks toward period-end. China’s government implemented market-friendly policies to support new economic drivers that could help steer the economy toward more sustainable growth. Lower interest rates there fueled massive stock market speculation and a 60% price gain up to mid-June 2015 for the domestic A-share market.2 Concerned the market was overheated, the People’s Bank of China reduced liquidity, which led to a market panic in the last two weeks of June, exacerbated by certain government intervention measures. Central bank actions varied across emerging markets, as some banks raised interest rates in response to rising inflation and weakening currencies, while others lowered interest rates to promote economic growth. In the recent global environment, emerging market stocks, as measured by the MSCI Emerging Markets Index, rose for the six-month period.3
Investment Strategy
At Franklin Mutual Series, we are committed to our distinctive value approach to investing. Our major investment strategy is
1. Source: Morningstar.
2. Source: MSCI.
One cannot invest directly in an index, and an index is not representative of the Fund’s portfolio. Please see Index Descriptions following the Fund Summaries.
3. Please see Index Descriptions following the Fund Summaries.
| MS-2 | Semiannual Report |
FRANKLIN MUTUAL SHARES VIP FUND
investing in undervalued stocks. When selecting undervalued equities, we are attracted to fundamentally strong companies with healthy balance sheets, high-quality assets, substantial free cash flow and shareholder-oriented management teams and whose stocks are trading at discounts to our assessment of the companies’ intrinsic or business value. We also look for asset-rich companies whose shares may be trading at depressed levels due to concerns over short-term earnings disappointments, litigation, management strategy or other perceived negatives. While the vast majority of our undervalued equity investments are made in publicly traded companies globally, we may invest occasionally in privately held companies as well.
We complement this more traditional investment strategy with two others. One is distressed investing, which is complex and can take many forms. The most common distressed investment the Fund undertakes is the purchase of financially troubled or bankrupt companies’ debt at a substantial discount to face value. After the financially distressed company is reorganized, often in bankruptcy court, the old debt is typically replaced with new securities issued by the financially stronger company.
The other piece of our investment strategy is participating in arbitrage situations, another highly specialized field. When companies announce proposed mergers or takeovers, commonly referred to as “deals,” the target company may trade at a discount to the bid it ultimately accepts. One form of arbitrage involves purchasing the target company’s stock when it is trading below the value we believe it would receive in a deal. In keeping with our commitment to a relatively conservative investment approach, we typically focus our arbitrage efforts on announced deals, and eschew rumored deals or other situations we consider relatively risky.
In addition, it is our practice to hedge the Fund’s currency exposure when we deem it advantageous for our shareholders.
What is meant by “hedge”?
To hedge an investment is to take a position intended to offset potential losses/gains that may be incurred by a companion financial instrument.
Manager’s Discussion
During the six months ended June 30, 2015, European equities rebounded while overall global markets slowed after a three-year ascent. Globally, major central banks remained accommodative while fiscal authorities focused on budgetary discipline. Large companies also remained disciplined about operating costs, with margins at historically high levels in many industries and regions — Europe being an exception. To drive
further growth, companies started looking externally to mergers and acquisitions (M&A), taking advantage of low interest rates to finance deals. In this environment, we saw many opportunities.
Equity prices are typically forward looking, reflecting investors’ beliefs about how various factors and events will play out in the future. Global equity prices at period-end were not at distressed levels, but from our perspective, they reflected a consensus view of a modest global recovery and the persistence of historically high profit margins. Some countries, such as Greece and China, and sectors, such as energy, have been subject to significant market movements, but the global equity market as a whole has been relatively stable. Global quantitative easing has provided a supportive backdrop, and corporations, in general, have built strong balance sheets and focused intensely on improving efficiency.
The acceleration of M&A that we have been waiting for is now well under way, with announcements of mega mergers in health care, telecommunications and technology. At the same time, regulatory scrutiny increased, as happened with Comcast’s failed attempt to acquire Time Warner Cable. Environments like this — active M&A combined with regulatory uncertainty and market volatility — have historically been a good combination for us. As we discussed in the 2014 annual report, we seek to use a mixture of merger arbitrage positions — positions constructed solely to benefit from deal completion — and investments in one or both of the companies involved in a deal to benefit from a deal spread and from possible value creation once the deal is completed.
| Top 10 Sectors/Industries | ||||
| Based on Equity Securities | ||||
| 6/30/15 | ||||
| % of Total Net Assets | ||||
| Banks | 10.8% | |||
| Insurance | 9.3% | |||
| Media | 8.5% | |||
| Pharmaceuticals | 8.0% | |||
| Oil, Gas & Consumable Fuels | 6.1% | |||
| Tobacco | 4.9% | |||
| Software | 4.7% | |||
| Technology Hardware, Storage & Peripherals | 4.6% | |||
| Health Care Equipment & Supplies | 3.8% | |||
| Food & Staples Retailing | 3.1% | |||
| Semiannual Report | MS-3 |
FRANKLIN MUTUAL SHARES VIP FUND
Distressed debt remained a difficult market for us to find compelling new opportunities in. Low interest rates have kept credit widely available, and we saw little real distress. The biggest exception continued to be energy, where lower commodity prices created strain for some issuers. However, the modest recovery in energy prices since the beginning of the year relieved some of the pressure, and in the past six months we found fewer new opportunities in this sector than we expected.
During the period under review, the Fund initiated positions in Macy’s and Holcim. Macy’s is a retailer that we believe to be well run and that owns valuable real estate and other potential sources of incremental value. Macy’s owns more than two-thirds of its stores and, in our view, could extract meaningful value without jeopardizing its retail franchise. Another possible source of value may be the company’s outsourced credit card operations. Macy’s management acknowledged that the financial markets seemed receptive to such transactions and the company indicated an increased willingness to explore these options.
Holcim is a Swiss manufacturer of cement, aggregates and other construction products. At period-end, the company was in the process of merging with France’s Lafarge, another major European cement maker, with the deal expected to close in July 2015. The merger would create a global company with a presence in over 90 countries that, in our view, would likely produce significant synergies, help to improve operating profitability and generate strong cash flows.
Turning to Fund performance, many Fund holdings increased in value during the six-month period. Top contributors included pharmaceutical companies Hospira and Eli Lilly & Co., and health care insurer Cigna.
Hospira is a global pharmaceutical and medical device company specializing in injectable generic drugs and biosimilars — drugs highly similar to medications licensed by other firms. Shares of Hospira benefited from an early February announcement that Pfizer reached an agreement to acquire Hospira. We believed the deal made sense as Hospira offered Pfizer a strong leadership position in injectables and an attractive high-growth market in the generic segment, and the deal positioned Pfizer as a top-tier biosimilars company with a strong pipeline. This acquisition news was in line with our views on industry consolidation and more specifically on Hospira as a highly attractive asset in the generics industry. Hospira also made substantial progress with its core business performance on an organic basis as demonstrated by its solid first-quarter results.
Shares of Cigna, a U.S.-based global health care insurer, jumped in mid-June after competitor Anthem announced it had made four bids to acquire the company, all of which Cigna had rejected. Prior to that news, Cigna had been the subject of increased investor speculation that it might seek to acquire a competitor or could itself be a potential takeover target, which had helped push the stock higher. Operationally, Cigna reported better-than-expected earnings results and raised its 2015 guidance in April, providing earnings support for its shares.
Eli Lilly, a U.S.-based pharmaceutical company, performed well during the period as Wall Street, in our view, gained more appreciation for the company’s research and development capabilities and deep pipeline. Eli Lilly has many attractive assets targeting end markets with high unmet medical needs that, in our assessment, position its business to generate strong revenues and free cash flows in the long term.
During the period under review, some of the Fund’s investments negatively affected performance. These included document technology and business process solutions company Xerox, global media company Twenty-First Century Fox and information technology products provider Hewlett-Packard (HP).
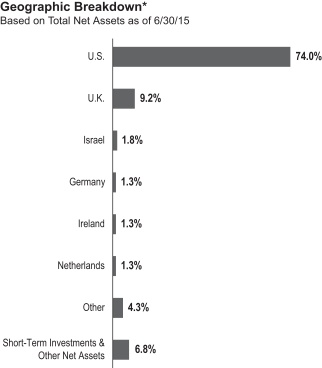
*Figures are stated as a percentage of total and may not equal 100% or may be negative due to rounding, use of any derivatives, unsettled trades or other factors.
| MS-4 | Semiannual Report |
FRANKLIN MUTUAL SHARES VIP FUND
Xerox lowered its 2015 earnings guidance in April and reported disappointing quarterly results as margins deteriorated in its services unit. Management attributed the margin decline to execution difficulties, particularly with its large health care-related projects. Xerox struggled with its biggest government health care contracts within its services unit for a considerable time, causing a series of cost-driven misses. Outside of services, the company’s document technology unit performed well and its capital management has been favorable as the company continued to repurchase shares.
Twenty-First Century Fox comprises the global television and entertainment assets that were part of News Corporation before the company’s mid-2013 split. In February, Twenty-First Century Fox lowered its 2015 earnings outlook due to a stronger U.S. dollar, worse-than-expected ratings at its broadcast network and lower-than-expected box office performance during the 2014 winter holiday season. The company maintained its earnings guidance in May but cautioned that currency could hinder its earnings growth outlook. In June, the company stated that Rupert Murdoch would hand over the role of chief executive officer to James Murdoch, his son, and remain executive co-chairman, effective July 1. Market reaction was slightly negative due to uncertainty over how James Murdoch may run the company, particularly regarding any changes in the capital structure or capital returns to shareholders.
HP reported a mixed set of quarterly results in February and lowered its 2015 full-year guidance due to a stronger U.S. dollar. HP also lowered its earnings outlook for 2015 and its full-year free cash flow estimate, a result of separation costs from its plan to break into two companies, higher working capital and lower earnings. Although the cost of splitting into two separate companies was viewed as expensive, we believed it would be a positive move with the potential to unlock some value.
During the period, the Fund held currency forwards and futures to somewhat hedge the currency risk of the portfolio’s non-U.S. dollar investments. The hedges had a minor positive impact on the Fund’s performance.
What is a currency forward contract?
A currency forward contract, or a currency forward, is an agreement between the Fund and a counterparty to buy or sell a foreign currency at a specific exchange rate on a future date.
What is a futures contract?
A futures contract, or a future, is an agreement between the Fund and a counterparty made through a U.S. or foreign futures exchange to buy or sell an underlying instrument or asset at a specific price on a future date.
Thank you for your continued participation in Franklin Mutual Shares VIP Fund. We look forward to serving your future investment needs.
The foregoing information reflects our analysis, opinions and portfolio holdings as of June 30, 2015, the end of the reporting period. The way we implement our main investment strategies and the resulting portfolio holdings may change depending on factors such as market and economic conditions. These opinions may not be relied upon as investment advice or an offer for a particular security. The information is not a complete analysis of every aspect of any market, country, industry, security or the Fund. Statements of fact are from sources considered reliable, but the investment manager makes no representation or warranty as to their completeness or accuracy. Although historical performance is no guarantee of future results, these insights may help you understand our investment management philosophy.
| Top 10 Equity Holdings | ||||
| 6/30/15 | ||||
| Company Sector/Industry, Country | % of Total Net Assets | |||
| Merck & Co. Inc. Pharmaceuticals, U.S. | 2.6% | |||
| Microsoft Corp. Software, U.S. | 2.6% | |||
| Medtronic PLC Health Care Equipment & Supplies, U.S. | 2.6% | |||
| Eli Lilly & Co. Pharmaceuticals, U.S. | 2.2% | |||
| PNC Financial Services Group Inc. Banks, U.S. | 2.0% | |||
| Time Warner Cable Inc. Media, U.S. | 1.9% | |||
| American International Group Inc. Insurance, U.S. | 1.9% | |||
| Apple Inc. Technology Hardware, Storage & Peripherals, U.S. | 1.9% | |||
| Teva Pharmaceutical Industries Ltd., ADR Pharmaceuticals, Israel | 1.8% | |||
| Twenty-First Century Fox Inc., B Media, U.S. | 1.7% | |||
The dollar value, number of shares or principal amount, and names of all portfolio holdings are listed in the Fund’s Statement of Investments.
| Semiannual Report | MS-5 |
FRANKLIN MUTUAL SHARES VIP FUND
Class 1 Fund Expenses
As an investor in a variable insurance contract (Contract) that indirectly provides for investment in an underlying mutual fund, you can incur transaction and/or ongoing expenses at both the Fund level and the Contract level.
| • | Transaction expenses can include sales charges (loads) on purchases, surrender fees, transfer fees and premium taxes. |
| • | Ongoing expenses can include management fees, distribution and service (12b-1) fees, contract fees, annual maintenance fees, mortality and expense risk fees and other fees and expenses. All mutual funds and Contracts have some types of ongoing expenses. |
The expenses shown in the table are meant to highlight ongoing expenses at the Fund level only and do not include ongoing expenses at the Contract level, or transaction expenses at either the Fund or Contract levels. While the Fund does not have transaction expenses, if the transaction and ongoing expenses at the Contract level were included, the expenses shown below would be higher. You should consult your Contract prospectus or disclosure document for more information.
The table shows Fund-level ongoing expenses and can help you understand these expenses and compare them with those of other mutual funds offered through the Contract. The table assumes a $1,000 investment held for the six months indicated. Please refer to the Fund prospectus for additional information on operating expenses.
Actual Fund Expenses
The first line (Actual) of the table provides actual account values and expenses. The “Ending Account Value” is derived from the Fund’s actual return, which includes the effect of ongoing Fund expenses, but does not include the effect of ongoing Contract expenses.
You can estimate the Fund-level expenses you incurred during the period by following these steps. Of course, your account value and expenses will differ from those in this illustration:
| 1. | Divide your account value by $1,000. |
If an account had an $8,600 value, then $8,600 ÷ $1,000 = 8.6.
| 2. | Multiply the result by the number under the heading “Fund-Level Expenses Incurred During Period.” |
If Fund-Level Expenses Incurred During Period were $7.50, then 8.6 × $7.50 = $64.50.
In this illustration, the estimated expenses incurred this period at the Fund level are $64.50.
Hypothetical Example for Comparison with Other Mutual Funds
Information in the second line (Hypothetical) of the table can help you compare ongoing expenses of the Fund with those of other mutual funds offered through the Contract. This information may not be used to estimate the actual ending account balance or expenses you incurred during the period. The hypothetical “Ending Account Value” is based on the Fund’s actual expense ratio and an assumed 5% annual rate of return before expenses, which does not represent the Fund’s actual return. The figure under the heading “Fund-Level Expenses Incurred During Period” shows the hypothetical expenses your account would have incurred under this scenario. You can compare this figure with the 5% hypothetical examples that appear in shareholder reports of other funds offered through a Contract.
| Class 1 | Beginning Account Value 1/1/15 | Ending Account Value 6/30/15 | Fund-Level Expenses Incurred During Period* 1/1/15–6/30/15 | |||||||||
Actual | $1,000 | $1,021.80 | $3.76 | |||||||||
Hypothetical (5% return before expenses) | $1,000 | $1,021.08 | $3.76 | |||||||||
*Expenses are calculated using the most recent six-month annualized expense ratio, net of expense waivers, for the Fund’s Class 1 shares (0.75%), which does not include any ongoing expenses of the Contract for which the Fund is an investment option, multiplied by the average account value over the period, multiplied by 181/365 to reflect the one-half year period.
| MS-6 | Semiannual Report |
FRANKLIN TEMPLETON VARIABLE INSURANCE PRODUCTS TRUST
Financial Highlights
Franklin Mutual Shares VIP Fund
| Six Months Ended June 30, 2015 (unaudited) | Year Ended December 31, | |||||||||||||||||||||||
| 2014 | 2013 | 2012 | 2011 | 2010 | ||||||||||||||||||||
| Class 1 | ||||||||||||||||||||||||
| Per share operating performance (for a share outstanding throughout the period) | ||||||||||||||||||||||||
Net asset value, beginning of period | $22.91 | $21.92 | $17.45 | $15.57 | $16.14 | $14.75 | ||||||||||||||||||
|
| |||||||||||||||||||||||
| Income from investment operationsa: | ||||||||||||||||||||||||
Net investment incomeb | 0.26 | 0.62 | c | 0.42 | 0.35 | 0.38 | d | 0.40 | e | |||||||||||||||
Net realized and unrealized gains (losses) | 0.24 | 1.01 | 4.52 | 1.92 | (0.53 | ) | 1.27 | |||||||||||||||||
|
| |||||||||||||||||||||||
Total from investment operations | 0.50 | 1.63 | 4.94 | 2.27 | (0.15 | ) | 1.67 | |||||||||||||||||
|
| |||||||||||||||||||||||
| Less distributions from: | ||||||||||||||||||||||||
Net investment income | — | (0.52 | ) | (0.47 | ) | (0.39 | ) | (0.42 | ) | (0.28 | ) | |||||||||||||
Net realized gains | — | (0.12 | ) | — | — | — | — | |||||||||||||||||
|
| |||||||||||||||||||||||
Total distributions | — | (0.64 | ) | (0.47 | ) | (0.39 | ) | (0.42 | ) | (0.28 | ) | |||||||||||||
|
| |||||||||||||||||||||||
Net asset value, end of period | $23.41 | $22.91 | $21.92 | $17.45 | $15.57 | $16.14 | ||||||||||||||||||
|
| |||||||||||||||||||||||
Total returnf | 2.18% | 7.38% | 28.53% | 14.61% | (0.79)% | 11.47% | ||||||||||||||||||
| Ratios to average net assetsg | ||||||||||||||||||||||||
Expensesh | 0.75% | i,j | 0.73% | i | 0.71% | i | 0.71% | 0.73% | i | 0.74% | i | |||||||||||||
Expenses incurred in connection with securities sold short | 0.04% | 0.03% | —% | k | —% | k | —% | k | 0.02% | |||||||||||||||
Net investment income | 2.25% | 2.83% | c | 2.08% | 2.06% | 2.28% | d | 2.66% | e | |||||||||||||||
| Supplemental data | ||||||||||||||||||||||||
Net assets, end of period (000’s) | $668,588 | $656,463 | $552,163 | $449,343 | $1,170,781 | $1,301,520 | ||||||||||||||||||
Portfolio turnover rate | 11.91% | 21.33% | 24.05% | 34.07% | l | 41.02% | 32.05% | |||||||||||||||||
aThe amount shown for a share outstanding throughout the period may not correlate with the Statement of Operations for the period due to the timing of sales and repurchases of the Fund’s shares in relation to income earned and/or fluctuating fair value of the investments of the Fund.
bBased on average daily shares outstanding.
cNet investment income per share includes approximately $0.23 per share received in the form of special dividends paid in connection with certain Fund’s holdings. Excluding these amounts, the ratio of net investment income to average net assets would have been 1.79%.
dNet investment income per share includes approximately $0.02 per share related to interest income received that had previously been deemed uncollectible. Excluding this amount, the ratio of net investment income to average net assets would have been 2.14%.
eNet investment income per share includes approximately $0.11 per share received in the form of a special dividend paid in connection with a corporate REIT conversion. Excluding this non-recurring amount, the ratio of the net investment income to average net assets would have been 1.93%.
fTotal return does not include fees, charges or expenses imposed by the variable annuity and life insurance contracts for which Franklin Templeton Variable Insurance Products Trust serves as an underlying investment vehicle. Total return is not annualized for periods less than one year.
gRatios are annualized for periods less than one year.
hIncludes dividend expense on securities sold short and security borrowing fees, if any. See below for the ratios of such expenses to average net assets for the periods presented. See Note 1(f).
iBenefit of expense reduction rounds to less than 0.01%.
jBenefit of waiver and payments by affiliates rounds to less than 0.01%.
kRounds to less than 0.01%.
lExcludes the value of portfolio securities delivered as a result of a redemption in-kind.
| The accompanying notes are an integral part of these financial statements. | Semiannual Report | MS-7 |
FRANKLIN TEMPLETON VARIABLE INSURANCE PRODUCTS TRUST
FINANCIAL HIGHLIGHTS
Franklin Mutual Shares VIP Fund (continued)
| Six Months Ended June 30, 2015 (unaudited) | Year Ended December 31, | |||||||||||||||||||||||
| 2014 | 2013 | 2012 | 2011 | 2010 | ||||||||||||||||||||
| Class 2 | ||||||||||||||||||||||||
| Per share operating performance (for a share outstanding throughout the period) | ||||||||||||||||||||||||
Net asset value, beginning of period | $22.60 | $21.63 | $17.23 | $15.38 | $15.95 | $14.58 | ||||||||||||||||||
|
| |||||||||||||||||||||||
| Income from investment operationsa: | ||||||||||||||||||||||||
Net investment incomeb | 0.23 | 0.58c | 0.36 | 0.30 | 0.32 | d | 0.36 | e | ||||||||||||||||
Net realized and unrealized gains (losses) | 0.24 | 0.97 | 4.46 | 1.90 | (0.51 | ) | 1.25 | |||||||||||||||||
|
| |||||||||||||||||||||||
Total from investment operations | 0.47 | 1.55 | 4.82 | 2.20 | (0.19 | ) | 1.61 | |||||||||||||||||
|
| |||||||||||||||||||||||
| Less distributions from: | ||||||||||||||||||||||||
Net investment income | — | (0.46 | ) | (0.42 | ) | (0.35 | ) | (0.38 | ) | (0.24 | ) | |||||||||||||
Net realized gains | — | (0.12 | ) | — | — | — | — | |||||||||||||||||
|
| |||||||||||||||||||||||
Total distributions | — | (0.58 | ) | (0.42 | ) | (0.35 | ) | (0.38 | ) | (0.24 | ) | |||||||||||||
|
| |||||||||||||||||||||||
Net asset value, end of period | $23.07 | $22.60 | $21.63 | $17.23 | $15.38 | $15.95 | ||||||||||||||||||
|
| |||||||||||||||||||||||
Total returnf | 2.08% | 7.12% | 28.26% | 14.24% | (1.04)% | 11.19% | ||||||||||||||||||
| Ratios to average net assetsg | ||||||||||||||||||||||||
Expensesh | 1.00% | i,j | 0.98% | i | 0.96% | i | 0.96% | 0.98% | i | 0.99% | i | |||||||||||||
Expenses incurred in connection with securities sold short | 0.04% | 0.03% | —% | k | —% | k | —% | k | 0.02% | |||||||||||||||
Net investment income | 2.00% | 2.58% | c | 1.83% | 1.81% | 2.03% | d | 2.41% | e | |||||||||||||||
| Supplemental data | ||||||||||||||||||||||||
Net assets, end of period (000’s) | $4,059,361 | $4,218,342 | $4,558,547 | $4,069,803 | $3,913,220 | $4,188,821 | ||||||||||||||||||
Portfolio turnover rate | 11.91% | 21.33% | 24.05% | 34.07% | l | 41.02% | 32.05% | |||||||||||||||||
aThe amount shown for a share outstanding throughout the period may not correlate with the Statement of Operations for the period due to the timing of sales and repurchases of the Fund’s shares in relation to income earned and/or fluctuating fair value of the investments of the Fund.
bBased on average daily shares outstanding.
cNet investment income per share includes approximately $0.23 per share received in the form of special dividends paid in connection with certain Fund’s holdings. Excluding these amounts, the ratio of net investment income to average net assets would have been 1.54%.
dNet investment income per share includes approximately $0.02 per share related to interest income received that had previously been deemed uncollectible. Excluding this amount, the ratio of net investment income to average net assets would have been 1.89%.
eNet investment income per share includes approximately $0.11 per share received in the form of a special dividend paid in connection with a corporate REIT conversion. Excluding this non-recurring amount, the ratio of the net investment income to average net assets would have been 1.68%.
fTotal return does not include fees, charges or expenses imposed by the variable annuity and life insurance contracts for which Franklin Templeton Variable Insurance Products Trust serves as an underlying investment vehicle. Total return is not annualized for periods less than one year.
gRatios are annualized for periods less than one year.
hIncludes dividend expense on securities sold short and security borrowing fees, if any. See below for the ratios of such expenses to average net assets for the periods presented. See Note 1(f).
iBenefit of expense reduction rounds to less than 0.01%.
jBenefit of waiver and payments by affiliates rounds to less than 0.01%.
kRounds to less than 0.01%.
lExcludes the value of portfolio securities delivered as a result of a redemption in-kind.
| MS-8 | Semiannual Report | The accompanying notes are an integral part of these financial statements. |
FRANKLIN TEMPLETON VARIABLE INSURANCE PRODUCTS TRUST
FINANCIAL HIGHLIGHTS
Franklin Mutual Shares VIP Fund (continued)
| Six Months Ended June 30, 2015 (unaudited) | Year Ended December 31, | |||||||||||||||||||||||
| 2014 | 2013 | 2012 | 2011 | 2010 | ||||||||||||||||||||
| Class 4 | ||||||||||||||||||||||||
| Per share operating performance (for a share outstanding throughout the period) | ||||||||||||||||||||||||
Net asset value, beginning of period | $22.72 | $21.74 | $17.31 | $15.45 | $16.03 | $14.66 | ||||||||||||||||||
|
| |||||||||||||||||||||||
| Income from investment operationsa: | ||||||||||||||||||||||||
Net investment incomeb | 0.22 | 0.57 | c | 0.34 | 0.28 | 0.30 | d | 0.35 | e | |||||||||||||||
Net realized and unrealized gains (losses) | 0.23 | 0.96 | 4.49 | 1.91 | (0.51 | ) | 1.26 | |||||||||||||||||
|
| |||||||||||||||||||||||
Total from investment operations | 0.45 | 1.53 | 4.83 | 2.19 | (0.21 | ) | 1.61 | |||||||||||||||||
|
| |||||||||||||||||||||||
| Less distributions from: | ||||||||||||||||||||||||
Net investment income | — | (0.43 | ) | (0.40 | ) | (0.33 | ) | (0.37 | ) | (0.24 | ) | |||||||||||||
Net realized gains | — | (0.12 | ) | — | — | — | — | |||||||||||||||||
|
| |||||||||||||||||||||||
Total distributions | — | (0.55 | ) | (0.40 | ) | (0.33 | ) | (0.37 | ) | (0.24 | ) | |||||||||||||
|
| |||||||||||||||||||||||
Net asset value, end of period | $23.17 | $22.72 | $21.74 | $17.31 | $15.45 | $16.03 | ||||||||||||||||||
|
| |||||||||||||||||||||||
Total returnf | 1.98% | 7.04% | 28.05% | 14.20% | (1.12)% | 11.06% | ||||||||||||||||||
| Ratios to average net assetsg | ||||||||||||||||||||||||
Expensesh | 1.10% | i,j | 1.08% | i | 1.06% | i | 1.06% | 1.08% | i | 1.09% | i | |||||||||||||
Expenses incurred in connection with securities sold short | 0.04% | 0.03% | —% | k | —% | k | —% | k | 0.02% | |||||||||||||||
Net investment income | 1.90% | 2.48% | c | 1.73% | 1.71% | 1.93% | d | 2.31% | e | |||||||||||||||
| Supplemental data | ||||||||||||||||||||||||
Net assets, end of period (000’s) | $150,345 | $158,020 | $188,153 | $165,015 | $162,049 | $167,274 | ||||||||||||||||||
Portfolio turnover rate | 11.91% | 21.33% | 24.05% | 34.07% | l | 41.02% | 32.05% | |||||||||||||||||
aThe amount shown for a share outstanding throughout the period may not correlate with the Statement of Operations for the period due to the timing of sales and repurchases of the Fund’s shares in relation to income earned and/or fluctuating fair value of the investments of the Fund.
bBased on average daily shares outstanding.
cNet investment income per share includes approximately $0.23 per share received in the form of special dividends paid in connection with certain Fund’s holdings. Excluding these amounts, the ratio of net investment income to average net assets would have been 1.44%.
dNet investment income per share includes approximately $0.02 per share related to interest income received that had previously been deemed uncollectible. Excluding this amount, the ratio of net investment income to average net assets would have been 1.79%.
eNet investment income per share includes approximately $0.11 per share received in the form of a special dividend paid in connection with a corporate REIT conversion. Excluding this non-recurring amount, the ratio of the net investment income to average net assets would have been 1.58%.
fTotal return does not include fees, charges or expenses imposed by the variable annuity and life insurance contracts for which Franklin Templeton Variable Insurance Products Trust serves as an underlying investment vehicle. Total return is not annualized for periods less than one year.
gRatios are annualized for periods less than one year.
hIncludes dividend expense on securities sold short and security borrowing fees, if any. See below for the ratios of such expenses to average net assets for the periods presented. See Note 1(f).
iBenefit of expense reduction rounds to less than 0.01%.
jBenefit of waiver and payments by affiliates rounds to less than 0.01%.
kRounds to less than 0.01%.
lExcludes the value of portfolio securities delivered as a result of a redemption in-kind.
| The accompanying notes are an integral part of these financial statements. | Semiannual Report | MS-9 |
FRANKLIN TEMPLETON VARIABLE INSURANCE PRODUCTS TRUST
Statement of Investments, June 30, 2015 (unaudited)
Franklin Mutual Shares VIP Fund
| ||||||||||||||
| Country | Shares | Value | ||||||||||||
Common Stocks and Other Equity Interests 86.5% | ||||||||||||||
Aerospace & Defense 1.5% | ||||||||||||||
B/E Aerospace Inc. | United States | 449,172 | $ | 24,659,543 | ||||||||||
Huntington Ingalls Industries Inc. | United States | 344,548 | 38,792,660 | |||||||||||
| a | KLX Inc. | United States | 224,586 | 9,910,980 | ||||||||||
|
| |||||||||||||
| 73,363,183 | ||||||||||||||
|
| |||||||||||||
Auto Components 0.3% | ||||||||||||||
| a,b | International Automotive Components Group Brazil LLC | Brazil | 1,730,515 | 151,029 | ||||||||||
| a,b,c | International Automotive Components Group North America LLC | United States | 15,382,424 | 13,690,573 | ||||||||||
|
| |||||||||||||
| 13,841,602 | ||||||||||||||
|
| |||||||||||||
Automobiles 1.3% | ||||||||||||||
General Motors Co. | United States | 1,871,900 | 62,390,427 | |||||||||||
|
| |||||||||||||
Banks 10.8% | ||||||||||||||
Barclays PLC | United Kingdom | 11,077,220 | 45,333,027 | |||||||||||
CIT Group Inc. | United States | 1,035,952 | 48,161,409 | |||||||||||
Citigroup Inc. | United States | 1,021,609 | 56,433,681 | |||||||||||
Citizens Financial Group Inc. | United States | 1,660,202 | 45,340,117 | |||||||||||
Columbia Banking System Inc. | United States | 163,162 | 5,309,292 | |||||||||||
| a | FCB Financial Holdings Inc., A | United States | 493,723 | 15,700,391 | ||||||||||
Guaranty Bancorp | United States | 209,583 | 3,460,215 | |||||||||||
ING Groep NV, IDR | Netherlands | 1,593,846 | 26,306,436 | |||||||||||
JPMorgan Chase & Co. | United States | 1,079,000 | 73,113,040 | |||||||||||
KB Financial Group Inc. | South Korea | 447,452 | 14,746,685 | |||||||||||
PNC Financial Services Group Inc. | United States | 1,022,679 | 97,819,246 | |||||||||||
Societe Generale SA | France | 214,711 | 10,018,849 | |||||||||||
State Bank Financial Corp. | United States | 352,200 | 7,642,740 | |||||||||||
SunTrust Banks Inc. | United States | 929,422 | 39,983,735 | |||||||||||
Wells Fargo & Co. | United States | 655,860 | 36,885,566 | |||||||||||
|
| |||||||||||||
| 526,254,429 | ||||||||||||||
|
| |||||||||||||
Beverages 1.1% | ||||||||||||||
PepsiCo Inc. | United States | 589,792 | 55,051,185 | |||||||||||
|
| |||||||||||||
Chemicals 0.0% | ||||||||||||||
| a,d,e | Dow Corning Corp., Contingent Distribution | United States | 100,000 | — | ||||||||||
|
| |||||||||||||
Communications Equipment 2.4% | ||||||||||||||
Cisco Systems Inc. | United States | 2,495,550 | 68,527,803 | |||||||||||
Nokia Corp., ADR | Finland | 3,299,845 | 22,603,938 | |||||||||||
Nokia OYJ, A | Finland | 4,118,438 | 27,951,841 | |||||||||||
|
| |||||||||||||
| 119,083,582 | ||||||||||||||
|
| |||||||||||||
Construction Materials 0.7% | ||||||||||||||
| a | Holcim Ltd., B | Switzerland | 490,292 | 36,178,107 | ||||||||||
|
| |||||||||||||
Consumer Finance 0.5% | ||||||||||||||
| a | Ally Financial Inc. | United States | 1,050,600 | 23,564,958 | ||||||||||
|
| |||||||||||||
Containers & Packaging 1.0% | ||||||||||||||
MeadWestvaco Corp. | United States | 1,008,696 | 47,600,364 | |||||||||||
|
| |||||||||||||
Diversified Consumer Services 0.2% | ||||||||||||||
Cengage Learning Holdings II LP | United States | 289,744 | 8,185,268 | |||||||||||
|
| |||||||||||||
| MS-10 | Semiannual Report |
FRANKLIN TEMPLETON VARIABLE INSURANCE PRODUCTS TRUST
STATEMENT OF INVESTMENTS (UNAUDITED)
Franklin Mutual Shares VIP Fund (continued)
| Country | Shares | Value | ||||||||||||
Common Stocks and Other Equity Interests (continued) | ||||||||||||||
Diversified Telecommunication Services 0.7% | ||||||||||||||
| a,d,e | Global Crossing Holdings Ltd., Contingent Distribution | United States | 9,005,048 | $ | — | |||||||||
Koninklijke KPN NV | Netherlands | 9,037,680 | 34,547,106 | |||||||||||
|
| |||||||||||||
| 34,547,106 | ||||||||||||||
|
| |||||||||||||
Energy Equipment & Services 1.1% | ||||||||||||||
Baker Hughes Inc. | United States | 870,800 | 53,728,360 | |||||||||||
|
| |||||||||||||
Food & Staples Retailing 3.1% | ||||||||||||||
CVS Health Corp. | United States | 468,093 | 49,093,594 | |||||||||||
The Kroger Co. | United States | 627,420 | 45,494,224 | |||||||||||
Walgreens Boots Alliance Inc. | United States | 690,148 | 58,276,097 | |||||||||||
|
| |||||||||||||
| 152,863,915 | ||||||||||||||
|
| |||||||||||||
Health Care Equipment & Supplies 3.8% | ||||||||||||||
Medtronic PLC | United States | 1,680,602 | 124,532,608 | |||||||||||
Stryker Corp. | United States | 625,571 | 59,785,821 | |||||||||||
|
| |||||||||||||
| 184,318,429 | ||||||||||||||
|
| |||||||||||||
Health Care Providers & Services 0.5% | ||||||||||||||
Cigna Corp. | United States | 157,754 | 25,556,148 | |||||||||||
|
| |||||||||||||
Independent Power & Renewable Electricity Producers 0.6% | ||||||||||||||
NRG Energy Inc. | United States | 1,304,154 | 29,839,044 | |||||||||||
|
| |||||||||||||
Insurance 9.3% | ||||||||||||||
ACE Ltd. | United States | 585,315 | 59,514,829 | |||||||||||
| a | Alleghany Corp. | United States | 111,968 | 52,486,120 | ||||||||||
The Allstate Corp. | United States | 750,760 | 48,701,801 | |||||||||||
American International Group Inc. | United States | 1,528,976 | 94,521,296 | |||||||||||
MetLife Inc. | United States | 1,072,353 | 60,041,045 | |||||||||||
White Mountains Insurance Group Ltd. | United States | 114,635 | 75,079,047 | |||||||||||
XL Group PLC | Ireland | 1,711,000 | 63,649,200 | |||||||||||
|
| |||||||||||||
| 453,993,338 | ||||||||||||||
|
| |||||||||||||
IT Services 1.0% | ||||||||||||||
Xerox Corp. | United States | 4,708,324 | 50,096,567 | |||||||||||
|
| |||||||||||||
Machinery 1.8% | ||||||||||||||
Caterpillar Inc. | United States | 571,256 | 48,453,934 | |||||||||||
CNH Industrial NV (EUR Traded) | United Kingdom | 1,150,471 | 10,487,925 | |||||||||||
CNH Industrial NV, special voting (EUR Traded) | United Kingdom | 1,844,814 | 16,817,695 | |||||||||||
Federal Signal Corp. | United States | 757,221 | 11,290,165 | |||||||||||
|
| |||||||||||||
| 87,049,719 | ||||||||||||||
|
| |||||||||||||
Marine 1.2% | ||||||||||||||
A.P. Moeller-Maersk AS, B | Denmark | 31,080 | 56,271,881 | |||||||||||
|
| |||||||||||||
Media 8.5% | ||||||||||||||
CBS Corp., B | United States | 1,025,107 | 56,893,438 | |||||||||||
| a | DIRECTV | United States | 875,479 | 81,235,696 | ||||||||||
Reed Elsevier PLC | United Kingdom | 3,747,940 | 60,940,946 | |||||||||||
Time Warner Cable Inc. | United States | 532,856 | 94,938,954 | |||||||||||
Time Warner Inc. | United States | 426,778 | 37,304,665 | |||||||||||
Tribune Media Co., A | United States | 30,790 | 1,643,878 | |||||||||||
Tribune Publishing Co. | United States | 42,857 | 665,998 | |||||||||||
| Semiannual Report | MS-11 |
FRANKLIN TEMPLETON VARIABLE INSURANCE PRODUCTS TRUST
STATEMENT OF INVESTMENTS (UNAUDITED)
Franklin Mutual Shares VIP Fund (continued)
| Country | Shares | Value | ||||||||||||
Common Stocks and Other Equity Interests (continued) |
| |||||||||||||
Media (continued) | ||||||||||||||
Twenty-First Century Fox Inc., B | United States | 2,579,369 | $ | 83,107,269 | ||||||||||
|
| |||||||||||||
| 416,730,844 | ||||||||||||||
|
| |||||||||||||
Metals & Mining 1.4% | ||||||||||||||
Freeport-McMoRan Inc., B | United States | 1,867,696 | 34,776,499 | |||||||||||
ThyssenKrupp AG | Germany | 1,241,767 | 32,293,009 | |||||||||||
|
| |||||||||||||
| 67,069,508 | ||||||||||||||
|
| |||||||||||||
Multiline Retail 0.8% | ||||||||||||||
Macy’s Inc. | United States | 561,205 | 37,864,501 | |||||||||||
|
| |||||||||||||
Oil, Gas & Consumable Fuels 6.1% | ||||||||||||||
Anadarko Petroleum Corp. | United States | 279,670 | 21,831,040 | |||||||||||
Apache Corp. | United States | 793,090 | 45,705,777 | |||||||||||
BG Group PLC | United Kingdom | 1,977,986 | 32,923,075 | |||||||||||
BP PLC | United Kingdom | 4,717,802 | 31,140,120 | |||||||||||
CONSOL Energy Inc. | United States | 755,295 | 16,420,113 | |||||||||||
Marathon Oil Corp. | United States | 1,788,098 | 47,456,121 | |||||||||||
Murphy Oil Corp. | United States | 502,750 | 20,899,318 | |||||||||||
Royal Dutch Shell PLC, A | United Kingdom | 2,097,311 | 59,298,525 | |||||||||||
| a | Whiting Petroleum Corp. | United States | 671,647 | 22,567,339 | ||||||||||
|
| |||||||||||||
| 298,241,428 | ||||||||||||||
|
| |||||||||||||
Paper & Forest Products 1.2% | ||||||||||||||
International Paper Co. | United States | 1,212,515 | 57,703,589 | |||||||||||
|
| |||||||||||||
Personal Products 0.7% | ||||||||||||||
Avon Products Inc. | United States | 1,419,285 | 8,884,724 | |||||||||||
Edgewell Personal Care Co. | United States | 196,162 | 25,805,111 | |||||||||||
|
| |||||||||||||
| 34,689,835 | ||||||||||||||
|
| |||||||||||||
Pharmaceuticals 8.0% | ||||||||||||||
Eli Lilly & Co. | United States | 1,274,615 | 106,417,607 | |||||||||||
| a | Hospira Inc. | United States | 787,789 | 69,884,762 | ||||||||||
Merck & Co. Inc. | United States | 2,219,988 | 126,383,917 | |||||||||||
Teva Pharmaceutical Industries Ltd., ADR | Israel | 1,506,201 | 89,016,479 | |||||||||||
|
| |||||||||||||
| 391,702,765 | ||||||||||||||
|
| |||||||||||||
Real Estate Investment Trusts (REITs) 0.3% | ||||||||||||||
Alexander’s Inc. | United States | 40,126 | 16,451,660 | |||||||||||
|
| |||||||||||||
Real Estate Management & Development 0.1% | ||||||||||||||
| a | Forestar Group Inc. | United States | 161,671 | 2,127,590 | ||||||||||
|
| |||||||||||||
Semiconductors & Semiconductor Equipment 0.4% | ||||||||||||||
Altera Corp. | United States | 365,549 | 18,716,109 | |||||||||||
|
| |||||||||||||
Software 5.0% | ||||||||||||||
CA Inc. | United States | 1,533,479 | 44,915,600 | |||||||||||
Microsoft Corp. | United States | 2,858,157 | 126,187,631 | |||||||||||
Symantec Corp. | United States | 3,067,415 | 71,317,399 | |||||||||||
|
| |||||||||||||
| 242,420,630 | ||||||||||||||
|
| |||||||||||||
Specialty Retail 0.3% | ||||||||||||||
| a | Office Depot Inc. | United States | 1,755,259 | 15,200,543 | ||||||||||
|
| |||||||||||||
| MS-12 | Semiannual Report |
FRANKLIN TEMPLETON VARIABLE INSURANCE PRODUCTS TRUST
STATEMENT OF INVESTMENTS (UNAUDITED)
Franklin Mutual Shares VIP Fund (continued)
| Country | Shares | Value | ||||||||||||
Common Stocks and Other Equity Interests (continued) |
| |||||||||||||
Technology Hardware, Storage & Peripherals 4.6% | ||||||||||||||
Apple Inc. | United States | 727,210 | $ | 91,210,314 | ||||||||||
EMC Corp. | United States | 1,689,120 | 44,575,877 | |||||||||||
Hewlett-Packard Co. | United States | 1,516,627 | 45,513,976 | |||||||||||
Samsung Electronics Co. Ltd. | South Korea | 38,066 | 43,110,007 | |||||||||||
|
| |||||||||||||
| 224,410,174 | ||||||||||||||
|
| |||||||||||||
Tobacco 4.9% | ||||||||||||||
Altria Group Inc. | United States | 965,268 | 47,211,258 | |||||||||||
British American Tobacco PLC | United Kingdom | 1,449,417 | 77,760,719 | |||||||||||
Imperial Tobacco Group PLC | United Kingdom | 1,096,837 | 52,848,429 | |||||||||||
Philip Morris International Inc. | United States | 282,010 | 22,608,742 | |||||||||||
Reynolds American Inc. | United States | 526,417 | 39,302,293 | |||||||||||
|
| |||||||||||||
| 239,731,441 | ||||||||||||||
|
| |||||||||||||
Wireless Telecommunication Services 1.3% | ||||||||||||||
Vodafone Group PLC | United Kingdom | 17,442,704 | 62,984,622 | |||||||||||
|
| |||||||||||||
Total Common Stocks and Other Equity Interests | 4,219,822,851 | |||||||||||||
|
| |||||||||||||
Preferred Stocks (Cost $35,233,301) 0.6% | ||||||||||||||
Automobiles 0.6% | ||||||||||||||
Volkswagen AG, pfd. | Germany | 135,289 | 31,360,748 | |||||||||||
|
| |||||||||||||
| Principal Amount* | ||||||||||||||
Corporate Bonds, Notes and Senior Floating Rate Interests 3.6% | ||||||||||||||
Avaya Inc., | ||||||||||||||
f senior note, 144A, 10.50%, 3/01/21 | United States | 18,224,000 | 15,125,920 | |||||||||||
f senior secured note, 144A, 7.00%, 4/01/19 | United States | 12,923,000 | 12,696,847 | |||||||||||
g,h Term B-3 Loan, 4.687%, 10/26/17 | United States | 12,791,927 | 12,743,164 | |||||||||||
g,h Term B-6 Loan, 6.50%, 3/31/18 | United States | 3,119,721 | 3,108,300 | |||||||||||
| g,h | Cengage Learning Acquisitions Inc., Original Term Loans, | United States | 1,769,087 | 1,775,721 | ||||||||||
iHeartCommunications Inc., | ||||||||||||||
senior secured note, first lien, 9.00%, 12/15/19 | United States | 26,449,000 | 25,305,081 | |||||||||||
g,h Tranche D Term Loan, 6.937%, 1/30/19 | United States | 34,746,619 | 32,169,567 | |||||||||||
g,h Tranche E Term Loan, 7.687%, 7/30/19 | United States | 11,168,253 | 10,491,178 | |||||||||||
| g,h | JC Penney Corp. Inc., Term Loan, 6.00%, 5/22/18 | United States | 14,545,649 | 14,527,467 | ||||||||||
NGPL PipeCo LLC, | ||||||||||||||
f,i senior secured note, 144A, 9.625%, 6/01/19 | United States | 14,481,000 | 14,734,417 | |||||||||||
g,h Term Loan, 6.75%, 9/15/17 | United States | 759,247 | 728,497 | |||||||||||
Samson Investment Co., senior note, 9.75%, 2/15/20 | United States | 16,690,000 | 1,043,125 | |||||||||||
| g,h | Toys R Us-Delaware Inc., | |||||||||||||
FILO Loans, 8.25%, 10/24/19 | United States | 2,560,000 | 2,579,200 | |||||||||||
Term B-4 Loan, 9.75%, 4/24/20 | United States | 21,566,968 | 20,391,568 | |||||||||||
Walter Energy Inc., | ||||||||||||||
g,h B Term Loan, 7.25%, 4/02/18 | United States | 11,218,193 | 6,188,707 | |||||||||||
f first lien, 144A, 9.50%, 10/15/19 | United States | 6,301,000 | 3,481,303 | |||||||||||
f,j second lien, 144A, PIK, 11.50%, 4/01/20 | United States | 5,419,860 | 293,735 | |||||||||||
|
| |||||||||||||
Total Corporate Bonds, Notes and Senior Floating Rate Interests (Cost $188,814,534) | 177,383,797 | |||||||||||||
|
| |||||||||||||
| Semiannual Report | MS-13 |
FRANKLIN TEMPLETON VARIABLE INSURANCE PRODUCTS TRUST
STATEMENT OF INVESTMENTS (UNAUDITED)
Franklin Mutual Shares VIP Fund (continued)
| Country | Principal Amount* | Value | ||||||||||||
Corporate Notes and Senior Floating Rate Interests in Reorganization 2.1% | ||||||||||||||
| b,k | Broadband Ventures III LLC, secured promissory note, | United States | 1,754 | $ | — | |||||||||
| g,h,k | Caesars Entertainment Operating Co. Inc., | |||||||||||||
Term B-5-B Loans, 1.50%, 3/01/17 | United States | 3,251,752 | 2,893,028 | |||||||||||
Term B-6-B Loans, 1.50%, 3/01/17 | United States | 15,503,483 | 13,925,445 | |||||||||||
Term B-7 Loans, 1.50%, 3/01/17 | United States | 9,850,500 | 8,624,113 | |||||||||||
| g,h,k | Texas Competitive Electric Holdings Co. LLC, Term Loans, | United States | 90,618,405 | 52,374,629 | ||||||||||
| f,k | Texas Competitive Electric Holdings Co. LLC/Texas Competitive Electric Holdings Finance Inc., senior secured note, first lien, 144A, 11.50%, 10/01/20 | United States | 39,308,000 | 24,076,150 | ||||||||||
|
| |||||||||||||
Total Corporate Notes and Senior Floating Rate Interests in Reorganization (Cost $143,163,473) | 101,893,365 | |||||||||||||
|
| |||||||||||||
| Shares | ||||||||||||||
Companies in Liquidation 0.4% | ||||||||||||||
| a | Adelphia Recovery Trust | United States | 29,283,354 | 58,567 | ||||||||||
| a,d | Adelphia Recovery Trust, Arahova Contingent Value Vehicle, Contingent Distribution | United States | 1,955,453 | 21,705 | ||||||||||
| a,b,c,l | CB FIM Coinvestors LLC | United States | 6,400,507 | — | ||||||||||
| a,d,e | Century Communications Corp., Contingent Distribution | United States | 5,487,000 | — | ||||||||||
| a,b | FIM Coinvestor Holdings I, LLC | United States | 8,006,950 | — | ||||||||||
| a,m | Lehman Brothers Holdings Inc., Bankruptcy Claim | United States | 144,058,799 | 19,087,791 | ||||||||||
| a,d,e | Tribune Media Litigation Trust, Contingent Distribution | United States | 394,048 | — | ||||||||||
| a,d,e | Tropicana Litigation Trust, Contingent Distribution | United States | 18,305,000 | — | ||||||||||
|
| |||||||||||||
Total Companies in Liquidation (Cost $27,470,282) | 19,168,063 | |||||||||||||
|
| |||||||||||||
| Principal Amount* | ||||||||||||||
Municipal Bonds (Cost $17,894,164) 0.3% | ||||||||||||||
Puerto Rico Commonwealth GO, Refunding, Series A, 8.00%, 7/01/35 | United States | 20,409,000 | 13,827,098 | |||||||||||
|
| |||||||||||||
Total Investments before Short Term Investments (Cost $3,514,948,011) | 4,563,455,922 | |||||||||||||
|
| |||||||||||||
Short Term Investments 7.0% | ||||||||||||||
U.S. Government and Agency Securities 7.0% | ||||||||||||||
| n | FHLB, 7/01/15 | United States | 10,500,000 | 10,500,000 | ||||||||||
| n,o | U.S. Treasury Bills, 7/02/15 - 12/24/15 | United States | 333,280,000 | 333,267,570 | ||||||||||
|
| |||||||||||||
Total U.S. Government and Agency Securities (Cost $343,727,100) | 343,767,570 | |||||||||||||
|
| |||||||||||||
Total Investments before Money Market Funds and Joint Repurchase Agreements (Cost $3,858,675,111) | 4,907,223,492 | |||||||||||||
|
| |||||||||||||
| MS-14 | Semiannual Report |
FRANKLIN TEMPLETON VARIABLE INSURANCE PRODUCTS TRUST
STATEMENT OF INVESTMENTS (UNAUDITED)
Franklin Mutual Shares VIP Fund (continued)
| Country | Shares | Value | ||||||||||||
| p | Investments from Cash Collateral Received for Loaned Securities 0.1% | |||||||||||||
Money Market Funds (Cost $250,000) 0.0%† | ||||||||||||||
| a,q | Institutional Fiduciary Trust Money Market Portfolio | United States | 250,000 | $ | 250,000 | |||||||||
|
| |||||||||||||
| Principal Amount* | ||||||||||||||
Repurchase Agreements 0.1% | ||||||||||||||
| r | Joint Repurchase Agreement, 0.12%, 7/01/15 | United States | 1,000,000 | 1,000,000 | ||||||||||
Barclays Capital Inc. | ||||||||||||||
Collateralized by U.S. Treasury Bonds, 4.75% - 7.625%, 11/15/16 - 5/15/37; U.S. Treasury Notes, 0.375% - 4.875%, 8/31/15 - 11/15/24; and U.S. Treasury Strips, 8/15/15 - 2/15/45 (valued at $1,020,000) | ||||||||||||||
| r | Joint Repurchase Agreement, 0.09%, 7/01/15 | United States | 462,284 | 462,284 | ||||||||||
BNP Paribas Securities Corp. | ||||||||||||||
Collateralized by U.S. Government and Agency Securities, | ||||||||||||||
| r | Joint Repurchase Agreement, 0.11%, 7/01/15 | United States | 1,000,000 | 1,000,000 | ||||||||||
RBS Securities Corp. | ||||||||||||||
Collateralized by U.S. Treasury Bonds, 3.625%, 2/15/44; and | ||||||||||||||
|
| |||||||||||||
Total Joint Repurchase Agreements (Cost $2,462,284) | 2,462,284 | |||||||||||||
|
| |||||||||||||
Total Investments from Cash Collateral Received for Loaned Securities (Cost $2,712,284) | 2,712,284 | |||||||||||||
|
| |||||||||||||
Total Investments (Cost $3,861,387,395) 100.6% | 4,909,935,776 | |||||||||||||
Securities Sold Short (0.3)% | (15,497,071 | ) | ||||||||||||
Other Assets, less Liabilities (0.3)% | (16,144,995 | ) | ||||||||||||
|
| |||||||||||||
Net Assets 100.0% | $ | 4,878,293,710 | ||||||||||||
|
| |||||||||||||
| Shares | ||||||||||||||
| s | Securities Sold Short (0.3)% | |||||||||||||
Common Stocks (0.3)% | ||||||||||||||
Energy Equipment & Services (0.0)%† | ||||||||||||||
Halliburton Co. | United States | 23,554 | $ | (1,014,471 | ) | |||||||||
|
| |||||||||||||
Software (0.3)% | ||||||||||||||
VMware Inc., A | United States | 168,913 | (14,482,600 | ) | ||||||||||
|
| |||||||||||||
Total Securities Sold Short (Proceeds $15,069,751) | $ | (15,497,071 | ) | |||||||||||
|
| |||||||||||||
| Semiannual Report | MS-15 |
FRANKLIN TEMPLETON VARIABLE INSURANCE PRODUCTS TRUST
STATEMENT OF INVESTMENTS (UNAUDITED)
Franklin Mutual Shares VIP Fund (continued)
*The principal amount is stated in U.S. dollars unless otherwise indicated.
†Rounds to less than 0.1% of net assets.
aNon-income producing.
bSee Note 8 regarding restricted securities.
cAt June 30, 2015, pursuant to the Fund’s policies and the requirements of applicable securities law, the Fund may be restricted from trading these securities for a limited or extended period of time.
dContingent distributions represent the right to receive additional distributions, if any, during the reorganization of the underlying company. Shares represent total underlying principal of debt securities.
eSecurity has been deemed illiquid because it may not be able to be sold within seven days. At June 30, 2015, the aggregate value of these securities was $—.
fSecurity was purchased pursuant to Rule 144A under the Securities Act of 1933 and may be sold in transactions exempt from registration only to qualified institutional buyers or in a public offering registered under the Securities Act of 1933. These securities have been deemed liquid under guidelines approved by the Trust’s Board of Trustees. At June 30, 2015, the aggregate value of these securities was $70,408,372, representing 1.44% of net assets.
gSee Note 1(h) regarding senior floating rate interests.
hThe coupon rate shown represents the rate at period end.
iA portion or all of the security is on loan at June 30, 2015. See Note 1(g).
jIncome may be received in additional securities and/or cash.
kSee Note 7 regarding credit risk and defaulted securities.
lSee Note 10 regarding holdings of 5% voting securities.
mBankruptcy claims represent the right to receive distributions, if any, during the liquidation of the underlying pool of assets. Shares represent amount of allowed unsecured claims.
nThe security is traded on a discount basis with no stated coupon rate.
oSecurity or a portion of the security has been pledged as collateral for securities sold short and open forward contracts. At June 30, 2015, the aggregate value of these securities and/or cash pledged as collateral was $33,680,635, representing 0.69% of net assets.
pSee Note 1(g) regarding securities on loan.
qSee Note 3(e) regarding investments in Institutional Fiduciary Trust Money Market Portfolio.
rSee Note 1(c) regarding joint repurchase agreement.
sSee Note 1(f) regarding securities sold short.
At June 30, 2015, the Fund had the following futures contracts outstanding. See Note 1(d).
| Futures Contracts | ||||||||||||||||||||||||
| Description | Type | Number of Contracts | Notional Value | Expiration Date | Unrealized Appreciation | Unrealized Depreciation | ||||||||||||||||||
| Currency Contracts | ||||||||||||||||||||||||
EUR/USD | Short | 579 | $ | 80,741,550 | 9/14/15 | $ | 992,898 | $ | — | |||||||||||||||
GBP/USD | Short | 1,349 | 132,581,406 | 9/14/15 | — | (3,216,656 | ) | |||||||||||||||||
|
|
|
| |||||||||||||||||||||
Totals | $ | 213,322,956 | $ | 992,898 | $ | (3,216,656 | ) | |||||||||||||||||
|
|
|
| |||||||||||||||||||||
Net unrealized appreciation (depreciation) |
| $ | (2,223,758 | ) | ||||||||||||||||||||
|
| |||||||||||||||||||||||
At June 30, 2015, the Fund had the following forward exchange contracts outstanding. See Note 1(d).
| Forward Exchange Contracts | ||||||||||||||||||||||||||||
| Currency | Counterpartya | Type | Quantity | Contract Amount | Settlement Date | Unrealized Appreciation | Unrealized Depreciation | |||||||||||||||||||||
| OTC Forward Exchange Contracts | ||||||||||||||||||||||||||||
Euro | BOFA | Buy | 826,458 | $ | 921,308 | 7/20/15 | $ | — | $ | (9 | ) | |||||||||||||||||
Euro | BOFA | Sell | 6,447,054 | 7,453,203 | 7/20/15 | 266,307 | — | |||||||||||||||||||||
Euro | BONY | Sell | 179,048 | 207,970 | 7/20/15 | 8,375 | — | |||||||||||||||||||||
Euro | BZWS | Sell | 489,735 | 551,378 | 7/20/15 | 5,443 | — | |||||||||||||||||||||
Euro | DBAB | Buy | 826,457 | 921,099 | 7/20/15 | 200 | — | |||||||||||||||||||||
Euro | DBAB | Sell | 7,142,343 | 8,305,410 | 7/20/15 | 343,435 | — | |||||||||||||||||||||
Euro | FBCO | Buy | 224,674 | 250,416 | 7/20/15 | 41 | — | |||||||||||||||||||||
Euro | FBCO | Sell | 5,734,336 | 6,662,646 | 7/20/15 | 270,257 | — | |||||||||||||||||||||
Euro | HSBC | Sell | 8,556,372 | 9,956,800 | 7/20/15 | 418,528 | — | |||||||||||||||||||||
Euro | SSBT | Buy | 7,666,257 | 8,600,625 | 7/20/15 | — | (54,614 | ) | ||||||||||||||||||||
Euro | SSBT | Sell | 6,709,599 | 7,830,938 | 7/20/15 | 351,368 | — | |||||||||||||||||||||
| MS-16 | Semiannual Report |
FRANKLIN TEMPLETON VARIABLE INSURANCE PRODUCTS TRUST
STATEMENT OF INVESTMENTS (UNAUDITED)
Franklin Mutual Shares VIP Fund (continued)
| Forward Exchange Contracts (continued) | ||||||||||||||||||||||||||||
| Currency | Counterpartya | Type | Quantity | Contract Amount | Settlement Date | Unrealized Appreciation | Unrealized Depreciation | |||||||||||||||||||||
British Pound | BOFA | Sell | 7,529,719 | $ | 11,413,360 | 7/21/15 | $ | — | $ | (414,052 | ) | |||||||||||||||||
British Pound | HSBC | Sell | 16,370,375 | 24,817,123 | 7/21/15 | — | (896,875 | ) | ||||||||||||||||||||
South Korean Won | BOFA | Buy | 5,585,997,787 | 5,136,597 | 8/12/15 | — | (152,797 | ) | ||||||||||||||||||||
South Korean Won | BOFA | Sell | 19,303,548,983 | 17,370,052 | 8/12/15 | 156,929 | (9,410 | ) | ||||||||||||||||||||
South Korean Won | FBCO | Buy | 2,072,041,457 | 1,886,925 | 8/12/15 | — | (38,260 | ) | ||||||||||||||||||||
South Korean Won | FBCO | Sell | 22,034,462,403 | 19,812,252 | 8/12/15 | 157,932 | (4,721 | ) | ||||||||||||||||||||
South Korean Won | HSBC | Buy | 8,106,681,355 | 7,444,506 | 8/12/15 | — | (211,765 | ) | ||||||||||||||||||||
South Korean Won | HSBC | Sell | 38,226,485,775 | 34,315,467 | 8/12/15 | 225,534 | (15,552 | ) | ||||||||||||||||||||
British Pound | BOFA | Buy | 10,991,797 | 16,928,242 | 8/19/15 | 346,866 | (13,257 | ) | ||||||||||||||||||||
British Pound | BOFA | Sell | 16,898,157 | 25,721,605 | 8/19/15 | — | (815,773 | ) | ||||||||||||||||||||
British Pound | BZWS | Sell | 1,794,100 | 2,754,660 | 8/19/15 | — | (62,849 | ) | ||||||||||||||||||||
British Pound | DBAB | Sell | 1,386,268 | 2,128,277 | 8/19/15 | — | (48,760 | ) | ||||||||||||||||||||
British Pound | FBCO | Buy | 3,086,798 | 4,652,318 | 8/19/15 | 207,362 | (12,079 | ) | ||||||||||||||||||||
British Pound | FBCO | Sell | 10,410,658 | 15,937,224 | 8/19/15 | — | (411,990 | ) | ||||||||||||||||||||
British Pound | HSBC | Sell | 11,053,640 | 16,945,964 | 8/19/15 | — | (413,007 | ) | ||||||||||||||||||||
British Pound | SSBT | Buy | 2,163,158 | 3,416,487 | 8/19/15 | — | (19,398 | ) | ||||||||||||||||||||
British Pound | SSBT | Sell | 2,921,822 | 4,460,384 | 8/19/15 | — | (128,134 | ) | ||||||||||||||||||||
Euro | BOFA | Sell | 2,999,321 | 3,282,685 | 8/31/15 | 16,684 | (79,542 | ) | ||||||||||||||||||||
Euro | DBAB | Sell | 3,426,131 | 3,736,846 | 8/31/15 | 15,297 | (100,070 | ) | ||||||||||||||||||||
Euro | FBCO | Sell | 4,820,572 | 5,303,800 | 8/31/15 | 47,475 | (120,699 | ) | ||||||||||||||||||||
Euro | HSBC | Sell | 2,969,096 | 3,228,215 | 8/31/15 | 6,666 | (90,278 | ) | ||||||||||||||||||||
Euro | SSBT | Sell | 1,160,000 | 1,260,440 | 8/31/15 | 3,159 | (36,622 | ) | ||||||||||||||||||||
Euro | BOFA | Sell | 10,413,964 | 11,214,781 | 10/16/15 | 1,576 | (411,732 | ) | ||||||||||||||||||||
Euro | BZWS | Sell | 705,542 | 794,483 | 10/16/15 | 6,898 | — | |||||||||||||||||||||
Euro | DBAB | Sell | 6,613,061 | 7,134,224 | 10/16/15 | — | (247,827 | ) | ||||||||||||||||||||
Euro | FBCO | Sell | 8,259,032 | 8,904,630 | 10/16/15 | 6,806 | (321,598 | ) | ||||||||||||||||||||
Euro | HSBC | Sell | 9,171,359 | 10,003,706 | 10/16/15 | 12,615 | (246,747 | ) | ||||||||||||||||||||
Euro | SSBT | Sell | 5,610,671 | 6,080,844 | 10/16/15 | 11,688 | (193,944 | ) | ||||||||||||||||||||
British Pound | BOFA | Buy | 861,483 | 1,353,703 | 10/22/15 | — | (1,410 | ) | ||||||||||||||||||||
British Pound | BOFA | Sell | 46,350,988 | 70,659,666 | 10/22/15 | — | (2,098,746 | ) | ||||||||||||||||||||
British Pound | BONY | Buy | 7,860,451 | 12,120,926 | 10/22/15 | 217,839 | — | |||||||||||||||||||||
British Pound | DBAB | Buy | 1,706,683 | 2,649,714 | 10/22/15 | 30,258 | (946 | ) | ||||||||||||||||||||
British Pound | FBCO | Buy | 5,843,831 | 9,023,734 | 10/22/15 | 149,487 | — | |||||||||||||||||||||
British Pound | FBCO | Sell | 18,638,002 | 27,770,624 | 10/22/15 | — | (1,485,958 | ) | ||||||||||||||||||||
British Pound | HSBC | Buy | 782,005 | 1,228,029 | 10/22/15 | — | (495 | ) | ||||||||||||||||||||
Euro | BOFA | Sell | 27,865,190 | 31,730,360 | 11/18/15 | 605,648 | — | |||||||||||||||||||||
Euro | DBAB | Sell | 23,082,147 | 26,071,563 | 11/18/15 | 333,686 | (44,298 | ) | ||||||||||||||||||||
Euro | FBCO | Sell | 2,320,732 | 2,589,719 | 11/18/15 | 18,895 | (21,375 | ) | ||||||||||||||||||||
Euro | HSBC | Sell | 17,415,551 | 19,785,680 | 11/18/15 | 333,463 | (513 | ) | ||||||||||||||||||||
Euro | SSBT | Sell | 11,307,125 | 12,732,959 | 11/18/15 | 108,145 | (4,959 | ) | ||||||||||||||||||||
|
| |||||||||||||||||||||||||||
Totals Forward Exchange Contracts unrealized appreciation (depreciation) |
| $ | 4,684,862 | $ | (9,231,061 | ) | ||||||||||||||||||||||
|
| |||||||||||||||||||||||||||
Net unrealized appreciation (depreciation) |
| $ | (4,546,199 | ) | ||||||||||||||||||||||||
|
| |||||||||||||||||||||||||||
aMay be comprised of multiple contracts with the same counterparty, currency and settlement date.
See Abbreviations on page MS-32.
| Semiannual Report | MS-17 |
FRANKLIN TEMPLETON VARIABLE INSURANCE PRODUCTS TRUST
Financial Statements
Statement of Assets and Liabilities
June 30, 2015 (unaudited)
| Franklin Mutual Shares VIP Fund | ||||
Assets: | ||||
Investments in securities: | ||||
Cost - Unaffiliated issuers | $ | 3,858,675,111 | ||
Cost - Sweep Money Fund (Note 3e) | 250,000 | |||
Cost - Repurchase agreements | 2,462,284 | |||
|
| |||
Total cost of investments | $ | 3,861,387,395 | ||
|
| |||
Value - Unaffiliated issuers | $ | 4,907,223,492 | ||
Value - Sweep Money Fund (Note 3e) | 250,000 | |||
Value - Repurchase agreements | 2,462,284 | |||
|
| |||
Total value of investments (includes securities loaned in the amount of $2,628,203) | 4,909,935,776 | |||
Cash | 7,533,017 | |||
Restricted cash (Note 1e) | 130,000 | |||
Foreign currency, at value (cost $598,197) | 594,369 | |||
Receivables: | ||||
Investment securities sold | 672,450 | |||
Capital shares sold | 1,079,524 | |||
Dividends and interest | 11,027,891 | |||
Due from brokers | 20,257,105 | |||
Variation margin | 814,181 | |||
Unrealized appreciation on OTC forward exchange contracts | 4,684,862 | |||
Other assets | 2,055 | |||
|
| |||
Total assets | 4,956,731,230 | |||
|
| |||
Liabilities: | ||||
Payables: | ||||
Investment securities purchased | 42,193,312 | |||
Capital shares redeemed | 3,258,358 | |||
Management fees | 2,817,724 | |||
Distribution fees | 1,846,698 | |||
Securities sold short, at value (proceeds $15,069,751) | 15,497,071 | |||
Payable upon return of securities loaned | 2,712,284 | |||
Due to brokers | 130,000 | |||
Unrealized depreciation on OTC forward exchange contracts | 9,231,061 | |||
Accrued expenses and other liabilities | 751,012 | |||
|
| |||
Total liabilities | 78,437,520 | |||
|
| |||
Net assets, at value | $ | 4,878,293,710 | ||
|
| |||
Net assets consist of: | ||||
Paid-in capital | $ | 3,142,757,402 | ||
Undistributed net investment income | 185,952,900 | |||
Net unrealized appreciation (depreciation) | 1,041,401,335 | |||
Accumulated net realized gain (loss) | 508,182,073 | |||
|
| |||
Net assets, at value | $ | 4,878,293,710 | ||
|
| |||
| MS-18 | Semiannual Report | The accompanying notes are an integral part of these financial statements. |
FRANKLIN TEMPLETON VARIABLE INSURANCE PRODUCTS TRUST
FINANCIAL STATEMENTS
Statement of Assets and Liabilities (continued)
June 30, 2015 (unaudited)
| Franklin Mutual Shares VIP Fund | ||||
| Class 1: | ||||
Net assets, at value | $ | 668,587,530 | ||
|
| |||
Shares outstanding | 28,558,787 | |||
|
| |||
Net asset value and maximum offering price per share | $ | 23.41 | ||
|
| |||
| Class 2: | ||||
Net assets, at value | $ | 4,059,360,703 | ||
|
| |||
Shares outstanding | 175,991,641 | |||
|
| |||
Net asset value and maximum offering price per share | $ | 23.07 | ||
|
| |||
| Class 4: | ||||
Net assets, at value | $ | 150,345,477 | ||
|
| |||
Shares outstanding | 6,487,576 | |||
|
| |||
Net asset value and maximum offering price per share | $ | 23.17 | ||
|
| |||
| The accompanying notes are an integral part of these financial statements. | Semiannual Report | MS-19 |
FRANKLIN TEMPLETON VARIABLE INSURANCE PRODUCTS TRUST
FINANCIAL STATEMENTS
Statement of Operations
for the six months ended June 30, 2015 (unaudited)
| Franklin Mutual Shares VIP Fund | ||||
Investment income: | ||||
Dividends | $ | 62,596,880 | ||
Interest | 11,629,565 | |||
Income from securities loaned | 531,005 | |||
|
| |||
Total investment income | 74,757,450 | |||
|
| |||
Expenses: | ||||
Management fees (Note 3a) | 17,129,669 | |||
Distribution fees: (Note 3c) | ||||
Class 2 | 5,212,377 | |||
Class 4 | 272,466 | |||
Custodian fees (Note 4) | 67,706 | |||
Reports to shareholders | 333,331 | |||
Professional fees | 56,137 | |||
Trustees’ fees and expenses | 10,927 | |||
Dividends on securities sold short | 1,019,595 | |||
Other | 42,098 | |||
|
| |||
Total expenses | 24,144,306 | |||
Expense reductions (Note 4) | (347 | ) | ||
Expenses waived/paid by affiliates (Note 3e) | (3,521 | ) | ||
|
| |||
Net expenses | 24,140,438 | |||
|
| |||
Net investment income | 50,617,012 | |||
|
| |||
Realized and unrealized gains (losses): | ||||
Net realized gain (loss) from: | ||||
Investments | 207,649,352 | |||
Foreign currency transactions | 29,464,212 | |||
Futures contracts | 8,043,133 | |||
Securities sold short | (50,921 | ) | ||
|
| |||
Net realized gain (loss) | 245,105,776 | |||
|
| |||
Net change in unrealized appreciation (depreciation) on: | ||||
Investments | (164,739,767 | ) | ||
Translation of other assets and liabilities denominated in foreign currencies | (23,470,984 | ) | ||
Futures contracts | (4,727,782 | ) | ||
|
| |||
Net change in unrealized appreciation (depreciation) | (192,938,533 | ) | ||
|
| |||
Net realized and unrealized gain (loss) | 52,167,243 | |||
|
| |||
Net increase (decrease) in net assets resulting from operations | $ | 102,784,255 | ||
|
| |||
| MS-20 | Semiannual Report | The accompanying notes are an integral part of these financial statements. |
FRANKLIN TEMPLETON VARIABLE INSURANCE PRODUCTS TRUST
FINANCIAL STATEMENTS
Statements of Changes in Net Assets
| Franklin Mutual Shares VIP Fund | ||||||||
| Six Months Ended June 30, 2015 (unaudited) | Year Ended December 31, 2014 | |||||||
Increase (decrease) in net assets: | ||||||||
Operations: | ||||||||
Net investment income | $ | 50,617,012 | $ | 136,029,133 | ||||
Net realized gain (loss) | 245,105,776 | 280,369,418 | ||||||
Net change in unrealized appreciation (depreciation) | (192,938,533 | ) | (60,935,280 | ) | ||||
|
| |||||||
Net increase (decrease) in net assets resulting from operations | 102,784,255 | 355,463,271 | ||||||
|
| |||||||
Distributions to shareholders from: | ||||||||
Net investment income: | ||||||||
Class 1 | — | (14,458,134 | ) | |||||
Class 2 | — | (87,785,708 | ) | |||||
Class 4 | — | (3,061,827 | ) | |||||
Net realized gains: | ||||||||
Class 1 | — | (3,341,870 | ) | |||||
Class 2 | — | (22,825,048 | ) | |||||
Class 4 | — | (853,086 | ) | |||||
|
| |||||||
Total distributions to shareholders | — | (132,325,673 | ) | |||||
|
| |||||||
Capital share transactions: (Note 2) | ||||||||
Class 1 | (1,964,783 | ) | 79,247,758 | |||||
Class 2 | (244,396,238 | ) | (529,398,101 | ) | ||||
Class 4 | (10,954,251 | ) | (39,025,210 | ) | ||||
|
| |||||||
Total capital share transactions | (257,315,272 | ) | (489,175,553 | ) | ||||
|
| |||||||
Net increase (decrease) in net assets | (154,531,017 | ) | (266,037,955 | ) | ||||
Net assets: | ||||||||
Beginning of period | 5,032,824,727 | 5,298,862,682 | ||||||
|
| |||||||
End of period | $ | 4,878,293,710 | $ | 5,032,824,727 | ||||
|
| |||||||
Undistributed net investment income included in net assets: | ||||||||
End of period | $ | 185,952,900 | $ | 135,335,888 | ||||
|
| |||||||
| The accompanying notes are an integral part of these financial statements. | Semiannual Report | MS-21 |
FRANKLIN TEMPLETON VARIABLE INSURANCE PRODUCTS TRUST
Notes to Financial Statements (unaudited)
Franklin Mutual Shares VIP Fund
1. Organization and Significant Accounting Policies
Franklin Templeton Variable Insurance Products Trust (Trust) is registered under the Investment Company Act of 1940 (1940 Act) as an open-end management investment company, consisting of nineteen separate funds and applies the specialized accounting and reporting guidance in U.S. Generally Accepted Accounting Principles (U.S. GAAP). Franklin Mutual Shares VIP Fund (Fund) is included in this report. The financial statements of the remaining funds in the Trust are presented separately. Shares of the Fund are generally sold only to insurance company separate accounts to fund the benefits of variable life insurance policies or variable annuity contracts. The Fund offers three classes of shares: Class 1, Class 2 and Class 4. Each class of shares differs by its distribution fees, voting rights on matters affecting a single class and its exchange privilege.
The following summarizes the Fund’s significant accounting policies.
a. Financial Instrument Valuation
The Fund’s investments in financial instruments are carried at fair value daily. Fair value is the price that would be received to sell an asset or paid to transfer a liability in an orderly transaction between market participants on the measurement date. The Fund calculates the net asset value (NAV) per share at the close of the New York Stock Exchange (NYSE), generally at 4 p.m. Eastern time (NYSE close) on each day the NYSE is open for trading. Under compliance policies and procedures approved by the Trust’s Board of Trustees (the Board), the Fund’s administrator has responsibility for oversight of valuation, including leading the cross-functional Valuation and Liquidity Oversight Committee (VLOC). The VLOC provides administration and oversight of the Fund’s valuation policies and procedures, which are approved annually by the Board. Among other things, these procedures allow the Fund to utilize independent pricing services, quotations from securities and financial instrument dealers, and other market sources to determine fair value.
Equity securities and derivative financial instruments (derivatives) listed on an exchange or on the NASDAQ National Market System are valued at the last quoted sale price or the official closing price of the day, respectively. Foreign equity securities are valued as of the close of trading on the foreign stock exchange on which the security is primarily traded or as of the NYSE close, whichever is earlier. The value is then converted into its U.S. dollar equivalent at the foreign exchange rate
in effect at the NYSE close on the day that the value of the security is determined. Over-the-counter (OTC) securities are valued within the range of the most recent quoted bid and ask prices. Securities that trade in multiple markets or on multiple exchanges are valued according to the broadest and most representative market. Certain equity securities are valued based upon fundamental characteristics or relationships to similar securities. Investments in open-end mutual funds are valued at the closing NAV.
Debt securities generally trade in the OTC market rather than on a securities exchange. The Fund’s pricing services use multiple valuation techniques to determine fair value. In instances where sufficient market activity exists, the pricing services may utilize a market-based approach through which quotes from market makers are used to determine fair value. In instances where sufficient market activity may not exist or is limited, the pricing services also utilize proprietary valuation models which may consider market characteristics such as benchmark yield curves, credit spreads, estimated default rates, anticipated market interest rate volatility, coupon rates, anticipated timing of principal repayments, underlying collateral, and other unique security features in order to estimate the relevant cash flows, which are then discounted to calculate the fair value. Securities denominated in a foreign currency are converted into their U.S. dollar equivalent at the foreign exchange rate in effect at the NYSE close on the date that the values of the foreign debt securities are determined. Repurchase agreement are valued at cost, which approximates fair value.
Certain derivatives trade in the OTC market. The Fund’s pricing services use various techniques including industry standard option pricing models and proprietary discounted cash flow models to determine the fair value of those instruments. The Fund’s net benefit or obligation under the derivative contract, as measured by the fair value of the contract, is included in net assets.
The Fund has procedures to determine the fair value of financial instruments for which market prices are not reliable or readily available. Under these procedures, the VLOC convenes on a regular basis to review such financial instruments and considers a number of factors, including significant unobservable valuation inputs, when arriving at fair value. The VLOC primarily employs a market-based approach which may use related or comparable assets or liabilities, recent transactions, market multiples, book values, and other relevant information for the
| MS-22 | Semiannual Report |
FRANKLIN TEMPLETON VARIABLE INSURANCE PRODUCTS TRUST
NOTES TO FINANCIAL STATEMENTS (UNAUDITED)
Franklin Mutual Shares VIP Fund (continued)
investment to determine the fair value of the investment. An income-based valuation approach may also be used in which the anticipated future cash flows of the investment are discounted to calculate fair value. Discounts may also be applied due to the nature or duration of any restrictions on the disposition of the investments. Due to the inherent uncertainty of valuations of such investments, the fair values may differ significantly from the values that would have been used had an active market existed. The VLOC employs various methods for calibrating these valuation approaches including a regular review of key inputs and assumptions, transactional back-testing or disposition analysis, and reviews of any related market activity.
Trading in securities on foreign securities stock exchanges and OTC markets may be completed before the daily NYSE close. In addition, trading in certain foreign markets may not take place on every NYSE business day. Occasionally, events occur between the time at which trading in a foreign security is completed and the close of the NYSE that might call into question the reliability of the value of a portfolio security held by the Fund. As a result, differences may arise between the value of the Fund’s portfolio securities as determined at the foreign market close and the latest indications of value at the close of the NYSE. In order to minimize the potential for these differences, the VLOC monitors price movements following the close of trading in foreign stock markets through a series of country specific market proxies (such as baskets of American Depositary Receipts, futures contracts and exchange traded funds). These price movements are measured against established trigger thresholds for each specific market proxy to assist in determining if an event has occurred that may call into question the reliability of the values of the foreign securities held by the Fund. If such an event occurs, the securities may be valued using fair value procedures, which may include the use of independent pricing services.
When the last day of the reporting period is a non-business day, certain foreign markets may be open on those days that the NYSE is closed, which could result in differences between the value of the Fund’s portfolio securities on the last business day and the last calendar day of the reporting period. Any significant security valuation changes due to an open foreign market are adjusted and reflected by the Fund for financial reporting purposes.
b. Foreign Currency Translation
Portfolio securities and other assets and liabilities denominated in foreign currencies are translated into U.S. dollars based on
the exchange rate of such currencies against U.S. dollars on the date of valuation. The Fund may enter into foreign currency exchange contracts to facilitate transactions denominated in a foreign currency. Purchases and sales of securities, income and expense items denominated in foreign currencies are translated into U.S. dollars at the exchange rate in effect on the transaction date. Portfolio securities and assets and liabilities denominated in foreign currencies contain risks that those currencies will decline in value relative to the U.S. dollar. Occasionally, events may impact the availability or reliability of foreign exchange rates used to convert the U.S. dollar equivalent value. If such an event occurs, the foreign exchange rate will be valued at fair value using procedures established and approved by the Board.
The Fund does not separately report the effect of changes in foreign exchange rates from changes in market prices on securities held. Such changes are included in net realized and unrealized gain or loss from investments in the Statement of Operations.
Realized foreign exchange gains or losses arise from sales of foreign currencies, currency gains or losses realized between the trade and settlement dates on securities transactions and the difference between the recorded amounts of dividends, interest, and foreign withholding taxes and the U.S. dollar equivalent of the amounts actually received or paid. Net unrealized foreign exchange gains and losses arise from changes in foreign exchange rates on foreign denominated assets and liabilities other than investments in securities held at the end of the reporting period.
c. Joint Repurchase Agreement
The Fund enters into a joint repurchase agreement whereby its uninvested cash balance is deposited into a joint cash account with other funds managed by the investment manager or an affiliate of the investment manager and is used to invest in one or more repurchase agreements. The value and face amount of the joint repurchase agreement are allocated to the funds based on their pro-rata interest. A repurchase agreement is accounted for as a loan by the Fund to the seller, collateralized by securities which are delivered to the Fund’s custodian. The fair value, including accrued interest, of the initial collateralization is required to be at least 102% of the dollar amount invested by the funds, with the value of the underlying securities marked to market daily to maintain coverage of at least 100%. Repurchase agreements are subject to the terms of Master Repurchase Agreements (MRAs) with approved counterparties (sellers). The
| Semiannual Report | MS-23 |
FRANKLIN TEMPLETON VARIABLE INSURANCE PRODUCTS TRUST
NOTES TO FINANCIAL STATEMENTS (UNAUDITED)
Franklin Mutual Shares VIP Fund (continued)
1. Organization and Significant Accounting Policies (continued)
c. Joint Repurchase Agreement (continued)
MRAs contain various provisions, including but not limited to events of default and maintenance of collateral for repurchase agreements. The Fund may sell securities it holds as collateral and apply the proceeds towards the repurchase price and any other amounts owed by the seller to the Fund in the event of default by the seller. This could involve costs or delays in addition to a loss on the securities if their value falls below the repurchase price owed by the seller. The joint repurchase agreement held by the Fund at period end, as indicated in the Statement of Investments, had been entered into on June 30, 2015.
d. Derivative Financial Instruments
The Fund invested in derivatives in order to manage risk or gain exposure to various other investments or markets. Derivatives are financial contracts based on an underlying or notional amount, require no initial investment or an initial net investment that is smaller than would normally be required to have a similar response to changes in market factors, and require or permit net settlement. Derivatives contain various risks including the potential inability of the counterparty to fulfill their obligations under the terms of the contract, the potential for an illiquid secondary market, and/or the potential for market movements which expose the Fund to gains or losses in excess of the amounts shown in the Statement of Assets and Liabilities. Realized gain and loss and unrealized appreciation and depreciation on these contracts for the period are included in the Statement of Operations.
Derivative counterparty credit risk is managed through a formal evaluation of the creditworthiness of all potential counterparties. The Fund attempts to reduce its exposure to counterparty credit risk on OTC derivatives, whenever possible, by entering into International Swaps and Derivatives Association (ISDA) master agreements with certain counterparties. These agreements contain various provisions, including but not limited to collateral requirements, events of default, or early termination. Termination events applicable to the counterparty include certain deteriorations in the credit quality of the counterparty. Termination events applicable to the Fund include failure of the Fund to maintain certain net asset levels and/or limit the decline in net assets over various periods of time. In the event of default or early termination, the ISDA master agreement gives the
non-defaulting party the right to net and close-out all transactions traded, whether or not arising under the ISDA agreement, to one net amount payable by one counterparty to the other. However, absent an event of default or early termination, OTC derivative assets and liabilities are presented gross and not offset in the Statement of Assets and Liabilities. Early termination by the counterparty may result in an immediate payment by the Fund of any net liability owed to that counterparty under the ISDA agreement. At June 30, 2015, the Fund had OTC derivatives in a net liability position of $5,090,077 and the aggregate value of collateral pledged for such contracts was $5,804,445.
Collateral requirements differ by type of derivative. Collateral or initial margin requirements are set by the broker or exchange clearing house for exchange traded and centrally cleared derivatives. Initial margin deposited is held at the exchange and can be in the form of cash and/or securities. For OTC derivatives traded under an ISDA master agreement, posting of collateral is required by either the fund or the applicable counterparty if the total net exposure of all OTC derivatives with the applicable counterparty exceeds the minimum transfer amount, which typically ranges from $100,000 to $250,000, and can vary depending on the counterparty and the type of the agreement. Generally, collateral is determined at the close of fund business each day and any additional collateral required due to changes in derivative values may be delivered by the fund or the counterparty within a few business days. Collateral pledged and/or received by the fund for OTC derivatives, if any, is held in segregated accounts with the fund’s custodian/counterparty broker and can be in the form of cash and/or securities. Unrestricted cash may be invested according to the Fund’s investment objectives.
At June 30, 2015, the Fund received $229,767 in a U.S. Treasury Note as collateral for derivatives.
The Fund entered into exchange traded futures contracts primarily to manage exposure to certain foreign currencies. A futures contract is an agreement between the Fund and a counterparty to buy or sell an asset for a specified price on a future date. Required initial margins are pledged by the Fund, and the daily change in fair value is accounted for as a variation margin payable or receivable in the Statement of Assets and Liabilities.
The Fund entered into OTC forward exchange contracts primarily to manage exposure to certain foreign currencies. A forward
| MS-24 | Semiannual Report |
FRANKLIN TEMPLETON VARIABLE INSURANCE PRODUCTS TRUST
NOTES TO FINANCIAL STATEMENTS (UNAUDITED)
Franklin Mutual Shares VIP Fund (continued)
exchange contract is an agreement between the Fund and a counterparty to buy or sell a foreign currency at a specific exchange rate on a future date.
See Note 9 regarding other derivative information.
e. Restricted Cash
At June 30, 2015, the Fund held restricted cash in connection with investments in certain derivative securities. Restricted cash is held in a segregated account with the Fund’s custodian and is reflected in the Statement of Assets and Liabilities.
f. Securities Sold Short
The Fund is engaged in selling securities short, which obligates the Fund to replace a borrowed security with the same security at current fair value. The Fund incurs a loss if the price of the security increases between the date of the short sale and the date on which the Fund replaces the borrowed security. The Fund realizes a gain if the price of the security declines between those dates. Gains are limited to the price at which the Fund sold the security short, while losses are potentially unlimited in size.
The Fund is required to establish a margin account with the broker lending the security sold short. While the short sale is outstanding, the broker retains the proceeds of the short sale to the extent necessary to meet margin requirements until the short position is closed out. A deposit must also be maintained with the Fund’s custodian/counterparty broker consisting of cash and/or securities having a value equal to a specified percentage of the value of the securities sold short. The Fund is obligated to pay fees for borrowing the securities sold short and is required to pay the counterparty any dividends and/or interest due on securities sold short. Such dividends and/or interest and any security borrowing fees are recorded as an expense to the Fund.
g. Securities Lending
The Fund participates in an agency based securities lending program to earn additional income. The Fund receives cash collateral against the loaned securities in an amount equal to at least 102% of the fair value of the loaned securities. Collateral is maintained over the life of the loan in an amount not less than 100% of the fair value of loaned securities, as determined at the close of fund business each day; any additional collateral required due to changes in security values is delivered to the Fund on the next business day. The collateral is deposited into a joint cash account with other funds and is used to invest in a
money market fund managed by Franklin Advisers, Inc., an affiliate of the Fund, and/or a joint repurchase agreement. The total cash collateral received at period end was $2,712,284. The Fund may receive income from the investment of cash collateral, in addition to lending fees and rebates paid by the borrower. Income from securities loaned is reported separately in the Statement of Operations. The Fund bears the market risk with respect to the collateral investment, securities loaned, and the risk that the agent may default on its obligations to the Fund. If the borrower defaults on its obligation to return the securities loaned, the Fund has the right to repurchase the securities in the open market using the collateral received. The securities lending agent has agreed to indemnify the Fund in the event of default by a third party borrower.
h. Senior Floating Rate Interests
The Fund invests in senior secured corporate loans that pay interest at rates which are periodically reset by reference to a base lending rate plus a spread. These base lending rates are generally the prime rate offered by a designated U.S. bank or the London InterBank Offered Rate (LIBOR). Senior secured corporate loans often require prepayment of principal from excess cash flows or at the discretion of the borrower. As a result, actual maturity may be substantially less than the stated maturity. Senior secured corporate loans in which the Fund invests are generally readily marketable, but may be subject to certain restrictions on resale.
i. Income and Deferred Taxes
It is the Fund’s policy to qualify as a regulated investment company under the Internal Revenue Code. The Fund intends to distribute to shareholders substantially all of its taxable income and net realized gains to relieve it from federal income and if applicable, excise taxes. As a result, no provision for U.S. federal income taxes is required.
The Fund may be subject to foreign taxation related to income received, capital gains on the sale of securities and certain foreign currency transactions in the foreign jurisdictions in which it invests. Foreign taxes, if any, are recorded based on the tax regulations and rates that exist in the foreign markets in which the Fund invests. When a capital gain tax is determined to apply, the Fund records an estimated deferred tax liability in an amount that would be payable if the securities were disposed of on the valuation date. As a result of several court cases, in certain countries across the European Union, the Fund has filed
| Semiannual Report | MS-25 |
FRANKLIN TEMPLETON VARIABLE INSURANCE PRODUCTS TRUST
NOTES TO FINANCIAL STATEMENTS (UNAUDITED)
Franklin Mutual Shares VIP Fund (continued)
1. Organization and Significant Accounting Policies (continued)
i. Income and Deferred Taxes (continued)
additional tax reclaims for previously withheld taxes on dividends earned in those countries. These additional filings are subject to various administrative proceedings by the local jurisdictions’ tax authorities within the European Union, as well as a number of related judicial proceedings. At this time, uncertainty exists as to the ultimate resolution of these proceedings, the likelihood of receipt of these reclaims, and the potential timing of payment, and accordingly, no amounts are reflected in the financial statements.
The Fund recognizes the tax benefits of uncertain tax positions only when the position is “more likely than not” to be sustained upon examination by the tax authorities based on the technical merits of the tax position. As of June 30, 2015, and for all open tax years, the Fund has determined that no liability for unrecognized tax benefits is required in the Fund’s financial statements related to uncertain tax positions taken on a tax return (or expected to be taken on future tax returns). Open tax years are those that remain subject to examination and are based on each tax jurisdiction’s statute of limitation.
j. Security Transactions, Investment Income, Expenses and Distributions
Security transactions are accounted for on trade date. Realized gains and losses on security transactions are determined on a specific identification basis. Interest income and estimated expenses are accrued daily. Amortization of premium and accretion of discount on debt securities are included in interest income. Dividend income and dividends declared on securities sold short are recorded on the ex-dividend date except for certain dividends from foreign securities where the dividend rate is not available. In such cases, the dividend is recorded as soon as the information is received by the Fund. Distributions to shareholders are recorded on the ex-dividend date and are determined according to income tax regulations (tax basis). Distributable earnings determined on a tax basis may differ from earnings recorded in accordance with U.S. GAAP. These differences may be permanent or temporary. Permanent differences are reclassified among capital accounts to reflect their tax character. These reclassifications have no impact on net assets or the results of operations. Temporary differences are not reclassified, as they may reverse in subsequent periods.
Common expenses incurred by the Trust are allocated among the funds based on the ratio of net assets of each fund to the combined net assets of the Trust. Fund specific expenses are charged directly to the fund that incurred the expense.
Realized and unrealized gains and losses and net investment income, not including class specific expenses, are allocated daily to each class of shares based upon the relative proportion of net assets of each class. Differences in per share distributions, by class, are generally due to differences in class specific expenses.
k. Accounting Estimates
The preparation of financial statements in accordance with U.S. GAAP requires management to make estimates and assumptions that affect the reported amounts of assets and liabilities at the date of the financial statements and the amounts of income and expenses during the reporting period. Actual results could differ from those estimates.
l. Guarantees and Indemnifications
Under the Trust’s organizational documents, its officers and trustees are indemnified by the Trust against certain liabilities arising out of the performance of their duties to the Trust. Additionally, in the normal course of business, the Trust, on behalf of the Fund, enters into contracts with service providers that contain general indemnification clauses. The Trust’s maximum exposure under these arrangements is unknown as this would involve future claims that may be made against the Trust that have not yet occurred. Currently, the Trust expects the risk of loss to be remote.
| MS-26 | Semiannual Report |
FRANKLIN TEMPLETON VARIABLE INSURANCE PRODUCTS TRUST
NOTES TO FINANCIAL STATEMENTS (UNAUDITED)
Franklin Mutual Shares VIP Fund (continued)
2. Shares Of Beneficial Interest
At June 30, 2015, there were an unlimited number of shares authorized (without par value). Transactions in the Fund’s shares were as follows:
| Six Months Ended June 30, 2015 | Year Ended December 31, 2014 | |||||||||||||||||
| Shares | Amount | Shares | Amount | |||||||||||||||
| Class 1 Shares: | ||||||||||||||||||
Shares sold | 2,294,459 | $ | 54,157,323 | 5,610,891 | $ | 127,714,907 | ||||||||||||
Shares issued in reinvestment of distributions | — | — | 766,251 | 17,800,004 | ||||||||||||||
Shares redeemed | (2,385,553 | ) | (56,122,106 | ) | (2,917,184 | ) | (66,267,153 | ) | ||||||||||
|
| |||||||||||||||||
Net increase (decrease) | (91,094 | ) | $ | (1,964,783 | ) | 3,459,958 | $ | 79,247,758 | ||||||||||
|
| |||||||||||||||||
| Class 2 Shares: | ||||||||||||||||||
Shares sold | 6,076,907 | $ | 140,050,485 | 9,492,120 | $ | 213,958,738 | ||||||||||||
Shares issued in reinvestment of distributions | — | — | 4,821,742 | 110,610,757 | ||||||||||||||
Shares redeemed | (16,709,700 | ) | (384,446,723 | ) | (38,420,623 | ) | (853,967,596 | ) | ||||||||||
|
| |||||||||||||||||
Net increase (decrease) | (10,632,793 | ) | $ | (244,396,238 | ) | (24,106,761 | ) | $ | (529,398,101 | ) | ||||||||
|
| |||||||||||||||||
| Class 4 Shares: | ||||||||||||||||||
Shares sold | 188,044 | $ | 4,334,176 | 237,284 | $ | 5,313,846 | ||||||||||||
Shares issued in reinvestment of distributions | — | — | 169,771 | 3,914,913 | ||||||||||||||
Shares redeemed | (655,237 | ) | (15,288,427 | ) | (2,108,780 | ) | (48,253,969 | ) | ||||||||||
|
| |||||||||||||||||
Net increase (decrease) | (467,193 | ) | $ | (10,954,251 | ) | (1,701,725 | ) | $ | (39,025,210 | ) | ||||||||
|
| |||||||||||||||||
3. Transactions With Affiliates
Franklin Resources, Inc. is the holding company for various subsidiaries that together are referred to as Franklin Templeton Investments. Certain officers and trustees of the Fund are also officers and/or directors of the following subsidiaries:
| Subsidiary | Affiliation | |
Franklin Mutual Advisers, LLC (Franklin Mutual) | Investment manager | |
Franklin Templeton Services, LLC (FT Services) | Administrative manager | |
Franklin Templeton Distributors, Inc. (Distributors) | Principal underwriter | |
Franklin Templeton Investor Services, LLC (Investor Services) | Transfer agent |
a. Management Fees
The Fund pays an investment management fee to Franklin Mutual based on the average daily net assets of the Fund as follows:
| Annualized Fee Rate | Net Assets | |
0.750% | Up to and including $200 million | |
0.735% | Over $200 million, up to and including $700 million | |
0.700% | Over $700 million, up to and including $1.2 billion | |
0.675% | Over $1.2 billion, up to and including $5 billion | |
0.645% | Over $5 billion, up to and including $10 billion | |
0.625% | Over $10 billion, up to and including $15 billion | |
0.605% | Over $15 billion, up to and including $20 billion | |
0.585% | In excess of $20 billion |
| Semiannual Report | MS-27 |
FRANKLIN TEMPLETON VARIABLE INSURANCE PRODUCTS TRUST
NOTES TO FINANCIAL STATEMENTS (UNAUDITED)
Franklin Mutual Shares VIP Fund (continued)
3. Transactions With Affiliates (continued)
b. Administrative Fees
Under an agreement with Franklin Mutual, FT Services provides administrative services to the Fund. The fee is paid by Franklin Mutual based on the Fund’s average daily net assets, and is not an additional expense of the Fund.
c. Distribution Fees
The Board has adopted distribution plans for Class 2 and Class 4 shares pursuant to Rule 12b-1 under the 1940 Act. Under the Fund’s compensation distribution plans, the Fund pays Distributors for costs incurred in connection with the servicing, sale and distribution of the Fund’s shares up to 0.35% per year of its average daily net assets of each class. Some distribution fees are not charged on shares held by affiliates. The Board has agreed to limit the current rate to 0.25% per year for Class 2. The plan year, for purposes of monitoring compliance with the maximum annual plan rates, is February 1 through January 31.
d. Transfer Agent Fees
Investor Services, under terms of an agreement, performs shareholder servicing for the Fund and is not paid by the Fund for the services.
e. Investments in Institutional Fiduciary Trust Money Market Portfolio
The Fund invests in Institutional Fiduciary Trust Money Market Portfolio (Sweep Money Fund), an affiliated open-end management investment company. Management fees paid by the Fund are waived on assets invested in the Sweep Money Fund, as noted in the Statement of Operations, in an amount not to exceed the management and administrative fees paid directly or indirectly by the Sweep Money Fund.
f. Other Affiliated Transactions
At June 30, 2015, Franklin Templeton Variable Insurance Products Trust – Franklin Founding Funds Allocation VIP Fund owned 7.97% of the Fund’s outstanding shares.
4. Expense Offset Arrangement
The Fund has entered into an arrangement with its custodian whereby credits realized as a result of uninvested cash balances are used to reduce a portion of the Fund’s custodian expenses. During the period ended June 30, 2015, the custodian fees were reduced as noted in the Statement of Operations.
5. Income Taxes
At June 30, 2015, the cost of investments and net unrealized appreciation (depreciation) for income tax purposes were as follows:
Cost of investments | $ | 3,884,788,754 | ||
|
| |||
Unrealized appreciation | $ | 1,255,955,954 | ||
Unrealized depreciation | (230,808,932 | ) | ||
|
| |||
Net unrealized appreciation (depreciation) | $ | 1,025,147,022 | ||
|
|
Differences between income and/or capital gains as determined on a book basis and a tax basis are primarily due to differing treatments of foreign currency transactions, and bond discounts and premiums.
| MS-28 | Semiannual Report |
FRANKLIN TEMPLETON VARIABLE INSURANCE PRODUCTS TRUST
NOTES TO FINANCIAL STATEMENTS
Franklin Mutual Shares VIP Fund (continued)
6. Investment Transactions
Purchases and sales of investments (excluding short term securities and securities sold short) for the period ended June 30, 2015, aggregated $548,521,552 and $689,747,186, respectively.
7. Credit Risk and Defaulted Securities
The Fund may purchase the pre-default or defaulted debt of distressed companies. Distressed companies are financially troubled and are about to be or are already involved in financial restructuring or bankruptcy. Risks associated with purchasing these securities include the possibility that the bankruptcy or other restructuring process takes longer than expected, or that distributions in restructuring are less than anticipated, either or both of which may result in unfavorable consequences to the Fund. If it becomes probable that the income on debt securities, including those of distressed companies, will not be collected, the Fund discontinues accruing income and recognizes an adjustment for uncollectible interest.
At June 30, 2015, the aggregate long value of distressed company securities for which interest recognition has been discontinued was $101,893,365, representing 2.09% of the Fund’s net assets. For information as to specific securities, see the accompanying Statement of Investments.
8. Restricted Securities
The Fund invests in securities that are restricted under the Securities Act of 1933 (1933 Act) or which are subject to legal, contractual, or other agreed upon restrictions on resale. Restricted securities are often purchased in private placement transactions, and cannot be sold without prior registration unless the sale is pursuant to an exemption under the 1933 Act. Disposal of these securities may require greater effort and expense, and prompt sale at an acceptable price may be difficult. The Fund may have registration rights for restricted securities. The issuer generally incurs all registration costs.
At June 30, 2015, the Fund held investments in restricted securities, excluding certain securities exempt from registration under the 1933 Act deemed to be liquid, as follows:
| Principal Amount/ Shares | Issuer | Acquisition Dates | Cost | Value | ||||||||||
| 1,754 | Broadband Ventures III LLC, secured promissory note, 5.00%, 2/01/12 | 7/01/10 - 11/30/12 | $ | 1,754 | $ | — | ||||||||
| 6,400,507 | CB FIM Coinvestors LLC | 1/15/09 - 6/02/09 | — | — | ||||||||||
| 8,006,950 | FIM Coinvestor Holdings I, LLC | 11/20/06 - 6/02/09 | — | — | ||||||||||
| 1,730,515 | International Automotive Components Group Brazil LLC | 4/13/06 - 12/26/08 | 1,149,241 | 151,029 | ||||||||||
| 15,382,424 | International Automotive Components Group North America LLC | 1/12/06 - 3/18/13 | 12,591,586 | 13,690,573 | ||||||||||
|
| |||||||||||||
Total Restricted Securities (Value is 0.28% of Net Assets) | $ | 13,742,581 | $ | 13,841,602 | ||||||||||
|
| |||||||||||||
9. Other Derivative Information
At June 30, 2015, the Fund’s investments in derivative contracts are reflected in the Statement of Assets and Liabilities as follows:
Asset Derivatives | Liability Derivatives | |||||||||||
| Derivative Contracts Not Accounted for as Hedging Instruments | Statement of Assets and Liabilities Location | Fair Value | Statement of Assets and Liabilities Location | Fair Value | ||||||||
Foreign exchange contracts | Variation margin | $ | 992,898 | a | Variation margin | $ | 3,216,656 | a | ||||
Unrealized appreciation on OTC forward exchange contracts | 4,684,862 | Unrealized depreciation on | 9,231,061 | |||||||||
|
|
|
| |||||||||
Totals | $ | 5,677,760 | $ | 12,447,717 | ||||||||
|
|
|
| |||||||||
aThis amount reflects the cumulative appreciation (depreciation) of futures contracts as reported in the Statement of Investments. Only the variation margin receivable/payable at period end is separately reported within the Statement of Assets and Liabilities. Prior variation margin movements were recorded to cash upon receipt or payment.
| Semiannual Report | MS-29 |
FRANKLIN TEMPLETON VARIABLE INSURANCE PRODUCTS TRUST
NOTES TO FINANCIAL STATEMENTS (UNAUDITED)
Franklin Mutual Shares VIP Fund (continued)
9. Other Derivative Information (continued)
For the period ended June 30, 2015, the effect of derivative contracts in the Fund’s Statement of Operations was as follows:
| Derivative Contracts Not Accounted for as Hedging Instruments | Statement of Operations Locations | Net Realized Gain (Loss) for the Period | Statement of Operations Locations | Net Change in for the Period | ||||||||
Net realized gain (loss) from: | Net change in unrealized appreciation (depreciation) on: | |||||||||||
Foreign exchange contracts | Foreign currency transactions | $ | 29,991,112 | a | Translation of other assets and liabilities denominated in foreign currencies | $ | (23,514,040 | )a | ||||
Futures contracts | 8,043,133 | Futures contracts | (4,727,782 | ) | ||||||||
|
|
|
| |||||||||
Totals | $ | 38,034,245 | $ | (28,241,822 | ) | |||||||
|
|
|
| |||||||||
aForward exchange contracts are included in net realized gain (loss) from foreign currency transactions and net change in unrealized appreciation (depreciation) on translation of other assets and liabilities denominated in foreign currencies in the Statement of Operations.
For the period ended June 30, 2015, the average month end fair value of derivatives represented 0.51% of average month end net assets. The average month end number of open derivative contracts for the period was 215.
See Note 1(d) regarding derivative financial instruments.
10. Holdings of 5% Voting Securities of Portfolio Companies
The 1940 Act defines “affiliated companies” to include investments in portfolio companies in which a fund owns 5% or more of the outstanding voting securities. Investments in “affiliated companies” for the Fund for the period ended June 30, 2015, were as shown below.
| Name of Issuer | Number of Shares Held at Beginning of Period | Gross Additions | Gross Reductions | Number of Shares Held at End of Period | Value at End of Period | Investment Income | Realized Gain (Loss) | |||||||||||||||||||||
| Non-Controlled Affiliates | ||||||||||||||||||||||||||||
CB FIM Coinvestors LLC (Value is 0.00% of Net Assets) | 6,400,507 | — | — | 6,400,507 | $ | — | $ | — | $ | — | ||||||||||||||||||
|
| |||||||||||||||||||||||||||
11. Credit Facility
The Fund, together with other U.S. registered and foreign investment funds (collectively, Borrowers), managed by Franklin Templeton Investments, are borrowers in a joint syndicated senior unsecured credit facility totaling $2 billion (Global Credit Facility) which matures on February 12, 2016. This Global Credit Facility provides a source of funds to the Borrowers for temporary and emergency purposes, including the ability to meet future unanticipated or unusually large redemption requests.
Under the terms of the Global Credit Facility, the Fund shall, in addition to interest charged on any borrowings made by the Fund and other costs incurred by the Fund, pay its share of fees and expenses incurred in connection with the implementation and maintenance of the Global Credit Facility, based upon its relative share of the aggregate net assets of all of the Borrowers, including an annual commitment fee of 0.07% based upon the unused portion of the Global Credit Facility. These fees are reflected in other expenses in the Statement of Operations. During the period ended June 30, 2015, the Fund did not use the Global Credit Facility.
| MS-30 | Semiannual Report |
FRANKLIN TEMPLETON VARIABLE INSURANCE PRODUCTS TRUST
NOTES TO FINANCIAL STATEMENTS (UNAUDITED)
Franklin Mutual Shares VIP Fund (continued)
12. Fair Value Measurements
The Fund follows a fair value hierarchy that distinguishes between market data obtained from independent sources (observable inputs) and the Fund’s own market assumptions (unobservable inputs). These inputs are used in determining the value of the Fund’s financial instruments and are summarized in the following fair value hierarchy:
| • | Level 1 – quoted prices in active markets for identical financial instruments |
| • | Level 2 – other significant observable inputs (including quoted prices for similar financial instruments, interest rates, prepayment speed, credit risk, etc.) |
| • | Level 3 – significant unobservable inputs (including the Fund’s own assumptions in determining the fair value of financial instruments) |
The input levels are not necessarily an indication of the risk or liquidity associated with financial instruments at that level.
For movements between the levels within the fair value hierarchy, the Fund has adopted a policy of recognizing the transfers as of the date of the underlying event which caused the movement.
A summary of inputs used as of June 30, 2015, in valuing the Fund’s assets and liabilities carried at fair value, is as follows:
| Level 1 | Level 2 | Level 3 | Total | |||||||||||||
| Assets: | ||||||||||||||||
Investments in Securities: | ||||||||||||||||
Equity Invstments:a | ||||||||||||||||
Auto Components | $ | — | $ | — | $ | 13,841,602 | $ | 13,841,602 | ||||||||
Machinery | 70,232,024 | 16,817,695 | — | 87,049,719 | ||||||||||||
All Other Equity Investmentsb | 4,150,292,278 | — | — | c | 4,150,292,278 | |||||||||||
Corporate Bonds, Notes and Senior Floating Rate Interests | — | 177,383,797 | — | 177,383,797 | ||||||||||||
Corporate Notes and Senior Floating Rate Interests in Reorganization | — | 101,893,365 | — | c | 101,893,365 | |||||||||||
Companies in Liquidation | — | 19,168,063 | — | c | 19,168,063 | |||||||||||
Municipal Bonds | — | 13,827,098 | — | 13,827,098 | ||||||||||||
Short Term Investments | 333,517,570 | 12,962,284 | — | 346,479,854 | ||||||||||||
|
| |||||||||||||||
Total Investments in Securities | $ | 4,554,041,872 | $ | 342,052,302 | $ | 13,841,602 | $ | 4,909,935,776 | ||||||||
|
| |||||||||||||||
Other Financial Instruments | ||||||||||||||||
Futures Contracts | $ | 992,898 | $ | — | $ | — | $ | 992,898 | ||||||||
Forward Exchange Contracts | — | 4,684,862 | — | 4,684,862 | ||||||||||||
|
| |||||||||||||||
Total Other Financial Instruments | $ | 992,898 | $ | 4,684,862 | $ | — | $ | 5,677,760 | ||||||||
|
| |||||||||||||||
| Liabilities: | ||||||||||||||||
Other Financial Instruments | ||||||||||||||||
Securities Sold Short | $ | 15,497,071 | $ | — | $ | — | $ | 15,497,071 | ||||||||
Futures Contracts | 3,216,656 | — | — | 3,216,656 | ||||||||||||
Forward Exchange Contracts | — | 9,231,061 | — | 9,231,061 | ||||||||||||
|
| |||||||||||||||
Total Other Financial Instruments | $ | 18,713,727 | $ | 9,231,061 | $ | — | $ | 27,944,788 | ||||||||
|
| |||||||||||||||
aIncludes common and preferred stocks as well as other equity investments.
bFor detailed categories, see the accompanying Statement of Investments.
cIncludes securities determined to have no value at June 30, 2015.
A reconciliation of assets in which Level 3 inputs are used in determining fair value is presented when there are significant Level 3 financial instruments at the end of the period.
| Semiannual Report | MS-31 |
FRANKLIN TEMPLETON VARIABLE INSURANCE PRODUCTS TRUST
NOTES TO FINANCIAL STATEMENTS (UNAUDITED)
Franklin Mutual Shares VIP Fund (continued)
13. New Accounting Pronouncements
In June 2014, the Financial Accounting Standards Board issued Accounting Standards Update (ASU) No. 2014-11, Transfers and Servicing (Topic 860), Repurchase-to-Maturity Transactions, Repurchase Financings, and Disclosures. The ASU changes the accounting for certain repurchase agreements and expands disclosure requirements related to repurchase agreements, securities lending, repurchase-to-maturity and similar transactions. The ASU is effective for certain transactions accounted for as a sale for interim and annual reporting periods beginning after December 15, 2014, and transactions accounted for as secured borrowings for annual periods beginning after December 15, 2014, and for interim periods beginning after March 15, 2015. Management has reviewed the requirements and believes the adoption of this ASU will not have a material impact on the financial statements.
14. Subsequent Events
The Fund has evaluated subsequent events through the issuance of the financial statements and determined that no events have occurred that require disclosure.
Abbreviations
| Counterparty | Currency | Selected Portfolio | ||||||||
| BOFA | Bank of America Corp. | CAD | Canadian Dollar | ADR | American Depositary Receipt | |||||
| BONY | Bank of New York Mellon | CHF | Swiss Franc | FHLB | Federal Home Loan Bank | |||||
| BZWS | Barclays Bank PLC | EUR | Euro | GO | General Obligation | |||||
| DBAB | Deutsche Bank AG | GBP | British Pound | IDR | International Depositary Receipt | |||||
| FBCO | Credit Suisse Group AG | USD | United States Dollar | PIK | Payment-In-Kind | |||||
| HSBC | HSBC Bank USA, N.A. | |||||||||
| SSBT | State Street Bank and Trust Co. | |||||||||
| MS-32 | Semiannual Report |
Franklin Rising Dividends VIP Fund
This semiannual report for Franklin Rising Dividends VIP Fund covers the period ended June 30, 2015.
Class 1 Performance Summary as of June 30, 2015
The Fund’s Class 1 shares had a -0.09% total return* for the six-month period ended June 30, 2015.
*The Fund has a fee waiver associated with any investment in a Franklin Templeton money fund, contractually guaranteed through at least its current fiscal year-end. Fund investment results reflect the fee waiver, to the extent applicable; without this reduction, the results would have been lower.
Performance reflects the Fund’s Class 1 operating expenses, but does not include any contract fees, expenses or sales charges. If they had been included, performance would be lower. These charges and deductions, particularly for variable life policies, can have a significant effect on contract values and insurance benefits. See the contract prospectus for a complete description of these expenses, including sales charges.
Performance data represent past performance, which does not guarantee future results. Investment return and principal value will fluctuate, and you may have a gain or loss when you sell your shares. Current performance may differ from figures shown.
| Semiannual Report | FRD-1 |
FRANKLIN RISING DIVIDENDS VIP FUND
Fund Goal and Main Investments
Franklin Rising Dividends VIP Fund seeks long-term capital appreciation, with preservation of capital as an important consideration. Under normal market conditions, the Fund invests at least 80% of its net assets in equity securities of companies that have paid rising dividends.
Fund Risks
All investments involve risks, including possible loss of principal. Value securities may not increase in price as anticipated or may decline further in value. While smaller and midsized companies may offer substantial opportunities for capital growth, they also involve heightened risks and should be considered speculative. Historically, smaller- and midsized-company securities have been more volatile in price than larger company securities, especially over the short term. The Fund is actively managed but there is no guarantee that the manager’s investment decisions will produce the desired results. The Fund’s prospectus also includes a description of the main investment risks.
Performance Overview
You can find the Fund’s six-month total return in the Performance Summary. In comparison, the Standard & Poor’s® 500 Index (S&P 500®) rose 1.23% for the same period.1 Please note the Fund employs a bottom-up stock selection process, and the managers invest in securities without regard to benchmark comparisons.
Economic and Market Overview
U.S. economic growth was mixed during the six months under review. In 2015’s first quarter, U.S. dollar strength, low energy prices, and a labor dispute at West Coast ports led exports to decline. Lower business investment and state and local government spending also weighed on the economy, while increases in consumer spending, residential investment and private inventory investment offered some support. In the second quarter, business capital spending rebounded and manufacturing and non-manufacturing activities increased, contributing to strong job gains that helped the unemployment rate decline from 5.6% in December 2014 to 5.3% in June 2015.2 Housing market data were generally encouraging as home sales and prices rose. After a brief, winter slump, retail sales rebounded in the spring as strong employment gains led to
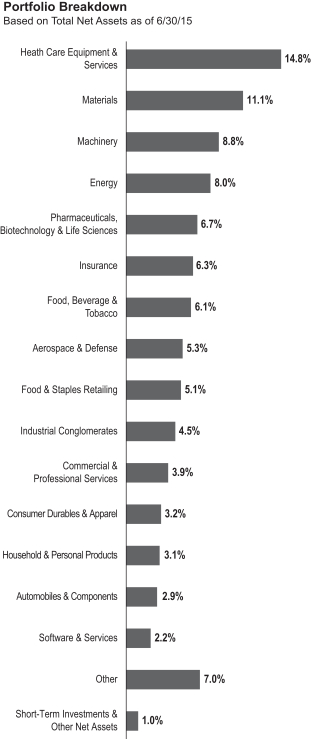
1. Source: Morningstar.
One cannot invest directly in an index, and an index is not representative of the Fund’s portfolio. Please see Index Descriptions following the Fund Summaries.
2. Source: Bureau of Labor Statistics.
| FRD-2 | Semiannual Report |
FRANKLIN RISING DIVIDENDS VIP FUND
broad-based improvement, especially for auto and gasoline sales. Inflation, as measured by the Consumer Price Index, rose during the six months amid generally higher energy prices bouncing from recent lows.
During the six-month period, the Federal Reserve Board (Fed) kept its target interest rate at 0%–0.25% while considering when an increase would be appropriate. The Fed anticipated raising its target rate when it saw further labor market progress and was reasonably confident that inflation would move back to 2% over the medium term. In its June meeting, the Fed lowered its 2015 economic growth forecast and raised unemployment estimates given the weak start to the year.
Investor confidence grew during the period as corporate profits remained healthy, the Fed showed caution about raising interest rates, economic data in Europe and Japan improved and China introduced more stimulus measures. However, the stock markets endured some sell-offs when many investors reacted to debt negotiations between Greece and its creditors, geopolitical tensions in certain regions, and less robust growth in China. For the six months under review, U.S. stocks, as measured by the S&P 500 and the Dow Jones Industrial Average, rose marginally after both reached all-time highs in May.3
Investment Strategy
We are a research-driven, fundamental investment adviser, pursuing a disciplined value-oriented strategy. As bottom-up investors concentrating primarily on individual securities, we seek fundamentally sound companies that we believe meet our screening criteria, which include consistent, substantial dividend increases; reinvested earnings; and strong balance sheets. We attempt to acquire such stocks at attractive prices, often when they are out of favor with other investors. In following these criteria, we do not necessarily focus on companies whose securities pay a high dividend but rather on companies that consistently raise their dividends.
Manager’s Discussion
During the period, three holdings that contributed to absolute performance were Roper Technologies, NIKE and West Pharmaceutical Services. Shares of Roper Technologies (formerly Roper Industries), a diversified industrial company, delivered strong results despite concerns that weakness in energy end markets, and the effects of this weakness in industrial markets, would present a significant headwind. Although Roper did report increasing headwinds in its energy
and industrial end markets, the company was able to mitigate the effects of these headwinds with very strong performance elsewhere. The company has 22 consecutive years of dividend increases. Shares of NIKE, a global athletic equipment and apparel maker, continued to rise in response to positive earnings reports in March and June. The company reported strong, constant currency growth and margin leverage, despite tough comparisons to the previous fiscal year when sales were elevated due to the FIFA World Cup. U.S. dollar strength reduced reported gross revenue growth, but investors appeared to look through this to the strong underlying fundamentals. NIKE continued to drive growth through innovation and progressive market segmentation. The company has raised its dividend for 13 consecutive years. Shares of West Pharmaceutical Services, a manufacturer of drug delivery systems and components, rose in response to two good earnings reports. In May, the company reported Food and Drug Administration approval of a customer’s drug that will be packaged using Resin CZ, an innovative material that was anticipated to hold the potential for high growth and margins. The company’s long-term growth drivers remained strong, in our view. The move from development to commercial use for some of its newer products such as
| Top 10 Holdings | ||||
| 6/30/15 | ||||
Company Sector/Industry | % of Total Net Assets | |||
| Roper Technologies Inc. Industrial Conglomerates | 4.0% | |||
| Praxair Inc. Materials | 3.6% | |||
| United Technologies Corp. Aerospace & Defense | 3.6% | |||
| Dover Corp. Machinery | 3.4% | |||
| Becton, Dickinson and Co. Health Care Equipment & Services | 3.3% | |||
| Johnson & Johnson Pharmaceuticals, Biotechnology & Life Sciences | 3.2% | |||
| West Pharmaceutical Services Inc. Health Care Equipment & Services | 3.2% | |||
| Air Products and Chemicals Inc. Materials | 3.0% | |||
| Stryker Corp. Health Care Equipment & Services | 3.0% | |||
| Johnson Controls Inc. Automobiles & Components | 3.0% | |||
The dollar value, number of shares or principal amount, and names of all portfolio holdings are listed in the Fund’s Statement of Investments.
3. Please see Index Descriptions following the Fund Summaries.
| Semiannual Report | FRD-3 |
FRANKLIN RISING DIVIDENDS VIP FUND
Resin CZ has been slower than anticipated, although we believe the company’s long-term growth drivers remained strong. West has raised its dividend for 22 consecutive years.
Detractors from absolute performance included Wal-Mart Stores, The Procter & Gamble Co. and Chevron. Shares of Wal-Mart, a global discount retailer, dropped steadily from the beginning of the year as investors were concerned about margin compression from wage hikes and increased e-commerce investments, as well as a disappointing earnings report in May. Investors have had high expectations of improved operational performance, driven by recent changes in management leadership. We believe that the company’s investments in e-commerce and in its associates make long-term sense and that management has the potential to make steady incremental improvement in its core markets. However, we believe this transformation will take time. Wal-Mart has raised its dividend for the past 42 years. Shares of Procter & Gamble, a global consumer products company, continued to decline after a disappointing earnings report in April. The turnaround in the company’s business lines, particularly in the beauty segment, is proceeding slowly. We believe the company has outlined a sensible strategic plan and has taken appropriate action in problem areas such as pricing and in divesting low value-add brands. We continue to regard Procter & Gamble’s brand-building skills as a key competitive advantage and believe the turnaround will deliver value for shareholders. The company has raised its dividend for the past 59 years. Shares of Chevron, a major integrated oil and gas company, declined over the period, as lower oil and natural gas prices pressured company earnings and as uncertainty surrounding global growth prospects and surplus oil inventories weighed on the energy sector broadly. Although Chevron’s oil and gas upstream production businesses struggled in the recent, weak energy price environment, the integrated refining and marketing businesses benefited from lower energy input prices, partially offsetting the upstream earnings headwinds.
During the period, we initiated new positions in The Gap, a clothing retailer with nine years of dividend increases; Linear Technology, a manufacturer and distributor of analog integrated circuits (23 years); and Tiffany, a jewelry retailer (13 years). We added to our holdings in Texas Instruments, a semiconductor
designer and manufacturer (11 years); W.W. Grainger, a distributor of maintenance, repair and operating products (44 years); and Microsoft, a developer and manufacturer of system software (11 years); among others. Positions we liquidated included International Business Machines and California Resources, the latter of which we received as a spin-off of Occidental Petroleum. We reduced our positions in Teleflex, NIKE and Roper Technologies, among others.
Our 10 largest positions on June 30, 2015, represented 33.3% of the Fund’s total net assets. It is interesting to note how these 10 companies would respond, in aggregate, to the Fund’s screening criteria based on a simple average of statistical measures. On average, these 10 companies have raised their dividends 30 years in a row and by 327% over the past 10 years. Their most recent year-over-year dividend increases averaged 11.4% with a yield of 1.9% on June 30, 2015, and a dividend payout ratio of 34.8%, based on estimates of calendar year 2015 operating earnings. The average price/earnings ratio was 19.8 times calendar year 2015 estimates versus 17.4 for that of the unmanaged S&P 500.
Thank you for your participation in Franklin Rising Dividends VIP Fund. We look forward to serving your future investment needs.
The foregoing information reflects our analysis, opinions and portfolio holdings as of June 30, 2015, the end of the reporting period. The way we implement our main investment strategies and the resulting portfolio holdings may change depending on factors such as market and economic conditions. These opinions may not be relied upon as investment advice or an offer for a particular security. The information is not a complete analysis of every aspect of any market, country, industry, security or the Fund. Statements of fact are from sources considered reliable, but the investment manager makes no representation or warranty as to their completeness or accuracy. Although historical performance is no guarantee of future results, these insights may help you understand our investment management philosophy.
| FRD-4 | Semiannual Report |
FRANKLIN RISING DIVIDENDS VIP FUND
Class 1 Fund Expenses
As an investor in a variable insurance contract (Contract) that indirectly provides for investment in an underlying mutual fund, you can incur transaction and/or ongoing expenses at both the Fund level and the Contract level.
| • | Transaction expenses can include sales charges (loads) on purchases, surrender fees, transfer fees and premium taxes. |
| • | Ongoing expenses can include management fees, distribution and service (12b-1) fees, contract fees, annual maintenance fees, mortality and expense risk fees and other fees and expenses. All mutual funds and Contracts have some types of ongoing expenses. |
The expenses shown in the table are meant to highlight ongoing expenses at the Fund level only and do not include ongoing expenses at the Contract level, or transaction expenses at either the Fund or Contract levels. While the Fund does not have transaction expenses, if the transaction and ongoing expenses at the Contract level were included, the expenses shown below would be higher. You should consult your Contract prospectus or disclosure document for more information.
The table shows Fund-level ongoing expenses and can help you understand these expenses and compare them with those of other mutual funds offered through the Contract. The table assumes a $1,000 investment held for the six months indicated. Please refer to the Fund prospectus for additional information on operating expenses.
Actual Fund Expenses
The first line (Actual) of the table provides actual account values and expenses. The “Ending Account Value” is derived from the Fund’s actual return, which includes the effect of ongoing Fund expenses, but does not include the effect of ongoing Contract expenses.
You can estimate the Fund-level expenses you incurred during the period by following these steps. Of course, your account value and expenses will differ from those in this illustration:
| 1. | Divide your account value by $1,000. |
If an account had an $8,600 value, then $8,600 ÷ $1,000 = 8.6.
| 2. | Multiply the result by the number under the heading “Fund-Level Expenses Incurred During Period.” |
If Fund-Level Expenses Incurred During Period were $7.50, then 8.6 × $7.50 = $64.50.
In this illustration, the estimated expenses incurred this period at the Fund level are $64.50.
Hypothetical Example for Comparison with Other Mutual Funds
Information in the second line (Hypothetical) of the table can help you compare ongoing expenses of the Fund with those of other mutual funds offered through the Contract. This information may not be used to estimate the actual ending account balance or expenses you incurred during the period. The hypothetical “Ending Account Value” is based on the Fund’s actual expense ratio and an assumed 5% annual rate of return before expenses, which does not represent the Fund’s actual return. The figure under the heading “Fund-Level Expenses Incurred During Period” shows the hypothetical expenses your account would have incurred under this scenario. You can compare this figure with the 5% hypothetical examples that appear in shareholder reports of other funds offered through a Contract.
| Class 1 | Beginning Account Value 1/1/15 | Ending Account Value 6/30/15 | Fund-Level Expenses 1/1/15–6/30/15 | |||||||||
Actual | $1,000 | $ 999.10 | $3.07 | |||||||||
Hypothetical (5% return before expenses) | $1,000 | $1,021.72 | $3.11 | |||||||||
*Expenses are calculated using the most recent six-month annualized expense ratio, net of expenses waivers, for the Fund’s Class 1 shares (0.62%), which does not include any ongoing expenses of the Contract for which the Fund is an investment option, multiplied by the average account value over the period, multiplied by 181/365 to reflect the one-half year period.
| Semiannual Report | FRD-5 |
FRANKLIN TEMPLETON VARIABLE INSURANCE PRODUCTS TRUST
Financial Highlights
Franklin Rising Dividends VIP Fund
| Six Months Ended June 30, 2015 (unaudited) | Year Ended December 31, | |||||||||||||||||||||||
| 2014 | 2013 | 2012 | 2011 | 2010 | ||||||||||||||||||||
| Class 1 | ||||||||||||||||||||||||
Per share operating performance (for a share outstanding throughout the period) | ||||||||||||||||||||||||
Net asset value, beginning of period | $29.63 | $28.14 | $22.03 | $20.01 | $19.15 | $16.13 | ||||||||||||||||||
|
| |||||||||||||||||||||||
| Income from investment operationsa: | ||||||||||||||||||||||||
Net investment incomeb | 0.23 | 0.45 | 0.40 | 0.41 | 0.36 | 0.32 | ||||||||||||||||||
Net realized and unrealized gains (losses) | (0.24 | ) | 2.03 | 6.16 | 2.00 | 0.83 | 3.01 | |||||||||||||||||
|
| |||||||||||||||||||||||
Total from investment operations | (0.01 | ) | 2.48 | 6.56 | 2.41 | 1.19 | 3.33 | |||||||||||||||||
|
| |||||||||||||||||||||||
| Less distributions from: | ||||||||||||||||||||||||
Net investment income | (0.48 | ) | (0.44 | ) | (0.45 | ) | (0.39 | ) | (0.33 | ) | (0.31 | ) | ||||||||||||
Net realized gains | (3.01 | ) | (0.55 | ) | — | — | — | — | ||||||||||||||||
|
| |||||||||||||||||||||||
Total distributions | (3.49 | ) | (0.99 | ) | (0.45 | ) | (0.39 | ) | (0.33 | ) | (0.31 | ) | ||||||||||||
|
| |||||||||||||||||||||||
Net asset value, end of period | $26.13 | $29.63 | $28.14 | $22.03 | $20.01 | $19.15 | ||||||||||||||||||
|
| |||||||||||||||||||||||
Total returnc | (0.09)% | 9.01% | 30.05% | 12.18% | 6.29% | 20.94% | ||||||||||||||||||
| Ratios to average net assetsd | ||||||||||||||||||||||||
Expenses | 0.62% | e | 0.62% | e | 0.61% | 0.63% | 0.63% | 0.64% | ||||||||||||||||
Net investment income | 1.56% | 1.58% | 1.59% | 1.96% | 1.87% | 1.88% | ||||||||||||||||||
| Supplemental data | ||||||||||||||||||||||||
Net assets, end of period (000’s) | $152,345 | $160,480 | $168,380 | $141,455 | $140,297 | $148,544 | ||||||||||||||||||
Portfolio turnover rate | 3.19% | 8.61% | 0.07% | 11.19% | 12.76% | 8.97% | ||||||||||||||||||
aThe amount shown for a share outstanding throughout the period may not correlate with the Statement of Operations for the period due to the timing of sales and repurchases of the Fund’s shares in relation to income earned and/or fluctuating fair value of the investments of the Fund.
bBased on average daily shares outstanding.
cTotal return does not include fees, charges or expenses imposed by the variable annuity and life insurance contracts for which Franklin Templeton Variable Insurance Products Trust serves as an underlying investment vehicle. Total return is not annualized for periods less than one year.
dRatios are annualized for periods less than one year.
eBenefit of waiver and payments by affiliates rounds to less than 0.01%.
| FRD-6 | Semiannual Report | The accompanying notes are an integral part of these financial statements. |
FRANKLIN TEMPLETON VARIABLE INSURANCE PRODUCTS TRUST
FINANCIAL HIGHLIGHTS
Franklin Rising Dividends VIP Fund (continued)
Six Months Ended (unaudited) | Year Ended December 31, | |||||||||||||||||||||||
| 2014 | 2013 | 2012 | 2011 | 2010 | ||||||||||||||||||||
| Class 2 | ||||||||||||||||||||||||
| Per share operating performance (for a share outstanding throughout the period) | ||||||||||||||||||||||||
Net asset value, beginning of period | $29.06 | $27.62 | $21.64 | $19.65 | $18.82 | $15.86 | ||||||||||||||||||
|
| |||||||||||||||||||||||
| Income from investment operationsa: | ||||||||||||||||||||||||
Net investment incomeb | 0.19 | 0.37 | 0.33 | 0.35 | 0.31 | 0.28 | ||||||||||||||||||
Net realized and unrealized gains (losses) | (0.22 | ) | 1.99 | 6.04 | 1.98 | 0.81 | 2.95 | |||||||||||||||||
|
| |||||||||||||||||||||||
Total from investment operations | (0.03 | ) | 2.36 | 6.37 | 2.33 | 1.12 | 3.23 | |||||||||||||||||
|
| |||||||||||||||||||||||
| Less distributions from: | ||||||||||||||||||||||||
Net investment income | (0.41 | ) | (0.37 | ) | (0.39 | ) | (0.34 | ) | (0.29 | ) | (0.27 | ) | ||||||||||||
Net realized gains | (3.01 | ) | (0.55 | ) | — | — | — | — | ||||||||||||||||
|
| |||||||||||||||||||||||
Total distributions | (3.42 | ) | (0.92 | ) | (0.39 | ) | (0.34 | ) | (0.29 | ) | (0.27 | ) | ||||||||||||
|
| |||||||||||||||||||||||
Net asset value, end of period | $25.61 | $29.06 | $27.62 | $21.64 | $19.65 | $18.82 | ||||||||||||||||||
|
| |||||||||||||||||||||||
Total returnc | (0.18)% | 8.72% | 29.69% | 11.96% | 6.00% | 20.64% | ||||||||||||||||||
| Ratios to average net assetsd | ||||||||||||||||||||||||
Expenses | 0.87% | e | 0.87% | e | 0.86% | 0.88% | 0.88% | 0.89% | ||||||||||||||||
Net investment income | 1.31% | 1.33% | 1.34% | 1.71% | 1.62% | 1.63% | ||||||||||||||||||
| Supplemental data | ||||||||||||||||||||||||
Net assets, end of period (000’s) | $1,574,405 | $1,667,816 | $1,752,012 | $1,550,084 | $1,523,396 | $1,572,732 | ||||||||||||||||||
Portfolio turnover rate | 3.19% | 8.61% | 0.07% | 11.19% | 12.76% | 8.97% | ||||||||||||||||||
aThe amount shown for a share outstanding throughout the period may not correlate with the Statement of Operations for the period due to the timing of sales and repurchases of the Fund’s shares in relation to income earned and/or fluctuating fair value of the investments of the Fund.
bBased on average daily shares outstanding.
cTotal return does not include fees, charges or expenses imposed by the variable annuity and life insurance contracts for which Franklin Templeton Variable Insurance Products Trust serves as an underlying investment vehicle. Total return is not annualized for periods less than one year.
dRatios are annualized for periods less than one year.
eBenefit of waiver and payments by affiliates rounds to less than 0.01%.
| The accompanying notes are an integral part of these financial statements. | Semiannual Report | FRD-7 |
FRANKLIN TEMPLETON VARIABLE INSURANCE PRODUCTS TRUST
FINANCIAL HIGHLIGHTS
Franklin Rising Dividends VIP Fund (continued)
Six Months Ended (unaudited) | Year Ended December 31, | |||||||||||||||||||||||
| 2014 | 2013 | 2012 | 2011 | 2010 | ||||||||||||||||||||
| Class 4 | ||||||||||||||||||||||||
| Per share operating performance (for a share outstanding throughout the period) | ||||||||||||||||||||||||
Net asset value, beginning of period | $29.19 | $27.76 | $21.78 | $19.83 | $19.04 | $16.09 | ||||||||||||||||||
|
| |||||||||||||||||||||||
| Income from investment operationsa: | ||||||||||||||||||||||||
Net investment incomeb | 0.18 | 0.35 | 0.32 | 0.35 | 0.31 | 0.32 | ||||||||||||||||||
Net realized and unrealized gains (losses) | (0.24 | ) | 2.00 | 6.07 | 1.96 | 0.80 | 2.94 | |||||||||||||||||
|
| |||||||||||||||||||||||
Total from investment operations | (0.06 | ) | 2.35 | 6.39 | 2.31 | 1.11 | 3.26 | |||||||||||||||||
|
| |||||||||||||||||||||||
| Less distributions from: | ||||||||||||||||||||||||
Net investment income | (0.41 | ) | (0.37 | ) | (0.41 | ) | (0.36 | ) | (0.32 | ) | (0.31 | ) | ||||||||||||
Net realized gains | (3.01 | ) | (0.55 | ) | — | — | — | — | ||||||||||||||||
|
| |||||||||||||||||||||||
Total distributions | (3.42 | ) | (0.92 | ) | (0.41 | ) | (0.36 | ) | (0.32 | ) | (0.31 | ) | ||||||||||||
|
| |||||||||||||||||||||||
Net asset value, end of period | $25.71 | $29.19 | $27.76 | $21.78 | $19.83 | $19.04 | ||||||||||||||||||
|
| |||||||||||||||||||||||
Total returnc | (0.26)% | 8.62% | 29.57% | 11.78% | 5.89% | 20.62% | ||||||||||||||||||
| Ratios to average net assetsd | ||||||||||||||||||||||||
Expenses | 0.97% | e | 0.97% | e | 0.96% | 0.98% | 0.98% | 0.99% | ||||||||||||||||
Net investment income | 1.21% | 1.23% | 1.24% | 1.61% | 1.52% | 1.53% | ||||||||||||||||||
| Supplemental data | ||||||||||||||||||||||||
Net assets, end of period (000’s) | $19,484 | $15,503 | $12,028 | $6,432 | $3,020 | $1,007 | ||||||||||||||||||
Portfolio turnover rate | 3.19% | 8.61% | 0.07% | 11.19% | 12.76% | 8.97% | ||||||||||||||||||
aThe amount shown for a share outstanding throughout the period may not correlate with the Statement of Operations for the period due to the timing of sales and repurchases of the Fund’s shares in relation to income earned and/or fluctuating fair value of the investments of the Fund.
bBased on average daily shares outstanding.
cTotal return does not include fees, charges or expenses imposed by the variable annuity and life insurance contracts for which Franklin Templeton Variable Insurance Products Trust serves as an underlying investment vehicle. Total return is not annualized for periods less than one year.
dRatios are annualized for periods less than one year.
eBenefit of waiver and payments by affiliates rounds to less than 0.01%.
| FRD-8 | Semiannual Report | The accompanying notes are an integral part of these financial statements. |
FRANKLIN TEMPLETON VARIABLE INSURANCE PRODUCTS TRUST
Statement of Investments, June 30, 2015 (unaudited)
Franklin Rising Dividends VIP Fund
| ||||||||||
| Shares | Value | |||||||||
Common Stocks 99.0% | ||||||||||
Aerospace & Defense 5.3% | ||||||||||
General Dynamics Corp. | 73,500 | $ | 10,414,215 | |||||||
Honeywell International Inc. | 180,100 | 18,364,797 | ||||||||
United Technologies Corp. | 568,611 | 63,076,018 | ||||||||
|
| |||||||||
| 91,855,030 | ||||||||||
|
| |||||||||
Automobiles & Components 2.9% | ||||||||||
Johnson Controls Inc. | 1,040,500 | 51,535,965 | ||||||||
|
| |||||||||
Commercial & Professional Services 3.9% | ||||||||||
ABM Industries Inc. | 814,288 | 26,765,647 | ||||||||
Brady Corp., A | 653,579 | 16,169,544 | ||||||||
Cintas Corp. | 205,700 | 17,400,163 | ||||||||
Matthews International Corp., A | 139,942 | 7,436,518 | ||||||||
|
| |||||||||
| 67,771,872 | ||||||||||
|
| |||||||||
Consumer Durables & Apparel 3.2% | ||||||||||
Leggett & Platt Inc. | 332,800 | 16,200,704 | ||||||||
NIKE Inc., B | 360,000 | 38,887,200 | ||||||||
|
| |||||||||
| 55,087,904 | ||||||||||
|
| |||||||||
Consumer Services 1.5% | ||||||||||
McDonald’s Corp. | 254,345 | 24,180,579 | ||||||||
Yum! Brands Inc. | 25,400 | 2,288,032 | ||||||||
|
| |||||||||
| 26,468,611 | ||||||||||
|
| |||||||||
Diversified Financials 0.5% | ||||||||||
State Street Corp. | 110,500 | 8,508,500 | ||||||||
|
| |||||||||
Energy 8.0% | ||||||||||
Chevron Corp. | 451,500 | 43,556,205 | ||||||||
EOG Resources Inc. | 33,600 | 2,941,680 | ||||||||
Exxon Mobil Corp. | 365,500 | 30,409,600 | ||||||||
Occidental Petroleum Corp. | 370,790 | 28,836,338 | ||||||||
Schlumberger Ltd. | 398,000 | 34,303,620 | ||||||||
|
| |||||||||
| 140,047,443 | ||||||||||
|
| |||||||||
Food & Staples Retailing 5.1% | ||||||||||
CVS Health Corp. | 71,600 | 7,509,408 | ||||||||
Wal-Mart Stores Inc. | 634,800 | 45,026,364 | ||||||||
Walgreens Boots Alliance Inc. | 437,100 | 36,908,724 | ||||||||
|
| |||||||||
| 89,444,496 | ||||||||||
|
| |||||||||
Food, Beverage & Tobacco 6.1% | ||||||||||
Archer-Daniels-Midland Co. | 713,000 | 34,380,860 | ||||||||
Bunge Ltd. | 166,400 | 14,609,920 | ||||||||
McCormick & Co. Inc. | 295,000 | 23,880,250 | ||||||||
PepsiCo Inc. | 363,900 | 33,966,426 | ||||||||
|
| |||||||||
| 106,837,456 | ||||||||||
|
| |||||||||
Health Care Equipment & Services 14.8% | ||||||||||
Abbott Laboratories | 641,800 | 31,499,544 | ||||||||
Becton, Dickinson and Co. | 408,543 | 57,870,116 | ||||||||
DENTSPLY International Inc. | 4,000 | 206,200 | ||||||||
Medtronic PLC | 667,500 | 49,461,750 | ||||||||
Stryker Corp. | 542,100 | 51,808,497 | ||||||||
| Semiannual Report | FRD-9 |
FRANKLIN TEMPLETON VARIABLE INSURANCE PRODUCTS TRUST
STATEMENT OF INVESTMENTS (UNAUDITED)
Franklin Rising Dividends VIP Fund (continued)
| Shares | Value | |||||||||
Common Stocks (continued) | ||||||||||
Health Care Equipment & Services (continued) | ||||||||||
Teleflex Inc. | 86,053 | $ | 11,655,879 | |||||||
West Pharmaceutical Services Inc. | 966,933 | 56,159,469 | ||||||||
|
| |||||||||
| 258,661,455 | ||||||||||
|
| |||||||||
Household & Personal Products 3.1% | ||||||||||
Colgate-Palmolive Co. | 191,000 | 12,493,310 | ||||||||
The Procter & Gamble Co. | 538,600 | 42,140,064 | ||||||||
|
| |||||||||
| 54,633,374 | ||||||||||
|
| |||||||||
Industrial Conglomerates 4.5% | ||||||||||
Carlisle Cos. Inc. | 96,261 | 9,637,651 | ||||||||
Roper Technologies Inc. | 404,650 | 69,785,939 | ||||||||
|
| |||||||||
| 79,423,590 | ||||||||||
|
| |||||||||
Insurance 6.3% | ||||||||||
Aflac Inc. | 276,200 | 17,179,640 | ||||||||
Arthur J. Gallagher & Co. | 704,000 | 33,299,200 | ||||||||
The Chubb Corp. | 45,000 | 4,281,300 | ||||||||
Erie Indemnity Co., A | 488,085 | 40,057,136 | ||||||||
Old Republic International Corp. | 635,708 | 9,936,116 | ||||||||
RLI Corp. | 103,142 | 5,300,468 | ||||||||
|
| |||||||||
| 110,053,860 | ||||||||||
|
| |||||||||
Machinery 8.8% | ||||||||||
Donaldson Co. Inc. | 350,068 | 12,532,434 | ||||||||
Dover Corp. | 839,376 | 58,907,408 | ||||||||
Hillenbrand Inc. | 1,027,300 | 31,538,110 | ||||||||
Pentair PLC (United Kingdom) | 738,800 | 50,792,500 | ||||||||
|
| |||||||||
| 153,770,452 | ||||||||||
|
| |||||||||
Materials 11.1% | ||||||||||
Air Products and Chemicals Inc. | 378,900 | 51,844,887 | ||||||||
Albemarle Corp. | 706,700 | 39,059,309 | ||||||||
Bemis Co. Inc. | 172,199 | 7,750,677 | ||||||||
Ecolab Inc. | 107,000 | 12,098,490 | ||||||||
Nucor Corp. | 447,055 | 19,701,714 | ||||||||
Praxair Inc. | 530,460 | 63,416,493 | ||||||||
|
| |||||||||
| 193,871,570 | ||||||||||
|
| |||||||||
Media 0.9% | ||||||||||
John Wiley & Sons Inc., A | 279,100 | 15,174,667 | ||||||||
|
| |||||||||
Pharmaceuticals, Biotechnology & Life Sciences 6.7% | ||||||||||
AbbVie Inc. | 300,800 | 20,210,752 | ||||||||
Johnson & Johnson | 580,000 | 56,526,800 | ||||||||
Perrigo Co. PLC | 1,500 | 277,245 | ||||||||
Pfizer Inc. | 1,193,100 | 40,004,643 | ||||||||
Roche Holding AG, ADR (Switzerland) | 25,000 | 876,750 | ||||||||
|
| |||||||||
| 117,896,190 | ||||||||||
|
| |||||||||
Retailing 1.5% | ||||||||||
The Gap Inc. | 345,800 | 13,199,186 | ||||||||
Ross Stores Inc. | 58,000 | 2,819,380 | ||||||||
Target Corp. | 85,800 | 7,003,854 | ||||||||
| FRD-10 | Semiannual Report |
FRANKLIN TEMPLETON VARIABLE INSURANCE PRODUCTS TRUST
STATEMENT OF INVESTMENTS (UNAUDITED)
Franklin Rising Dividends VIP Fund (continued)
| Shares | Value | |||||||||
Common Stocks (continued) | ||||||||||
Retailing (continued) | ||||||||||
Tiffany & Co. | 26,600 | $ | 2,441,880 | |||||||
|
| |||||||||
| 25,464,300 | ||||||||||
|
| |||||||||
Semiconductors & Semiconductor Equipment 1.3% | ||||||||||
Linear Technology Corp. | 137,100 | 6,063,933 | ||||||||
Texas Instruments Inc. | 315,800 | 16,266,858 | ||||||||
|
| |||||||||
| 22,330,791 | ||||||||||
|
| |||||||||
Software & Services 2.2% | ||||||||||
Accenture PLC, A | 158,500 | 15,339,630 | ||||||||
Microsoft Corp. | 524,500 | 23,156,675 | ||||||||
|
| |||||||||
| 38,496,305 | ||||||||||
|
| |||||||||
Technology Hardware & Equipment 0.7% | ||||||||||
| a | Knowles Corp. | 285,500 | 5,167,550 | |||||||
QUALCOMM Inc. | 114,500 | 7,171,135 | ||||||||
|
| |||||||||
| 12,338,685 | ||||||||||
|
| |||||||||
Trading Companies & Distributors 0.4% | ||||||||||
W.W. Grainger Inc. | 26,100 | 6,176,565 | ||||||||
|
| |||||||||
Transportation 0.2% | ||||||||||
United Parcel Service Inc., B | 28,500 | 2,761,935 | ||||||||
|
| |||||||||
Total Common Stocks (Cost $993,676,464) | 1,728,611,016 | |||||||||
|
| |||||||||
Short Term Investments (Cost $20,238,220) 1.1% | ||||||||||
Money Market Funds 1.1% | ||||||||||
| a,b | Institutional Fiduciary Trust Money Market Portfolio | 20,238,220 | 20,238,220 | |||||||
|
| |||||||||
Total Investments (Cost $1,013,914,684) 100.1% | 1,748,849,236 | |||||||||
Other Assets, less Liabilities (0.1)% | (2,614,292 | ) | ||||||||
|
| |||||||||
Net Assets 100.0% | $ | 1,746,234,944 | ||||||||
|
| |||||||||
See Abbreviations on page FRD-20.
aNon-income producing.
bSee Note 3(e) regarding investments in Institutional Fiduciary Trust Money Market Portfolio.
| The accompanying notes are an integral part of these financial statements. | Semiannual Report | FRD-11 |
FRANKLIN TEMPLETON VARIABLE INSURANCE PRODUCTS TRUST
Financial Statements
Statement of Assets and Liabilities
June 30, 2015 (unaudited)
| Franklin Rising Dividends VIP Fund | ||||
Assets: | ||||
Investments in securities: | ||||
Cost - Unaffiliated issuers | $ | 993,676,464 | ||
Cost - Sweep Money Fund (Note 3e) | 20,238,220 | |||
|
| |||
Total cost of investments | $ | 1,013,914,684 | ||
|
| |||
Value - Unaffiliated issuers | $ | 1,728,611,016 | ||
Value - Sweep Money Fund (Note 3e) | 20,238,220 | |||
|
| |||
Total value of investments | 1,748,849,236 | |||
Receivables: | ||||
Investment securities sold | 3,059,461 | |||
Capital shares sold | 532,865 | |||
Dividends | 2,452,558 | |||
Other assets | 745 | |||
|
| |||
Total assets | 1,754,894,865 | |||
|
| |||
Liabilities: | ||||
Payables: | ||||
Investment securities purchased | 5,887,222 | |||
Capital shares redeemed | 1,000,283 | |||
Management fees | 883,231 | |||
Distribution fees | 684,271 | |||
Accrued expenses and other liabilities | 204,914 | |||
|
| |||
Total liabilities | 8,659,921 | |||
|
| |||
Net assets, at value | $ | 1,746,234,944 | ||
|
| |||
Net assets consist of: | ||||
Paid-in capital | $ | 900,760,238 | ||
Undistributed net investment income | 11,882,123 | |||
Net unrealized appreciation (depreciation) | 734,934,552 | |||
Accumulated net realized gain (loss) | 98,658,031 | |||
|
| |||
Net assets, at value | $ | 1,746,234,944 | ||
|
| |||
| Class 1: | ||||
Net assets, at value | $ | 152,345,146 | ||
|
| |||
Shares outstanding | 5,830,029 | |||
|
| |||
Net asset value and maximum offering price per share | $ | 26.13 | ||
|
| |||
| Class 2: | ||||
Net assets, at value | $ | 1,574,405,408 | ||
|
| |||
Shares outstanding | 61,483,261 | |||
|
| |||
Net asset value and maximum offering price per share | $ | 25.61 | ||
|
| |||
| Class 4: | ||||
Net assets, at value | $ | 19,484,390 | ||
|
| |||
Shares outstanding | 757,728 | |||
|
| |||
Net asset value and maximum offering price per share | $ | 25.71 | ||
|
| |||
| FRD-12 | Semiannual Report | The accompanying notes are an integral part of these financial statements. |
FRANKLIN TEMPLETON VARIABLE INSURANCE PRODUCTS TRUST
FINANCIAL STATEMENTS
Statement of Operations
for the six months ended June 30, 2015 (unaudited)
| Franklin Rising Dividends VIP Fund | ||||
Investment income: | ||||
Dividends | $ | 19,481,743 | ||
|
| |||
Expenses: | ||||
Management fees (Note 3a) | 5,404,973 | |||
Distribution fees: (Note 3c) | ||||
Class 2 | 2,016,389 | |||
Class 4 | 30,940 | |||
Custodian fees (Note 4) | 8,288 | |||
Reports to shareholders | 93,447 | |||
Professional fees | 28,092 | |||
Trustees’ fees and expenses | 3,856 | |||
Other | 15,501 | |||
|
| |||
Total expenses | 7,601,486 | |||
Expenses waived/paid by affiliates (Note 3e) | (8,719 | ) | ||
|
| |||
Net expenses | 7,592,767 | |||
|
| |||
Net investment income | 11,888,976 | |||
|
| |||
Realized and unrealized gains (losses): | ||||
Net realized gain (loss) from: | ||||
Investments | 98,785,977 | |||
Foreign currency transactions | (1,710 | ) | ||
|
| |||
Net realized gain (loss) | 98,784,267 | |||
|
| |||
Net change in unrealized appreciation (depreciation) on investments | (113,597,195 | ) | ||
|
| |||
Net realized and unrealized gain (loss) | (14,812,928 | ) | ||
|
| |||
Net increase (decrease) in net assets resulting from operations | $ | (2,923,952 | ) | |
|
| |||
| The accompanying notes are an integral part of these financial statements. | Semiannual Report | FRD-13 |
FRANKLIN TEMPLETON VARIABLE INSURANCE PRODUCTS TRUST
FINANCIAL STATEMENTS
Statements of Changes in Net Assets
| Franklin Rising Dividends VIP Fund | ||||||||
| Six Months Ended June 30, 2015 (unaudited) | Year Ended December 31, 2014 | |||||||
Increase (decrease) in net assets: | ||||||||
Operations: | ||||||||
Net investment income | $ | 11,888,976 | $ | 24,971,534 | ||||
Net realized gain (loss) | 98,784,267 | 183,292,710 | ||||||
Net change in unrealized appreciation (depreciation) | (113,597,195 | ) | (59,038,904 | ) | ||||
|
| |||||||
Net increase (decrease) in net assets resulting from operations | (2,923,952 | ) | 149,225,340 | |||||
|
| |||||||
Distributions to shareholders from: | ||||||||
Net investment income: | ||||||||
Class 1 | (2,507,451 | ) | (2,478,710 | ) | ||||
Class 2 | (22,189,853 | ) | (22,406,447 | ) | ||||
Class 4 | (275,517 | ) | (165,391 | ) | ||||
Net realized gains: | ||||||||
Class 1 | (15,606,236 | ) | (3,072,165 | ) | ||||
Class 2 | (164,222,373 | ) | (32,971,551 | ) | ||||
Class 4 | (2,002,122 | ) | (247,432 | ) | ||||
|
| |||||||
Total distributions to shareholders | (206,803,552 | ) | (61,341,696 | ) | ||||
|
| |||||||
Capital share transactions: (Note 2) | ||||||||
Class 1 | 10,034,631 | (16,079,195 | ) | |||||
Class 2 | 95,813,532 | (163,125,563 | ) | |||||
Class 4 | 6,315,156 | 2,701,123 | ||||||
|
| |||||||
Total capital share transactions | 112,163,319 | (176,503,635 | ) | |||||
|
| |||||||
Net increase (decrease) in net assets | (97,564,185 | ) | (88,619,991 | ) | ||||
Net assets: | ||||||||
Beginning of period | 1,843,799,129 | 1,932,419,120 | ||||||
|
| |||||||
End of period | $ | 1,746,234,944 | $ | 1,843,799,129 | ||||
|
| |||||||
Undistributed net investment income included in net assets: | ||||||||
End of period | $ | 11,882,123 | $ | 24,965,968 | ||||
|
| |||||||
| FRD-14 | Semiannual Report | The accompanying notes are an integral part of these financial statements. |
FRANKLIN TEMPLETON VARIABLE INSURANCE PRODUCTS TRUST
Notes to Financial Statements (unaudited)
Franklin Rising Dividends VIP Fund
1. Organization and Significant Accounting Policies
Franklin Templeton Variable Insurance Products Trust (Trust) is registered under the Investment Company Act of 1940 (1940 Act) as an open-end management investment company, consisting of nineteen separate funds and applies the specialized accounting and reporting guidance in U.S. Generally Accepted Accounting Principles (U.S. GAAP). Franklin Rising Dividends VIP Fund (Fund) is included in this report. The financial statements of the remaining funds in the Trust are presented separately. Shares of the Fund are generally sold only to insurance company separate accounts to fund the benefits of variable life insurance policies or variable annuity contracts. The Fund offers three classes of shares: Class 1, Class 2 and Class 4. Each class of shares differs by its distribution fees, voting rights on matters affecting a single class and its exchange privilege.
The following summarizes the Fund’s significant accounting policies.
a. Financial Instrument Valuation
The Fund’s investments in financial instruments are carried at fair value daily. Fair value is the price that would be received to sell an asset or paid to transfer a liability in an orderly transaction between market participants on the measurement date. The Fund calculates the net asset value (NAV) per share at the close of the New York Stock Exchange (NYSE), generally at 4 p.m. Eastern time (NYSE close) on each day the NYSE is open for trading. Under compliance policies and procedures approved by the Trust’s Board of Trustees (the Board), the Fund’s administrator has responsibility for oversight of valuation, including leading the cross-functional Valuation and Liquidity Oversight Committee (VLOC). The VLOC provides administration and oversight of the Fund’s valuation policies and procedures, which are approved annually by the Board. Among other things, these procedures allow the Fund to utilize independent pricing services, quotations from securities and financial instrument dealers, and other market sources to determine fair value.
Equity securities listed on an exchange or on the NASDAQ National Market System are valued at the last quoted sale price or the official closing price of the day, respectively. Foreign equity securities are valued as of the close of trading on the foreign stock exchange on which the security is primarily traded or as of the NYSE close, whichever is earlier. The value is then converted into its U.S. dollar equivalent at the foreign exchange rate in effect at the NYSE close on the day that the value of the
security is determined. Over-the-counter (OTC) securities are valued within the range of the most recent quoted bid and ask prices. Securities that trade in multiple markets or on multiple exchanges are valued according to the broadest and most representative market. Certain equity securities are valued based upon fundamental characteristics or relationships to similar securities. Investments in open-end mutual funds are valued at the closing NAV.
The Fund has procedures to determine the fair value of financial instruments for which market prices are not reliable or readily available. Under these procedures, the VLOC convenes on a regular basis to review such financial instruments and considers a number of factors, including significant unobservable valuation inputs, when arriving at fair value. The VLOC primarily employs a market-based approach which may use related or comparable assets or liabilities, recent transactions, market multiples, book values, and other relevant information for the investment to determine the fair value of the investment. An income-based valuation approach may also be used in which the anticipated future cash flows of the investment are discounted to calculate fair value. Discounts may also be applied due to the nature or duration of any restrictions on the disposition of the investments. Due to the inherent uncertainty of valuations of such investments, the fair values may differ significantly from the values that would have been used had an active market existed. The VLOC employs various methods for calibrating these valuation approaches including a regular review of key inputs and assumptions, transactional back-testing or disposition analysis, and reviews of any related market activity.
Trading in securities on foreign securities stock exchanges and OTC markets may be completed before the daily NYSE close. In addition, trading in certain foreign markets may not take place on every NYSE business day. Occasionally, events occur between the time at which trading in a foreign security is completed and the close of the NYSE that might call into question the reliability of the value of a portfolio security held by the Fund. As a result, differences may arise between the value of the Fund’s portfolio securities as determined at the foreign market close and the latest indications of value at the close of the NYSE. In order to minimize the potential for these differences, the VLOC monitors price movements following the close of trading in foreign stock markets through a series of country specific market proxies (such as baskets of American Depositary Receipts, futures contracts and exchange traded funds). These price movements are measured against established trigger
| Semiannual Report | FRD-15 |
FRANKLIN TEMPLETON VARIABLE INSURANCE PRODUCTS TRUST
NOTES TO FINANCIAL STATEMENTS (UNAUDITED)
Franklin Rising Dividends VIP Fund (continued)
1. Organization and Significant Accounting Policies (continued)
a. Financial Instrument Valuation (continued)
thresholds for each specific market proxy to assist in determining if an event has occurred that may call into question the reliability of the values of the foreign securities held by the Fund. If such an event occurs, the securities may be valued using fair value procedures, which may include the use of independent pricing services.
When the last day of the reporting period is a non-business day, certain foreign markets may be open on those days that the NYSE is closed, which could result in differences between the value of the Fund’s portfolio securities on the last business day and the last calendar day of the reporting period. Any significant security valuation changes due to an open foreign market are adjusted and reflected by the Fund for financial reporting purposes.
b. Foreign Currency Translation
Portfolio securities and other assets and liabilities denominated in foreign currencies are translated into U.S. dollars based on the exchange rate of such currencies against U.S. dollars on the date of valuation. The Fund may enter into foreign currency exchange contracts to facilitate transactions denominated in a foreign currency. Purchases and sales of securities, income and expense items denominated in foreign currencies are translated into U.S. dollars at the exchange rate in effect on the transaction date. Portfolio securities and assets and liabilities denominated in foreign currencies contain risks that those currencies will decline in value relative to the U.S. dollar. Occasionally, events may impact the availability or reliability of foreign exchange rates used to convert the U.S. dollar equivalent value. If such an event occurs, the foreign exchange rate will be valued at fair value using procedures established and approved by the Board.
The Fund does not separately report the effect of changes in foreign exchange rates from changes in market prices on securities held. Such changes are included in net realized and unrealized gain or loss from investments in the Statement of Operations.
Realized foreign exchange gains or losses arise from sales of foreign currencies, currency gains or losses realized between the trade
and settlement dates on securities transactions and the difference between the recorded amounts of dividends, interest,
and foreign withholding taxes and the U.S. dollar equivalent of the amounts actually received or paid. Net unrealized foreign exchange gains and losses arise from changes in foreign exchange rates on foreign denominated assets and liabilities other than investments in securities held at the end of the reporting period.
c. Income and Deferred Taxes
It is the Fund’s policy to qualify as a regulated investment company under the Internal Revenue Code. The Fund intends to distribute to shareholders substantially all of its taxable income and net realized gains to relieve it from federal income and if applicable, excise taxes. As a result, no provision for U.S. federal income taxes is required.
The Fund may be subject to foreign taxation related to income received, capital gains on the sale of securities and certain foreign currency transactions in the foreign jurisdictions in which it invests. Foreign taxes, if any, are recorded based on the tax regulations and rates that exist in the foreign markets in which the Fund invests. When a capital gain tax is determined to apply, the Fund records an estimated deferred tax liability in an amount that would be payable if the securities were disposed of on the valuation date.
The Fund recognizes the tax benefits of uncertain tax positions only when the position is “more likely than not” to be sustained upon examination by the tax authorities based on the technical merits of the tax position. As of June 30, 2015, and for all open tax years, the Fund has determined that no liability for unrecognized tax benefits is required in the Fund’s financial statements related to uncertain tax positions taken on a tax return (or expected to be taken on future tax returns). Open tax years are those that remain subject to examination and are based on each tax jurisdiction’s statute of limitation.
d. Security Transactions, Investment Income, Expenses and Distributions
Security transactions are accounted for on trade date. Realized gains and losses on security transactions are determined on a specific identification basis. Estimated expenses are accrued daily. Dividend income is recorded on the ex-dividend date except for certain dividends from foreign securities where the dividend rate is not available. In such cases, the dividend is recorded as soon as the information is received by the Fund. Distributions to shareholders are recorded on the ex-dividend date and are determined according to income tax regulations (tax basis).
| FRD-16 | Semiannual Report |
FRANKLIN TEMPLETON VARIABLE INSURANCE PRODUCTS TRUST
NOTES TO FINANCIAL STATEMENTS (UNAUDITED)
Franklin Rising Dividends VIP Fund (continued)
Distributable earnings determined on a tax basis may differ from earnings recorded in accordance with U.S. GAAP. These differences may be permanent or temporary. Permanent differences are reclassified among capital accounts to reflect their tax character. These reclassifications have no impact on net assets or the results of operations. Temporary differences are not reclassified, as they may reverse in subsequent periods.
Common expenses incurred by the Trust are allocated among the funds based on the ratio of net assets of each fund to the combined net assets of the Trust. Fund specific expenses are charged directly to the fund that incurred the expense.
Realized and unrealized gains and losses and net investment income, not including class specific expenses, are allocated daily to each class of shares based upon the relative proportion of net assets of each class. Differences in per share distributions, by class, are generally due to differences in class specific expenses.
e. Accounting Estimates
The preparation of financial statements in accordance with U.S. GAAP requires management to make estimates and assumptions that affect the reported amounts of assets and liabilities at the date of the financial statements and the amounts of income and expenses during the reporting period. Actual results could differ from those estimates.
f. Guarantees and Indemnifications
Under the Trust’s organizational documents, its officers and trustees are indemnified by the Trust against certain liabilities arising out of the performance of their duties to the Trust. Additionally, in the normal course of business, the Trust, on behalf of the Fund, enters into contracts with service providers that contain general indemnification clauses. The Trust’s maximum exposure under these arrangements is unknown as this would involve future claims that may be made against the Trust that have not yet occurred. Currently, the Trust expects the risk of loss to be remote.
2. Shares of Beneficial Interest
At June 30, 2015, there were an unlimited number of shares authorized (without par value). Transactions in the Fund’s shares were as follows:
| Six Months Ended June 30, 2015 | Year Ended December 31, 2014 | |||||||||||||||||
| Shares | Amount | Shares | Amount | |||||||||||||||
| Class 1 Shares: | ||||||||||||||||||
Shares sold | 95,922 | $ | 2,785,337 | 159,314 | $ | 4,468,085 | ||||||||||||
Shares issued in reinvestment of distributions | 689,257 | 18,113,687 | 197,681 | 5,550,875 | ||||||||||||||
Shares redeemed | (371,956 | ) | (10,864,393 | ) | (923,627 | ) | (26,098,155 | ) | ||||||||||
|
| |||||||||||||||||
Net increase (decrease) | 413,223 | $ | 10,034,631 | (566,632 | ) | $ | (16,079,195 | ) | ||||||||||
|
| |||||||||||||||||
| Class 2 Shares: | ||||||||||||||||||
Shares sold | 1,777,662 | $ | 51,433,885 | 5,801,510 | $ | 162,781,330 | ||||||||||||
Shares issued in reinvestment of distributions | 7,239,310 | 186,412,226 | 2,007,904 | 55,377,998 | ||||||||||||||
Shares redeemed | (4,922,722 | ) | (142,032,579 | ) | (13,846,241 | ) | (381,284,891 | ) | ||||||||||
|
| |||||||||||||||||
Net increase (decrease) | 4,094,250 | $ | 95,813,532 | (6,036,827 | ) | $ | (163,125,563 | ) | ||||||||||
|
| |||||||||||||||||
| Class 4 Shares: | ||||||||||||||||||
Shares sold | 174,737 | $ | 5,085,967 | 178,786 | $ | 4,991,418 | ||||||||||||
Shares issued in reinvestment of distributions | 88,076 | 2,277,639 | 14,893 | 412,823 | ||||||||||||||
Shares redeemed | (36,161 | ) | (1,048,450 | ) | (95,832 | ) | (2,703,118 | ) | ||||||||||
|
| |||||||||||||||||
Net increase (decrease) | 226,652 | $ | 6,315,156 | 97,847 | $ | 2,701,123 | ||||||||||||
|
| |||||||||||||||||
| Semiannual Report | FRD-17 |
FRANKLIN TEMPLETON VARIABLE INSURANCE PRODUCTS TRUST
NOTES TO FINANCIAL STATEMENTS (UNAUDITED)
Franklin Rising Dividends VIP Fund (continued)
3. Transactions With Affiliates
Franklin Resources, Inc. is the holding company for various subsidiaries that together are referred to as Franklin Templeton Investments. Certain officers and trustees of the Fund are also officers and/or directors of the following subsidiaries:
| Subsidiary | Affiliation | |
Franklin Advisory Services, LLC (Advisory Services) | Investment manager | |
Franklin Templeton Services, LLC (FT Services) | Administrative manager | |
Franklin Templeton Distributors, Inc. (Distributors) | Principal underwriter | |
Franklin Templeton Investor Services, LLC (Investor Services) | Transfer agent |
a. Management Fees
The Fund pays an investment management fee to Advisory Services based on the average daily net assets of the Fund as follows:
| Annualized Fee Rate | Net Assets | |
0.750% | Up to and including $500 million | |
0.625% | Over $500 million, up to and including $1 billion | |
0.500% | In excess of $1 billion |
b. Administrative Fees
Under an agreement with Advisory Services, FT Services provides administrative services to the Fund. The fee is paid by Advisory Services based on the Fund’s average daily net assets, and is not an additional expense of the Fund.
c. Distribution Fees
The Board has adopted distribution plans for Class 2 and Class 4 shares pursuant to Rule 12b-1 under the 1940 Act. Under the Fund’s compensation distribution plans, the Fund pays Distributors for costs incurred in connection with the servicing, sale and distribution of the Fund’s shares up to 0.35% per year of its average daily net assets of each class. Some distribution fees are not charged on shares held by affiliates. The Board has agreed to limit the current rate to 0.25% per year for Class 2. The plan year, for purposes of monitoring compliance with the maximum annual plan rates, is February 1 through January 31.
d. Transfer Agent Fees
Investor Services, under terms of an agreement, performs shareholder servicing for the Fund and is not paid by the Fund for the services.
e. Investments in Institutional Fiduciary Trust Money Market Portfolio
The Fund invests in Institutional Fiduciary Trust Money Market Portfolio (Sweep Money Fund), an affiliated open-end management investment company. Management fees paid by the Fund are waived on assets invested in the Sweep Money Fund, as noted in the Statement of Operations, in an amount not to exceed the management and administrative fees paid directly or indirectly by the Sweep Money Fund. Prior to January 1, 2014, the waiver was accounted for as a reduction to management fees.
4. Expense Offset Arrangement
The Fund has entered into an arrangement with its custodian whereby credits realized as a result of uninvested cash balances are used to reduce a portion of the Fund’s custodian expenses. During the period ended June 30, 2015, there were no credits earned.
| FRD-18 | Semiannual Report |
FRANKLIN TEMPLETON VARIABLE INSURANCE PRODUCTS TRUST
NOTES TO FINANCIAL STATEMENTS (UNAUDITED)
Franklin Rising Dividends VIP Fund (continued)
5. Income Taxes
At June 30, 2015, the cost of investments and net unrealized appreciation (depreciation) for income tax purposes were as follows:
Cost of investments | $ | 1,014,036,927 | ||
|
| |||
Unrealized appreciation | $ | 746,792,303 | ||
Unrealized depreciation | (11,979,994 | ) | ||
|
| |||
Net unrealized appreciation (depreciation) | $ | 734,812,309 | ||
|
|
Differences between income and/or capital gains as determined on a book basis and a tax basis are primarily due to differing treatment of wash sales.
6. Investment Transactions
Purchases and sales of investments (excluding short term securities) for the period ended June 30, 2015, aggregated $56,587,960 and $127,912,009, respectively.
7. Credit Facility
The Fund, together with other U.S. registered and foreign investment funds (collectively, Borrowers), managed by Franklin Templeton Investments, are borrowers in a joint syndicated senior unsecured credit facility totaling $2 billion (Global Credit Facility) which matures on February 12, 2016. This Global Credit Facility provides a source of funds to the Borrowers for temporary and emergency purposes, including the ability to meet future unanticipated or unusually large redemption requests.
Under the terms of the Global Credit Facility, the Fund shall, in addition to interest charged on any borrowings made by the Fund and other costs incurred by the Fund, pay its share of fees and expenses incurred in connection with the implementation and maintenance of the Global Credit Facility, based upon its relative share of the aggregate net assets of all of the Borrowers, including an annual commitment fee of 0.07% based upon the unused portion of the Global Credit Facility. These fees are reflected in other expenses in the Statement of Operations. During the period ended June 30, 2015, the Fund did not use the Global Credit Facility.
8. Fair Value Measurements
The Fund follows a fair value hierarchy that distinguishes between market data obtained from independent sources (observable inputs) and the Fund’s own market assumptions (unobservable inputs). These inputs are used in determining the value of the Fund’s financial instruments and are summarized in the following fair value hierarchy:
| • | Level 1 – quoted prices in active markets for identical financial instruments |
| • | Level 2 – other significant observable inputs (including quoted prices for similar financial instruments, interest rates, prepayment speed, credit risk, etc.) |
| • | Level 3 – significant unobservable inputs (including the Fund’s own assumptions in determining the fair value of financial instruments) |
The input levels are not necessarily an indication of the risk or liquidity associated with financial instruments at that level.
For movements between the levels within the fair value hierarchy, the Fund has adopted a policy of recognizing the transfers as of the date of the underlying event which caused the movement.
At June 30, 2015, all of the Fund’s investments in financial instruments carried at fair value were valued using Level 1 inputs. For detailed categories, see the accompanying Statement of Investments.
| Semiannual Report | FRD-19 |
FRANKLIN TEMPLETON VARIABLE INSURANCE PRODUCTS TRUST
NOTES TO FINANCIAL STATEMENTS (UNAUDITED)
Franklin Rising Dividends VIP Fund (continued)
9. Subsequent Events
The Fund has evaluated subsequent events through the issuance of the financial statements and determined that no events have occurred that require disclosure.
Abbreviations
| Selected Portfolio | ||
| ADR | American Depositary Receipt | |
| FRD-20 | Semiannual Report |
Franklin Small Cap Value VIP Fund
This semiannual report for Franklin Small Cap Value VIP Fund covers the period ended June 30, 2015.
Class 1 Performance Summary as of June 30, 2015
The Fund’s Class 1 shares delivered a +1.58% total return* for the six-month period ended June 30, 2015.
*The Fund has a fee waiver associated with any investment in a Franklin Templeton money fund, contractually guaranteed through at least its current fiscal year-end. Fund investment results reflect the fee waiver, to the extent applicable; without this reduction, the results would have been lower.
Performance reflects the Fund’s Class 1 operating expenses, but does not include any contract fees, expenses or sales charges. If they had been included, performance would be lower. These charges and deductions, particularly for variable life policies, can have a significant effect on contract values and insurance benefits. See the contract prospectus for a complete description of these expenses, including sales charges.
Performance data represent past performance, which does not guarantee future results. Investment return and principal value will fluctuate, and you may have a gain or loss when you sell your shares. Current performance may differ from figures shown.
| Semiannual Report | FSV-1 |
FRANKLIN SMALL CAP VALUE VIP FUND
Fund Goal and Main Investments
Franklin Small Cap Value VIP Fund seeks long-term total return. Under normal market conditions, the Fund invests at least 80% of its net assets in investments of small capitalization companies. For this Fund, small capitalization companies are those with market capitalizations under $3.5 billion at the time of purchase. The Fund generally invests in equity securities of companies that the manager believes are undervalued and have the potential for capital appreciation.
Fund Risks
All investments involve risks, including possible loss of principal. The Fund’s investments in smaller company stocks carry special risks as such stocks have historically exhibited greater price volatility than larger company stocks, particularly over the short term. Additionally, smaller companies often have relatively small revenues, limited product lines and a small market share. In addition, the Fund may invest up to 25% of its total assets in foreign securities, which involve special risks, including currency fluctuations and economic and political uncertainty. The Fund is actively managed but there is no guarantee that the manager’s investment decisions will produce the desired results. The Fund’s prospectus also includes a description of the main investment risks.
Performance Overview
You can find the Fund’s six-month total return in the Performance Summary. For comparison, the Fund’s benchmark, the Russell 2500™ Value Index, rose 1.71% for the same period.1 Please note the Fund employs a bottom-up stock selection process, and the managers invest in securities without regard to benchmark comparisons.
Economic and Market Overview
U.S. economic growth was mixed during the six months under review. In 2015’s first quarter, U.S. dollar strength, low energy prices, and a labor dispute at West Coast ports led exports to decline. Lower business investment and state and local government spending also weighed on the economy, while increases in consumer spending, residential investment and private inventory investment offered some support. In the second quarter, business capital spending rebounded and
manufacturing and non-manufacturing activities increased, contributing to strong job gains that helped the unemployment rate decline from 5.6% in December 2014 to 5.3% in June 2015.2 Housing market data were generally encouraging as home sales and prices rose. After a brief, winter slump, retail sales rebounded in the spring as strong employment gains led to broad-based improvement, especially for auto and gasoline sales. Inflation, as measured by the Consumer Price Index, rose during the six months amid generally higher energy prices bouncing from recent lows.
During the six-month period, the Federal Reserve Board (Fed) kept its target interest rate at 0%–0.25% while considering when an increase would be appropriate. The Fed anticipated raising its target rate when it saw further labor market progress and was reasonably confident that inflation would move back to 2% over the medium term. In its June meeting, the Fed lowered its 2015 economic growth forecast and raised unemployment estimates given the weak start to the year.
Investor confidence grew during the period as corporate profits remained healthy, the Fed showed caution about raising interest rates, economic data in Europe and Japan improved and China introduced more stimulus measures. However, the stock markets endured some sell-offs when many investors reacted to debt negotiations between Greece and its creditors, geopolitical tensions in certain regions, and less robust growth in China. For the six months under review, U.S. stocks, as measured by the Standard & Poor’s® 500 Index and the Dow Jones Industrial Average, rose marginally after both reached all-time highs in May.3
Investment Strategy
We generally invest in stocks that we believe are undervalued and have the potential for capital appreciation. We consider a stock price a “value” when it trades at less than the price at which we believe it would trade if the market reflected all factors relating to the company’s worth. Accordingly, we invest in companies that we believe have, for example, stock prices that are low relative to current or historical or future earnings, book value, cash flow or sales; recent sharp price declines but the potential for good long-term earnings prospects; and valuable intangibles not reflected in the stock price. Companies in which we may invest include those that may be considered out of
1. Source: Morningstar.
One cannot invest directly in an index, and an index is not representative of the Fund’s portfolio. Please see Index Descriptions following the Fund Summaries.
2. Source: Bureau of Labor Statistics.
3. Please see Index Descriptions following the Fund Summaries.
| FSV-2 | Semiannual Report |
FRANKLIN SMALL CAP VALUE VIP FUND
favor, such as companies attempting to recover from bankruptcy, business setbacks, adverse events or cyclical downturns, or that may be considered potential takeover targets.
Manager’s Discussion
Contributors to absolute Fund performance included The Men’s Wearhouse, Sensient Technologies and HCC Insurance Holdings. Men’s Wearhouse, a clothing retailer, reported better-than-expected same store sales and earnings per share as well as a positive outlook regarding the integration of Jos. A. Bank. Sensient Technologies, a flavors and fragrances producer, reported weaker-than-expected 2015 guidance due to the impact of the strong U.S. dollar on its global markets. However, its business model’s relative resiliency and the ability to benefit from continued operational improvements appeared to have had a positive influence on the share price. HCC Insurance Holdings, a specialty insurance products underwriter, was the subject of an all-cash takeover offer from Tokio Marine Holdings at a 38% premium to HCC’s then share price.
Detractors from absolute Fund performance included Carpenter Technology, Helix Energy Solutions Group and Axiall. Carpenter Technology, a manufacturer of specialty metals primarily for the aerospace, energy and industrial sectors, was negatively impacted by internal production issues and weak sales to energy customers due to substantially lower oil prices during the period. Helix Energy Solutions Group, an offshore provider of well production services, was also hurt by lower oil prices, which increased the level of uncertainty regarding future business opportunities and profitability. Axiall, a chlor-alkali and building products manufacturer, was negatively affected by weaker-than-expected end-market pricing arising from industry-wide chlor-alkali capacity expansions and weak demand.
During the period, we initiated new positions in LTC Properties, a health care real estate investment trust; The Laclede Group, a natural gas utility; BRP, a designer, manufacturer and marketer of recreational powersport products; Crocs, a designer, manufacturer and distributor of footwear, apparel and accessories; MKS Instruments, a provider of advanced semiconductor manufacturing equipment; Invacare, a manufacturer and distributor of health care products; and Griffon, a manufacturer of building products, defense equipment and plastics. We added to our holdings in Everbank Financial, a bank holding company; Gerresheimer, a manufacturer of glass and plastic products for the health care industry; and the aforementioned Axiall; among others.
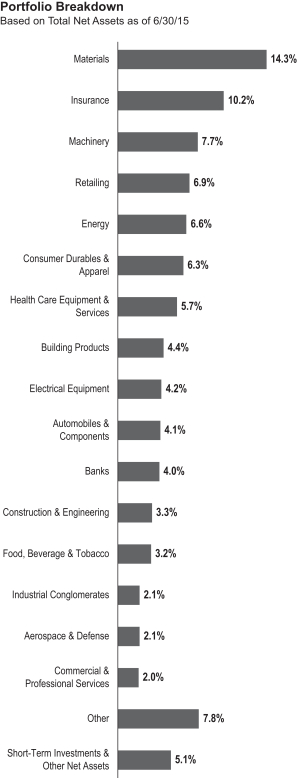
| Semiannual Report | FSV-3 |
FRANKLIN SMALL CAP VALUE VIP FUND
We eliminated positions in SkyWest, Steel Dynamics and Applied Industrial Technologies, among others. Positions we reduced included Thor Industries, Cabot and Apogee Enterprises, among others.
Finally, in addition to HCC’s takeover offer there were two additional offers during the period. Montpelier Re Holdings was the subject of a stock and cash deal from Endurance Specialty Holdings at a 7% premium to its prior-day’s closing price, and Excel Trust received a cash takeover offer from Blackstone at a 14% premium to its prior-day’s closing price.
Thank you for your participation in Franklin Small Cap Value VIP Fund. We look forward to serving your future investment needs.
The foregoing information reflects our analysis, opinions and portfolio holdings as of June 30, 2015, the end of the reporting period. The way we implement our main investment strategies and the resulting portfolio holdings may change depending on factors such as market and economic conditions. These opinions may not be relied upon as investment advice or an offer for a particular security. The information is not a complete analysis of every aspect of any market, country, industry, security or the Fund. Statements of fact are from sources considered reliable, but the investment manager makes no representation or warranty as to their completeness or accuracy. Although historical performance is no guarantee of future results, these insights may help you understand our investment management philosophy.
| Top 10 Holdings | ||||
| 6/30/15 | ||||
| Company Sector/Industry | % of Total Net Assets | |||
| Axiall Corp. Materials | 2.5% | |||
| Maple Leaf Foods Inc. (Canada) Food, Beverage & Tobacco | 2.4% | |||
| StanCorp Financial Group Inc. Insurance | 2.4% | |||
| Carlisle Cos. Inc. Industrial Conglomerates | 2.1% | |||
| AAR Corp. Aerospace & Defense | 2.1% | |||
| Sensient Technologies Corp. Materials | 2.0% | |||
| Regal Beloit Corp. Electrical Equipment | 2.0% | |||
| A. Schulman Inc. Materials | 2.0% | |||
| Teleflex Inc. Health Care Equipment & Services | 2.0% | |||
| H.B. Fuller Co. Materials | 1.9% | |||
The dollar value, number of shares or principal amount, and names of all portfolio holdings are listed in the Fund’s Statement of Investments.
| FSV-4 | Semiannual Report |
FRANKLIN SMALL CAP VALUE VIP FUND
Class 1 Fund Expenses
As an investor in a variable insurance contract (Contract) that indirectly provides for investment in an underlying mutual fund, you can incur transaction and/or ongoing expenses at both the Fund level and the Contract level.
| • | Transaction expenses can include sales charges (loads) on purchases, surrender fees, transfer fees and premium taxes. |
| • | Ongoing expenses can include management fees, distribution and service (12b-1) fees, contract fees, annual maintenance fees, mortality and expense risk fees and other fees and expenses. All mutual funds and Contracts have some types of ongoing expenses. |
The expenses shown in the table are meant to highlight ongoing expenses at the Fund level only and do not include ongoing expenses at the Contract level, or transaction expenses at either the Fund or Contract levels. While the Fund does not have transaction expenses, if the transaction and ongoing expenses at the Contract level were included, the expenses shown below would be higher. You should consult your Contract prospectus or disclosure document for more information.
The table shows Fund-level ongoing expenses and can help you understand these expenses and compare them with those of other mutual funds offered through the Contract. The table assumes a $1,000 investment held for the six months indicated. Please refer to the Fund prospectus for additional information on operating expenses.
Actual Fund Expenses
The first line (Actual) of the table provides actual account values and expenses. The “Ending Account Value” is derived from the Fund’s actual return, which includes the effect of ongoing Fund expenses, but does not include the effect of ongoing Contract expenses.
You can estimate the Fund-level expenses you incurred during the period by following these steps. Of course, your account value and expenses will differ from those in this illustration:
| 1. | Divide your account value by $1,000. |
If an account had an $8,600 value, then $8,600 ÷ $1,000 = 8.6.
| 2. | Multiply the result by the number under the heading “Fund-Level Expenses Incurred During Period.” |
If Fund-Level Expenses Incurred During Period were $7.50, then 8.6 × $7.50 = $64.50.
In this illustration, the estimated expenses incurred this period at the Fund level are $64.50.
Hypothetical Example for Comparison with Other Mutual Funds
Information in the second line (Hypothetical) of the table can help you compare ongoing expenses of the Fund with those of other mutual funds offered through the Contract. This information may not be used to estimate the actual ending account balance or expenses you incurred during the period. The hypothetical “Ending Account Value” is based on the Fund’s actual expense ratio and an assumed 5% annual rate of return before expenses, which does not represent the Fund’s actual return. The figure under the heading “Fund-Level Expenses Incurred During Period” shows the hypothetical expenses your account would have incurred under this scenario. You can compare this figure with the 5% hypothetical examples that appear in shareholder reports of other funds offered through a Contract.
| Class 1 | Beginning Account Value 1/1/15 | Ending Account Value 6/30/15 | Fund-Level Expenses 1/1/15–6/30/15 | |||||||||
Actual | $1,000 | $1,015.80 | $3.20 | |||||||||
Hypothetical (5% return before expenses) | $1,000 | $1,021.62 | $3.21 | |||||||||
*Expenses are calculated using the most recent six-month annualized expense ratio, net of expenses waivers, for the Fund’s Class 1 shares (0.64%), which does not include any ongoing expenses of the Contract for which the Fund is an investment option, multiplied by the average account value over the period, multiplied by 181/365 to reflect the one-half year period.
| Semiannual Report | FSV-5 |
FRANKLIN TEMPLETON VARIABLE INSURANCE PRODUCTS TRUST
Financial Highlights
Franklin Small Cap Value VIP Fund
Six Months Ended (unaudited) | Year Ended December 31, | |||||||||||||||||||||||
| 2014 | 2013 | 2012 | 2011 | 2010 | ||||||||||||||||||||
| Class 1 | ||||||||||||||||||||||||
Per share operating performance (for a share outstanding throughout the period) | ||||||||||||||||||||||||
Net asset value, beginning of period | $22.81 | $24.54 | $18.58 | $15.82 | $16.55 | $13.00 | ||||||||||||||||||
|
| |||||||||||||||||||||||
| Income from investment operationsa: | ||||||||||||||||||||||||
Net investment incomeb | 0.10 | 0.19 | 0.19 | 0.29 | c | 0.16 | 0.14 | |||||||||||||||||
Net realized and unrealized gains (losses) | 0.29 | 0.06 | 6.45 | 2.64 | (0.74 | ) | 3.54 | |||||||||||||||||
|
| |||||||||||||||||||||||
Total from investment operations | 0.39 | 0.25 | 6.64 | 2.93 | (0.58 | ) | 3.68 | |||||||||||||||||
|
| |||||||||||||||||||||||
| Less distributions from: | ||||||||||||||||||||||||
Net investment income | (0.20 | ) | (0.20 | ) | (0.32 | ) | (0.17 | ) | (0.15 | ) | (0.13 | ) | ||||||||||||
Net realized gains | (3.17 | ) | (1.78 | ) | (0.36 | ) | — | — | — | |||||||||||||||
|
| |||||||||||||||||||||||
Total distributions | (3.37 | ) | (1.98 | ) | (0.68 | ) | (0.17 | ) | (0.15 | ) | (0.13 | ) | ||||||||||||
|
| |||||||||||||||||||||||
Net asset value, end of period | $19.83 | $22.81 | $24.54 | $18.58 | $15.82 | $16.55 | ||||||||||||||||||
|
| |||||||||||||||||||||||
Total returnd | 1.58% | 0.88% | 36.50% | 18.75% | (3.53)% | 28.49% | ||||||||||||||||||
| Ratios to average net assetse | ||||||||||||||||||||||||
Expenses | 0.64% | f | 0.63% | f,g | 0.63% | 0.67% | 0.66% | 0.67% | ||||||||||||||||
Net investment income | 0.89% | 0.82% | 0.90% | 1.70% | c | 1.02% | 0.98% | |||||||||||||||||
| Supplemental data | ||||||||||||||||||||||||
Net assets, end of period (000’s) | $53,657 | $57,843 | $62,408 | $40,133 | $39,374 | $47,300 | ||||||||||||||||||
Portfolio turnover rate | 12.42% | 19.45% | 10.44% | 5.84% | 14.39% | 15.92% | ||||||||||||||||||
aThe amount shown for a share outstanding throughout the period may not correlate with the Statement of Operations for the period due to the timing of sales and repurchases of the Fund’s shares in relation to income earned and/or fluctuating fair value of the investments of the Fund.
bBased on average daily shares outstanding.
cNet investment income per share includes approximately $0.10 per share received in the form of special dividends. Excluding these amounts, the ratio of net investment income to average net assets would have been 1.10%.
dTotal return does not include fees, charges or expenses imposed by the variable annuity and life insurance contracts for which Franklin Templeton Variable Insurance Products Trust serves as an underlying investment vehicle. Total return is not annualized for periods less than one year.
eRatios are annualized for periods less than one year.
fBenefit of waiver and payments by affiliates rounds to less than 0.01%.
gBenefit of expense reduction rounds to less than 0.01%.
| FSV-6 | Semiannual Report | The accompanying notes are an integral part of these financial statements. |
FRANKLIN TEMPLETON VARIABLE INSURANCE PRODUCTS TRUST
FINANCIAL HIGHLIGHTS
Franklin Small Cap Value VIP Fund (continued)
Six Months Ended (unaudited) | Year Ended December 31, | |||||||||||||||||||||||
| 2014 | 2013 | 2012 | 2011 | 2010 | ||||||||||||||||||||
| Class 2 | ||||||||||||||||||||||||
Per share operating performance (for a share outstanding throughout the period) | ||||||||||||||||||||||||
Net asset value, beginning of period | $22.32 | $24.07 | $18.23 | $15.53 | $16.25 | $12.77 | ||||||||||||||||||
|
| |||||||||||||||||||||||
| Income from investment operationsa: | ||||||||||||||||||||||||
Net investment incomeb | 0.07 | 0.13 | 0.14 | 0.24 | c | 0.12 | 0.10 | |||||||||||||||||
Net realized and unrealized gains (losses) | 0.29 | 0.05 | 6.34 | 2.59 | (0.73 | ) | 3.48 | |||||||||||||||||
|
| |||||||||||||||||||||||
Total from investment operations | 0.36 | 0.18 | 6.48 | 2.83 | (0.61 | ) | 3.58 | |||||||||||||||||
|
| |||||||||||||||||||||||
| Less distributions from: | ||||||||||||||||||||||||
Net investment income | (0.14 | ) | (0.15 | ) | (0.28 | ) | (0.13 | ) | (0.11 | ) | (0.10 | ) | ||||||||||||
Net realized gains | (3.17 | ) | (1.78 | ) | (0.36 | ) | — | — | — | |||||||||||||||
|
| |||||||||||||||||||||||
Total distributions | (3.31 | ) | (1.93 | ) | (0.64 | ) | (0.13 | ) | (0.11 | ) | (0.10 | ) | ||||||||||||
|
| |||||||||||||||||||||||
Net asset value, end of period | $19.37 | $22.32 | $24.07 | $18.23 | $15.53 | $16.25 | ||||||||||||||||||
|
| |||||||||||||||||||||||
Total returnd | 1.47% | 0.57% | 36.24% | 18.39% | (3.76)% | 28.22% | ||||||||||||||||||
| Ratios to average net assetse | ||||||||||||||||||||||||
Expenses | 0.89% | f | 0.88% | f,g | 0.88% | 0.92% | 0.91% | 0.92% | ||||||||||||||||
Net investment income | 0.64% | 0.57% | 0.65% | 1.45% | c | 0.77% | 0.73% | |||||||||||||||||
| Supplemental data | ||||||||||||||||||||||||
Net assets, end of period (000’s) | $1,370,966 | $1,445,325 | $1,606,802 | $1,286,573 | $1,211,168 | $1,362,292 | ||||||||||||||||||
Portfolio turnover rate | 12.42% | 19.45% | 10.44% | 5.84% | 14.39% | 15.92% | ||||||||||||||||||
aThe amount shown for a share outstanding throughout the period may not correlate with the Statement of Operations for the period due to the timing of sales and repurchases of the Fund’s shares in relation to income earned and/or fluctuating fair value of the investments of the Fund.
bBased on average daily shares outstanding.
cNet investment income per share includes approximately $0.10 per share received in the form of special dividends. Excluding these amounts, the ratio of net investment income to average net assets would have been 0.85%.
dTotal return does not include fees, charges or expenses imposed by the variable annuity and life insurance contracts for which Franklin Templeton Variable Insurance Products Trust serves as an underlying investment vehicle. Total return is not annualized for periods less than one year.
eRatios are annualized for periods less than one year.
fBenefit of waiver and payments by affiliates rounds to less than 0.01%.
gBenefit of expense reduction rounds to less than 0.01%.
| The accompanying notes are an integral part of these financial statements. | Semiannual Report | FSV-7 |
FRANKLIN TEMPLETON VARIABLE INSURANCE PRODUCTS TRUST
FINANCIAL HIGHLIGHTS
Franklin Small Cap Value VIP Fund (continued)
Six Months Ended (unaudited) | Year Ended December 31, | |||||||||||||||||||||||
| 2014 | 2013 | 2012 | 2011 | 2010 | ||||||||||||||||||||
| Class 4 | ||||||||||||||||||||||||
Per share operating performance (for a share outstanding throughout the period) | ||||||||||||||||||||||||
Net asset value, beginning of period | $22.63 | $24.37 | $18.44 | $15.71 | $16.44 | $12.92 | ||||||||||||||||||
|
| |||||||||||||||||||||||
| Income from investment operationsa: | ||||||||||||||||||||||||
Net investment incomeb | 0.06 | 0.11 | 0.12 | 0.22 | c | 0.11 | 0.09 | |||||||||||||||||
Net realized and unrealized gains (losses) | 0.30 | 0.05 | 6.42 | 2.63 | (0.75 | ) | 3.53 | |||||||||||||||||
|
| |||||||||||||||||||||||
Total from investment operations | 0.36 | 0.16 | 6.54 | 2.85 | (0.64 | ) | 3.62 | |||||||||||||||||
|
| |||||||||||||||||||||||
| Less distributions from: | ||||||||||||||||||||||||
Net investment income | (0.12 | ) | (0.12 | ) | (0.25 | ) | (0.12 | ) | (0.09 | ) | (0.10 | ) | ||||||||||||
Net realized gains | (3.17 | ) | (1.78 | ) | (0.36 | ) | — | — | — | |||||||||||||||
|
| |||||||||||||||||||||||
Total distributions | (3.29 | ) | (1.90 | ) | (0.61 | ) | (0.12 | ) | (0.09 | ) | (0.10 | ) | ||||||||||||
|
| |||||||||||||||||||||||
Net asset value, end of period | $19.70 | $22.63 | $24.37 | $18.44 | $15.71 | $16.44 | ||||||||||||||||||
|
| |||||||||||||||||||||||
Total returnd | 1.44% | 0.48% | 36.12% | 18.27% | (3.87)% | 28.14% | ||||||||||||||||||
| Ratios to average net assetse | ||||||||||||||||||||||||
Expenses | 0.99% | f | 0.98% | f,g | 0.98% | 1.02% | 1.01% | 1.02% | ||||||||||||||||
Net investment income | 0.54% | 0.47% | 0.55% | 1.35% | c | 0.67% | 0.63% | |||||||||||||||||
| Supplemental data | ||||||||||||||||||||||||
Net assets, end of period (000’s) | $30,652 | $30,452 | $35,936 | $32,424 | $34,284 | $39,075 | ||||||||||||||||||
Portfolio turnover rate | 12.42% | 19.45% | 10.44% | 5.84% | 14.39% | 15.92% | ||||||||||||||||||
aThe amount shown for a share outstanding throughout the period may not correlate with the Statement of Operations for the period due to the timing of sales and repurchases of the Fund’s shares in relation to income earned and/or fluctuating fair value of the investments of the Fund.
bBased on average daily shares outstanding.
cNet investment income per share includes approximately $0.10 per share received in the form of special dividends. Excluding these amounts, the ratio of net investment income to average net assets would have been 0.75%.
dTotal return does not include fees, charges or expenses imposed by the variable annuity and life insurance contracts for which Franklin Templeton Variable Insurance Products Trust serves as an underlying investment vehicle. Total return is not annualized for periods less than one year.
eRatios are annualized for periods less than one year.
fBenefit of waiver and payments by affiliates rounds to less than 0.01%.
gBenefit of expense reduction rounds to less than 0.01%.
| FSV-8 | Semiannual Report | The accompanying notes are an integral part of these financial statements. |
FRANKLIN TEMPLETON VARIABLE INSURANCE PRODUCTS TRUST
Statement of Investments, June 30, 2015 (unaudited)
Franklin Small Cap Value VIP Fund
| ||||||||||
| Shares | Value | |||||||||
Common Stocks 94.4% | ||||||||||
Aerospace & Defense 2.1% | ||||||||||
AAR Corp. | 950,100 | $ | 30,279,687 | |||||||
|
| |||||||||
Automobiles & Components 4.1% | ||||||||||
Drew Industries Inc. | 245,200 | 14,226,504 | ||||||||
Gentex Corp. | 1,174,600 | 19,286,932 | ||||||||
Thor Industries Inc. | 317,800 | 17,885,784 | ||||||||
Winnebago Industries Inc. | 331,200 | 7,813,008 | ||||||||
|
| |||||||||
| 59,212,228 | ||||||||||
|
| |||||||||
Banks 4.0% | ||||||||||
Chemical Financial Corp. | 412,554 | 13,639,035 | ||||||||
EverBank Financial Corp. | 1,227,600 | 24,122,340 | ||||||||
OFG Bancorp. (Puerto Rico) | 572,000 | 6,103,240 | ||||||||
Peoples Bancorp Inc. | 241,900 | 5,645,946 | ||||||||
TrustCo Bank Corp. NY | 1,203,800 | 8,462,714 | ||||||||
|
| |||||||||
| 57,973,275 | ||||||||||
|
| |||||||||
Building Products 4.4% | ||||||||||
Apogee Enterprises Inc. | 85,300 | 4,490,192 | ||||||||
| a | Gibraltar Industries Inc. | 842,300 | 17,157,651 | |||||||
Griffon Corp. | 98,000 | 1,560,160 | ||||||||
Simpson Manufacturing Co. Inc. | 433,400 | 14,735,600 | ||||||||
Universal Forest Products Inc. | 504,700 | 26,259,541 | ||||||||
|
| |||||||||
| 64,203,144 | ||||||||||
|
| |||||||||
Commercial & Professional Services 2.0% | ||||||||||
McGrath RentCorp | 399,318 | 12,151,247 | ||||||||
MSA Safety Inc. | 357,113 | 17,323,551 | ||||||||
|
| |||||||||
| 29,474,798 | ||||||||||
|
| |||||||||
Construction & Engineering 3.3% | ||||||||||
EMCOR Group Inc. | 550,100 | 26,278,277 | ||||||||
Granite Construction Inc. | 611,800 | 21,725,018 | ||||||||
|
| |||||||||
| 48,003,295 | ||||||||||
|
| |||||||||
Consumer Durables & Apparel 6.3% | ||||||||||
| a | BRP Inc. (Canada) | 824,200 | 19,262,128 | |||||||
Brunswick Corp. | 205,700 | 10,461,902 | ||||||||
| a | Crocs Inc. | 944,700 | 13,896,537 | |||||||
| a | Helen of Troy Ltd. | 21,800 | 2,125,282 | |||||||
Hooker Furniture Corp. | 445,000 | 11,173,950 | ||||||||
La-Z-Boy Inc. | 926,200 | 24,396,108 | ||||||||
| a | M/I Homes Inc. | 435,900 | 10,753,653 | |||||||
|
| |||||||||
| 92,069,560 | ||||||||||
|
| |||||||||
Electrical Equipment 4.2% | ||||||||||
EnerSys | 254,210 | 17,868,421 | ||||||||
Franklin Electric Co. Inc. | 348,798 | 11,276,639 | ||||||||
Powell Industries Inc. | 100,900 | 3,548,653 | ||||||||
Regal Beloit Corp. | 397,000 | 28,818,230 | ||||||||
|
| |||||||||
| 61,511,943 | ||||||||||
|
| |||||||||
Energy 6.1% | ||||||||||
Bristow Group Inc. | 246,600 | 13,143,780 | ||||||||
Energen Corp. | 220,000 | 15,026,000 | ||||||||
| Semiannual Report | FSV-9 |
FRANKLIN TEMPLETON VARIABLE INSURANCE PRODUCTS TRUST
STATEMENT OF INVESTMENTS (UNAUDITED)
Franklin Small Cap Value VIP Fund (continued)
| Shares | Value | |||||||||
Common Stocks (continued) | ||||||||||
Energy (continued) | ||||||||||
| a | Helix Energy Solutions Group Inc. | 495,600 | $ | 6,259,428 | ||||||
Hunting PLC (United Kingdom) | 1,201,900 | 11,517,929 | ||||||||
| a | Oil States International Inc. | 299,900 | 11,165,277 | |||||||
Rowan Cos. PLC | 759,300 | 16,028,823 | ||||||||
| a | Unit Corp. | 577,900 | 15,672,648 | |||||||
|
| |||||||||
| 88,813,885 | ||||||||||
|
| |||||||||
Food, Beverage & Tobacco 3.2% | ||||||||||
GrainCorp Ltd. (Australia) | 1,725,000 | 11,362,406 | ||||||||
Maple Leaf Foods Inc. (Canada) | 1,861,000 | 35,297,910 | ||||||||
|
| |||||||||
| 46,660,316 | ||||||||||
|
| |||||||||
Health Care Equipment & Services 5.7% | ||||||||||
Hill-Rom Holdings Inc. | 344,000 | 18,689,520 | ||||||||
Invacare Corp. | 379,600 | 8,210,748 | ||||||||
STERIS Corp. | 410,900 | 26,478,396 | ||||||||
Teleflex Inc. | 211,800 | 28,688,310 | ||||||||
|
| |||||||||
| 82,066,974 | ||||||||||
|
| |||||||||
Industrial Conglomerates 2.1% | ||||||||||
Carlisle Cos. Inc. | 308,900 | 30,927,068 | ||||||||
|
| |||||||||
Insurance 10.2% | ||||||||||
Arthur J. Gallagher & Co. | 168,200 | 7,955,860 | ||||||||
Aspen Insurance Holdings Ltd. | 538,700 | 25,803,730 | ||||||||
The Hanover Insurance Group Inc. | 345,000 | 25,540,350 | ||||||||
HCC Insurance Holdings Inc. | 188,200 | 14,461,288 | ||||||||
Montpelier Re Holdings Ltd. | 246,400 | 9,732,800 | ||||||||
Old Republic International Corp. | 1,075,900 | 16,816,317 | ||||||||
StanCorp Financial Group Inc. | 454,600 | 34,372,306 | ||||||||
Validus Holdings Ltd. | 317,800 | 13,980,022 | ||||||||
|
| |||||||||
| 148,662,673 | ||||||||||
|
| |||||||||
Machinery 7.7% | ||||||||||
Astec Industries Inc. | 523,800 | 21,905,316 | ||||||||
EnPro Industries Inc. | 120,500 | 6,895,010 | ||||||||
Hillenbrand Inc. | 365,500 | 11,220,850 | ||||||||
Kennametal Inc. | 228,500 | 7,796,420 | ||||||||
Lincoln Electric Holdings Inc. | 112,800 | 6,868,392 | ||||||||
| b | Lindsay Corp. | 132,800 | 11,674,448 | |||||||
Mueller Industries Inc. | 712,200 | 24,727,584 | ||||||||
| a | Wabash National Corp. | 1,384,500 | 17,361,630 | |||||||
Watts Water Technologies Inc., A | 55,000 | 2,851,750 | ||||||||
|
| |||||||||
| 111,301,400 | ||||||||||
|
| |||||||||
Materials 14.3% | ||||||||||
A. Schulman Inc. | 657,066 | 28,726,926 | ||||||||
Allegheny Technologies Inc. | 243,900 | 7,365,780 | ||||||||
AptarGroup Inc. | 65,000 | 4,145,050 | ||||||||
Axiall Corp. | 992,200 | 35,768,810 | ||||||||
Cabot Corp. | 47,400 | 1,767,546 | ||||||||
Carpenter Technology Corp. | 497,900 | 19,258,772 | ||||||||
H.B. Fuller Co. | 679,500 | 27,601,290 | ||||||||
| FSV-10 | Semiannual Report |
FRANKLIN TEMPLETON VARIABLE INSURANCE PRODUCTS TRUST
STATEMENT OF INVESTMENTS (UNAUDITED)
Franklin Small Cap Value VIP Fund (continued)
| Shares | Value | |||||||||
Common Stocks (continued) | ||||||||||
Materials (continued) | ||||||||||
Minerals Technologies Inc. | 316,200 | $ | 21,542,706 | |||||||
RPM International Inc. | 362,600 | 17,756,522 | ||||||||
Sensient Technologies Corp. | 436,000 | 29,796,240 | ||||||||
Stepan Co. | 274,800 | 14,869,428 | ||||||||
|
| |||||||||
| 208,599,070 | ||||||||||
|
| |||||||||
Pharmaceuticals, Biotechnology & Life Sciences 1.4% | ||||||||||
Gerresheimer AG (Germany) | 336,000 | 20,935,790 | ||||||||
|
| |||||||||
Real Estate 1.8% | ||||||||||
Excel Trust Inc. | 505,600 | 7,973,312 | ||||||||
LTC Properties Inc. | 433,500 | 18,033,600 | ||||||||
|
| |||||||||
| 26,006,912 | ||||||||||
|
| |||||||||
Retailing 6.9% | ||||||||||
Caleres Inc. | 378,500 | 12,028,730 | ||||||||
The Cato Corp., A | 362,900 | 14,066,004 | ||||||||
| a | Genesco Inc. | 163,308 | 10,783,227 | |||||||
Group 1 Automotive Inc. | 184,200 | 16,730,886 | ||||||||
The Men’s Wearhouse Inc. | 385,600 | 24,705,392 | ||||||||
| a | The Pep Boys - Manny, Moe & Jack | 1,359,100 | 16,676,157 | |||||||
| a | West Marine Inc. | 610,700 | 5,887,148 | |||||||
|
| |||||||||
| 100,877,544 | ||||||||||
|
| |||||||||
Semiconductors & Semiconductor Equipment 1.5% | ||||||||||
Cohu Inc. | 736,000 | 9,737,280 | ||||||||
MKS Instruments Inc. | 311,800 | 11,829,692 | ||||||||
|
| |||||||||
| 21,566,972 | ||||||||||
|
| |||||||||
Technology Hardware & Equipment 1.6% | ||||||||||
| a | Ingram Micro Inc., A | 507,100 | 12,692,713 | |||||||
| a | Rofin-Sinar Technologies Inc. | 388,900 | 10,733,640 | |||||||
|
| |||||||||
| 23,426,353 | ||||||||||
|
| |||||||||
Transportation 0.3% | ||||||||||
| a | Genesee & Wyoming Inc. | 53,200 | 4,052,776 | |||||||
|
| |||||||||
Utilities 1.2% | ||||||||||
The Laclede Group Inc. | 327,000 | 17,023,620 | ||||||||
|
| |||||||||
Total Common Stocks (Cost $960,025,911) | 1,373,649,283 | |||||||||
|
| |||||||||
| Principal Amount | ||||||||||
Corporate Bonds (Cost $7,686,695) 0.5% | ||||||||||
Energy 0.5% | ||||||||||
Unit Corp., senior sub. note, 6.625%, 5/15/21 | $ | 7,944,000 | 7,745,400 | |||||||
|
| |||||||||
Total Investments before Short Term Investments (Cost $967,712,606) | 1,381,394,683 | |||||||||
|
| |||||||||
| Semiannual Report | FSV-11 |
FRANKLIN TEMPLETON VARIABLE INSURANCE PRODUCTS TRUST
STATEMENT OF INVESTMENTS (UNAUDITED)
Franklin Small Cap Value VIP Fund (continued)
| Shares | Value | |||||||||
Short Term Investments 5.8% | ||||||||||
Money Market Funds (Cost $71,812,977) 5.0% | ||||||||||
| a,c | Institutional Fiduciary Trust Money Market Portfolio | 71,812,977 | $ | 71,812,977 | ||||||
|
| |||||||||
| d | Investments from Cash Collateral Received for Loaned Securities 0.8% |
| ||||||||
Money Market Funds (Cost $5,500,000) 0.4% | ||||||||||
| a,c | Institutional Fiduciary Trust Money Market Portfolio | 5,500,000 | 5,500,000 | |||||||
|
| |||||||||
| Principal Amount | ||||||||||
Repurchase Agreements 0.4% | ||||||||||
| e | Joint Repurchase Agreement, 0.11%, 7/01/15 (Maturity Value $2,791,387) | $ | 2,791,378 | 2,791,378 | ||||||
RBS Securities Inc., | ||||||||||
Collateralized by U.S. Treasury Bonds, 3.625%, 2/15/44; and U.S. Treasury Notes, 1.00% - 3.625%, 9/30/15 - 2/15/24 (valued at $2,847,213) | ||||||||||
| e | Joint Repurchase Agreement, 0.12%, 7/01/15 (Maturity Value $2,791,387) | 2,791,378 | 2,791,378 | |||||||
Barclays Capital Inc., | ||||||||||
Collateralized by U.S. Treasury Bonds, 4.75% - 7.625%, 11/15/16 - 5/15/37; U.S. Treasury Notes, 0.375% - 4.875%, 8/31/15 - 11/15/24; and U.S. Treasury Strips, 8/15/15 - 2/15/45 (valued at $2,847,207) | ||||||||||
| e | Joint Repurchase Agreement, 0.14%, 7/01/15 (Maturity Value $670,402) | 670,399 | 670,399 | |||||||
SG Americas Securities LLC, | ||||||||||
Collateralized by U.S. Treasury Bonds, 2.875% - 10.625%, 8/15/15 - 11/15/44; U.S. Treasury Bonds, Index Linked, 0.375% - 2.375%, 7/15/23 - 2/15/43; U.S. Treasury Notes, 1.25% - 3.625%, 2/29/16 - 8/15/24; and U.S. Treasury Notes, Index Linked, 0.625% - 2.375%, 1/15/17 - 7/15/21 (valued at $683,807) | ||||||||||
|
| |||||||||
Total Repurchase Agreements (Cost $6,253,155) | 6,253,155 | |||||||||
|
| |||||||||
Total Investments from Cash Collateral Received for Loaned Securities (Cost $11,753,155) | 11,753,155 | |||||||||
|
| |||||||||
Total Investments (Cost $1,051,278,738) 100.7% | 1,464,960,815 | |||||||||
Other Assets, less Liabilities (0.7)% | (9,686,006 | ) | ||||||||
|
| |||||||||
Net Assets 100.0% | $ | 1,455,274,809 | ||||||||
|
| |||||||||
aNon-income producing.
bA portion or all of the security is on loan at June 30, 2015. See Note 1(d).
cSee Note 3(e) regarding investments in Institutional Fiduciary Trust Money Market Portfolio.
dSee Note 1(d) regarding securities on loan.
eSee Note 1(c) regarding joint repurchase agreement.
| FSV-12 | Semiannual Report | The accompanying notes are an integral part of these financial statements. |
FRANKLIN TEMPLETON VARIABLE INSURANCE PRODUCTS TRUST
Financial Statements
Statement of Assets and Liabilities
June 30, 2015 (unaudited)
Franklin Small Cap Value VIP Fund | ||||
Assets: | ||||
Investments in securities: | ||||
Cost - Unaffiliated issuers | $ | 967,712,606 | ||
Cost - Sweep Money Fund (Note 3e) | 77,312,977 | |||
Cost - Repurchase agreements | 6,253,155 | |||
|
| |||
Total cost of investments | $ | 1,051,278,738 | ||
|
| |||
Value - Unaffiliated issuers | $ | 1,381,394,683 | ||
Value - Sweep Money Fund (Note 3e) | 77,312,977 | |||
Value - Repurchase agreements | 6,253,155 | |||
|
| |||
Total value of investments (includes securities loaned in the amount of $11,674,448) | 1,464,960,815 | |||
Receivables: | ||||
Investment securities sold | 10,028,009 | |||
Capital shares sold | 223,218 | |||
Dividends and interest | 1,097,313 | |||
Other assets | 607 | |||
|
| |||
Total assets | 1,476,309,962 | |||
|
| |||
Liabilities: | ||||
Payables: | ||||
Investment securities purchased | 6,817,976 | |||
Capital shares redeemed | 792,943 | |||
Management fees | 740,462 | |||
Distribution fees | 600,172 | |||
Payable upon return of securities loaned | 11,753,155 | |||
Accrued expenses and other liabilities | 330,445 | |||
|
| |||
Total liabilities | 21,035,153 | |||
|
| |||
Net assets, at value | $ | 1,455,274,809 | ||
|
| |||
Net assets consist of: | ||||
Paid-in capital | $ | 927,406,103 | ||
Undistributed net investment income | 4,170,181 | |||
Net unrealized appreciation (depreciation) | 413,681,869 | |||
Accumulated net realized gain (loss) | 110,016,656 | |||
|
| |||
Net assets, at value | $ | 1,455,274,809 | ||
|
| |||
| Class 1: | ||||
Net assets, at value | $ | 53,657,393 | ||
|
| |||
Shares outstanding | 2,705,950 | |||
|
| |||
Net asset value and maximum offering price per share | $ | 19.83 | ||
|
| |||
| Class 2: | ||||
Net assets, at value | $ | 1,370,965,515 | ||
|
| |||
Shares outstanding | 70,768,625 | |||
|
| |||
Net asset value and maximum offering price per share | $ | 19.37 | ||
|
| |||
| Class 4: | ||||
Net assets, at value | $ | 30,651,901 | ||
|
| |||
Shares outstanding | 1,556,138 | |||
|
| |||
Net asset value and maximum offering price per share | $ | 19.70 | ||
|
| |||
| The accompanying notes are an integral part of these financial statements. | Semiannual Report | FSV-13 |
FRANKLIN TEMPLETON VARIABLE INSURANCE PRODUCTS TRUST
FINANCIAL STATEMENTS
Statement of Operations
for the six months ended June 30, 2015 (unaudited)
Franklin Small Cap Value VIP Fund | ||||
Investment income: | ||||
Dividends | $ | 10,436,416 | ||
Interest | 280,380 | |||
Income from securities loaned | 502,862 | |||
|
| |||
Total investment income | 11,219,658 | |||
|
| |||
Expenses: | ||||
Management fees (Note 3a) | 4,525,038 | |||
Distribution fees: (Note 3c) | ||||
Class 2 | 1,729,509 | |||
Class 4 | 51,706 | |||
Custodian fees (Note 4) | 8,969 | |||
Reports to shareholders | 164,943 | |||
Professional fees | 24,735 | |||
Trustees’ fees and expenses | 3,365 | |||
Other | 12,544 | |||
|
| |||
Total expenses | 6,520,809 | |||
Expenses waived/paid by affiliates (Note 3e) | (35,124 | ) | ||
|
| |||
Net expenses | 6,485,685 | |||
|
| |||
Net investment income | 4,733,973 | |||
|
| |||
Realized and unrealized gains (losses): | ||||
Net realized gain (loss) from: | ||||
Investments | 110,077,069 | |||
Foreign currency transactions | 29,745 | |||
|
| |||
Net realized gain (loss) | 110,106,814 | |||
|
| |||
Net change in unrealized appreciation (depreciation) on: | ||||
Investments | (94,022,100 | ) | ||
Translation of other assets and liabilities denominated in foreign currencies | (208 | ) | ||
|
| |||
Net change in unrealized appreciation (depreciation) | (94,022,308 | ) | ||
|
| |||
Net realized and unrealized gain (loss) | 16,084,506 | |||
|
| |||
Net increase (decrease) in net assets resulting from operations | $ | 20,818,479 | ||
|
| |||
| FSV-14 | Semiannual Report | The accompanying notes are an integral part of these financial statements. |
FRANKLIN TEMPLETON VARIABLE INSURANCE PRODUCTS TRUST
FINANCIAL STATEMENTS
Statements of Changes in Net Assets
| Franklin Small Cap Value VIP Fund | ||||||||
| Six Months Ended June 30, 2015 (unaudited) | Year Ended December 31, 2014 | |||||||
Increase (decrease) in net assets: | ||||||||
Operations: | ||||||||
Net investment income | $ | 4,733,973 | $ | 9,166,921 | ||||
Net realized gain (loss) | 110,106,814 | 204,970,194 | ||||||
Net change in unrealized appreciation (depreciation) | (94,022,308 | ) | (206,772,254 | ) | ||||
|
| |||||||
Net increase (decrease) in net assets resulting from operations | 20,818,479 | 7,364,861 | ||||||
|
| |||||||
Distributions to shareholders from: | ||||||||
Net investment income: | ||||||||
Class 1 | (483,179 | ) | (493,372 | ) | ||||
Class 2 | (8,399,662 | ) | (9,349,846 | ) | ||||
Class 4 | (155,331 | ) | (160,210 | ) | ||||
Net realized gains: | ||||||||
Class 1 | (7,665,840 | ) | (4,292,308 | ) | ||||
Class 2 | (193,180,034 | ) | (112,743,662 | ) | ||||
Class 4 | (4,250,502 | ) | (2,435,910 | ) | ||||
|
| |||||||
Total distributions to shareholders | (214,134,548 | ) | (129,475,308 | ) | ||||
|
| |||||||
Capital share transactions: (Note 2) | ||||||||
Class 1 | 3,052,483 | (206,770 | ) | |||||
Class 2 | 107,684,628 | (46,032,420 | ) | |||||
Class 4 | 4,233,755 | (3,176,134 | ) | |||||
|
| |||||||
Total capital share transactions | 114,970,866 | (49,415,324 | ) | |||||
|
| |||||||
Net increase (decrease) in net assets | (78,345,203 | ) | (171,525,771 | ) | ||||
Net assets: | ||||||||
Beginning of period | 1,533,620,012 | 1,705,145,783 | ||||||
|
| |||||||
End of period | $ | 1,455,274,809 | $ | 1,533,620,012 | ||||
|
| |||||||
Undistributed net investment income included in net assets: | ||||||||
End of period | $ | 4,170,181 | $ | 8,474,380 | ||||
|
| |||||||
| The accompanying notes are an integral part of these financial statements. | Semiannual Report | FSV-15 |
FRANKLIN TEMPLETON VARIABLE INSURANCE PRODUCTS TRUST
Notes to Financial Statements (unaudited)
Franklin Small Cap Value VIP Fund
1. Organization and Significant Accounting Policies
Franklin Templeton Variable Insurance Products Trust (Trust) is registered under the Investment Company Act of 1940 (1940 Act) as an open-end management investment company, consisting of nineteen separate funds and applies the specialized accounting and reporting guidance in U.S. Generally Accepted Accounting Principles (U.S. GAAP). Franklin Small Cap Value VIP Fund (Fund) is included in this report. The financial statements of the remaining funds in the Trust are presented separately. Shares of the Fund are generally sold only to insurance company separate accounts to fund the benefits of variable life insurance policies or variable annuity contracts. The Fund offers three classes of shares: Class 1, Class 2 and Class 4. Each class of shares differs by its distribution fees, voting rights on matters affecting a single class and its exchange privilege.
The following summarizes the Fund’s significant accounting policies.
a. Financial Instrument Valuation
The Fund’s investments in financial instruments are carried at fair value daily. Fair value is the price that would be received to sell an asset or paid to transfer a liability in an orderly transaction between market participants on the measurement date. The Fund calculates the net asset value (NAV) per share at the close of the New York Stock Exchange (NYSE), generally at 4 p.m. Eastern time (NYSE close) on each day the NYSE is open for trading. Under compliance policies and procedures approved by the Trust’s Board of Trustees (the Board), the Fund’s administrator has responsibility for oversight of valuation, including leading the cross-functional Valuation and Liquidity Oversight Committee (VLOC). The VLOC provides administration and oversight of the Fund’s valuation policies and procedures, which are approved annually by the Board. Among other things, these procedures allow the Fund to utilize independent pricing services, quotations from securities and financial instrument dealers, and other market sources to determine fair value.
Equity securities listed on an exchange or on the NASDAQ National Market System are valued at the last quoted sale price or the official closing price of the day, respectively. Foreign equity securities are valued as of the close of trading on the foreign stock exchange on which the security is primarily traded or as of the NYSE close, whichever is earlier. The value is then converted into its U.S. dollar equivalent at the foreign exchange rate in effect at the NYSE close on the day that the value of the
security is determined. Over-the-counter (OTC) securities are valued within the range of the most recent quoted bid and ask prices. Securities that trade in multiple markets or on multiple exchanges are valued according to the broadest and most representative market. Certain equity securities are valued based upon fundamental characteristics or relationships to similar securities. Investments in open-end mutual funds are valued at the closing NAV.
Debt securities generally trade in the OTC market rather than on a securities exchange. The Fund’s pricing services use multiple valuation techniques to determine fair value. In instances where sufficient market activity exists, the pricing services may utilize a market-based approach through which quotes from market makers are used to determine fair value. In instances where sufficient market activity may not exist or is limited, the pricing services also utilize proprietary valuation models which may consider market characteristics such as benchmark yield curves, credit spreads, estimated default rates, anticipated market interest rate volatility, coupon rates, anticipated timing of principal repayments, underlying collateral, and other unique security features in order to estimate the relevant cash flows, which are then discounted to calculate the fair value. Repurchase agreements are valued at cost, which approximates fair value.
The Fund has procedures to determine the fair value of financial instruments for which market prices are not reliable or readily available. Under these procedures, the VLOC convenes on a regular basis to review such financial instruments and considers a number of factors, including significant unobservable valuation inputs, when arriving at fair value. The VLOC primarily employs a market-based approach which may use related or comparable assets or liabilities, recent transactions, market multiples, book values, and other relevant information for the investment to determine the fair value of the investment. An income-based valuation approach may also be used in which the anticipated future cash flows of the investment are discounted to calculate fair value. Discounts may also be applied due to the nature or duration of any restrictions on the disposition of the investments. Due to the inherent uncertainty of valuations of such investments, the fair values may differ significantly from the values that would have been used had an active market existed. The VLOC employs various methods for calibrating these valuation approaches including a regular review of key inputs and assumptions, transactional back-testing or disposition analysis, and reviews of any related market activity.
| FSV-16 | Semiannual Report |
FRANKLIN TEMPLETON VARIABLE INSURANCE PRODUCTS TRUST
NOTES TO FINANCIAL STATEMENTS (UNAUDITED)
Franklin Small Cap Value VIP Fund (continued)
Trading in securities on foreign securities stock exchanges and OTC markets may be completed before the daily NYSE close. In addition, trading in certain foreign markets may not take place on every NYSE business day. Occasionally, events occur between the time at which trading in a foreign security is completed and the close of the NYSE that might call into question the reliability of the value of a portfolio security held by the Fund. As a result, differences may arise between the value of the Fund’s portfolio securities as determined at the foreign market close and the latest indications of value at the close of the NYSE. In order to minimize the potential for these differences, the VLOC monitors price movements following the close of trading in foreign stock markets through a series of country specific market proxies (such as baskets of American Depositary Receipts, futures contracts and exchange traded funds). These price movements are measured against established trigger thresholds for each specific market proxy to assist in determining if an event has occurred that may call into question the reliability of the values of the foreign securities held by the Fund. If such an event occurs, the securities may be valued using fair value procedures, which may include the use of independent pricing services.
When the last day of the reporting period is a non-business day, certain foreign markets may be open on those days that the NYSE is closed, which could result in differences between the value of the Fund’s portfolio securities on the last business day and the last calendar day of the reporting period. Any significant security valuation changes due to an open foreign market are adjusted and reflected by the Fund for financial reporting purposes.
b. Foreign Currency Translation
Portfolio securities and other assets and liabilities denominated in foreign currencies are translated into U.S. dollars based on the exchange rate of such currencies against U.S. dollars on the date of valuation. The Fund may enter into foreign currency exchange contracts to facilitate transactions denominated in a foreign currency. Purchases and sales of securities, income and expense items denominated in foreign currencies are translated into U.S. dollars at the exchange rate in effect on the transaction date. Portfolio securities and assets and liabilities denominated in foreign currencies contain risks that those currencies will decline in value relative to the U.S. dollar. Occasionally, events may impact the availability or reliability of foreign exchange rates used to convert the U.S. dollar equivalent value. If such an
event occurs, the foreign exchange rate will be valued at fair value using procedures established and approved by the Board.
The Fund does not separately report the effect of changes in foreign exchange rates from changes in market prices on securities held. Such changes are included in net realized and unrealized gain or loss from investments in the Statement of Operations.
Realized foreign exchange gains or losses arise from sales of foreign currencies, currency gains or losses realized between the trade and settlement dates on securities transactions and the difference between the recorded amounts of dividends, interest, and foreign withholding taxes and the U.S. dollar equivalent of the amounts actually received or paid. Net unrealized foreign exchange gains and losses arise from changes in foreign exchange rates on foreign denominated assets and liabilities other than investments in securities held at the end of the reporting period.
c. Joint Repurchase Agreement
The Fund enters into a joint repurchase agreement whereby its uninvested cash balance is deposited into a joint cash account with other funds managed by the investment manager or an affiliate of the investment manager and is used to invest in one or more repurchase agreements. The value and face amount of the joint repurchase agreement are allocated to the funds based on their pro-rata interest. A repurchase agreement is accounted for as a loan by the Fund to the seller, collateralized by securities which are delivered to the Fund’s custodian. The fair value, including accrued interest, of the initial collateralization is required to be at least 102% of the dollar amount invested by the funds, with the value of the underlying securities marked to market daily to maintain coverage of at least 100%. Repurchase agreements are subject to the terms of Master Repurchase Agreements (MRAs) with approved counterparties (sellers). The MRAs contain various provisions, including but not limited to events of default and maintenance of collateral for repurchase agreements. In the event of default by either the seller or the Fund, certain MRAs may permit the non-defaulting party to net and close-out all transactions, if any, traded under such agreements. The Fund may sell securities it holds as collateral and apply the proceeds towards the repurchase price and any other amounts owed by the seller to the Fund in the event of default by the seller. This could involve costs or delays in addition to a loss on the securities if their value falls below the repurchase price owed by the seller. The joint repurchase agreement held
| Semiannual Report | FSV-17 |
FRANKLIN TEMPLETON VARIABLE INSURANCE PRODUCTS TRUST
NOTES TO FINANCIAL STATEMENTS (UNAUDITED)
Franklin Small Cap Value VIP Fund (continued)
1. Organization and Significant Accounting Policies (continued)
c. Joint Repurchase Agreement (continued)
by the Fund at period end, as indicated in the Statement of Investments, had been entered into on June 30, 2015.
d. Securities Lending
The Fund participates in an agency based securities lending program to earn additional income. The Fund receives cash collateral against the loaned securities in an amount equal to at least 102% of the fair value of the loaned securities. Collateral is maintained over the life of the loan in an amount not less than 100% of the fair value of loaned securities, as determined at the close of fund business each day; any additional collateral required due to changes in security values is delivered to the Fund on the next business day. The collateral is deposited into a joint cash account with other funds and is used to invest in a money market fund managed by Franklin Advisers, Inc., an affiliate of the Fund, and/or a joint repurchase agreement as indicated in the Statement of Investments. The total cash collateral received at period end was $11,753,155. The Fund may receive income from the investment of cash collateral, in addition to lending fees and rebates paid by the borrower. Income from securities loaned is reported separately in the Statement of Operations. The Fund bears the market risk with respect to the collateral investment, securities loaned, and the risk that the agent may default on its obligations to the Fund. If the borrower defaults on its obligation to return the securities loaned, the Fund has the right to repurchase the securities in the open market using the collateral received. The securities lending agent has agreed to indemnify the Fund in the event of default by a third party borrower.
e. Income and Deferred Taxes
It is the Fund’s policy to qualify as a regulated investment company under the Internal Revenue Code. The Fund intends to distribute to shareholders substantially all of its taxable income and net realized gains to relieve it from federal income and if applicable, excise taxes. As a result, no provision for U.S. federal income taxes is required.
The Fund may be subject to foreign taxation related to income received, capital gains on the sale of securities and certain foreign currency transactions in the foreign jurisdictions in which it invests. Foreign taxes, if any, are recorded based on the tax regulations and rates that exist in the foreign markets in which
the Fund invests. When a capital gain tax is determined to apply, the Fund records an estimated deferred tax liability in an amount that would be payable if the securities were disposed of on the valuation date.
The Fund recognizes the tax benefits of uncertain tax positions only when the position is “more likely than not” to be sustained upon examination by the tax authorities based on the technical merits of the tax position. As of June 30, 2015, and for all open tax years, the Fund has determined that no liability for unrecognized tax benefits is required in the Fund’s financial statements related to uncertain tax positions taken on a tax return (or expected to be taken on future tax returns). Open tax years are those that remain subject to examination and are based on each tax jurisdiction’s statute of limitation.
f. Security Transactions, Investment Income, Expenses and Distributions
Security transactions are accounted for on trade date. Realized gains and losses on security transactions are determined on a specific identification basis. Interest income and estimated expenses are accrued daily. Amortization of premium and accretion of discount on debt securities are included in interest income. Dividend income recorded on the ex-dividend date except for certain dividends from foreign securities where the dividend rate is not available. In such cases, the dividend is recorded as soon as the information is received by the Fund. Distributions to shareholders are recorded on the ex-dividend date and are determined according to income tax regulations (tax basis). Distributable earnings determined on a tax basis may differ from earnings recorded in accordance with U.S. GAAP. These differences may be permanent or temporary. Permanent differences are reclassified among capital accounts to reflect their tax character. These reclassifications have no impact on net assets or the results of operations. Temporary differences are not reclassified, as they may reverse in subsequent periods.
Common expenses incurred by the Trust are allocated among the funds based on the ratio of net assets of each fund to the combined net assets of the Trust. Fund specific expenses are charged directly to the fund that incurred the expense.
Realized and unrealized gains and losses and net investment income, not including class specific expenses, are allocated daily to each class of shares based upon the relative proportion of net assets of each class. Differences in per share distributions, by class, are generally due to differences in class specific expenses.
| FSV-18 | Semiannual Report |
FRANKLIN TEMPLETON VARIABLE INSURANCE PRODUCTS TRUST
NOTES TO FINANCIAL STATEMENTS (UNAUDITED)
Franklin Small Cap Value VIP Fund (continued)
g. Accounting Estimates
The preparation of financial statements in accordance with U.S. GAAP requires management to make estimates and assumptions that affect the reported amounts of assets and liabilities at the date of the financial statements and the amounts of income and expenses during the reporting period. Actual results could differ from those estimates.
h. Guarantees and Indemnifications
Under the Trust’s organizational documents, its officers and trustees are indemnified by the Trust against certain liabilities
arising out of the performance of their duties to the Trust. Additionally, in the normal course of business, the Trust, on behalf of the Fund, enters into contracts with service providers that contain general indemnification clauses. The Trust’s maximum exposure under these arrangements is unknown as this would involve future claims that may be made against the Trust that have not yet occurred. Currently, the Trust expects the risk of loss to be remote.
2. Shares of Beneficial Interest
At June 30, 2015, there were an unlimited number of shares authorized (without par value). Transactions in the Fund’s shares were as follows:
| Six Months Ended June 30, 2015 | Year Ended December 31, 2014 | |||||||||||||||||
| Shares | Amount | Shares | Amount | |||||||||||||||
| Class 1 Shares: | ||||||||||||||||||
Shares sold | 48,157 | $ | 1,087,666 | 175,851 | $ | 4,068,553 | ||||||||||||
Shares issued in reinvestment of distributions | 407,044 | 8,149,019 | 206,102 | 4,785,680 | ||||||||||||||
Shares redeemed | (285,461 | ) | (6,184,202 | ) | (388,575 | ) | (9,061,003 | ) | ||||||||||
|
| |||||||||||||||||
Net increase (decrease) | 169,740 | $ | 3,052,483 | (6,622 | ) | $ | (206,770 | ) | ||||||||||
|
| |||||||||||||||||
| Class 2 Shares: | ||||||||||||||||||
Shares sold | 1,853,789 | $ | 41,013,490 | 5,020,152 | $ | 113,569,546 | ||||||||||||
Shares issued in reinvestment of distributions | 10,305,710 | 201,579,696 | 5,364,390 | 122,093,507 | ||||||||||||||
Shares redeemed | (6,133,706 | ) | (134,908,558 | ) | (12,408,353 | ) | (281,695,473 | ) | ||||||||||
|
| |||||||||||||||||
Net increase (decrease) | 6,025,793 | $ | 107,684,628 | (2,023,811 | ) | $ | (46,032,420 | ) | ||||||||||
|
| |||||||||||||||||
| Class 4 Shares: | ||||||||||||||||||
Shares sold | 118,874 | $ | 2,673,514 | 176,245 | $ | 3,946,345 | ||||||||||||
Shares issued in reinvestment of distributions | 221,510 | 4,405,833 | 112,435 | 2,596,120 | ||||||||||||||
Shares redeemed | (129,615 | ) | (2,845,592 | ) | (418,040 | ) | (9,718,599 | ) | ||||||||||
|
| |||||||||||||||||
Net increase (decrease) | 210,769 | $ | 4,233,755 | (129,360 | ) | $ | (3,176,134 | ) | ||||||||||
|
| |||||||||||||||||
3. Transactions With Affiliates
Franklin Resources, Inc. is the holding company for various subsidiaries that together are referred to as Franklin Templeton Investments. Certain officers and trustees of the Fund are also officers and/or directors of the following subsidiaries:
| Subsidiary | Affiliation | |
Franklin Advisory Services, LLC (Advisory Services) | Investment manager | |
Franklin Templeton Services, LLC (FT Services) | Administrative manager | |
Franklin Templeton Distributors, Inc. (Distributors) | Principal underwriter | |
Franklin Templeton Investor Services, LLC (Investor Services) | Transfer agent |
| Semiannual Report | FSV-19 |
FRANKLIN TEMPLETON VARIABLE INSURANCE PRODUCTS TRUST
NOTES TO FINANCIAL STATEMENTS (UNAUDITED)
Franklin Small Cap Value VIP Fund (continued)
3. Transactions With Affiliates (continued)
a. Management Fees
The Fund pays an investment management fee to Advisory Services based on the average daily net assets of the Fund as follows:
| Annualized Fee Rate | Net Assets | |
0.750% | Up to and including $200 million | |
0.635% | Over $200 million, up to and including $700 million | |
0.600% | Over $700 million, up to and including $1.2 billion | |
0.575% | Over $1.2 billion, up to and including $1.3 billion | |
0.475% | In excess of $1.3 billion |
b. Administrative Fees
Under an agreement with Advisory Services, FT Services provides administrative services to the Fund. The fee is paid by Advisory Services based on the Fund’s average daily net assets, and is not an additional expense of the Fund.
c. Distribution Fees
The Board has adopted distribution plans for Class 2 and Class 4 shares pursuant to Rule 12b-1 under the 1940 Act. Under the Fund’s compensation distribution plans, the Fund pays Distributors for costs incurred in connection with the servicing, sale and distribution of the Fund’s shares up to 0.35% per year of its average daily net assets of each class. Some distribution fees are not charged on shares held by affiliates. The Board has agreed to limit the current rate to 0.25% per year for Class 2. The plan year, for purposes of monitoring compliance with the maximum annual plan rates, is February 1 through January 31.
d. Transfer Agent Fees
Investor Services, under terms of an agreement, performs shareholder servicing for the Fund and is not paid by the Fund for the services.
e. Investments in Institutional Fiduciary Trust Money Market Portfolio
The Fund invests in Institutional Fiduciary Trust Money Market Portfolio (Sweep Money Fund), an affiliated open-end management investment company. Management fees paid by the Fund are waived on assets invested in the Sweep Money Fund, as noted in the Statement of Operations, in an amount not to exceed the management and administrative fees paid directly or indirectly by the Sweep Money Fund. Prior to January 1, 2014, the waiver was accounted for as a reduction to management fees.
4. Expense Offset Arrangement
The Fund has entered into an arrangement with its custodian whereby credits realized as a result of uninvested cash balances are used to reduce a portion of the Fund’s custodian expenses. During the period ended June 30, 2015, there were no credits earned.
5. Income Taxes
At June 30, 2015, the cost of investments and net unrealized appreciation (depreciation) for income tax purposes were as follows:
Cost of investments | $ | 1,051,923,748 | ||
|
| |||
Unrealized appreciation | $ | 453,091,229 | ||
Unrealized depreciation | (40,054,162 | ) | ||
|
| |||
Net unrealized appreciation (depreciation) | $ | 413,037,067 | ||
|
|
| FSV-20 | Semiannual Report |
FRANKLIN TEMPLETON VARIABLE INSURANCE PRODUCTS TRUST
NOTES TO FINANCIAL STATEMENTS (UNAUDITED)
Franklin Small Cap Value VIP Fund (continued)
Differences between income and/or capital gains as determined on a book basis and a tax basis are primarily due to differing treatment of passive foreign investment company shares.
6. Investment Transactions
Purchases and sales of investments (excluding short term securities) for the period ended June 30, 2015, aggregated $176,034,150 and $300,394,786, respectively.
7. Credit Facility
The Fund, together with other U.S. registered and foreign investment funds (collectively, Borrowers), managed by Franklin Templeton Investments, are borrowers in a joint syndicated senior unsecured credit facility totaling $2 billion (Global Credit Facility) which matures on February 12, 2016. This Global Credit Facility provides a source of funds to the Borrowers for temporary and emergency purposes, including the ability to meet future unanticipated or unusually large redemption requests.
Under the terms of the Global Credit Facility, the Fund shall, in addition to interest charged on any borrowings made by the Fund and other costs incurred by the Fund, pay its share of fees and expenses incurred in connection with the implementation and maintenance of the Global Credit Facility, based upon its relative share of the aggregate net assets of all of the Borrowers, including an annual commitment fee of 0.07% based upon the unused portion of the Global Credit Facility. These fees are reflected in other expenses in the Statement of Operations. During the period ended June 30, 2015, the Fund did not use the Global Credit Facility.
8. Fair Value Measurements
The Fund follows a fair value hierarchy that distinguishes between market data obtained from independent sources (observable inputs) and the Fund’s own market assumptions (unobservable inputs). These inputs are used in determining the value of the Fund’s financial instruments and are summarized in the following fair value hierarchy:
| • | Level 1 – quoted prices in active markets for identical financial instruments |
| • | Level 2 – other significant observable inputs (including quoted prices for similar financial instruments, interest rates, prepayment speed, credit risk, etc.) |
| • | Level 3 – significant unobservable inputs (including the Fund’s own assumptions in determining the fair value of financial instruments) |
The input levels are not necessarily an indication of the risk or liquidity associated with financial instruments at that level.
For movements between the levels within the fair value hierarchy, the Fund has adopted a policy of recognizing the transfers as of the date of the underlying event which caused the movement.
A summary of inputs used as of June 30, 2015, in valuing the Fund’s assets carried at fair value, is as follows:
| Level 1 | Level 2 | Level 3 | Total | |||||||||||||
| Assets: | ||||||||||||||||
Investments in Securities: | ||||||||||||||||
Equity Investmentsa | $ | 1,373,649,283 | $ | — | $ | — | $ | 1,373,649,283 | ||||||||
Corporate Bonds | — | 7,745,400 | — | 7,745,400 | ||||||||||||
Short Term Investments | 77,312,977 | 6,253,155 | — | 83,566,132 | ||||||||||||
|
| |||||||||||||||
Total Investments in Securities | $ | 1,450,962,260 | $ | 13,998,555 | $ | — | $ | 1,464,960,815 | ||||||||
|
| |||||||||||||||
aFor detailed categories, see the accompanying Statement of Investments.
| Semiannual Report | FSV-21 |
FRANKLIN TEMPLETON VARIABLE INSURANCE PRODUCTS TRUST
NOTES TO FINANCIAL STATEMENTS (UNAUDITED)
Franklin Small Cap Value VIP Fund (continued)
9. New Accounting Pronouncements
In June 2014, the Financial Accounting Standards Board issued Accounting Standards Update (ASU) No. 2014-11, Transfers and Servicing (Topic 860), Repurchase-to-Maturity Transactions, Repurchase Financings, and Disclosures. The ASU changes the accounting for certain repurchase agreements and expands disclosure requirements related to repurchase agreements, securities lending, repurchase-to-maturity and similar transactions. The ASU is effective for certain transactions accounted for as a sale for interim and annual reporting periods beginning after December 15, 2014, and transactions accounted for as secured borrowings for annual periods beginning after December 15, 2014, and for interim periods beginning after March 15, 2015. Management has reviewed the requirements and believes the adoption of this ASU will not have a material impact on the financial statements.
10. Subsequent Events
The Fund has evaluated subsequent events through the issuance of the financial statements and determined that no events have occurred that require disclosure.
| FSV-22 | Semiannual Report |
Franklin Small-Mid Cap Growth VIP Fund
We are pleased to bring you Franklin Small-Mid Cap Growth VIP Fund’s semiannual report for the period ended June 30, 2015.
Class 1 Performance Summary as of June 30, 2015
The Fund’s Class 1 shares delivered a +7.42% total return* for the six-month period ended June 30, 2015.
*The Fund has a fee waiver associated with any investment in a Franklin Templeton money fund, contractually guaranteed through at least its current fiscal year-end. Fund investment results reflect the fee waiver, to the extent applicable; without this reduction, the results would have been lower.
Performance reflects the Fund’s Class 1 operating expenses, but does not include any contract fees, expenses or sales charges. If they had been included, performance would be lower. These charges and deductions, particularly for variable life policies, can have a significant effect on contract values and insurance benefits. See the contract prospectus for a complete description of these expenses, including sales charges.
Performance data represent past performance, which does not guarantee future results. Investment return and principal value will fluctuate, and you may have a gain or loss when you sell your shares. Current performance may differ from figures shown.
| Semiannual Report | FSC-1 |
FRANKLIN SMALL-MID CAP GROWTH VIP FUND
Fund Goal and Main Investments
Franklin Small-Mid Cap Growth VIP Fund seeks long-term capital growth. Under normal market conditions, the Fund invests at least 80% of its net assets in equity securities of small-capitalization and mid-capitalization companies. For this Fund, small cap companies are those within the market capitalization range of companies in the Russell 2500™ Index at the time of purchase, and midcap companies are those within the market capitalization range of companies in the Russell Midcap® Index at the time of purchase.1
Fund Risks
All investments involve risks, including possible loss of principal. Growth stock prices reflect projections of future earnings or revenues, and can, therefore, fall dramatically if the company fails to meet those projections. Smaller, midsized and relatively new or unseasoned companies can be particularly sensitive to changing economic conditions, and their prospects for growth are less certain than those of larger, more established companies. Historically, these securities have experienced more price volatility than larger company stocks, especially over the short term. To the extent the Fund focuses on particular countries, regions, industries, sectors or types of investment from time to time, it may be subject to greater risks of adverse developments in such areas of focus than a fund that invests in a wider variety of countries, regions, industries, sectors or investments. From time to time, the trading market for a particular security or type of security in which the Fund invests may become less liquid or even illiquid. The Fund is actively managed but there is no guarantee that the manager’s investment decisions will produce the desired results. The Fund’s prospectus also includes a description of the main investment risks.
Performance Overview
You can find the Fund’s six-month total return in the Performance Summary. In comparison, the Fund’s narrow benchmark, the Russell Midcap® Growth Index, generated a +4.18% total return, and its broad benchmark, the Standard & Poor’s® 500 Index (S&P 500®), produced a +1.23% total return for the same period.2
Economic and Market Overview
U.S. economic growth was mixed during the six months under review. In 2015’s first quarter, U.S. dollar strength, low energy
prices, and a labor dispute at West Coast ports led exports to decline. Lower business investment and state and local government spending also weighed on the economy, while increases in consumer spending, residential investment and private inventory investment offered some support. In the second quarter, business capital spending rebounded and manufacturing and non-manufacturing activities increased, contributing to strong job gains that helped the unemployment rate decline from 5.6% in December 2014 to 5.3% in June 2015.3 Housing market data were generally encouraging as home sales and prices rose. After a brief, winter slump, retail sales rebounded in the spring as strong employment gains led to broad-based improvement, especially for auto and gasoline sales. Inflation, as measured by the Consumer Price Index, rose during the six months amid generally higher energy prices bouncing from recent lows.
During the six-month period, the Federal Reserve Board (Fed) kept its target interest rate at 0%–0.25% while considering when an increase would be appropriate. The Fed anticipated
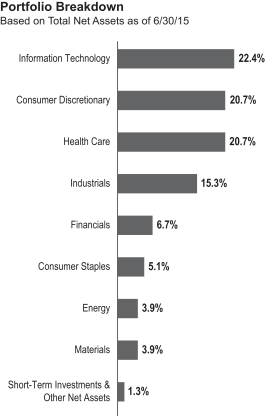
1. Please see Index Descriptions following the Fund Summaries.
2. Source: Morningstar.
One cannot invest directly in an index, and an index is not representative of the Fund’s portfolio. Please see Index Descriptions following the Fund Summaries.
3. Source: Bureau of Labor Statistics.
| FSC-2 | Semiannual Report |
FRANKLIN SMALL-MID CAP GROWTH VIP FUND
raising its target rate when it saw further labor market progress and was reasonably confident that inflation would move back to 2% over the medium term. In its June meeting, the Fed lowered its 2015 economic growth forecast and raised unemployment estimates given the weak start to the year.
Investor confidence grew during the period as corporate profits remained healthy, the Fed showed caution about raising interest rates, economic data in Europe and Japan improved and China introduced more stimulus measures. However, the stock markets endured some sell-offs when many investors reacted to debt negotiations between Greece and its creditors, geopolitical tensions in certain regions, and less robust growth in China. For the six months under review, U.S. stocks, as measured by the S&P 500 and the Dow Jones Industrial Average, rose marginally after both reached all-time highs in May.1
Investment Strategy
We use fundamental, bottom-up research to seek companies meeting our criteria of growth potential, quality and valuation. In seeking sustainable growth characteristics, we look for companies we believe can produce sustainable earnings and cash flow growth, evaluating the long-term market opportunity and competitive structure of an industry to target leaders and emerging leaders. We define quality companies as those with strong and improving competitive positions in attractive markets. We also believe important attributes of quality are experienced and talented management teams as well as financial strength reflected in the capital structure, gross and operating margins, free cash flow generation and returns on capital employed. Our valuation analysis includes a range of potential outcomes based on an assessment of multiple scenarios. In assessing value, we consider whether security prices fully reflect the balance of the sustainable growth opportunities relative to business and financial risks.
Manager’s Discussion
Nearly all sectors represented in the Fund’s portfolio delivered positive returns and contributed to absolute performance during the six months under review. Relative to the Russell Midcap Growth® Index, key contributors included stock selection in industrials and consumer discretionary and an overweighting in health care.
The Fund’s overall industrials holdings outperformed those of the benchmark index, although the sector was impacted by slower emerging market economic growth, commodity price declines and the negative effects of foreign currency exchange. Many of the Fund’s industrials holdings performed
well, however, particularly our off-benchmark investment in Allegiant Travel. The leisure travel company benefited from capacity reduction at smaller airports as the biggest U.S. airlines focused on large airports. This trend resulted in new opportunities for Allegiant to expand its business faster than many investors anticipated. Furthermore, the company’s profit margins grew, as reduced competition at smaller airports helped its airfares hold up better than airfares at large airports, where competition intensified in 2015.
The Fund’s consumer discretionary holdings performed well overall, as strength in many industries, notably athletic apparel, media, Internet retail and specialty retail more than offset weakness in hotels, restaurants and leisure. Positions in several strongly performing companies, notably Netflix, helped relative results. The video streaming and DVD subscription service company maintained robust domestic subscriber growth while accelerating the pace of international subscriber expansion. Netflix demonstrated operating leverage in its domestic business as it approached its long-term target model. As a result, many investors were willing to overlook near-term losses in the company’s international business. Accelerating subscriber growth led many analysts to raise their forecasts of the company’s long-term subscriber growth and longer term profitability.
| Top 10 Holdings | ||||
| 6/30/15 | ||||
| Company Sector/Industry | % of Total Net Assets | |||
| NXP Semiconductors NV (Netherlands) Information Technology | 1.7% | |||
| AMETEK Inc. Industrials | 1.5% | |||
| Perrigo Co. PLC Health Care | 1.4% | |||
| Electronic Arts Inc. Information Technology | 1.4% | |||
| Impax Laboratories Inc. Health Care | 1.4% | |||
| Affiliated Managers Group Inc. Financials | 1.4% | |||
| Signature Bank Financials | 1.4% | |||
| Axalta Coating Systems Ltd. Materials | 1.3% | |||
| Intercontinental Exchange Inc. Financials | 1.3% | |||
| Quintiles Transnational Holdings Inc. Health Care | 1.3% | |||
The dollar value, number of shares or principal amount, and names of all portfolio holdings are listed in the Fund’s Statement of Investments.
| Semiannual Report | FSC-3 |
FRANKLIN SMALL-MID CAP GROWTH VIP FUND
Health care was one of the period’s best-performing sectors, driven largely by the biotechnology and pharmaceuticals industries, as many companies received positive responses from the Food and Drug Administration (FDA), maintained pricing flexibility and generated solid earnings growth. Further benefiting the sector were many companies’ limited exposure to emerging markets, including Greece and China, and consolidation in several industries. Top contributors to Fund performance included our off-benchmark investment in Impax Laboratories. The company confirmed its full-year 2015 guidance, as it overcame first-quarter 2015 challenges, including delays with the acquisition of privately held pharmaceutical holding company Tower Holdings, the launch of a first-to-file generic drug and the accounting for revenue of its new Parkinson’s disease treatment Rytary. In our view, the company was executing the specialty pharmaceutical model efficiently by making synergistic acquisitions and building a brand franchise.
Other notable contributors included our off-benchmark investment in NXP Semiconductors and a position in Electronic Arts. NXP is a leading supplier of highly secure communication and microcontroller products. The company benefited from its leading intellectual properties in the fields of cryptography and near field communications. NXP products enable secure passports, toll passes and emerging wireless payments via smartphones and chip-based credit cards. The company will merge with Freescale Semiconductor, which will create one of the largest mixed-signal semiconductor companies in the world. Electronic Arts performed well during the period under the new leadership of chief executive officer Andrew Wilson and chief financial officer Blake Jorgenson. The video game developer benefited from three factors: the new generation of video game consoles, the proliferation of mobile gaming on smartphones and the margin-enhancing shift to digital game downloads.
In contrast, key detractors from the Fund’s relative performance included stock selection in the consumer staples sector, particularly in the beverages and food retail industries. Our off-benchmark investment in Boston Beer was a major detractor, as the craft brewer’s share price declined after the company missed market expectations for fourth-quarter 2014 revenue and earnings growth and full-year 2015 guidance. First-quarter 2015 earnings exceeded expectations, however, aided by product price increases, lower sales costs and a smooth transition between seasonal products. We continued to be highly selective in consumer staples, given the potential negative effects of foreign currency exchange rates on companies with significant global exposure and some instances of valuations we considered to be elevated amid challenging growth prospects.
Although the Fund’s overall information technology holdings performed well and contributed to absolute returns, stock selection detracted from relative performance, particularly with Stratasys4 and Yelp. Shares of Stratasys, the world’s leading additive manufacturing (3D printing) original equipment manufacturer, weakened after company management announced a two-year investment plan focused on industry-specific solutions, specifically in aerospace, medical and automotive. Furthermore, the 3D printing industry’s slower growth in the first quarter led Stratasys and many of its peers to lower full-year 2015 guidance. Consumer review website operator Yelp’s sales reorganization contributed to lower-than-expected first-quarter 2015 revenue, an issue corrected by quarter-end with a return to typical sales force productivity levels. Overall website traffic was mixed, with mobile web and application usage growth offset by slowing desktop traffic, and the company added fewer local accounts year-over-year. In our view, the company’s transition to a more transparent cost-per-click advertising unit could potentially have a positive long-term effect, despite some near-term challenges. Yelp maintained an advantage in consumer reviews and unique content, and valuation levels appeared compelling to us at period-end.
Key individual detractors included oncology drug developer Puma Biotechnology and casino operator MGM Resorts International. Puma Biotechnology has been focused on clinical trials for Neratinib, developed to treat breast cancer and other tumors. Puma’s shares declined due to several factors, including uncertainty ahead of a phase III Neratinib data presentation, the departure of a senior vice president and lawsuits filed against the company. Potential acquirers were granted access to Neratinib’s phase III data, but we think strategic investors may wait for the data to be presented publicly. At period-end, we continued to be optimistic about the drug’s potential FDA approval, given that the consensus opinion of doctors involved has so far been positive, noting that all patient subsets in the phase III trial population had been achieving a clinically meaningful benefit.
MGM was hurt by weakness in Macau, which accounted for a significant part of its consolidated earnings and long-term growth potential. Gaming revenue in Macau fell due to various factors, including China’s anti-graft campaign and visa restrictions that limited visitation from mainland China. Additionally, first-quarter 2015 revenue in Las Vegas missed expectations due to comparison with 2014’s first quarter, which had a strong convention calendar.
4. Not held at period-end.
| FSC-4 | Semiannual Report |
FRANKLIN SMALL-MID CAP GROWTH VIP FUND
Thank you for your participation in Franklin Small-Mid Cap Growth VIP Fund. We look forward to serving your future investment needs.
The foregoing information reflects our analysis, opinions and portfolio holdings as of June 30, 2015, the end of the reporting period. The way we implement our main investment strategies and the resulting portfolio holdings may change depending on factors such as market and economic conditions. These opinions may not be relied upon as investment advice or an offer for a particular security. The information is not a complete analysis of every aspect of any market, country, industry, security or the Fund. Statements of fact are from sources considered reliable, but the investment manager makes no representation or warranty as to their completeness or accuracy. Although historical performance is no guarantee of future results, these insights may help you understand our investment management philosophy.
| Semiannual Report | FSC-5 |
FRANKLIN SMALL-MID CAP GROWTH VIP FUND
Class 1 Fund Expenses
As an investor in a variable insurance contract (Contract) that indirectly provides for investment in an underlying mutual fund, you can incur transaction and/or ongoing expenses at both the Fund level and the Contract level.
| • | Transaction expenses can include sales charges (loads) on purchases, surrender fees, transfer fees and premium taxes. |
| • | Ongoing expenses can include management fees, distribution and service (12b-1) fees, contract fees, annual maintenance fees, mortality and expense risk fees and other fees and expenses. All mutual funds and Contracts have some types of ongoing expenses. |
The expenses shown in the table are meant to highlight ongoing expenses at the Fund level only and do not include ongoing expenses at the Contract level, or transaction expenses at either the Fund or Contract levels. While the Fund does not have transaction expenses, if the transaction and ongoing expenses at the Contract level were included, the expenses shown below would be higher. You should consult your Contract prospectus or disclosure document for more information.
The table shows Fund-level ongoing expenses and can help you understand these expenses and compare them with those of other mutual funds offered through the Contract. The table assumes a $1,000 investment held for the six months indicated. Please refer to the Fund prospectus for additional information on operating expenses.
Actual Fund Expenses
The first line (Actual) of the table provides actual account values and expenses. The “Ending Account Value” is derived from the Fund’s actual return, which includes the effect of ongoing Fund expenses, but does not include the effect of ongoing Contract expenses.
You can estimate the Fund-level expenses you incurred during the period by following these steps. Of course, your account value and expenses will differ from those in this illustration:
| 1. | Divide your account value by $1,000. |
If an account had an $8,600 value, then $8,600 ÷ $1,000 = 8.6.
| 2. | Multiply the result by the number under the heading “Fund-Level Expenses Incurred During Period.” |
If Fund-Level Expenses Incurred During Period were $7.50, then 8.6 × $7.50 = $64.50.
In this illustration, the estimated expenses incurred this period at the Fund level are $64.50.
Hypothetical Example for Comparison with Other Mutual Funds
Information in the second line (Hypothetical) of the table can help you compare ongoing expenses of the Fund with those of other mutual funds offered through the Contract. This information may not be used to estimate the actual ending account balance or expenses you incurred during the period. The hypothetical “Ending Account Value” is based on the Fund’s actual expense ratio and an assumed 5% annual rate of return before expenses, which does not represent the Fund’s actual return. The figure under the heading “Fund-Level Expenses Incurred During Period” shows the hypothetical expenses your account would have incurred under this scenario. You can compare this figure with the 5% hypothetical examples that appear in shareholder reports of other funds offered through a Contract.
| Class 1 | Beginning Account Value 1/1/15 | Ending Account Value 6/30/15 | Fund-Level Expenses 1/1/15–6/30/15 | |||||||||
Actual | $1,000 | $1,074.20 | $4.11 | |||||||||
Hypothetical (5% return before expenses) | $1,000 | $1,020.83 | $4.01 | |||||||||
*Expenses are calculated using the most recent six-month annualized expense ratio, net of expense waivers, for the Fund’s Class 1 shares (0.80%), which does not include any ongoing expenses of the Contract for which the Fund is an investment option, multiplied by the average account value over the period, multiplied by 181/365 to reflect the one-half year period.
| FSC-6 | Semiannual Report |
FRANKLIN TEMPLETON VARIABLE INSURANCE PRODUCTS TRUST
Financial Highlights
Franklin Small-Mid Cap Growth VIP Fund
Six Months Ended (unaudited) | Year Ended December 31, | |||||||||||||||||||||||
| 2014 | 2013 | 2012 | 2011 | 2010 | ||||||||||||||||||||
| Class 1 | ||||||||||||||||||||||||
Per share operating performance (for a share outstanding throughout the period) | ||||||||||||||||||||||||
Net asset value, beginning of period | $24.95 | $28.38 | $21.87 | $21.19 | $22.21 | $17.36 | ||||||||||||||||||
|
| |||||||||||||||||||||||
| Income from investment operationsa: | ||||||||||||||||||||||||
Net investment income (loss)b | (0.02 | ) | (0.07 | ) | (0.09 | ) | (0.01 | )c | (0.05 | ) | (0.01 | )�� | ||||||||||||
Net realized and unrealized gains (losses) | 1.92 | 2.04 | 8.19 | 2.27 | (0.97 | ) | 4.86 | |||||||||||||||||
|
| |||||||||||||||||||||||
Total from investment operations | 1.90 | 1.97 | 8.10 | 2.26 | (1.02 | ) | 4.85 | |||||||||||||||||
|
| |||||||||||||||||||||||
Less distributions from net realized gains | (5.83 | ) | (5.40 | ) | (1.59 | ) | (1.58 | ) | — | — | ||||||||||||||
|
| |||||||||||||||||||||||
Net asset value, end of period | $21.02 | $24.95 | $28.38 | $21.87 | $21.19 | $22.21 | ||||||||||||||||||
|
| |||||||||||||||||||||||
Total returnd | 7.42% | 7.78% | 38.50% | 11.12% | (4.59)% | 27.94% | ||||||||||||||||||
| Ratios to average net assetse | ||||||||||||||||||||||||
Expenses | 0.80% | f | 0.80% | f | 0.80% | g | 0.80% | 0.79% | 0.79% | |||||||||||||||
Net investment income (loss) | (0.13)% | (0.29)% | (0.35)% | (0.03)% | c | (0.21)% | (0.07)% | |||||||||||||||||
| Supplemental data | ||||||||||||||||||||||||
Net assets, end of period (000’s) | $103,200 | $99,803 | $98,020 | $75,977 | $76,384 | $89,826 | ||||||||||||||||||
Portfolio turnover rate | 16.96% | 48.73% | 42.77% | 41.44% | 45.00% | 46.69% | ||||||||||||||||||
aThe amount shown for a share outstanding throughout the period may not correlate with the Statement of Operations for the period due to the timing of sales and repurchases of the Fund’s shares in relation to income earned and/or fluctuating fair value of the investments of the Fund.
bBased on average daily shares outstanding.
cNet investment income per share includes approximately $0.03 per share received in the form of special dividends. Excluding these amounts, the ratio of net investment income to average net assets would have been (0.16)%.
dTotal return does not include fees, charges or expenses imposed by the variable annuity and life insurance contracts for which Franklin Templeton Variable Insurance Products Trust serves as an underlying investment vehicle. Total return is not annualized for periods less than one year.
eRatios are annualized for periods less than one year.
fBenefit of waiver and payments by affiliates rounds to less than 0.01%.
gBenefit of expense reduction rounds to less than 0.01%.
| The accompanying notes are an integral part of these financial statements. | Semiannual Report | FSC-7 |
FRANKLIN TEMPLETON VARIABLE INSURANCE PRODUCTS TRUST
FINANCIAL HIGHLIGHTS
Franklin Small-Mid Cap Growth VIP Fund (continued)
| Six Months Ended June 30, 2015 (unaudited) | Year Ended December 31, | |||||||||||||||||||||||
| 2014 | 2013 | 2012 | 2011 | 2010 | ||||||||||||||||||||
| Class 2 | ||||||||||||||||||||||||
Per share operating performance (for a share outstanding throughout the period) | ||||||||||||||||||||||||
Net asset value, beginning of period | $23.56 | $27.16 | $21.04 | $20.49 | $21.54 | $16.87 | ||||||||||||||||||
|
| |||||||||||||||||||||||
| Income from investment operationsa: | ||||||||||||||||||||||||
Net investment income (loss)b | (0.05 | ) | (0.13 | ) | (0.14 | ) | (0.06 | )c | (0.10 | ) | (0.06 | ) | ||||||||||||
Net realized and unrealized gains (losses) | 1.82 | 1.93 | 7.85 | 2.19 | (0.95 | ) | 4.73 | |||||||||||||||||
|
| |||||||||||||||||||||||
Total from investment operations | 1.77 | 1.80 | 7.71 | 2.13 | (1.05 | ) | 4.67 | |||||||||||||||||
|
| |||||||||||||||||||||||
Less distributions from net realized gains | (5.83 | ) | (5.40 | ) | (1.59 | ) | (1.58 | ) | — | — | ||||||||||||||
|
| |||||||||||||||||||||||
Net asset value, end of period | $19.50 | $23.56 | $27.16 | $21.04 | $20.49 | $21.54 | ||||||||||||||||||
|
| |||||||||||||||||||||||
Total returnd | 7.30% | 7.47% | 38.15% | 10.85% | (4.87)% | 27.68% | ||||||||||||||||||
| Ratios to average net assetse | ||||||||||||||||||||||||
Expenses | 1.05% | f | 1.05% | f | 1.05% | g | 1.05% | 1.04% | 1.04% | |||||||||||||||
Net investment income (loss) | (0.38)% | (0.54)% | (0.60)% | (0.28)% | c | (0.46)% | (0.32)% | |||||||||||||||||
| Supplemental data | ||||||||||||||||||||||||
Net assets, end of period (000’s) | $584,764 | $582,772 | $660,806 | $670,193 | $717,086 | $939,481 | ||||||||||||||||||
Portfolio turnover rate | 16.96% | 48.73% | 42.77% | 41.44% | 45.00% | 46.69% | ||||||||||||||||||
aThe amount shown for a share outstanding throughout the period may not correlate with the Statement of Operations for the period due to the timing of sales and repurchases of the Fund’s shares in relation to income earned and/or fluctuating fair value of the investments of the Fund.
bBased on average daily shares outstanding.
cNet investment income per share includes approximately $0.03 per share received in the form of special dividends. Excluding these amounts, the ratio of net investment income to average net assets would have been (0.41)%.
dTotal return does not include fees, charges or expenses imposed by the variable annuity and life insurance contracts for which Franklin Templeton Variable Insurance Products Trust serves as an underlying investment vehicle. Total return is not annualized for periods less than one year.
eRatios are annualized for periods less than one year.
fBenefit of waiver and payments by affiliates rounds to less than 0.01%.
gBenefit of expense reduction rounds to less than 0.01%.
| FSC-8 | Semiannual Report | The accompanying notes are an integral part of these financial statements. |
FRANKLIN TEMPLETON VARIABLE INSURANCE PRODUCTS TRUST
FINANCIAL HIGHLIGHTS
Franklin Small-Mid Cap Growth VIP Fund (continued)
Six Months Ended (unaudited) | Year Ended December 31, | |||||||||||||||||||||||
| 2014 | 2013 | 2012 | 2011 | 2010 | ||||||||||||||||||||
| Class 4 | ||||||||||||||||||||||||
| Per share operating performance | ||||||||||||||||||||||||
| (for a share outstanding throughout the period) | ||||||||||||||||||||||||
Net asset value, beginning of period | $24.14 | $27.72 | $21.47 | $20.90 | $21.98 | $17.24 | ||||||||||||||||||
|
| |||||||||||||||||||||||
| Income from investment operationsa: | ||||||||||||||||||||||||
Net investment income (loss)b | (0.06 | ) | (0.16 | ) | (0.17 | ) | (0.09 | )c | (0.12 | ) | (0.07 | ) | ||||||||||||
Net realized and unrealized gains (losses) | 1.85 | 1.98 | 8.01 | 2.24 | (0.96 | ) | 4.81 | |||||||||||||||||
|
| |||||||||||||||||||||||
Total from investment operations | 1.79 | 1.82 | 7.84 | 2.15 | (1.08 | ) | 4.74 | |||||||||||||||||
|
| |||||||||||||||||||||||
Less distributions from net realized gains | (5.83 | ) | (5.40 | ) | (1.59 | ) | (1.58 | ) | — | — | ||||||||||||||
|
| |||||||||||||||||||||||
Net asset value, end of period | $20.10 | $24.14 | $27.72 | $21.47 | $20.90 | $21.98 | ||||||||||||||||||
|
| |||||||||||||||||||||||
Total returnd | 7.20% | 7.39% | 37.99% | 10.79% | (4.91)% | 27.49% | ||||||||||||||||||
| Ratios to average net assetse | ||||||||||||||||||||||||
Expenses | 1.15% | f | 1.15% | f | 1.15% | g | 1.15% | 1.14% | 1.14% | |||||||||||||||
Net investment income (loss) | (0.48)% | (0.64)% | (0.70)% | (0.38)% | c | (0.56)% | (0.42)% | |||||||||||||||||
| Supplemental data | ||||||||||||||||||||||||
Net assets, end of period (000’s) | $17,893 | $16,384 | $19,132 | $12,000 | $12,664 | $15,413 | ||||||||||||||||||
Portfolio turnover rate | 16.96% | 48.73% | 42.77% | 41.44% | 45.00% | 46.69% | ||||||||||||||||||
aThe amount shown for a share outstanding throughout the period may not correlate with the Statement of Operations for the period due to the timing of sales and repurchases of the Fund’s shares in relation to income earned and/or fluctuating fair value of the investments of the Fund.
bBased on average daily shares outstanding.
cNet investment income per share includes approximately $0.03 per share received in the form of special dividends. Excluding these amounts, the ratio of net investment income to average net assets would have been (0.51)%.
dTotal return does not include fees, charges or expenses imposed by the variable annuity and life insurance contracts for which Franklin Templeton Variable Insurance Products Trust serves as an underlying investment vehicle. Total return is not annualized for periods less than one year.
eRatios are annualized for periods less than one year.
fBenefit of waiver and payments by affiliates rounds to less than 0.01%.
gBenefit of expense reduction rounds to less than 0.01%.
| The accompanying notes are an integral part of these financial statements. | Semiannual Report | FSC-9 |
FRANKLIN TEMPLETON VARIABLE INSURANCE PRODUCTS TRUST
Statement of Investments, June 30, 2015 (unaudited)
Franklin Small-Mid Cap Growth VIP Fund
| ||||||||||
| Shares | Value | |||||||||
Common Stocks 98.7% | ||||||||||
Consumer Discretionary 20.7% | ||||||||||
| a | 2U Inc. | 36,049 | $ | 1,160,417 | ||||||
Advance Auto Parts Inc. | 18,700 | 2,978,723 | ||||||||
BorgWarner Inc. | 97,300 | 5,530,532 | ||||||||
| a | Buffalo Wild Wings Inc. | 27,900 | 4,371,651 | |||||||
| a,b | Charter Communications Inc., A | 30,800 | 5,274,500 | |||||||
| a | Chipotle Mexican Grill Inc. | 13,800 | 8,348,862 | |||||||
Dick’s Sporting Goods Inc. | 125,600 | 6,502,312 | ||||||||
| a | Dollar Tree Inc. | 74,800 | 5,908,452 | |||||||
| a,b | Global Eagle Entertainment Inc. | 254,000 | 3,307,080 | |||||||
| a | Grand Canyon Education Inc. | 113,700 | 4,820,880 | |||||||
Hanesbrands Inc. | 150,200 | 5,004,664 | ||||||||
Harman International Industries Inc. | 50,700 | 6,030,258 | ||||||||
| a | IMAX Corp. (Canada) | 103,200 | 4,155,864 | |||||||
| a | Jarden Corp. | 174,650 | 9,038,138 | |||||||
| b | KB Home | 365,400 | 6,065,640 | |||||||
L Brands Inc. | 81,000 | 6,944,130 | ||||||||
Marriott International Inc., A | 109,900 | 8,175,461 | ||||||||
| a | MGM Resorts International | 177,991 | 3,248,336 | |||||||
| a | Netflix Inc. | 11,900 | 7,817,586 | |||||||
Nordstrom Inc. | 84,500 | 6,295,250 | ||||||||
Polaris Industries Inc. | 27,200 | 4,028,592 | ||||||||
| a | Tenneco Inc. | 123,400 | 7,088,096 | |||||||
Tiffany & Co. | 42,100 | 3,864,780 | ||||||||
Tractor Supply Co. | 71,400 | 6,421,716 | ||||||||
| a | Under Armour Inc., A | 67,476 | 5,630,197 | |||||||
Wolverine World Wide Inc. | 126,800 | 3,611,264 | ||||||||
| a,b | Zoe’s Kitchen Inc. | 108,300 | 4,433,802 | |||||||
|
| |||||||||
| 146,057,183 | ||||||||||
|
| |||||||||
Consumer Staples 5.1% | ||||||||||
| a | Boston Beer Inc., A | 22,800 | 5,289,372 | |||||||
Constellation Brands Inc., A | 73,300 | 8,504,266 | ||||||||
| a,b | Freshpet Inc. | 196,800 | 3,660,480 | |||||||
| a | Monster Beverage Corp. | 68,000 | 9,113,360 | |||||||
| a | TreeHouse Foods Inc. | 67,400 | 5,461,422 | |||||||
Whole Foods Market Inc. | 99,600 | 3,928,224 | ||||||||
|
| |||||||||
| 35,957,124 | ||||||||||
|
| |||||||||
Energy 3.9% | ||||||||||
Cabot Oil & Gas Corp., A | 227,200 | 7,165,888 | ||||||||
| a | Concho Resources Inc. | 64,000 | 7,287,040 | |||||||
| a | Diamondback Energy Inc. | 77,100 | 5,811,798 | |||||||
EQT Corp. | 71,700 | 5,832,078 | ||||||||
Oceaneering International Inc. | 39,900 | 1,858,941 | ||||||||
|
| |||||||||
| 27,955,745 | ||||||||||
|
| |||||||||
Financials 6.7% | ||||||||||
| a | Affiliated Managers Group Inc. | 44,000 | 9,618,400 | |||||||
Arthur J. Gallagher & Co. | 91,400 | 4,323,220 | ||||||||
Intercontinental Exchange Inc. | 41,608 | 9,303,965 | ||||||||
Jones Lang LaSalle Inc. | 18,700 | 3,197,700 | ||||||||
Lazard Ltd., A | 126,500 | 7,114,360 | ||||||||
| a | Signature Bank | 65,100 | 9,529,989 | |||||||
| FSC-10 | Semiannual Report |
FRANKLIN TEMPLETON VARIABLE INSURANCE PRODUCTS TRUST
STATEMENT OF INVESTMENTS (UNAUDITED)
Franklin Small-Mid Cap Growth VIP Fund (continued)
| Shares | Value | |||||||||
Common Stocks (continued) | ||||||||||
Financials (continued) | ||||||||||
T. Rowe Price Group Inc. | 52,300 | $ | 4,065,279 | |||||||
|
| |||||||||
| 47,152,913 | ||||||||||
|
| |||||||||
Health Care 20.7% | ||||||||||
| a,b | Aduro Biotech Inc. | 34,900 | 1,058,517 | |||||||
| a,b | Axovant Sciences Ltd. | 71,600 | 1,459,208 | |||||||
| a | BioMarin Pharmaceutical Inc. | 29,000 | 3,966,620 | |||||||
| a | Bluebird Bio Inc. | 8,553 | 1,440,069 | |||||||
| a | Celldex Therapeutics Inc. | 140,700 | 3,548,454 | |||||||
| a | Cerner Corp. | 97,600 | 6,740,256 | |||||||
The Cooper Cos. Inc. | 40,600 | 7,225,582 | ||||||||
| a | DaVita HealthCare Partners Inc. | 81,700 | 6,492,699 | |||||||
DENTSPLY International Inc. | 77,200 | 3,979,660 | ||||||||
| a | DexCom Inc. | 51,600 | 4,126,968 | |||||||
| a | Edwards Lifesciences Corp. | 44,000 | 6,266,920 | |||||||
| a | Envision Healthcare Holdings Inc. | 186,700 | 7,370,916 | |||||||
| a | HCA Holdings Inc. | 79,759 | 7,235,736 | |||||||
| a | HeartWare International Inc. | 21,506 | 1,563,271 | |||||||
| a | Heron Therapeutics Inc. | 86,042 | 2,681,069 | |||||||
| a | HMS Holdings Corp. | 140,913 | 2,419,476 | |||||||
| a | Hologic Inc. | 184,600 | 7,025,876 | |||||||
| a | Illumina Inc. | 26,800 | 5,852,048 | |||||||
| a | Impax Laboratories Inc. | 214,200 | 9,836,064 | |||||||
| a | Incyte Corp. | 36,700 | 3,824,507 | |||||||
| a | Inovalon Holdings Inc., A | 91,092 | 2,541,467 | |||||||
| a | Insulet Corp. | 62,785 | 1,945,393 | |||||||
| a | Karyopharm Therapeutics Inc. | 42,613 | 1,159,500 | |||||||
| a,b | Keryx Biopharmaceuticals Inc. | 68,900 | 687,622 | |||||||
| a | Mettler-Toledo International Inc. | 19,100 | 6,521,886 | |||||||
| a | Nevro Corp. | 29,600 | 1,591,000 | |||||||
Perrigo Co. PLC | 54,985 | 10,162,877 | ||||||||
| a | Pfenex Inc. | 113,500 | 2,201,900 | |||||||
| a | Puma Biotechnology Inc. | 15,125 | 1,765,844 | |||||||
| a | Quintiles Transnational Holdings Inc. | 127,700 | 9,272,297 | |||||||
| a,b | Revance Therapeutics Inc. | 112,300 | 3,591,354 | |||||||
St. Jude Medical Inc. | 78,300 | 5,721,381 | ||||||||
| a | Tandem Diabetes Care Inc. | 147,600 | 1,599,984 | |||||||
| a | Vertex Pharmaceuticals Inc. | 24,800 | 3,062,304 | |||||||
|
| |||||||||
| 145,938,725 | ||||||||||
|
| |||||||||
Industrials 15.3% | ||||||||||
Acuity Brands Inc. | 24,100 | 4,337,518 | ||||||||
| a | The Advisory Board Co. | 90,800 | 4,964,036 | |||||||
Allegiant Travel Co. | 30,292 | 5,388,341 | ||||||||
AMETEK Inc. | 191,200 | 10,473,936 | ||||||||
B/E Aerospace Inc. | 108,300 | 5,945,670 | ||||||||
| a | DigitalGlobe Inc. | 152,100 | 4,226,859 | |||||||
Flowserve Corp. | 99,300 | 5,229,138 | ||||||||
| a | Genesee & Wyoming Inc. | 53,800 | 4,098,484 | |||||||
| a | HD Supply Holdings Inc. | 165,700 | 5,829,326 | |||||||
Hexcel Corp. | 136,800 | 6,804,432 | ||||||||
| a | IHS Inc., A | 70,200 | 9,029,826 | |||||||
| Semiannual Report | FSC-11 |
FRANKLIN TEMPLETON VARIABLE INSURANCE PRODUCTS TRUST
STATEMENT OF INVESTMENTS (UNAUDITED)
Franklin Small-Mid Cap Growth VIP Fund (continued)
| Shares | Value | |||||||||
Common Stocks (continued) | ||||||||||
Industrials (continued) | ||||||||||
J.B. Hunt Transport Services Inc. | 47,300 | $ | 3,882,857 | |||||||
Kansas City Southern | 44,400 | 4,049,280 | ||||||||
Robert Half International Inc. | 141,900 | 7,875,450 | ||||||||
Roper Technologies Inc. | 47,670 | 8,221,168 | ||||||||
| a | Spirit Airlines Inc. | 91,100 | 5,657,310 | |||||||
Towers Watson & Co. | 33,600 | 4,226,880 | ||||||||
| a | WABCO Holdings Inc. | 64,000 | 7,918,080 | |||||||
|
| |||||||||
| 108,158,591 | ||||||||||
|
| |||||||||
Information Technology 22.4% | ||||||||||
| a | Alliance Data Systems Corp. | 10,200 | 2,977,788 | |||||||
| a | ANSYS Inc. | 42,500 | 3,877,700 | |||||||
Applied Materials Inc. | 293,100 | 5,633,382 | ||||||||
Avago Technologies Ltd. (Singapore) | 68,000 | 9,039,240 | ||||||||
| a | Bottomline Technologies Inc. | 106,800 | 2,970,108 | |||||||
Cognex Corp. | 133,400 | 6,416,540 | ||||||||
| a | CoStar Group Inc. | 26,800 | 5,393,768 | |||||||
| a | Demandware Inc. | 49,900 | 3,546,892 | |||||||
| a | Electronic Arts Inc. | 150,100 | 9,981,650 | |||||||
Equinix Inc. | 24,283 | 6,167,882 | ||||||||
Fidelity National Information Services Inc. | 50,772 | 3,137,710 | ||||||||
| a | FleetCor Technologies Inc. | 44,600 | 6,960,276 | |||||||
| a | Fortinet Inc. | 59,100 | 2,442,603 | |||||||
| a | Freescale Semiconductor Ltd. | 131,300 | 5,248,061 | |||||||
| a | GoDaddy Inc., A | 17,700 | 498,963 | |||||||
| a | HomeAway Inc. | 145,000 | 4,512,400 | |||||||
Intersil Corp., A | 394,800 | 4,938,948 | ||||||||
| a | JDS Uniphase Corp. | 355,900 | 4,121,322 | |||||||
Lam Research Corp. | 42,500 | 3,457,375 | ||||||||
| a | LinkedIn Corp., A | 31,000 | 6,405,530 | |||||||
| a | NetSuite Inc. | 31,700 | 2,908,475 | |||||||
| a | NXP Semiconductors NV (Netherlands) | 125,200 | 12,294,640 | |||||||
| a | Palo Alto Networks Inc. | 12,100 | 2,113,870 | |||||||
| a | Pandora Media Inc. | 212,100 | 3,296,034 | |||||||
| a | Red Hat Inc. | 80,900 | 6,142,737 | |||||||
| a | ServiceNow Inc. | 67,300 | 5,001,063 | |||||||
| a | Twitter Inc. | 148,700 | 5,385,914 | |||||||
| a | Vantiv Inc., A | 120,700 | 4,609,533 | |||||||
| a | VeriFone Systems Inc. | 150,500 | 5,110,980 | |||||||
| a | ViaSat Inc. | 106,600 | 6,423,716 | |||||||
| a | Workday Inc. | 35,000 | 2,673,650 | |||||||
| a | Yelp Inc. | 99,500 | 4,281,485 | |||||||
|
| |||||||||
| 157,970,235 | ||||||||||
|
| |||||||||
Materials 3.9% | ||||||||||
| a | Axalta Coating Systems Ltd. | 284,400 | 9,407,952 | |||||||
Cytec Industries Inc. | 129,600 | 7,844,688 | ||||||||
H.B. Fuller Co. | 90,913 | 3,692,886 | ||||||||
Martin Marietta Materials Inc. | 45,800 | 6,481,158 | ||||||||
|
| |||||||||
| 27,426,684 | ||||||||||
|
| |||||||||
Total Common Stocks (Cost $458,523,459) | 696,617,200 | |||||||||
|
| |||||||||
| FSC-12 | Semiannual Report |
FRANKLIN TEMPLETON VARIABLE INSURANCE PRODUCTS TRUST
STATEMENT OF INVESTMENTS (UNAUDITED)
Franklin Small-Mid Cap Growth VIP Fund (continued)
| Shares | Value | |||||||||
Short Term Investments 4.6% | ||||||||||
Money Market Funds (Cost $13,283,487) 1.9% | ||||||||||
| a,c | Institutional Fiduciary Trust Money Market Portfolio | 13,283,487 | $ | 13,283,487 | ||||||
|
| |||||||||
| d | Investments from Cash Collateral Received for Loaned Securities | |||||||||
Money Market Funds 2.7% | ||||||||||
| a,c | Institutional Fiduciary Trust Money Market Portfolio | 19,269,775 | 19,269,775 | |||||||
|
| |||||||||
Total Investments (Cost $491,076,721) 103.3% | 729,170,462 | |||||||||
Other Assets, less Liabilities (3.3)% | (23,313,388 | ) | ||||||||
|
| |||||||||
Net Assets 100.0% | $ | 705,857,074 | ||||||||
|
| |||||||||
aNon-income producing.
bA portion or all of the security is on loan at June 30, 2015. See Note 1(c).
cSee Note 3(e) regarding investments in Institutional Fiduciary Trust Money Market Portfolio.
dSee Note 1(c) regarding securities on loan.
| The accompanying notes are an integral part of these financial statements. | Semiannual Report | FSC-13 |
FRANKLIN TEMPLETON VARIABLE INSURANCE PRODUCTS TRUST
Financial Statements
Statement of Assets and Liabilities
June 30, 2015 (unaudited)
Franklin Small-Mid Cap Growth | ||||
Assets: | ||||
Investments in securities: | ||||
Cost - Unaffiliated issuers | $ | 458,523,459 | ||
Cost - Sweep Money Fund (Note 3e) | 32,553,262 | |||
|
| |||
Total cost of investments | $ | 491,076,721 | ||
|
| |||
Value - Unaffiliated issuers | $ | 696,617,200 | ||
Value - Sweep Money Fund (Note 3e) | 32,553,262 | |||
|
| |||
Total value of investments (includes securities loaned in the amount of $19,030,441) | 729,170,462 | |||
Receivables: | ||||
Capital shares sold | 101,787 | |||
Dividends and interest | 182,803 | |||
Due from custodian | 67,725 | |||
Other assets | 289 | |||
|
| |||
Total assets | 729,523,066 | |||
|
| |||
Liabilities: | ||||
Payables: | ||||
Investment securities purchased | 2,719,691 | |||
Capital shares redeemed | 727,890 | |||
Management fees | 450,583 | |||
Distribution fees | 257,589 | |||
Payable upon return of securities loaned | 19,337,500 | |||
Accrued expenses and other liabilities | 172,739 | |||
|
| |||
Total liabilities | 23,665,992 | |||
|
| |||
Net assets, at value | $ | 705,857,074 | ||
|
| |||
Net assets consist of: | ||||
Paid-in capital | $ | 445,577,837 | ||
Undistributed net investment income (loss) | (1,233,685 | ) | ||
Net unrealized appreciation (depreciation) | 238,093,741 | |||
Accumulated net realized gain (loss) | 23,419,181 | |||
|
| |||
Net assets, at value | $ | 705,857,074 | ||
|
| |||
| Class 1: | ||||
Net assets, at value | $ | 103,200,093 | ||
|
| |||
Shares outstanding | 4,909,779 | |||
|
| |||
Net asset value and maximum offering price per share | $ | 21.02 | ||
|
| |||
| Class 2: | ||||
Net assets, at value | $ | 584,763,773 | ||
|
| |||
Shares outstanding | 29,987,796 | |||
|
| |||
Net asset value and maximum offering price per share | $ | 19.50 | ||
|
| |||
| Class 4: | ||||
Net assets, at value | $ | 17,893,208 | ||
|
| |||
Shares outstanding | 890,035 | |||
|
| |||
Net asset value and maximum offering price per share | $ | 20.10 | ||
|
| |||
| FSC-14 | Semiannual Report | The accompanying notes are an integral part of these financial statements. |
FRANKLIN TEMPLETON VARIABLE INSURANCE PRODUCTS TRUST
FINANCIAL STATEMENTS
Statement of Operations
for the six months ended June 30, 2015 (unaudited)
Franklin Small-Mid Cap Growth | ||||
Investment income: | ||||
Dividends | $ | 1,998,765 | ||
Income from securities loaned | 371,987 | |||
|
| |||
Total investment income | 2,370,752 | |||
|
| |||
Expenses: | ||||
Management fees (Note 3a) | 2,730,937 | |||
Distribution fees: (Note 3c) | ||||
Class 2 | 735,031 | |||
Class 4 | 30,028 | |||
Custodian fees (Note 4) | 3,647 | |||
Reports to shareholders | 86,210 | |||
Professional fees | 23,177 | |||
Trustees’ fees and expenses | 1,528 | |||
Other | 6,652 | |||
|
| |||
Total expenses | 3,617,210 | |||
Expenses waived/paid by affiliates (Note 3e) | (8,781 | ) | ||
|
| |||
Net expenses | 3,608,429 | |||
|
| |||
Net investment income (loss) | (1,237,677 | ) | ||
|
| |||
Realized and unrealized gains (losses): | ||||
Net realized gain (loss) from investments | 24,444,619 | |||
Net change in unrealized appreciation (depreciation) on investments | 27,015,060 | |||
|
| |||
Net realized and unrealized gain (loss) | 51,459,679 | |||
|
| |||
Net increase (decrease) in net assets resulting from operations | $ | 50,222,002 | ||
|
| |||
| The accompanying notes are an integral part of these financial statements. | Semiannual Report | FSC-15 |
FRANKLIN TEMPLETON VARIABLE INSURANCE PRODUCTS TRUST
FINANCIAL STATEMENTS
Statements of Changes in Net Assets
| Franklin Small-Mid Cap Growth VIP Fund | ||||||||
| Six Months Ended June 30, 2015 (unaudited) | Year Ended | |||||||
Increase (decrease) in net assets: | ||||||||
Operations: | ||||||||
Net investment income (loss) | $ | (1,237,677 | ) | $ | (3,724,526 | ) | ||
Net realized gain (loss) | 24,444,619 | 165,568,522 | ||||||
Net change in unrealized appreciation (depreciation) | 27,015,060 | (110,422,791 | ) | |||||
|
| |||||||
Net increase (decrease) in net assets resulting from operations | 50,222,002 | 51,421,205 | ||||||
|
| |||||||
Distributions to shareholders from: | ||||||||
Net realized gains: | ||||||||
Class 1 | (22,509,343 | ) | (18,164,400 | ) | ||||
Class 2 | (135,758,632 | ) | (120,447,127 | ) | ||||
Class 4 | (4,098,814 | ) | (3,536,394 | ) | ||||
|
| |||||||
Total distributions to shareholders | (162,366,789 | ) | (142,147,921 | ) | ||||
|
| |||||||
Capital share transactions: (Note 2) | ||||||||
Class 1 | 18,544,086 | 12,658,981 | ||||||
Class 2 | 96,062,460 | (469,072 | ) | |||||
Class 4 | 4,436,402 | (462,764 | ) | |||||
|
| |||||||
Total capital share transactions | 119,042,948 | 11,727,145 | ||||||
|
| |||||||
Net increase (decrease) in net assets | 6,898,161 | (78,999,571 | ) | |||||
Net assets: | ||||||||
Beginning of period | 698,958,913 | 777,958,484 | ||||||
|
| |||||||
End of period | $ | 705,857,074 | $ | 698,958,913 | ||||
|
| |||||||
Undistributed net investment income (loss) included in net assets: | ||||||||
End of period | $ | (1,233,685 | ) | $ | 3,992 | |||
|
| |||||||
| FSC-16 | Semiannual Report | The accompanying notes are an integral part of these financial statements. |
FRANKLIN TEMPLETON VARIABLE INSURANCE PRODUCTS TRUST
Notes to Financial Statements (unaudited)
Franklin Small-Mid Cap Growth VIP Fund
1. Organization and Significant Accounting Policies
Franklin Templeton Variable Insurance Products Trust (Trust) is registered under the Investment Company Act of 1940 (1940 Act) as an open-end management investment company, consisting of nineteen separate funds and applies the specialized accounting and reporting guidance in U.S. Generally Accepted Accounting Principles (U.S. GAAP). Franklin Small-Mid Cap Growth VIP Fund (Fund) is included in this report. The financial statements of the remaining funds in the Trust are presented separately. Shares of the Fund are generally sold only to insurance company separate accounts to fund the benefits of variable life insurance policies or variable annuity contracts. At June 30, 2015, 40.79% of the Fund’s shares were held through one insurance company. Investment activities of these insurance company separate accounts could have a material impact on the Fund. The Fund offers three classes of shares: Class 1, Class 2 and Class 4. Each class of shares differs by its distribution fees, voting rights on matters affecting a single class and its exchange privilege.
The following summarizes the Fund’s significant accounting policies.
a. Financial Instrument Valuation
The Fund’s investments in financial instruments are carried at fair value daily. Fair value is the price that would be received to sell an asset or paid to transfer a liability in an orderly transaction between market participants on the measurement date. The Fund calculates the net asset value (NAV) per share at the close of the New York Stock Exchange (NYSE), generally at 4 p.m. Eastern time (NYSE close) on each day the NYSE is open for trading. Under compliance policies and procedures approved by the Trust’s Board of Trustees (the Board), the Fund’s administrator has responsibility for oversight of valuation, including leading the cross-functional Valuation and Liquidity Oversight Committee (VLOC). The VLOC provides administration and oversight of the Fund’s valuation policies and procedures, which are approved annually by the Board. Among other things, these procedures allow the Fund to utilize independent pricing services, quotations from securities and financial instrument dealers, and other market sources to determine fair value.
Equity securities listed on an exchange or on the NASDAQ National Market System are valued at the last quoted sale price or the official closing price of the day, respectively. Foreign equity securities are valued as of the close of trading on the
foreign stock exchange on which the security is primarily traded or as of the NYSE close, whichever is earlier. The value is then converted into its U.S. dollar equivalent at the foreign exchange rate in effect at the NYSE close on the day that the value of the security is determined. Over-the-counter (OTC) securities are valued within the range of the most recent quoted bid and ask prices. Securities that trade in multiple markets or on multiple exchanges are valued according to the broadest and most representative market. Certain equity securities are valued based upon fundamental characteristics or relationships to similar securities. Investments in open-end mutual funds are valued at the closing NAV.
The Fund has procedures to determine the fair value of financial instruments for which market prices are not reliable or readily available. Under these procedures, the VLOC convenes on a regular basis to review such financial instruments and considers a number of factors, including significant unobservable valuation inputs, when arriving at fair value. The VLOC primarily employs a market-based approach which may use related or comparable assets or liabilities, recent transactions, market multiples, book values, and other relevant information for the investment to determine the fair value of the investment. An income-based valuation approach may also be used in which the anticipated future cash flows of the investment are discounted to calculate fair value. Discounts may also be applied due to the nature or duration of any restrictions on the disposition of the investments. Due to the inherent uncertainty of valuations of such investments, the fair values may differ significantly from the values that would have been used had an active market existed. The VLOC employs various methods for calibrating these valuation approaches including a regular review of key inputs and assumptions, transactional back-testing or disposition analysis, and reviews of any related market activity.
Trading in securities on foreign securities stock exchanges and OTC markets may be completed before the daily NYSE close. In addition, trading in certain foreign markets may not take place on every NYSE business day. Occasionally, events occur between the time at which trading in a foreign security is completed and the close of the NYSE that might call into question the reliability of the value of a portfolio security held by the Fund. As a result, differences may arise between the value of the Fund’s portfolio securities as determined at the foreign market close and the latest indications of value at the close of the NYSE. In order to minimize the potential for these differences, the VLOC monitors price movements following the close
| Semiannual Report | FSC-17 |
FRANKLIN TEMPLETON VARIABLE INSURANCE PRODUCTS TRUST
NOTES TO FINANCIAL STATEMENTS (UNAUDITED)
Franklin Small-Mid Cap Growth VIP Fund (continued)
1. Organization and Significant Accounting Policies (continued)
a. Financial Instrument Valuation (continued)
of trading in foreign stock markets through a series of country specific market proxies (such as baskets of American Depositary Receipts, futures contracts and exchange traded funds). These price movements are measured against established trigger thresholds for each specific market proxy to assist in determining if an event has occurred that may call into question the reliability of the values of the foreign securities held by the Fund. If such an event occurs, the securities may be valued using fair value procedures, which may include the use of independent pricing services.
When the last day of the reporting period is a non-business day, certain foreign markets may be open on those days that the NYSE is closed, which could result in differences between the value of the Fund’s portfolio securities on the last business day and the last calendar day of the reporting period. Any significant security valuation changes due to an open foreign market are adjusted and reflected by the Fund for financial reporting purposes.
b. Foreign Currency Translation
Portfolio securities and other assets and liabilities denominated in foreign currencies are translated into U.S. dollars based on the exchange rate of such currencies against U.S. dollars on the date of valuation. The Fund may enter into foreign currency exchange contracts to facilitate transactions denominated in a foreign currency. Purchases and sales of securities, income and expense items denominated in foreign currencies are translated into U.S. dollars at the exchange rate in effect on the transaction date. Portfolio securities and assets and liabilities denominated in foreign currencies contain risks that those currencies will decline in value relative to the U.S. dollar. Occasionally, events may impact the availability or reliability of foreign exchange rates used to convert the U.S. dollar equivalent value. If such an event occurs, the foreign exchange rate will be valued at fair value using procedures established and approved by the Board.
The Fund does not separately report the effect of changes in foreign exchange rates from changes in market prices on securities held. Such changes are included in net realized and unrealized gain or loss from investments in the Statement of Operations.
Realized foreign exchange gains or losses arise from sales of foreign currencies, currency gains or losses realized between the trade and settlement dates on securities transactions and the difference between the recorded amounts of dividends, interest, and foreign withholding taxes and the U.S. dollar equivalent of the amounts actually received or paid. Net unrealized foreign exchange gains and losses arise from changes in foreign exchange rates on foreign denominated assets and liabilities other than investments in securities held at the end of the reporting period.
c. Securities Lending
The Fund participates in an agency based securities lending program to earn additional income. The Fund receives cash collateral against the loaned securities in an amount equal to at least 102% of the fair value of the loaned securities. Collateral is maintained over the life of the loan in an amount not less than 100% of the fair value of loaned securities, as determined at the close of fund business each day; any additional collateral required due to changes in security values is delivered to the Fund on the next business day. The collateral is deposited into a joint cash account with other funds and is used to invest in a money market fund managed by Franklin Advisers, Inc., an affiliate of the Fund. The total cash collateral received at period end was $19,337,500, of which $67,725 was uninvested cash included in due from custodian in the Statement of Assets and Liabilities. The Fund may receive income from the investment of cash collateral, in addition to lending fees and rebates paid by the borrower. Income from securities loaned is reported separately in the Statement of Operations. The Fund bears the market risk with respect to the collateral investment, securities loaned, and the risk that the agent may default on its obligations to the Fund. If the borrower defaults on its obligation to return the securities loaned, the Fund has the right to repurchase the securities in the open market using the collateral received. The securities lending agent has agreed to indemnify the Fund in the event of default by a third party borrower.
d. Income and Deferred Taxes
It is the Fund’s policy to qualify as a regulated investment company under the Internal Revenue Code. The Fund intends to distribute to shareholders substantially all of its taxable income and net realized gains to relieve it from federal income and if applicable, excise taxes. As a result, no provision for U.S. federal income taxes is required.
| FSC-18 | Semiannual Report |
FRANKLIN TEMPLETON VARIABLE INSURANCE PRODUCTS TRUST
NOTES TO FINANCIAL STATEMENTS (UNAUDITED)
Franklin Small-Mid Cap Growth VIP Fund (continued)
The Fund may be subject to foreign taxation related to income received, capital gains on the sale of securities and certain foreign currency transactions in the foreign jurisdictions in which it invests. Foreign taxes, if any, are recorded based on the tax regulations and rates that exist in the foreign markets in which the Fund invests. When a capital gain tax is determined to apply, the Fund records an estimated deferred tax liability in an amount that would be payable if the securities were disposed of on the valuation date.
The Fund recognizes the tax benefits of uncertain tax positions only when the position is “more likely than not” to be sustained upon examination by the tax authorities based on the technical merits of the tax position. As of June 30, 2015, and for all open tax years, the Fund has determined that no liability for unrecognized tax benefits is required in the Fund’s financial statements related to uncertain tax positions taken on a tax return (or expected to be taken on future tax returns). Open tax years are those that remain subject to examination and are based on each tax jurisdiction’s statute of limitation.
e. Security Transactions, Investment Income, Expenses and Distributions
Security transactions are accounted for on trade date. Realized gains and losses on security transactions are determined on a specific identification basis. Estimated expenses are accrued daily. Dividend income is recorded on the ex-dividend date except for certain dividends from foreign securities where the dividend rate is not available. In such cases, the dividend is recorded as soon as the information is received by the Fund. Distributions to shareholders are recorded on the ex-dividend date and are determined according to income tax regulations (tax basis). Distributable earnings determined on a tax basis may differ from earnings recorded in accordance with U.S. GAAP. These differences may be permanent or temporary. Permanent
differences are reclassified among capital accounts to reflect their tax character. These reclassifications have no impact on net assets or the results of operations. Temporary differences are not reclassified, as they may reverse in subsequent periods.
Common expenses incurred by the Trust are allocated among the funds based on the ratio of net assets of each fund to the combined net assets of the Trust. Fund specific expenses are charged directly to the fund that incurred the expense.
Realized and unrealized gains and losses and net investment income, not including class specific expenses, are allocated daily to each class of shares based upon the relative proportion of net assets of each class. Differences in per share distributions, by class, are generally due to differences in class specific expenses.
f. Accounting Estimates
The preparation of financial statements in accordance with U.S. GAAP requires management to make estimates and assumptions that affect the reported amounts of assets and liabilities at the date of the financial statements and the amounts of income and expenses during the reporting period. Actual results could differ from those estimates.
g. Guarantees and Indemnifications
Under the Trust’s organizational documents, its officers and trustees are indemnified by the Trust against certain liabilities arising out of the performance of their duties to the Trust. Additionally, in the normal course of business, the Trust, on behalf of the Fund, enters into contracts with service providers that contain general indemnification clauses. The Trust’s maximum exposure under these arrangements is unknown as this would involve future claims that may be made against the Trust that have not yet occurred. Currently, the Trust expects the risk of loss to be remote.
| Semiannual Report | FSC-19 |
FRANKLIN TEMPLETON VARIABLE INSURANCE PRODUCTS TRUST
NOTES TO FINANCIAL STATEMENTS (UNAUDITED)
Franklin Small-Mid Cap Growth VIP Fund (continued)
2. Shares of Beneficial Interest
At June 30, 2015, there were an unlimited number of shares authorized (without par value). Transactions in the Fund’s shares were as follows:
| Six Months Ended June 30, 2015 | Year Ended December 31, 2014 | |||||||||||||||||
| Shares | Amount | Shares | Amount | |||||||||||||||
| Class 1 Shares: | ||||||||||||||||||
Shares sold | 112,358 | $ | 2,922,114 | 274,487 | $ | 7,229,775 | ||||||||||||
Shares issued in reinvestment of distributions | 1,062,262 | 22,509,342 | 759,699 | 18,164,400 | ||||||||||||||
Shares redeemed | (265,033 | ) | (6,887,370 | ) | (487,310 | ) | (12,735,194 | ) | ||||||||||
|
| |||||||||||||||||
Net increase (decrease) | 909,587 | $ | 18,544,086 | 546,876 | $ | 12,658,981 | ||||||||||||
|
| |||||||||||||||||
| Class 2 Shares: | ||||||||||||||||||
Shares sold | 657,872 | $ | 16,268,128 | 897,666 | $ | 22,309,519 | ||||||||||||
Shares issued in reinvestment of distributions | 6,905,322 | 135,758,633 | 5,327,162 | 120,447,127 | ||||||||||||||
Shares redeemed | (2,308,725 | ) | (55,964,301 | ) | (5,821,755 | ) | (143,225,718 | ) | ||||||||||
|
| |||||||||||||||||
Net increase (decrease) | 5,254,469 | $ | 96,062,460 | 403,073 | $ | (469,072 | ) | |||||||||||
|
| |||||||||||||||||
| Class 4 Shares: | ||||||||||||||||||
Shares sold | 101,415 | $ | 2,581,270 | 67,020 | $ | 1,726,663 | ||||||||||||
Shares issued in reinvestment of distributions | 202,211 | 4,098,814 | 152,628 | 3,536,394 | ||||||||||||||
Shares redeemed | (92,389 | ) | (2,243,682 | ) | (231,062 | ) | (5,725,821 | ) | ||||||||||
|
| |||||||||||||||||
Net increase (decrease) | 211,237 | $ | 4,436,402 | (11,414 | ) | $ | (462,764 | ) | ||||||||||
|
| |||||||||||||||||
3. Transactions With Affiliates
Franklin Resources, Inc. is the holding company for various subsidiaries that together are referred to as Franklin Templeton Investments. Certain officers and trustees of the Fund are also officers and/or directors of the following subsidiaries:
| Subsidiary | Affiliation | |
Franklin Advisers, Inc. (Advisers) | Investment manager | |
Franklin Templeton Services, LLC (FT Services) | Administrative manager | |
Franklin Templeton Distributors, Inc. (Distributors) | Principal underwriter | |
Franklin Templeton Investor Services, LLC (Investor Services) | Transfer agent |
a. Management Fees
The Fund pays an investment management fee to Advisers based on the average daily net assets of the Fund as follows:
| Annualized Fee Rate | Net Assets | |
0.800% | Up to and including $500 million | |
0.700% | Over $500 million, up to and including $1 billion | |
0.650% | Over $1 billion, up to and including $1.5 billion | |
0.600% | Over $1.5 billion, up to and including $6.5 billion | |
0.575% | Over $6.5 billion, up to and including $11.5 billion | |
0.550% | Over $11.5 billion, up to and including $16.5 billion | |
0.540% | Over $16.5 billion, up to and including $19 billion |
| FSC-20 | Semiannual Report |
FRANKLIN TEMPLETON VARIABLE INSURANCE PRODUCTS TRUST
NOTES TO FINANCIAL STATEMENTS
Franklin Small-Mid Cap Growth VIP Fund (continued)
| Annualized Fee Rate | Net Assets | |
0.530% | Over $19 billion, up to and including $21.5 billion | |
0.520% | In excess of $21.5 billion |
b. Administrative Fees
Under an agreement with Advisers, FT Services provides administrative services to the Fund. The fee is paid by Advisers based on the Fund’s average daily net assets, and is not an additional expense of the Fund.
c. Distribution Fees
The Board has adopted distribution plans for Class 2 and Class 4 shares pursuant to Rule 12b-1 under the 1940 Act. Under the Fund’s compensation distribution plans, the Fund pays Distributors for costs incurred in connection with the servicing, sale and distribution of the Fund’s shares up to 0.35% per year of its average daily net assets of each class. Some distribution fees are not charged on shares held by affiliates. The Board has agreed to limit the current rate to 0.25% per year for Class 2. The plan year, for purposes of monitoring compliance with the maximum annual plan rates, is February 1 through January 31.
d. Transfer Agent Fees
Investor Services, under terms of an agreement, performs shareholder servicing for the Fund and is not paid by the Fund for the services.
e. Investments in Institutional Fiduciary Trust Money Market Portfolio
The Fund invests in Institutional Fiduciary Trust Money Market Portfolio (Sweep Money Fund), an affiliated open-end management investment company. Management fees paid by the Fund are waived on assets invested in the Sweep Money Fund, as noted in the Statement of Operations, in an amount not to exceed the management and administrative fees paid directly or indirectly by the Sweep Money Fund. Prior to January 1, 2014, the waiver was accounted for as a reduction to management fees.
4. Expense Offset Arrangement
The Fund has entered into an arrangement with its custodian whereby credits realized as a result of uninvested cash balances are used to reduce a portion of the Fund’s custodian expenses. During the period ended June 30, 2015, there were no credits earned.
5. Income Taxes
At June 30, 2015, the cost of investments and net unrealized appreciation (depreciation) for income tax purposes were as follows:
Cost of investments | $ | 492,054,230 | ||
|
| |||
Unrealized appreciation | $ | 247,005,899 | ||
Unrealized depreciation | (9,889,667 | ) | ||
|
| |||
Net unrealized appreciation (depreciation) | $ | 237,116,232 | ||
|
|
Differences between income and/or capital gains as determined on a book basis and a tax basis are primarily due to differing treatments of wash sales.
6. Investment Transactions
Purchases and sales of investments (excluding short term securities) for the period ended June 30, 2015, aggregated $118,691,233 and $162,095,021, respectively.
| Semiannual Report | FSC-21 |
FRANKLIN TEMPLETON VARIABLE INSURANCE PRODUCTS TRUST
NOTES TO FINANCIAL STATEMENTS (UNAUDITED)
Franklin Small-Mid Cap Growth VIP Fund (continued)
7. Credit Facility
The Fund, together with other U.S. registered and foreign investment funds (collectively, Borrowers), managed by Franklin Templeton Investments, are borrowers in a joint syndicated senior unsecured credit facility totaling $2 billion (Global Credit Facility) which matures on February 12, 2016. This Global Credit Facility provides a source of funds to the Borrowers for temporary and emergency purposes, including the ability to meet future unanticipated or unusually large redemption requests.
Under the terms of the Global Credit Facility, the Fund shall, in addition to interest charged on any borrowings made by the Fund and other costs incurred by the Fund, pay its share of fees and expenses incurred in connection with the implementation and maintenance of the Global Credit Facility, based upon its relative share of the aggregate net assets of all of the Borrowers, including an annual commitment fee of 0.07% based upon the unused portion of the Global Credit Facility. These fees are reflected in other expenses in the Statement of Operations. During the period ended June 30, 2015, the Fund did not use the Global Credit Facility.
8. Fair Value Measurements
The Fund follows a fair value hierarchy that distinguishes between market data obtained from independent sources (observable inputs) and the Fund’s own market assumptions (unobservable inputs). These inputs are used in determining the value of the Fund’s financial instruments and are summarized in the following fair value hierarchy:
| • | Level 1 – quoted prices in active markets for identical financial instruments |
| • | Level 2 – other significant observable inputs (including quoted prices for similar financial instruments, interest rates, prepayment speed, credit risk, etc.) |
| • | Level 3 – significant unobservable inputs (including the Fund’s own assumptions in determining the fair value of financial instruments) |
The input levels are not necessarily an indication of the risk or liquidity associated with financial instruments at that level.
For movements between the levels within the fair value hierarchy, the Fund has adopted a policy of recognizing the transfers as of the date of the underlying event which caused the movement.
A summary of inputs used as of June 30, 2015, in valuing the Fund’s assets carried at fair value, is as follows:
| Level 1 | Level 2 | Level 3 | Total | |||||||||||||
| Assets: | ||||||||||||||||
Investments in Securities | ||||||||||||||||
Equity Investmentsa | $ | 696,617,200 | $ | — | $ | — | $ | 696,617,200 | ||||||||
Short Term Investments | 32,553,262 | — | — | 32,553,262 | ||||||||||||
|
| |||||||||||||||
Total Investments in Securities | $ | 729,170,462 | $ | — | $ | — | $ | 729,170,462 | ||||||||
|
| |||||||||||||||
aFor detailed categories, see the accompanying Statement of Investments.
9. New Accounting Pronouncements
In June 2014, the Financial Accounting Standards Board issued Accounting Standards Update (ASU) No. 2014-11, Transfers and Servicing (Topic 860), Repurchase-to-Maturity Transactions, Repurchase Financings, and Disclosures. The ASU changes the accounting for certain repurchase agreements and expands disclosure requirements related to repurchase agreements, securities lending, repurchase-tomaturity and similar transactions. The ASU is effective for certain transactions accounted for as a sale for interim and annual reporting periods beginning after December 15, 2014, and transactions accounted for as secured borrowings for annual periods beginning after December 15, 2014, and for interim periods beginning after March 15, 2015. Management has reviewed the requirements and believes the adoption of this ASU will not have a material impact on the financial statements.
| FSC-22 | Semiannual Report |
FRANKLIN TEMPLETON VARIABLE INSURANCE PRODUCTS TRUST
NOTES TO FINANCIAL STATEMENTS (UNAUDITED)
Franklin Small-Mid Cap Growth VIP Fund (continued)
10. Subsequent Events
The Fund has evaluated subsequent events through the issuance of the financial statements and determined that no events have occurred that require disclosure.
| Semiannual Report | FSC-23 |
Franklin Strategic Income VIP Fund
This semiannual report for Franklin Strategic Income VIP Fund covers the period ended June 30, 2015.
Class 1 Performance Summary as of June 30, 2015
The Fund’s Class 1 shares delivered a +0.58% total return* for the six-month period ended June 30, 2015.
*The Fund has a fee waiver associated with any investment in a Franklin Templeton money fund, contractually guaranteed through at least its current fiscal year-end. Fund investment results reflect the fee waiver, to the extent applicable; without this reduction, the results would have been lower.
Performance reflects the Fund’s Class 1 operating expenses, but does not include any contract fees, expenses or sales charges. If they had been included, performance would be lower. These charges and deductions, particularly for variable life policies, can have a significant effect on contract values and insurance benefits. See the contract prospectus for a complete description of these expenses, including sales charges.
Performance data represent past performance, which does not guarantee future results. Investment return and principal value will fluctuate, and you may have a gain or loss when you sell your shares. Current performance may differ from figures shown.
| Semiannual Report | FSI-1 |
FRANKLIN STRATEGIC INCOME VIP FUND
Fund Goals and Main Investments
Franklin Strategic Income VIP Fund seeks a high level of current income, with capital appreciation over the long term as a secondary goal. Under normal market conditions, the Fund invests primarily to predominantly in U.S. and foreign debt securities, including those in emerging markets.
Fund Risks
All investments involve risks, including possible loss of principal. Bond prices generally move in the opposite direction of interest rates. Thus, as prices of bonds in the Fund adjust to a rise in interest rates, the Fund’s share price may decline. Changes in the financial strength of a bond issuer or in a bond’s credit rating may affect its value. High yields reflect the higher credit risks associated with certain lower rated securities held in the portfolio. Floating rate loans and high yield corporate bonds are rated below investment grade and are subject to greater risk of default, which could result in loss of principal — a risk that may be heightened in a slowing economy. The risks of foreign securities include currency fluctuations and political uncertainty. Investments in developing markets involve heightened risks related to the same factors, in addition to those associated with their relatively small size and lesser liquidity. Investing in derivative securities and the use of foreign currency techniques involve special risks as such may not achieve the anticipated benefits and/or may result in losses to the Fund. The Fund is actively managed but there is no guarantee that the manager’s investment decisions will produce the desired results. The Fund’s prospectus also includes a description of the main investment risks.
Performance Overview
You can find the Fund’s six-month total return in the Performance Summary. For comparison, the Fund’s benchmark, the Barclays U.S. Aggregate Bond Index, had a -0.10% total return for the period under review.1 The Fund’s peers, as measured by the Lipper Multi-Sector Income Funds Classification Average, produced a +1.04% return.2
Economic and Market Overview
U.S. economic growth was mixed during the six-months under review. In 2015’s first quarter, U.S. dollar strength, low energy prices and a labor dispute at West Coast ports led exports to
decline. Lower business investment and state and local government spending also weighed on the economy, while increases in consumer spending, residential investment and private inventory investment offered some support. In the second quarter, business capital spending rebounded and manufacturing and non-manufacturing activities increased, contributing to strong job gains that helped the unemployment rate decline from 5.6% in December 2014 to 5.3% in June 2015.3 Housing market data were generally encouraging as home sales and prices rose. After a brief, winter slump, retail sales rebounded in the spring as strong employment gains led to broad-based improvement, especially for auto and gasoline sales. Inflation, as measured by the Consumer Price Index, rose during the six months amid generally higher energy prices bouncing from recent lows.
During the six-month period, the Federal Reserve Board (Fed) kept its target interest rate at 0%–0.25% while considering when an increase might be appropriate. The Fed anticipated raising its target rate when it saw further labor market progress and was reasonably confident that inflation would move back to 2% over the medium term. In its June meeting, the Fed lowered its 2015 economic growth forecast and raised unemployment estimates given the weak start to the year.
The 10-year Treasury yield, which moves inversely to price, declined from 2.17% at the start of the period to a six-month low of 1.68% in early February as investors sought less risky assets given concerns about soft domestic data, Greece’s debt negotiations, less robust growth in China and the Fed’s cautious tone on raising interest rates. At period-end, the yield rose to 2.35% based partly on upbeat domestic and eurozone economic data and expectations of an agreement between Greece and its international creditors.
Yields generally increased across much of Europe, Asia and the Americas, though select markets experienced a decline in yields. The U.S. dollar broadly strengthened against most
developed and emerging market currencies over the period. The European Central Bank’s asset purchases could keep interest rates low and put further downward pressure on the euro, which depreciated against the U.S. dollar during the period. Japan remained heavily indebted and has become reliant on its central bank as the buyer of last resort for its debt financing. Although Japan’s quantitative easing measures have been positive for global risk assets, we think they are likely to contribute to further yen depreciation.
1. Source: Morningstar.
2. Source: Lipper, a Thomson Reuters Company.
One cannot invest directly in an index, and an index is not representative of the Fund’s portfolio. Please see Index Descriptions following the Fund Summaries.
3. Source: Bureau of Labor Statistics.
| FSI-2 | Semiannual Report |
FRANKLIN STRATEGIC INCOME VIP FUND
Investment Strategy
We allocate our investments among the various types of debt available based on our assessment of changing economic, global market, industry and issuer conditions. We use a top-down analysis of macroeconomic trends, combined with a bottom-up fundamental analysis of market sectors, industries and issuers, seeking to take advantage of varying sector reactions to economic events. For example, we may evaluate business cycles, yield curves, country risk, and the relative interest rates among currencies, and values between and within markets. In selecting debt securities, we generally conduct our own analysis of the security’s intrinsic value rather than simply relying on the coupon rate or rating. We may also enter into various transactions involving certain currency-, interest rate- or credit-related derivative instruments.
Manager’s Discussion
During the first half of 2015, the global fixed income markets were impacted by two broad themes: Treasury yield volatility and a strengthening U.S. dollar. A combination of relatively tepid global economic growth combined with quantitative easing (QE) measures implemented in the eurozone and Japan caused longer term interest rates in many developed markets to decline at the start of the period. However, although Europe and Japan engaged in forms of QE, the U.S. discontinued incremental QE and guided the market toward an expectation of likely increases in the short-term federal funds target rate. As a result, the U.S. dollar experienced broad strengthening over the past six months. Moreover, with some early signs of growth in the European economy combined with the expectation for short-term rate increases in the U.S. by year-end, government yield curves rose during the second half of the period. Overall for the six-month period, the 10-year U.S. Treasury yield climbed from 2.17% to 2.35%. By way of comparison, after falling below 0.2% in April, the 10-year German government bond yield jumped to 0.8% by the end of June. Although concerns regarding Greece’s fate in the eurozone and the outlook for Chinese economic growth negatively impacted financial markets toward period-end, equity markets were still able to generate a positive total return over the past six months, with the Standard & Poor’s® 500 Index rising 1.23%.1
The Fund posted a slightly positive total return for the review period. Fund returns outperformed the Barclays U.S. Aggregate Bond Index, as the Aggregate Index’s longer rate duration caused that benchmark to generate a negative total return as U.S. interest rates rose. Conversely, the Fund’s exposure to global non-dollar bonds detracted from returns given U.S. dollar strength, even as the Fund’s short positions in the euro and yen, achieved through currency forwards, added to returns, as both
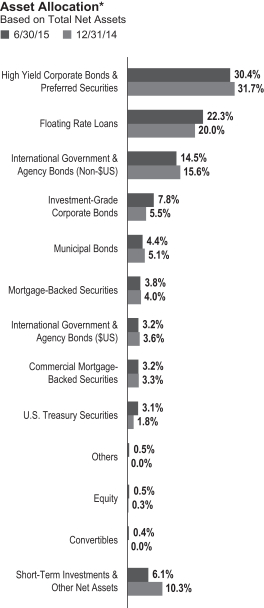
*Figures reflect certain derivatives held in the portfolio (or their underlying reference assets) and may not total 100% or may be negative due to rounding, use of any derivatives, unsettled trades or other factors. The breakdown may not match the Statement of Investments (SOI).
The dollar value, number of shares or principal amount, and names of all portfolio holdings are listed in the Fund’s SOI.
currencies weakened compared to the U.S. dollar. Also, the Fund’s municipal bond position suffered from a longer maturity profile in a period of rising rates, as well as from holdings in Puerto Rico. Finally, within the Fund’s high yield exposure, select holdings in the energy and mining sectors also declined as a result of a weak commodity price environment. Overall, the Fund lagged the performance of the Lipper Multi-Sector Income Funds peer group during the six-month period.
| Semiannual Report | FSI-3 |
FRANKLIN STRATEGIC INCOME VIP FUND
What is duration?
Duration is a measure of a bond’s price sensitivity to interest rate changes. In general, a portfolio of securities with a lower duration can be expected to be less sensitive to interest rate changes than a portfolio with a higher duration.
What is a currency forward contract?
A currency forward contract, or a currency forward, is an agreement between the Fund and a counterparty to buy or sell a foreign currency at a specific exchange rate on a future date.
In the corporate sectors, U.S. dollar strength along with a significant decline in energy-related profitability due to lower commodity prices negatively impacted first-quarter 2015 earnings generally. Investors also seemed to expect commodity prices to similarly constrain second-quarter operating results. However, default rates in the high yield market remained below historical averages, and corporate liquidity was generally still robust given refinancing activity over the past several years, which lowered interest costs and, in many cases, boosted cash balances. Although many senior management teams remained focused on shareholder-friendly activities such as stock buybacks, dividends and mergers and acquisitions, following the financial crisis we believe there continued to be a greater focus on prudent balance sheet management. Overall, the high yield market’s lesser sensitivity to interest rates allowed it to post a positive return during the period, although prices for certain commodity-related issues were still under pressure. We slightly reduced the Fund’s exposure to high yield in favor of leveraged bank loans, given favorable credit fundamentals for loans as well as the senior secured nature of loans and their ultimate floating rate characteristics. We also increased exposure to investment-grade corporate bonds, considering their higher quality and what we deemed more attractive yields due to the rise in the U.S. Treasury yield curve and an increase in spreads over U.S. Treasuries for that sector.
What is the yield curve?
The yield curve is a line that plots the interest rates, at a set point in time, of bonds having equal credit quality but differing maturity rates. The most frequently reported yield curve compares three-month, two-year and 30-year U.S. Treasury debt.
Outside the U.S., the strong U.S. dollar negatively impacted non-dollar global bond positions. The Fund further reduced its exposure to global government bonds during the period, but it was still hampered by its remaining non-dollar holdings. Conversely, the Fund’s net short positions in the yen and the euro, achieved through currency forwards, helped support performance given the decline in those currencies over the past
six months. The Fund maintained a fairly modest exposure to hard currency emerging market bonds.
With the rise in longer term U.S. interest rates, the more rate-sensitive fixed income sectors, such as Treasuries, agencies and mortgage-backed securities, generally posted flat total returns during the period. The Fund maintained a lower exposure to these sectors, preferring higher income opportunities in the corporate credit markets.
Higher longer term U.S. interest rates negatively impacted the generally longer duration municipal bond sector. In addition, concerns regarding Puerto Rico’s debt burden as well as the U.S. commonwealth’s prospective treatment of certain municipal obligations in a restructuring scenario pressured select issues. The Fund held a somewhat modest exposure to municipal bonds at period-end but would look for additional investment opportunities if price volatility continues.
The portfolio utilized derivatives, including currency forwards and credit derivatives. Currency forwards are typically used to take long and short positions in currencies and as a tool to hedge currency risk. Credit derivatives can be used to hedge against credit risk or to otherwise enhance Fund returns by taking long or short positions in individual credits or baskets of credits in various sectors including in the corporate, municipal, sovereign and securitized markets.
What is a credit derivative?
A credit derivative is a contract agreement between the Fund and a counterparty that is principally used by the Fund to gain or increase exposure to certain high yield securities or segments of the high yield bond market and/or to hedge against credit risk.
Thank you for your participation in Franklin Strategic Income VIP Fund. We look forward to serving your future investment needs.
The foregoing information reflects our analysis, opinions and portfolio holdings as of June 30, 2015, the end of the reporting period. The way we implement our main investment strategies and the resulting portfolio holdings may change depending on factors such as market and economic conditions. These opinions may not be relied upon as investment advice or an offer for a particular security. The information is not a complete analysis of every aspect of any market, country, industry, security or the Fund. Statements of fact are from sources considered reliable, but the investment manager makes no representation or warranty as to their completeness or accuracy. Although historical performance is no guarantee of future results, these insights may help you understand our investment management philosophy.
| FSI-4 | Semiannual Report |
FRANKLIN STRATEGIC INCOME VIP FUND
Class 1 Fund Expenses
As an investor in a variable insurance contract (Contract) that indirectly provides for investment in an underlying mutual fund, you can incur transaction and/or ongoing expenses at both the Fund level and the Contract level.
| • | Transaction expenses can include sales charges (loads) on purchases, surrender fees, transfer fees and premium taxes. |
| • | Ongoing expenses can include management fees, distribution and service (12b-1) fees, contract fees, annual maintenance fees, mortality and expense risk fees and other fees and expenses. All mutual funds and Contracts have some types of ongoing expenses. |
The expenses shown in the table are meant to highlight ongoing expenses at the Fund level only and do not include ongoing expenses at the Contract level, or transaction expenses at either the Fund or Contract levels. While the Fund does not have transaction expenses, if the transaction and ongoing expenses at the Contract level were included, the expenses shown below would be higher. You should consult your Contract prospectus or disclosure document for more information.
The table shows Fund-level ongoing expenses and can help you understand these expenses and compare them with those of other mutual funds offered through the Contract. The table assumes a $1,000 investment held for the six months indicated. Please refer to the Fund prospectus for additional information on operating expenses.
Actual Fund Expenses
The first line (Actual) of the table provides actual account values and expenses. The “Ending Account Value” is derived from the Fund’s actual return, which includes the effect of ongoing Fund expenses, but does not include the effect of ongoing Contract expenses.
You can estimate the Fund-level expenses you incurred during the period by following these steps. Of course, your account value and expenses will differ from those in this illustration:
| 1. | Divide your account value by $1,000. |
If an account had an $8,600 value, then $8,600 ÷ $1,000 = 8.6.
| 2. | Multiply the result by the number under the heading “Fund-Level Expenses Incurred During Period.” |
If Fund-Level Expenses Incurred During Period were $7.50, then 8.6 × $7.50 = $64.50.
In this illustration, the estimated expenses incurred this period at the Fund level are $64.50.
Hypothetical Example for Comparison with Other Mutual Funds
Information in the second line (Hypothetical) of the table can help you compare ongoing expenses of the Fund with those of other mutual funds offered through the Contract. This information may not be used to estimate the actual ending account balance or expenses you incurred during the period. The hypothetical “Ending Account Value” is based on the Fund’s actual expense ratio and an assumed 5% annual rate of return before expenses, which does not represent the Fund’s actual return. The figure under the heading “Fund-Level Expenses Incurred During Period” shows the hypothetical expenses your account would have incurred under this scenario. You can compare this figure with the 5% hypothetical examples that appear in shareholder reports of other funds offered through a Contract.
| Class 1 | Beginning Account Value 1/1/15 | Ending Account Value 6/30/15 | Fund-Level Expenses Incurred During Period* 1/1/15–6/30/15 | |||||||||
Actual | $1,000 | $1,005.80 | $3.08 | |||||||||
Hypothetical (5% return before expenses) | $1,000 | $1,021.72 | $3.11 | |||||||||
*Expenses are calculated using the most recent six-month annualized expense ratio, net of expense waivers, for the Fund’s Class 1 shares (0.62%), which does not include any ongoing expenses of the Contract for which the Fund is an investment option, multiplied by the average account value over the period, multiplied by 181/365 to reflect the one-half year period.
| Semiannual Report | FSI-5 |
FRANKLIN TEMPLETON VARIABLE INSURANCE PRODUCTS TRUST
Financial Highlights
Franklin Strategic Income VIP Fund
Six Months Ended (unaudited) | Year Ended December 31, | |||||||||||||||||||||||
| 2014 | 2013 | 2012 | 2011 | 2010 | ||||||||||||||||||||
| Class 1 | ||||||||||||||||||||||||
| Per share operating performance (for a share outstanding throughout the period) | ||||||||||||||||||||||||
Net asset value, beginning of period | $11.90 | $12.64 | $13.17 | $12.55 | $12.99 | $12.28 | ||||||||||||||||||
|
| |||||||||||||||||||||||
| Income from investment operationsa: | ||||||||||||||||||||||||
Net investment incomeb | 0.27 | 0.54 | 0.59 | 0.65 | 0.69 | 0.72 | ||||||||||||||||||
Net realized and unrealized gains (losses) | (0.19 | ) | (0.25 | ) | (0.15 | ) | 0.92 | (0.32 | ) | 0.61 | ||||||||||||||
|
| |||||||||||||||||||||||
Total from investment operations | 0.08 | 0.29 | 0.44 | 1.57 | 0.37 | 1.33 | ||||||||||||||||||
|
| |||||||||||||||||||||||
| Less distributions from: | ||||||||||||||||||||||||
Net investment income and net foreign currency gains | (0.77 | ) | (0.78 | ) | (0.80 | ) | (0.93 | ) | (0.81 | ) | (0.62 | ) | ||||||||||||
Net realized gains | (0.20 | ) | (0.25 | ) | (0.17 | ) | (0.02 | ) | — | — | ||||||||||||||
|
| |||||||||||||||||||||||
Total distributions | (0.97 | ) | (1.03 | ) | (0.97 | ) | (0.95 | ) | (0.81 | ) | (0.62 | ) | ||||||||||||
|
| |||||||||||||||||||||||
Net asset value, end of period | $11.01 | $11.90 | $12.64 | $13.17 | $12.55 | $12.99 | ||||||||||||||||||
|
| |||||||||||||||||||||||
Total returnc | 0.58% | 2.12% | 3.52% | 13.12% | 2.78% | 11.21% | ||||||||||||||||||
| Ratios to average net assetsd | ||||||||||||||||||||||||
Expenses before waiver and payments by affiliates | 0.63% | 0.63% | 0.60% | 0.58% | 0.60% | 0.59% | ||||||||||||||||||
Expenses net of waiver and payments by affiliates | 0.62% | e | 0.62% | e | 0.60% | e | 0.58% | 0.60% | e | 0.59% | e | |||||||||||||
Net investment income | 4.59% | 4.34% | 4.58% | 5.04% | 5.36% | 5.71% | ||||||||||||||||||
| Supplemental data | ||||||||||||||||||||||||
Net assets, end of period (000’s) | $513,236 | $574,850 | $705,493 | $1,019,537 | $1,043,690 | $1,195,149 | ||||||||||||||||||
Portfolio turnover rate | 52.59% | 55.64% | 48.06% | 49.98% | 55.65% | 56.46% | ||||||||||||||||||
Portfolio turnover rate excluding mortgage dollar rollsf | 30.93% | 48.86% | 47.01% | 48.75% | 55.65% | 56.46% | ||||||||||||||||||
aThe amount shown for a share outstanding throughout the period may not correlate with the Statement of Operations for the period due to the timing of sales and repurchases of the Fund’s shares in relation to income earned and/or fluctuating fair value of the investments of the Fund.
bBased on average daily shares outstanding.
cTotal return does not include fees, charges or expenses imposed by the variable annuity and life insurance contracts for which Franklin Templeton Variable Insurance Products Trust serves as an underlying investment vehicle. Total return is not annualized for periods less than one year.
dRatios are annualized for periods less than one year.
eBenefit of expense reduction rounds to less than 0.01%.
fSee Note 1(h) regarding mortgage dollar rolls.
| FSI-6 | Semiannual Report | The accompanying notes are an integral part of these financial statements. |
FRANKLIN TEMPLETON VARIABLE INSURANCE PRODUCTS TRUST
FINANCIAL HIGHLIGHTS
Franklin Strategic Income VIP Fund (continued)
Six Months Ended June 30, 2015 (unaudited) | Year Ended December 31, | |||||||||||||||||||||||
| 2014 | 2013 | 2012 | 2011 | 2010 | ||||||||||||||||||||
| Class 2 | ||||||||||||||||||||||||
| Per share operating performance (for a share outstanding throughout the period) | ||||||||||||||||||||||||
Net asset value, beginning of period | $11.55 | $12.30 | $12.84 | $12.27 | $12.72 | $12.05 | ||||||||||||||||||
|
| |||||||||||||||||||||||
| Income from investment operationsa: | ||||||||||||||||||||||||
Net investment incomeb | 0.25 | 0.49 | 0.54 | 0.60 | 0.64 | 0.68 | ||||||||||||||||||
Net realized and unrealized gains (losses) | (0.19 | ) | (0.24 | ) | (0.13 | ) | 0.89 | (0.30 | ) | 0.59 | ||||||||||||||
|
| |||||||||||||||||||||||
Total from investment operations | 0.06 | 0.25 | 0.41 | 1.49 | 0.34 | 1.27 | ||||||||||||||||||
|
| |||||||||||||||||||||||
| Less distributions from: | ||||||||||||||||||||||||
Net investment income and net foreign currency gains | (0.74 | ) | (0.75 | ) | (0.78 | ) | (0.90 | ) | (0.79 | ) | (0.60 | ) | ||||||||||||
Net realized gains | (0.20 | ) | (0.25 | ) | (0.17 | ) | (0.02 | ) | — | — | ||||||||||||||
|
| |||||||||||||||||||||||
Total distributions | (0.94 | ) | (1.00 | ) | (0.95 | ) | (0.92 | ) | (0.79 | ) | (0.60 | ) | ||||||||||||
|
| |||||||||||||||||||||||
Net asset value, end of period | $10.67 | $11.55 | $12.30 | $12.84 | $12.27 | $12.72 | ||||||||||||||||||
|
| |||||||||||||||||||||||
Total returnc | 0.46% | 1.86% | 3.32% | 12.75% | 2.57% | 10.91% | ||||||||||||||||||
| Ratios to average net assetsd | ||||||||||||||||||||||||
Expenses before waiver and payments by affiliates | 0.88% | 0.88% | 0.85% | 0.83% | 0.85% | 0.84% | ||||||||||||||||||
Expenses net of waiver and payments by affiliates | 0.87% | e | 0.87% | e | 0.85% | e | 0.83% | 0.85% | e | 0.84% | e | |||||||||||||
Net investment income | 4.34% | 4.09% | �� | 4.33% | 4.79% | 5.11% | 5.46% | |||||||||||||||||
| Supplemental data | ||||||||||||||||||||||||
Net assets, end of period (000’s) | $214,326 | $206,571 | $175,307 | $158,451 | $123,749 | $101,347 | ||||||||||||||||||
Portfolio turnover rate | 52.59% | 55.64% | 48.06% | 49.98% | 55.65% | 56.46% | ||||||||||||||||||
Portfolio turnover rate excluding mortgage dollar rollsf | 30.93% | 48.86% | 47.01% | 48.75% | 55.65% | 56.46% | ||||||||||||||||||
aThe amount shown for a share outstanding throughout the period may not correlate with the Statement of Operations for the period due to the timing of sales and repurchases of the Fund’s shares in relation to income earned and/or fluctuating fair value of the investments of the Fund.
bBased on average daily shares outstanding.
cTotal return does not include fees, charges or expenses imposed by the variable annuity and life insurance contracts for which Franklin Templeton Variable Insurance Products Trust serves as an underlying investment vehicle. Total return is not annualized for periods less than one year.
dRatios are annualized for periods less than one year.
eBenefit of expense reduction rounds to less than 0.01%.
fSee Note 1(h) regarding mortgage dollar rolls.
| The accompanying notes are an integral part of these financial statements. | Semiannual Report | FSI-7 |
FRANKLIN TEMPLETON VARIABLE INSURANCE PRODUCTS TRUST
FINANCIAL HIGHLIGHTS
Franklin Strategic Income VIP Fund (continued)
Six Months Ended (unaudited) | Year Ended December 31, | |||||||||||||||||||||||
| 2014 | 2013 | 2012 | 2011 | 2010 | ||||||||||||||||||||
| Class 4 | ||||||||||||||||||||||||
| Per share operating performance (for a share outstanding throughout the period) | ||||||||||||||||||||||||
Net asset value, beginning of period | $11.78 | $12.51 | $13.04 | $12.44 | $12.88 | $12.20 | ||||||||||||||||||
|
| |||||||||||||||||||||||
| Income from investment operationsa: | ||||||||||||||||||||||||
Net investment incomeb | 0.25 | 0.49 | 0.54 | 0.60 | 0.64 | 0.67 | ||||||||||||||||||
Net realized and unrealized gains (losses) | (0.19 | ) | (0.25 | ) | (0.14 | ) | 0.91 | (0.31 | ) | 0.60 | ||||||||||||||
|
| |||||||||||||||||||||||
Total from investment operations | 0.06 | 0.24 | 0.40 | 1.51 | 0.33 | 1.27 | ||||||||||||||||||
|
| |||||||||||||||||||||||
| Less distributions from: | ||||||||||||||||||||||||
Net investment income and net foreign currency gains | (0.72 | ) | (0.72 | ) | (0.76 | ) | (0.89 | ) | (0.77 | ) | (0.59 | ) | ||||||||||||
Net realized gains | (0.20 | ) | (0.25 | ) | (0.17 | ) | (0.02 | ) | — | — | ||||||||||||||
|
| |||||||||||||||||||||||
Total distributions | (0.92 | ) | (0.97 | ) | (0.93 | ) | (0.91 | ) | (0.77 | ) | (0.59 | ) | ||||||||||||
|
| |||||||||||||||||||||||
Net asset value, end of period | $10.92 | $11.78 | $12.51 | $13.04 | $12.44 | $12.88 | ||||||||||||||||||
|
| |||||||||||||||||||||||
Total returnc | 0.44% | 1.75% | 3.17% | 12.67% | 2.46% | 10.88% | ||||||||||||||||||
| Ratios to average net assetsd | ||||||||||||||||||||||||
Expenses before waiver and payments by affiliates | 0.98% | 0.98% | 0.95% | 0.93% | 0.95% | 0.94% | ||||||||||||||||||
Expenses net of waiver and payments by affiliates | 0.97% | e | 0.97% | e | 0.95% | e | 0.93% | 0.95% | e | 0.94% | e | |||||||||||||
Net investment income | 4.24% | 3.99% | 4.23% | 4.69% | 5.01% | 5.36% | ||||||||||||||||||
| Supplemental data | ||||||||||||||||||||||||
Net assets, end of period (000’s) | $110,238 | $113,986 | $134,970 | $196,479 | $188,786 | $188,178 | ||||||||||||||||||
Portfolio turnover rate | 52.59% | 55.64% | 48.06% | 49.98% | 55.65% | 56.46% | ||||||||||||||||||
Portfolio turnover rate excluding mortgage dollar rollsf | 30.93% | 48.86% | 47.01% | 48.75% | 55.65% | 56.46% | ||||||||||||||||||
aThe amount shown for a share outstanding throughout the period may not correlate with the Statement of Operations for the period due to the timing of sales and repurchases of the Fund’s shares in relation to income earned and/or fluctuating fair value of the investments of the Fund.
bBased on average daily shares outstanding.
cTotal return does not include fees, charges or expenses imposed by the variable annuity and life insurance contracts for which Franklin Templeton Variable Insurance Products Trust serves as an underlying investment vehicle. Total return is not annualized for periods less than one year.
dRatios are annualized for periods less than one year.
eBenefit of expense reduction rounds to less than 0.01%.
fSee Note 1(h) regarding mortgage dollar rolls.
| FSI-8 | Semiannual Report | The accompanying notes are an integral part of these financial statements. |
FRANKLIN TEMPLETON VARIABLE INSURANCE PRODUCTS TRUST
Statement of Investments, June 30, 2015 (unaudited)
Franklin Strategic Income VIP Fund
| ||||||||||||||
| Country | Shares | Value | ||||||||||||
Common Stocks 0.5% | ||||||||||||||
Consumer Services 0.5% | ||||||||||||||
| a,b,c | Turtle Bay Resort | United States | 1,901,449 | $ | 3,788,636 | |||||||||
|
| |||||||||||||
Materials 0.0%† | ||||||||||||||
| a | Verso Corp. | United States | 9,431 | 6,225 | ||||||||||
|
| |||||||||||||
Transportation 0.0%† | ||||||||||||||
| a | CEVA Holdings LLC | United Kingdom | 224 | 165,967 | ||||||||||
|
| |||||||||||||
Total Common Stocks (Cost $2,532,467) | 3,960,828 | |||||||||||||
|
| |||||||||||||
Convertible Preferred Stocks 0.0%† | ||||||||||||||
Transportation 0.0%† | ||||||||||||||
| a | CEVA Holdings LLC, cvt. pfd., A-1 | United Kingdom | 6 | 6,000 | ||||||||||
| a | CEVA Holdings LLC, cvt. pfd., A-2 | United Kingdom | 486 | 359,277 | ||||||||||
|
| |||||||||||||
Total Convertible Preferred Stocks (Cost $731,856) | 365,277 | |||||||||||||
|
| |||||||||||||
| Principal Amount* | ||||||||||||||
Corporate Bonds 38.5% | ||||||||||||||
Automobiles & Components 0.8% | ||||||||||||||
| d | Avis Budget Finance PLC, senior note, 144A, 6.00%, 3/01/21 | United States | 1,000,000 | EUR | 1,174,352 | |||||||||
| d | Fiat Chrysler Automobiles NV, senior note, 144A, 5.25%, 4/15/23 | United Kingdom | 3,500,000 | 3,434,375 | ||||||||||
The Goodyear Tire & Rubber Co., senior note, 6.50%, 3/01/21 | United States | 2,000,000 | 2,125,000 | |||||||||||
|
| |||||||||||||
| 6,733,727 | ||||||||||||||
|
| |||||||||||||
Banks 3.2% | ||||||||||||||
Bank of America Corp., | ||||||||||||||
e junior sub. bond, AA, 6.10% to 3/17/25, FRN thereafter, Perpetual | United States | 800,000 | 795,000 | |||||||||||
e junior sub. bond, M, 8.125% to 5/15/18, FRN thereafter, Perpetual | United States | 2,000,000 | 2,125,000 | |||||||||||
senior note, 5.65%, 5/01/18 | United States | 1,500,000 | 1,648,032 | |||||||||||
CIT Group Inc., senior note, | ||||||||||||||
5.375%, 5/15/20 | United States | 1,000,000 | 1,045,000 | |||||||||||
5.00%, 8/15/22 | United States | 2,500,000 | 2,481,250 | |||||||||||
Citigroup Inc., | ||||||||||||||
e junior sub. bond, M, 6.30% to 5/15/24, FRN thereafter, Perpetual | United States | 700,000 | 684,250 | |||||||||||
e junior sub. bond, O, 5.875% to 3/27/20, FRN thereafter, Perpetual | United States | 1,000,000 | 1,003,450 | |||||||||||
senior note, 3.875%, 10/25/23 | United States | 3,000,000 | 3,062,877 | |||||||||||
sub. bond, 5.50%, 9/13/25 | United States | 500,000 | 540,658 | |||||||||||
sub. note, 4.05%, 7/30/22 | United States | 300,000 | 307,308 | |||||||||||
JPMorgan Chase & Co., | ||||||||||||||
e junior sub. bond, R, 6.00% to 8/01/23, FRN thereafter, Perpetual | United States | 1,500,000 | 1,492,500 | |||||||||||
e junior sub. bond, V, 5.00% to 7/30/19, FRN thereafter, Perpetual | United States | 200,000 | 196,000 | |||||||||||
e junior sub. note, X, 6.10% to 10/01/24, FRN thereafter, Perpetual | United States | 500,000 | 502,375 | |||||||||||
senior note, 4.25%, 10/15/20 | United States | 1,000,000 | 1,069,029 | |||||||||||
sub. note, 3.375%, 5/01/23 | United States | 1,000,000 | 971,421 | |||||||||||
sub. note, 3.875%, 9/10/24 | United States | 1,000,000 | 982,110 | |||||||||||
Royal Bank of Scotland Group PLC, sub. note, 6.125%, 12/15/22 | United Kingdom | 1,000,000 | 1,073,750 | |||||||||||
The Royal Bank of Scotland PLC, sub. note, 6.934%, 4/09/18 | United Kingdom | 1,500,000 | EUR | 1,875,410 | ||||||||||
| e | Wells Fargo & Co., junior sub. bond, | |||||||||||||
5.875% to 6/15/25, FRN thereafter, Perpetual | United States | 2,500,000 | 2,562,500 | |||||||||||
S, 5.90% to 6/15/24, FRN thereafter, Perpetual | United States | 2,500,000 | 2,512,500 | |||||||||||
|
| |||||||||||||
| 26,930,420 | ||||||||||||||
|
| |||||||||||||
| Semiannual Report | FSI-9 |
FRANKLIN TEMPLETON VARIABLE INSURANCE PRODUCTS TRUST
STATEMENT OF INVESTMENTS (UNAUDITED)
Franklin Strategic Income VIP Fund (continued)
| Country | Principal Amount* | Value | ||||||||||||
Corporate Bonds (continued) | ||||||||||||||
Capital Goods 1.1% | ||||||||||||||
| d | Abengoa Finance SAU, senior note, 144A, 8.875%, 11/01/17 | Spain | 1,300,000 | $ | 1,356,062 | |||||||||
| d | Bombardier Inc., senior bond, 144A, 7.50%, 3/15/25 | Canada | 3,400,000 | 3,102,500 | ||||||||||
| d | KM Germany Holdings GmbH, senior secured note, first lien, 144A, 8.75%, 12/15/20 | Germany | 900,000 | EUR | 1,077,604 | |||||||||
Navistar International Corp., senior note, 8.25%, 11/01/21 | United States | 1,500,000 | 1,432,500 | |||||||||||
Terex Corp., senior note, 6.00%, 5/15/21 | United States | 1,000,000 | 1,010,000 | |||||||||||
TransDigm Inc., | ||||||||||||||
senior sub. bond, 6.50%, 7/15/24 | United States | 500,000 | 496,250 | |||||||||||
d senior sub. bond, 144A, 6.50%, 5/15/25 | United States | 200,000 | 198,750 | |||||||||||
senior sub. note, 6.00%, 7/15/22 | United States | 400,000 | 397,000 | |||||||||||
|
| |||||||||||||
| 9,070,666 | ||||||||||||||
|
| |||||||||||||
Consumer Durables & Apparel 0.6% | ||||||||||||||
KB Home, senior note, | ||||||||||||||
4.75%, 5/15/19 | United States | 1,000,000 | 997,500 | |||||||||||
7.00%, 12/15/21 | United States | 1,200,000 | 1,245,000 | |||||||||||
M/I Homes Inc., senior note, 8.625%, 11/15/18 | United States | 300,000 | 311,250 | |||||||||||
Toll Brothers Finance Corp., senior bond, 5.625%, 1/15/24 | United States | 1,100,000 | 1,163,250 | |||||||||||
Visant Corp., senior note, 10.00%, 10/01/17 | United States | 1,400,000 | 1,135,750 | |||||||||||
|
| |||||||||||||
| 4,852,750 | ||||||||||||||
|
| |||||||||||||
Consumer Services 1.6% | ||||||||||||||
| d | 1011778 BC ULC/New Red Finance Inc., | |||||||||||||
secured note, second lien, 144A, 6.00%, 4/01/22 | Canada | 2,000,000 | 2,060,000 | |||||||||||
senior secured note, first lien, 144A, 4.625%, 1/15/22 | Canada | 1,100,000 | 1,086,250 | |||||||||||
| f | Caesars Entertainment Operating Co. Inc., senior secured note, first lien, 11.25%, 6/01/17 | United States | 2,500,000 | 1,975,000 | ||||||||||
| d,g | Financiere Quick SAS, 144A, FRN, 7.511%, 10/15/19 | France | 1,500,000 | EUR | 1,292,405 | |||||||||
| d,f | Fontainebleau Las Vegas, senior secured note, first lien, 144A, 11.00%, 6/15/15 | United States | 2,500,000 | 12,625 | ||||||||||
| d | International Game Technology PLC, senior secured bond, 144A, 6.50%, 2/15/25 | United States | 3,500,000 | 3,257,188 | ||||||||||
MGM Resorts International, senior note, | ||||||||||||||
6.625%, 7/15/15 | United States | 2,500,000 | 2,502,750 | |||||||||||
6.75%, 10/01/20 | United States | 200,000 | 212,460 | |||||||||||
6.625%, 12/15/21 | United States | 500,000 | 525,000 | |||||||||||
| d | Wynn Macau Ltd., senior note, 144A, 5.25%, 10/15/21 | Macau | 1,000,000 | 949,375 | ||||||||||
|
| |||||||||||||
| 13,873,053 | ||||||||||||||
|
| |||||||||||||
Diversified Financials 2.2% | ||||||||||||||
AerCap Ireland Capital Ltd./AerCap Global Aviation Trust, senior note, | ||||||||||||||
4.25%, 7/01/20 | Netherlands | 1,300,000 | 1,301,625 | |||||||||||
d 144A, 5.00%, 10/01/21 | Netherlands | 1,100,000 | 1,133,000 | |||||||||||
Deutsche Bank AG, sub. bond, 4.296% to 5/24/23, FRN thereafter, 5/24/28 | Germany | 3,500,000 | 3,311,525 | |||||||||||
E*TRADE Financial Corp., senior note, | ||||||||||||||
5.375%, 11/15/22 | United States | 700,000 | 719,250 | |||||||||||
4.625%, 9/15/23 | United States | 800,000 | 788,000 | |||||||||||
| e | The Goldman Sachs Group Inc., junior sub. bond, M, 5.375% to 5/10/20, FRN thereafter, Perpetual | United States | 3,000,000 | 2,970,000 | ||||||||||
| FSI-10 | Semiannual Report |
FRANKLIN TEMPLETON VARIABLE INSURANCE PRODUCTS TRUST
STATEMENT OF INVESTMENTS (UNAUDITED)
Franklin Strategic Income VIP Fund (continued)
| Country | Principal Amount* | Value | ||||||||||||
Corporate Bonds (continued) | ||||||||||||||
Diversified Financials (continued) | ||||||||||||||
Morgan Stanley, | ||||||||||||||
e junior sub. bond, 5.55% to 7/15/20, FRN thereafter, Perpetual | United States | 2,500,000 | $ | 2,485,000 | ||||||||||
sub. bond, 3.95%, 4/23/27 | United States | 1,000,000 | 943,420 | |||||||||||
Navient Corp., senior note, | ||||||||||||||
8.45%, 6/15/18 | United States | 1,000,000 | 1,113,800 | |||||||||||
5.50%, 1/15/19 | United States | 1,500,000 | 1,533,180 | |||||||||||
5.875%, 3/25/21 | United States | 700,000 | 701,309 | |||||||||||
6.125%, 3/25/24 | United States | 500,000 | 480,000 | |||||||||||
| d | Neuberger Berman Group LLC/Finance Corp., senior note, 144A, 5.875%, 3/15/22 | United States | 1,000,000 | 1,072,500 | ||||||||||
|
| |||||||||||||
| 18,552,609 | ||||||||||||||
|
| |||||||||||||
Energy 6.8% | ||||||||||||||
Access Midstream Partner LP/ACMP Finance Corp., senior note, 6.125%, 7/15/22 | United States | 600,000 | 634,730 | |||||||||||
BreitBurn Energy Partners LP/BreitBurn Finance Corp., senior bond, 7.875%, 4/15/22 | United States | 2,300,000 | 1,932,000 | |||||||||||
California Resources Corp., | ||||||||||||||
senior bond, 6.00%, 11/15/24 | United States | 1,500,000 | 1,295,625 | |||||||||||
senior note, 5.50%, 9/15/21 | United States | 800,000 | 697,000 | |||||||||||
CGG SA, senior note, | ||||||||||||||
7.75%, 5/15/17 | France | 159,000 | 155,025 | |||||||||||
6.50%, 6/01/21 | France | 1,800,000 | 1,503,000 | |||||||||||
6.875%, 1/15/22 | France | 200,000 | 167,625 | |||||||||||
CHC Helicopter SA, | ||||||||||||||
senior note, 9.375%, 6/01/21 | Canada | 260,000 | 156,000 | |||||||||||
senior secured note, first lien, 9.25%, 10/15/20 | Canada | 2,205,000 | 1,608,272 | |||||||||||
Chesapeake Energy Corp., senior note, | ||||||||||||||
6.625%, 8/15/20 | United States | 200,000 | 196,000 | |||||||||||
6.125%, 2/15/21 | United States | 1,500,000 | 1,413,750 | |||||||||||
5.75%, 3/15/23 | United States | 1,000,000 | 910,000 | |||||||||||
Clayton Williams Energy Inc., senior note, 7.75%, 4/01/19 | United States | 1,800,000 | 1,719,000 | |||||||||||
CONSOL Energy Inc., senior note, |
| |||||||||||||
5.875%, 4/15/22 | United States | 2,500,000 | 2,135,300 | |||||||||||
d 144A, 8.00%, 4/01/23 | United States | 500,000 | 476,250 | |||||||||||
Energy Transfer Equity LP, senior note, first lien, 7.50%, 10/15/20 | United States | 2,500,000 | 2,831,250 | |||||||||||
Energy Transfer Partners LP, senior note, 5.20%, 2/01/22 | United States | 1,000,000 | 1,047,369 | |||||||||||
Energy XXI Gulf Coast Inc., |
| |||||||||||||
senior note, 9.25%, 12/15/17 | United States | 1,500,000 | 798,750 | |||||||||||
senior note, 6.875%, 3/15/24 | United States | 1,000,000 | 330,000 | |||||||||||
d senior secured note, second lien, 144A, 11.00%, 3/15/20 | United States | 700,000 | 617,750 | |||||||||||
| d | EnQuest PLC, senior note, 144A, 7.00%, 4/15/22 | United Kingdom | 1,500,000 | 1,208,438 | ||||||||||
Freeport-McMoRan Oil & Gas LLC/FCX Oil & Gas Inc., senior note, 6.875%, 2/15/23 | United States | 672,000 | 722,400 | |||||||||||
| d,h | Gaz Capital SA (OJSC Gazprom), loan participation, |
| ||||||||||||
senior bond, 144A, 6.51%, 3/07/22 | Russia | 500,000 | 503,250 | |||||||||||
senior note, 144A, 5.092%, 11/29/15 | Russia | 1,500,000 | 1,516,875 | |||||||||||
senior note, 144A, 3.85%, 2/06/20 | Russia | 1,500,000 | 1,385,625 | |||||||||||
Halcon Resources Corp., senior note, |
| |||||||||||||
8.875%, 5/15/21 | United States | 2,000,000 | 1,325,000 | |||||||||||
9.25%, 2/15/22 | United States | 800,000 | 522,000 | |||||||||||
| Semiannual Report | FSI-11 |
FRANKLIN TEMPLETON VARIABLE INSURANCE PRODUCTS TRUST
STATEMENT OF INVESTMENTS (UNAUDITED)
Franklin Strategic Income VIP Fund (continued)
| Country | Principal Amount* | Value | ||||||||||||
Corporate Bonds (continued) | ||||||||||||||
Energy (continued) | ||||||||||||||
| d | Kinder Morgan Finance Co. LLC, senior secured note, 144A, 6.00%, 1/15/18 | United States | 2,000,000 | $ | 2,167,188 | |||||||||
Kinder Morgan Inc., senior note, 6.50%, 9/15/20 | United States | 1,500,000 | 1,715,673 | |||||||||||
Linn Energy LLC/Finance Corp., senior note, | ||||||||||||||
8.625%, 4/15/20 | United States | 2,000,000 | 1,650,420 | |||||||||||
7.75%, 2/01/21 | United States | 1,200,000 | 939,000 | |||||||||||
6.50%, 9/15/21 | United States | 200,000 | 150,000 | |||||||||||
| d | LUKOIL International Finance BV, senior note, 144A, 4.563%, 4/24/23 | Russia | 3,500,000 | 3,125,937 | ||||||||||
Martin Midstream Partners LP/Martin Midstream Finance Corp., senior note, 7.25%, 2/15/21 | United States | 2,000,000 | 1,975,000 | |||||||||||
Midstates Petroleum Co. Inc./LLC, senior note, 9.25%, 6/01/21 | United States | 1,500,000 | 630,000 | |||||||||||
Oasis Petroleum Inc., senior note, 6.875%, 3/15/22 | United States | 1,300,000 | 1,326,000 | |||||||||||
Offshore Group Investment Ltd., | ||||||||||||||
senior bond, first lien, 7.125%, 4/01/23 | United States | 700,000 | 430,500 | |||||||||||
senior secured note, first lien, 7.50%, 11/01/19 | United States | 1,800,000 | 1,112,625 | |||||||||||
PBF Holding Co. LLC, first lien, 8.25%, 2/15/20 | United States | 1,000,000 | 1,061,500 | |||||||||||
Peabody Energy Corp., senior note, |
| |||||||||||||
6.50%, 9/15/20 | United States | 2,500,000 | 862,500 | |||||||||||
6.25%, 11/15/21 | United States | 1,500,000 | 487,500 | |||||||||||
Penn Virginia Corp., senior note, 8.50%, 5/01/20 | United States | 1,500,000 | 1,353,750 | |||||||||||
Penn Virginia Resource Partners LP/Penn Virginia Resource Finance Corp., senior note, | ||||||||||||||
8.375%, 6/01/20 | United States | 500,000 | 543,125 | |||||||||||
6.50%, 5/15/21 | United States | 400,000 | 423,500 | |||||||||||
| d,f,g | Quicksilver Resources Inc., secured note, second lien, 144A, FRN, 7.00%, 6/21/19 | United States | 900,000 | 551,250 | ||||||||||
Regency Energy Partners LP/Regency Energy Finance Corp., senior note, | ||||||||||||||
5.875%, 3/01/22 | United States | 200,000 | 212,972 | |||||||||||
5.00%, 10/01/22 | United States | 500,000 | 508,080 | |||||||||||
Sabine Pass Liquefaction LLC, |
| |||||||||||||
first lien, 5.625%, 2/01/21 | United States | 2,000,000 | 2,050,000 | |||||||||||
first lien, 5.625%, 4/15/23 | United States | 900,000 | 901,404 | |||||||||||
senior secured note, first lien, 5.75%, 5/15/24 | United States | 300,000 | 300,375 | |||||||||||
Sanchez Energy Corp., senior note, |
| |||||||||||||
7.75%, 6/15/21 | United States | 1,700,000 | 1,700,000 | |||||||||||
6.125%, 1/15/23 | United States | 600,000 | 540,000 | |||||||||||
W&T Offshore Inc., senior note, 8.50%, 6/15/19 | United States | 2,000,000 | 1,397,500 | |||||||||||
Williams Partners LP, senior bond, 4.00%, 9/15/25 | United States | 1,500,000 | 1,405,751 | |||||||||||
|
| |||||||||||||
| 57,329,834 | ||||||||||||||
|
| |||||||||||||
Food & Staples Retailing 0.4% | ||||||||||||||
| d | Cencosud SA, senior note, 144A, |
| ||||||||||||
4.875%, 1/20/23 | Chile | 1,500,000 | 1,508,738 | |||||||||||
5.15%, 2/12/25 | Chile | 1,500,000 | 1,514,565 | |||||||||||
|
| |||||||||||||
| 3,023,303 | ||||||||||||||
|
| |||||||||||||
Food, Beverage & Tobacco 0.9% | ||||||||||||||
Constellation Brands Inc., senior note, 4.25%, 5/01/23 | United States | 1,000,000 | 987,500 | |||||||||||
| FSI-12 | Semiannual Report |
FRANKLIN TEMPLETON VARIABLE INSURANCE PRODUCTS TRUST
STATEMENT OF INVESTMENTS (UNAUDITED)
Franklin Strategic Income VIP Fund (continued)
| Country | Principal Amount* | Value | ||||||||||||
Corporate Bonds (continued) | ||||||||||||||
Food, Beverage & Tobacco (continued) | ||||||||||||||
| d | JBS USA LLC/Finance Inc., senior note, 144A, | |||||||||||||
8.25%, 2/01/20 | United States | 2,500,000 | $ | 2,662,500 | ||||||||||
7.25%, 6/01/21 | United States | 300,000 | 317,625 | |||||||||||
5.75%, 6/15/25 | United States | 500,000 | 496,250 | |||||||||||
| d | Post Holdings Inc., senior note, 144A, | |||||||||||||
6.75%, 12/01/21 | United States | 1,700,000 | 1,704,250 | |||||||||||
6.00%, 12/15/22 | United States | 500,000 | 483,125 | |||||||||||
| d | Smithfield Foods Inc., senior note, 144A, 5.875%, 8/01/21 | United States | 600,000 | 622,500 | ||||||||||
|
| |||||||||||||
| 7,273,750 | ||||||||||||||
|
| |||||||||||||
Health Care Equipment & Services 1.9% | ||||||||||||||
Alere Inc., senior sub. note, 6.50%, 6/15/20 | United States | 800,000 | 832,000 | |||||||||||
AmSurg Corp., senior note, 5.625%, 7/15/22 | United States | 400,000 | 402,500 | |||||||||||
CHS/Community Health Systems Inc., | ||||||||||||||
senior note, 8.00%, 11/15/19 | United States | 1,500,000 | 1,584,375 | |||||||||||
senior note, 6.875%, 2/01/22 | United States | 400,000 | 423,500 | |||||||||||
senior secured note, first lien, 5.125%, 8/15/18 | United States | 600,000 | 616,800 | |||||||||||
DaVita HealthCare Partners Inc., | ||||||||||||||
senior bond, 5.125%, 7/15/24 | United States | 500,000 | 492,500 | |||||||||||
senior bond, 5.00%, 5/01/25 | United States | 900,000 | 868,500 | |||||||||||
senior note, 5.75%, 8/15/22 | United States | 1,500,000 | 1,595,625 | |||||||||||
HCA Inc., | ||||||||||||||
senior note, 7.50%, 2/15/22 | United States | 1,000,000 | 1,150,000 | |||||||||||
senior note, 5.875%, 5/01/23 | United States | 1,500,000 | 1,597,500 | |||||||||||
senior secured bond, first lien, 5.875%, 3/15/22 | United States | 1,000,000 | 1,090,000 | |||||||||||
senior secured bond, first lien, 5.25%, 4/15/25 | United States | 600,000 | 623,625 | |||||||||||
| d,i | Hologic Inc., senior note, 144A, 5.25%, 7/15/22 | United States | 1,000,000 | 1,023,750 | ||||||||||
Omnicare Inc., senior note, 4.75%, 12/01/22 | United States | 700,000 | 745,500 | |||||||||||
Tenet Healthcare Corp., senior note, | ||||||||||||||
8.125%, 4/01/22 | United States | 1,200,000 | 1,317,000 | |||||||||||
d 144A, 5.00%, 3/01/19 | United States | 500,000 | 501,875 | |||||||||||
d 144A, 5.50%, 3/01/19 | United States | 1,200,000 | 1,215,000 | |||||||||||
| d | Tenet Healthcare Corp. II, senior note, 144A, 6.75%, 6/15/23 | United States | 300,000 | 306,562 | ||||||||||
|
| |||||||||||||
| 16,386,612 | ||||||||||||||
|
| |||||||||||||
Insurance 0.8% | ||||||||||||||
MetLife Inc., junior sub. note, | ||||||||||||||
e 5.25% to 6/15/20, FRN thereafter, Perpetual | United States | 1,200,000 | 1,192,500 | |||||||||||
6.40% to 12/15/36, FRN thereafter, 12/15/66 | United States | 1,500,000 | 1,650,000 | |||||||||||
| d | Nippon Life Insurance Co., sub. bond, 144A, 5.10% to 10/16/24, FRN thereafter, 10/16/44 | Japan | 3,500,000 | 3,652,215 | ||||||||||
|
| |||||||||||||
| 6,494,715 | ||||||||||||||
|
| |||||||||||||
Materials 4.9% | ||||||||||||||
ArcelorMittal, senior note, | ||||||||||||||
6.25%, 3/01/21 | Luxembourg | 3,000,000 | 3,164,835 | |||||||||||
6.125%, 6/01/25 | Luxembourg | 300,000 | 300,375 | |||||||||||
| d | Ardagh Packaging Finance PLC/Ardagh MP Holdings USA Inc., senior note, 144A, | |||||||||||||
7.00%, 11/15/20 | Luxembourg | 105,882 | 108,331 | |||||||||||
6.75%, 1/31/21 | Luxembourg | 200,000 | 205,500 | |||||||||||
6.00%, 6/30/21 | Luxembourg | 1,300,000 | 1,309,750 | |||||||||||
| Semiannual Report | FSI-13 |
FRANKLIN TEMPLETON VARIABLE INSURANCE PRODUCTS TRUST
STATEMENT OF INVESTMENTS (UNAUDITED)
Franklin Strategic Income VIP Fund (continued)
| Country | Principal Amount* | Value | ||||||||||||
Corporate Bonds (continued) | ||||||||||||||
Materials (continued) | ||||||||||||||
| d | Barminco Finance Pty. Ltd., senior note, 144A, 9.00%, 6/01/18 | Australia | 1,500,000 | $ | 1,425,938 | |||||||||
| d | Cemex Finance LLC, senior secured note, first lien, 144A, 6.00%, 4/01/24 | Mexico | 1,000,000 | 991,250 | ||||||||||
| d | Cemex SAB de CV, | |||||||||||||
first lien, 144A, 5.70%, 1/11/25 | Mexico | 1,500,000 | 1,431,562 | |||||||||||
secured note, 144A, 5.875%, 3/25/19 | Mexico | 1,000,000 | 1,026,250 | |||||||||||
| d | Ceramtec Group GmbH, senior note, 144A, 8.25%, 8/15/21 | Germany | 1,400,000 | EUR | 1,709,427 | |||||||||
| d | The Chemours Co., | |||||||||||||
senior bond, 144A, 7.00%, 5/15/25 | United States | 500,000 | 486,250 | |||||||||||
senior note, 144A, 6.625%, 5/15/23 | United States | 1,800,000 | 1,748,250 | |||||||||||
| d | First Quantum Minerals Ltd., senior note, 144A, | |||||||||||||
6.75%, 2/15/20 | Canada | 1,400,000 | 1,361,500 | |||||||||||
7.00%, 2/15/21 | Canada | 1,725,000 | 1,658,156 | |||||||||||
| d | FMG Resources (August 2006) Pty. Ltd., senior secured note, 144A, 9.75%, 3/01/22 | Australia | 3,200,000 | 3,302,000 | ||||||||||
Freeport-McMoRan Inc., senior note, 4.55%, 11/14/24 | United States | 2,500,000 | 2,330,487 | |||||||||||
| d | Glencore Finance Canada Ltd., senior bond, 144A, 4.95%, 11/15/21 | Switzerland | 1,500,000 | 1,575,687 | ||||||||||
| d | Glencore Funding LLC, senior note, 144A, | |||||||||||||
4.125%, 5/30/23 | Switzerland | 1,000,000 | 967,806 | |||||||||||
4.625%, 4/29/24 | Switzerland | 500,000 | 496,752 | |||||||||||
| d | INVISTA Finance LLC, senior secured note, 144A, 4.25%, 10/15/19 | United States | 2,800,000 | 2,772,000 | ||||||||||
Novelis Inc., senior note, 8.75%, 12/15/20 | Canada | 1,600,000 | 1,696,000 | |||||||||||
| d | Owens-Brockway Glass Container Inc., senior note, 144A, 5.00%, 1/15/22 | United States | 1,400,000 | 1,387,750 | ||||||||||
Reynolds Group Issuer Inc./LLC/SA, | ||||||||||||||
first lien, 5.75%, 10/15/20 | United States | 700,000 | 719,250 | |||||||||||
senior note, 8.50%, 5/15/18 | United States | 1,000,000 | 1,021,250 | |||||||||||
senior note, 8.25%, 2/15/21 | United States | 1,000,000 | 1,042,500 | |||||||||||
senior secured note, first lien, 7.125%, 4/15/19 | United States | 800,000 | 825,000 | |||||||||||
| d | Sealed Air Corp., | |||||||||||||
senior bond, 144A, 5.125%, 12/01/24 | United States | 1,000,000 | 990,000 | |||||||||||
senior bond, 144A, 5.50%, 9/15/25 | United States | 400,000 | 404,000 | |||||||||||
senior note, 144A, 4.875%, 12/01/22 | United States | 1,000,000 | 988,750 | |||||||||||
Steel Dynamics Inc., | ||||||||||||||
senior bond, 5.50%, 10/01/24 | United States | 1,000,000 | 1,002,500 | |||||||||||
senior note, 5.125%, 10/01/21 | United States | 1,000,000 | 1,007,000 | |||||||||||
| d | U.S. Coatings Acquisition Inc./Flash Dutch 2 BV, 144A, 5.75%, 2/01/21 | United States | 1,000,000 | EUR | 1,175,048 | |||||||||
Verso Paper Holdings LLC/Inc., senior secured note, first lien, 11.75%, 1/15/19 | United States | 451,000 | 264,963 | |||||||||||
|
| |||||||||||||
| 40,896,117 | ||||||||||||||
|
| |||||||||||||
Media 3.8% | ||||||||||||||
CCO Holdings LLC/CCO Holdings Capital Corp., senior bond, | ||||||||||||||
5.25%, 9/30/22 | United States | 2,700,000 | 2,666,250 | |||||||||||
d 144A, 5.375%, 5/01/25 | United States | 900,000 | 878,625 | |||||||||||
Clear Channel Worldwide Holdings Inc., | ||||||||||||||
senior note, 6.50%, 11/15/22 | United States | 1,000,000 | 1,045,000 | |||||||||||
senior sub. note, 7.625%, 3/15/20 | United States | 200,000 | 207,250 | |||||||||||
senior sub. note, 7.625%, 3/15/20 | United States | 500,000 | 523,125 | |||||||||||
| FSI-14 | Semiannual Report |
FRANKLIN TEMPLETON VARIABLE INSURANCE PRODUCTS TRUST
STATEMENT OF INVESTMENTS (UNAUDITED)
Franklin Strategic Income VIP Fund (continued)
| Country | Principal Amount* | Value | ||||||||||||
Corporate Bonds (continued) | ||||||||||||||
Media (continued) | ||||||||||||||
CSC Holdings LLC, senior note, | ||||||||||||||
6.75%, 11/15/21 | United States | 2,500,000 | $ | 2,643,750 | ||||||||||
5.25%, 6/01/24 | United States | 200,000 | 193,000 | |||||||||||
DISH DBS Corp., senior note, | ||||||||||||||
7.125%, 2/01/16 | United States | 2,000,000 | 2,055,000 | |||||||||||
6.75%, 6/01/21 | United States | 500,000 | 522,500 | |||||||||||
5.875%, 7/15/22 | United States | 500,000 | 491,250 | |||||||||||
5.875%, 11/15/24 | United States | 500,000 | 481,563 | |||||||||||
Gannett Co. Inc., | ||||||||||||||
senior bond, 6.375%, 10/15/23 | United States | 1,000,000 | 1,045,000 | |||||||||||
d senior bond, 144A, 5.50%, 9/15/24 | United States | 300,000 | 297,750 | |||||||||||
senior note, 5.125%, 7/15/20 | United States | 1,000,000 | 1,028,750 | |||||||||||
iHeartCommunications Inc., | ||||||||||||||
senior secured bond, first lien, 9.00%, 3/01/21 | United States | 2,400,000 | 2,196,000 | |||||||||||
senior secured note, first lien, 9.00%, 9/15/22 | United States | 700,000 | 637,000 | |||||||||||
| d | Nielsen Finance LLC/Co., senior note, 144A, 5.00%, 4/15/22 | United States | 300,000 | 294,563 | ||||||||||
| d | Sirius XM Radio Inc., senior bond, 144A, | |||||||||||||
6.00%, 7/15/24 | United States | 1,700,000 | 1,721,250 | |||||||||||
5.375%, 4/15/25 | United States | 800,000 | 776,000 | |||||||||||
Time Warner Cable Inc., senior note, 4.00%, 9/01/21 | United States | 2,500,000 | 2,567,315 | |||||||||||
| d | Unitymedia Hessen GmbH & Co. KG/Unitymedia NRW GmbH, senior secured note, first lien, 144A, 5.625%, 4/15/23 | Germany | 720,000 | EUR | 866,596 | |||||||||
| d | Unitymedia KabelBW GmbH, senior bond, 144A, 6.125%, 1/15/25 | Germany | 1,700,000 | 1,776,500 | ||||||||||
| d | Univision Communications Inc., senior secured note, first lien, 144A, 5.125%, 2/15/25 | United States | 3,000,000 | 2,895,000 | ||||||||||
| d | Videotron Ltd., senior bond, 144A, 5.375%, 6/15/24 | Canada | 800,000 | 802,000 | ||||||||||
| d | Virgin Media Finance PLC, senior bond, 144A, 6.375%, 10/15/24 | United Kingdom | 900,000 | GBP | 1,476,642 | |||||||||
| d | Virgin Media Secured Finance PLC, senior secured bond, first lien, 144A, 5.50%, 1/15/25 | United Kingdom | 1,900,000 | 1,910,687 | ||||||||||
|
| |||||||||||||
| 31,998,366 | ||||||||||||||
|
| |||||||||||||
Pharmaceuticals, Biotechnology & Life Sciences 2.0% | ||||||||||||||
AbbVie Inc., senior note, 3.60%, 5/14/25 | United States | 1,500,000 | 1,483,335 | |||||||||||
Actavis Funding SCS, senior bond, 3.80%, 3/15/25 | United States | 1,500,000 | 1,474,203 | |||||||||||
| d | Baxalta Inc., senior note, 144A, 4.00%, 6/23/25 | United States | 2,100,000 | 2,090,519 | ||||||||||
| d | Endo Finance LLC/Endo Ltd./Endo Finco Inc., | |||||||||||||
senior bond, 144A, 6.00%, 2/01/25 | United States | 1,200,000 | 1,225,500 | |||||||||||
i senior note, 144A, 6.00%, 7/15/23 | United States | 700,000 | 717,500 | |||||||||||
Grifols Worldwide Operations Ltd., senior note, 5.25%, 4/01/22 | United States | 700,000 | 703,500 | |||||||||||
| d,j | Jaguar Holding Co. I, senior note, 144A, PIK, 9.375%, 10/15/17 | United States | 2,500,000 | 2,559,375 | ||||||||||
| d | Valeant Pharmaceuticals International Inc., | |||||||||||||
senior bond, 144A, 6.125%, 4/15/25 | United States | 300,000 | 309,750 | |||||||||||
senior note, 144A, 7.50%, 7/15/21 | United States | 600,000 | 650,250 | |||||||||||
senior note, 144A, 5.50%, 3/01/23 | United States | 400,000 | 405,000 | |||||||||||
| d | VPI Escrow Corp., senior note, 144A, 6.375%, 10/15/20 | United States | 2,400,000 | 2,533,500 | ||||||||||
Zoetis Inc., senior bond, 3.25%, 2/01/23 | United States | 2,500,000 | 2,422,997 | |||||||||||
|
| |||||||||||||
| 16,575,429 | ||||||||||||||
|
| |||||||||||||
Real Estate 0.1% | ||||||||||||||
Crown Castle International Corp., senior bond, 5.25%, 1/15/23 | United States | 500,000 | 505,500 | |||||||||||
|
| |||||||||||||
| Semiannual Report | FSI-15 |
FRANKLIN TEMPLETON VARIABLE INSURANCE PRODUCTS TRUST
STATEMENT OF INVESTMENTS (UNAUDITED)
Franklin Strategic Income VIP Fund (continued)
| Country | Principal Amount* | Value | ||||||||||||
Corporate Bonds (continued) | ||||||||||||||
Retailing 0.7% | ||||||||||||||
| d | Argos Merger Sub Inc., senior note, 144A, 7.125%, 3/15/23 | United States | 700,000 | $ | 735,000 | |||||||||
| d | Edcon Ltd., secured note, 144A, 9.50%, 3/01/18 | South Africa | 1,800,000 | EUR | 1,589,763 | |||||||||
| d | Family Tree Escrow LLC, senior note, 144A, 5.75%, 3/01/23 | United States | 900,000 | 945,000 | ||||||||||
| d | Netflix Inc., senior bond, 144A, 5.875%, 2/15/25 | United States | 2,300,000 | 2,392,253 | ||||||||||
|
| |||||||||||||
| 5,662,016 | ||||||||||||||
|
| |||||||||||||
Software & Services 1.1% | ||||||||||||||
| d | BMC Software Finance Inc., senior note, 144A, 8.125%, 7/15/21 | United States | 2,500,000 | 2,034,375 | ||||||||||
Equinix Inc., senior bond, 5.375%, 4/01/23 | United States | 2,500,000 | 2,512,500 | |||||||||||
First Data Corp., | ||||||||||||||
senior bond, 12.625%, 1/15/21 | United States | 300,000 | 347,250 | |||||||||||
d senior secured bond, second lien, 144A, 8.25%, 1/15/21 | United States | 3,000,000 | 3,172,500 | |||||||||||
Sterling International Inc., senior note, 11.00%, 10/01/19 | United States | 1,100,000 | 1,171,500 | |||||||||||
|
| |||||||||||||
| 9,238,125 | ||||||||||||||
|
| |||||||||||||
Technology Hardware & Equipment 0.3% | ||||||||||||||
| d | Alcatel-Lucent USA Inc., senior note, 144A, 6.75%, 11/15/20 | France | 1,500,000 | 1,591,875 | ||||||||||
| d,j | CommScope Holdings Co. Inc., senior note, 144A, PIK, 6.625%, 6/01/20 | United States | 200,000 | 208,250 | ||||||||||
| d | CommScope Technologies Finance LLC, senior bond, 144A, 6.00%, 6/15/25 | United States | 900,000 | 898,875 | ||||||||||
|
| |||||||||||||
| 2,699,000 | ||||||||||||||
|
| |||||||||||||
Telecommunication Services 3.3% | ||||||||||||||
AT&T Inc., senior bond, 3.40%, 5/15/25 | United States | 1,900,000 | 1,807,728 | |||||||||||
CenturyLink Inc., | ||||||||||||||
senior bond, 6.75%, 12/01/23 | United States | 200,000 | 201,375 | |||||||||||
d senior bond, 144A, 5.625%, 4/01/25 | United States | 900,000 | 815,625 | |||||||||||
senior note, 6.00%, 4/01/17 | United States | 500,000 | 523,125 | |||||||||||
senior note, 6.45%, 6/15/21 | United States | 500,000 | 506,250 | |||||||||||
| d | Digicel Group Ltd., senior note, 144A, 8.25%, 9/30/20 | Bermuda | 1,500,000 | 1,507,500 | ||||||||||
| d | Digicel Ltd., senior note, 144A, | |||||||||||||
6.00%, 4/15/21 | Bermuda | 1,000,000 | 967,500 | |||||||||||
6.75%, 3/01/23 | Bermuda | 300,000 | 293,827 | |||||||||||
Frontier Communications Corp., | ||||||||||||||
senior bond, 7.625%, 4/15/24 | United States | 300,000 | 266,250 | |||||||||||
senior note, 8.50%, 4/15/20 | United States | 100,000 | 104,800 | |||||||||||
senior note, 8.75%, 4/15/22 | United States | 200,000 | 199,000 | |||||||||||
senior note, 7.875%, 1/15/27 | United States | 400,000 | 372,000 | |||||||||||
Intelsat Jackson Holdings SA, | ||||||||||||||
senior bond, 6.625%, 12/15/22 | Luxembourg | 1,600,000 | 1,474,000 | |||||||||||
senior note, 7.25%, 10/15/20 | Luxembourg | 1,000,000 | 992,500 | |||||||||||
senior note, 7.50%, 4/01/21 | Luxembourg | 1,000,000 | 992,500 | |||||||||||
| d | Millicom International Cellular SA, senior note, 144A, 6.625%, 10/15/21 | Luxembourg | 2,000,000 | 2,068,750 | ||||||||||
| d | Play Finance 2 SA, senior secured note, 144A, 5.25%, 2/01/19 | Poland | 800,000 | EUR | 919,118 | |||||||||
Sprint Communications Inc., senior note, | ||||||||||||||
8.375%, 8/15/17 | United States | 1,200,000 | 1,302,000 | |||||||||||
6.00%, 11/15/22 | United States | 500,000 | 458,125 | |||||||||||
d 144A, 9.00%, 11/15/18 | United States | 1,500,000 | 1,697,640 | |||||||||||
d 144A, 7.00%, 3/01/20 | United States | 800,000 | 872,160 | |||||||||||
Sprint Corp., senior bond, 7.875%, 9/15/23 | United States | 500,000 | 488,750 | |||||||||||
| FSI-16 | Semiannual Report |
FRANKLIN TEMPLETON VARIABLE INSURANCE PRODUCTS TRUST
STATEMENT OF INVESTMENTS (UNAUDITED)
Franklin Strategic Income VIP Fund (continued)
| Country | Principal Amount* | Value | ||||||||||||
Corporate Bonds (continued) | ||||||||||||||
Telecommunication Services (continued) | ||||||||||||||
T-Mobile USA Inc., | ||||||||||||||
senior bond, 6.50%, 1/15/24 | United States | 300,000 | $ | 310,500 | ||||||||||
senior bond, 6.375%, 3/01/25 | United States | 1,300,000 | 1,337,375 | |||||||||||
senior note, 6.542%, 4/28/20 | United States | 1,400,000 | 1,469,286 | |||||||||||
senior note, 6.125%, 1/15/22 | United States | 200,000 | 207,000 | |||||||||||
Verizon Communications Inc., senior note, 5.15%, 9/15/23 | United States | 2,000,000 | 2,195,012 | |||||||||||
| d | Wind Acquisition Finance SA, senior secured note, 144A, | |||||||||||||
4.00%, 7/15/20 | Italy | 1,200,000 | EUR | 1,343,191 | ||||||||||
7.00%, 4/23/21 | Italy | 1,500,000 | EUR | 1,735,266 | ||||||||||
|
| |||||||||||||
| 27,428,153 | ||||||||||||||
|
| |||||||||||||
Transportation 0.7% | ||||||||||||||
| d | Florida East Coast Holdings Corp., | |||||||||||||
secured note, first lien, 144A, 6.75%, 5/01/19 | United States | 900,000 | 904,500 | |||||||||||
senior note, 144A, 9.75%, 5/01/20 | United States | 400,000 | 381,000 | |||||||||||
Hertz Corp., senior note, | ||||||||||||||
6.75%, 4/15/19 | United States | 1,000,000 | 1,034,400 | |||||||||||
6.25%, 10/15/22 | United States | 1,500,000 | 1,530,000 | |||||||||||
| d | Stena AB, senior bond, 144A, 7.00%, 2/01/24 | Sweden | 900,000 | 873,000 | ||||||||||
| d | Stena International SA, secured bond, 144A, 5.75%, 3/01/24 | Sweden | 1,100,000 | 1,053,239 | ||||||||||
|
| |||||||||||||
| 5,776,139 | ||||||||||||||
|
| |||||||||||||
Utilities 1.3% | ||||||||||||||
Calpine Corp., | ||||||||||||||
senior bond, 5.75%, 1/15/25 | United States | 1,200,000 | 1,171,500 | |||||||||||
senior note, 5.375%, 1/15/23 | United States | 1,300,000 | 1,283,750 | |||||||||||
| d,e | EDF SA, sub. note, 144A, 5.25% to 1/29/23, FRN thereafter, Perpetual | France | 3,000,000 | 3,015,000 | ||||||||||
Exelon Corp., senior bond, 3.95%, 6/15/25 | United States | 1,800,000 | 1,811,502 | |||||||||||
| d | InterGen NV, secured bond, 144A, 7.00%, 6/30/23 | Netherlands | 2,500,000 | 2,237,500 | ||||||||||
| d,f | Texas Competitive Electric Holdings Co. LLC/Texas Competitive Electric Holdings Finance Inc., senior secured note, first lien, 144A, 11.50%, 10/01/20 | United States | 3,000,000 | 1,837,500 | ||||||||||
|
| |||||||||||||
| 11,356,752 | ||||||||||||||
|
| |||||||||||||
Total Corporate Bonds (Cost $336,299,717) | 322,657,036 | |||||||||||||
|
| |||||||||||||
| g,k | Senior Floating Rate Interests 20.8% | |||||||||||||
Automobiles & Components 0.9% | ||||||||||||||
Crowne Group LLC, Term Loan, 6.00%, 9/30/20 | United States | 1,117,056 | 1,117,056 | |||||||||||
FRAM Group Holdings Inc. (Autoparts Holdings), | ||||||||||||||
Second Lien Term Loan, 11.00%, 1/29/18 | United States | 1,458,729 | 1,363,912 | |||||||||||
Term Loan, 7.00%, 7/29/17 | United States | 3,111,198 | 2,986,751 | |||||||||||
| i | The Goodyear Tire & Rubber Co., Second Lien Loans, 5.25%, 4/30/19 | United States | 358,614 | 359,734 | ||||||||||
Henniges Automotive Holdings Inc., Term Loans, 5.50%, 6/12/21 | United States | 806,589 | 808,605 | |||||||||||
| i | TI Group Automotive Systems LLC, Term Loan B, 5.75%, 6/30/22 | United States | 230,658 | 231,090 | ||||||||||
UCI International Inc., Term Loan, 5.50%, 7/26/17 | United States | 576,748 | 573,864 | |||||||||||
|
| |||||||||||||
| 7,441,012 | ||||||||||||||
|
| |||||||||||||
| Semiannual Report | FSI-17 |
FRANKLIN TEMPLETON VARIABLE INSURANCE PRODUCTS TRUST
STATEMENT OF INVESTMENTS (UNAUDITED)
Franklin Strategic Income VIP Fund (continued)
| Country | Principal Amount* | Value | ||||||||||||
| g,k | Senior Floating Rate Interests (continued) | |||||||||||||
Capital Goods 1.1% | ||||||||||||||
Alfred Fueling Systems Inc. (Wayne Fueling), | ||||||||||||||
First Lien Initial Term Loan, 4.75%, 6/18/21 | United States | 489,413 | $ | 494,307 | ||||||||||
Second Lien Initial Term Loan, 8.50%, 6/20/22 | United States | 845,106 | 842,993 | |||||||||||
Doncasters U.S. Finance LLC, Second Lien Term Loan, 9.50%, 10/09/20 | United States | 125,226 | 125,539 | |||||||||||
| l | Erickson Inc., Purchase Price Notes, 6.00%, 11/02/20 | United States | 179,526 | 154,500 | ||||||||||
LCS Deco LLC, Term B Loans, 5.50%, 5/21/22 | United States | 61,664 | 62,358 | |||||||||||
Onsite Rental Group Operations Pty. Ltd., Term B Loan, 5.50%, 7/30/21 | United States | 2,422,669 | 2,362,102 | |||||||||||
Sensus USA Inc., | ||||||||||||||
First Lien Term Loan, 4.50%, 5/09/17 | United States | 1,314,688 | 1,308,936 | |||||||||||
Second Lien Term Loan, 8.50%, 5/09/18 | United States | 3,032,186 | 3,017,025 | |||||||||||
TransDigm Inc., | ||||||||||||||
Tranche C Term Loan, 3.75%, 2/28/20 | United States | 91,027 | 90,503 | |||||||||||
Tranche D Term Loan, 3.75%, 6/04/21 | United States | 291,258 | 289,370 | |||||||||||
| i | WireCo Worldgroup Inc., Term Loan, 6.00%, 2/15/17 | United States | 359,972 | 360,646 | ||||||||||
|
| |||||||||||||
| 9,108,279 | ||||||||||||||
|
| |||||||||||||
Commercial & Professional Services 0.6% | ||||||||||||||
AlixPartners LLP, Second Lien 2013 Recapitalization Term Loan, 9.00%, 7/10/21 | United States | 2,678,927 | 2,710,739 | |||||||||||
Interactive Data Corp., Term Loan, 4.75%, 5/02/21 | United States | 2,238,602 | 2,247,930 | |||||||||||
|
| |||||||||||||
| 4,958,669 | ||||||||||||||
|
| |||||||||||||
Consumer Services 3.3% | ||||||||||||||
24 Hour Fitness Worldwide Inc., Term Loan, 4.75%, 5/28/21 | United States | 945,498 | 902,656 | |||||||||||
Boyd Gaming Corp., Term A Loan, 3.146%, 8/14/18 | United States | 54,575 | 54,609 | |||||||||||
Caesars Entertainment Resort Properties LLC, Term B Loans, 7.00%, 10/11/20 | United States | 4,050,250 | 3,713,573 | |||||||||||
Cannery Casino Resorts LLC, | ||||||||||||||
Second Lien Term Loan, 10.00%, 10/02/19 | United States | 780,000 | 713,700 | |||||||||||
Term Loan, 6.00%, 10/02/18 | United States | 2,930,099 | 2,906,902 | |||||||||||
Fitness International LLC, Term B Loan, 5.50%, 7/01/20 | United States | 4,258,984 | 4,111,253 | |||||||||||
Hilton Worldwide Finance LLC, Initial Term Loan, 3.50%, 10/26/20 | United States | 1,053,531 | 1,054,702 | |||||||||||
ROC Finance LLC, Funded Term B Loans, 5.00%, 6/20/19 | United States | 2,246,088 | 2,205,378 | |||||||||||
Seaworld Parks and Entertainment Inc., Term B-2 Loan, 3.00%, 5/14/20 | United States | 1,538,046 | 1,487,338 | |||||||||||
TGI Friday’s Inc., First Lien Initial Term Loan, 5.25%, 7/15/20 | United States | 467,979 | 470,904 | |||||||||||
| i | Town Sports International LLC, Initial Term Loan, 4.50%, 11/15/20 | United States | 1,366,654 | 1,091,045 | ||||||||||
Travelport Finance Luxembourg S.A.R.L., Initial Term Loan, 5.75%, 9/02/21 | Luxembourg | 2,347,674 | 2,358,433 | |||||||||||
| c,j | Turtle Bay Holdings LLC, Term Loan B, PIK, 3.00%, 6/30/16 | United States | 6,490,742 | 6,506,969 | ||||||||||
|
| |||||||||||||
| 27,577,462 | ||||||||||||||
|
| |||||||||||||
Diversified Financials 0.6% | ||||||||||||||
Guggenheim Partners Investment Management Holdings LLC, Initial Term Loan, 4.25%, 7/22/20 | United States | 927,314 | 931,951 | |||||||||||
Trans Union LLC, 2015 Term B-2 Loans, 3.75%, 4/09/21 | United States | 3,988,167 | 3,960,748 | |||||||||||
|
| |||||||||||||
| 4,892,699 | ||||||||||||||
|
| |||||||||||||
| FSI-18 | Semiannual Report |
FRANKLIN TEMPLETON VARIABLE INSURANCE PRODUCTS TRUST
STATEMENT OF INVESTMENTS (UNAUDITED)
Franklin Strategic Income VIP Fund (continued)
| Country | Principal Amount* | Value | ||||||||||||
| g,k | Senior Floating Rate Interests (continued) | |||||||||||||
Energy 2.1% | ||||||||||||||
Bowie Resource Holdings LLC, | ||||||||||||||
i First Lien Initial Term Loan, 6.75%, 8/16/20 | United States | 2,724,383 | $ | 2,594,975 | ||||||||||
Second Lien Initial Term Loan, 11.75%, 2/16/21 | United States | 480,257 | 457,445 | |||||||||||
Citgo Petroleum Corp., Term B Loan, 4.50%, 7/29/21 | United States | 222,890 | 223,215 | |||||||||||
| i | Drillships Ocean Ventures Inc. and Drillships Ventures Projects Inc., Term Loan, 5.50%, 7/25/21 | Marshall Islands | 2,099,047 | 1,796,784 | ||||||||||
Fieldwood Energy LLC, | ||||||||||||||
i Loans, 3.875%, 10/01/18 | United States | 2,930,400 | 2,796,334 | |||||||||||
Second Lien Loans, 8.375%, 9/30/20 | United States | 468,000 | 359,190 | |||||||||||
| i | Foresight Energy LLC, Term Loans, 5.50%, 8/21/20 | United States | 1,372,000 | 1,361,710 | ||||||||||
OSG Bulk Ships Inc., Initial Term Loan, 5.25%, 8/05/19 | United States | 1,239,185 | 1,240,734 | |||||||||||
OSG International Inc. (OIN), Initial Term Loan, 5.75%, 8/05/19 | United States | 2,012,176 | 2,022,237 | |||||||||||
| i | Peabody Energy Corp., Term Loan, 4.25%, 9/24/20 | United States | 1,781,863 | 1,506,152 | ||||||||||
| i | UTEX Industries Inc., First Lien Initial Term Loan, 5.00%, 5/21/21 | United States | 3,111,139 | 2,888,824 | ||||||||||
Westmoreland Coal Co., Term Loan, 7.50%, 12/16/20 | United States | 661,307 | 644,774 | |||||||||||
|
| |||||||||||||
| 17,892,374 | ||||||||||||||
|
| |||||||||||||
Food, Beverage & Tobacco 0.4% | ||||||||||||||
AdvancePierre Foods Inc., Second Lien Term Loan, 9.50%, 10/10/17 | United States | 1,805,558 | 1,837,155 | |||||||||||
| i | CSM Bakery Supplies LLC (U.S. Acquisition), Second Lien Term Loan, 8.75%, 7/03/21 | United States | 296,913 | 282,810 | ||||||||||
| i | Post Holdings Inc., Series A Incremental Term Loan, 3.75%, 6/02/21 | United States | 1,067,625 | 1,064,480 | ||||||||||
|
| |||||||||||||
| 3,184,445 | ||||||||||||||
|
| |||||||||||||
Health Care Equipment & Services 1.3% | ||||||||||||||
Carestream Health Inc., Second Lien Loan, 9.50%, 12/07/19 | United States | 662,437 | 660,119 | |||||||||||
Community Health Systems Inc., 2018 Term F Loans, 3.534%, 12/31/18 | United States | 986,859 | 987,211 | |||||||||||
Connolly LLC, | ||||||||||||||
i Initial Term Loan, 4.50%, 5/14/21 | United States | 2,676,482 | 2,676,482 | |||||||||||
Second Lien Initial Term Loan, 8.00%, 5/13/22 | United States | 253,793 | 255,697 | |||||||||||
Dialysis Newco Inc., Second Lien Term Loan B, 7.75%, 10/22/21 | United States | 267,300 | 269,973 | |||||||||||
Kinetic Concepts Inc., Dollar Term E-1 Loan, 4.50%, 5/04/18 | United States | 1,006,689 | 1,011,879 | |||||||||||
Millennium Health LLC, Tranche B Term Loan, 5.25%, 4/16/21 | United States | 2,350,675 | 984,345 | |||||||||||
Surgery Centers Holdings Inc., Second Lien Term Loan, 8.50%, 11/03/21 | United States | 269,467 | 269,467 | |||||||||||
Truven Health Analytics Inc., New Tranche B Term Loan, 4.50%, 6/06/19 | United States | 1,730,880 | 1,729,258 | |||||||||||
U.S. Renal Care Inc., Tranche B-2 Term Loan, 4.25%, 7/03/19 | United States | 1,716,635 | 1,717,172 | |||||||||||
|
| |||||||||||||
| 10,561,603 | ||||||||||||||
|
| |||||||||||||
Household & Personal Products 0.9% | ||||||||||||||
FGI Operating Co. LLC (Freedom Group), Term B Loans, 5.50%, 4/19/19 | United States | 4,641,758 | 4,421,275 | |||||||||||
Revlon Consumer Products Corp., Replacement Term Loan, 3.25%, 11/19/17 | United States | 459,530 | 459,721 | |||||||||||
| i | Spectrum Brands Inc., Term Loan B, 5.25%, 6/23/22 | United States | 980,983 | 984,457 | ||||||||||
Sun Products Corp., Tranche B Term Loan, 5.50%, 3/23/20 | United States | 2,170,122 | 2,110,444 | |||||||||||
|
| |||||||||||||
| 7,975,897 | ||||||||||||||
|
| |||||||||||||
| Semiannual Report | FSI-19 |
FRANKLIN TEMPLETON VARIABLE INSURANCE PRODUCTS TRUST
STATEMENT OF INVESTMENTS (UNAUDITED)
Franklin Strategic Income VIP Fund (continued)
| Country | Principal Amount* | Value | ||||||||||||
| g,k | Senior Floating Rate Interests (continued) | |||||||||||||
Materials 2.9% | ||||||||||||||
| i | Appvion Inc., Term Loan, 5.75% - 6.75%, 6/28/19 | United States | 2,949,330 | $ | 2,761,923 | |||||||||
Atkore International Inc., Second Lien Initial Term Loan, 7.75%, 10/09/21 | United States | 219,800 | 206,795 | |||||||||||
Caraustar Industries Inc., | ||||||||||||||
Term Loan B, 8.00%, 5/01/19 | United States | 1,662,052 | 1,670,349 | |||||||||||
Term Loan C, 8.00%, 5/01/19 | United States | 2,726,300 | 2,739,910 | |||||||||||
CD&R Millennium U.S. Acquico LLC, Second Lien Initial Term Loan, 8.75%, 7/31/22 | United States | 585,000 | 579,881 | |||||||||||
The Chemours Co. LLC, Tranche B Term Loan, 3.75%, 5/12/22 | United States | 750,232 | 748,670 | |||||||||||
Coveris Holdings SA, Term B-1 Loan, 4.50%, 5/08/19 | Luxembourg | 2,966,959 | 2,978,703 | |||||||||||
Cyanco Intermediate Corp., Initial Term Loan, 5.50%, 5/01/20 | United States | 3,296,453 | 3,296,453 | |||||||||||
FMG America Finance Inc. (Fortescue Metals Group), Loans, 3.75%, 6/30/19 | Australia | 2,118,932 | 1,886,513 | |||||||||||
HII Holding Corp. (Houghton International), Second Lien Term Loan, 9.50%, 12/21/20 | United States | 575,175 | 577,332 | |||||||||||
Huntsman International LLC, Extended Term B Dollar Loan, 2.731%, 4/19/17 | United States | 378,485 | 378,719 | |||||||||||
Ineos U.S. Finance LLC, Dollar Term Loan, 4.25%, 3/31/22 | United States | 408,802 | 409,185 | |||||||||||
Nexeo Solutions LLC, | ||||||||||||||
Term B-1 Loan, 5.00%, 9/08/17 | United States | 110,369 | 109,035 | |||||||||||
Term B-3 Loan, 5.00%, 9/08/17 | United States | 107,871 | 106,568 | |||||||||||
Novelis Inc., Initial Term Loan, 4.00%, 6/02/22 | Canada | 802,059 | 799,052 | |||||||||||
OCI Beaumont LLC, Term B-3 Loan, 5.50%, 8/20/19 | United States | 1,758,812 | 1,785,195 | |||||||||||
Oxbow Carbon LLC, | ||||||||||||||
First Lien Tranche B Term Loan, 4.25%, 7/19/19 | United States | 328,724 | 328,107 | |||||||||||
Second Lien Initial Term Loan, 8.00%, 1/17/20 | United States | 311,538 | 295,183 | |||||||||||
OXEA GmbH, Second Lien Term Loan, 8.25%, 7/15/20 | Luxembourg | 891,600 | 845,627 | |||||||||||
Solenis International LP and Solenis Holdings, Second Lien Term Loan, 7.75%, 7/31/22 | United States | 174,800 | 169,611 | |||||||||||
Tronox Pigments (Netherlands) BV, Term Loan, 4.25%, 3/19/20 | Netherlands | 264,410 | 264,938 | |||||||||||
Walter Energy Inc., B Term Loan, 7.25%, 4/02/18 | United States | 3,083,004 | 1,700,792 | |||||||||||
|
| |||||||||||||
| 24,638,541 | ||||||||||||||
|
| |||||||||||||
Media 2.2% | ||||||||||||||
| i | AMC Entertainment Inc., Initial Term Loan, 5.00%, 4/30/20 | United States | 344,420 | 344,375 | ||||||||||
Cengage Learning Acquisitions Inc., Original Term Loans, 7.00%, 3/31/20 | United States | 2,661,763 | 2,671,745 | |||||||||||
| i | Charter Communications Operating LLC, Term E Loan, (CCO Safari), 3.00%, 7/01/20 | United States | 1,403,177 | 1,387,742 | ||||||||||
Cumulus Media Holdings Inc., Term Loans, 4.25%, 12/23/20 | United States | 459,266 | 437,164 | |||||||||||
MediArena Acquisition BV, Second Lien Dollar Term B Loan, 10.00%, 8/13/22 | Netherlands | 430,000 | 416,025 | |||||||||||
Radio One Inc., Term Loan B, 4.78%, 12/31/18 | United States | 6,867,843 | 7,003,771 | |||||||||||
UPC Financing Partnership (UPC Broadband Holdings BV), Term Loan AH, 3.25%, 6/30/21 | Netherlands | 1,231,045 | 1,215,657 | |||||||||||
Virgin Media Bristol LLC, F Facility, 3.50%, 6/30/23 | United States | 571,213 | 566,394 | |||||||||||
William Morris Endeavor Entertainment LLC, Term Loans Second Lien, 8.25%, 5/06/22 | United States | 4,466,536 | 4,360,456 | |||||||||||
|
| |||||||||||||
| 18,403,329 | ||||||||||||||
|
| |||||||||||||
| FSI-20 | Semiannual Report |
FRANKLIN TEMPLETON VARIABLE INSURANCE PRODUCTS TRUST
STATEMENT OF INVESTMENTS (UNAUDITED)
Franklin Strategic Income VIP Fund (continued)
| Country | Principal Amount* | Value | ||||||||||||
| g,k | Senior Floating Rate Interests (continued) | |||||||||||||
Pharmaceuticals, Biotechnology & Life Sciences 1.1% | ||||||||||||||
| i | Endo Luxembourg Finance Co. and Endo LLC, Term Loan B, 3.25%, 7/01/22 | United States | 1,526,156 | $ | 1,531,879 | |||||||||
Grifols Worldwide Operations USA Inc., US Tranche B Term Loan, 3.187%, 2/27/21 | United States | 2,766,840 | 2,770,443 | |||||||||||
Horizon Pharma Inc., 2015 Term Loan, 4.50%, 5/07/21 | United States | 54,713 | 54,970 | |||||||||||
Valeant Pharmaceuticals International Inc., | ||||||||||||||
i Series D-2 Tranche B Term Loan, 5.00%, 2/13/19 | United States | 1,340,000 | 1,338,827 | |||||||||||
Series F-1 New Term Loan, 4.00%, 4/01/22 | United States | 3,472,725 | 3,475,094 | |||||||||||
|
| |||||||||||||
| 9,171,213 | ||||||||||||||
|
| |||||||||||||
Real Estate 0.0%† | ||||||||||||||
Capital Automotive LP, Second Lien Term Loan, 6.00%, 4/30/20 | United States | 182,500 | 185,846 | |||||||||||
|
| |||||||||||||
Retailing 0.9% | ||||||||||||||
BJ’s Wholesale Club Inc., | ||||||||||||||
2013 (Nov) Replacement Loans, 4.50%, 9/26/19 | United States | 1,755,822 | 1,759,246 | |||||||||||
Second Lien 2013 (Nov) Replacement Loans, 8.50%, 3/26/20 | United States | 1,915,908 | 1,934,668 | |||||||||||
| i | Dollar Tree Inc., Term B-1 Loans, 3.50%, 3/09/22 | United States | 293,851 | 294,340 | ||||||||||
| i | Evergreen AcqCo. 1 LP (Savers), Term Loan, 5.00%, 7/09/19 | United States | 3,158,333 | 2,956,989 | ||||||||||
The Men’s Wearhouse Inc., Tranche B Term Loan, 4.50%, 6/18/21 | United States | 747,063 | 750,331 | |||||||||||
|
| |||||||||||||
| 7,695,574 | ||||||||||||||
|
| |||||||||||||
Semiconductors & Semiconductor Equipment 0.1% | ||||||||||||||
M/A-COM Technology Solutions Holdings Inc., Initial Term Loan, 4.50%, 5/07/21 | United States | 518,364 | 519,660 | |||||||||||
|
| |||||||||||||
Software & Services 1.6% | ||||||||||||||
BMC Software Finance Inc., Initial U.S. Term Loans, 5.00%, 9/10/20 | United States | 4,804,119 | 4,534,555 | |||||||||||
MoneyGram International Inc., Term Loan, 4.25%, 3/27/20 | United States | 5,139,994 | 4,889,419 | |||||||||||
Sungard Availability Services Capital Inc., Tranche B Term Loan, 6.00%, 3/29/19 | United States | 2,887,509 | 2,656,509 | |||||||||||
Vertafore Inc., Second Lien Term Loan, 9.75%, 10/27/17 | United States | 1,173,616 | 1,189,753 | |||||||||||
|
| |||||||||||||
| 13,270,236 | ||||||||||||||
|
| |||||||||||||
Technology Hardware & Equipment 0.1% | ||||||||||||||
CIENA Corp., Term Loan, 3.75%, 7/15/19 | United States | 228,679 | 229,536 | |||||||||||
| i | CommScope Inc., Tranche 5 Term Loan, 5.25%, 12/29/22 | United States | 389,022 | 389,205 | ||||||||||
| i | Dell International LLC, Term B-2 Loan, 5.50%, 4/29/20 | United States | 296,201 | 296,492 | ||||||||||
|
| |||||||||||||
| 915,233 | ||||||||||||||
|
| |||||||||||||
Telecommunication Services 0.2% | ||||||||||||||
Intelsat Jackson Holdings SA, Tranche B-2 Term Loan, 3.75%, 6/30/19 | Luxembourg | 1,328,748 | 1,320,997 | |||||||||||
|
| |||||||||||||
Transportation 0.3% | ||||||||||||||
American Airlines Inc., 2015 Term Loans, 3.50%, 6/27/20 | United States | 1,170,000 | 1,161,225 | |||||||||||
| i | Navios Maritime Midstream Partners LP, Term Loan B, 6.75%, 6/18/20 | Marshall Islands | 1,305,136 | 1,301,873 | ||||||||||
|
| |||||||||||||
| 2,463,098 | ||||||||||||||
|
| |||||||||||||
Utilities 0.2% | ||||||||||||||
Calpine Construction Finance Co. LP, | ||||||||||||||
Term B-1 Loan, 3.00%, 5/03/20 | United States | 1,189,486 | 1,170,652 | |||||||||||
Term B-2 Loan, 3.25%, 1/31/22 | United States | 296,533 | 292,919 | |||||||||||
| Semiannual Report | FSI-21 |
FRANKLIN TEMPLETON VARIABLE INSURANCE PRODUCTS TRUST
STATEMENT OF INVESTMENTS (UNAUDITED)
Franklin Strategic Income VIP Fund (continued)
| Country | Principal Amount* | Value | ||||||||||||
| g,k | Senior Floating Rate Interests (continued) | |||||||||||||
Utilities (continued) | ||||||||||||||
Calpine Corp., Term Loan (B5), 3.50%, 5/27/22 | United States | 492,357 | $ | 488,703 | ||||||||||
|
| |||||||||||||
| 1,952,274 | ||||||||||||||
|
| |||||||||||||
Total Senior Floating Rate Interests (Cost $178,340,231) | 174,128,441 | |||||||||||||
|
| |||||||||||||
Foreign Government and Agency Securities 16.1% | ||||||||||||||
Government of Hungary, | ||||||||||||||
5.50%, 2/12/16 | Hungary | 1,454,700,000 | HUF | 5,284,057 | ||||||||||
5.50%, 12/22/16 | Hungary | 46,690,000 | HUF | 175,880 | ||||||||||
6.50%, 6/24/19 | Hungary | 206,000,000 | HUF | 835,261 | ||||||||||
7.50%, 11/12/20 | Hungary | 313,570,000 | HUF | 1,350,995 | ||||||||||
A, 6.75%, 11/24/17 | Hungary | 104,470,000 | HUF | 414,462 | ||||||||||
A, 5.50%, 12/20/18 | Hungary | 34,100,000 | HUF | 133,553 | ||||||||||
A, 7.00%, 6/24/22 | Hungary | 930,000 | HUF | 3,962 | ||||||||||
A, 6.00%, 11/24/23 | Hungary | 1,270,000 | HUF | 5,192 | ||||||||||
senior note, 6.25%, 1/29/20 | Hungary | 3,000,000 | 3,365,145 | |||||||||||
senior note, 6.375%, 3/29/21 | Hungary | 1,000,000 | 1,138,785 | |||||||||||
Government of Indonesia, FR34, 12.80%, 6/15/21 | Indonesia | 17,235,000,000 | IDR | 1,562,746 | ||||||||||
Government of Malaysia, | ||||||||||||||
3.835%, 8/12/15 | Malaysia | 7,475,000 | MYR | 1,981,751 | ||||||||||
4.72%, 9/30/15 | Malaysia | 10,268,000 | MYR | 2,731,035 | ||||||||||
3.197%, 10/15/15 | Malaysia | 13,330,000 | MYR | 3,532,741 | ||||||||||
senior bond, 3.814%, 2/15/17 | Malaysia | 2,500,000 | MYR | 669,342 | ||||||||||
senior bond, 4.24%, 2/07/18 | Malaysia | 600,000 | MYR | 162,783 | ||||||||||
senior note, 3.172%, 7/15/16 | Malaysia | 32,500,000 | MYR | 8,619,322 | ||||||||||
Government of Mexico, | ||||||||||||||
8.00%, 12/17/15 | Mexico | 753,560 | m MXN | 4,899,563 | ||||||||||
6.25%, 6/16/16 | Mexico | 1,524,310 | m MXN | 9,947,454 | ||||||||||
7.25%, 12/15/16 | Mexico | 930,330 | m MXN | 6,203,946 | ||||||||||
Government of Poland, | ||||||||||||||
6.25%, 10/24/15 | Poland | 9,134,000 | PLN | 2,462,542 | ||||||||||
4.75%, 10/25/16 | Poland | 31,000,000 | PLN | 8,552,467 | ||||||||||
Strip, 7/25/15 | Poland | 2,052,000 | PLN | 544,878 | ||||||||||
Strip, 1/25/16 | Poland | 1,066,000 | PLN | 280,797 | ||||||||||
| d | Government of Portugal, 144A, 5.125%, 10/15/24 | Portugal | 5,000,000 | 5,150,775 | ||||||||||
| d | Government of Serbia, senior note, 144A, | |||||||||||||
4.875%, 2/25/20 | Serbia | 4,410,000 | 4,469,513 | |||||||||||
7.25%, 9/28/21 | Serbia | 1,000,000 | 1,123,795 | |||||||||||
Government of Singapore, senior note, 1.125%, 4/01/16 | Singapore | 7,350,000 | SGD | 5,466,798 | ||||||||||
Government of Sri Lanka, | ||||||||||||||
A, 6.50%, 7/15/15 | Sri Lanka | 28,980,000 | LKR | 216,467 | ||||||||||
A, 6.40%, 8/01/16 | Sri Lanka | 19,500,000 | LKR | 145,405 | ||||||||||
B, 6.40%, 10/01/16 | Sri Lanka | 16,000,000 | LKR | 119,022 | ||||||||||
B, 8.50%, 7/15/18 | Sri Lanka | 15,280,000 | LKR | 116,459 | ||||||||||
C, 8.50%, 4/01/18 | Sri Lanka | 8,070,000 | LKR | 61,667 | ||||||||||
D, 8.50%, 6/01/18 | Sri Lanka | 54,050,000 | LKR | 412,456 | ||||||||||
Government of the Philippines, | ||||||||||||||
senior bond, 7.00%, 1/27/16 | Philippines | 80,000,000 | PHP | 1,811,808 | ||||||||||
senior note, 1.625%, 4/25/16 | Philippines | 155,000,000 | PHP | 3,417,660 | ||||||||||
| FSI-22 | Semiannual Report |
FRANKLIN TEMPLETON VARIABLE INSURANCE PRODUCTS TRUST
STATEMENT OF INVESTMENTS (UNAUDITED)
Franklin Strategic Income VIP Fund (continued)
| Country | Principal Amount* | Value | ||||||||||||
Foreign Government and Agency Securities (continued) | ||||||||||||||
| d | Government of Ukraine, | |||||||||||||
144A, 7.75%, 9/23/20 | Ukraine | 3,850,000 | $ | 1,901,457 | ||||||||||
senior bond, 144A, 7.80%, 11/28/22 | Ukraine | 2,790,000 | 1,468,237 | |||||||||||
senior note, 144A, 7.95%, 2/23/21 | Ukraine | 2,120,000 | 1,119,625 | |||||||||||
senior note, 144A, 7.50%, 4/17/23 | Ukraine | 1,000,000 | 525,625 | |||||||||||
| n | Government of Uruguay, senior bond, Index Linked, 4.375%, 12/15/28 | Uruguay | 174,338,838 | UYU | 6,203,396 | |||||||||
Korea Monetary Stabilization Bond, senior note, | ||||||||||||||
2.80%, 8/02/15 | South Korea | 1,324,510,000 | KRW | 1,184,295 | ||||||||||
2.81%, 10/02/15 | South Korea | 6,000,000,000 | KRW | 5,376,025 | ||||||||||
2.07%, 12/02/16 | South Korea | 3,750,000,000 | KRW | 3,368,985 | ||||||||||
Korea Treasury Bond, senior note, | ||||||||||||||
2.75%, 12/10/15 | South Korea | 5,847,900,000 | KRW | 5,250,454 | ||||||||||
3.00%, 12/10/16 | South Korea | 5,500,000,000 | KRW | 5,006,083 | ||||||||||
Nota Do Tesouro Nacional, | ||||||||||||||
10.00%, 1/01/17 | Brazil | 7,500 | o BRL | 2,291,035 | ||||||||||
10.00%, 1/01/23 | Brazil | 4,000 | o BRL | 1,134,117 | ||||||||||
p Index Linked, 6.00%, 8/15/16 | Brazil | 1,604 | o BRL | 1,356,529 | ||||||||||
p Index Linked, 6.00%, 8/15/18 | Brazil | 5,525 | o BRL | 4,648,173 | ||||||||||
p Index Linked, 6.00%, 5/15/23 | Brazil | 2,250 | o BRL | 1,875,427 | ||||||||||
Uruguay Notas del Tesoro, | ||||||||||||||
10.25%, 8/22/15 | Uruguay | 59,720,000 | UYU | 2,207,981 | ||||||||||
9.50%, 1/27/16 | Uruguay | 9,220,000 | UYU | 341,379 | ||||||||||
n 18, Index Linked, 2.25%, 8/23/17 | Uruguay | 27,357,989 | UYU | 959,404 | ||||||||||
Uruguay Treasury Bill, Strip, | ||||||||||||||
7/02/15 | Uruguay | 510,000 | UYU | 18,876 | ||||||||||
8/20/15 | Uruguay | 35,364,000 | UYU | 1,287,839 | ||||||||||
|
| |||||||||||||
Total Foreign Government and Agency Securities | 134,895,426 | |||||||||||||
|
| |||||||||||||
U.S. Government and Agency Securities 3.1% | ||||||||||||||
U.S. Treasury Bond, | ||||||||||||||
7.875%, 2/15/21 | United States | 900,000 | 1,194,047 | |||||||||||
6.50%, 11/15/26 | United States | 2,400,000 | 3,371,439 | |||||||||||
U.S. Treasury Note, | ||||||||||||||
4.625%, 2/15/17 | United States | 600,000 | 639,422 | |||||||||||
3.75%, 11/15/18 | United States | 7,000,000 | 7,598,829 | |||||||||||
2.75%, 2/15/24 | United States | 4,000,000 | 4,147,812 | |||||||||||
2.50%, 5/15/24 | United States | 6,000,000 | 6,095,154 | |||||||||||
n Index Linked, 2.125%, 1/15/19 | United States | 771,348 | 839,081 | |||||||||||
n Index Linked, 0.625%, 7/15/21 | United States | 1,679,503 | 1,732,906 | |||||||||||
|
| |||||||||||||
Total U.S. Government and Agency Securities | 25,618,690 | |||||||||||||
|
| |||||||||||||
Asset-Backed Securities and Commercial Mortgage-Backed Securities 6.5% | ||||||||||||||
Banks 3.6% | ||||||||||||||
Banc of America Commercial Mortgage Trust, 2006-4, AJ, 5.695%, 7/10/46 | United States | 1,807,000 | 1,854,000 | |||||||||||
| g | Bear Stearns Adjustable Rate Mortgage Trust, 2004-4, A6, FRN, 2.68%, 6/25/34 | United States | 2,018,905 | 2,038,781 | ||||||||||
| Semiannual Report | FSI-23 |
FRANKLIN TEMPLETON VARIABLE INSURANCE PRODUCTS TRUST
STATEMENT OF INVESTMENTS (UNAUDITED)
Franklin Strategic Income VIP Fund (continued)
| Country | Principal Amount* | Value | ||||||||||||
Asset-Backed Securities and Commercial Mortgage-Backed Securities (continued) | ||||||||||||||
Banks (continued) | ||||||||||||||
Bear Stearns Commercial Mortgage Securities Inc., | ||||||||||||||
g 2006-PW11, AJ, FRN, 5.597%, 3/11/39 | United States | 1,000,000 | $ | 1,018,520 | ||||||||||
g 2006-PW12, AJ, FRN, 5.94%, 9/11/38 | United States | 1,440,000 | 1,470,541 | |||||||||||
2006-PW13, AJ, 5.611%, 9/11/41 | United States | 5,100,000 | 5,185,514 | |||||||||||
Citigroup Commercial Mortgage Trust, | ||||||||||||||
2006-C5, AJ, 5.482%, 10/15/49 | United States | 1,882,000 | 1,879,062 | |||||||||||
g 2007-C6, AM, FRN, 5.899%, 6/10/17 | United States | 2,500,000 | 2,650,806 | |||||||||||
2015-GC27, A5, 3.137%, 2/10/48 | United States | 610,000 | 600,580 | |||||||||||
| g | Citigroup/Deutsche Bank Commercial Mortgage Trust, 2006-CD3, AJ, FRN, 5.688%, 10/15/48 | United States | 2,700,000 | 2,617,299 | ||||||||||
Countrywide Asset-Backed Certificates, 2005-11, AF4, 5.21%, 3/25/34 | United States | 1,275,000 | 1,245,843 | |||||||||||
CSAIL Commercial Mortgage Trust, 2015-C1, A4, 3.505%, 4/15/50 | United States | 550,000 | 562,236 | |||||||||||
Greenwich Capital Commercial Funding Corp., | ||||||||||||||
g 2006-GG7, AJ, FRN, 6.013%, 7/10/38 | United States | 2,560,000 | 2,595,539 | |||||||||||
2007-GG9, AM, 5.475%, 3/10/39 | United States | 1,030,000 | 1,076,726 | |||||||||||
JPMBB Commercial Mortgage Securities Trust, 2015-C28, A4, 3.227%, 10/15/48 | United States | 550,000 | 543,918 | |||||||||||
JP Morgan Chase Commercial Mortgage Securities Trust, | ||||||||||||||
2006-CB17, AM, 5.464%, 12/12/43 | United States | 760,000 | 782,504 | |||||||||||
g 2006-LDP7, AJ, FRN, 6.10%, 4/15/45 | United States | 1,680,000 | 1,680,400 | |||||||||||
| g | Merrill Lynch Mortgage Investors Trust, 2005-A6, 2A3, FRN, 0.567%, 8/25/35 | United States | 345,285 | 313,865 | ||||||||||
| g | Morgan Stanley Capital I Trust, 2006-HQ8, AJ, FRN, 5.681%, 3/12/44 | United States | 200,000 | 202,999 | ||||||||||
Wells Fargo Commercial Mortgage Trust, 2014-LC16, A4, 3.548%, 8/15/50 | United States | 220,000 | 226,612 | |||||||||||
Wells Fargo Mortgage Backed Securities Trust, | ||||||||||||||
g 2004-W, A9, FRN, 2.614%, 11/25/34 | United States | 1,063,415 | 1,082,083 | |||||||||||
2007-3, 3A1, 5.50%, 4/25/37 | United States | 300,815 | 311,032 | |||||||||||
|
| |||||||||||||
| 29,938,860 | ||||||||||||||
|
| |||||||||||||
Diversified Financials 2.9% | ||||||||||||||
| d,g | ARES CLO XII Ltd., 2007-12A, B, 144A, FRN, 1.282%, 11/25/20 | United States | 1,380,000 | 1,363,399 | ||||||||||
| d,g | Atrium CDO Corp., 10A, C, 144A, FRN, 2.876%, 7/16/25 | United States | 1,400,000 | 1,389,962 | ||||||||||
| d,g | Atrium XI, 11A, C, 144A, FRN, 3.477%, 10/23/25 | Cayman Islands | 1,820,000 | 1,828,026 | ||||||||||
| d,g | BCAP LLC Trust, 2009-RR1, 2A2, 144A, FRN, 2.644%, 5/26/35 | United States | 440,000 | 419,984 | ||||||||||
| d,g | Catamaran CLO Ltd., 2013-1A, C, 144A, FRN, 2.877%, 1/27/25 | Cayman Islands | 1,130,000 | 1,106,677 | ||||||||||
| d,g | Cent CDO Ltd., 2007-15A, A2B, 144A, FRN, 0.626%, 3/11/21 | United States | 1,251,000 | 1,190,464 | ||||||||||
| d,g | Cent CLO LP, 2013-17A, D, 144A, FRN, 3.278%, 1/30/25 | Cayman Islands | 784,314 | 786,314 | ||||||||||
| d,g | CIFC Funding Ltd., 2007-3A, A1J, 144A, FRN, 0.677%, 7/26/21 | United States | 960,000 | 941,779 | ||||||||||
| d,g | ColumbusNova CLO Ltd., 2007-2A, A2, 144A, FRN, 1.275%, 10/15/21 | United States | 860,000 | 844,159 | ||||||||||
| d,g | CT CDO IV Ltd., 2006-4A, A1, 144A, FRN, 0.497%, 10/20/43 | United States | 1,258,983 | 1,256,623 | ||||||||||
| d,g | Eaton Vance CDO Ltd., 2014-1A, | |||||||||||||
B, 144A, FRN, 2.325%, 7/15/26 | United States | 426,000 | 428,313 | |||||||||||
C, 144A, FRN, 3.275%, 7/15/26 | United States | 167,100 | 167,414 | |||||||||||
| g | FHLMC Structured Agency Credit Risk Debt Notes, | |||||||||||||
2014-DN1, M2, FRN, 2.387%, 2/25/24 | United States | 1,500,000 | 1,502,966 | |||||||||||
2014-HQ2, M2, FRN, 2.387%, 9/25/24 | United States | 1,000,000 | 993,866 | |||||||||||
| FSI-24 | Semiannual Report |
FRANKLIN TEMPLETON VARIABLE INSURANCE PRODUCTS TRUST
STATEMENT OF INVESTMENTS (UNAUDITED)
Franklin Strategic Income VIP Fund (continued)
| Country | Principal Amount* | Value | ||||||||||||
Asset-Backed Securities and Commercial Mortgage-Backed Securities (continued) | ||||||||||||||
Diversified Financials (continued) | ||||||||||||||
| g | FHLMC Structured Agency Credit Risk Debt Notes, (continued) | |||||||||||||
2015-HQ1, M2, FRN, 2.387%, 3/25/25 | United States | 1,000,000 | $ | 993,760 | ||||||||||
| d | G-Force LLC, 2005-RRA, C, 144A, 5.20%, 8/22/36 | United States | 2,000,000 | 1,949,480 | ||||||||||
| g | Impac Secured Assets Trust, 2007-2, FRN, 0.437%, 4/25/37 | United States | 317,866 | 294,716 | ||||||||||
| d,g | ING Investment Management CLO Ltd., | |||||||||||||
2013-1A, B, 144A, FRN, 3.175%, 4/15/24 | Cayman Islands | 270,000 | 270,680 | |||||||||||
2013-1A, C, 144A, FRN, 3.775%, 4/15/24 | Cayman Islands | 440,000 | 433,594 | |||||||||||
2013-2A, B, 144A, FRN, 2.957%, 4/25/25 | United States | 1,080,000 | 1,075,604 | |||||||||||
| d,g | Invitation Homes Trust, 2015-SFR1, A, 144A, FRN, 1.635%, 3/17/32 | United States | 1,471,496 | 1,478,737 | ||||||||||
| g | MortgageIT Trust, 2004-1, A2, FRN, 1.087%, 11/25/34 | United States | 377,914 | 363,108 | ||||||||||
| d,g | Newcastle CDO Ltd., 2004-5A, 1, 144A, FRN, 0.622%, 12/24/39 | United States | 202,010 | 199,796 | ||||||||||
| g | Opteum Mortgage Acceptance Corp. Trust, 2005-4, 1APT, FRN, 0.497%, 11/25/35 | United States | 647,731 | 612,717 | ||||||||||
Residential Asset Securities Corp., 2004-KS1, AI4, 4.213%, 4/25/32 | United States | 20,066 | 20,058 | |||||||||||
| g | Structured Asset Securities Corp., 2005-2XS, 2A2, FRN, 1.684%, 2/25/35 | United States | 350,471 | 339,015 | ||||||||||
| g,q | Talisman 6 Finance, Reg S, FRN, 0.191%, 10/22/16 | Germany | 1,394,253 | EUR | 1,536,143 | |||||||||
| g | Thornburg Mortgage Securities Trust, 2005-1, A3, FRN, 2.23%, 4/25/45 | United States | 335,921 | 338,328 | ||||||||||
|
| |||||||||||||
| 24,125,682 | ||||||||||||||
|
| |||||||||||||
Total Asset-Backed Securities and Commercial Mortgage-Backed Securities (Cost $51,927,722) | 54,064,542 | |||||||||||||
|
| |||||||||||||
Mortgage-Backed Securities 2.4% | ||||||||||||||
| g | Federal Home Loan Mortgage Corp. (FHLMC) Adjustable Rate 0.0%† |
| ||||||||||||
FHLMC, 2.348%, 1/01/33 | United States | 54,231 | 56,856 | |||||||||||
|
| |||||||||||||
Federal Home Loan Mortgage Corp. (FHLMC) Fixed Rate 0.4% | ||||||||||||||
FHLMC Gold 15 Year, 5.50%, 7/01/17 - 7/01/19 | United States | 73,071 | 77,013 | |||||||||||
FHLMC Gold 15 Year, 6.00%, 5/01/17 | United States | 2,874 | 2,956 | |||||||||||
FHLMC Gold 15 Year, 6.50%, 5/01/16 | United States | 176 | 178 | |||||||||||
| i | FHLMC Gold 30 Year, 3.50%, 7/01/45 | United States | 1,648,000 | 1,692,063 | ||||||||||
FHLMC Gold 30 Year, 5.00%, 4/01/34 - 8/01/35 | United States | 367,109 | 405,946 | |||||||||||
FHLMC Gold 30 Year, 5.50%, 3/01/33 - 1/01/35 | United States | 320,851 | 360,226 | |||||||||||
FHLMC Gold 30 Year, 6.00%, 4/01/33 - 2/01/36 | United States | 286,146 | 326,168 | |||||||||||
FHLMC Gold 30 Year, 6.50%, 12/01/23 - 6/01/36 | United States | 67,833 | 78,205 | |||||||||||
FHLMC Gold 30 Year, 7.00%, 9/01/21 - 4/01/30 | United States | 29,550 | 33,533 | |||||||||||
FHLMC Gold 30 Year, 7.50%, 8/01/30 - 7/01/31 | United States | 1,183 | 1,273 | |||||||||||
|
| |||||||||||||
| 2,977,561 | ||||||||||||||
|
| |||||||||||||
| g | Federal National Mortgage Association (FNMA) Adjustable Rate 0.0%† |
| ||||||||||||
FNMA, 2.31% - 2.42%, 4/01/20 - 12/01/34 | United States | 199.351 | 211,468 | |||||||||||
|
| |||||||||||||
Federal National Mortgage Association (FNMA) Fixed Rate 1.7% | ||||||||||||||
| i | FNMA 15 Year, 2.50%, 7/01/22 - 7/01/30 | United States | 3,423,933 | 3,464,640 | ||||||||||
FNMA 15 Year, 4.50%, 6/01/19 - 3/01/20 | United States | 108,732 | 113,392 | |||||||||||
FNMA 15 Year, 5.00%, 10/01/17 - 6/01/18 | United States | 76,178 | 79,786 | |||||||||||
FNMA 15 Year, 5.50%, 3/01/16 - 11/01/18 | United States | 412,157 | 428,087 | |||||||||||
FNMA 15 Year, 6.00%, 4/01/16 - 7/01/16 | United States | 567 | 568 | |||||||||||
| i | FNMA 30 Year, 3.00%, 7/01/45 | United States | 4,578,000 | 4,550,460 | ||||||||||
| i | FNMA 30 Year, 3.50%, 7/01/45 | United States | 4,887,000 | 5,027,024 | ||||||||||
| Semiannual Report | FSI-25 |
FRANKLIN TEMPLETON VARIABLE INSURANCE PRODUCTS TRUST
STATEMENT OF INVESTMENTS (UNAUDITED)
Franklin Strategic Income VIP Fund (continued)
| Country | Principal Amount* | Value | ||||||||||||
Mortgage-Backed Securities (continued) | ||||||||||||||
Federal National Mortgage Association (FNMA) Fixed Rate (continued) |
| |||||||||||||
FNMA 30 Year, 5.00%, 4/01/30 | United States | 116,006 | $ | 128,100 | ||||||||||
FNMA 30 Year, 6.50%, 6/01/28 - 10/01/37 | United States | 314,447 | 361,507 | |||||||||||
|
| |||||||||||||
| 14,153,564 | ||||||||||||||
|
| |||||||||||||
Government National Mortgage Association (GNMA) Fixed Rate 0.3% |
| |||||||||||||
GNMA I SF 30 Year, 5.00%, 11/15/33 - 7/15/34 | United States | 402,588 | 450,175 | |||||||||||
GNMA I SF 30 Year, 6.50%, 2/15/32 | United States | 2,126 | 2,427 | |||||||||||
GNMA I SF 30 Year, 7.00%, 10/15/28 - 6/15/32 | United States | 19,585 | 20,033 | |||||||||||
GNMA I SF 30 Year, 7.50%, 9/15/30 | United States | 1,497 | 1,788 | |||||||||||
| i | GNMA II SF 30 Year, 3.00%, 7/01/45 | United States | 100,000 | 100,768 | ||||||||||
| i | GNMA II SF 30 Year, 3.50%, 7/01/45 | United States | 1,920,000 | 1,989,075 | ||||||||||
GNMA II SF 30 Year, 5.00%, 9/20/33 - 11/20/33 | United States | 118,817 | 132,979 | |||||||||||
GNMA II SF 30 Year, 6.00%, 11/20/34 | United States | 136,718 | 159,736 | |||||||||||
GNMA II SF 30 Year, 6.50%, 4/20/31 - 2/20/34 | United States | 62,981 | 73,798 | |||||||||||
GNMA II SF 30 Year, 7.50%, 1/20/28 - 4/20/32 | United States | 16,496 | 19,396 | |||||||||||
|
| |||||||||||||
| 2,950,175 | ||||||||||||||
|
| |||||||||||||
Total Mortgage-Backed Securities (Cost $20,052,123) | 20,349,624 | |||||||||||||
|
| |||||||||||||
Municipal Bonds 4.3% | ||||||||||||||
Arkansas State GO, Four-Lane Highway Construction and Improvement Bonds, 3.25%, 6/15/22 | United States | 400,000 | 428,340 | |||||||||||
California State GO, Various Purpose, | ||||||||||||||
5.25%, 11/01/40 | United States | 560,000 | 643,462 | |||||||||||
Refunding, 5.25%, 3/01/38 | United States | 1,500,000 | 1,633,845 | |||||||||||
Refunding, 5.00%, 4/01/38 | United States | 2,000,000 | 2,162,260 | |||||||||||
Refunding, NATL Insured, 4.50%, 12/01/32 | United States | 300,000 | 313,299 | |||||||||||
Series 1, AGMC Insured, Pre-Refunded, 4.75%, 9/01/31 | United States | 290,000 | 298,526 | |||||||||||
Chicago GO, | ||||||||||||||
Build America Bonds, Direct Payment, Taxable Project, Series B, 7.517%, 1/01/40 | United States | 355,000 | 362,242 | |||||||||||
Taxable Project, Series B, 6.034%, 1/01/42 | United States | 500,000 | 422,460 | |||||||||||
Colorado State ISD, GO, Mitchell and Scurry Counties, School Building, PSF Guarantee, 5.00%, 8/15/43 | United States | 300,000 | 331,518 | |||||||||||
Evansville Local Public Improvement Bond Bank Revenue, Sewage Works Project, Series A, 5.00%, 7/01/36 | United States | 675,000 | 739,949 | |||||||||||
Florida Hurricane Catastrophe Fund Finance Corp. Revenue, Series A, 2.995%, 7/01/20 | United States | 3,000,000 | 3,060,300 | |||||||||||
Illinois State GO, | ||||||||||||||
5.877%, 3/01/19 | United States | 2,000,000 | 2,163,720 | |||||||||||
Build America Bonds, 7.35%, 7/01/35 | United States | 1,000,000 | 1,107,930 | |||||||||||
Massachusetts State GO, Consolidated Loan of 2014, Series A, 4.50%, 12/01/43 | United States | 2,300,000 | 2,414,678 | |||||||||||
Minnesota State GO, Various Purpose, Refunding, Series F, 4.00%, 10/01/24 | United States | 2,650,000 | 2,990,419 | |||||||||||
Nassau County GO, General Improvement Bonds, Series B, 5.00%, | ||||||||||||||
4/01/39 | United States | 1,500,000 | 1,624,815 | |||||||||||
4/01/43 | United States | 1,600,000 | 1,709,856 | |||||||||||
New Jersey EDA Revenue, School Facilities Construction, Refunding, Series NN, 5.00%, 3/01/30 | United States | 700,000 | 719,215 | |||||||||||
| FSI-26 | Semiannual Report |
FRANKLIN TEMPLETON VARIABLE INSURANCE PRODUCTS TRUST
STATEMENT OF INVESTMENTS (UNAUDITED)
Franklin Strategic Income VIP Fund (continued)
| Country | Principal Amount* | Value | ||||||||||||
Municipal Bonds (continued) | ||||||||||||||
New York City HDC Revenue, Series B1, 5.00%, 7/01/33 | United States | 500,000 | $ | 558,875 | ||||||||||
New York City Municipal Water Finance Authority Water and Sewer System Revenue, Second General Resolution, Fiscal 2014, Refunding, Series BB, 5.00%, 6/15/46 | United States | 2,430,000 | 2,656,112 | |||||||||||
New York State Urban Development Corp. Revenue, State Personal Income Tax, General Purpose, Series C, 5.00%, 3/15/29 | United States | 1,500,000 | 1,712,385 | |||||||||||
Port Authority of New York and New Jersey Revenue, Consolidated, One Hundred Ninety-First Series A, 4.823%, 6/01/45 | United States | 3,500,000 | 3,470,810 | |||||||||||
Puerto Rico Electric Power Authority Power Revenue, | ||||||||||||||
Series A, 6.75%, 7/01/36 | United States | 3,465,000 | 1,879,971 | |||||||||||
Series XX, 5.25%, 7/01/40 | United States | 165,000 | 89,522 | |||||||||||
Puerto Rico Sales Tax FICO Revenue, Capital Appreciation, Refunding, Series A, zero cpn., 8/01/26 | United States | 275,000 | 76,447 | |||||||||||
Puerto Rico Sales Tax FICO Sales Tax Revenue, | ||||||||||||||
Capital Appreciation, Series A, zero cpn., 8/01/25 | United States | 320,000 | 99,654 | |||||||||||
first subordinate, Series A, 5.75%, 8/01/37 | United States | 500,000 | 276,250 | |||||||||||
first subordinate, Series A, 6.50%, 8/01/44 | United States | 2,500,000 | 1,393,750 | |||||||||||
South Carolina State Public Service Authority Revenue, Refunding, Series B, 5.00%, 12/01/38 | United States | 1,000,000 | 1,090,850 | |||||||||||
|
| |||||||||||||
Total Municipal Bonds (Cost $36,882,968) | 36,431,460 | |||||||||||||
|
| |||||||||||||
| Shares | ||||||||||||||
Escrows and Litigation Trusts 0.0% | ||||||||||||||
| a,l | Comfort Co. Inc., Escrow Account | United States | 13,427 | — | ||||||||||
| a,l | NewPage Corp., Litigation Trust | United States | 2,500,000 | — | ||||||||||
|
| |||||||||||||
Total Escrows and Litigation Trusts (Cost $ —) | — | |||||||||||||
|
| |||||||||||||
Total Investments before Short Term Investments (Cost $810,495,316) | 772,471,324 | |||||||||||||
|
| |||||||||||||
| Principal Amount* | ||||||||||||||
Short Term Investments 9.0% | ||||||||||||||
Foreign Government and Agency Securities (Cost $3,976,926) 0.5% | ||||||||||||||
Korea Monetary Stabilization Bond, senior note, 2.79%, 6/02/16 | South Korea | 4,400,000,000 | KRW | 3,972,635 | ||||||||||
|
| |||||||||||||
Total Investments before Money Market Funds (Cost $814,472,242) | 776,443,959 | |||||||||||||
|
| |||||||||||||
| Shares | ||||||||||||||
Money Market Funds (Cost $70,999,990) 8.5% | ||||||||||||||
| a,r | Institutional Fiduciary Trust Money Market Portfolio | United States | 70,999,990 | 70,999,990 | ||||||||||
|
| |||||||||||||
Total Investments (Cost $885,472,232) 101.2% | 847,443,949 | |||||||||||||
Other Assets, less Liabilities (1.2)% | (9,644,312 | ) | ||||||||||||
|
| |||||||||||||
Net Assets 100.0% | $ | 837,799,637 | ||||||||||||
|
| |||||||||||||
| Semiannual Report | FSI-27 |
FRANKLIN TEMPLETON VARIABLE INSURANCE PRODUCTS TRUST
STATEMENT OF INVESTMENTS (UNAUDITED)
Franklin Strategic Income VIP Fund (continued)
†Rounds to less than 0.1% of net assets.
*The principal amount is stated in U.S. dollars unless otherwise indicated.
aNon-income producing.
bThe security is owned by FT Holdings Corporation III, a wholly-owned subsidiary of the Fund. See Note 1(g).
cAt June 30, 2015, pursuant to the Fund’s policies and the requirements of applicable securities law, the Fund may be restricted from trading these securities for a limited or extended period of time.
dSecurity was purchased pursuant to Rule 144A under the Securities Act of 1933 and may be sold in transactions exempt from registration only to qualified institutional buyers or in a public offering registered under the Securities Act of 1933. These securities have been deemed liquid under guidelines approved by the Trust’s Board of Trustees. At June 30, 2015, the aggregate value of these securities was $169,457,707, representing 20.23% of net assets.
ePerpetual security with no stated maturity date.
fSee Note 7 regarding defaulted securities.
gThe coupon rate shown represents the rate at period end.
hSee Note 1(f) regarding loan participation notes.
iA portion or all of the security purchased on a when-issued, delayed delivery, or to-be-announced (TBA) basis. See Note 1(c).
jIncome may be received in additional securities and/or cash.
kSee Note 1(i) regarding senior floating rate interests.
lSecurity has been deemed illiquid because it may not be able to be sold within seven days. At June 30, 2015, the aggregate value of these securities was $154,500, representing 0.02% of net assets.
mPrincipal amount is stated in 100 Mexican Peso Units
nPrincipal amount of security is adjusted for inflation. See Note 1(k).
oPrincipal amount is stated in 1,000 Brazilian Real Units.
pRedemption price at maturity is adjusted for inflation. See Note 1(k).
qSecurity was purchased pursuant to Regulation S under the Securities Act of 1933, which exempts from registration securities offered and sold outside of the United States. Such a security cannot be sold in the United States without either an effective registration statement filed pursuant to the Securities Act of 1933, or pursuant to an exemption from registration. This security has been deemed liquid under guidelines approved by the Trust’s Board of Trustees. At June 30, 2015, the value of this security was $1,536,143, representing 0.18% of net assets.
rSee Note 3(e) regarding investments in Institutional Fiduciary Trust Money Market Portfolio.
At June 30, 2015, the Fund had the following forward exchange contracts outstanding. See Note 1(d).
| Forward Exchange Contracts | ||||||||||||||||||||||||||||
| Currency | Counterpartya | Type | Quantity | Contract Amount | Settlement Date | Unrealized Appreciation | Unrealized Depreciation | |||||||||||||||||||||
| OTC Forward Exchange Contracts | ||||||||||||||||||||||||||||
Chilean Peso | BZWS | Buy | 477,650,000 | $ | 764,240 | 7/23/15 | $ | — | $ | (18,711 | ) | |||||||||||||||||
Chilean Peso | DBAB | Buy | 140,000,000 | 223,642 | 7/23/15 | — | (5,126 | ) | ||||||||||||||||||||
Euro | BZWS | Sell | 167,374 | 199,799 | 7/23/15 | 13,210 | — | |||||||||||||||||||||
Euro | DBAB | Buy | 1,333,927 | 1,500,268 | 7/23/15 | — | (13,202 | ) | ||||||||||||||||||||
Euro | DBAB | Sell | 1,404,872 | 1,677,880 | 7/23/15 | 111,726 | — | |||||||||||||||||||||
Euro | JPHQ | Sell | 4,984,544 | 5,954,900 | 7/23/15 | 398,117 | — | |||||||||||||||||||||
Indian Rupee | CITI | Buy | 4,537,000 | 71,562 | 7/23/15 | — | (444 | ) | ||||||||||||||||||||
Indian Rupee | DBAB | Buy | 307,316,000 | 4,692,564 | 7/23/15 | 124,614 | — | |||||||||||||||||||||
Indian Rupee | HSBC | Buy | 144,338,000 | 2,201,953 | 7/23/15 | 60,545 | — | |||||||||||||||||||||
Indian Rupee | JPHQ | Buy | 23,701,000 | 361,682 | 7/23/15 | 9,831 | — | |||||||||||||||||||||
Japanese Yen | BZWS | Sell | 136,513,000 | 1,151,736 | 7/23/15 | 36,018 | — | |||||||||||||||||||||
Japanese Yen | CITI | Sell | 127,820,000 | 1,076,841 | 7/23/15 | 32,171 | — | |||||||||||||||||||||
Japanese Yen | DBAB | Buy | 246,700,000 | 2,001,948 | 7/23/15 | 14,327 | — | |||||||||||||||||||||
Japanese Yen | DBAB | Sell | 607,629,000 | 5,116,962 | 7/23/15 | 150,821 | — | |||||||||||||||||||||
Japanese Yen | GSCO | Sell | 42,760,000 | 361,378 | 7/23/15 | 11,901 | — | |||||||||||||||||||||
Japanese Yen | HSBC | Sell | 247,910,000 | 2,094,586 | 7/23/15 | 68,422 | — | |||||||||||||||||||||
Japanese Yen | JPHQ | Sell | 149,719,000 | 1,264,812 | 7/23/15 | 41,162 | — | |||||||||||||||||||||
Singapore Dollar | DBAB | Buy | 2,636,400 | 1,965,451 | 7/23/15 | 1,542 | (10,361 | ) | ||||||||||||||||||||
Singapore Dollar | DBAB | Sell | 1,332,800 | 997,904 | 7/23/15 | 8,752 | — | |||||||||||||||||||||
Singapore Dollar | JPHQ | Buy | 694,000 | 513,960 | 7/23/15 | 1,100 | — | |||||||||||||||||||||
Euro | DBAB | Sell | 2,242,876 | 2,547,795 | 8/27/15 | 46,167 | — | |||||||||||||||||||||
Euro | JPHQ | Sell | 1,788,861 | 2,047,826 | 8/27/15 | 52,590 | — | |||||||||||||||||||||
Japanese Yen | DBAB | Sell | 257,790,000 | 2,201,076 | 8/27/15 | 93,336 | — | |||||||||||||||||||||
Japanese Yen | HSBC | Sell | 85,800,000 | 733,102 | 8/27/15 | 31,584 | — | |||||||||||||||||||||
Japanese Yen | JPHQ | Sell | 181,500,000 | 1,550,801 | 8/27/15 | 66,822 | — | |||||||||||||||||||||
| FSI-28 | Semiannual Report |
FRANKLIN TEMPLETON VARIABLE INSURANCE PRODUCTS TRUST
STATEMENT OF INVESTMENTS (UNAUDITED)
Franklin Strategic Income VIP Fund (continued)
| Forward Exchange Contracts | ||||||||||||||||||||||||||||
| Currency | Counterpartya | Type | Quantity | Contract Amount | Settlement Date | Unrealized Appreciation | Unrealized Depreciation | |||||||||||||||||||||
| OTC Forward Exchange Contracts (continued) | ||||||||||||||||||||||||||||
British Pound | DBAB | Sell | 380,363 | $ | 587,280 | 9/17/15 | $ | — | $ | (9,924 | ) | |||||||||||||||||
Chilean Peso | DBAB | Buy | 314,000,000 | 496,051 | 9/17/15 | — | (8,554 | ) | ||||||||||||||||||||
Chilean Peso | JPHQ | Buy | 234,301,000 | 372,054 | 9/17/15 | — | (8,293 | ) | ||||||||||||||||||||
Chilean Peso | MSCO | Buy | 220,380,000 | 349,449 | 9/17/15 | — | (7,301 | ) | ||||||||||||||||||||
Euro | BZWS | Sell | 132,570 | 150,743 | 9/17/15 | 2,832 | — | |||||||||||||||||||||
Euro | DBAB | Sell | 4,905,869 | 5,295,003 | 9/17/15 | 2,666 | (181,243 | ) | ||||||||||||||||||||
Euro | HSBC | Sell | 142,717 | 162,336 | 9/17/15 | 3,104 | — | |||||||||||||||||||||
Euro | JPHQ | Sell | 2,118,679 | 2,409,747 | 9/17/15 | 45,893 | — | |||||||||||||||||||||
Japanese Yen | DBAB | Sell | 1,020,022,000 | 8,584,415 | 9/17/15 | 241,238 | — | |||||||||||||||||||||
Japanese Yen | HSBC | Sell | 80,270,000 | 677,184 | 9/17/15 | 20,623 | — | |||||||||||||||||||||
Japanese Yen | JPHQ | Sell | 235,580,000 | 1,986,825 | 9/17/15 | 59,920 | — | |||||||||||||||||||||
Singapore Dollar | DBAB | Buy | 4,665,140 | 3,434,290 | 9/17/15 | 25,380 | — | |||||||||||||||||||||
Singapore Dollar | HSBC | Buy | 837,000 | 616,597 | 9/17/15 | 4,122 | — | |||||||||||||||||||||
Singapore Dollar | JPHQ | Buy | 4,945,200 | 3,649,325 | 9/17/15 | 18,038 | — | |||||||||||||||||||||
British Pound | DBAB | Sell | 1,350,860 | 2,050,200 | 10/22/15 | — | (70,282 | ) | ||||||||||||||||||||
Chilean Peso | CITI | Buy | 377,668,000 | 606,452 | 10/22/15 | — | (21,956 | ) | ||||||||||||||||||||
Chilean Peso | JPHQ | Buy | 1,598,650,000 | 2,566,051 | 10/22/15 | — | (91,909 | ) | ||||||||||||||||||||
Euro | BZWS | Sell | 4,318,741 | 4,849,082 | 10/22/15 | 27,600 | — | |||||||||||||||||||||
Euro | CITI | Sell | 1,058,200 | 1,187,025 | 10/22/15 | 5,641 | — | |||||||||||||||||||||
Euro | DBAB | Sell | 4,582,808 | 5,133,799 | 10/22/15 | 17,510 | — | |||||||||||||||||||||
Euro | GSCO | Sell | 369,000 | 413,856 | 10/22/15 | 1,901 | — | |||||||||||||||||||||
Euro | JPHQ | Sell | 6,561,135 | 7,358,117 | 10/22/15 | 33,205 | — | |||||||||||||||||||||
Indian Rupee | DBAB | Sell | 31,625,000 | 478,804 | 10/22/15 | — | (8,964 | ) | ||||||||||||||||||||
Japanese Yen | BZWS | Sell | 60,047,000 | 502,532 | 10/22/15 | 11,014 | — | |||||||||||||||||||||
Japanese Yen | CITI | Sell | 31,757,000 | 265,057 | 10/22/15 | 5,109 | — | |||||||||||||||||||||
Japanese Yen | DBAB | Sell | 27,184,000 | 227,025 | 10/22/15 | 4,509 | — | |||||||||||||||||||||
Japanese Yen | HSBC | Sell | 147,626,000 | 1,232,219 | 10/22/15 | 23,820 | — | |||||||||||||||||||||
Japanese Yen | JPHQ | Sell | 366,653,000 | 3,062,294 | 10/22/15 | 61,040 | — | |||||||||||||||||||||
Singapore Dollar | DBAB | Sell | 1,249,000 | 934,461 | 10/22/15 | 8,617 | — | |||||||||||||||||||||
Euro | BZWS | Sell | 529,706 | 601,328 | 12/17/15 | 9,337 | — | |||||||||||||||||||||
Euro | CITI | Sell | 3,868,000 | 4,391,770 | 12/17/15 | 68,960 | — | |||||||||||||||||||||
Euro | DBAB | Sell | 4,942,326 | 5,611,616 | 12/17/15 | 88,158 | — | |||||||||||||||||||||
Euro | JPHQ | Sell | 2,176,103 | 2,470,312 | 12/17/15 | 38,337 | — | |||||||||||||||||||||
Indian Rupee | DBAB | Buy | 128,000,000 | 1,942,042 | 12/17/15 | 11,911 | — | |||||||||||||||||||||
Japanese Yen | DBAB | Sell | 1,175,702,500 | 9,608,121 | 12/17/15 | — | (27,656 | ) | ||||||||||||||||||||
Japanese Yen | JPHQ | Sell | 548,120,000 | 4,476,569 | 12/17/15 | — | (15,692 | ) | ||||||||||||||||||||
Japanese Yen | MSCO | Sell | 12,500,000 | 102,110 | 12/17/15 | — | (337 | ) | ||||||||||||||||||||
|
| |||||||||||||||||||||||||||
Totals Forward Exchange Contracts unrealized appreciation (depreciation) |
| 2,215,243 | (499,955 | ) | ||||||||||||||||||||||||
|
| |||||||||||||||||||||||||||
Net unrealized appreciation (depreciation) |
| $ | 1,715,288 | |||||||||||||||||||||||||
|
| |||||||||||||||||||||||||||
aMay be comprised of multiple contracts with the same counterparty, currency and settlement date.
At June 30, 2015, the Fund had the following credit default swap contracts outstanding. See Note 1(d).
Credit Default Swap Contracts
| Description | Periodic Payment Rate | Counterparty / Exchange | Notional Amounta | Expiration Date | Upfront Premiums Paid (Received) | Unrealized Appreciation | Unrealized Depreciation | Value | Ratingb | |||||||||||||||||||||||||
| OTC Swaps Contracts | ||||||||||||||||||||||||||||||||||
| Contracts to Sell Protectionc | ||||||||||||||||||||||||||||||||||
| Traded Index | ||||||||||||||||||||||||||||||||||
MCDX.NA.24 | 1.00 | % | CITI | 7,000,000 | 6/20/20 | $ | 6,659 | $ | — | $ | (1,981 | ) | $ | 4,678 | Non Investment Grade | |||||||||||||||||||
MCDX.NA.24 | 1.00 | % | GSCO | 3,000,000 | 6/20/20 | 15,538 | — | (4,624 | ) | 10,914 | Non Investment Grade | |||||||||||||||||||||||
|
| |||||||||||||||||||||||||||||||||
Net unrealized appreciation (depreciation) |
| $ | (6,605 | ) | ||||||||||||||||||||||||||||||
|
| |||||||||||||||||||||||||||||||||
| Semiannual Report | FSI-29 |
FRANKLIN TEMPLETON VARIABLE INSURANCE PRODUCTS TRUST
STATEMENT OF INVESTMENTS (UNAUDITED)
Franklin Strategic Income VIP Fund (continued)
aIn U.S. dollars unless otherwise indicated. For contracts to sell protection, the notional amount is equal to the maximum potential amount of the future payments and no recourse provisions have been entered into in association with the contracts.
bBased on internal ratings for index swaps. Internal ratings based on mapping into equivalent ratings from external vendors.
cThe fund enters contracts to sell protection to create a long credit position. Performance triggers include failure to pay or bankruptcy of the underlying securities for traded index swaps.
See Note 8 regarding other derivative information.
See Abbreviations on page FSI-46.
| FSI-30 | Semiannual Report | The accompanying notes are an integral part of these financial statements. |
FRANKLIN TEMPLETON VARIABLE INSURANCE PRODUCTS TRUST
Financial Statements
Statement of Assets and Liabilities
June 30, 2015 (unaudited)
| Franklin Strategic Income VIP Fund | ||||
Assets: | ||||
Investments in securities: | ||||
Cost - Unaffiliated issuers | $ | 814,472,242 | ||
Cost - Sweep Money Fund (Note 3e) | 70,999,990 | |||
|
| |||
Total cost of investments | $ | 885,472,232 | ||
|
| |||
Value - Unaffiliated issuers | $ | 776,443,959 | ||
Value - Sweep Money Fund (Note 3e) | 70,999,990 | |||
|
| |||
Total value of investments | 847,443,949 | |||
Cash | 698,667 | |||
Restricted Cash (Note 1e) | 916,000 | |||
Foreign currency, at value (cost $3,793,637) | 3,788,578 | |||
Receivables: | ||||
Investment securities sold | 8,594,544 | |||
Capital shares sold | 206,350 | |||
Interest | 8,819,040 | |||
OTC swap contracts (premiums paid $23,212) | 22,197 | |||
Unrealized appreciation on OTC forward exchange contracts | 2,215,243 | |||
Other assets | 378 | |||
|
| |||
Total assets | 872,704,946 | |||
|
| |||
Liabilities: | ||||
Payables: | ||||
Investment securities purchased | 31,897,244 | |||
Capital shares redeemed | 633,985 | |||
Management fees | 400,741 | |||
Distribution fees | 156,099 | |||
Due to brokers | 916,000 | |||
Unrealized depreciation on OTC forward exchange contracts | 499,955 | |||
Unrealized depreciation on OTC swap contracts | 6,605 | |||
Deferred tax | 8,456 | |||
Accrued expenses and other liabilities | 386,224 | |||
|
| |||
Total liabilities | 34,905,309 | |||
|
| |||
Net assets, at value | $ | 837,799,637 | ||
|
| |||
Net assets consist of: | ||||
Paid-in capital | $ | 858,077,749 | ||
Undistributed net investment income | 5,033,856 | |||
Net unrealized appreciation (depreciation) | (36,433,718 | ) | ||
Accumulated net realized gain (loss) | 11,121,750 | |||
|
| |||
Net assets, at value | $ | 837,799,637 | ||
|
| |||
| The accompanying notes are an integral part of these financial statements. | Semiannual Report | FSI-31 |
FRANKLIN TEMPLETON VARIABLE INSURANCE PRODUCTS TRUST
FINANCIAL STATEMENTS
Statement of Assets and Liabilities (continued)
June 30, 2015 (unaudited)
| Franklin Strategic Income VIP Fund | ||||
| Class 1: | ||||
Net assets, at value | $ | 513,236,092 | ||
|
| |||
Shares outstanding | 46,608,936 | |||
|
| |||
Net asset value and maximum offering price per share | $ | 11.01 | ||
|
| |||
| Class 2: | ||||
Net assets, at value | $ | 214,326,030 | ||
|
| |||
Shares outstanding | 20,087,337 | |||
|
| |||
Net asset value and maximum offering price per share | $ | 10.67 | ||
|
| |||
| Class 4: | ||||
Net assets, at value | $ | 110,237,515 | ||
|
| |||
Shares outstanding | 10,094,792 | |||
|
| |||
Net asset value and maximum offering price per share | $ | 10.92 | ||
|
| |||
| FSI-32 | Semiannual Report | The accompanying notes are an integral part of these financial statements. |
FRANKLIN TEMPLETON VARIABLE INSURANCE PRODUCTS TRUST
FINANCIAL STATEMENTS
Statement of Operations
for the six months ended June 30, 2015 (unaudited)
| Franklin Strategic Income VIP Fund | ||||
Investment income: | ||||
Dividends | $ | 83,389 | ||
Interest | 22,596,173 | |||
|
| |||
Total investment income | 22,679,562 | |||
|
| |||
Expenses: | ||||
Management fees (Note 3a) | 2,533,315 | |||
Distribution fees: (note 3c) | ||||
Class 2 | 266,238 | |||
Class 4 | 197,804 | |||
Custodian fees (Note 4) | 57,120 | |||
Reports to shareholders | 89,511 | |||
Professional fees | 45,071 | |||
Trustees’ fees and expenses | 1,998 | |||
Other | 37,409 | |||
|
| |||
Total expenses | 3,228,466 | |||
Expense reductions (Note 4) | (392 | ) | ||
Expenses waived/paid by affiliates (Note 3e) | (47,844 | ) | ||
|
| |||
Net expenses | 3,180,230 | |||
|
| |||
Net investment income | 19,499,332 | |||
|
| |||
Realized and unrealized gains (losses): | ||||
Net realized gain (loss) from: | ||||
Investments | (5,596,265 | ) | ||
Foreign currency transactions | 14,640,910 | |||
Swap contracts | 126,596 | |||
|
| |||
Net realized gain (loss) | 9,171,241 | |||
|
| |||
Net change in unrealized appreciation (depreciation) on: | ||||
Investments | (14,100,002 | ) | ||
Translation of other assets and liabilities denominated in foreign currencies | (9,062,515 | ) | ||
Swap contracts | (182,222 | ) | ||
Change in deferred taxes on unrealized appreciation | 2,643 | |||
|
| |||
Net change in unrealized appreciation (depreciation) | (23,342,096 | ) | ||
|
| |||
Net realized and unrealized gain (loss) | (14,170,855 | ) | ||
|
| |||
Net increase (decrease) in net assets resulting from operations | $ | 5,328,477 | ||
|
| |||
| The accompanying notes are an integral part of these financial statements. | Semiannual Report | FSI-33 |
FRANKLIN TEMPLETON VARIABLE INSURANCE PRODUCTS TRUST
FINANCIAL STATEMENTS
Statements of Changes in Net Assets
| Franklin Strategic Income VIP Fund | ||||||||
| Six Months Ended June 30, 2015 (unaudited) | Year Ended December 31, 2014 | |||||||
Increase (decrease) in net assets: | ||||||||
Operations: | ||||||||
Net investment income | $ | 19,499,332 | $ | 41,174,450 | ||||
Net realized gain (loss) | 9,171,241 | 21,895,839 | ||||||
Net change in unrealized appreciation (depreciation) | (23,342,096 | ) | (41,564,436 | ) | ||||
|
| |||||||
Net increase (decrease) in net assets resulting from operations | 5,328,477 | 21,505,853 | ||||||
|
| |||||||
Distributions to shareholders from: | ||||||||
Net investment income and net foreign currency gains: | ||||||||
Class 1 | (33,228,366 | ) | (39,220,893 | ) | ||||
Class 2 | (13,693,486 | ) | (11,269,863 | ) | ||||
Class 4 | (6,782,412 | ) | (7,512,342 | ) | ||||
Net realized gains: | ||||||||
Class 1 | (8,524,986 | ) | (12,517,628 | ) | ||||
Class 2 | (3,636,551 | ) | (3,732,579 | ) | ||||
Class 4 | (1,855,841 | ) | (2,588,163 | ) | ||||
|
| |||||||
Total distributions to shareholders | (67,721,642 | ) | (76,841,468 | ) | ||||
|
| |||||||
Capital share transactions: (Note 2) | ||||||||
Class 1 | (23,652,255 | ) | (94,647,397 | ) | ||||
Class 2 | 24,072,010 | 43,236,033 | ||||||
Class 4 | 4,365,706 | (13,615,799 | ) | |||||
|
| |||||||
Total capital share transactions | 4,785,461 | (65,027,163 | ) | |||||
|
| |||||||
Net increase (decrease) in net assets | (57,607,704 | ) | (120,362,778 | ) | ||||
Net assets: | ||||||||
Beginning of period | 895,407,341 | 1,015,770,119 | ||||||
|
| |||||||
End of period | $ | 837,799,637 | $ | 895,407,341 | ||||
|
| |||||||
Undistributed net investment income included in net assets: | ||||||||
End of period | $ | 5,033,856 | $ | 39,238,788 | ||||
|
| |||||||
| FSI-34 | Semiannual Report | The accompanying notes are an integral part of these financial statements. |
FRANKLIN TEMPLETON VARIABLE INSURANCE PRODUCTS TRUST
Notes to Financial Statements (unaudited)
Franklin Strategic Income VIP Fund
1. Organization and Significant Accounting Policies
Franklin Templeton Variable Insurance Products Trust (Trust) is registered under the Investment Company Act of 1940 (1940 Act) as an open-end management investment company, consisting of nineteen separate funds and applies the specialized accounting and reporting guidance in U.S. Generally Accepted Accounting Principles (U.S. GAAP). Franklin Strategic Income VIP Fund (Fund) is included in this report. The financial statements of the remaining funds in the Trust are presented separately. Shares of the Fund are generally sold only to insurance company separate accounts to fund the benefits of variable life insurance policies or variable annuity contracts. At June 30, 2015, 75.26% of the Fund’s shares were held through one insurance company. Investment activities of these insurance company separate accounts could have a material impact on the Fund. The Fund offers three classes of shares: Class 1, Class 2 and Class 4. Each class of shares differs by its distribution fees, voting rights on matters affecting a single class and its exchange privilege.
The following summarizes the Fund’s significant accounting policies.
a. Financial Instrument Valuation
The Fund’s investments in financial instruments are carried at fair value daily. Fair value is the price that would be received to sell an asset or paid to transfer a liability in an orderly transaction between market participants on the measurement date. The Fund calculates the net asset value (NAV) per share at the close of the New York Stock Exchange (NYSE), generally at 4 p.m. Eastern time (NYSE close) on each day the NYSE is open for trading. Under compliance policies and procedures approved by the Trust’s Board of Trustees (the Board), the Fund’s administrator has responsibility for oversight of valuation, including leading the cross-functional Valuation and Liquidity Oversight Committee (VLOC). The VLOC provides administration and oversight of the Fund’s valuation policies and procedures, which are approved annually by the Board. Among other things, these procedures allow the Fund to utilize independent pricing services, quotations from securities and financial instrument dealers, and other market sources to determine fair value.
Equity securities listed on an exchange or on the NASDAQ National Market System are valued at the last quoted sale price or the official closing price of the day, respectively. Foreign equity securities are valued as of the close of trading on the
foreign stock exchange on which the security is primarily traded or as of the NYSE close, whichever is earlier. The value is then converted into its U.S. dollar equivalent at the foreign exchange rate in effect at the NYSE close on the day that the value of the security is determined. Over-the-counter (OTC) securities are valued within the range of the most recent quoted bid and ask prices. Securities that trade in multiple markets or on multiple exchanges are valued according to the broadest and most representative market. Certain equity securities are valued based upon fundamental characteristics or relationships to similar securities. Investments in open-end mutual funds are valued at the closing NAV.
Debt securities generally trade in the OTC market rather than on a securities exchange. The Fund’s pricing services use multiple valuation techniques to determine fair value. In instances where sufficient market activity exists, the pricing services may utilize a market-based approach through which quotes from market makers are used to determine fair value. In instances where sufficient market activity may not exist or is limited, the pricing services also utilize proprietary valuation models which may consider market characteristics such as benchmark yield curves, credit spreads, estimated default rates, anticipated market interest rate volatility, coupon rates, anticipated timing of principal repayments, underlying collateral, and other unique security features in order to estimate the relevant cash flows, which are then discounted to calculate the fair value. Securities denominated in a foreign currency are converted into their U.S. dollar equivalent at the foreign exchange rate in effect at the NYSE close on the date that the values of the foreign debt securities are determined.
Certain derivative financial instruments (derivatives) trade in the OTC market. The Fund’s pricing services use various techniques including industry standard option pricing models and proprietary discounted cash flow models to determine the fair value of those instruments. The Fund’s net benefit or obligation under the derivative contract, as measured by the fair value of the contract, is included in net assets.
The Fund has procedures to determine the fair value of financial instruments for which market prices are not reliable or readily available. Under these procedures, the VLOC convenes on a regular basis to review such financial instruments and considers a number of factors, including significant unobservable valuation inputs, when arriving at fair value. The VLOC primarily employs a market-based approach which may use related or
| Semiannual Report | FSI-35 |
FRANKLIN TEMPLETON VARIABLE INSURANCE PRODUCTS TRUST
NOTES TO FINANCIAL STATEMENTS (UNAUDITED)
Franklin Strategic Income VIP Fund (continued)
1. Organization and Significant Accounting Policies (continued)
a. Financial Instrument Valuation (continued)
comparable assets or liabilities, recent transactions, market multiples, book values, and other relevant information for the investment to determine the fair value of the investment. An income-based valuation approach may also be used in which the anticipated future cash flows of the investment are discounted to calculate fair value. Discounts may also be applied due to the nature or duration of any restrictions on the disposition of the investments. Due to the inherent uncertainty of valuations of such investments, the fair values may differ significantly from the values that would have been used had an active market existed. The VLOC employs various methods for calibrating these valuation approaches including a regular review of key inputs and assumptions, transactional back-testing or disposition analysis, and reviews of any related market activity.
Trading in securities on foreign securities stock exchanges and OTC markets may be completed before the daily NYSE close. In addition, trading in certain foreign markets may not take place on every NYSE business day. Occasionally, events occur between the time at which trading in a foreign security is completed and the close of the NYSE that might call into question the reliability of the value of a portfolio security held by the Fund. As a result, differences may arise between the value of the Fund’s portfolio securities as determined at the foreign market close and the latest indications of value at the close of the NYSE. In order to minimize the potential for these differences, the VLOC monitors price movements following the close of trading in foreign stock markets through a series of country specific market proxies (such as baskets of American Depositary Receipts, futures contracts and exchange traded funds). These price movements are measured against established trigger thresholds for each specific market proxy to assist in determining if an event has occurred that may call into question the reliability of the values of the foreign securities held by the Fund. If such an event occurs, the securities may be valued using fair value procedures, which may include the use of independent pricing services.
When the last day of the reporting period is a non-business day, certain foreign markets may be open on those days that the NYSE is closed, which could result in differences between the value of the Fund’s portfolio securities on the last business day and the last calendar day of the reporting period. Any significant security
valuation changes due to an open foreign market are adjusted and reflected by the Fund for financial reporting purposes.
b. Foreign Currency Translation
Portfolio securities and other assets and liabilities denominated in foreign currencies are translated into U.S. dollars based on the exchange rate of such currencies against U.S. dollars on the date of valuation. The Fund may enter into foreign currency exchange contracts to facilitate transactions denominated in a foreign currency. Purchases and sales of securities, income and expense items denominated in foreign currencies are translated into U.S. dollars at the exchange rate in effect on the transaction date. Portfolio securities and assets and liabilities denominated in foreign currencies contain risks that those currencies will decline in value relative to the U.S. dollar. Occasionally, events may impact the availability or reliability of foreign exchange rates used to convert the U.S. dollar equivalent value. If such an event occurs, the foreign exchange rate will be valued at fair value using procedures established and approved by the Board.
The Fund does not separately report the effect of changes in foreign exchange rates from changes in market prices on securities held. Such changes are included in net realized and unrealized gain or loss from investments in the Statement of Operations.
Realized foreign exchange gains or losses arise from sales of foreign currencies, currency gains or losses realized between the trade and settlement dates on securities transactions and the difference between the recorded amounts of dividends, interest, and foreign withholding taxes and the U.S. dollar equivalent of the amounts actually received or paid. Net unrealized foreign exchange gains and losses arise from changes in foreign exchange rates on foreign denominated assets and liabilities other than investments in securities held at the end of the reporting period.
c. Securities Purchased on a When-Issued, Delayed Delivery, and TBA Basis
The Fund purchases securities on a when-issued, delayed delivery and to-be-announced (TBA) basis, with payment and delivery scheduled for a future date. These transactions are subject to market fluctuations and are subject to the risk that the value at delivery may be more or less than the trade date purchase price. Although the Fund will generally purchase these securities with the intention of holding the securities, it may sell
| FSI-36 | Semiannual Report |
FRANKLIN TEMPLETON VARIABLE INSURANCE PRODUCTS TRUST
NOTES TO FINANCIAL STATEMENTS (UNAUDITED)
Franklin Strategic Income VIP Fund (continued)
the securities before the settlement date. Sufficient assets have been segregated for these securities.
d. Derivative Financial Instruments
The Fund invested in derivatives in order to manage risk or gain exposure to various other investments or markets. Derivatives are financial contracts based on an underlying or notional amount, require no initial investment or an initial net investment that is smaller than would normally be required to have a similar response to changes in market factors, and require or permit net settlement. Derivatives contain various risks including the potential inability of the counterparty to fulfill their obligations under the terms of the contract, the potential for an illiquid secondary market, and/or the potential for market movements which expose the Fund to gains or losses in excess of the amounts shown in the Statement of Assets and Liabilities. Realized gain and loss and unrealized appreciation and depreciation on these contracts for the period are included in the Statement of Operations.
Derivative counterparty credit risk is managed through a formal evaluation of the creditworthiness of all potential counterparties. The Fund attempts to reduce its exposure to counterparty credit risk on OTC derivatives, whenever possible, by entering into International Swaps and Derivatives Association (ISDA) master agreements with certain counterparties. These agreements contain various provisions, including but not limited to collateral requirements, events of default, or early termination. Termination events applicable to the counterparty include certain deteriorations in the credit quality of the counterparty. Termination events applicable to the Fund include failure of the Fund to maintain certain net asset levels and/or limit the decline in net assets over various periods of time. In the event of default or early termination, the ISDA master agreement gives the non-defaulting party the right to net and close-out all transactions traded, whether or not arising under the ISDA agreement, to one net amount payable by one counterparty to the other. However, absent an event of default or early termination, OTC derivative assets and liabilities are presented gross and not offset in the Statement of Assets and Liabilities. Early termination by the counterparty may result in an immediate payment by the Fund of any net liability owed to that counterparty under the ISDA agreement.
Collateral requirements differ by type of derivative. Collateral terms are contract specific for OTC derivatives. For OTC
derivatives traded under an ISDA master agreement, posting of collateral is required by either the fund or the applicable counterparty if the total net exposure of all OTC derivatives with the applicable counterparty exceeds the minimum transfer amount, which typically ranges from $100,000 to $250,000, and can vary depending on the counterparty and the type of the agreement. Generally, collateral is determined at the close of fund business each day and any additional collateral required due to changes in derivative values may be delivered by the fund or the counterparty within a few business days. Collateral pledged and/or received by the fund, if any, is held in segregated accounts with the fund’s custodian/counterparty broker and can be in the form of cash and/or securities. Unrestricted cash may be invested according to the Fund’s investment objectives.
The Fund entered into OTC forward exchange contracts primarily to manage and/or gain exposure to certain foreign currencies. A forward exchange contract is an agreement between the Fund and a counterparty to buy or sell a foreign currency at a specific exchange rate on a future date.
The Fund entered into credit default swap contracts primarily to manage exposure to credit risk. A credit default swap is an agreement between the Fund and a counterparty whereby the buyer of the contract receives credit protection and the seller of the contract guarantees the credit worthiness of a referenced debt obligation. These agreements may be privately negotiated in the over-the-counter market (“OTC credit default swaps”) or may be executed in a multilateral trade facility platform, such as a registered exchange (“centrally cleared credit default swaps”). The underlying referenced debt obligation may be a single issuer of corporate or sovereign debt, a credit index, or a tranche of a credit index. In the event of a default of the underlying referenced debt obligation, the buyer is entitled to receive the notional amount of the credit default swap contract from the seller in exchange for the referenced debt obligation, a net settlement amount equal to the notional amount of the credit default swap less the recovery value of the referenced debt obligation, or other agreed upon amount. For centrally cleared credit default swaps, required initial margins are pledged by the Fund, and the daily change in fair value is accounted for as a variation margin payable or receivable in the Statement of Assets and Liabilities. Over the term of the contract, the buyer pays the seller a periodic stream of payments, provided that no event of default has occurred. Such periodic payments are accrued daily as an unrealized appreciation or depreciation until the payments
| Semiannual Report | FSI-37 |
FRANKLIN TEMPLETON VARIABLE INSURANCE PRODUCTS TRUST
NOTES TO FINANCIAL STATEMENTS (UNAUDITED)
Franklin Strategic Income VIP Fund (continued)
1. Organization and Significant Accounting Policies (continued)
d. Derivative Financial Instruments (continued)
are made, at which time they are realized. Payments received or paid to initiate a credit default swap contract are reflected in the Statement of Assets and Liabilities and represent compensating factors between stated terms of the credit default swap agreement and prevailing market conditions (credit spreads and other relevant factors). These upfront payments are amortized over the term of the contract as a realized gain or loss in the Statement of Operations.
See Note 8 regarding other derivative information.
e. Restricted Cash
At June 30, 2015, the Fund held restricted cash in connection with investments in certain derivative securities. Restricted cash is held in a segregated account with the Fund’s custodian and is reflected in the Statement of Assets and Liabilities.
f. Loan Participation Notes
The Fund invests in loan participation notes (“Participations”). Participations are loans originally issued to a borrower by one or more financial institutions (the “Lender”) and subsequently sold to other investors, such as the Fund. Participations typically result in the Fund having a contractual relationship only with the Lender and not with the borrower. The Fund has the right to receive from the Lender any payments of principal, interest and fees which the Lender received from the borrower. The Fund generally has no rights to either enforce compliance by the borrower with the terms of the loan agreement or to any collateral relating to the original loan. As a result, the Fund assumes the credit risk of both the borrower and the Lender that is selling the Participation. The Participations may also involve interest rate risk and liquidity risk, including the potential default or insolvency of the borrower and/or the Lender.
g. Investments in FT Holdings Corporation III (FT Subsidiary)
The Fund invests in certain financial instruments through its investment in the FT Subsidiary. FT Subsidiary is a Delaware Corporation, is a wholly-owned subsidiary of the Fund, and is able to invest in certain financial instruments consistent with the investment objective of the Fund. At June 30, 2015, FT Subsidiary’s investment, Turtle Bay Resort, as well as any other
assets and liabilities of the FT Subsidiary are reflected in the Fund’s Statement of Investments and Statement of Assets and Liabilities. The financial statements have been consolidated and include the accounts of the Fund and FT Subsidiary. All intercompany transactions and balances have been eliminated.
h. Mortgage Dollar Rolls
The Fund enters into mortgage dollar rolls, typically on a TBA basis. Mortgage dollar rolls are agreements between the Fund and a financial institution to simultaneously sell and repurchase mortgage-backed securities at a future date. Gains or losses are realized on the initial sale, and the difference between the repurchase price and the sale price is recorded as an unrealized gain or loss to the Fund upon entering into the mortgage dollar roll. In addition, the Fund may invest the cash proceeds that are received from the initial sale. During the period between the sale and repurchase, the Fund is not entitled to principal and interest paid on the mortgage backed securities. The risks of mortgage dollar roll transactions include the potential inability of the counterparty to fulfill its obligations.
i. Senior Floating Rate Interests
The Fund invests in senior secured corporate loans that pay interest at rates which are periodically reset by reference to a base lending rate plus a spread. These base lending rates are generally the prime rate offered by a designated U.S. bank or the London InterBank Offered Rate (LIBOR). Senior secured corporate loans often require prepayment of principal from excess cash flows or at the discretion of the borrower. As a result, actual maturity may be substantially less than the stated maturity. Senior secured corporate loans in which the Fund invests are generally readily marketable, but may be subject to certain restrictions on resale.
j. Income and Deferred Taxes
It is the Fund’s policy to qualify as a regulated investment company under the Internal Revenue Code. The Fund intends to distribute to shareholders substantially all of its taxable income and net realized gains to relieve it from federal income and if applicable, excise taxes. As a result, no provision for U.S. federal income taxes is required.
The Fund may be subject to foreign taxation related to income received, capital gains on the sale of securities and certain foreign currency transactions in the foreign jurisdictions in which it invests. Foreign taxes, if any, are recorded based on the tax
| FSI-38 | Semiannual Report |
FRANKLIN TEMPLETON VARIABLE INSURANCE PRODUCTS TRUST
NOTES TO FINANCIAL STATEMENTS (UNAUDITED)
Franklin Strategic Income VIP Fund (continued)
regulations and rates that exist in the foreign markets in which the Fund invests. When a capital gain tax is determined to apply, the Fund records an estimated deferred tax liability in an amount that would be payable if the securities were disposed of on the valuation date.
The Fund recognizes the tax benefits of uncertain tax positions only when the position is “more likely than not” to be sustained upon examination by the tax authorities based on the technical merits of the tax position. As of June 30, 2015, and for all open tax years, the Fund has determined that no liability for unrecognized tax benefits is required in the Fund’s financial statements related to uncertain tax positions taken on a tax return (or expected to be taken on future tax returns). Open tax years are those that remain subject to examination and are based on each tax jurisdiction’s statute of limitation.
k. Security Transactions, Investment Income, Expenses and Distributions
Security transactions are accounted for on trade date. Realized gains and losses on security transactions are determined on a specific identification basis. Interest income and estimated expenses are accrued daily. Amortization of premium and accretion of discount on debt securities are included in interest income. Paydown gains and losses are recorded as an adjustment to interest income. Facility fees are recognized as income over the expected term of the loan. Dividend income is recorded on the ex-dividend date. Distributions to shareholders are recorded on the ex-dividend date and are determined according to income tax regulations (tax basis). Distributable earnings determined on a tax basis may differ from earnings recorded in accordance with U.S. GAAP. These differences may be permanent or temporary. Permanent differences are reclassified among capital accounts to reflect their tax character. These reclassifications have no impact on net assets or the results of operations. Temporary differences are not reclassified, as they may reverse in subsequent periods.
Common expenses incurred by the Trust are allocated among the funds based on the ratio of net assets of each fund to the
combined net assets of the Trust. Fund specific expenses are charged directly to the fund that incurred the expense.
Realized and unrealized gains and losses and net investment income, not including class specific expenses, are allocated daily to each class of shares based upon the relative proportion of net assets of each class. Differences in per share distributions, by class, are generally due to differences in class specific expenses.
Inflation-indexed bonds are adjusted for inflation through periodic increases or decreases in the security’s interest accruals, face amount, or principal redemption value, by amounts corresponding to the rate of inflation as measured by an index. Any increase or decrease in the face amount or principal redemption value will be included as interest income in the Statement of Operations.
l. Accounting Estimates
The preparation of financial statements in accordance with U.S. GAAP requires management to make estimates and assumptions that affect the reported amounts of assets and liabilities at the date of the financial statements and the amounts of income and expenses during the reporting period. Actual results could differ from those estimates.
m. Guarantees and Indemnifications
Under the Trust’s organizational documents, its officers and trustees are indemnified by the Trust against certain liabilities arising out of the performance of their duties to the Trust. Additionally, in the normal course of business, the Trust, on behalf of the Fund, enters into contracts with service providers that contain general indemnification clauses. The Trust’s maximum exposure under these arrangements is unknown as this would involve future claims that may be made against the Trust that have not yet occurred. Currently, the Trust expects the risk of loss to be remote.
| Semiannual Report | FSI-39 |
FRANKLIN TEMPLETON VARIABLE INSURANCE PRODUCTS TRUST
NOTES TO FINANCIAL STATEMENTS (UNAUDITED)
Franklin Strategic Income VIP Fund (continued)
2. Shares of Beneficial Interest
At June 30, 2015, there were an unlimited number of shares authorized (without par value). Transactions in the Fund’s shares were as follows:
| Six Months Ended June 30, 2015 | Year Ended December 31, 2014 | |||||||||||||||||
| Shares | Amount | Shares | Amount | |||||||||||||||
| Class 1 Shares: | ||||||||||||||||||
Shares sold | 216,677 | $ | 2,593,431 | 702,662 | $ | 8,745,867 | ||||||||||||
Shares issued in reinvestment of distributions | 3,778,584 | 41,753,352 | 4,268,855 | 51,738,520 | ||||||||||||||
Shares redeemed | (5,694,368 | ) | (67,999,038 | ) | (12,467,167 | ) | (155,131,784 | ) | ||||||||||
|
| |||||||||||||||||
Net increase (decrease) | (1,699,107 | ) | $ | (23,652,255 | ) | (7,495,650 | ) | $ | (94,647,397 | ) | ||||||||
|
| |||||||||||||||||
| Class 2 Shares: | ||||||||||||||||||
Shares sold | 2,509,062 | $ | 28,992,544 | 6,058,039 | $ | 72,800,016 | ||||||||||||
Shares issued in reinvestment of distributions | 1,618,117 | 17,330,037 | 1,273,552 | 15,002,442 | ||||||||||||||
Shares redeemed | (1,927,657 | ) | (22,250,571 | ) | (3,696,063 | ) | (44,566,425 | ) | ||||||||||
|
| |||||||||||||||||
Net increase (decrease) | 2,199,522 | $ | 24,072,010 | 3,635,528 | $ | 43,236,033 | ||||||||||||
|
| |||||||||||||||||
| Class 4 Shares: | ||||||||||||||||||
Shares sold | 451,552 | $ | 5,350,839 | 732,854 | $ | 9,004,820 | ||||||||||||
Shares issued in reinvestment of distributions | 788,162 | 8,638,254 | 839,610 | 10,100,506 | ||||||||||||||
Shares redeemed | (819,468 | ) | (9,623,387 | ) | (2,683,922 | ) | (32,721,125 | ) | ||||||||||
|
| |||||||||||||||||
Net increase (decrease) | 420,246 | $ | 4,365,706 | (1,111,458 | ) | $ | (13,615,799 | ) | ||||||||||
|
| |||||||||||||||||
3. Transactions With Affiliates
Franklin Resources, Inc. is the holding company for various subsidiaries that together are referred to as Franklin Templeton Investments. Certain officers and trustees of the Fund are also officers and/or directors of the following subsidiaries:
| Subsidiary | Affiliation | |
Franklin Advisers, Inc. (Advisers) | Investment manager | |
Franklin Templeton Services, LLC (FT Services) | Administrative manager | |
Franklin Templeton Distributors, Inc. (Distributors) | Principal underwriter | |
Franklin Templeton Investor Services, LLC (Investor Services) | Transfer agent |
a. Management Fees
The Fund pays an investment management fee to Advisers based on the average daily net assets of the Fund as follows:
| Annualized Fee Rate | Net Assets | |
0.625% | Up to and including $500 million | |
0.525% | Over $500 million, up to and including $1 billion | |
0.480% | Over $1 billion, up to and including $1.5 billion | |
0.435% | Over $1.5 billion, up to and including $6.5 billion | |
0.415% | Over $6.5 billion, up to and including $11.5 billion | |
0.400% | Over $11.5 billion, up to and including $16.5 billion | |
0.390% | Over $16.5 billion, up to and including $19 billion | |
0.380% | Over $19 billion, up to and including $21.5 billion | |
0.370% | In excess of $21.5 billion |
| FSI-40 | Semiannual Report |
FRANKLIN TEMPLETON VARIABLE INSURANCE PRODUCTS TRUST
NOTES TO FINANCIAL STATEMENTS (UNAUDITED)
Franklin Strategic Income VIP Fund (continued)
b. Administrative Fees
Under an agreement with Advisers, FT Services provides administrative services to the Fund. The fee is paid by Advisers based on the Fund’s average daily net assets, and is not an additional expense of the Fund.
c. Distribution Fees
The Board has adopted distribution plans for Class 2 and Class 4 shares pursuant to Rule 12b-1 under the 1940 Act. Under the Fund’s compensation distribution plans, the Fund pays Distributors for costs incurred in connection with the servicing, sale and distribution of the Fund’s shares up to 0.25%, and 0.35% per year of its average daily net assets of Class 2 and Class 4, respectively. Some distribution fees are not charged on shares held by affiliates. The plan year, for purposes of monitoring compliance with the maximum annual plan rates, is February 1 through January 31.
d. Transfer Agent Fees
Investor Services, under terms of an agreement, performs shareholder servicing for the Fund and is not paid by the Fund for the services.
e. Investments in Institutional Fiduciary Trust Money Market Portfolio
The Fund invests in Institutional Fiduciary Trust Money Market Portfolio (Sweep Money Fund), an affiliated open-end management investment company. Management fees paid by the Fund are waived on assets invested in the Sweep Money Fund, as noted in the Statement of Operations, in an amount not to exceed the management and administrative fees paid directly or indirectly by the Sweep Money Fund. Prior to January 1, 2014, the waiver was accounted for as a reduction to management fees.
4. Expense Offset Arrangement
The Fund has entered into an arrangement with its custodian whereby credits realized as a result of uninvested cash balances are used to reduce a portion of the Fund’s custodian expenses. During the period ended June 30, 2015, the custodian fees were reduced as noted in the Statement of Operations.
5. Income Taxes
At June 30, 2015, the cost of investments and net unrealized appreciation (depreciation) for income tax purposes were as follows:
Cost of investments | $ | 887,769,495 | ||
|
| |||
Unrealized appreciation | $ | 16,490,160 | ||
Unrealized depreciation | (56,815,706 | ) | ||
|
| |||
Net unrealized appreciation (depreciation) | $ | (40,325,546 | ) | |
|
|
Differences between income and/or capital gains as determined on a book basis and a tax basis are primarily due to differing treatments of foreign currency transactions and bond discounts and premiums.
6. Investment Transactions
Purchases and sales of investments (excluding short term securities) for the period ended June 30, 2015, aggregated $417,602,224 and $417,822,487, respectively.
| Semiannual Report | FSI-41 |
FRANKLIN TEMPLETON VARIABLE INSURANCE PRODUCTS TRUST
NOTES TO FINANCIAL STATEMENTS (UNAUDITED)
Franklin Strategic Income VIP Fund (continued)
7. Credit Risk And Defaulted Securities
At June 30, 2015, the Fund had 58.32% of its portfolio invested in high yield, senior secured floating rate notes, or other securities rated below investment grade. These securities may be more sensitive to economic conditions causing greater price volatility and are potentially subject to a greater risk of loss due to default than higher rated securities.
The Fund held defaulted securities and/or other securities for which the income has been deemed uncollectible. At June 30, 2015, the aggregate value of these securities was $4,376,375, representing 0.52% of the Fund’s net assets. The Fund discontinues accruing income on securities for which income has been deemed uncollectible and provides an estimate for losses on interest receivable. The securities have been identified in the accompanying Statement of Investments.
8. Other Derivative Information
At June 30, 2015, the Fund’s investments in derivative contracts are reflected in the Statement of Assets and Liabilities as follows:
Asset Derivatives | Liability Derivatives | |||||||||||
Derivative Contracts Not Accounted for as Hedging Instruments | Statement of Assets and Liabilities Location | Fair Value | Statement of Assets and Liabilities Location | Fair Value | ||||||||
Foreign exchange contracts | Unrealized appreciation on OTC forward exchange contracts | $ | 2,215,243 | Unrealized depreciation on OTC forward exchange contracts | $ | 499,955 | ||||||
Credit contracts | OTC swap contracts (premium paid) | 22,197 | OTC swap contracts (premium received) | — | ||||||||
Unrealized appreciation on OTC swap contracts | — | Unrealized depreciation on OTC swap contracts | 6,605 | |||||||||
|
|
|
| |||||||||
Totals | $ | 2,237,440 | $ | 506,560 | ||||||||
|
|
|
| |||||||||
For the period ended June 30, 2015, the effect of derivative contracts in the Fund’s Statement of Operations was as follows:
Derivative Contracts Not Accounted for as Hedging Instruments | Statement of Operations Locations | Net Realized Gain (Loss) for the Period | Statement of Operations Locations | Net Change in Unrealized Appreciation (Depreciation) for the Period | ||||||||
Net realized gain (loss) from: | Net change in unrealized appreciation (depreciation) on: | |||||||||||
Foreign exchange | Foreign currency transactions | $ | 15,020,616 | a | Translation of other assets and liabilities denominated in foreign currencies | $ | (9,130,400 | )a | ||||
Credit contracts | Swap contracts | 126,596 | Swap contracts | (182,222 | ) | |||||||
|
|
|
| |||||||||
Totals | $ | 15,147,212 | $ | (9,312,622 | ) | |||||||
|
|
|
| |||||||||
aForward exchange contracts are included in net realized gain (loss) from foreign currency transactions and net change in unrealized appreciation (depreciation) on translation of other assets and liabilities denominated in foreign currencies in the Statement of Operations.
| FSI-42 | Semiannual Report |
FRANKLIN TEMPLETON VARIABLE INSURANCE PRODUCTS TRUST
NOTES TO FINANCIAL STATEMENTS (UNAUDITED)
Franklin Strategic Income VIP Fund (continued)
At June 30, 2015, the Fund’s OTC derivative assets and liabilities, are as follows:
| Gross and Net Amounts of Assets and Liabilities Presented in the Statement of Assets and Liabilities | ||||||||
| Assetsa | Liabilitiesa | |||||||
| Derivatives | ||||||||
Forward exchange contracts | $ | 2,215,243 | $ | 499,955 | ||||
Swap Contracts | 22,197 | 6,605 | ||||||
|
| |||||||
Total | $ | 2,237,440 | $ | 506,560 | ||||
|
| |||||||
aAbsent an event of default or early termination, OTC derivative assets and liabilities are presented gross and not offset in the Statement of Assets and Liabilities.
At June 30, 2015, the Fund’s OTC derivative assets which may be offset against the Fund’s OTC derivative liabilities and collateral received from the counterparty, is as follows:
| Amounts Not Offset in the Statement of Assets and Liabilities | ||||||||||||||||||||
| Gross and Net Amounts of Assets Presented in the Statement of Assets and Liabilities | Financial Instruments Available for Offset | Financial Instruments Collateral Receiveda | Cash Collateral Receivedb | Net Amount (Not less than zero) | ||||||||||||||||
| Counterparty | ||||||||||||||||||||
BZWS | $ | 100,011 | $ | (18,711 | ) | $ | — | $ | — | $ | 81,300 | |||||||||
CITI | 118,540 | (24,381 | ) | — | — | 94,159 | ||||||||||||||
DBAB | 951,274 | (335,312 | ) | — | (615,962 | ) | — | |||||||||||||
GSCO | 29,340 | (4,624 | ) | — | — | 24,716 | ||||||||||||||
HSBC | 212,220 | — | (64,105 | ) | — | 148,115 | ||||||||||||||
JPHQ | 826,055 | (115,894 | ) | (474,003 | ) | — | 236,158 | |||||||||||||
MSCO | — | — | — | — | — | |||||||||||||||
|
| |||||||||||||||||||
Total | $ | 2,237,440 | $ | (498,922 | ) | $ | (538,108 | ) | $ | (615,962 | ) | $ | 584,448 | |||||||
|
| |||||||||||||||||||
aAt June 30, 2015, the Fund received U.S. Government Agency Securities and U.S. Treasury Bonds and Notes as collateral for derivatives.
bIn some instances, the collateral amounts disclosed in the table above were adjusted due to the requirement to limit collateral amounts to avoid the effect of overcollateralization. Actual collateral received and/or pledged may be more than the amounts disclosed herein.
| Semiannual Report | FSI-43 |
FRANKLIN TEMPLETON VARIABLE INSURANCE PRODUCTS TRUST
NOTES TO FINANCIAL STATEMENTS (UNAUDITED)
Franklin Strategic Income VIP Fund (continued)
8. Other Derivative Information (continued)
At June 30, 2015, the Fund’s OTC derivative liabilities which may be offset against the Fund’s OTC derivative assets and collateral pledged to the counterparty, is as follows:
| Amounts Not Offset in the Statement of Assets and Liabilities | ||||||||||||||||||||
| Gross and Net Amounts of Liabilities Presented in the Statement of Assets and Liabilities | Financial Instruments Available for Offset | Financial Instruments Collateral Pledged | Cash Collateral Pledged | Net Amount (Not less than zero) | ||||||||||||||||
| Counterparty | ||||||||||||||||||||
BZWS | $ | 18,711 | $ | (18,711 | ) | $ | — | $ | — | $ | — | |||||||||
CITI | 24,381 | (24,381 | ) | — | — | — | ||||||||||||||
DBAB | 335,312 | (335,312 | ) | — | — | — | ||||||||||||||
GSCO | 4,624 | (4,624 | ) | — | — | — | ||||||||||||||
HSBC | — | — | — | — | — | |||||||||||||||
JPHQ | 115,894 | (115,894 | ) | — | — | — | ||||||||||||||
MSCO | 7,638 | — | — | — | 7,638 | |||||||||||||||
|
| |||||||||||||||||||
Total | $ | 506,560 | $ | (498,922 | ) | $ | — | $ | — | $ | 7,638 | |||||||||
|
| |||||||||||||||||||
For the period ended June 30, 2015, the average month end fair value of derivatives represented 1.33% of average month end net assets. The average month end number of open derivative contracts for the period was 126.
See Note 1(d) regarding derivative financial instruments.
9. Credit Facility
The Fund, together with other U.S. registered and foreign investment funds (collectively, Borrowers), managed by Franklin Templeton Investments, are borrowers in a joint syndicated senior unsecured credit facility totaling $2 billion (Global Credit Facility) which matures on February 12, 2016. This Global Credit Facility provides a source of funds to the Borrowers for temporary and emergency purposes, including the ability to meet future unanticipated or unusually large redemption requests.
Under the terms of the Global Credit Facility, the Fund shall, in addition to interest charged on any borrowings made by the Fund and other costs incurred by the Fund, pay its share of fees and expenses incurred in connection with the implementation and maintenance of the Global Credit Facility, based upon its relative share of the aggregate net assets of all of the Borrowers, including an annual commitment fee of 0.07% based upon the unused portion of the Global Credit Facility. These fees are reflected in other expenses in the Statement of Operations. During the period ended June 30, 2015, the Fund did not use the Global Credit Facility.
10. Fair Value Measurements
The Fund follows a fair value hierarchy that distinguishes between market data obtained from independent sources (observable inputs) and the Fund’s own market assumptions (unobservable inputs). These inputs are used in determining the value of the Fund’s financial instruments and are summarized in the following fair value hierarchy:
| • | Level 1 – quoted prices in active markets for identical financial instruments |
| • | Level 2 – other significant observable inputs (including quoted prices for similar financial instruments, interest rates, prepayment speed, credit risk, etc.) |
| • | Level 3 – significant unobservable inputs (including the Fund’s own assumptions in determining the fair value of financial instruments) |
| FSI-44 | Semiannual Report |
FRANKLIN TEMPLETON VARIABLE INSURANCE PRODUCTS TRUST
NOTES TO FINANCIAL STATEMENTS (UNAUDITED)
Franklin Strategic Income VIP Fund (continued)
The input levels are not necessarily an indication of the risk or liquidity associated with financial instruments at that level.
For movements between the levels within the fair value hierarchy, the Fund has adopted a policy of recognizing the transfers as of the date of the underlying event which caused the movement.
A summary of inputs used as of June 30, 2015, in valuing the Fund’s assets and liabilities carried at fair value, is as follows:
| Level 1 | Level 2 | Level 3 | Total | |||||||||||||
| Assets: | ||||||||||||||||
Investments in Securities: | ||||||||||||||||
Equity Investments:a | ||||||||||||||||
Consumer Services | $ | — | $ | — | $ | 3,788,636 | $ | 3,788,636 | ||||||||
Transportation | — | 531,244 | — | 531,244 | ||||||||||||
All other Equity Investmentsb | 6,225 | — | — | 6,225 | ||||||||||||
Corporate Bonds | — | 322,488,411 | 168,625 | 322,657,036 | ||||||||||||
Senior Floating Rate Interests | — | 173,973,941 | 154,500 | 174,128,441 | ||||||||||||
Foreign Government and Agency Securities | — | 134,895,426 | — | 134,895,426 | ||||||||||||
U.S. Government and Agency Securities | — | 25,618,690 | — | 25,618,690 | ||||||||||||
Asset-Backed Securities and Commercial Mortgage-Backed Securities | — | 54,064,542 | — | 54,064,542 | ||||||||||||
Mortgage-Backed Securities | — | 20,349,624 | — | 20,349,624 | ||||||||||||
Municipal Bonds | — | 36,431,460 | — | 36,431,460 | ||||||||||||
Escrows and Litigation Trusts | — | — | — | c | — | |||||||||||
Short Term Investments | 70,999,990 | 3,972,635 | — | 74,972,625 | ||||||||||||
|
| |||||||||||||||
Total Investments in Securities | $ | 71,006,215 | $ | 772,325,973 | $ | 4,111,761 | $ | 847,443,949 | ||||||||
|
| |||||||||||||||
Other Financial Instruments | ||||||||||||||||
Forward Exchange Contracts | $ | — | $ | 2,215,243 | $ | — | $ | 2,215,243 | ||||||||
|
| |||||||||||||||
| Liabilities: | ||||||||||||||||
Other Financial Instruments | ||||||||||||||||
Forward Exchange Contracts | $ | — | $ | 499,955 | $ | — | $ | 499,955 | ||||||||
Swap Contracts | — | 6,605 | — | 6,605 | ||||||||||||
|
| |||||||||||||||
Total Other Financial Instruments | $ | — | $ | 506,560 | $ | — | $ | 506,560 | ||||||||
|
| |||||||||||||||
aIncludes common and convertible preferred stocks.
bFor detailed categories, see the accompanying Statement of Investments.
cIncludes securities determined to have no value at June 30, 2015.
A reconciliation of assets in which Level 3 inputs are used in determining fair value is presented when there are significant Level 3 financial instruments at the end of the period.
11. Subsequent Events
The Fund has evaluated subsequent events through the issuance of the financial statements and determined that no events have occurred that require disclosure.
| Semiannual Report | FSI-45 |
FRANKLIN TEMPLETON VARIABLE INSURANCE PRODUCTS TRUST
NOTES TO FINANCIAL STATEMENTS (UNAUDITED)
Franklin Strategic Income VIP Fund (continued)
Abbreviations
| Counterparty | Currency | Selected Portfolio | ||||||||
| BZWS | Barclays Bank PLC | BRL | Brazilian Real | AGMC | Assured Guaranty Municipal Corp. | |||||
| CITI | Citigroup, Inc. | EUR | Euro | CDO | Collateralized Debt Obligation | |||||
| DBAB | Deutsche Bank AG | GBP | British Pound | CLO | Collateralized Loan Obligation | |||||
| GSCO | The Goldman Sachs Group, Inc. | HUF | Hungarian Forint | EDA | Economic Development Authority | |||||
| HSBC | HSBC Bank USA, N.A. | IDR | Indonesian Rupiah | FICO | Financing Corp. | |||||
| JPHQ | JP Morgan Chase & Co. | KRW | South Korean Won | FRN | Floating Rate Note | |||||
| MSCO | Morgan Stanley | LKR | Sri Lankan Rupee | GO | General Obligation | |||||
| MXN | Mexican Peso | HDC | Housing Development Corp. | |||||||
| MYR | Malaysian Ringgit | �� | ISD | Independent School District | ||||||
| PHP | Philippine Peso | NATL | National Public Financial Guarantee Corp. | |||||||
| PLN | Polish Zloty | PIK | Payment-In-Kind | |||||||
| SGD | Singapore Dollar | PSF | Permanent School Fund | |||||||
| UYU | Uruguayan Peso | |||||||||
| FSI-46 | Semiannual Report |
Franklin U.S. Government Securities VIP Fund
This semiannual report for Franklin U.S. Government Securities VIP Fund covers the period ended June 30, 2015.
Class 1 Performance Summary as of June 30, 2015
The Fund’s Class 1 shares delivered a +0.24% total return* for the six-month period ended June 30, 2015.
Performance reflects the Fund’s Class 1 operating expenses, but does not include any contract fees, expenses or sales charges. If they had been included, performance would be lower. These charges and deductions, particularly for variable life policies, can have a significant effect on contract values and insurance benefits. See the contract prospectus for a complete description of these expenses, including sales charges.
Performance data represent past performance, which does not guarantee future results. Investment return and principal value will fluctuate, and you may have a gain or loss when you sell your shares. Current performance may differ from figures shown.
| Semiannual Report | FUS-1 |
FRANKLIN U.S. GOVERNMENT SECURITIES VIP FUND
Fund Goal and Main Investments
Franklin U.S. Government Securities VIP Fund seeks income. Under normal market conditions, the Fund invests at least 80% of its net assets in U.S. government securities.
Fund Risks
All investments involve risks, including possible loss of principal. The Fund’s share price and yield will be affected by interest rate movements and mortgage prepayments. Bond prices generally move in the opposite direction of interest rates. Thus, as prices of bonds in the Fund adjust to a rise in interest rates, the Fund’s share price may decline. Changes in the financial strength of a bond issuer or in a bond’s credit rating may affect its value. The Fund is actively managed but there is no guarantee that the manager’s investment decisions will produce the desired results. The Fund’s prospectus also includes a description of the main investment risks.
Performance Overview
You can find the Fund’s six-month total return in the Performance Summary. In comparison, the Fund’s primary benchmark, the Barclays U.S. Government Index: Intermediate Component, delivered a +0.82% total return.1 The Fund’s secondary benchmark, the Lipper VIP General U.S. Government Funds Classification Average, had a -0.50% total return.2 Funds in the Lipper average may allocate as much as 35% of their investments in asset types other than U.S. government and agency mortgage-backed securities.
Economic and Market Overview
U.S. economic growth was mixed during the six months under review. In 2015’s first quarter, U.S. dollar strength, low energy prices, and a labor dispute at West Coast ports led exports to decline. Lower business investment and state and local government spending also weighed on the economy, while increases in consumer spending, residential investment and private inventory investment offered some support. In the second quarter, business capital spending rebounded and manufacturing and non-manufacturing activities increased, contributing to strong job gains that helped the unemployment rate decline from 5.6% in December 2014 to 5.3% in June 2015.3 Housing market data were generally encouraging as
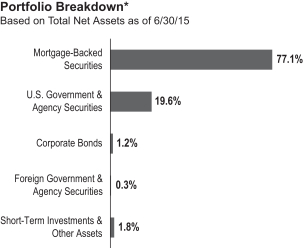
The dollar value, number of shares or principal amount, and names of all portfolio holdings are listed in the Fund’s Statement of Investments.
home sales and prices rose. After a brief, winter slump, retail sales rebounded in the spring as strong employment gains led to broad-based improvement, especially for auto and gasoline sales. Inflation, as measured by the Consumer Price Index, rose during the six months amid generally higher energy prices bouncing from recent lows.
During the six-month period, the Federal Reserve Board (Fed) kept its target interest rate at 0%–0.25% while considering when an increase might be appropriate. The Fed anticipated raising its target rate when it saw further labor market progress and was reasonably confident that inflation would move back to 2% over the medium term. In its June meeting, the Fed lowered its 2015 economic growth forecast and raised unemployment estimates given the weak start to the year.
The 10-year Treasury yield, which moves inversely to price, declined from 2.17% at the start of the period to a six-month low of 1.68% in early February as investors sought less risky assets given concerns about soft domestic data, Greece’s debt negotiations, less robust growth in China and the Fed’s cautious tone on raising interest rates. At period-end, the yield rose to 2.35% based partly on upbeat domestic and eurozone economic data and expectations of an agreement between Greece and its international creditors.
1. Source: Morningstar.
2. Source: Lipper, a Thomson Reuters Company.
One cannot invest directly in an index, and an index is not representative of the Fund’s portfolio. Please see Index Descriptions following the Fund Summaries.
3. Source: Bureau of Labor Statistics.
| FUS-2 | Semiannual Report |
FRANKLIN U.S. GOVERNMENT SECURITIES VIP FUND
Investment Strategy
Using our straightforward investment approach, we seek to produce current income with a high degree of credit safety from a conservatively managed portfolio of U.S. government securities. Analyzing securities using proprietary and nonproprietary research, we seek to identify attractive investment opportunities.
Manager’s Discussion
The overall mortgage market outpaced Treasuries during the period, and Government National Mortgage Association mortgage-backed securities (MBS) also outperformed Treasuries but lagged their conventional agency mortgage counterparts. During the period, mortgage rates rose and the Fed announced it anticipated raising its target rate if labor market and inflation data met its goals. We believed the Fed’s reinvestment of mortgage repayments could end within a few quarters after the first rate increase, and questions remained about the demand source for agency MBS after the Fed’s buying ends.
The Fund maintains a consistent and disciplined approach to our investment strategy. The Fund’s investment process and strategy have not changed, and the team continues to look for strong cash flow fundamentals and valuations seeking to uncover opportunities across the agency mortgage and agency debenture universe. The Fund emphasizes agency pass-throughs and invests in other agency securities for diversification purposes.
During the period, we were more weighted toward GNMA IIs (pools of mortgages from multiple issuers) than GNMA Is (pools of mortgages from single issuers). Over the period, we increased exposure to GNMA II 3.5% coupons while reducing the allocations to 4.0%, 4.5% and 5.0% coupons. At year-end, our heaviest allocations were in 3.5% and 4.0% coupons. The Fund’s allocation to higher coupon securities was additive to relative performance, while our overweighted position in lower coupon securities compared with the benchmark index detracted from relative performance.
Thank you for your participation in Franklin U.S. Government Securities VIP Fund. We look forward to serving your future investment needs.
The foregoing information reflects our analysis, opinions and portfolio holdings as of June 30, 2015, the end of the reporting period. The way we implement our main investment strategies and the resulting portfolio holdings may change depending on factors such as market and economic conditions. These opinions may not be relied upon as investment advice or an offer for a particular security. The information is not a complete analysis of every aspect of any market, country, industry, security or the Fund. Statements of fact are from sources considered reliable, but the investment manager makes no representation or warranty as to their completeness or accuracy. Although historical performance is no guarantee of future results, these insights may help you understand our investment management philosophy.
| Semiannual Report | FUS-3 |
FRANKLIN U.S. GOVERNMENT SECURITIES VIP FUND
Class 1 Fund Expenses
As an investor in a variable insurance contract (Contract) that indirectly provides for investment in an underlying mutual fund, you can incur transaction and/or ongoing expenses at both the Fund level and the Contract level.
| • | Transaction expenses can include sales charges (loads) on purchases, surrender fees, transfer fees and premium taxes. |
| • | Ongoing expenses can include management fees, distribution and service (12b-1) fees, contract fees, annual maintenance fees, mortality and expense risk fees and other fees and expenses. All mutual funds and Contracts have some types of ongoing expenses. |
The expenses shown in the table are meant to highlight ongoing expenses at the Fund level only and do not include ongoing expenses at the Contract level, or transaction expenses at either the Fund or Contract levels. While the Fund does not have transaction expenses, if the transaction and ongoing expenses at the Contract level were included, the expenses shown below would be higher. You should consult your Contract prospectus or disclosure document for more information.
The table shows Fund-level ongoing expenses and can help you understand these expenses and compare them with those of other mutual funds offered through the Contract. The table assumes a $1,000 investment held for the six months indicated. Please refer to the Fund prospectus for additional information on operating expenses.
Actual Fund Expenses
The first line (Actual) of the table provides actual account values and expenses. The “Ending Account Value” is derived from the Fund’s actual return, which includes the effect of ongoing Fund expenses, but does not include the effect of ongoing Contract expenses.
You can estimate the Fund-level expenses you incurred during the period by following these steps. Of course, your account value and expenses will differ from those in this illustration:
| 1. | Divide your account value by $1,000. |
If an account had an $8,600 value, then $8,600 ÷ $1,000 = 8.6.
| 2. | Multiply the result by the number under the heading “Fund-Level Expenses Incurred During Period.” |
If Fund-Level Expenses Incurred During Period were $7.50, then 8.6 × $7.50 = $64.50.
In this illustration, the estimated expenses incurred this period at the Fund level are $64.50.
Hypothetical Example for Comparison with Other Mutual Funds
Information in the second line (Hypothetical) of the table can help you compare ongoing expenses of the Fund with those of other mutual funds offered through the Contract. This information may not be used to estimate the actual ending account balance or expenses you incurred during the period. The hypothetical “Ending Account Value” is based on the Fund’s actual expense ratio and an assumed 5% annual rate of return before expenses, which does not represent the Fund’s actual return. The figure under the heading “Fund-Level Expenses Incurred During Period” shows the hypothetical expenses your account would have incurred under this scenario. You can compare this figure with the 5% hypothetical examples that appear in shareholder reports of other funds offered through a Contract.
| Class 1 | Beginning Account Value 1/1/15 | Ending Account Value 6/30/15 | Fund-Level Expenses 1/1/15–6/30/15 | |||||||||
Actual | $1,000 | $1,002.40 | $2.43 | |||||||||
Hypothetical (5% return before expenses) | $1,000 | $1,022.36 | $2.46 | |||||||||
*Expenses are calculated using the most recent six-month annualized expense ratio for the Fund’s Class 1 shares (0.49%), which does not include any ongoing expenses of the Contract for which the Fund is an investment option, multiplied by the average account value over the period, multiplied by 181/365 to reflect the one-half year period.
| FUS-4 | Semiannual Report |
FRANKLIN TEMPLETON VARIABLE INSURANCE PRODUCTS TRUST
Financial Highlights
Franklin U.S. Government Securities VIP Fund
| Six Months Ended June 30, 2015 (unaudited) | Year Ended December 31, | |||||||||||||||||||||||
| 2014 | 2013 | 2012 | 2011 | 2010 | ||||||||||||||||||||
| Class 1 | ||||||||||||||||||||||||
Per share operating performance (for a share outstanding throughout the period) | ||||||||||||||||||||||||
Net asset value, beginning of period | $13.00 | $12.91 | $13.57 | $13.67 | $13.34 | $13.08 | ||||||||||||||||||
|
| |||||||||||||||||||||||
| Income from investment operationsa: | ||||||||||||||||||||||||
Net investment incomeb | 0.10 | 0.24 | 0.24 | 0.32 | 0.42 | 0.47 | ||||||||||||||||||
Net realized and unrealized gains (losses) | (0.07 | ) | 0.22 | (0.51 | ) | (0.03 | ) | 0.36 | 0.25 | |||||||||||||||
|
| |||||||||||||||||||||||
Total from investment operations | 0.03 | 0.46 | (0.27 | ) | 0.29 | 0.78 | 0.72 | |||||||||||||||||
|
| |||||||||||||||||||||||
Less distributions from net investment income | (0.35 | ) | (0.37 | ) | (0.39 | ) | (0.39 | ) | (0.45 | ) | (0.46 | ) | ||||||||||||
|
| |||||||||||||||||||||||
Net asset value, end of period | $12.68 | $13.00 | $12.91 | $13.57 | $13.67 | $13.34 | ||||||||||||||||||
|
| |||||||||||||||||||||||
Total returnc | 0.24% | 3.64% | (1.99)% | 2.12% | 5.96% | 5.56% | ||||||||||||||||||
| Ratios to average net assetsd | ||||||||||||||||||||||||
Expenses | 0.49% | 0.49% | e | 0.49% | e | 0.50% | 0.51% | 0.52% | ||||||||||||||||
Net investment income | 1.58% | 1.84% | 1.84% | 2.36% | 3.11% | 3.51% | ||||||||||||||||||
| Supplemental data | ||||||||||||||||||||||||
Net assets, end of period (000’s) | $85,248 | $90,656 | $99,947 | $126,536 | $136,628 | $157,551 | ||||||||||||||||||
Portfolio turnover rate | 32.51% | 42.88% | 69.47% | 45.89% | 37.89% | 51.04% | ||||||||||||||||||
Portfolio turnover rate excluding mortgage dollar rollsf | 32.51% | 42.88% | 67.80% | 45.89% | 37.89% | 51.04% | ||||||||||||||||||
aThe amount shown for a share outstanding throughout the period may not correlate with the Statement of Operations for the period due to the timing of sales and repurchases of the Fund’s shares in relation to income earned and/or fluctuating fair value of the investments of the Fund.
bBased on average daily shares outstanding.
cTotal return does not include fees, charges or expenses imposed by the variable annuity and life insurance contracts for which Franklin Templeton Variable Insurance Products Trust serves as an underlying investment vehicle. Total return is not annualized for periods less than one year.
dRatios are annualized for periods less than one year.
eBenefit of expense reduction rounds to less than 0.01%.
fSee Note 1(c) regarding mortgage dollar rolls.
| The accompanying notes are an integral part of these financial statements. | Semiannual Report | FUS-5 |
FRANKLIN TEMPLETON VARIABLE INSURANCE PRODUCTS TRUST
FINANCIAL HIGHLIGHTS
Franklin U.S. Government Securities VIP Fund (continued)
Six Months Ended (unaudited) | Year Ended December 31, | |||||||||||||||||||||||
| 2014 | 2013 | 2012 | 2011 | 2010 | ||||||||||||||||||||
| Class 2 | ||||||||||||||||||||||||
Per share operating performance (for a share outstanding throughout the period) | ||||||||||||||||||||||||
Net asset value, beginning of period | $12.73 | $12.65 | $13.31 | $13.42 | $13.11 | $12.87 | ||||||||||||||||||
|
| |||||||||||||||||||||||
| Income from investment operationsa: | ||||||||||||||||||||||||
Net investment incomeb | 0.08 | 0.20 | 0.21 | 0.28 | 0.38 | 0.43 | ||||||||||||||||||
Net realized and unrealized gains (losses) | (0.07 | ) | 0.22 | (0.50 | ) | (0.03 | ) | 0.35 | 0.24 | |||||||||||||||
|
| |||||||||||||||||||||||
Total from investment operations | 0.01 | 0.42 | (0.29 | ) | 0.25 | 0.73 | 0.67 | |||||||||||||||||
|
| |||||||||||||||||||||||
Less distributions from net investment income | (0.32 | ) | (0.34 | ) | (0.37 | ) | (0.36 | ) | (0.42 | ) | (0.43 | ) | ||||||||||||
|
| |||||||||||||||||||||||
Net asset value, end of period | $12.42 | $12.73 | $12.65 | $13.31 | $13.42 | $13.11 | ||||||||||||||||||
|
| |||||||||||||||||||||||
Total returnc | 0.07% | 3.38% | (2.24)% | 1.89% | 5.68% | 5.28% | ||||||||||||||||||
| Ratios to average net assetsd | ||||||||||||||||||||||||
Expenses | 0.74% | 0.74% | e | 0.74% | e | 0.75% | 0.76% | 0.77% | ||||||||||||||||
Net investment income | 1.33% | 1.59% | 1.59% | 2.11% | 2.86% | 3.26% | ||||||||||||||||||
| Supplemental data | ||||||||||||||||||||||||
Net assets, end of period (000’s) | $1,343,349 | $1,369,037 | $1,267,994 | $1,206,089 | $894,699 | $703,997 | ||||||||||||||||||
Portfolio turnover rate | 32.51% | 42.88% | 69.47% | 45.89% | 37.89% | 51.04% | ||||||||||||||||||
Portfolio turnover rate excluding mortgage dollar rollsf | 32.51% | 42.88% | 67.80% | 45.89% | 37.89% | 51.04% | ||||||||||||||||||
aThe amount shown for a share outstanding throughout the period may not correlate with the Statement of Operations for the period due to the timing of sales and repurchases of the Fund’s shares in relation to income earned and/or fluctuating fair value of the investments of the Fund.
bBased on average daily shares outstanding.
cTotal return does not include fees, charges or expenses imposed by the variable annuity and life insurance contracts for which Franklin Templeton Variable Insurance Products Trust serves as an underlying investment vehicle. Total return is not annualized for periods less than one year.
dRatios are annualized for periods less than one year.
eBenefit of expense reduction rounds to less than 0.01%.
fSee Note 1(c) regarding mortgage dollar rolls.
| FUS-6 | Semiannual Report | The accompanying notes are an integral part of these financial statements. |
FRANKLIN TEMPLETON VARIABLE INSURANCE PRODUCTS TRUST
Statement of Investments, June 30, 2015 (unaudited)
Franklin U.S. Government Securities VIP Fund
| ||||||||||
| Principal Amount* | Value | |||||||||
Corporate Bonds 1.2% | ||||||||||
New Valley Generation IV, secured bond, 4.687%, 1/15/22 | 2,616,461 | $ | 2,856,959 | |||||||
Private Export Funding Corp., | ||||||||||
2.30%, 9/15/20 | 3,500,000 | 3,518,609 | ||||||||
secured bond, 2.80%, 5/15/22 | 9,000,000 | 9,138,897 | ||||||||
secured note, LL, 2.25%, 3/15/20 | 1,700,000 | 1,722,964 | ||||||||
|
| |||||||||
Total Corporate Bonds (Cost $17,447,539) | 17,237,429 | |||||||||
|
| |||||||||
Foreign Government and Agency Securities 0.3% | ||||||||||
| a | International Bank for Reconstruction and Development, | |||||||||
2, zero cpn., 2/15/16 (Supranational) | 1,868,000 | 1,862,441 | ||||||||
Principal Strip, 7/15/17 (Supranational) | 1,761,000 | 1,717,072 | ||||||||
|
| |||||||||
Total Foreign Government and Agency Securities | 3,579,513 | |||||||||
|
| |||||||||
Mortgage-Backed Securities 77.1% | ||||||||||
| b | Federal Home Loan Mortgage Corp. (FHLMC) Adjustable Rate 6.3% | |||||||||
FHLMC, 1.607% - 2.275%, 12/01/16 - 6/01/42 | 5,429,449 | 5,700,965 | ||||||||
FHLMC, 2.278% - 2.285%, 9/01/32 - 9/01/37 | 10,922,810 | 11,603,426 | ||||||||
FHLMC, 2.287% - 2.348%, 10/01/22 - 7/01/41 | 13,093,079 | 13,951,111 | ||||||||
FHLMC, 2.348% - 2.42%, 10/01/22 - 2/01/40 | 12,790,970 | 13,631,870 | ||||||||
FHLMC, 2.422% - 2.434%, 11/01/25 - 9/01/38 | 6,304,424 | 6,706,195 | ||||||||
FHLMC, 2.436% - 2.482%, 2/01/19 - 8/01/37 | 12,475,636 | 13,262,861 | ||||||||
FHLMC, 2.485% - 2.508%, 6/01/24 - 11/01/37 | 2,445,653 | 2,604,139 | ||||||||
FHLMC, 2.509% - 2.515%, 9/01/30 - 4/01/40 | 13,337,965 | 14,277,406 | ||||||||
FHLMC, 2.515% - 6.094%, 12/01/18 - 8/01/41 | 7,465,972 | 7,911,865 | ||||||||
|
| |||||||||
| 89,649,838 | ||||||||||
|
| |||||||||
Federal Home Loan Mortgage Corp. (FHLMC) Fixed Rate 3.1% | ||||||||||
FHLMC Gold 15 Year, 4.50%, 3/01/25 - 4/01/25 | 2,460,812 | 2,588,341 | ||||||||
FHLMC Gold 30 Year, 3.00%, 5/01/43 | 638,696 | 635,493 | ||||||||
FHLMC Gold 30 Year, 3.50%, 3/01/32 - 5/01/43 | 7,104,447 | 7,401,450 | ||||||||
FHLMC Gold 30 Year, 4.00%, 9/01/40 - 12/01/41 | 11,941,326 | 12,652,165 | ||||||||
FHLMC Gold 30 Year, 4.50%, 5/01/40 - 7/01/41 | 5,122,924 | 5,541,540 | ||||||||
FHLMC Gold 30 Year, 5.00%, 9/01/33 - 4/01/40 | 7,450,908 | 8,251,119 | ||||||||
FHLMC Gold 30 Year, 5.50%, 7/01/33 - 5/01/38 | 2,571,536 | 2,890,934 | ||||||||
FHLMC Gold 30 Year, 6.00%, 1/01/24 - 8/01/35 | 1,688,850 | 1,920,562 | ||||||||
FHLMC Gold 30 Year, 6.50%, 12/01/23 - 5/01/35 | 737,848 | 845,683 | ||||||||
FHLMC Gold 30 Year, 7.00%, 4/01/24 - 6/01/32 | 293,072 | 333,201 | ||||||||
FHLMC Gold 30 Year, 7.50%, 12/01/22 - 5/01/24 | 5,407 | 5,744 | ||||||||
FHLMC Gold 30 Year, 8.00%, 9/01/21 - 5/01/22 | 6,154 | 6,977 | ||||||||
FHLMC Gold 30 Year, 8.50%, 10/01/21 - 7/01/31 | 519,846 | 627,682 | ||||||||
FHLMC PC 30 Year, 8.00%, 1/01/17 - 5/01/17 | 2,007 | 2,012 | ||||||||
FHLMC PC 30 Year, 8.50%, 9/01/20 | 355 | 366 | ||||||||
|
| |||||||||
| 43,703,269 | ||||||||||
|
| |||||||||
| b | Federal National Mortgage Association (FNMA) Adjustable Rate 7.9% | |||||||||
FNMA, 1.356% - 2.089%, 4/01/16 - 10/01/44 | 10,459,566 | 11,056,322 | ||||||||
FNMA, 2.10% - 2.235%, 11/01/17 - 7/01/37 | 9,924,445 | 10,501,366 | ||||||||
FNMA, 2.239% - 2.24%, 8/01/36 - 8/01/37 | 11,748,069 | 12,499,152 | ||||||||
FNMA, 2.241% - 2.281%, 1/01/17 - 9/01/39 | 12,964,012 | 13,778,581 | ||||||||
FNMA, 2.285% - 2.364%, 10/01/19 - 4/01/40 | 12,408,600 | 13,241,890 | ||||||||
FNMA, 2.366% - 2.446%, 1/01/19 - 12/01/40 | 13,495,594 | 14,278,678 | ||||||||
FNMA, 2.447% - 2.505%, 6/01/21 - 3/01/47 | 759,360 | 795,100 | ||||||||
| Semiannual Report | FUS-7 |
FRANKLIN TEMPLETON VARIABLE INSURANCE PRODUCTS TRUST
STATEMENT OF INVESTMENTS (UNAUDITED)
Franklin U.S. Government Securities VIP Fund (continued)
| Principal Amount* | Value | |||||||||
Mortgage-Backed Securities (continued) | ||||||||||
| b | Federal National Mortgage Association (FNMA) Adjustable Rate (continued) | |||||||||
FNMA, 2.509%, 9/01/37 | 32,112,924 | $ | 34,401,021 | |||||||
FNMA, 2.515% - 6.084%, 8/01/18 - 4/01/41 | 2,408,079 | 2,499,038 | ||||||||
|
| |||||||||
| 113,051,148 | ||||||||||
|
| |||||||||
Federal National Mortgage Association (FNMA) Fixed Rate 7.6% | ||||||||||
FNMA 15 Year, 5.50%, 6/01/16 - 1/01/25 | 2,688,302 | 2,951,424 | ||||||||
FNMA 15 Year, 6.00%, 8/01/17 - 9/01/17 | 97,617 | 100,622 | ||||||||
FNMA 30 Year, 3.00%, 12/01/42 | 306,389 | 305,007 | ||||||||
| c | FNMA 30 Year, 3.50%, 7/01/45 | 50,000,000 | 51,432,616 | |||||||
FNMA 30 Year, 4.00%, 1/01/41 - 6/01/41 | 9,052,454 | 9,600,959 | ||||||||
FNMA 30 Year, 4.00%, 8/01/41 | 5,134,170 | 5,465,279 | ||||||||
FNMA 30 Year, 4.50%, 8/01/40 - 12/01/40 | 8,881,726 | 9,617,524 | ||||||||
FNMA 30 Year, 4.50%, 4/01/41 - 6/01/41 | 5,188,881 | 5,623,006 | ||||||||
FNMA 30 Year, 5.00%, 3/01/34 - 7/01/41 | 10,252,113 | 11,341,055 | ||||||||
FNMA 30 Year, 5.50%, 12/01/32 - 8/01/35 | 3,315,042 | 3,730,325 | ||||||||
FNMA 30 Year, 6.00%, 1/01/24 - 8/01/38 | 4,899,975 | 5,585,021 | ||||||||
FNMA 30 Year, 6.50%, 1/01/24 - 9/01/36 | 803,907 | 923,866 | ||||||||
FNMA 30 Year, 7.50%, 4/01/23 - 8/01/25 | 30,268 | 32,142 | ||||||||
FNMA 30 Year, 8.00%, 3/01/22 - 2/01/25 | 120,888 | 127,021 | ||||||||
FNMA 30 Year, 8.50%, 3/01/20 - 6/01/21 | 956 | 1,026 | ||||||||
FNMA 30 Year, 9.00%, 10/01/26 | 110,134 | 127,757 | ||||||||
FNMA GL 30 Year, 8.00%, 8/01/19 | 12,810 | 12,969 | ||||||||
FNMA PL 30 Year, 5.50%, 4/01/34 | 1,670,061 | 1,857,741 | ||||||||
|
| |||||||||
| 108,835,360 | ||||||||||
|
| |||||||||
Government National Mortgage Association (GNMA) Fixed Rate 52.2% | ||||||||||
GNMA I SF 30 Year, 3.00%, 7/15/42 | 719,240 | 730,408 | ||||||||
GNMA I SF 30 Year, 4.50%, 1/15/39 - 11/15/39 | 12,700,090 | 13,857,555 | ||||||||
GNMA I SF 30 Year, 4.50%, 2/15/40 - 6/15/40 | 11,207,066 | 12,200,799 | ||||||||
GNMA I SF 30 Year, 4.50%, 7/15/40 - 6/15/41 | 8,894,272 | 9,727,467 | ||||||||
GNMA I SF 30 Year, 5.00%, 6/15/30 - 2/15/39 | 8,527,608 | 9,524,431 | ||||||||
GNMA I SF 30 Year, 5.00%, 4/15/39 - 10/15/39 | 10,615,397 | 11,827,369 | ||||||||
GNMA I SF 30 Year, 5.00%, 10/15/39 - 1/15/40 | 8,446,481 | 9,504,553 | ||||||||
GNMA I SF 30 Year, 5.00%, 2/15/40 - 4/15/40 | 12,662,052 | 14,251,163 | ||||||||
GNMA I SF 30 Year, 5.00%, 4/15/40 - 9/15/40 | 4,569,249 | 5,118,797 | ||||||||
GNMA I SF 30 Year, 5.50%, 12/15/28 - 10/15/39 | 10,492,964 | 11,971,376 | ||||||||
GNMA I SF 30 Year, 6.00%, 11/15/23 - 11/15/38 | 5,547,941 | 6,394,484 | ||||||||
GNMA I SF 30 Year, 6.50%, 5/15/23 - 9/15/38 | 2,797,285 | 3,215,938 | ||||||||
GNMA I SF 30 Year, 7.00%, 9/15/22 - 1/15/32 | 810,055 | 864,715 | ||||||||
GNMA I SF 30 Year, 7.50%, 2/15/17 - 8/15/33 | 771,501 | 899,528 | ||||||||
GNMA I SF 30 Year, 8.00%, 3/15/17 - 5/15/24 | 214,298 | 224,613 | ||||||||
GNMA I SF 30 Year, 8.50%, 6/15/22 - 12/15/24 | 84,374 | 88,947 | ||||||||
GNMA I SF 30 Year, 9.00%, 6/15/16 - 5/15/20 | 15,348 | 15,429 | ||||||||
GNMA I SF 30 Year, 9.50%, 7/15/16 - 12/15/20 | 59,523 | 61,509 | ||||||||
GNMA I SF 30 Year, 10.00%, 11/15/17 - 8/15/21 | 31,517 | 33,006 | ||||||||
GNMA II SF 30 Year, 3.00%, 12/20/42 - 2/20/45 | 4,501,951 | 4,546,687 | ||||||||
GNMA II SF 30 Year, 3.50%, 12/20/40 - 7/20/42 | 4,408,658 | 4,581,036 | ||||||||
GNMA II SF 30 Year, 3.50%, 8/20/42 | 13,518,712 | 14,047,562 | ||||||||
GNMA II SF 30 Year, 3.50%, 9/20/42 | 38,188,031 | 39,683,917 | ||||||||
GNMA II SF 30 Year, 3.50%, 10/20/42 | 11,671,245 | 12,129,031 | ||||||||
GNMA II SF 30 Year, 3.50%, 11/20/42 | 23,002,614 | 23,904,855 | ||||||||
GNMA II SF 30 Year, 3.50%, 12/20/42 | 17,021,927 | 17,690,468 | ||||||||
| FUS-8 | Semiannual Report |
FRANKLIN TEMPLETON VARIABLE INSURANCE PRODUCTS TRUST
STATEMENT OF INVESTMENTS (UNAUDITED)
Franklin U.S. Government Securities VIP Fund (continued)
| Principal Amount* | Value | |||||||||
Mortgage-Backed Securities (continued) | ||||||||||
Government National Mortgage Association (GNMA) Fixed Rate (continued) | ||||||||||
GNMA II SF 30 Year, 3.50%, 1/20/43 | 28,630,980 | $ | 29,755,471 | |||||||
GNMA II SF 30 Year, 3.50%, 3/20/43 | 10,834,702 | 11,260,805 | ||||||||
GNMA II SF 30 Year, 3.50%, 4/20/43 | 13,728,926 | 14,268,860 | ||||||||
GNMA II SF 30 Year, 3.50%, 5/20/43 | 24,118,095 | 25,066,619 | ||||||||
GNMA II SF 30 Year, 3.50%, 6/20/43 - 8/20/43 | 11,569,892 | 12,024,921 | ||||||||
GNMA II SF 30 Year, 3.50%, 4/20/45 | 30,903,828 | 32,189,219 | ||||||||
GNMA II SF 30 Year, 3.50%, 5/20/45 | 10,978,208 | 11,392,706 | ||||||||
| c | GNMA II SF 30 Year, 3.50%, 6/20/45 | 91,045,000 | 94,831,933 | |||||||
GNMA II SF 30 Year, 4.00%, 11/20/39 - 12/20/40 | 10,356,881 | 11,088,663 | ||||||||
GNMA II SF 30 Year, 4.00%, 1/20/41 - 7/20/41 | 13,302,238 | 14,228,197 | ||||||||
GNMA II SF 30 Year, 4.00%, 9/20/41 | 1,892,096 | 2,024,297 | ||||||||
GNMA II SF 30 Year, 4.00%, 11/20/41 | 14,124,480 | 15,109,905 | ||||||||
GNMA II SF 30 Year, 4.00%, 12/20/41 - 2/20/44 | 5,499,274 | 5,913,406 | ||||||||
GNMA II SF 30 Year, 4.00%, 11/20/44 | 27,357,180 | 28,978,968 | ||||||||
GNMA II SF 30 Year, 4.00%, 12/20/44 | 67,635,068 | 71,644,608 | ||||||||
GNMA II SF 30 Year, 4.00%, 2/20/45 | 17,114,310 | 18,128,880 | ||||||||
GNMA II SF 30 Year, 4.50%, 10/20/39 - 4/20/41 | 11,108,587 | 12,128,796 | ||||||||
GNMA II SF 30 Year, 4.50%, 5/20/41 - 6/20/41 | 12,633,811 | 13,789,648 | ||||||||
GNMA II SF 30 Year, 4.50%, 7/20/41 | 7,700,912 | 8,405,456 | ||||||||
GNMA II SF 30 Year, 4.50%, 9/20/41 | 11,712,298 | 12,809,133 | ||||||||
GNMA II SF 30 Year, 4.50%, 10/20/41 - 3/20/42 | 9,652,149 | 10,550,566 | ||||||||
GNMA II SF 30 Year, 4.50%, 2/20/44 | 5,807,527 | 6,267,314 | ||||||||
GNMA II SF 30 Year, 4.50%, 10/20/44 | 8,495,919 | 9,169,486 | ||||||||
GNMA II SF 30 Year, 5.00%, 9/20/33 - 6/20/40 | 11,683,516 | 13,030,171 | ||||||||
GNMA II SF 30 Year, 5.00%, 8/20/41 - 10/20/42 | 8,104,505 | 9,031,541 | ||||||||
GNMA II SF 30 Year, 5.00%, 6/20/44 | 7,702,503 | 8,404,677 | ||||||||
GNMA II SF 30 Year, 5.50%, 5/20/34 - 6/20/38 | 9,085,767 | 10,356,242 | ||||||||
GNMA II SF 30 Year, 6.00%, 11/20/23 - 7/20/39 | 5,577,456 | 6,408,421 | ||||||||
GNMA II SF 30 Year, 6.50%, 12/20/27 - 4/20/34 | 771,323 | 898,470 | ||||||||
GNMA II SF 30 Year, 7.00%, 5/20/32 | 13,429 | 16,450 | ||||||||
GNMA II SF 30 Year, 7.50%, 11/20/17 - 5/20/33 | 152,596 | 173,480 | ||||||||
GNMA II SF 30 Year, 8.00%, 9/20/16 - 8/20/26 | 9,024 | 10,998 | ||||||||
GNMA II SF 30 Year, 9.50%, 4/20/25 | 2,541 | 2,555 | ||||||||
|
| |||||||||
| 746,456,505 | ||||||||||
|
| |||||||||
Total Mortgage-Backed Securities (Cost $1,093,710,399) | 1,101,696,120 | |||||||||
|
| |||||||||
U.S. Government and Agency Securities 19.6% | ||||||||||
Federal Agricultural Mortgage Corp., | ||||||||||
1.41%, 3/06/20 | 10,000,000 | 9,832,850 | ||||||||
2.66%, 4/12/22 | 7,000,000 | 7,187,992 | ||||||||
4.30%, 5/13/19 | 1,010,000 | 1,113,195 | ||||||||
| d | Federal Agricultural Mortgage Corp. Guaranteed Trust 07-1, 144A, 5.125%, 4/19/17 | 13,000,000 | 13,986,674 | |||||||
FFCB, 1.50%, 11/16/15 | 10,000,000 | 10,047,360 | ||||||||
FHLB, | ||||||||||
4.75%, 12/16/16 | 17,000,000 | 18,012,690 | ||||||||
5.25%, 6/05/17 | 9,000,000 | 9,782,244 | ||||||||
FICO, | ||||||||||
1P, Strip, 5/11/18 | 10,000,000 | 9,649,840 | ||||||||
12, Strip, 6/06/18 | 4,627,000 | 4,438,584 | ||||||||
13P, Strip, 12/27/18 | 2,500,000 | 2,382,490 | ||||||||
| Semiannual Report | FUS-9 |
FRANKLIN TEMPLETON VARIABLE INSURANCE PRODUCTS TRUST
STATEMENT OF INVESTMENTS (UNAUDITED)
Franklin U.S. Government Securities VIP Fund (continued)
| Principal Amount | * | Value | ||||||||
U.S. Government and Agency Securities (continued) | ||||||||||
15, Strip, 3/07/16 | 15,000,000 | $ | 14,953,620 | |||||||
15P, Strip, 3/07/19 | 1,798,000 | 1,692,765 | ||||||||
16, Strip, 4/05/17 | 12,367,000 | 12,185,873 | ||||||||
A-P, Strip, 2/08/18 | 1,000,000 | 972,900 | ||||||||
B-P, Strip, 4/06/18 | 1,405,000 | 1,361,680 | ||||||||
D-P, Strip, 9/26/19 | 7,605,000 | 7,051,265 | ||||||||
E-P, Strip, 11/02/18 | 8,896,000 | 8,477,470 | ||||||||
FNMA, senior note, 5.375%, 6/12/17 | 17,800,000 | 19,390,003 | ||||||||
Israel Government Agency for International Development Bond, | ||||||||||
5.50%, 9/18/23 | 12,000,000 | 14,460,534 | ||||||||
7-Z, U.S. Government Guaranteed, Strip, 8/15/22 | 5,619,000 | 4,655,409 | ||||||||
U.S. Government Guaranteed, Strip, 5/01/17 | 5,000,000 | 4,916,355 | ||||||||
Overseas Private Investment Corp., A, zero cpn., | ||||||||||
2/19/18 | 682,174 | 706,196 | ||||||||
11/15/20 | 2,575,000 | 2,961,822 | ||||||||
SBA, | ||||||||||
b FRN, 3.125%, 3/25/18 | 208,888 | 209,348 | ||||||||
PC, 1995-20L, 1, 6.45%, 12/01/15 | 19,655 | 19,983 | ||||||||
PC, 1996-20L, 1, 6.70%, 12/01/16 | 62,041 | 63,905 | ||||||||
PC, 1997-20G, 1, 6.85%, 7/01/17 | 89,743 | 92,663 | ||||||||
PC, 1998-20I, 1, 6.00%, 9/01/18 | 323,620 | 342,894 | ||||||||
Tunisia Government Agency for International Development Bond, 1.686%, 7/16/19 | 7,000,000 | 7,039,200 | ||||||||
TVA, | ||||||||||
1.875%, 8/15/22 | 6,000,000 | 5,788,122 | ||||||||
5.88%, 4/01/36 | 5,000,000 | 6,482,477 | ||||||||
Strip, 11/01/18 | 2,644,000 | 2,512,152 | ||||||||
Strip, 6/15/19 | 5,973,000 | 5,540,614 | ||||||||
Strip, 6/15/20 | 6,138,000 | 5,549,267 | ||||||||
| e | U.S. Treasury Bond, Index Linked, 2.00%, 1/15/26 | 13,111,884 | 15,025,406 | |||||||
U.S. Treasury Note, | ||||||||||
0.875%, 11/30/16 | 2,500,000 | 2,513,867 | ||||||||
1.25%, 1/31/19 | 10,000,000 | 9,997,660 | ||||||||
1.75%, 10/31/18 | 3,000,000 | 3,059,532 | ||||||||
4.25%, 8/15/15 | 20,000,000 | 20,107,040 | ||||||||
e Index Linked, 0.125%, 4/15/19 | 10,096,592 | 10,218,851 | ||||||||
Ukraine Government Agency for International Development Bonds, 1.844%, 5/16/19 | 5,000,000 | 5,018,785 | ||||||||
|
| |||||||||
Total U.S. Government and Agency Securities | 279,801,577 | |||||||||
|
| |||||||||
Total Investments before Short Term Investments | 1,402,314,639 | |||||||||
|
| |||||||||
| FUS-10 | Semiannual Report |
FRANKLIN TEMPLETON VARIABLE INSURANCE PRODUCTS TRUST
STATEMENT OF INVESTMENTS (UNAUDITED)
Franklin U.S. Government Securities VIP Fund (continued)
| Principal Amount* | Value | |||||||||
Short Term Investments (Cost $72,716,421) 5.1% | ||||||||||
Repurchase Agreements 5.1% | ||||||||||
| f | Joint Repurchase Agreement, 0.095%, 7/01/15 (Maturity Value $72,716,613) | 72,716,421 | $ | 72,716,421 | ||||||
BNP Paribas Securities Corp. (Maturity Value $17,844,657) HSBC Securities (USA) Inc. (Maturity Value $37,473,779) Merrill Lynch, Pierce, Fenner & Smith Inc. (Maturity Value $17,398,177) | ||||||||||
Collateralized by U.S. Government Agency Securities, 0.000% - 5.50%, 12/01/15 - 6/12/20; | ||||||||||
|
| |||||||||
Total Investments (Cost $1,464,221,846) 103.3% | 1,475,031,060 | |||||||||
Other Assets, less Liabilities (3.3)% | (46,433,711 | ) | ||||||||
|
| |||||||||
Net Assets 100.0% | $ | 1,428,597,349 | ||||||||
|
| |||||||||
See Abbreviations on page FUS-20.
*The principal amount is stated in U.S. dollars unless otherwise indicated.
aA supranational organization is an entity formed by two or more central governments through international treaties.
bThe coupon rate shown represents the rate at period end.
cA portion or all of the security purchased on a delayed delivery or to-be-announced (TBA) basis. See Note 1(c).
dSecurity was purchased pursuant to Rule 144A under the Securities Act of 1933 and may be sold in transactions exempt from registration only to qualified institutional buyers or in a public offering registered under the Securities Act of 1933. This security has been deemed liquid under guidelines approved by the Trust’s Board of Trustees. At June 30, 2015, the value of this security was $13,986,674, representing 0.98% of net assets.
ePrincipal amount of security is adjusted for inflation. See Note 1(f).
fSee Note 1(b) regarding joint repurchase agreement.
gThe security is traded on a discount basis with no stated coupon rate.
| The accompanying notes are an integral part of these financial statements. | Semiannual Report | FUS-11 |
FRANKLIN TEMPLETON VARIABLE INSURANCE PRODUCTS TRUST
Financial Statements
Statement of Assets and Liabilities
June 30, 2015 (unaudited)
| Franklin U.S. Government Securities VIP Fund | ||||
Assets: | ||||
Investments in securities: | ||||
Cost - Unaffiliated issuers | $ | 1,391,505,425 | ||
Cost - Repurchase agreements | 72,716,421 | |||
|
| |||
Total cost of investments | $ | 1,464,221,846 | ||
|
| |||
Value - Unaffiliated issuers | $ | 1,402,314,639 | ||
Value - Repurchase agreements | 72,716,421 | |||
|
| |||
Total value of investments | 1,475,031,060 | |||
Receivables: | ||||
Investment securities sold | 65,015,442 | |||
Capital shares sold | 536,119 | |||
Interest | 4,557,768 | |||
Due from brokers | 455,000 | |||
Other assets | 622 | |||
|
| |||
Total assets | 1,545,596,011 | |||
|
| |||
Liabilities: | ||||
Payables: | ||||
Investment securities purchased | 114,942,812 | |||
Capital shares redeemed | 760,890 | |||
Management fees | 548,775 | |||
Distribution fees | 562,402 | |||
Accrued expenses and other liabilities | 183,783 | |||
|
| |||
Total liabilities | 116,998,662 | |||
|
| |||
Net assets, at value | $ | 1,428,597,349 | ||
|
| |||
Net assets consist of: | ||||
Paid-in capital | $ | 1,453,750,077 | ||
Undistributed net investment income | 3,109,325 | |||
Net unrealized appreciation (depreciation) | 10,809,214 | |||
Accumulated net realized gain (loss) | (39,071,267 | ) | ||
|
| |||
Net assets, at value | $ | 1,428,597,349 | ||
|
| |||
| Class 1: | ||||
Net assets, at value | $ | 85,248,231 | ||
|
| |||
Shares outstanding | 6,725,033 | |||
|
| |||
Net asset value and maximum offering price per share | $ | 12.68 | ||
|
| |||
| Class 2: | ||||
Net assets, at value | $ | 1,343,349,118 | ||
|
| |||
Shares outstanding | 108,154,105 | |||
|
| |||
Net asset value and maximum offering price per share | $ | 12.42 | ||
|
| |||
| FUS-12 | Semiannual Report | The accompanying notes are an integral part of these financial statements. |
FRANKLIN TEMPLETON VARIABLE INSURANCE PRODUCTS TRUST
FINANCIAL STATEMENTS
Statement of Operations
for the six months ended June 30, 2015 (unaudited)
| Franklin U.S. Government Securities VIP Fund | ||||
Investment income: | ||||
Interest | $ | 21,631,533 | ||
Paydown gain (loss) | (6,764,367 | ) | ||
|
| |||
Total investment income | 14,867,166 | |||
|
| |||
Expenses: | ||||
Management fees (Note 3a) | 3,342,751 | |||
Distribution fees - Class 2 (Note 3c) | 1,678,879 | |||
Custodian fees (Note 4) | 6,458 | |||
Reports to shareholders | 106,917 | |||
Professional fees | 25,003 | |||
Trustees’ fees and expenses | 2,931 | |||
Other | 47,101 | |||
|
| |||
Total expenses | 5,210,040 | |||
|
| |||
Net investment income | 9,657,126 | |||
|
| |||
Realized and unrealized gains (losses): | ||||
Net realized gain (loss) from investments | 18,719 | |||
Net change in unrealized appreciation (depreciation) on investments | (8,630,516 | ) | ||
|
| |||
Net realized and unrealized gain (loss) | (8,611,797 | ) | ||
|
| |||
Net increase (decrease) in net assets resulting from operations | $ | 1,045,329 | ||
|
| |||
| The accompanying notes are an integral part of these financial statements. | Semiannual Report | FUS-13 |
FRANKLIN TEMPLETON VARIABLE INSURANCE PRODUCTS TRUST
FINANCIAL STATEMENTS
Statements of Changes in Net Assets
| Franklin U.S. Government Securities VIP Fund | ||||||||
| Six Months Ended June 30, 2015 (unaudited) | Year Ended December 31, 2014 | |||||||
Increase (decrease) in net assets: | ||||||||
Operations: | ||||||||
Net investment income | $ | 9,657,126 | $ | 22,886,524 | ||||
Net realized gain (loss) | 18,719 | 423,321 | ||||||
Net change in unrealized appreciation (depreciation) | (8,630,516 | ) | 24,473,688 | |||||
|
| |||||||
Net increase (decrease) in net assets resulting from operations | 1,045,329 | 47,783,533 | ||||||
|
| |||||||
Distributions to shareholders from: | ||||||||
Net investment income: | ||||||||
Class 1 | (2,296,272 | ) | (2,743,382 | ) | ||||
Class 2 | (33,598,882 | ) | (35,038,168 | ) | ||||
|
| |||||||
Total distributions to shareholders | (35,895,154 | ) | (37,781,550 | ) | ||||
|
| |||||||
Capital share transactions: (Note 2) | ||||||||
Class 1 | (3,290,820 | ) | (10,061,210 | ) | ||||
Class 2 | 7,044,746 | 91,810,860 | ||||||
|
| |||||||
Total capital share transactions | 3,753,926 | 81,749,650 | ||||||
|
| |||||||
Net increase (decrease) in net assets | (31,095,899 | ) | 91,751,633 | |||||
Net assets: | ||||||||
Beginning of period | 1,459,693,248 | 1,367,941,615 | ||||||
|
| |||||||
End of period | $ | 1,428,597,349 | $ | 1,459,693,248 | ||||
|
| |||||||
Undistributed net investment income included in net assets: | ||||||||
End of period | $ | 3,109,325 | $ | 29,347,353 | ||||
|
| |||||||
| FUS-14 | Semiannual Report | The accompanying notes are an integral part of these financial statements. |
FRANKLIN TEMPLETON VARIABLE INSURANCE PRODUCTS TRUST
Notes to Financial Statements (unaudited)
Franklin U.S. Government Securities VIP Fund
1. Organization and Significant Accounting Policies
Franklin Templeton Variable Insurance Products Trust (Trust) is registered under the Investment Company Act of 1940 (1940 Act) as an open-end management investment company, consisting of nineteen separate funds and applies the specialized accounting and reporting guidance in U.S. Generally Accepted Accounting Principles (U.S. GAAP). Franklin U.S. Government Securities VIP Fund (Fund) is included in this report. The financial statements of the remaining funds in the Trust are presented separately. Shares of the Fund are generally sold only to insurance company separate accounts to fund the benefits of variable life insurance policies or variable annuity contracts. At June 30, 2015, 43.50% of the Fund’s shares were held through one insurance company. Investment activities of these insurance company separate accounts could have a material impact on the Fund. The Fund offers two classes of shares: Class 1 and Class 2. Each class of shares differs by its distribution fees, voting rights on matters affecting a single class and its exchange privilege
The following summarizes the Fund’s significant accounting policies.
a. Financial Instrument Valuation
The Fund’s investments in financial instruments are carried at fair value daily. Fair value is the price that would be received to sell an asset or paid to transfer a liability in an orderly transaction between market participants on the measurement date. The Fund calculates the net asset value per share at the close of the New York Stock Exchange (NYSE), generally at 4 p.m. Eastern time (NYSE close) on each day the NYSE is open for trading. Under compliance policies and procedures approved by the Trust’s Board of Trustees (the Board), the Fund’s administrator has responsibility for oversight of valuation, including leading the cross-functional Valuation and Liquidity Oversight Committee (VLOC). The VLOC provides administration and oversight of the Fund’s valuation policies and procedures, which are approved annually by the Board. Among other things, these procedures allow the Fund to utilize independent pricing services, quotations from securities and financial instrument dealers, and other market sources to determine fair value.
Debt securities generally trade in the over-the-counter market rather than on a securities exchange. The Fund’s pricing services use multiple valuation techniques to determine fair value. In instances where sufficient market activity exists, the pricing
services may utilize a market-based approach through which quotes from market makers are used to determine fair value. In instances where sufficient market activity may not exist or is limited, the pricing services also utilize proprietary valuation models which may consider market characteristics such as benchmark yield curves, credit spreads, estimated default rates, anticipated market interest rate volatility, coupon rates, anticipated timing of principal repayments, underlying collateral, and other unique security features in order to estimate the relevant cash flows, which are then discounted to calculate the fair value. Repurchase agreements are valued at cost, which approximates fair value.
The Fund has procedures to determine the fair value of financial instruments for which market prices are not reliable or readily available. Under these procedures, the VLOC convenes on a regular basis to review such financial instruments and considers a number of factors, including significant unobservable valuation inputs, when arriving at fair value. The VLOC primarily employs a market-based approach which may use related or comparable assets or liabilities, recent transactions, market multiples, book values, and other relevant information for the investment to determine the fair value of the investment. An income-based valuation approach may also be used in which the anticipated future cash flows of the investment are discounted to calculate fair value. Discounts may also be applied due to the nature or duration of any restrictions on the disposition of the investments. Due to the inherent uncertainty of valuations of such investments, the fair values may differ significantly from the values that would have been used had an active market existed. The VLOC employs various methods for calibrating these valuation approaches including a regular review of key inputs and assumptions, transactional back-testing or disposition analysis, and reviews of any related market activity.
b. Joint Repurchase Agreement
The Fund enters into a joint repurchase agreement whereby its uninvested cash balance is deposited into a joint cash account with other funds managed by the investment manager or an affiliate of the investment manager and is used to invest in one or more repurchase agreements. The value and face amount of the joint repurchase agreement are allocated to the funds based on their pro-rata interest. A repurchase agreement is accounted for as a loan by the Fund to the seller, collateralized by securities which are delivered to the Fund’s custodian. The fair value, including accrued interest, of the initial collateralization
| Semiannual Report | FUS-15 |
FRANKLIN TEMPLETON VARIABLE INSURANCE PRODUCTS TRUST
NOTES TO FINANCIAL STATEMENTS (UNAUDITED)
Franklin U.S. Government Securities VIP Fund (continued)
1. Organization and Significant Accounting Policies (continued)
b. Joint Repurchase Agreement (continued)
is required to be at least 102% of the dollar amount invested by the funds, with the value of the underlying securities marked to market daily to maintain coverage of at least 100%. Repurchase agreements are subject to the terms of Master Repurchase Agreements (MRAs) with approved counterparties (sellers). The MRAs contain various provisions, including but not limited to events of default and maintenance of collateral for repurchase agreements. In the event of default by either the seller or the Fund, certain MRAs may permit the non-defaulting party to net and close-out all transactions, if any, traded under such agreements. The Fund may sell securities it holds as collateral and apply the proceeds towards the repurchase price and any other amounts owed by the seller to the Fund in the event of default by the seller. This could involve costs or delays in addition to a loss on the securities if their value falls below the repurchase price owed by the seller. The joint repurchase agreement held by the Fund at period end, as indicated in the Statement of Investments, had been entered into on June 30, 2015.
c. Securities Purchased on a Delayed Delivery and TBA Basis
The Fund purchases securities on a delayed delivery and to-be-announced (TBA) basis, with payment and delivery scheduled for a future date. These transactions are subject to market fluctuations and are subject to the risk that the value at delivery may be more or less than the trade date purchase price. Although the Fund will generally purchase these securities with the intention of holding the securities, it may sell the securities before the settlement date. Sufficient assets have been segregated for these securities.
d. Mortgage Dollar Rolls
The Fund enters into mortgage dollar rolls, typically on a TBA basis. Mortgage dollar rolls are agreements between the Fund and a financial institution to simultaneously sell and repurchase mortgage-backed securities at a future date. Gains or losses are realized on the initial sale, and the difference between the repurchase price and the sale price is recorded as an unrealized gain or loss to the Fund upon entering into the mortgage dollar roll. In addition, the Fund may invest the cash proceeds that are received from the initial sale. During the period between the
sale and repurchase, the Fund is not entitled to principal and interest paid on the mortgage backed securities. The risks of mortgage dollar roll transactions include the potential inability of the counterparty to fulfill its obligations.
e. Income Taxes
It is the Fund’s policy to qualify as a regulated investment company under the Internal Revenue Code. The Fund intends to distribute to shareholders substantially all of its taxable income and net realized gains to relieve it from federal income and if applicable, excise taxes. As a result, no provision for U.S. federal income taxes is required.
The Fund recognizes the tax benefits of uncertain tax positions only when the position is “more likely than not” to be sustained upon examination by the tax authorities based on the technical merits of the tax position. As of June 30, 2015, and for all open tax years, the Fund has determined that no liability for unrecognized tax benefits is required in the Fund’s financial statements related to uncertain tax positions taken on a tax return (or expected to be taken on future tax returns). Open tax years are those that remain subject to examination and are based on each tax jurisdiction’s statute of limitation.
f. Security Transactions, Investment Income, Expenses and Distributions
Security transactions are accounted for on trade date. Realized gains and losses on security transactions are determined on a specific identification basis. Interest income and estimated expenses are accrued daily. Amortization of premium and accretion of discount on debt securities are included in interest income. Paydown gains and losses are recorded separately in the Statement of Operations. Distributions to shareholders are recorded on the ex-dividend date and are determined according to income tax regulations (tax basis). Distributable earnings determined on a tax basis may differ from earnings recorded in accordance with U.S. GAAP. These differences may be permanent or temporary. Permanent differences are reclassified among capital accounts to reflect their tax character. These reclassifications have no impact on net assets or the results of operations. Temporary differences are not reclassified, as they may reverse in subsequent periods.
Common expenses incurred by the Trust are allocated among the funds based on the ratio of net assets of each fund to the combined net assets of the Trust. Fund specific expenses are charged directly to the fund that incurred the expense.
| FUS-16 | Semiannual Report |
FRANKLIN TEMPLETON VARIABLE INSURANCE PRODUCTS TRUST
NOTES TO FINANCIAL STATEMENTS (UNAUDITED)
Franklin U.S. Government Securities VIP Fund (continued)
Realized and unrealized gains and losses and net investment income, not including class specific expenses, are allocated daily to each class of shares based upon the relative proportion of net assets of each class. Differences in per share distributions, by class, are generally due to differences in class specific expenses.
Inflation-indexed bonds are adjusted for inflation through periodic increases or decreases in the security’s interest accruals, face amount, or principal redemption value, by amounts corresponding to the rate of inflation as measured by an index. Any increase or decrease in the face amount or principal redemption value will be included as interest income in the Statement of Operations.
g. Accounting Estimates
The preparation of financial statements in accordance with U.S. GAAP requires management to make estimates and assumptions
that affect the reported amounts of assets and liabilities at the date of the financial statements and the amounts of income and expenses during the reporting period. Actual results could differ from those estimates.
h. Guarantees and Indemnifications
Under the Trust’s organizational documents, its officers and trustees are indemnified by the Trust against certain liabilities arising out of the performance of their duties to the Trust. Additionally, in the normal course of business, the Trust, on behalf of the Fund, enters into contracts with service providers that contain general indemnification clauses. The Trust’s maximum exposure under these arrangements is unknown as this would involve future claims that may be made against the Trust that have not yet occurred. Currently, the Trust expects the risk of loss to be remote.
2. Shares of Beneficial Interest
At June 30, 2015, there were an unlimited number of shares authorized (without par value). Transactions in the Fund’s shares were as follows:
| Six Months Ended June 30, 2015 | Year Ended December 31, 2014 | |||||||||||||||||
| Shares | Amount | Shares | Amount | |||||||||||||||
| Class 1 Shares: | ||||||||||||||||||
Shares sold | 88,029 | $ | 1,147,002 | 242,868 | $ | 3,161,287 | ||||||||||||
Shares issued in reinvestment of distributions | 181,380 | 2,296,272 | 214,159 | 2,743,382 | ||||||||||||||
Shares redeemed | (516,496 | ) | (6,734,094 | ) | (1,229,027 | ) | (15,965,879 | ) | ||||||||||
|
| |||||||||||||||||
Net increase (decrease) | (247,087 | ) | $ | (3,290,820 | ) | (772,000 | ) | $ | (10,061,210 | ) | ||||||||
|
| |||||||||||||||||
| Class 2 Shares: | ||||||||||||||||||
Shares sold | 4,559,390 | $ | 58,189,126 | 13,830,012 | $ | 175,846,470 | ||||||||||||
Shares issued in reinvestment of distributions | 2,709,587 | 33,598,882 | 2,789,663 | 35,038,168 | ||||||||||||||
Shares redeemed | (6,641,145 | ) | (84,743,262 | ) | (9,358,233 | ) | (119,073,778 | ) | ||||||||||
|
| |||||||||||||||||
Net increase (decrease) | 627,832 | $ | 7,044,746 | 7,261,442 | $ | 91,810,860 | ||||||||||||
|
| |||||||||||||||||
3. Transactions With Affiliates
Franklin Resources, Inc. is the holding company for various subsidiaries that together are referred to as Franklin Templeton Investments. Certain officers and trustees of the Fund are also officers and/or directors of the following subsidiaries:
| Subsidiary | Affiliation | |
Franklin Advisers, Inc. (Advisers) | Investment manager | |
Franklin Templeton Services, LLC (FT Services) | Administrative manager | |
Franklin Templeton Distributors, Inc. (Distributors) | Principal underwriter | |
Franklin Templeton Investor Services, LLC (Investor Services) | Transfer agent |
| Semiannual Report | FUS-17 |
FRANKLIN TEMPLETON VARIABLE INSURANCE PRODUCTS TRUST
NOTES TO FINANCIAL STATEMENTS (UNAUDITED)
Franklin U.S. Government Securities VIP Fund (continued)
3. Transactions With Affiliates (continued)
a. Management Fees
The Fund pays an investment management fee to Advisers based on the average daily net assets of the Fund as follows:
| Annualized Fee Rate | Net Assets | |
0.625% | Up to and including $100 million | |
0.500% | Over $100 million, up to and including $250 million | |
0.450% | Over $250 million, up to and including $7.5 billion | |
0.440% | Over $7.5 billion, up to and including $10 billion | |
0.430% | Over $10 billion, up to and including $12.5 billion | |
0.420% | Over $12.5 billion, up to and including $15 billion | |
0.400% | In excess of $15 billion |
b. Administrative Fees
Under an agreement with Advisers, FT Services provides administrative services to the Fund. The fee is paid by Advisers based on the Fund’s average daily net assets, and is not an additional expense of the Fund.
c. Distribution Fees
The Board has adopted a distribution plan for Class 2 shares pursuant to Rule 12b-1 under the 1940 Act. Under the Fund’s compensation distribution plan, the Fund pays Distributors for costs incurred in connection with the servicing, sale and distribution of the Fund’s shares up to 0.35% per year of its average daily net assets. Some distribution fees are not charged on shares held by affiliates. The Board has agreed to limit the current rate to 0.25% per year for Class 2. The plan year, for purposes of monitoring compliance with the maximum annual plan rate, is February 1 through January 31.
d. Transfer Agent Fees
Investor Services, under terms of an agreement, performs shareholder servicing for the Fund and is not paid by the Fund for the services.
4. Expense Offset Arrangement
The Fund has entered into an arrangement with its custodian whereby credits realized as a result of uninvested cash balances are used to reduce a portion of the Fund’s custodian expenses. During the period ended June 30, 2015, there were no credits earned.
5. Income Taxes
For tax purposes, capital losses may be carried over to offset future capital gains. Capital loss carryforwards with no expiration, if any, must be fully utilized before those losses with expiration dates.
At December 31, 2014, capital loss carryforwards were as follows:
Capital loss carryforwards subject to expiration: | ||||
2015 | $ | 2,329,071 | ||
2016 | 841,479 | |||
2017 | 401,851 | |||
2018 | 426,637 | |||
Capital loss carryforwards not subject to expiration: | ||||
Short term | 17,923,545 | |||
Long term | 16,965,019 | |||
|
| |||
Total capital loss carryforwards | $ | 38,887,602 | ||
|
| |||
| FUS-18 | Semiannual Report |
FRANKLIN TEMPLETON VARIABLE INSURANCE PRODUCTS TRUST
NOTES TO FINANCIAL STATEMENTS (UNAUDITED)
Franklin U.S. Government Securities VIP Fund (continued)
At June 30, 2015, the cost of investments and net unrealized appreciation (depreciation) for income tax purposes were as follows:
Cost of investments | $ | 1,472,278,291 | ||
|
| |||
Unrealized appreciation | $ | 20,771,255 | ||
Unrealized depreciation | (18,018,486 | ) | ||
|
| |||
Net unrealized appreciation (depreciation) | $ | 2,752,769 | ||
|
|
Differences between income and/or capital gains as determined on a book basis and a tax basis are primarily due to differing treatments of paydown losses and bond discounts and premiums.
6. Investment Transactions
Purchases and sales of investments (excluding short term securities) for the period ended June 30, 2015, aggregated $458,922,948 and $472,703,677, respectively.
7. Credit Facility
The Fund, together with other U.S. registered and foreign investment funds (collectively, Borrowers), managed by Franklin Templeton Investments, are borrowers in a joint syndicated senior unsecured credit facility totaling $2 billion (Global Credit Facility) which matures on February 12, 2016. This Global Credit Facility provides a source of funds to the Borrowers for temporary and emergency purposes, including the ability to meet future unanticipated or unusually large redemption requests.
Under the terms of the Global Credit Facility, the Fund shall, in addition to interest charged on any borrowings made by the Fund and other costs incurred by the Fund, pay its share of fees and expenses incurred in connection with the implementation and maintenance of the Global Credit Facility, based upon its relative share of the aggregate net assets of all of the Borrowers, including an annual commitment fee of 0.07% based upon the unused portion of the Global Credit Facility. These fees are reflected in other expenses in the Statement of Operations. During the period ended June 30, 2015, the Fund did not use the Global Credit Facility.
8. Fair Value Measurements
The Fund follows a fair value hierarchy that distinguishes between market data obtained from independent sources (observable inputs) and the Fund’s own market assumptions (unobservable inputs). These inputs are used in determining the value of the Fund’s financial instruments and are summarized in the following fair value hierarchy:
| • | Level 1 – quoted prices in active markets for identical financial instruments |
| • | Level 2 – other significant observable inputs (including quoted prices for similar financial instruments, interest rates, prepayment speed, credit risk, etc.) |
| • | Level 3 – significant unobservable inputs (including the Fund’s own assumptions in determining the fair value of financial instruments) |
The input levels are not necessarily an indication of the risk or liquidity associated with financial instruments at that level.
For movements between the levels within the fair value hierarchy, the Fund has adopted a policy of recognizing the transfers as of the date of the underlying event which caused the movement.
At June 30, 2015, all of the Fund’s investments in financial instruments carried at fair value were valued using Level 2 inputs.
| Semiannual Report | FUS-19 |
FRANKLIN TEMPLETON VARIABLE INSURANCE PRODUCTS TRUST
NOTES TO FINANCIAL STATEMENTS (UNAUDITED)
Franklin U.S. Government Securities VIP Fund (continued)
9. Subsequent Events
The Fund has evaluated subsequent events through the issuance of the financial statements and determined that no events have occurred that require disclosure.
Abbreviations
| Selected Portfolio | ||
| FFCB | Federal Farm Credit Bank | |
| FHLB | Federal Home Loan Bank | |
| FICO | Financing Corp. | |
| FRN | Floating Rate Note | |
| GL | Government Loan | |
| PC | Participation Certificate | |
| PL | Project Loan | |
| SBA | Small Business Administration | |
| SF | Single Family | |
| TVA | Tennessee Valley Authority | |
| FUS-20 | Semiannual Report |
Templeton Developing Markets VIP Fund
This semiannual report for Templeton Developing Markets VIP Fund covers the period ended June 30, 2015.
Class 1 Performance Summary as of June 30, 2015
The Fund’s Class 1 shares had a -1.97% total return* for the six-month period ended June 30, 2015.
*The Fund has a fee waiver associated with any investment in a Franklin Templeton money fund, contractually guaranteed through at least its current fiscal year-end. Fund investment results reflect the fee waiver, to the extent applicable; without this reduction, the results would have been lower.
Performance reflects the Fund’s Class 1 operating expenses, but does not include any contract fees, expenses or sales charges. If they had been included, performance would be lower. These charges and deductions, particularly for variable life policies, can have a significant effect on contract values and insurance benefits. See the contract prospectus for a complete description of these expenses, including sales charges.
Performance data represent past performance, which does not guarantee future results. Investment return and principal value will fluctuate, and you may have a gain or loss when you sell your shares. Current performance may differ from figures shown.
| Semiannual Report | TD-1 |
TEMPLETON DEVELOPING MARKETS VIP FUND
Fund Goal and Main Investments
Templeton Developing Markets VIP Fund seeks long-term capital appreciation. Under normal market conditions, the Fund invests at least 80% of its net assets in emerging market investments.
Fund Risks
All investments involve risks, including possible loss of principal. Special risks are associated with foreign investing, including currency fluctuations, economic instability and political developments. Investments in developing markets, of which frontier markets are a subset, involve heightened risks related to the same factors, in addition to those associated with these markets’ smaller size, lesser liquidity and lack of established legal, political, business and social frameworks to support securities markets. Because these frameworks are typically even less developed in frontier markets, as well as various factors including the increased potential for extreme price volatility, illiquidity, trade barriers and exchange controls, the risks associated with developing markets are magnified in frontier markets. The Fund is designed for the aggressive portion of a well-diversified portfolio. The Fund is actively managed but there is no guarantee that the manager’s investment decisions will produce the desired results. The Fund’s prospectus also includes a description of the main investment risks.
Performance Overview
You can find the Fund’s six-month total return in the Performance Summary. In comparison, the MSCI Emerging Markets (EM) Index generated a +3.12% total return, and the Standard & Poor’s®/International Finance Corporation Investable Composite Index produced a +4.03% total return for the same period.1 Please note index performance numbers are for reference and we do not attempt to track an index but rather undertake investments on the basis of fundamental research.
Economic and Market Overview
The global economy expanded moderately during the six months under review. Although several emerging market countries faced headwinds such as soft domestic demand, weak exports and geopolitical crises, emerging market economies overall continued to grow faster than developed market economies. China’s economy grew at a less robust pace in 2015’s first half, amid relatively steady consumption and industrial production but weaker fixed-asset investment growth. Domestic demand continued to account for a greater portion of gross
domestic product, as per-capita income grew and the government’s market-friendly policies supported new economic drivers that could help make economic expansion more sustainable. Many emerging market countries showed signs of economic improvement, including India, South Africa and the Czech Republic, while others, such as Thailand and South Korea, showed signs of moderation. In the first quarter, Brazil’s economy contracted and Russia’s economy contracted for the third consecutive quarter. Many emerging market central banks, including those of Russia, India and China, lowered interest rates to promote lending and economic growth. In contrast, Brazil’s central bank raised interest rates in an effort to control inflation and support the country’s currency.
Emerging market stocks experienced volatility during the period amid concerns about global economic growth, the future course of U.S. monetary policy, the devaluation of many currencies against the U.S. dollar and Greece’s debt negotiations. Nonetheless, China’s monetary stimulus measures, the Bank of Japan’s and the European Central Bank’s monetary easing, and the U.S. Federal Reserve’s accommodative policy provided investors with some optimism. Early in the period, a temporary solution to Greece’s dispute with the country’s international creditors and a Russia-Ukraine ceasefire agreement bolstered emerging market stocks. However, near period-end, investors grew concerned about Greece’s possible exit from the eurozone as debt negotiations deteriorated. The Greek government subsequently imposed capital controls, defaulted on scheduled payments to the International Monetary Fund and announced a referendum on the terms of a potential bailout
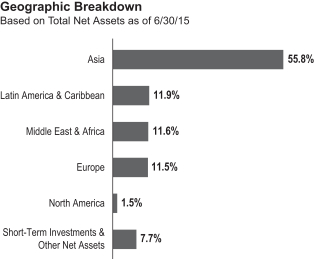
1. Source: Morningstar.
One cannot invest directly in an index, and an index is not representative of the Fund’s portfolio. Please see Index Descriptions following the Fund Summaries.
| TD-2 | Semiannual Report |
TEMPLETON DEVELOPING MARKETS VIP FUND
deal. Although oil prices began to improve during the period, the effects of 2014’s sharp decline on several oil-producing countries’ economies, financial positions and currencies continued to weigh on investor sentiment.
For the six months ended June 30, 2015, emerging market stocks, as measured by the MSCI EM Index, rose 5.80% in local currency terms, as many investors seemed to focus on the relatively attractive valuations of many emerging market stocks.1 However, relatively weak local currencies resulted in a +3.12% total return in U.S. dollar terms.1 European and Asian emerging markets overall performed well for the period, which helped offset declines in Latin America.
The Chinese government’s market-friendly policies, stimulus measures and commitment to stable growth supported China equity markets overall, particularly the domestic A-share market.2 As measured by the MSCI China A Index, the domestic A-share market began to rise in late 2014 after the People’s Bank of China’s (PBOC’s) surprise interest rate cut in November and the effective easing of loan and deposit regulations to boost the economy. Also supporting A shares was the Shanghai-Hong Kong Stock Connect program, which opened China’s domestic A-share market to certain qualified foreign investors. Domestic retail investor market speculation led the MSCI China A Index to generate total returns of +112.27% for the 12 months and +33.92% for the six months ended June 30, 2015.3 In contrast, Chinese stocks aimed at foreign investors, as measured by the MSCI China Index, produced more modest +24.95% and +14.84% total returns for the same respective periods, as foreign investors seemed more focused on economic growth and market fundamentals.3
After peaking on June 12, China’s domestic market began to correct, resulting initially from tight liquidity conditions and uncertainties about the PBOC’s monetary policy, with a 17.33% decline for the MSCI China A Index from June 12 to June 30.3 Following the domestic market’s nearly 8% plunge on June 26, the PBOC lowered its benchmark interest rate and announced targeted reserve requirement ratio cuts for certain banks.3 In an effort to prevent a market collapse, the government imposed
other measures that restricted trading. However, certain government intervention measures were not well received and further contributed to investor concerns.
Investment Strategy
We employ a fundamental research, value-oriented, long-term investment approach. We focus on the market price of a company’s securities relative to our evaluation of its long-
term earnings, asset value and cash flow potential. We also consider a company’s profit and loss outlook, balance sheet strength, cash flow trends and asset value in relation to the current price. Our analysis considers the company’s corporate governance behavior as well as its position in its sector, the economic framework and political environment. We invest in securities without regard to benchmark comparisons.
Manager’s Discussion
During the six months under review, the Fund remained diversified among different emerging market countries. We invested in China through B, China H, Red Chip and P Chip shares,2 as well as single-listed American Depositary Receipts (ADRs of companies whose underlying shares are not listed in home markets),4 with no holdings in China’s domestic A-share
| Top 10 Countries | ||||
| 6/30/15 | ||||
| % of Total Net Assets | ||||
| China | 22.8% | |||
| South Africa | 10.6% | |||
| Brazil | 9.9% | |||
| India | 9.5% | |||
| Thailand | 6.8% | |||
| South Korea | 5.6% | |||
| Belgium | 4.2% | |||
| Taiwan | 4.2% | |||
| Indonesia | 4.1% | |||
| U.K. | 4.0% | |||
2. China equity markets consist of A, B, China H, Red Chip and P Chip shares. “A” denotes shares of companies incorporated in China that are listed on the Shanghai and Shenzhen Stock Exchanges, are quoted in the Chinese renminbi and entail foreign investment regulations. “B” denotes shares of companies incorporated in China that are listed on the Shanghai and Shenzhen Stock Exchanges, are quoted in foreign currencies (U.S. dollar for Shanghai and Hong Kong dollar for Shenzhen) and are open to foreign investors. “China H” denotes shares of China-incorporated, Hong Kong Stock Exchange-listed companies with most businesses in China. “Red Chip” denotes shares of Hong Kong Stock Exchange-listed companies substantially owned by Chinese mainland state entities, with significant exposure to China. “P Chip” denotes shares of Hong Kong Stock Exchange-listed companies controlled by Chinese mainland individuals and incorporated outside of China, with a majority of their business in China.
3. Source: MSCI.
One cannot invest directly in an index, and an index is not representative of the Fund’s portfolio. Please see Index Descriptions following the Fund Summaries.
4. A single-listed ADR is a negotiable U.S. security issued by a U.S. bank, referred to as a “depositary bank,” that typically represents a non-U.S. company’s equity, is publicly available to U.S. investors on a national stock exchange (NYSE or NASDAQ) or on the over-the-counter market, and has underlying shares that are not publicly traded in the issuer’s home market.
| Semiannual Report | TD-3 |
TEMPLETON DEVELOPING MARKETS VIP FUND
market. Consistent with our long-term investment strategy, we viewed China’s recent market correction in the context of a long-term uptrend. We continued to monitor China’s economic and market developments while seeking to minimize risk and to establish long-term positions in quality companies at share prices we considered more attractive.
Key contributors to the Fund’s absolute performance during the reporting period included Naspers, Hyundai Development and SK Innovation.
Naspers is a South Africa-based media conglomerate with a portfolio of emerging market assets focused on Internet services and online advertising, which continued to experience rapid growth and increasingly effective advertising revenue generation. Solid corporate results, driven by strong growth in its pay television and Internet platforms, also bolstered the company’s share price. A key asset in Naspers’s business portfolio is an investment in China’s largest and most widely used Internet services platform, Tencent Holdings, another Fund holding that performed well during the reporting period. Further supporting investor sentiment was Naspers’s agreements with other companies to develop joint online classified advertising businesses in Brazil, Indonesia, Thailand and Bangladesh.
Hyundai Development is one of South Korea’s leading residential property developers. We believed that with its strong IPARK brand name, the company could potentially have the largest market share in the country’s residential construction business. The South Korean government’s measures to stimulate the housing market and the central bank’s rate cuts resulting in record-low interest rates aided investor sentiment during the reporting period. After posting losses in 2012 and 2013, the company reported profits in 2014, as it benefited from South Korea’s strong residential demand growth.
SK Innovation is a South Korean energy conglomerate with interests in oil refining, petrochemicals, lubricants and exploration and production. The company also has expertise in lithium-polymer battery production. Its shares rose during the period as a strong turnaround in its core refining and petrochemicals businesses helped the company return to profit in 2015’s first quarter, following a loss in 2014’s fourth quarter. The company’s efforts to streamline its businesses and improve its financial position were also well received by investors.
In contrast, key detractors from the Fund’s absolute performance included Tata Motors, Avon Products and Itau Unibanco Holding.
| Top 10 Holdings | ||||
| 6/30/15 | ||||
| Company Sector/Industry, Country | % of Total Net Assets | |||
| Naspers Ltd., N Media, South Africa | 5.3% | |||
| Anheuser-Busch InBev NV Beverages, Belgium | 4.3% | |||
| TSMC (Taiwan Semiconductor Manufacturing Co.) Ltd. Semiconductors & Semiconductor Equipment, Taiwan | 4.2% | |||
| Itau Unibanco Holding SA, ADR, pfd. Banks, Brazil | 4.2% | |||
| Unilever PLC Personal Products, U.K. | 4.0% | |||
| Brilliance China Automotive Holdings Ltd. Automobiles, China | 3.5% | |||
| Tata Consultancy Services Ltd. IT Services, India | 3.2% | |||
| China Life Insurance Co. Ltd., H Insurance, China | 2.9% | |||
| Remgro Ltd. Diversified Financial Services, South Africa | 2.8% | |||
| PetroChina Co. Ltd., H Oil, Gas & Consumable Fuels, China | 2.7% | |||
The dollar value, number of shares or principal amount, and names of all portfolio holdings are listed in the Fund’s Statement of Investments (SOI).
Tata Motors, India’s largest automobile company, produces a wide range of cars and commercial vehicles in its home market, while its wholly owned subsidiary manufactures British luxury car brands Jaguar and Land Rover. Tata Motors’ shares declined as the luxury car subsidiary experienced weak demand in a number of key markets, including China, Brazil and Europe. In addition, vehicle production by a joint venture in China progressed more slowly than anticipated, leading to weaker-than-expected earnings in 2015’s first quarter.
Avon Products is a U.S.-based global cosmetics business with substantial operations in various emerging markets, most notably Brazil. Brazil’s weak economy hurt the company’s corporate results. Concerns about Avon’s ability to pay its substantial debts in a weak market environment led to credit rating downgrades. However, the firm is in the process of selling certain assets and using the proceeds to reduce its debt. Further hurting Avon’s shares were the economic and currency crises in Russia, another substantial market.
Itau Unibanco, one of Brazil’s largest financial conglomerates, provides a full range of banking and financial services. It continued to produce strong operating performance despite Brazil’s difficult economic environment. The company’s shares
| TD-4 | Semiannual Report |
TEMPLETON DEVELOPING MARKETS VIP FUND
strengthened through April, but profit taking and the Brazilian real’s weakness against the U.S. dollar, as well as political protests and sluggish economic growth that worried investors, pressured stock performance.
It is important to recognize the effect of currency movements on the Fund’s performance. In general, if the value of the U.S. dollar goes up compared with a foreign currency, an investment traded in that foreign currency will go down in value because it will be worth fewer U.S. dollars. This can have a negative effect on Fund performance. Conversely, when the U.S. dollar weakens in relation to a foreign currency, an investment traded in that foreign currency will increase in value, which can contribute to Fund performance. For the six months ended June 30, 2015, the U.S. dollar rose in value relative to most currencies. As a result, the Fund’s performance was negatively affected by the portfolio’s investment predominantly in securities with non-U.S. currency exposure.
In the past six months, we increased the Fund’s holdings in several countries, including Brazil, South Korea, Indonesia and Taiwan, as we continued to invest in opportunities we considered more attractive. We also initiated exposure to certain countries, notably Russia and Cambodia, and made select purchases in China through single-listed ADRs and B, China H and Red Chip shares. In sector terms, we increased investments largely in consumer discretionary, health care and information technology.5 Key purchases included a new position in Baidu, China’s leading Internet search engine, and additional shares of TSMC (Taiwan Semiconductor Manufacturing Co.), the world’s largest independent integrated circuit foundry, and Dr. Reddy’s Laboratories, one of India’s major pharmaceutical companies.
Conversely, we reduced the Fund’s investments in several countries, including Thailand, South Africa and India, and eliminated exposure to certain countries, notably Turkey and Qatar, as we received share redemptions and as we focused on stocks we considered to be more attractively valued within our investment universe. In sector terms, we reduced holdings largely in financials and sold some positions in industrials and consumer staples.6 Key sales included reductions in Siam Commercial Bank, a financial products and services provider in Thailand and internationally; Remgro, a South African conglomerate with businesses in finance, health care, food and industrials; and China Construction Bank, a Chinese commercial bank.
Thank you for your participation in Templeton Developing Markets VIP Fund. We look forward to serving your future investment needs.
The foregoing information reflects our analysis, opinions and portfolio holdings as of June 30, 2015, the end of the reporting period. The way we implement our main investment strategies and the resulting portfolio holdings may change depending on factors such as market and economic conditions. These opinions may not be relied upon as investment advice or an offer for a particular security. The information is not a complete analysis of every aspect of any market, country, industry, security or the Fund. Statements of fact are from sources considered reliable, but the investment manager makes no representation or warranty as to their completeness or accuracy. Although historical performance is no guarantee of future results, these insights may help you understand our investment management philosophy.
5. The consumer discretionary sector comprises auto components; automobiles; distributors; diversified consumer services; hotels, restaurants and leisure; Internet and catalog retail; media; multiline retail; specialty retail; and textiles, apparel and luxury goods in the SOI. The health care sector comprises biotechnology and pharmaceuticals in the SOI. The information technology sector comprises Internet software and services; IT services; semiconductors and semiconductor equipment; and technology hardware, storage and peripherals in the SOI.
6. The financials sector comprises banks, diversified financial services, insurance, and real estate management and development in the SOI. The industrials sector comprises airlines, construction and engineering, machinery and marine in the SOI. The consumer staples sector comprises beverages, food and staples retailing, food products and personal products in the SOI.
| Semiannual Report | TD-5 |
TEMPLETON DEVELOPING MARKETS VIP FUND
Class 1 Fund Expenses
As an investor in a variable insurance contract (Contract) that indirectly provides for investment in an underlying mutual fund, you can incur transaction and/or ongoing expenses at both the Fund level and the Contract level.
| • | Transaction expenses can include sales charges (loads) on purchases, surrender fees, transfer fees and premium taxes. |
| • | Ongoing expenses can include management fees, distribution and service (12b-1) fees, contract fees, annual maintenance fees, mortality and expense risk fees and other fees and expenses. All mutual funds and Contracts have some types of ongoing expenses. |
The expenses shown in the table are meant to highlight ongoing expenses at the Fund level only and do not include ongoing expenses at the Contract level, or transaction expenses at either the Fund or Contract levels. While the Fund does not have transaction expenses, if the transaction and ongoing expenses at the Contract level were included, the expenses shown below would be higher. You should consult your Contract prospectus or disclosure document for more information.
The table shows Fund-level ongoing expenses and can help you understand these expenses and compare them with those of other mutual funds offered through the Contract. The table assumes a $1,000 investment held for the six months indicated. Please refer to the Fund prospectus for additional information on operating expenses.
Actual Fund Expenses
The first line (Actual) of the table provides actual account values and expenses. The “Ending Account Value” is derived from the Fund’s actual return, which includes the effect of ongoing Fund expenses, but does not include the effect of ongoing Contract expenses.
You can estimate the Fund-level expenses you incurred during the period by following these steps. Of course, your account value and expenses will differ from those in this illustration:
| 1. | Divide your account value by $1,000. |
If an account had an $8,600 value, then $8,600 ÷ $1,000 = 8.6.
| 2. | Multiply the result by the number under the heading “Fund-Level Expenses Incurred During Period.” |
If Fund-Level Expenses Incurred During Period were $7.50, then 8.6 × $7.50 = $64.50.
In this illustration, the estimated expenses incurred this period at the Fund level are $64.50.
Hypothetical Example for Comparison with Other Mutual Funds
Information in the second line (Hypothetical) of the table can help you compare ongoing expenses of the Fund with those of other mutual funds offered through the Contract. This information may not be used to estimate the actual ending account balance or expenses you incurred during the period. The hypothetical “Ending Account Value” is based on the Fund’s actual expense ratio and an assumed 5% annual rate of return before expenses, which does not represent the Fund’s actual return. The figure under the heading “Fund-Level Expenses Incurred During Period” shows the hypothetical expenses your account would have incurred under this scenario. You can compare this figure with the 5% hypothetical examples that appear in shareholder reports of other funds offered through a Contract.
| Class 1 | Beginning Account Value 1/1/15 | Ending Account Value 6/30/15 | Fund-Level Expenses 1/1/15–6/30/15 | |||||||||
Actual | $1,000 | $ 980.30 | $6.68 | |||||||||
Hypothetical (5% return before expenses) | $1,000 | $1,018.05 | $6.80 | |||||||||
*Expenses are calculated using the most recent six-month annualized expense ratio, net of expense waivers, for the Fund’s Class 1 shares (1.36%), which does not include any ongoing expenses of the Contract for which the Fund is an investment option, multiplied by the average account value over the period, multiplied by 181/365 to reflect the one-half year period.
| TD-6 | Semiannual Report |
FRANKLIN TEMPLETON VARIABLE INSURANCE PRODUCTS TRUST
Financial Highlights
Templeton Developing Markets VIP Fund
| Six Months Ended June 30, 2015 (unaudited) | Year Ended December 31, | |||||||||||||||||||||||
| 2014 | 2013 | 2012 | 2011 | 2010 | ||||||||||||||||||||
| Class 1 | ||||||||||||||||||||||||
Per share operating performance (for a share outstanding throughout the period) | ||||||||||||||||||||||||
Net asset value, beginning of period | $9.27 | $10.26 | $10.58 | $9.50 | $11.40 | $9.86 | ||||||||||||||||||
|
| |||||||||||||||||||||||
| Income from investment operationsa: | ||||||||||||||||||||||||
Net investment incomeb | 0.05 | 0.15 | c | 0.13 | 0.19 | 0.17 | 0.09 | |||||||||||||||||
Net realized and unrealized gains (losses) | (0.24 | ) | (0.97 | ) | (0.22 | ) | 1.06 | (1.94 | ) | 1.63 | ||||||||||||||
|
| |||||||||||||||||||||||
Total from investment operations | (0.19 | ) | (0.82 | ) | (0.09 | ) | 1.25 | (1.77 | ) | 1.72 | ||||||||||||||
|
| |||||||||||||||||||||||
| Less distributions from: | ||||||||||||||||||||||||
Net investment income | (0.20 | ) | (0.17 | ) | (0.23 | ) | (0.17 | ) | (0.13 | ) | (0.18 | ) | ||||||||||||
Net realized gains | (1.13 | ) | — | — | — | — | — | |||||||||||||||||
|
| |||||||||||||||||||||||
Total distributions | (1.33 | ) | (0.17 | ) | (0.23 | ) | (0.17 | ) | (0.13 | ) | (0.18 | ) | ||||||||||||
|
| |||||||||||||||||||||||
Redemption fees | — | — | d | — | d | — | d | — | d | — | d | |||||||||||||
|
| |||||||||||||||||||||||
Net asset value, end of period | $7.75 | $9.27 | $10.26 | $10.58 | $9.50 | $11.40 | ||||||||||||||||||
|
| |||||||||||||||||||||||
Total returne | (1.97)% | (8.09)% | (0.73)% | 13.40% | (15.67)% | 17.83% | ||||||||||||||||||
| Ratios to average net assetsf | ||||||||||||||||||||||||
Expenses | 1.36% | g | 1.36% | g | 1.35% | 1.35% | 1.40% | 1.49% | h | |||||||||||||||
Net investment income | 1.20% | 1.51% | c | 1.25% | 1.93% | 1.57% | 0.87% | |||||||||||||||||
| Supplemental data | ||||||||||||||||||||||||
Net assets, end of period (000’s) | $99,951 | $114,487 | $145,707 | $203,568 | $232,544 | $347,242 | ||||||||||||||||||
Portfolio turnover rate | 27.00% | 82.87% | 44.59% | 24.45% | 14.90% | 24.41% | ||||||||||||||||||
aThe amount shown for a share outstanding throughout the period may not correlate with the Statement of Operations for the period due to the timing of sales and repurchases of the Fund’s shares in relation to income earned and/or fluctuating fair value of the investments of the Fund.
bBased on average daily shares outstanding.
cNet investment income per share includes approximately $0.04 per share received in the form of special dividends. Excluding these amounts, the ratio of net investment income to average net assets would have been 1.11%.
dAmount rounds to less than $0.01 per share.
eTotal return does not include fees, charges or expenses imposed by the variable annuity and life insurance contracts for which Franklin Templeton Variable Insurance Products Trust serves as an underlying investment vehicle. Total return is not annualized for periods less than one year.
fRatios are annualized for periods less than one year.
gBenefit of waiver and payments by affiliates rounds to less than 0.01%.
hBenefit of expense reduction rounds to less than 0.01%.
| The accompanying notes are an integral part of these financial statements. | Semiannual Report | TD-7 |
FRANKLIN TEMPLETON VARIABLE INSURANCE PRODUCTS TRUST
FINANCIAL HIGHLIGHTS
Templeton Developing Markets VIP Fund (continued)
| Six Months Ended June 30, 2015 (unaudited) | Year Ended December 31, | |||||||||||||||||||||||
| 2014 | 2013 | 2012 | 2011 | 2010 | ||||||||||||||||||||
| Class 2 | ||||||||||||||||||||||||
Per share operating performance (for a share outstanding throughout the period) | ||||||||||||||||||||||||
Net asset value, beginning of period | $9.20 | $10.19 | $10.50 | $9.42 | $11.30 | $9.78 | ||||||||||||||||||
|
| |||||||||||||||||||||||
| Income from investment operationsa: | ||||||||||||||||||||||||
Net investment incomeb | 0.04 | 0.12 | c | 0.10 | 0.17 | 0.14 | 0.06 | |||||||||||||||||
Net realized and unrealized gains (losses) | (0.24 | ) | (0.96 | ) | (0.21 | ) | 1.05 | (1.92 | ) | 1.62 | ||||||||||||||
|
| |||||||||||||||||||||||
Total from investment operations | (0.20 | ) | (0.84 | ) | (0.11 | ) | 1.22 | (1.78 | ) | 1.68 | ||||||||||||||
|
| |||||||||||||||||||||||
| Less distributions from: | ||||||||||||||||||||||||
Net investment income | (0.18 | ) | (0.15 | ) | (0.20 | ) | (0.14 | ) | (0.10 | ) | (0.16 | ) | ||||||||||||
Net realized gains | (1.13 | ) | — | — | — | — | — | |||||||||||||||||
|
| |||||||||||||||||||||||
Total distributions | (1.31 | ) | (0.15 | ) | (0.20 | ) | (0.14 | ) | (0.10 | ) | (0.16 | ) | ||||||||||||
|
| |||||||||||||||||||||||
Redemption fees | — | — | d | — | d | — | d | — | d | — | d | |||||||||||||
|
| |||||||||||||||||||||||
Net asset value, end of period | $7.69 | $9.20 | $10.19 | $10.50 | $9.42 | $11.30 | ||||||||||||||||||
|
| |||||||||||||||||||||||
Total returne | (2.17)% | (8.39)% | (0.92)% | 13.16% | (15.86)% | 17.58% | ||||||||||||||||||
| Ratios to average net assetsf | ||||||||||||||||||||||||
Expenses | 1.61% | g | 1.61% | g | 1.60% | 1.60% | 1.65% | 1.74% | h | |||||||||||||||
Net investment income | 0.95% | 1.26% | c | 1.00% | 1.68% | 1.32% | 0.62% | |||||||||||||||||
| Supplemental data | ||||||||||||||||||||||||
Net assets, end of period (000’s) | $233,398 | $250,813 | $274,683 | $291,638 | $295,223 | $392,546 | ||||||||||||||||||
Portfolio turnover rate | 27.00% | 82.87% | 44.59% | 24.45% | 14.90% | 24.41% | ||||||||||||||||||
aThe amount shown for a share outstanding throughout the period may not correlate with the Statement of Operations for the period due to the timing of sales and repurchases of the Fund’s shares in relation to income earned and/or fluctuating fair value of the investments of the Fund.
bBased on average daily shares outstanding.
cNet investment income per share includes approximately $0.04 per share received in the form of special dividends. Excluding these amounts, the ratio of net investment income to average net assets would have been 0.86%.
dAmount rounds to less than $0.01 per share.
eTotal return does not include fees, charges or expenses imposed by the variable annuity and life insurance contracts for which Franklin Templeton Variable Insurance Products Trust serves as an underlying investment vehicle. Total return is not annualized for periods less than one year.
fRatios are annualized for periods less than one year.
gBenefit of waiver and payments by affiliates rounds to less than 0.01%.
hBenefit of expense reduction rounds to less than 0.01%.
| TD-8 | Semiannual Report | The accompanying notes are an integral part of these financial statements. |
FRANKLIN TEMPLETON VARIABLE INSURANCE PRODUCTS TRUST
FINANCIAL HIGHLIGHTS
Templeton Developing Markets VIP Fund (continued)
| Six Months Ended June 30, 2015 (unaudited) | Year Ended December 31, | |||||||||||||||||||||||
| 2014 | 2013 | 2012 | 2011 | 2010 | ||||||||||||||||||||
| Class 4 | ||||||||||||||||||||||||
Per share operating performance (for a share outstanding throughout the period) | ||||||||||||||||||||||||
Net asset value, beginning of period | $9.22 | $10.20 | $10.50 | $9.42 | $11.30 | $9.80 | ||||||||||||||||||
|
| |||||||||||||||||||||||
| Income from investment operationsa: | ||||||||||||||||||||||||
Net investment incomeb | 0.04 | 0.12 | c | 0.10 | 0.16 | 0.13 | 0.05 | |||||||||||||||||
Net realized and unrealized gains (losses) | (0.25 | ) | (0.97 | ) | (0.21 | ) | 1.04 | (1.91 | ) | 1.61 | ||||||||||||||
|
| |||||||||||||||||||||||
Total from investment operations | (0.21 | ) | (0.85 | ) | (0.11 | ) | 1.20 | (1.78 | ) | 1.66 | ||||||||||||||
|
| |||||||||||||||||||||||
| Less distributions from: | ||||||||||||||||||||||||
Net investment income | (0.16 | ) | (0.13 | ) | (0.19 | ) | (0.12 | ) | (0.10 | ) | (0.16 | ) | ||||||||||||
Net realized gains | (1.13 | ) | — | — | — | — | — | |||||||||||||||||
|
| |||||||||||||||||||||||
Total distributions | (1.29 | ) | (0.13 | ) | (0.19 | ) | (0.12 | ) | (0.10 | ) | (0.16 | ) | ||||||||||||
|
| |||||||||||||||||||||||
Redemption fees | — | — | d | — | d | — | d | — | d | — | d | |||||||||||||
|
| |||||||||||||||||||||||
Net asset value, end of period | $7.72 | $9.22 | $10.20 | $10.50 | $9.42 | $11.30 | ||||||||||||||||||
|
| |||||||||||||||||||||||
Total returne | (2.22)% | (8.48)% | (1.07)% | 13.06% | (15.88)% | 17.41% | ||||||||||||||||||
| Ratios to average net assetsf | ||||||||||||||||||||||||
Expenses | 1.71% | g | 1.71% | g | 1.70% | 1.70% | 1.75% | 1.84% | h | |||||||||||||||
Net investment income | 0.85% | 1.16% | c | 0.90% | 1.58% | 1.22% | 0.52% | |||||||||||||||||
| Supplemental data | ||||||||||||||||||||||||
Net assets, end of period (000’s) | $9,311 | $11,106 | $15,225 | $23,341 | $24,380 | $37,198 | ||||||||||||||||||
Portfolio turnover rate | 27.00% | 82.87% | 44.59% | 24.45% | 14.90% | 24.41% | ||||||||||||||||||
aThe amount shown for a share outstanding throughout the period may not correlate with the Statement of Operations for the period due to the timing of sales and repurchases of the Fund’s shares in relation to income earned and/or fluctuating fair value of the investments of the Fund.
bBased on average daily shares outstanding.
cNet investment income per share includes approximately $0.04 per share received in the form of special dividends. Excluding these amounts, the ratio of net investment income to average net assets would have been 0.76%.
dAmount rounds to less than $0.01 per share.
eTotal return does not include fees, charges or expenses imposed by the variable annuity and life insurance contracts for which Franklin Templeton Variable Insurance Products Trust serves as an underlying investment vehicle. Total return is not annualized for periods less than one year.
fRatios are annualized for periods less than one year.
gBenefit of waiver and payments by affiliates rounds to less than 0.01%.
hBenefit of expense reduction rounds to less than 0.01%.
| The accompanying notes are an integral part of these financial statements. | Semiannual Report | TD-9 |
FRANKLIN TEMPLETON VARIABLE INSURANCE PRODUCTS TRUST
Statement of Investments, June 30, 2015 (unaudited)
Templeton Developing Markets VIP Fund
| ||||||||||||||
| Industry | Shares | Value | ||||||||||||
Common Stocks 83.6% | ||||||||||||||
Argentina 0.6% | ||||||||||||||
| a | Grupo Clarin SA, B, GDR, Reg S | Media | 18,505 | $ | 240,565 | |||||||||
YPF Sociedad Anonima, D, ADR | Oil, Gas & Consumable Fuels | 64,500 | 1,769,235 | |||||||||||
|
| |||||||||||||
| 2,009,800 | ||||||||||||||
|
| |||||||||||||
Belgium 4.2% | ||||||||||||||
Anheuser-Busch InBev NV | Beverages | 120,577 | 14,445,532 | |||||||||||
|
| |||||||||||||
Brazil 2.6% | ||||||||||||||
Cia Hering | Specialty Retail | 276,200 | 1,078,941 | |||||||||||
Estacio Participacoes SA | Diversified Consumer Services | 297,700 | 1,722,856 | |||||||||||
Kroton Educacional SA | Diversified Consumer Services | 1,011,300 | 3,865,980 | |||||||||||
M Dias Branco SA | Food Products | 82,100 | 2,164,486 | |||||||||||
|
| |||||||||||||
| 8,832,263 | ||||||||||||||
|
| |||||||||||||
Cambodia 0.3% | ||||||||||||||
NagaCorp Ltd. | Hotels, Restaurants & Leisure | 1,582,000 | 1,171,451 | |||||||||||
|
| |||||||||||||
China 22.8% | ||||||||||||||
| b | Alibaba Group Holding Ltd., ADR | Internet Software & Services | 34,320 | 2,823,506 | ||||||||||
| b | Aluminum Corp. of China Ltd., H | Metals & Mining | 2,799,400 | 1,415,653 | ||||||||||
| b | Baidu Inc., ADR | Internet Software & Services | 32,500 | 6,470,100 | ||||||||||
Brilliance China Automotive Holdings Ltd. | Automobiles | 7,713,700 | 12,040,762 | |||||||||||
China Construction Bank Corp., H | Banks | 3,769,300 | 3,447,567 | |||||||||||
China Life Insurance Co. Ltd., H | Insurance | 2,276,000 | 9,865,461 | |||||||||||
China Mobile Ltd. | Wireless Telecommunication Services | 440,000 | 5,642,154 | |||||||||||
China Petroleum and Chemical Corp., H | Oil, Gas & Consumable Fuels | 8,628,000 | 7,435,196 | |||||||||||
China Shipping Development Co. Ltd., H | Marine | 5,560,300 | 4,210,582 | |||||||||||
Dah Chong Hong Holdings Ltd. | Distributors | 2,853,900 | 1,483,712 | |||||||||||
Fuyao Group Glass Industries Co. Ltd., H | Auto Components | 730,000 | 1,787,413 | |||||||||||
Guangzhou Automobile Group Co. Ltd., H | Automobiles | 1,972,000 | 1,826,574 | |||||||||||
Industrial and Commercial Bank of China Ltd., H | Banks | 3,145,300 | 2,495,416 | |||||||||||
| c | Inner Mongolia Yitai Coal Co. Ltd., B | Oil, Gas & Consumable Fuels | 243,400 | 347,819 | ||||||||||
NetEase Inc., ADR | Internet Software & Services | 12,903 | 1,869,193 | |||||||||||
PetroChina Co. Ltd., H | Oil, Gas & Consumable Fuels | 8,244,600 | 9,178,807 | |||||||||||
Poly Culture Group Corp. Ltd., H | Media | 262,300 | 1,043,901 | |||||||||||
Tencent Holdings Ltd. | Internet Software & Services | 231,300 | 4,619,048 | |||||||||||
|
| |||||||||||||
| 78,002,864 | ||||||||||||||
|
| |||||||||||||
Greece 1.2% | ||||||||||||||
| b | Alpha Bank A E | Banks | 10,386,182 | 3,132,268 | ||||||||||
| b | National Bank of Greece SA | Banks | 964,992 | 1,061,972 | ||||||||||
|
| |||||||||||||
| 4,194,240 | ||||||||||||||
|
| |||||||||||||
Hong Kong 0.7% | ||||||||||||||
Dairy Farm International Holdings Ltd. | Food & Staples Retailing | 187,433 | 1,623,170 | |||||||||||
MGM China Holdings Ltd. | Hotels, Restaurants & Leisure | 429,200 | 702,077 | |||||||||||
|
| |||||||||||||
| 2,325,247 | ||||||||||||||
|
| |||||||||||||
India 9.5% | ||||||||||||||
Biocon Ltd. | Biotechnology | 545,046 | 3,954,182 | |||||||||||
Dr. Reddy’s Laboratories Ltd. | Pharmaceuticals | 132,420 | 7,415,917 | |||||||||||
Infosys Ltd. | IT Services | 124,678 | 1,930,936 | |||||||||||
Oil & Natural Gas Corp. Ltd. | Oil, Gas & Consumable Fuels | 297,100 | 1,447,212 | |||||||||||
Reliance Industries Ltd. | Oil, Gas & Consumable Fuels | 138,200 | 2,174,602 | |||||||||||
| TD-10 | Semiannual Report |
FRANKLIN TEMPLETON VARIABLE INSURANCE PRODUCTS TRUST
STATEMENT OF INVESTMENTS (UNAUDITED)
Templeton Developing Markets VIP Fund (continued)
| Industry | Shares | Value | ||||||||||||
Common Stocks (continued) | ||||||||||||||
India (continued) | ||||||||||||||
Tata Consultancy Services Ltd. | IT Services | 266,840 | $ | 10,709,798 | ||||||||||
Tata Motors Ltd. | Automobiles | 511,667 | 3,495,068 | |||||||||||
Tata Motors Ltd., A | Automobiles | 352,469 | 1,445,741 | |||||||||||
|
| |||||||||||||
| 32,573,456 | ||||||||||||||
|
| |||||||||||||
Indonesia 4.1% | ||||||||||||||
Astra International Tbk PT | Automobiles | 14,567,700 | 7,730,469 | |||||||||||
Bank Danamon Indonesia Tbk PT | Banks | 6,199,400 | 1,999,432 | |||||||||||
Semen Indonesia (Persero) Tbk PT | Construction Materials | 4,895,500 | 4,406,225 | |||||||||||
|
| |||||||||||||
| 14,136,126 | ||||||||||||||
|
| |||||||||||||
Pakistan 0.9% | ||||||||||||||
Habib Bank Ltd. | Banks | 1,550,000 | 3,264,359 | |||||||||||
Oil & Gas Development Co. Ltd. | Oil, Gas & Consumable Fuels | 5,600 | 9,856 | |||||||||||
|
| |||||||||||||
| 3,274,215 | ||||||||||||||
|
| |||||||||||||
Panama 0.5% | ||||||||||||||
Copa Holdings SA | Airlines | 21,922 | 1,810,538 | |||||||||||
|
| |||||||||||||
Peru 0.5% | ||||||||||||||
Compania de Minas Buenaventura SA, ADR | Metals & Mining | 153,850 | 1,596,963 | |||||||||||
|
| |||||||||||||
Philippines 0.9% | ||||||||||||||
Bloomberry Resorts Corp. | Hotels, Restaurants & Leisure | 13,485,300 | 2,573,839 | |||||||||||
| b | Melco Crown Philippines Resorts Corp. | Hotels, Restaurants & Leisure | 4,316,800 | 489,947 | ||||||||||
|
| |||||||||||||
| 3,063,786 | ||||||||||||||
|
| |||||||||||||
Russia 0.9% | ||||||||||||||
Mining and Metallurgical Co. Norilsk Nickel OJSC, ADR | Metals & Mining | 179,200 | 3,023,104 | |||||||||||
|
| |||||||||||||
South Africa 10.6% | ||||||||||||||
| b | Impala Platinum Holdings Ltd. | Metals & Mining | 352,750 | 1,574,414 | ||||||||||
Kumba Iron Ore Ltd. | Metals & Mining | 56,434 | 700,253 | |||||||||||
MTN Group Ltd. | Wireless Telecommunication Services | 303,331 | 5,703,351 | |||||||||||
Naspers Ltd., N | Media | 116,330 | 18,119,789 | |||||||||||
Remgro Ltd. | Diversified Financial Services | 443,443 | 9,328,851 | |||||||||||
Truworths International Ltd. | Specialty Retail | 139,837 | 985,043 | |||||||||||
|
| |||||||||||||
| 36,411,701 | ||||||||||||||
|
| |||||||||||||
South Korea 5.6% | ||||||||||||||
Bukwang Pharmaceutical Co. Ltd. | Pharmaceuticals | 34,677 | 1,043,742 | |||||||||||
Fila Korea Ltd. | Textiles, Apparel & Luxury Goods | 6,910 | 685,050 | |||||||||||
Hyundai Development Co. | Construction & Engineering | 72,470 | 4,284,872 | |||||||||||
| b | Interpark Corp. | Internet & Catalog Retail | 20,300 | 169,342 | ||||||||||
KT Skylife Co. Ltd. | Media | 31,000 | 560,671 | |||||||||||
Lotte Shopping Co. Ltd. | Multiline Retail | 8,082 | 1,692,713 | |||||||||||
Samsung Electronics Co. Ltd. | Technology Hardware, Storage & Peripherals | 3,498 | 3,961,509 | |||||||||||
Samsung Heavy Industries Co. Ltd. | Machinery | 104,120 | 1,585,551 | |||||||||||
| b | SK Innovation Co. Ltd. | Oil, Gas & Consumable Fuels | 46,511 | 5,068,006 | ||||||||||
|
| |||||||||||||
| 19,051,456 | ||||||||||||||
|
| |||||||||||||
Switzerland 1.2% | ||||||||||||||
Compagnie Financiere Richemont SA | Textiles, Apparel & Luxury Goods | 28,178 | 2,291,666 | |||||||||||
| b | Oriflame Holding AG | Personal Products | 104,570 | 1,689,796 | ||||||||||
|
| |||||||||||||
| 3,981,462 | ||||||||||||||
|
| |||||||||||||
| Semiannual Report | TD-11 |
FRANKLIN TEMPLETON VARIABLE INSURANCE PRODUCTS TRUST
STATEMENT OF INVESTMENTS (UNAUDITED)
Templeton Developing Markets VIP Fund (continued)
| Industry | Shares | Value | ||||||||||||
Common Stocks (continued) | ||||||||||||||
Taiwan 4.2% | ||||||||||||||
Taiwan Semiconductor Manufacturing Co. Ltd. | Semiconductors & Semiconductor Equipment | 3,143,000 | $ | 14,291,450 | ||||||||||
|
| |||||||||||||
Thailand 6.8% | ||||||||||||||
Kasikornbank PCL, fgn. | Banks | 268,500 | 1,500,932 | |||||||||||
Land and Houses PCL, fgn. | Real Estate Management & Development | 8,858,800 | 2,358,154 | |||||||||||
Land and Houses PCL, NVDR | Real Estate Management & Development | 4,347,600 | 1,138,014 | |||||||||||
PTT Exploration and Production PCL, fgn. | Oil, Gas & Consumable Fuels | 785,300 | 2,531,727 | |||||||||||
PTT PCL, fgn. | Oil, Gas & Consumable Fuels | 361,500 | 3,838,465 | |||||||||||
Siam Commercial Bank PCL, fgn. | Banks | 770,100 | 3,541,868 | |||||||||||
Thai Beverage PCL, fgn. | Beverages | 14,863,200 | 8,441,866 | |||||||||||
|
| |||||||||||||
| 23,351,026 | ||||||||||||||
|
| |||||||||||||
United Kingdom 4.0% | ||||||||||||||
Unilever PLC | Personal Products | 318,597 | 13,664,084 | |||||||||||
|
| |||||||||||||
United States 1.5% | ||||||||||||||
Avon Products Inc. | Personal Products | 821,469 | 5,142,396 | |||||||||||
|
| |||||||||||||
Total Common Stocks | 286,353,160 | |||||||||||||
|
| |||||||||||||
| d | Participatory Notes 1.0% | |||||||||||||
Saudi Arabia 1.0% | ||||||||||||||
| e | Deutsche Bank AG/London, | |||||||||||||
Etihad Etisalat Co., 144A, 9/27/16 | Wireless Telecommunication Services | 66,819 | 600,400 | |||||||||||
Samba Financial Group, 144A, 9/27/16 | Banks | 257,955 | 1,795,127 | |||||||||||
| e | HSBC Bank PLC, Etihad Etisalat Co., 144A, 11/20/17 | Wireless Telecommunication Services | 102,495 | 920,966 | ||||||||||
|
| |||||||||||||
Total Participatory Notes | 3,316,493 | |||||||||||||
|
| |||||||||||||
Preferred Stocks 7.7% | ||||||||||||||
Brazil 7.3% | ||||||||||||||
Banco Bradesco SA, ADR, pfd. | Banks | 273,280 | 2,503,245 | |||||||||||
Itau Unibanco Holding SA, ADR, pfd. | Banks | 1,289,010 | 14,114,659 | |||||||||||
| b | Petroleo Brasileiro SA, ADR, pfd. | Oil, Gas & Consumable Fuels | 572,800 | 4,674,048 | ||||||||||
Vale SA, ADR, pfd., A | Metals & Mining | 747,400 | 3,774,370 | |||||||||||
|
| |||||||||||||
| 25,066,322 | ||||||||||||||
|
| |||||||||||||
Chile 0.4% | ||||||||||||||
Sociedad Quimica y Minera de Chile SA, ADR, pfd., B | Chemicals | 94,287 | 1,510,478 | |||||||||||
|
| |||||||||||||
Total Preferred Stocks | 26,576,800 | |||||||||||||
|
| |||||||||||||
Total Investments before Short Term Investments | 316,246,453 | |||||||||||||
|
| |||||||||||||
| TD-12 | Semiannual Report |
FRANKLIN TEMPLETON VARIABLE INSURANCE PRODUCTS TRUST
STATEMENT OF INVESTMENTS (UNAUDITED)
Templeton Developing Markets VIP Fund (continued)
| Shares | Value | |||||||||||
Short Term Investments | ||||||||||||
Money Market Funds 6.7% | ||||||||||||
United States 6.7% | ||||||||||||
| b,f | Institutional Fiduciary Trust Money Market Portfolio | 22,975,019 | $ | 22,975,019 | ||||||||
|
| |||||||||||
Total Investments | 339,221,472 | |||||||||||
Other Assets, less Liabilities 1.0% | 3,438,828 | |||||||||||
|
| |||||||||||
Net Assets 100.0% | $ | 342,660,300 | ||||||||||
|
| |||||||||||
See Abbreviations on page TD-24.
aSecurity was purchased pursuant to Regulation S under the Securities Act of 1933, which exempts from registration securities offered and sold outside of the United States. Such a security cannot be sold in the United States without either an effective registration statement filed pursuant to the Securities Act of 1933, or pursuant to an exemption from registration. This security has been deemed liquid under guidelines approved by the Trust’s Board of Trustees. At June 30, 2015, the value of this security was $240,565 representing 0.07% of net assets.
bNon-income producing.
cAt June 30, 2015, pursuant to the Fund’s policies and the requirements of applicable securities law, the Fund may be restricted from trading these securities for a limited or extended period of time.
dSee Note 1(c) regarding Participatory Notes.
eSecurity was purchased pursuant to Rule 144A under the Securities Act of 1933 and may be sold in transactions exempt from registration only to qualified institutional buyers or in a public offering registered under the Securities Act of 1933. These securities have been deemed liquid under guidelines approved by the Trust’s Board of Trustees. At June 30, 2015, the aggregate value of these securities was $3,316,493, representing 0.97% of net assets.
fSee Note 3(e) regarding investments in Institutional Fiduciary Trust Money Market Portfolio.
| The accompanying notes are an integral part of these financial statements. | Semiannual Report | TD-13 |
FRANKLIN TEMPLETON VARIABLE INSURANCE PRODUCTS TRUST
Financial Statements
Statement of Assets and Liabilities
June 30, 2015 (unaudited)
| Templeton Developing Markets VIP Fund | ||||
Assets: | ||||
Investments in securities: | ||||
Cost - Unaffiliated issuers | $ | 312,729,887 | ||
Cost - Sweep Money Fund (Note 3e) | 22,975,019 | |||
|
| |||
Total cost of investments | $ | 335,704,906 | ||
|
| |||
Value - Unaffiliated issuers | $ | 316,246,453 | ||
Value - Sweep Money Fund (Note 3e) | 22,975,019 | |||
|
| |||
Total value of investments | 339,221,472 | |||
Cash | 139,707 | |||
Foreign currency, at value (cost $141,634) | 130,099 | |||
Receivables: | ||||
Investment securities sold | 3,537,530 | |||
Capital shares sold | 204,229 | |||
Dividends | 1,415,724 | |||
Foreign tax | 24,154 | |||
Other assets | 161 | |||
|
| |||
Total assets | 344,673,076 | |||
|
| |||
Liabilities: | ||||
Payables: | ||||
Investment securities purchased | 330,127 | |||
Capital shares redeemed | 819,233 | |||
Management fees | 354,002 | |||
Distribution fees | 107,039 | |||
Reports to shareholders | 183,946 | |||
Deferred tax | 134,531 | |||
Accrued expenses and other liabilities | 83,898 | |||
|
| |||
Total liabilities | 2,012,776 | |||
|
| |||
Net assets, at value | $ | 342,660,300 | ||
|
| |||
Net assets consist of: | ||||
Paid-in capital | $ | 334,675,283 | ||
Distributions in excess of net investment income | (5,699,346 | ) | ||
Net unrealized appreciation (depreciation) | 3,335,127 | |||
Accumulated net realized gain (loss) | 10,349,236 | |||
|
| |||
Net assets, at value | $ | 342,660,300 | ||
|
| |||
| TD-14 | Semiannual Report | The accompanying notes are an integral part of these financial statements. |
FRANKLIN TEMPLETON VARIABLE INSURANCE PRODUCTS TRUST
FINANCIAL STATEMENTS
Statement of Assets and Liabilities (continued)
June 30, 2015 (unaudited)
| Templeton Developing Markets VIP Fund | ||||
| Class 1: | ||||
Net assets, at value | $ | 99,951,190 | ||
|
| |||
Shares outstanding | 12,904,441 | |||
|
| |||
Net asset value and maximum offering price per share | $ | 7.75 | ||
|
| |||
| Class 2: | ||||
Net assets, at value | $ | 233,398,446 | ||
|
| |||
Shares outstanding | 30,343,732 | |||
|
| |||
Net asset value and maximum offering price per share | $ | 7.69 | ||
|
| |||
| Class 4: | ||||
Net assets, at value | $ | 9,310,664 | ||
|
| |||
Shares outstanding | 1,205,734 | |||
|
| |||
Net asset value and maximum offering price per share | $ | 7.72 | ||
|
| |||
| The accompanying notes are an integral part of these financial statements. | Semiannual Report | TD-15 |
FRANKLIN TEMPLETON VARIABLE INSURANCE PRODUCTS TRUST
FINANCIAL STATEMENTS
Statement of Operations
for the six months ended June 30, 2015 (unaudited)
| Templeton Developing Markets VIP Fund | ||||
Investment income: | ||||
Dividends (net of foreign taxes of $594,327) | $ | 4,737,502 | ||
Income from securities loaned | 32 | |||
|
| |||
Total investment income | 4,737,534 | |||
|
| |||
Expenses: | ||||
Management fees (Note 3a) | 2,308,702 | |||
Distribution fees: (Note 3c) | ||||
Class 2 | 309,414 | |||
Class 4 | 18,426 | |||
Custodian fees (Note 4) | 75,651 | |||
Reports to shareholders | 92,519 | |||
Professional fees | 33,618 | |||
Trustees’ fees and expenses | 898 | |||
Other | 12,235 | |||
|
| |||
Total expenses | 2,851,463 | |||
Expenses waived/paid by affiliates (Note 3e) | (11,026 | ) | ||
|
| |||
Net expenses | 2,840,437 | |||
|
| |||
Net investment income | 1,897,097 | |||
|
| |||
Realized and unrealized gains (losses): | ||||
Net realized gain (loss) from: | ||||
Investments | 15,108,207 | |||
Foreign currency transactions | (376,081 | ) | ||
|
| |||
Net realized gain (loss) | 14,732,126 | |||
|
| |||
Net change in unrealized appreciation (depreciation) on: | ||||
Investments | (23,722,225 | ) | ||
Translation of other assets and liabilities denominated in foreign currencies | (11,609 | ) | ||
Change in deferred taxes on unrealized appreciation | (105,129 | ) | ||
|
| |||
Net change in unrealized appreciation (depreciation) | (23,838,963 | ) | ||
|
| |||
Net realized and unrealized gain (loss) | (9,106,837 | ) | ||
|
| |||
Net increase (decrease) in net assets resulting from operations | $ | (7,209,740 | ) | |
|
| |||
| TD-16 | Semiannual Report | The accompanying notes are an integral part of these financial statements. |
FRANKLIN TEMPLETON VARIABLE INSURANCE PRODUCTS TRUST
FINANCIAL STATEMENTS
Statements of Changes in Net Assets
| Templeton Developing Markets VIP Fund | ||||||||
| Six Months Ended June 30, 2015 (unaudited) | Year Ended December 31, 2014 | |||||||
Increase (decrease) in net assets: | ||||||||
Operations: | ||||||||
Net investment income | $ | 1,897,097 | $ | 5,767,995 | ||||
Net realized gain (loss) | 14,732,126 | 66,732,640 | ||||||
Net change in unrealized appreciation (depreciation) | (23,838,963 | ) | (106,645,647 | ) | ||||
|
| |||||||
Net increase (decrease) in net assets resulting from operations | (7,209,740 | ) | (34,145,012 | ) | ||||
|
| |||||||
Distributions to shareholders from: | ||||||||
Net investment income: | ||||||||
Class 1 | (2,280,023 | ) | (2,319,775 | ) | ||||
Class 2 | (4,605,588 | ) | (4,358,800 | ) | ||||
Class 4 | (178,865 | ) | (173,399 | ) | ||||
Net realized gains: | ||||||||
Class 1 | (12,555,712 | ) | — | |||||
Class 2 | (29,329,089 | ) | — | |||||
Class 4 | (1,242,906 | ) | — | |||||
|
| |||||||
Total distributions to shareholders | (50,192,183 | ) | (6,851,974 | ) | ||||
|
| |||||||
Capital share transactions: (Note 2) | ||||||||
Class 1 | 2,320,716 | (18,560,195 | ) | |||||
Class 2 | 21,510,897 | 2,280,393 | ||||||
Class 3 | — | (33,674,042 | ) | |||||
Class 4 | (174,999 | ) | (2,909,339 | ) | ||||
|
| |||||||
Total capital share transactions | 23,656,614 | (52,863,183 | ) | |||||
|
| |||||||
Redemption fees | — | 68 | ||||||
|
| |||||||
Net increase (decrease) in net assets | (33,745,309 | ) | (93,860,101 | ) | ||||
Net assets: | ||||||||
Beginning of period | 376,405,609 | 470,265,710 | ||||||
|
| |||||||
End of period | $ | 342,660,300 | $ | 376,405,609 | ||||
|
| |||||||
Distributions in excess of net investment income, end of period | $ | (5,699,346 | ) | $ | (531,967 | ) | ||
|
| |||||||
| The accompanying notes are an integral part of these financial statements. | Semiannual Report | TD-17 |
FRANKLIN TEMPLETON VARIABLE INSURANCE PRODUCTS TRUST
Notes to Financial Statements (unaudited)
Templeton Developing Markets VIP Fund
1. Organization and Significant Accounting Policies
Franklin Templeton Variable Insurance Products Trust (Trust) is registered under the Investment Company Act of 1940 (1940 Act) as an open-end management investment company, consisting of nineteen separate funds and applies the specialized accounting and reporting guidance in U.S. Generally Accepted Accounting Principles (U.S. GAAP). Templeton Developing Markets VIP Fund (Fund) is included in this report. The financial statements of the remaining funds in the Trust are presented separately. Shares of the Fund are generally sold only to insurance company separate accounts to fund the benefits of variable life insurance policies or variable annuity contracts. The Fund offers three classes of shares: Class 1, Class 2 and Class 4. Effective May 1, 2014, all Class 3 shares were converted to Class 2. Each class of shares differs by its distribution fees, voting rights on matters affecting a single class and its exchange privilege.
The following summarizes the Fund’s significant accounting policies.
a. Financial Instrument Valuation
The Fund’s investments in financial instruments are carried at fair value daily. Fair value is the price that would be received to sell an asset or paid to transfer a liability in an orderly transaction between market participants on the measurement date. The Fund calculates the net asset value (NAV) per share at the close of the New York Stock Exchange (NYSE), generally at 4 p.m. Eastern time (NYSE close) on each day the NYSE is open for trading. Under compliance policies and procedures approved by the Trust’s Board of Trustees (the Board), the Fund’s administrator has responsibility for oversight of valuation, including leading the cross-functional Valuation and Liquidity Oversight Committee (VLOC). The VLOC provides administration and oversight of the Fund’s valuation policies and procedures, which are approved annually by the Board. Among other things, these procedures allow the Fund to utilize independent pricing services, quotations from securities and financial instrument dealers, and other market sources to determine fair value.
Equity securities listed on an exchange or on the NASDAQ National Market System are valued at the last quoted sale price or the official closing price of the day, respectively. Foreign equity securities are valued as of the close of trading on the foreign stock exchange on which the security is primarily traded or as of the NYSE close, whichever is earlier. The value is then
converted into its U.S. dollar equivalent at the foreign exchange rate in effect at the NYSE close on the day that the value of the security is determined. Over-the-counter (OTC) securities are valued within the range of the most recent quoted bid and ask prices. Securities that trade in multiple markets or on multiple exchanges are valued according to the broadest and most representative market. Certain equity securities are valued based upon fundamental characteristics or relationships to similar securities. Investments in open-end mutual funds are valued at the closing NAV.
The Fund has procedures to determine the fair value of financial instruments for which market prices are not reliable or readily available. Under these procedures, the VLOC convenes on a regular basis to review such financial instruments and considers a number of factors, including significant unobservable valuation inputs, when arriving at fair value. The VLOC primarily employs a market-based approach which may use related or comparable assets or liabilities, recent transactions, market multiples, book values, and other relevant information for the investment to determine the fair value of the investment. An income-based valuation approach may also be used in which the anticipated future cash flows of the investment are discounted to calculate fair value. Discounts may also be applied due to the nature or duration of any restrictions on the disposition of the investments. Due to the inherent uncertainty of valuations of such investments, the fair values may differ significantly from the values that would have been used had an active market existed. The VLOC employs various methods for calibrating these valuation approaches including a regular review of key inputs and assumptions, transactional back-testing or disposition analysis, and reviews of any related market activity.
Trading in securities on foreign securities stock exchanges and OTC markets may be completed before the daily NYSE close. In addition, trading in certain foreign markets may not take place on every NYSE business day. Occasionally, events occur between the time at which trading in a foreign security is completed and the close of the NYSE that might call into question the reliability of the value of a portfolio security held by the Fund. As a result, differences may arise between the value of the Fund’s portfolio securities as determined at the foreign market close and the latest indications of value at the close of the NYSE. In order to minimize the potential for these differences, the VLOC monitors price movements following the close of trading in foreign stock markets through a series of country specific market proxies (such as baskets of American
| TD-18 | Semiannual Report |
FRANKLIN TEMPLETON VARIABLE INSURANCE PRODUCTS TRUST
NOTES TO FINANCIAL STATEMENTS (UNAUDITED)
Templeton Developing Markets VIP Fund (continued)
Depositary Receipts, futures contracts and exchange traded funds). These price movements are measured against established trigger thresholds for each specific market proxy to assist in determining if an event has occurred that may call into question the reliability of the values of the foreign securities held by the Fund. If such an event occurs, the securities may be valued using fair value procedures, which may include the use of independent pricing services. At June 30, 2015, a market event occurred resulting in a portion of the securities held by the Fund being valued using fair value procedures.
When the last day of the reporting period is a non-business day, certain foreign markets may be open on those days that the NYSE is closed, which could result in differences between the value of the Fund’s portfolio securities on the last business day and the last calendar day of the reporting period. Any significant security valuation changes due to an open foreign market are adjusted and reflected by the Fund for financial reporting purposes.
b. Foreign Currency Translation
Portfolio securities and other assets and liabilities denominated in foreign currencies are translated into U.S. dollars based on the exchange rate of such currencies against U.S. dollars on the date of valuation. The Fund may enter into foreign currency exchange contracts to facilitate transactions denominated in a foreign currency. Purchases and sales of securities, income and expense items denominated in foreign currencies are translated into U.S. dollars at the exchange rate in effect on the transaction date. Portfolio securities and assets and liabilities denominated in foreign currencies contain risks that those currencies will decline in value relative to the U.S. dollar. Occasionally, events may impact the availability or reliability of foreign exchange rates used to convert the U.S. dollar equivalent value. If such an event occurs, the foreign exchange rate will be valued at fair value using procedures established and approved by the Board.
The Fund does not separately report the effect of changes in foreign exchange rates from changes in market prices on securities held. Such changes are included in net realized and unrealized gain or loss from investments in the Statement of Operations.
Realized foreign exchange gains or losses arise from sales of foreign currencies, currency gains or losses realized between the trade and settlement dates on securities transactions and the
difference between the recorded amounts of dividends, interest, and foreign withholding taxes and the U.S. dollar equivalent of the amounts actually received or paid. Net unrealized foreign exchange gains and losses arise from changes in foreign exchange rates on foreign denominated assets and liabilities other than investments in securities held at the end of the reporting period.
c. Participatory Notes
The Fund invests in Participatory Notes (P-Notes). P-notes are promissory notes that are designed to offer a return linked to the performance of a particular underlying equity security or market. P-Notes are issued by banks or broker-dealers and allow the fund to gain exposure to common stocks in markets where direct investment is not allowed. Income received from P-Notes is recorded as dividend income in the Statement of Operations. P-Notes may contain various risks including the potential inability of the counterparty to fulfill their obligations under the terms of the contract. These securities may be more volatile and less liquid than other investments held by the Fund.
d. Securities Lending
The Fund participates in an agency based securities lending program to earn additional income. The Fund receives cash collateral against the loaned securities in an amount equal to at least 102% of the fair value of the loaned securities. Collateral is maintained over the life of the loan in an amount not less than 100% of the fair value of loaned securities, as determined at the close of fund business each day; any additional collateral required due to changes in security values is delivered to the Fund on the next business day. The collateral is deposited into a joint cash account with other funds and is used to invest in a money market fund managed by Franklin Advisers, Inc., an affiliate of the Fund. The Fund may receive income from the investment of cash collateral, in addition to lending fees and rebates paid by the borrower. Income from securities loaned is reported separately in the Statement of Operations. The Fund bears the market risk with respect to the collateral investment, securities loaned, and the risk that the agent may default on its obligations to the Fund. If the borrower defaults on its obligation to return the securities loaned, the Fund has the right to repurchase the securities in the open market using the collateral received. The securities lending agent has agreed to indemnify the Fund in the event of default by a third party borrower. At June 30, 2015, the Fund had no securities on loan.
| Semiannual Report | TD-19 |
FRANKLIN TEMPLETON VARIABLE INSURANCE PRODUCTS TRUST
NOTES TO FINANCIAL STATEMENTS (UNAUDITED)
Templeton Developing Markets VIP Fund (continued)
1. Organization and Significant Accounting Policies (continued)
e. Income and Deferred Taxes
It is the Fund’s policy to qualify as a regulated investment company under the Internal Revenue Code. The Fund intends to distribute to shareholders substantially all of its taxable income and net realized gains to relieve it from federal income and if applicable, excise taxes. As a result, no provision for U.S. federal income taxes is required.
The Fund may be subject to foreign taxation related to income received, capital gains on the sale of securities and certain foreign currency transactions in the foreign jurisdictions in which it invests. Foreign taxes, if any, are recorded based on the tax regulations and rates that exist in the foreign markets in which the Fund invests. When a capital gain tax is determined to apply, the Fund records an estimated deferred tax liability in an amount that would be payable if the securities were disposed of on the valuation date.
The Fund recognizes the tax benefits of uncertain tax positions only when the position is “more likely than not” to be sustained upon examination by the tax authorities based on the technical merits of the tax position. As of June 30, 2015, and for all open tax years, the Fund has determined that no liability for unrecognized tax benefits is required in the Fund’s financial statements related to uncertain tax positions taken on a tax return (or expected to be taken on future tax returns). Open tax years are those that remain subject to examination and are based on each tax jurisdiction’s statute of limitation.
f. Security Transactions, Investment Income, Expenses and Distributions
Security transactions are accounted for on trade date. Realized gains and losses on security transactions are determined on a specific identification basis. Estimated expenses are accrued daily. Dividend income is recorded on the ex-dividend date except for certain dividends from foreign securities where the dividend rate is not available. In such cases, the dividend is recorded as soon as the information is received by the Fund. Distributions to shareholders are recorded on the ex-dividend date and are determined according to income tax regulations (tax basis). Distributable earnings determined on a tax basis may differ from earnings recorded in accordance with U.S. GAAP. These differences may be permanent or temporary. Permanent
differences are reclassified among capital accounts to reflect their tax character. These reclassifications have no impact on net assets or the results of operations. Temporary differences are not reclassified, as they may reverse in subsequent periods.
Common expenses incurred by the Trust are allocated among the funds based on the ratio of net assets of each fund to the combined net assets of the Trust. Fund specific expenses are charged directly to the fund that incurred the expense.
Realized and unrealized gains and losses and net investment income, not including class specific expenses, are allocated daily to each class of shares based upon the relative proportion of net assets of each class. Differences in per share distributions, by class, are generally due to differences in class specific expenses.
g. Accounting Estimates
The preparation of financial statements in accordance with U.S. GAAP requires management to make estimates and assumptions that affect the reported amounts of assets and liabilities at the date of the financial statements and the amounts of income and expenses during the reporting period. Actual results could differ from those estimates.
h. Redemption Fees
Redemptions and exchanges of interests in an insurance company subaccount that invested in Class 3 shares of the Fund were subject to a 1.0% short term trading fee if the interest in the subaccount had been held for less than 60 days. Such fees were retained by the Fund and accounted for as an addition to paid-in capital, allocated to each class of shares based upon the relative proportion of net assets of each class. There were no redemption fees for the period.
i. Guarantees and Indemnifications
Under the Trust’s organizational documents, its officers and trustees are indemnified by the Trust against certain liabilities arising out of the performance of their duties to the Trust. Additionally, in the normal course of business, the Trust, on behalf of the Fund, enters into contracts with service providers that contain general indemnification clauses. The Trust’s maximum exposure under these arrangements is unknown as this would involve future claims that may be made against the Trust that have not yet occurred. Currently, the Trust expects the risk of loss to be remote.
| TD-20 | Semiannual Report |
FRANKLIN TEMPLETON VARIABLE INSURANCE PRODUCTS TRUST
NOTES TO FINANCIAL STATEMENTS (UNAUDITED)
Templeton Developing Markets VIP Fund (continued)
2. Shares of Beneficial Interest
At June 30, 2015, there were an unlimited number of shares authorized (without par value). Transactions in the Fund’s shares were as follows:
| Six Months Ended June 30, 2015 | Year Ended December 31, 2014 | |||||||||||||||||
| Shares | Amount | Shares | Amount | |||||||||||||||
| Class 1 Shares: | ||||||||||||||||||
Shares sold | 656,065 | $ | 6,178,959 | 1,624,952 | $ | 16,226,245 | ||||||||||||
Shares issued in reinvestment of distributions | 1,921,727 | 14,835,735 | 229,681 | 2,319,775 | ||||||||||||||
Shares redeemed | (2,021,987 | ) | (18,693,978 | ) | (3,701,849 | ) | (37,106,215 | ) | ||||||||||
|
| |||||||||||||||||
Net increase (decrease) | 555,805 | $ | 2,320,716 | (1,847,216 | ) | $ | (18,560,195 | ) | ||||||||||
|
| |||||||||||||||||
| Class 2 Shares: | ||||||||||||||||||
Shares sold | 1,844,144 | $ | 17,240,930 | 7,755,421 | $ | 76,467,757 | ||||||||||||
Shares issued in reinvestment of distributions | 4,430,114 | 33,934,677 | 434,143 | 4,358,800 | ||||||||||||||
Shares redeemed | (3,190,230 | ) | (29,664,710 | ) | (7,896,683 | ) | (78,546,164 | ) | ||||||||||
|
| |||||||||||||||||
Net increase (decrease) | 3,084,028 | $ | 21,510,897 | 292,881 | $ | 2,280,393 | ||||||||||||
|
| |||||||||||||||||
| Class 3 Sharesa: | ||||||||||||||||||
Shares sold | 171,371 | $ | 1,697,483 | |||||||||||||||
Shares redeemed | (3,593,907 | ) | (35,371,525 | ) | ||||||||||||||
|
| |||||||||||||||||
Net increase (decrease) | (3,422,536 | ) | $ | (33,674,042 | ) | |||||||||||||
|
| |||||||||||||||||
| Class 4 Shares: | ||||||||||||||||||
Shares sold | 38,594 | $ | 350,595 | 89,395 | $ | 875,146 | ||||||||||||
Shares issued in reinvestment of distributions | 184,886 | 1,421,771 | 17,219 | 173,399 | ||||||||||||||
Shares redeemed | (222,189 | ) | (1,947,365 | ) | (395,412 | ) | (3,957,884 | ) | ||||||||||
|
| |||||||||||||||||
Net increase (decrease) | 1,291 | $ | (174,999 | ) | (288,798 | ) | $ | (2,909,339 | ) | |||||||||
|
| |||||||||||||||||
aEffective May 1, 2014, all Class 3 shares were converted to Class 2.
3. Transactions With Affiliates
Franklin Resources, Inc. is the holding company for various subsidiaries that together are referred to as Franklin Templeton Investments. Certain officers and trustees of the Fund are also officers and/or trustees of the following subsidiaries:
| Subsidiary | Affiliation | |
Templeton Asset Management Ltd. (TAML) | Investment manager | |
Franklin Templeton Services, LLC (FT Services) | Administrative manager | |
Franklin Templeton Distributors, Inc. (Distributors) | Principal underwriter | |
Franklin Templeton Investor Services, LLC (Investor Services) | Transfer agent |
a. Management Fees
The Fund pays an investment management fee to TAML based on the average daily net assets of the Fund as follows:
| Annualized Fee Rate | Net Assets | |
1.250% | Up to and including $200 million | |
1.235% | Over $200 million, up to and including $700 million |
| Semiannual Report | TD-21 |
FRANKLIN TEMPLETON VARIABLE INSURANCE PRODUCTS TRUST
NOTES TO FINANCIAL STATEMENTS (UNAUDITED)
Templeton Developing Markets VIP Fund (continued)
| Annualized Fee Rate | �� | Net Assets |
1.200% | Over $700 million, up to and including $1 billion | |
1.150% | Over $1 billion, up to and including $1.2 billion | |
1.125% | Over $1.2 billion, up to and including $5 billion | |
1.075% | Over $5 billion, up to and including $10 billion | |
1.025% | Over $10 billion, up to and including $15 billion | |
0.975% | Over $15 billion, up to and including $20 billion | |
0.925% | In excess of $20 billion |
b. Administrative Fees
Under an agreement with TAML, FT Services provides administrative services to the Fund. The fee is paid by TAML based on the Fund’s average daily net assets, and is not an additional expense of the Fund.
c. Distribution Fees
The Board has adopted distribution plans for Class 2 and Class 4 shares pursuant to Rule 12b-1 under the 1940 Act. Under the Fund’s compensation distribution plans, the Fund pays Distributors for costs incurred in connection with the servicing, sale and distribution of the Fund’s shares up to 0.25% and 0.35% per year of its average daily net assets of Class 2 and Class 4, respectively. Some distribution fees are not charged on shares held by affiliates. The plan year, for purposes of monitoring compliance with the maximum annual plan rates, is February 1 through January 31.
d. Transfer Agent Fees
Investor Services, under terms of an agreement, performs shareholder servicing for the Fund and is not paid by the Fund for the services.
e. Investments in Institutional Fiduciary Trust Money Market Portfolio
The Fund invests in Institutional Fiduciary Trust Money Market Portfolio (Sweep Money Fund), an affiliated open-end management investment company. Management fees paid by the Fund are waived on assets invested in the Sweep Money Fund, as noted in the Statement of Operations, in an amount not to exceed the management and administrative fees paid directly or indirectly by the Sweep Money Fund. Prior to January 1, 2014, the waiver was accounted for as a reduction to management fees.
4. Expense Offset Arrangement
The Fund has entered into an arrangement with its custodian whereby credits realized as a result of uninvested cash balances are used to reduce a portion of the Fund’s custodian expenses. During the period ended June 30, 2015, there were no credits earned.
5. Income Taxes
At June 30, 2015, the cost of investments and net unrealized appreciation (depreciation) for income tax purposes were as follows:
Cost of investments | $ | 346,262,959 | ||
|
| |||
Unrealized appreciation | $ | 35,553,624 | ||
Unrealized depreciation | (42,595,111 | ) | ||
|
| |||
Net unrealized appreciation (depreciation) | $ | (7,041,487 | ) | |
|
|
| TD-22 | Semiannual Report |
FRANKLIN TEMPLETON VARIABLE INSURANCE PRODUCTS TRUST
NOTES TO FINANCIAL STATEMENTS (UNAUDITED)
Templeton Developing Markets VIP Fund (continued)
Differences between income and/or capital gains as determined on a book basis and a tax basis are primarily due to differing treatments of foreign currency transactions, passive foreign investment company shares, corporate actions and wash sales.
6. Investment Transactions
Purchases and sales of investments (excluding short term securities) for the period ended June 30, 2015, aggregated $92,822,396 and $115,092,009 respectively.
7. Concentration of Risk
Investing in foreign securities may include certain risks and considerations not typically associated with investing in U.S. securities, such as fluctuating currency values and changing local and regional economic, political and social conditions, which may result in greater market volatility. In addition, certain foreign securities may not be as liquid as U.S. securities.
8. Credit Facility
The Fund, together with other U.S. registered and foreign investment funds (collectively, Borrowers), managed by Franklin Templeton Investments, are borrowers in a joint syndicated senior unsecured credit facility totaling $2 billion (Global Credit Facility) which matures on February 12, 2016. This Global Credit Facility provides a source of funds to the Borrowers for temporary and emergency purposes, including the ability to meet future unanticipated or unusually large redemption requests.
Under the terms of the Global Credit Facility, the Fund shall, in addition to interest charged on any borrowings made by the Fund and other costs incurred by the Fund, pay its share of fees and expenses incurred in connection with the implementation and maintenance of the Global Credit Facility, based upon its relative share of the aggregate net assets of all of the Borrowers, including an annual commitment fee of 0.07% based upon the unused portion of the Global Credit Facility. These fees are reflected in other expenses in the Statement of Operations. During the period ended June 30, 2015, the Fund did not use the Global Credit Facility.
9. Fair Value Measurements
The Fund follows a fair value hierarchy that distinguishes between market data obtained from independent sources (observable inputs) and the Fund’s own market assumptions (unobservable inputs). These inputs are used in determining the value of the Fund’s financial instruments and are summarized in the following fair value hierarchy:
| • | Level 1 – quoted prices in active markets for identical financial instruments |
| • | Level 2 – other significant observable inputs (including quoted prices for similar financial instruments, interest rates, prepayment speed, credit risk, etc.) |
| • | Level 3 – significant unobservable inputs (including the Fund’s own assumptions in determining the fair value of financial instruments) |
The input levels are not necessarily an indication of the risk or liquidity associated with financial instruments at that level.
For movements between the levels within the fair value hierarchy, the Fund has adopted a policy of recognizing the transfers as of the date of the underlying event which caused the movement.
| Semiannual Report | TD-23 |
FRANKLIN TEMPLETON VARIABLE INSURANCE PRODUCTS TRUST
NOTES TO FINANCIAL STATEMENTS (UNAUDITED)
Templeton Developing Markets VIP Fund (continued)
A summary of inputs used as of June 30, 2015, in valuing the Fund’s assets carried at fair value, is as follows:
| Level 1 | Level 2 | Level 3 | Total | |||||||||||||
| Assets: | ||||||||||||||||
Investments in Securities: | ||||||||||||||||
Equity Investments:a | ||||||||||||||||
Greece | $ | — | $ | 4,194,240 | $ | — | $ | 4,194,240 | ||||||||
Russia | — | 3,023,104 | — | 3,023,104 | ||||||||||||
All Other Equity Investmentsb | 305,712,616 | — | — | 305,712,616 | ||||||||||||
Participatory Notes | — | 3,316,493 | — | 3,316,493 | ||||||||||||
Short Term Investments | 22,975,019 | — | — | 22,975,019 | ||||||||||||
|
| |||||||||||||||
Total Investments in Securities | $ | 328,687,635 | $ | 10,533,837 | $ | — | $ | 339,221,472 | ||||||||
|
| |||||||||||||||
aIncludes common and preferred stocks.
bFor detailed categories, see the accompanying Statement of Investments.
10. New Accounting Pronouncements
In June 2014, the Financial Accounting Standards Board issued Accounting Standards Update (ASU) No. 2014-11, Transfers and Servicing (Topic 860), Repurchase-to-Maturity Transactions, Repurchase Financings, and Disclosures. The ASU changes the accounting for certain repurchase agreements and expands disclosure requirements related to repurchase agreements, securities lending, repurchase-to-maturity and similar transactions. The ASU is effective for certain transactions accounted for as a sale for interim and annual reporting periods beginning after December 15, 2014, and transactions accounted for as secured borrowings for annual periods beginning after December 15, 2014, and for interim periods beginning after March 15, 2015. Management has reviewed the requirements and believes the adoption of this ASU will not have a material impact on the financial statements.
11. Subsequent Events
The Fund has evaluated subsequent events through the issuance of the financial statements and determined that no events have occurred that require disclosure.
Abbreviations
| Selected Portfolio | ||
| ADR | American Depositary Receipt | |
| GDR | Global Depositary Receipt | |
| NVDR | Non-Voting Depository Receipt | |
| TD-24 | Semiannual Report |
FRANKLIN TEMPLETON VARIABLE INSURANCE PRODUCTS TRUST
Tax Information (unaudited)
Templeton Developing Markets VIP Fund
At December 31, 2014, more than 50% of the Fund’s total assets were invested in securities of foreign issuers. In most instances, foreign taxes were withheld from income paid to the Fund on these investments. As shown in the table below, the Fund hereby reports to shareholders the foreign source income and foreign taxes paid, pursuant to Section 853 of the Internal Revenue Code. This written statement will allow shareholders of record on June 12, 2015, to treat their proportionate share of foreign taxes paid by the Fund as having been paid directly by them. The shareholder shall consider these amounts as foreign taxes paid in the tax year in which they receive the Fund distribution.
The following table provides a detailed analysis of foreign tax paid, and foreign source income as reported by the Fund, to Class 1, Class 2 and Class 4 shareholders of record.
| Class | Foreign Tax Paid Per Share | Foreign Source Income Per Share | ||
Class 1 | $0.0236 | $0.2262 | ||
Class 2 | $0.0236 | $0.1999 | ||
Class 4 | $0.0236 | $0.1841 |
Foreign Tax Paid Per Share (Column 1) is the amount per share available to you, as a tax credit (assuming you held your shares in the Fund for a minimum of 16 days during the 31-day period beginning 15 days before the ex-dividend date of the Fund’s distribution to which the foreign taxes relate), or, as a tax deduction.
Foreign Source Income Per Share (Column 2) is the amount per share of income dividends attributable to foreign securities held by the Fund, plus any foreign taxes withheld on these dividends.
| Semiannual Report | TD-25 |
Templeton Foreign VIP Fund
This semiannual report for Templeton Foreign VIP Fund covers the period ended June 30, 2015.
Class 1 Performance Summary as of June 30, 2015
The Fund’s Class 1 shares delivered a +4.55% total return* for the six-month period ended June 30, 2015.
*The Fund has a fee waiver associated with any investment in a Franklin Templeton money fund, contractually guaranteed through at least its current fiscal year-end. Fund investment results reflect the fee waiver, to the extent applicable; without this reduction, the results would have been lower.
Performance reflects the Fund’s Class 1 operating expenses, but does not include any contract fees, expenses or sales charges. If they had been included, performance would be lower. These charges and deductions, particularly for variable life policies, can have a significant effect on contract values and insurance benefits. See the contract prospectus for a complete description of these expenses, including sales charges.
Performance data represent past performance, which does not guarantee future results. Investment return and principal value will fluctuate, and you may have a gain or loss when you sell your shares. Current performance may differ from figures shown.
| Semiannual Report | TF-1 |
TEMPLETON FOREIGN VIP FUND
Fund Goal and Main Investments
Templeton Foreign VIP Fund seeks long-term capital growth. Under normal market conditions, the Fund invests at least 80% of its net assets in investments of issuers located outside the U.S., including those in emerging markets.
Fund Risks
All investments involve risks, including possible loss of principal. Special risks are associated with foreign investing, including currency fluctuations, economic instability and political developments; investments in emerging markets involve heightened risks related to the same factors. In addition, smaller company stocks have historically experienced more price volatility than larger company stocks, especially over the short term. To the extent the Fund focuses on particular countries, regions, industries, sectors or types of investment from time to time, it may be subject to greater risks of adverse developments in such areas of focus than a fund that invests in a wider variety of countries, regions, industries, sectors or investments. The Fund is actively managed but there is no guarantee that the manager’s investment decisions will produce the desired results. The Fund’s prospectus also includes a description of the main investment risks.
Performance Overview
You can find the Fund’s six-month total return in the Performance Summary. In comparison, the Fund’s benchmark, the MSCI Europe, Australasia, Far East (EAFE) Index, produced a +5.88% total return for the same period.1 Please note, index performance information is provided for reference and we do not attempt to track the index but rather undertake investments on the basis of fundamental research.
Economic and Market Overview
The global economy expanded moderately during the six months under review despite slowing growth in some countries. As measured by the MSCI World Index, stocks in global developed markets advanced overall during the six-month period amid a generally accommodative monetary policy environment and signs of economic improvement in Europe and Japan. Oil prices rebounded from earlier lows as demand picked up despite rising inventories and strong global supply, while gold prices declined marginally during the period under review.
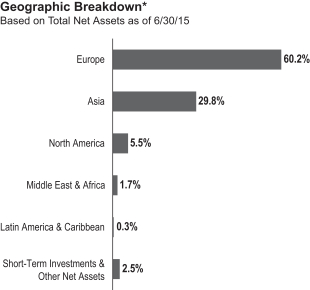
U.S. economic growth was mixed during the six months under review. In 2015’s first quarter, U.S. dollar strength, low energy prices, and a labor dispute at West Coast ports led exports to decline. In the second quarter, business capital spending rebounded and manufacturing and non-manufacturing activities increased, contributing to strong job gains. During the six-month period, the U.S. Federal Reserve Board (Fed) kept its target interest rate at 0%–0.25% while considering when an increase would be appropriate, based on labor market and inflation data. In its June meeting, the Fed lowered its economic growth forecast for 2015 and raised unemployment estimates given the weak start to the year.
Outside the U.S., the U.K. economy slowed in 2015’s first quarter as the mining and agriculture sectors contracted. Near period-end, the Conservative Party’s unexpected victory in the U.K. general elections supported investor sentiment. In the eurozone, economic growth improved somewhat during the six-month period. Spain expanded at a solid pace, and France and Italy returned to growth in 2015’s first quarter. However, Germany, the region’s largest economy, slowed during the first quarter amid sluggish exports. The region avoided deflation as the annual inflation rate rose in May. The European Central Bank (ECB) maintained its benchmark interest rates during the period and also expanded its asset purchases to boost inflation and the economy. The region generally benefited from a weaker euro that helped exports, the ECB’s accommodative policy and an improved 2015 eurozone growth forecast, but Greece’s debt situation remained a major concern.
1. Source: Morningstar.
One cannot invest directly in an index, and an index is not representative of the Fund’s portfolio. Please see Index Descriptions following the Fund Summaries.
| TF-2 | Semiannual Report |
TEMPLETON FOREIGN VIP FUND
The Japanese economy continued to grow in 2015’s first quarter after exiting recession in the previous quarter, driven by an increase in private demand as business investment and private consumption rose. The Bank of Japan maintained its monetary policy during the review period but lowered its economic growth and inflation forecasts at its April meeting.
In emerging markets, economic growth generally moderated. A ceasefire agreement between Russia and Ukraine helped emerging market stocks early in the period. However, Greece’s credit default due to the lack of progress in negotiations weighed on emerging market stocks toward period-end. China’s government implemented market-friendly policies to support new economic drivers that could help steer the economy toward more sustainable growth. Lower interest rates there fueled massive stock market speculation and a 60% price gain up to mid-June 2015 for the domestic A-share market.2 Concerned the market was overheated, the People’s Bank of China reduced liquidity, which led to a market panic in the last two weeks of June, exacerbated by certain government intervention measures. Central bank actions varied across emerging markets, as some banks raised interest rates in response to rising inflation and weakening currencies, while others lowered interest rates to promote economic growth. In the recent global environment, emerging market stocks, as measured by the MSCI Emerging Markets Index, rose for the six-month period.3
Investment Strategy
Our investment philosophy is bottom up, value oriented and long term. In choosing investments, we generally focus on the market price of a company’s securities relative to our evaluation of the company’s potential long-term earnings, asset value and cash flow. Among factors we consider are a company’s historical value measures, including price/earnings ratio, profit margins and liquidation value. We do in-depth research to construct a bargain list from which we buy.
Manager’s Discussion
Although the Fund’s performance for the six-month period lagged that of its benchmark, the MSCI EAFE Index, the Fund had several notable sector contributors. Stock selection in consumer staples aided the Fund’s relative results, notably food and staples retailer Tesco (U.K.).4 Tesco shares gained, despite the company’s huge fourth-quarter loss, based on expectations that
a new turnaround strategy the company adopted would help improve its market share and revenues. The firm’s sales increased in the first half of the period owing to generally falling grocery prices. Tesco’s first-quarter sales declined but beat market expectations, as transactions and sales volume rose compared with the previous fiscal year. Stock selection and positioning in energy overcame the negative effect of our overweighting and aided relative performance.5 Energy equipment and services company Petrofac (U.K.), oil and gas company Royal Dutch Shell (U.K.) and a position in oil explorer Dragon Oil (Turkmenistan)6 were particularly helpful. During the period, oil prices rebounded somewhat despite higher inventories and strong global supplies because of rising global demand. Toward period-end, a decline in U.S. inventories, a sharp drop in the number of active U.S. oil rigs and unrest in the Middle East also supported oil prices. Petrofac’s share price rose after it reported an increase in order backlog due to strong performance of its engineering and construction division and
| Top 10 Holdings | ||||
| 6/30/15 | ||||
| Company Sector/Industry, Country | % of Total Net Assets | |||
Samsung Electronics Co. Ltd. Technology Hardware, Storage & Peripherals, South Korea | 3.4% | |||
| Credit Suisse Group AG Capital Markets, Switzerland | 2.3% | |||
| BNP Paribas SA Banks, France | 2.3% | |||
| Tesco PLC Food & Staples Retailing, U.K. | 2.2% | |||
| Sanofi Pharmaceuticals, France | 2.1% | |||
| Roche Holding AG Pharmaceuticals, Switzerland | 2.1% | |||
| Hana Financial Group Inc. Banks, South Korea | 2.0% | |||
| GlaxoSmithKline PLC Pharmaceuticals, U.K. | 1.9% | |||
| Nissan Motor Co. Ltd. Automobiles, Japan | 1.9% | |||
| AXA SA Insurance, France | 1.8% | |||
The dollar value, number of shares or principal amount, and names of all portfolio holdings are listed in the Fund’s Statement of Investments (SOI).
2. Source: MSCI. Please see Index Descriptions following the Fund Summaries.
3. Please see Index Descriptions following the Fund Summaries.
4. The consumer staples sector comprises beverages and food and staples retailing in the SOI.
5. The energy sector comprises energy equipment and services; and oil, gas and consumable fuels in the SOI.
6. Not part of the index.
| Semiannual Report | TF-3 |
TEMPLETON FOREIGN VIP FUND
based on news that its high-cost flagship North Sea project was nearing completion. Other individual contributors included Japanese firms Nissan Motor, ITOCHU and Capcom.6 Also notably aiding relative performance was a lack of exposure to utilities, as that sector underperformed the index.
In contrast, stock selection in financials, especially banks and insurance companies, hindered Fund performance.7 Among the sector’s major detractors were the Fund’s investments in Hana Financial Group (South Korea)6 and ACE (U.S.).6 Stock selection in industrials, including German aviation company Deutsche Lufthansa, also hampered relative performance.8 Lufthansa’s share price fell after it canceled its dividend due to weak full-year 2014 earnings, which were hurt by the sale of its information technology (IT) unit, a wrong-way bet on fuel prices and an increase in its pension liabilities. The crash of a plane operated by Germanwings, Lufthansa’s budget airline, also hurt the aviation company’s stock price. Stock selection in IT, particularly the Fund’s position in Samsung Electronics (South Korea),6 hindered relative performance.9 Samsung’s full-year 2014 and first-quarter 2015 earnings declined, reflecting a slowdown in its mobile phone sales due to rising competition from Apple and low-cost rivals. The company adopted a series of measures to boost growth, including the implementation of its own operating system and introduction of its proprietary mobile payment system. The company also adopted cost-cutting measures to compete with its rivals’ expanding market share. An underweighted allocation and stock selection in the consumer discretionary sector hurt the Fund’s relative performance.10 The sector’s top detractors included investments in auto parts maker Hyundai Mobis6 and automobile maker Hyundai Motor,6 both based in South Korea.6 Other individual detractors included the Fund’s investments in steel manufacturer POSCO (South Korea),6 oil company Suncor Energy (Canada)6 and oilfield services company Trican Well Service (Canada).6 POSCO’s share price declined after news that a major shareholder sold its stake. Highlighting POSCO’s weak credit quality, international credit rating agency Moody’s Investors Service revised its outlook on the company to negative from stable.
From a geographic perspective, stock selection in Europe, primarily investments in the U.K., Switzerland, Spain and France, contributed to the Fund’s performance. A lack of exposure to Australia, which underperformed the index, helped relative results. Exposure to Turkmenistan6 and an overweighted allocation to China also aided returns. In contrast, stock selection in Asia detracted from relative returns. Our allocation in North America,6 especially in Canadian energy companies, also hurt relative performance.
It is important to recognize the effect of currency movements on the Fund’s performance. In general, if the value of the U.S. dollar goes up compared with a foreign currency, an investment traded in that foreign currency will go down in value because it will be worth fewer U.S. dollars. This can have a negative effect on Fund performance. Conversely, when the U.S. dollar weakens in relation to a foreign currency, an investment traded in that foreign currency will increase in value, which can contribute to Fund performance. For the six months ended June 30, 2015, the U.S. dollar appreciated in value relative to many currencies in which the Fund’s investments were traded. As a result, the Fund’s performance was negatively affected by the portfolio’s investment predominantly in securities with non-U.S. currency exposure.
Thank you for your participation in Templeton Foreign VIP Fund. We look forward to serving your future investment needs.
The foregoing information reflects our analysis, opinions and portfolio holdings as of June 30, 2015, the end of the reporting period. The way we implement our main investment strategies and the resulting portfolio holdings may change depending on factors such as market and economic conditions. These opinions may not be relied upon as investment advice or an offer for a particular security. The information is not a complete analysis of every aspect of any market, country, industry, security or the Fund. Statements of fact are from sources considered reliable, but the investment manager makes no representation or warranty as to their completeness or accuracy. Although historical performance is no guarantee of future results, these insights may help you understand our investment management philosophy.
7. The financials sector comprises banks, capital markets, diversified financial services and insurance in the SOI.
8. The industrials sector comprises aerospace and defense, airlines, building products, construction and engineering, electrical equipment, industrial conglomerates, and trading companies and distributors in the SOI.
9. The information technology sector comprises electronic equipment, instruments and components; semiconductors and semiconductor equipment; software; and technology hardware, storage and peripherals in the SOI.
10. The consumer discretionary sector comprises auto components, automobiles, multiline retail and specialty retail in the SOI.
| TF-4 | Semiannual Report |
TEMPLETON FOREIGN VIP FUND
Class 1 Fund Expenses
As an investor in a variable insurance contract (Contract) that indirectly provides for investment in an underlying mutual fund, you can incur transaction and/or ongoing expenses at both the Fund level and the Contract level.
| • | Transaction expenses can include sales charges (loads) on purchases, surrender fees, transfer fees and premium taxes. |
| • | Ongoing expenses can include management fees, distribution and service (12b-1) fees, contract fees, annual maintenance fees, mortality and expense risk fees and other fees and expenses. All mutual funds and Contracts have some types of ongoing expenses. |
The expenses shown in the table are meant to highlight ongoing expenses at the Fund level only and do not include ongoing expenses at the Contract level, or transaction expenses at either the Fund or Contract levels. While the Fund does not have transaction expenses, if the transaction and ongoing expenses at the Contract level were included, the expenses shown below would be higher. You should consult your Contract prospectus or disclosure document for more information.
The table shows Fund-level ongoing expenses and can help you understand these expenses and compare them with those of other mutual funds offered through the Contract. The table assumes a $1,000 investment held for the six months indicated. Please refer to the Fund prospectus for additional information on operating expenses.
Actual Fund Expenses
The first line (Actual) of the table provides actual account values and expenses. The “Ending Account Value” is derived from the Fund’s actual return, which includes the effect of ongoing Fund expenses, but does not include the effect of ongoing Contract expenses.
You can estimate the Fund-level expenses you incurred during the period by following these steps. Of course, your account value and expenses will differ from those in this illustration:
| 1. | Divide your account value by $1,000. |
If an account had an $8,600 value, then $8,600 ÷ $1,000 = 8.6.
| 2. | Multiply the result by the number under the heading “Fund-Level Expenses Incurred During Period.” |
If Fund-Level Expenses Incurred During Period were $7.50, then 8.6 × $7.50 = $64.50.
In this illustration, the estimated expenses incurred this period at the Fund level are $64.50.
Hypothetical Example for Comparison with Other Mutual Funds
Information in the second line (Hypothetical) of the table can help you compare ongoing expenses of the Fund with those of other mutual funds offered through the Contract. This information may not be used to estimate the actual ending account balance or expenses you incurred during the period. The hypothetical “Ending Account Value” is based on the Fund’s actual expense ratio and an assumed 5% annual rate of return before expenses, which does not represent the Fund’s actual return. The figure under the heading “Fund-Level Expenses Incurred During Period” shows the hypothetical expenses your account would have incurred under this scenario. You can compare this figure with the 5% hypothetical examples that appear in shareholder reports of other funds offered through a Contract.
| Class 1 | Beginning Account Value 1/1/15 | Ending Account Value 6/30/15 | Fund-Level Expenses 1/1/15–6/30/15 | |||||||||
Actual | $1,000 | $1,045.50 | $3.91 | |||||||||
Hypothetical (5% return before expenses) | $1,000 | $1,020.98 | $3.86 | |||||||||
*Expenses are calculated using the most recent six-month annualized expense ratio, net of expense waivers, for the Fund’s Class 1 shares (0.77%), which does not include any ongoing expenses of the Contract for which the Fund is an investment option, multiplied by the average account value over the period, multiplied by 181/365 to reflect the one-half year period.
| Semiannual Report | TF-5 |
FRANKLIN TEMPLETON VARIABLE INSURANCE PRODUCTS TRUST
Financial Highlights
Templeton Foreign VIP Fund
| Six Months Ended June 30, 2015 (unaudited) | Year Ended December 31, | |||||||||||||||||||||||
| 2014 | 2013 | 2012 | 2011 | 2010 | ||||||||||||||||||||
| Class 1 | ||||||||||||||||||||||||
| Per share operating performance (for a share outstanding throughout the period) | ||||||||||||||||||||||||
Net asset value, beginning of period | $15.34 | $17.56 | $14.63 | $12.78 | $14.54 | $13.68 | ||||||||||||||||||
|
| |||||||||||||||||||||||
| Income from investment operationsa: | ||||||||||||||||||||||||
Net investment incomeb | 0.23 | 0.53 | c | 0.34 | 0.38 | 0.42 | 0.28 | |||||||||||||||||
Net realized and unrealized gains (losses) | 0.48 | (2.39 | ) | 3.00 | 1.91 | (1.90 | ) | 0.86 | ||||||||||||||||
|
| |||||||||||||||||||||||
Total from investment operations | 0.71 | (1.86 | ) | 3.34 | 2.29 | (1.48 | ) | 1.14 | ||||||||||||||||
|
| |||||||||||||||||||||||
| Less distributions from: | ||||||||||||||||||||||||
Net investment income | (0.53 | ) | (0.36 | ) | (0.41 | ) | (0.44 | ) | (0.28 | ) | (0.28 | ) | ||||||||||||
Net realized gains | (0.50 | ) | — | — | — | — | — | |||||||||||||||||
|
| |||||||||||||||||||||||
Total distributions | (1.03 | ) | (0.36 | ) | (0.41 | ) | (0.44 | ) | (0.28 | ) | (0.28 | ) | ||||||||||||
|
| |||||||||||||||||||||||
Redemption fees | — | — | d | — | d | — | d | — | d | — | d | |||||||||||||
|
| |||||||||||||||||||||||
Net asset value, end of period | $15.02 | $15.34 | $17.56 | $14.63 | $12.78 | $14.54 | ||||||||||||||||||
|
| |||||||||||||||||||||||
Total returne | 4.55% | (10.89)% | 23.27% | 18.60% | (10.44)% | 8.67% | ||||||||||||||||||
| Ratios to average net assetsf | ||||||||||||||||||||||||
Expenses before waiver and payments by affiliates | 0.78% | 0.77% | 0.78% | 0.79% | 0.79% | 0.78% | ||||||||||||||||||
Expenses net of waiver and payments by affiliates | 0.77% | 0.77% | g | 0.78% | 0.79% | 0.79% | h | 0.78% | h | |||||||||||||||
Net investment income | 2.92% | 3.11% | c | 2.16% | 2.84% | 2.92% | 2.10% | |||||||||||||||||
| Supplemental data | ||||||||||||||||||||||||
Net assets, end of period (000’s) | $248,969 | $248,355 | $298,468 | $265,924 | $254,292 | $321,282 | ||||||||||||||||||
Portfolio turnover rate | 6.91% | 25.71% | 23.61% | 12.53% | 21.09% | 19.16% | ||||||||||||||||||
aThe amount shown for a share outstanding throughout the period may not correlate with the Statement of Operations for the period due to the timing of sales and repurchases of the Fund’s shares in relation to income earned and/or fluctuating fair value of the investments of the Fund.
bBased on average daily shares outstanding.
cNet investment income per share includes approximately $0.16 per share received in the form of a special dividend paid in connection with certain Fund holdings. Excluding this amount, the ratio of net investment income to average net assets would have been 2.13%.
dAmount rounds to less than $0.01 per share.
eTotal return does not include fees, charges or expenses imposed by the variable annuity and life insurance contracts for which Franklin Templeton Variable Insurance Products Trust serves as an underlying investment vehicle. Total return is not annualized for periods less than one year.
fRatios are annualized for periods less than one year.
gBenefit of waiver and payments by affiliates rounds to less than 0.01%.
hBenefit of expense reduction rounds to less than 0.01%.
| TF-6 | Semiannual Report | The accompanying notes are an integral part of these financial statements. |
FRANKLIN TEMPLETON VARIABLE INSURANCE PRODUCTS TRUST
FINANCIAL HIGHLIGHTS
Templeton Foreign VIP Fund (continued)
Six Months Ended (unaudited) | Year Ended December 31, | |||||||||||||||||||||||
| 2014 | 2013 | 2012 | 2011 | 2010 | ||||||||||||||||||||
| Class 2 | ||||||||||||||||||||||||
Per share operating performance (for a share outstanding throughout the period) | ||||||||||||||||||||||||
Net asset value, beginning of period | $15.05 | $17.24 | $14.37 | $12.56 | $14.29 | $13.45 | ||||||||||||||||||
|
| |||||||||||||||||||||||
| Income from investment operationsa: | ||||||||||||||||||||||||
Net investment incomeb | 0.21 | 0.48 | c | 0.30 | 0.34 | 0.37 | 0.25 | |||||||||||||||||
Net realized and unrealized gains (losses) | 0.48 | (2.35 | ) | 2.94 | 1.87 | (1.86 | ) | 0.84 | ||||||||||||||||
|
| |||||||||||||||||||||||
Total from investment operations | 0.69 | (1.87 | ) | 3.24 | 2.21 | (1.49 | ) | 1.09 | ||||||||||||||||
|
| |||||||||||||||||||||||
| Less distributions from: | ||||||||||||||||||||||||
Net investment income | (0.49 | ) | (0.32 | ) | (0.37 | ) | (0.40 | ) | (0.24 | ) | (0.25 | ) | ||||||||||||
Net realized gains | (0.50 | ) | — | — | — | — | — | |||||||||||||||||
|
| |||||||||||||||||||||||
Total distributions | (0.99 | ) | (0.32 | ) | (0.37 | ) | (0.40 | ) | (0.24 | ) | (0.25 | ) | ||||||||||||
|
| |||||||||||||||||||||||
Redemption fees | — | — | d | — | d | — | d | — | d | — | d | |||||||||||||
|
| |||||||||||||||||||||||
Net asset value, end of period | $14.75 | $15.05 | $17.24 | $14.37 | $12.56 | $14.29 | ||||||||||||||||||
|
| |||||||||||||||||||||||
Total returne | 4.49% | (11.13)% | 22.97% | 18.23% | (10.63)% | 8.41% | ||||||||||||||||||
| Ratios to average net assetsf | ||||||||||||||||||||||||
Expenses before waiver and payments by affiliates | 1.03% | 1.02% | 1.03% | 1.04% | 1.04% | 1.03% | ||||||||||||||||||
Expenses net of waiver and payments by affiliates | 1.02% | 1.02% | g | 1.03% | 1.04% | 1.04% | h | 1.03% | h | |||||||||||||||
Net investment income | 2.67% | 2.86% | c | 1.91% | 2.59% | 2.67% | 1.85% | |||||||||||||||||
| Supplemental data | ||||||||||||||||||||||||
Net assets, end of period (000’s) | $1,645,639 | $1,645,571 | $1,873,586 | $1,744,231 | $1,679,412 | $2,090,757 | ||||||||||||||||||
Portfolio turnover rate | 6.91% | 25.71% | 23.61% | 12.53% | 21.09% | 19.16% | ||||||||||||||||||
aThe amount shown for a share outstanding throughout the period may not correlate with the Statement of Operations for the period due to the timing of sales and repurchases of the Fund’s shares in relation to income earned and/or fluctuating fair value of the investments of the Fund.
bBased on average daily shares outstanding.
cNet investment income per share includes approximately $0.16 per share received in the form of a special dividend paid in connection with certain Fund holdings. Excluding this amount, the ratio of net investment income to average net assets would have been 1.88%.
dAmount rounds to less than $0.01 per share.
eTotal return does not include fees, charges or expenses imposed by the variable annuity and life insurance contracts for which Franklin Templeton Variable Insurance Products Trust serves as an underlying investment vehicle. Total return is not annualized for periods less than one year.
fRatios are annualized for periods less than one year.
gBenefit of waiver and payments by affiliates rounds to less than 0.01%.
hBenefit of expense reduction rounds to less than 0.01%.
| The accompanying notes are an integral part of these financial statements. | Semiannual Report | TF-7 |
FRANKLIN TEMPLETON VARIABLE INSURANCE PRODUCTS TRUST
FINANCIAL HIGHLIGHTS
Templeton Foreign VIP Fund (continued)
Six Months Ended (unaudited) | Year Ended December 31, | |||||||||||||||||||||||
| 2014 | 2013 | 2012 | 2011 | 2010 | ||||||||||||||||||||
| Class 4 | ||||||||||||||||||||||||
| Per share operating performance (for a share outstanding throughout the period) | ||||||||||||||||||||||||
Net asset value, beginning of period | $15.16 | $17.37 | $14.48 | $12.66 | $14.43 | $13.59 | ||||||||||||||||||
|
| |||||||||||||||||||||||
| Income from investment operationsa: | ||||||||||||||||||||||||
Net investment incomeb | 0.20 | 0.46 | c | 0.28 | 0.33 | 0.36 | 0.17 | |||||||||||||||||
Net realized and unrealized gains (losses) | 0.48 | (2.36 | ) | 2.97 | 1.89 | (1.88 | ) | 0.92 | ||||||||||||||||
|
| |||||||||||||||||||||||
Total from investment operations | 0.68 | (1.90 | ) | 3.25 | 2.22 | (1.52 | ) | 1.09 | ||||||||||||||||
|
| |||||||||||||||||||||||
| Less distributions from: | ||||||||||||||||||||||||
Net investment income | (0.48 | ) | (0.31 | ) | (0.36 | ) | (0.40 | ) | (0.25 | ) | (0.25 | ) | ||||||||||||
Net realized gains | (0.50 | ) | — | — | — | — | — | |||||||||||||||||
|
| |||||||||||||||||||||||
Total distributions | (0.98 | ) | (0.31 | ) | (0.36 | ) | (0.40 | ) | (0.25 | ) | (0.25 | ) | ||||||||||||
|
| |||||||||||||||||||||||
Redemption fees | — | — | d | — | d | — | d | — | d | — | d | |||||||||||||
|
| |||||||||||||||||||||||
Net asset value, end of period | $14.86 | $15.16 | $17.37 | $14.48 | $12.66 | $14.43 | ||||||||||||||||||
|
| |||||||||||||||||||||||
Total returne | 4.38% | (11.22)% | 22.86% | 18.14% | (10.74)% | 8.38% | ||||||||||||||||||
| Ratios to average net assetsf | ||||||||||||||||||||||||
Expenses before waiver and payments by affiliates | 1.13% | 1.12% | 1.13% | 1.14% | 1.14% | 1.13% | ||||||||||||||||||
Expenses net of waiver and payments by affiliates | 1.12% | 1.12% | g | 1.13% | 1.14% | 1.14% | h | 1.13% | h | |||||||||||||||
Net investment income | 2.57% | 2.76% | c | 1.81% | 2.49% | 2.57% | 1.75% | |||||||||||||||||
| Supplemental data | ||||||||||||||||||||||||
Net assets, end of period (000’s) | $503,357 | $503,143 | $513,098 | $416,277 | $353,346 | $305,505 | ||||||||||||||||||
Portfolio turnover rate | 6.91% | 25.71% | 23.61% | 12.53% | 21.09% | 19.16% | ||||||||||||||||||
aThe amount shown for a share outstanding throughout the period may not correlate with the Statement of Operations for the period due to the timing of sales and repurchases of the Fund’s shares in relation to income earned and/or fluctuating fair value of the investments of the Fund.
bBased on average daily shares outstanding.
cNet investment income per share includes approximately $0.16 per share received in the form of a special dividend paid in connection with certain Fund holdings. Excluding this amount, the ratio of net investment income to average net assets would have been 1.78%.
dAmount rounds to less than $0.01 per share.
eTotal return does not include fees, charges or expenses imposed by the variable annuity and life insurance contracts for which Franklin Templeton Variable Insurance Products Trust serves as an underlying investment vehicle. Total return is not annualized for periods less than one year.
fRatios are annualized for periods less than one year.
gBenefit of waiver and payments by affiliates rounds to less than 0.01%.
hBenefit of expense reduction rounds to less than 0.01%.
| TF-8 | Semiannual Report | The accompanying notes are an integral part of these financial statements. |
FRANKLIN TEMPLETON VARIABLE INSURANCE PRODUCTS TRUST
Statement of Investments, June 30, 2015 (unaudited)
Templeton Foreign VIP Fund
| ||||||||||||||
| Country | Shares | Value | ||||||||||||
Common Stocks 97.5% | ||||||||||||||
Aerospace & Defense 1.0% | ||||||||||||||
BAE Systems PLC | United Kingdom | 3,443,320 | $ | 24,407,466 | ||||||||||
|
| |||||||||||||
Airlines 0.7% | ||||||||||||||
| a | Deutsche Lufthansa AG | Germany | 1,207,980 | 15,569,188 | ||||||||||
|
| |||||||||||||
Auto Components 2.3% | ||||||||||||||
Cie Generale des Etablissements Michelin, B | France | 301,290 | 31,559,271 | |||||||||||
Hyundai Mobis Co. Ltd. | South Korea | 118,532 | 22,443,628 | |||||||||||
|
| |||||||||||||
| 54,002,899 | ||||||||||||||
|
| |||||||||||||
Automobiles 3.4% | ||||||||||||||
Hero Motocorp Ltd. | India | 178,802 | 7,099,113 | |||||||||||
Hyundai Motor Co. | South Korea | 100,134 | 12,163,038 | |||||||||||
Nissan Motor Co. Ltd. | Japan | 4,327,500 | 45,081,808 | |||||||||||
| b | Toyota Motor Corp., ADR | Japan | 136,317 | 18,232,399 | ||||||||||
|
| |||||||||||||
| 82,576,358 | ||||||||||||||
| �� |
|
| ||||||||||||
Banks 14.9% | ||||||||||||||
Bangkok Bank PCL, fgn. | Thailand | 2,994,500 | 15,809,472 | |||||||||||
Barclays PLC | United Kingdom | 5,471,520 | 22,391,951 | |||||||||||
BNP Paribas SA | France | 898,450 | 54,219,182 | |||||||||||
DBS Group Holdings Ltd. | Singapore | 929,520 | 14,278,542 | |||||||||||
Hana Financial Group Inc. | South Korea | 1,820,051 | 47,222,752 | |||||||||||
HSBC Holdings PLC | United Kingdom | 4,015,600 | 36,391,723 | |||||||||||
ING Groep NV, IDR | Netherlands | 1,898,874 | 31,340,924 | |||||||||||
KB Financial Group Inc., ADR | South Korea | 1,189,645 | 39,103,631 | |||||||||||
Societe Generale SA | France | 391,870 | 18,285,446 | |||||||||||
Standard Chartered PLC | United Kingdom | 1,546,140 | 24,751,368 | |||||||||||
UniCredit SpA | Italy | 5,333,111 | 35,809,501 | |||||||||||
United Overseas Bank Ltd. | Singapore | 985,000 | 16,871,297 | |||||||||||
|
| |||||||||||||
| 356,475,789 | ||||||||||||||
|
| |||||||||||||
Beverages 0.6% | ||||||||||||||
Suntory Beverage & Food Ltd. | Japan | 377,600 | 15,040,444 | |||||||||||
|
| |||||||||||||
Building Products 1.0% | ||||||||||||||
Compagnie de Saint-Gobain | France | 527,310 | 23,665,094 | |||||||||||
|
| |||||||||||||
Capital Markets 2.8% | ||||||||||||||
Credit Suisse Group AG | Switzerland | 1,976,558 | 54,323,111 | |||||||||||
GAM Holding Ltd. | Switzerland | 639,660 | 13,441,684 | |||||||||||
|
| |||||||||||||
| 67,764,795 | ||||||||||||||
|
| |||||||||||||
Chemicals 1.0% | ||||||||||||||
Akzo Nobel NV | Netherlands | 323,170 | 23,507,435 | |||||||||||
|
| |||||||||||||
Construction & Engineering 1.4% | ||||||||||||||
Carillion PLC | United Kingdom | 3,750,730 | 20,146,106 | |||||||||||
Sinopec Engineering Group Co. Ltd. | China | 15,049,000 | 13,939,203 | |||||||||||
|
| |||||||||||||
| 34,085,309 | ||||||||||||||
|
| |||||||||||||
Construction Materials 1.0% | ||||||||||||||
CRH PLC | Ireland | 811,570 | 22,900,780 | |||||||||||
|
| |||||||||||||
Diversified Financial Services 1.8% | ||||||||||||||
BM&F BOVESPA SA | Brazil | 2,189,700 | 8,251,064 | |||||||||||
Deutsche Boerse AG | Germany | 419,350 | 34,700,337 | |||||||||||
|
| |||||||||||||
| 42,951,401 | ||||||||||||||
|
| |||||||||||||
| Semiannual Report | TF-9 |
FRANKLIN TEMPLETON VARIABLE INSURANCE PRODUCTS TRUST
STATEMENT OF INVESTMENTS (UNAUDITED)
Templeton Foreign VIP Fund (continued)
| Country | Shares | Value | ||||||||||||
Common Stocks (continued) | ||||||||||||||
Diversified Telecommunication Services 4.1% | ||||||||||||||
China Telecom Corp. Ltd., H | China | 52,438,357 | $ | 30,779,838 | ||||||||||
Singapore Telecommunications Ltd. | Singapore | 4,671,000 | 14,600,126 | |||||||||||
| b | Telefonica SA, ADR | Spain | 2,270,951 | 32,247,504 | ||||||||||
Telenor ASA | Norway | 928,054 | 20,333,192 | |||||||||||
|
| |||||||||||||
| 97,960,660 | ||||||||||||||
|
| |||||||||||||
Electrical Equipment 0.7% | ||||||||||||||
ABB Ltd. | Switzerland | 838,920 | 17,566,093 | |||||||||||
|
| |||||||||||||
Electronic Equipment, Instruments & Components 0.9% | ||||||||||||||
| a | Flextronics International Ltd. | Singapore | 155,274 | 1,756,149 | ||||||||||
Kingboard Chemical Holdings Ltd. | Hong Kong | 11,646,000 | 20,192,119 | |||||||||||
|
| |||||||||||||
| 21,948,268 | ||||||||||||||
|
| |||||||||||||
Energy Equipment & Services 7.1% | ||||||||||||||
Ensign Energy Services Inc. | Canada | 1,965,300 | 19,259,625 | |||||||||||
Petrofac Ltd. | United Kingdom | 2,312,160 | 33,617,895 | |||||||||||
Precision Drilling Corp. | Canada | 3,553,800 | 23,900,656 | |||||||||||
| a | SBM Offshore NV | Netherlands | 2,815,920 | 33,359,088 | ||||||||||
Subsea 7 SA | United Kingdom | 1,397,990 | 13,683,324 | |||||||||||
Technip SA | France | 604,680 | 37,414,130 | |||||||||||
Trican Well Service Ltd. | Canada | 2,373,000 | 7,884,668 | |||||||||||
|
| |||||||||||||
| 169,119,386 | ||||||||||||||
|
| |||||||||||||
Food & Staples Retailing 2.8% | ||||||||||||||
Metro AG | Germany | 489,650 | 15,432,126 | |||||||||||
Tesco PLC | United Kingdom | 15,808,630 | 52,787,556 | |||||||||||
|
| |||||||||||||
| 68,219,682 | ||||||||||||||
|
| |||||||||||||
Health Care Equipment & Supplies 0.7% | ||||||||||||||
Getinge AB, B | Sweden | 737,270 | 17,737,477 | |||||||||||
|
| |||||||||||||
Health Care Providers & Services 1.7% | ||||||||||||||
Shanghai Pharmaceuticals Holding Co. Ltd., H | China | 6,434,800 | 17,930,593 | |||||||||||
Sinopharm Group Co. | China | 5,059,200 | 22,451,540 | |||||||||||
|
| |||||||||||||
| 40,382,133 | ||||||||||||||
|
| |||||||||||||
Industrial Conglomerates 1.4% | ||||||||||||||
CK Hutchison Holdings Ltd. | Hong Kong | 676,877 | 9,989,451 | |||||||||||
Siemens AG | Germany | 233,124 | 23,473,386 | |||||||||||
|
| |||||||||||||
| 33,462,837 | ||||||||||||||
|
| |||||||||||||
Insurance 7.9% | ||||||||||||||
ACE Ltd. | United States | 307,649 | 31,281,750 | |||||||||||
Aegon NV | Netherlands | 4,446,700 | 32,667,479 | |||||||||||
Aviva PLC | United Kingdom | 3,200,110 | 24,759,813 | |||||||||||
AXA SA | France | 1,685,708 | 42,513,562 | |||||||||||
China Life Insurance Co. Ltd., H | China | 4,946,000 | 21,438,739 | |||||||||||
Muenchener Rueckversicherungs-Gesellschaft AG | Germany | 68,060 | 12,060,065 | |||||||||||
NN Group NV | Netherlands | 453,400 | 12,740,928 | |||||||||||
Swiss Re AG | Switzerland | 130,190 | 11,520,931 | |||||||||||
|
| |||||||||||||
| 188,983,267 | ||||||||||||||
|
| |||||||||||||
Life Sciences Tools & Services 1.9% | ||||||||||||||
Lonza Group AG | Switzerland | 121,930 | 16,286,019 | |||||||||||
| a | MorphoSys AG | Germany | 116,110 | 8,330,694 | ||||||||||
| TF-10 | Semiannual Report |
FRANKLIN TEMPLETON VARIABLE INSURANCE PRODUCTS TRUST
STATEMENT OF INVESTMENTS (UNAUDITED)
Templeton Foreign VIP Fund (continued)
| Country | Shares | Value | ||||||||||||
Common Stocks (continued) | ||||||||||||||
Life Sciences Tools & Services (continued) | ||||||||||||||
| a | QIAGEN NV | Netherlands | 807,901 | $ | 19,839,549 | |||||||||
|
| |||||||||||||
| 44,456,262 | ||||||||||||||
|
| |||||||||||||
Metals & Mining 2.1% | ||||||||||||||
HudBay Minerals Inc. | Canada | 2,891,000 | 24,072,378 | |||||||||||
POSCO | South Korea | 136,907 | 27,390,204 | |||||||||||
|
| |||||||||||||
| 51,462,582 | ||||||||||||||
|
| |||||||||||||
Multiline Retail 1.7% | ||||||||||||||
Marks & Spencer Group PLC | United Kingdom | 4,756,720 | 40,054,248 | |||||||||||
|
| |||||||||||||
Oil, Gas & Consumable Fuels 7.8% | ||||||||||||||
BP PLC | United Kingdom | 5,463,315 | 36,060,921 | |||||||||||
Dragon Oil PLC | Turkmenistan | 1,624,250 | 18,525,320 | |||||||||||
Eni SpA | Italy | 1,319,747 | 23,415,009 | |||||||||||
Kunlun Energy Co. Ltd. | China | 9,072,000 | 9,233,915 | |||||||||||
LUKOIL Holdings, ADR | Russia | 160,535 | 7,064,343 | |||||||||||
Royal Dutch Shell PLC, A | United Kingdom | 16,803 | 471,592 | |||||||||||
Royal Dutch Shell PLC, B | United Kingdom | 1,094,263 | 31,063,907 | |||||||||||
Suncor Energy Inc. | Canada | 901,700 | 24,834,652 | |||||||||||
Total SA, B | France | 763,826 | 37,088,783 | |||||||||||
|
| |||||||||||||
| 187,758,442 | ||||||||||||||
|
| |||||||||||||
Pharmaceuticals 11.6% | ||||||||||||||
Bayer AG | Germany | 212,040 | 29,668,467 | |||||||||||
GlaxoSmithKline PLC | United Kingdom | 2,246,815 | 46,680,898 | |||||||||||
Merck KGaA | Germany | 233,460 | 23,254,844 | |||||||||||
Novartis AG | Switzerland | 252,140 | 24,847,290 | |||||||||||
Roche Holding AG | Switzerland | 179,480 | 50,287,413 | |||||||||||
Sanofi | France | 513,135 | 50,461,218 | |||||||||||
Teva Pharmaceutical Industries Ltd., ADR | Israel | 712,823 | 42,127,839 | |||||||||||
UCB SA | Belgium | 160,740 | 11,534,612 | |||||||||||
|
| |||||||||||||
| 278,862,581 | ||||||||||||||
|
| |||||||||||||
Semiconductors & Semiconductor Equipment 1.9% | ||||||||||||||
| a | GCL-Poly Energy Holdings Ltd. | China | 138,306,000 | 31,937,425 | ||||||||||
Infineon Technologies AG | Germany | 1,103,225 | 13,684,214 | |||||||||||
|
| |||||||||||||
| 45,621,639 | ||||||||||||||
|
| |||||||||||||
Software 0.8% | ||||||||||||||
Capcom Co. Ltd. | Japan | 952,900 | 18,460,053 | |||||||||||
|
| |||||||||||||
Specialty Retail 1.3% | ||||||||||||||
Kingfisher PLC | United Kingdom | 5,856,576 | 31,953,967 | |||||||||||
|
| |||||||||||||
Technology Hardware, Storage & Peripherals 4.5% | ||||||||||||||
CANON Inc. | Japan | 521,800 | 16,979,071 | |||||||||||
Konica Minolta Inc. | Japan | 864,300 | 10,091,386 | |||||||||||
Samsung Electronics Co. Ltd. | South Korea | 71,408 | 80,870,051 | |||||||||||
|
| |||||||||||||
| 107,940,508 | ||||||||||||||
|
| |||||||||||||
Trading Companies & Distributors 2.0% | ||||||||||||||
Daewoo International Corp. | South Korea | 496,809 | 11,448,030 | |||||||||||
ITOCHU Corp. | Japan | 2,838,600 | 37,503,196 | |||||||||||
|
| |||||||||||||
| 48,951,226 | ||||||||||||||
|
| |||||||||||||
| Semiannual Report | TF-11 |
FRANKLIN TEMPLETON VARIABLE INSURANCE PRODUCTS TRUST
STATEMENT OF INVESTMENTS (UNAUDITED)
Templeton Foreign VIP Fund (continued)
| Country | Shares | Value | ||||||||||||
Common Stocks (continued) | ||||||||||||||
Wireless Telecommunication Services 2.7% | ||||||||||||||
China Mobile Ltd. | China | 1,340,500 | $ | 17,189,334 | ||||||||||
SoftBank Group Corp. | Japan | 477,500 | 28,125,643 | |||||||||||
Vodafone Group PLC, ADR | United Kingdom | 549,982 | 20,046,844 | |||||||||||
|
| |||||||||||||
| 65,361,821 | ||||||||||||||
|
| |||||||||||||
Total Common Stocks (Cost $2,110,115,310) | 2,339,210,090 | |||||||||||||
|
| |||||||||||||
Short Term Investments 3.0% | ||||||||||||||
Money Market Funds (Cost $58,616,745) 2.5% | ||||||||||||||
| a,c | Institutional Fiduciary Trust Money Market Portfolio | United States | 58,616,745 | 58,616,745 | ||||||||||
|
| |||||||||||||
| d | Investments from Cash Collateral Received for Loaned Securities (Cost $11,088,700) 0.5% | |||||||||||||
Money Market Funds 0.5% | ||||||||||||||
| a,c | Institutional Fiduciary Trust Money Market Portfolio | United States | 11,088,700 | 11,088,700 | ||||||||||
|
| |||||||||||||
Total Investments (Cost $2,179,820,755) 100.5% | 2,408,915,535 | |||||||||||||
Other Assets, less Liabilities (0.5)% | (10,949,941 | ) | ||||||||||||
|
| |||||||||||||
Net Assets 100.0% | $ | 2,397,965,594 | ||||||||||||
|
| |||||||||||||
See Abbreviations on page TF-22.
aNon-income producing.
bA portion or all of the security is on loan at June 30, 2015. See Note 1(c).
cSee Note 3(e) regarding investments in Institutional Fiduciary Trust Money Market Portfolio.
dSee Note 1(c) regarding securities on loan.
| TF-12 | Semiannual Report | The accompanying notes are an integral part of these financial statements. |
FRANKLIN TEMPLETON VARIABLE INSURANCE PRODUCTS TRUST
Financial Statements
Statement of Assets and Liabilities
June 30, 2015 (unaudited)
| Templeton Foreign VIP Fund | ||||
Assets: | ||||
Investments in securities: | ||||
Cost - Unaffiliated issuers | $ | 2,110,115,310 | ||
Cost - Sweep Money Fund (Note 3e) | 69,705,445 | |||
|
| |||
Total cost of investments | $ | 2,179,820,755 | ||
|
| |||
Value - Unaffiliated issuers | $ | 2,339,210,090 | ||
Value - Sweep Money Fund (Note 3e) | 69,705,445 | |||
|
| |||
Total value of investments (includes securities loaned in the amount $10,972,210) | 2,408,915,535 | |||
Cash | 659,054 | |||
Receivables: | ||||
Capital shares sold | 1,235,877 | |||
Dividends | 7,452,703 | |||
Due from custodian | 35,400 | |||
Other assets | 1,012 | |||
|
| |||
Total assets | 2,418,299,581 | |||
|
| |||
Liabilities: | ||||
Payables: | ||||
Investment securities purchased | 2,114,518 | |||
Capital shares redeemed | 4,069,027 | |||
Management fees | 1,501,208 | |||
Distribution fees | 1,032,261 | |||
Payable upon return of securities loaned | 11,124,100 | |||
Accrued expenses and other liabilities | 492,873 | |||
|
| |||
Total liabilities | 20,333,987 | |||
|
| |||
Net assets, at value | $ | 2,397,965,594 | ||
|
| |||
Net assets consist of: | ||||
Paid-in capital | $ | 2,140,693,451 | ||
Undistributed net investment income | 32,906,565 | |||
Net unrealized appreciation (depreciation) | 229,091,761 | |||
Accumulated net realized gain (loss) | (4,726,183 | ) | ||
|
| |||
Net assets, at value | $ | 2,397,965,594 | ||
|
| |||
| Class 1: | ||||
Net assets, at value | $ | 248,969,472 | ||
|
| |||
Shares outstanding | 16,572,304 | |||
|
| |||
Net asset value and maximum offering price per share | $ | 15.02 | ||
|
| |||
| Class 2: | ||||
Net assets, at value | $ | 1,645,639,135 | ||
|
| |||
Shares outstanding | 111,579,509 | |||
|
| |||
Net asset value and maximum offering price per share | $ | 14.75 | ||
|
| |||
| Class 4: | ||||
Net assets, at value | $ | 503,356,987 | ||
|
| |||
Shares outstanding | 33,869,747 | |||
|
| |||
Net asset value and maximum offering price per share | $ | 14.86 | ||
|
| |||
| The accompanying notes are an integral part of these financial statements. | Semiannual Report | TF-13 |
FRANKLIN TEMPLETON VARIABLE INSURANCE PRODUCTS TRUST
FINANCIAL STATEMENTS
Statement of Operations
for the six months ended June 30, 2015 (unaudited)
| Templeton Foreign VIP Fund | ||||
Investment income: | ||||
Dividends (net of foreign taxes of $4,664,676) | $ | 44,680,190 | ||
Income from securities loaned | 737,942 | |||
|
| |||
Total investment income | 45,418,132 | |||
|
| |||
Expenses: | ||||
Management fees (Note 3a) | 9,144,270 | |||
Distribution fees: (Note 3c) | ||||
Class 2 | 2,112,759 | |||
Class 4 | 897,956 | |||
Custodian fees (Note 4) | 121,101 | |||
Reports to shareholders | 204,743 | |||
Registration and filing fees | 330 | |||
Professional fees | 50,756 | |||
Trustees’ fees and expenses | 5,478 | |||
Other | 30,838 | |||
|
| |||
Total expenses | 12,568,231 | |||
Expenses waived/paid by affiliates (Note 3e) | (62,711 | ) | ||
|
| |||
Net expenses | 12,505,520 | |||
|
| |||
Net investment income | 32,912,612 | |||
|
| |||
Realized and unrealized gains (losses): | ||||
Net realized gain (loss) from: | ||||
Investments | (483,705 | ) | ||
Foreign currency transactions | 418,713 | |||
|
| |||
Net realized gain (loss) | (64,992 | ) | ||
|
| |||
Net change in unrealized appreciation (depreciation) on: | ||||
Investments | 75,895,400 | |||
Translation of other assets and liabilities denominated in foreign currencies | 89,921 | |||
|
| |||
Net change in unrealized appreciation (depreciation) | 75,985,321 | |||
|
| |||
Net realized and unrealized gain (loss) | 75,920,329 | |||
|
| |||
Net increase (decrease) in net assets resulting from operations | $ | 108,832,941 | ||
|
| |||
| TF-14 | Semiannual Report | The accompanying notes are an integral part of these financial statements. |
FRANKLIN TEMPLETON VARIABLE INSURANCE PRODUCTS TRUST
FINANCIAL STATEMENTS
Statements of Changes in Net Assets
| Templeton Foreign VIP Fund | ||||||||
Six Months Ended June 30, 2015 | Year Ended December 31, | |||||||
Increase (decrease) in net assets: | ||||||||
Operations: | ||||||||
Net investment income | $ | 32,912,612 | $ | 75,694,144 | ||||
Net realized gain (loss) | (64,992 | ) | 132,002,353 | |||||
Net change in unrealized appreciation (depreciation) | 75,985,321 | (498,830,366 | ) | |||||
|
| |||||||
Net increase (decrease) in net assets resulting from operations | 108,832,941 | (291,133,869 | ) | |||||
|
| |||||||
Distributions to shareholders from: | ||||||||
Net investment income: | ||||||||
Class 1 | (8,346,614 | ) | (5,893,509 | ) | ||||
Class 2 | (51,791,116 | ) | (34,594,703 | ) | ||||
Class 4 | (15,312,865 | ) | (9,091,879 | ) | ||||
Net realized gains: | ||||||||
Class 1 | (7,826,999 | ) | — | |||||
Class 2 | (52,898,439 | ) | — | |||||
Class 4 | (16,028,658 | ) | — | |||||
|
| |||||||
Total distributions to shareholders | (152,204,691 | ) | (49,580,091 | ) | ||||
|
| |||||||
Capital share transactions: (Note 2) | ||||||||
Class 1 | 5,266,931 | (13,666,266 | ) | |||||
Class 2 | 29,855,580 | 10,314,563 | ||||||
Class 3 | — | (96,991,462 | ) | |||||
Class 4 | 9,146,216 | 57,564,581 | ||||||
|
| |||||||
Total capital share transactions | 44,268,727 | (42,778,584 | ) | |||||
|
| |||||||
Redemption fees | — | 3,115 | ||||||
|
| |||||||
Net increase (decrease) in net assets | 896,977 | (383,489,429 | ) | |||||
Net assets: | ||||||||
Beginning of period | 2,397,068,617 | 2,780,558,046 | ||||||
|
| |||||||
End of period | $ | 2,397,965,594 | $ | 2,397,068,617 | ||||
|
| |||||||
Undistributed net investment income included in net assets: | ||||||||
End of period | $ | 32,906,565 | $ | 75,444,548 | ||||
|
| |||||||
| The accompanying notes are an integral part of these financial statements. | Semiannual Report | TF-15 |
FRANKLIN TEMPLETON VARIABLE INSURANCE PRODUCTS TRUST
Notes to Financial Statements (unaudited)
Templeton Foreign VIP Fund
1. Organization and Significant Accounting Policies
Franklin Templeton Variable Insurance Products Trust (Trust) is registered under the Investment Company Act of 1940 (1940 Act) as an open-end management investment company, consisting of nineteen separate funds and applies the specialized accounting and reporting guidance in U.S. Generally Accepted Accounting Principles (U.S. GAAP). Templeton Foreign VIP Fund (Fund) is included in this report. The financial statements of the remaining funds in the Trust are presented separately. Shares of the Fund are generally sold only to insurance company separate accounts to fund the benefits of variable life insurance policies or variable annuity contracts. The Fund offers three classes of shares: Class 1, Class 2 and Class 4. Each class of shares differs by its distribution fees, voting rights on matters affecting a single class and its exchange privilege.
The following summarizes the Fund’s significant accounting policies.
a. Financial Instrument Valuation
The Fund’s investments in financial instruments are carried at fair value daily. Fair value is the price that would be received to sell an asset or paid to transfer a liability in an orderly transaction between market participants on the measurement date. The Fund calculates the net asset value (NAV) per share at the close of the New York Stock Exchange (NYSE), generally at 4 p.m. Eastern time (NYSE close) on each day the NYSE is open for trading. Under compliance policies and procedures approved by the Trust’s Board of Trustees (the Board), the Fund’s administrator has responsibility for oversight of valuation, including leading the cross-functional Valuation and Liquidity Oversight Committee (VLOC). The VLOC provides administration and oversight of the Fund’s valuation policies and procedures, which are approved annually by the Board. Among other things, these procedures allow the Fund to utilize independent pricing services, quotations from securities and financial instrument dealers, and other market sources to determine fair value.
Equity securities listed on an exchange or on the NASDAQ National Market System are valued at the last quoted sale price or the official closing price of the day, respectively. Foreign equity securities are valued as of the close of trading on the foreign stock exchange on which the security is primarily traded or as of the NYSE close, whichever is earlier. The value is then converted into its U.S. dollar equivalent at the foreign exchange
rate in effect at the NYSE close on the day that the value of the security is determined. Over-the-counter (OTC) securities are valued within the range of the most recent quoted bid and ask prices. Securities that trade in multiple markets or on multiple exchanges are valued according to the broadest and most representative market. Certain equity securities are valued based upon fundamental characteristics or relationships to similar securities. Investments in open-end mutual funds are valued at the closing NAV.
The Fund has procedures to determine the fair value of financial instruments for which market prices are not reliable or readily available. Under these procedures, the VLOC convenes on a regular basis to review such financial instruments and considers a number of factors, including significant unobservable valuation inputs, when arriving at fair value. The VLOC primarily employs a market-based approach which may use related or comparable assets or liabilities, recent transactions, market multiples, book values, and other relevant information for the investment to determine the fair value of the investment. An income-based valuation approach may also be used in which the anticipated future cash flows of the investment are discounted to calculate fair value. Discounts may also be applied due to the nature or duration of any restrictions on the disposition of the investments. Due to the inherent uncertainty of valuations of such investments, the fair values may differ significantly from the values that would have been used had an active market existed. The VLOC employs various methods for calibrating these valuation approaches including a regular review of key inputs and assumptions, transactional back-testing or disposition analysis, and reviews of any related market activity.
Trading in securities on foreign securities stock exchanges and OTC markets may be completed before the daily NYSE close. In addition, trading in certain foreign markets may not take place on every NYSE business day. Occasionally, events occur between the time at which trading in a foreign security is completed and the close of the NYSE that might call into question the reliability of the value of a portfolio security held by the Fund. As a result, differences may arise between the value of the Fund’s portfolio securities as determined at the foreign market close and the latest indications of value at the close of the NYSE. In order to minimize the potential for these differences, the VLOC monitors price movements following the close of trading in foreign stock markets through a series of country specific market proxies (such as baskets of American Depositary Receipts, futures contracts and exchange traded funds).
| TF-16 | Semiannual Report |
FRANKLIN TEMPLETON VARIABLE INSURANCE PRODUCTS TRUST
NOTES TO FINANCIAL STATEMENTS (UNAUDITED)
Templeton Foreign VIP Fund (continued)
These price movements are measured against established trigger thresholds for each specific market proxy to assist in determining if an event has occurred that may call into question the reliability of the values of the foreign securities held by the Fund. If such an event occurs, the securities may be valued using fair value procedures, which may include the use of independent pricing services.
When the last day of the reporting period is a non-business day, certain foreign markets may be open on those days that the NYSE is closed, which could result in differences between the value of the Fund’s portfolio securities on the last business day and the last calendar day of the reporting period. Any significant security valuation changes due to an open foreign market are adjusted and reflected by the Fund for financial reporting purposes.
b. Foreign Currency Translation
Portfolio securities and other assets and liabilities denominated in foreign currencies are translated into U.S. dollars based on the exchange rate of such currencies against U.S. dollars on the date of valuation. The Fund may enter into foreign currency exchange contracts to facilitate transactions denominated in a foreign currency. Purchases and sales of securities, income and expense items denominated in foreign currencies are translated into U.S. dollars at the exchange rate in effect on the transaction date. Portfolio securities and assets and liabilities denominated in foreign currencies contain risks that those currencies will decline in value relative to the U.S. dollar. Occasionally, events may impact the availability or reliability of foreign exchange rates used to convert the U.S. dollar equivalent value. If such an
event occurs, the foreign exchange rate will be valued at fair value using procedures established and approved by the Board.
The Fund does not separately report the effect of changes in foreign exchange rates from changes in market prices on securities held. Such changes are included in net realized and unrealized gain or loss from investments in the Statement of Operations.
Realized foreign exchange gains or losses arise from sales of foreign currencies, currency gains or losses realized between the trade and settlement dates on securities transactions and the difference between the recorded amounts of dividends, interest, and foreign withholding taxes and the U.S. dollar equivalent of the amounts actually received or paid. Net unrealized foreign exchange gains and losses arise from changes in foreign
exchange rates on foreign denominated assets and liabilities other than investments in securities held at the end of the reporting period.
c. Securities Lending
The Fund participates in an agency based securities lending program to earn additional income. The Fund receives cash collateral against the loaned securities in an amount equal to at least 102% of the fair value of the loaned securities. Collateral is maintained over the life of the loan in an amount not less than 100% of the fair value of loaned securities, as determined at the close of fund business each day; any additional collateral required due to changes in security values is delivered to the Fund on the next business day. The collateral is deposited into a joint cash account with other funds and is used to invest in a money market fund managed by Franklin Advisers, Inc., an affiliate of the Fund. The total cash collateral received at period end was $11,124,100, of which $35,400 was uninvested cash included in due from custodian in the Statement of Assets and Liabilities. The Fund may receive income from the investment of cash collateral, in addition to lending fees and rebates paid by the borrower. Income from securities loaned is reported separately in the Statement of Operations. The Fund bears the market risk with respect to the collateral investment, securities loaned, and the risk that the agent may default on its obligations to the Fund. If the borrower defaults on its obligation to return the securities loaned, the Fund has the right to repurchase the securities in the open market using the collateral received. The securities lending agent has agreed to indemnify the Fund in the event of default by a third party borrower.
d. Income and Deferred Taxes
It is the Fund’s policy to qualify as a regulated investment company under the Internal Revenue Code. The Fund intends to distribute to shareholders substantially all of its taxable income and net realized gains to relieve it from federal income and if applicable, excise taxes. As a result, no provision for U.S. federal income taxes is required.
The Fund may be subject to foreign taxation related to income received, capital gains on the sale of securities and certain foreign currency transactions in the foreign jurisdictions in which it invests. Foreign taxes, if any, are recorded based on the tax regulations and rates that exist in the foreign markets in which the Fund invests. When a capital gain tax is determined to apply, the Fund records an estimated deferred tax liability in an
| Semiannual Report | TF-17 |
FRANKLIN TEMPLETON VARIABLE INSURANCE PRODUCTS TRUST
NOTES TO FINANCIAL STATEMENTS (UNAUDITED)
Templeton Foreign VIP Fund (continued)
1. Organization and Significant Accounting Policies (continued)
d. Income and Deferred Taxes (continued)
amount that would be payable if the securities were disposed of on the valuation date. As a result of several court cases, in certain countries across the European Union, the Fund has filed additional tax reclaims for previously withheld taxes on dividends earned in those countries. These additional filings are subject to various administrative proceedings by the local jurisdictions’ tax authorities within the European Union, as well as a number of related judicial proceedings. At this time, uncertainty exists as to the ultimate resolution of these proceedings, the likelihood of receipt of these reclaims, and the potential timing of payment, and accordingly, no amounts are reflected in the financial statements.
The Fund recognizes the tax benefits of uncertain tax positions only when the position is “more likely than not” to be sustained upon examination by the tax authorities based on the technical merits of the tax position. As of June 30, 2015, and for all open tax years, the Fund has determined that no liability for unrecognized tax benefits is required in the Fund’s financial statements related to uncertain tax positions taken on a tax return (or expected to be taken on future tax returns). Open tax years are those that remain subject to examination and are based on each tax jurisdiction’s statute of limitation.
e. Security Transactions, Investment Income, Expenses and Distributions
Security transactions are accounted for on trade date. Realized gains and losses on security transactions are determined on a specific identification basis. Estimated expenses are accrued daily. Dividend income is recorded on the ex-dividend date except for certain dividends from foreign securities where the dividend rate is not available. In such cases, the dividend is recorded as soon as the information is received by the Fund. Distributions to shareholders are recorded on the ex-dividend date and are determined according to income tax regulations (tax basis). Distributable earnings determined on a tax basis may differ from earnings recorded in accordance with U.S. GAAP. These differences may be permanent or temporary. Permanent differences are reclassified among capital accounts to reflect their tax character. These reclassifications have no impact on net assets or the results of operations. Temporary differences are not reclassified, as they may reverse in subsequent periods.
Common expenses incurred by the Trust are allocated among the funds based on the ratio of net assets of each fund to the combined net assets of the Trust. Fund specific expenses are charged directly to the fund that incurred the expense.
Realized and unrealized gains and losses and net investment income, not including class specific expenses, are allocated daily to each class of shares based upon the relative proportion of net assets of each class. Differences in per share distributions, by class, are generally due to differences in class specific expenses.
f. Accounting Estimates
The preparation of financial statements in accordance with U.S. GAAP requires management to make estimates and assumptions that affect the reported amounts of assets and liabilities at the date of the financial statements and the amounts of income and expenses during the reporting period. Actual results could differ from those estimates.
g. Redemption Fees
Redemptions and exchanges of interests in an insurance company subaccount that invested in Class 3 shares of the Fund were subject to a 1.0% short term trading fee if the interest in the subaccount had been held for less than 60 days. Such fees were retained by the Fund and accounted for as an addition to paid-in capital, allocated to each class of shares based upon the relative proportion of net assets of each class. There were no redemption fees for the period.
h. Guarantees and Indemnifications
Under the Trust’s organizational documents, its officers and trustees are indemnified by the Trust against certain liabilities arising out of the performance of their duties to the Trust. Additionally, in the normal course of business, the Trust, on behalf of the Fund, enters into contracts with service providers that contain general indemnification clauses. The Trust’s maximum exposure under these arrangements is unknown as this would involve future claims that may be made against the Trust that have not yet occurred. Currently, the Trust expects the risk of loss to be remote.
| TF-18 | Semiannual Report |
FRANKLIN TEMPLETON VARIABLE INSURANCE PRODUCTS TRUST
NOTES TO FINANCIAL STATEMENTS (UNAUDITED)
Templeton Foreign VIP Fund (continued)
2. Shares of Beneficial Interest
At June 30, 2015, there were an unlimited number of shares authorized (without par value). Transactions in the Fund’s shares were as follows:
| Six Months Ended June 30, 2015 | Year Ended December 31, 2014 | |||||||||||||||||
| Shares | Amount | Shares | Amount | |||||||||||||||
| Class 1 Shares: | ||||||||||||||||||
Shares sold | 232,679 | $ | 3,715,265 | 620,933 | $ | 10,378,692 | ||||||||||||
Shares issued in reinvestment of distributions | 1,057,790 | 16,173,613 | 329,615 | 5,893,509 | ||||||||||||||
Shares redeemed | (910,134 | ) | (14,621,947 | ) | (1,754,194 | ) | (29,938,467 | ) | ||||||||||
|
| |||||||||||||||||
Net increase (decrease) | 380,335 | $ | 5,266,931 | (803,646 | ) | $ | (13,666,266 | ) | ||||||||||
|
| |||||||||||||||||
| Class 2 Shares: | ||||||||||||||||||
Shares sold | 6,958,125 | $ | 108,664,246 | 18,861,260 | $ | 315,063,591 | ||||||||||||
Shares issued in reinvestment of distributions | 6,974,654 | 104,689,555 | 1,967,844 | 34,594,703 | ||||||||||||||
Shares redeemed | (11,669,847 | ) | (183,498,221 | ) | (20,169,191 | ) | (339,343,731 | ) | ||||||||||
|
| |||||||||||||||||
Net increase (decrease) | 2,262,932 | $ | 29,855,580 | 659,913 | $ | 10,314,563 | ||||||||||||
|
| |||||||||||||||||
| Class 3 Sharesa: | ||||||||||||||||||
Shares sold | 149,791 | $ | 2,553,688 | |||||||||||||||
Shares redeemed | (5,703,761 | ) | (99,545,150 | ) | ||||||||||||||
|
| |||||||||||||||||
Net increase (decrease) | (5,553,970 | ) | $ | (96,991,462 | ) | |||||||||||||
|
| |||||||||||||||||
| Class 4 Shares: | ||||||||||||||||||
Shares sold | 1,542,741 | $ | 24,309,180 | 6,994,024 | $ | 113,655,992 | ||||||||||||
Shares issued in reinvestment of distributions | 2,072,852 | 31,341,523 | 513,375 | 9,091,879 | ||||||||||||||
Shares redeemed | (2,938,570 | ) | (46,504,487 | ) | (3,859,063 | ) | (65,183,290 | ) | ||||||||||
|
| |||||||||||||||||
Net increase (decrease) | 677,023 | $ | 9,146,216 | 3,648,336 | $ | 57,564,581 | ||||||||||||
|
| |||||||||||||||||
aEffective May 1, 2014, all Class 3 Shares were converted to Class 2.
3. Transactions With Affiliates
Franklin Resources, Inc. is the holding company for various subsidiaries that together are referred to as Franklin Templeton Investments. Certain officers and trustees of the Fund are also officers and/or directors of the following subsidiaries:
| Subsidiary | Affiliation | |
Templeton Investment Counsel, LLC (TIC) | Investment manager | |
Franklin Templeton Services, LLC (FT Services) | Administrative manager | |
Franklin Templeton Distributors, Inc. (Distributors) | Principal underwriter | |
Franklin Templeton Investor Services, LLC (Investor Services) | Transfer agent |
| Semiannual Report | TF-19 |
FRANKLIN TEMPLETON VARIABLE INSURANCE PRODUCTS TRUST
NOTES TO FINANCIAL STATEMENTS (UNAUDITED)
Templeton Foreign VIP Fund (continued)
3. Transactions With Affiliates (continued)
a. Management Fees
The Fund pays an investment management fee to TIC based on the average daily net assets of the Fund as follows:
| Annualized Fee Rate | Net Assets | |
0.900% | Up to and including $200 million | |
0.810% | Over $200 million, up to and including $700 million | |
0.775% | Over $700 million, up to and including $1.2 billion | |
0.750% | Over $1.2 billion, up to and including $1.3 billion | |
0.675% | Over $1.3 billion, up to and including $10 billion | |
0.655% | Over $10 billion, up to and including $15 billion | |
0.635% | Over $15 billion, up to and including $20 billion | |
0.615% | In excess of $20 billion |
b. Administrative Fees
Under an agreement with TIC, FT Services provides administrative services to the Fund. The fee is paid by TIC based on the Fund’s average daily net assets, and is not an additional expense of the Fund.
c. Distribution Fees
The Board has adopted distribution plans for Class 2 and Class 4 shares pursuant to Rule 12b-1 under the 1940 Act. Under the Fund’s compensation distribution plans, the Fund pays Distributors for costs incurred in connection with the servicing, sale and distribution of the Fund’s shares up to 0.25% and 0.35% per year of its average daily net assets of Class 2 and Class 4, respectively. Some distribution fees are not charged on shares held by affiliates. The plan year, for purposes of monitoring compliance with the maximum annual plan rates, is February 1 through January 31.
d. Transfer Agent Fees
Investor Services, under terms of an agreement, performs shareholder servicing for the Fund and is not paid by the Fund for the services.
e. Investments in Institutional Fiduciary Trust Money Market Portfolio
The Fund invests in Institutional Fiduciary Trust Money Market Portfolio (Sweep Money Fund), an affiliated open-end management investment company. Management fees paid by the Fund are waived on assets invested in the Sweep Money Fund, as noted in the Statement of Operations, in an amount not to exceed the management and administrative fees paid directly or indirectly by the Sweep Money Fund. Prior to January 1, 2014, the waiver was accounted for as a reduction to management fees.
4. Expense Offset Arrangement
The Fund has entered into an arrangement with its custodian whereby credits realized as a result of uninvested cash balances are used to reduce a portion of the Fund’s custodian expenses. During the period ended June 30, 2015, there were no credits earned.
| TF-20 | Semiannual Report |
FRANKLIN TEMPLETON VARIABLE INSURANCE PRODUCTS TRUST
NOTES TO FINANCIAL STATEMENTS (UNAUDITED)
Templeton Foreign VIP Fund (continued)
5. Income Taxes
At June 30, 2015, the cost of investments and net unrealized appreciation (depreciation) for income tax purposes were as follows:
Cost of investments | $ | 2,184,481,312 | ||
|
| |||
Unrealized appreciation | $ | 441,828,050 | ||
Unrealized depreciation | (217,393,827 | ) | ||
|
| |||
Net unrealized appreciation (depreciation) | $ | 224,434,223 | ||
|
|
Differences between income and/or capital gains as determined on a book basis and a tax basis are primarily due to differing treatment of foreign currency transactions.
6. Investment Transactions
Purchases and sales of investments (excluding short term securities) for the period ended June 30, 2015, aggregated $199,856,523 and $163,698,190 respectively.
7. Concentration of Risk
Investing in foreign securities may include certain risks and considerations not typically associated with investing in U.S. securities, such as fluctuating currency values and changing local and regional economic, political and social conditions, which may result in greater market volatility. In addition, certain foreign securities may not be as liquid as U.S. securities.
8. Credit Facility
The Fund, together with other U.S. registered and foreign investment funds (collectively, Borrowers), managed by Franklin Templeton Investments, are borrowers in a joint syndicated senior unsecured credit facility totaling $2 billion (Global Credit Facility) which matures on February 12, 2016. This Global Credit Facility provides a source of funds to the Borrowers for temporary and emergency purposes, including the ability to meet future unanticipated or unusually large redemption requests.
Under the terms of the Global Credit Facility, the Fund shall, in addition to interest charged on any borrowings made by the Fund and other costs incurred by the Fund, pay its share of fees and expenses incurred in connection with the implementation and maintenance of the Global Credit Facility, based upon its relative share of the aggregate net assets of all of the Borrowers, including an annual commitment fee of 0.07% based upon the unused portion of the Global Credit Facility. These fees are reflected in other expenses in the Statement of Operations. During the period ended June 30, 2015, the Fund did not use the Global Credit Facility.
9. Fair Value Measurements
The Fund follows a fair value hierarchy that distinguishes between market data obtained from independent sources (observable inputs) and the Fund’s own market assumptions (unobservable inputs). These inputs are used in determining the value of the Fund’s financial instruments and are summarized in the following fair value hierarchy:
| • | Level 1 – quoted prices in active markets for identical financial instruments |
| • | Level 2 – other significant observable inputs (including quoted prices for similar financial instruments, interest rates, prepayment speed, credit risk, etc.) |
| • | Level 3 – significant unobservable inputs (including the Fund’s own assumptions in determining the fair value of financial instruments) |
The input levels are not necessarily an indication of the risk or liquidity associated with financial instruments at that level.
| Semiannual Report | TF-21 |
FRANKLIN TEMPLETON VARIABLE INSURANCE PRODUCTS TRUST
NOTES TO FINANCIAL STATEMENTS (UNAUDITED)
Templeton Foreign VIP Fund (continued)
9. Fair Value Measurements (continued)
For movements between the levels within the fair value hierarchy, the Fund has adopted a policy of recognizing the transfers as of the date of the underlying event which caused the movement.
At June 30, 2015, all of the Fund’s investments in financial instruments carried at fair value were valued using Level 1 inputs. For detailed categories, see the accompanying Statement of Investments.
10. New Accounting Pronouncements
In June 2014, the Financial Accounting Standards Board issued Accounting Standards Update (ASU) No. 2014-11, Transfers and Servicing (Topic 860), Repurchase-to-Maturity Transactions, Repurchase Financings, and Disclosures. The ASU changes the accounting for certain repurchase agreements and expands disclosure requirements related to repurchase agreements, securities lending, repurchase-to-maturity and similar transactions. The ASU is effective for certain transactions accounted for as a sale for interim and annual reporting periods beginning after December 15, 2014, and transactions accounted for as secured borrowings for annual periods beginning after December 15, 2014, and for interim periods beginning after March 15, 2015. Management has reviewed the requirements and believes the adoption of this ASU will not have a material impact on the financial statements.
11. Subsequent Events
The Fund has evaluated subsequent events through the issuance of the financial statements and determined that no events have occurred that require disclosure.
Abbreviations
| Selected Portfolio | ||
| ADR | American Depositary Receipt | |
| IDR | International Depositary Receipt | |
| TF-22 | Semiannual Report |
FRANKLIN TEMPLETON VARIABLE INSURANCE PRODUCTS TRUST
Tax Information (unaudited)
Templeton Foreign VIP Fund
At December 31, 2014, more than 50% of the Fund’s total assets were invested in securities of foreign issuers. In most instances, foreign taxes were withheld from income paid to the Fund on these investments. As shown in the table below, the Fund hereby reports to shareholders the foreign source income and foreign taxes paid, pursuant to Section 853 of the Internal Revenue Code. This written statement will allow shareholders of record on June 12, 2015, to treat their proportionate share of foreign taxes paid by the Fund as having been paid directly by them. The shareholder shall consider these amounts as foreign taxes paid in the tax year in which they receive the Fund distribution.
The following table provides a detailed analysis of foreign tax paid and foreign source income as reported by the Fund, to Class 1, Class 2, and Class 4 shareholders of record.
| Class | Foreign Tax Paid Per Share | Foreign Source Income Per Share | ||
Class 1 | $0.0275 | $0.5528 | ||
Class 2 | $0.0275 | $0.5105 | ||
Class 4 | $0.0275 | $0.4982 |
Foreign Tax Paid Per Share (Column 1) is the amount per share available to you, as a tax credit (assuming you held your shares in the Fund for a minimum of 16 days during the 31-day period beginning 15 days before the ex-dividend date of the Fund’s distribution to which the foreign taxes relate), or, as a tax deduction.
Foreign Source Income Per Share (Column 2) is the amount per share of income dividends attributable to foreign securities held by the Fund, plus any foreign taxes withheld on these dividends.
| Semiannual Report | TF-23 |
Templeton Global Bond VIP Fund
This semiannual report for Templeton Global Bond VIP Fund covers the period ended June 30, 2015.
Class 1 Performance Summary as of June 30, 2015
The Fund’s Class 1 shares had a -0.17% total return for the six-month period ended June 30, 2015.
Performance reflects the Fund’s Class 1 operating expenses, but does not include any contract fees, expenses or sales charges. If they had been included, performance would be lower. These charges and deductions, particularly for variable life policies, can have a significant effect on contract values and insurance benefits. See the contract prospectus for a complete description of these expenses, including sales charges.
Performance data represent past performance, which does not guarantee future results. Investment return and principal value will fluctuate, and you may have a gain or loss when you sell your shares. Current performance may differ from figures shown.
| Semiannual Report | TGB-1 |
TEMPLETON GLOBAL BOND VIP FUND
Fund Goal and Main Investments
Templeton Global Bond VIP Fund seeks high current income, consistent with preservation of capital, with capital appreciation as a secondary consideration. Under normal market conditions, the Fund invests at least 80% of its net assets in bonds, which include debt securities of any maturity, such as bonds, notes, bills and debentures.
Fund Risks
All investments involve risks, including possible loss of principal. Currency rates may fluctuate significantly over short periods of time, and can reduce returns. Derivatives, including currency management strategies, involve costs and can create economic leverage in the portfolio that may result in significant volatility and cause the Fund to participate in losses (as well as gains) on an amount that exceeds the Fund’s initial investment. The Fund may not achieve the anticipated benefits and may realize losses when a counterparty fails to perform as promised. Foreign securities involve special risks, including currency fluctuations and economic and political uncertainties. Investments in emerging markets involve heightened risks related to the same factors, in addition to those associated with these markets’ smaller size and lesser liquidity. Sovereign debt securities are subject to various risks in addition to those relating to debt securities and foreign securities generally, including, but not limited to, the risk that a government entity may be unwilling or unable to pay interest and repay principal on its sovereign debt, or otherwise meet its obligations when due. Investments in lower rated bonds include higher risk of default and loss of principal. Changes in interest rates will affect the value of the Fund’s portfolio and its share price and yield. Bond prices generally move in the opposite direction of interest rates. As prices of bonds in the Fund adjust to a rise in interest rates, the Fund’s share price may decline. The markets for particular securities or types of securities are or may become relatively illiquid. Reduced liquidity will have an adverse impact on the security’s value and on the Fund’s ability to sell such securities when necessary to meet the Fund’s liquidity needs or in response to a specific market event. The Fund is also nondiversified, which involves the risk of greater price fluctuation than a more diversified portfolio. Changes in the financial strength of a bond issuer or in a bond’s credit rating may affect its value. The Fund is actively managed but there is no guarantee that the manager’s investment decisions will produce the desired results. The Fund’s prospectus also includes a description of the main investment risks.
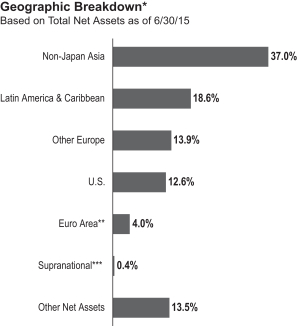
*Figures reflect certain derivatives held in the portfolio (or their underlying reference assets) and may not total 100% or may be negative due to rounding, use of any derivatives, unsettled trades or other factors.
**The Fund’s euro area investments were in Ireland, Slovenia and Portugal.
***The Fund’s supranational investment was denominated in the Mexican peso.
Performance Overview
You can find the Fund’s six-month total return in the Performance Summary. For comparison, the Fund’s benchmarks, the J.P. Morgan (JPM) Global Government Bond Index (GGBI) had a -3.43% total return and the Citigroup World Government Bond Index, had a -4.02% total return for the same period.1
Economic and Market Overview
During the period, global financial markets were influenced by growth in the U.S., economic stabilization in China, lower oil prices, and the abundance of global liquidity from the Bank of Japan (BOJ) and the European Central Bank (ECB). Yields generally increased across much of Europe, Asia and the Americas during the period, though select markets experienced a decline in yields. The yield on the 10-year U.S. Treasury note declined from 2.17% at the start of the period to a low of 1.68% at the end of January, before rising to 2.35% by the end of June. The U.S. dollar broadly strengthened against most developed and emerging market currencies over the six-month period.
1. Source: Morningstar.
One cannot invest directly in an index, and an index is not representative of the Fund’s portfolio. Please see Index Descriptions following the Fund Summaries.
| TGB-2 | Semiannual Report |
TEMPLETON GLOBAL BOND VIP FUND
We continued to see differentiation among specific emerging market economies; some have healthy current account and fiscal balances, with large international reserves, while others struggle with deficits and economic imbalances. We believed economies that we feel have healthier balances and stronger growth prospects, such as Mexico, will be in a stronger position to potentially raise rates in conjunction with U.S. Federal Reserve rate hikes, which should lead to a fundamental strengthening of their respective currencies over the medium-to-long term.
In March, the ECB launched quantitative easing (QE) with the aim of increasing the size of its balance sheet to a level higher than its previous peak. The ECB has stated that it intends to continue its asset purchases until it sees a sustained adjustment in the path of inflation toward its price stability norm of inflation below and close to 2.0%, making the program effectively open ended. This could keep interest rates low for a while, and we anticipated that it would put further downward pressure on the euro. Additionally, we believed the ECB would likely continue with QE until there is a resolution to the debt crisis in Greece. The euro depreciated 7.92% against the U.S. dollar over the six-month period.2
Japan remained heavily indebted, compelling the country down a road of extraordinary policy measures. With government debt at more than 200% of gross domestic product, a persistent trade deficit and a current account deficit, Japan has become reliant on its central bank to function as the buyer of last resort for its debt financing. Though Japan’s QE measures have been positive for global risk assets, they are likely to contribute to further yen depreciation, in our assessment. The Japanese yen depreciated 2.02% against the U.S. dollar over the six-month period.2
Investment Strategy
We invest selectively in bonds around the world based upon our assessment of changing market, political and economic conditions. While seeking opportunities, we monitor various factors including changes in interest rates, currency exchange rates and credit risks. We seek to manage the Fund’s exposure to various currencies and may utilize currency forward contracts.
What is a currency forward contract?
A currency forward contract, or a currency forward, is an agreement between the Fund and a counterparty to buy or sell a foreign currency at a specific exchange rate on a future date.
| Currency Breakdown* | ||||
| 6/30/15 | ||||
| % of Total Net Assets | ||||
| Americas | 101.1% | |||
U.S. Dollar | 78.7% | |||
Mexican Peso | 15.2% | |||
Brazilian Real | 4.2% | |||
Chilean Peso | 2.9% | |||
Peruvian Nuevo Sol | 0.1% | |||
| Asia Pacific | 24.4% | |||
South Korean Won | 14.7% | |||
Malaysian Ringgit | 14.5% | |||
Singapore Dollar | 7.5% | |||
Indonesian Rupiah | 4.8% | |||
Indian Rupee | 4.0% | |||
Philippine Peso | 2.0% | |||
Sri Lankan Rupee | 1.3% | |||
Japanese Yen | -24.4% | |||
| Europe | -23.1% | |||
Polish Zloty | 8.0% | |||
Hungarian Forint | 3.2% | |||
Euro | -34.3% | |||
| Australia & New Zealand | -2.4% | |||
Australian Dollar | -2.4% | |||
*Figures reflect certain derivatives held in the portfolio (or their underlying reference assets) and may not total 100% or may be negative due to rounding, use of any derivatives, unsettled trades or other factors.
The dollar value, number of shares or principal amount, and names of all portfolio holdings are listed in the Fund’s Statement of Investments.
Manager’s Discussion
The core of our fixed income strategy remained positioning ourselves to navigate what we think is a rising-rate environment. Consequently, we continued to position defensively with regard to duration while actively seeking opportunities that could potentially offer positive real yields without taking undue interest rate risk. The Fund maintained low duration exposure with some select duration exposures in countries that had higher rates and/or that had healthier fiscal and monetary fundamentals, in our view.
2. Source: FactSet
| Semiannual Report | TGB-3 |
TEMPLETON GLOBAL BOND VIP FUND
What is duration?
Duration is a measure of a bond’s price sensitivity to interest rate changes. In general, a portfolio of securities with a lower duration can be expected to be less sensitive to interest rate changes than a portfolio with a higher duration.
During the period, we selectively used interest rate swaps to manage duration exposures and used currency forwards to manage currency exposures. For example, we increased our negative duration exposure to U.S. Treasuries during the period. We also continued to position for value in currencies across several developed and emerging market economies that we believed had strong growth fundamentals. We maintained net-negative positions in the Japanese yen and the euro, through the use of currency forwards, as we continued to expect accommodative monetary policies from the BOJ and ECB.
What is an interest rate swap?
An interest rate swap is an agreement between two parties to exchange interest rate obligations, generally one based on an interest rate fixed to maturity and the other based on an interest rate that changes in accordance with changes in a designated benchmark (for example, LIBOR, prime, commercial paper or other benchmarks).
During the period, the Fund’s absolute performance benefited from interest rate strategies. Currency positions detracted from absolute return, while sovereign credit exposures had a largely neutral effect. The Fund maintained a defensive approach regarding interest rates in developed and emerging markets. Negative duration exposures to U.S. Treasuries contributed to absolute return. Among currencies, the Fund’s net-negative
positions in the euro and the Japanese yen, through the use of currency forwards, contributed to absolute performance. However, currency positions in Latin America and Asia ex-Japan detracted from absolute results.
Relative to the JPM GGBI, currency positions and interest rate strategies contributed to performance while sovereign credit exposures had a largely neutral effect. Among currencies, the Fund’s underweighted positions in the euro and the Japanese yen contributed to relative return. However, overweighted currency positions in Latin America and Asia ex-Japan detracted from relative results. The Fund maintained a shorter duration positioning relative to the JPM GGBI. Underweighted duration exposure to the U.S. contributed to relative performance.
Thank you for your participation in Templeton Global Bond VIP Fund. We look forward to serving your future investment needs.
The foregoing information reflects our analysis, opinions and portfolio holdings as of June 30, 2015, the end of the reporting period. The way we implement our main investment strategies and the resulting portfolio holdings may change depending on factors such as market and economic conditions. These opinions may not be relied upon as investment advice or an offer for a particular security. The information is not a complete analysis of every aspect of any market, country, industry, security or the Fund. Statements of fact are from sources considered reliable, but the investment manager makes no representation or warranty as to their completeness or accuracy. Although historical performance is no guarantee of future results, these insights may help you understand our investment management philosophy.
| TGB-4 | Semiannual Report |
TEMPLETON GLOBAL BOND VIP FUND
Class 1 Fund Expenses
As an investor in a variable insurance contract (Contract) that indirectly provides for investment in an underlying mutual fund, you can incur transaction and/or ongoing expenses at both the Fund level and the Contract level.
| • | Transaction expenses can include sales charges (loads) on purchases, surrender fees, transfer fees and premium taxes. |
| • | Ongoing expenses can include management fees, distribution and service (12b-1) fees, contract fees, annual maintenance fees, mortality and expense risk fees and other fees and expenses. All mutual funds and Contracts have some types of ongoing expenses. |
The expenses shown in the table are meant to highlight ongoing expenses at the Fund level only and do not include ongoing expenses at the Contract level, or transaction expenses at either the Fund or Contract levels. While the Fund does not have transaction expenses, if the transaction and ongoing expenses at the Contract level were included, the expenses shown below would be higher. You should consult your Contract prospectus or disclosure document for more information.
The table shows Fund-level ongoing expenses and can help you understand these expenses and compare them with those of other mutual funds offered through the Contract. The table assumes a $1,000 investment held for the six months indicated. Please refer to the Fund prospectus for additional information on operating expenses.
Actual Fund Expenses
The first line (Actual) of the table provides actual account values and expenses. The “Ending Account Value” is derived from the Fund’s actual return, which includes the effect of ongoing Fund expenses, but does not include the effect of ongoing Contract expenses.
You can estimate the Fund-level expenses you incurred during the period by following these steps. Of course, your account value and expenses will differ from those in this illustration:
| 1. | Divide your account value by $1,000. |
If an account had an $8,600 value,
then $8,600 ÷ $1,000 = 8.6.
| 2. | Multiply the result by the number under the heading “Fund-Level Expenses Incurred During Period.” |
If Fund-Level Expenses Incurred During Period were $7.50,
then 8.6 × $7.50 = $64.50.
In this illustration, the estimated expenses incurred this period at the Fund level are $64.50.
Hypothetical Example for Comparison with Other Mutual Funds
Information in the second line (Hypothetical) of the table can help you compare ongoing expenses of the Fund with those of other mutual funds offered through the Contract. This information may not be used to estimate the actual ending account balance or expenses you incurred during the period. The hypothetical “Ending Account Value” is based on the Fund’s actual expense ratio and an assumed 5% annual rate of return before expenses, which does not represent the Fund’s actual return. The figure under the heading “Fund-Level Expenses Incurred During Period” shows the hypothetical expenses your account would have incurred under this scenario. You can compare this figure with the 5% hypothetical examples that appear in shareholder reports of other funds offered through a Contract.
| Class 1 | Beginning Account Value 1/1/15 | Ending Account Value 6/30/15 | Fund-Level Expenses Incurred During Period* 1/1/15–6/30/15 | |||||||||
Actual | $ | 1,000 | $ | 998.30 | $ | 2.53 | ||||||
Hypothetical (5% return before expenses) | $ | 1,000 | $ | 1,022.27 | $ | 2.56 | ||||||
*Expenses are calculated using the most recent six-month annualized expense ratio for the Fund’s Class 1 shares (0.51%), which does not include any ongoing expenses of the Contract for which the Fund is an investment option, multiplied by the average account value over the period, multiplied by 181/365 to reflect the one-half year period.
| Semiannual Report | TGB-5 |
FRANKLIN TEMPLETON VARIABLE INSURANCE PRODUCTS TRUST
Financial Highlights
Templeton Global Bond VIP Fund
| Six Months Ended June 30, 2015 (unaudited) | Year Ended December 31, | |||||||||||||||||||||||
| 2014 | 2013 | 2012 | 2011 | 2010 | ||||||||||||||||||||
| Class 1 | ||||||||||||||||||||||||
| Per share operating performance (for a share outstanding throughout the period) | ||||||||||||||||||||||||
Net asset value, beginning of period | $18.56 | $19.15 | $20.01 | $18.61 | $19.94 | $17.72 | ||||||||||||||||||
|
| |||||||||||||||||||||||
| Income from investment operationsa: | ||||||||||||||||||||||||
Net investment incomeb | 0.28 | 0.58 | 0.64 | 0.72 | 0.87 | 1.00 | ||||||||||||||||||
Net realized and unrealized gains (losses) | (0.31 | ) | (0.16 | ) | (0.30 | ) | 1.99 | (0.92 | ) | 1.58 | ||||||||||||||
|
| |||||||||||||||||||||||
Total from investment operations | (0.03 | ) | 0.42 | 0.34 | 2.71 | (0.05 | ) | 2.58 | ||||||||||||||||
|
| |||||||||||||||||||||||
| Less distributions from: | ||||||||||||||||||||||||
Net investment income and net foreign currency gains | (1.43 | ) | (1.01 | ) | (0.96 | ) | (1.28 | ) | (1.15 | ) | (0.31 | ) | ||||||||||||
Net realized gains | (0.09 | ) | — | (0.24 | ) | (0.03 | ) | (0.13 | ) | (0.05 | ) | |||||||||||||
|
| |||||||||||||||||||||||
Total distributions | (1.52 | ) | (1.01 | ) | (1.20 | ) | (1.31 | ) | (1.28 | ) | (0.36 | ) | ||||||||||||
|
| |||||||||||||||||||||||
Redemption fees | — | — | c | — | c | — | c | — | c | — | c | |||||||||||||
|
| |||||||||||||||||||||||
Net asset value, end of period | $17.01 | $18.56 | $19.15 | $20.01 | $18.61 | $19.94 | ||||||||||||||||||
|
| |||||||||||||||||||||||
Total returnd | (0.17)% | 2.12% | 1.89% | 15.31% | (0.61)% | 14.71% | ||||||||||||||||||
| Ratios to average net assetse | ||||||||||||||||||||||||
Expensesf | 0.51% | 0.51% | 0.51% | 0.55% | 0.56% | 0.55% | ||||||||||||||||||
Net investment income | 3.02% | 3.08% | 3.26% | 3.71% | 4.40% | 5.27% | ||||||||||||||||||
| Supplemental data | ||||||||||||||||||||||||
Net assets, end of period (000’s) | $314,491 | $323,491 | $280,963 | $307,142 | $269,819 | $272,232 | ||||||||||||||||||
Portfolio turnover rate | 27.46% | 39.14% | 34.39% | 43.26% | 34.18% | 8.77% | ||||||||||||||||||
aThe amount shown for a share outstanding throughout the period may not correlate with the Statement of Operations for the period due to the timing of sales and repurchases of the Fund’s shares in relation to income earned and/or fluctuating fair value of the investments of the Fund.
bBased on average daily shares outstanding.
cAmount rounds to less than $0.01 per share.
dTotal return does not include fees, charges or expenses imposed by the variable annuity and life insurance contracts for which Franklin Templeton Variable Insurance Products Trust serves as an underlying investment vehicle. Total return is not annualized for periods less than one year.
eRatios are annualized for periods less than one year.
fBenefit of expense reduction rounds to less than 0.01%.
| TGB-6 | Semiannual Report | The accompanying notes are an integral part of these financial statements. |
FRANKLIN TEMPLETON VARIABLE INSURANCE PRODUCTS TRUST
FINANCIAL HIGHLIGHTS
Templeton Global Bond VIP Fund (continued)
Six Months Ended (unaudited) | Year Ended December 31, | |||||||||||||||||||||||
| 2014 | 2013 | 2012 | 2011 | 2010 | ||||||||||||||||||||
| Class 2 | ||||||||||||||||||||||||
| Per share operating performance (for a share outstanding throughout the period) | ||||||||||||||||||||||||
Net asset value, beginning of period | $17.99 | $18.60 | $19.47 | $18.15 | $19.49 | $17.34 | ||||||||||||||||||
|
| |||||||||||||||||||||||
| Income from investment operationsa: | ||||||||||||||||||||||||
Net investment incomeb | 0.25 | 0.52 | 0.57 | 0.65 | 0.79 | 0.93 | ||||||||||||||||||
Net realized and unrealized gains (losses) | (0.30 | ) | (0.17 | ) | (0.27 | ) | 1.94 | (0.89 | ) | 1.54 | ||||||||||||||
|
| |||||||||||||||||||||||
Total from investment operations | (0.05 | ) | 0.35 | 0.30 | 2.59 | (0.10 | ) | 2.47 | ||||||||||||||||
|
| |||||||||||||||||||||||
| Less distributions from: | ||||||||||||||||||||||||
Net investment income and net foreign currency gains | (1.39 | ) | (0.96 | ) | (0.93 | ) | (1.24 | ) | (1.11 | ) | (0.27 | ) | ||||||||||||
Net realized gains | (0.09 | ) | — | (0.24 | ) | (0.03 | ) | (0.13 | ) | (0.05 | ) | |||||||||||||
|
| |||||||||||||||||||||||
Total distributions | (1.48 | ) | (0.96 | ) | (1.17 | ) | (1.27 | ) | (1.24 | ) | (0.32 | ) | ||||||||||||
|
| |||||||||||||||||||||||
Redemption fees | — | — | c | — | c | — | c | — | c | — | c | |||||||||||||
|
| |||||||||||||||||||||||
Net asset value, end of period | $16.46 | $17.99 | $18.60 | $19.47 | $18.15 | $19.49 | ||||||||||||||||||
|
| |||||||||||||||||||||||
Total returnd | (0.31)% | 1.83% | 1.63% | 15.07% | (0.87)% | 14.45% | ||||||||||||||||||
| Ratios to average net assetse | ||||||||||||||||||||||||
Expensesf | 0.76% | 0.76% | 0.76% | 0.80% | 0.81% | 0.80% | ||||||||||||||||||
Net investment income | 2.77% | 2.83% | 3.01% | 3.46% | 4.15% | 5.02% | ||||||||||||||||||
| Supplemental data | ||||||||||||||||||||||||
Net assets, end of period (000’s) | $3,182,833 | $3,177,638 | $2,826,039 | $2,418,229 | $1,812,814 | $1,490,794 | ||||||||||||||||||
Portfolio turnover rate | 27.46% | 39.14% | 34.39% | 43.26% | 34.18% | 8.77% | ||||||||||||||||||
aThe amount shown for a share outstanding throughout the period may not correlate with the Statement of Operations for the period due to the timing of sales and repurchases of the Fund’s shares in relation to income earned and/or fluctuating fair value of the investments of the Fund.
bBased on average daily shares outstanding.
cAmount rounds to less than $0.01 per share.
dTotal return does not include fees, charges or expenses imposed by the variable annuity and life insurance contracts for which Franklin Templeton Variable Insurance Products Trust serves as an underlying investment vehicle. Total return is not annualized for periods less than one year.
eRatios are annualized for periods less than one year.
fBenefit of expense reduction rounds to less than 0.01%.
| The accompanying notes are an integral part of these financial statements. | Semiannual Report | TGB-7 |
FRANKLIN TEMPLETON VARIABLE INSURANCE PRODUCTS TRUST
FINANCIAL HIGHLIGHTS
Templeton Global Bond VIP Fund (continued)
Six Months Ended (unaudited) | Year Ended December 31, | |||||||||||||||||||||||
| 2014 | 2013 | 2012 | 2011 | 2010 | ||||||||||||||||||||
| Class 4 | ||||||||||||||||||||||||
| Per share operating performance (for a share outstanding throughout the period) | ||||||||||||||||||||||||
Net asset value, beginning of period | $18.38 | $18.97 | $19.82 | $18.44 | $19.78 | $17.61 | ||||||||||||||||||
|
| |||||||||||||||||||||||
| Income from investment operationsa: | ||||||||||||||||||||||||
Net investment incomeb | 0.24 | 0.51 | 0.56 | 0.64 | 0.79 | 0.93 | ||||||||||||||||||
Net realized and unrealized gains (losses) | (0.30 | ) | (0.18 | ) | (0.28 | ) | 1.98 | (0.91 | ) | 1.56 | ||||||||||||||
|
| |||||||||||||||||||||||
Total from investment operations | (0.06 | ) | 0.33 | 0.28 | 2.62 | (0.12 | ) | 2.49 | ||||||||||||||||
|
| |||||||||||||||||||||||
| Less distributions from: | ||||||||||||||||||||||||
Net investment income and net foreign currency gains | (1.36 | ) | (0.92 | ) | (0.89 | ) | (1.21 | ) | (1.09 | ) | (0.27 | ) | ||||||||||||
Net realized gains | (0.09 | ) | — | (0.24 | ) | (0.03 | ) | (0.13 | ) | (0.05 | ) | |||||||||||||
|
| |||||||||||||||||||||||
Total distributions | (1.45 | ) | (0.92 | ) | (1.13 | ) | (1.24 | ) | (1.22 | ) | (0.32 | ) | ||||||||||||
|
| |||||||||||||||||||||||
Redemption fees | — | — | c | — | c | — | c | — | c | — | c | |||||||||||||
|
| |||||||||||||||||||||||
Net asset value, end of period | $16.87 | $18.38 | $18.97 | $19.82 | $18.44 | $19.78 | ||||||||||||||||||
|
| |||||||||||||||||||||||
Total returnd | (0.31)% | 1.69% | 1.54% | 14.97% | (0.96)% | 14.28% | ||||||||||||||||||
| Ratios to average net assetse | ||||||||||||||||||||||||
Expensesf | 0.86% | 0.86% | 0.86% | 0.90% | 0.91% | 0.90% | ||||||||||||||||||
Net investment income | 2.67% | 2.73% | 2.91% | 3.36% | 4.05% | 4.92% | ||||||||||||||||||
| Supplemental data | ||||||||||||||||||||||||
Net assets, end of period (000’s) | $112,169 | $111,199 | $118,145 | $163,241 | $151,695 | $150,891 | ||||||||||||||||||
Portfolio turnover rate | 27.46% | 39.14% | 34.39% | 43.26% | 34.18% | 8.77% | ||||||||||||||||||
aThe amount shown for a share outstanding throughout the period may not correlate with the Statement of Operations for the period due to the timing of sales and repurchases of the Fund’s shares in relation to income earned and/or fluctuating fair value of the investments of the Fund.
bBased on average daily shares outstanding.
cAmount rounds to less than $0.01 per share.
dTotal return does not include fees, charges or expenses imposed by the variable annuity and life insurance contracts for which Franklin Templeton Variable Insurance Products Trust serves as an underlying investment vehicle. Total return is not annualized for periods less than one year.
eRatios are annualized for periods less than one year.
fBenefit of expense reduction rounds to less than 0.01%.
| TGB-8 | Semiannual Report | The accompanying notes are an integral part of these financial statements. |
FRANKLIN TEMPLETON VARIABLE INSURANCE PRODUCTS TRUST
Statement of Investments, June 30, 2015 (unaudited)
Templeton Global Bond VIP Fund
| ||||||||||
Principal Amount* | Value | |||||||||
Foreign Government and Agency Securities 57.4% | ||||||||||
Brazil 4.2% | ||||||||||
Letra Tesouro Nacional, Strip, | ||||||||||
10/01/15 | 4,950 | a BRL | $ | 1,538,310 | ||||||
1/01/16 | 38,490 | a BRL | 11,564,962 | |||||||
7/01/16 | 8,470 | a BRL | 2,382,589 | |||||||
10/01/16 | 4,700 | a BRL | 1,278,541 | |||||||
1/01/17 | 46,660 | a BRL | 12,326,675 | |||||||
1/01/18 | 28,770 | a BRL | 6,776,823 | |||||||
Nota Do Tesouro Nacional, | ||||||||||
9.762%, 1/01/17 | 104,630 | a BRL | 31,961,466 | |||||||
10.00%, 1/01/21 | 9,240 | a BRL | 2,672,259 | |||||||
10.00%, 1/01/23 | 26,700 | a BRL | 7,570,231 | |||||||
b Index Linked, 6.00%, 8/15/16 | 14,388 | a BRL | 12,168,172 | |||||||
b Index Linked, 6.00%, 5/15/17 | 202 | a BRL | 171,030 | |||||||
b Index Linked, 6.00%, 8/15/18 | 15,665 | a BRL | 13,178,938 | |||||||
b Index Linked, 6.00%, 5/15/19 | 8,578 | a BRL | 7,180,752 | |||||||
b Index Linked, 6.00%, 8/15/20 | 1,090 | a BRL | 910,788 | |||||||
b Index Linked, 6.00%, 8/15/22 | 18,770 | a BRL | 15,643,442 | |||||||
b Index Linked, 6.00%, 5/15/23 | 5,716 | a BRL | 4,764,418 | |||||||
b Index Linked, 6.00%, 8/15/24 | 3,110 | a BRL | 2,635,160 | |||||||
b Index Linked, 6.00%, 5/15/45 | 10,825 | a BRL | 9,176,960 | |||||||
senior note, 10.00%, 1/01/19 | 21,390 | a BRL | 6,355,738 | |||||||
|
| |||||||||
| 150,257,254 | ||||||||||
|
| |||||||||
Hungary 3.9% | ||||||||||
Government of Hungary, | ||||||||||
4.125%, 2/19/18 | 13,132,000 | 13,692,802 | ||||||||
4.00%, 4/25/18 | 629,920,000 | HUF | 2,345,975 | |||||||
6.50%, 6/24/19 | 1,445,130,000 | HUF | 5,859,521 | |||||||
7.50%, 11/12/20 | 317,540,000 | HUF | 1,368,099 | |||||||
5.375%, 2/21/23 | 26,430,000 | 28,674,568 | ||||||||
A, 6.75%, 11/24/17 | 2,394,300,000 | HUF | 9,498,854 | |||||||
A, 5.50%, 12/20/18 | 446,060,000 | HUF | 1,746,997 | |||||||
A, 7.00%, 6/24/22 | 1,459,910,000 | HUF | 6,219,638 | |||||||
A, 6.00%, 11/24/23 | 1,118,980,000 | HUF | 4,574,351 | |||||||
B, 6.75%, 2/24/17 | 178,880,000 | HUF | 686,893 | |||||||
B, 5.50%, 6/24/25 | 2,661,360,000 | HUF | 10,671,975 | |||||||
senior note, 6.25%, 1/29/20 | 6,420,000 | 7,201,410 | ||||||||
senior note, 6.375%, 3/29/21 | 14,820,000 | 16,876,794 | ||||||||
c senior note, Reg S, 4.375%, 7/04/17 | 6,602,000 | EUR | 7,849,638 | |||||||
c senior note, Reg S, 5.75%, 6/11/18 | 14,475,000 | EUR | 18,242,492 | |||||||
c senior note, Reg S, 3.875%, 2/24/20 | 3,120,000 | EUR | 3,821,315 | |||||||
|
| |||||||||
| 139,331,322 | ||||||||||
|
| |||||||||
Iceland 0.2% | ||||||||||
| d | Government of Iceland, 144A, 5.875%, 5/11/22 | 7,660,000 | 8,641,399 | |||||||
|
| |||||||||
India 2.0% | ||||||||||
Government of India, | ||||||||||
senior bond, 7.80%, 5/03/20 | 720,800,000 | INR | 11,228,343 | |||||||
senior bond, 8.28%, 9/21/27 | 217,800,000 | INR | 3,457,039 | |||||||
senior bond, 8.60%, 6/02/28 | 747,500,000 | INR | 12,196,027 | |||||||
senior note, 7.28%, 6/03/19 | 28,000,000 | INR | 431,389 | |||||||
senior note, 8.12%, 12/10/20 | 541,300,000 | INR | 8,524,013 | |||||||
| Semiannual Report | TGB-9 |
FRANKLIN TEMPLETON VARIABLE INSURANCE PRODUCTS TRUST
STATEMENT OF INVESTMENTS (UNAUDITED)
Templeton Global Bond VIP Fund (continued)
Principal Amount* | Value | |||||||||
Foreign Government and Agency Securities (continued) | ||||||||||
India (continued) | ||||||||||
senior note, 8.35%, 5/14/22 | 212,700,000 | INR | $ | 3,387,852 | ||||||
senior note, 7.16%, 5/20/23 | 133,700,000 | INR | 1,986,151 | |||||||
senior note, 8.83%, 11/25/23 | 1,805,900,000 | INR | 29,607,967 | |||||||
|
| |||||||||
| 70,818,781 | ||||||||||
|
| |||||||||
Indonesia 4.6% | ||||||||||
Government of Indonesia, | ||||||||||
7.875%, 4/15/19 | 183,634,000,000 | IDR | 13,706,130 | |||||||
8.375%, 3/15/34 | 81,180,000,000 | IDR | 6,073,660 | |||||||
FR31, 11.00%, 11/15/20 | 243,036,000,000 | IDR | 20,377,208 | |||||||
FR34, 12.80%, 6/15/21 | 390,269,000,000 | IDR | 35,386,783 | |||||||
FR35, 12.90%, 6/15/22 | 67,421,000,000 | IDR | 6,267,207 | |||||||
FR36, 11.50%, 9/15/19 | 49,810,000,000 | IDR | 4,169,246 | |||||||
FR39, 11.75%, 8/15/23 | 5,491,000,000 | IDR | 493,953 | |||||||
FR40, 11.00%, 9/15/25 | 46,856,000,000 | IDR | 4,143,659 | |||||||
FR43, 10.25%, 7/15/22 | 146,713,000,000 | IDR | 12,134,456 | |||||||
FR44, 10.00%, 9/15/24 | 4,454,000,000 | IDR | 369,536 | |||||||
FR46, 9.50%, 7/15/23 | 226,780,000,000 | IDR | 18,168,003 | |||||||
FR48, 9.00%, 9/15/18 | 16,920,000,000 | IDR | 1,301,404 | |||||||
FR61, 7.00%, 5/15/22 | 198,861,000,000 | IDR | 13,983,289 | |||||||
senior bond, 5.625%, 5/15/23 | 240,596,000,000 | IDR | 15,311,433 | |||||||
senior bond, 9.00%, 3/15/29 | 20,350,000,000 | IDR | 1,610,294 | |||||||
senior bond, FR53, 8.25%, 7/15/21 | 51,204,000,000 | IDR | 3,839,424 | |||||||
senior bond, FR56, 8.375%, 9/15/26 | 4,994,000,000 | IDR | 377,420 | |||||||
senior note, 8.50%, 10/15/16 | 3,358,000,000 | IDR | 254,917 | |||||||
senior note, FR70, 8.375%, 3/15/24 | 113,021,000,000 | IDR | 8,527,966 | |||||||
|
| |||||||||
| 166,495,988 | ||||||||||
|
| |||||||||
Ireland 1.4% | ||||||||||
Government of Ireland, senior bond, 5.40%, 3/13/25 | 34,251,980 | EUR | 50,967,986 | |||||||
|
| |||||||||
Lithuania 0.5% | ||||||||||
| d | Government of Lithuania, 144A, | |||||||||
7.375%, 2/11/20 | 12,690,000 | 15,145,325 | ||||||||
6.125%, 3/09/21 | 3,240,000 | 3,741,050 | ||||||||
|
| |||||||||
| 18,886,375 | ||||||||||
|
| |||||||||
Malaysia 7.2% | ||||||||||
Government of Malaysia, | ||||||||||
3.835%, 8/12/15 | 204,045,000 | MYR | 54,095,840 | |||||||
4.72%, 9/30/15 | 47,770,000 | MYR | 12,705,643 | |||||||
3.197%, 10/15/15 | 193,520,000 | MYR | 51,287,029 | |||||||
senior bond, 4.262%, 9/15/16 | 57,800,000 | MYR | 15,524,172 | |||||||
senior bond, 3.814%, 2/15/17 | 63,345,000 | MYR | 16,959,783 | |||||||
senior bond, 4.24%, 2/07/18 | 44,360,000 | MYR | 12,035,066 | |||||||
senior note, 3.172%, 7/15/16 | 147,616,000 | MYR | 39,149,225 | |||||||
senior note, 3.394%, 3/15/17 | 220,880,000 | MYR | 58,751,564 | |||||||
|
| |||||||||
| 260,508,322 | ||||||||||
|
| |||||||||
Mexico 7.1% | ||||||||||
Government of Mexico, | ||||||||||
8.00%, 12/17/15 | 8,264,450 | f MXN | 53,734,528 | |||||||
6.25%, 6/16/16 | 5,519,810 | f MXN | 36,021,580 | |||||||
| TGB-10 | Semiannual Report |
FRANKLIN TEMPLETON VARIABLE INSURANCE PRODUCTS TRUST
STATEMENT OF INVESTMENTS (UNAUDITED)
Templeton Global Bond VIP Fund (continued)
Principal Amount* | Value | |||||||||
Foreign Government and Agency Securities (continued) | ||||||||||
Mexico (continued) | ||||||||||
7.25%, 12/15/16 | 18,216,300f | MXN | $ | 121,476,189 | ||||||
7.75%, 12/14/17 | 4,473,000f | MXN | 30,735,058 | |||||||
| g | Mexican Udibonos, Index Linked, | |||||||||
5.00%, 6/16/16 | 593,742h | MXN | 3,962,022 | |||||||
3.50%, 12/14/17 | 595,273h | MXN | 4,030,367 | |||||||
4.00%, 6/13/19 | 408,580h | MXN | 2,820,686 | |||||||
2.50%, 12/10/20 | 321,778h | MXN | 2,080,820 | |||||||
|
| |||||||||
| 254,861,250 | ||||||||||
|
| |||||||||
Peru 0.1% | ||||||||||
Government of Peru, senior bond, 7.84%, 8/12/20 | 11,090,000 | PEN | 3,876,665 | |||||||
|
| |||||||||
Philippines 1.3% | ||||||||||
Government of the Philippines, | ||||||||||
senior bond, 7.00%, 1/27/16 | 1,053,220,000 | PHP | 23,852,901 | |||||||
senior bond, 9.125%, 9/04/16 | 31,840,000 | PHP | 748,805 | |||||||
senior note, 1.625%, 4/25/16 | 985,550,000 | PHP | 21,730,804 | |||||||
|
| |||||||||
| 46,332,510 | ||||||||||
|
| |||||||||
Poland 5.9% | ||||||||||
Government of Poland, | ||||||||||
6.25%, 10/24/15 | 34,630,000 | PLN | 9,336,308 | |||||||
5.00%, 4/25/16 | 61,000,000 | PLN | 16,645,037 | |||||||
4.75%, 10/25/16 | 340,685,000 | PLN | 93,990,234 | |||||||
5.75%, 9/23/22 | 48,750,000 | PLN | 15,154,408 | |||||||
j FRN, 2.01%, 1/25/17 | 59,279,000 | PLN | 15,754,613 | |||||||
j FRN, 2.01%, 1/25/21 | 60,135,000 | PLN | 15,780,173 | |||||||
Strip, 1/25/16 | 177,077,000 | PLN | 46,644,168 | |||||||
|
| |||||||||
| 213,304,941 | ||||||||||
|
| |||||||||
Portugal 2.2% | ||||||||||
Government of Portugal, | ||||||||||
d 144A, 5.125%, 10/15/24 | 28,820,000 | 29,689,067 | ||||||||
c Reg S, 3.875%, 2/15/30 | 41,530,000 | EUR | 48,967,529 | |||||||
c senior bond, Reg S, 4.95%, 10/25/23 | 284,900 | EUR | 372,342 | |||||||
c senior note, Reg S, 5.65%, 2/15/24 | 712,400 | EUR | 969,449 | |||||||
|
| |||||||||
| 79,998,387 | ||||||||||
|
| |||||||||
Serbia 1.4% | ||||||||||
| d | Government of Serbia, senior note, 144A, | |||||||||
5.25%, 11/21/17 | 4,590,000 | 4,759,876 | ||||||||
4.875%, 2/25/20 | 8,800,000 | 8,918,756 | ||||||||
7.25%, 9/28/21 | 32,130,000 | 36,107,533 | ||||||||
|
| |||||||||
| 49,786,165 | ||||||||||
|
| |||||||||
Singapore 0.2% | ||||||||||
Government of Singapore, senior note, 1.125%, 4/01/16 | 11,000,000 | SGD | 8,181,602 | |||||||
|
| |||||||||
Slovenia 0.4% | ||||||||||
| d | Government of Slovenia, senior note, 144A, | |||||||||
5.50%, 10/26/22 | 8,140,000 | 9,069,629 | ||||||||
5.85%, 5/10/23 | 5,030,000 | 5,705,252 | ||||||||
|
| |||||||||
| 14,774,881 | ||||||||||
|
| |||||||||
| Semiannual Report | TGB-11 |
FRANKLIN TEMPLETON VARIABLE INSURANCE PRODUCTS TRUST
STATEMENT OF INVESTMENTS (UNAUDITED)
Templeton Global Bond VIP Fund (continued)
Principal Amount* | Value | |||||||||
Foreign Government and Agency Securities (continued) | ||||||||||
South Korea 11.2% | ||||||||||
Korea Monetary Stabilization Bond, senior note, | ||||||||||
2.80%, 8/02/15 | 68,737,030,000 | KRW | $ | 61,460,411 | ||||||
2.81%, 10/02/15 | 2,932,000,000 | KRW | 2,627,084 | |||||||
2.90%, 12/02/15 | 55,739,500,000 | KRW | 50,065,236 | |||||||
2.78%, 2/02/16 | 20,416,550,000 | KRW | 18,364,135 | |||||||
2.80%, 4/02/16 | 38,761,670,000 | KRW | 34,936,358 | |||||||
2.79%, 6/02/16 | 24,830,400,000 | KRW | 22,418,661 | |||||||
1.62%, 6/09/16 | 6,427,100,000 | KRW | 5,741,406 | |||||||
2.46%, 8/02/16 | 48,720,700,000 | KRW | 43,904,766 | |||||||
2.22%, 10/02/16 | 8,481,500,000 | KRW | 7,628,517 | |||||||
2.07%, 12/02/16 | 32,544,900,000 | KRW | 29,238,205 | |||||||
1.96%, 2/02/17 | 16,503,100,000 | KRW | 14,809,278 | |||||||
Korea Treasury Bond, | ||||||||||
senior bond, 4.00%, 3/10/16 | 1,283,100,000 | KRW | 1,165,086 | |||||||
senior note, 4.00%, 9/10/15 | 3,390,100,000 | KRW | 3,042,236 | |||||||
senior note, 2.75%, 12/10/15 | 32,942,000,000 | KRW | 29,576,510 | |||||||
senior note, 2.75%, 6/10/16 | 41,481,500,000 | KRW | 37,447,018 | |||||||
senior note, 5.00%, 9/10/16 | 2,806,000,000 | KRW | 2,605,166 | |||||||
senior note, 3.00%, 12/10/16 | 44,123,360,000 | KRW | 40,160,950 | |||||||
|
| |||||||||
| 405,191,023 | ||||||||||
|
| |||||||||
Sri Lanka 1.3% | ||||||||||
Government of Sri Lanka, | ||||||||||
8.25%, 3/01/17 | 41,710,000 | LKR | 317,901 | |||||||
8.00%, 6/15/17 | 40,210,000 | LKR | 305,302 | |||||||
10.60%, 7/01/19 | 447,990,000 | LKR | 3,641,052 | |||||||
10.60%, 9/15/19 | 644,010,000 | LKR | 5,234,932 | |||||||
8.00%, 11/01/19 | 40,210,000 | LKR | 299,151 | |||||||
11.20%, 7/01/22 | 69,990,000 | LKR | 584,502 | |||||||
A, 6.50%, 7/15/15 | 239,920,000 | LKR | 1,792,089 | |||||||
A, 11.00%, 8/01/15 | 1,349,700,000 | LKR | 10,117,206 | |||||||
A, 8.50%, 11/01/15 | 144,870,000 | LKR | 1,088,786 | |||||||
A, 6.40%, 8/01/16 | 109,200,000 | LKR | 814,270 | |||||||
A, 5.80%, 1/15/17 | 112,300,000 | LKR | 825,819 | |||||||
A, 7.50%, 8/15/18 | 63,830,000 | LKR | 474,010 | |||||||
A, 8.00%, 11/15/18 | 512,300,000 | LKR | 3,849,348 | |||||||
A, 9.00%, 5/01/21 | 861,720,000 | LKR | 6,506,761 | |||||||
B, 6.40%, 10/01/16 | 119,100,000 | LKR | 885,974 | |||||||
B, 8.50%, 7/15/18 | 146,350,000 | LKR | 1,115,431 | |||||||
C, 8.50%, 4/01/18 | 483,480,000 | LKR | 3,694,511 | |||||||
D, 8.50%, 6/01/18 | 633,000,000 | LKR | 4,830,425 | |||||||
|
| |||||||||
| 46,377,470 | ||||||||||
|
| |||||||||
| k | Supranational 0.4% | |||||||||
Inter-American Development Bank, senior note, 7.50%, 12/05/24 | 200,000,000 | MXN | 14,468,398 | |||||||
|
| |||||||||
Ukraine 1.9% | ||||||||||
| d | Government of Ukraine, | |||||||||
144A, 9.25%, 7/24/17 | 57,230,000 | 27,863,856 | ||||||||
144A, 7.75%, 9/23/20 | 17,227,000 | 8,508,157 | ||||||||
senior bond, 144A, 6.58%, 11/21/16 | 12,541,000 | 6,239,148 | ||||||||
senior bond, 144A, 7.80%, 11/28/22 | 10,110,000 | 5,320,388 | ||||||||
| TGB-12 | Semiannual Report |
FRANKLIN TEMPLETON VARIABLE INSURANCE PRODUCTS TRUST
STATEMENT OF INVESTMENTS (UNAUDITED)
Templeton Global Bond VIP Fund (continued)
Principal Amount* | Value | |||||||||
Foreign Government and Agency Securities (continued) | ||||||||||
Ukraine (continued) | ||||||||||
senior note, 144A, 4.95%, 10/13/15 | 290,000 | EUR | $ | 170,887 | ||||||
senior note, 144A, 6.25%, 6/17/16 | 8,760,000 | 4,341,675 | ||||||||
senior note, 144A, 7.95%, 2/23/21 | 24,098,000 | 12,726,756 | ||||||||
senior note, 144A, 7.50%, 4/17/23 | 8,160,000 | 4,289,100 | ||||||||
|
| |||||||||
| 69,459,967 | ||||||||||
|
| |||||||||
Total Foreign Government and Agency Securities (Cost $2,295,326,495) | 2,072,520,686 | |||||||||
|
| |||||||||
Quasi-Sovereign and Corporate Bonds 0.1% | ||||||||||
South Korea 0.0%† | ||||||||||
The Export-Import Bank of Korea, senior note, 4.625%, 2/20/17 | 230,000 | EUR | 274,315 | |||||||
|
| |||||||||
Ukraine 0.1% | ||||||||||
| d | Financing of Infrastructure Projects State Enterprise, 144A, | |||||||||
8.375%, 11/03/17 | 1,100,000 | 538,131 | ||||||||
7.40%, 4/20/18 | 840,000 | 415,800 | ||||||||
| c,l | State Export-Import Bank of Ukraine, (Biz Finance PLC), loan participation, Reg S, 8.75%, 1/22/18 | 2,480,000 | 1,858,450 | |||||||
|
| |||||||||
| 2,812,381 | ||||||||||
|
| |||||||||
Total Quasi-Sovereign and Corporate Bonds (Cost $4,126,532) | 3,086,696 | |||||||||
|
| |||||||||
Total Investments before Short Term Investments (Cost $2,299,453,027) | 2,075,607,382 | |||||||||
|
| |||||||||
Short Term Investments 29.0% | ||||||||||
Foreign Government and Agency Securities 16.4% | ||||||||||
Indonesia 0.1% | ||||||||||
| e | Indonesia Treasury Bills, 1/07/16 - 2/04/16 | 40,862,000,000 | IDR | 2,965,687 | ||||||
|
| |||||||||
Malaysia 3.3% | ||||||||||
| e | Bank of Negara Monetary Notes, 7/16/15 - 11/24/15 | 350,910,000 | MYR | 92,358,280 | ||||||
| e | Malaysia Treasury Bills, 4/29/15 - 5/27/16 | 102,330,000 | MYR | 26,895,130 | ||||||
|
| |||||||||
| 119,253,410 | ||||||||||
|
| |||||||||
Mexico 7.3% | ||||||||||
| e | Mexico Treasury Bills, | |||||||||
3/31/16 | 132,797,920 | i MXN | 82,303,525 | |||||||
9/17/15 - 6/23/16 | 292,512,040 | i MXN | 182,207,957 | |||||||
|
| |||||||||
| 264,511,482 | ||||||||||
|
| |||||||||
Philippines 0.5% | ||||||||||
| e | Philippine Treasury Bills, 7/08/15 - 3/02/16 | 817,460,000 | PHP | 18,017,235 | ||||||
|
| |||||||||
Singapore 3.4% | ||||||||||
| e | Monetary Authority of Singapore Treasury Bills, | |||||||||
7/31/15 | 56,520,000 | SGD | 41,938,688 | |||||||
7/03/15 - 8/21/15 | 107,130,000 | SGD | 79,488,782 | |||||||
|
| |||||||||
| 121,427,470 | ||||||||||
|
| |||||||||
| Semiannual Report | TGB-13 |
FRANKLIN TEMPLETON VARIABLE INSURANCE PRODUCTS TRUST
STATEMENT OF INVESTMENTS (UNAUDITED)
Templeton Global Bond VIP Fund (continued)
Principal Amount* | Value | |||||||||
Short Term Investments (continued) | ||||||||||
Foreign Government and Agency Securities (continued) | ||||||||||
South Korea 1.8% | ||||||||||
Korea Monetary Stabilization Bonds, | ||||||||||
e 7/07/15 - 12/15/15 | 56,995,780,000 | KRW | $ | 50,700,245 | ||||||
senior note, 2.13%, 10/08/15 | 3,266,500,000 | KRW | 2,922,022 | |||||||
senior note, 1.92%, 3/09/16 | 640,770,000 | KRW | 573,641 | |||||||
senior note, 1.74%, 5/09/16 | 11,405,300,000 | KRW | 10,199,107 | |||||||
|
| |||||||||
| 64,395,015 | ||||||||||
|
| |||||||||
Total Foreign Government and Agency Securities (Cost $615,412,396) | 590,570,299 | |||||||||
|
| |||||||||
U.S. Government and Agency Securities 11.8% | ||||||||||
United States 11.8% | ||||||||||
| e | FHLB, | |||||||||
7/01/15 | 223,446,000 | 223,446,000 | ||||||||
7/06/15 | 203,295,000 | 203,294,797 | ||||||||
|
| |||||||||
Total U.S. Government and Agency Securities (Cost $426,739,681) | 426,740,797 | |||||||||
|
| |||||||||
Total Investments before Repurchase Agreements (Cost $3,341,605,104) | 3,092,918,478 | |||||||||
|
| |||||||||
Repurchase Agreements (Cost $29,083,774) 0.8% | ||||||||||
United States 0.8% | ||||||||||
| m | Joint Repurchase Agreement, 0.095%, 7/01/15 (Maturity Value $29,083,851) | 29,083,774 | 29,083,774 | |||||||
BNP Paribas Securities Corp. (Maturity Value $7,137,177) | ||||||||||
HSBC Securities (USA) Inc. (Maturity Value $14,988,072) Merrill Lynch, Pierce, Fenner & Smith Inc. (Maturity Value $6,958,602) | ||||||||||
Collateralized by U.S. Government Agency Securities, 0.000% - 5.50%, 12/01/15 - 6/12/20; U.S. Government Agency Securities, Strips, 6/01/17; eU.S. Treasury Bills, 3/31/16; U.S. Treasury Bonds, 3.125%, 8/15/44; and U.S. Treasury Notes, 1.25% - 1.75%, 1/31/19 - 9/30/19 (valued at $29,671,401) | ||||||||||
|
| |||||||||
Total Investments (Cost $3,370,688,878) 86.5% | 3,122,002,252 | |||||||||
Other Assets, less Liabilities 13.5% | 487,491,722 | |||||||||
|
| |||||||||
Net Assets 100.0% | $ | 3,609,493,974 | ||||||||
|
| |||||||||
| TGB-14 | Semiannual Report |
FRANKLIN TEMPLETON VARIABLE INSURANCE PRODUCTS TRUST
STATEMENT OF INVESTMENTS (UNAUDITED)
Templeton Global Bond VIP Fund (continued)
See Abbreviations on page TGB-38.
†Rounds to less than 0.1% of net assets.
*The principal amount is stated in U.S. dollars unless otherwise indicated.
aPrincipal amount is stated in 1,000 Brazilian Real Units.
bRedemption price at maturity is adjusted for inflation. See Note 1(h).
cSecurity was purchased pursuant to Regulation S under the Securities Act of 1933, which exempts from registration securities offered and sold outside of the United States. Such a security cannot be sold in the United States without either an effective registration statement filed pursuant to the Securities Act of 1933, or pursuant to an exemption from registration. These securities have been deemed liquid under guidelines approved by the Trust’s Board of Trustees. At June 30, 2015, the aggregate value of these securities was $82,081,215, representing 2.27% of net assets.
dSecurity was purchased pursuant to Rule 144A under the Securities Act of 1933 and may be sold in transactions exempt from registration only to qualified institutional buyers or in a public offering registered under the Securities Act of 1933. These securities have been deemed liquid under guidelines approved by the Trust’s Board of Trustees. At June 30, 2015, the aggregate value of these securities was $192,191,785, representing 5.32% of net assets.
eThe security is traded on a discount basis with no stated coupon rate.
fPrincipal amount is stated in 100 Mexican Peso Units.
gPrincipal amount of security is adjusted for inflation. See Note 1(h).
hPrincipal amount is stated in Unidad de Inversion Units.
iPrincipal amount is stated in 10 Mexican Peso Units.
jThe coupon rate shown represents the rate at period end.
kA supranational organization is an entity formed by two or more central governments through international treaties.
lSee Note 1(f) regarding loan participation notes.
mSee Note 1(c) regarding joint repurchase agreement.
At June 30, 2015, the Fund had the following forward exchange contracts outstanding. See Note 1(d).
| Forward Exchange Contracts | ||||||||||||||||||||||||||||||
| Currency | Counterpartya | Type | Quantity | Contract Amount* | Settlement Date | Unrealized Appreciation | Unrealized Depreciation | |||||||||||||||||||||||
| OTC Forward Exchange Contracts | ||||||||||||||||||||||||||||||
Malaysian Ringgit | JPHQ | Buy | 5,661,200 | 1,519,785 | 7/03/15 | $ | — | $ | (20,729 | ) | ||||||||||||||||||||
Chilean Peso | DBAB | Buy | 719,621,000 | 1,148,710 | 7/06/15 | — | (23,675 | ) | ||||||||||||||||||||||
Chilean Peso | DBAB | Sell | 719,621,000 | 1,136,842 | 7/06/15 | 11,807 | — | |||||||||||||||||||||||
Chilean Peso | MSCO | Buy | 3,180,970,000 | 5,105,317 | 7/06/15 | — | (132,278 | ) | ||||||||||||||||||||||
Chilean Peso | MSCO | Sell | 3,180,970,000 | 5,027,215 | 7/06/15 | 54,175 | — | |||||||||||||||||||||||
Indian Rupee | DBAB | Buy | 457,757,494 | 7,153,858 | 7/06/15 | 41,302 | — | |||||||||||||||||||||||
Indian Rupee | DBAB | Sell | 457,757,494 | 7,173,758 | 7/06/15 | — | (21,402 | ) | ||||||||||||||||||||||
Chilean Peso | DBAB | Buy | 1,461,296,000 | 2,316,723 | 7/07/15 | — | (32,392 | ) | ||||||||||||||||||||||
Chilean Peso | DBAB | Sell | 1,461,296,000 | 2,308,524 | 7/07/15 | 24,194 | — | |||||||||||||||||||||||
Chilean Peso | DBAB | Buy | 1,151,779,000 | 1,828,656 | 7/08/15 | — | (28,342 | ) | ||||||||||||||||||||||
Malaysian Ringgit | DBAB | Buy | 8,862,500 | 2,449,219 | 7/08/15 | — | (103,521 | ) | ||||||||||||||||||||||
Malaysian Ringgit | DBAB | Sell | 8,862,500 | 2,456,211 | 7/08/15 | 110,513 | — | |||||||||||||||||||||||
Chilean Peso | CITI | Buy | 2,285,090,000 | 3,618,053 | 7/09/15 | — | (46,635 | ) | ||||||||||||||||||||||
Hungarian Forint | DBAB | Buy | 18,260,690,000 | 58,591,703 | EUR | 7/09/15 | — | (758,431 | ) | |||||||||||||||||||||
Indian Rupee | DBAB | Buy | 258,123,000 | 4,070,704 | 7/09/15 | 5,595 | (21,026 | ) | ||||||||||||||||||||||
Polish Zloty | DBAB | Buy | 17,528,000 | 4,201,846 | EUR | 7/09/15 | — | (25,973 | ) | |||||||||||||||||||||
Mexican Peso | CITI | Buy | 105,786,172 | 7,946,081 | 7/10/15 | — | (1,220,944 | ) | ||||||||||||||||||||||
Mexican Peso | CITI | Sell | 105,786,172 | 6,930,981 | 7/10/15 | 205,844 | — | |||||||||||||||||||||||
Chilean Peso | DBAB | Buy | 1,284,460,000 | 2,080,771 | 7/13/15 | — | (74,029 | ) | ||||||||||||||||||||||
Mexican Peso | CITI | Buy | 109,357,558 | 7,383,237 | 7/13/15 | — | (432,637 | ) | ||||||||||||||||||||||
Mexican Peso | CITI | Sell | 109,357,558 | 7,163,472 | 7/13/15 | 212,871 | — | |||||||||||||||||||||||
Polish Zloty | BZWS | Buy | 17,528,000 | 4,213,092 | EUR | 7/13/15 | — | (39,294 | ) | |||||||||||||||||||||
Polish Zloty | CITI | Buy | 5,990,000 | 1,436,322 | EUR | 7/13/15 | — | (9,576 | ) | |||||||||||||||||||||
Polish Zloty | DBAB | Buy | 17,528,000 | 4,198,122 | EUR | 7/13/15 | — | (22,608 | ) | |||||||||||||||||||||
Malaysian Ringgit | DBAB | Buy | 18,006,622 | 5,557,599 | 7/14/15 | — | (794,212 | ) | ||||||||||||||||||||||
Malaysian Ringgit | DBAB | Sell | 18,006,622 | 4,987,984 | 7/14/15 | 224,596 | — | |||||||||||||||||||||||
Polish Zloty | DBAB | Buy | 30,704,000 | 7,396,415 | EUR | 7/14/15 | — | (87,338 | ) | |||||||||||||||||||||
Chilean Peso | MSCO | Buy | 2,370,410,000 | 3,780,860 | 7/15/15 | — | (78,222 | ) | ||||||||||||||||||||||
Indian Rupee | DBAB | Buy | 239,338,000 | 3,782,445 | 7/15/15 | — | (25,955 | ) | ||||||||||||||||||||||
Malaysian Ringgit | DBAB | Buy | 13,610,000 | 4,200,617 | 7/15/15 | — | (600,612 | ) | ||||||||||||||||||||||
| Semiannual Report | TGB-15 |
FRANKLIN TEMPLETON VARIABLE INSURANCE PRODUCTS TRUST
STATEMENT OF INVESTMENTS (UNAUDITED)
Templeton Global Bond VIP Fund (continued)
| Forward Exchange Contracts (continued) | ||||||||||||||||||||||||||||||
| Currency | Counterpartya | Type | Quantity | Contract Amount* | Settlement Date | Unrealized Appreciation | Unrealized Depreciation | |||||||||||||||||||||||
Malaysian Ringgit | DBAB | Sell | 13,610,000 | 3,769,770 | 7/15/15 | $ | 169,765 | $ | — | |||||||||||||||||||||
Euro | BZWS | Sell | 2,243,000 | 3,063,624 | 7/16/15 | 563,362 | — | |||||||||||||||||||||||
Euro | MSCO | Sell | 9,679,000 | 13,215,319 | 7/16/15 | 2,426,184 | — | |||||||||||||||||||||||
Japanese Yen | HSBC | Sell | 536,380,000 | 4,620,779 | 7/16/15 | 237,343 | — | |||||||||||||||||||||||
Japanese Yen | SCNY | Sell | 707,660,000 | 6,070,635 | 7/16/15 | 287,455 | — | |||||||||||||||||||||||
Chilean Peso | MSCO | Buy | 1,592,750,000 | 2,507,517 | 7/17/15 | — | (20,080 | ) | ||||||||||||||||||||||
Indian Rupee | JPHQ | Buy | 21,500,000 | 339,585 | 7/17/15 | — | (2,245 | ) | ||||||||||||||||||||||
Chilean Peso | BZWS | Buy | 199,342,000 | 311,837 | 7/20/15 | — | (609 | ) | ||||||||||||||||||||||
Chilean Peso | DBAB | Buy | 2,188,820,000 | 3,517,872 | 7/20/15 | — | (100,520 | ) | ||||||||||||||||||||||
Chilean Peso | MSCO | Buy | 4,469,425,000 | 7,036,527 | 7/20/15 | — | (58,520 | ) | ||||||||||||||||||||||
Euro | BZWS | Sell | 3,518,000 | 4,769,458 | 7/20/15 | 847,744 | — | |||||||||||||||||||||||
Indian Rupee | DBAB | Buy | 491,655,000 | 7,759,094 | 7/20/15 | — | (48,657 | ) | ||||||||||||||||||||||
Malaysian Ringgit | DBAB | Buy | 2,637,000 | 807,781 | 7/20/15 | — | (110,574 | ) | ||||||||||||||||||||||
Malaysian Ringgit | DBAB | Buy | 11,455,000 | 2,581,641 | EUR | 7/20/15 | 150,732 | — | ||||||||||||||||||||||
Malaysian Ringgit | DBAB | Sell | 2,637,000 | 730,127 | 7/20/15 | 32,920 | — | |||||||||||||||||||||||
Japanese Yen | DBAB | Sell | 858,140,000 | 7,379,628 | 7/21/15 | 366,242 | — | |||||||||||||||||||||||
Euro | DBAB | Sell | 1,935,000 | 2,623,667 | 7/22/15 | 466,553 | — | |||||||||||||||||||||||
Euro | MSCO | Sell | 12,182,000 | 16,491,261 | 7/22/15 | 2,910,922 | — | |||||||||||||||||||||||
Indian Rupee | DBAB | Buy | 79,271,000 | 1,247,708 | 7/22/15 | — | (4,934 | ) | ||||||||||||||||||||||
Indian Rupee | JPHQ | Buy | 378,455,000 | 5,959,612 | 7/22/15 | — | (26,370 | ) | ||||||||||||||||||||||
Malaysian Ringgit | DBAB | Buy | 4,160,000 | 1,279,016 | 7/22/15 | — | (179,333 | ) | ||||||||||||||||||||||
Malaysian Ringgit | DBAB | Buy | 12,933,000 | 2,932,587 | EUR | 7/22/15 | 149,589 | — | ||||||||||||||||||||||
Malaysian Ringgit | DBAB | Sell | 4,160,000 | 1,151,621 | 7/22/15 | 51,937 | — | |||||||||||||||||||||||
Chilean Peso | DBAB | Buy | 2,227,910,000 | 3,527,127 | 7/23/15 | — | (49,743 | ) | ||||||||||||||||||||||
Euro | DBAB | Sell | 1,759,000 | 2,382,882 | 7/23/15 | 421,944 | — | |||||||||||||||||||||||
Singapore Dollar | JPHQ | Buy | 5,740,000 | 4,294,157 | 7/23/15 | — | (34,156 | ) | ||||||||||||||||||||||
Japanese Yen | CITI | Sell | 913,412,000 | 9,038,135 | 7/24/15 | 1,572,740 | — | |||||||||||||||||||||||
Japanese Yen | JPHQ | Sell | 1,407,000,000 | 13,914,849 | 7/24/15 | 2,415,317 | — | |||||||||||||||||||||||
Chilean Peso | JPHQ | Buy | 1,501,938,000 | 2,412,171 | 7/27/15 | — | (68,801 | ) | ||||||||||||||||||||||
Euro | DBAB | Sell | 4,715,000 | 6,358,460 | 7/27/15 | 1,101,877 | — | |||||||||||||||||||||||
Euro | GSCO | Sell | 4,711,000 | 6,355,846 | 7/27/15 | 1,103,722 | — | |||||||||||||||||||||||
Indian Rupee | DBAB | Buy | 130,201,000 | 2,026,948 | 7/27/15 | 12,631 | — | |||||||||||||||||||||||
Japanese Yen | JPHQ | Sell | 490,100,000 | 4,849,594 | 7/27/15 | 843,812 | — | |||||||||||||||||||||||
Malaysian Ringgit | DBAB | Buy | 5,058,000 | 1,563,959 | 7/27/15 | — | (227,487 | ) | ||||||||||||||||||||||
Malaysian Ringgit | DBAB | Buy | 16,628,000 | 3,811,838 | EUR | 7/27/15 | 143,926 | — | ||||||||||||||||||||||
Malaysian Ringgit | DBAB | Sell | 5,058,000 | 1,399,635 | 7/27/15 | 63,162 | — | |||||||||||||||||||||||
Malaysian Ringgit | JPHQ | Buy | 9,715,000 | 2,649,521 | 7/27/15 | — | (82,533 | ) | ||||||||||||||||||||||
Chilean Peso | DBAB | Buy | 1,967,720,000 | 3,386,490 | 7/28/15 | — | (316,687 | ) | ||||||||||||||||||||||
Chilean Peso | MSCO | Buy | 1,963,430,000 | 3,378,293 | 7/28/15 | — | (315,183 | ) | ||||||||||||||||||||||
Euro | CITI | Sell | 1,935,410 | 2,610,733 | 7/28/15 | 452,984 | — | |||||||||||||||||||||||
Euro | GSCO | Sell | 11,263,000 | 15,199,644 | 7/28/15 | 2,642,758 | — | |||||||||||||||||||||||
Japanese Yen | BZWS | Sell | 1,079,470,000 | 10,640,152 | 7/29/15 | 1,816,991 | — | |||||||||||||||||||||||
Chilean Peso | JPHQ | Buy | 675,370,000 | 1,160,629 | 7/30/15 | — | (107,199 | ) | ||||||||||||||||||||||
Malaysian Ringgit | JPHQ | Buy | 5,318,000 | 1,644,403 | 7/30/15 | — | (239,606 | ) | ||||||||||||||||||||||
Malaysian Ringgit | JPHQ | Buy | 16,628,000 | 3,812,712 | EUR | 7/30/15 | 141,604 | — | ||||||||||||||||||||||
Chilean Peso | DBAB | Buy | 635,690,000 | 1,093,096 | 7/31/15 | — | (101,653 | ) | ||||||||||||||||||||||
Euro | JPHQ | Sell | 11,263,000 | 15,142,653 | 7/31/15 | 2,585,238 | — | |||||||||||||||||||||||
Indian Rupee | DBAB | Buy | 326,663,137 | 5,067,255 | 7/31/15 | 46,549 | — | |||||||||||||||||||||||
Malaysian Ringgit | HSBC | Buy | 3,005,000 | 925,128 | 7/31/15 | — | (131,411 | ) | ||||||||||||||||||||||
Malaysian Ringgit | JPHQ | Buy | 11,703,000 | 3,604,028 | 7/31/15 | — | (512,889 | ) | ||||||||||||||||||||||
Polish Zloty | CITI | Buy | 135,806,000 | 36,404,528 | 7/31/15 | — | (341,991 | ) | ||||||||||||||||||||||
Chilean Peso | DBAB | Buy | 1,271,380,000 | 2,156,343 | 8/04/15 | — | (174,215 | ) | ||||||||||||||||||||||
Euro | BZWS | Sell | 282,898 | 379,461 | 8/04/15 | 64,032 | — | |||||||||||||||||||||||
Euro | HSBC | Sell | 11,263,000 | 15,115,228 | 8/04/15 | 2,557,079 | — | |||||||||||||||||||||||
Chilean Peso | BZWS | Buy | 1,142,900,000 | 1,853,401 | 8/05/15 | — | (71,749 | ) | ||||||||||||||||||||||
Euro | BZWS | Sell | 7,003,000 | 9,413,958 | 8/05/15 | 1,605,559 | — | |||||||||||||||||||||||
| TGB-16 | Semiannual Report |
FRANKLIN TEMPLETON VARIABLE INSURANCE PRODUCTS TRUST
STATEMENT OF INVESTMENTS (UNAUDITED)
Templeton Global Bond VIP Fund (continued)
| Forward Exchange Contracts (continued) | ||||||||||||||||||||||||||||||
| Currency | Counterpartya | Type | Quantity | Contract Amount* | Settlement Date | Unrealized Appreciation | Unrealized Depreciation | |||||||||||||||||||||||
Euro | JPHQ | Sell | 5,724,900 | 7,696,327 | 8/05/15 | $ | 1,313,019 | $ | — | |||||||||||||||||||||
Indian Rupee | HSBC | Buy | 120,016,750 | 1,865,570 | 8/05/15 | 11,710 | — | |||||||||||||||||||||||
Chilean Peso | DBAB | Buy | 760,285,000 | 1,234,489 | 8/06/15 | — | (49,404 | ) | ||||||||||||||||||||||
Malaysian Ringgit | DBAB | Buy | 143,249,150 | 34,519,531 | EUR | 8/06/15 | — | (676,370 | ) | |||||||||||||||||||||
Malaysian Ringgit | HSBC | Buy | 21,208,085 | 6,488,828 | 8/06/15 | — | (890,491 | ) | ||||||||||||||||||||||
Malaysian Ringgit | JPHQ | Buy | 1,100,000 | 338,826 | 8/06/15 | — | (48,457 | ) | ||||||||||||||||||||||
Singapore Dollar | DBAB | Buy | 6,207,000 | 4,986,343 | 8/06/15 | — | (380,750 | ) | ||||||||||||||||||||||
Euro | CITI | Sell | 7,698,954 | 10,300,172 | 8/10/15 | 1,715,151 | — | |||||||||||||||||||||||
Malaysian Ringgit | HSBC | Buy | 1,320,000 | 364,440 | 8/10/15 | — | (16,138 | ) | ||||||||||||||||||||||
South Korean Won | HSBC | Buy | 21,363,430,000 | 19,509,982 | 8/10/15 | — | (448,714 | ) | ||||||||||||||||||||||
Chilean Peso | MSCO | Buy | 2,814,050,000 | 4,565,521 | 8/11/15 | — | (181,248 | ) | ||||||||||||||||||||||
Euro | DBAB | Sell | 4,845,000 | 6,492,082 | 8/11/15 | 1,089,396 | — | |||||||||||||||||||||||
Euro | JPHQ | Sell | 6,343,900 | 8,496,861 | 8/11/15 | 1,422,743 | — | |||||||||||||||||||||||
Indian Rupee | HSBC | Buy | 251,448,000 | 3,863,675 | 8/11/15 | 65,556 | — | |||||||||||||||||||||||
Japanese Yen | CITI | Sell | 751,731,000 | 7,378,955 | 8/11/15 | 1,233,726 | — | |||||||||||||||||||||||
Malaysian Ringgit | HSBC | Buy | 2,230,000 | 680,895 | 8/11/15 | — | (92,536 | ) | ||||||||||||||||||||||
Singapore Dollar | HSBC | Buy | 6,206,000 | 4,596,697 | 8/11/15 | 7,827 | — | |||||||||||||||||||||||
Chilean Peso | DBAB | Buy | 1,145,000,000 | 1,934,775 | 8/12/15 | — | (151,043 | ) | ||||||||||||||||||||||
Indian Rupee | DBAB | Buy | 39,609,000 | 607,693 | 8/12/15 | 11,152 | — | |||||||||||||||||||||||
Indian Rupee | HSBC | Buy | 42,784,000 | 656,304 | 8/12/15 | 12,147 | — | |||||||||||||||||||||||
Indian Rupee | JPHQ | Buy | 60,607,000 | 939,527 | 8/12/15 | 7,388 | — | |||||||||||||||||||||||
Malaysian Ringgit | HSBC | Buy | 6,100,000 | 1,857,321 | 8/12/15 | — | (248,070 | ) | ||||||||||||||||||||||
Singapore Dollar | BZWS | Buy | 1,717,028 | 1,266,992 | 8/12/15 | 6,933 | — | |||||||||||||||||||||||
Singapore Dollar | DBAB | Buy | 12,363,000 | 9,119,611 | 8/12/15 | 52,951 | — | |||||||||||||||||||||||
South Korean Won | HSBC | Buy | 11,980,000,000 | 1,157,868,285 | JPY | 8/12/15 | 1,223,087 | — | ||||||||||||||||||||||
Indian Rupee | HSBC | Buy | 108,000,000 | 1,664,111 | 8/13/15 | 22,988 | — | |||||||||||||||||||||||
Euro | MSCO | Sell | 1,962,500 | �� | 2,451,084 | 8/14/15 | 262,593 | — | ||||||||||||||||||||||
Chilean Peso | CITI | Buy | 3,039,493,000 | 5,030,857 | 8/17/15 | — | (298,059 | ) | ||||||||||||||||||||||
Chilean Peso | JPHQ | Buy | 612,933,000 | 1,015,378 | 8/17/15 | — | (60,979 | ) | ||||||||||||||||||||||
Euro | MSCO | Sell | 1,962,500 | 2,634,705 | 8/17/15 | 446,119 | — | |||||||||||||||||||||||
Japanese Yen | CITI | Sell | 684,870,000 | 5,746,663 | 8/17/15 | 147,643 | — | |||||||||||||||||||||||
Singapore Dollar | BZWS | Buy | 4,886,000 | 3,604,042 | 8/17/15 | 20,802 | — | |||||||||||||||||||||||
Singapore Dollar | HSBC | Buy | 3,667,000 | 2,700,145 | 8/17/15 | 20,342 | — | |||||||||||||||||||||||
Chilean Peso | MSCO | Buy | 981,300,000 | 1,653,551 | 8/18/15 | — | (125,714 | ) | ||||||||||||||||||||||
Euro | BZWS | Sell | 7,066,000 | 9,482,678 | 8/18/15 | 1,602,536 | — | |||||||||||||||||||||||
Japanese Yen | DBAB | Sell | 838,612,000 | 8,222,613 | 8/18/15 | 1,366,631 | — | |||||||||||||||||||||||
Singapore Dollar | HSBC | Buy | 3,667,000 | 2,700,145 | 8/18/15 | 20,304 | — | |||||||||||||||||||||||
Malaysian Ringgit | HSBC | Buy | 4,899,000 | 1,350,889 | 8/19/15 | — | (59,390 | ) | ||||||||||||||||||||||
Polish Zloty | DBAB | Buy | 59,155,000 | 13,879,634 | EUR | 8/19/15 | 221,572 | — | ||||||||||||||||||||||
Chilean Peso | JPHQ | Buy | 528,050,000 | 890,097 | 8/20/15 | — | (68,105 | ) | ||||||||||||||||||||||
Euro | DBAB | Sell | 3,964,000 | 5,317,012 | 8/20/15 | 896,153 | — | |||||||||||||||||||||||
Euro | JPHQ | Sell | 7,851,000 | 10,535,061 | 8/20/15 | 1,779,215 | — | |||||||||||||||||||||||
Japanese Yen | HSBC | Sell | 1,621,372,000 | 15,864,697 | 8/20/15 | 2,609,057 | — | |||||||||||||||||||||||
Japanese Yen | JPHQ | Sell | 1,135,828,000 | 11,119,108 | 8/20/15 | 1,833,067 | — | |||||||||||||||||||||||
Chilean Peso | DBAB | Buy | 1,812,300,000 | 2,979,776 | 8/24/15 | — | (159,727 | ) | ||||||||||||||||||||||
Japanese Yen | BZWS | Sell | 376,247,000 | 3,656,824 | 8/24/15 | 580,657 | — | |||||||||||||||||||||||
Singapore Dollar | DBAB | Buy | 3,667,000 | 2,689,205 | 8/24/15 | 31,012 | — | |||||||||||||||||||||||
Japanese Yen | DBAB | Sell | 371,821,000 | 3,595,670 | 8/25/15 | 555,656 | — | |||||||||||||||||||||||
Japanese Yen | HSBC | Sell | 746,218,000 | 7,220,300 | 8/25/15 | 1,119,212 | — | |||||||||||||||||||||||
Euro | BZWS | Sell | 2,680,925 | 3,567,306 | 8/26/15 | 577,136 | — | |||||||||||||||||||||||
Euro | SCNY | Sell | 13,581,483 | 15,417,835 | 8/26/15 | 269,728 | — | |||||||||||||||||||||||
Indian Rupee | DBAB | Buy | 98,937,000 | 1,525,040 | 8/26/15 | 17,195 | — | |||||||||||||||||||||||
Japanese Yen | BZWS | Sell | 1,085,075,000 | 10,507,573 | 8/26/15 | 1,635,889 | — | |||||||||||||||||||||||
Japanese Yen | JPHQ | Sell | 1,135,833,000 | 10,494,692 | 8/26/15 | 1,208,006 | — | |||||||||||||||||||||||
Japanese Yen | SCNY | Sell | 937,086,000 | 7,858,658 | 8/26/15 | 196,948 | — | |||||||||||||||||||||||
Malaysian Ringgit | HSBC | Buy | 1,223,000 | 332,202 | 8/26/15 | — | (10,016 | ) | ||||||||||||||||||||||
| Semiannual Report | TGB-17 |
FRANKLIN TEMPLETON VARIABLE INSURANCE PRODUCTS TRUST
STATEMENT OF INVESTMENTS (UNAUDITED)
Templeton Global Bond VIP Fund (continued)
| Forward Exchange Contracts (continued) | ||||||||||||||||||||||||||||||
| Currency | Counterpartya | Type | Quantity | Contract Amount* | Settlement Date | Unrealized Appreciation | Unrealized Depreciation | |||||||||||||||||||||||
Singapore Dollar | DBAB | Buy | 15,499,000 | 11,386,277 | 8/26/15 | $ | 110,709 | $ | — | |||||||||||||||||||||
Chilean Peso | DBAB | Buy | 4,238,800,000 | 6,978,846 | 8/27/15 | — | (384,902 | ) | ||||||||||||||||||||||
Euro | HSBC | Sell | 18,537,726 | 24,543,023 | 8/27/15 | 3,866,667 | — | |||||||||||||||||||||||
Euro | JPHQ | Sell | 14,996,625 | 19,862,655 | 8/27/15 | 3,135,924 | — | |||||||||||||||||||||||
Japanese Yen | DBAB | Sell | 685,950,000 | 6,621,746 | 8/27/15 | 1,013,289 | — | |||||||||||||||||||||||
Japanese Yen | HSBC | Sell | 1,247,125,000 | 12,039,978 | 8/27/15 | 1,843,247 | — | |||||||||||||||||||||||
Japanese Yen | JPHQ | Sell | 751,903,000 | 7,268,029 | 8/27/15 | 1,120,327 | — | |||||||||||||||||||||||
Malaysian Ringgit | JPHQ | Buy | 8,340,000 | 2,577,734 | 8/27/15 | — | (380,877 | ) | ||||||||||||||||||||||
Chilean Peso | JPHQ | Buy | 593,800,000 | 990,988 | 8/28/15 | — | (67,352 | ) | ||||||||||||||||||||||
Malaysian Ringgit | HSBC | Buy | 2,087,700 | 568,252 | 8/28/15 | — | (18,382 | ) | ||||||||||||||||||||||
Chilean Peso | DBAB | Buy | 1,346,508,000 | 2,163,865 | 8/31/15 | — | (70,010 | ) | ||||||||||||||||||||||
Euro | DBAB | Sell | 1,058,312 | 1,399,745 | 8/31/15 | 219,269 | — | |||||||||||||||||||||||
Japanese Yen | JPHQ | Sell | 372,662,000 | 3,602,775 | 8/31/15 | 555,634 | — | |||||||||||||||||||||||
Euro | DBAB | Sell | 1,732,000 | 2,288,803 | 9/02/15 | 356,815 | — | |||||||||||||||||||||||
Chilean Peso | BZWS | Buy | 3,010,700,000 | 4,820,205 | 9/03/15 | — | (139,815 | ) | ||||||||||||||||||||||
Chilean Peso | MSCO | Buy | 3,307,630,000 | 5,296,106 | 9/03/15 | — | (154,113 | ) | ||||||||||||||||||||||
Chilean Peso | DBAB | Buy | 385,308,000 | 611,600 | 9/04/15 | — | (12,662 | ) | ||||||||||||||||||||||
Chilean Peso | DBAB | Buy | 3,733,979,000 | 6,082,565 | 9/08/15 | — | (280,512 | ) | ||||||||||||||||||||||
Euro | DBAB | Sell | 8,105,300 | 10,692,674 | 9/08/15 | 1,650,658 | — | |||||||||||||||||||||||
Euro | JPHQ | Sell | 20,765,000 | 27,017,342 | 9/08/15 | 3,852,567 | — | |||||||||||||||||||||||
Singapore Dollar | CITI | Buy | 21,075,381 | 15,414,995 | 9/08/15 | 216,082 | — | |||||||||||||||||||||||
Chilean Peso | DBAB | Buy | 1,320,220,000 | 2,165,360 | 9/09/15 | — | (114,126 | ) | ||||||||||||||||||||||
Indian Rupee | JPHQ | Buy | 139,661,000 | 2,149,623 | 9/10/15 | 21,413 | — | |||||||||||||||||||||||
Indian Rupee | CITI | Buy | 69,318,000 | 1,058,775 | 9/11/15 | 18,572 | — | |||||||||||||||||||||||
Singapore Dollar | HSBC | Buy | 10,521,600 | 7,547,776 | 9/16/15 | 255,134 | — | |||||||||||||||||||||||
Chilean Peso | DBAB | Buy | 1,231,460,000 | 1,931,399 | 9/17/15 | — | (19,514 | ) | ||||||||||||||||||||||
Japanese Yen | BZWS | Sell | 285,057,504 | 2,673,734 | 9/18/15 | 342,087 | — | |||||||||||||||||||||||
Chilean Peso | DBAB | Buy | 1,216,245,000 | 1,900,234 | 9/21/15 | — | (12,682 | ) | ||||||||||||||||||||||
Euro | BZWS | Sell | 678,250 | 882,658 | 9/21/15 | 125,874 | — | |||||||||||||||||||||||
Singapore Dollar | HSBC | Buy | 9,120,000 | 7,226,624 | 9/21/15 | — | (463,529 | ) | ||||||||||||||||||||||
Chilean Peso | JPHQ | Buy | 1,792,000,000 | 2,786,503 | 9/22/15 | — | (5,669 | ) | ||||||||||||||||||||||
Euro | DBAB | Sell | 8,070,000 | 10,422,002 | 9/23/15 | 1,417,315 | — | |||||||||||||||||||||||
Hungarian Forint | JPHQ | Buy | 1,156,013,000 | 3,674,198 | EUR | 9/23/15 | — | (18,356 | ) | |||||||||||||||||||||
Chilean Peso | MSCO | Buy | 3,180,970,000 | 4,992,498 | 9/24/15 | — | (57,183 | ) | ||||||||||||||||||||||
Euro | BZWS | Sell | 1,647,381 | 2,124,100 | 9/24/15 | 285,888 | — | |||||||||||||||||||||||
Hungarian Forint | JPHQ | Buy | 925,405,000 | 2,938,073 | EUR | 9/25/15 | — | (11,320 | ) | |||||||||||||||||||||
Philippine Peso | JPHQ | Buy | 123,740,000 | 2,754,062 | 9/25/15 | — | (23,019 | ) | ||||||||||||||||||||||
Chilean Peso | DBAB | Buy | 719,621,000 | 1,128,959 | 9/28/15 | — | (12,878 | ) | ||||||||||||||||||||||
Euro | CITI | Sell | 1,532,964 | 1,977,064 | 9/28/15 | 266,418 | — | |||||||||||||||||||||||
Euro | DBAB | Sell | 3,753,000 | 4,833,226 | 9/28/15 | 645,227 | — | |||||||||||||||||||||||
Malaysian Ringgit | DBAB | Buy | 11,080,500 | 3,343,341 | 9/28/15 | — | (432,934 | ) | ||||||||||||||||||||||
Malaysian Ringgit | DBAB | Sell | 11,080,500 | 3,050,630 | 9/28/15 | 140,224 | — | |||||||||||||||||||||||
Malaysian Ringgit | HSBC | Buy | 11,490,000 | 3,467,005 | 9/28/15 | — | (449,039 | ) | ||||||||||||||||||||||
Euro | BZWS | Sell | 6,085,000 | 7,769,358 | 9/29/15 | 978,937 | — | |||||||||||||||||||||||
Japanese Yen | JPHQ | Sell | 285,510,329 | 2,628,065 | 9/29/15 | 292,204 | — | |||||||||||||||||||||||
Euro | HSBC | Sell | 5,430,000 | 6,919,096 | 9/30/15 | 859,494 | — | |||||||||||||||||||||||
Indian Rupee | DBAB | Buy | 283,149,851 | 4,331,992 | 9/30/15 | 53,019 | — | |||||||||||||||||||||||
Japanese Yen | JPHQ | Sell | 172,207,000 | 1,586,540 | 9/30/15 | 177,622 | — | |||||||||||||||||||||||
Malaysian Ringgit | HSBC | Buy | 7,790,000 | 2,089,088 | 9/30/15 | — | (43,311 | ) | ||||||||||||||||||||||
South Korean Won | HSBC | Buy | 9,530,000,000 | 9,062,381 | 9/30/15 | — | (569,108 | ) | ||||||||||||||||||||||
Euro | DBAB | Sell | 14,880,000 | 18,981,226 | 10/01/15 | 2,375,595 | — | |||||||||||||||||||||||
Indian Rupee | HSBC | Buy | 120,016,750 | 1,848,024 | 10/05/15 | 8,895 | — | |||||||||||||||||||||||
Chilean Peso | DBAB | Buy | 1,461,296,000 | 2,289,894 | 10/07/15 | — | (25,330 | ) | ||||||||||||||||||||||
Euro | JPHQ | Sell | 6,370,000 | 8,073,147 | 10/07/15 | 963,620 | — | |||||||||||||||||||||||
Japanese Yen | JPHQ | Sell | 5,663,900,000 | 52,286,176 | 10/07/15 | 5,939,563 | — | |||||||||||||||||||||||
Mexican Peso | HSBC | Buy | 377,048,070 | 27,308,472 | 10/07/15 | — | (3,489,669 | ) | ||||||||||||||||||||||
| TGB-18 | Semiannual Report |
FRANKLIN TEMPLETON VARIABLE INSURANCE PRODUCTS TRUST
STATEMENT OF INVESTMENTS (UNAUDITED)
Templeton Global Bond VIP Fund (continued)
| Forward Exchange Contracts (continued) | ||||||||||||||||||||||||||||||
| Currency | Counterpartya | Type | Quantity | Contract Amount* | Settlement Date | Unrealized Appreciation | Unrealized Depreciation | |||||||||||||||||||||||
Mexican Peso | HSBC | Sell | 377,048,070 | 24,541,648 | 10/07/15 | $ | 722,846 | $ | — | |||||||||||||||||||||
Euro | DBAB | Sell | 6,200,000 | 6,751,490 | 10/08/15 | — | (168,431 | ) | ||||||||||||||||||||||
Euro | DBAB | Sell | 12,680,000 | 16,085,214 | 10/09/15 | 1,932,595 | — | |||||||||||||||||||||||
Japanese Yen | HSBC | Sell | 2,816,800,000 | 26,142,602 | 10/09/15 | 3,092,239 | — | |||||||||||||||||||||||
Euro | HSBC | Sell | 8,692,000 | 9,430,472 | 10/13/15 | — | (271,719 | ) | ||||||||||||||||||||||
Japanese Yen | BZWS | Sell | 1,426,300,000 | 13,246,191 | 10/13/15 | 1,573,491 | — | |||||||||||||||||||||||
Japanese Yen | DBAB | Sell | 1,406,600,000 | 13,071,276 | 10/13/15 | 1,559,799 | — | |||||||||||||||||||||||
Mexican Peso | DBAB | Buy | 259,112,000 | 18,946,476 | 10/14/15 | — | (2,586,587 | ) | ||||||||||||||||||||||
Mexican Peso | DBAB | Sell | 259,112,000 | 16,792,741 | 10/14/15 | 432,853 | — | |||||||||||||||||||||||
Malaysian Ringgit | DBAB | Buy | 60,000,000 | 15,166,298 | EUR | 10/15/15 | — | (1,192,602 | ) | |||||||||||||||||||||
Indian Rupee | JPHQ | Buy | 60,607,000 | 928,686 | 10/19/15 | 6,604 | — | |||||||||||||||||||||||
Japanese Yen | JPHQ | Sell | 652,895,000 | 6,177,044 | 10/19/15 | 833,101 | — | |||||||||||||||||||||||
Euro | HSBC | Sell | 12,569,000 | 16,093,348 | 10/20/15 | 2,061,726 | — | |||||||||||||||||||||||
Japanese Yen | JPHQ | Sell | 1,233,160,000 | 11,663,845 | 10/20/15 | 1,570,211 | — | |||||||||||||||||||||||
Malaysian Ringgit | JPHQ | Buy | 8,104,000 | 2,421,490 | 10/20/15 | — | (296,847 | ) | ||||||||||||||||||||||
Malaysian Ringgit | JPHQ | Buy | 15,728,213 | 4,190,949 | 10/21/15 | — | (67,799 | ) | ||||||||||||||||||||||
Japanese Yen | BZWS | Sell | 735,200,000 | 6,909,125 | 10/22/15 | 891,115 | — | |||||||||||||||||||||||
Malaysian Ringgit | HSBC | Buy | 14,613,000 | 4,370,308 | 10/23/15 | — | (540,159 | ) | ||||||||||||||||||||||
Euro | DBAB | Sell | 4,545,000 | 5,769,196 | 10/26/15 | 694,735 | — | |||||||||||||||||||||||
Malaysian Ringgit | DBAB | Buy | 10,811,000 | 3,244,306 | 10/26/15 | — | (411,399 | ) | ||||||||||||||||||||||
Malaysian Ringgit | DBAB | Sell | 10,811,000 | 2,970,300 | 10/26/15 | 137,393 | — | |||||||||||||||||||||||
Malaysian Ringgit | HSBC | Buy | 7,209,825 | 2,163,813 | 10/26/15 | — | (274,556 | ) | ||||||||||||||||||||||
Euro | BZWS | Sell | 5,604,306 | 7,117,300 | 10/27/15 | 860,015 | — | |||||||||||||||||||||||
Indian Rupee | JPHQ | Buy | 358,075,000 | 5,524,817 | 10/29/15 | — | (9,199 | ) | ||||||||||||||||||||||
Euro | DBAB | Sell | 3,319,244 | 4,238,509 | 10/30/15 | 532,318 | — | |||||||||||||||||||||||
Indian Rupee | HSBC | Buy | 679,529,000 | 10,481,027 | 10/30/15 | — | (15,819 | ) | ||||||||||||||||||||||
Malaysian Ringgit | JPHQ | Buy | 7,468,000 | 2,236,263 | 10/30/15 | — | (280,015 | ) | ||||||||||||||||||||||
Euro | DBAB | Sell | 224,556 | 284,400 | 11/03/15 | 33,647 | — | |||||||||||||||||||||||
Euro | UBSW | Sell | 32,701,000 | 41,113,332 | 11/04/15 | 4,596,733 | — | |||||||||||||||||||||||
Euro | BZWS | Sell | 1,581,109 | 1,986,252 | 11/06/15 | 220,591 | — | |||||||||||||||||||||||
Indian Rupee | DBAB | Buy | 457,757,494 | 7,032,685 | 11/06/15 | 7,983 | — | |||||||||||||||||||||||
Euro | GSCO | Sell | 2,990,000 | 3,366,292 | 11/09/15 | 27,101 | — | |||||||||||||||||||||||
Euro | DBAB | Sell | 15,875,000 | 19,827,081 | 11/10/15 | 2,097,769 | — | |||||||||||||||||||||||
Japanese Yen | CITI | Sell | 341,992,119 | 2,999,865 | 11/10/15 | 199,290 | — | |||||||||||||||||||||||
Euro | JPHQ | Sell | 8,969,211 | 11,238,870 | 11/12/15 | 1,221,616 | — | |||||||||||||||||||||||
Euro | MSCO | Sell | 4,572,000 | 5,715,937 | 11/12/15 | 609,704 | — | |||||||||||||||||||||||
Japanese Yen | CITI | Sell | 796,524,000 | 6,841,843 | 11/12/15 | 318,813 | — | |||||||||||||||||||||||
Japanese Yen | HSBC | Sell | 413,563,000 | 3,625,281 | 11/12/15 | 238,460 | — | |||||||||||||||||||||||
Japanese Yen | JPHQ | Sell | 335,950,000 | 2,951,798 | 11/12/15 | 200,579 | — | |||||||||||||||||||||||
Euro | BZWS | Sell | 2,643,000 | 3,298,966 | 11/13/15 | 347,079 | — | |||||||||||||||||||||||
Euro | CITI | Sell | 5,658,426 | 6,336,192 | 11/13/15 | 16,466 | — | |||||||||||||||||||||||
Euro | GSCO | Sell | 2,279,000 | 2,545,711 | 11/13/15 | 365 | — | |||||||||||||||||||||||
Euro | SCNY | Sell | 629,000 | 703,235 | 11/13/15 | 723 | — | |||||||||||||||||||||||
Japanese Yen | GSCO | Sell | 490,555,000 | 4,099,334 | 11/13/15 | 81,908 | — | |||||||||||||||||||||||
Japanese Yen | SCNY | Sell | 366,681,000 | 3,063,922 | 11/13/15 | 60,968 | — | |||||||||||||||||||||||
Euro | DBAB | Sell | 10,778,730 | 13,489,042 | 11/16/15 | 1,449,925 | — | |||||||||||||||||||||||
Euro | GSCO | Sell | 3,095,000 | 3,488,344 | 11/16/15 | 31,437 | — | |||||||||||||||||||||||
Euro | MSCO | Sell | 5,391,000 | 6,746,028 | 11/16/15 | 724,643 | — | |||||||||||||||||||||||
Japanese Yen | CITI | Sell | 366,680,000 | 3,064,119 | 11/16/15 | 60,972 | — | |||||||||||||||||||||||
Japanese Yen | MSCO | Sell | 300,000,000 | 2,616,089 | 11/16/15 | 159,059 | — | |||||||||||||||||||||||
Japanese Yen | SCNY | Sell | 340,600,700 | 2,975,146 | 11/16/15 | 185,592 | — | |||||||||||||||||||||||
Australian Dollar | JPHQ | Sell | 57,889,000 | 46,565,912 | 11/18/15 | 2,257,818 | — | |||||||||||||||||||||||
Euro | DBAB | Sell | 2,240,000 | 2,791,376 | 11/18/15 | 289,353 | — | |||||||||||||||||||||||
Euro | UBSW | Sell | 3,245,000 | 4,046,191 | 11/18/15 | 421,608 | — | |||||||||||||||||||||||
Japanese Yen | BOFA | Sell | 1,105,661,700 | 9,315,621 | 11/18/15 | 259,736 | — | |||||||||||||||||||||||
Japanese Yen | DBAB | Sell | 796,770,000 | 6,869,891 | 11/18/15 | 343,974 | — | |||||||||||||||||||||||
| Semiannual Report | TGB-19 |
FRANKLIN TEMPLETON VARIABLE INSURANCE PRODUCTS TRUST
STATEMENT OF INVESTMENTS (UNAUDITED)
Templeton Global Bond VIP Fund (continued)
| Forward Exchange Contracts (continued) | ||||||||||||||||||||||||||||||
| Currency | Counterpartya | Type | Quantity | Contract Amount* | Settlement Date | Unrealized Appreciation | Unrealized Depreciation | |||||||||||||||||||||||
Australian Dollar | CITI | Sell | 13,307,000 | 10,617,456 | 11/19/15 | $ | 432,856 | $ | — | |||||||||||||||||||||
Australian Dollar | JPHQ | Sell | 42,398,000 | 33,791,206 | 11/19/15 | 1,341,619 | — | |||||||||||||||||||||||
Euro | DBAB | Sell | 5,073,398 | 6,346,537 | 11/19/15 | 679,574 | — | |||||||||||||||||||||||
Japanese Yen | CITI | Sell | 986,239,000 | 8,516,377 | 11/19/15 | 438,440 | — | |||||||||||||||||||||||
Malaysian Ringgit | DBAB | Buy | 7,197,960 | 2,106,145 | 11/19/15 | — | (223,811 | ) | ||||||||||||||||||||||
Malaysian Ringgit | DBAB | Sell | 7,197,960 | 1,973,991 | 11/19/15 | 91,657 | — | |||||||||||||||||||||||
Singapore Dollar | DBAB | Buy | 11,645,100 | 8,782,127 | 11/19/15 | — | (153,272 | ) | ||||||||||||||||||||||
Japanese Yen | CITI | Sell | 1,107,834,000 | 9,558,533 | 11/20/15 | 484,453 | — | |||||||||||||||||||||||
Malaysian Ringgit | HSBC | Buy | 4,326,000 | 1,262,365 | 11/20/15 | — | (131,171 | ) | ||||||||||||||||||||||
Euro | GSCO | Sell | 4,454,000 | 4,999,615 | 11/23/15 | 24,143 | — | |||||||||||||||||||||||
Japanese Yen | HSBC | Sell | 207,909,000 | 1,778,520 | 11/24/15 | 75,421 | — | |||||||||||||||||||||||
Singapore Dollar | BZWS | Buy | 21,427,761 | 16,002,211 | 11/27/15 | — | (126,268 | ) | ||||||||||||||||||||||
Euro | DBAB | Sell | 837,570 | 1,044,140 | 11/30/15 | 108,385 | — | |||||||||||||||||||||||
Singapore Dollar | DBAB | Buy | 5,960,000 | 4,435,858 | 11/30/15 | 6,922 | (27,164 | ) | ||||||||||||||||||||||
Euro | GSCO | Sell | 463,000 | 505,865 | 12/01/15 | — | (11,421 | ) | ||||||||||||||||||||||
Euro | DBAB | Sell | 5,440,000 | 6,787,488 | 12/04/15 | 709,321 | — | |||||||||||||||||||||||
Euro | HSBC | Sell | 2,155,292 | 2,655,061 | 12/09/15 | 246,706 | — | |||||||||||||||||||||||
Euro | SCNY | Sell | 2,400,751 | 2,965,696 | 12/09/15 | 283,061 | — | |||||||||||||||||||||||
Japanese Yen | HSBC | Sell | 2,052,400,000 | 16,392,317 | 12/09/15 | — | (425,663 | ) | ||||||||||||||||||||||
Euro | MSCO | Sell | 1,412,000 | 1,769,808 | 12/11/15 | 191,959 | — | |||||||||||||||||||||||
Mexican Peso | CITI | Buy | 95,083,400 | 6,461,665 | 12/11/15 | — | (484,528 | ) | ||||||||||||||||||||||
Mexican Peso | CITI | Sell | 95,083,400 | 6,158,092 | 12/11/15 | 180,955 | — | |||||||||||||||||||||||
Malaysian Ringgit | JPHQ | Buy | 13,361,013 | 3,526,171 | 12/14/15 | — | (39,486 | ) | ||||||||||||||||||||||
Singapore Dollar | JPHQ | Buy | 5,686,000 | 4,225,624 | 12/14/15 | — | (13,809 | ) | ||||||||||||||||||||||
Euro | BOFA | Sell | 17,769,000 | 22,094,863 | 12/15/15 | 2,237,281 | — | |||||||||||||||||||||||
Euro | JPHQ | Sell | 5,095,000 | 6,360,241 | 12/15/15 | 666,371 | — | |||||||||||||||||||||||
Mexican Peso | CITI | Buy | 45,585,080 | 3,001,981 | 12/18/15 | — | (137,922 | ) | ||||||||||||||||||||||
Mexican Peso | CITI | Sell | 45,585,080 | 2,950,701 | 12/18/15 | 86,642 | — | |||||||||||||||||||||||
Japanese Yen | DBAB | Sell | 1,453,310,000 | 12,440,592 | 12/21/15 | 528,549 | — | |||||||||||||||||||||||
Japanese Yen | HSBC | Sell | 1,455,540,000 | 12,445,832 | 12/21/15 | 515,510 | — | |||||||||||||||||||||||
Japanese Yen | BZWS | Sell | 696,650,000 | 5,891,731 | 12/22/15 | 181,517 | — | |||||||||||||||||||||||
Japanese Yen | CITI | Sell | 1,086,780,000 | 9,203,760 | 12/22/15 | 295,778 | — | |||||||||||||||||||||||
Malaysian Ringgit | HSBC | Buy | 36,880,000 | 9,737,551 | 12/22/15 | — | (119,831 | ) | ||||||||||||||||||||||
Singapore Dollar | HSBC | Buy | 6,864,000 | 5,085,462 | 12/22/15 | — | (1,613 | ) | ||||||||||||||||||||||
Singapore Dollar | DBAB | Buy | 8,589,700 | 6,413,335 | 12/23/15 | — | (51,427 | ) | ||||||||||||||||||||||
Euro | BZWS | Sell | 6,863,000 | 8,364,804 | 1/05/16 | 691,748 | — | |||||||||||||||||||||||
Euro | DBAB | Sell | 2,285,618 | 2,741,416 | 1/07/16 | 185,899 | — | |||||||||||||||||||||||
Japanese Yen | DBAB | Sell | 770,370,000 | 6,468,045 | 1/07/16 | 151,160 | — | |||||||||||||||||||||||
Japanese Yen | GSCO | Sell | 329,010,000 | 2,778,449 | 1/08/16 | 80,564 | — | |||||||||||||||||||||||
Euro | BZWS | Sell | 6,181,000 | 7,355,019 | 1/11/16 | 443,473 | — | |||||||||||||||||||||||
Malaysian Ringgit | JPHQ | Buy | 3,956,000 | 1,070,202 | 1/11/16 | — | (40,083 | ) | ||||||||||||||||||||||
Euro | CITI | Sell | 5,040,000 | 5,988,528 | 1/13/16 | 352,570 | — | |||||||||||||||||||||||
Euro | SCNY | Sell | 15,572,000 | 18,495,643 | 1/13/16 | 1,082,323 | — | |||||||||||||||||||||||
Japanese Yen | CITI | Sell | 138,680,000 | 1,169,743 | 1/14/16 | 32,398 | — | |||||||||||||||||||||||
Japanese Yen | SCNY | Sell | 415,980,000 | 3,530,640 | 1/14/16 | 119,097 | — | |||||||||||||||||||||||
Euro | DBAB | Sell | 9,460,000 | 11,193,545 | 1/15/16 | 614,438 | — | |||||||||||||||||||||||
Euro | JPHQ | Sell | 29,033,000 | 34,339,030 | 1/15/16 | 1,871,459 | — | |||||||||||||||||||||||
Japanese Yen | BZWS | Sell | 1,089,820,000 | 9,275,616 | 1/15/16 | 337,545 | — | |||||||||||||||||||||||
Japanese Yen | JPHQ | Sell | 708,450,000 | 6,007,072 | 1/15/16 | 196,775 | — | |||||||||||||||||||||||
Malaysian Ringgit | JPHQ | Buy | 1,700,000 | 461,180 | 1/15/16 | — | (18,637 | ) | ||||||||||||||||||||||
Euro | BZWS | Sell | 28,096,000 | 33,250,857 | 1/19/16 | 1,828,136 | — | |||||||||||||||||||||||
Euro | JPHQ | Sell | 27,973,000 | 33,054,295 | 1/19/16 | 1,769,138 | — | |||||||||||||||||||||||
Malaysian Ringgit | JPHQ | Buy | 1,856,000 | 499,327 | 1/19/16 | — | (16,313 | ) | ||||||||||||||||||||||
Euro | DBAB | Sell | 4,856,000 | 5,692,932 | 1/20/16 | 261,825 | — | |||||||||||||||||||||||
Japanese Yen | JPHQ | Sell | 652,895,000 | 5,619,274 | 1/20/16 | 263,949 | — | |||||||||||||||||||||||
Euro | BZWS | Sell | 2,638,000 | 3,078,810 | 1/21/16 | 128,315 | — | |||||||||||||||||||||||
| TGB-20 | Semiannual Report |
FRANKLIN TEMPLETON VARIABLE INSURANCE PRODUCTS TRUST
STATEMENT OF INVESTMENTS (UNAUDITED)
Templeton Global Bond VIP Fund (continued)
| Forward Exchange Contracts (continued) | ||||||||||||||||||||||||||||||
| Currency | Counterpartya | Type | Quantity | Contract Amount* | Settlement Date | Unrealized Appreciation | Unrealized Depreciation | |||||||||||||||||||||||
Euro | JPHQ | Sell | 300,000 | 349,890 | 1/22/16 | $ | 14,344 | $ | — | |||||||||||||||||||||
Euro | JPHQ | Sell | 28,236,000 | 33,053,880 | 1/25/16 | 1,470,064 | — | |||||||||||||||||||||||
Japanese Yen | GSCO | Sell | 944,420,000 | 8,073,691 | 1/27/16 | 325,818 | — | |||||||||||||||||||||||
Japanese Yen | DBAB | Sell | 8,368,505,770 | 71,593,000 | 1/28/16 | 2,937,407 | — | |||||||||||||||||||||||
Japanese Yen | HSBC | Sell | 1,162,462,488 | 9,934,091 | 1/28/16 | 397,197 | — | |||||||||||||||||||||||
Euro | CITI | Sell | 4,998,400 | 5,694,777 | 1/29/16 | 103,206 | — | |||||||||||||||||||||||
Euro | DBAB | Sell | 57,063,000 | 65,106,030 | 1/29/16 | 1,271,235 | — | |||||||||||||||||||||||
Japanese Yen | DBAB | Sell | 897,860,782 | 7,658,576 | 1/29/16 | 292,305 | — | |||||||||||||||||||||||
Japanese Yen | JPHQ | Sell | 1,719,500,000 | 14,740,045 | 2/08/16 | 629,371 | — | |||||||||||||||||||||||
Japanese Yen | SCNY | Sell | 1,720,000,000 | 14,741,804 | 2/08/16 | 627,026 | — | |||||||||||||||||||||||
Euro | CITI | Sell | 6,572,000 | 7,548,599 | 2/09/16 | 194,756 | — | |||||||||||||||||||||||
Euro | DBAB | Sell | 1,738,000 | 2,000,264 | 2/09/16 | 55,502 | — | |||||||||||||||||||||||
Euro | GSCO | Sell | 2,045,000 | 2,350,728 | 2/09/16 | 62,442 | — | |||||||||||||||||||||||
Japanese Yen | BZWS | Sell | 1,720,220,000 | 14,743,563 | 2/09/16 | 626,633 | — | |||||||||||||||||||||||
Japanese Yen | CITI | Sell | 366,860,000 | 3,145,179 | 2/09/16 | 134,554 | — | |||||||||||||||||||||||
Japanese Yen | JPHQ | Sell | 1,723,960,000 | 14,770,681 | 2/09/16 | 623,058 | — | |||||||||||||||||||||||
Euro | HSBC | Sell | 1,800,000 | 2,044,332 | 2/10/16 | 30,146 | — | |||||||||||||||||||||||
Euro | BZWS | Sell | 6,341,000 | 7,206,694 | 2/11/16 | 110,994 | — | |||||||||||||||||||||||
Japanese Yen | GSCO | Sell | 394,373,000 | 3,346,540 | 2/12/16 | 109,891 | — | |||||||||||||||||||||||
Japanese Yen | HSBC | Sell | 1,035,240,000 | 8,788,190 | 2/12/16 | 291,898 | — | |||||||||||||||||||||||
Japanese Yen | JPHQ | Sell | 1,034,700,000 | 8,783,792 | 2/12/16 | 291,933 | — | |||||||||||||||||||||||
Euro | SCNY | Sell | 657,000 | 747,354 | 2/16/16 | 12,071 | — | |||||||||||||||||||||||
Japanese Yen | CITI | Sell | 1,371,360,000 | 11,534,793 | 2/16/16 | 278,831 | — | |||||||||||||||||||||||
Japanese Yen | JPHQ | Sell | 686,710,000 | 5,795,143 | 2/16/16 | 158,708 | — | |||||||||||||||||||||||
Euro | GSCO | Sell | 2,038,000 | 2,341,519 | 2/17/16 | 60,632 | — | |||||||||||||||||||||||
Euro | JPHQ | Sell | 3,942,000 | 4,525,613 | 2/17/16 | 113,808 | — | |||||||||||||||||||||||
Japanese Yen | GSCO | Sell | 810,877,280 | 6,875,979 | 2/17/16 | 220,229 | — | |||||||||||||||||||||||
Japanese Yen | JPHQ | Sell | 831,970,000 | 7,042,327 | 2/17/16 | 213,447 | — | |||||||||||||||||||||||
Euro | BZWS | Sell | 6,280,000 | 7,197,948 | 2/22/16 | 168,663 | — | |||||||||||||||||||||||
Japanese Yen | BZWS | Sell | 343,460,000 | 2,910,135 | 2/25/16 | 90,431 | — | |||||||||||||||||||||||
Japanese Yen | HSBC | Sell | 385,460,000 | 3,267,552 | 2/25/16 | 103,040 | — | |||||||||||||||||||||||
Euro | BOFA | Sell | 2,694,506 | 3,076,668 | 2/26/16 | 60,385 | — | |||||||||||||||||||||||
Euro | BZWS | Sell | 13,673,773 | 15,603,553 | 2/26/16 | 296,861 | — | |||||||||||||||||||||||
Euro | DBAB | Sell | 1,530,900 | 1,744,154 | 2/26/16 | 30,435 | — | |||||||||||||||||||||||
Japanese Yen | BZWS | Sell | 1,576,550,000 | 13,282,362 | 2/26/16 | 339,038 | — | |||||||||||||||||||||||
Euro | DBAB | Sell | 2,579,651 | 2,951,043 | 2/29/16 | 63,124 | — | |||||||||||||||||||||||
Japanese Yen | DBAB | Sell | 229,660,000 | 1,943,965 | 2/29/16 | 58,339 | — | |||||||||||||||||||||||
Japanese Yen | JPHQ | Sell | 848,300,000 | 7,158,801 | 3/03/16 | 193,310 | — | |||||||||||||||||||||||
Japanese Yen | HSBC | Sell | 400,800,000 | 3,371,609 | 3/04/16 | 80,512 | — | |||||||||||||||||||||||
Euro | DBAB | Sell | 1,536,000 | 1,730,765 | 3/07/16 | 10,926 | — | |||||||||||||||||||||||
Euro | BZWS | Sell | 7,226,276 | 8,050,361 | 3/09/16 | — | (41,193 | ) | ||||||||||||||||||||||
Euro | GSCO | Sell | 21,480,000 | 23,909,818 | 3/09/16 | — | (142,207 | ) | ||||||||||||||||||||||
Euro | HSBC | Sell | 1,844,000 | 2,050,344 | 3/09/16 | — | (14,458 | ) | ||||||||||||||||||||||
Japanese Yen | BZWS | Sell | 1,712,605,900 | 14,359,548 | 3/09/16 | 295,061 | — | |||||||||||||||||||||||
Euro | CITI | Sell | 31,404,613 | 34,460,282 | 3/10/16 | — | (705,572 | ) | ||||||||||||||||||||||
Euro | MSCO | Sell | 5,225,000 | 5,727,384 | 3/10/16 | — | (123,400 | ) | ||||||||||||||||||||||
Mexican Peso | CITI | Buy | 30,688,400 | 1,927,506 | 3/11/16 | — | (11,827 | ) | ||||||||||||||||||||||
Mexican Peso | CITI | Sell | 30,688,400 | 1,973,569 | 3/11/16 | 57,889 | — | |||||||||||||||||||||||
Mexican Peso | HSBC | Buy | 135,500,950 | 8,518,858 | 3/11/16 | — | (60,405 | ) | ||||||||||||||||||||||
Mexican Peso | HSBC | Sell | 135,500,950 | 8,714,728 | 3/11/16 | 256,276 | — | |||||||||||||||||||||||
Mexican Peso | CITI | Buy | 13,389,800 | 834,177 | 3/14/16 | 1,468 | — | |||||||||||||||||||||||
Mexican Peso | CITI | Sell | 13,389,800 | 860,892 | 3/14/16 | 25,246 | — | |||||||||||||||||||||||
Euro | BZWS | Sell | 1,161,439 | 1,242,902 | 3/16/16 | — | (57,825 | ) | ||||||||||||||||||||||
Euro | CITI | Sell | 861,168 | 922,742 | 3/16/16 | — | (41,704 | ) | ||||||||||||||||||||||
Euro | JPHQ | Sell | 541,000 | 579,330 | 3/16/16 | — | (26,551 | ) | ||||||||||||||||||||||
Japanese Yen | CITI | Sell | 286,112,008 | 2,381,889 | 3/16/16 | 31,837 | — | |||||||||||||||||||||||
| Semiannual Report | TGB-21 |
FRANKLIN TEMPLETON VARIABLE INSURANCE PRODUCTS TRUST
STATEMENT OF INVESTMENTS (UNAUDITED)
Templeton Global Bond VIP Fund (continued)
| Forward Exchange Contracts (continued) | ||||||||||||||||||||||||||||||
| Currency | Counterpartya | Type | Quantity | Contract Amount* | Settlement Date | Unrealized Appreciation | Unrealized Depreciation | |||||||||||||||||||||||
Mexican Peso | CITI | Buy | 12,505,100 | 784,806 | 3/18/16 | $ | — | $ | (4,614 | ) | ||||||||||||||||||||
Mexican Peso | CITI | Sell | 12,505,100 | 803,763 | 3/18/16 | 23,570 | — | |||||||||||||||||||||||
Japanese Yen | CITI | Sell | 1,866,452,000 | 15,518,075 | 3/22/16 | 185,242 | — | |||||||||||||||||||||||
Japanese Yen | MSCO | Sell | 575,230,000 | 4,781,868 | 3/22/16 | 56,375 | — | |||||||||||||||||||||||
Euro | BZWS | Sell | 744,197 | 799,573 | 3/23/16 | — | (34,013 | ) | ||||||||||||||||||||||
Mexican Peso | CITI | Buy | 75,637,200 | 4,824,170 | 3/23/16 | — | (106,987 | ) | ||||||||||||||||||||||
Mexican Peso | CITI | Sell | 75,637,200 | 4,859,722 | 3/23/16 | 142,539 | — | |||||||||||||||||||||||
Japanese Yen | DBAB | Sell | 725,287,000 | 6,040,535 | 3/24/16 | 82,035 | — | |||||||||||||||||||||||
Japanese Yen | BZWS | Sell | 983,714,840 | 8,304,475 | 3/28/16 | 221,992 | — | |||||||||||||||||||||||
Malaysian Ringgit | HSBC | Buy | 7,634,000 | 2,020,218 | 3/28/16 | — | (43,275 | ) | ||||||||||||||||||||||
Euro | BOFA | Sell | 50,857,200 | 56,167,756 | 3/29/16 | — | (807,354 | ) | ||||||||||||||||||||||
Euro | BZWS | Sell | 18,402,361 | 20,274,801 | 3/29/16 | — | (341,287 | ) | ||||||||||||||||||||||
Euro | DBAB | Sell | 2,736,000 | 3,015,346 | 3/29/16 | — | (49,784 | ) | ||||||||||||||||||||||
Euro | GSCO | Sell | 30,376,000 | 33,387,780 | 3/29/16 | — | (642,326 | ) | ||||||||||||||||||||||
Euro | HSBC | Sell | 20,544,891 | 22,609,653 | 3/29/16 | — | (406,703 | ) | ||||||||||||||||||||||
South Korean Won | DBAB | Buy | 21,440,000,000 | 19,317,056 | 3/29/16 | — | (232,056 | ) | ||||||||||||||||||||||
Euro | BOFA | Sell | 14,283,200 | 15,836,712 | 3/30/16 | — | (165,177 | ) | ||||||||||||||||||||||
Euro | BZWS | Sell | 6,085,000 | 6,725,659 | 3/30/16 | — | (91,545 | ) | ||||||||||||||||||||||
Euro | GSCO | Sell | 4,020,000 | 4,415,568 | 3/31/16 | — | (88,292 | ) | ||||||||||||||||||||||
Euro | CITI | Sell | 6,421,600 | 7,126,576 | 4/08/16 | — | (69,675 | ) | ||||||||||||||||||||||
Malaysian Ringgit | HSBC | Buy | 4,010,000 | 1,072,422 | 4/11/16 | — | (34,944 | ) | ||||||||||||||||||||||
Euro | DBAB | Sell | 7,243,000 | 7,842,938 | 4/13/16 | — | (275,018 | ) | ||||||||||||||||||||||
Euro | SCNY | Sell | 4,346,000 | 4,664,236 | 4/13/16 | — | (206,762 | ) | ||||||||||||||||||||||
Japanese Yen | CITI | Sell | 261,800,000 | 2,191,455 | 4/13/16 | 39,354 | — | |||||||||||||||||||||||
Euro | JPHQ | Sell | 3,907,000 | 4,175,098 | 4/14/16 | — | (203,999 | ) | ||||||||||||||||||||||
Euro | HSBC | Sell | 6,919,000 | 7,372,195 | 4/18/16 | — | (383,786 | ) | ||||||||||||||||||||||
Japanese Yen | BZWS | Sell | 700,840,000 | 5,918,507 | 4/18/16 | 156,420 | — | |||||||||||||||||||||||
Japanese Yen | JPHQ | Sell | 917,650,000 | 7,782,224 | 4/21/16 | 236,885 | — | |||||||||||||||||||||||
Euro | BZWS | Sell | 6,575,679 | 7,186,987 | 4/29/16 | — | (186,576 | ) | ||||||||||||||||||||||
Euro | SCNY | Sell | 11,263,000 | 12,403,942 | 4/29/16 | — | (225,696 | ) | ||||||||||||||||||||||
Euro | BZWS | Sell | 1,259,000 | 1,410,584 | 5/09/16 | — | (1,606 | ) | ||||||||||||||||||||||
Euro | BZWS | Sell | 8,551,980 | 9,822,804 | 5/18/16 | 227,664 | — | |||||||||||||||||||||||
Japanese Yen | CITI | Sell | 1,104,534,000 | 9,341,458 | 5/18/16 | 251,791 | — | |||||||||||||||||||||||
Japanese Yen | BOFA | Sell | 1,102,846,375 | 9,272,759 | 5/19/16 | 196,697 | — | |||||||||||||||||||||||
Japanese Yen | BZWS | Sell | 1,105,842,500 | 9,295,919 | 5/19/16 | 195,199 | — | |||||||||||||||||||||||
Japanese Yen | HSBC | Sell | 1,106,730,400 | 9,348,570 | 5/19/16 | 240,542 | — | |||||||||||||||||||||||
Euro | JPHQ | Sell | 15,309,581 | 17,571,036 | 5/20/16 | 392,978 | — | |||||||||||||||||||||||
Japanese Yen | JPHQ | Sell | 715,709,000 | 6,026,186 | 5/20/16 | 135,952 | — | |||||||||||||||||||||||
Euro | DBAB | Sell | 3,887,000 | 4,355,461 | 5/23/16 | — | (6,326 | ) | ||||||||||||||||||||||
Malaysian Ringgit | HSBC | Buy | 298,500 | 80,621 | 5/23/16 | — | (3,609 | ) | ||||||||||||||||||||||
Euro | JPHQ | Sell | 4,730,771 | 5,303,265 | 5/26/16 | — | (5,836 | ) | ||||||||||||||||||||||
Euro | BZWS | Sell | 2,836,669 | 3,093,785 | 5/31/16 | — | (90,141 | ) | ||||||||||||||||||||||
Malaysian Ringgit | HSBC | Buy | 1,229,300 | 332,243 | 5/31/16 | — | (15,257 | ) | ||||||||||||||||||||||
Euro | BZWS | Sell | 7,895,591 | 8,783,253 | 6/06/16 | — | (80,493 | ) | ||||||||||||||||||||||
Euro | GSCO | Sell | 2,033,100 | 2,315,111 | 6/08/16 | 32,576 | — | |||||||||||||||||||||||
Japanese Yen | CITI | Sell | 1,370,500,000 | 11,124,577 | 6/08/16 | — | (161,259 | ) | ||||||||||||||||||||||
Japanese Yen | BZWS | Sell | 1,689,110,000 | 13,602,548 | 6/10/16 | — | (307,859 | ) | ||||||||||||||||||||||
Japanese Yen | CITI | Sell | 2,595,800,000 | 20,921,217 | 6/10/16 | — | (456,096 | ) | ||||||||||||||||||||||
Japanese Yen | HSBC | Sell | 1,798,900,000 | 14,511,354 | 6/10/16 | — | (303,212 | ) | ||||||||||||||||||||||
Euro | GSCO | Sell | 8,105,300 | 9,231,531 | 6/13/16 | 130,447 | — | |||||||||||||||||||||||
Japanese Yen | DBAB | Sell | 595,700,000 | 4,837,348 | 6/13/16 | — | (68,910 | ) | ||||||||||||||||||||||
Japanese Yen | JPHQ | Sell | 1,666,680,000 | 13,520,949 | 6/13/16 | — | (206,030 | ) | ||||||||||||||||||||||
Euro | DBAB | Sell | 2,383,000 | 2,715,524 | 6/15/16 | 39,597 | — | |||||||||||||||||||||||
Japanese Yen | CITI | Sell | 310,702,000 | 2,533,220 | 6/16/16 | — | (26,000 | ) | ||||||||||||||||||||||
Japanese Yen | JPHQ | Sell | 702,800,000 | 5,727,441 | 6/16/16 | — | (61,449 | ) | ||||||||||||||||||||||
Malaysian Ringgit | JPHQ | Buy | 14,772,000 | 3,838,877 | 6/20/16 | — | (34,860 | ) | ||||||||||||||||||||||
| TGB-22 | Semiannual Report |
FRANKLIN TEMPLETON VARIABLE INSURANCE PRODUCTS TRUST
STATEMENT OF INVESTMENTS (UNAUDITED)
Templeton Global Bond VIP Fund (continued)
| Forward Exchange Contracts (continued) | ||||||||||||||||||||||||||||||
| Currency | Counterpartya | Type | Quantity | Contract Amount* | Settlement Date | Unrealized Appreciation | Unrealized Depreciation | |||||||||||||||||||||||
Euro | BZWS | Sell | 1,124,367 | 1,291,195 | 6/22/16 | $ | 28,351 | $ | — | |||||||||||||||||||||
Japanese Yen | DBAB | Sell | 1,455,820,000 | 11,913,421 | 6/22/16 | — | (80,273 | ) | ||||||||||||||||||||||
Philippine Peso | JPHQ | Buy | 251,010,000 | 5,477,219 | 6/27/16 | 733 | — | |||||||||||||||||||||||
Philippine Peso | JPHQ | Buy | 17,950,000 | 392,093 | 6/29/16 | — | (392 | ) | ||||||||||||||||||||||
|
| |||||||||||||||||||||||||||||
Totals Forward Exchange Contracts unrealized appreciation (depreciation) |
| 158,285,277 | (35,020,649 | ) | ||||||||||||||||||||||||||
|
| |||||||||||||||||||||||||||||
Net unrealized appreciation (depreciation) |
| $ | 123,264,628 | |||||||||||||||||||||||||||
|
| |||||||||||||||||||||||||||||
aMay be comprised of multiple contracts with the same counterparty, currency and settlement date.
*In U.S. dollars unless otherwise indicated.
See Abbreviations on page TGB - 38
At June 30, 2015, the Fund had the following interest rate swap contracts outstanding. See Note 1(d).
Interest Rate Swap Contracts
| Description | Counterparty / Exchange | Notional Amount | Expiration Date | Unrealized Appreciation | Unrealized Depreciation | |||||||||||||||
| Centrally Cleared Swap Contracts | ||||||||||||||||||||
Receive Floating rate 3-month USD BBA LIBOR | LCH | $ | 183,490,000 | 10/17/17 | $ | 149,311 | $ | — | ||||||||||||
Receive Floating rate 3-month USD BBA LIBOR | CME | 13,090,000 | 10/04/23 | — | (551,629 | ) | ||||||||||||||
Receive Floating rate 3-month USD BBA LIBOR | CME | 13,090,000 | 10/04/23 | — | (572,421 | ) | ||||||||||||||
Receive Floating rate 3-month USD BBA LIBOR | CME | 13,090,000 | 10/07/23 | — | (539,304 | ) | ||||||||||||||
Receive Floating rate 3-month USD BBA LIBOR | LCH | 34,000,000 | 7/07/24 | — | (1,408,596 | ) | ||||||||||||||
Receive Floating rate 3-month USD BBA LIBOR | LCH | 114,670,000 | 1/22/25 | 4,327,082 | — | |||||||||||||||
Receive Floating rate 3-month USD BBA LIBOR | LCH | 143,340,000 | 1/23/25 | 4,689,175 | — | |||||||||||||||
Receive Floating rate 3-month USD BBA LIBOR | LCH | 84,590,000 | 1/27/25 | 2,767,042 | — | |||||||||||||||
Receive Floating rate 3-month USD BBA LIBOR | LCH | 21,150,000 | 1/29/25 | 765,030 | — | |||||||||||||||
Receive Floating rate 3-month USD BBA LIBOR | LCH | 17,910,000 | 1/30/25 | 642,090 | — | |||||||||||||||
Receive Floating rate 3-month USD BBA LIBOR | LCH | 28,210,000 | 2/03/25 | 1,344,946 | — | |||||||||||||||
Receive Floating rate 3-month USD BBA LIBOR | CME | 6,370,000 | 10/04/43 | — | (979,938 | ) | ||||||||||||||
Receive Floating rate 3-month USD BBA LIBOR | CME | 6,370,000 | 10/04/43 | — | (1,004,015 | ) | ||||||||||||||
Receive Floating rate 3-month USD BBA LIBOR | CME | 6,370,000 | 10/07/43 | — | (988,504 | ) | ||||||||||||||
|
| |||||||||||||||||||
Totals Centrally Cleared Swap Contracts |
| 14,684,676 | (6,044,407 | ) | ||||||||||||||||
|
| |||||||||||||||||||
| OTC Swap Contracts | ||||||||||||||||||||
Receive Floating rate 3-month USD BBA LIBOR | JPHQ | $ | 3,240,000 | 3/04/21 | — | (325,518 | ) | |||||||||||||
Receive Floating rate 3-month USD BBA LIBOR | DBAB | 14,630,000 | 3/28/21 | — | (1,411,561 | ) | ||||||||||||||
Receive Floating rate 3-month USD BBA LIBOR | CITI | 7,460,000 | 2/25/41 | — | (2,114,040 | ) | ||||||||||||||
| Semiannual Report | TGB-23 |
FRANKLIN TEMPLETON VARIABLE INSURANCE PRODUCTS TRUST
STATEMENT OF INVESTMENTS (UNAUDITED)
Templeton Global Bond VIP Fund (continued)
| Interest Rate Swap Contracts (continued) | ||||||||||||||||||||
| Description | Counterparty / Exchange | Notional Amount | Expiration Date | Unrealized Appreciation | Unrealized Depreciation | |||||||||||||||
| OTC Swap Contracts (continued) | ||||||||||||||||||||
Receive Floating rate 3-month USD BBA LIBOR | JPHQ | $ | 7,460,000 | 2/25/41 | $ | — | $ | (2,117,848 | ) | |||||||||||
Receive Floating rate 3-month USD BBA LIBOR | JPHQ | 5,600,000 | 2/28/41 | — | (1,563,760 | ) | ||||||||||||||
Receive Floating rate 3-month USD BBA LIBOR | JPHQ | 1,870,000 | 3/01/41 | — | (511,646 | ) | ||||||||||||||
|
| |||||||||||||||||||
Totals OTC Swap Contracts |
| — | (8,044,373 | ) | ||||||||||||||||
|
| |||||||||||||||||||
Totals Interest Rate Swap Contracts |
| 14,684,676 | (14,088,780 | ) | ||||||||||||||||
|
| |||||||||||||||||||
Net unrealized appreciation (depreciation) |
| $ | 595,896 | |||||||||||||||||
|
| |||||||||||||||||||
See Abbreviations on page TGB - 38
| TGB-24 | Semiannual Report | The accompanying notes are an integral part of these financial statements. |
FRANKLIN TEMPLETON VARIABLE INSURANCE PRODUCTS TRUST
Financial Statements
Statement of Assets and Liabilities
June 30, 2015 (unaudited)
| Templeton Global Bond VIP Fund | ||||
Assets: | ||||
Investments in securities: | ||||
Cost - Unaffiliated issuers | $ | 3,341,605,104 | ||
Cost - Repurchase agreements | 29,083,774 | |||
|
| |||
Total cost of investments | $ | 3,370,688,878 | ||
|
| |||
Value - Unaffiliated issuers | $ | 3,092,918,478 | ||
Value - Repurchase agreements | 29,083,774 | |||
|
| |||
Total value of investments | 3,122,002,252 | |||
Cash | 260,867,224 | |||
Restricted cash (Note 1e) | 90,161,000 | |||
Foreign currency, at value (cost $57,514,172) | 57,437,227 | |||
Receivables: | ||||
Capital shares sold | 1,444,513 | |||
Interest | 29,334,413 | |||
Due from brokers | 31,738,882 | |||
Variation margin | 496,994 | |||
Unrealized appreciation on OTC forward exchange contracts | 158,285,277 | |||
Other assets | 1,520 | |||
|
| |||
Total assets | 3,751,769,302 | |||
|
| |||
Liabilities: | ||||
Payables: | ||||
Investment securities purchased | 362,907 | |||
Capital shares redeemed | 2,689,298 | |||
Management fees | 1,361,466 | |||
Distribution fees | 1,408,066 | |||
Due to Brokers | 90,161,000 | |||
Unrealized depreciation on OTC forward exchange contracts | 35,020,649 | |||
Unrealized depreciation on OTC swap contracts | 8,044,373 | |||
Deferred tax | 2,114,112 | |||
Accrued expenses and other liabilities | 1,113,457 | |||
|
| |||
Total liabilities | 142,275,328 | |||
|
| |||
Net assets, at value | $ | 3,609,493,974 | ||
|
| |||
Net assets consist of: | ||||
Paid-in capital | $ | 3,824,400,848 | ||
Distributions in excess of net investment income | (189,107,472 | ) | ||
Net unrealized appreciation (depreciation) | (127,778,666 | ) | ||
Accumulated net realized gain (loss) | 101,979,264 | |||
|
| |||
Net assets, at value | $ | 3,609,493,974 | ||
|
| |||
| The accompanying notes are an integral part of these financial statements. | Semiannual Report | TGB-25 |
FRANKLIN TEMPLETON VARIABLE INSURANCE PRODUCTS TRUST
FINANCIAL STATEMENTS
Statement of Assets and Liabilities (continued)
June 30, 2015 (unaudited)
| Templeton Global Bond VIP Fund | ||||
| Class 1: | ||||
Net assets, at value | $ | 314,491,442 | ||
|
| |||
Shares outstanding | 18,492,358 | |||
|
| |||
Net asset value and maximum offering price per share | $ | 17.01 | ||
|
| |||
| Class 2: | ||||
Net assets, at value | $ | 3,182,833,155 | ||
|
| |||
Shares outstanding | 193,365,027 | |||
|
| |||
Net asset value and maximum offering price per share | $ | 16.46 | ||
|
| |||
| Class 4: | ||||
Net assets, at value | $ | 112,169,377 | ||
|
| |||
Shares outstanding | 6,650,496 | |||
|
| |||
Net asset value and maximum offering price per share | $ | 16.87 | ||
|
| |||
| TGB-26 | Semiannual Report | The accompanying notes are an integral part of these financial statements. |
FRANKLIN TEMPLETON VARIABLE INSURANCE PRODUCTS TRUST
FINANCIAL STATEMENTS
Statement of Operations
for the six months ended June 30, 2015 (unaudited)
| Templeton Global Bond VIP Fund | ||||
Investment income: | ||||
Interest (net of foreign taxes $1,593,998) | $ | 63,647,816 | ||
|
| |||
Expenses: | ||||
Management fees (Note 3a) | 8,222,285 | |||
Distribution fees: (Note 3c) | ||||
Class 2 | 3,965,344 | |||
Class 4 | 194,267 | |||
Custodian fees (Note 4) | 645,147 | |||
Reports to shareholders | 265,712 | |||
Professional fees | 44,099 | |||
Trustees’ fees and expenses | 7,299 | |||
Other | 54,854 | |||
|
| |||
Total expenses | 13,399,007 | |||
Expense reductions (Note 4) | (3,034 | ) | ||
|
| |||
Net expenses | 13,395,973 | |||
|
| |||
Net investment income | 50,251,843 | |||
|
| |||
Realized and unrealized gains (losses): | ||||
Net realized gain (loss) from: | ||||
Investments | (67,044,871 | ) | ||
Foreign currency transactions | 171,457,838 | |||
Swap contracts | (2,361,145 | ) | ||
|
| |||
Net realized gain (loss) | 102,051,822 | |||
|
| |||
Net change in unrealized appreciation (depreciation) on: | ||||
Investments | (111,113,040 | ) | ||
Translation of other assets and liabilities denominated in foreign currencies | (68,964,991 | ) | ||
Swap contracts | 16,623,319 | |||
Change in deferred taxes on unrealized appreciation | 510,553 | |||
|
| |||
Net change in unrealized appreciation (depreciation) | (162,944,159 | ) | ||
|
| |||
Net realized and unrealized gain (loss) | (60,892,337 | ) | ||
|
| |||
Net increase (decrease) in net assets resulting from operations | $ | (10,640,494 | ) | |
|
| |||
| The accompanying notes are an integral part of these financial statements. | Semiannual Report | TGB-27 |
FRANKLIN TEMPLETON VARIABLE INSURANCE PRODUCTS TRUST
FINANCIAL STATEMENTS
Statements of Changes in Net Assets
| Templeton Global Bond VIP Fund | ||||||||
| Six Months Ended June 30, 2015 (unaudited) | Year Ended December 31, 2014 | |||||||
Increase (decrease) in net assets: | ||||||||
Operations: | ||||||||
Net investment income | $ | 50,251,843 | $ | 100,660,962 | ||||
Net realized gain (loss) | 102,051,822 | 33,697,929 | ||||||
Net change in unrealized appreciation (depreciation) | (162,944,159 | ) | (73,886,293 | ) | ||||
|
| |||||||
Net increase (decrease) in net assets resulting from operations | (10,640,494 | ) | 60,472,598 | |||||
|
| |||||||
Distributions to shareholders from: | ||||||||
Net investment income and net foreign currency gains: | ||||||||
Class 1 | (24,254,176 | ) | (15,858,865 | ) | ||||
Class 2 | (245,964,961 | ) | (156,385,457 | ) | ||||
Class 4 | (8,346,133 | ) | (5,645,270 | ) | ||||
Net realized gains: | ||||||||
Class 1 | (1,526,914 | ) | — | |||||
Class 2 | (15,975,209 | ) | — | |||||
Class 4 | (550,981 | ) | — | |||||
|
| |||||||
Total distributions to shareholders | (296,618,374 | ) | (177,889,592 | ) | ||||
|
| |||||||
Capital share transactions: (Note 2) | ||||||||
Class 1 | 17,326,539 | 52,744,146 | ||||||
Class 2 | 276,832,821 | 457,068,596 | ||||||
Class 3 | — | (195,888,546 | ) | |||||
Class 4 | 10,264,899 | (3,448,828 | ) | |||||
|
| |||||||
Total capital share transactions | 304,424,259 | 310,475,368 | ||||||
|
| |||||||
Redemption fees | — | 1,163 | ||||||
|
| |||||||
Net increase (decrease) in net assets | (2,834,609 | ) | 193,059,537 | |||||
Net assets: | ||||||||
Beginning of period | 3,612,328,583 | 3,419,269,046 | ||||||
|
| |||||||
End of period | $ | 3,609,493,974 | $ | 3,612,328,583 | ||||
|
| |||||||
Undistributed net investment income (distributions in excess of net investment income) included in net assets: | ||||||||
End of period | $ | (189,107,472 | ) | $ | 39,205,955 | |||
|
| |||||||
| TGB-28 | Semiannual Report | The accompanying notes are an integral part of these financial statements. |
FRANKLIN TEMPLETON VARIABLE INSURANCE PRODUCTS TRUST
Notes to Financial Statements (unaudited)
Templeton Global Bond VIP Fund
1. Organization and Significant Accounting Policies
Franklin Templeton Variable Insurance Products Trust (Trust) is registered under the Investment Company Act of 1940 (1940 Act) as an open-end management investment company, consisting of nineteen separate funds and applies the specialized accounting and reporting guidance in U.S. Generally Accepted Accounting Principles (U.S. GAAP). Templeton Global Bond VIP Fund (Fund) is included in this report. The financial statements of the remaining funds in the Trust are presented separately. Shares of the Fund are generally sold only to insurance company separate accounts to fund the benefits of variable life insurance policies or variable annuity contracts. The Fund offers three classes of shares: Class 1, Class 2 and Class 4. Effective May 1, 2014, all Class 3 shares were converted to Class 2. Each class of shares differs by its distribution fees, voting rights on matters affecting a single class and its exchange privilege.
The following summarizes the Fund’s significant accounting policies.
a. Financial Instrument Valuation
The Fund’s investments in financial instruments are carried at fair value daily. Fair value is the price that would be received to sell an asset or paid to transfer a liability in an orderly transaction between market participants on the measurement date. The Fund calculates the net asset value per share at the close of the New York Stock Exchange (NYSE), generally at 4 p.m. Eastern time (NYSE close) on each day the NYSE is open for trading. Under compliance policies and procedures approved by the Trust’s Board of Trustees (the Board), the Fund’s administrator has responsibility for oversight of valuation, including leading the cross-functional Valuation and Liquidity Oversight Committee (VLOC). The VLOC provides administration and oversight of the Fund’s valuation policies and procedures, which are approved annually by the Board. Among other things, these procedures allow the Fund to utilize independent pricing services, quotations from securities and financial instrument dealers, and other market sources to determine fair value.
Debt securities generally trade in the over-the-counter (OTC) market rather than on a securities exchange. The Fund’s pricing services use multiple valuation techniques to determine fair value. In instances where sufficient market activity exists, the pricing services may utilize a market-based approach through which quotes from market makers are used to determine fair
value. In instances where sufficient market activity may not exist or is limited, the pricing services also utilize proprietary valuation models which may consider market characteristics such as benchmark yield curves, credit spreads, estimated default rates, anticipated market interest rate volatility, coupon rates, anticipated timing of principal repayments, underlying collateral, and other unique security features in order to estimate the relevant cash flows, which are then discounted to calculate the fair value. Securities denominated in a foreign currency are converted into their U.S. dollar equivalent at the foreign exchange rate in effect at the NYSE close on the date that the values of the foreign debt securities are determined. Repurchase agreements are valued at cost, which approximates fair value.
Derivative financial instruments (derivatives) listed on an exchange are valued at the official closing price of the day. Certain derivatives trade in the OTC market. The Fund’s pricing services use various techniques including industry standard option pricing models and proprietary discounted cash flow models to determine the fair value of those instruments. The Fund’s net benefit or obligation under the derivative contract, as measured by the fair value of the contract, is included in net assets.
The Fund has procedures to determine the fair value of financial instruments for which market prices are not reliable or readily available. Under these procedures, the VLOC convenes on a regular basis to review such financial instruments and considers a number of factors, including significant unobservable valuation inputs, when arriving at fair value. The VLOC primarily employs a market-based approach which may use related or comparable assets or liabilities, recent transactions, market multiples, book values, and other relevant information for the investment to determine the fair value of the investment. An income-based valuation approach may also be used in which the anticipated future cash flows of the investment are discounted to calculate fair value. Discounts may also be applied due to the nature or duration of any restrictions on the disposition of the investments. Due to the inherent uncertainty of valuations of such investments, the fair values may differ significantly from the values that would have been used had an active market existed. The VLOC employs various methods for calibrating these valuation approaches including a regular review of key inputs and assumptions, transactional back-testing or disposition analysis, and reviews of any related market activity.
| Semiannual Report | TGB-29 |
FRANKLIN TEMPLETON VARIABLE INSURANCE PRODUCTS TRUST
NOTES TO FINANCIAL STATEMENTS (UNAUDITED)
Templeton Global Bond VIP Fund (continued)
1. Organization and Significant Accounting Policies (continued)
b. Foreign Currency Translation
Portfolio securities and other assets and liabilities denominated in foreign currencies are translated into U.S. dollars based on the exchange rate of such currencies against U.S. dollars on the date of valuation. The Fund may enter into foreign currency exchange contracts to facilitate transactions denominated in a foreign currency. Purchases and sales of securities, income and expense items denominated in foreign currencies are translated into U.S. dollars at the exchange rate in effect on the transaction date. Portfolio securities and assets and liabilities denominated in foreign currencies contain risks that those currencies will decline in value relative to the U.S. dollar. Occasionally, events may impact the availability or reliability of foreign exchange rates used to convert the U.S. dollar equivalent value. If such an event occurs, the foreign exchange rate will be valued at fair value using procedures established and approved by the Board.
The Fund does not separately report the effect of changes in foreign exchange rates from changes in market prices on securities held. Such changes are included in net realized and unrealized gain or loss from investments in the Statement of Operations.
Realized foreign exchange gains or losses arise from sales of foreign currencies, currency gains or losses realized between the trade and settlement dates on securities transactions and the difference between the recorded amounts of dividends, interest, and foreign withholding taxes and the U.S. dollar equivalent of the amounts actually received or paid. Net unrealized foreign exchange gains and losses arise from changes in foreign exchange rates on foreign denominated assets and liabilities other than investments in securities held at the end of the reporting period.
c. Joint Repurchase Agreement
The Fund enters into a joint repurchase agreement whereby its uninvested cash balance is deposited into a joint cash account with other funds managed by the investment manager or an affiliate of the investment manager and is used to invest in one or more repurchase agreements. The value and face amount of the joint repurchase agreement are allocated to the funds based on their pro-rata interest. A repurchase agreement is accounted for as a loan by the Fund to the seller, collateralized by securities which are delivered to the Fund’s custodian. The fair
value, including accrued interest, of the initial collateralization is required to be at least 102% of the dollar amount invested by the funds, with the value of the underlying securities marked to market daily to maintain coverage of at least 100%. Repurchase agreements are subject to the terms of Master Repurchase Agreements (MRAs) with approved counterparties (sellers). The MRAs contain various provisions, including but not limited to events of default and maintenance of collateral for repurchase agreements. In the event of default by either the seller or the Fund, certain MRAs may permit the non-defaulting party to net and close-out all transactions, if any, traded under such agreements. The Fund may sell securities it holds as collateral and apply the proceeds towards the repurchase price and any other amounts owed by the seller to the Fund in the event of default by the seller. This could involve costs or delays in addition to a loss on the securities if their value falls below the repurchase price owed by the seller. The joint repurchase agreement held by the Fund at period end, as indicated in the Statement of Investments, had been entered into on June 30, 2015.
d. Derivative Financial Instruments
The Fund invested in derivatives in order to manage risk or gain exposure to various other investments or markets. Derivatives are financial contracts based on an underlying or notional amount, require no initial investment or an initial net investment that is smaller than would normally be required to have a similar response to changes in market factors, and require or permit net settlement. Derivatives contain various risks including the potential inability of the counterparty to fulfill their obligations under the terms of the contract, the potential for an illiquid secondary market, and/or the potential for market movements which expose the Fund to gains or losses in excess of the amounts shown in the Statement of Assets and Liabilities. Realized gain and loss and unrealized appreciation and depreciation on these contracts for the period are included in the Statement of Operations.
Derivative counterparty credit risk is managed through a formal evaluation of the creditworthiness of all potential counterparties. The Fund attempts to reduce its exposure to counterparty credit risk on OTC derivatives, whenever possible, by entering into International Swaps and Derivatives Association (ISDA) master agreements with certain counterparties. These agreements contain various provisions, including but not limited to collateral requirements, events of default, or early termination. Termination events applicable to the counterparty include certain deteriorations in the credit quality of the counterparty.
| TGB-30 | Semiannual Report |
FRANKLIN TEMPLETON VARIABLE INSURANCE PRODUCTS TRUST
NOTES TO FINANCIAL STATEMENTS (UNAUDITED)
Templeton Global Bond VIP Fund (continued)
Termination events applicable to the Fund include failure of the Fund to maintain certain net asset levels and/or limit the decline in net assets over various periods of time. In the event of default or early termination, the ISDA master agreement gives the non-defaulting party the right to net and close-out all transactions traded, whether or not arising under the ISDA agreement, to one net amount payable by one counterparty to the other. However, absent an event of default or early termination, OTC derivative assets and liabilities are presented gross and not offset in the Statement of Assets and Liabilities. Early termination by the counterparty may result in an immediate payment by the Fund of any net liability owed to that counterparty under the ISDA agreement.
Collateral requirements differ by type of derivative. Collateral or initial margin requirements are set by the broker or exchange clearing house for exchange traded and centrally cleared derivatives. Initial margin deposited is held at the exchange and can be in the form of cash and/or securities. For OTC derivatives traded under an ISDA master agreement, posting of collateral is required by either the fund or the applicable counterparty if the total net exposure of all OTC derivatives with the applicable counterparty exceeds the minimum transfer amount, which typically ranges from $100,000 to $250,000, and can vary depending on the counterparty and the type of the agreement. Generally, collateral is determined at the close of fund business each day and any additional collateral required due to changes in derivative values may be delivered by the fund or the counterparty within a few business days. Collateral pledged and/or received by the fund for OTC derivatives, if any, is held in segregated accounts with the fund’s custodian/counterparty broker and can be in the form of cash and/or securities. Unrestricted cash may be invested according to the Fund’s investment objectives.
The Fund entered into OTC forward exchange contracts primarily to manage and/or gain exposure to certain foreign currencies. A forward exchange contract is an agreement between the Fund and a counterparty to buy or sell a foreign currency at a specific exchange rate on a future date.
The Fund entered into interest rate swap contracts primarily to manage interest rate risk. An interest rate swap is an agreement between the Fund and a counterparty to exchange cash flows based on the difference between two interest rates, applied to a notional amount. These agreements may be privately negotiated in the over-the-counter market (“OTC interest rate swaps”) or
may be executed on a registered exchange (“centrally cleared interest rate swaps”). For centrally cleared interest rate swaps, required initial margins are pledged by the Fund, and the daily change in fair value is accounted for as a variation margin payable or receivable in the Statement of Assets and Liabilities. Over the term of the contract, contractually required payments to be paid and to be received are accrued daily and recorded as unrealized depreciation and appreciation until the payments are made, at which time they are realized.
See Note 9 regarding other derivative information.
e. Restricted Cash
At June 30, 2015, the Fund held restricted cash in connection with investments in certain derivative securities. Restricted cash is held in a segregated account with the Fund’s counterparty broker and is reflected in the Statement of Assets and Liabilities.
f. Loan Participation Notes
The Fund invests in loan participation notes (“Participations”). Participations are loans originally issued to a borrower by one or more financial institutions (the “Lender”) and subsequently sold to other investors, such as the Fund. Participations typically result in the Fund having a contractual relationship only with the Lender and not with the borrower. The Fund has the right to receive from the Lender any payments of principal, interest and fees which the Lender received from the borrower. The Fund generally has no rights to either enforce compliance by the borrower with the terms of the loan agreement or to any collateral relating to the original loan. As a result, the Fund assumes the credit risk of both the borrower and the Lender that is selling the Participation. The Participations may also involve interest rate risk and liquidity risk, including the potential default or insolvency of the borrower and/or the Lender.
g. Income and Deferred Taxes
It is the Fund’s policy to qualify as a regulated investment company under the Internal Revenue Code. The Fund intends to distribute to shareholders substantially all of its taxable income and net realized gains to relieve it from federal income and if applicable, excise taxes. As a result, no provision for U.S. federal income taxes is required.
The Fund may be subject to foreign taxation related to income received, capital gains on the sale of securities and certain
| Semiannual Report | TGB-31 |
FRANKLIN TEMPLETON VARIABLE INSURANCE PRODUCTS TRUST
NOTES TO FINANCIAL STATEMENTS (UNAUDITED)
Templeton Global Bond VIP Fund (continued)
1. Organization and Significant Accounting Policies (continued)
g. Income and Deferred Taxes (continued)
foreign currency transactions in the foreign jurisdictions in which it invests. Foreign taxes, if any, are recorded based on the tax regulations and rates that exist in the foreign markets in which the Fund invests. When a capital gain tax is determined to apply, the Fund records an estimated deferred tax liability in an amount that would be payable if the securities were disposed of on the valuation date.
The Fund recognizes the tax benefits of uncertain tax positions only when the position is “more likely than not” to be sustained upon examination by the tax authorities based on the technical merits of the tax position. As of June 30, 2015, and for all open tax years, the Fund has determined that no liability for unrecognized tax benefits is required in the Fund’s financial statements related to uncertain tax positions taken on a tax return (or expected to be taken on future tax returns). Open tax years are those that remain subject to examination and are based on each tax jurisdiction’s statute of limitation.
h. Security Transactions, Investment Income, Expenses and Distributions
Security transactions are accounted for on trade date. Realized gains and losses on security transactions are determined on a specific identification basis. Interest income and estimated expenses are accrued daily. Amortization of premium and accretion of discount on debt securities are included in interest income. Distributions to shareholders are recorded on the ex-dividend date and are determined according to income tax regulations (tax basis). Distributable earnings determined on a tax basis may differ from earnings recorded in accordance with U.S. GAAP. These differences may be permanent or temporary. Permanent differences are reclassified among capital accounts to reflect their tax character. These reclassifications have no impact on net assets or the results of operations. Temporary differences are not reclassified, as they may reverse in subsequent periods.
Common expenses incurred by the Trust are allocated among the funds based on the ratio of net assets of each fund to the combined net assets of the Trust. Fund specific expenses are charged directly to the fund that incurred the expense.
Realized and unrealized gains and losses and net investment income, not including class specific expenses, are allocated daily to each class of shares based upon the relative proportion of net assets of each class. Differences in per share distributions, by class, are generally due to differences in class specific expenses.
Inflation-indexed bonds are adjusted for inflation through periodic increases or decreases in the security’s interest accruals, face amount, or principal redemption value, by amounts corresponding to the rate of inflation as measured by an index. Any increase or decrease in the face amount or principal redemption value will be included as interest income in the Statement of Operations.
i. Accounting Estimates
The preparation of financial statements in accordance with U.S. GAAP requires management to make estimates and assumptions that affect the reported amounts of assets and liabilities at the date of the financial statements and the amounts of income and expenses during the reporting period. Actual results could differ from those estimates.
j. Redemption Fees
Redemptions and exchanges of interests in an insurance company subaccount that invested in Class 3 shares of the Fund were subject to a 1.0% short term trading fee if the interest in the subaccount had been held for less than 60 days. Such fees were retained by the Fund and accounted for as an addition to paid-in capital, allocated to each class of shares based upon the relative proportion of net assets of each class. There were no redemption fees for the period.
k. Guarantees and Indemnifications
Under the Trust’s organizational documents, its officers and trustees are indemnified by the Trust against certain liabilities arising out of the performance of their duties to the Trust. Additionally, in the normal course of business, the Trust, on behalf of the Fund, enters into contracts with service providers that contain general indemnification clauses. The Trust’s maximum exposure under these arrangements is unknown as this would involve future claims that may be made against the Trust that have not yet occurred. Currently, the Trust expects the risk of loss to be remote.
| TGB-32 | Semiannual Report |
FRANKLIN TEMPLETON VARIABLE INSURANCE PRODUCTS TRUST
NOTES TO FINANCIAL STATEMENTS (UNAUDITED)
Templeton Global Bond VIP Fund (continued)
2. Shares of Beneficial Interest
At June 30, 2015, there were an unlimited number of shares authorized (without par value). Transactions in the Fund’s shares were as follows:
| Six Months Ended June 30, 2015 | Year Ended December 31, 2014 | |||||||||||||||||
| Shares | Amount | Shares | Amount | |||||||||||||||
| Class 1 Shares: | ||||||||||||||||||
Shares sold | 1,743,610 | $ | 32,333,219 | 4,252,687 | $ | 81,034,541 | ||||||||||||
Shares issued in reinvestment of distributions | 1,514,753 | 25,781,090 | 844,006 | 15,858,865 | ||||||||||||||
Shares redeemed | (2,198,476 | ) | (40,787,770 | ) | (2,332,299 | ) | (44,149,260 | ) | ||||||||||
|
| |||||||||||||||||
Net increase (decrease) | 1,059,887 | $ | 17,326,539 | 2,764,394 | $ | 52,744,146 | ||||||||||||
|
| |||||||||||||||||
| Class 2 Shares: | ||||||||||||||||||
Shares sold | 9,372,994 | $ | 168,432,060 | 34,833,702 | $ | 645,437,884 | ||||||||||||
Shares issued in reinvestment of distributions | 15,904,078 | 261,940,170 | 8,573,764 | 156,385,457 | ||||||||||||||
Shares redeemed | (8,564,291 | ) | (153,539,409 | ) | (18,696,173 | ) | (344,754,745 | ) | ||||||||||
|
| |||||||||||||||||
Net increase (decrease) | 16,712,781 | $ | 276,832,821 | 24,711,293 | $ | 457,068,596 | ||||||||||||
|
| |||||||||||||||||
| Class 3 Sharesa: | ||||||||||||||||||
Shares sold | 167,296 | $ | 3,090,319 | |||||||||||||||
Shares redeemed | (10,595,103 | ) | (198,978,865 | ) | ||||||||||||||
|
|
| ||||||||||||||||
Net increase (decrease) | (10,427,807 | ) | $ | (195,888,546 | ) | |||||||||||||
|
|
| ||||||||||||||||
| Class 4 Shares: | ||||||||||||||||||
Shares sold | 574,525 | $ | 10,511,082 | 721,184 | $ | 13,510,739 | ||||||||||||
Shares issued on reinvestment of distributions | 527,080 | 8,897,114 | 302,695 | 5,645,270 | ||||||||||||||
Shares redeemed | (500,493 | ) | (9,143,297 | ) | (1,203,628 | ) | (22,604,837 | ) | ||||||||||
|
| |||||||||||||||||
Net increase (decrease) | 601,112 | $ | 10,264,899 | (179,749 | ) | $ | (3,448,828 | ) | ||||||||||
|
| |||||||||||||||||
aEffective May 1, 2014, all Class 3 shares were converted to Class 2.
3. Transactions with Affiliates
Franklin Resources, Inc. is the holding company for various subsidiaries that together are referred to as Franklin Templeton Investments. Certain officers and trustees of the Fund are also officers and/or directors of the following subsidiaries:
| Subsidiary | Affiliation | |
Franklin Advisers, Inc. (Advisers) | Investment manager | |
Franklin Templeton Services, LLC (FT Services) | Administrative manager | |
Franklin Templeton Distributors, Inc. (Distributors) | Principal underwriter | |
Franklin Templeton Investor Services, LLC (Investor Services) | Transfer agent |
| Semiannual Report | TGB-33 |
FRANKLIN TEMPLETON VARIABLE INSURANCE PRODUCTS TRUST
NOTES TO FINANCIAL STATEMENTS (UNAUDITED)
Templeton Global Bond VIP Fund (continued)
3. Transactions with Affiliates (continued)
a. Management Fees
The Fund pays an investment management fee to Advisers based on the average daily net assets of the Fund as follows:
| Annualized Fee Rate | Net Assets | |
0.625% | Up to and including $100 million | |
0.500% | Over $100 million, up to and including $250 million | |
0.450% | Over $250 million, up to and including $7.5 billion | |
0.440% | Over $7.5 billion, up to and including $10 billion | |
0.430% | Over $10 billion, up to and including $12.5 billion | |
0.420% | Over $12.5 billion, up to and including $15 billion | |
0.400% | In excess of $15 billion |
b. Administrative Fees
Under an agreement with Advisers, FT Services provides administrative services to the Fund. The fee is paid by Advisers based on the Fund’s average daily net assets, and is not an additional expense of the Fund.
c. Distribution Fees
The Board has adopted distribution plans for Class 2 and Class 4 shares pursuant to Rule 12b-1 under the 1940 Act. Under the Fund’s compensation distribution plans, the Fund pays Distributors for costs incurred in connection with the servicing, sale and distribution of the Fund’s shares up to 0.25% and 0.35% per year of its average daily net assets of Class 2 and Class 4, respectively. Some distribution fees are not charged on shares held by affiliates. The plan year, for purposes of monitoring compliance with the maximum annual plan rates, is February 1 through January 31.
d. Transfer Agent Fees
Investor Services, under terms of an agreement, performs shareholder servicing for the Fund and is not paid by the Fund for the services.
4. Expense Offset Arrangement
The Fund has entered into an arrangement with its custodian whereby credits realized as a result of uninvested cash balances are used to reduce a portion of the Fund’s custodian expenses. During the period ended June 30, 2015, the custodian fees were reduced as noted in the Statement of Operations.
5. Income Taxes
At June 30, 2015, the cost of investments and net unrealized appreciation (depreciation) for income tax purposes were as follows:
Cost of investments | $ | 3,389,954,591 | ||
|
| |||
Unrealized appreciation | $ | 27,115,431 | ||
Unrealized depreciation | (295,067,770 | ) | ||
|
| |||
Net unrealized appreciation (depreciation) | $ | (267,952,339 | ) | |
|
|
Differences between income and/or capital gains as determined on a book basis and a tax basis are primarily due to differing treatments of foreign currency transactions, bond discounts and premiums, and tax straddles.
| TGB-34 | Semiannual Report |
FRANKLIN TEMPLETON VARIABLE INSURANCE PRODUCTS TRUST
NOTES TO FINANCIAL STATEMENTS (UNAUDITED)
Templeton Global Bond VIP Fund (continued)
6. Investment Transactions
Purchases and sales of investments (excluding short term securities) for the period ended June 30, 2015, aggregated $636,286,941 and $567,920,060, respectively.
7. Credit Risk
At June 30, 2015, the Fund had 12.42% of its portfolio invested in high yield or other securities rated below investment grade. These securities may be more sensitive to economic conditions causing greater price volatility and are potentially subject to a greater risk of loss due to default than higher rated securities.
8. Concentration of Risk
Investing in foreign securities may include certain risks and considerations not typically associated with investing in U.S. securities, such as fluctuating currency values and changing local and regional economic, political and social conditions, which may result in greater market volatility. In addition, certain foreign securities may not be as liquid as U.S. securities.
9. Other Derivative Information
At June 30, 2015, the Fund’s investments in derivative contracts are reflected in the Statement of Assets and Liabilities as follows:
Asset Derivatives | Liability Derivatives | |||||||||||
| Derivative Contracts Not Accounted for as Hedging Instruments | Statement of Assets and Liabilities Location | Fair Value | Statement of Assets and Liabilities Location | Fair Value | ||||||||
Interest rate contracts | Variation margin | $ | 14,684,676 | a | Variation margin | $ | 6,044,407 | a | ||||
Unrealized appreciation on OTC swap contracts | — | Unrealized depreciation on OTC swap contracts | 8,044,373 | |||||||||
Foreign exchange contracts | Unrealized appreciation on OTC forward exchange contracts | 158,285,277 | Unrealized depreciation on OTC forward exchange contracts | 35,020,649 | ||||||||
|
|
|
| |||||||||
Totals | $ | 172,969,953 | $ | 49,109,429 | ||||||||
|
|
|
| |||||||||
aThis amount reflects the cumulative appreciation (depreciation) of centrally cleared swap contracts as reported in the Statement of Investments. Only the variation margin receivable/payable at period end is separately reported within the Statement of Assets and Liabilities. Prior variation margin movements were recorded to cash upon receipt or payment.
For the period ended June 30, 2015, the effect of derivative contracts in the Fund’s Statement of Operations was as follows:
| Derivative Contracts Not Accounted for as Hedging Instruments | Statement of Operations Locations | Net Realized Gain (Loss) for the Period | Statement of Operations Locations | Net Change in Unrealized Appreciation (Depreciation) for the Period | ||||||||
Net realized gain (loss) from: | Net change in unrealized appreciation (depreciation) on: | |||||||||||
Interest rate contracts | Swap contracts | $ | (2,361,145 | ) | Swap contracts | $ | 16,623,319 | |||||
Foreign exchange contracts | Foreign currency transactions | 179,005,384 | a | Translation of other assets and liabilities denominated in foreign currencies | (69,398,655 | )a | ||||||
|
|
|
| |||||||||
Totals | $ | 176,644,239 | $ | (52,775,336 | ) | |||||||
|
|
|
| |||||||||
aForward exchange contracts are included in net realized gain (loss) from foreign currency transactions and net change in unrealized appreciation (depreciation) on translation of other assets and liabilities denominated in foreign currencies in the Statement of Operations.
| Semiannual Report | TGB-35 |
FRANKLIN TEMPLETON VARIABLE INSURANCE PRODUCTS TRUST
NOTES TO FINANCIAL STATEMENTS (UNAUDITED)
Templeton Global Bond VIP Fund (continued)
9. Other Derivative Information (continued)
At June 30, 2015, the Fund’s OTC derivative assets and liabilities are as follows:
| Gross and Net Amounts of Assets and Liabilities Presented in the Statement of Assets and Liabilities | ||||||||
| Assetsa | Liabilitiesa | |||||||
| Derivatives | ||||||||
Forward exchange contracts | $ | 158,285,277 | $ | 35,020,649 | ||||
Swap contracts | — | 8,044,373 | ||||||
|
| |||||||
Total | $ | 158,285,277 | $ | 43,065,022 | ||||
|
| |||||||
aAbsent an event of default or early termination, OTC derivative assets and liabilities are presented gross and not offset in the Statement of Assets and Liabilities.
At June 30, 2015, the Fund’s OTC derivative assets which may be offset against the Fund’s OTC derivative liabilities and collateral received from the counterparty, is as follows:
| Amounts Not Offset in the Statement of Assets and Liabilities | ||||||||||||||||||||
| Gross and Net Amounts of Assets Presented in the Statement of Assets and Liabilities | Financial Instruments Available for Offset | Financial Instruments Collateral Receiveda,b | Cash Collateral Receivedb | Net Amount (Not less than zero) | ||||||||||||||||
| Counterparty | ||||||||||||||||||||
BOFA | $ | 2,754,099 | $ | (972,531 | ) | $ | (1,781,568 | ) | $ | — | $ | — | ||||||||
BZWS | 21,314,759 | (1,610,273 | ) | — | (19,704,486 | ) | — | |||||||||||||
CITI | 10,411,947 | (6,670,066 | ) | — | — | 3,741,881 | ||||||||||||||
DBAB | 33,510,651 | (13,654,784 | ) | — | (19,855,867 | ) | — | |||||||||||||
GSCO | 4,934,033 | (884,246 | ) | — | (4,030,000 | ) | 19,787 | |||||||||||||
HSBC | 23,092,608 | (9,975,984 | ) | (13,116,624 | ) | — | — | |||||||||||||
JPHQ | 46,282,114 | (7,618,739 | ) | (4,049,583 | ) | (34,600,000 | ) | 13,792 | ||||||||||||
MSCO | 7,841,733 | (1,245,941 | ) | — | (6,595,792 | ) | — | |||||||||||||
SCNY | 3,124,992 | (432,458 | ) | — | (2,692,534 | ) | — | |||||||||||||
UBSW | 5,018,341 | — | (5,018,341 | ) | — | — | ||||||||||||||
|
| |||||||||||||||||||
Total | $ | 158,285,277 | $ | (43,065,022 | ) | $ | (23,966,116 | ) | $ | (87,478,679 | ) | $ | 3,775,460 | |||||||
|
| |||||||||||||||||||
aAt June 30, 2015, the Fund received United Kingdom Treasury Bonds and Notes, U.S. Government and Agency Securities and U.S. Treasury Bonds and Notes as collateral for derivatives.
bIn some instances, the collateral amounts disclosed in the table above were adjusted due to the requirement to limit the collateral amounts to avoid the effect of overcollateralization. Actual collateral received and/or pledged may be more than the amounts disclosed herein.
| TGB-36 | Semiannual Report |
FRANKLIN TEMPLETON VARIABLE INSURANCE PRODUCTS TRUST
NOTES TO FINANCIAL STATEMENTS (UNAUDITED)
Templeton Global Bond VIP Fund (continued)
At June 30, 2015, the Fund’s OTC derivative liabilities which may be offset against the Fund’s OTC derivative assets and collateral pledged to the counterparty, is as follows:
| Amounts Not Offset in the Statement of Assets and Liabilities | ||||||||||||||||||||
| Gross and Net Amounts of Liabilities Presented in the Statement of Assets and Liabilities | Financial Instruments Available for Offset | Financial Instruments Collateral Pledged | Cash Collateral Pledged | Net Amount (Not less than zero) | ||||||||||||||||
| Counterparty | ||||||||||||||||||||
BOFA | $ | 972,531 | $ | (972,531 | ) | $ | — | $ | — | $ | — | |||||||||
BZWS | 1,610,273 | (1,610,273 | ) | — | — | — | ||||||||||||||
CITI | 6,670,066 | (6,670,066 | ) | — | — | — | ||||||||||||||
DBAB | 13,654,784 | (13,654,784 | ) | — | — | — | ||||||||||||||
GSCO | 884,246 | (884,246 | ) | — | — | — | ||||||||||||||
HSBC | 9,975,984 | (9,975,984 | ) | — | — | — | ||||||||||||||
JPHQ | 7,618,739 | (7,618,739 | ) | — | — | — | ||||||||||||||
MSCO | 1,245,941 | (1,245,941 | ) | — | — | — | ||||||||||||||
SCNY | 432,458 | (432,458 | ) | — | — | — | ||||||||||||||
UBSW | — | — | — | — | — | |||||||||||||||
|
| |||||||||||||||||||
Total | $ | 43,065,022 | $ | (43,065,022 | ) | $ | — | $ | — | $ | — | |||||||||
|
| |||||||||||||||||||
aIn some instances, the collateral amounts disclosed in the table above were adjusted due to the requirement to limit the collateral amounts to avoid the effect of overcollateralization. Actual collateral received and/or pledged may be more than the amounts disclosed herein.
For the period ended June 30, 2015, the average month end fair value of derivatives represented 7.95% of average month end net assets. The average month end number of open derivative contracts for the period was 509.
See Note 1(d) regarding derivative financial instruments.
See Abbreviations on page TGB - 42
10. Credit Facility
The Fund, together with other U.S. registered and foreign investment funds (collectively, Borrowers), managed by Franklin Templeton Investments, are borrowers in a joint syndicated senior unsecured credit facility totaling $2 billion (Global Credit Facility) which matures on February 12, 2016. This Global Credit Facility provides a source of funds to the Borrowers for temporary and emergency purposes, including the ability to meet future unanticipated or unusually large redemption requests.
Under the terms of the Global Credit Facility, the Fund shall, in addition to interest charged on any borrowings made by the Fund and other costs incurred by the Fund, pay its share of fees and expenses incurred in connection with the implementation and maintenance of the Global Credit Facility, based upon its relative share of the aggregate net assets of all of the Borrowers, including an annual commitment fee of 0.07% based upon the unused portion of the Global Credit Facility. These fees are reflected in other expenses in the Statement of Operations. During the period ended June 30, 2015, the Fund did not use the Global Credit Facility.
| Semiannual Report | TGB-37 |
FRANKLIN TEMPLETON VARIABLE INSURANCE PRODUCTS TRUST
NOTES TO FINANCIAL STATEMENTS (UNAUDITED)
Templeton Global Bond VIP Fund (continued)
11. Fair Value Measurements
The Fund follows a fair value hierarchy that distinguishes between market data obtained from independent sources (observable inputs) and the Fund’s own market assumptions (unobservable inputs). These inputs are used in determining the value of the Fund’s financial instruments and are summarized in the following fair value hierarchy:
| • | Level 1 – quoted prices in active markets for identical financial instruments |
| • | Level 2 – other significant observable inputs (including quoted prices for similar financial instruments, interest rates, prepayment speed, credit risk, etc.) |
| • | Level 3 – significant unobservable inputs (including the Fund’s own assumptions in determining the fair value of financial instruments) |
The input levels are not necessarily an indication of the risk or liquidity associated with financial instruments at that level.
For movements between the levels within the fair value hierarchy, the Fund has adopted a policy of recognizing the transfers as of the date of the underlying event which caused the movement.
At June 30, 2015, all of the Fund’s investments in financial instruments carried at fair value were valued using Level 2 inputs.
12. Subsequent Events
The Fund has evaluated subsequent events through the issuance of the financial statements and determined that no events have occurred that require disclosure.
Abbreviations
| Counterparty/Exchange | Currency | Select Portfolio | ||||||||
| BOFA | Bank of America N.A. | BRL | Brazilian Real | FHLB | Federal Home Loan Bank | |||||
| BZWS | Barclays Bank PLC | EUR | Euro | FRN | Floating Rate Note | |||||
| CITI | Citigroup, Inc. | HUF | Hungarian Forint | |||||||
| CME | Chicago Mercantile Exchange | IDR | Indonesian Rupiah | |||||||
| DBAB | Deutsche Bank AG | INR | Indian Rupee | |||||||
| GSCO | Goldman Sachs Bank | JPY | Japanese Yen | |||||||
| HSBC | HSBC Bank USA N.A. | KRW | South Korean Won | |||||||
| JPHQ | JP Morgan Chase & Co. | LKR | Sri Lankan Rupee | |||||||
| LCH | London Clearing House | MXN | Mexican Peso | |||||||
| MSCO | Morgan Stanley | MYR | Malaysian Ringgit | |||||||
| SCNY | Standard Chartered Bank | PEN | Peruvian Nuevo Sol | |||||||
| UBSW | UBS AG | PHP | Philippine Peso | |||||||
| PLN | Polish Zloty | |||||||||
| SGD | Singapore Dollar | |||||||||
| TGB-38 | Semiannual Report |
FRANKLIN TEMPLETON VARIABLE INSURANCE PRODUCTS TRUST
Tax Information (unaudited)
Templeton Global Bond VIP Fund
At December 31, 2014, more than 50% of the Fund’s total assets were invested in securities of foreign issuers. In most instances, foreign taxes were withheld from income paid to the Fund on these investments. As shown in the table below, the Fund hereby reports to shareholders the foreign source income and foreign taxes paid, pursuant to Section 853 of the Internal Revenue Code. This written statement will allow shareholders of record on June 12, 2015, to treat their proportionate share of foreign taxes paid by the Fund as having been paid directly by them. The shareholder shall consider these amounts as foreign taxes paid in the tax year in which they receive the Fund distribution.
The following table provides a detailed analysis of foreign tax paid, and foreign source income as reported by the Fund, to Class 1, Class 2 and Class 4 shareholders of record.
| Class | Foreign Tax Paid Per Share | Foreign Source Income Per Share | ||
Class 1 | $0.0142 | $0.6667 | ||
Class 2 | $0.0142 | $0.6479 | ||
Class 4 | $0.0142 | $0.6378 |
Foreign Tax Paid Per Share (Column 1) is the amount per share available to you, as a tax credit (assuming you held your shares in the Fund for a minimum of 16 days during the 31-day period beginning 15 days before the ex-dividend date of the Fund’s distribution to which the foreign taxes relate), or, as a tax deduction.
Foreign Source Income Per Share (Column 2) is the amount per share of income dividends attributable to foreign securities held by the Fund, plus any foreign taxes withheld on these dividends.
| Semiannual Report | TGB-39 |
Templeton Growth VIP Fund
This semiannual report for Templeton Growth VIP Fund covers the period ended June 30, 2015.
Class 1 Performance Summary as of June 30, 2015
The Fund’s Class 1 shares delivered a +1.17% total return for the six-month period ended June 30, 2015.
Performance reflects the Fund’s Class 1 operating expenses, but does not include any contract fees, expenses or sales charges. If they had been included, performance would be lower. These charges and deductions, particularly for variable life policies, can have a significant effect on contract values and insurance benefits. See the contract prospectus for a complete description of these expenses, including sales charges.
Performance data represent past performance, which does not guarantee future results. Investment return and principal value will fluctuate, and you may have a gain or loss when you sell your shares. Current performance may differ from figures shown.
| Semiannual Report | TG-1 |
TEMPLETON GROWTH VIP FUND
Fund Goal and Main Investments
Templeton Growth VIP Fund seeks long-term capital growth. Under normal market conditions, the Fund invests predominantly in equity securities of companies located anywhere in the world, including emerging markets.
Fund Risks
All investments involve risks, including possible loss of principal. Special risks are associated with foreign investing, including currency fluctuations, economic instability and political developments; investments in emerging markets involve heightened risks related to the same factors. In addition, smaller and midsized-company stocks have historically experienced more price volatility than larger company stocks, especially over the short term. Value securities may not increase in price as anticipated or may decline further in value. To the extent the Fund focuses on particular countries, regions, industries, sectors or types of investments from time to time, it may be subject to greater risks of adverse developments in such areas of focus than a fund that invests in a wider variety of countries, regions, industries, sectors or investments. The Fund is actively managed but there is no guarantee that the manager’s investment decisions will produce the desired results. The Fund’s prospectus also includes a description of the main investment risks.
Performance Overview
You can find the Fund’s six-month total return in the Performance Summary. For comparison, the Fund’s benchmarks, the MSCI All Country World Index (ACWI) returned +2.97%, and the MSCI World Index returned +2.95% for the period under review.1
Economic and Market Overview
The global economy expanded moderately during the six months under review despite slowing growth in some countries. As measured by the MSCI World Index, stocks in global developed markets advanced overall during the six-month period amid a generally accommodative monetary policy environment and signs of economic improvement in Europe and Japan. Oil prices rebounded from earlier lows as demand picked up despite rising inventories and strong global supply, while gold prices declined marginally during the period under review.
U.S. economic growth was mixed during the six months under review. In 2015’s first quarter, U.S. dollar strength, low energy prices, and a labor dispute at West Coast ports led exports to
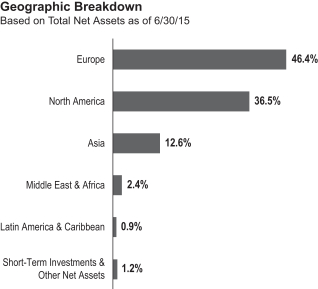
decline. In the second quarter, business capital spending rebounded and manufacturing and non-manufacturing activities increased, contributing to strong job gains. During the six-month period, the U.S. Federal Reserve Board (Fed) kept its target interest rate at 0%–0.25% while considering when an increase would be appropriate, based on labor market and inflation data. In its June meeting, the Fed lowered its economic growth forecast for 2015 and raised unemployment estimates given the weak start to the year.
Outside the U.S., the U.K. economy slowed in 2015’s first quarter as the mining and agriculture sectors contracted. Near period-end, the Conservative Party’s unexpected victory in the U.K. general elections supported investor sentiment. In the eurozone, economic growth improved somewhat during the six-month period. Spain expanded at a solid pace, and France and Italy returned to growth in 2015’s first quarter. However, Germany, the region’s largest economy, slowed during the first quarter amid sluggish exports. The region avoided deflation as the annual inflation rate rose in May. The European Central Bank (ECB) maintained its benchmark interest rates during the period and also expanded its asset purchases to boost inflation and the economy. The region generally benefited from a weaker euro that helped exports, the ECB’s accommodative policy and an improved 2015 eurozone growth forecast, but Greece’s debt situation remained a major concern.
The Japanese economy continued to grow in 2015’s first quarter after exiting recession in the previous quarter, driven by an
1. Source: Morningstar.
One cannot invest directly in an index, and an index is not representative of the Fund’s portfolio. Please see Index Descriptions following the Fund Summaries.
| TG-2 | Semiannual Report |
TEMPLETON GROWTH VIP FUND
increase in private demand as business investment and private consumption rose. The Bank of Japan maintained its monetary policy during the review period, but lowered its economic growth and inflation forecasts at its April meeting.
In emerging markets, economic growth generally moderated. A ceasefire agreement between Russia and Ukraine helped emerging market stocks early in the period. However, Greece’s credit default due to the lack of progress in negotiations weighed on emerging market stocks toward period-end. China’s government implemented market-friendly policies to support new economic drivers that could help steer the economy toward more sustainable growth. Lower interest rates there fueled massive stock market speculation and a 60% price gain up to mid-June 2015 for the domestic A-share market.2 Concerned the market was overheated, the People’s Bank of China reduced liquidity, which led to a market panic in the last two weeks of June, exacerbated by certain government intervention measures. Central bank actions varied across emerging markets, as some banks raised interest rates in response to rising inflation and weakening currencies, while others lowered interest rates to promote economic growth. In the recent global environment, emerging market stocks, as measured by the MSCI Emerging Markets Index, rose for the six-month period.3
Investment Strategy
Our investment philosophy is bottom up, value oriented and long term. In choosing investments, we will focus on the market price of a company’s securities relative to our evaluation of the company’s potential long-term earnings, asset value and cash flow. Among factors we may consider are a company’s historical value measures, including price/earnings ratio, profit margins and liquidation value. We do in-depth research to construct a bargain list from which we buy.
Manager’s Discussion
Global equities advanced during the six months under review, though momentum waned toward period-end as the Greek debt drama intensified, Chinese market volatility flared and U.S. economic growth disappointed. The prevailing market trends during the period were the outperformance of defensive and late-cycle consumer sectors and the underperformance of early-cycle resource and industrial sectors. In this environment, the Fund delivered absolute gains but trailed its benchmark MSCI ACWI.
| Top 10 Holdings | ||||
| 6/30/15 | ||||
| Company Sector/Industry, Country | % of Total Net Assets | |||
| Microsoft Corp. Software, U.S. | 3.1% | |||
| Samsung Electronics Co. Ltd. Technology Hardware, Storage & Peripherals, South Korea | 3.1% | |||
| Citigroup Inc. Banks, U.S. | 2.5% | |||
| Teva Pharmaceutical Industries Ltd., ADR Pharmaceuticals, Israel | 2.4% | |||
| Comcast Corp., Special A Media, U.S. | 2.1% | |||
| American International Group Inc. Insurance, U.S. | 2.1% | |||
| CRH PLC Construction Materials, Ireland | 2.0% | |||
| Roche Holding AG Pharmaceuticals, Switzerland | 1.9% | |||
| Amgen Inc. Biotechnology, U.S. | 1.9% | |||
| Pfizer Inc. Pharmaceuticals, U.S. | 1.8% | |||
The dollar value, number of shares or principal amount, and names of all portfolio holdings are listed in the Fund’s Statement of Investments (SOI).
In our analysis, conditions remained difficult for value-oriented equity investors during the period as value stocks extended their longest stretch of underperformance on record, trailing their growth counterparts by a wide margin. We feel that sustained low interest rate policies in many regions and expanded global stimulus measures ensured that correlations between stocks stayed historically elevated. In other words, our view is that broad-based economic and policy news remained the key market drivers, overshadowing stock-specific fundamental factors that typically influence share prices over time.
At the sector level, stock selection in information technology (IT) detracted from relative performance.4 Shares of U.S. computer-maker Hewlett-Packard declined after the company forecast lower-than-expected earnings, saying a rising U.S. dollar would hurt results as the firm prepared to split in two. Nevertheless, we remained favorable toward Hewlett-Packard given what we considered its still cheap sum-of-the-parts valuation and the prospect of additional cost savings from restructuring initiatives. South Korean semiconductor and
2. MSCI.
3. Please see Index Descriptions following the Fund Summaries.
4. The IT sector comprises communications equipment; electronic equipment, instruments and components; software; and technology hardware, storage and peripherals in the SOI.
| Semiannual Report | TG-3 |
TEMPLETON GROWTH VIP FUND
consumer electronics firm Samsung Electronics also lagged. After more than doubling in value between 2011 and 2013 as the firm successfully grew its profitable mobile phone business, shares of Samsung showed little movement more recently due to slower handset growth and an unfavorable South Korean won-to-Japanese yen exchange rate. We believed Samsung remained inexpensive and were encouraged by the positive changes under way at the company, including a recently announced US$2 billion buyback and renewed expectations for a dividend hike. In our analysis, Samsung has solid net cash and investment levels, a reinvigorated leadership focused on shareholder value, and significant scope for operational and strategic improvement across business lines, and remains well positioned for additional increases from recent modest valuation levels.
Stock selection in industrials and consumer discretionary also detracted from relative returns.5 From the industrials sector, shares of German airline Deutsche Lufthansa declined due to charges tied to pension obligations, an asset disposal and a wrong-way bet on fuel prices. We continued to see additional opportunity in Lufthansa at what we deemed recently depressed valuations given its strong balance sheet, diversified business portfolio and ongoing restructuring program. From the consumer discretionary sector, U.S. luxury lifestyle brand Michael Kors Holdings declined after the firm posted a surprising sales decline in its primary North American market and gave a disappointing forecast for the coming year. This company has had a phenomenal growth trajectory in recent years and it appeared to us that expectations for future growth had run ahead of what was realistically achievable. However, Michael Kors seemed cheap to us based on near-term measures and, as a relatively young company with strong brand recognition, it may have numerous opportunities to expand global penetration over a long-term investment horizon.
Although the Fund’s overweighted allocation in the health care sector contributed to relative performance, the negative effect of stock selection more than offset the gains from the overweighting.6 Within the biotechnology sector, U.S.-based Amgen detracted from relative performance. However, we believed select biotechnology stocks offered an interesting value proposition. Biotechnology drugs have tended to have longer duration lifecycles than traditional pharmaceutical products, and have generally been more immune to pricing pressures and
generic competition. We remained positive on our holdings in this industry, as cash flow generation and pipeline innovation continued to accelerate. Elsewhere in the health care sector, pharmaceuticals firms Sanofi (France), Allergan (U.S.) and Pfizer (U.S.) contributed. In general, pharmaceuticals stocks have consolidated gains after a long stretch of outperformance driven by earnings improvements and growing cash flow generation at the company level and mergers and acquisition activity at the industry level. We became more active in the pharmaceuticals industry during the mid- and late-2000s, when research and development (R&D) productivity faltered, cost structures were bloated and patent expirations loomed. These conditions gave us a chance to buy, at a discount that we considered significant, businesses that we believed could be restructured and repositioned for long-term growth. For the most part, we believed our investment theses have worked out as cost-cutting buffered margins and improving R&D productivity offset patent losses with new, often longer life, revenue streams. In our analysis, shares had appreciated as the value cycle progressed, and the industry had recently traded at a slight premium to the broader market, making continued pipeline development essential to future return prospects. During the period, we found a few bargains among major pharmaceuticals stocks; however, our mature value holdings in the sector generated strong cash flows to support healthy dividend yields and continued to self-fund R&D.
Turning to contributors, we were encouraged by the strong absolute and relative gains of our European financials holdings overall at a time when Greece’s escalating debt drama created significant turmoil and uncertainty in the European financial system.7 Shares of Dutch financial services firm ING Groep advanced to a post-financial crisis high after the firm posted a major increase in profit at its banking operation in the first quarter, helped by a boost in fees from new lending. The company comfortably passed the ECB’s recent stress tests and has repaid the final installment of the Dutch government’s bailout-era loan. Following years of drastic restructuring, ING has improved its capital position, allowing it to return to lending growth and, consequently, higher levels of profitability. The stock remained reasonably valued, in our analysis, given its slight premium to book value and double-digit return on equity. More broadly, the European banking system has restructured and recapitalized, with systemically important firms exiting non-core businesses and shoring up their balance sheets. We
5. The industrials sector comprises aerospace and defense, air freight and logistics, airlines, commercial services and supplies, construction and engineering, industrial conglomerates, and machinery in the SOI. The consumer discretionary sector comprises auto components; automobiles; media; multiline retail; specialty retail; and textiles, apparel and luxury goods in the SOI.
6. The health care sector comprises biotechnology, life sciences tools and services, and pharmaceuticals in the SOI.
7. The financials sector comprises banks, capital markets, consumer finance and insurance in the SOI.
| TG-4 | Semiannual Report |
TEMPLETON GROWTH VIP FUND
believe an emerging banking union with a single supervisor will soon support the financial system, ensuring regulatory consistency and a stronger industry safety net. Across the sector, major eurozone bank exposure to Greece was minimal. In 2010–2011, during the last round of fears that Greece would leave the eurozone, formal and robust support mechanisms were lacking. Five years later, the ECB has launched large-scale quantitative easing measures and policy tools such as the European Stability Mechanism, Long-Term Refinancing Operations and Outright Monetary Transactions. Such progress suggested to us that firewalls have strengthened and the scope for targeted policy intervention has increased dramatically in the eurozone. The recent revival of credit growth in the region was further evidence that the rightsizing of loan books and capital buffers along with the ECB’s stimulatory efforts were beginning to have their intended effect on the economy.
Stock selection in the materials sector also contributed to relative performance.8 In our view, the sector had offered only limited value in recent years, with selective opportunities concentrated primarily in chemicals and building materials companies. Irish building materials firm CRH delivered solid gains after agreeing to buy the assets that two rivals were required to divest as a regulatory condition to complete their merger. The company’s diverse geographical assets generated strong revenues and earnings last year and should help CRH gain market share and transform into a major cement producer. The deal will likely add quickly to CRH’s earnings and represent considerable value for long-term shareholders, in our analysis. We found fewer opportunities among metals and mining firms, where stock prices seemed to reflect excessive optimism about demand scenarios as the Chinese economy moderates and Beijing attempts to rebalance away from commodity-intensive fixed asset investment toward a more sustainable, consumption-oriented growth model. Bulk commodities like iron ore and coal looked particularly vulnerable to us in this environment given abundant global supply and the disproportionate reliance on a moderating China to drive demand growth. Base and precious metals, however, offered what we generally considered more attractive supply and demand fundamentals and may present select value opportunities following a sustained period of weakness. A position in Russian miner Mining and Metallurgical Co. Norilsk Nickel was a major contributor during the period as nickel prices rebounded from a bear market and investor sentiment on Russia improved.
From a regional standpoint, an underweighting and stock selection in Asia notably detracted, pressured by an underweighting in Japan and stock selection in South Korea and China. Chinese equities suffered a steep decline at period-end following a dramatic rally in the mainland A-share market, prompting the government to enact a number of heavy-handed market controls intended to stem the massive sell-off. We believed Beijing’s determined efforts to regain control of share prices underscored the importance of buoyant markets to a government undertaking delicate economic and political transitions; it also raised concerns about China’s commitment to liberalizing its markets at a time when the country desires greater representation and influence in the global financial system. Shortly after period-end, the new measures and their effects were still being monitored; however, many international investors added moral hazard to their list of Chinese market concerns that also included systemic leverage, illiquidity, volatility, lack of transparency and insufficient price discovery. In our analysis, although such concerns raised the risk premium for Chinese equities, we noted that select Hong Kong-listed H shares, which did not participate in the extreme A-share rally, have likely been oversold and represented what we believed to be compelling long-term value.
Encouragingly, European holdings contributed to relative performance, buoyed by an overweighted allocation and stock selection. Despite the negative headlines and periodic crises, we believe Europe has made significant progress in strengthening its defenses and positioning for sustainable growth. Economic conditions have also improved, with recent sentiment readings above average and multiple leading indicators consistent with improving economic growth. Critically, in a region where a majority of lending is carried out by banks, credit conditions have been improving, with loan growth for households and corporations recently turning positive. In fact, credit demand in Europe was at an eight-year high and bank balance sheets have started growing again. Challenges remained as Europe tried to balance the need for further integration with the desire to respect national sovereignty and political self-determination. However, in our opinion, the European experiment has been a continual study of disagreement and reconciliation among countries whose strong national identities often obscure a foundation of deeply shared interests and values. There will be more bumps along the way, but we believed Europe continued to advance in the right direction. European equities, trading at a considerable discount to their global peers based on price-to-book value and a record discount to their U.S. peers based on cyclically
8. The materials sector comprises chemicals, construction materials, and metals and mining in the SOI.
| Semiannual Report | TG-5 |
TEMPLETON GROWTH VIP FUND
adjusted earnings, remained a source of selective value in this environment, in our analysis.
It is also important to recognize the effect of currency movements on the Fund’s performance. In general, if the value of the U.S. dollar goes up compared with a foreign currency, an investment traded in that foreign currency will go down in value because it will be worth fewer U.S. dollars. This can have a negative effect on Fund performance. Conversely, when the U.S. dollar weakens in relation to a foreign currency, an investment traded in that foreign currency will increase in value, which can contribute to Fund performance. For the six months ended June 30, 2015, the U.S. dollar rose in value relative to most currencies. As a result, the Fund’s performance was negatively affected by the portfolio’s substantial investment in securities with non-U.S. currency exposure.
Through six decades of investing in global equity markets, our goal has always been simple: to maximize total returns over time. Admittedly, attempting to buy stocks at the point of maximum pessimism involves weathering volatility and
“capturing down markets” at times, but this matters little to long-term risk mitigation and investment excellence, in our opinion.
Thank you for your participation in Templeton Growth VIP Fund. We look forward to serving your future investment needs.
The foregoing information reflects our analysis, opinions and portfolio holdings as of June 30, 2015, the end of the reporting period. The way we implement our main investment strategies and the resulting portfolio holdings may change depending on factors such as market and economic conditions. These opinions may not be relied upon as investment advice or an offer for a particular security. The information is not a complete analysis of every aspect of any market, country, industry, security or the Fund. Statements of fact are from sources considered reliable, but the investment manager makes no representation or warranty as to their completeness or accuracy. Although historical performance is no guarantee of future results, these insights may help you understand our investment management philosophy.
| TG-6 | Semiannual Report |
TEMPLETON GROWTH VIP FUND
Class 1 Fund Expenses
As an investor in a variable insurance contract (Contract) that indirectly provides for investment in an underlying mutual fund, you can incur transaction and/or ongoing expenses at both the Fund level and the Contract level.
| • | Transaction expenses can include sales charges (loads) on purchases, surrender fees, transfer fees and premium taxes. |
| • | Ongoing expenses can include management fees, distribution and service (12b-1) fees, contract fees, annual maintenance fees, mortality and expense risk fees and other fees and expenses. All mutual funds and Contracts have some types of ongoing expenses. |
The expenses shown in the table are meant to highlight ongoing expenses at the Fund level only and do not include ongoing expenses at the Contract level, or transaction expenses at either the Fund or Contract levels. While the Fund does not have transaction expenses, if the transaction and ongoing expenses at the Contract level were included, the expenses shown below would be higher. You should consult your Contract prospectus or disclosure document for more information.
The table shows Fund-level ongoing expenses and can help you understand these expenses and compare them with those of other mutual funds offered through the Contract. The table assumes a $1,000 investment held for the six months indicated. Please refer to the Fund prospectus for additional information on operating expenses.
Actual Fund Expenses
The first line (Actual) of the table provides actual account values and expenses. The “Ending Account Value” is derived from the Fund’s actual return, which includes the effect of ongoing Fund expenses, but does not include the effect of ongoing Contract expenses.
You can estimate the Fund-level expenses you incurred during the period by following these steps. Of course, your account value and expenses will differ from those in this illustration:
| 1. | Divide your account value by $1,000. |
If an account had an $8,600 value, then $8,600 ÷ $1,000 = 8.6.
| 2. | Multiply the result by the number under the heading “Fund-Level Expenses Incurred During Period.” |
If Fund-Level Expenses Incurred During Period were $7.50, then 8.6 × $7.50 = $64.50.
In this illustration, the estimated expenses incurred this period at the Fund level are $64.50.
Hypothetical Example for Comparison with Other Mutual Funds
Information in the second line (Hypothetical) of the table can help you compare ongoing expenses of the Fund with those of other mutual funds offered through the Contract. This information may not be used to estimate the actual ending account balance or expenses you incurred during the period. The hypothetical “Ending Account Value” is based on the Fund’s actual expense ratio and an assumed 5% annual rate of return before expenses, which does not represent the Fund’s actual return. The figure under the heading “Fund-Level Expenses Incurred During Period” shows the hypothetical expenses your account would have incurred under this scenario. You can compare this figure with the 5% hypothetical examples that appear in shareholder reports of other funds offered through a Contract.
| Class 1 | Beginning Account Value 1/1/15 | Ending Account Value 6/30/15 | Fund-Level Expenses 1/1/15–6/30/15 | |||||||||
Actual | $1,000 | $1,011.70 | $3.94 | |||||||||
Hypothetical (5% return before expenses) | $1,000 | $1,020.88 | $3.96 | |||||||||
*Expenses are calculated using the most recent six-month annualized expense ratio for the Fund’s Class 1 shares (0.79%), which does not include any ongoing expenses of the Contract for which the Fund is an investment option, multiplied by the average account value over the period, multiplied by 181/365 to reflect the one-half year period.
| Semiannual Report | TG-7 |
TOTHE PROSPECTUSES
DATED MAY 1, 2015
OF TEMPLETON GROWTH VIP FUND
(A series of Franklin Templeton Variable Insurance Products Trust)
The Prospectus is amended as follows:
I. The section in the Fund Summary under the heading “Portfolio Managers” on page TG-S4 is replaced with the following:
Portfolio Managers
Norman J. Boersma, CFA President, Chief Executive Officer and Director of Global Advisors and portfolio manager of the Fund since 2011.
Tucker Scott, CFA Executive Vice President of Global Advisors and portfolio manager of the Fund since May 2015.
James Harper, CFA Executive Vice President of Global Advisors and portfolio manager of the Fund since 2010.
Heather Arnold, CFA Executive Vice President, Director of Research and Portfolio Manager of Global Advisors and portfolio manager of the Fund since 2014.
II. In the Fund Details, under the heading “Management,” the portfolio manager information beginning on page TG-D6 is replaced with the following:
The Fund is managed by a team of dedicated professionals focused on investments in equity securities of companies anywhere in the world. The portfolio managers of the team are as follows:
Norman J. Boersma, CFA President, Chief Executive Officer and Director of Global Advisors Mr. Boersma has been lead portfolio manager of the Fund since 2011. He has primary responsibility for the investments of the Fund. He has final authority over all aspects of the Fund’s investment portfolio, including but not limited to, purchases and sales of individual securities, portfolio risk assessment, and the management of daily cash balances in accordance with anticipated investment management requirements. The degree to which he may perform these functions, and the nature of these functions, may change from time to time. He joined Franklin Templeton Investments in 1991.
Tucker Scott, CFA Executive Vice President of Global Advisors Mr. Scott has been a portfolio manager of the Fund since May 2015, providing research and advice on the purchases and sales of individual securities, and portfolio risk assessment. He joined Franklin Templeton Investments in 1996.
| TG-8 |
James Harper, CFA Executive Vice President of Global Advisors Mr. Harper has been a portfolio manager of the Fund since 2010, providing research and advice on the purchases and sales of individual securities, and portfolio risk assessment. He joined Franklin Templeton Investments in 2007.
Heather Arnold, CFA Executive Vice President, Director of Research and Portfolio Manager of Global Advisors Ms. Arnold has been a portfolio manager of the Fund since 2014, providing research and advice on the purchases and sales of individual securities, and portfolio risk assessment. She first joined Franklin Templeton Investments in 1997, left in 2001 to start her own company and rejoined again in 2008.
CFA® and Chartered Financial Analyst® are trademarks owned by CFA Institute.
Please keep this supplement with your prospectus for future reference.
| TG-9 |
FRANKLIN TEMPLETON VARIABLE INSURANCE PRODUCTS TRUST
Financial Highlights
Templeton Growth VIP Fund
Six Months Ended June 30, 2015 (unaudited) | Year Ended December 31, | |||||||||||||||||||||||
| 2014 | 2013 | 2012 | 2011 | 2010 | ||||||||||||||||||||
| Class 1 | ||||||||||||||||||||||||
Per share operating performance (for a share outstanding throughout the period) | ||||||||||||||||||||||||
Net asset value, beginning of period | $14.85 | $15.47 | $12.16 | $10.27 | $11.19 | $10.56 | ||||||||||||||||||
|
| |||||||||||||||||||||||
| Income from investment operationsa: | ||||||||||||||||||||||||
Net investment incomeb | 0.21 | 0.38 | c | 0.22 | 0.27 | 0.25 | 0.17 | |||||||||||||||||
Net realized and unrealized gains (losses) | (0.03 | ) | (0.75 | ) | 3.49 | 1.88 | (0.99 | ) | 0.62 | |||||||||||||||
|
| |||||||||||||||||||||||
Total from investment operations | 0.18 | (0.37 | ) | 3.71 | 2.15 | (0.74 | ) | 0.79 | ||||||||||||||||
|
| |||||||||||||||||||||||
Less distributions from net investment income | (0.42 | ) | (0.25 | ) | (0.40 | ) | (0.26 | ) | (0.18 | ) | (0.16 | ) | ||||||||||||
|
| |||||||||||||||||||||||
Net asset value, end of period | $14.61 | $14.85 | $15.47 | $12.16 | $10.27 | $11.19 | ||||||||||||||||||
|
| |||||||||||||||||||||||
Total returnd | 1.17% | (2.53)% | 31.05% | 21.40% | (6.80)% | 7.74% | ||||||||||||||||||
| Ratios to average net assetse | ||||||||||||||||||||||||
Expenses | 0.79% | f | 0.78% | 0.78% | g | 0.78% | g | 0.78% | g | 0.77% | g | |||||||||||||
Net investment income | 2.73% | 2.46% | c | 1.62% | 2.31% | 2.22% | 1.71% | |||||||||||||||||
| Supplemental data | ||||||||||||||||||||||||
Net assets, end of period (000’s) | $538,340 | $572,860 | $588,409 | $476,954 | $1,200,682 | $1,348,622 | ||||||||||||||||||
Portfolio turnover rate | 10.10% | 17.46% | 11.60% | 18.73% | h | 42.13% | h | 9.61% | ||||||||||||||||
aThe amount shown for a share outstanding throughout the period may not correlate with the Statement of Operations for the period due to the timing of sales and repurchases of the Fund’s shares in relation to income earned and/or fluctuating fair value of the investments of the Fund.
bBased on average daily shares outstanding.
cNet investment income per share includes approximately $0.09 per share received in the form of special dividends. Excluding these amounts, the ratio of net investment income to average net assets would have been 1.88%.
dTotal return does not include fees, charges or expenses imposed by the variable annuity and life insurance contracts for which Franklin Templeton Variable Insurance Products Trust serves as an underlying investment vehicle. Total return is not annualized for periods less than one year.
eRatios are annualized for periods less than one year.
fBenefit of waiver and payments by affiliates rounds to less than 0.01%.
gBenefit of expense reduction rounds to less than 0.01%.
hExcludes the value of portfolio securities delivered as a result of redemption in-kind.
| TG-10 | Semiannual Report | The accompanying notes are an integral part of these financial statements. |
FRANKLIN TEMPLETON VARIABLE INSURANCE PRODUCTS TRUST
FINANCIAL HIGHLIGHTS
Templeton Growth VIP Fund (continued)
Six Months Ended June 30, 2015 (unaudited) | Year Ended December 31, | |||||||||||||||||||||||
| 2014 | 2013 | 2012 | 2011 | 2010 | ||||||||||||||||||||
| Class 2 | ||||||||||||||||||||||||
Per share operating performance (for a share outstanding throughout the period) | ||||||||||||||||||||||||
Net asset value, beginning of period | $14.61 | $15.23 | $11.97 | $10.11 | $11.01 | $10.40 | ||||||||||||||||||
|
| |||||||||||||||||||||||
| Income from investment operationsa: | ||||||||||||||||||||||||
Net investment incomeb | 0.18 | 0.34 | c | 0.19 | 0.21 | 0.21 | 0.15 | |||||||||||||||||
Net realized and unrealized gains (losses) | (0.01 | ) | (0.75 | ) | 3.44 | 1.88 | (0.96 | ) | 0.60 | |||||||||||||||
|
| |||||||||||||||||||||||
Total from investment operations | 0.17 | (0.41 | ) | 3.63 | 2.09 | (0.75 | ) | 0.75 | ||||||||||||||||
|
| |||||||||||||||||||||||
Less distributions from net investment income | (0.38 | ) | (0.21 | ) | (0.37 | ) | (0.23 | ) | 0.15 | (0.14 | ) | |||||||||||||
|
| |||||||||||||||||||||||
Net asset value, end of period | $14.40 | $14.61 | $15.23 | $11.97 | $10.11 | $11.01 | ||||||||||||||||||
|
| |||||||||||||||||||||||
Total returnd | 1.10% | (2.81)% | 30.82% | 21.07% | (6.97)% | 7.39% | ||||||||||||||||||
| Ratios to average net assetse | ||||||||||||||||||||||||
Expenses | 1.04% | f | 1.03% | 1.03% | g | 1.03% | g | 1.03% | g | 1.02% | g | |||||||||||||
Net investment income | 2.48% | 2.21% | c | 1.37% | 2.06% | 1.97% | 1.46% | |||||||||||||||||
| Supplemental data | ||||||||||||||||||||||||
Net assets, end of period (000’s) | $1,093,508 | $1,171,896 | $1,450,304 | $1,352,554 | $1,254,193 | $1,626,885 | ||||||||||||||||||
Portfolio turnover rate | 10.10% | 17.46% | 11.60% | 18.73% | h | 42.13% | h | 9.61% | ||||||||||||||||
aThe amount shown for a share outstanding throughout the period may not correlate with the Statement of Operations for the period due to the timing of sales and repurchases of the Fund’s shares in relation to income earned and/or fluctuating fair value of the investments of the Fund.
bBased on average daily shares outstanding.
cNet investment income per share includes approximately $0.09 per share received in the form of special dividends. Excluding these amounts, the ratio of net investment income to average net assets would have been 1.63%.
dTotal return does not include fees, charges or expenses imposed by the variable annuity and life insurance contracts for which Franklin Templeton Variable Insurance Products Trust serves as an underlying investment vehicle. Total return is not annualized for periods less than one year.
eRatios are annualized for periods less than one year.
fBenefit of waiver and payments by affiliates rounds to less than 0.01%.
gBenefit of expense reduction rounds to less than 0.01%.
hExcludes the value of portfolio securities delivered as a result of redemption in-kind.
| The accompanying notes are an integral part of these financial statements. | Semiannual Report | TG-11 |
FRANKLIN TEMPLETON VARIABLE INSURANCE PRODUCTS TRUST
FINANCIAL HIGHLIGHTS
Templeton Growth VIP Fund (continued)
Six Months Ended June 30, 2015 (unaudited) | Year Ended December 31, | |||||||||||||||||||||||
| 2014 | 2013 | 2012 | 2011 | 2010 | ||||||||||||||||||||
| Class 4 | ||||||||||||||||||||||||
| Per share operating performance (for a share outstanding throughout the period) | ||||||||||||||||||||||||
Net asset value, beginning of period | $14.73 | $15.35 | $12.07 | $10.19 | $11.11 | $10.50 | ||||||||||||||||||
|
| |||||||||||||||||||||||
| Income from investment operationsa: | ||||||||||||||||||||||||
Net investment incomeb | 0.18 | 0.33 | c | 0.17 | 0.20 | 0.20 | 0.14 | |||||||||||||||||
Net realized and unrealized gains (losses) | (0.02 | ) | (0.76 | ) | 3.47 | 1.90 | (0.98 | ) | 0.61 | |||||||||||||||
|
| |||||||||||||||||||||||
Total from investment operations | 0.16 | (0.43 | ) | 3.64 | 2.10 | (0.78 | ) | 0.75 | ||||||||||||||||
|
| |||||||||||||||||||||||
Less distributions from net investment income | (0.36 | ) | (0.19 | ) | (0.36 | ) | (0.22 | ) | (0.14 | ) | (0.14 | ) | ||||||||||||
|
| |||||||||||||||||||||||
Net asset value, end of period | $14.53 | $14.73 | $15.35 | $12.07 | $10.19 | $11.11 | ||||||||||||||||||
|
| |||||||||||||||||||||||
Total returnd | 1.04% | (2.88)% | 30.64% | 21.02% | (7.14)% | 7.31% | ||||||||||||||||||
| Ratios to average net assetse | ||||||||||||||||||||||||
Expenses | 1.14% | f | 1.13% | 1.13% | g | 1.13% | g | 1.13% | g | 1.12% | g | |||||||||||||
Net investment income | 2.38% | 2.11% | c | 1.27% | 1.96% | 1.87% | 1.36% | |||||||||||||||||
| Supplemental data | ||||||||||||||||||||||||
Net assets, end of period (000’s) | $55,833 | $59,989 | $72,683 | $67,158 | $56,170 | $60,569 | ||||||||||||||||||
Portfolio turnover rate | 10.10% | 17.46% | 11.60% | 18.73% | h | 42.13% | h | 9.61% | ||||||||||||||||
aThe amount shown for a share outstanding throughout the period may not correlate with the Statement of Operations for the period due to the timing of sales and repurchases of the Fund’s shares in relation to income earned and/or fluctuating fair value of the investments of the Fund.
bBased on average daily shares outstanding.
cNet investment income per share includes approximately $0.09 per share received in the form of special dividends. Excluding these amounts, the ratio of net investment income to average net assets would have been 1.53%.
dTotal return does not include fees, charges or expenses imposed by the variable annuity and life insurance contracts for which Franklin Templeton Variable Insurance Products Trust serves as an underlying investment vehicle. Total return is not annualized for periods less than one year.
eRatios are annualized for periods less than one year.
fBenefit of waiver and payments by affiliates rounds to less than 0.01%.
gBenefit of expense reduction rounds to less than 0.01%.
hExcludes the value of portfolio securities delivered as a result of redemption in-kind.
| TG-12 | Semiannual Report | The accompanying notes are an integral part of these financial statements. |
FRANKLIN TEMPLETON VARIABLE INSURANCE PRODUCTS TRUST
Statement of Investments, June 30, 2015 (unaudited)
Templeton Growth VIP Fund
| ||||||||||||||
| Country | Shares | Value | ||||||||||||
Common Stocks 97.9% | ||||||||||||||
Aerospace & Defense 0.7% | ||||||||||||||
BAE Systems PLC | United Kingdom | 1,730,147 | $ | 12,263,892 | ||||||||||
|
| |||||||||||||
Air Freight & Logistics 0.9% | ||||||||||||||
United Parcel Service Inc., B | United States | 160,030 | 15,508,507 | |||||||||||
|
| |||||||||||||
Airlines 1.3% | ||||||||||||||
| a | Deutsche Lufthansa AG | Germany | 1,735,414 | 22,367,082 | ||||||||||
|
| |||||||||||||
Auto Components 1.3% | ||||||||||||||
Cie Generale des Etablissements Michelin, B | France | 207,869 | 21,773,686 | |||||||||||
|
| |||||||||||||
Automobiles 2.7% | ||||||||||||||
Hero Motocorp Ltd. | India | 114,200 | 4,534,170 | |||||||||||
Hyundai Motor Co. | South Korea | 130,180 | 15,812,654 | |||||||||||
Nissan Motor Co. Ltd. | Japan | 2,342,720 | 24,405,327 | |||||||||||
|
| |||||||||||||
| 44,752,151 | ||||||||||||||
|
| |||||||||||||
Banks 15.6% | ||||||||||||||
Bangkok Bank PCL, fgn. | Thailand | 913,600 | 4,809,843 | |||||||||||
BNP Paribas SA | France | 401,637 | 24,237,776 | |||||||||||
Citigroup Inc. | United States | 770,990 | 42,589,488 | |||||||||||
| a | Commerzbank AG | Germany | 547,840 | 6,999,844 | ||||||||||
Credit Agricole SA | France | 1,640,346 | 24,386,635 | |||||||||||
DBS Group Holdings Ltd. | Singapore | 932,690 | 14,327,238 | |||||||||||
HSBC Holdings PLC | United Kingdom | 2,567,864 | 23,271,490 | |||||||||||
ING Groep NV, IDR | Netherlands | 1,273,446 | 21,018,232 | |||||||||||
JPMorgan Chase & Co. | United States | 440,760 | 29,865,898 | |||||||||||
KB Financial Group Inc. | South Korea | 657,984 | 21,685,193 | |||||||||||
Standard Chartered PLC | United Kingdom | 539,080 | 8,629,857 | |||||||||||
SunTrust Banks Inc. | United States | 478,520 | 20,585,930 | |||||||||||
UniCredit SpA | Italy | 3,118,881 | 20,941,918 | |||||||||||
|
| |||||||||||||
| 263,349,342 | ||||||||||||||
|
| |||||||||||||
Biotechnology 2.2% | ||||||||||||||
Amgen Inc. | United States | 207,480 | 31,852,330 | |||||||||||
Gilead Sciences Inc. | United States | 49,050 | 5,742,774 | |||||||||||
|
| |||||||||||||
| 37,595,104 | ||||||||||||||
|
| |||||||||||||
Capital Markets 3.1% | ||||||||||||||
Credit Suisse Group AG | Switzerland | 1,058,236 | 29,084,232 | |||||||||||
Morgan Stanley | United States | 609,690 | 23,649,875 | |||||||||||
|
| |||||||||||||
| 52,734,107 | ||||||||||||||
|
| |||||||||||||
Chemicals 1.0% | ||||||||||||||
Akzo Nobel NV | Netherlands | 227,412 | 16,541,983 | |||||||||||
|
| |||||||||||||
Commercial Services & Supplies 0.5% | ||||||||||||||
Serco Group PLC | United Kingdom | 4,886,178 | 9,057,900 | |||||||||||
|
| |||||||||||||
Communications Equipment 1.7% | ||||||||||||||
Cisco Systems Inc. | United States | 778,890 | 21,388,320 | |||||||||||
Ericsson, B | Sweden | 723,972 | 7,499,586 | |||||||||||
|
| |||||||||||||
| 28,887,906 | ||||||||||||||
|
| |||||||||||||
Construction & Engineering 0.7% | ||||||||||||||
| b | FLSmidth & Co. AS | Denmark | 250,000 | 12,025,515 | ||||||||||
|
| |||||||||||||
| Semiannual Report | TG-13 |
FRANKLIN TEMPLETON VARIABLE INSURANCE PRODUCTS TRUST
STATEMENT OF INVESTMENTS (UNAUDITED)
Templeton Growth VIP Fund (continued)
| Country | Shares | Value | ||||||||||||
Common Stocks (continued) | ||||||||||||||
Construction Materials 2.0% | ||||||||||||||
CRH PLC | Ireland | 1,172,741 | $ | 33,092,258 | ||||||||||
| c | CRH PLC, 144A | Ireland | 38,100 | 1,075,101 | ||||||||||
|
| |||||||||||||
| 34,167,359 | ||||||||||||||
|
| |||||||||||||
Consumer Finance 0.8% | ||||||||||||||
Capital One Financial Corp. | United States | 154,710 | 13,609,839 | |||||||||||
|
| |||||||||||||
Diversified Telecommunication Services 3.5% | ||||||||||||||
China Telecom Corp. Ltd., ADR | China | 179,195 | 10,577,881 | |||||||||||
Singapore Telecommunications Ltd. | Singapore | 4,679,470 | 14,626,601 | |||||||||||
Telefonica SA | Spain | 1,787,635 | 25,400,930 | |||||||||||
Verizon Communications Inc. | United States | 158,750 | 7,399,337 | |||||||||||
|
| |||||||||||||
| 58,004,749 | ||||||||||||||
|
| |||||||||||||
Electronic Equipment, Instruments & Components 0.5% | ||||||||||||||
| a | Flextronics International Ltd. | Singapore | 691,118 | 7,816,544 | ||||||||||
|
| |||||||||||||
Energy Equipment & Services 2.4% | ||||||||||||||
Baker Hughes Inc. | United States | 301,680 | 18,613,656 | |||||||||||
Halliburton Co. | United States | 129,480 | 5,576,704 | |||||||||||
Noble Corp. PLC | United States | 523,100 | 8,050,509 | |||||||||||
Technip SA | France | 137,470 | 8,505,855 | |||||||||||
|
| |||||||||||||
| 40,746,724 | ||||||||||||||
|
| |||||||||||||
Food & Staples Retailing 3.0% | ||||||||||||||
CVS Health Corp. | United States | 139,920 | 14,674,810 | |||||||||||
Metro AG | Germany | 587,740 | 18,523,593 | |||||||||||
Tesco PLC | United Kingdom | 5,191,768 | 17,336,148 | |||||||||||
|
| |||||||||||||
| 50,534,551 | ||||||||||||||
|
| |||||||||||||
Health Care Equipment & Supplies 3.1% | ||||||||||||||
Getinge AB, B | Sweden | 925,050 | 22,255,148 | |||||||||||
Medtronic PLC | United States | 408,310 | 30,255,771 | |||||||||||
|
| |||||||||||||
| 52,510,919 | ||||||||||||||
|
| |||||||||||||
Industrial Conglomerates 1.2% | ||||||||||||||
Siemens AG | Germany | 201,712 | 20,310,494 | |||||||||||
|
| |||||||||||||
Insurance 6.3% | ||||||||||||||
Aegon NV | Netherlands | 1,717,940 | 12,620,768 | |||||||||||
American International Group Inc. | United States | 569,370 | 35,198,453 | |||||||||||
Aviva PLC | United Kingdom | 947,200 | 7,328,653 | |||||||||||
AXA SA | France | 1,091,068 | 27,516,739 | |||||||||||
Swiss Re AG | Switzerland | 270,006 | 23,893,697 | |||||||||||
|
| |||||||||||||
| 106,558,310 | ||||||||||||||
|
| |||||||||||||
Internet Software & Services 0.8% | ||||||||||||||
| a | Google Inc., A | United States | 24,310 | 13,128,372 | ||||||||||
|
| |||||||||||||
Life Sciences Tools & Services 0.6% | ||||||||||||||
| a | QIAGEN NV | Netherlands | 385,000 | 9,454,409 | ||||||||||
|
| |||||||||||||
Machinery 0.8% | ||||||||||||||
| a | Navistar International Corp. | United States | 598,440 | 13,542,697 | ||||||||||
|
| |||||||||||||
Media 4.7% | ||||||||||||||
Comcast Corp., Special A | United States | 592,942 | 35,540,943 | |||||||||||
| TG-14 | �� | Semiannual Report |
FRANKLIN TEMPLETON VARIABLE INSURANCE PRODUCTS TRUST
STATEMENT OF INVESTMENTS (UNAUDITED)
Templeton Growth VIP Fund (continued)
| Country | Shares | Value | ||||||||||||
Common Stocks (continued) | ||||||||||||||
Media (continued) | ||||||||||||||
| a | News Corp., A | United States | 319,435 | $ | 4,660,557 | |||||||||
Sky PLC | United Kingdom | 1,055,761 | 17,199,689 | |||||||||||
Twenty-First Century Fox Inc., A | United States | 641,182 | 20,867,268 | |||||||||||
|
| |||||||||||||
| 78,268,457 | ||||||||||||||
|
| |||||||||||||
Metals & Mining 2.0% | ||||||||||||||
Mining and Metallurgical Co. Norilsk Nickel OJSC, ADR | Russia | 1,040,760 | 17,557,621 | |||||||||||
POSCO | South Korea | 76,429 | 15,290,715 | |||||||||||
POSCO, ADR | South Korea | 27,740 | 1,361,757 | |||||||||||
|
| |||||||||||||
| 34,210,093 | ||||||||||||||
|
| |||||||||||||
Multiline Retail 0.9% | ||||||||||||||
Target Corp. | United States | 191,680 | 15,646,838 | |||||||||||
|
| |||||||||||||
Oil, Gas & Consumable Fuels 8.7% | ||||||||||||||
Apache Corp. | United States | 209,000 | 12,044,670 | |||||||||||
BP PLC | United Kingdom | 2,847,664 | 18,796,168 | |||||||||||
Chesapeake Energy Corp. | United States | 1,136,570 | 12,695,487 | |||||||||||
Chevron Corp. | United States | 137,470 | 13,261,731 | |||||||||||
Eni SpA | Italy | 776,759 | 13,781,292 | |||||||||||
Galp Energia SGPS SA, B | Portugal | 1,575,520 | 18,471,419 | |||||||||||
Kunlun Energy Co. Ltd. | China | 17,103,030 | 17,408,282 | |||||||||||
Royal Dutch Shell PLC, A | United Kingdom | 4,510 | 126,577 | |||||||||||
Royal Dutch Shell PLC, B | United Kingdom | 299,573 | 8,504,270 | |||||||||||
Suncor Energy Inc. | Canada | 46,000 | 1,266,934 | |||||||||||
Total SA, B | France | 618,659 | 30,039,969 | |||||||||||
|
| |||||||||||||
| 146,396,799 | ||||||||||||||
|
| |||||||||||||
Pharmaceuticals 11.6% | ||||||||||||||
| a | Allergan PLC | United States | 56,124 | 17,031,389 | ||||||||||
GlaxoSmithKline PLC | United Kingdom | 1,207,210 | 25,081,570 | |||||||||||
Merck KGaA | Germany | 219,854 | 21,899,556 | |||||||||||
Pfizer Inc. | United States | 908,503 | 30,462,106 | |||||||||||
Roche Holding AG | Switzerland | 115,383 | 32,328,463 | |||||||||||
Sanofi | France | 290,857 | 28,602,606 | |||||||||||
Teva Pharmaceutical Industries Ltd., ADR | Israel | 688,930 | 40,715,763 | |||||||||||
|
| |||||||||||||
| 196,121,453 | ||||||||||||||
|
| |||||||||||||
Software 3.4% | ||||||||||||||
Microsoft Corp. | United States | 1,177,169 | 51,972,011 | |||||||||||
SAP SE | Germany | 80,912 | 5,644,791 | |||||||||||
|
| |||||||||||||
| 57,616,802 | ||||||||||||||
|
| |||||||||||||
Specialty Retail 2.0% | ||||||||||||||
Best Buy Co. Inc. | United States | 223,160 | 7,277,247 | |||||||||||
Kingfisher PLC | United Kingdom | 4,891,448 | 26,688,148 | |||||||||||
|
| |||||||||||||
| 33,965,395 | ||||||||||||||
|
| |||||||||||||
Technology Hardware, Storage & Peripherals 4.7% | ||||||||||||||
Hewlett-Packard Co. | United States | 942,050 | 28,270,920 | |||||||||||
Samsung Electronics Co. Ltd. | South Korea | 45,620 | 51,664,964 | |||||||||||
|
| |||||||||||||
| 79,935,884 | ||||||||||||||
|
| |||||||||||||
| Semiannual Report | TG-15 |
FRANKLIN TEMPLETON VARIABLE INSURANCE PRODUCTS TRUST
STATEMENT OF INVESTMENTS (UNAUDITED)
Templeton Growth VIP Fund (continued)
| Country | Shares | Value | ||||||||||||
Common Stocks (continued) | ||||||||||||||
Textiles, Apparel & Luxury Goods 0.8% | ||||||||||||||
| a | Michael Kors Holdings Ltd. | United States | 321,440 | $ | 13,529,410 | |||||||||
|
| |||||||||||||
Wireless Telecommunication Services 2.4% | ||||||||||||||
SoftBank Group Corp. | Japan | 149,680 | 8,816,432 | |||||||||||
Turkcell Iletisim Hizmetleri AS, ADR | Turkey | 1,653,543 | 18,999,209 | |||||||||||
Vodafone Group PLC | United Kingdom | 3,292,417 | 11,888,733 | |||||||||||
|
| |||||||||||||
| 39,704,374 | ||||||||||||||
|
| |||||||||||||
Total Common Stocks (Cost $1,360,517,289) | 1,652,637,647 | |||||||||||||
|
| |||||||||||||
Preferred Stocks (Cost $22,230,600) 0.9% | ||||||||||||||
Oil, Gas & Consumable Fuels 0.9% | ||||||||||||||
| a | Petroleo Brasileiro SA, ADR, pfd. | Brazil | 1,913,392 | 15,613,279 | ||||||||||
|
| |||||||||||||
Total Investments before Short Term Investments (Cost $1,382,747,889) | 1,668,250,926 | |||||||||||||
|
| |||||||||||||
| Principal Amount | ||||||||||||||
Short Term Investments 1.6% | ||||||||||||||
Time Deposits 1.1% | ||||||||||||||
Bank of Montreal, 0.03%, 7/01/15 | United States | $ | 7,000,000 | 7,000,000 | ||||||||||
Royal Bank of Canada, 0.05%, 7/01/15 | United States | 11,500,000 | 11,500,000 | |||||||||||
|
| |||||||||||||
Total Time Deposits (Cost $18,500,000) | 18,500,000 | |||||||||||||
|
| |||||||||||||
Total Investments before Money Market Funds | 1,686,750,926 | |||||||||||||
|
| |||||||||||||
| Shares | ||||||||||||||
| d | Investments from Cash Collateral Received for Loaned Securities (Cost $7,762,500) 0.5% | |||||||||||||
Money Market Funds 0.5% | ||||||||||||||
| a,e | Institutional Fiduciary Trust Money Market Portfolio | United States | 7,762,500 | 7,762,500 | ||||||||||
|
| |||||||||||||
Total Investments (Cost $1,409,010,389) 100.4% | 1,694,513,426 | |||||||||||||
Other Assets, less Liabilities (0.4)% | (6,832,503 | ) | ||||||||||||
|
| |||||||||||||
Net Assets 100.0% | $ | 1,687,680,923 | ||||||||||||
|
| |||||||||||||
See Abbreviations on page TG-26.
aNon-income producing.
bA portion or all of the security is on loan at June 30, 2015. See Note 1(c).
cSecurity was purchased pursuant to Rule 144A under the Securities Act of 1933 and may be sold in transactions exempt from registration only to qualified institutional buyers or in a public offering registered under the Securities Act of 1933. This security has been deemed liquid under guidelines approved by the Trust’s Board of Trustee. At June 30, 2015, the aggregate value of this security was $1,075,101, representing 0.06% of net assets.
dSee Note 1(c) regarding securities on loan.
eSee Note 3(e) regarding investments in Institutional Fiduciary Trust Money Market Portfolio.
| TG-16 | Semiannual Report | The accompanying notes are an integral part of these financial statements. |
FRANKLIN TEMPLETON VARIABLE INSURANCE PRODUCTS TRUST
Financial Statements
Statement of Assets and Liabilities
June 30, 2015 (unaudited)
Templeton Growth VIP Fund | ||||
Assets: | ||||
Investments in securities: | ||||
Cost - Unaffiliated issuers | $ | 1,401,247,889 | ||
Cost - Sweep Money Fund (Note 3e) | 7,762,500 | |||
|
| |||
Total cost of investments | $ | 1,409,010,389 | ||
|
| |||
Value - Unaffiliated issuers | $ | 1,686,750,926 | ||
Value - Sweep Money Fund (Note 3e) | 7,762,500 | |||
|
| |||
Total value of investments (Includes securities loaned in the amount of $7,215,309) | 1,694,513,426 | |||
Cash | 451,364 | |||
Receivables: | ||||
Investment securities sold | 2,410,959 | |||
Capital shares sold | 1,460,092 | |||
Dividends and interest | 2,832,070 | |||
Other assets | 735 | |||
|
| |||
Total assets | 1,701,668,646 | |||
|
| |||
Liabilities: | ||||
Payables: | ||||
Investment securities purchased | 3,892,107 | |||
Capital shares redeemed | 359,392 | |||
Management fees | 1,088,580 | |||
Distribution fees | 516,905 | |||
Payable upon return of securities loaned | 7,762,500 | |||
Accrued expenses and other liabilities | 368,239 | |||
|
| |||
Total liabilities | 13,987,723 | |||
|
| |||
Net assets, at value | $ | 1,687,680,923 | ||
|
| |||
Net assets consist of: | ||||
Paid-in capital | $ | 1,406,775,027 | ||
Undistributed net investment income | 22,591,055 | |||
Net unrealized appreciation (depreciation) | 285,479,348 | |||
Accumulated net realized gain (loss) | (27,164,507 | ) | ||
|
| |||
Net assets, at value | $ | 1,687,680,923 | ||
|
| |||
| Class 1: | ||||
Net assets, at value | $ | 538,339,902 | ||
|
| |||
Shares outstanding | 36,842,340 | |||
|
| |||
Net asset value and maximum offering price per share | $ | 14.61 | ||
|
| |||
| Class 2: | ||||
Net assets, at value | $ | 1,093,508,315 | ||
|
| |||
Shares outstanding | 75,959,830 | |||
|
| |||
Net asset value and maximum offering price per share | $ | 14.40 | ||
|
| |||
| Class 4: | ||||
Net assets, at value | $ | 55,832,706 | ||
|
| |||
Shares outstanding | 3,843,702 | |||
|
| |||
Net asset value and maximum offering price per share | $ | 14.53 | ||
|
| |||
| The accompanying notes are an integral part of these financial statements. | Semiannual Report | TG-17 |
FRANKLIN TEMPLETON VARIABLE INSURANCE PRODUCTS TRUST
FINANCIAL STATEMENTS
Statement of Operations
for the six months ended June 30, 2015 (unaudited)
| Templeton Growth VIP Fund | ||||
Investment income: | ||||
Dividends (net of foreign taxes of $3,152,458) | $ | 30,546,737 | ||
Interest | 3,442 | |||
Income from securities loaned | 549,280 | |||
|
| |||
Total investment income | 31,099,459 | |||
|
| |||
Expenses: | ||||
Management fees (Note 3a) | 6,726,036 | |||
Distribution fees: (Note 3c) | ||||
Class 2 | 1,433,072 | |||
Class 4 | 103,414 | |||
Custodian fees (Note 4) | 62,553 | |||
Reports to shareholders | 126,678 | |||
Professional fees | 45,392 | |||
Trustees’ fees and expenses | 4,207 | |||
Other | 25,076 | |||
|
| |||
Total expenses | 8,526,428 | |||
Expenses waived/paid by affiliates (Note 3e) | (20,553 | ) | ||
|
| |||
Net expenses | 8,505,875 | |||
|
| |||
Net investment income | 22,593,584 | |||
|
| |||
Realized and unrealized gains (losses): | ||||
Net realized gain (loss) from: | ||||
Investments | 62,244,166 | |||
Foreign currency transactions | 137,342 | |||
|
| |||
Net realized gain (loss) | 62,381,508 | |||
|
| |||
Net change in unrealized appreciation (depreciation) on: | ||||
Investments | (63,281,066 | ) | ||
Translation of other assets and liabilities denominated in foreign currencies | 23,776 | |||
|
| |||
Net change in unrealized appreciation (depreciation) | (63,257,290 | ) | ||
|
| |||
Net realized and unrealized gain (loss) | (875,782 | ) | ||
|
| |||
Net increase (decrease) in net assets resulting from operations | $ | 21,717,802 | ||
|
| |||
| TG-18 | Semiannual Report | The accompanying notes are an integral part of these financial statements. |
FRANKLIN TEMPLETON VARIABLE INSURANCE PRODUCTS TRUST
FINANCIAL STATEMENTS
Statements of Changes in Net Assets
| Templeton Growth VIP Fund | ||||||||
Six Months June 30, 2015 (unaudited) | Year December 31, | |||||||
Increase (decrease) in net assets: | ||||||||
Operations: | ||||||||
Net investment income | $ | 22,593,584 | $ | 45,743,743 | ||||
Net realized gain (loss) | 62,381,508 | 105,495,221 | ||||||
Net change in unrealized appreciation (depreciation) | (63,257,290 | ) | (200,494,822 | ) | ||||
|
| |||||||
Net increase (decrease) in net assets resulting from operations | 21,717,802 | (49,255,858 | ) | |||||
|
| |||||||
Distributions to shareholders from: | ||||||||
Net investment income: | ||||||||
Class 1 | (15,123,132 | ) | (9,482,577 | ) | ||||
Class 2 | (28,110,279 | ) | (18,300,865 | ) | ||||
Class 4 | (1,358,156 | ) | (885,005 | ) | ||||
|
| |||||||
Total distributions to shareholders | (44,591,567 | ) | (28,668,447 | ) | ||||
|
| |||||||
Capital share transactions: (Note 2) | ||||||||
Class 1 | (26,831,138 | ) | 9,471,206 | |||||
Class 2 | (63,809,621 | ) | (227,816,318 | ) | ||||
Class 4 | (3,549,129 | ) | (10,381,665 | ) | ||||
|
| |||||||
Total capital share transactions | (94,189,888 | ) | (228,726,777 | ) | ||||
|
| |||||||
Net increase (decrease) in net assets | (117,063,653 | ) | (306,651,082 | ) | ||||
Net assets: | ||||||||
Beginning of period | 1,804,744,576 | 2,111,395,658 | ||||||
|
| |||||||
End of period | $ | 1,687,680,923 | $ | 1,804,744,576 | ||||
|
| |||||||
Undistributed net investment income included in net assets: | ||||||||
End of period | $ | 22,591,055 | $ | 44,589,038 | ||||
|
| |||||||
| The accompanying notes are an integral part of these financial statements. | Semiannual Report | TG-19 |
FRANKLIN TEMPLETON VARIABLE INSURANCE PRODUCTS TRUST
Notes to Financial Statements (unaudited)
Templeton Growth VIP Fund
1. Organization and Significant Accounting Policies
Franklin Templeton Variable Insurance Products Trust (Trust) is registered under the Investment Company Act of 1940 (1940 Act) as an open-end management investment company, consisting of nineteen separate funds and applies the specialized accounting and reporting guidance in U.S. Generally Accepted Accounting Principles (U.S. GAAP). Templeton Growth VIP Fund (Fund) is included in this report. The financial statements of the remaining funds in the Trust are presented separately. Shares of the Fund are generally sold only to insurance company separate accounts to fund the benefits of variable life insurance policies or variable annuity contracts. The Fund offers three classes of shares: Class 1, Class 2, and Class 4. Each class of shares differs by its distribution fees, voting rights on matters affecting a single class and its exchange privilege.
The following summarizes the Fund’s significant accounting policies.
a. Financial Instrument Valuation
The Fund’s investments in financial instruments are carried at fair value daily. Fair value is the price that would be received to sell an asset or paid to transfer a liability in an orderly transaction between market participants on the measurement date. The Fund calculates the net asset value (NAV) per share at the close of the New York Stock Exchange (NYSE), generally at 4 p.m. Eastern time (NYSE close) on each day the NYSE is open for trading. Under compliance policies and procedures approved by the Trust’s Board of Trustees (the Board), the Fund’s administrator has responsibility for oversight of valuation, including leading the cross-functional Valuation and Liquidity Oversight Committee (VLOC). The VLOC provides administration and oversight of the Fund’s valuation policies and procedures, which are approved annually by the Board. Among other things, these procedures allow the Fund to utilize independent pricing services, quotations from securities and financial instrument dealers, and other market sources to determine fair value.
Equity securities listed on an exchange or on the NASDAQ National Market System are valued at the last quoted sale price or the official closing price of the day, respectively. Foreign equity securities are valued as of the close of trading on the foreign stock exchange on which the security is primarily traded or as of the NYSE close, whichever is earlier. The value is then converted into its U.S. dollar equivalent at the foreign exchange rate in effect at the NYSE close on the day that the value of the
security is determined. Over-the-counter (OTC) securities are valued within the range of the most recent quoted bid and ask prices. Securities that trade in multiple markets or on multiple exchanges are valued according to the broadest and most representative market. Certain equity securities are valued based upon fundamental characteristics or relationships to similar securities. Investments in open-end mutual funds are valued at the closing NAV. Time deposits are valued at cost, which approximates fair value.
The Fund has procedures to determine the fair value of financial instruments for which market prices are not reliable or readily available. Under these procedures, the VLOC convenes on a regular basis to review such financial instruments and considers a number of factors, including significant unobservable valuation inputs, when arriving at fair value. The VLOC primarily employs a market-based approach which may use related or comparable assets or liabilities, recent transactions, market multiples, book values, and other relevant information for the investment to determine the fair value of the investment. An income-based valuation approach may also be used in which the anticipated future cash flows of the investment are discounted to calculate fair value. Discounts may also be applied due to the nature or duration of any restrictions on the disposition of the investments. Due to the inherent uncertainty of valuations of such investments, the fair values may differ significantly from the values that would have been used had an active market existed. The VLOC employs various methods for calibrating these valuation approaches including a regular review of key inputs and assumptions, transactional back-testing or disposition analysis, and reviews of any related market activity.
Trading in securities on foreign securities stock exchanges and OTC markets may be completed before the daily NYSE close. In addition, trading in certain foreign markets may not take place on every NYSE business day. Occasionally, events occur between the time at which trading in a foreign security is completed and the close of the NYSE that might call into question the reliability of the value of a portfolio security held by the Fund. As a result, differences may arise between the value of the Fund’s portfolio securities as determined at the foreign market close and the latest indications of value at the close of the NYSE. In order to minimize the potential for these differences, the VLOC monitors price movements following the close of trading in foreign stock markets through a series of country specific market proxies (such as baskets of American Depositary Receipts, futures contracts and exchange traded funds).
| TG-20 | Semiannual Report |
FRANKLIN TEMPLETON VARIABLE INSURANCE PRODUCTS TRUST
NOTES TO FINANCIAL STATEMENTS (UNAUDITED)
Templeton Growth VIP Fund (continued)
These price movements are measured against established trigger thresholds for each specific market proxy to assist in determining if an event has occurred that may call into question the reliability of the values of the foreign securities held by the Fund. If such an event occurs, the securities may be valued using fair value procedures, which may include the use of independent pricing services.
When the last day of the reporting period is a non-business day, certain foreign markets may be open on those days that the NYSE is closed, which could result in differences between the value of the Fund’s portfolio securities on the last business day and the last calendar day of the reporting period. Any significant security valuation changes due to an open foreign market are adjusted and reflected by the Fund for financial reporting purposes.
b. Foreign Currency Translation
Portfolio securities and other assets and liabilities denominated in foreign currencies are translated into U.S. dollars based on the exchange rate of such currencies against U.S. dollars on the date of valuation. The Fund may enter into foreign currency exchange contracts to facilitate transactions denominated in a foreign currency. Purchases and sales of securities, income and expense items denominated in foreign currencies are translated into U.S. dollars at the exchange rate in effect on the transaction date. Portfolio securities and assets and liabilities denominated in foreign currencies contain risks that those currencies will decline in value relative to the U.S. dollar. Occasionally, events may impact the availability or reliability of foreign exchange rates used to convert the U.S. dollar equivalent value. If such an event occurs, the foreign exchange rate will be valued at fair value using procedures established and approved by the Board.
The Fund does not separately report the effect of changes in foreign exchange rates from changes in market prices on securities held. Such changes are included in net realized and unrealized gain or loss from investments in the Statement of Operations.
Realized foreign exchange gains or losses arise from sales of foreign currencies, currency gains or losses realized between the trade and settlement dates on securities transactions and the difference between the recorded amounts of dividends, interest, and foreign withholding taxes and the U.S. dollar equivalent of the amounts actually received or paid. Net unrealized foreign exchange gains and losses arise from changes in foreign
exchange rates on foreign denominated assets and liabilities other than investments in securities held at the end of the reporting period.
c. Securities Lending
The Fund participates in an agency based securities lending program to earn additional income. The Fund receives cash collateral against the loaned securities in an amount equal to at least 102% of the fair value of the loaned securities. Collateral is maintained over the life of the loan in an amount not less than 100% of the fair value of loaned securities, as determined at the close of fund business each day; any additional collateral required due to changes in security values is delivered to the Fund on the next business day. The collateral is deposited into a joint cash account with other funds and is used to invest in a money market fund managed by Franklin Advisers, Inc., an affiliate of the Funds. The Fund may receive income from the investment of cash collateral, in addition to lending fees and rebates paid by the borrower. Income from securities loaned is reported separately in the Statement of Operations. The Fund bears the market risk with respect to the collateral investment, securities loaned, and the risk that the agent may default on its obligations to the Fund. If the borrower defaults on its obligation to return the securities loaned, the Fund has the right to repurchase the securities in the open market using the collateral received. The securities lending agent has agreed to indemnify the Fund in the event of default by a third party borrower.
d. Income and Deferred Taxes
It is the Fund’s policy to qualify as a regulated investment company under the Internal Revenue Code. The Fund intends to distribute to shareholders substantially all of its taxable income and net realized gains to relieve it from federal income and if applicable, excise taxes. As a result, no provision for U.S. federal income taxes is required.
The Fund may be subject to foreign taxation related to income received, capital gains on the sale of securities and certain foreign currency transactions in the foreign jurisdictions in which it invests. Foreign taxes, if any, are recorded based on the tax regulations and rates that exist in the foreign markets in which the Fund invests. When a capital gain tax is determined to apply, the Fund records an estimated deferred tax liability in an amount that would be payable if the securities were disposed of on the valuation date. As a result of several court cases, in certain countries across the European Union, the Fund has filed
| Semiannual Report | TG-21 |
FRANKLIN TEMPLETON VARIABLE INSURANCE PRODUCTS TRUST
NOTES TO FINANCIAL STATEMENTS (UNAUDITED)
Templeton Growth VIP Fund (continued)
1. Organization and Significant Accounting Policies (continued)
d. Income and Deferred Taxes (continued)
additional tax reclaims for previously withheld taxes on dividends earned in those countries. These additional filings are subject to various administrative proceedings by the local jurisdictions’ tax authorities within the European Union, as well as a number of related judicial proceedings. At this time, uncertainty exists as to the ultimate resolution of these proceedings, the likelihood of receipt of these reclaims, and the potential timing of payment, and accordingly, no amounts are reflected in the financial statements.
The Fund recognizes the tax benefits of uncertain tax positions only when the position is “more likely than not” to be sustained upon examination by the tax authorities based on the technical merits of the tax position. As of June 30, 2015, and for all open tax years, the Fund has determined that no liability for unrecognized tax benefits is required in the Fund’s financial statements related to uncertain tax positions taken on a tax return (or expected to be taken on future tax returns). Open tax years are those that remain subject to examination and are based on each tax jurisdiction’s statute of limitation.
e. Security Transactions, Investment Income, Expenses and Distributions
Security transactions are accounted for on trade date. Realized gains and losses on security transactions are determined on a specific identification basis. Interest income and estimated expenses are accrued daily. Dividend income, is recorded on the ex-dividend date except for certain dividends from foreign securities where the dividend rate is not available. In such cases, the dividend is recorded as soon as the information is received by the Fund. Distributions to shareholders are recorded on the ex-dividend date and are determined according to income tax regulations (tax basis). Distributable earnings determined on a tax basis may differ from earnings recorded in accordance with U.S.
GAAP. These differences may be permanent or temporary. Permanent differences are reclassified among capital accounts to reflect their tax character. These reclassifications have no impact on net assets or the results of operations. Temporary differences are not reclassified, as they may reverse in subsequent periods.
Common expenses incurred by the Trust are allocated among the funds based on the ratio of net assets of each fund to the combined net assets of the Trust. Fund specific expenses are charged directly to the fund that incurred the expense.
Realized and unrealized gains and losses and net investment income, not including class specific expenses, are allocated daily to each class of shares based upon the relative proportion of net assets of each class. Differences in per share distributions, by class, are generally due to differences in class specific expenses.
f. Accounting Estimates
The preparation of financial statements in accordance with U.S. GAAP requires management to make estimates and assumptions that affect the reported amounts of assets and liabilities at the date of the financial statements and the amounts of income and expenses during the reporting period. Actual results could differ from those estimates.
g. Guarantees and Indemnifications
Under the Trust’s organizational documents, its officers and trustees are indemnified by the Trust against certain liabilities arising out of the performance of their duties to the Trust. Additionally, in the normal course of business, the Trust, on behalf of the Fund, enters into contracts with service providers that contain general indemnification clauses. The Trust’s maximum exposure under these arrangements is unknown as this would involve future claims that may be made against the Trust that have not yet occurred. Currently, the Trust expects the risk of loss to be remote.
| TG-22 | Semiannual Report |
FRANKLIN TEMPLETON VARIABLE INSURANCE PRODUCTS TRUST
NOTES TO FINANCIAL STATEMENTS (UNAUDITED)
Templeton Growth VIP Fund (continued)
2. Shares of Beneficial Interest
At June 30, 2015, there were an unlimited number of shares authorized (without par value). Transactions in the Fund’s shares were as follows:
| Six Months Ended June 30, 2015 | Year Ended December 31, 2014 | |||||||||||||||||
| Shares | Amount | Shares | Amount | |||||||||||||||
| Class 1 Shares: | ||||||||||||||||||
Shares sold | 174,719 | $ | 2,628,557 | 2,100,767 | $ | 33,047,439 | ||||||||||||
Shares issued in reinvestment of distributions | 1,016,340 | 15,123,132 | 589,713 | 9,482,577 | ||||||||||||||
Shares redeemed | (2,923,773 | ) | (44,582,827 | ) | (2,142,457 | ) | (33,058,810 | ) | ||||||||||
|
| |||||||||||||||||
Net increase (decrease) | (1,732,714 | ) | $ | (26,831,138 | ) | 548,023 | $ | 9,471,206 | ||||||||||
|
| |||||||||||||||||
| Class 2 Shares: | ||||||||||||||||||
Shares sold | 1,886,017 | $ | 28,562,254 | 2,721,083 | $ | 41,308,837 | ||||||||||||
Shares issued in reinvestment of distributions | 1,917,482 | 28,110,279 | 1,155,358 | 18,300,865 | ||||||||||||||
Shares redeemed | (8,045,951 | ) | (120,482,154 | ) | (18,911,727 | ) | (287,426,020 | ) | ||||||||||
|
| |||||||||||||||||
Net increase (decrease) | (4,242,452 | ) | $ | (63,809,621 | ) | (15,035,286 | ) | $ | (227,816,318 | ) | ||||||||
|
| |||||||||||||||||
| Class 4 Shares: | ||||||||||||||||||
Shares sold | 130,521 | $ | 1,929,451 | 416,620 | $ | 6,355,215 | ||||||||||||
Shares issued on reinvestment of distributions | 91,767 | 1,358,156 | 55,382 | 885,005 | ||||||||||||||
Shares redeemed | (451,066 | ) | (6,836,736 | ) | (1,134,025 | ) | (17,621,885 | ) | ||||||||||
|
| |||||||||||||||||
Net increase (decrease) | (228,778 | ) | $ | (3,549,129 | ) | (662,023 | ) | $ | (10,381,665 | ) | ||||||||
|
| |||||||||||||||||
3. Transactions With Affiliates
Franklin Resources, Inc. is the holding company for various subsidiaries that together are referred to as Franklin Templeton Investments. Certain officers and trustees of the Fund are also officers and/or directors of the following subsidiaries:
| Subsidiary | Affiliation | |
Templeton Global Advisors Limited (TGAL) | Investment manager | |
Franklin Templeton Services, LLC (FT Services) | Administrative manager | |
Franklin Templeton Distributors, Inc. (Distributors) | Principal underwriter | |
Franklin Templeton Investor Services, LLC (Investor Services) | Transfer agent |
a. Management Fees
The Fund pays an investment management fee to TGAL based on the average daily net assets of the Fund as follows:
| Annualized Fee Rate | Net Assets | |
1.000% | Up to and including $100 million | |
0.900% | Over $100 million, up to and including $250 million | |
0.800% | Over $250 million, up to and including $500 million | |
0.750% | Over $500 million, up to and including $1 billion | |
0.700% | Over $1 billion, up to and including $5 billion | |
0.675% | Over $5 billion, up to and including $10 billion | |
0.655% | Over $10 billion, up to and including $15 billion |
| Semiannual Report | TG-23 |
FRANKLIN TEMPLETON VARIABLE INSURANCE PRODUCTS TRUST
NOTES TO FINANCIAL STATEMENTS (UNAUDITED)
Templeton Growth VIP Fund (continued)
3. Transactions With Affiliates (continued)
a. Management Fees (continued)
| Annualized Fee Rate | Net Assets | |
0.635% | Over $15 billion, up to and including $20 billion | |
0.615% | In excess of $20 billion |
b. Administrative Fees
Under an agreement with TGAL, FT Services provides administrative services to the Fund. The fee is paid by TGAL based on the Fund’s average daily net assets, and is not an additional expense of the Fund.
c. Distribution Fees
The Board has adopted a distribution plans for Class 2 and Class 4 shares pursuant to Rule 12b-1 under the 1940 Act. Under the Fund’s compensation distribution plans, the Fund pays Distributors for costs incurred in connection with the servicing, sale and distribution of the Fund’s shares up to 0.35% per year of its average daily net assets of each class. Some distribution fees are not charged on shares held by affiliates. The Board has agreed to limit the current rate to 0.25% per year for Class 2. The plan year, for purposes of monitoring compliance with the maximum annual plan rates, is February 1 through January 31.
d. Transfer Agent Fees
Investor Services, under terms of an agreement, performs shareholder servicing for the Fund and is not paid by the Fund for the services.
e. Investments in Institutional Fiduciary Trust Money Market Portfolio
The Fund invests in Institutional Fiduciary Trust Money Market Portfolio (Sweep Money Fund), an affiliated open-end management investment company. Management fees paid by the Fund are waived on assets invested in the Sweep Money Fund, as noted in the Statement of Operations, in an amount not to exceed the management and administrative fees paid directly or indirectly by the Sweep Money Fund.
f. Other Affiliated Transactions
At June 30, 2015, Franklin Templeton Variable Insurance Products Trust – Franklin Founding Funds Allocation VIP Fund owned 22.86% of the Fund’s outstanding shares.
4. Expense Offset Arrangement
The Fund has entered into an arrangement with its custodian whereby credits realized as a result of uninvested cash balances are used to reduce a portion of the Fund’s custodian expenses. During the period ended June 30, 2015, there were no credits earned.
5. Income Taxes
For tax purposes, capital losses may be carried over to offset future capital gains. Capital loss carryforwards with no expiration, if any, must be fully utilized before those losses with expiration dates.
| TG-24 | Semiannual Report |
FRANKLIN TEMPLETON VARIABLE INSURANCE PRODUCTS TRUST
NOTES TO FINANCIAL STATEMENTS (UNAUDITED)
Templeton Growth VIP Fund (continued)
At December 31, 2014, capital loss carryforwards were as follows:
Capital loss carryforwards subject to expiration: | ||||
2017 | $ | 16,985,638 | ||
2018 | 55,299,629 |
At June 30, 2015, the cost of investments and net unrealized appreciation (depreciation) for income tax purposes were as follows:
Cost of investments | $ | 1,425,100,820 | ||
|
| |||
Unrealized appreciation | $ | 397,481,041 | ||
Unrealized depreciation | (128,068,435 | ) | ||
|
| |||
Net unrealized appreciation (depreciation) | $ | 269,412,606 | ||
|
|
Differences between income and/or capital gains as determined on a book basis and a tax basis are primarily due to differing treatments of foreign currency transactions, passive foreign investment company shares and wash sales.
6. Investment Transactions
Purchases and sales of investments (excluding short term securities) for the period ended June 30, 2015, aggregated $176,481,952 and $269,835,278, respectively.
7. Concentration of Risk
Investing in foreign securities may include certain risks and considerations not typically associated with investing in U.S. securities, such as fluctuating currency values and changing local and regional economic, political and social conditions, which may result in greater market volatility. In addition, certain foreign securities may not be as liquid as U.S. securities.
8. Credit Facility
The Fund, together with other U.S. registered and foreign investment funds (collectively, Borrowers), managed by Franklin Templeton Investments, are borrowers in a joint syndicated senior unsecured credit facility totaling $2 billion (Global Credit Facility) which matures on February 12, 2016. This Global Credit Facility provides a source of funds to the Borrowers for temporary and emergency purposes, including the ability to meet future unanticipated or unusually large redemption requests.
Under the terms of the Global Credit Facility, the Fund shall, in addition to interest charged on any borrowings made by the Fund and other costs incurred by the Fund, pay its share of fees and expenses incurred in connection with the implementation and maintenance of the Global Credit Facility, based upon its relative share of the aggregate net assets of all of the Borrowers, including an annual commitment fee of 0.07% based upon the unused portion of the Global Credit Facility. These fees are reflected in other expenses in the Statement of Operations. During the period ended June 30, 2015, the Fund did not use the Global Credit Facility.
9. Fair Value Measurements
The Fund follows a fair value hierarchy that distinguishes between market data obtained from independent sources (observable inputs) and the Fund’s own market assumptions (unobservable inputs). These inputs are used in determining the value of the Fund’s financial instruments and are summarized in the following fair value hierarchy:
| • | Level 1 – quoted prices in active markets for identical financial instruments |
| • | Level 2 – other significant observable inputs (including quoted prices for similar financial instruments, interest rates, prepayment speed, credit risk, etc.) |
| • | Level 3 – significant unobservable inputs (including the Fund’s own assumptions in determining the fair value of financial instruments) |
| Semiannual Report | TG-25 |
FRANKLIN TEMPLETON VARIABLE INSURANCE PRODUCTS TRUST
NOTES TO FINANCIAL STATEMENTS (UNAUDITED)
Templeton Growth VIP Fund (continued)
9. Fair Value Measurements (continued)
The input levels are not necessarily an indication of the risk or liquidity associated with financial instruments at that level.
For movements between the levels within the fair value hierarchy, the Fund has adopted a policy of recognizing the transfers as of the date of the underlying event which caused the movement.
A summary of inputs used as of June 30, 2015, in valuing the Fund’s assets carried at fair value, is as follows:
| Level 1 | Level 2 | Level 3 | Total | |||||||||||||
| Assets: | ||||||||||||||||
Investments in Securities: | ||||||||||||||||
Equity Investmentsa,b | $ | 1,668,250,926 | $ | — | $ | — | $ | 1,668,250,926 | ||||||||
Short Term Investments | 7,762,500 | 18,500,000 | — | 26,262,500 | ||||||||||||
|
| |||||||||||||||
Total Investments in Securities | $ | 1,676,013,426 | $ | 18,500,000 | $ | — | $ | 1,694,513,426 | ||||||||
|
| |||||||||||||||
aIncludes common and preferred stocks.
bFor detailed categories, see the accompanying Statement of Investments.
10. New Accounting Pronouncements
In June 2014, the Financial Accounting Standards Board issued Accounting Standards Update (ASU) No. 2014-11, Transfers and Servicing (Topic 860), Repurchase-to-Maturity Transactions, Repurchase Financings, and Disclosures. The ASU changes the accounting for certain repurchase agreements and expands disclosure requirements related to repurchase agreements, securities lending, repurchase-to-maturity and similar transactions. The ASU is effective for certain transactions accounted for as a sale for interim and annual reporting periods beginning after December 15, 2014, and transactions accounted for as secured borrowings for annual periods beginning after December 15, 2014, and for interim periods beginning after March 15, 2015. Management has reviewed the requirements and believes the adoption of this ASU will not have a material impact on the financial statements.
11. Subsequent Events
The Fund has evaluated subsequent events through the issuance of the financial statements and determined that no events have occurred that require disclosure.
Abbreviations
| ADR | American Depositary Receipt | |
| IDR | International Depositary Receipt | |
| TG-26 | Semiannual Report |
FRANKLIN TEMPLETON VARIABLE INSURANCE PRODUCTS TRUST
TAX INFORMATION (UNAUDITED)
Templeton Growth VIP Fund
At December 31, 2014 more than 50% of the Fund’s total assets were invested in securities of foreign issuers. In most instances, foreign taxes were withheld from income paid to the Fund on these investments. As shown in the table below, the Fund hereby reports to shareholders the foreign source income and foreign taxes paid, pursuant to Section 853 of the Internal Revenue Code (Code). This written statement will allow shareholders of record on June 12, 2015, to treat their proportionate share of foreign taxes paid by the Fund as having been paid directly by them. The shareholder shall consider these amounts as foreign taxes paid in the tax year in which they receive the Fund distribution.
The following table provides a detailed analysis of foreign tax paid and foreign source income as reported by the Fund, to Class 1, Class 2, and Class 4 shareholders of record.
| Class | Foreign Tax Paid Per Share | Foreign Source Income Per Share | ||
Class 1 | $0.0215 | $0.3708 | ||
Class 2 | $0.0215 | $0.3332 | ||
Class 4 | $0.0215 | $0.3183 |
Foreign Tax Paid Per Share (Column 1) is the amount per share available to you, as a tax credit (assuming you held your shares in the Fund for a minimum of 16 days during the 31-day period beginning 15 days before the ex-dividend date of the Fund’s distribution to which the foreign taxes relate), or, as a tax deduction.
Foreign Source Income Per Share (Column 2) is the amount per share of income dividends attributable to foreign securities held by the Fund, plus any foreign taxes withheld on these dividends.
| Semiannual Report | TG-27 |
FRANKLIN TEMPLETON VARIABLE INSURANCE PRODUCTS TRUST
The indexes are unmanaged and include reinvestment of any income or distributions.
For Russell Indexes: Russell Investment Group is the source and owner of the trademarks, service marks and copyrights related to the Russell Indexes. Russell® is a trademark of Russell Investment Group.
See www.franklintempletondatasources.com for additional data provider information.
Barclays 1-3 Month U.S. Treasury Bill Index includes all publicly issued zero-coupon U.S. Treasury bills that have a remaining maturity between one month and three months and are investment-grade rated, U.S. dollar denominated, fixed rate and nonconvertible.
Barclays U.S. Aggregate Bond Index is a market capitalization-weighted index representing the U.S. investment-grade, fixed-rate, taxable bond market with index components for government and corporate, mortgage pass-through and asset-backed securities. All issues included are SEC registered, taxable, dollar denominated and nonconvertible, must have at least one year to final maturity and must be rated investment grade (Baa3/BBB-/BBB- or higher) using the middle rating of Moody’s, Standard & Poor’s and Fitch, respectively.
Barclays U.S. Government Index: Intermediate Component is the intermediate component of the Barclays U.S. Government Index, which includes public obligations of the U.S. Treasury with at least one year to final maturity and publicly issued debt of U.S. government agencies, quasi-federal corporations, and corporate or foreign debt guaranteed by the U.S. government.
Bloomberg Commodity Index comprises exchange-traded futures on physical commodities, which are weighted to account for economic significance and market liquidity. Prior to 7/1/14, the index was known as the Dow Jones-UBS Commodity Index.
Citigroup World Government Bond Index is a market capitalization-weighted index consisting of investment-grade world government bond markets.
Consumer Price Index (CPI) is a commonly used measure of the inflation rate.
Credit Suisse (CS) High Yield Index is designed to mirror the investable universe of the U.S. dollar-denominated high yield debt market.
Dow Jones Industrial Average is a price-weighted average of blue-chip stocks that are generally the leaders in their industry.
FTSE® EPRA®/NAREIT® Developed Index is a free float-adjusted index designed to measure the performance of publicly traded real estate securities in the North American, European and Asian real estate markets.
J.P. Morgan (JPM) Global Government Bond Index (GGBI) tracks total returns for liquid, fixed-rate, domestic government bonds with maturities greater than one year issued by developed countries globally.
Lipper Multi-Sector Income Funds Classification Average is calculated by averaging the total returns of all funds within the Lipper Multi-Sector Income Funds classification in the Lipper Open-End underlying funds universe. Lipper Multi-Sector Income Funds are defined as funds that seek current income by allocating assets among different fixed income securities sectors (not primarily in one sector except for defensive purposes), including U.S. and foreign governments, with a significant portion rated below investment grade. For the six-month period ended 6/30/15, there were 293 funds in this category. Lipper calculations do not include contract fees, expenses or sales charges, and may have been different if such charges had been considered.
Lipper VIP Equity Income Funds Classification Average is an equally weighted average calculation of performance figures for all funds within the Lipper Equity Income Funds classification in the Lipper VIP underlying funds universe. Lipper Equity Income Funds seek relatively high current income and growth of income through investing 60% or more of their portfolios in equities. For the six-month period ended 6/30/15, there were 71 funds in this category. Lipper calculations do not include contract fees, expenses or sales charges, and may have been different if such charges had been considered.
Lipper VIP General U.S. Government Funds Classification Average is an equally weighted average calculation of performance figures for all funds within the Lipper General U.S. Government Funds classification in the Lipper VIP underlying funds universe. Lipper General U.S. Government Funds invest primarily in U.S. government and agency issues. For the six-month period ended 6/30/15, there were 52 funds in this category. Lipper calculations do not include contract fees, expenses or sales charges, and may have been different if such charges had been considered.
| Semiannual Report | I-1 |
FRANKLIN TEMPLETON VARIABLE INSURANCE PRODUCTS TRUST
INDEX DESCRIPTIONS
Lipper VIP High Yield Funds Classification Average is an equally weighted average calculation of performance figures for all funds within the Lipper High Yield Funds Classification in the Lipper VIP underlying funds universe. Lipper High Yield Funds aim at high (relative) current yield from fixed income securities, have no quality or maturity restrictions, and tend to invest in lower grade debt issues. For the six-month period ended 6/30/15, there were 113 funds in this category. Lipper calculations do not include contract fees, expenses or sales charges, and may have been different if such charges had been considered.
MSCI All Country World Index (ACWI) is a free float-adjusted, market capitalization-weighted index designed to measure equity market performance in global developed and emerging markets.
MSCI China A Index is a free float-adjusted, market capitalization-weighted index designed to measure equity market performance of companies incorporated in China that are listed on the Shanghai and Shenzhen Stock Exchanges, are quoted in the Chinese renminbi and entail foreign investment regulations.
MSCI China Index is a free float-adjusted, market capitalization-weighted index designed to measure equity market performance of China, as represented by B, China H, Red Chip and P Chip shares.
MSCI Emerging Markets (EM) Index is a free float-adjusted, market capitalization-weighted index designed to measure equity market performance in global emerging markets.
MSCI Europe, Australasia, Far East (EAFE) Index is a free float-adjusted, market capitalization-weighted index designed to measure equity market performance in global developed markets excluding the U.S. and Canada.
MSCI World Index is a free float-adjusted, market capitalization-weighted index designed to measure equity market performance in global developed markets.
Russell 1000® Growth Index is market capitalization weighted and measures performance of those Russell 1000® Index companies with higher price-to-book ratios and higher forecasted growth values.
Russell 1000® Index is market capitalization weighted and measures performance of the largest companies in the Russell 3000® Index, which represents the majority of the U.S. market’s total capitalization.
Russell 1000® Value Index is market capitalization weighted and measures performance of those Russell 1000® Index companies with lower price-to-book ratios and lower forecasted growth values.
Russell 2500TM Index is market capitalization weighted and measures performance of the smallest companies in the Russell 3000® Index, which represent a modest amount of the Russell 3000® Index’s total market capitalization.
Russell 2500 TM Value Index is market capitalization weighted and measures performance of those Russell 2500 TM Index companies with lower price-to-book ratios and lower forecasted growth values.
Russell 3000® Growth Index is market capitalization weighted and measures performance of those Russell 3000® Index companies with higher price-to-book ratios and higher forecasted growth values.
Russell 3000® Index is market capitalization weighted and measures performance of the largest U.S. companies based on total market capitalization and represents the majority of the investable U.S. equity market.
Russell Midcap® Growth Index is market capitalization weighted and measures performance of those Russell Midcap® Index companies with higher price-to-book ratios and higher forecasted growth values.
Russell Midcap® Index is market capitalization weighted and measures performance of the smallest companies in the Russell 1000® Index, which represent a modest amount of the Russell 1000® Index’s total market capitalization.
Standard & Poor’s® 500 Index (S&P 500®) is a market capitalization-weighted index of 500 stocks designed to measure total U.S. equity market performance.
Standard & Poor’s®/International Finance Corporation Investable (S&P®/IFCI) Composite Index is a free float-adjusted, market capitalization-weighted index designed to measure equity performance in global emerging markets.
| I-2 | Semiannual Report |
FRANKLIN TEMPLETON VARIABLE INSURANCE PRODUCTS TRUST
Board Review of Investment Management Agreement
At a meeting held April 14, 2015, the Board of Trustees (Board), including a majority of non-interested or independent Trustees, approved renewal of the investment management agreement for each of the separate funds within the Trust (Fund(s)). In reaching this decision, the Board took into account information furnished throughout the year at regular Board meetings, as well as information prepared specifically in connection with the annual renewal review process. Information furnished and discussed throughout the year included investment performance reports and related financial information for each Fund, along with periodic reports on expenses, shareholder services, legal and compliance matters, pricing, brokerage commissions and execution and other services provided by the Investment Manager (Manager) and its affiliates. Information furnished specifically in connection with the renewal process included reports prepared by Lipper, Inc. (Lipper), an independent organization, as well as additional material, including a Fund profitability analysis prepared by management. The Lipper reports compared each Fund’s investment performance and expenses with those of other mutual funds deemed comparable to the Fund as selected by Lipper. The Fund profitability analysis discussed the profitability to Franklin Templeton Investments (FTI) from its overall U.S. fund operations, as well as on an individual fund-by-fund basis. Additional material accompanying such profitability analysis included information on a fund-by-fund basis listing portfolio managers and other accounts they manage, as well as information on management fees charged by the Manager and its affiliates to U.S. mutual funds and other accounts, including management’s explanation of differences where relevant. Such material also included a memorandum prepared by management describing project initiatives and capital investments relating to the services provided to the Funds by the FTI organization, as well as a memorandum relating to economies of scale.
In considering such materials, the independent Trustees received assistance and advice from and met separately with independent counsel. While the investment management agreements for all Funds were considered at the same Board meeting, the Board dealt with each Fund separately. In approving continuance of the investment management agreement for each Fund, the Board, including a majority of independent Trustees, determined that the existing management fee structure was fair and reasonable and that continuance of the investment management agreement was in the best interests of each Fund and its shareholders. While
attention was given to all information furnished, the following discusses some primary factors relevant to the Board’s decision.
NATURE, EXTENT AND QUALITY OF SERVICE. The Board was satisfied with the nature and quality of the overall services provided by the Manager and its affiliates to the Funds and its shareholders, except as noted later with respect to investment performance. The Board’s opinion was based, in part, upon periodic reports furnished it showing that the investment policies and restrictions for each Fund were consistently complied with as well as other reports periodically furnished the Board covering matters such as the compliance of portfolio managers and other management personnel with the code of ethics adopted throughout the Franklin Templeton fund complex, the adherence to fair value pricing procedures established by the Board, and the accuracy of net asset value calculations. Favorable consideration was given to management’s continual efforts and expenditures in establishing effective business continuity plans and developing strategies to address cybersecurity threats. Among other factors taken into account by the Board were the Manager’s best execution trading policies, including a favorable report by an independent portfolio trading analytical firm that also covered FOREX transactions. Consideration was also given to the experience of each Fund’s portfolio management team, the number of accounts managed and general method of compensation. In this latter respect, the Board noted that a primary factor in management’s determination of a portfolio manager’s bonus compensation was the relative investment performance of the funds he or she managed and that a portion of such bonus was required to be invested in a predesignated list of funds within such person’s fund management area so as to be aligned with the interests of shareholders. Particular attention was given to management’s conservative approach and diligent risk management procedures, including continual monitoring of counterparty credit risk and attention given to derivatives and other complex instruments, including expanded collateralization requirements. The Board also took into account, among other things, management’s efforts in establishing a global credit facility for the benefit of the Funds and other accounts managed by FTI to provide a source of cash for temporary and emergency purposes or to meet unusual redemption requests as well as the strong financial position of the Manager’s parent company and its commitment to the mutual fund business as evidenced by its continued subsidization of money market funds.
INVESTMENT PERFORMANCE. The Board placed significant emphasis on the investment performance of each of the
| Semiannual Report | SI-1 |
FRANKLIN TEMPLETON VARIABLE INSURANCE PRODUCTS TRUST
SHAREHOLDER INFORMATION
Board Review of Investment Management Agreement (continued)
Funds in view of its importance to shareholders. While consideration was given to performance reports and discussions with portfolio managers at Board meetings throughout the year, particular attention in assessing performance was given to the Lipper reports furnished for the agreement renewals of all Funds. The Lipper reports prepared for each of the individual Funds showed the investment performance of Class 1 shares for those having such class of shares and Class 2 shares for those Funds that did not have Class 1 shares, in comparison to a performance universe selected by Lipper. Comparative performance for each Fund was shown for the one-year period ended January 31, 2015, and previous periods ended that date of up to 10 years unless otherwise noted. Performance was shown on a total return basis for each Fund. In certain cases, income return was indicated as well. The following summarizes the performance results for each of the Funds and the Board’s view of such performance.
Franklin Flex Cap Growth VIP Fund – The performance universe for this Fund, which has been in operation for 10 full years, consisted of the Fund and all multi-cap growth funds underlying variable insurance products as selected by Lipper. The Lipper report showed the Fund’s comparative total return for the one-year period to be in the lowest performing quintile of its performance universe, and on an annualized basis to also be in the lowest performing quintile of such universe for each of the previous three- and five-year periods. The Board discussed with management the reasons for the Fund’s underperformance and steps management was taking to evaluate its highest conviction stocks, but found the Fund’s absolute performance on an annualized basis as shown in the Lipper report to be acceptable.
Franklin Founding Funds Allocation VIP Fund – The performance universe for this Fund consisted of the Fund and all mixed-asset target allocation growth funds underlying variable insurance products as selected by Lipper. The Fund has been in existence for seven years and the Lipper report showed its income return to be in the highest quintile of such Lipper universe for the one-year period, and on an annualized basis to also be in the highest quintile of such universe for each of the previous three- and five-year periods. The Lipper report showed the Fund’s total return for the one-year period to be in the lowest performing quintile of such performance universe and on an annualized basis to be in the second-highest performing quintile of such universe for the previous three-year period, and to be in the second-lowest performing quintile of such universe for the previous five-year
period. In assessing the relevance of such comparative performance, the Board noted the Fund is not actively managed and that its performance reflects those of the three underlying funds in which it invests in equal portions, which are not perfectly aligned to the investment style of comparative funds. The Board was satisfied with the Fund’s performance as shown in the Lipper report.
Franklin Global Real Estate VIP Fund – The performance universe for this Fund consisted of the Fund and all global real estate funds underlying variable insurance products as selected by Lipper. The Lipper report showed the Fund’s total return to be in the highest performing quintile of such universe for the one-year period, and on an annualized basis to be in the highest performing quintile of such universe for the previous three- and five-year periods, but in the lowest performing quintile of such universe for the previous 10-year period. Noting the marked improvement in performance in recent years, the Board was satisfied with the Fund’s comparative performance as shown in the Lipper report.
Franklin Growth and Income VIP Fund – The performance universe for this Fund consisted of the Fund and all equity income funds underlying variable insurance products as selected by Lipper. The Lipper report showed the Fund’s income return during the one-year period to be in the highest quintile of its Lipper performance universe, and on an annualized basis in each of the previous three-, five- and 10-year periods to also be in the highest quintile of such universe. The Lipper report showed the Fund’s total return for the one-year period to be in the middle performing quintile of its performance universe, and on an annualized basis, to be in the second-lowest performing quintile of such universe for each of the previous three- and 10-year periods, and the second-highest performing quintile of such universe for the previous five-year period. The Board noted management’s attention to intensifying its focus on its highest conviction investments and found the Fund’s comparative performance as shown in the Lipper report to be satisfactory.
Franklin High Income VIP Fund – The performance universe for this Fund consisted of the Fund and all high yield funds underlying variable insurance products as selected by Lipper. The Lipper report showed the Fund’s income return for the one-year period to be in the second-highest quintile of such performance universe, and on an annualized basis to be in the highest and second-highest quintiles of such universe for the previous three- and five-year periods, respectively, and to be in the middle quintile of such universe for the previous 10-year period. The Lipper report showed the Fund’s total return to be in the lowest
| SI-2 | Semiannual Report |
FRANKLIN TEMPLETON VARIABLE INSURANCE PRODUCTS TRUST
SHAREHOLDER INFORMATION
performing quintile of its performance universe for the one-year period, and, on an annualized basis, to be in the middle performing quintile of such universe for the previous three-year period, and in the second-highest performing quintile of such universe for the previous five- and 10-year periods. The Board was satisfied with the Fund’s comparative performance as shown in the Lipper report, noting the Fund’s income objective.
Franklin Income VIP Fund – The performance universe for this Fund consisted of the Fund and all mixed-asset target allocation moderate funds underlying variable insurance products as selected by Lipper. The Lipper report showed the Fund’s income return to be in the highest quintile of such performance universe for the one-year period and to also be in the highest quintile of such universe for each of the previous three-, five- and 10-year periods on an annualized basis. The Lipper report showed the Fund’s total return to be in the lowest performing quintile of its performance universe for the one-year period, and on an annualized basis to be in the middle performing quintile of such universe for the previous three- and five-year periods, and the second-highest performing quintile of such universe for the previous 10-year period. The Board was satisfied with the Fund’s comparative performance as shown in the Lipper report.
Franklin Large Cap Growth VIP Fund – The performance universe for this Fund consisted of the Fund and all large-cap growth funds underlying variable insurance products as selected by Lipper. The Lipper report showed the Fund’s total return to be in the highest or best performing quintile of such universe for the one-year period, and on an annualized basis to be in the second-lowest performing quintile of such universe for the previous three-year period, and the lowest performing quintile of such universe for each of the previous five- and 10-year periods. The Board discussed with management the Fund’s historical underperformance and noted that a new portfolio manager was appointed for the Fund, effective May 1, 2014. In view of such discussions, and in light of the Fund’s positive total return during the most recent year, the Board believed that appropriate action had been taken and that the Fund’s comparative performance as shown in the Lipper report was acceptable.
Franklin Mutual Global Discovery VIP Fund – The performance universe for this Fund consisted of the Fund and all global large-cap value funds underlying variable insurance products as selected by Lipper. The Lipper report showed the Fund’s total return to be in the highest performing quintile of such universe for the one-year period, and on an annualized basis to be in the highest performing quintile of such universe for the previous
three-, five- and 10-year periods. The Board found the Fund’s overall comparative performance as set forth in the Lipper report to be satisfactory, noting that the three-year annualized total return exceeded 13%.
Franklin Mutual Shares VIP Fund – The performance universe for this Fund consisted of the Fund and all large-cap value funds underlying variable insurance products as selected by Lipper. The Lipper report showed the Fund’s total return for the one-year period to be in the second-lowest performing quintile of the performance universe, and on an annualized basis to be in the lowest performing quintile of such universe for the previous three- and five-year periods, and to be in the middle performing quintile for the previous 10-year period. The Board found the Fund’s overall performance as set forth in the Lipper report to be unacceptable, but acknowledged management’s explanation that the Fund is managed conservatively and the Fund’s cash holdings detract from relative performance in sharply rising markets. The Board indicated it would continue to monitor the Fund.
Franklin Rising Dividends VIP Fund – The performance universe for this Fund consisted of the Fund and all multi-cap core funds underlying variable insurance products as selected by Lipper. The Lipper report showed the Fund’s comparative total return to be in the middle performing quintile of the performance universe for the one-year period, and on an annualized basis to be in the second-lowest performing quintile of such universe for the previous three-year period, and the middle performing quintile of such universe for each of the previous five- and 10-year periods. The Board found the Fund’s comparative performance as set forth in the Lipper report to be acceptable, noting that its total return was above the median for the one-year period as well as the annualized five-year period.
Franklin Small Cap Value VIP Fund – The performance group for this Fund consisted of the Fund and all small-cap value funds underlying variable insurance products as selected by Lipper. The Lipper report showed the Fund’s total return for the one-year period to be in the second-lowest performing quintile of such performance universe, and on an annualized basis to also be in the second-lowest performing quintile of such universe for the previous three-year period, and in the second-highest performing quintile of such universe for each of the previous five- and 10-year periods. The Board found the Fund’s comparative performance as set forth in the Lipper report to be acceptable, noting management’s recent commitment of two additional analysts to support the Fund and the Fund’s longer term positive returns.
| Semiannual Report | SI-3 |
FRANKLIN TEMPLETON VARIABLE INSURANCE PRODUCTS TRUST
SHAREHOLDER INFORMATION
Board Review of Investment Management Agreement (continued)
Franklin Small-Mid Cap Growth VIP Fund – The performance universe for this Fund consisted of the Fund and all mid-cap growth funds underlying variable insurance products as selected by Lipper. The Lipper report showed the Fund’s total return for the one-year period to be in the second-lowest performing quintile of such universe, and on an annualized basis to be in the middle performing quintile of such universe for each of the previous three- and five-year periods, and the second-lowest performing quintile of such universe for the previous 10-year period. The Board discussed with management portfolio adjustments and the commitment of additional resources to the portfolio team. Given management’s attention to the Fund, the Board found the Fund’s performance to be acceptable and noted that the 10-year annualized performance was less than 1% below the median.
Franklin Strategic Income VIP Fund – The performance universe for this Fund consisted of the Fund and all general bond funds underlying variable insurance products as selected by Lipper. The Lipper report showed the Fund’s income return to be in the highest quintile of such Lipper universe for the one-year period, and on an annualized basis to also be in the highest quintile of such universe during each of the previous three- and five-year periods, and in the second-highest quintile of such universe for the previous 10-year period. The Lipper report showed the Fund’s total return to be in the second-lowest performing quintile of such universe during the one-year period, and on an annualized basis to be in either the highest or second-highest performing quintile of such universe for each of the previous three-, five- and 10-year periods. The Board was satisfied with the Fund’s performance as shown in the Lipper report.
Templeton Developing Markets VIP Fund – The performance universe for this Fund consisted of the Fund and all emerging markets funds underlying variable insurance products as selected by Lipper. The Lipper report showed the Fund’s comparative total return for the one-year period to be in the second-lowest performing quintile of such performance universe and on an annualized basis to also be in the second-lowest performing quintile of such universe for each of the previous three-, five- and 10-year periods. The Board found the performance of the Fund as set forth in the Lipper report to be disappointing and discussed with management the impact of the Manager’s approach to investing, which was out of favor in current markets. The Board also discussed with management steps it was
evaluating to improve the performance, including a more rigorous selling discipline. The Board concluded that continued monitoring is warranted in light of the Fund’s underperformance, but did not believe a portfolio management change was needed at this time.
Templeton Foreign VIP Fund – The performance universe for this Fund consisted of the Fund and all international large-cap value funds underlying variable insurance products as selected by Lipper. The Lipper report showed the Fund’s comparative total return for the one-year period to be in the lowest performing quintile of such performance universe and on an annualized basis to be in the second-lowest performing quintile of such universe for the previous three-year period, in the second-highest performing quintile of such universe for the previous five-year period, and in the highest performing quintile of such universe for the previous 10-year period. The Board was satisfied with the Fund’s comparative investment performance as set forth in the Lipper report, noting that performance was in the highest or second-highest quintile in each of the previous seven years.
Templeton Global Bond VIP Fund – The performance universe for this Fund consisted of the Fund and all global income funds underlying variable insurance products as selected by Lipper. The Lipper report showed the Fund’s income return for the one-year period to be in the highest quintile of such Lipper universe, and on an annualized basis to also be in the highest quintile of such universe for the previous three- and 10-year periods, and in the second-highest quintile of such universe for the previous five-year period. The Lipper report showed the Fund’s total return for the one-year period to be in the highest performing quintile of its performance universe, and on an annualized basis to also be in the highest performing quintile of such universe for each of the previous three-, five- and 10-year annualized periods. The Board was satisfied with the Fund’s comparative performance as set forth in the Lipper report.
Templeton Growth VIP Fund – The performance universe for this Fund consisted of the Fund and all global large-cap value funds underlying variable insurance products as selected by Lipper. The Lipper report showed the Fund’s total return for the one-year period to be in the lowest or worst performing quintile of such performance universe and on an annualized basis to be in the middle performing quintile of such universe for the previous three-year period, and the second-lowest performing quintile of such universe for the previous five- and 10-year periods. The Board found the Fund’s comparative performance as set forth in the Lipper report to be acceptable, noting that the
| SI-4 | Semiannual Report |
FRANKLIN TEMPLETON VARIABLE INSURANCE PRODUCTS TRUST
SHAREHOLDER INFORMATION
Fund’s performance had been in the highest quintile in three of the previous five one-year periods. They also observed that the Fund’s annualized performance was within 1% of the median for the trailing five-year period.
COMPARATIVE EXPENSES. Consideration was given to expense comparison information contained in the Lipper reports furnished for each Fund, which compared its management fee and total expense ratio with those of a group of other funds selected by Lipper as its appropriate Lipper expense group. Lipper expense data is based upon information taken from each fund’s most recent annual report, which reflects historical asset levels that may be quite different from those currently existing, particularly in a period of market volatility. While recognizing such inherent limitation and the fact that expense ratios generally increase as assets decline and decrease as assets grow, the Board believed the independent analysis conducted by Lipper to be an appropriate measure of comparative expenses. In reviewing comparative costs, Lipper provides information on each Fund’s contractual investment management fee rate in comparison with the contractual investment management fee rate that would have been charged by other funds within its Lipper expense group assuming they were similar in size to the Fund, as well as the actual total expense ratio of the Fund in comparison with those of its Lipper expense group. The Lipper contractual investment management fee analysis includes administrative charges at the fund level as being part of a management fee, and actual total expenses, for comparative consistency, are shown by Lipper for the same class of shares for all funds within a particular Lipper expense group. The results of such comparisons showed that both the contractual investment management fee rates and actual total expense ratios of the following Funds were in the least expensive quintiles of their respective Lipper expense groups: Franklin Small Cap Value VIP Fund, Franklin Growth and Income VIP Fund, Franklin High Income VIP Fund, Franklin Income VIP Fund and Templeton Global Bond VIP Fund. The Board was satisfied with the comparative contractual investment management fees and expenses of these Funds as shown in their Lipper reports. The contractual investment management fee rates and actual total expense ratios of each of Franklin Global Real Estate VIP Fund, Franklin Mutual Global Discovery VIP Fund and Templeton Developing Markets VIP Fund were above the medians of their Lipper expense groups, but in no case by more than 22 basis points. The Board found the comparative contractual investment management fees and expenses of these Funds as shown in their Lipper report to be acceptable. The contractual investment management fee rates of the following
Funds were at or above the median while the actual total expense ratios were in the middle performing quintile: Franklin Flex Cap Growth VIP Fund, Franklin Large Cap Growth VIP Fund and Franklin Mutual Shares VIP Fund. The Board found the comparative expenses of these Funds as shown in the Lipper reports to be acceptable. The contractual investment management fee rates of the following Funds were at or above the median while the actual total expense ratios were below the median: Franklin Small-Mid Cap Growth VIP Fund and Templeton Growth VIP Fund. The Board was satisfied with the comparative expenses of these Funds as shown in the Lipper reports. The contractual investment management fee rates and actual total expense ratios for the following Funds were in the first or second quintiles of their expense groups, meaning they were among the least expensive of their peers: Franklin Strategic Income VIP Fund, Franklin Rising Dividends VIP Fund, Franklin Founding Funds Allocation VIP Fund, Franklin U.S. Government Securities VIP Fund and Templeton Foreign VIP Fund. The Board was satisfied with the comparative expenses of these Funds as shown in the Lipper reports.
MANAGEMENT PROFITABILITY. The Board also considered the level of profits realized by the Manager and its affiliates in connection with the operation of each Fund. In this respect, the Board reviewed the Fund profitability analysis that addresses the overall profitability of Franklin Templeton’s U.S. fund business, as well as its profits in providing management and other services to each of the individual funds during the 12-month period ended September 30, 2014, being the most recent fiscal year-end for Franklin Resources, Inc., the Manager’s parent. In reviewing the analysis, the Board recognized that allocation methodologies are inherently subjective and various allocation methodologies may be reasonable while producing different results. In this respect, the Board noted that while management continually makes refinements to its methodologies in response to organizational and product related changes, the overall approach as defined by the primary drivers and activity measurements has remained consistent with that used in the Fund’s profitability report presentations from prior years. Additionally, the Fund’s independent registered public accounting firm had been engaged by the Manager to periodically review the reasonableness of the allocation methodologies to be used solely by the Funds’ Board in reference to the profitability analysis. In reviewing and discussing such analysis, management discussed with the Board its belief that costs incurred in establishing the infrastructure necessary for the type of mutual fund operations conducted by the Manager and its affiliates may not be fully reflected in the expenses allocated to
| Semiannual Report | SI-5 |
FRANKLIN TEMPLETON VARIABLE INSURANCE PRODUCTS TRUST
SHAREHOLDER INFORMATION
Board Review of Investment Management Agreement (continued)
each Fund in determining its profitability, as well as the fact that the level of profits, to a certain extent, reflected operational cost savings and efficiencies initiated by management. The Board also took into account management’s expenditures in improving services provided the Funds, as well as the need to implement systems to meet additional regulatory and compliance requirements resulting from statutes such as the Sarbanes-Oxley and Dodd-Frank Acts and recent SEC and other regulatory requirements. In addition, the Board considered a third-party study comparing the profitability of the Manager’s parent on an overall basis to other publicly held managers broken down to show profitability from management operations exclusive of distribution expenses, as well as profitability including distribution expenses. The Board also considered the extent to which the Manager and its affiliates might derive ancillary benefits from Fund operations, including potential benefits resulting from personnel, systems enhancements necessitated by fund growth, as well as increased leverage with the service providers and counterparties. Based upon its consideration of all these factors, the Board determined that the level of profits realized by the Manager and its affiliates from providing services to each Fund was not excessive in view of the nature, quality and extent of services provided.
ECONOMIES OF SCALE. The Board also considered whether economies of scale are realized by the Manager as the Funds grow larger and the extent to which this is reflected in the level of management fees charged. While recognizing that any precise determination is inherently subjective, the Board noted that based upon the Fund profitability analysis, it appears that as some funds get larger, at some point economies of scale do result in the Manager realizing a larger profit margin on management services provided such a fund. The Board also noted that economies of scale are shared with a fund and its shareholders through management fee breakpoints so that as a fund grows in size, its effective management fee rate declines. In the case of Franklin Founding Funds Allocation VIP Fund, the management fees of the underlying funds in which it invests have management fee breakpoints that extend beyond their existing asset sizes, and in the case of each of the other Funds, other than Franklin Rising Dividends VIP Fund, their management fees contain breakpoints that extend beyond their existing asset sizes. To the extent economies of scale may be realized by the Manager and its affiliates, the Board believed the schedule of investment management fees provides a sharing of benefits
for each Fund and its shareholders. The investment management structure of Franklin Rising Dividends VIP Fund provides for a fee of 0.750% on the first $500 million of assets; 0.625% on the next $500 million of assets; and 0.500% on assets in excess of $1 billion. This Fund had assets of $1.8 billion at December 31, 2014, and in reviewing its fee structure, management stated its belief that this fee structure reaches a relatively low rate quickly reflecting anticipated economies of scale. In support of such position, management pointed out the favorable management fee and total expense comparisons of this Fund within its Lipper expense group as previously discussed under “Comparative Expenses.” In light of such position and taking into account the fact that the reduced rate on assets in excess of the last breakpoint lowers the Fund’s overall investment management fee rate, the Board believed that the schedule of investment management fees provides a sharing of benefits for the Fund and its shareholders, but intends to monitor future growth and the appropriateness of adding additional breakpoints.
Proxy Voting Policies and Procedures
The Trust’s investment manager has established Proxy Voting Policies and Procedures (Policies) that the Trust uses to determine how to vote proxies relating to portfolio securities. Shareholders may view the Trust’s complete Policies online at franklintempleton.com. Alternatively, shareholders may request copies of the Policies free of charge by calling the Proxy Group collect at (954) 527-7678 or by sending a written request to: Franklin Templeton Companies, LLC, 300 S.E. 2nd Street, Fort Lauderdale, FL 33301, Attention: Proxy Group. Copies of the Trust’s proxy voting records are also made available online at franklintempleton.com and posted on the U.S. Securities and Exchange Commission’s website at sec.gov and reflect the most recent 12-month period ended June 30.
Quarterly Statement of Investments
The Trust files a complete statement of investments with the U.S. Securities and Exchange Commission for the first and third quarters for each fiscal year on Form N-Q. Shareholders may view the filed Form N-Q by visiting the Commission’s website at sec.gov. The filed form may also be viewed and copied at the Commission’s Public Reference Room in Washington, DC. Information regarding the operations of the Public Reference Room may be obtained by calling (800) SEC-0330.
| SI-6 | Semiannual Report |

Semiannual Report
Franklin Templeton
Variable Insurance Products Trust
Investment Managers
Franklin Advisers, Inc.
Franklin Advisory Services, LLC
Franklin Mutual Advisers, LLC
Franklin Templeton Institutional, LLC
Templeton Asset Management Ltd.
Templeton Global Advisors Limited
Templeton Investment Counsel, LLC
Fund Administrator
Franklin Templeton Services, LLC
Distributor
Franklin Templeton Distributors, Inc.
Franklin Templeton Variable Insurance Products Trust (FTVIP) shares are not offered to the public; they are offered and sold only to:
(1) insurance company separate accounts (Separate Account) to serve as the underlying investment vehicle for variable contracts;
(2) certain qualified plans; and (3) other mutual funds (funds of funds).
Authorized for distribution to investors in Separate Accounts only when accompanied or preceded by the current prospectus for the applicable contract, which includes the Separate Account and the FTVIP prospectuses. Investors should carefully consider a fund’s investment goals, risks, charges and expenses before investing. The prospectus contains this and other information; please read it carefully before investing.
To help ensure we provide you with quality service, all calls to and from our service areas are monitored and/or recorded.
| © 2015 Franklin Templeton Investments. All rights reserved. | VIP1 S 08/15 |
| Item 2. | Code of Ethics. |
| (a) | The Registrant has adopted a code of ethics that applies to its principal executive officers and principal financial and accounting officer. |
| (c) | N/A |
| (d) | N/A |
| (f) | Pursuant to Item 12(a)(1), the Registrant is attaching as an exhibit a copy of its code of ethics that applies to its principal executive officers and principal financial and accounting officer. |
| Item 3. | Audit Committee Financial Expert. |
| (a)(1) | The Registrant has an audit committee financial expert serving on its audit committee. |
| (2) | The audit committee financial expert is John B. Wilson and he is “independent” as defined under the relevant Securities and Exchange Commission Rules and Releases. |
| Item 4. | Principal Accountant Fees and Services. N/A |
| Item 5. | Audit Committee of Listed Registrants. N/A |
| Item 6. | Schedule of Investments. N/A |
| Item 7. | Disclosure of Proxy Voting Policies and Procedures for Closed-End Management Investment Companies. N/A |
| Item 8. | Portfolio Managers of Closed-End Management Investment Companies. N/A |
| Item 9. | Purchases of Equity Securities by Closed-End Management Investment Company and Affiliated Purchasers. N/A |
| Item 10. | Submission of Matters to a Vote of Security Holders. |
There have been no changes to the procedures by which shareholders may recommend nominees to the Registrant’s Board of Trustees that would require disclosure herein.
| Item 11. | Controls and Procedures. |
(a) Evaluation of Disclosure Controls and Procedures. The Registrant maintains disclosure controls and procedures that are designed to ensure that information required to be disclosed in the Registrant’s filings under the Securities Exchange Act of 1934 and the Investment Company Act of 1940 is recorded, processed, summarized and reported within the periods specified in the rules and forms of the Securities and Exchange Commission. Such information is accumulated and communicated to the Registrant’s management, including its principal executive officer and principal financial officer, as appropriate, to allow timely decisions regarding required disclosure. The Registrant’s management, including the principal executive officer and the principal financial officer, recognizes that any set of controls and procedures, no matter how well designed and operated, can provide only reasonable assurance of achieving the desired control objectives.
Within 90 days prior to the filing date of this Shareholder Report on Form N-CSR, the Registrant had carried out an evaluation, under the supervision and with the participation of the Registrant’s management, including the Registrant’s principal executive officer and the Registrant’s principal financial officer, of the effectiveness of the design and operation of the Registrant’s disclosure controls and procedures. Based on such evaluation, the Registrant’s principal executive officer and principal financial officer concluded that the Registrant’s disclosure controls and procedures are effective.
(b) Changes in Internal Controls. There have been no changes in the Registrant’s internal controls or in other factors that could materially affect the internal controls over financial reporting subsequent to the date of their evaluation in connection with the preparation of this Shareholder Report on Form N-CSR.
| Item 12. | Exhibits. |
(a)(1) Code of Ethics
(a)(2) Certifications pursuant to Section 302 of the Sarbanes-Oxley Act of 2002 of Laura F. Fergerson, Chief Executive Officer – Finance and Administration, and Gaston Gardey, Chief Financial Officer and Chief Accounting Officer
(b) Certifications pursuant to Section 906 of the Sarbanes-Oxley Act of 2002 of Laura F. Fergerson, Chief Executive Officer – Finance and Administration, and Gaston Gardey, Chief Financial Officer and Chief Accounting Officer
SIGNATURES
Pursuant to the requirements of the Securities Exchange Act of 1934 and the Investment Company Act of 1940, the registrant has duly caused this report to be signed on its behalf by the undersigned, thereunto duly authorized.
Franklin Templeton Variable Insurance Products Trust
| By | /s/ LAURA F. FERGERSON | |
| Laura F. Fergerson | ||
| Chief Executive Officer – | ||
| Finance and Administration |
Date August 27, 2015
Pursuant to the requirements of the Securities Exchange Act of 1934 and the Investment Company Act of 1940, this report has been signed below by the following persons on behalf of the registrant and in the capacities and on the dates indicated.
| By | /s/ LAURA F. FERGERSON | |
| Laura F. Fergerson | ||
| Chief Executive Officer – | ||
| Finance and Administration |
Date August 27, 2015
| By | /s/ GASTON GARDEY | |
| Gaston Gardey | ||
| Chief Financial Officer and | ||
| Chief Accounting Officer |
Date August 27, 2015