UNITED STATES
SECURITIES AND EXCHANGE COMMISSION
Washington, DC 20549
FORM N-CSRS
CERTIFIED SHAREHOLDER REPORT OF REGISTERED
MANAGEMENT INVESTMENT COMPANIES
Investment Company Act file number 811-05583
Franklin Templeton
Variable Insurance Products Trust
(Exact name of registrant as specified in charter)
One Franklin Parkway,
San Mateo, CA 94403-1906
(Address of principal executive offices) (Zip code)
Craig S. Tyle,
One Franklin Parkway,
San Mateo, CA 94403-1906
(Name and address of agent for service)
Registrant’s telephone number, including area code: (650) 312-2000
Date of fiscal year end: 12/31
Date of reporting period: 06/30/16
| Item 1. | Reports to Stockholders. |
 | Semiannual Report June 30, 2016 |
Franklin Templeton
Variable Insurance Products Trust

Franklin Templeton Variable Insurance
Products Trust Semiannual Report
| Table of Contents | ||||
| Important Notes to Performance Information | i | |||
| Fund Summaries | ||||
Franklin Flex Cap Growth VIP Fund | FFC-1 | |||
Franklin Founding Funds Allocation VIP Fund | FFA-1 | |||
Franklin High Income VIP Fund | FH-1 | |||
Franklin Income VIP Fund | FI-1 | |||
Franklin Mutual Global Discovery VIP Fund | MGD-1 | |||
Franklin Mutual Shares VIP Fund | MS-1 | |||
Franklin Rising Dividends VIP Fund | FRD-1 | |||
Franklin Small Cap Value VIP Fund | FSV-1 | |||
*Prospectus Supplement | FSV-6 | |||
Franklin Small-Mid Cap Growth VIP Fund | FSC-1 | |||
Franklin Strategic Income VIP Fund | FSI-1 | |||
Templeton Developing Markets VIP Fund | TD-1 | |||
Templeton Foreign VIP Fund | TF-1 | |||
*Prospectus Supplement | TF-6 | |||
Templeton Global Bond VIP Fund | TGB-1 | |||
Templeton Growth VIP Fund | TG-1 | |||
*Prospectus Supplement | TG-8 | |||
| Index Descriptions | I-1 | |||
| Shareholder Information | SI-1 | |||
*Not part of the semiannual report. Retain for your records.
| Not FDIC Insured | | | May Lose Value | | | No Bank Guarantee |
MASTER CLASS – 4
FRANKLIN TEMPLETON VARIABLE INSURANCE PRODUCTS TRUST
Important Notes to
Performance Information
Performance data is historical and cannot predict or guarantee future results. Principal value and investment return will fluctuate with market conditions, and you may have a gain or loss when you withdraw your money. Inception dates of the funds may have preceded the effective dates of the subaccounts, contracts or their availability in all states.
When reviewing the index comparisons, please keep in mind that indexes have a number of inherent performance differentials over the funds. First, unlike the funds, which must
hold a minimum amount of cash to maintain liquidity, indexes do not have a cash component. Second, the funds are actively managed and, thus, are subject to management fees to cover salaries of securities analysts or portfolio managers in addition to other expenses. Indexes are unmanaged and do not include any commissions or other expenses typically associated with investing in securities. Third, indexes often contain a different mix of securities than the fund to which they are compared. Additionally, please remember that indexes are simply a measure of performance and cannot be invested in directly.
| Semiannual Report | i |
Franklin Flex Cap Growth VIP Fund
This semiannual report for Franklin Flex Cap Growth VIP Fund covers the period ended June 30, 2016.
Class 4 Performance Summary as of June 30, 2016
The Fund’s Class 4 Shares delivered a -5.37% total return* for the six-month period ended June 30, 2016.
*The Fund has an expense reduction contractually guaranteed through at least 4/30/17 and a fee waiver associated with its investments in a Franklin Templeton money fund and/or Franklin Templeton fund, as applicable, contractually guaranteed through at least the Fund’s current fiscal year-end. Fund investment results reflect the expense reduction and fee waiver, to the extent applicable; without these reductions, the results would have been lower.
Performance reflects the Fund’s Class 4 operating expenses, but does not include any contract fees, expenses or sales charges. If they had been included, performance would be lower. These charges and deductions, particularly for variable life policies, can have a significant effect on contract values and insurance benefits. See the contract prospectus for a complete description of these expenses, including sales charges.
Performance data represent past performance, which does not guarantee future results. Investment return and principal value will fluctuate, and you may have a gain or loss when you sell your shares. Current performance may differ from figures shown.
| Semiannual Report | FFC-1 |
FRANKLIN FLEX CAP GROWTH VIP FUND
Fund Goal and Main Investments
The Fund seeks capital appreciation. Under normal market conditions, the Fund invests predominantly in equity securities of companies that the investment manager believes have the potential for capital appreciation.
Fund Risks
All investments involve risks, including possible loss of principal. Growth stock prices reflect projections of future earnings or revenues, and can, therefore, fall dramatically if the company fails to meet those projections. Smaller, midsized and relatively new or unseasoned companies can be particularly sensitive to changing economic conditions, and their prospects for growth are less certain than those of larger, more established companies. Historically, these securities have experienced more price volatility than larger company stocks, especially over the short term. To the extent the Fund focuses on particular countries, regions, industries, sectors or types of investment from time to time, it may be subject to greater risk of adverse developments in such areas of focus than a fund that invests in a wider variety of countries, regions, industries, sectors or investments. Foreign securities involve special risks, including currency fluctuations and economic and political uncertainties. The Fund is actively managed but there is no guarantee that the manager’s investment decisions will produce the desired results. The Fund’s prospectus also includes a description of the main investment risks.
Performance Overview
You can find the Fund’s six-month total return in the Performance Summary. In comparison, the Russell 1000® Growth Index generated a +1.36% total return, the Russell 3000® Growth Index delivered a +1.14% total return, and the Standard & Poor’s® 500 Index (S&P 500®) Index produced a +3.84% total return for the same period.1
Economic and Market Overview
For the six-month period ended June 30, 2016, the U.S. economy grew moderately, as measured by gross domestic product in 2016’s first and second quarters, driven by consumer spending and exports. A decline in private inventory investment and nonresidential fixed investment contributed to the moderation. Although the unemployment rate rose from 4.7% in May to 4.9% in June, the increase was due to additional people
entering the labor force, and for the entire period under review, unemployment declined slightly.2 Home sales and prices rose amid relatively low mortgage rates. Monthly retail sales grew during most of the review period, and rose to the highest level in April in more than a year, due to a broad-based increase across most retail categories. Inflation, as measured by the Consumer Price Index, remained subdued overall even though it spiked to the highest level in three years in April mainly due to a rebound in energy prices.
After raising its target range for the federal funds rate to 0.25%–0.50% at its December meeting, the Federal Reserve (Fed) maintained the rate through period-end. Although the Fed indicated a potential interest rate hike in June, subsequent reports showed job additions slowed substantially in May. Consequently, at its June meeting, the Fed kept the federal funds rate unchanged, and indicated that in determining the timing and size of future adjustments to the target range, it will assess realized and expected economic conditions relative to its objectives of maximum employment and 2.00% inflation. The Fed expects economic conditions to evolve in a manner that could warrant only gradual increases in the federal funds rate.
U.S. equity markets rose for the period under review, as investors generally remained confident due to the Fed’s continued caution surrounding further interest rate increases, the European Central Bank expanding its quantitative easing measures and cutting its benchmark interest rate to zero, the People’s Bank of China introducing further easing measures and the Bank of Japan adopting a negative interest rate policy. The rally in crude oil prices near period-end also boosted investor confidence. However, the U.K.’s historic referendum to leave the European Union, also known as the “Brexit”, global economic growth concerns and China’s slowing economy weighed on market sentiment. Despite periods of volatility, the broad U.S. stock market ended the six-month period higher, as measured by the S&P 500.
Investment Strategy
We use fundamental, bottom-up research to seek companies meeting our criteria of growth potential, quality and valuation. In seeking sustainable growth characteristics, we look for companies we believe can produce sustainable earnings and cash flow growth, evaluating the long-term market opportunity and competitive structure of an industry to target leaders and emerging leaders. We define quality companies as those with
1. Source: Morningstar. One cannot invest directly in an index, and an index is not representative of the Fund’s portfolio. Please see Index Descriptions following the Fund Summaries.
2. Source: Bureau of Labor Statistics.
| FFC-2 | Semiannual Report |
FRANKLIN FLEX CAP GROWTH VIP FUND
strong and improving competitive positions in attractive markets. We also believe important attributes of quality are experienced and talented management teams as well as financial strength reflected in the capital structure, gross and operating margins, free cash flow generation and returns on capital employed. Our valuation analysis includes a range of potential outcomes based on an assessment of multiple scenarios. In assessing value, we consider whether security prices fully reflect the balance of the sustainable growth opportunities relative to business and financial risks.
Manager’s Discussion
For the six-months ended June 30, 2016, some sectors represented in the Fund’s portfolio contributed to absolute performance. Relative to the Russell 3000® Growth Index, stock selection and a slightly favorable overweighted position in energy aided the Fund’s performance. In energy, independent oil and gas company Cabot Oil & Gas performed well over the period due to its low-cost natural gas assets in the Marcellus Shale, which helped the company maintain a strong balance sheet amid lower natural gas prices. The company was also able to raise funds in early 2016, which helped fortify its balance sheet and future pipeline spending in 2017 and beyond. In our analysis, Cabot’s position at the low end of the natural gas cost curve has made it attractive to many investors who believe that the company could potentially weather lower natural gas prices for a longer time and still be able to generate profits at lower price levels, compared with its higher cost peers.
Other key notable contributors to the Fund’s relative performance included HD Supply Holdings, Equinix and Facebook. Shares of construction and industrial products distributor HD Supply Holdings increased during the period as strong U.S. commercial construction markets coupled with market share gains drove relatively high revenue growth. The company experienced a double-digit margin expansion due partly to management direction, debt refinancing and improved cash flows. Data center provider Equinix benefited from the rising adoption of cloud computing technology. The company also acquired data center and colocation center company TelecityGroup, which we believe could provide Equinix with a dominant position in the European market. Social media network Facebook delivered strong fourth quarter 2015 results that exceeded analysts’ expectations. Advertising revenue accelerated based on Facebook’s successful strategy for capitalizing on the consumer shift from personal computers to mobile devices, leading the company to generate a substantial portion of its revenue from mobile advertising. Additionally, the company benefited from a highly engaged user base with strong
data, targeting and measurement capabilities, which prompted advertisers to continue to shift more of their budgets toward Facebook advertising.
Conversely, sectors that detracted from the Fund’s relative performance included an overweighted position in information technology (IT) and stock selection in the IT, financials and health care sectors.3 Within IT, network security solutions
| Semiannual Report | FFC-3 |
FRANKLIN FLEX CAP GROWTH VIP FUND
provider Palo Alto Networks and cloud-based solutions provider ServiceNow hurt the Fund’s performance. Palo Alto Networks experienced difficulties during the period when investors became concerned about slowing product growth. The company appeared to be more focused on selling subscriptions than comparables, which may be attributed to the competitive security space in 2015. ServiceNow struggled near the end of 2015 as the company attempted to reposition itself as a multi-product business. ServiceNow also experienced an elevated sales force turnover in 2015, which negatively impacted billings as the year progressed. We believe these challenges were temporary and that business conditions and management execution will begin to improve.
In the financials sector, the Fund’s positions in commercial bank Signature Bank and financial services provider and bank SVB Financial Group detracted from performance. Although banks were generally impacted by low U.S. interest rates, Signature Bank was relatively less sensitive than other banks during the period, but concerns surrounding slowing growth and the company’s losses in its taxi medallion portfolio weighed on the stock. Moreover, regulatory scrutiny of commercial real estate loans also negatively affected Signature Bank.
Within the health care sector, some holdings that hurt the Fund’s relative performance included biopharmaceutical company Celgene and pharmaceutical firm Allergan. Shares of Celgene declined during the period due primarily to the general decline of the health care sector. Additionally, fundamental catalysts further deterred the company’s performance. Allergan’s shares fell following the termination of its merger with Pfizer after the U.S. government issued new rules related to mergers that could result in the reduction of a company’s tax rate. The cancellation of this deal led to a sell-off in Allergan shares.
Thank you for your participation in Franklin Flex Cap Growth VIP Fund. We look forward to serving your future investment needs.
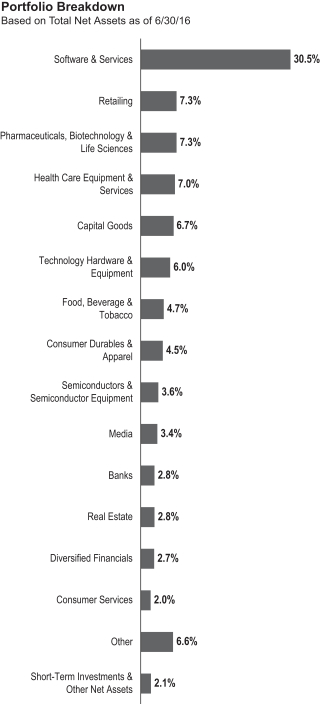
| Top 10 Holdings | ||||
| 6/30/16 | ||||
| Company Sector/Industry | % of Total Net Assets | |||
| Facebook Inc. Software & Services | 4.9% | |||
| Amazon.com Inc. Retailing | 4.0% | |||
| Alphabet Inc. Software & Services | 3.7% | |||
| MasterCard Inc. Software & Services | 3.1% | |||
| Constellation Brands Inc. Food, Beverage & Tobacco | 2.7% | |||
| Celgene Corp. Pharmaceuticals, Biotechnology & Life Sciences | 2.7% | |||
| Fortune Brands Home & Security Inc. Capital Goods | 2.5% | |||
| HD Supply Holdings Inc. Capital Goods | 2.4% | |||
| Apple Inc. Technology Hardware & Equipment | 2.3% | |||
| McKesson Corp. Health Care Equipment & Services | 2.3% | |||
The dollar value, number of shares or principal amount, and names of all portfolio holdings are listed in the Fund’s Statement of Investments (SOI).
The foregoing information reflects our analysis, opinions and portfolio holdings as of June 30, 2016, the end of the reporting period. The way we implement our main investment strategies and the resulting portfolio holdings may change depending on factors such as market and economic conditions. These opinions may not be relied upon as investment advice or an offer for a particular security. The information is not a complete analysis of every aspect of any market, country, industry, security or the Fund. Statements of fact are from sources considered reliable, but the investment manager makes no representation or warranty as to their completeness or accuracy. Although historical performance is no guarantee of future results, these insights may help you understand our investment management philosophy.
3. The IT sector comprises semiconductors and semiconductor equipment, software and services, and technology hardware and equipment in the SOI. The financials sector comprises banks, diversified financials and real estate in the SOI. The health care sector comprises health care equipment and services and pharmaceuticals, biotechnology and life sciences in the SOI.
| FFC-4 | Semiannual Report |
FRANKLIN FLEX CAP GROWTH VIP FUND
Class 4 Fund Expenses
As an investor in a variable insurance contract (Contract) that indirectly provides for investment in an underlying mutual fund, you can incur transaction and/or ongoing expenses at both the Fund level and the Contract level.
| • | Transaction expenses can include sales charges (loads) on purchases, surrender fees, transfer fees and premium taxes. |
| • | Ongoing expenses can include management fees, distribution and service (12b-1) fees, contract fees, annual maintenance fees, mortality and expense risk fees and other fees and expenses. All mutual funds and Contracts have some types of ongoing expenses. |
The expenses shown in the table are meant to highlight ongoing expenses at the Fund level only and do not include ongoing expenses at the Contract level, or transaction expenses at either the Fund or Contract levels. While the Fund does not have transaction expenses, if the transaction and ongoing expenses at the Contract level were included, the expenses shown below would be higher. You should consult your Contract prospectus or disclosure document for more information.
The table shows Fund-level ongoing expenses and can help you understand these expenses and compare them with those of other mutual funds offered through the Contract. The table assumes a $1,000 investment held for the six months indicated. Please refer to the Fund prospectus for additional information on operating expenses.
Actual Fund Expenses
The first line (Actual) of the table provides actual account values and expenses. The “Ending Account Value” is derived from the Fund’s actual return, which includes the effect of ongoing Fund expenses, but does not include the effect of ongoing Contract expenses.
You can estimate the Fund-level expenses you incurred during the period by following these steps. Of course, your account value and expenses will differ from those in this illustration:
| 1. | Divide your account value by $1,000. |
If an account had an $8,600 value, then $8,600 ÷ $1,000 = 8.6.
| 2. | Multiply the result by the number under the heading “Fund-Level Expenses Incurred During Period.” |
If Fund-Level Expenses Incurred During Period were $7.50, then 8.6 × $7.50 = $64.50.
In this illustration, the estimated expenses incurred this period at the Fund level are $64.50.
Hypothetical Example for Comparison with Other Mutual Funds
Information in the second line (Hypothetical) of the table can help you compare ongoing expenses of the Fund with those of other mutual funds offered through the Contract. This information may not be used to estimate the actual ending account balance or expenses you incurred during the period. The hypothetical “Ending Account Value” is based on the Fund’s actual expense ratio and an assumed 5% annual rate of return before expenses, which does not represent the Fund’s actual return. The figure under the heading “Fund-Level Expenses Incurred During Period” shows the hypothetical expenses your account would have incurred under this scenario. You can compare this figure with the 5% hypothetical examples that appear in shareholder reports of other funds offered through a Contract.
| Class 4 | Beginning Account Value 1/1/16 | Ending Account Value 6/30/16 | Fund-Level Expenses 1/1/16–6/30/16 | |||||||||
Actual | $ | 1,000 | $ | 946.30 | $ | 5.13 | ||||||
Hypothetical (5% return before expenses) | $ | 1,000 | $ | 1,019.59 | $ | 5.32 | ||||||
*Expenses are calculated using the most recent six-month annualized expense ratio, net of expense waivers, for the Fund’s Class 4 shares (1.06%), which does not include any ongoing expenses of the Contract for which the Fund is an investment option, multiplied by the average account value over the period, multiplied by 182/366 to reflect the one-half year period.
| Semiannual Report | FFC-5 |
FRANKLIN TEMPLETON VARIABLE INSURANCE PRODUCTS TRUST
Financial Highlights
Franklin Flex Cap Growth VIP Fund
Six Months Ended (unaudited) | Year Ended December 31, | |||||||||||||||||||||||
| 2015 | 2014 | 2013 | 2012 | 2011 | ||||||||||||||||||||
| Class 2 | ||||||||||||||||||||||||
| Per share operating performance (for a share outstanding throughout the period) | ||||||||||||||||||||||||
Net asset value, beginning of period | $7.09 | $16.61 | $18.11 | $13.21 | $12.09 | $12.70 | ||||||||||||||||||
|
| |||||||||||||||||||||||
| Income from investment operationsa: | ||||||||||||||||||||||||
Net investment income (loss)b | (0.02 | ) | (0.06 | ) | (0.08 | ) | (0.01 | ) | 0.01 | (0.02 | ) | |||||||||||||
Net realized and unrealized gains (losses) | (0.36 | ) | 1.00 | 1.09 | 4.95 | 1.11 | (0.59 | ) | ||||||||||||||||
|
| |||||||||||||||||||||||
Total from investment operations | (0.38 | ) | 0.94 | 1.01 | 4.94 | 1.12 | (0.61 | ) | ||||||||||||||||
|
| |||||||||||||||||||||||
| Less distributions from: | ||||||||||||||||||||||||
Net investment income | — | — | — | (— | )c | — | — | |||||||||||||||||
Net realized gains | (0.97 | ) | (10.46 | ) | (2.51 | ) | (0.04 | ) | — | — | ||||||||||||||
|
| |||||||||||||||||||||||
Total distributions | (0.97 | ) | (10.46 | ) | (2.51 | ) | (0.04 | ) | — | — | ||||||||||||||
|
| |||||||||||||||||||||||
Net asset value, end of period | $5.74 | $7.09 | $16.61 | $18.11 | $13.21 | $12.09 | ||||||||||||||||||
|
| |||||||||||||||||||||||
Total returnd | (5.36)% | 4.37% | 6.11% | 37.48% | 9.26% | (4.80 | )% | |||||||||||||||||
| Ratios to average net assetse | ||||||||||||||||||||||||
Expenses before waiver and payments by affiliates | 1.36% | 1.33% | 1.20% | 1.18% | 1.18% | 1.16% | ||||||||||||||||||
Expenses net of waiver and payments by affiliates | 0.96% | 0.96% | 0.95% | 0.93% | 0.93% | 0.93% | ||||||||||||||||||
Net investment income (loss) | (0.50)% | (0.62)% | (0.46)% | (0.09)% | 0.09% | (0.14)% | ||||||||||||||||||
| Supplemental data | ||||||||||||||||||||||||
Net assets, end of period (000’s) | $67,480 | $82,901 | $93,354 | $169,123 | $159,122 | $188,527 | ||||||||||||||||||
Portfolio turnover rate | 9.99% | 88.15% | 52.83% | 52.15% | 43.50% | 63.99% | ||||||||||||||||||
aThe amount shown for a share outstanding throughout the period may not correlate with the Statement of Operations for the period due to the timing of sales and repurchases of the Fund’s shares in relation to income earned and/or fluctuating fair value of the investments of the Fund.
bBased on average daily shares outstanding.
cAmount rounds to less than $0.01 per share.
dTotal return does not include fees, charges or expenses imposed by the variable annuity and life insurance contracts for which Franklin Templeton Variable Insurance Products Trust serves as an underlying investment vehicle. Total return is not annualized for periods less than one year.
eRatios are annualized for periods less than one year.
| FFC-6 | Semiannual Report | The accompanying notes are an integral part of these financial statements. |
FRANKLIN TEMPLETON VARIABLE INSURANCE PRODUCTS TRUST
FINANCIAL HIGHLIGHTS
Franklin Flex Cap Growth VIP Fund (continued)
| Six Months Ended June 30, 2016 (unaudited) | Year Ended December 31, | |||||||||||||||||||||||
| 2015 | 2014 | 2013 | 2012 | 2011 | ||||||||||||||||||||
| Class 4 | ||||||||||||||||||||||||
| Per share operating performance (for a share outstanding throughout the period) | ||||||||||||||||||||||||
Net asset value, beginning of period | $6.90 | $16.44 | $17.96 | $13.12 | $12.01 | $12.63 | ||||||||||||||||||
|
| |||||||||||||||||||||||
| Income from investment operationsa: | ||||||||||||||||||||||||
Net investment income (loss)b | (0.02 | ) | (0.07 | ) | (0.10 | ) | (0.03 | ) | (— | )c | (0.03 | ) | ||||||||||||
Net realized and unrealized gains (losses) | (0.35 | ) | 0.99 | 1.09 | 4.91 | 1.11 | (0.59 | ) | ||||||||||||||||
|
| |||||||||||||||||||||||
Total from investment operations | (0.37 | ) | 0.92 | 0.99 | 4.88 | 1.11 | (0.62 | ) | ||||||||||||||||
|
| |||||||||||||||||||||||
Less distributions from net realized gains | (0.97 | ) | (10.46 | ) | (2.51 | ) | (0.04 | ) | — | — | ||||||||||||||
|
| |||||||||||||||||||||||
Net asset value, end of period | $5.56 | $6.90 | $16.44 | $17.96 | $13.12 | $12.01 | ||||||||||||||||||
|
| |||||||||||||||||||||||
Total returnd | (5.37)% | 4.32% | 5.98% | 37.28% | 9.24% | (4.91)% | ||||||||||||||||||
| Ratios to average net assetse | ||||||||||||||||||||||||
Expenses before waiver and payments by affiliates | 1.46% | 1.43% | 1.30% | 1.28% | 1.28% | 1.26% | ||||||||||||||||||
Expenses net of waiver and payments by affiliates | 1.06% | 1.06% | 1.05% | 1.03% | 1.03% | 1.03% | ||||||||||||||||||
Net investment income (loss) | (0.60)% | (0.72)% | (0.56)% | (0.19)% | (0.01)% | (0.24)% | ||||||||||||||||||
| Supplemental data | ||||||||||||||||||||||||
Net assets, end of period (000’s) | $30,630 | $34,479 | $31,355 | $251,339 | $216,607 | $270,598 | ||||||||||||||||||
Portfolio turnover rate | 9.99% | 88.15% | 52.83% | 52.15% | 43.50% | 63.99% | ||||||||||||||||||
aThe amount shown for a share outstanding throughout the period may not correlate with the Statement of Operations for the period due to the timing of sales and repurchases of the Fund’s shares in relation to income earned and/or fluctuating fair value of the investments of the Fund.
bBased on average daily shares outstanding.
cAmount rounds to less than $0.01 per share.
dTotal return does not include fees, charges or expenses imposed by the variable annuity and life insurance contracts for which Franklin Templeton Variable Insurance Products Trust serves as an underlying investment vehicle. Total return is not annualized for periods less than one year.
eRatios are annualized for periods less than one year.
| The accompanying notes are an integral part of these financial statements. | Semiannual Report | FFC-7 |
FRANKLIN TEMPLETON VARIABLE INSURANCE PRODUCTS TRUST
Statement of Investments, June 30, 2016 (unaudited)
Franklin Flex Cap Growth VIP Fund
| ||||||||||
| Shares | Value | |||||||||
Common Stocks 97.9% | ||||||||||
Automobiles & Components 0.6% | ||||||||||
| a | Tesla Motors Inc. | 2,700 | $ | 573,156 | ||||||
|
| |||||||||
Banks 2.8% | ||||||||||
| a | Signature Bank | 17,000 | 2,123,640 | |||||||
| a | SVB Financial Group | 7,000 | 666,120 | |||||||
|
| |||||||||
| 2,789,760 | ||||||||||
|
| |||||||||
Capital Goods 6.7% | ||||||||||
Fortune Brands Home & Security Inc. | 42,000 | 2,434,740 | ||||||||
| a | HD Supply Holdings Inc. | 67,500 | 2,350,350 | |||||||
Honeywell International Inc. | 7,500 | 872,400 | ||||||||
Roper Technologies Inc. | 5,590 | 953,430 | ||||||||
|
| |||||||||
| 6,610,920 | ||||||||||
|
| |||||||||
Commercial & Professional Services 1.7% | ||||||||||
| a | IHS Inc., A | 9,500 | 1,098,295 | |||||||
| a | Stericycle Inc. | 5,500 | 572,660 | |||||||
|
| |||||||||
| 1,670,955 | ||||||||||
|
| |||||||||
Consumer Durables & Apparel 4.5% | ||||||||||
NIKE Inc., B | 37,000 | 2,042,400 | ||||||||
| a | TRI Pointe Group Inc. | 140,000 | 1,654,800 | |||||||
| a | Under Armour Inc., A | 9,500 | 381,235 | |||||||
| a | Under Armour Inc., C | 9,567 | 348,254 | |||||||
|
| |||||||||
| 4,426,689 | ||||||||||
|
| |||||||||
Consumer Services 2.0% | ||||||||||
Starbucks Corp. | 35,000 | 1,999,200 | ||||||||
|
| |||||||||
Diversified Financials 2.7% | ||||||||||
| a | Affiliated Managers Group Inc. | 6,000 | 844,620 | |||||||
Intercontinental Exchange Inc. | 5,500 | 1,407,780 | ||||||||
| a | PRA Group Inc. | 16,500 | 398,310 | |||||||
|
| |||||||||
| 2,650,710 | ||||||||||
|
| |||||||||
Energy 1.2% | ||||||||||
Cabot Oil & Gas Corp., A | 45,000 | 1,158,300 | ||||||||
|
| |||||||||
Food & Staples Retailing 1.1% | ||||||||||
CVS Health Corp. | 11,000 | 1,053,140 | ||||||||
|
| |||||||||
Food, Beverage & Tobacco 4.7% | ||||||||||
Constellation Brands Inc., A | 16,000 | 2,646,400 | ||||||||
| a | Monster Beverage Corp. | 12,000 | 1,928,520 | |||||||
|
| |||||||||
| 4,574,920 | ||||||||||
|
| |||||||||
Health Care Equipment & Services 7.0% | ||||||||||
| a | Cerner Corp. | 13,500 | 791,100 | |||||||
| a | DexCom Inc. | 7,500 | 594,975 | |||||||
| a | Edwards Lifesciences Corp. | 13,000 | 1,296,490 | |||||||
| a | Envision Healthcare Holdings Inc. | 17,000 | 431,290 | |||||||
McKesson Corp. | 12,000 | 2,239,800 | ||||||||
Medtronic PLC | 11,000 | 954,470 | ||||||||
| a | Nevro Corp. | 7,000 | 516,320 | |||||||
|
| |||||||||
| 6,824,445 | ||||||||||
|
| |||||||||
| FFC-8 | Semiannual Report |
FRANKLIN TEMPLETON VARIABLE INSURANCE PRODUCTS TRUST
STATEMENT OF INVESTMENTS (UNAUDITED)
Franklin Flex Cap Growth VIP Fund (continued)
| Shares | Value | |||||||||
Common Stocks (continued) | ||||||||||
Materials 1.6% | ||||||||||
Ecolab Inc. | 13,500 | $ | 1,601,100 | |||||||
|
| |||||||||
Media 3.4% | ||||||||||
| a | Charter Communications Inc., A | 3,616 | 826,762 | |||||||
| a | Global Eagle Entertainment Inc. | 35,000 | 232,400 | |||||||
| a | IMAX Corp. (Canada) | 15,500 | 456,940 | |||||||
The Walt Disney Co. | 18,500 | 1,809,670 | ||||||||
|
| |||||||||
| 3,325,772 | ||||||||||
|
| |||||||||
Pharmaceuticals, Biotechnology & Life Sciences 7.3% | ||||||||||
| a | Allergan PLC | 3,500 | 808,815 | |||||||
| a | Biogen Inc. | 4,000 | 967,280 | |||||||
Bristol-Myers Squibb Co. | 22,500 | 1,654,875 | ||||||||
| a | Celgene Corp. | 26,500 | 2,613,695 | |||||||
| a | Illumina Inc. | 3,600 | 505,368 | |||||||
| a | Regeneron Pharmaceuticals Inc. | 1,250 | 436,538 | |||||||
| a | Revance Therapeutics Inc. | 11,000 | 149,600 | |||||||
|
| |||||||||
| 7,136,171 | ||||||||||
|
| |||||||||
Real Estate 2.8% | ||||||||||
American Tower Corp. | 10,500 | 1,192,905 | ||||||||
Equinix Inc. | 4,000 | 1,550,920 | ||||||||
|
| |||||||||
| 2,743,825 | ||||||||||
|
| |||||||||
Retailing 7.3% | ||||||||||
Advance Auto Parts Inc. | 4,500 | 727,335 | ||||||||
| a | Amazon.com Inc. | 5,500 | 3,935,910 | |||||||
| a | The Priceline Group Inc. | 1,350 | 1,685,354 | |||||||
Tractor Supply Co. | 8,850 | 806,943 | ||||||||
|
| |||||||||
| 7,155,542 | ||||||||||
|
| |||||||||
Semiconductors & Semiconductor Equipment 3.6% | ||||||||||
| a | Cavium Inc. | 10,000 | 386,000 | |||||||
| a | MACOM Technology Solutions Holdings Inc. | 17,500 | 577,150 | |||||||
| a | Nanometrics Inc. | 17,490 | 363,617 | |||||||
| a | NXP Semiconductors NV (Netherlands) | 28,000 | 2,193,520 | |||||||
|
| |||||||||
| 3,520,287 | ||||||||||
|
| |||||||||
Software & Services 30.5% | ||||||||||
| a | Alphabet Inc., C | 5,250 | 3,633,525 | |||||||
| a | Cognizant Technology Solutions Corp., A | 12,000 | 686,880 | |||||||
| a | CoStar Group Inc. | 5,000 | 1,093,300 | |||||||
| a | Electronic Arts Inc. | 8,000 | 606,080 | |||||||
| a | Ellie Mae Inc. | 6,500 | 595,725 | |||||||
| a | Envestnet Inc. | 9,446 | 314,646 | |||||||
| a | EPAM Systems Inc. | 12,000 | 771,720 | |||||||
| a | Facebook Inc., A | 42,000 | 4,799,760 | |||||||
| a | FleetCor Technologies Inc. | 10,500 | 1,502,865 | |||||||
MasterCard Inc., A | 35,000 | 3,082,100 | ||||||||
Microsoft Corp. | 30,000 | 1,535,100 | ||||||||
| a | Mobileye NV (Israel) | 15,000 | 692,100 | |||||||
| a | Paylocity Holding Corp. | 36,500 | 1,576,800 | |||||||
| a | Salesforce.com Inc. | 27,500 | 2,183,775 | |||||||
| Semiannual Report | FFC-9 |
FRANKLIN TEMPLETON VARIABLE INSURANCE PRODUCTS TRUST
STATEMENT OF INVESTMENTS (UNAUDITED)
Franklin Flex Cap Growth VIP Fund (continued)
| Shares | Value | |||||||||
Common Stocks (continued) | ||||||||||
Software & Services (continued) | ||||||||||
| a | ServiceNow Inc. | 32,500 | $ | 2,158,000 | ||||||
| a | Tyler Technologies Inc. | 11,000 | 1,833,810 | |||||||
Visa Inc., A | 26,500 | 1,965,505 | ||||||||
| a | Zendesk Inc. | 35,000 | 923,300 | |||||||
|
| |||||||||
| 29,954,991 | ||||||||||
|
| |||||||||
Technology Hardware & Equipment 6.0% | ||||||||||
Apple Inc. | 23,500 | 2,246,600 | ||||||||
Harris Corp. | 22,500 | 1,877,400 | ||||||||
| a | Palo Alto Networks Inc. | 14,500 | 1,778,280 | |||||||
|
| |||||||||
| 5,902,280 | ||||||||||
|
| |||||||||
Transportation 0.4% | ||||||||||
| a | Spirit Airlines Inc. | 7,770 | 348,640 | |||||||
|
| |||||||||
Total Common Stocks (Cost $61,669,363) | 96,020,803 | |||||||||
|
| |||||||||
Short Term Investments (Cost $1,348,380) 1.3% | ||||||||||
Money Market Funds 1.3% | ||||||||||
| a,b | Institutional Fiduciary Trust Money Market Portfolio | 1,348,380 | 1,348,380 | |||||||
|
| |||||||||
Total Investments (Cost $63,017,743) 99.2% | 97,369,183 | |||||||||
Other Assets, less Liabilities 0.8% | 740,198 | |||||||||
|
| |||||||||
Net Assets 100.0% | $ | 98,109,381 | ||||||||
|
| |||||||||
aNon-income producing.
bSee Note 3(e) regarding investments in affiliated management investment companies.
| FFC-10 | Semiannual Report | The accompanying notes are an integral part of these financial statements. |
FRANKLIN TEMPLETON VARIABLE INSURANCE PRODUCTS TRUST
Financial Statements
Statement of Assets and Liabilities
June 30, 2016 (unaudited)
| Franklin Flex Cap Growth VIP Fund | ||||
Assets: | ||||
Investments in securities: | ||||
Cost - Unaffiliated issuers | $ | 61,669,363 | ||
Cost - Non-controlled affiliates (Note 3e) | 1,348,380 | |||
|
| |||
Total cost of investments | $ | 63,017,743 | ||
|
| |||
Value - Unaffiliated issuers | $ | 96,020,803 | ||
Value - Non-controlled affiliates (Note 3e) | 1,348,380 | |||
|
| |||
Total value of investments | 97,369,183 | |||
Receivables: | ||||
Investment securities sold | 853,498 | |||
Capital shares sold | 11,666 | |||
Dividends | 28,939 | |||
Other assets | 48 | |||
|
| |||
Total assets | 98,263,334 | |||
|
| |||
Liabilities: | ||||
Payables: | ||||
Capital shares redeemed | 14,481 | |||
Management fees | 48,890 | |||
Distribution fees | 46,494 | |||
Reports to shareholders | 25,226 | |||
Professional fees | 14,828 | |||
Accrued expenses and other liabilities | 4,034 | |||
|
| |||
Total liabilities | 153,953 | |||
|
| |||
Net assets, at value | $ | 98,109,381 | ||
|
| |||
Net assets consist of: | ||||
Paid-in capital | $ | 65,710,929 | ||
Undistributed net investment income (loss) | (265,702 | ) | ||
Net unrealized appreciation (depreciation) | 34,351,440 | |||
Accumulated net realized gain (loss) | (1,687,286 | ) | ||
|
| |||
Net assets, at value | $ | 98,109,381 | ||
|
| |||
| Class 2: | ||||
Net assets, at value | $ | 67,479,655 | ||
|
| |||
Shares outstanding | 11,754,597 | |||
|
| |||
Net asset value and maximum offering price per share | $ | 5.74 | ||
|
| |||
| Class 4: | ||||
Net assets, at value | $ | 30,629,726 | ||
|
| |||
Shares outstanding | 5,511,310 | |||
|
| |||
Net asset value and maximum offering price per share | $ | 5.56 | ||
|
| |||
| The accompanying notes are an integral part of these financial statements. | Semiannual Report | FFC-11 |
FRANKLIN TEMPLETON VARIABLE INSURANCE PRODUCTS TRUST
FINANCIAL STATEMENTS
Statement of Operations
for the six months ended June 30, 2016 (unaudited)
| Franklin Flex Cap Growth VIP Fund | ||||
Investment income: | ||||
Dividends | $ | 229,469 | ||
|
| |||
Expenses: | ||||
Management fees (Note 3a) | 498,735 | |||
Distribution fees: (Note 3c) | ||||
Class 2 | 86,133 | |||
Class 4 | 54,129 | |||
Custodian fees (Note 4) | 577 | |||
Reports to shareholders | 31,437 | |||
Professional fees | 17,934 | |||
Trustees’ fees and expenses | 259 | |||
Other | 2,675 | |||
|
| |||
Total expenses | 691,879 | |||
Expenses waived/paid by affiliates (Note 3e and 3f) | (196,708 | ) | ||
|
| |||
Net expenses | 495,171 | |||
|
| |||
Net investment income (loss) | (265,702 | ) | ||
|
| |||
Realized and unrealized gains (losses): | ||||
Net realized gain (loss) from investments | (1,160,179 | ) | ||
Net change in unrealized appreciation (depreciation) on investments | (4,993,014 | ) | ||
|
| |||
Net realized and unrealized gain (loss) | (6,153,193 | ) | ||
|
| |||
Net increase (decrease) in net assets resulting from operations | $ | (6,418,895 | ) | |
|
| |||
| FFC-12 | Semiannual Report | The accompanying notes are an integral part of these financial statements. |
FRANKLIN TEMPLETON VARIABLE INSURANCE PRODUCTS TRUST
FINANCIAL STATEMENTS
Statements of Changes in Net Assets
| Franklin Flex Cap Growth VIP Fund | ||||||||
| Six Months Ended June 30, 2016 (unaudited) | Year Ended December 31, 2015 | |||||||
Increase (decrease) in net assets: | ||||||||
Operations: | ||||||||
Net investment income (loss) | $ | (265,702 | ) | $ | (797,786 | ) | ||
Net realized gain (loss) | (1,160,179 | ) | 14,700,445 | |||||
Net change in unrealized appreciation (depreciation) | (4,993,014 | ) | (9,006,175 | ) | ||||
|
| |||||||
Net increase (decrease) in net assets resulting from operations | (6,418,895 | ) | 4,896,484 | |||||
|
| |||||||
Distributions to shareholders from: | ||||||||
Net realized gains: | ||||||||
Class 2 | (9,849,775 | ) | (55,457,455 | ) | ||||
Class 4 | (4,640,994 | ) | (20,021,151 | ) | ||||
|
| |||||||
Total distributions to shareholders | (14,490,769 | ) | (75,478,606 | ) | ||||
|
| |||||||
Capital share transactions: (Note 2) | ||||||||
Class 2 | (1,017,135 | ) | 41,392,972 | |||||
Class 4 | 2,656,247 | 21,859,783 | ||||||
|
| |||||||
Total capital share transactions | 1,639,112 | 63,252,755 | ||||||
|
| |||||||
Net increase (decrease) in net assets | (19,270,552 | ) | (7,329,367 | ) | ||||
Net assets: | ||||||||
Beginning of period | 117,379,933 | 124,709,300 | ||||||
|
| |||||||
End of period | $ | 98,109,381 | $ | 117,379,933 | ||||
|
| |||||||
Undistributed net investment income (loss) included in net assets: | ||||||||
End of period | $ | (265,702 | ) | $ | — | |||
|
| |||||||
| The accompanying notes are an integral part of these financial statements. | Semiannual Report | FFC-13 |
FRANKLIN TEMPLETON VARIABLE INSURANCE PRODUCTS TRUST
Notes to Financial Statements (unaudited)
Franklin Flex Cap Growth VIP Fund
1. Organization and Significant Accounting Policies
Franklin Templeton Variable Insurance Products Trust (Trust) is registered under the Investment Company Act of 1940 (1940 Act) as an open-end management investment company, consisting of nineteen separate funds and applies the specialized accounting and reporting guidance in U.S. Generally Accepted Accounting Principles (U.S. GAAP). Franklin Flex Cap Growth VIP Fund (Fund) is included in this report. The financial statements of the remaining funds in the Trust are presented separately. Shares of the Fund are generally sold only to insurance company separate accounts to fund the benefits of variable life insurance policies or variable annuity contracts. At June 30, 2016, 42.21% of the Fund’s shares were held through one insurance company. Investment activities of these insurance company separate accounts could have a material impact on the Fund. The Fund offers two classes of shares: Class 2 and Class 4. Each class of shares differs by its distribution fees, voting rights on matters affecting a single class and its exchange privilege.
The following summarizes the Fund’s significant accounting policies.
a. Financial Instrument Valuation
The Fund’s investments in financial instruments are carried at fair value daily. Fair value is the price that would be received to sell an asset or paid to transfer a liability in an orderly transaction between market participants on the measurement date. The Fund calculates the net asset value (NAV) per share as of 4 p.m. Eastern time each day the New York Stock Exchange (NYSE) is open for trading. Under compliance policies and procedures approved by the Trust’s Board of Trustees (the Board), the Fund’s administrator has responsibility for oversight of valuation, including leading the cross-functional Valuation Committee (VC). The VC provides administration and oversight of the Fund’s valuation policies and procedures, which are approved annually by the Board. Among other things, these procedures allow the Fund to utilize independent pricing services, quotations from securities and financial instrument dealers, and other market sources to determine fair value.
Equity securities listed on an exchange or on the NASDAQ National Market System are valued at the last quoted sale price or the official closing price of the day, respectively. Foreign equity securities are valued as of the close of trading on the foreign stock exchange on which the security is primarily traded or as of 4 p.m. Eastern time whichever is earlier. The value is then converted into its U.S. dollar equivalent at the foreign exchange
rate in effect at 4 p.m. Eastern time on the day that the value of the security is determined. Over-the-counter (OTC) securities are valued within the range of the most recent quoted bid and ask prices. Securities that trade in multiple markets or on multiple exchanges are valued according to the broadest and most representative market. Certain equity securities are valued based upon fundamental characteristics or relationships to similar securities.
Investments in open-end mutual funds are valued at the closing NAV.
The Fund has procedures to determine the fair value of financial instruments for which market prices are not reliable or readily available. Under these procedures, the VC convenes on a regular basis to review such financial instruments and considers a number of factors, including significant unobservable valuation inputs, when arriving at fair value. The VC primarily employs a market-based approach which may use related or comparable assets or liabilities, recent transactions, market multiples, book values, and other relevant information for the investment to determine the fair value of the investment. An income-based valuation approach may also be used in which the anticipated future cash flows of the investment are discounted to calculate fair value. Discounts may also be applied due to the nature or duration of any restrictions on the disposition of the investments. Due to the inherent uncertainty of valuations of such investments, the fair values may differ significantly from the values that would have been used had an active market existed. The VC employs various methods for calibrating these valuation approaches including a regular review of key inputs and assumptions, transactional back-testing or disposition analysis, and reviews of any related market activity.
Trading in securities on foreign securities stock exchanges and OTC markets may be completed before 4 p.m. Eastern time. In addition, trading in certain foreign markets may not take place on every NYSE business day. Occasionally, events occur between the time at which trading in a foreign security is completed and the close of the NYSE that might call into question the reliability of the value of a portfolio security held by the Fund. As a result, differences may arise between the value of the Fund’s portfolio securities as determined at the foreign market close and the latest indications of value at the close of the NYSE. In order to minimize the potential for these differences, the VC monitors price movements following the close of trading in foreign stock markets through a series of country
| FFC-14 | Semiannual Report |
FRANKLIN TEMPLETON VARIABLE INSURANCE PRODUCTS TRUST
NOTES TO FINANCIAL STATEMENTS (UNAUDITED)
Franklin Flex Cap Growth VIP Fund (continued)
specific market proxies (such as baskets of American Depositary Receipts, futures contracts and exchange traded funds). These price movements are measured against established trigger thresholds for each specific market proxy to assist in determining if an event has occurred that may call into question the reliability of the values of the foreign securities held by the Fund. If such an event occurs, the securities may be valued using fair value procedures, which may include the use of independent pricing services.
When the last day of the reporting period is a non-business day, certain foreign markets may be open on those days that the NYSE is closed, which could result in differences between the value of the Fund’s portfolio securities on the last business day and the last calendar day of the reporting period. Any significant security valuation changes due to an open foreign market are adjusted and reflected by the Fund for financial reporting purposes.
b. Income and Deferred Taxes
It is the Fund’s policy to qualify as a regulated investment company under the Internal Revenue Code. The Fund intends to distribute to shareholders substantially all of its taxable income and net realized gains to relieve it from federal income and if applicable, excise taxes. As a result, no provision for U.S. federal income taxes is required.
The Fund may be subject to foreign taxation related to income received, capital gains on the sale of securities and certain foreign currency transactions in the foreign jurisdictions in which it invests. Foreign taxes, if any, are recorded based on the tax regulations and rates that exist in the foreign markets in which the Fund invests. When a capital gain tax is determined to apply, the Fund records an estimated deferred tax liability in an amount that would be payable if the securities were disposed of on the valuation date.
The Fund may recognize an income tax liability related to its uncertain tax positions under U.S. GAAP when the uncertain tax position has a less than 50% probability that it will be sustained upon examination by the tax authorities based on its technical merits. As of June 30, 2016, the Fund has determined that no tax liability is required in its financial statements related to uncertain tax positions for any open tax years (or expected to be taken in future tax years). Open tax years are those that remain subject to examination and are based on each tax jurisdiction’s statute of limitation.
c. Security Transactions, Investment Income, Expenses and Distributions
Security transactions are accounted for on trade date. Realized gains and losses on security transactions are determined on a specific identification basis. Estimated expenses are accrued daily. Dividend income is recorded on the ex-dividend date. Distributions to shareholders are recorded on the ex-dividend date and are determined according to income tax regulations (tax basis). Distributable earnings determined on a tax basis may differ from earnings recorded in accordance with U.S. GAAP. These differences may be permanent or temporary. Permanent differences are reclassified among capital accounts to reflect their tax character. These reclassifications have no impact on net assets or the results of operations. Temporary differences are not reclassified, as they may reverse in subsequent periods.
Common expenses incurred by the Trust are allocated among the Funds based on the ratio of net assets of each Fund to the combined net assets of the Trust. Fund specific expenses are charged directly to the fund that incurred the expense.
Realized and unrealized gains and losses and net investment income, not including class specific expenses, are allocated daily to each class of shares based upon the relative proportion of net assets of each class. Differences in per share distributions, by class, are generally due to differences in class specific expenses.
d. Accounting Estimates
The preparation of financial statements in accordance with U.S. GAAP requires management to make estimates and assumptions that affect the reported amounts of assets and liabilities at the date of the financial statements and the amounts of income and expenses during the reporting period. Actual results could differ from those estimates.
e. Guarantees and Indemnifications
Under the Trust’s organizational documents, its officers and trustees are indemnified by the Trust against certain liabilities arising out of the performance of their duties to the Trust. Additionally, in the normal course of business, the Trust, on behalf of the Fund, enters into contracts with service providers that contain general indemnification clauses. The Trust’s maximum exposure under these arrangements is unknown as this would involve future claims that may be made against the Trust that have not yet occurred. Currently, the Trust expects the risk of loss to be remote.
| Semiannual Report | FFC-15 |
FRANKLIN TEMPLETON VARIABLE INSURANCE PRODUCTS TRUST
NOTES TO FINANCIAL STATEMENTS (UNAUDITED)
Franklin Flex Cap Growth VIP Fund (continued)
2. Shares of Beneficial Interest
At June 30, 2016, there were an unlimited number of shares authorized (without par value). Transactions in the Fund’s shares were as follows:
| Six Months Ended June 30, 2016 | Year Ended December 31, 2015 | |||||||||||||||||||
| Shares | Amount | Shares | Amount | |||||||||||||||||
| Class 2 Shares: | ||||||||||||||||||||
Shares sold | 536,194 | $ | 3,528,082 | 2,700,321 | $ | 22,329,959 | ||||||||||||||
Shares issued in reinvestment of distributions | 1,710,030 | 9,849,775 | 7,659,869 | 55,457,455 | ||||||||||||||||
Shares redeemed | (2,191,158 | ) | (14,394,992 | ) | (4,281,552 | ) | (36,394,442 | ) | ||||||||||||
|
| |||||||||||||||||||
Net increase (decrease) | 55,066 | $ | (1,017,135 | ) | 6,078,638 | $ | 41,392,972 | |||||||||||||
|
| |||||||||||||||||||
| Class 4 Shares: | ||||||||||||||||||||
Shares sold | 392,833 | $ | 2,449,869 | 1,255,219 | $ | 10,687,379 | ||||||||||||||
Shares issued in reinvestment of distributions | 831,719 | 4,640,994 | 2,839,880 | 20,021,151 | ||||||||||||||||
Shares redeemed | (713,550 | ) | (4,434,616 | ) | (1,002,629 | ) | (8,848,747 | ) | ||||||||||||
|
| |||||||||||||||||||
Net increase (decrease) | 511,002 | $ | 2,656,247 | 3,092,470 | $ | 21,859,783 | ||||||||||||||
|
| |||||||||||||||||||
3. Transactions With Affiliates
Franklin Resources, Inc. is the holding company for various subsidiaries that together are referred to as Franklin Templeton Investments. Certain officers and trustees of the Fund are also officers and/or directors of the following subsidiaries:
| Subsidiary | Affiliation | |
Franklin Advisers, Inc. (Advisers) | Investment manager | |
Franklin Templeton Services, LLC (FT Services) | Administrative manager | |
Franklin Templeton Distributors, Inc. (Distributors) | Principal underwriter | |
Franklin Templeton Investor Services, LLC (Investor Services) | Transfer agent |
a. Management Fees
The Fund pays an investment management fee to Advisers based on the average daily net assets of the Fund as follows:
| Annualized Fee Rate | Net Assets | |
1.000% | Up to and including $100 million | |
0.900% | Over $100 million, up to and including $250 million | |
0.850% | Over $250 million, up to and including $10 billion | |
0.800% | Over $10 billion, up to and including $12.5 billion | |
0.775% | Over $12.5 billion, up to and including $15 billion | |
0.750% | In excess of $15 billion |
For the period ended June 30, 2016, the annualized effective investment management fee rate was 0.999% of the Fund’s average daily net assets.
b. Administrative Fees
Under an agreement with Advisers, FT Services provides administrative services to the Fund. The fee is paid by Advisers based on the Fund’s average daily net assets, and is not an additional expense of the Fund.
| FFC-16 | Semiannual Report |
FRANKLIN TEMPLETON VARIABLE INSURANCE PRODUCTS TRUST
NOTES TO FINANCIAL STATEMENTS (UNAUDITED)
Franklin Flex Cap Growth VIP Fund (continued)
c. Distribution Fees
The Board has adopted distribution plans for Class 2 and Class 4 shares pursuant to Rule 12b-1 under the 1940 Act. Under the Fund’s compensation distribution plans, the Fund pays Distributors for costs incurred in connection with the servicing, sale and distribution of the Fund’s shares up to 0.35% per year of its average daily net assets of each class. The Board has agreed to limit the current rate to 0.25% per year for Class 2. The plan year, for purposes of monitoring compliance with the maximum annual plan rates, is February 1 through January 31.
d. Transfer Agent Fees
Investor Services, under terms of an agreement, performs shareholder servicing for the Fund and is not paid by the Fund for the services.
e. Investments in Affiliated Management Investment Companies
The Fund invests in one or more affiliated management investment companies for purposes other than exercising a controlling influence over the management or policies. Management fees paid by the Fund are waived on assets invested in the affiliated management investment companies, as noted in the Statement of Operations, in an amount not to exceed the management and administrative fees paid directly or indirectly by each affiliate. Prior to January 1, 2014, the waiver was accounted for as a reduction to management fees.
| Number of Shares Held at Beginning of Period | Gross Additions | Gross Reductions | Number of Shares Held at End of Period | Value at End of Period | Investment Income | Realized Gain (Loss) | % of Affiliated Fund Shares Outstanding Held at End of Period | |||||||||||||||||||||||
| Non-Controlled Affiliates | ||||||||||||||||||||||||||||||
Institutional Fiduciary Trust Money Market Portfolio | — | 15,510,802 | (14,162,422 | ) | 1,348,380 | $ | 1,348,380 | $ | — | $ | — | —% | a | |||||||||||||||||
|
| |||||||||||||||||||||||||||||
aRounds to less than 0.1%.
f. Waiver and Expense Reimbursements
Advisers has contractually agreed in advance to waive or limit its fees and to assume as its own expense certain expenses otherwise payable by the Fund so that the expenses (excluding distribution fees, and acquired fund fees and expenses) for Class 2 and Class 4 of the Fund do not exceed 0.71%, based on the average net assets of each class (other than certain non-routine expenses or costs, including those relating to litigation, indemnification, reorganizations, and liquidations) until April 30, 2017. Total expenses waived or paid are not subject to recapture subsequent to the Fund’s fiscal year end.
4. Expense Offset Arrangement
The Fund has entered into an arrangement with its custodian whereby credits realized as a result of uninvested cash balances are used to reduce a portion of the Fund’s custodian expenses. During the period ended June 30, 2016, there were no credits earned.
5. Income Taxes
At June 30, 2016, the cost of investments and net unrealized appreciation (depreciation) for income tax purposes were as follows:
Cost of investments | $ | 63,634,091 | ||
|
| |||
Unrealized appreciation | $ | 35,844,032 | ||
Unrealized depreciation | (2,108,940 | ) | ||
|
| |||
Net unrealized appreciation (depreciation) | $ | 33,735,092 | ||
|
|
| Semiannual Report | FFC-17 |
FRANKLIN TEMPLETON VARIABLE INSURANCE PRODUCTS TRUST
NOTES TO FINANCIAL STATEMENTS (UNAUDITED)
Franklin Flex Cap Growth VIP Fund (continued)
5. Income Taxes (continued)
Differences between income and/or capital gains as determined on a book basis and a tax basis are primarily due to differing treatment of wash sales.
6. Investment Transactions
Purchases and sales of investments (excluding short term securities) for the period ended June 30, 2016, aggregated $10,097,996 and $23,199,511, respectively.
7. Credit Facility
The Fund, together with other U.S. registered and foreign investment funds (collectively, Borrowers), managed by Franklin Templeton Investments, are borrowers in a joint syndicated senior unsecured credit facility totaling $2 billion (Global Credit Facility) which matures on February 10, 2017. This Global Credit Facility provides a source of funds to the Borrowers for temporary and emergency purposes, including the ability to meet future unanticipated or unusually large redemption requests.
Under the terms of the Global Credit Facility, the Fund shall, in addition to interest charged on any borrowings made by the Fund and other costs incurred by the Fund, pay its share of fees and expenses incurred in connection with the implementation and maintenance of the Global Credit Facility, based upon its relative share of the aggregate net assets of all of the Borrowers, including an annual commitment fee of 0.07% based upon the unused portion of the Global Credit Facility. Effective February 12, 2016, the annual commitment fee is 0.15%. These fees are reflected in other expenses in the Statement of Operations. During the period ended June 30, 2016, the Fund did not use the Global Credit Facility.
8. Fair Value Measurements
The Fund follows a fair value hierarchy that distinguishes between market data obtained from independent sources (observable inputs) and the Fund’s own market assumptions (unobservable inputs). These inputs are used in determining the value of the Fund’s financial instruments and are summarized in the following fair value hierarchy:
| • | Level 1 – quoted prices in active markets for identical financial instruments |
| • | Level 2 – other significant observable inputs (including quoted prices for similar financial instruments, interest rates, prepayment speed, credit risk, etc.) |
| • | Level 3 – significant unobservable inputs (including the Fund’s own assumptions in determining the fair value of financial instruments) |
The input levels are not necessarily an indication of the risk or liquidity associated with financial instruments at that level.
For movements between the levels within the fair value hierarchy, the Fund has adopted a policy of recognizing the transfers as of the date of the underlying event which caused the movement.
At June 30, 2016, all of the Fund’s investments in financial instruments carried at fair value were valued using Level 1 inputs. For detailed categories, see the accompanying Statement of Investments.
9. Subsequent Events
The Fund has evaluated subsequent events through the issuance of the financial statements and determined that no events have occurred that require disclosure.
| FFC-18 | Semiannual Report |
Franklin Founding Funds Allocation VIP Fund
This semiannual report for Franklin Founding Funds Allocation VIP Fund covers the period ended June 30, 2016.
Class 4 Performance Summary as of June 30, 2016
The Fund’s Class 4 shares delivered a +2.11% total return* for the six-month period ended June 30, 2016.
*The Fund has an expense reduction contractually guaranteed through at least 4/30/17. Fund investment results reflect the expense reduction, to the extent applicable; without this reduction, the results would have been lower.
Performance reflects the Fund’s Class 4 operating expenses, but does not include any contract fees, expenses or sales charges. If they had been included, performance would be lower. These charges and deductions, particularly for variable life policies, can have a significant effect on contract values and insurance benefits. See the contract prospectus for a complete description of these expenses, including sales charges.
Performance data represent past performance, which does not guarantee future results. Investment return and principal value will fluctuate, and you may have a gain or loss when you sell your shares. Current performance may differ from figures shown.
| Semiannual Report | FFA-1 |
FRANKLIN FOUNDING FUNDS ALLOCATION VIP FUND
Fund Goals and Main Investments
The Fund seeks capital appreciation, with income as a secondary goal. Under normal market conditions, the Fund invests equal portions in Class 1 shares of Franklin Income VIP Fund, Franklin Mutual Shares VIP Fund and Templeton Growth VIP Fund.
Fund Risks
All investments involve risks, including possible loss of principal. Because the Fund invests in underlying funds that may engage in a variety of investment strategies involving certain risks, the Fund may be subject to these same risks. Stock prices fluctuate, sometimes rapidly and dramatically, due to factors affecting individual companies, particular industries or sectors, or general market conditions. Bonds are affected by changes in interest rates and the creditworthiness of their issuers. Bond prices generally move in the opposite direction of interest rates. Thus, as prices of bonds adjust to a rise in interest rates, the Fund’s share price may decline. Higher yielding, lower rated corporate bonds entail a greater degree of credit risk compared to investment-grade securities. Foreign investing carries additional risks such as currency and market volatility and political or social instability, risks that are heightened in developing countries. Value securities may not increase in price as anticipated or may decline further in value. The Fund’s prospectus also includes a description of the main investment risks.
Performance Overview
You can find the Fund’s six-month total return in the Performance Summary. In comparison, the Standard & Poor’s® 500 Index (S&P 500®) generated a +3.84% total return and the MSCI World Index produced a +1.02% total return for the same period.1
Economic and Market Overview
The global economy expanded during the six months under review. An improvement in commodity prices including a rally in crude oil prices, accommodative monetary policy from various global central banks, finalization of the new debt deal for Greece and encouraging Chinese trade data toward period-end boosted market sentiment. However, global equity market volatility increased after the U.S. Federal Reserve’s (Fed’s) June decision to keep its federal funds target range unchanged, while providing a cautious stance on further interest rate hikes. In addition, global economic concerns and the U.K.’s historic
referendum to leave the European Union (EU), also known as the “Brexit,” contributed to volatile global stock markets.
Oil prices fell at the beginning of the review period, largely due to strong global supply, but recovered in the period’s second half amid oilfield outages and continued demand growth. Meanwhile, commodity prices increased for most of the review period as oversupply for a host of commodities shrank and the market appeared to be on the path of rebalancing after hitting a glut-induced bottom earlier in the year. Gold prices continued to rise following the Brexit referendum as some investors turned to safe haven investing. The U.S. dollar generally depreciated against most currencies during the period, which increased returns of many foreign assets in U.S. dollar terms. In this environment, global developed market stocks overall, as measured by the MSCI World Index, rose slightly during the period.
The U.S. economy grew moderately, as measured by gross domestic product (GDP) in 2016’s first and second quarters, driven by consumer spending and exports. A decline in private inventory investment and nonresidential fixed investment contributed to the moderation. The Fed maintained its target interest rate during the review period after raising it for the first time in nine years at its December meeting. The Fed kept its target rate unchanged in its June meeting mainly due to a substantial slowdown in job additions toward period-end. The Fed expects economic conditions to evolve in a manner that could warrant only gradual increases in the federal funds rate.
In Europe, slower U.K. economic growth continued in 2016’s first quarter as output slowed in construction, production and agriculture. Immediate effects of the Brexit materialized as U.K. stocks significantly declined and the pound sterling hit a three-decade low amid intensified selling. Credit rating agencies Standard & Poor’s and Fitch also downgraded the U.K.’s credit rating. In the eurozone, despite investors’ concerns about banking sector weakness, low corporate earnings and post-Brexit political repercussions, some regions benefited due to rising consumer spending resulting from a cheaper euro, low inflation and signs of sustained economic growth. The eurozone’s annual inflation rate remained in negative territory for most of the review period; however, it rose marginally above zero in June.
Japan’s economy posted mixed results, contracting in 2015’s fourth quarter stemming from declining private and household consumption. However, the economy expanded during 2016’s first quarter as private consumption increased and business investment decreased less than initially believed. The Bank of
1. Source: Morningstar. One cannot invest directly in an index, and an index is not representative of the Fund’s portfolio. Please see Index Descriptions following the Fund Summaries.
| FFA-2 | Semiannual Report |
FRANKLIN FOUNDING FUNDS ALLOCATION VIP FUND
Japan (BOJ) took several actions during the review period. In January, to boost lending and support inflation, the BOJ introduced a negative interest rate on excess reserves held at the central bank by financial institutions. In April, the BOJ further reduced its GDP and inflation forecasts for fiscal year 2016, and decided against additional quantitative easing measures. However, after the U.K.’s vote in June to leave the EU, the BOJ hinted at carrying out flexible open market operations to stabilize its financial markets.
In emerging markets, economic growth generally moderated during the review period. Brazil’s economy witnessed its longest recession since the 1930s amid political and economic turmoil, while Russia’s economy continued to contract. The Bank of Russia reduced its key interest rate in an attempt to revive its economy. China’s economic growth slowed marginally in 2016’s first quarter compared to the previous quarter, but remained largely in line with the government’s target. The People’s Bank of China cut its cash reserve requirement ratio for the country’s banks and effectively devalued the renminbi against the U.S. dollar to the lowest level in more than five years. Overall, emerging market stocks, as measured by the MSCI Emerging Markets Index, rose for the six-month period.2
Investment Strategy
The Fund normally invests its assets in an equally weighted combination of Class 1 shares of Franklin Income VIP Fund, Franklin Mutual Shares VIP Fund and Templeton Growth VIP Fund. These underlying funds, in turn, invest in a variety of U.S. and foreign equity securities and, to a lesser extent, fixed income and money market securities. As market conditions affect the underlying funds, we rebalance the Fund’s allocations seeking to maintain equal weightings of approximately 33 1⁄3% of total net assets in each underlying fund whenever the actual allocations exceed plus or minus 3% of the fixed allocation percentages.
Manager’s Discussion
The Fund’s performance can be attributed largely to its allocation among the underlying funds and their investments in domestic and foreign equities, fixed income securities, and short-term investments and other net assets.
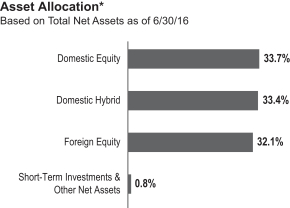
*The asset allocation is based on the Statement of Investments (SOI), which classifies each underlying fund into a broad asset class.
The dollar value, number of shares or principal amount, and names of all portfolio holdings are listed in the Fund’s SOI.
During the six months under review, Franklin Income VIP Fund – Class 1 and Franklin Mutual Shares VIP Fund – Class 1 outperformed the S&P 500. Templeton Growth VIP Fund – Class 1 underperformed the MSCI World Index.
Thank you for your participation in Franklin Founding Funds Allocation VIP Fund. We look forward to serving your future investment needs.
The foregoing information reflects our analysis, opinions and portfolio holdings as of June 30, 2016, the end of the reporting period. The way we implement our main investment strategies and the resulting portfolio holdings may change depending on factors such as market and economic conditions. These opinions may not be relied upon as investment advice or an offer for a particular security. The information is not a complete analysis of every aspect of any market, country, industry, security or the Fund. Statements of fact are from sources considered reliable, but the investment manager makes no representation or warranty as to their completeness or accuracy. Although historical performance is no guarantee of future results, these insights may help you understand our investment management philosophy.
2. Please see Index Descriptions following the Fund Summaries.
| Semiannual Report | FFA-3 |
FRANKLIN FOUNDING FUNDS ALLOCATION VIP FUND
Class 4 Fund Expenses
As an investor in a variable insurance contract (Contract) that indirectly provides for investment in an underlying mutual fund, you can incur transaction and/or ongoing expenses at both the Fund level and the Contract level.
| • | Transaction expenses can include sales charges (loads) on purchases, surrender fees, transfer fees and premium taxes. |
| • | Ongoing expenses can include management fees, distribution and service (12b-1) fees, contract fees, annual maintenance fees, mortality and expense risk fees and other fees and expenses. All mutual funds and Contracts have some types of ongoing expenses. |
The expenses shown in the table are meant to highlight ongoing expenses at the Fund level only and do not include ongoing expenses at the Contract level, or transaction expenses at either the Fund or Contract levels. While the Fund does not have transaction expenses, if the transaction and ongoing expenses at the Contract level were included, the expenses shown below would be higher. You should consult your Contract prospectus or disclosure document for more information.
The table shows Fund-level ongoing expenses and can help you understand these expenses and compare them with those of other mutual funds offered through the Contract. The table assumes a $1,000 investment held for the six months indicated. Please refer to the Fund prospectus for additional information on operating expenses.
Actual Fund Expenses
The first line (Actual) of the table provides actual account values and expenses. The “Ending Account Value” is derived from the Fund’s actual return, which includes the effect of ongoing Fund expenses, but does not include the effect of ongoing Contract expenses.
You can estimate the Fund-level expenses you incurred during the period by following these steps. Of course, your account value and expenses will differ from those in this illustration:
| 1. | Divide your account value by $1,000. |
If an account had an $8,600 value, then $8,600 ÷ $1,000 = 8.6.
| 2. | Multiply the result by the number under the heading “Fund-Level Expenses Incurred During Period.” |
If Fund-Level Expenses Incurred During Period were $7.50, then 8.6 × $7.50 = $64.50.
In this illustration, the estimated expenses incurred this period at the Fund level are $64.50.
Hypothetical Example for Comparison with Other Mutual Funds
Information in the second line (Hypothetical) of the table can help you compare ongoing expenses of the Fund with those of other mutual funds offered through the Contract. This information may not be used to estimate the actual ending account balance or expenses you incurred during the period. The hypothetical “Ending Account Value” is based on the Fund’s actual expense ratio and an assumed 5% annual rate of return before expenses, which does not represent the Fund’s actual return. The figure under the heading “Fund-Level Expenses Incurred During Period” shows the hypothetical expenses your account would have incurred under this scenario. You can compare this figure with the 5% hypothetical examples that appear in shareholder reports of other funds offered through a Contract.
| Class 4 | Beginning Account Value 1/1/16 | Ending Account Value 6/30/16 | Expenses Paid 1/1/16–6/30/16 | Expenses Paid 1/1/16–6/30/16 | ||||||||||||
Actual | $ | 1,000 | $ | 1,021.10 | $ | 2.26 | $ | 5.58 | ||||||||
Hypothetical (5% return before expenses) | $ | 1,000 | $ | 1,022.58 | $ | 2.26 | $ | 5.57 | ||||||||
*Expenses are calculated using the most recent six-month annualized expense ratio excluding expenses of the underlying funds, net of expense waivers, for the Fund’s Class 4 shares (0.45%), which does not include any ongoing expenses of the Contract for which the Fund is an investment option, multiplied by the average account value over the period, multiplied by 182/366 to reflect the one-half year period.
**Expenses are calculated using the most recent six-month annualized expense ratio including expenses of the underlying funds, net of expense waivers, for the Fund’s Class 4 shares (1.11%), which does not include any ongoing expenses of the Contract for which the Fund is an investment option, multiplied by the average account value over the period, multiplied by 182/366 to reflect the one-half year period.
| FFA-4 | Semiannual Report |
FRANKLIN TEMPLETON VARIABLE INSURANCE PRODUCTS TRUST
Financial Highlights
Franklin Founding Funds Allocation VIP Fund
Six Months Ended (unaudited) | Year Ended December 31, | |||||||||||||||||||||||
| 2015 | 2014 | 2013 | 2012 | 2011 | ||||||||||||||||||||
| Class 1 | ||||||||||||||||||||||||
Per share operating performance (for a share outstanding throughout the period) | ||||||||||||||||||||||||
Net asset value, beginning of period | $6.80 | $7.47 | $7.47 | $8.55 | $7.63 | $7.73 | ||||||||||||||||||
|
| |||||||||||||||||||||||
| Income from investment operationsa: | ||||||||||||||||||||||||
Net investment incomeb,c | 0.16 | 0.26 | 0.22 | 0.30 | 0.26 | 0.25 | ||||||||||||||||||
Net realized and unrealized gains (losses) | (0.01 | ) | (0.68 | ) | 0.02 | 1.42 | 0.90 | (0.35 | ) | |||||||||||||||
|
| |||||||||||||||||||||||
Total from investment operations | 0.15 | (0.42 | ) | 0.24 | 1.72 | 1.16 | (0.10 | ) | ||||||||||||||||
|
| |||||||||||||||||||||||
| Less distributions from: | ||||||||||||||||||||||||
Net investment income | (0.29 | ) | (0.24 | ) | (0.23 | ) | (1.15 | ) | (0.24 | ) | (— | )d | ||||||||||||
Net realized gains | (0.23 | ) | (0.01 | ) | (0.01 | ) | (1.65 | ) | — | — | ||||||||||||||
|
| |||||||||||||||||||||||
Total distributions | (0.52 | ) | (0.25 | ) | (0.24 | ) | (2.80 | ) | (0.24 | ) | (— | )d | ||||||||||||
|
| |||||||||||||||||||||||
Net asset value, end of period | $6.43 | $6.80 | $7.47 | $7.47 | $8.55 | $7.63 | ||||||||||||||||||
|
| |||||||||||||||||||||||
Total returne | 2.29% | (5.93)% | 3.05% | 24.14% | 15.56% | (1.28)% | ||||||||||||||||||
| Ratios to average net assetsf | ||||||||||||||||||||||||
Expenses before waiver and payments by affiliatesg | 0.12% | 0.11% | 0.11% | 0.11% | 0.11% | 0.11% | ||||||||||||||||||
Expenses net of waiver and payments by affiliatesg | 0.10% | 0.10% | 0.10% | 0.10% | 0.10% | 0.10% | ||||||||||||||||||
Net investment incomec | 4.90% | 3.51% | 2.88% | 3.67% | 4.06% | 3.44% | ||||||||||||||||||
| Supplemental data | ||||||||||||||||||||||||
Net assets, end of period (000’s) | $1,035 | $1,083 | $1,114 | $952 | $767 | $470 | ||||||||||||||||||
Portfolio turnover rate | 0.10% | 0.26% | 4.80% | 3.91% | 28.46% | h | 58.42% | |||||||||||||||||
aThe amount shown for a share outstanding throughout the period may not correlate with the Statement of Operations for the period due to the timing of sales and repurchases of the Fund’s shares in relation to income earned and/or fluctuating fair value of the investments of the Fund.
bBased on average daily shares outstanding.
cRecognition of net investment income by the Fund is affected by the timing of declaration of dividends by the Underlying Funds in which the Fund invests.
dAmount rounds to less than $0.01 per share.
eTotal return does not include fees, charges or expenses imposed by the variable annuity and life insurance contracts for which Franklin Templeton Variable Insurance Products Trust serves as an underlying investment vehicle. Total return is not annualized for periods less than one year.
fRatios are annualized for periods less than one year.
gDoes not include expenses of the Underlying Funds in which the Fund invests. The weighted average indirect expenses of the Underlying Funds was 0.66% for the period ended June 30, 2016.
hExcludes the value of portfolio securities delivered as a result of a redemption in-kind.
| The accompanying notes are an integral part of these financial statements. | Semiannual Report | FFA-5 |
FRANKLIN TEMPLETON VARIABLE INSURANCE PRODUCTS TRUST
FINANCIAL HIGHLIGHTS
Franklin Founding Funds Allocation VIP Fund (continued)
| Six Months Ended June 30, 2016 (unaudited) | Year Ended December 31, | |||||||||||||||||||||||
| 2015 | 2014 | 2013 | 2012 | 2011 | ||||||||||||||||||||
| Class 2 | ||||||||||||||||||||||||
| Per share operating performance (for a share outstanding throughout the period) | ||||||||||||||||||||||||
Net asset value, beginning of period | $6.75 | $7.42 | $7.42 | $8.51 | $7.59 | $7.71 | ||||||||||||||||||
|
| |||||||||||||||||||||||
| Income from investment operationsa: | ||||||||||||||||||||||||
Net investment incomeb,c | 0.15 | 0.24 | 0.20 | 0.27 | 0.25 | 0.23 | ||||||||||||||||||
Net realized and unrealized gains (losses) | (— | )d | (0.68 | ) | 0.02 | 1.42 | 0.89 | (0.35 | ) | |||||||||||||||
|
| |||||||||||||||||||||||
Total from investment operations | 0.15 | (0.44 | ) | 0.22 | 1.69 | 1.14 | (0.12 | ) | ||||||||||||||||
|
| |||||||||||||||||||||||
| Less distributions from: | ||||||||||||||||||||||||
Net investment income | (0.27 | ) | (0.22 | ) | (0.21 | ) | (1.13 | ) | (0.22 | ) | (— | )d | ||||||||||||
Net realized gains | (0.23 | ) | (0.01 | ) | (0.01 | ) | (1.65 | ) | — | — | ||||||||||||||
|
| |||||||||||||||||||||||
Total distributions | (0.50 | ) | (0.23 | ) | (0.22 | ) | (2.78 | ) | (0.22 | ) | (— | )d | ||||||||||||
|
| |||||||||||||||||||||||
Net asset value, end of period | $6.40 | $6.75 | $7.42 | $7.42 | $8.51 | $7.59 | ||||||||||||||||||
|
| |||||||||||||||||||||||
Total returne | 2.31% | (6.21)% | 2.85% | 23.77% | 15.33% | (1.54)% | ||||||||||||||||||
| Ratios to average net assetsf | ||||||||||||||||||||||||
Expenses before waiver and payments by affiliatesg | 0.37% | 0.36% | 0.36% | 0.36% | 0.36% | 0.36% | ||||||||||||||||||
Expenses net of waiver and payments by affiliatesg | 0.35% | 0.35% | 0.35% | 0.35% | 0.35% | 0.35% | ||||||||||||||||||
Net investment incomec | 4.65% | 3.26% | 2.63% | 3.42% | 3.81% | 3.19% | ||||||||||||||||||
| Supplemental data | ||||||||||||||||||||||||
Net assets, end of period (000’s) | $462,197 | $480,715 | $557,704 | $547,506 | $472,686 | $448,101 | ||||||||||||||||||
Portfolio turnover rate | 0.10% | 0.26% | 4.80% | 3.91% | 28.46% | h | 58.42% | |||||||||||||||||
aThe amount shown for a share outstanding throughout the period may not correlate with the Statement of Operations for the period due to the timing of sales and repurchases of the Fund’s shares in relation to income earned and/or fluctuating fair value of the investments of the Fund.
bBased on average daily shares outstanding.
cRecognition of net investment income by the Fund is affected by the timing of declaration of dividends by the Underlying Funds in which the Fund invests.
dAmount rounds to less than $0.01 per share.
eTotal return does not include fees, charges or expenses imposed by the variable annuity and life insurance contracts for which Franklin Templeton Variable Insurance Products Trust serves as an underlying investment vehicle. Total return is not annualized for periods less than one year.
fRatios are annualized for periods less than one year.
gDoes not include expenses of the Underlying Funds in which the Fund invests. The weighted average indirect expenses of the Underlying Funds was 0.66% for the period ended June 30, 2016.
hExcludes the value of portfolio securities delivered as a result of a redemption in-kind.
| FFA-6 | Semiannual Report | The accompanying notes are an integral part of these financial statements. |
FRANKLIN TEMPLETON VARIABLE INSURANCE PRODUCTS TRUST
FINANCIAL HIGHLIGHTS
Franklin Founding Funds Allocation VIP Fund (continued)
| Six Months Ended June 30, 2016 (unaudited) | Year Ended December 31, | |||||||||||||||||||||||
| 2015 | 2014 | 2013 | 2012 | 2011 | ||||||||||||||||||||
| Class 4 | ||||||||||||||||||||||||
| Per share operating performance (for a share outstanding throughout the period) | ||||||||||||||||||||||||
Net asset value, beginning of period | $6.87 | $7.54 | $7.54 | $8.49 | $7.58 | $7.71 | ||||||||||||||||||
|
| |||||||||||||||||||||||
| Income from investment operationsa: | ||||||||||||||||||||||||
Net investment incomeb,c | 0.15 | 0.23 | 0.20 | 0.26 | 0.30 | 0.24 | ||||||||||||||||||
Net realized and unrealized gains (losses) | (0.01 | ) | (0.68 | ) | 0.02 | 1.43 | 0.83 | (0.37 | ) | |||||||||||||||
|
| |||||||||||||||||||||||
Total from investment operations | 0.14 | (0.45 | ) | 0.22 | 1.69 | 1.13 | (0.13 | ) | ||||||||||||||||
|
| |||||||||||||||||||||||
| Less distributions from: | ||||||||||||||||||||||||
Net investment income | (0.26 | ) | (0.21 | ) | (0.21 | ) | (0.99 | ) | (0.22 | ) | (— | )d | ||||||||||||
Net realized gains | (0.23 | ) | (0.01 | ) | (0.01 | ) | (1.65 | ) | — | — | ||||||||||||||
|
| |||||||||||||||||||||||
Total distributions | (0.49 | ) | (0.22 | ) | (0.22 | ) | (2.64 | ) | (0.22 | ) | (— | )d | ||||||||||||
|
| |||||||||||||||||||||||
Net asset value, end of period | $6.52 | $6.87 | $7.54 | $7.54 | $8.49 | $7.58 | ||||||||||||||||||
|
| |||||||||||||||||||||||
Total returne | 2.11% | (6.24)% | 2.75% | 23.68% | 15.17% | (1.67)% | ||||||||||||||||||
| Ratios to average net assetsf | ||||||||||||||||||||||||
Expenses before waiver and payments by affiliatesg | 0.47% | 0.46% | 0.46% | 0.46% | 0.46% | 0.46% | ||||||||||||||||||
Expenses net of waiver and payments by affiliatesg | 0.45% | 0.45% | 0.45% | 0.45% | 0.45% | 0.45% | ||||||||||||||||||
Net investment incomec | 4.55% | 3.16% | 2.53% | 3.32% | 3.71% | 3.09% | ||||||||||||||||||
| Supplemental data | ||||||||||||||||||||||||
Net assets, end of period (000’s) | $518,950 | $550,825 | $702,324 | $676,781 | $493,813 | $2,860,928 | ||||||||||||||||||
Portfolio turnover rate | 0.10% | 0.26% | 4.80% | 3.91% | 28.46% | h | 58.42% | |||||||||||||||||
aThe amount shown for a share outstanding throughout the period may not correlate with the Statement of Operations for the period due to the timing of sales and repurchases of the Fund’s shares in relation to income earned and/or fluctuating fair value of the investments of the Fund.
bBased on average daily shares outstanding.
cRecognition of net investment income by the Fund is affected by the timing of declaration of dividends by the Underlying Funds in which the Fund invests.
dAmount rounds to less than $0.01 per share.
eTotal return does not include fees, charges or expenses imposed by the variable annuity and life insurance contracts for which Franklin Templeton Variable Insurance Products Trust serves as an underlying investment vehicle. Total return is not annualized for periods less than one year.
fRatios are annualized for periods less than one year.
gDoes not include expenses of the Underlying Funds in which the Fund invests. The weighted average indirect expenses of the Underlying Funds was 0.66% for the period ended June 30, 2016.
hExcludes the value of portfolio securities delivered as a result of a redemption in-kind.
| The accompanying notes are an integral part of these financial statements. | Semiannual Report | FFA-7 |
FRANKLIN TEMPLETON VARIABLE INSURANCE PRODUCTS TRUST
Statement of Investments, June 30, 2016 (unaudited)
Franklin Founding Funds Allocation VIP Fund
| ||||||||||
| Shares | Value | |||||||||
Investments in Underlying Fundsa |
| |||||||||
Domestic Equity 33.7% | ||||||||||
Franklin Mutual Shares VIP Fund, Class 1 | 16,253,153 | $ | 330,914,202 | |||||||
|
| |||||||||
Domestic Hybrid 33.4% | ||||||||||
Franklin Income VIP Fund, Class 1 | 22,323,253 | 328,151,825 | ||||||||
|
| |||||||||
Foreign Equity 32.1% | ||||||||||
Templeton Growth VIP Fund, Class 1 | 25,696,831 | 315,557,091 | ||||||||
|
| |||||||||
Total Investments in Underlying Funds (Cost $784,229,704) 99.2% | 974,623,118 | |||||||||
Other Assets, less Liabilities 0.8% | 7,558,183 | |||||||||
|
| |||||||||
Net Assets 100.0% | $ | 982,181,301 | ||||||||
|
| |||||||||
aSee Note 3(d) regarding investments in Underlying Funds.
| FFA-8 | Semiannual Report | The accompanying notes are an integral part of these financial statements. |
FRANKLIN TEMPLETON VARIABLE INSURANCE PRODUCTS TRUST
Financial Statements
Statement of Assets and Liabilities
June 30, 2016 (unaudited)
| Franklin Founding Funds Allocation VIP Fund | ||||
Assets: | ||||
Investments in Securities: | ||||
Cost – Non-controlled affiliates (Note 3d) | $ | 784,229,704 | ||
|
| |||
Value – Non-controlled affiliates (Note 3d) | $ | 974,623,118 | ||
Cash | 4,176,196 | |||
Receivables: | ||||
Investment securities sold | 5,000,000 | |||
Capital shares sold | 134,283 | |||
Other assets | 451 | |||
|
| |||
Total assets | 983,934,048 | |||
|
| |||
Liabilities: | ||||
Payables: | ||||
Capital shares redeemed | 1,106,038 | |||
Administrative fees | 68,260 | |||
Distribution fees | 498,299 | |||
Accrued expenses and other liabilities | 80,150 | |||
|
| |||
Total liabilities | 1,752,747 | |||
|
| |||
Net assets, at value | $ | 982,181,301 | ||
|
| |||
Net assets consist of: | ||||
Paid-in capital | $ | 810,321,282 | ||
Undistributed net investment income | 20,620,378 | |||
Net unrealized appreciation (depreciation) | 190,393,414 | |||
Accumulated net realized gain (loss) | (39,153,773 | ) | ||
|
| |||
Net assets, at value | $ | 982,181,301 | ||
|
| |||
| Class 1: | ||||
Net assets, at value | $ | 1,035,040 | ||
|
| |||
Shares outstanding | 160,873 | |||
|
| |||
Net asset value and maximum offering price per share | $ | 6.43 | ||
|
| |||
| Class 2: | ||||
Net assets, at value | $ | 462,196,500 | ||
|
| |||
Shares outstanding | 72,251,827 | |||
|
| |||
Net asset value and maximum offering price per share | $ | 6.40 | ||
|
| |||
| Class 4: | ||||
Net assets, at value | $ | 518,949,761 | ||
|
| |||
Shares outstanding | 79,613,340 | |||
|
| |||
Net asset value and maximum offering price per share | $ | 6.52 | ||
|
| |||
| The accompanying notes are an integral part of these financial statements. | Semiannual Report | FFA-9 |
FRANKLIN TEMPLETON VARIABLE INSURANCE PRODUCTS TRUST
FINANCIAL STATEMENTS
Statement of Operations
for the six months ended June 30, 2016 (unaudited)
| Franklin Founding Funds Allocation VIP Fund | ||||
Investment income: | ||||
Dividends from Non-controlled affiliates (Note 3d) | $ | 24,362,675 | ||
|
| |||
Expenses: | ||||
Administrative fees (Note 3a) | 486,881 | |||
Distribution fees: (Note 3b) | ||||
Class 2 | 570,343 | |||
Class 4 | 903,913 | |||
Reports to shareholders | 47,234 | |||
Professional fees | 16,921 | |||
Trustees’ fees and expenses | 2,614 | |||
Other | 7,077 | |||
|
| |||
Total expenses | 2,034,983 | |||
Expenses waived/paid by affiliates (Note 3e) | (73,848 | ) | ||
|
| |||
Net expenses | 1,961,135 | |||
|
| |||
Net investment income | 22,401,540 | |||
|
| |||
Realized and unrealized gains (losses): | ||||
Net realized gain (loss) from: | ||||
Sale of investments in Non-controlled affiliates (Note 3d) | 574,880 | |||
Realized gain distribution by Non-controlled affiliates (Note 3d) | 12,581,004 | |||
|
| |||
Net realized gain (loss) | 13,155,884 | |||
|
| |||
Net change in unrealized appreciation (depreciation) on investments | (16,032,961 | ) | ||
|
| |||
Net realized and unrealized gain (loss) | (2,877,077 | ) | ||
|
| |||
Net increase (decrease) in net assets resulting from operations | $ | 19,524,463 | ||
|
| |||
| FFA-10 | Semiannual Report | The accompanying notes are an integral part of these financial statements. |
FRANKLIN TEMPLETON VARIABLE INSURANCE PRODUCTS TRUST
FINANCIAL STATEMENTS
Statements of Changes in Net Assets
| Franklin Founding Funds Allocation VIP Fund | ||||||||
| Six Months Ended June 30, 2016 (unaudited) | Year Ended December 31, 2015 | |||||||
Increase (decrease) in net assets: | ||||||||
Operations: | ||||||||
Net investment income | $ | 22,401,540 | $ | 37,413,879 | ||||
Net realized gain (loss) | 13,155,884 | 35,400,605 | ||||||
Net change in unrealized appreciation (depreciation) | (16,032,961 | ) | (142,745,103 | ) | ||||
|
| |||||||
Net increase (decrease) in net assets resulting from operations | 19,524,463 | (69,930,619 | ) | |||||
|
| |||||||
Distributions to shareholders from: | ||||||||
Net investment income: | ||||||||
Class 1 | (42,945 | ) | (36,795 | ) | ||||
Class 2 | (18,199,649 | ) | (15,525,526 | ) | ||||
Class 4 | (19,362,702 | ) | (17,645,320 | ) | ||||
Net realized gains: | ||||||||
Class 1 | (33,890 | ) | (1,845 | ) | ||||
Class 2 | (15,405,932 | ) | (848,940 | ) | ||||
Class 4 | (17,041,268 | ) | (1,013,211 | ) | ||||
|
| |||||||
Total distributions to shareholders | (70,086,386 | ) | (35,071,637 | ) | ||||
|
| |||||||
Capital share transactions: (Note 2) | ||||||||
Class 1 | 5,200 | 76,918 | ||||||
Class 2 | 5,604,467 | (28,851,107 | ) | |||||
Class 4 | (5,489,399 | ) | (94,741,812 | ) | ||||
|
| |||||||
Total capital share transactions | 120,268 | (123,516,001 | ) | |||||
|
| |||||||
Net increase (decrease) in net assets | (50,441,655 | ) | (228,518,257 | ) | ||||
Net assets: | ||||||||
Beginning of period | 1,032,622,956 | 1,261,141,213 | ||||||
|
| |||||||
End of period | $ | 982,181,301 | $ | 1,032,622,956 | ||||
|
| |||||||
Undistributed net investment income included in net assets: | ||||||||
End of period | $ | 20,620,378 | $ | 35,824,134 | ||||
|
| |||||||
| The accompanying notes are an integral part of these financial statements. | Semiannual Report | FFA-11 |
FRANKLIN TEMPLETON VARIABLE INSURANCE PRODUCTS TRUST
Notes to Financial Statements (unaudited)
Franklin Founding Funds Allocation VIP Fund
1. Organization and Significant Accounting Policies
Franklin Templeton Variable Insurance Products Trust (Trust) is registered under the Investment Company Act of 1940 (1940 Act) as an open-end management investment company, consisting of nineteen separate funds and applies the specialized accounting and reporting guidance in U.S. Generally Accepted Accounting Principles (U.S. GAAP). Franklin Founding Funds Allocation VIP Fund (Fund) is included in this report. The financial statements of the remaining funds in the Trust are presented separately. The Fund invests primarily in other funds of the Trust (Underlying Funds). Shares of the Fund are generally sold only to insurance company separate accounts to fund the benefits of variable life insurance policies or variable annuity contracts. The Fund offers three classes of shares: Class 1, Class 2 and Class 4. Each class of shares differs by its distribution fees, voting rights on matters affecting a single class and its exchange privilege.
The accounting policies of the Underlying Funds are outlined in their respective shareholder reports. A copy of the Underlying Funds’ shareholder reports is available on the U.S. Securities and Exchange Commission (SEC) website at sec.gov or at the SEC’s Public Reference Room in Washington, D.C. The Underlying Funds’ shareholder reports are not covered by this report.
The following summarizes the Fund’s significant accounting policies.
a. Financial Instrument Valuation
The Fund’s investments in financial instruments are carried at fair value daily. Fair value is the price that would be received to sell an asset or paid to transfer a liability in an orderly transaction between market participants on the measurement date. The Fund calculates the net asset value (NAV) per share as of 4 p.m. Eastern time each day the New York Stock Exchange (NYSE) is open for trading. Under compliance policies and procedures approved by the Trust’s Board of Trustees (the Board), the Fund’s administrator has responsibility for oversight of valuation, including leading the cross-functional Valuation Committee (VC). The VC provides administration and oversight of the Fund’s valuation policies and procedures, which are approved annually by the Board. Investments in the Underlying Funds are valued at their closing NAV each trading day.
b. Income Taxes
It is the Fund’s policy to qualify as a regulated investment company under the Internal Revenue Code. The Fund intends to distribute to shareholders substantially all of its taxable income and net realized gains to relieve it from federal income and if applicable, excise taxes. As a result, no provision for U.S. federal income taxes is required.
The Fund may recognize an income tax liability related to its uncertain tax positions under U.S. GAAP when the uncertain tax position has a less than 50% probability that it will be sustained upon examination by the tax authorities based on its technical merits. As of June 30, 2016, the Fund has determined that no tax liability is required in its financial statements related to uncertain tax positions for any open tax years (or expected to be taken in future tax years). Open tax years are those that remain subject to examination and are based on each tax jurisdiction’s statute of limitation.
c. Security Transactions, Investment Income, Expenses and Distributions
Security transactions are accounted for on trade date. Realized gains and losses on security transactions are determined on a specific identification basis. Estimated expenses are accrued daily. Dividend income and realized gain distributions are recorded on the ex-dividend date. Distributions to shareholders are recorded on the ex-dividend date and are determined according to income tax regulations (tax basis). Distributable earnings determined on a tax basis may differ from earnings recorded in accordance with U.S. GAAP. These differences may be permanent or temporary. Permanent differences are reclassified among capital accounts to reflect their tax character. These reclassifications have no impact on net assets or the results of operations. Temporary differences are not reclassified, as they may reverse in subsequent periods.
Common expenses incurred by the Trust are allocated among the Funds based on the ratio of net assets of each Fund to the combined net assets of the Trust. Fund specific expenses are charged directly to the fund that incurred the expense.
The Fund indirectly bears its proportionate share of expenses from the Underlying Funds. Since the Underlying Funds have varied expense levels and the Fund may own different
| FFA-12 | Semiannual Report |
FRANKLIN TEMPLETON VARIABLE INSURANCE PRODUCTS TRUST
NOTES TO FINANCIAL STATEMENTS (UNAUDITED)
Franklin Founding Funds Allocation VIP Fund (continued)
proportions of the Underlying Funds at different times, the amount of expenses incurred indirectly by the Fund will vary.
Realized and unrealized gains and losses and net investment income, not including class specific expenses, are allocated daily to each class of shares based upon the relative proportion of net assets of each class. Differences in per share distributions, by class, are generally due to differences in class specific expenses.
d. Accounting Estimates
The preparation of financial statements in accordance with U.S. GAAP requires management to make estimates and assumptions that affect the reported amounts of assets and liabilities at the date of the financial statements and the amounts of income and
expenses during the reporting period. Actual results could differ from those estimates.
e. Guarantees and Indemnifications
Under the Trust’s organizational documents, its officers and trustees are indemnified by the Trust against certain liabilities arising out of the performance of their duties to the Trust. Additionally, in the normal course of business, the Trust, on behalf of the Fund, enters into contracts with service providers that contain general indemnification clauses. The Trust’s maximum exposure under these arrangements is unknown as this would involve future claims that may be made against the Trust that have not yet occurred. Currently, the Trust expects the risk of loss to be remote.
2. Shares of Beneficial Interest
At June 30, 2016, there were an unlimited number of shares authorized (without par value). Transactions in the Fund’s shares were as follows:
| Six Months Ended June 30, 2016 | Year Ended December 31, 2015 | |||||||||||||||||||
| Shares | Amount | Shares | Amount | |||||||||||||||||
| Class 1 Shares: | ||||||||||||||||||||
Shares sold | 12,476 | $ | 83,200 | 19,319 | $ | 143,699 | ||||||||||||||
Shares issued in reinvestment of distributions | 12,138 | 76,835 | 5,229 | 38,640 | ||||||||||||||||
Shares redeemed | (22,971 | ) | (154,835 | ) | (14,405 | ) | (105,421 | ) | ||||||||||||
|
| |||||||||||||||||||
Net increase (decrease) | 1,643 | $ | 5,200 | 10,143 | $ | 76,918 | ||||||||||||||
|
| |||||||||||||||||||
| Class 2 Shares: | ||||||||||||||||||||
Shares sold | 3,111,474 | $ | 21,036,796 | 6,246,409 | $ | 45,291,801 | ||||||||||||||
Shares issued in reinvestment of distributions | 5,334,219 | 33,605,581 | 2,227,819 | 16,374,466 | ||||||||||||||||
Shares redeemed | (7,372,913 | ) | (49,037,910 | ) | (12,470,063 | ) | (90,517,374 | ) | ||||||||||||
|
| |||||||||||||||||||
Net increase (decrease) | 1,072,780 | $ | 5,604,467 | (3,995,835 | ) | $ | (28,851,107 | ) | ||||||||||||
|
| |||||||||||||||||||
| Class 4 Shares: | ||||||||||||||||||||
Shares sold | 771,190 | $ | 5,227,115 | 2,856,721 | $ | 21,294,894 | ||||||||||||||
Shares issued in reinvestment of distributions | 5,670,400 | 36,403,970 | 2,494,456 | 18,658,531 | ||||||||||||||||
Shares redeemed | (7,059,820 | ) | (47,120,484 | ) | (18,324,962 | ) | (134,695,237 | ) | ||||||||||||
|
| |||||||||||||||||||
Net increase (decrease) | (618,230 | ) | $ | (5,489,399 | ) | (12,973,785 | ) | $ | (94,741,812 | ) | ||||||||||
|
| |||||||||||||||||||
3. Transactions With Affiliates
Franklin Resources, Inc. is the holding company for various subsidiaries that together are referred to as Franklin Templeton Investments. Certain officers and trustees of the Fund are also officers and/or directors of the following subsidiaries:
| Subsidiary | Affiliation | |
Franklin Templeton Services, LLC (FT Services) | Administrative manager | |
Franklin Templeton Distributors, Inc. (Distributors) | Principal underwriter | |
Franklin Templeton Investor Services, LLC (Investor Services) | Transfer agent |
| Semiannual Report | FFA-13 |
FRANKLIN TEMPLETON VARIABLE INSURANCE PRODUCTS TRUST
NOTES TO FINANCIAL STATEMENTS
Franklin Founding Funds Allocation VIP Fund (continued)
3. Transactions With Affiliates (continued)
a. Administrative Fees
The Fund pays an administrative fee to FT Services of 0.10% per year of the average daily net assets of the Fund for administrative services including monitoring and rebalancing the percentage of the Fund’s investments in the Underlying Funds.
b. Distribution Fees
The Board has adopted distribution plans for Class 2 and Class 4 shares pursuant to Rule 12b-1 under the 1940 Act. Under the Fund’s compensation distribution plans, the Fund pays Distributors for costs incurred in connection with the servicing, sale and distribution of the Fund’s shares up to 0.35% per year of its average daily net assets of each class. The Board has agreed to limit the current rate to 0.25% per year for Class 2. The plan year, for purposes of monitoring compliance with the maximum annual plan rates, is February 1 through January 31.
c. Transfer Agent Fees
Investor Services, under terms of an agreement, performs shareholder servicing for the Fund and is not paid by the Fund for the services.
d. Investments in Underlying Funds
The Fund invests in Underlying Funds which are managed by Franklin Advisers, Inc. (Advisers), an affiliate of FT Services. The Fund does not invest in Underlying Funds for the purpose of exercising a controlling influence over the management or policies.
Investments in Underlying Funds for the period ended June 30, 2016, were as follows:
| Underlying Funds | Number of Shares Held at Beginning of Period | Gross Additions | Gross Reductions | Number of Shares Held at End of Period | Value at End of Period | Investment Income | Realized Gain (Loss) | % of Underlying Fund Shares Outstanding Held at End of Period | ||||||||||||||||||||||||
| Non-Controlled Affiliates | ||||||||||||||||||||||||||||||||
Franklin Income VIP Fund, Class 1 | 23,343,030 | 1,232,945 | (2,252,722 | ) | 22,323,253 | $ | 328,151,825 | $ | 16,820,344 | $ | (2,422,697 | ) | 5.4% | |||||||||||||||||||
Franklin Mutual Shares VIP Fund, Class 1 | 17,510,038 | — | (1,256,885 | ) | 16,253,153 | 330,914,202 | — | (140,318 | ) | 7.8% | ||||||||||||||||||||||
Templeton Growth VIP Fund, Class 1 | 25,118,084 | 1,645,407 | (1,066,660 | ) | 25,696,831 | 315,557,091 | 7,542,331 | 15,718,899 | a | 23.9% | ||||||||||||||||||||||
|
| |||||||||||||||||||||||||||||||
Total | $ | 974,623,118 | $ | 24,362,675 | $ | 13,155,884 | ||||||||||||||||||||||||||
|
| |||||||||||||||||||||||||||||||
aIncludes realized gain distributions received.
e. Waiver and Expense Reimbursements
FT Services has contractually agreed in advance to waive or limit its fees and to assume as its own expense certain expenses otherwise payable by the Fund so that the expenses (excluding distribution fees and acquired fund fees and expenses) for each class of the Fund do not exceed 0.10%, based on the average net assets of each class (other than certain non-routine expenses or costs, including those relating to litigation, indemnification, reorganizations, and liquidations) until April 30, 2017. Total expenses waived or paid are not subject to recapture subsequent to the Fund’s fiscal year end.
4. Expense Offset Arrangement
The Fund has entered into an arrangement with its custodian whereby credits realized as a result of uninvested cash balances are used to reduce a portion of the Fund’s custodian expenses. During the period ended June 30, 2016, there were no credits earned.
| FFA-14 | Semiannual Report |
FRANKLIN TEMPLETON VARIABLE INSURANCE PRODUCTS TRUST
NOTES TO FINANCIAL STATEMENTS
Franklin Founding Funds Allocation VIP Fund (continued)
5. Income Taxes
At June 30, 2016, the cost of investments and net unrealized appreciation (depreciation) for income tax purposes were as follows:
Cost of investments | $ | 836,104,895 | ||
|
| |||
Unrealized appreciation | $ | 190,393,414 | ||
Unrealized depreciation | (51,875,191 | ) | ||
|
| |||
Net unrealized appreciation (depreciation) | $ | 138,518,223 | ||
|
|
Differences between income and/or capital gains as determined on a book basis and a tax basis are primarily due to differing treatment of wash sales.
6. Investment Transactions
Purchases and sales of Underlying Funds (excluding short term securities) for the period ended June 30, 2016, aggregated $1,000,000 and $70,798,834, respectively.
7. Credit Facility
The Fund, together with other U.S. registered and foreign investment funds (collectively, Borrowers), managed by Franklin Templeton Investments, are borrowers in a joint syndicated senior unsecured credit facility totaling $2 billion (Global Credit Facility) which matures on February 10, 2017. This Global Credit Facility provides a source of funds to the Borrowers for temporary and emergency purposes, including the ability to meet future unanticipated or unusually large redemption requests.
Under the terms of the Global Credit Facility, the Fund shall, in addition to interest charged on any borrowings made by the Fund and other costs incurred by the Fund, pay its share of fees and expenses incurred in connection with the implementation and maintenance of the Global Credit Facility, based upon its relative share of the aggregate net assets of all of the Borrowers, including an annual commitment fee of 0.07% based upon the unused portion of the Global Credit Facility. Effective February 12, 2016, the annual commitment fee is 0.15%. These fees are reflected in other expenses in the Statement of Operations. During the period ended June 30, 2016, the Fund did not use the Global Credit Facility.
8. Fair Value Measurements
The Fund follows a fair value hierarchy that distinguishes between market data obtained from independent sources (observable inputs) and the Fund’s own market assumptions (unobservable inputs). These inputs are used in determining the value of the Fund’s financial instruments and are summarized in the following fair value hierarchy:
| • | Level 1 – quoted prices in active markets for identical financial instruments |
| • | Level 2 – other significant observable inputs (including quoted prices for similar financial instruments, interest rates, prepayment speed, credit risk, etc.) |
| • | Level 3 – significant unobservable inputs (including the Fund’s own assumptions in determining the fair value of financial instruments) |
The input levels are not necessarily an indication of the risk or liquidity associated with financial instruments at that level.
For movements between the levels within the fair value hierarchy, the Fund has adopted a policy of recognizing the transfers as of the date of the underlying event which caused the movement.
At June 30, 2016, all of the Fund’s investments in financial instruments carried at fair value were valued using Level 1 inputs. For detailed categories, see the accompanying Statement of Investments.
9. Subsequent Events
The Fund has evaluated subsequent events through the issuance of the financial statements and determined that no events have occurred that require disclosure.
| Semiannual Report | FFA-15 |
FRANKLIN TEMPLETON VARIABLE INSURANCE PRODUCTS TRUST
Tax Information (unaudited)
Franklin Founding Funds Allocation VIP Fund
During the fiscal year ended December 31, 2015, the Fund, a qualified fund of funds under Section 852(g)(2) of Internal Revenue Code (Code), received an allocation of foreign taxes paid from one or more of its underlying funds. As shown in the table below, the Fund hereby reports to shareholders the foreign source income and foreign taxes paid by underlying funds, pursuant to Section 853 of the Code. This written statement will allow shareholders of record on June 14, 2016, to treat their proportionate share of foreign taxes paid by the underlying funds as having been paid directly by them. The shareholder shall consider these amounts as foreign taxes paid in the tax year in which they receive the Fund distribution.
The following table provides a detailed analysis of foreign tax paid and foreign source income as reported by the Fund, to Class 1, Class 2, and Class 4 shareholders of record.
| Class | Foreign Tax Paid Per Share | Foreign Source Income Per Share | ||
Class 1 | $0.0039 | $0.0675 | ||
Class 2 | $0.0039 | $0.0675 | ||
Class 4 | $0.0039 | $0.0675 |
Foreign Tax Paid Per Share (Column 1) is the amount per share available to you, as a tax credit (assuming you held your shares in the Fund for a minimum of 16 days during the 31-day period beginning 15 days before the ex-dividend date of the Fund’s distribution to which the foreign taxes relate), or, as a tax deduction.
Foreign Source Income Per Share (Column 2) is the amount per share of income dividends attributable to foreign securities held by the Fund, plus any foreign taxes withheld on these dividends.
| FFA-16 | Semiannual Report |
Franklin High Income VIP Fund
This semiannual report for Franklin High Income VIP Fund covers the period ended June 30, 2016.
Class 4 Performance Summary as of June 30, 2016
The Fund’s Class 4 shares delivered a +8.16% total return for the six-month period ended June 30, 2016.
Performance reflects the Fund’s Class 4 operating expenses, but does not include any contract fees, expenses or sales charges. If they had been included, performance would be lower. These charges and deductions, particularly for variable life policies, can have a significant effect on contract values and insurance benefits. See the contract prospectus for a complete description of these expenses, including sales charges.
Performance data represent past performance, which does not guarantee future results. Investment return and principal value will fluctuate, and you may have a gain or loss when you sell your shares. Current performance may differ from figures shown.
| Semiannual Report | FH-1 |
FRANKLIN HIGH INCOME VIP FUND
Fund Goals and Main Investments
The Fund seeks a high level of current income with capital appreciation as a secondary goal. Under normal market conditions, the Fund invests predominantly in high yield, lower rated debt securities and preferred stocks.
Fund Risks
All investments involve risks, including possible loss of principal. The risks associated with higher yielding, lower rated securities include higher risk of default and loss of principal. Changes in the financial strength of a bond issuer or in a bond’s credit rating may affect its value. In addition, interest rate movements will affect the Fund’s share price and yield. Bond prices generally move in the opposite direction of interest rates. Thus, as prices of bonds in the Fund adjust to a rise in interest rates, the Fund’s share price may decline. Investment in foreign securities also involves special risks, including currency fluctuations, and political and economic uncertainty. The Fund is actively managed but there is no guarantee that the manager’s investment decisions will produce the desired results. The Fund’s prospectus also includes a description of the main investment risks.
Performance Overview
You can find the Fund’s six-month total return in the Performance Summary. In comparison, the Fund’s benchmark, the Credit Suisse (CS) High Yield Index, posted a +9.19% total return for the period under review.1 The Fund’s peers, as measured by the Lipper VIP High Yield Funds Classification Average, delivered a +6.52% total return.2
Economic and Market Overview
The U.S. economy grew moderately, as measured by gross domestic product in 2016’s first and second quarters, driven by consumer spending and exports. A decline in private inventory investment and nonresidential fixed investment contributed to the moderation. Although the unemployment rate rose from 4.7% in May to 4.9% in June, the increase was due to additional people entering the labor force, and for the entire period under review, unemployment declined slightly.3 Home sales and prices rose amid relatively low mortgage rates. Monthly retail sales grew during most of the review period, and rose to the highest level in April in more than a year, due to a broad-based increase across most retail categories. Inflation, as measured by
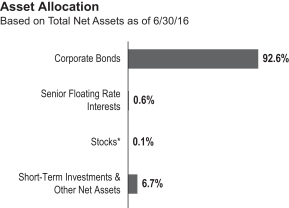
*Includes common and convertible preferred shares.
the Consumer Price Index, remained subdued overall even though it spiked to the highest level in three years in April mainly due to a rebound in energy prices.
After raising its target range for the federal funds rate to 0.25%–0.50% at its December meeting, the Federal Reserve (Fed) maintained the rate through-period end. Although the Fed hinted at an interest rate hike in June, subsequent reports showed job additions slowed substantially in May. Consequently, at its June meeting, the Fed kept the federal funds rates unchanged, and indicated that in determining the timing and size of future adjustments to the target range, it will assess realized and expected economic conditions relative to its objectives of maximum employment and 2.00% inflation. The Fed expects economic conditions to evolve in a manner that could warrant only gradual increases in the federal funds rate.
The 10-year Treasury yield, which moves inversely to price, declined during the period. It declined from a period high of 2.27% on December 31, 2015, and remained relatively low through period-end, reflecting investors’ concerns about global economic uncertainty. Negative interest rates in Japan and Europe, and central banks’ purchases of government bonds, also put downward pressure on U.S. yields. It touched a period low of 1.46% on June 27, 2016, and ended the period at 1.49%, after the Fed kept short-term interest rates unchanged and fears of Britain’s exit from the European Union (also known as the “Brexit”) boosted safe-haven buying by investors.
1. Source: Credit Suisse Group.
2. Source: Lipper, a Thomson Reuters Company.
One cannot invest directly in an index, and an index is not representative of the Fund’s portfolio. Please see Index Descriptions following the Fund Summaries.
3. Source: Bureau of Labor Statistics.
| FH-2 | Semiannual Report |
FRANKLIN HIGH INCOME VIP FUND
Investment Strategy
We are research-driven, fundamental investors who rely on a team of analysts to provide in-depth industry expertise and use qualitative and quantitative analyses to evaluate companies. As bottom-up investors, we focus primarily on individual securities. We also consider sectors when choosing investments. In selecting securities for the Fund’s investment portfolio, we do not rely principally on ratings assigned by rating agencies but perform our own independent analysis to evaluate an issuer’s creditworthiness. We consider a variety of factors, including an issuer’s experience and managerial strength, its sensitivity to economic conditions and its current financial condition.
Manager’s Discussion
During the period, mixed U.S. economic data at the start of 2016, continued weak commodity prices and investor concerns about China’s growth rate weighed on financial markets. The prospect of the Fed increasing its target short-term interest rate and the Brexit caused further volatility. However, by period-end, dovish comments by the Fed reassured investors, and oil prices posted a notable recovery as a rebalancing of supply and demand led to investor hopes that a sustainable price recovery was underway. Other commodities also rebounded based on general increased optimism for global growth, allowing securities in the metals and mining industry to realize price gains.
The heavy combined weighting of the energy sector and metals and mining industry significantly affected the high yield corporate bond market’s performance during the period. The gain in commodity prices and change in investor sentiment drove the high yield market to stage a strong rally in the second half of the period. The Brexit caused temporary volatility, but markets quickly recovered based on analysts’ prevailing view that any negative impact would be largely confined to the U.K. Overall, spreads to comparable Treasuries narrowed almost 100 basis points by period-end.
Fundamentally, with the overall decline in commodity prices throughout 2015, earnings and credit quality trends for the energy sector and metals and mining industry were challenged going into 2016. As expected, default rates in commodity-related sectors rose as companies attempted to reduce debt on their balance sheets and strengthen liquidity in the face of lower cash flow and earnings prospects.
We feel the fundamental outlook for the remainder of the high yield corporate market continued to be supportive. Although
| Top 10 Sectors/Industries | ||||
| 6/30/16 | ||||
% of Total Net Assets | ||||
| Energy | 13.7% | |||
| Materials | 13.2% | |||
| Media | 10.2% | |||
| Telecommunication Services | 9.1% | |||
| Health Care Equipment & Services | 5.6% | |||
| Banks | 5.3% | |||
| Diversified Financials | 4.3% | |||
| Pharmaceuticals, Biotechnology & Life Sciences | 3.7% | |||
| Consumer Services | 3.7% | |||
| Consumer Durables & Apparel | 3.3% | |||
The dollar value, number of shares or principal amount, and names of all portfolio holdings are listed in the Fund’s Statement of Investments (SOI).
earnings growth and margin improvements may have already peaked and leverage ratios have ticked higher over the past few years, given the significant refinancing activity and earnings growth over the past several years, non-commodity high yield issuers have experienced below-average default rates. Spreads tightened during the period for many non-commodity related issuers, but given the prospect for more stable credit fundamentals, we still believed valuations to be relatively attractive across many of these industries.
In terms of the Fund’s performance, during the period the Fund underperformed the CS High Yield Index but outperformed the return of peer funds, as measured by the Lipper High Yield Funds Classification Average. The underperformance against the CS High Yield Index was primarily due to the Fund’s larger positioning in the energy sector as well as certain holdings in the media and health care sectors.4
During the period, we drew on our fundamental research process to make individual investment decisions and to overweight and underweight certain industries relative to our benchmark in an effort to potentially outperform. Overall, our industry exposure had a negative impact on relative returns during the period. For example, our overweighted position and security selection in the cable industry detracted from performance.5 Significant new issuance, merger and acquisition activity, a highly competitive landscape and potential spectrum sales caused volatility in the industry. Our overweighted position in large cap issuer Intelsat Jackson Holdings, a dominant player in the satellite market, also hurt Fund performance as the company’s highly leveraged balance sheet was pressured in the face of uncertain demand.
4. The health care sector comprises health care equipment and services and pharmaceuticals, biotechnology and life sciences in the SOI.
5. Cable is part of media in the SOI.
| Semiannual Report | FH-3 |
FRANKLIN HIGH INCOME VIP FUND
The normally defensive health care sector was another detractor, with poor performance driven mainly by developments in the pharmaceuticals industry. The Fund was overweighted in the sector as a whole, which dragged on relative performance. Our position in Valeant Pharmaceuticals International, a large cap issuer in the high yield market, experienced notable price declines driven mainly by questionable accounting and strategic practices. Finally, a combination of industry positioning and security selection in the energy sector also hampered returns. Although the energy sector posted a meaningful recovery as a whole, some more leveraged issuers preemptively moved to restructure their balance sheets when oil prices approached their lows. This trend pressured the recovery in their bond prices on a relative basis and our holdings in these types of situations hurt relative performance.
Some of the Fund’s industry weightings favorably impacted relative performance. The general rally in commodity prices spurred a recovery in the metals and mining industry, benefiting our overweighted position.6 The aerospace and defense industry and the information technology sector also produced positive results.7 The Fund’s weightings in these sectors roughly matched the benchmark index, and these positionings did not significantly affect performance. However, our ratings mix in information technology was a relative contributor and our security selection in aerospace and defense outperformed the index.
Thank you for your participation in Franklin High Income VIP Fund. We look forward to serving your future investment needs.
The foregoing information reflects our analysis, opinions and portfolio holdings as of June 30, 2016, the end of the reporting period. The way we implement our main investment strategies and the resulting portfolio holdings may change depending on factors such as market and economic conditions. These opinions may not be relied upon as investment advice or an offer for a particular security. The information is not a complete analysis of every aspect of any market, country, industry, security or the Fund. Statements of fact are from sources considered reliable, but the investment manager makes no representation or warranty as to their completeness or accuracy. Although historical performance is no guarantee of future results, these insights may help you understand our investment management philosophy.
6. Metals and mining is part of materials in the SOI.
7. The aerospace and defense sector is part of capital goods in the SOI. The information technology sector comprises software and services and technology, hardware and equipment in the SOI.
| FH-4 | Semiannual Report |
FRANKLIN HIGH INCOME VIP FUND
Class 4 Fund Expenses
As an investor in a variable insurance contract (Contract) that indirectly provides for investment in an underlying mutual fund, you can incur transaction and/or ongoing expenses at both the Fund level and the Contract level.
| • | Transaction expenses can include sales charges (loads) on purchases, surrender fees, transfer fees and premium taxes. |
| • | Ongoing expenses can include management fees, distribution and service (12b-1) fees, contract fees, annual maintenance fees, mortality and expense risk fees and other fees and expenses. All mutual funds and Contracts have some types of ongoing expenses. |
The expenses shown in the table are meant to highlight ongoing expenses at the Fund level only and do not include ongoing expenses at the Contract level, or transaction expenses at either the Fund or Contract levels. While the Fund does not have transaction expenses, if the transaction and ongoing expenses at the Contract level were included, the expenses shown below would be higher. You should consult your Contract prospectus or disclosure document for more information.
The table shows Fund-level ongoing expenses and can help you understand these expenses and compare them with those of other mutual funds offered through the Contract. The table assumes a $1,000 investment held for the six months indicated. Please refer to the Fund prospectus for additional information on operating expenses.
Actual Fund Expenses
The first line (Actual) of the table provides actual account values and expenses. The “Ending Account Value” is derived from the Fund’s actual return, which includes the effect of ongoing Fund expenses, but does not include the effect of ongoing Contract expenses.
You can estimate the Fund-level expenses you incurred during the period by following these steps. Of course, your account value and expenses will differ from those in this illustration:
| 1. | Divide your account value by $1,000. |
If an account had an $8,600 value, then $8,600 ÷ $1,000 = 8.6.
| 2. | Multiply the result by the number under the heading “Fund-Level Expenses Incurred During Period.” |
If Fund-Level Expenses Incurred During Period were $7.50, then 8.6 × $7.50 = $64.50.
In this illustration, the estimated expenses incurred this period at the Fund level are $64.50.
Hypothetical Example for Comparison with Other Mutual Funds
Information in the second line (Hypothetical) of the table can help you compare ongoing expenses of the Fund with those of other mutual funds offered through the Contract. This information may not be used to estimate the actual ending account balance or expenses you incurred during the period. The hypothetical “Ending Account Value” is based on the Fund’s actual expense ratio and an assumed 5% annual rate of return before expenses, which does not represent the Fund’s actual return. The figure under the heading “Fund-Level Expenses Incurred During Period” shows the hypothetical expenses your account would have incurred under this scenario. You can compare this figure with the 5% hypothetical examples that appear in shareholder reports of other funds offered through a Contract.
| Class 4 | Beginning Account Value 1/1/6 | Ending Account Value 6/30/16 | Fund-Level Expenses 1/1/16–6/30/16 | |||||||||
Actual | $ | 1,000 | $ | 1,081.60 | $ | 4.97 | ||||||
Hypothetical (5% return before expenses) | $ | 1,000 | $ | 1,020.09 | $ | 4.82 | ||||||
*Expenses are calculated using the most recent six-month annualized expense ratio for the Fund’s Class 4 shares (0.96%), which does not include any ongoing expenses of the Contract for which the Fund is an investment option, multiplied by the average account value over the period, multiplied by 182/366 to reflect the one-half year period.
| Semiannual Report | FH-5 |
FRANKLIN TEMPLETON VARIABLE INSURANCE PRODUCTS TRUST
Financial Highlights
Franklin High Income VIP Fund
Six Months Ended (unaudited) | Year Ended December 31, | |||||||||||||||||||||||
| 2015 | 2014 | 2013 | 2012 | 2011 | ||||||||||||||||||||
| Class 1 | ||||||||||||||||||||||||
| Per share operating performance (for a share outstanding throughout the period) | ||||||||||||||||||||||||
Net asset value, beginning of period | $5.63 | $6.62 | $7.02 | $7.01 | $6.52 | $6.63 | ||||||||||||||||||
|
| |||||||||||||||||||||||
| Income from investment operationsa: | ||||||||||||||||||||||||
Net investment incomeb | 0.17 | 0.39 | 0.42 | 0.46 | 0.48 | 0.50 | ||||||||||||||||||
Net realized and unrealized gains (losses) | 0.29 | (0.93 | ) | (0.38 | ) | 0.09 | 0.51 | (0.19 | ) | |||||||||||||||
|
| |||||||||||||||||||||||
Total from investment operations | 0.46 | (0.54 | ) | 0.04 | 0.55 | 0.99 | 0.31 | |||||||||||||||||
|
| |||||||||||||||||||||||
Less distributions from net investment income | (0.42 | ) | (0.45 | ) | (0.44 | ) | (0.54 | ) | (0.50 | ) | (0.42 | ) | ||||||||||||
|
| |||||||||||||||||||||||
Net asset value, end of period | $5.67 | $5.63 | $6.62 | $7.02 | $7.01 | $6.52 | ||||||||||||||||||
|
| |||||||||||||||||||||||
Total returnc | 8.28% | (8.88)% | 0.21% | 8.17% | 15.94% | 4.63% | ||||||||||||||||||
| Ratios to average net assetsd | ||||||||||||||||||||||||
Expenses | 0.61% | e | 0.59% | e | 0.57% | e | 0.58% | e | 0.58% | 0.58% | ||||||||||||||
Net investment income | 6.09% | 6.20% | 6.00% | 6.63% | 7.15% | 7.52% | ||||||||||||||||||
| Supplemental data | ||||||||||||||||||||||||
Net assets, end of period (000’s) | $26,977 | $26,835 | $34,552 | $39,300 | $42,166 | $41,971 | ||||||||||||||||||
Portfolio turnover rate | 12.24% | 28.56% | 39.46% | 30.78% | 37.03% | 45.11% | ||||||||||||||||||
aThe amount shown for a share outstanding throughout the period may not correlate with the Statement of Operations for the period due to the timing of sales and repurchases of the Fund’s shares in relation to income earned and/or fluctuating fair value of the investments of the Fund.
bBased on average daily shares outstanding.
cTotal return does not include fees, charges or expenses imposed by the variable annuity and life insurance contracts for which Franklin Templeton Variable Insurance Products Trust serves as an underlying investment vehicle. Total return is not annualized for periods less than one year.
dRatios are annualized for periods less than one year.
eBenefit of expense reduction rounds to less than 0.01%.
| FH-6 | Semiannual Report | The accompanying notes are an integral part of these financial statements. |
FRANKLIN TEMPLETON VARIABLE INSURANCE PRODUCTS TRUST
FINANCIAL HIGHLIGHTS
Franklin High Income VIP Fund (continued)
Six Months Ended (unaudited) | Year Ended December 31, | |||||||||||||||||||||||
| 2015 | 2014 | 2013 | 2012 | 2011 | ||||||||||||||||||||
| Class 2 | ||||||||||||||||||||||||
| Per share operating performance (for a share outstanding throughout the period) | ||||||||||||||||||||||||
Net asset value, beginning of period | $5.44 | $6.41 | $6.81 | $6.82 | $6.36 | $6.47 | ||||||||||||||||||
|
| |||||||||||||||||||||||
| Income from investment operationsa: | ||||||||||||||||||||||||
Net investment incomeb | 0.16 | 0.36 | 0.39 | 0.43 | 0.46 | 0.47 | ||||||||||||||||||
Net realized and unrealized gains (losses) | 0.29 | (0.90 | ) | (0.37 | ) | 0.08 | 0.48 | (0.18 | ) | |||||||||||||||
|
| |||||||||||||||||||||||
Total from investment operations | 0.45 | (0.54 | ) | 0.02 | 0.51 | 0.94 | 0.29 | |||||||||||||||||
|
| |||||||||||||||||||||||
Less distributions from net investment income | (0.41 | ) | (0.43 | ) | (0.42 | ) | (0.52 | ) | (0.48 | ) | (0.40 | ) | ||||||||||||
|
| |||||||||||||||||||||||
Net asset value, end of period | $5.48 | $5.44 | $6.41 | $6.81 | $6.82 | $6.36 | ||||||||||||||||||
|
| |||||||||||||||||||||||
Total returnc | 8.26% | (9.12)% | (0.02)% | 7.83% | 15.56% | 4.56% | ||||||||||||||||||
| Ratios to average net assetsd | ||||||||||||||||||||||||
Expenses | 0.86% | e | 0.84% | e | 0.82% | e | 0.83% | e | 0.83% | 0.83% | ||||||||||||||
Net investment income | 5.84% | 5.95% | 5.75% | 6.38% | 6.90% | 7.27% | ||||||||||||||||||
| Supplemental data | ||||||||||||||||||||||||
Net assets, end of period (000’s) | $212,063 | $205,339 | $261,944 | $291,826 | $281,851 | $249,452 | ||||||||||||||||||
Portfolio turnover rate | 12.24% | 28.56% | 39.46% | 30.78% | 37.03% | 45.11% | ||||||||||||||||||
aThe amount shown for a share outstanding throughout the period may not correlate with the Statement of Operations for the period due to the timing of sales and repurchases of the Fund’s shares in relation to income earned and/or fluctuating fair value of the investments of the Fund.
bBased on average daily shares outstanding.
cTotal return does not include fees, charges or expenses imposed by the variable annuity and life insurance contracts for which Franklin Templeton Variable Insurance Products Trust serves as an underlying investment vehicle. Total return is not annualized for periods less than one year.
dRatios are annualized for periods less than one year.
eBenefit of expense reduction rounds to less than 0.01%.
| The accompanying notes are an integral part of these financial statements. | Semiannual Report | FH-7 |
FRANKLIN TEMPLETON VARIABLE INSURANCE PRODUCTS TRUST
FINANCIAL HIGHLIGHTS
Franklin High Income VIP Fund (continued)
Six Months Ended (unaudited) | Year Ended December 31, | |||||||||||||||||||||||
| 2015 | 2014 | 2013 | 2012 | 2011 | ||||||||||||||||||||
| Class 4 | ||||||||||||||||||||||||
| Per share operating performance (for a share outstanding throughout the period) | ||||||||||||||||||||||||
Net asset value, beginning of period | $5.56 | $6.54 | $6.94 | $6.94 | $6.46 | $6.57 | ||||||||||||||||||
|
| |||||||||||||||||||||||
| Income from investment operationsa: | ||||||||||||||||||||||||
Net investment incomeb | 0.16 | 0.37 | 0.39 | 0.43 | 0.46 | 0.47 | ||||||||||||||||||
Net realized and unrealized gains (losses) | 0.29 | (0.92 | ) | (0.38 | ) | 0.08 | 0.49 | (0.18 | ) | |||||||||||||||
|
| |||||||||||||||||||||||
Total from investment operations | 0.45 | (0.55 | ) | 0.01 | 0.51 | 0.95 | 0.29 | |||||||||||||||||
|
| |||||||||||||||||||||||
Less distributions from net investment income | (0.40 | ) | (0.43 | ) | (0.41 | ) | (0.51 | ) | (0.47 | ) | (0.40 | ) | ||||||||||||
|
| |||||||||||||||||||||||
Net asset value, end of period | $5.61 | $5.56 | $6.54 | $6.94 | $6.94 | $6.46 | ||||||||||||||||||
|
| |||||||||||||||||||||||
Total returnc | 8.16% | (9.20)% | (0.15)% | 7.72% | 15.50% | 4.39% | ||||||||||||||||||
| Ratios to average net assetsd | ||||||||||||||||||||||||
Expenses | 0.96% | e | 0.94% | e | 0.92% | e | 0.93% | e | 0.93% | 0.93% | ||||||||||||||
Net investment income | 5.74% | 5.85% | 5.65% | 6.28% | 6.80% | 7.17% | ||||||||||||||||||
| Supplemental data | ||||||||||||||||||||||||
Net assets, end of period (000’s) | $22,798 | $21,708 | $25,740 | $27,789 | $27,664 | $27,055 | ||||||||||||||||||
Portfolio turnover rate | 12.24% | 28.56% | 39.46% | 30.78% | 37.03% | 45.11% | ||||||||||||||||||
aThe amount shown for a share outstanding throughout the period may not correlate with the Statement of Operations for the period due to the timing of sales and repurchases of the Fund’s shares in relation to income earned and/or fluctuating fair value of the investments of the Fund.
bBased on average daily shares outstanding.
cTotal return does not include fees, charges or expenses imposed by the variable annuity and life insurance contracts for which Franklin Templeton Variable Insurance Products Trust serves as an underlying investment vehicle. Total return is not annualized for periods less than one year.
dRatios are annualized for periods less than one year.
eBenefit of expense reduction rounds to less than 0.01%.
| FH-8 | Semiannual Report | The accompanying notes are an integral part of these financial statements. |
FRANKLIN TEMPLETON VARIABLE INSURANCE PRODUCTS TRUST
Statement of Investments, June 30, 2016 (unaudited)
Franklin High Income VIP Fund
| ||||||||||||||
| Country | Shares | Value | ||||||||||||
Common Stocks (Cost $334,368) 0.0%† | ||||||||||||||
Transportation 0.0%† | ||||||||||||||
| a,b | CEVA Holdings LLC | United Kingdom | 224 | $ | 78,498 | |||||||||
|
| |||||||||||||
Convertible Preferred Stocks 0.1% | ||||||||||||||
Transportation 0.1% | ||||||||||||||
| a,b | CEVA Holdings LLC, cvt. pfd., A-1 | United Kingdom | 6 | 3,150 | ||||||||||
| a,b | CEVA Holdings LLC, cvt. pfd., A-2 | United Kingdom | 486 | 169,928 | ||||||||||
|
| |||||||||||||
Total Convertible Preferred Stocks (Cost $731,855) | 173,078 | |||||||||||||
|
| |||||||||||||
| Principal Amount* | ||||||||||||||
Corporate Bonds 92.6% | ||||||||||||||
Automobiles & Components 1.6% | ||||||||||||||
Fiat Chrysler Automobiles NV, senior note, 5.25%, 4/15/23 | United Kingdom | 3,000,000 | 2,987,774 | |||||||||||
The Goodyear Tire & Rubber Co., | ||||||||||||||
senior bond, 5.00%, 5/31/26 | United States | 1,000,000 | 1,021,250 | |||||||||||
senior note, 5.125%, 11/15/23 | United States | 300,000 | 311,250 | |||||||||||
|
| |||||||||||||
| 4,320,274 | ||||||||||||||
|
| |||||||||||||
Banks 5.3% | ||||||||||||||
| c | Bank of America Corp., junior sub. bond, M, 8.125% to 5/15/18, FRN thereafter, Perpetual | United States | 2,500,000 | 2,509,375 | ||||||||||
CIT Group Inc., senior note, | ||||||||||||||
5.375%, 5/15/20 | United States | 1,000,000 | 1,045,000 | |||||||||||
5.00%, 8/15/22 | United States | 2,700,000 | 2,754,000 | |||||||||||
| c | Citigroup Inc., junior sub. bond, M, 6.30% to 5/15/24, FRN thereafter, Perpetual | United States | 2,800,000 | 2,789,220 | ||||||||||
| c | JPMorgan Chase & Co., junior sub. bond, R, 6.00% to 8/01/23, FRN thereafter, Perpetual | United States | 2,500,000 | 2,559,375 | ||||||||||
Royal Bank of Scotland Group PLC, sub. note, 6.125%, 12/15/22 | United Kingdom | 2,000,000 | 2,098,910 | |||||||||||
|
| |||||||||||||
| 13,755,880 | ||||||||||||||
|
| |||||||||||||
Capital Goods 1.3% | ||||||||||||||
| d | Bombardier Inc., senior bond, 144A, 7.50%, 3/15/25 | Canada | 600,000 | 522,000 | ||||||||||
Navistar International Corp., senior bond, 8.25%, 11/01/21 | United States | 1,400,000 | 990,500 | |||||||||||
TransDigm Inc., | ||||||||||||||
senior sub. bond, 6.50%, 7/15/24 | United States | 1,000,000 | 1,010,000 | |||||||||||
senior sub. bond, 6.50%, 5/15/25 | United States | 200,000 | 201,250 | |||||||||||
d senior sub. bond, 144A, 6.375%, 6/15/26 | United States | 300,000 | 299,625 | |||||||||||
senior sub. note, 6.00%, 7/15/22 | United States | 500,000 | 505,090 | |||||||||||
|
| |||||||||||||
| 3,528,465 | ||||||||||||||
|
| |||||||||||||
Commercial & Professional Services 1.6% | ||||||||||||||
| d | Acosta Inc., senior note, 144A, 7.75%, 10/01/22 | United States | 2,000,000 | 1,765,000 | ||||||||||
| b,e | Goss Graphic Systems Inc., senior sub. note, 12.25%, 11/19/05 | United States | 1,912,374 | 191 | ||||||||||
United Rentals North America Inc., senior bond, 5.75%, 11/15/24 | United States | 2,500,000 | 2,531,250 | |||||||||||
|
| |||||||||||||
| 4,296,441 | ||||||||||||||
|
| |||||||||||||
Consumer Durables & Apparel 3.3% | ||||||||||||||
| d | Hanesbrands Inc., senior bond, 144A, 4.875%, 5/15/26 | United States | 1,600,000 | 1,613,760 | ||||||||||
KB Home, | ||||||||||||||
senior bond, 7.50%, 9/15/22 | United States | 2,100,000 | 2,173,500 | |||||||||||
senior note, 7.00%, 12/15/21 | United States | 700,000 | 707,000 | |||||||||||
| d | Newell Brands Inc., senior note, 144A, 5.00%, 11/15/23 | United States | 1,200,000 | 1,261,884 | ||||||||||
| Semiannual Report | FH-9 |
FRANKLIN TEMPLETON VARIABLE INSURANCE PRODUCTS TRUST
STATEMENT OF INVESTMENTS (UNAUDITED)
Franklin High Income VIP Fund (continued)
| Country | Principal Amount* | Value | ||||||||||||
Corporate Bonds (continued) | ||||||||||||||
Consumer Durables & Apparel (continued) | ||||||||||||||
| d | Taylor Morrison Communities Inc./Monarch Communities Inc., | |||||||||||||
5.25%, 4/15/21 | United States | 900,000 | $ | 902,250 | ||||||||||
5.875%, 4/15/23 | United States | 600,000 | 606,000 | |||||||||||
5.625%, 3/01/24 | United States | 1,500,000 | 1,470,000 | |||||||||||
|
| |||||||||||||
| 8,734,394 | ||||||||||||||
|
| |||||||||||||
Consumer Services 3.7% | ||||||||||||||
| d | 1011778 BC ULC/New Red Finance Inc., | |||||||||||||
secured note, second lien, 144A, 6.00%, 4/01/22 | Canada | 2,000,000 | 2,079,380 | |||||||||||
senior secured note, first lien, 144A, 4.625%, 1/15/22 | Canada | 900,000 | 915,750 | |||||||||||
| d | 24 Hour Holdings III LLC, senior note, 144A, 8.00%, 6/01/22 | United States | 2,500,000 | 1,906,250 | ||||||||||
| d,e | Fontainebleau Las Vegas, senior secured bond, first lien, 144A, 11.00%, 6/15/15 | United States | 1,700,000 | 3,358 | ||||||||||
| d | International Game Technology PLC, senior secured bond, 144A, 6.50%, 2/15/25 | United States | 2,500,000 | 2,525,000 | ||||||||||
| d | Wynn Las Vegas LLC/Wynn Las Vegas Capital Corp., senior bond, 144A, 5.50%, 3/01/25 | United States | 1,100,000 | 1,068,375 | ||||||||||
| d | Wynn Macau Ltd., senior note, 144A, 5.25%, 10/15/21 | Macau | 1,200,000 | 1,161,000 | ||||||||||
|
| |||||||||||||
| 9,659,113 | ||||||||||||||
|
| |||||||||||||
Diversified Financials 4.3% | ||||||||||||||
AerCap Ireland Capital Ltd./AerCap Global Aviation Trust, senior note, 4.625%, 10/30/20 | Netherlands | 1,700,000 | 1,760,359 | |||||||||||
Deutsche Bank AG, sub. bond, 4.296% to 5/24/23, FRN thereafter, 5/24/28 | Germany | 1,300,000 | 1,145,495 | |||||||||||
| d | KFC Holding Co./Pizza Hut Holdings LLC/Taco Bell of America LLC, senior note, 144A, | |||||||||||||
5.00%, 6/01/24 | United States | 1,000,000 | 1,027,500 | |||||||||||
5.25%, 6/01/26 | United States | 1,000,000 | 1,027,500 | |||||||||||
| d | Lincoln Finance Ltd., senior secured note, 144A, 7.375%, 4/15/21 | Netherlands | 1,600,000 | 1,662,000 | ||||||||||
Navient Corp., senior note, 5.50%, 1/15/19 | United States | 3,500,000 | 3,528,875 | |||||||||||
| d | OneMain Financial Holdings Inc., senior note, 144A, 7.25%, 12/15/21 | United States | 1,100,000 | 1,058,750 | ||||||||||
|
| |||||||||||||
| 11,210,479 | ||||||||||||||
|
| |||||||||||||
Energy 13.7% | ||||||||||||||
California Resources Corp., | ||||||||||||||
d secured note, second lien, 144A, 8.00%, 12/15/22 | United States | 2,155,000 | 1,532,744 | |||||||||||
senior bond, 6.00%, 11/15/24 | United States | 621,000 | 305,842 | |||||||||||
senior note, 5.50%, 9/15/21 | United States | 184,000 | 93,840 | |||||||||||
Calumet Specialty Products Partners LP/Calumet Finance Corp., senior note, | ||||||||||||||
7.75%, 4/15/23 | United States | 1,500,000 | 1,068,750 | |||||||||||
d 144A, 11.50%, 1/15/21 | United States | 600,000 | 676,500 | |||||||||||
CGG SA, senior note, 6.875%, 1/15/22 | France | 2,300,000 | 1,012,000 | |||||||||||
| e,f | CHC Helicopter SA, | |||||||||||||
senior note, 9.375%, 6/01/21 | Canada | 260,000 | 37,700 | |||||||||||
senior secured note, first lien, 9.25%, 10/15/20 | Canada | 2,700,000 | 1,215,000 | |||||||||||
| d | Cheniere Corpus Christi Holdings LLC, senior secured note, 144A, 7.00%, 6/30/24 | United States | 1,000,000 | 1,028,130 | ||||||||||
| d | Chesapeake Energy Corp., secured note, second lien, 144A, 8.00%, 12/15/22 | United States | 1,830,000 | 1,560,075 | ||||||||||
| FH-10 | Semiannual Report |
FRANKLIN TEMPLETON VARIABLE INSURANCE PRODUCTS TRUST
STATEMENT OF INVESTMENTS (UNAUDITED)
Franklin High Income VIP Fund (continued)
| Country | Principal Amount* | Value | ||||||||||||
Corporate Bonds (continued) | ||||||||||||||
Energy (continued) | ||||||||||||||
CONSOL Energy Inc., senior note, | ||||||||||||||
5.875%, 4/15/22 | United States | 1,100,000 | $ | 966,625 | ||||||||||
8.00%, 4/01/23 | United States | 1,800,000 | 1,602,000 | |||||||||||
CSI Compressco LP/CSI Compressco Finance Inc., senior note, 7.25%, 8/15/22 | United States | 700,000 | 577,500 | |||||||||||
Energy Transfer Equity LP, | ||||||||||||||
senior note, first lien, 7.50%, 10/15/20 | United States | 2,600,000 | 2,769,000 | |||||||||||
senior secured bond, first lien, 5.875%, 1/15/24 | United States | 400,000 | 391,000 | |||||||||||
senior secured bond, first lien, 5.50%, 6/01/27 | United States | 500,000 | 472,500 | |||||||||||
| e | Energy XXI Gulf Coast Inc., senior note, | |||||||||||||
7.50%, 12/15/21 | United States | 1,000,000 | 115,000 | |||||||||||
6.875%, 3/15/24 | United States | 500,000 | 57,500 | |||||||||||
| d | EnQuest PLC, senior note, 144A, 7.00%, 4/15/22 | United Kingdom | 2,500,000 | 1,528,125 | ||||||||||
| e | EPL Oil & Gas Inc., senior note, 8.25%, 2/15/18 | United States | 1,400,000 | 154,000 | ||||||||||
| d | Ferrellgas LP/Ferrellgas Finance Corp., senior note, 144A, 6.75%, 6/15/23 | United States | 2,400,000 | 2,118,000 | ||||||||||
| b,e | Goodrich Petroleum Corp., secured note, second lien, 144A, 8.875%, 3/15/18 | United States | 1,250 | g | 125,000 | |||||||||
| e | Halcon Resources Corp., | |||||||||||||
senior note, 8.875%, 5/15/21 | United States | 1,800,000 | 369,000 | |||||||||||
d senior secured note, third lien, 144A, 13.00%, 2/15/22 | United States | 1,170,000 | 625,950 | |||||||||||
| d,e | Linn Energy LLC/Finance Corp., senior secured note, second lien, 144A, 12.00%, 12/15/20 | United States | 1,800,000 | 625,500 | ||||||||||
Martin Midstream Partners LP/Martin Midstream Finance Corp., senior note, 7.25%, 2/15/21 | United States | 1,100,000 | 1,023,000 | |||||||||||
Memorial Resource Development Corp., senior note, 5.875%, 7/01/22 | United States | 1,100,000 | 1,100,000 | |||||||||||
| e | Midstates Petroleum Co. Inc./LLC, senior note, 9.25%, 6/01/21 | United States | 1,500,000 | 22,500 | ||||||||||
| d | Murray Energy Corp., secured note, second lien, 144A, 11.25%, 4/15/21 | United States | 1,200,000 | 342,000 | ||||||||||
| d,e | Peabody Energy Corp., secured note, second lien, 144A, 10.00%, 3/15/22 | United States | 2,700,000 | 364,500 | ||||||||||
| e | Penn Virginia Corp., senior note, 8.50%, 5/01/20 | United States | 1,200,000 | 468,000 | ||||||||||
QEP Resources Inc., senior bond, | ||||||||||||||
5.375%, 10/01/22 | United States | 1,000,000 | 937,500 | |||||||||||
5.25%, 5/01/23 | United States | 1,500,000 | 1,387,500 | |||||||||||
Sabine Pass Liquefaction LLC, | ||||||||||||||
first lien, 5.625%, 2/01/21 | United States | 2,400,000 | 2,436,000 | |||||||||||
first lien, 5.625%, 4/15/23 | United States | 900,000 | 907,875 | |||||||||||
senior secured note, first lien, 5.75%, 5/15/24 | United States | 200,000 | 199,500 | |||||||||||
Sanchez Energy Corp., senior note, | ||||||||||||||
7.75%, 6/15/21 | United States | 1,800,000 | 1,534,500 | |||||||||||
6.125%, 1/15/23 | United States | 1,000,000 | 777,500 | |||||||||||
Weatherford International Ltd., senior note, | ||||||||||||||
7.75%, 6/15/21 | United States | 1,000,000 | 977,500 | |||||||||||
8.25%, 6/15/23 | United States | 1,300,000 | 1,238,250 | |||||||||||
WPX Energy Inc., senior note, 8.25%, 8/01/23 | United States | 1,000,000 | 1,007,500 | |||||||||||
|
| |||||||||||||
| 35,750,906 | ||||||||||||||
|
| |||||||||||||
Food, Beverage & Tobacco 2.6% | ||||||||||||||
Cott Beverages Inc., senior note, 6.75%, 1/01/20 | United States | 1,100,000 | 1,150,875 | |||||||||||
| d | Dole Food Co. Inc., senior secured note, 144A, 7.25%, 5/01/19 | United States | 500,000 | 500,000 | ||||||||||
| Semiannual Report | FH-11 |
FRANKLIN TEMPLETON VARIABLE INSURANCE PRODUCTS TRUST
STATEMENT OF INVESTMENTS (UNAUDITED)
Franklin High Income VIP Fund (continued)
| Country | Principal Amount* | Value | ||||||||||||
Corporate Bonds (continued) | ||||||||||||||
Food, Beverage & Tobacco (continued) | ||||||||||||||
| d | JBS USA LLC/Finance Inc., | |||||||||||||
senior bond, 144A, 5.875%, 7/15/24 | United States | 1,500,000 | $ | 1,460,625 | ||||||||||
senior note, 144A, 8.25%, 2/01/20 | United States | 1,000,000 | 1,040,000 | |||||||||||
Post Holdings Inc., senior note, | ||||||||||||||
7.375%, 2/15/22 | United States | 1,600,000 | 1,688,000 | |||||||||||
d 144A, 6.75%, 12/01/21 | United States | 600,000 | 636,000 | |||||||||||
d 144A, 6.00%, 12/15/22 | United States | 300,000 | 308,625 | |||||||||||
|
| |||||||||||||
| 6,784,125 | ||||||||||||||
|
| |||||||||||||
Health Care Equipment & Services 5.6% | ||||||||||||||
| d | Acadia Healthcare Co. Inc., senior note, 144A, 6.50%, 3/01/24 | United States | 700,000 | 712,250 | ||||||||||
Alere Inc., senior sub. note, 6.50%, 6/15/20 | United States | 200,000 | 200,000 | |||||||||||
CHS/Community Health Systems Inc., senior note, | ||||||||||||||
7.125%, 7/15/20 | United States | 700,000 | 652,463 | |||||||||||
6.875%, 2/01/22 | United States | 2,300,000 | 2,024,000 | |||||||||||
DaVita HealthCare Partners Inc., senior bond, 5.125%, 7/15/24 | United States | 2,000,000 | 2,025,950 | |||||||||||
HCA Inc., | ||||||||||||||
senior bond, 5.875%, 5/01/23 | United States | 1,000,000 | 1,068,750 | |||||||||||
senior bond, 5.375%, 2/01/25 | United States | 1,500,000 | 1,541,250 | |||||||||||
senior secured note, first lien, 5.00%, 3/15/24 | United States | 2,300,000 | 2,386,250 | |||||||||||
| d | MPH Acquisition Holdings LLC, senior note, 144A, 7.125%, 6/01/24 | United States | 400,000 | 421,000 | ||||||||||
Tenet Healthcare Corp., senior note, | ||||||||||||||
5.00%, 3/01/19 | United States | 200,000 | 194,500 | |||||||||||
8.125%, 4/01/22 | United States | 3,000,000 | 3,089,400 | |||||||||||
6.75%, 6/15/23 | United States | 300,000 | 288,375 | |||||||||||
|
| |||||||||||||
| 14,604,188 | ||||||||||||||
|
| |||||||||||||
Materials 13.2% | ||||||||||||||
| d | American Builders & Contractors Supply Co. Inc., senior note, 144A, 5.625%, 4/15/21 | United States | 2,100,000 | 2,178,750 | ||||||||||
ArcelorMittal, senior note, | ||||||||||||||
6.50%, 3/01/21 | France | 1,900,000 | 1,961,702 | |||||||||||
6.125%, 6/01/25 | France | 700,000 | 700,000 | |||||||||||
| d | Ardagh Packaging Finance PLC/Ardagh MP Holdings USA Inc., senior note, 144A, | |||||||||||||
7.00%, 11/15/20 | Luxembourg | 176,471 | 173,824 | |||||||||||
6.75%, 1/31/21 | Luxembourg | 300,000 | 302,250 | |||||||||||
6.00%, 6/30/21 | Luxembourg | 1,900,000 | 1,895,250 | |||||||||||
| d | Barminco Finance Pty. Ltd., senior note, 144A, 9.00%, 6/01/18 | Australia | 1,600,000 | 1,329,504 | ||||||||||
| d | Blue Cube Spinco Inc., senior bond, 144A, 10.00%, 10/15/25 | United States | 1,200,000 | 1,392,000 | ||||||||||
| d | BlueScope Steel Ltd./BlueScope Steel Finance, senior note, 144A, 7.125%, 5/01/18 | Australia | 738,000 | 767,520 | ||||||||||
| d | Cemex Finance LLC, senior secured note, first lien, 144A, 6.00%, 4/01/24 | Mexico | 1,700,000 | 1,652,553 | ||||||||||
| d | Cemex SAB de CV, senior secured bond, first lien, 144A, 6.125%, 5/05/25 | Mexico | 1,400,000 | 1,364,244 | ||||||||||
The Chemours Co., | ||||||||||||||
senior bond, 7.00%, 5/15/25 | United States | 500,000 | 421,875 | |||||||||||
senior note, 6.625%, 5/15/23 | United States | 1,800,000 | 1,539,000 | |||||||||||
| d | CVR Partners LP/CVR Nitrogen Finance Corp., 144A, 9.25%, 6/15/23 | United States | 1,000,000 | 1,021,250 | ||||||||||
| d | Eldorado Gold Corp., senior note, 144A, 6.125%, 12/15/20 | Canada | 1,600,000 | 1,608,000 | ||||||||||
| FH-12 | Semiannual Report |
FRANKLIN TEMPLETON VARIABLE INSURANCE PRODUCTS TRUST
STATEMENT OF INVESTMENTS (UNAUDITED)
Franklin High Income VIP Fund (continued)
| Country | Principal Amount* | Value | ||||||||||||
Corporate Bonds (continued) | ||||||||||||||
Materials (continued) | ||||||||||||||
| d | First Quantum Minerals Ltd., senior note, 144A, | |||||||||||||
6.75%, 2/15/20 | Canada | 2,000,000 | $ | 1,680,000 | ||||||||||
7.00%, 2/15/21 | Canada | 1,836,000 | 1,484,865 | |||||||||||
| d | FMG Resources (August 2006) Pty. Ltd., senior secured note, 144A, 9.75%, 3/01/22 | Australia | 1,000,000 | 1,110,000 | ||||||||||
| d | NOVA Chemicals Corp., senior bond, 144A, 5.00%, 5/01/25 | Canada | 2,000,000 | 1,985,000 | ||||||||||
| d | Owens-Brockway Glass Container Inc., senior note, 144A, | |||||||||||||
5.00%, 1/15/22 | United States | 1,400,000 | 1,407,000 | |||||||||||
5.875%, 8/15/23 | United States | 600,000 | 631,377 | |||||||||||
| d | Platform Specialty Products Corp., senior note, 144A, | |||||||||||||
10.375%, 5/01/21 | United States | 300,000 | 303,000 | |||||||||||
6.50%, 2/01/22 | United States | 1,500,000 | 1,327,500 | |||||||||||
| d | Rain CII Carbon LLC/CII Carbon Corp., second lien, 144A, 8.25%, 1/15/21 | United States | 1,200,000 | 978,000 | ||||||||||
| d | Reynolds Group Issuer Inc./Reynolds Group Issuer LLC/Reynolds Group Issuer Luxembourg SA, | |||||||||||||
first lien, 144A, 5.125%, 7/15/23 | United States | 1,200,000 | 1,216,500 | |||||||||||
senior note, 144A, 7.00%, 7/15/24 | United States | 500,000 | 515,687 | |||||||||||
Steel Dynamics Inc., | ||||||||||||||
senior bond, 5.50%, 10/01/24 | United States | 800,000 | 820,000 | |||||||||||
senior note, 5.125%, 10/01/21 | United States | 800,000 | 821,000 | |||||||||||
| d | Summit Materials LLC/Summit Materials Finance Corp., senior note, 144A, 8.50%, 4/15/22 | United States | 1,800,000 | 1,914,750 | ||||||||||
| e | Verso Paper Holdings LLC/Inc., senior secured note, first lien, 11.75%, 1/15/19 | United States | 451,000 | 77,798 | ||||||||||
|
| |||||||||||||
| 34,580,199 | ||||||||||||||
|
| |||||||||||||
Media 10.2% | ||||||||||||||
| d | Altice U.S. Finance I Corp., senior secured bond, 144A, 5.50%, 5/15/26 | United States | 1,500,000 | 1,503,750 | ||||||||||
AMC Networks Inc., senior note, 5.00%, 4/01/24 | United States | 1,500,000 | 1,490,437 | |||||||||||
CCO Holdings LLC/CCO Holdings Capital Corp., senior bond, | ||||||||||||||
5.25%, 9/30/22 | United States | 1,000,000 | 1,028,750 | |||||||||||
d 144A, 5.375%, 5/01/25 | United States | 800,000 | 814,000 | |||||||||||
d 144A, 5.75%, 2/15/26 | United States | 500,000 | 516,250 | |||||||||||
Clear Channel Worldwide Holdings Inc., | ||||||||||||||
senior note, 6.50%, 11/15/22 | United States | 1,000,000 | 1,005,000 | |||||||||||
senior sub. note, 7.625%, 3/15/20 | United States | 1,100,000 | 1,052,150 | |||||||||||
CSC Holdings LLC, senior note, | ||||||||||||||
6.75%, 11/15/21 | United States | 1,500,000 | 1,533,750 | |||||||||||
5.25%, 6/01/24 | United States | 1,000,000 | 910,000 | |||||||||||
DISH DBS Corp., senior note, 5.875%, 11/15/24 | United States | 3,500,000 | 3,281,250 | |||||||||||
Gannett Co. Inc., | ||||||||||||||
senior bond, 6.375%, 10/15/23 | United States | 2,000,000 | 2,132,500 | |||||||||||
senior note, 5.125%, 7/15/20 | United States | 500,000 | 516,875 | |||||||||||
iHeartCommunications Inc., | ||||||||||||||
senior secured bond, first lien, 9.00%, 3/01/21 | United States | 2,500,000 | 1,771,875 | |||||||||||
senior secured note, first lien, 9.00%, 9/15/22 | United States | 700,000 | 488,250 | |||||||||||
| d | Radio One Inc., senior sub. note, 144A, 9.25%, 2/15/20 | United States | 800,000 | 712,000 | ||||||||||
| d | Sirius XM Radio Inc., senior bond, 144A, 6.00%, 7/15/24 | United States | 2,500,000 | 2,590,625 | ||||||||||
| d | Virgin Media Finance PLC, senior bond, 144A, 6.375%, 4/15/23 | United Kingdom | 1,700,000 | 1,708,500 | ||||||||||
| Semiannual Report | FH-13 |
FRANKLIN TEMPLETON VARIABLE INSURANCE PRODUCTS TRUST
STATEMENT OF INVESTMENTS (UNAUDITED)
Franklin High Income VIP Fund (continued)
| Country | Principal Amount* | Value | ||||||||||||
Corporate Bonds (continued) | ||||||||||||||
Media (continued) | ||||||||||||||
| d | Virgin Media Secured Finance PLC, senior secured bond, first lien, 144A, 5.50%, 1/15/25 | United Kingdom | 1,100,000 | $ | 1,084,875 | |||||||||
| d | WMG Acquisition Corp., senior note, 144A, 5.625%, 4/15/22 | United States | 2,500,000 | 2,565,625 | ||||||||||
|
| |||||||||||||
| 26,706,462 | ||||||||||||||
|
| |||||||||||||
Pharmaceuticals, Biotechnology & Life Sciences 3.7% | ||||||||||||||
| d | Concordia International Corp., senior note, 144A, 7.00%, 4/15/23 | Canada | 1,300,000 | 1,114,750 | ||||||||||
| d | Endo Finance LLC/Endo Ltd./Endo Finco Inc., | |||||||||||||
senior bond, 144A, 6.00%, 2/01/25 | United States | 1,500,000 | 1,308,750 | |||||||||||
senior note, 144A, 6.00%, 7/15/23 | United States | 700,000 | 619,500 | |||||||||||
Horizon Pharma Inc., senior note, 6.625%, 5/01/23 | United States | 2,500,000 | 2,325,000 | |||||||||||
| d | Jaguar Holding Co. II/Pharmaceutical Product Development LLC, senior note, 144A, 6.375%, 8/01/23 | United States | 900,000 | 922,500 | ||||||||||
| d | Valeant Pharmaceuticals International, senior note, 144A, 6.375%, 10/15/20 | United States | 3,000,000 | 2,595,000 | ||||||||||
| d | Valeant Pharmaceuticals International Inc., | |||||||||||||
senior bond, 144A, 6.125%, 4/15/25 | United States | 700,000 | 563,500 | |||||||||||
senior note, 144A, 5.625%, 12/01/21 | United States | 300,000 | 249,000 | |||||||||||
|
| |||||||||||||
| 9,698,000 | ||||||||||||||
|
| |||||||||||||
Real Estate 1.1% | ||||||||||||||
Equinix Inc., senior bond, 5.375%, 4/01/23 | United States | 2,800,000 | 2,905,000 | |||||||||||
|
| |||||||||||||
Retailing 1.4% | ||||||||||||||
| d | Argos Merger Sub Inc., senior note, 144A, 7.125%, 3/15/23 | United States | 1,600,000 | 1,650,000 | ||||||||||
Netflix Inc., senior bond, 5.875%, 2/15/25 | United States | 1,900,000 | 2,002,125 | |||||||||||
|
| |||||||||||||
| 3,652,125 | ||||||||||||||
|
| |||||||||||||
Semiconductors & Semiconductor Equipment 0.8% | ||||||||||||||
| d | Microsemi Corp., senior note, 144A, 9.125%, 4/15/23 | United States | 700,000 | 773,500 | ||||||||||
| d | Qorvo Inc., senior bond, 144A, 7.00%, 12/01/25 | United States | 1,200,000 | 1,272,000 | ||||||||||
|
| |||||||||||||
| 2,045,500 | ||||||||||||||
|
| |||||||||||||
Software & Services 3.0% | ||||||||||||||
| d | BMC Software Finance Inc., senior note, 144A, 8.125%, 7/15/21 | United States | 3,000,000 | 2,265,000 | ||||||||||
| d | First Data Corp., | |||||||||||||
second lien, 144A, 5.75%, 1/15/24 | United States | 2,900,000 | 2,885,500 | |||||||||||
senior note, 144A, 7.00%, 12/01/23 | United States | 700,000 | 713,125 | |||||||||||
Infor (U.S.) Inc., senior note, 6.50%, 5/15/22 | United States | 2,000,000 | 1,898,760 | |||||||||||
|
| |||||||||||||
| 7,762,385 | ||||||||||||||
|
| |||||||||||||
Technology Hardware & Equipment 3.0% | ||||||||||||||
| d | Blackboard Inc., senior note, 144A, 7.75%, 11/15/19 | United States | 2,000,000 | 1,690,000 | ||||||||||
| d | CommScope Technologies Finance LLC, senior bond, 144A, 6.00%, 6/15/25 | United States | 1,600,000 | 1,648,000 | ||||||||||
| d | Diamond 1 Finance Corp./Diamond 2 Finance Corp., | |||||||||||||
senior note, 144A, 5.875%, 6/15/21 | United States | 300,000 | 307,734 | |||||||||||
senior note, 144A, 7.125%, 6/15/24 | United States | 300,000 | 313,801 | |||||||||||
senior secured bond, first lien, 144A, 5.45%, 6/15/23 | United States | 700,000 | 726,873 | |||||||||||
senior secured bond, first lien, 144A, 6.02%, 6/15/26 | United States | 500,000 | 519,703 | |||||||||||
| d | Western Digital Corp., senior note, 144A, 10.50%, 4/01/24 | United States | 2,400,000 | 2,574,000 | ||||||||||
|
| |||||||||||||
| 7,780,111 | ||||||||||||||
|
| |||||||||||||
| FH-14 | Semiannual Report |
FRANKLIN TEMPLETON VARIABLE INSURANCE PRODUCTS TRUST
STATEMENT OF INVESTMENTS (UNAUDITED)
Franklin High Income VIP Fund (continued)
| Country | Principal Amount* | Value | ||||||||||||
Corporate Bonds (continued) | ||||||||||||||
Telecommunication Services 9.1% | ||||||||||||||
CenturyLink Inc., | ||||||||||||||
senior bond, 6.75%, 12/01/23 | United States | 300,000 | $ | 295,875 | ||||||||||
senior note, 6.45%, 6/15/21 | United States | 400,000 | 407,500 | |||||||||||
senior note, 5.80%, 3/15/22 | United States | 2,500,000 | 2,436,725 | |||||||||||
| d | Digicel Group Ltd., senior note, 144A, 8.25%, 9/30/20 | Bermuda | 1,500,000 | 1,257,120 | ||||||||||
| d | Digicel Ltd., senior note, 144A, 6.00%, 4/15/21 | Bermuda | 2,200,000 | 1,894,750 | ||||||||||
Intelsat Jackson Holdings SA, | ||||||||||||||
senior bond, 5.50%, 8/01/23 | Luxembourg | 1,500,000 | 960,000 | |||||||||||
senior note, 7.50%, 4/01/21 | Luxembourg | 3,800,000 | 2,641,000 | |||||||||||
Sprint Communications Inc., senior note, | ||||||||||||||
8.375%, 8/15/17 | United States | 1,500,000 | 1,545,000 | |||||||||||
d 144A, 9.00%, 11/15/18 | United States | 3,000,000 | 3,206,250 | |||||||||||
Sprint Corp., senior bond, | ||||||||||||||
7.875%, 9/15/23 | United States | 500,000 | 411,250 | |||||||||||
7.125%, 6/15/24 | United States | 500,000 | 398,125 | |||||||||||
T-Mobile USA Inc., | ||||||||||||||
senior bond, 6.50%, 1/15/24 | United States | 900,000 | 950,625 | |||||||||||
senior bond, 6.375%, 3/01/25 | United States | 1,600,000 | 1,678,000 | |||||||||||
senior note, 6.542%, 4/28/20 | United States | 1,600,000 | 1,650,016 | |||||||||||
senior note, 6.125%, 1/15/22 | United States | 200,000 | 210,500 | |||||||||||
senior note, 6.00%, 4/15/24 | United States | 600,000 | 625,500 | |||||||||||
| d | Wind Acquisition Finance SA, | |||||||||||||
secured note, second lien, 144A, 7.375%, 4/23/21 | Italy | 3,000,000 | 2,859,015 | |||||||||||
senior secured note, first lien, 144A, 4.75%, 7/15/20 | Italy | 500,000 | 492,500 | |||||||||||
|
| |||||||||||||
| 23,919,751 | ||||||||||||||
|
| |||||||||||||
Transportation 0.9% | ||||||||||||||
| d | Florida East Coast Holdings Corp., | |||||||||||||
secured note, first lien, 144A, 6.75%, 5/01/19 | United States | 900,000 | 900,000 | |||||||||||
senior note, 144A, 9.75%, 5/01/20 | United States | 500,000 | 427,500 | |||||||||||
| d | Stena International SA, senior secured bond, first lien, 144A, 5.75%, 3/01/24 | Sweden | 1,300,000 | 1,072,500 | ||||||||||
|
| |||||||||||||
| 2,400,000 | ||||||||||||||
|
| |||||||||||||
Utilities 3.2% | ||||||||||||||
Calpine Corp., | ||||||||||||||
senior bond, 5.75%, 1/15/25 | United States | 1,200,000 | 1,171,500 | |||||||||||
senior note, 5.375%, 1/15/23 | United States | 1,300,000 | 1,274,000 | |||||||||||
d senior secured bond, first lien, 144A, 5.875%, 1/15/24 | United States | 400,000 | 418,000 | |||||||||||
| d | InterGen NV, secured bond, 144A, 7.00%, 6/30/23 | Netherlands | 3,000,000 | 2,137,500 | ||||||||||
NRG Yield Operating LLC, senior bond, 5.375%, 8/15/24 | United States | 2,000,000 | 2,000,000 | |||||||||||
Talen Energy Supply LLC, senior bond, 6.50%, 6/01/25 | United States | 700,000 | 584,500 | |||||||||||
| d,e | Texas Competitive Electric Holdings Co. LLC/Texas Competitive | |||||||||||||
Electric Holdings Finance Inc., senior secured note, first lien, 144A, 11.50%, 10/01/20 | United States | 2,500,000 | 856,250 | |||||||||||
|
| |||||||||||||
| 8,441,750 | ||||||||||||||
|
| |||||||||||||
Total Corporate Bonds (Cost $273,011,528) | 242,535,548 | |||||||||||||
|
| |||||||||||||
| h,i | Senior Floating Rate Interests (Cost $1,515,654) 0.6% | |||||||||||||
Household & Personal Products 0.6% | ||||||||||||||
Sun Products Corp., Tranche B Term Loan, 5.50%, 3/23/20 | United States | 1,524,607 | 1,527,466 | |||||||||||
|
| |||||||||||||
| Semiannual Report | FH-15 |
FRANKLIN TEMPLETON VARIABLE INSURANCE PRODUCTS TRUST
STATEMENT OF INVESTMENTS (UNAUDITED)
Franklin High Income VIP Fund (continued)
| Country | Shares | Value | ||||||||||||
Escrows and Litigation Trusts (Cost $ —) 0.0% | ||||||||||||||
| a,b | NewPage Corp., Litigation Trust | United States | 2,500,000 | $ | — | |||||||||
|
| |||||||||||||
Total Investments before Short Term Investments | 244,314,590 | |||||||||||||
|
| |||||||||||||
| Principal Amount* | ||||||||||||||
Short Term Investments (Cost $6,138,978) 2.4% | ||||||||||||||
Repurchase Agreements 2.4% | ||||||||||||||
| j | Joint Repurchase Agreement, 0.382%, 7/01/16 | United States | 6,138,978 | 6,138,978 | ||||||||||
BNP Paribas Securities Corp. (Maturity Value $1,991,076) | ||||||||||||||
Collateralized by U.S. Government Agency Securities, | ||||||||||||||
|
| |||||||||||||
Total Investments (Cost $281,732,383) 95.7% | 250,453,568 | |||||||||||||
Other Assets, less Liabilities 4.3% | 11,385,555 | |||||||||||||
|
| |||||||||||||
Net Assets 100.0% | $ | 261,839,123 | ||||||||||||
|
| |||||||||||||
See Abbreviations on page FH-26.
†Rounds to less than 0.1% of net assets.
*The principal amount is stated in U.S. dollars unless otherwise indicated.
aNon-income producing.
bSecurity has been deemed illiquid because it may not be able to be sold within seven days. At June 30, 2016, the aggregate value of these securities was $376,767, representing 0.1% of net assets.
cPerpetual security with no stated maturity date.
dSecurity was purchased pursuant to Rule 144A under the Securities Act of 1933 and may be sold in transactions exempt from registration only to qualified institutional buyers or in a public offering registered under the Securities Act of 1933. These securities have been deemed liquid under guidelines approved by the Trust’s Board of Trustees. At June 30, 2016, the aggregate value of these securities was $118,323,476, representing 45.2% of net assets.
eSee Note 7 regarding defaulted securities.
fAt June 30, 2016, pursuant to the Fund’s policies and the requirements of applicable securities law, the Fund is restricted from trading these securities at period end.
gPrincipal amount is stated in 1,000 Units.
hSee Note 1(d) regarding senior floating rate interests.
iThe coupon rate shown represents the rate at period end.
j See Note 1(c) regarding joint repurchase agreement.
| FH-16 | Semiannual Report | The accompanying notes are an integral part of these financial statements. |
FRANKLIN TEMPLETON VARIABLE INSURANCE PRODUCTS TRUST
Financial Statements
Statement of Assets and Liabilities
June 30, 2016 (unaudited)
| Franklin High Income VIP Fund | ||||
Assets: | ||||
Investments in securities: | ||||
Cost - Unaffiliated issuers | $ | 275,593,405 | ||
Cost - Repurchase agreements | 6,138,978 | |||
|
| |||
Total cost of investments | $ | 281,732,383 | ||
|
| |||
Value - Unaffiliated issuers | $ | 244,314,590 | ||
Value - Repurchase agreements | 6,138,978 | |||
|
| |||
Total value of investments | 250,453,568 | |||
Receivables: | ||||
Investment securities sold | 2,461,918 | |||
Capital shares sold | 5,319,321 | |||
Interest | 4,029,675 | |||
Other assets | 114 | |||
|
| |||
Total assets | 262,264,596 | |||
|
| |||
Liabilities: | ||||
Payables: | ||||
Capital shares redeemed | 139,627 | |||
Management fees | 115,850 | |||
Distribution fees | 100,363 | |||
Trustees’ fees and expenses | 23 | |||
Reports to shareholders | 40,904 | |||
Professional fees | 21,956 | |||
Accrued expenses and other liabilities | 6,750 | |||
|
| |||
Total liabilities | 425,473 | |||
|
| |||
Net assets, at value | $ | 261,839,123 | ||
|
| |||
Net assets consist of: | ||||
Paid-in capital | $ | 315,989,450 | ||
Undistributed net investment income | 5,579,077 | |||
Net unrealized appreciation (depreciation) | (31,278,815 | ) | ||
Accumulated net realized gain (loss) | (28,450,589 | ) | ||
|
| |||
Net assets, at value | $ | 261,839,123 | ||
|
| |||
| Class 1: | ||||
Net assets, at value | $ | 26,977,476 | ||
|
| |||
Shares outstanding | 4,754,968 | |||
|
| |||
Net asset value and maximum offering price per share | $ | 5.67 | ||
|
| |||
| Class 2: | ||||
Net assets, at value | $ | 212,063,417 | ||
|
| |||
Shares outstanding | 38,690,817 | |||
|
| |||
Net asset value and maximum offering price per share | $ | 5.48 | ||
|
| |||
| Class 4: | ||||
Net assets, at value | $ | 22,798,230 | ||
|
| |||
Shares outstanding | 4,061,095 | |||
|
| |||
Net asset value and maximum offering price per share | $ | 5.61 | ||
|
| |||
| The accompanying notes are an integral part of these financial statements. | Semiannual Report | FH-17 |
FRANKLIN TEMPLETON VARIABLE INSURANCE PRODUCTS TRUST
FINANCIAL STATEMENTS
Statement of Operations
for the six months ended June 30, 2016 (unaudited)
| Franklin High Income VIP Fund | ||||
Investment income: | ||||
Interest | $ | 8,351,258 | ||
|
| |||
Expenses: | ||||
Management fees (Note 3a) | 684,216 | |||
Distribution fees: (Note 3c) | ||||
Class 2 | 251,137 | |||
Class 4 | 38,637 | |||
Custodian fees (Note 4) | 1,079 | |||
Reports to shareholders | 40,148 | |||
Professional fees | 25,113 | |||
Trustees’ fees and expenses | 669 | |||
Other | 11,312 | |||
|
| |||
Total expenses | 1,052,311 | |||
Expense reductions (Note 4) | (17 | ) | ||
|
| |||
Net expenses | 1,052,294 | |||
|
| |||
Net investment income | 7,298,964 | |||
|
| |||
Realized and unrealized gains (losses): | ||||
Net realized gain (loss) from investments | (3,421,920 | ) | ||
Net change in unrealized appreciation (depreciation) on investments | 15,969,619 | |||
|
| |||
Net realized and unrealized gain (loss) | 12,547,699 | |||
|
| |||
Net increase (decrease) in net assets resulting from operations | $ | 19,846,663 | ||
|
| |||
| FH-18 | Semiannual Report | The accompanying notes are an integral part of these financial statements. |
FRANKLIN TEMPLETON VARIABLE INSURANCE PRODUCTS TRUST
FINANCIAL STATEMENTS
Statements of Changes in Net Assets
| Franklin High Income VIP Fund | ||||||||
| Six Months Ended June 30, 2016 (unaudited) | Year Ended December 31, 2015 | |||||||
Increase (decrease) in net assets: | ||||||||
Operations: | ||||||||
Net investment income | $ | 7,298,964 | $ | 17,823,602 | ||||
Net realized gain (loss) | (3,421,920 | ) | (8,895,014 | ) | ||||
Net change in unrealized appreciation (depreciation) | 15,969,619 | (34,561,954 | ) | |||||
|
| |||||||
Net increase (decrease) in net assets resulting from operations | 19,846,663 | (25,633,366 | ) | |||||
|
| |||||||
Distributions to shareholders from: | ||||||||
Net investment income: | ||||||||
Class 1 | (1,890,311 | ) | (2,177,640 | ) | ||||
Class 2 | (14,579,216 | ) | (17,219,440 | ) | ||||
Class 4 | (1,529,698 | ) | (1,604,998 | ) | ||||
|
| |||||||
Total distributions to shareholders | (17,999,225 | ) | (21,002,078 | ) | ||||
|
| |||||||
Capital share transactions: (Note 2) | ||||||||
Class 1 | (80,442 | ) | (2,896,859 | ) | ||||
Class 2 | 5,355,423 | (18,609,864 | ) | |||||
Class 4 | 834,627 | (212,162 | ) | |||||
|
| |||||||
Total capital share transactions | 6,109,608 | (21,718,885 | ) | |||||
|
| |||||||
Net increase (decrease) in net assets | 7,957,046 | (68,354,329 | ) | |||||
Net assets: | ||||||||
Beginning of period | 253,882,077 | 322,236,406 | ||||||
|
| |||||||
End of period | $ | 261,839,123 | $ | 253,882,077 | ||||
|
| |||||||
Undistributed net investment income included in net assets: | ||||||||
End of period | $ | 5,579,077 | $ | 16,279,338 | ||||
|
| |||||||
| The accompanying notes are an integral part of these financial statements. | Semiannual Report | FH-19 |
FRANKLIN TEMPLETON VARIABLE INSURANCE PRODUCTS TRUST
Notes to Financial Statements (unaudited)
Franklin High Income VIP Fund
1. Organization and Significant Accounting Policies
Franklin Templeton Variable Insurance Products Trust (Trust) is registered under the Investment Company Act of 1940 (1940 Act) as an open-end management investment company, consisting of nineteen separate funds and applies the specialized accounting and reporting guidance in U.S. Generally Accepted Accounting Principles (U.S. GAAP). Franklin High Income VIP Fund (Fund) is included in this report. The financial statements of the remaining funds in the Trust are presented separately. Shares of the Fund are generally sold only to insurance company separate accounts to fund the benefits of variable life insurance policies or variable annuity contracts. At June 30, 2016, 85.09% of the Fund’s shares were held through one insurance company. Investment activities of these insurance company separate accounts could have a material impact on the Fund. The Fund offers three classes of shares: Class 1, Class 2, and Class 4. Each class of shares differs by its distribution fees, voting rights on matters affecting a single class and its exchange privilege.
The following summarizes the Fund’s significant accounting policies.
a. Financial Instrument Valuation
The Fund’s investments in financial instruments are carried at fair value daily. Fair value is the price that would be received to sell an asset or paid to transfer a liability in an orderly transaction between market participants on the measurement date. The Fund calculates the net asset value (NAV) per share as of 4 p.m. Eastern time each day the New York Stock Exchange (NYSE) is open for trading. Under compliance policies and procedures approved by the Trust’s Board of Trustees (the Board), the Fund’s administrator has responsibility for oversight of valuation, including leading the cross-functional Valuation Committee (VC). The VC provides administration and oversight of the Fund’s valuation policies and procedures, which are approved annually by the Board. Among other things, these procedures allow the Fund to utilize independent pricing services, quotations from securities and financial instrument dealers, and other market sources to determine fair value.
Equity securities listed on an exchange or on the NASDAQ National Market System are valued at the last quoted sale price or the official closing price of the day, respectively. Foreign equity securities are valued as of the close of trading on the foreign stock exchange on which the security is primarily traded or
as of 4 p.m. Eastern time whichever is earlier. The value is then converted into its U.S. dollar equivalent at the foreign exchange rate in effect at 4 p.m. Eastern time on the day that the value of the security is determined. Over-the-counter (OTC) securities are valued within the range of the most recent quoted bid and ask prices. Securities that trade in multiple markets or on multiple exchanges are valued according to the broadest and most representative market. Certain equity securities are valued based upon fundamental characteristics or relationships to similar securities.
Debt securities generally trade in the OTC market rather than on a securities exchange. The Fund’s pricing services use multiple valuation techniques to determine fair value. In instances where sufficient market activity exists, the pricing services may utilize a market-based approach through which quotes from market makers are used to determine fair value. In instances where sufficient market activity may not exist or is limited, the pricing services also utilize proprietary valuation models which may consider market characteristics such as benchmark yield curves, credit spreads, estimated default rates, anticipated market interest rate volatility, coupon rates, anticipated timing of principal repayments, underlying collateral, and other unique security features in order to estimate the relevant cash flows, which are then discounted to calculate the fair value. Securities denominated in a foreign currency are converted into their U.S. dollar equivalent at the foreign exchange rate in effect at 4 p.m. Eastern time on the date that the values of the foreign debt securities are determined.
Repurchase agreements are valued at cost, which approximates fair value.
The Fund has procedures to determine the fair value of financial instruments for which market prices are not reliable or readily available. Under these procedures, the VC convenes on a regular basis to review such financial instruments and considers a number of factors, including significant unobservable valuation inputs, when arriving at fair value. The VC primarily employs a market-based approach which may use related or comparable assets or liabilities, recent transactions, market multiples, book values, and other relevant information for the investment to determine the fair value of the investment. An income-based valuation approach may also be used in which the anticipated future cash flows of the investment are discounted to calculate fair value. Discounts may also be applied due to the nature or duration of any restrictions on the disposition of the
| FH-20 | Semiannual Report |
FRANKLIN TEMPLETON VARIABLE INSURANCE PRODUCTS TRUST
NOTES TO FINANCIAL STATEMENTS (UNAUDITED)
Franklin High Income VIP Fund (continued)
investments. Due to the inherent uncertainty of valuations of such investments, the fair values may differ significantly from the values that would have been used had an active market existed. The VC employs various methods for calibrating these valuation approaches including a regular review of key inputs and assumptions, transactional back-testing or disposition analysis, and reviews of any related market activity.
Trading in securities on foreign securities stock exchanges and OTC markets may be completed before 4 p.m. Eastern time. In addition, trading in certain foreign markets may not take place on every NYSE business day. Occasionally, events occur between the time at which trading in a foreign security is completed and the close of the NYSE that might call into question the reliability of the value of a portfolio security held by the Fund. As a result, differences may arise between the value of the Fund’s portfolio securities as determined at the foreign market close and the latest indications of value at the close of the NYSE. In order to minimize the potential for these differences, the VC monitors price movements following the close of trading in foreign stock markets through a series of country specific market proxies (such as baskets of American Depositary Receipts, futures contracts and exchange traded funds). These price movements are measured against established trigger thresholds for each specific market proxy to assist in determining if an event has occurred that may call into question the reliability of the values of the foreign securities held by the Fund. If such an event occurs, the securities may be valued using fair value procedures, which may include the use of independent pricing services.
When the last day of the reporting period is a non-business day, certain foreign markets may be open on those days that the NYSE is closed, which could result in differences between the value of the Fund’s portfolio securities on the last business day and the last calendar day of the reporting period. Any significant security valuation changes due to an open foreign market are adjusted and reflected by the Fund for financial reporting purposes.
b. Foreign Currency Translation
Portfolio securities and other assets and liabilities denominated in foreign currencies are translated into U.S. dollars based on the exchange rate of such currencies against U.S. dollars on the date of valuation. The Fund may enter into foreign currency exchange contracts to facilitate transactions denominated in a foreign currency. Purchases and sales of securities, income and
expense items denominated in foreign currencies are translated into U.S. dollars at the exchange rate in effect on the transaction date. Portfolio securities and assets and liabilities denominated in foreign currencies contain risks that those currencies will decline in value relative to the U.S. dollar. Occasionally, events may impact the availability or reliability of foreign exchange rates used to convert the U.S. dollar equivalent value. If such an event occurs, the foreign exchange rate will be valued at fair value using procedures established and approved by the Board.
The Fund does not separately report the effect of changes in foreign exchange rates from changes in market prices on securities held. Such changes are included in net realized and unrealized gain or loss from investments in the Statement of Operations.
Realized foreign exchange gains or losses arise from sales of foreign currencies, currency gains or losses realized between the trade and settlement dates on securities transactions and the difference between the recorded amounts of dividends, interest, and foreign withholding taxes and the U.S. dollar equivalent of the amounts actually received or paid. Net unrealized foreign exchange gains and losses arise from changes in foreign exchange rates on foreign denominated assets and liabilities other than investments in securities held at the end of the reporting period.
c. Joint Repurchase Agreement
The Fund enters into a joint repurchase agreement whereby its uninvested cash balance is deposited into a joint cash account with other funds managed by the investment manager or an affiliate of the investment manager and is used to invest in one or more repurchase agreements. The value and face amount of the joint repurchase agreement are allocated to the funds based on their pro-rata interest. A repurchase agreement is accounted for as a loan by the Fund to the seller, collateralized by securities which are delivered to the Fund’s custodian. The fair value, including accrued interest, of the initial collateralization is required to be at least 102% of the dollar amount invested by the funds, with the value of the underlying securities marked to market daily to maintain coverage of at least 100%. Repurchase agreements are subject to the terms of Master Repurchase Agreements (MRAs) with approved counterparties (sellers). The MRAs contain various provisions, including but not limited to events of default and maintenance of collateral for repurchase agreements. In the event of default by either the seller or the Fund, certain MRAs may permit the non-defaulting party to net
| Semiannual Report | FH-21 |
FRANKLIN TEMPLETON VARIABLE INSURANCE PRODUCTS TRUST
NOTES TO FINANCIAL STATEMENTS (UNAUDITED)
Franklin High Income VIP Fund (continued)
1. Organization and Significant Accounting Policies (continued)
c. Joint Repurchase Agreement (continued)
and close-out all transactions, if any, traded under such agreements. The Fund may sell securities it holds as collateral and apply the proceeds towards the repurchase price and any other amounts owed by the seller to the Fund in the event of default by the seller. This could involve costs or delays in addition to a loss on the securities if their value falls below the repurchase price owed by the seller. The joint repurchase agreement held by the Fund at period end, as indicated in the Statement of Investments, had been entered into on June 30, 2016.
d. Senior Floating Rate Interests
The Fund invests in senior secured corporate loans that pay interest at rates which are periodically reset by reference to a base lending rate plus a spread. These base lending rates are generally the prime rate offered by a designated U.S. bank or the London InterBank Offered Rate (LIBOR). Senior secured corporate loans often require prepayment of principal from excess cash flows or at the discretion of the borrower. As a result, actual maturity may be substantially less than the stated maturity. Senior secured corporate loans in which the Fund invests are generally readily marketable, but may be subject to certain restrictions on resale.
e. Income and Deferred Taxes
It is the Fund’s policy to qualify as a regulated investment company under the Internal Revenue Code. The Fund intends to distribute to shareholders substantially all of its taxable income and net realized gains to relieve it from federal income and if applicable, excise taxes. As a result, no provision for U.S. federal income taxes is required.
The Fund may be subject to foreign taxation related to income received, capital gains on the sale of securities and certain foreign currency transactions in the foreign jurisdictions in which it invests. Foreign taxes, if any, are recorded based on the tax regulations and rates that exist in the foreign markets in which the Fund invests. When a capital gain tax is determined to apply, the Fund records an estimated deferred tax liability in an amount that would be payable if the securities were disposed of on the valuation date.
The Fund may recognize an income tax liability related to its uncertain tax positions under U.S. GAAP when the uncertain
tax position has a less than 50% probability that it will be sustained upon examination by the tax authorities based on its technical merits. As of June 30, 2016, the Fund has determined that no tax liability is required in its financial statements related to uncertain tax positions for any open tax years (or expected to be taken in future tax years). Open tax years are those that remain subject to examination and are based on each tax jurisdiction’s statute of limitation.
f. Security Transactions, Investment Income, Expenses and Distributions
Security transactions are accounted for on trade date. Realized gains and losses on security transactions are determined on a specific identification basis. Interest income and estimated expenses are accrued daily. Amortization of premium and accretion of discount on debt securities are included in interest income. Facility fees are recognized as income over the expected term of the loan. Distributions to shareholders are recorded on the ex-dividend date and are determined according to income tax regulations (tax basis). Distributable earnings determined on a tax basis may differ from earnings recorded in accordance with U.S. GAAP. These differences may be permanent or temporary. Permanent differences are reclassified among capital accounts to reflect their tax character. These reclassifications have no impact on net assets or the results of operations. Temporary differences are not reclassified, as they may reverse in subsequent periods.
Common expenses incurred by the Trust are allocated among the Funds based on the ratio of net assets of each Fund to the combined net assets of the Trust. Fund specific expenses are charged directly to the fund that incurred the expense.
Realized and unrealized gains and losses and net investment income, not including class specific expenses, are allocated daily to each class of shares based upon the relative proportion of net assets of each class. Differences in per share distributions, by class, are generally due to differences in class specific expenses.
g. Accounting Estimates
The preparation of financial statements in accordance with U.S. GAAP requires management to make estimates and assumptions that affect the reported amounts of assets and liabilities at the date of the financial statements and the amounts of income and expenses during the reporting period. Actual results could differ from those estimates.
| FH-22 | Semiannual Report |
FRANKLIN TEMPLETON VARIABLE INSURANCE PRODUCTS TRUST
NOTES TO FINANCIAL STATEMENTS (UNAUDITED)
Franklin High Income VIP Fund (continued)
h. Guarantees and Indemnifications
Under the Trust’s organizational documents, its officers and trustees are indemnified by the Trust against certain liabilities arising out of the performance of their duties to the Trust. Additionally, in the normal course of business, the Trust, on behalf of the Fund, enters into contracts with service providers
that contain general indemnification clauses. The Trust’s maximum exposure under these arrangements is unknown as this would involve future claims that may be made against the Trust that have not yet occurred. Currently, the Trust expects the risk of loss to be remote.
2. Shares of Beneficial Interest
At June 30, 2016, there were an unlimited number of shares authorized (without par value). Transactions in the Fund’s shares were as follows:
| Six Months Ended June 30, 2016 | Year Ended December 31, 2015 | |||||||||||||||||||
| Shares | Amount | Shares | Amount | |||||||||||||||||
| Class 1 Shares: | ||||||||||||||||||||
Shares sold | 48,240 | $ | 275,100 | 75,416 | $ | 488,620 | ||||||||||||||
Shares issued in reinvestment of distributions | 336,354 | 1,890,311 | 345,109 | 2,177,640 | ||||||||||||||||
Shares redeemed | (395,202 | ) | (2,245,853 | ) | (874,142 | ) | (5,563,119 | ) | ||||||||||||
|
| |||||||||||||||||||
Net increase (decrease) | (10,608 | ) | $ | (80,442 | ) | (453,617 | ) | $ | (2,896,859 | ) | ||||||||||
|
| |||||||||||||||||||
| Class 2 Shares: | ||||||||||||||||||||
Shares sold | 3,993,563 | $ | 21,674,166 | 8,301,712 | $ | 51,141,411 | ||||||||||||||
Shares issued in reinvestment of distributions | 2,684,938 | 14,579,216 | 2,818,239 | 17,219,440 | ||||||||||||||||
Shares redeemed | (5,704,303 | ) | (30,897,959 | ) | (14,249,319 | ) | (86,970,715 | ) | ||||||||||||
|
| |||||||||||||||||||
Net increase (decrease) | 974,198 | $ | 5,355,423 | (3,129,368 | ) | $ | (18,609,864 | ) | ||||||||||||
|
| |||||||||||||||||||
| Class 4 Shares: | ||||||||||||||||||||
Shares sold | 175,339 | $ | 949,644 | 185,105 | $ | 1,139,732 | ||||||||||||||
Shares issued in reinvestment of distributions | 275,125 | 1,529,698 | 256,800 | 1,604,998 | ||||||||||||||||
Shares redeemed | (290,428 | ) | (1,644,715 | ) | (474,184 | ) | (2,956,892 | ) | ||||||||||||
|
| |||||||||||||||||||
Net increase (decrease) | 160,036 | $ | 834,627 | (32,279 | ) | $ | (212,162 | ) | ||||||||||||
|
| |||||||||||||||||||
3. Transactions With Affiliates
Franklin Resources, Inc. is the holding company for various subsidiaries that together are referred to as Franklin Templeton Investments. Certain officers and trustees of the Fund are also officers and/or directors of the following subsidiaries:
| Subsidiary | Affiliation | |
Franklin Advisers, Inc. (Advisers) | Investment manager | |
Franklin Templeton Services, LLC (FT Services) | Administrative manager | |
Franklin Templeton Distributors, Inc. (Distributors) | Principal underwriter | |
Franklin Templeton Investor Services, LLC (Investor Services) | Transfer agent |
| Semiannual Report | FH-23 |
FRANKLIN TEMPLETON VARIABLE INSURANCE PRODUCTS TRUST
NOTES TO FINANCIAL STATEMENTS (UNAUDITED)
Franklin High Income VIP Fund (continued)
3. Transactions With Affiliates (continued)
a. Management Fees
The Fund pays an investment management fee to Advisers based on the average daily net assets of the Fund as follows:
| Annualized Fee Rate | Net Assets | |
0.625% | Up to and including $100 million | |
0.500% | Over $100 million, up to and including $250 million | |
0.450% | Over $250 million, up to and including $7.5 billion | |
0.440% | Over $7.5 billion, up to and including $10 billion | |
0.430% | Over $10 billion, up to and including $12.5 billion | |
0.420% | Over $12.5 billion, up to and including $15 billion | |
0.400% | In excess of $15 billion |
For the period ended June 30, 2016, the annualized effective investment management fee rate was 0.549% of the Fund’s average daily net assets.
b. Administrative Fees
Under an agreement with Advisers, FT Services provides administrative services to the Fund. The fee is paid by Advisers based on the Fund’s average daily net assets, and is not an additional expense of the Fund.
c. Distribution Fees
The Board has adopted distribution plans for Class 2 and Class 4 shares pursuant to Rule 12b-1 under the 1940 Act. Under the Fund’s compensation distribution plans, the Fund pays Distributors for costs incurred in connection with the servicing, sale and distribution of the Fund’s shares up to 0.35% per year of its average daily net assets of each class. The Board has agreed to limit the current rate to 0.25% per year for Class 2. The plan year, for purposes of monitoring compliance with the maximum annual plan rates, is February 1 through January 31.
d. Transfer Agent Fees
Investor Services, under terms of an agreement, performs shareholder servicing for the Fund and is not paid by the Fund for the services.
4. Expense Offset Arrangement
The Fund has entered into an arrangement with its custodian whereby credits realized as a result of uninvested cash balances are used to reduce a portion of the Fund’s custodian expenses. During the period ended June 30, 2016, the custodian fees were reduced as noted in the Statement of Operations.
5. Income Taxes
For tax purposes, capital losses may be carried over to offset future capital gains. Capital loss carryforwards with no expiration, if any, must be fully utilized before those losses with expiration dates.
| FH-24 | Semiannual Report |
FRANKLIN TEMPLETON VARIABLE INSURANCE PRODUCTS TRUST
NOTES TO FINANCIAL STATEMENTS (UNAUDITED)
Franklin High Income VIP Fund (continued)
At June 30, 2016, capital loss carryforwards were as follows:
Capital loss carryforwards subject to expiration: | ||||
2016 | $ | 5,148,804 | ||
2017 | 10,621,353 | |||
Capital loss carryforwards not subject to expiration: | ||||
Short term | 79,444 | |||
Long term | 9,179,067 | |||
|
| |||
Total capital loss carryforwards | $ | 25,028,668 | ||
|
| |||
At June 30, 2016, the cost of investments and net unrealized appreciation (depreciation) for income tax purposes were as follows:
Cost of investments | $ | 282,994,655 | ||
|
| |||
Unrealized appreciation | $ | 4,038,847 | ||
Unrealized depreciation | (36,579,934 | ) | ||
|
| |||
Net unrealized appreciation (depreciation) | $ | (32,541,087 | ) | |
|
|
Differences between income and/or capital gains as determined on a book basis and a tax basis are primarily due to differing treatments of defaulted securities, bond discounts and premiums, and wash sales.
6. Investment Transactions
Purchases and sales of investments (excluding short term securities) for the period ended June 30, 2016, aggregated $29,309,337 and $33,186,100, respectively.
7. Credit Risk and Defaulted Securities
At June 30, 2016, the Fund had 95.5% of its portfolio invested in high yield securities, senior secured floating rate notes, or other securities rated below investment grade. These securities may be more sensitive to economic conditions causing greater price volatility and are potentially subject to a greater risk of loss due to default than higher rated securities.
The Fund held defaulted securities and/or other securities for which the income has been deemed uncollectible. At June 30, 2016, the aggregate value of these securities was $5,117,247, representing 2.0% of the Fund’s net assets. The Fund discontinues accruing income on securities for which income has been deemed uncollectible and provides an estimate for losses on interest receivable. The securities have been identified in the accompanying Statement of Investments.
8. Credit Facility
The Fund, together with other U.S. registered and foreign investment funds (collectively, Borrowers), managed by Franklin Templeton Investments, are borrowers in a joint syndicated senior unsecured credit facility totaling $2 billion (Global Credit Facility) which matures on February 10, 2017. This Global Credit Facility provides a source of funds to the Borrowers for temporary and emergency purposes, including the ability to meet future unanticipated or unusually large redemption requests.
Under the terms of the Global Credit Facility, the Fund shall, in addition to interest charged on any borrowings made by the Fund and other costs incurred by the Fund, pay its share of fees and expenses incurred in connection with the implementation and maintenance of the Global Credit Facility, based upon its relative share of the aggregate net assets of all of the Borrowers, including an annual commitment fee of 0.07% based upon the unused portion of the Global Credit Facility. Effective February 12, 2016, the annual commitment fee is 0.15%. These fees are reflected in other expenses in the Statement of Operations. During the period ended June 30, 2016, the Fund did not use the Global Credit Facility.
| Semiannual Report | FH-25 |
FRANKLIN TEMPLETON VARIABLE INSURANCE PRODUCTS TRUST
NOTES TO FINANCIAL STATEMENTS (UNAUDITED)
Franklin High Income VIP Fund (continued)
9. Fair Value Measurements
The Fund follows a fair value hierarchy that distinguishes between market data obtained from independent sources (observable inputs) and the Fund’s own market assumptions (unobservable inputs). These inputs are used in determining the value of the Fund’s financial instruments and are summarized in the following fair value hierarchy:
| • | Level 1 – quoted prices in active markets for identical financial instruments |
| • | Level 2 – other significant observable inputs (including quoted prices for similar financial instruments, interest rates, prepayment speed, credit risk, etc.) |
| • | Level 3 – significant unobservable inputs (including the Fund’s own assumptions in determining the fair value of financial instruments) |
The input levels are not necessarily an indication of the risk or liquidity associated with financial instruments at that level.
For movements between the levels within the fair value hierarchy, the Fund has adopted a policy of recognizing the transfers as of the date of the underlying event which caused the movement.
A summary of inputs used as of June 30, 2016, in valuing the Fund’s assets carried at fair value, is as follows:
| Level 1 | Level 2 | Level 3 | Total | |||||||||||||
| Assets: | ||||||||||||||||
Investments in Securities | ||||||||||||||||
Equity Investmentsa,b | $ | — | $ | — | $ | 251,576 | $ | 251,576 | ||||||||
Corporate Bonds | — | 242,384,499 | 151,049 | 242,535,548 | ||||||||||||
Senior Floating Rate Interests | — | 1,527,466 | — | 1,527,466 | ||||||||||||
Escrows and Litigation Trusts | — | — | — | c | — | |||||||||||
Short Term Investments | — | 6,138,978 | — | 6,138,978 | ||||||||||||
|
| |||||||||||||||
Total Investments in Securities | $ | — | $ | 250,050,943 | $ | 402,625 | $ | 250,453,568 | ||||||||
|
| |||||||||||||||
aIncludes common and convertible preferred stocks.
bFor detailed categories, see the accompanying Statement of Investments.
cIncludes securities determined to have no value at June 30, 2016.
A reconciliation of assets in which Level 3 inputs are used in determining fair value is presented when there are significant Level 3 financial instruments at the end of the period.
10. Subsequent Events
The Fund has evaluated subsequent events through the issuance of the financial statements and determined that no events have occurred that require disclosure.
Abbreviations
| Selected Portfolio | ||
| FRN | Floating Rate Note | |
| FH-26 | Semiannual Report |
Franklin Income VIP Fund
We are pleased to bring you Franklin Income VIP Fund’s semiannual report for the period ended June 30, 2016.
Class 4 Performance Summary as of June 30, 2016
The Fund’s Class 4 shares delivered a +5.61% total return* for the six-month period ended June 30, 2016.
*The Fund has a fee waiver associated with any investment in a Franklin Templeton money fund and/or Franklin Templeton fund, as applicable, contractually guaranteed through at least the Fund’s current fiscal year-end. Fund investment results reflect the fee waiver, to the extent applicable; without this reduction, the results would have been lower.
Performance reflects the Fund’s Class 4 operating expenses, but does not include any contract fees, expenses or sales charges. If they had been included, performance would be lower. These charges and deductions, particularly for variable life policies, can have a significant effect on contract values and insurance benefits. See the contract prospectus for a complete description of these expenses, including sales charges.
Performance data represent past performance, which does not guarantee future results. Investment return and principal value will fluctuate, and you may have a gain or loss when you sell your shares. Current performance may differ from figures shown.
| Semiannual Report | FI-1 |
FRANKLIN INCOME VIP FUND
Fund Goal and Main Investments
The Fund seeks to maximize income while maintaining prospects for capital appreciation. Under normal market conditions, the Fund invests in both equity and debt securities.
Fund Risks
All investments involve risks, including possible loss of principal. Stock prices fluctuate, sometimes rapidly and dramatically, due to factors affecting individual companies, particular industries or sectors, or general market conditions. The Fund’s share price and yield will be affected by interest rate movements. Bond prices generally move in the opposite direction of interest rates. Thus, as prices of bonds in the Fund adjust to a rise in interest rates, the Fund’s share price may decline. Changes in the financial strength of a bond issuer or in a bond’s credit rating may affect its value. The Fund’s portfolio includes a substantial portion of higher yielding, lower rated corporate bonds because of the relatively higher yields they offer. Floating rate loans are lower rated, higher yielding instruments, which are subject to increased risk of default and can potentially result in loss of principal. These securities carry a greater degree of credit risk relative to investment-grade securities. The Fund is actively managed but there is no guarantee that the manager’s investment decisions will produce the desired results. The Fund’s prospectus also includes a description of the main investment risks.
Performance Overview
You can find the Fund’s six-month total return in the Performance Summary. For comparison, the Fund’s equity benchmark, the Standard & Poor’s® 500 Index, produced a +3.84% total return, and its fixed income benchmark, the Barclays U.S. Aggregate Bond Index, had a +5.31% total return for the same period.1
Economic and Market Overview
The U.S. economy grew moderately, as measured by gross domestic product in 2016’s first and second quarters, driven by consumer spending and exports. A decline in private inventory investment and nonresidential fixed investment contributed to the moderation. Although the unemployment rate rose from 4.7% in May to 4.9% in June, the increase was due to additional people entering the labor force, and for the entire period under
| Portfolio Breakdown | ||||
| 6/30/16 | ||||
| % of Total Net Assets | ||||
| Equity* | 53.3 | % | ||
| Information Technology | 8.5 | % | ||
| Energy | 8.3 | % | ||
| Utilities | 6.8 | % | ||
| Industrials | 6.5 | % | ||
| Health Care | 6.4 | % | ||
| Financials | 5.8 | % | ||
| Consumer Discretionary | 4.7 | % | ||
| Materials | 3.5 | % | ||
| Telecommunication Services | 1.6 | % | ||
| Consumer Staples | 1.2 | % | ||
| Fixed Income | 35.7 | % | ||
| Health Care | 5.8 | % | ||
| Energy | 5.3 | % | ||
| Consumer Discretionary | 5.2 | % | ||
| Financials | 4.0 | % | ||
| Telecommunication Services | 3.9 | % | ||
| Information Technology | 3.6 | % | ||
| Industrials | 3.1 | % | ||
| Utilities | 2.3 | % | ||
| Materials | 2.2 | % | ||
| Consumer Staples | 0.3 | % | ||
| Short-Term Investments & Other Net Assets | 11.0 | % | ||
*Includes convertible bonds.
review, unemployment declined slightly.2 Home sales and prices rose amid relatively low mortgage rates. Monthly retail sales grew during most of the review period, and rose to the highest level in April in more than a year, due to a broad-based increase across most retail categories. Inflation, as measured by the Consumer Price Index, remained subdued overall even though it spiked to the highest level in three years in April mainly due to a rebound in energy prices.
After raising its target range for the federal funds rate to 0.25%–0.50% at its December meeting, the Federal Reserve (Fed) maintained the rate through-period end. Although the Fed hinted at an interest rate hike in June, subsequent reports showed job additions slowed substantially in May. Consequently, at its
1. Source: Morningstar. One cannot invest directly in an index, and an index is not representative of the Fund’s portfolio. Please see Index Descriptions following the Fund Summaries.
2. Source: Bureau of Labor Statistics.
| FI-2 | Semiannual Report |
FRANKLIN INCOME VIP FUND
June meeting, the Fed kept the federal funds rates unchanged, and indicated that in determining the timing and size of future adjustments to the target range, it will assess realized and expected economic conditions relative to its objectives of maximum employment and 2.00% inflation. The Fed expects economic conditions to evolve in a manner that could warrant only gradual increases in the federal funds rate.
The 10-year Treasury yield, which moves inversely to price, declined during the period. It declined from a period high of 2.27% on December 31, 2015, and remained relatively low through period-end, reflecting investors’ concerns about global economic uncertainty. Negative interest rates in Japan and Europe, and central banks’ purchases of government bonds, also put downward pressure on U.S. yields. It touched a period low of 1.46% on June 27, 2016, and ended the period at 1.49%, after the Fed kept short-term interest rates unchanged and fears of Britain’s exit from the European Union boosted safe-haven buying by investors.
Investment Strategy
We search for undervalued or out-of-favor securities we believe offer opportunities for income today and growth tomorrow. We generally perform independent analysis of the debt securities being considered for the Fund’s portfolio, rather than relying principally on ratings assigned by rating agencies. In analyzing debt and equity securities, we consider a variety of factors, including: a security’s relative value based on such factors as anticipated cash flow, interest or dividend coverage, asset coverage, and earnings prospects; the experience and strength of a company’s management; a company’s sensitivity to changes in interest rates and business conditions; a company’s debt maturity schedules and borrowing requirements; and a company’s changing financial condition and market recognition of the change.
Manager’s Discussion
During the six months under review, we shifted the Fund’s asset mix after finding what we considered attractive opportunities in the fixed income sector, while realizing gains in our equity positions. We strategically reduced our equity weighting from 62.7% to 53.3%, and increased our fixed income weighting from 24.2% to 35.7%. Our cash position fell from 13.1% to 11.0% of total net assets.
| Top Five Equity Holdings | ||||
| 6/30/16 | ||||
Company Sector/Industry | % of Total Net Assets | |||
| Royal Dutch Shell PLC (U.K.) Energy | 2.8% | |||
| General Electric Co. Industrials | 2.1% | |||
| Chevron Corp. Energy | 1.9% | |||
| Pfizer Inc. Health Care | 1.6% | |||
| Apple Inc. Information Technology | 1.5% | |||
The dollar value, number of shares or principal amount, and names of all portfolio holdings are listed in the Fund’s Statement of Investments (SOI).
The utilities sector was a significant contributor to Fund results. PG&E, The Southern Company and Xcel Energy delivered positive performance. Utilities have performed well as investors sought their perceived earnings stability and relatively high dividend yields. We trimmed some of our utility positions after we found opportunities in other sectors.
Industrials was another equity contributor during the period, and our position in General Electric helped results. The company continued to streamline its operations by divesting non-core businesses in an effort to increase its focus on the areas where it is a market leader. Defense contractors Lockheed Martin3 and Raytheon were strong performers as they benefited from a strengthening budget outlook due to continued political instability abroad. Both companies surpassed consensus investor expectations during the reporting period.
In contrast, the equity consumer discretionary and financials sectors were major detractors during the period. In consumer discretionary, auto makers General Motors, Fiat Chrysler3 and Ford Motor hurt Fund performance. Among financials, our positions in insurer MetLife, banking and financial services provider Wells Fargo & Co. and financial services firm
JPMorganChase & Co. were detrimental to results.
Most fixed income sectors delivered positive returns during the period. Within fixed income, the communications sector was a major contributor.4 Sprint bonds performed well as the company significantly increased its liquidity, which could provide the capital necessary to continue to improve its competitive position in the marketplace. Mass media company
3. Not held at period-end.
4. Communications holdings are in consumer discretionary and telecommunication services in the fixed income section of the SOI.
| Semiannual Report | FI-3 |
FRANKLIN INCOME VIP FUND
| Top Five Fixed Income and Senior Floating Rate Interests Holdings* | ||||
| 6/30/16 | ||||
| Issuer Sector/Industry | % of Total Net Assets | |||
Weatherford International Ltd. Energy | 1.6% | |||
CHS/Community Health Systems Inc. Health Care | 1.6% | |||
DISH DBS Corp. Consumer Discretionary | 1.5% | |||
Citigroup Inc. Financials | 1.3% | |||
iHeartCommunications Inc. Consumer Discretionary | 1.2% | |||
*Does not include convertible bonds.
The dollar value, number of shares or principal amount, and names of all portfolio holdings are listed in the Fund’s Statement of Investments (SOI).
iHeartCommunications also did well as the company continued to post solid operating results and reduce its debt load.
Another significant contributor in fixed income was the technology sector.5 Our positions in business service management software developer BMC Software and payment technology company First Data, along with a new position in data storage company Western Digital, were standout performers.
Thank you for your participation in Franklin Income VIP Fund. We look forward to serving your future investment needs.
The foregoing information reflects our analysis, opinions and portfolio holdings as of June 30, 2016, the end of the reporting period. The way we implement our main investment strategies and the resulting portfolio holdings may change depending on factors such as market and economic conditions. These opinions may not be relied upon as investment advice or an offer for a particular security. The information is not a complete analysis of every aspect of any market, country, industry, security or the Fund. Statements of fact are from sources considered reliable, but the investment manager makes no representation or warranty as to their completeness or accuracy. Although historical performance is no guarantee of future results, these insights may help you understand our investment management philosophy.
5. Technology holdings are in information technology in the fixed income section of the SOI.
| FI-4 | Semiannual Report |
FRANKLIN INCOME VIP FUND
Class 4 Fund Expenses
As an investor in a variable insurance contract (Contract) that indirectly provides for investment in an underlying mutual fund, you can incur transaction and/or ongoing expenses at both the Fund level and the Contract level.
| • | Transaction expenses can include sales charges (loads) on purchases, surrender fees, transfer fees and premium taxes. |
| • | Ongoing expenses can include management fees, distribution and service (12b-1) fees, contract fees, annual maintenance fees, mortality and expense risk fees and other fees and expenses. All mutual funds and Contracts have some types of ongoing expenses. |
The expenses shown in the table are meant to highlight ongoing expenses at the Fund level only and do not include ongoing expenses at the Contract level, or transaction expenses at either the Fund or Contract levels. While the Fund does not have transaction expenses, if the transaction and ongoing expenses at the Contract level were included, the expenses shown below would be higher. You should consult your Contract prospectus or disclosure document for more information.
The table shows Fund-level ongoing expenses and can help you understand these expenses and compare them with those of other mutual funds offered through the Contract. The table assumes a $1,000 investment held for the six months indicated. Please refer to the Fund prospectus for additional information on operating expenses.
Actual Fund Expenses
The first line (Actual) of the table provides actual account values and expenses. The “Ending Account Value” is derived from the Fund’s actual return, which includes the effect of ongoing Fund expenses, but does not include the effect of ongoing Contract expenses.
You can estimate the Fund-level expenses you incurred during the period by following these steps. Of course, your account value and expenses will differ from those in this illustration:
| 1. | Divide your account value by $1,000. |
If an account had an $8,600 value, then $8,600 ÷ $1,000 = 8.6.
| 2. | Multiply the result by the number under the heading “Fund-Level Expenses Incurred During Period.” |
If Fund-Level Expenses Incurred During Period were $7.50, then 8.6 × $7.50 = $64.50.
In this illustration, the estimated expenses incurred this period at the Fund level are $64.50.
Hypothetical Example for Comparison with Other Mutual Funds
Information in the second line (Hypothetical) of the table can help you compare ongoing expenses of the Fund with those of other mutual funds offered through the Contract. This information may not be used to estimate the actual ending account balance or expenses you incurred during the period. The hypothetical “Ending Account Value” is based on the Fund’s actual expense ratio and an assumed 5% annual rate of return before expenses, which does not represent the Fund’s actual return. The figure under the heading “Fund-Level Expenses Incurred During Period” shows the hypothetical expenses your account would have incurred under this scenario. You can compare this figure with the 5% hypothetical examples that appear in shareholder reports of other funds offered through a Contract.
| Class 4 | Beginning Account Value 1/1/16 | Ending Account Value 6/30/16 | Fund-Level Expenses 1/1/16–6/30/16 | |||||||||
Actual | $ | 1,000 | $ | 1,056.10 | $ | 4.04 | ||||||
Hypothetical (5% return before expenses) | $ | 1,000 | $ | 1,020.93 | $ | 3.97 | ||||||
*Expenses are calculated using the most recent six-month annualized expense ratio, net of expense waivers, for the Fund’s Class 4 shares (0.79%), which does not include any ongoing expenses of the Contract for which the Fund is an investment option, multiplied by the average account value over the period, multiplied by 182/366 to reflect the one-half year period.
| Semiannual Report | FI-5 |
FRANKLIN TEMPLETON VARIABLE INSURANCE PRODUCTS TRUST
Financial Highlights
Franklin Income VIP Fund
| Six Months Ended June 30, 2016 (unaudited) | Year Ended December 31, | |||||||||||||||||||||||
| 2015 | 2014 | 2013 | 2012 | 2011 | ||||||||||||||||||||
| Class 1 | ||||||||||||||||||||||||
| Per share operating performance (for a share outstanding throughout the period) | ||||||||||||||||||||||||
Net asset value, beginning of period | $14.64 | $16.48 | $16.53 | $15.47 | $14.68 | $15.16 | ||||||||||||||||||
|
| |||||||||||||||||||||||
| Income from investment operationsa: | ||||||||||||||||||||||||
Net investment incomeb | 0.33 | 0.71 | 0.72 | 0.81 | 0.91 | 0.96 | ||||||||||||||||||
Net realized and unrealized gains (losses) | 0.51 | (1.78 | ) | 0.11 | 1.31 | 0.90 | (0.54 | ) | ||||||||||||||||
|
| |||||||||||||||||||||||
Total from investment operations | 0.84 | (1.07 | ) | 0.83 | 2.12 | 1.81 | 0.42 | |||||||||||||||||
|
| |||||||||||||||||||||||
Less distributions from net investment income | (0.78 | ) | (0.77 | ) | (0.88 | ) | (1.06 | ) | (1.02 | ) | (0.90 | ) | ||||||||||||
|
| |||||||||||||||||||||||
Net asset value, end of period | $14.70 | $14.64 | $16.48 | $16.53 | $15.47 | $14.68 | ||||||||||||||||||
|
| |||||||||||||||||||||||
Total returnc | 5.84% | (6.84)% | 4.92% | 14.18% | 12.91% | 2.71% | ||||||||||||||||||
| Ratios to average net assetsd | ||||||||||||||||||||||||
Expenses before waiver and payments by affiliates | 0.47% | 0.46% | 0.47% | 0.47% | 0.47% | 0.47% | ||||||||||||||||||
Expenses net of waiver and payments by affiliates | 0.44% | e | 0.46% | e,f | 0.47% | e | 0.47% | e | 0.47% | 0.47% | e | |||||||||||||
Net investment income | 4.52% | 4.47% | 4.26% | 5.07% | 6.03% | 6.35% | ||||||||||||||||||
| Supplemental data | ||||||||||||||||||||||||
Net assets, end of period (000’s) | $662,361 | $604,228 | $714,664 | $695,004 | $584,391 | $1,300,935 | ||||||||||||||||||
Portfolio turnover rate | 27.34% | 31.53% | 24.77% | 21.71% | 26.66% | g | 28.65% | |||||||||||||||||
aThe amount shown for a share outstanding throughout the period may not correlate with the Statement of Operations for the period due to the timing of sales and repurchases of the Fund’s shares in relation to income earned and/or fluctuating fair value of the investments of the Fund.
bBased on average daily shares outstanding.
cTotal return does not include fees, charges or expenses imposed by the variable annuity and life insurance contracts for which Franklin Templeton Variable Insurance Products Trust serves as an underlying investment vehicle. Total return is not annualized for periods less than one year.
dRatios are annualized for periods less than one year.
eBenefit of expense reduction rounds to less than 0.01%.
fBenefit of waiver and payments by affiliates rounds to less than 0.01%.
gExcludes the value of portfolio securities delivered as a result of a redemption in-kind.
| FI-6 | Semiannual Report | The accompanying notes are an integral part of these financial statements. |
FRANKLIN TEMPLETON VARIABLE INSURANCE PRODUCTS TRUST
FINANCIAL HIGHLIGHTS
Franklin Income VIP Fund (continued)
Six Months Ended (unaudited) | Year Ended December 31, | |||||||||||||||||||||||
| 2015 | 2014 | 2013 | 2012 | 2011 | ||||||||||||||||||||
| Class 2 | ||||||||||||||||||||||||
| Per share operating performance (for a share outstanding throughout the period) | ||||||||||||||||||||||||
Net asset value, beginning of period | $14.20 | $16.00 | $16.07 | $15.07 | $14.32 | $14.82 | ||||||||||||||||||
|
| |||||||||||||||||||||||
| Income from investment operationsa: | ||||||||||||||||||||||||
Net investment incomeb | 0.30 | 0.65 | 0.66 | 0.75 | 0.85 | 0.90 | ||||||||||||||||||
Net realized and unrealized gains (losses) | 0.49 | (1.73 | ) | 0.11 | 1.27 | 0.88 | (0.53 | ) | ||||||||||||||||
|
| |||||||||||||||||||||||
Total from investment operations | 0.79 | (1.08 | ) | 0.77 | 2.02 | 1.73 | 0.37 | |||||||||||||||||
|
| |||||||||||||||||||||||
Less distributions from net investment income | (0.74 | ) | (0.72 | ) | (0.84 | ) | (1.02 | ) | (0.98 | ) | (0.87 | ) | ||||||||||||
|
| |||||||||||||||||||||||
Net asset value, end of period | $14.25 | $14.20 | $16.00 | $16.07 | $15.07 | $14.32 | ||||||||||||||||||
|
| |||||||||||||||||||||||
Total returnc | 5.65% | (7.05)% | 4.62% | 13.94% | 12.65% | 2.38% | ||||||||||||||||||
| Ratios to average net assetsd | ||||||||||||||||||||||||
Expenses before waiver and payments by affiliates | 0.72% | 0.71% | 0.72% | 0.72% | 0.72% | 0.72% | ||||||||||||||||||
Expenses net of waiver and payments by affiliates | 0.69% | e | 0.71% | e,f | 0.72% | e | 0.72% | e | 0.72% | 0.72% | e | |||||||||||||
Net investment income | 4.27% | 4.22% | 4.01% | 4.82% | 5.78% | 6.10% | ||||||||||||||||||
| Supplemental data | ||||||||||||||||||||||||
Net assets, end of period (000’s) | $4,921,752 | $4,907,599 | $6,022,804 | $6,188,045 | $6,182,997 | $5,915,637 | ||||||||||||||||||
Portfolio turnover rate | 27.34% | 31.53% | 24.77% | 21.71% | 26.66% | g | 28.65% | |||||||||||||||||
aThe amount shown for a share outstanding throughout the period may not correlate with the Statement of Operations for the period due to the timing of sales and repurchases of the Fund’s shares in relation to income earned and/or fluctuating fair value of the investments of the Fund.
bBased on average daily shares outstanding.
cTotal return does not include fees, charges or expenses imposed by the variable annuity and life insurance contracts for which Franklin Templeton Variable Insurance Products Trust serves as an underlying investment vehicle. Total return is not annualized for periods less than one year.
dRatios are annualized for periods less than one year.
eBenefit of expense reduction rounds to less than 0.01%.
fBenefit of waiver and payments by affiliates rounds to less than 0.01%.
gExcludes the value of portfolio securities delivered as a result of a redemption in-kind.
| The accompanying notes are an integral part of these financial statements. | Semiannual Report | FI-7 |
FRANKLIN TEMPLETON VARIABLE INSURANCE PRODUCTS TRUST
FINANCIAL HIGHLIGHTS
Franklin Income VIP Fund (continued)
Six Months Ended (unaudited) | Year Ended December 31, | |||||||||||||||||||||||
| 2015 | 2014 | 2013 | 2012 | 2011 | ||||||||||||||||||||
| Class 4 | ||||||||||||||||||||||||
| Per share operating performance (for a share outstanding throughout the period) | ||||||||||||||||||||||||
Net asset value, beginning of period | $14.49 | $16.31 | $16.36 | $15.32 | $14.54 | $15.04 | ||||||||||||||||||
|
| |||||||||||||||||||||||
| Income from investment operationsa: | ||||||||||||||||||||||||
Net investment incomeb | 0.30 | 0.65 | 0.66 | 0.75 | 0.85 | 0.90 | ||||||||||||||||||
Net realized and unrealized gains (losses) | 0.50 | (1.76 | ) | 0.11 | 1.30 | 0.90 | (0.54 | ) | ||||||||||||||||
|
| |||||||||||||||||||||||
Total from investment operations | 0.80 | (1.11 | ) | 0.77 | 2.05 | 1.75 | 0.36 | |||||||||||||||||
|
| |||||||||||||||||||||||
Less distributions from net investment income | (0.72 | ) | (0.71 | ) | (0.82 | ) | (1.01 | ) | (0.97 | ) | (0.86 | ) | ||||||||||||
|
| |||||||||||||||||||||||
Net asset value, end of period | $14.57 | $14.49 | $16.31 | $16.36 | $15.32 | $14.54 | ||||||||||||||||||
|
| |||||||||||||||||||||||
Total returnc | 5.61% | (7.15)% | 4.52% | 13.85% | 12.56% | 2.29% | ||||||||||||||||||
| Ratios to average net assetsd | ||||||||||||||||||||||||
Expenses before waiver and payments by affiliates | 0.82% | 0.81% | 0.82% | 0.82% | 0.82% | 0.82% | ||||||||||||||||||
Expenses net of waiver and payments by affiliates | 0.79% | e | 0.81% | e,f | 0.82% | e | 0.82% | e | 0.82% | 0.82% | e | |||||||||||||
Net investment income | 4.17% | 4.12% | 3.91% | 4.72% | 5.68% | 6.00% | ||||||||||||||||||
| Supplemental data | ||||||||||||||||||||||||
Net assets, end of period (000’s) | $304,884 | $306,023 | $378,545 | $397,652 | $436,405 | $431,435 | ||||||||||||||||||
Portfolio turnover rate | 27.34% | 31.53% | 24.77% | 21.71% | 26.66% | g | 28.65% | |||||||||||||||||
aThe amount shown for a share outstanding throughout the period may not correlate with the Statement of Operations for the period due to the timing of sales and repurchases of the Fund’s shares in relation to income earned and/or fluctuating fair value of the investments of the Fund.
bBased on average daily shares outstanding.
cTotal return does not include fees, charges or expenses imposed by the variable annuity and life insurance contracts for which Franklin Templeton Variable Insurance Products Trust serves as an underlying investment vehicle. Total return is not annualized for periods less than one year.
dRatios are annualized for periods less than one year.
eBenefit of expense reduction rounds to less than 0.01%.
fBenefit of waiver and payments by affiliates rounds to less than 0.01%.
gExcludes the value of portfolio securities delivered as a result of a redemption in-kind.
| FI-8 | Semiannual Report | The accompanying notes are an integral part of these financial statements. |
FRANKLIN TEMPLETON VARIABLE INSURANCE PRODUCTS TRUST
Statement of Investments, June 30, 2016 (unaudited)
Franklin Income VIP Fund
| ||||||||||||||
| Country | Shares | Value | ||||||||||||
Common Stocks 44.6% | ||||||||||||||
Consumer Discretionary 3.2% | ||||||||||||||
Ford Motor Co. | United States | 4,643,943 | $ | 58,374,363 | ||||||||||
General Motors Co. | United States | 2,224,426 | 62,951,257 | |||||||||||
Nordstrom Inc. | United States | 200,000 | 7,610,000 | |||||||||||
Target Corp. | United States | 839,100 | 58,585,962 | |||||||||||
|
| |||||||||||||
| 187,521,582 | ||||||||||||||
|
| |||||||||||||
Consumer Staples 1.2% | ||||||||||||||
The Coca-Cola Co. | United States | 150,000 | 6,799,500 | |||||||||||
PepsiCo Inc. | United States | 584,000 | 61,868,960 | |||||||||||
|
| |||||||||||||
| 68,668,460 | ||||||||||||||
|
| |||||||||||||
Energy 7.8% | ||||||||||||||
Anadarko Petroleum Corp. | United States | 500,000 | 26,625,000 | |||||||||||
BP PLC, ADR | United Kingdom | 1,800,000 | 63,918,000 | |||||||||||
Chevron Corp. | United States | 1,055,000 | 110,595,650 | |||||||||||
Denbury Resources Inc. | United States | 292,400 | 1,049,716 | |||||||||||
Occidental Petroleum Corp. | United States | 436,000 | 32,944,160 | |||||||||||
| a | PetroQuest Energy Inc. | United States | 12,250 | 40,792 | ||||||||||
| a,b | Rex Energy Corp. | United States | 75,000 | 43,527 | ||||||||||
Royal Dutch Shell PLC, A, ADR | United Kingdom | 3,021,748 | 166,860,925 | |||||||||||
| a | Sanchez Energy Corp. | United States | 14,825 | 104,668 | ||||||||||
Total SA, B, ADR | France | 1,192,900 | 57,378,490 | |||||||||||
|
| |||||||||||||
| 459,560,928 | ||||||||||||||
|
| |||||||||||||
Financials 3.3% | ||||||||||||||
Host Hotels & Resorts Inc. | United States | 1,500,000 | 24,315,000 | |||||||||||
JPMorgan Chase & Co. | United States | 485,100 | 30,144,114 | |||||||||||
MetLife Inc. | United States | 1,145,108 | 45,609,652 | |||||||||||
U.S. Bancorp | United States | 1,000,000 | 40,330,000 | |||||||||||
Wells Fargo & Co. | United States | 1,100,000 | 52,063,000 | |||||||||||
|
| |||||||||||||
| 192,461,766 | ||||||||||||||
|
| |||||||||||||
Health Care 5.6% | ||||||||||||||
AstraZeneca PLC | United Kingdom | 1,000,000 | 59,562,978 | |||||||||||
Bristol-Myers Squibb Co. | United States | 394,396 | 29,007,826 | |||||||||||
Eli Lilly & Co. | United States | 764,800 | 60,228,000 | |||||||||||
Pfizer Inc. | United States | 2,638,975 | 92,918,310 | |||||||||||
Roche Holding AG | Switzerland | 136,500 | 35,813,595 | |||||||||||
Sanofi, ADR | France | 1,208,292 | 50,567,020 | |||||||||||
|
| |||||||||||||
| 328,097,729 | ||||||||||||||
|
| |||||||||||||
Industrials 6.4% | ||||||||||||||
| a,c | CEVA Holdings LLC | United Kingdom | 13,012 | 4,554,291 | ||||||||||
Deere & Co. | United States | 350,000 | 28,364,000 | |||||||||||
General Electric Co. | United States | 3,976,200 | 125,170,776 | |||||||||||
Raytheon Co. | United States | 480,000 | 65,256,000 | |||||||||||
Republic Services Inc. | United States | 527,300 | 27,055,763 | |||||||||||
Union Pacific Corp. | United States | 600,000 | 52,350,000 | |||||||||||
United Technologies Corp. | United States | 700,000 | 71,785,000 | |||||||||||
|
| |||||||||||||
| 374,535,830 | ||||||||||||||
|
| |||||||||||||
Information Technology 6.3% | ||||||||||||||
Analog Devices Inc. | United States | 400,000 | 22,656,000 | |||||||||||
Apple Inc. | United States | 915,317 | 87,504,305 | |||||||||||
| Semiannual Report | FI-9 |
FRANKLIN TEMPLETON VARIABLE INSURANCE PRODUCTS TRUST
STATEMENT OF INVESTMENTS (UNAUDITED)
Franklin Income VIP Fund (continued)
| Country | Shares | Value | ||||||||||||
Common Stocks (continued) | ||||||||||||||
Information Technology (continued) | ||||||||||||||
Cisco Systems Inc. | United States | 900,000 | $ | 25,821,000 | ||||||||||
| a | First Data Holdings Inc., B | United States | 1,559,550 | 17,264,219 | ||||||||||
Intel Corp. | United States | 1,727,000 | 56,645,600 | |||||||||||
Microsoft Corp. | United States | 1,333,500 | 68,235,195 | |||||||||||
QUALCOMM Inc. | United States | 550,000 | 29,463,500 | |||||||||||
Texas Instruments Inc. | United States | 1,000,000 | 62,650,000 | |||||||||||
|
| |||||||||||||
| 370,239,819 | ||||||||||||||
|
| |||||||||||||
Materials 3.2% | ||||||||||||||
BASF SE | Germany | 387,500 | 29,522,449 | |||||||||||
The Dow Chemical Co. | United States | 1,525,700 | 75,842,547 | |||||||||||
The Mosaic Co. | United States | 1,100,000 | 28,798,000 | |||||||||||
Rio Tinto PLC, ADR | United Kingdom | 1,800,000 | 56,340,000 | |||||||||||
|
| |||||||||||||
| 190,502,996 | ||||||||||||||
|
| |||||||||||||
Telecommunication Services 1.6% | ||||||||||||||
BCE Inc. | Canada | 466,000 | 22,050,337 | |||||||||||
Telstra Corp. Ltd. | Australia | 3,446,331 | 14,292,637 | |||||||||||
Verizon Communications Inc. | United States | 1,075,000 | 60,028,000 | |||||||||||
|
| |||||||||||||
| 96,370,974 | ||||||||||||||
|
| |||||||||||||
Utilities 6.0% | ||||||||||||||
Dominion Resources Inc. | United States | 862,056 | 67,180,024 | |||||||||||
Duke Energy Corp. | United States | 702,500 | 60,267,475 | |||||||||||
PG&E Corp. | United States | 935,300 | 59,784,376 | |||||||||||
Public Service Enterprise Group Inc. | United States | 923,500 | 43,044,335 | |||||||||||
Sempra Energy | United States | 368,300 | 41,993,566 | |||||||||||
The Southern Co. | United States | 888,200 | 47,634,166 | |||||||||||
Xcel Energy Inc. | United States | 810,964 | 36,314,968 | |||||||||||
|
| |||||||||||||
| 356,218,910 | ||||||||||||||
|
| |||||||||||||
Total Common Stocks (Cost $2,250,285,831) | 2,624,178,994 | |||||||||||||
|
| |||||||||||||
| d | Equity-Linked Securities 4.3% | |||||||||||||
Consumer Discretionary 1.4% | ||||||||||||||
| e | Morgan Stanley into Ford Motors, 8.50%, 144A | United States | 2,485,000 | 31,512,037 | ||||||||||
| e | Royal Bank of Canada into Target Corp., 6.00%, 144A | United States | 700,000 | 49,862,820 | ||||||||||
|
| |||||||||||||
| 81,374,857 | ||||||||||||||
|
| |||||||||||||
Financials 0.5% | ||||||||||||||
| e | Citigroup Inc. into Bank of America Corp., 7.50%, 144A | United States | 2,100,000 | 28,004,130 | ||||||||||
|
| |||||||||||||
Health Care 0.5% | ||||||||||||||
| e | JPMorgan Chase & Co. into Merck & Co. Inc., 6.25%, 144A | United States | 500,000 | 28,643,350 | ||||||||||
|
| |||||||||||||
Information Technology 1.9% | ||||||||||||||
| e | JPMorgan Chase & Co. into Oracle Corp., 6.00%, 144A | United States | 700,000 | 28,880,180 | ||||||||||
| e | Wells Fargo & Co. into Intel Corp., 7.00%, 144A | United States | 1,700,000 | 55,578,950 | ||||||||||
| e | Wells Fargo Bank N.A into Cisco Systems Inc., 7.25%, 144A | United States | 1,050,000 | 29,731,800 | ||||||||||
|
| |||||||||||||
| 114,190,930 | ||||||||||||||
|
| |||||||||||||
Total Equity-Linked Securities (Cost $260,718,300) | 252,213,267 | |||||||||||||
|
| |||||||||||||
| FI-10 | Semiannual Report |
FRANKLIN TEMPLETON VARIABLE INSURANCE PRODUCTS TRUST
STATEMENT OF INVESTMENTS (UNAUDITED)
Franklin Income VIP Fund (continued)
| Country | Shares | Value | ||||||||||||
Convertible Preferred Stocks 3.7% | ||||||||||||||
Consumer Discretionary 0.1% | ||||||||||||||
Fiat Chrysler Automobiles NV, 7.875%, cvt. pfd. | United Kingdom | 85,000 | $ | 5,016,700 | ||||||||||
|
| |||||||||||||
Energy 0.0%† | ||||||||||||||
Sanchez Energy Corp., 6.50%, cvt. pfd., B | United States | 54,200 | 1,198,497 | |||||||||||
|
| |||||||||||||
Financials 1.8% | ||||||||||||||
Bank of America Corp., 7.25%, cvt. pfd., L | United States | 64,600 | 77,197,000 | |||||||||||
FelCor Lodging Trust Inc., 7.80%, cvt. pfd., A | United States | 167,325 | 4,214,917 | |||||||||||
| a | FNMA, 5.375%, cvt. pfd. | United States | 475 | 5,996,875 | ||||||||||
Wells Fargo & Co., 7.50%, cvt. pfd., A | United States | 15,000 | 19,488,000 | |||||||||||
|
| |||||||||||||
| 106,896,792 | ||||||||||||||
|
| |||||||||||||
Health Care 0.3% | ||||||||||||||
Allergan PLC, 5.50%, cvt. pfd. | United States | 9,500 | 7,919,390 | |||||||||||
Teva Pharmaceutical Industries Ltd., 7.00%, cvt. pfd. | Israel | 15,000 | 12,405,000 | |||||||||||
|
| |||||||||||||
| 20,324,390 | ||||||||||||||
|
| |||||||||||||
Industrials 0.1% | ||||||||||||||
| a,c | CEVA Holdings LLC, cvt. pfd., A-1 | United Kingdom | 397 | 208,425 | ||||||||||
| a,c | CEVA Holdings LLC, cvt. pfd., A-2 | United Kingdom | 14,711 | 5,148,815 | ||||||||||
|
| |||||||||||||
| 5,357,240 | ||||||||||||||
|
| |||||||||||||
Information Technology 0.3% | ||||||||||||||
| a,e | Mandatory Exchangeable Trust, 5.75%, cvt. pfd., 144A | China | 150,000 | 15,335,250 | ||||||||||
|
| |||||||||||||
Materials 0.3% | ||||||||||||||
Alcoa Inc., 5.375%, cvt. pfd. | United States | 500,000 | 16,435,000 | |||||||||||
|
| |||||||||||||
Utilities 0.8% | ||||||||||||||
Dominion Resources Inc., 6.375%, cvt. pfd., A | United States | 162,000 | 8,398,080 | |||||||||||
Dominion Resources Inc., 6.00%, cvt. pfd., B | United States | 145,000 | 8,714,500 | |||||||||||
NextEra Energy Inc., 6.371%, cvt. pfd. | United States | 500,000 | 32,390,000 | |||||||||||
|
| |||||||||||||
| 49,502,580 | ||||||||||||||
|
| |||||||||||||
Total Convertible Preferred Stocks | 220,066,449 | |||||||||||||
|
| |||||||||||||
Preferred Stocks (Cost $8,750,000) 0.2% | ||||||||||||||
Financials 0.2% | ||||||||||||||
Morgan Stanley, 6.375%, pfd., I | United States | 350,000 | 9,467,500 | |||||||||||
|
| |||||||||||||
| Principal Amount* | ||||||||||||||
Convertible Bonds 0.5% | ||||||||||||||
Energy 0.5% | ||||||||||||||
Cobalt International Energy Inc., cvt., senior bond, 3.125%, 5/15/24 | United States | 10,000,000 | 3,400,000 | |||||||||||
Stone Energy Corp., cvt., senior note, 1.75%, 3/01/17 | United States | 10,000,000 | 4,643,750 | |||||||||||
Weatherford International Ltd., cvt., senior note, 5.875%, 7/01/21 | United States | 22,000,000 | 23,966,250 | |||||||||||
|
| |||||||||||||
Total Convertible Bonds (Cost $39,520,943) | 32,010,000 | |||||||||||||
|
| |||||||||||||
Corporate Bonds 32.3% | ||||||||||||||
Consumer Discretionary 4.0% | ||||||||||||||
| e | 24 Hour Holdings III LLC, senior note, 144A, 8.00%, 6/01/22 | United States | 500,000 | 381,250 | ||||||||||
| e | Altice Luxembourg SA, senior secured note, 144A, 7.75%, 5/15/22 | Luxembourg | 3,000,000 | 3,041,250 | ||||||||||
| e | Argos Merger Sub Inc., senior note, 144A, 7.125%, 3/15/23 | United States | 3,000,000 | 3,093,750 | ||||||||||
| Semiannual Report | FI-11 |
FRANKLIN TEMPLETON VARIABLE INSURANCE PRODUCTS TRUST
STATEMENT OF INVESTMENTS (UNAUDITED)
Franklin Income VIP Fund (continued)
| Country | Principal Amount* | Value | ||||||||||||
Corporate Bonds (continued) | ||||||||||||||
Consumer Discretionary (continued) | ||||||||||||||
CCO Holdings LLC/CCO Holdings Capital Corp., | ||||||||||||||
senior bond, 5.125%, 2/15/23 | United States | 10,000,000 | $ | 10,150,000 | ||||||||||
e senior bond, 144A, 5.75%, 2/15/26 | United States | 5,000,000 | 5,162,500 | |||||||||||
e senior note, 144A, 5.875%, 4/01/24 | United States | 5,000,000 | 5,225,000 | |||||||||||
DISH DBS Corp., | ||||||||||||||
senior bond, 5.00%, 3/15/23 | United States | 35,000,000 | 31,937,500 | |||||||||||
e senior bond, 144A, 7.75%, 7/01/26 | United States | 15,000,000 | 15,525,000 | |||||||||||
senior note, 5.875%, 7/15/22 | United States | 30,000,000 | 29,250,000 | |||||||||||
senior note, 5.875%, 11/15/24 | United States | 9,400,000 | 8,812,500 | |||||||||||
Dollar General Corp., senior bond, 3.25%, 4/15/23 | United States | 5,000,000 | 5,199,180 | |||||||||||
Fiat Chrysler Automobiles NV, senior note, 5.25%, 4/15/23 | United Kingdom | 11,300,000 | 11,253,952 | |||||||||||
iHeartCommunications Inc., | ||||||||||||||
senior secured bond, first lien, 9.00%, 3/01/21 | United States | 19,400,000 | 13,749,750 | |||||||||||
senior secured note, first lien, 9.00%, 12/15/19 | United States | 18,000,000 | 13,747,500 | |||||||||||
senior secured note, first lien, 9.00%, 9/15/22 | United States | 12,200,000 | 8,509,500 | |||||||||||
| e | International Game Technology PLC, | |||||||||||||
senior secured bond, 144A, 6.50%, 2/15/25 | United States | 8,500,000 | 8,585,000 | |||||||||||
senior secured note, 144A, 6.25%, 2/15/22 | United States | 8,500,000 | 8,691,250 | |||||||||||
KB Home, senior bond, 7.50%, 9/15/22 | United States | 6,500,000 | 6,727,500 | |||||||||||
| e | Shea Homes LP/Shea Homes Funding Corp., | |||||||||||||
senior bond, 144A, 6.125%, 4/01/25 | United States | 10,000,000 | 10,000,000 | |||||||||||
senior note, 144A, 5.875%, 4/01/23 | United States | 5,000,000 | 4,975,000 | |||||||||||
| e | Sirius XM Radio Inc., senior bond, 144A, 6.00%, 7/15/24 | United States | 10,000,000 | 10,362,500 | ||||||||||
| e | Univision Communications Inc., senior secured note, first lien, | |||||||||||||
5/15/23 | United States | 10,000,000 | 9,975,000 | |||||||||||
2/15/25 | United States | 7,140,000 | 7,086,450 | |||||||||||
| e | Virgin Media Secured Finance PLC, senior secured bond, first lien, 144A, 5.50%, 1/15/25 | United Kingdom | 7,000,000 | 6,903,750 | ||||||||||
|
| |||||||||||||
| 238,345,082 | ||||||||||||||
|
| |||||||||||||
Consumer Staples 0.3% | ||||||||||||||
Cott Beverages Inc., senior note, 5.375%, 7/01/22 | United States | 2,500,000 | 2,509,375 | |||||||||||
| e | JBS USA LLC/Finance Inc., senior note, 144A, 7.25%, 6/01/21 | United States | 12,500,000 | 13,000,000 | ||||||||||
|
| |||||||||||||
| 15,509,375 | ||||||||||||||
|
| |||||||||||||
Energy 5.2% | ||||||||||||||
Antero Resources Corp., senior note, 5.375%, 11/01/21 | United States | 5,000,000 | 4,925,000 | |||||||||||
Bill Barrett Corp., senior note, | ||||||||||||||
7.625%, 10/01/19 | United States | 30,000,000 | 24,600,000 | |||||||||||
7.00%, 10/15/22 | United States | 16,358,000 | 11,859,550 | |||||||||||
Calumet Specialty Products Partners LP/Calumet Finance Corp., | ||||||||||||||
senior note, 6.50%, 4/15/21 | United States | 9,500,000 | 6,840,000 | |||||||||||
Chesapeake Energy Corp., | ||||||||||||||
e secured note, second lien, 144A, 8.00%, 12/15/22 | United States | 33,550,000 | 28,601,375 | |||||||||||
senior note, 7.25%, 12/15/18 | United States | 10,000,000 | 8,750,000 | |||||||||||
f senior note, FRN, 3.878%, 4/15/19 | United States | 10,000,000 | 7,575,000 | |||||||||||
| e | Denbury Resources Inc., senior secured note, 144A, | United States | 7,200,000 | 7,236,000 | ||||||||||
| e,g | Energy XXI Gulf Coast Inc., senior secured note, second lien, 144A, 11.00%, 3/15/20 | United States | 26,516,000 | 10,738,980 | ||||||||||
| FI-12 | Semiannual Report |
FRANKLIN TEMPLETON VARIABLE INSURANCE PRODUCTS TRUST
STATEMENT OF INVESTMENTS (UNAUDITED)
Franklin Income VIP Fund (continued)
| Country | Principal Amount* | Value | ||||||||||||
Corporate Bonds (continued) | ||||||||||||||
Energy (continued) | ||||||||||||||
| e | EnQuest PLC, senior note, 144A, 7.00%, 4/15/22 | United Kingdom | 11,000,000 | $ | 6,723,750 | |||||||||
Ferrellgas LP/Ferrellgas Finance Corp., senior note, | United States | 5,000,000 | 4,612,500 | |||||||||||
| e | Halcon Resources Corp., | |||||||||||||
secured note, second lien, 144A, 8.625%, 2/01/20 | United States | 9,000,000 | 8,533,080 | |||||||||||
g senior secured note, third lien, 144A, 13.00%, 2/15/22 | United States | 1,100,000 | 588,500 | |||||||||||
Kinder Morgan Inc., | ||||||||||||||
senior note, MTN, 7.75%, 1/15/32 | United States | 22,000,000 | 24,728,176 | |||||||||||
e senior secured bond, first lien, 144A, 5.625%, 11/15/23 | United States | 7,000,000 | 7,511,700 | |||||||||||
| e | McDermott International Inc., second lien, 144A, 8.00%, 5/01/21 | United States | 12,592,000 | 10,892,080 | ||||||||||
| e | NGPL PipeCo LLC, secured note, 144A, 7.119%, 12/15/17 | United States | 3,750,000 | 3,928,125 | ||||||||||
| e | PetroQuest Energy Inc., second lien, 144A, 10.00%, 2/15/21 | United States | 1,653,000 | 1,140,570 | ||||||||||
| e | Rex Energy Corp., second lien, 144A, 1.00% to 10/01/17, | United States | 5,000,000 | 1,125,000 | ||||||||||
| e | Sabine Pass Liquefaction LLC, senior secured bond, 144A, | United States | 15,000,000 | 15,000,000 | ||||||||||
Sanchez Energy Corp., senior note, 7.75%, 6/15/21 | United States | 22,000,000 | 18,755,000 | |||||||||||
Stone Energy Corp., senior bond, 7.50%, 11/15/22 | United States | 26,905,000 | 12,241,775 | |||||||||||
| h | W&T Offshore Inc., senior note, 8.50%, 6/15/19 | United States | 45,000,000 | 11,250,000 | ||||||||||
Weatherford International Ltd., senior note, | ||||||||||||||
i 5.125%, 9/15/20 | United States | 12,500,000 | 11,831,250 | |||||||||||
7.75%, 6/15/21 | United States | 25,000,000 | 24,437,500 | |||||||||||
i 4.50%, 4/15/22 | United States | 9,900,000 | 8,538,750 | |||||||||||
8.25%, 6/15/23 | United States | 27,500,000 | 26,193,750 | |||||||||||
|
| |||||||||||||
| 309,157,411 | ||||||||||||||
|
| |||||||||||||
Financials 3.3% | ||||||||||||||
| j | Bank of America Corp., junior sub. bond, | |||||||||||||
AA, 6.10% to 3/17/25, FRN thereafter, Perpetual | United States | 8,000,000 | 8,130,000 | |||||||||||
M, 8.125% to 5/15/18, FRN thereafter, Perpetual | United States | 5,000,000 | 5,018,750 | |||||||||||
| j | Citigroup Inc., junior sub. bond, | |||||||||||||
5.35% to 5/15/23, FRN thereafter, Perpetual | United States | 10,000,000 | 9,420,500 | |||||||||||
5.90% to 2/15/23, FRN thereafter, Perpetual | United States | 12,500,000 | 12,343,750 | |||||||||||
5.95% to 1/30/23, FRN thereafter, Perpetual | United States | 4,500,000 | 4,452,188 | |||||||||||
M, 6.30% to 5/15/24, FRN thereafter, Perpetual | United States | 16,800,000 | 16,735,320 | |||||||||||
O, 5.875% to 3/27/20, FRN thereafter, Perpetual | United States | 25,000,000 | 24,031,250 | |||||||||||
Q, 5.95% to 8/15/20, FRN thereafter, Perpetual | United States | 10,000,000 | 9,761,500 | |||||||||||
Iron Mountain Inc., senior sub. bond, 5.75%, 8/15/24 | United States | 3,000,000 | 3,045,000 | |||||||||||
iStar Inc., senior note, 5.00%, 7/01/19 | United States | 3,500,000 | 3,281,250 | |||||||||||
| j | JPMorgan Chase & Co., junior sub. bond, | |||||||||||||
I, 7.90% to 4/30/19, FRN thereafter, Perpetual | United States | 50,000,000 | 51,062,500 | |||||||||||
R, 6.00% to 8/01/23, FRN thereafter, Perpetual | United States | 3,200,000 | 3,276,000 | |||||||||||
V, 5.00% to 7/30/19, FRN thereafter, Perpetual | United States | 10,000,000 | 9,575,000 | |||||||||||
| j | Morgan Stanley, junior sub. bond, 5.55% to 7/15/20, FRN | United States | 7,300,000 | 7,240,505 | ||||||||||
Navient Corp., senior note, 6.125%, 3/25/24 | United States | 5,000,000 | 4,412,500 | |||||||||||
| e | OneMain Financial Holdings Inc., senior note, 144A, | |||||||||||||
6.75%, 12/15/19 | United States | 10,000,000 | 9,787,500 | |||||||||||
7.25%, 12/15/21 | United States | 5,000,000 | 4,812,500 | |||||||||||
| j | Wells Fargo & Co., junior sub. bond, S, 5.90% to 6/15/24, FRN thereafter, Perpetual | United States | 7,900,000 | 8,137,000 | ||||||||||
|
| |||||||||||||
| 194,523,013 | ||||||||||||||
|
| |||||||||||||
| Semiannual Report | FI-13 |
FRANKLIN TEMPLETON VARIABLE INSURANCE PRODUCTS TRUST
STATEMENT OF INVESTMENTS (UNAUDITED)
Franklin Income VIP Fund (continued)
| Country | Principal Amount* | Value | ||||||||||||
Corporate Bonds (continued) | ||||||||||||||
Health Care 5.5% | ||||||||||||||
CHS/Community Health Systems Inc., senior note, | ||||||||||||||
8.00%, 11/15/19 | United States | 49,800,000 | $ | 48,866,250 | ||||||||||
7.125%, 7/15/20 | United States | 15,000,000 | 13,981,350 | |||||||||||
6.875%, 2/01/22 | United States | 33,500,000 | 29,480,000 | |||||||||||
| e | Concordia International Corp., senior note, 144A, 9.50%, 10/21/22 | Canada | 5,000,000 | 4,687,500 | ||||||||||
DaVita HealthCare Partners Inc., senior bond, 5.125%, 7/15/24 | United States | 5,000,000 | 5,064,875 | |||||||||||
| e | Endo Finance LLC, senior note, 144A, 5.75%, 1/15/22 | United States | 17,500,000 | 15,879,500 | ||||||||||
| e | Endo Finance LLC/Endo Ltd./Endo Finco Inc., | |||||||||||||
senior bond, 144A, 6.00%, 2/01/25 | United States | 10,000,000 | 8,725,000 | |||||||||||
senior note, 144A, 6.00%, 7/15/23 | United States | 10,000,000 | 8,850,000 | |||||||||||
HCA Inc., | ||||||||||||||
senior bond, 5.875%, 5/01/23 | United States | 7,500,000 | 8,015,625 | |||||||||||
senior note, 7.50%, 2/15/22 | United States | 25,000,000 | 28,487,500 | |||||||||||
senior secured bond, first lien, 5.25%, 4/15/25 | United States | 5,000,000 | 5,237,500 | |||||||||||
senior secured note, first lien, 5.00%, 3/15/24 | United States | 10,400,000 | 10,790,000 | |||||||||||
| e | Mallinckrodt International Finance SA/Mallinckrodt CB LLC, | |||||||||||||
5.75%, 8/01/22 | United States | 12,000,000 | 11,482,500 | |||||||||||
5.625%, 10/15/23 | United States | 10,000,000 | 9,362,500 | |||||||||||
5.50%, 4/15/25 | United States | 10,000,000 | 8,971,200 | |||||||||||
Tenet Healthcare Corp., senior note, | ||||||||||||||
8.125%, 4/01/22 | United States | 35,000,000 | 36,043,000 | |||||||||||
6.75%, 6/15/23 | United States | 23,200,000 | 22,301,000 | |||||||||||
| e | Valeant Pharmaceuticals International, senior note, 144A, | United States | 2,500,000 | 2,162,500 | ||||||||||
| e | Valeant Pharmaceuticals International Inc., | |||||||||||||
senior bond, 144A, 6.125%, 4/15/25 | United States | 9,400,000 | 7,567,000 | |||||||||||
senior note, 144A, 6.75%, 8/15/18 | United States | 8,325,000 | 8,051,274 | |||||||||||
senior note, 144A, 5.375%, 3/15/20 | United States | 15,000,000 | 12,890,625 | |||||||||||
senior note, 144A, 5.875%, 5/15/23 | United States | 12,500,000 | 10,156,250 | |||||||||||
| e | Vizient Inc., senior note, 144A, 10.375%, 3/01/24 | United States | 5,000,000 | 5,375,000 | ||||||||||
|
| |||||||||||||
| 322,427,949 | ||||||||||||||
|
| |||||||||||||
Industrials 2.3% | ||||||||||||||
The ADT Corp., senior note, 3.50%, 7/15/22 | United States | 10,500,000 | 9,673,125 | |||||||||||
| e | Algeco Scotsman Global Finance PLC, senior secured note, first lien, 144A, 8.50%, 10/15/18 | United Kingdom | 9,900,000 | 7,969,500 | ||||||||||
| e | Bombardier Inc., senior bond, 144A, | |||||||||||||
6.125%, 1/15/23 | Canada | 5,000,000 | 4,300,000 | |||||||||||
7.50%, 3/15/25 | Canada | 11,000,000 | 9,570,000 | |||||||||||
| e | CEVA Group PLC, senior note, first lien, 144A, 4.00%, 5/01/18 | United Kingdom | 12,691,882 | 11,359,234 | ||||||||||
Hertz Corp., senior note, 6.75%, 4/15/19 | United States | 10,000,000 | 10,210,770 | |||||||||||
Navistar International Corp., senior bond, 8.25%, 11/01/21 | United States | 5,675,000 | 4,015,063 | |||||||||||
| e | Prime Security Services Borrower LLC/Prime Finance Inc., | United States | 6,000,000 | 6,375,000 | ||||||||||
TransDigm Inc., | ||||||||||||||
senior sub. bond, 6.50%, 7/15/24 | United States | 10,000,000 | 10,100,000 | |||||||||||
e senior sub. bond, 144A, 6.375%, 6/15/26 | United States | 6,200,000 | 6,192,250 | |||||||||||
senior sub. note, 6.00%, 7/15/22 | United States | 7,700,000 | 7,778,386 | |||||||||||
United Rentals North America Inc., senior bond, 6.125%, 6/15/23 | United States | 11,400,000 | 11,927,250 | |||||||||||
| FI-14 | Semiannual Report |
FRANKLIN TEMPLETON VARIABLE INSURANCE PRODUCTS TRUST
STATEMENT OF INVESTMENTS (UNAUDITED)
Franklin Income VIP Fund (continued)
| Country | Principal Amount* | Value | ||||||||||||
Corporate Bonds (continued) | ||||||||||||||
Industrials (continued) | ||||||||||||||
| e | XPO Logistics Inc., senior note, 144A, | |||||||||||||
7.875%, 9/01/19 | United States | 6,700,000 | $ | 6,850,750 | ||||||||||
6.50%, 6/15/22 | United States | 28,480,000 | 27,305,200 | |||||||||||
|
| |||||||||||||
| 133,626,528 | ||||||||||||||
|
| |||||||||||||
Information Technology 3.4% | ||||||||||||||
| e | BMC Software Finance Inc., senior note, 144A, 8.125%, 7/15/21 | United States | 16,500,000 | 12,457,500 | ||||||||||
| e | CommScope Inc., | |||||||||||||
senior bond, 144A, 5.50%, 6/15/24 | United States | 10,000,000 | 10,187,500 | |||||||||||
senior note, 144A, 5.00%, 6/15/21 | United States | 8,422,000 | 8,634,655 | |||||||||||
| e | Diamond 1 Finance Corp./Diamond 2 Finance Corp., | |||||||||||||
senior note, 144A, 5.875%, 6/15/21 | United States | 3,600,000 | 3,692,808 | |||||||||||
senior note, 144A, 7.125%, 6/15/24 | United States | 3,600,000 | 3,765,607 | |||||||||||
senior secured bond, first lien, 144A, 5.45%, 6/15/23 | United States | 21,100,000 | 21,910,029 | |||||||||||
senior secured bond, first lien, 144A, 6.02%, 6/15/26 | United States | 16,200,000 | 16,838,377 | |||||||||||
senior secured note, first lien, 144A, 4.42%, 6/15/21 | United States | 21,400,000 | 22,018,974 | |||||||||||
| e | First Data Corp., | |||||||||||||
second lien, 144A, 5.75%, 1/15/24 | United States | 5,000,000 | 4,975,000 | |||||||||||
senior note, 144A, 7.00%, 12/01/23 | United States | 25,000,000 | 25,468,750 | |||||||||||
senior secured note, first lien, 144A, 5.375%, 8/15/23 | United States | 5,000,000 | 5,096,300 | |||||||||||
| e | Micron Technology Inc., senior secured note, 144A, 7.50%, 9/15/23 | United States | 5,000,000 | 5,358,000 | ||||||||||
| e | Microsemi Corp., senior note, 144A, 9.125%, 4/15/23 | United States | 5,500,000 | 6,077,500 | ||||||||||
NCR Corp., senior note, | ||||||||||||||
5.00%, 7/15/22 | United States | 5,500,000 | 5,417,500 | |||||||||||
6.375%, 12/15/23 | United States | 7,000,000 | 7,175,000 | |||||||||||
| e | Western Digital Corp., | |||||||||||||
senior note, 144A, 10.50%, 4/01/24 | United States | 30,000,000 | 32,175,000 | |||||||||||
senior secured note, 144A, 7.375%, 4/01/23 | United States | 10,000,000 | 10,675,000 | |||||||||||
|
| |||||||||||||
| 201,923,500 | ||||||||||||||
|
| |||||||||||||
Materials 2.1% | ||||||||||||||
| e | Ardagh Packaging Finance PLC/Ardagh MP Holdings USA Inc., senior note, 144A, | |||||||||||||
6.25%, 1/31/19 | Luxembourg | 7,500,000 | 7,659,375 | |||||||||||
4.625%, 5/15/23 | Luxembourg | 15,000,000 | 14,887,500 | |||||||||||
7.25%, 5/15/24 | Luxembourg | 10,200,000 | 10,480,500 | |||||||||||
| e | Cemex Finance LLC, senior secured note, first lien, 144A, | Mexico | 14,700,000 | 14,289,723 | ||||||||||
| e | First Quantum Minerals Ltd., senior note, 144A, 7.00%, 2/15/21 | Canada | 2,000,000 | 1,617,500 | ||||||||||
| e | FMG Resources (August 2006) Pty. Ltd., senior secured note, 144A, 9.75%, 3/01/22 | Australia | 27,000,000 | 29,970,000 | ||||||||||
| e | Platform Specialty Products Corp., senior note, 144A, | United States | 3,500,000 | 3,097,500 | ||||||||||
Reynolds Group Issuer Inc./Reynolds Group Issuer LLC/Reynolds Group Issuer Luxembourg SA, | ||||||||||||||
first lien, 5.75%, 10/15/20 | United States | 12,500,000 | 12,942,750 | |||||||||||
e first lien, 144A, 5.125%, 7/15/23 | United States | 4,300,000 | 4,359,125 | |||||||||||
senior note, 9.875%, 8/15/19 | United States | 3,476,000 | 3,593,315 | |||||||||||
e senior note, 144A, 7.00%, 7/15/24 | United States | 2,000,000 | 2,062,750 | |||||||||||
senior secured note, first lien, 6.875%, 2/15/21 | United States | 7,900,000 | 8,137,000 | |||||||||||
e,f senior secured note, first lien, 144A, FRN, 4.127%, 7/15/21 | United States | 7,600,000 | 7,638,000 | |||||||||||
|
| |||||||||||||
| 120,735,038 | ||||||||||||||
|
| |||||||||||||
| Semiannual Report | FI-15 |
FRANKLIN TEMPLETON VARIABLE INSURANCE PRODUCTS TRUST
STATEMENT OF INVESTMENTS (UNAUDITED)
Franklin Income VIP Fund (continued)
| Country | Principal Amount* | Value | ||||||||||||
Corporate Bonds (continued) | ||||||||||||||
Telecommunication Services 3.9% | ||||||||||||||
Consolidated Communications Inc., senior note, 6.50%, 10/01/22 | United States | 15,000,000 | $ | 13,537,500 | ||||||||||
Frontier Communications Corp., senior note, | ||||||||||||||
9.25%, 7/01/21 | United States | 7,400,000 | 7,862,500 | |||||||||||
10.50%, 9/15/22 | United States | 10,000,000 | 10,618,750 | |||||||||||
7.125%, 1/15/23 | United States | 7,800,000 | 7,020,000 | |||||||||||
Intelsat Jackson Holdings SA, senior bond, 5.50%, 8/01/23 | Luxembourg | 8,400,000 | 5,376,000 | |||||||||||
| e | Neptune Finco Corp., senior bond, 144A, 10.875%, 10/15/25 | United States | 13,000,000 | 14,860,560 | ||||||||||
Sprint Capital Corp., senior note, 6.90%, 5/01/19 | United States | 3,500,000 | 3,360,000 | |||||||||||
Sprint Communications Inc., | ||||||||||||||
11.50%, 11/15/21 | United States | 30,000,000 | 29,790,000 | |||||||||||
senior note, 7.00%, 8/15/20 | United States | 7,500,000 | 6,740,625 | |||||||||||
e senior note, 144A, 9.00%, 11/15/18 | United States | 11,900,000 | 12,718,125 | |||||||||||
Sprint Corp., | ||||||||||||||
senior bond, 7.875%, 9/15/23 | United States | 37,500,000 | 30,843,750 | |||||||||||
senior bond, 7.125%, 6/15/24 | United States | 8,200,000 | 6,529,250 | |||||||||||
senior note, 7.625%, 2/15/25 | United States | 15,000,000 | 11,943,750 | |||||||||||
T-Mobile USA Inc., | ||||||||||||||
senior bond, 6.625%, 4/01/23 | United States | 15,000,000 | 15,913,050 | |||||||||||
senior note, 6.25%, 4/01/21 | United States | 12,000,000 | 12,562,440 | |||||||||||
senior note, 6.633%, 4/28/21 | United States | 7,500,000 | 7,865,625 | |||||||||||
senior note, 6.731%, 4/28/22 | United States | 5,000,000 | 5,276,500 | |||||||||||
| e | Telecom Italia SpA, senior note, 144A, 5.303%, 5/30/24 | Italy | 5,000,000 | 5,025,000 | ||||||||||
| e | Wind Acquisition Finance SA, secured note, second lien, | Italy | 11,500,000 | 10,959,557 | ||||||||||
Zayo Group LLC/Zayo Capital Inc., senior note, 6.375%, 5/15/25 | United States | 10,000,000 | 10,237,500 | |||||||||||
|
| |||||||||||||
| 229,040,482 | ||||||||||||||
|
| |||||||||||||
Utilities 2.3% | ||||||||||||||
Calpine Corp., | ||||||||||||||
senior bond, 5.75%, 1/15/25 | United States | 15,000,000 | 14,643,750 | |||||||||||
senior note, 5.375%, 1/15/23 | United States | 19,500,000 | 19,110,000 | |||||||||||
senior note, 5.50%, 2/01/24 | United States | 5,000,000 | 4,850,000 | |||||||||||
e senior secured bond, 144A, 5.25%, 6/01/26 | United States | 15,000,000 | 15,000,000 | |||||||||||
Dynegy Inc., senior note, | ||||||||||||||
6.75%, 11/01/19 | United States | 38,000,000 | 38,285,000 | |||||||||||
7.375%, 11/01/22 | United States | 20,000,000 | 19,400,000 | |||||||||||
5.875%, 6/01/23 | United States | 8,000,000 | 7,080,000 | |||||||||||
| e | InterGen NV, secured bond, 144A, 7.00%, 6/30/23 | Netherlands | 25,000,000 | 17,812,500 | ||||||||||
|
| |||||||||||||
| 136,181,250 | ||||||||||||||
|
| |||||||||||||
Total Corporate Bonds (Cost $1,957,294,074) | 1,901,469,628 | |||||||||||||
|
| |||||||||||||
| f,k | Senior Floating Rate Interests 3.4% | |||||||||||||
Consumer Discretionary 1.2% | ||||||||||||||
Belk Inc., Closing Date Term Loan, 5.75%, 12/12/22 | United States | 24,937,500 | 19,950,000 | |||||||||||
iHeartCommunications Inc., | ||||||||||||||
Tranche D Term Loan, 7.21%, 1/30/19 | United States | 35,864,664 | 26,360,528 | |||||||||||
Tranche E Term Loan, 7.96%, 7/30/19 | United States | 13,142,769 | 9,668,149 | |||||||||||
Petco Animal Supplies Inc., Tranche B-1 Term Loans, | United States | 14,962,500 | 14,925,094 | |||||||||||
|
| |||||||||||||
| 70,903,771 | ||||||||||||||
|
| |||||||||||||
| FI-16 | Semiannual Report |
FRANKLIN TEMPLETON VARIABLE INSURANCE PRODUCTS TRUST
STATEMENT OF INVESTMENTS (UNAUDITED)
Franklin Income VIP Fund (continued)
| Country | Principal Amount* | Value | ||||||||||||
Senior Floating Rate Interests (continued) | ||||||||||||||
Energy 0.1% | ||||||||||||||
| h | W&T Offshore Inc., Second Lien Term Loan, 9.00%, 5/15/20 | United States | 11,000,000 | $ | 6,435,000 | |||||||||
|
| |||||||||||||
Financials 0.7% | ||||||||||||||
First Eagle Investment Management, Initial Term Loans, | United States | 39,800,000 | 39,169,846 | |||||||||||
|
| |||||||||||||
Health Care 0.3% | ||||||||||||||
Vizient Inc., Initial Term Loan, 6.25%, 2/10/23 | United States | 19,950,000 | 20,074,687 | |||||||||||
|
| |||||||||||||
Industrials 0.8% | ||||||||||||||
CEVA Group PLC, Pre-Funded L/C, 6.50%, 3/19/21 | United States | 5,382,266 | 4,453,825 | |||||||||||
CEVA Intercompany BV, Dutch BV Term Loan, 6.50%, 3/19/21 | Netherlands | 5,585,714 | 4,622,179 | |||||||||||
CEVA Logistics Canada ULC, Canadian Term Loan, 6.50%, 3/19/21 | Canada | 963,054 | 796,927 | |||||||||||
CEVA Logistics U.S. Holdings Inc., U.S. Term Loan, 6.50%, 3/19/21 | United States | 7,704,434 | 6,375,419 | |||||||||||
Commercial Barge Line Co., Initial Term Loan, 9.75%, 11/12/20 | United States | 9,875,000 | 9,233,125 | |||||||||||
Navistar Inc., Tranche B Term Loans, 6.50%, 8/07/20 | United States | 6,050,616 | 5,737,999 | |||||||||||
XPO Logistics Inc., First Lien Term Loan, 5.50%, 10/29/21 | United States | 14,925,000 | 14,962,313 | |||||||||||
|
| |||||||||||||
| 46,181,787 | ||||||||||||||
|
| |||||||||||||
Information Technology 0.2% | ||||||||||||||
Western Digital Corp., U.S. Term B Loan, 6.25%, 4/29/23 | United States | 10,000,000 | 10,056,250 | |||||||||||
|
| |||||||||||||
Materials 0.1% | ||||||||||||||
| l | FMG America Finance Inc. (Fortescue Metals Group), Loans, | Australia | 8,802,754 | 8,445,142 | ||||||||||
|
| |||||||||||||
Total Senior Floating Rate Interests | 201,266,483 | |||||||||||||
|
| |||||||||||||
| Shares | ||||||||||||||
Escrows and Litigation Trusts (Cost $62,602) 0.0% | ||||||||||||||
| a,c | Motors Liquidation Co., Escrow Account, cvt. pfd., C | United States | 1,400,000 | — | ||||||||||
|
| |||||||||||||
Total Investments before Short Term Investments (Cost $4,975,612,507) | 5,240,672,321 | |||||||||||||
|
| |||||||||||||
Short Term Investments 10.6% | ||||||||||||||
Money Market Funds (Cost $620,850,617) 10.5% | ||||||||||||||
| a,m | Institutional Fiduciary Trust Money Market Portfolio | United States | 620,850,617 | 620,850,617 | ||||||||||
|
| |||||||||||||
| n | Investments from Cash Collateral Received for Loaned Securities 0.1% | |||||||||||||
Money Market Funds (Cost $2,193,000) 0.1% | ||||||||||||||
| a,m | Institutional Fiduciary Trust Money Market Portfolio | United States | 2,193,000 | 2,193,000 | ||||||||||
|
| |||||||||||||
| Principal Amount* | ||||||||||||||
Repurchase Agreements (Cost $548,698) 0.0%† | ||||||||||||||
| o | Joint Repurchase Agreement, 0.40%, 7/01/16 | United States | 548,698 | 548,698 | ||||||||||
BNP Paribas Securities Corp. | ||||||||||||||
Collateralized by pU.S. Treasury Bill, 10/27/16; U.S. Treasury Bond, 8.75% - 9.00%, 11/15/18 - 5/15/20; U.S. Treasury Note, 0.363% - 4.75%, 9/15/16 - 3/31/21; U.S. Treasury Note, Index Linked, 2.625%, 7/15/17; and U.S. Treasury Strips, | ||||||||||||||
|
| |||||||||||||
| Semiannual Report | FI-17 |
FRANKLIN TEMPLETON VARIABLE INSURANCE PRODUCTS TRUST
STATEMENT OF INVESTMENTS (UNAUDITED)
Franklin Income VIP Fund (continued)
| Country | Principal Amount* | Value | ||||||||||||
Total Investments from Cash Collateral Received for Loaned Securities (Cost $2,741,698) | $ | 2,741,698 | ||||||||||||
|
| |||||||||||||
Total Investments (Cost $5,599,204,822) 99.6% | 5,864,264,636 | |||||||||||||
Other Assets, less Liabilities 0.4% | 24,732,606 | |||||||||||||
|
| |||||||||||||
Net Assets 100.0% | $ | 5,888,997,242 | ||||||||||||
|
| |||||||||||||
See Abbreviations on page FI-31.
†Rounds to less than 0.1% of net assets.
*The principal amount is stated in U.S. dollars unless otherwise indicated.
aNon-income producing.
bSee Note 8 regarding restricted securities.
cSecurity has been deemed illiquid because it may not be able to be sold within seven days. At June 30, 2016, the aggregate value of these securities was $9,911,531, representing 0.2% of net assets.
dSee Note 1(e) regarding equity-linked securities.
eSecurity was purchased pursuant to Rule 144A under the Securities Act of 1933 and may be sold in transactions exempt from registration only to qualified institutional buyers or in a public offering registered under the Securities Act of 1933. These securities have been deemed liquid under guidelines approved by the Trust’s Board of Trustees. At June 30, 2016, the aggregate value of these securities was $1,052,026,875, representing 17.9% of net assets.
fThe coupon rate shown represents the rate at period end.
gSee Note 7 regarding defaulted securities.
hAt June 30, 2016, pursuant to the Fund’s policies and the requirements of applicable securities law, the Fund is restricted from trading these securities at period end.
iA portion or all of the security is on loan at June 30, 2016. See Note 1(f).
jPerpetual security with no stated maturity date.
kSee Note 1(g) regarding senior floating rate interests.
lSecurity purchased on a when-issued or delayed delivery basis. See Note 1(d)
mSee Note 3(e) regarding investments in affiliated management investment companies.
nSee Note 1(f) regarding securities on loan.
oSee Note 1(c) regarding joint repurchase agreement.
pThe security is traded on a discount basis with no stated coupon rate.
| FI-18 | Semiannual Report | The accompanying notes are an integral part of these financial statements. | |||
FRANKLIN TEMPLETON VARIABLE INSURANCE PRODUCTS TRUST
Financial Statements
Statement of Assets and Liabilities
June 30, 2016 (unaudited)
| Franklin Income VIP Fund | ||||
Assets: | ||||
Investments in securities: | ||||
Cost - Unaffiliated issuers | $ | 4,975,612,507 | ||
Cost - Non-controlled affiliates (Note 3e) | 623,043,617 | |||
Cost - Repurchase agreements | 548,698 | |||
|
| |||
Total cost of investments | $ | 5,599,204,822 | ||
|
| |||
Value - Unaffiliated issuers | $ | 5,240,672,321 | ||
Value - Non-controlled affiliates (Note 3e) | 623,043,617 | |||
Value - Repurchase agreements | 548,698 | |||
|
| |||
Total value of investments (includes securities loaned in the amount of $2,678,775) | 5,864,264,636 | |||
Cash | 1,145,137 | |||
Receivables: | ||||
Investment securities sold | 11,241,511 | |||
Capital shares sold | 1,360,933 | |||
Dividends and interest | 43,295,458 | |||
Other assets | 2,596 | |||
|
| |||
Total assets | 5,921,310,271 | |||
|
| |||
Liabilities: | ||||
Payables: | ||||
Investment securities purchased | 14,792,929 | |||
Capital shares redeemed | 10,003,701 | |||
Management fees | 2,022,479 | |||
Distribution fees | 2,206,106 | |||
Payable upon return of securities loaned | 2,741,698 | |||
Accrued expenses and other liabilities | 546,116 | |||
|
| |||
Total liabilities | 32,313,029 | |||
|
| |||
Net assets, at value | $ | 5,888,997,242 | ||
|
| |||
Net assets consist of: | ||||
Paid-in capital | $ | 6,516,515,028 | ||
Undistributed net investment income | 114,134,037 | |||
Net unrealized appreciation (depreciation) | 265,056,283 | |||
Accumulated net realized gain (loss) | (1,006,708,106 | ) | ||
|
| |||
Net assets, at value | $ | 5,888,997,242 | ||
|
| |||
| The accompanying notes are an integral part of these financial statements. | Semiannual Report | FI-19 |
FRANKLIN TEMPLETON VARIABLE INSURANCE PRODUCTS TRUST
FINANCIAL STATEMENTS
Statement of Assets and Liabilities (continued)
June 30, 2016 (unaudited)
| Franklin Income VIP Fund | ||||
| Class 1: | ||||
Net assets, at value | $ | 662,360,607 | ||
|
| |||
Shares outstanding | 45,059,036 | |||
|
| |||
Net asset value and maximum offering price per share | $ | 14.70 | ||
|
| |||
| Class 2: | ||||
Net assets, at value | $ | 4,921,752,376 | ||
|
| |||
Shares outstanding | 345,275,478 | |||
|
| |||
Net asset value and maximum offering price per share | $ | 14.25 | ||
|
| |||
| Class 4: | ||||
Net assets, at value | $ | 304,884,259 | ||
|
| |||
Shares outstanding | 20,925,006 | |||
|
| |||
Net asset value and maximum offering price per share | $ | 14.57 | ||
|
| |||
| FI-20 | Semiannual Report | The accompanying notes are an integral part of these financial statements. |
FRANKLIN TEMPLETON VARIABLE INSURANCE PRODUCTS TRUST
FINANCIAL STATEMENTS
Statement of Operations
for the six months ended June 30, 2016 (unaudited)
| Franklin Income VIP Fund | ||||
Investment income: | ||||
Dividends | $ | 63,556,036 | ||
Interest | 76,102,592 | |||
Income from securities loaned (net of fees and rebates) | 643,258 | |||
|
| |||
Total investment income | 140,301,886 | |||
|
| |||
Expenses: | ||||
Management fees (Note 3a) | 12,868,273 | |||
Distribution fees: (Note 3c) | ||||
Class 2 | 5,926,691 | |||
Class 4 | 520,427 | |||
Custodian fees (Note 4) | 32,269 | |||
Reports to shareholders | 240,681 | |||
Professional fees | 74,421 | |||
Trustees’ fees and expenses | 14,842 | |||
Other | 62,152 | |||
|
| |||
Total expenses | 19,739,756 | |||
Expense reductions (Note 4) | (209 | ) | ||
Expenses waived/paid by affiliates (Note 3e) | (885,284 | ) | ||
|
| |||
Net expenses | 18,854,263 | |||
|
| |||
Net investment income | 121,447,623 | |||
|
| |||
Realized and unrealized gains (losses): | ||||
Net realized gain (loss) from: | ||||
Investments | (53,085,640 | ) | ||
Foreign currency transactions | 466,935 | |||
|
| |||
Net realized gain (loss) | (52,618,705 | ) | ||
|
| |||
Net change in unrealized appreciation (depreciation) on: | ||||
Investments | 247,556,039 | |||
Translation of other assets and liabilities denominated in foreign currencies | 6,414 | |||
|
| |||
Net change in unrealized appreciation (depreciation) | 247,562,453 | |||
|
| |||
Net realized and unrealized gain (loss) | 194,943,748 | |||
|
| |||
Net increase (decrease) in net assets resulting from operations | $ | 316,391,371 | ||
|
| |||
| The accompanying notes are an integral part of these financial statements. | Semiannual Report | FI-21 |
FRANKLIN TEMPLETON VARIABLE INSURANCE PRODUCTS TRUST
FINANCIAL STATEMENTS
Statements of Changes in Net Assets
| Franklin Income VIP Fund | ||||||||
| Six Months Ended June 30, 2016 (unaudited) | Year Ended December 31, 2015 | |||||||
Increase (decrease) in net assets: | ||||||||
Operations: | ||||||||
Net investment income | $ | 121,447,623 | $ | 280,263,160 | ||||
Net realized gain (loss) | (52,618,705 | ) | (198,185,492 | ) | ||||
Net change in unrealized appreciation (depreciation) | 247,562,453 | (544,397,831 | ) | |||||
|
| |||||||
Net increase (decrease) in net assets resulting from operations | 316,391,371 | (462,320,163 | ) | |||||
|
| |||||||
Distributions to shareholders from: | ||||||||
Net investment income: | ||||||||
Class 1 | (33,648,018 | ) | (32,196,540 | ) | ||||
Class 2 | (243,664,291 | ) | (260,631,132 | ) | ||||
Class 4 | (14,419,491 | ) | (15,803,892 | ) | ||||
|
| |||||||
Total distributions to shareholders | (291,731,800 | ) | (308,631,564 | ) | ||||
|
| |||||||
Capital share transactions: (Note 2) | ||||||||
Class 1 | 52,709,878 | (31,781,112 | ) | |||||
Class 2 | (3,067,770 | ) | (463,715,750 | ) | ||||
Class 4 | (3,155,246 | ) | (31,713,868 | ) | ||||
|
| |||||||
Total capital share transactions | 46,486,862 | (527,210,730 | ) | |||||
|
| |||||||
Net increase (decrease) in net assets | 71,146,433 | (1,298,162,457 | ) | |||||
Net assets: | ||||||||
Beginning of period | 5,817,850,809 | 7,116,013,266 | ||||||
|
| |||||||
End of period | $ | 5,888,997,242 | $ | 5,817,850,809 | ||||
|
| |||||||
Undistributed net investment income included in net assets: | ||||||||
End of period | $ | 114,134,037 | $ | 284,418,214 | ||||
|
| |||||||
| FI-22 | Semiannual Report | The accompanying notes are an integral part of these financial statements. |
FRANKLIN TEMPLETON VARIABLE INSURANCE PRODUCTS TRUST
Notes to Financial Statements (unaudited)
Franklin Income VIP Fund
1. Organization and Significant Accounting Policies
Franklin Templeton Variable Insurance Products Trust (Trust) is registered under the Investment Company Act of 1940 (1940 Act) as an open-end management investment company, consisting of nineteen separate funds and applies the specialized accounting and reporting guidance in U.S. Generally Accepted Accounting Principles (U.S. GAAP). Franklin Income VIP Fund (Fund) is included in this report. The financial statements of the remaining funds in the Trust are presented separately. Shares of the Fund are generally sold only to insurance company separate accounts to fund the benefits of variable life insurance policies or variable annuity contracts. The Fund offers three classes of shares: Class 1, Class 2, and Class 4. Each class of shares differs by its distribution fees, voting rights on matters affecting a single class and its exchange privilege.
The following summarizes the Fund’s significant accounting policies.
a. Financial Instrument Valuation
The Fund’s investments in financial instruments are carried at fair value daily. Fair value is the price that would be received to sell an asset or paid to transfer a liability in an orderly transaction between market participants on the measurement date. The Fund calculates the net asset value (NAV) per share as of 4 p.m. Eastern time each day the New York Stock Exchange (NYSE) is open for trading. Under compliance policies and procedures approved by the Trust’s Board of Trustees (the Board), the Fund’s administrator has responsibility for oversight of valuation, including leading the cross-functional Valuation Committee (VC). The VC provides administration and oversight of the Fund’s valuation policies and procedures, which are approved annually by the Board. Among other things, these procedures allow the Fund to utilize independent pricing services, quotations from securities and financial instrument dealers, and other market sources to determine fair value.
Equity securities listed on an exchange or on the NASDAQ National Market System are valued at the last quoted sale price or the official closing price of the day, respectively. Foreign equity securities are valued as of the close of trading on the foreign stock exchange on which the security is primarily traded or as of 4 p.m. Eastern time whichever is earlier. The value is then converted into its U.S. dollar equivalent at the foreign exchange rate in effect at 4 p.m. Eastern time on the day that the value of the security is determined. Over-the-counter (OTC) securities
are valued within the range of the most recent quoted bid and ask prices. Securities that trade in multiple markets or on multiple exchanges are valued according to the broadest and most representative market. Certain equity securities are valued based upon fundamental characteristics or relationships to similar securities.
Debt securities generally trade in the OTC market rather than on a securities exchange. The Fund’s pricing services use multiple valuation techniques to determine fair value. In instances where sufficient market activity exists, the pricing services may utilize a market-based approach through which quotes from market makers are used to determine fair value. In instances where sufficient market activity may not exist or is limited, the pricing services also utilize proprietary valuation models which may consider market characteristics such as benchmark yield curves, credit spreads, estimated default rates, anticipated market interest rate volatility, coupon rates, anticipated timing of principal repayments, underlying collateral, and other unique security features in order to estimate the relevant cash flows, which are then discounted to calculate the fair value. Securities denominated in a foreign currency are converted into their U.S. dollar equivalent at the foreign exchange rate in effect at 4 p.m. Eastern time on the date that the values of the foreign debt securities are determined.
Investments in open-end mutual funds are valued at the closing NAV. Repurchase agreements are valued at cost, which approximates fair value.
The Fund has procedures to determine the fair value of financial instruments for which market prices are not reliable or readily available. Under these procedures, the VC convenes on a regular basis to review such financial instruments and considers a number of factors, including significant unobservable valuation inputs, when arriving at fair value. The VC primarily employs a market-based approach which may use related or comparable assets or liabilities, recent transactions, market multiples, book values, and other relevant information for the investment to determine the fair value of the investment. An income-based valuation approach may also be used in which the anticipated future cash flows of the investment are discounted to calculate fair value. Discounts may also be applied due to the nature or duration of any restrictions on the disposition of the investments. Due to the inherent uncertainty of valuations of such investments, the fair values may differ significantly from the values that would have been used had an active market existed.
| Semiannual Report | FI-23 |
FRANKLIN TEMPLETON VARIABLE INSURANCE PRODUCTS TRUST
NOTES TO FINANCIAL STATEMENTS (UNAUDITED)
Franklin Income VIP Fund (continued)
1. Organization and Significant Accounting Policies (continued)
a. Financial Instrument Valuation (continued)
The VC employs various methods for calibrating these valuation approaches including a regular review of key inputs and assumptions, transactional back-testing or disposition analysis, and reviews of any related market activity.
Trading in securities on foreign securities stock exchanges and OTC markets may be completed before 4 p.m. Eastern time. In addition, trading in certain foreign markets may not take place on every NYSE business day. Occasionally, events occur between the time at which trading in a foreign security is completed and the close of the NYSE that might call into question the reliability of the value of a portfolio security held by the Fund. As a result, differences may arise between the value of the Fund’s portfolio securities as determined at the foreign market close and the latest indications of value at the close of the NYSE. In order to minimize the potential for these differences, the VC monitors price movements following the close of trading in foreign stock markets through a series of country specific market proxies (such as baskets of American Depositary Receipts, futures contracts and exchange traded funds). These price movements are measured against established trigger thresholds for each specific market proxy to assist in determining if an event has occurred that may call into question the reliability of the values of the foreign securities held by the Fund. If such an event occurs, the securities may be valued using fair value procedures, which may include the use of independent pricing services.
When the last day of the reporting period is a non-business day, certain foreign markets may be open on those days that the NYSE is closed, which could result in differences between the value of the Fund’s portfolio securities on the last business day and the last calendar day of the reporting period. Any significant security valuation changes due to an open foreign market are adjusted and reflected by the Fund for financial reporting purposes.
b. Foreign Currency Translation
Portfolio securities and other assets and liabilities denominated in foreign currencies are translated into U.S. dollars based on the exchange rate of such currencies against U.S. dollars on the date of valuation. The Fund may enter into foreign currency exchange contracts to facilitate transactions denominated in a
foreign currency. Purchases and sales of securities, income and expense items denominated in foreign currencies are translated into U.S. dollars at the exchange rate in effect on the transaction date. Portfolio securities and assets and liabilities denominated in foreign currencies contain risks that those currencies will decline in value relative to the U.S. dollar. Occasionally, events may impact the availability or reliability of foreign exchange rates used to convert the U.S. dollar equivalent value. If such an event occurs, the foreign exchange rate will be valued at fair value using procedures established and approved by the Board.
The Fund does not separately report the effect of changes in foreign exchange rates from changes in market prices on securities held. Such changes are included in net realized and unrealized gain or loss from investments in the Statement of Operations.
Realized foreign exchange gains or losses arise from sales of foreign currencies, currency gains or losses realized between the trade and settlement dates on securities transactions and the difference between the recorded amounts of dividends, interest, and foreign withholding taxes and the U.S. dollar equivalent of the amounts actually received or paid. Net unrealized foreign exchange gains and losses arise from changes in foreign exchange rates on foreign denominated assets and liabilities other than investments in securities held at the end of the reporting period.
c. Joint Repurchase Agreement
The Fund enters into a joint repurchase agreement whereby its uninvested cash balance is deposited into a joint cash account with other funds managed by the investment manager or an affiliate of the investment manager and is used to invest in one or more repurchase agreements. The value and face amount of the joint repurchase agreement are allocated to the funds based on their pro-rata interest. A repurchase agreement is accounted for as a loan by the Fund to the seller, collateralized by securities which are delivered to the Fund’s custodian. The fair value, including accrued interest, of the initial collateralization is required to be at least 102% of the dollar amount invested by the funds, with the value of the underlying securities marked to market daily to maintain coverage of at least 100%. Repurchase agreements are subject to the terms of Master Repurchase Agreements (MRAs) with approved counterparties (sellers). The MRAs contain various provisions, including but not limited to events of default and maintenance of collateral for repurchase agreements. In the event of default by either the seller or the
| FI-24 | Semiannual Report |
FRANKLIN TEMPLETON VARIABLE INSURANCE PRODUCTS TRUST
NOTES TO FINANCIAL STATEMENTS (UNAUDITED)
Franklin Income VIP Fund (continued)
Fund, certain MRAs may permit the non-defaulting party to net and close-out all transactions, if any, traded under such agreements. The Fund may sell securities it holds as collateral and apply the proceeds towards the repurchase price and any other amounts owed by the seller to the Fund in the event of default by the seller. This could involve costs or delays in addition to a loss on the securities if their value falls below the repurchase price owed by the seller. The joint repurchase agreement held by the Fund at period end, as indicated in the Statement of Investments, had been entered into on June 30, 2016.
d. Securities Purchased on a When-Issued or Delayed Delivery Basis
The Fund purchases securities on a when-issued or delayed delivery basis, with payment and delivery scheduled for a future date. These transactions are subject to market fluctuations and are subject to the risk that the value at delivery may be more or less than the trade date purchase price. Although the Fund will generally purchase these securities with the intention of holding the securities, it may sell the securities before the settlement date. Sufficient assets have been segregated for these securities.
e. Equity-Linked Securities
The Fund invests in equity-linked securities. Equity-linked securities are hybrid financial instruments that generally combine both debt and equity characteristics into a single note form. Income received from equity-linked securities is recorded as realized gains in the Statement of Operations and may be based on the performance of an underlying equity security, an equity index, or an option position. The risks of investing in equity-linked securities include unfavorable price movements in the underlying security and the credit risk of the issuing financial institution. There may be no guarantee of a return of principal with equity-linked securities and the appreciation potential may be limited. Equity-linked securities may be more volatile and less liquid than other investments held by the Fund.
f. Securities Lending
The Fund participates in an agency based securities lending program to earn additional income. The Fund receives cash collateral against the loaned securities in an amount equal to at least 102% of the fair value of the loaned securities. Collateral is maintained over the life of the loan in an amount not less than 100% of the fair value of loaned securities, as determined at the close of Fund business each day; any additional collateral required due to changes in security values is delivered to the Fund on the next business day. The collateral is deposited into a
joint cash account with other funds and is used to invest in a money market fund managed by Franklin Advisers, Inc., an affiliate of the Fund, and/or a joint repurchase agreement. The Fund may receive income from the investment of cash collateral, in addition to lending fees and rebates paid by the borrower. Income from securities loaned, net of fees paid to the securities lending agent and/or third-party vendor, is reported separately in the Statement of Operations. The Fund bears the market risk with respect to the collateral investment, securities loaned, and the risk that the agent may default on its obligations to the Fund. If the borrower defaults on its obligation to return the securities loaned, the Fund has the right to repurchase the securities in the open market using the collateral received. The securities lending agent has agreed to indemnify the Fund in the event of default by a third party borrower.
g. Senior Floating Rate Interests
The Fund invests in senior secured corporate loans that pay interest at rates which are periodically reset by reference to a base lending rate plus a spread. These base lending rates are generally the prime rate offered by a designated U.S. bank or the London InterBank Offered Rate (LIBOR). Senior secured corporate loans often require prepayment of principal from excess cash flows or at the discretion of the borrower. As a result, actual maturity may be substantially less than the stated maturity. Senior secured corporate loans in which the Fund invests are generally readily marketable, but may be subject to certain restrictions on resale.
h. Income and Deferred Taxes.
It is the Fund’s policy to qualify as a regulated investment company under the Internal Revenue Code. The Fund intends to distribute to shareholders substantially all of its taxable income and net realized gains to relieve it from federal income and if applicable, excise taxes. As a result, no provision for U.S. federal income taxes is required.
The Fund may be subject to foreign taxation related to income received, capital gains on the sale of securities and certain foreign currency transactions in the foreign jurisdictions in which it invests. Foreign taxes, if any, are recorded based on the tax regulations and rates that exist in the foreign markets in which the Fund invests. When a capital gain tax is determined to apply, the Fund records an estimated deferred tax liability in an amount that would be payable if the securities were disposed of on the valuation date. As a result of several court cases, in
| Semiannual Report | FI-25 |
FRANKLIN TEMPLETON VARIABLE INSURANCE PRODUCTS TRUST
NOTES TO FINANCIAL STATEMENTS (UNAUDITED)
Franklin Income VIP Fund (continued)
1. Organization and Significant Accounting Policies (continued)
h. Income and Deferred Taxes (continued)
certain countries across the European Union, the Fund filed additional tax reclaims for previously withheld taxes on dividends earned in those countries (EU reclaims). These additional filings are subject to various administrative proceedings by the local jurisdictions’ tax authorities within the European Union, as well as a number of related judicial proceedings. Income recognized, if any, for EU reclaims is reflected as other income in the Statement of Operations and any related receivable, if any, is reflected as European Union tax reclaims in the Statement of Assets and Liabilities. When uncertainty exists as to the ultimate resolution of these proceedings, the likelihood of receipt of these EU reclaims, and the potential timing of payment, no amounts are reflected in the financial statements.
The Fund may recognize an income tax liability related to its uncertain tax positions under U.S. GAAP when the uncertain tax position has a less than 50% probability that it will be sustained upon examination by the tax authorities based on its technical merits. As of June 30, 2016, the Fund has determined that no tax liability is required in its financial statements related to uncertain tax positions for any open tax years (or expected to be taken in future tax years). Open tax years are those that remain subject to examination and are based on each tax jurisdiction’s statute of limitation.
i. Security Transactions, Investment Income, Expenses and Distributions
Security transactions are accounted for on trade date. Realized gains and losses on security transactions are determined on a specific identification basis. Interest income and estimated expenses are accrued daily. Amortization of premium and accretion of discount on debt securities are included in interest income. Facility fees are recognized as income over the expected term of the loan. Dividend income is recorded on the ex-dividend date except for certain dividends from foreign securities where the dividend rate is not available. In such cases, the dividend is recorded as soon as the information is received by the Fund. Distributions to shareholders are recorded on the ex-dividend date and are determined according to income tax regulations (tax basis). Distributable earnings determined on a tax basis may differ from earnings recorded in accordance with U.S. GAAP. These differences may be permanent or temporary.
Permanent differences are reclassified among capital accounts to reflect their tax character. These reclassifications have no impact on net assets or the results of operations. Temporary differences are not reclassified, as they may reverse in subsequent periods.
Common expenses incurred by the Trust are allocated among the Funds based on the ratio of net assets of each Fund to the combined net assets of the Trust. Fund specific expenses are charged directly to the fund that incurred the expense.
Realized and unrealized gains and losses and net investment income, not including class specific expenses, are allocated daily to each class of shares based upon the relative proportion of net assets of each class. Differences in per share distributions, by class, are generally due to differences in class specific expenses.
j. Accounting Estimates
The preparation of financial statements in accordance with U.S. GAAP requires management to make estimates and assumptions that affect the reported amounts of assets and liabilities at the date of the financial statements and the amounts of income and expenses during the reporting period. Actual results could differ from those estimates.
k. Guarantees and Indemnifications
Under the Trust’s organizational documents, its officers and trustees are indemnified by the Trust against certain liabilities arising out of the performance of their duties to the Trust. Additionally, in the normal course of business, the Trust, on behalf of the Fund, enters into contracts with service providers that contain general indemnification clauses. The Trust’s maximum exposure under these arrangements is unknown as this would involve future claims that may be made against the Trust that have not yet occurred. Currently, the Trust expects the risk of loss to be remote.
| FI-26 | Semiannual Report |
FRANKLIN TEMPLETON VARIABLE INSURANCE PRODUCTS TRUST
NOTES TO FINANCIAL STATEMENTS (UNAUDITED)
Franklin Income VIP Fund (continued)
2. Shares of Beneficial Interest
At June 30, 2016, there were an unlimited number of shares authorized (without par value). Transactions in the Fund’s shares were as follows:
Shares of Beneficial Interest
| Six Months Ended June 30, 2016 | Year Ended December 31, 2015 | |||||||||||||||||||
| Shares | Amount | Shares | Amount | |||||||||||||||||
| Class 1 Shares: | ||||||||||||||||||||
Shares sold | 4,785,593 | $ | 67,213,855 | 1,738,174 | $ | 27,618,019 | ||||||||||||||
Shares issued in reinvestment of distributions | 2,331,810 | 33,648,018 | 2,040,338 | 32,196,540 | ||||||||||||||||
Shares redeemed | (3,330,652 | ) | (48,151,995 | ) | (5,869,235 | ) | (91,595,671 | ) | ||||||||||||
|
| |||||||||||||||||||
Net increase (decrease) | 3,786,751 | $ | 52,709,878 | (2,090,723 | ) | $ | (31,781,112 | ) | ||||||||||||
|
| |||||||||||||||||||
| Class 2 Shares: | ||||||||||||||||||||
Shares sold | 13,766,595 | $ | 198,995,920 | 21,413,080 | $ | 334,630,165 | ||||||||||||||
Shares issued in reinvestment of distributions | 17,417,033 | 243,664,291 | 17,001,378 | 260,631,132 | ||||||||||||||||
Shares redeemed | (31,552,736 | ) | (445,727,981 | ) | (69,202,126 | ) | (1,058,977,047 | ) | ||||||||||||
|
| |||||||||||||||||||
Net increase (decrease) | (369,108 | ) | $ | (3,067,770 | ) | (30,787,668 | ) | $ | (463,715,750 | ) | ||||||||||
|
| |||||||||||||||||||
| Class 4 Shares: | ||||||||||||||||||||
Shares sold | 973,176 | $ | 13,969,897 | 2,745,531 | $ | 43,147,056 | ||||||||||||||
Shares issued in reinvestment of distributions | 1,008,356 | 14,419,491 | 1,010,479 | 15,803,892 | ||||||||||||||||
Shares redeemed | (2,182,132 | ) | (31,544,634 | ) | (5,843,737 | ) | (90,664,816 | ) | ||||||||||||
|
| |||||||||||||||||||
Net increase (decrease) | (200,600 | ) | $ | (3,155,246 | ) | (2,087,727 | ) | $ | (31,713,868 | ) | ||||||||||
|
| |||||||||||||||||||
3. Transactions With Affiliates
Franklin Resources, Inc. is the holding company for various subsidiaries that together are referred to as Franklin Templeton Investments. Certain officers and trustees of the Fund are also officers and/or directors of the following subsidiaries:
| Subsidiary | Affiliation | |
Franklin Advisers, Inc. (Advisers) | Investment manager | |
Franklin Templeton Services, LLC (FT Services) | Administrative manager | |
Franklin Templeton Distributors, Inc. (Distributors) | Principal underwriter | |
Franklin Templeton Investor Services, LLC (Investor Services) | Transfer agent |
a. Management Fees
The Fund pays an investment management fee to Advisers based on the average daily net assets of the Fund as follows:
| Annualized Fee Rate | Net Assets | |
0.625% | Up to and including $100 million | |
0.500% | Over $100 million, up to and including $250 million | |
0.450% | Over $250 million, up to and including $7.5 billion | |
0.440% | Over $7.5 billion, up to and including $10 billion | |
0.430% | Over $10 billion, up to and including $12.5 billion | |
0.420% | Over $12.5 billion, up to and including $15 billion | |
0.400% | In excess of $15 billion |
| Semiannual Report | FI-27 |
FRANKLIN TEMPLETON VARIABLE INSURANCE PRODUCTS TRUST
NOTES TO FINANCIAL STATEMENTS (UNAUDITED)
Franklin Income VIP Fund (continued)
3. Transactions With Affiliates (continued)
For the period ended June 30, 2016, the annualized effective investment management fee rate was 0.454% of the Fund’s average daily net assets.
b. Administrative Fees
Under an agreement with Advisers, FT Services provides administrative services to the Fund. The fee is paid by Advisers based on the Fund’s average daily net assets, and is not an additional expense of the Fund.
c. Distribution Fees
The Board has adopted distribution plans for Class 2 and Class 4 shares pursuant to Rule 12b-1 under the 1940 Act. Under the Fund’s compensation distribution plans, the Fund pays Distributors for costs incurred in connection with the servicing, sale and distribution of the Fund’s shares up to 0.35%, per year of its average daily net assets of each class. The Board has agreed to limit the current rate to 0.25% per year for Class 2. The plan year, for purposes of monitoring compliance with the maximum annual plan rates, is February 1 through January 31.
d. Transfer Agent Fees
Investor Services, under terms of an agreement, performs shareholder servicing for the Fund and is not paid by the Fund for the services.
e. Investments in Affiliated Management Investment Companies
The Fund invests in one or more affiliated management investment companies for purposes other than exercising a controlling influence over the management or policies. Management fees paid by the Fund are waived on assets invested in the affiliated management investment companies, as noted in the Statement of Operations, in an amount not to exceed the management and administrative fees paid directly or indirectly by each affiliate.
| Number of Shares Held at Beginning of Period | Gross Additions | Gross Reductions | Number of Shares Held at End of Period | Value at End of Period | Investment Income | Realized Gain (Loss) | % of Affiliated Fund Shares Outstanding Held at End of Period | |||||||||||||||||||||||||
| Non-Controlled Affiliates | ||||||||||||||||||||||||||||||||
Institutional Fiduciary Trust Money | 589,053,827 | 665,929,014 | (631,939,224 | ) | 623,043,617 | $ | 623,043,617 | $ | — | $ | — | 3.2% | ||||||||||||||||||||
|
| |||||||||||||||||||||||||||||||
f. Other Affiliated Transactions
At June 30, 2016, Franklin Templeton Variable Insurance Products Trust — Franklin Founding Funds Allocation VIP Fund owned 5.4% of the Fund’s outstanding shares.
4. Expense Offset Arrangement
The Fund has entered into an arrangement with its custodian whereby credits realized as a result of uninvested cash balances are used to reduce a portion of the Fund’s custodian expenses. During the period ended June 30, 2016, the custodian fees were reduced as noted in the Statement of Operations.
| FI-28 | Semiannual Report |
FRANKLIN TEMPLETON VARIABLE INSURANCE PRODUCTS TRUST
NOTES TO FINANCIAL STATEMENTS (UNAUDITED)
Franklin Income VIP Fund (continued)
5. Income Taxes
For tax purposes, capital losses may be carried over to offset future capital gains. Capital loss carryforwards with no expiration, if any, must be fully utilized before those losses with expiration dates.
At December 31, 2015, capital loss carryforwards were as follows:
Capital loss carryforwards subject to expiration: | ||||
2016 | $ | 51,901,081 | ||
2017 | 521,405,875 | |||
2018 | 157,561,044 | |||
Capital loss carryforwards not subject to expiration: | ||||
Short term | 73,992,456 | |||
Long term | 144,130,633 | |||
|
| |||
Total capital loss carryforwards | $ | 948,991,089 | ||
|
|
At June 30, 2016, the cost of investments and net unrealized appreciation (depreciation) for income tax purposes were as follows:
Cost of investments | $ | 5,592,883,388 | ||
|
| |||
Unrealized appreciation | $ | 666,310,350 | ||
Unrealized depreciation | (394,929,102 | ) | ||
|
| |||
Net unrealized appreciation (depreciation) | $ | 271,381,248 | ||
|
|
Differences between income and/or capital gains as determined on a book basis and a tax basis are primarily due to differing treatments of bond discounts and premiums and equity-linked securities.
6. Investment Transactions
Purchases and sales of investments (excluding short term securities) for the period ended June 30, 2016, aggregated $1,358,778,213 and $1,379,809,114, respectively.
At June 30, 2016, in connection with securities lending transactions, the Fund loaned corporate bonds and received $2,741,698 of cash collateral. The gross amount of recognized liability for such transactions is included in payable upon return of securities loaned in the Statement of Assets and Liabilities. The agreements can be terminated at any time.
7. Credit Risk and Defaulted Securities
At June 30, 2016, the Fund had 32.7% of its portfolio invested in high yield, senior secured floating rate notes, or other securities rated below investment grade. These securities may be more sensitive to economic conditions causing greater price volatility and are potentially subject to a greater risk of loss due to default than higher rated securities.
The Fund held defaulted securities and/or other securities for which the income has been deemed uncollectible. At June 30, 2016, the aggregate value of these securities was $11,327,480, representing 0.2% of the Fund’s net assets. The Fund discontinues accruing income on securities for which income has been deemed uncollectible and provides an estimate for losses on interest receivable. The securities have been identified in the accompanying Statement of Investments.
8. Restricted Securities
The Fund invests in securities that are restricted under the Securities Act of 1933 (1933 Act) or which are subject to legal, contractual, or other agreed upon restrictions on resale. Restricted securities are often purchased in private placement transactions, and cannot be sold without prior registration unless the sale is pursuant to an exemption under the 1933 Act. Disposal of these securities
| Semiannual Report | FI-29 |
FRANKLIN TEMPLETON VARIABLE INSURANCE PRODUCTS TRUST
NOTES TO FINANCIAL STATEMENTS (UNAUDITED)
Franklin Income VIP Fund (continued)
8. Restricted Securities (continued)
may require greater effort and expense, and prompt sale at an acceptable price may be difficult. The Fund may have registration rights for restricted securities. The issuer generally incurs all registration costs.
At June 30, 2016, the Fund held investments in restricted securities, excluding certain securities exempt from registration under the 1933 Act deemed to be liquid, as follows:
| Shares | Issuer | Acquisition Date | Cost | Value | ||||||||||
| 75,000 | aRex Energy Corp. (Value is 0.0%b of Net Assets) | 12/16/14 | $ | 3,860,972 | $ | 43,527 | ||||||||
|
| |||||||||||||
a The Fund also invests in unrestricted securities or other investments in the issuer, valued at $1,125,000 as of June, 30, 2016.
bRounds to less than 0.1% of net assets.
9. Credit Facility
The Fund, together with other U.S. registered and foreign investment funds (collectively, Borrowers), managed by Franklin Templeton Investments, are borrowers in a joint syndicated senior unsecured credit facility totaling $2 billion (Global Credit Facility) which matures on February 10, 2017. This Global Credit Facility provides a source of funds to the Borrowers for temporary and emergency purposes, including the ability to meet future unanticipated or unusually large redemption requests.
Under the terms of the Global Credit Facility, the Fund shall, in addition to interest charged on any borrowings made by the Fund and other costs incurred by the Fund, pay its share of fees and expenses incurred in connection with the implementation and maintenance of the Global Credit Facility, based upon its relative share of the aggregate net assets of all of the Borrowers, including an annual commitment fee of 0.07% based upon the unused portion of the Global Credit Facility. Effective February 12, 2016, the annual commitment fee is 0.15%. These fees are reflected in other expenses in the Statement of Operations. During the period ended June 30, 2016, the Fund did not use the Global Credit Facility.
10. Fair Value Measurements
The Fund follows a fair value hierarchy that distinguishes between market data obtained from independent sources (observable inputs) and the Fund’s own market assumptions (unobservable inputs). These inputs are used in determining the value of the Fund’s financial instruments and are summarized in the following fair value hierarchy:
| • | Level 1 – quoted prices in active markets for identical financial instruments |
| • | Level 2 – other significant observable inputs (including quoted prices for similar financial instruments, interest rates, prepayment speed, credit risk, etc.) |
| • | Level 3 – significant unobservable inputs (including the Fund’s own assumptions in determining the fair value of financial instruments) |
The input levels are not necessarily an indication of the risk or liquidity associated with financial instruments at that level.
For movements between the levels within the fair value hierarchy, the Fund has adopted a policy of recognizing the transfers as of the date of the underlying event which caused the movement.
| FI-30 | Semiannual Report |
FRANKLIN TEMPLETON VARIABLE INSURANCE PRODUCTS TRUST
NOTES TO FINANCIAL STATEMENTS (UNAUDITED)
Franklin Income VIP Fund (continued)
A summary of inputs used as of June 30, 2016, in valuing the Fund’s assets carried at fair value, is as follows:
| Level 1 | Level 2 | Level 3 | Total | |||||||||||||
| Assets: | ||||||||||||||||
Investments in Securities: | ||||||||||||||||
Equity Investments:a | ||||||||||||||||
Energy | $ | 459,517,401 | $ | 1,198,497 | $ | 43,527 | $ | 460,759,425 | ||||||||
Financials | 302,829,183 | 5,996,875 | — | 308,826,058 | ||||||||||||
Industrials | 369,981,539 | — | 9,911,531 | 379,893,070 | ||||||||||||
Information Technology | 352,975,600 | 32,599,469 | — | 385,575,069 | ||||||||||||
All Other Equity Investments b | 1,318,659,321 | — | — | 1,318,659,321 | ||||||||||||
Equity-Linked Securities | — | 252,213,267 | — | 252,213,267 | ||||||||||||
Convertible Bonds | — | 32,010,000 | — | 32,010,000 | ||||||||||||
Corporate Bonds | 1,901,469,628 | 1,901,469,628 | ||||||||||||||
Senior Floating Rate Interests | — | 201,266,483 | — | 201,266,483 | ||||||||||||
Escrows and Litigation Trusts | — | — | — | c | — | |||||||||||
Short Term Investments | 623,043,617 | 548,698 | — | 623,592,315 | ||||||||||||
|
| |||||||||||||||
Total Investments in Securities | $ | 3,427,006,661 | $ | 2,427,302,917 | $ | 9,955,058 | $ | 5,864,264,636 | ||||||||
|
| |||||||||||||||
aIncludes common, preferred and convertible preferred stocks.
bFor detailed categories, see the accompanying Statement of Investments.
cIncludes securities determined to have no value at June 30, 2016.
A reconciliation of assets in which Level 3 inputs are used in determining fair value is presented when there are significant Level 3 financial instruments at the end of the period.
11. Subsequent Events
The Fund has evaluated subsequent events through the issuance of the financial statements and determined that no events have occurred that require disclosure.
Abbreviations
| Selected Portfolio | ||
| ADR | American Depositary Receipt | |
| FNMA | Federal National Mortgage Association | |
| FRN | Floating Rate Note | |
| L/C | Letter of Credit | |
| MTN | Medium Term Note | |
| Semiannual Report | FI-31 |
Franklin Mutual Global Discovery VIP Fund
This semiannual report for Franklin Mutual Global Discovery VIP Fund covers the period ended June 30, 2016.
Class 4 Performance Summary as of June 30, 2016
The Fund’s Class 4 shares had a -0.61% total return* for the six-month period ended June 30, 2016.
*The Fund has a fee waiver associated with any investment in a Franklin Templeton money fund and/or Franklin Templeton fund, as applicable, contractually guaranteed through at least the Fund’s current fiscal year-end. Fund investment results reflect the fee waiver, to the extent applicable; without this reduction, the results would have been lower.
Performance reflects the Fund’s Class 4 operating expenses, but does not include any contract fees, expenses or sales charges. If they had been included, performance would be lower. These charges and deductions, particularly for variable life policies, can have a significant effect on contract values and insurance benefits. See the contract prospectus for a complete description of these expenses, including sales charges.
Performance data represent past performance, which does not guarantee future results. Investment return and principal value will fluctuate, and you may have a gain or loss when you sell your shares. Current performance may differ from figures shown.
| Semiannual Report | MGD-1 |
FRANKLIN MUTUAL GLOBAL DISCOVERY VIP FUND
Fund Goal and Main Investments
The Fund seeks capital appreciation. Under normal market conditions, the Fund invests primarily in U.S. and foreign equity securities that the investment manager believes are undervalued.
Fund Risks
All investments involve risks, including possible loss of principal. Value securities may not increase in price as anticipated, or may decline further in value. The Fund’s investments in foreign securities involve certain risks including currency fluctuations, and economic and political uncertainties. Smaller company stocks have exhibited greater price volatility than larger company stocks, particularly over the short term. The Fund’s investments in companies engaged in mergers, reorganizations or liquidations also involve special risks as pending deals may not be completed on time or on favorable terms. The Fund may invest in lower rated bonds, which entail higher credit risk. The Fund is actively managed but there is no guarantee that the manager’s investment decisions will produce the desired results. The Fund’s prospectus also includes a description of the main investment risks.
Performance Overview
You can find the Fund’s six-month total return in the Performance Summary. In comparison, the Fund’s benchmark, the MSCI World Index, posted a +1.02% total return, and the Standard & Poor’s® 500 Index generated a +3.84% total return for the same period.1
Economic and Market Overview
The global economy expanded during the six months under review. An improvement in commodity prices including a rally in crude oil prices, accommodative monetary policy from various global central banks, finalization of the new debt deal for Greece and encouraging Chinese trade data toward period-end boosted market sentiment. However, global equity market volatility increased after the U.S. Federal Reserve’s (Fed’s) June decision to keep its federal funds target range unchanged, while providing a cautious stance on further interest rate hikes. In addition, global economic concerns and the U.K.’s historic referendum to leave the European Union (EU), also known as the “Brexit,” contributed to volatile global stock markets.
Oil prices fell at the beginning of the review period, largely due to a strong global supply, but recovered in the period’s second half amid oilfield outages and continued demand growth. Meanwhile, commodity prices increased for most of the review period as oversupply for a host of commodities shrank and the market appeared to be on the path of rebalancing after hitting a glut-induced bottom earlier in the year. Gold prices continued to rise following the Brexit referendum as some investors turned to safe haven investing. The U.S. dollar generally depreciated against most currencies during the period, which increased returns of many foreign assets in U.S. dollar terms. In this environment, global developed market stocks overall, as measured by the MSCI World Index, rose slightly during the period.2
The U.S. economy grew moderately, as measured by gross domestic product (GDP) in 2016’s first and second quarters, driven by consumer spending and exports. A decline in private inventory investment and non-residential fixed investment contributed to the moderation. The Fed maintained its target interest rate during the review period after raising it for the first time in nine years at its December 2015 meeting. The Fed kept its target rate unchanged in its June meeting mainly due to a substantial slowdown in job additions toward period-end. The Fed expects economic conditions to evolve in a manner that could warrant only gradual increases in the federal funds rate.
In Europe, slower U.K. economic growth continued in 2016’s first quarter as output slowed in construction, production and agriculture. Immediate effects of the Brexit materialized as U.K. stocks significantly declined and the pound sterling hit a three-decade low amid intensified selling. Credit rating agencies Standard & Poor’s and Fitch also downgraded the U.K.’s credit rating. In the eurozone, despite investors’ concerns about banking sector weakness, low corporate earnings and post-Brexit political repercussions, some regions benefited due to rising consumer spending resulting from a cheaper euro, low inflation and signs of sustained economic growth. The eurozone’s annual inflation rate remained in negative territory for most of the review period; however, it rose marginally above zero in June.
Japan’s economy posted mixed results, contracting in 2015’s fourth quarter stemming from declining private and household consumption. However, the economy expanded during 2016’s first quarter as private consumption increased and business investment decreased less than anticipated. The Bank of Japan (BOJ) took several actions during the review period. In January,
1. Source: Morningstar. One cannot invest directly in an index, and an index is not representative of the Fund’s portfolio. Please see Index Descriptions following the Fund Summaries.
2. Please see Index Descriptions following the Fund Summaries.
| MGD-2 | Semiannual Report |
FRANKLIN MUTUAL GLOBAL DISCOVERY VIP FUND
to boost lending and support inflation, the BOJ introduced a negative interest rate on excess reserves held at the central bank by financial institutions. In April, the BOJ further reduced its GDP and inflation forecasts for fiscal year 2016, and decided against additional quantitative easing measures. However, after the U.K.’s vote in June to leave the EU, the BOJ hinted at carrying out flexible open market operations to stabilize its financial markets.
In emerging markets, economic growth generally moderated during the review period. Brazil’s economy witnessed its longest recession since the 1930s amid political and economic turmoil, while Russia’s economy continued to contract. The Bank of Russia reduced its key interest rate in an attempt to revive its economy. China’s economic growth slowed marginally in 2016’s first quarter compared to the previous quarter, but remained largely in line with the government’s target. The People’s Bank of China cut its cash reserve requirement ratio for the country’s banks and effectively devalued the renminbi against the U.S. dollar to the lowest level in more than five years. Overall, emerging market stocks, as measured by the MSCI Emerging Markets Index, rose for the six-month period under review.2
Investment Strategy
At Franklin Mutual Series, we are committed to our distinctive value approach to investing. Our major investment strategy is investing in undervalued stocks. When selecting undervalued equities, we are attracted to what we believe are fundamentally strong companies with healthy balance sheets, high-quality assets, substantial free cash flow and shareholder-oriented management teams and whose stocks are trading at discounts to our assessment of the companies’ intrinsic or business value. We also look for asset-rich companies whose shares may be trading at depressed levels due to concerns over short-term earnings disappointments, litigation, management strategy or other perceived negatives. While the vast majority of our undervalued equity investments are made in publicly traded companies globally, we may invest occasionally in privately held companies as well.
We complement this more traditional investment strategy with two others. One is distressed investing, which is complex and can take many forms. The most common distressed investment the Fund undertakes is the purchase of financially troubled or bankrupt companies’ debt at a substantial discount to face
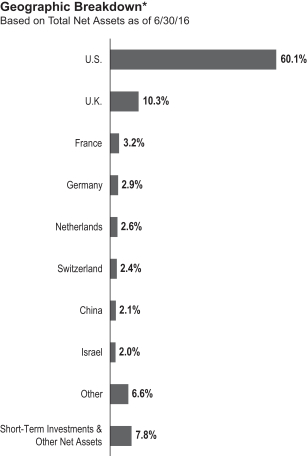
*Figures are stated as a percentage of total and may not equal 100% or may be negative due to rounding, use of any derivatives, unsettled trades or other factors.
value. After the financially distressed company is reorganized, often in bankruptcy court, the old debt is typically replaced with new securities issued by the financially stronger company.
The other piece of our investment strategy is participating in arbitrage situations, another highly specialized field. When companies announce proposed mergers or takeovers, commonly referred to as “deals,” the target company may trade at a discount to the bid it ultimately accepts. One form of arbitrage involves purchasing the target company’s stock when it is trading below the value we believe it would receive in a deal. In keeping with our commitment to a relatively conservative investment approach, we typically focus our arbitrage efforts on announced deals, and eschew rumored deals or other situations we consider relatively risky.
| Semiannual Report | MGD-3 |
FRANKLIN MUTUAL GLOBAL DISCOVERY VIP FUND
In addition, it is our practice to hedge the Fund’s currency exposure when we deem it advantageous for our shareholders.
What is meant by “hedge”?
To hedge an investment is to take a position intended to offset potential losses/gains that may be incurred by a companion financial instrument.
Manager’s Discussion
Economic and political uncertainty influenced markets during the six months under review. The year 2016 began with severe economic uncertainty. Brent oil prices plunged below US$30 per barrel as fears of a global recession spread. Global equity markets dropped from the start of the year, continuing a downward move from mid-2015 highs, before bottoming in mid-February. Commodity and equity prices rose over the following four months, before a late June surprise: the Brexit, ending a 43-year relationship with the rest of Europe. Uncertainty about the future status of the U.K. as well as implications for the EU and the global economy weighed on markets at the end of the period.
Equity prices are typically forward looking, reflecting investors’ beliefs about how various factors and events will play out in the future. Global equity prices at period-end were down from mid-2015 highs, reflecting increased uncertainty among investors regarding the consequences of Brexit in addition to long-standing concerns about China, commodity prices, interest rates and geopolitical events.
Following the momentous decision by U.K. voters on June 23 to leave the EU, we believe it is probable that the U.K. will face a heightened risk of an economic slowdown, as businesses will likely put investment decisions on hold while waiting for greater clarity. The negative impact on the rest of the EU will likely be less severe, although economic growth in the region was already running at a modest pace before the vote, and we do not believe the region will be immune. Among the region’s equity markets, we believe that financial and domestically oriented cyclical stocks were being perceived by some investors as more vulnerable. Those stocks that were viewed as defensive, as well as stocks with what we consider attractive dividend yields, will likely remain in favor among many investors, in our view, causing them to trade at even higher valuation multiples. Within the U.K., large multinational companies that generate most of their earnings abroad should benefit from the
| Top 10 Sectors/Industries | ||||
| 6/30/16 | ||||
% of Total Net Assets | ||||
| Banks | 13.6% | |||
| Insurance | 8.4% | |||
| Pharmaceuticals | 7.8% | |||
| Oil, Gas & Consumable Fuels | 7.0% | |||
| Software | 6.4% | |||
| Tobacco | 5.3% | |||
| Media | 4.5% | |||
| Health Care Equipment & Supplies | 4.2% | |||
| Food & Staples Retailing | 4.1% | |||
| Communications Equipment | 2.6% | |||
precipitous fall of the British pound that followed the Brexit vote. In this respect, the Fund’s exposure to U.K. equities was predominantly through a number of these global companies. Also, the Fund has only a modest exposure to European financials, particularly in banks.
Although the Brexit vote is clearly a negative surprise, we do not believe it will usher in a new global financial crisis similar to the one experienced eight years ago. While markets reacted brutally to the U.K.’s decision to leave the EU, we have not seen any systemic shock like the one that followed the fall of Lehman Brothers in 2008. We also believe that, eventually, the U.K. and the EU will come to an acceptable agreement concerning trade relations.
Three of the Fund’s top 10 positions at period-end were in health care.3 Merck, Medtronic and Switzerland-based Novartis are global companies that meet important customer needs with products protected by intellectual property. This focus on innovation that improves the lives of customers gives us confidence in the sustainability of their businesses. In addition, we feel that each has strong financial characteristics, including the ability to invest in research and development and acquisitions, while also providing material returns to shareholders, and trading at valuations that are attractive from our perspective as value investors.
The Fund also featured two information technology firms among its larger positions: Microsoft and Symantec.4 Microsoft features a strong global business based on innovation and meeting customer needs, including its fast-growing cloud business,
3. The health care sector comprises health care equipment and supplies, health care providers and services, and pharmaceuticals in the SOI.
4. The information technology sector comprises communications equipment, Internet software and services, IT services, semiconductors and semiconductor equipment, and software in the SOI.
| MGD-4 | Semiannual Report |
FRANKLIN MUTUAL GLOBAL DISCOVERY VIP FUND
while also returning excess capital to shareholders through dividends and share buybacks. Symantec also competes through innovation in providing security software to individuals and enterprises. Following a restructuring of its activities, the company is now focused on the fast-growing market for web-related security, while also returning capital to shareholders. In our view, these firms, like the health care firms mentioned previously, share these positive attributes as well as valuations that we, as value investors, find compelling.
Merger and acquisition (M&A) activity continued to be strong in the first half of 2016, helping to support valuations. Although deal volumes remained near historical highs, regulators globally continued to be more aggressive in their scrutiny of potentially negative effects of high concentration. We were disappointed to see regulators successfully sue to block the merger of Office Depot and Staples. Less surprising was the collapse of Halliburton’s attempt to acquire Baker Hughes (a Fund holding) on antitrust grounds, or the largest failure, Pfizer’s withdrawn attempt to acquire Allergan in the face of the U.S. Treasury Department’s new rules on tax inversions. We continue to be active in this space and work to ensure the potential rewards are big enough to outweigh the clear risks that exist in the current environment.
Turning to Fund performance, top contributors included British American Tobacco, oil and gas company Royal Dutch Shell and medical technology company Stryker.
Shares of U.K.-based British American Tobacco rose as many equity market investors showed a preference for defensive stocks (perceived to be less sensitive to economic conditions and/or having an attractive dividend yield, such as consumer staples) amid tepid global economic conditions, the low interest-rate environment and the late June U.K. referendum result in favor of leaving the EU. In our view, British American Tobacco remains an attractive position given the current management team, its portfolio of brands and track record of returning capital to shareholders.
Royal Dutch Shell is a U.K.-based oil and gas exploration and production company. Improved crude oil prices during the period helped many energy sector stocks, including Royal Dutch Shell. In January, company shareholders approved the acquisition of BG Group and both companies released quarterly results indicating strong cash flow and results in their natural gas operations. In June, investors reacted favorably to Royal Dutch Shell’s strategy update, which included an upward
revision to synergies related to the BG Group acquisition, including a lower cost base, a limit on capital spending, and an implicit lower oil-price breakeven point. The company also reiterated its intention to dispose of US$30 billion in assets through 2018, maintain its dividend, eliminate the scrip dividend, and buy back US$25 billion of its shares over time. Shares of Royal Dutch Shell did not follow the broad equity market decline after the June U.K. Brexit referendum result. The company is a U.S. dollar-based business that reports and declares its dividends in U.S. dollars, with some level of British pound-based costs, resulting in what we consider a more attractive valuation in its local market, given the decline in the pound.
U.S.-based medical technology company Stryker announced solid quarterly results in January and May that reflected strong organic growth, market share gains in many of its business segments and operating margin leverage that drove earnings growth. Along with the earnings results in May, Stryker raised its sales and earnings guidance for 2016. Beyond earnings, Stryker announced two strategic acquisitions in February. In our view, the deals were priced at full valuation but involved good-quality assets that offer Stryker the potential to enhance the value of existing assets and drive further value for Stryker shareholders.
During the period under review, Fund investments that detracted from performance included insurer NN Group, bank holding company Barclays and financial services company Citigroup.
NN Group is a Netherlands-based insurer spun out of ING Groep in 2014. Shares of NN Group followed the broad-based decline of European financial stocks in late June following the U.K.’s vote to leave the EU. In our view, the outcome had negative implications for the insurance sector by increasing economic uncertainty, adding immediate downward pressure on global interest rates and increasing the possibility that the U.S. Fed will further delay its next interest rate hike. Shares of NN Group also declined in January and early February as Europe’s financial sector was hurt by the potentially detrimental effect of the European Central Bank’s negative interest rate policy.
Shares of U.K.-based bank Barclays dropped sharply in late June after the U.K. Brexit vote. Investors feared the decision could lead to an increase in bad loans and reduced investment banking revenues if the U.K. economy slips into recession. Barclays’ stock had already significantly declined in January and early February as Europe’s financial sector was hindered by
| Semiannual Report | MGD-5 |
FRANKLIN MUTUAL GLOBAL DISCOVERY VIP FUND
| Top 10 Equity Holdings | ||||
| 6/30/16 | ||||
| Company Sector/Industry, Country | % of Total Net Assets | |||
| Microsoft Corp. | 3.1% | |||
| Software, U.S. | ||||
| Merck & Co. Inc. | 2.8% | |||
| Pharmaceuticals, U.S. | ||||
| Medtronic PLC | 2.3% | |||
| Health Care Equipment & Supplies, U.S. | ||||
| Royal Dutch Shell, PLC | 2.2% | |||
| Oil, Gas & Consumable Fuels, U.K. | ||||
| British American Tobacco PLC | 1.9% | |||
| Tobacco, U.K. | ||||
| Wells Fargo & Co. | 1.9% | |||
| Banks, U.S. | ||||
| Chubb Ltd. | 1.8% | |||
| Insurance, U.S. | ||||
| Vodafone Group PLC | 1.7% | |||
| Wireless Telecommunication Services, U.K. | ||||
| American International Group Inc. | 1.7% | |||
| Insurance, U.S. | ||||
| Novartis AG | 1.7% | |||
| Pharmaceuticals, Switzerland | ||||
The dollar value, number of shares or principal amount, and names of all portfolio holdings are listed in the Fund’s Statement of Investments (SOI).
the detrimental effects of low interest rates, ongoing concerns about the health of the global economy, and challenging conditions in capital markets. In addition, the bank’s share price was negatively impacted by a disappointing strategic update in early March that included limited downsizing of the investment banking unit and a dividend cut to fund an accelerated rundown of its non-core activities.
Citigroup is a U.S.-based diversified financial services company. Shares of the lender followed the broad-based decline of global financial stocks in late June after the U.K. Brexit vote. The stock also dropped sharply in January and early February, driven by ongoing investor concerns about global economic health (an area of particular relevance for Citigroup given its significant presence outside the U.S.), scaled back expectations regarding potential interest rate hikes by the U.S. Fed, concerns regarding financial sector exposure to energy companies and the
challenging conditions for capital market operations. Citigroup’s stock price was further impacted in mid-January by a weak set of quarterly results, including soft revenue and higher credit costs, due in part to a US$250 million charge to cover potential future losses in its oil and gas portfolio. However, we continue to view Citigroup as a cheaply valued bank with best-in-class capital levels that is focused on controlling costs, scaling back its non-core activities and returning excess capital to shareholders.
During the period, the Fund held currency forwards and futures to somewhat hedge the currency risk of the portfolio’s non-U.S. dollar investments. The currency forwards had a positive impact on the Fund’s performance, and currency futures had a negligible impact.
What is a currency forward?
A currency forward is an agreement between the Fund and a counterparty to buy or sell a foreign currency in exchange for another currency at a specific exchange rate on a future date.
What is a future?
A future is an agreement between the Fund and a counterparty made through a U.S. or foreign futures exchange to buy or sell an underlying instrument or asset at a specific price on a future date.
Thank you for your participation in Franklin Mutual Global Discovery VIP Fund. We look forward to serving your future investment needs.
The foregoing information reflects our analysis, opinions and portfolio holdings as of June 30, 2016, the end of the reporting period. The way we implement our main investment strategies and the resulting portfolio holdings may change depending on factors such as market and economic conditions. These opinions may not be relied upon as investment advice or an offer for a particular security. The information is not a complete analysis of every aspect of any market, country, industry, security or the Fund. Statements of fact are from sources considered reliable, but the investment manager makes no representation or warranty as to their completeness or accuracy. Although historical performance is no guarantee of future results, these insights may help you understand our investment management philosophy.
| MGD-6 | Semiannual Report |
FRANKLIN MUTUAL GLOBAL DISCOVERY VIP FUND
Class 4 Fund Expenses
As an investor in a variable insurance contract (Contract) that indirectly provides for investment in an underlying mutual fund, you can incur transaction and/or ongoing expenses at both the Fund level and the Contract level.
| • | Transaction expenses can include sales charges (loads) on purchases, surrender fees, transfer fees and premium taxes. |
| • | Ongoing expenses can include management fees, distribution and service (12b-1) fees, contract fees, annual maintenance fees, mortality and expense risk fees and other fees and expenses. All mutual funds and Contracts have some types of ongoing expenses. |
The expenses shown in the table are meant to highlight ongoing expenses at the Fund level only and do not include ongoing expenses at the Contract level, or transaction expenses at either the Fund or Contract levels. While the Fund does not have transaction expenses, if the transaction and ongoing expenses at the Contract level were included, the expenses shown below would be higher. You should consult your Contract prospectus or disclosure document for more information.
The table shows Fund-level ongoing expenses and can help you understand these expenses and compare them with those of other mutual funds offered through the Contract. The table assumes a $1,000 investment held for the six months indicated. Please refer to the Fund prospectus for additional information on operating expenses.
Actual Fund Expenses
The first line (Actual) of the table provides actual account values and expenses. The “Ending Account Value” is derived from the Fund’s actual return, which includes the effect of ongoing Fund expenses, but does not include the effect of ongoing Contract expenses.
You can estimate the Fund-level expenses you incurred during the period by following these steps. Of course, your account value and expenses will differ from those in this illustration:
| 1. | Divide your account value by $1,000. |
If an account had an $8,600 value, then $8,600 ÷ $1,000 = 8.6.
| 2. | Multiply the result by the number under the heading “Fund-Level Expenses Incurred During Period.” |
If Fund-Level Expenses Incurred During Period were $7.50, then 8.6 × $7.50 = $64.50.
In this illustration, the estimated expenses incurred this period at the Fund level are $64.50.
Hypothetical Example for Comparison with Other Mutual Funds
Information in the second line (Hypothetical) of the table can help you compare ongoing expenses of the Fund with those of other mutual funds offered through the Contract. This information may not be used to estimate the actual ending account balance or expenses you incurred during the period. The hypothetical “Ending Account Value” is based on the Fund’s actual expense ratio and an assumed 5% annual rate of return before expenses, which does not represent the Fund’s actual return. The figure under the heading “Fund-Level Expenses Incurred During Period” shows the hypothetical expenses your account would have incurred under this scenario. You can compare this figure with the 5% hypothetical examples that appear in shareholder reports of other funds offered through a Contract.
| Class 4 | Beginning Account Value 1/1/16 | Ending Account Value 6/30/16 | Fund-Level Expenses 1/1/16–6/30/16 | |||||||||
Actual | $ | 1,000 | $ | 993.90 | $ | 6.69 | ||||||
Hypothetical (5% return before expenses) | $ | 1,000 | $ | 1,018.15 | $ | 6.77 | ||||||
*Expenses are calculated using the most recent six-month annualized expense ratio, net of expense waivers, for the Fund’s Class 4 shares (1.35%), which does not include any ongoing expenses of the Contract for which the Fund is an investment option, multiplied by the average account value over the period, multiplied by 182/366 to reflect the one-half year period.
| Semiannual Report | MGD-7 |
FRANKLIN TEMPLETON VARIABLE INSURANCE PRODUCTS TRUST
Financial Highlights
Franklin Mutual Global Discovery VIP Fund
Six Months Ended June 30, 2016 (unaudited) | Year Ended December 31, | |||||||||||||||||||||||
| 2015 | 2014 | 2013 | 2012 | 2011 | ||||||||||||||||||||
| Class 1 | ||||||||||||||||||||||||
Per share operating performance (for a share outstanding throughout the period) | ||||||||||||||||||||||||
Net asset value, beginning of period | $19.85 | $22.61 | $23.31 | $20.55 | $19.66 | $21.16 | ||||||||||||||||||
|
| |||||||||||||||||||||||
| Income from investment operationsa: | ||||||||||||||||||||||||
Net investment incomeb | 0.29 | 0.37 | 0.68 | c | 0.46 | 0.43 | 0.52 | |||||||||||||||||
Net realized and unrealized gains (losses) | (0.37 | ) | (1.17 | ) | 0.76 | 5.03 | 2.21 | (1.09 | ) | |||||||||||||||
|
| |||||||||||||||||||||||
Total from investment operations | (0.08 | ) | (0.80 | ) | 1.44 | 5.49 | 2.64 | (0.57 | ) | |||||||||||||||
|
| |||||||||||||||||||||||
| Less distributions from: | ||||||||||||||||||||||||
Net investment income | — | (0.69 | ) | (0.57 | ) | (0.58 | ) | (0.64 | ) | (0.50 | ) | |||||||||||||
Net realized gains | — | (1.27 | ) | (1.57 | ) | (2.15 | ) | (1.11 | ) | (0.43 | ) | |||||||||||||
|
| |||||||||||||||||||||||
Total distributions | — | (1.96 | ) | (2.14 | ) | (2.73 | ) | (1.75 | ) | (0.93 | ) | |||||||||||||
|
| |||||||||||||||||||||||
Net asset value, end of period | $19.77 | $19.85 | $22.61 | $23.31 | $20.55 | $19.66 | ||||||||||||||||||
|
| |||||||||||||||||||||||
Total returnd | (0.40)% | (3.39)% | 5.98% | 27.95% | 13.63% | (2.73)% | ||||||||||||||||||
| Ratios to average net assetse | ||||||||||||||||||||||||
Expensesf | 1.00% | g,h | 1.02% | g,h | 1.00% | g | 0.97% | g | 0.99% | 0.97% | g | |||||||||||||
Expenses incurred in connection with securities sold short | —% | i | 0.02% | 0.03% | —% | i | —% | i | —% | i | ||||||||||||||
Net investment income | 3.03% | 1.71% | 2.85% | c | 2.13% | 2.12% | 2.34% | |||||||||||||||||
| Supplemental data | ||||||||||||||||||||||||
Net assets, end of period (000’s) | $2,754 | $2,632 | $2,313 | $2,465 | $1,136 | $974 | ||||||||||||||||||
Portfolio turnover rate | 8.70% | 21.88% | 22.18% | 15.58% | 25.63% | 26.17% | j | |||||||||||||||||
aThe amount shown for a share outstanding throughout the period may not correlate with the Statement of Operations for the period due to the timing of sales and repurchases of the Fund’s shares in relation to income earned and/or fluctuating fair value of the investments of the Fund.
bBased on average daily shares outstanding.
cNet investment income per share includes approximately $0.34 per share related to income received in the form of special dividends in connection with certain Fund holdings. Excluding this amount, the ratio of net investment income to average net assets would have been 1.40%.
dTotal return does not include fees, charges or expenses imposed by the variable annuity and life insurance contracts for which the Franklin Templeton Variable Insurance Products Trust serves as an underlying investment vehicle. Total return is not annualized for periods less than one year.
eRatios are annualized for periods less than one year.
fIncludes dividend and/or interest expense on securities sold short and security borrowing fees, if any. See below for the ratios of such expenses to average net assets for the periods presented. See Note 1(g).
gBenefit of expense reduction rounds to less than 0.01%.
hBenefit of waiver and payments by affiliates rounds to less than 0.01%.
iRounds to less than 0.01%.
jExcludes the value of portfolio securities delivered as a result of a redemption in-kind.
| MGD-8 | Semiannual Report | The accompanying notes are an integral part of these financial statements. |
FRANKLIN TEMPLETON VARIABLE INSURANCE PRODUCTS TRUST
FINANCIAL HIGHLIGHTS
Franklin Mutual Global Discovery VIP Fund (continued)
Six Months Ended (unaudited) | Year Ended December 31, | |||||||||||||||||||||||
| 2015 | 2014 | 2013 | 2012 | 2011 | ||||||||||||||||||||
| Class 2 | ||||||||||||||||||||||||
Per share operating performance (for a share outstanding throughout the period) | ||||||||||||||||||||||||
Net asset value, beginning of period | $19.37 | $22.11 | $22.84 | $20.17 | $19.30 | $20.80 | ||||||||||||||||||
|
| |||||||||||||||||||||||
| Income from investment operationsa: | ||||||||||||||||||||||||
Net investment incomeb | 0.26 | 0.32 | 0.60 | c | 0.42 | 0.38 | 0.43 | |||||||||||||||||
Net realized and unrealized gains (losses) | (0.36 | ) | (1.16 | ) | 0.75 | 4.92 | 2.15 | (1.04 | ) | |||||||||||||||
|
| |||||||||||||||||||||||
Total from investment operations | (0.10 | ) | (0.84 | ) | 1.35 | �� | 5.34 | 2.53 | (0.61 | ) | ||||||||||||||
|
| |||||||||||||||||||||||
| Less distributions from: | ||||||||||||||||||||||||
Net investment income | — | (0.63 | ) | (0.51 | ) | (0.52 | ) | (0.55 | ) | (0.46 | ) | |||||||||||||
Net realized gains | — | (1.27 | ) | (1.57 | ) | (2.15 | ) | (1.11 | ) | (0.43 | ) | |||||||||||||
|
| |||||||||||||||||||||||
Total distributions | — | (1.90 | ) | (2.08 | ) | (2.67 | ) | (1.66 | ) | (0.89 | ) | |||||||||||||
|
| |||||||||||||||||||||||
Net asset value, end of period | $19.27 | $19.37 | $22.11 | $22.84 | $20.17 | $19.30 | ||||||||||||||||||
|
| |||||||||||||||||||||||
Total returnd | (0.52)% | (3.65)% | 5.71% | 27.61% | 13.36% | (2.96)% | ||||||||||||||||||
| Ratios to average net assetse | ||||||||||||||||||||||||
Expensesf | 1.25% | g,h | 1.27% | g,h | 1.25% | g | 1.22% | g | 1.24% | 1.22% | g | |||||||||||||
Expenses incurred in connection with securities sold short | —% | i | 0.02% | 0.03% | —% | i | —%i | —% | i | |||||||||||||||
Net investment income | 2.78% | 1.46% | 2.60% | c | 1.88% | 1.87% | 2.09% | |||||||||||||||||
| Supplemental data | ||||||||||||||||||||||||
Net assets, end of period (000’s) | $597,645 | $629,366 | $685,711 | $684,780 | $660,465 | $712,161 | ||||||||||||||||||
Portfolio turnover rate | 8.70% | 21.88% | 22.18% | 15.58% | 25.63% | 26.17% | j | |||||||||||||||||
aThe amount shown for a share outstanding throughout the period may not correlate with the Statement of Operations for the period due to the timing of sales and repurchases of the Fund’s shares in relation to income earned and/or fluctuating fair value of the investments of the Fund.
bBased on average daily shares outstanding.
cNet investment income per share includes approximately $0.34 per share related to income received in the form of special dividends in connection with certain Fund holdings. Excluding this amount, the ratio of net investment income to average net assets would have been 1.15%.
dTotal return does not include fees, charges or expenses imposed by the variable annuity and life insurance contracts for which the Franklin Templeton Variable Insurance Products Trust serves as an underlying investment vehicle. Total return is not annualized for periods less than one year.
eRatios are annualized for periods less than one year.
fIncludes dividend and/or interest expense on securities sold short and security borrowing fees, if any. See below for the ratios of such expenses to average net assets for the periods presented. See Note 1(g).
gBenefit of expense reduction rounds to less than 0.01%.
hBenefit of waiver and payments by affiliates rounds to less than 0.01%.
iRounds to less than 0.01%.
jExcludes the value of portfolio securities delivered as a result of a redemption in-kind.
| The accompanying notes are an integral part of these financial statements. | Semiannual Report | MGD-9 |
FRANKLIN TEMPLETON VARIABLE INSURANCE PRODUCTS TRUST
FINANCIAL HIGHLIGHTS
Franklin Mutual Global Discovery VIP Fund (continued)
Six Months Ended (unaudited) | Year Ended December 31, | |||||||||||||||||||||||
| 2015 | 2014 | 2013 | 2012 | 2011 | ||||||||||||||||||||
| Class 4 | ||||||||||||||||||||||||
Per share operating performance (for a share outstanding throughout the period) | ||||||||||||||||||||||||
Net asset value, beginning of period | $19.66 | $22.39 | $23.10 | $20.38 | $19.50 | $21.02 | ||||||||||||||||||
|
| |||||||||||||||||||||||
| Income from investment operationsa: | ||||||||||||||||||||||||
Net investment incomeb | 0.25 | 0.30 | 0.61 | c | 0.40 | 0.36 | 0.40 | |||||||||||||||||
Net realized and unrealized gains (losses) | (0.37 | ) | (1.17 | ) | 0.73 | 4.97 | 2.19 | (1.05 | ) | |||||||||||||||
|
| |||||||||||||||||||||||
Total from investment operations | (0.12 | ) | (0.87 | ) | 1.34 | 5.37 | 2.55 | (0.65 | ) | |||||||||||||||
|
| |||||||||||||||||||||||
| Less distributions from: | ||||||||||||||||||||||||
Net investment income | — | (0.59 | ) | (0.48 | ) | (0.50 | ) | (0.56 | ) | (0.44 | ) | |||||||||||||
Net realized gains | — | (1.27 | ) | (1.57 | ) | (2.15 | ) | (1.11 | ) | (0.43 | ) | |||||||||||||
|
| |||||||||||||||||||||||
Total distributions | — | (1.86 | ) | (2.05 | ) | (2.65 | ) | (1.67 | ) | (0.87 | ) | |||||||||||||
|
| |||||||||||||||||||||||
Net asset value, end of period | $19.54 | $19.66 | $22.39 | $23.10 | $20.38 | $19.50 | ||||||||||||||||||
|
| |||||||||||||||||||||||
Total returnd | (0.61)% | (3.74)% | 5.60% | 27.52% | 13.27% | (3.08)% | ||||||||||||||||||
| Ratios to average net assetse | ||||||||||||||||||||||||
Expensesf | 1.35% | g,h | 1.37% | g,h | 1.35% | g | 1.32% | g | 1.34% | 1.32% | g | |||||||||||||
Expenses incurred in connection with securities sold short | —% | i | 0.02% | 0.03% | —% | i | —% | i | —% | i | ||||||||||||||
Net investment income | 2.68% | 1.36% | 2.50% | c | 1.78% | 1.77% | 1.99% | |||||||||||||||||
| Supplemental data | ||||||||||||||||||||||||
Net assets, end of period (000’s) | $45,021 | $49,054 | $59,961 | $70,354 | $62,346 | $66,695 | ||||||||||||||||||
Portfolio turnover rate | 8.70% | 21.88% | 22.18% | 15.58% | 25.63% | 26.17% | j | |||||||||||||||||
aThe amount shown for a share outstanding throughout the period may not correlate with the Statement of Operations for the period due to the timing of sales and repurchases of the Fund’s shares in relation to income earned and/or fluctuating fair value of the investments of the Fund.
bBased on average daily shares outstanding.
cNet investment income per share includes approximately $0.34 per share related to income received in the form of special dividends in connection with certain Fund holdings. Excluding this amount, the ratio of net investment income to average net assets would have been 1.05%.
dTotal return does not include fees, charges or expenses imposed by the variable annuity and life insurance contracts for which the Franklin Templeton Variable Insurance Products Trust serves as an underlying investment vehicle. Total return is not annualized for periods less than one year.
eRatios are annualized for periods less than one year.
fIncludes dividend and/or interest expense on securities sold short and security borrowing fees, if any. See below for the ratios of such expenses to average net assets for the periods presented. See Note 1(g).
gBenefit of expense reduction rounds to less than 0.01%.
hBenefit of waiver and payments by affiliates rounds to less than 0.01%.
iRounds to less than 0.01%.
jExcludes the value of portfolio securities delivered as a result of a redemption in-kind.
| MGD-10 | Semiannual Report | The accompanying notes are an integral part of these financial statements. |
FRANKLIN TEMPLETON VARIABLE INSURANCE PRODUCTS TRUST
Statement of Investments, June 30, 2016 (unaudited)
Franklin Mutual Global Discovery VIP Fund
| ||||||||||||||
| Country | Shares/Units | Value | ||||||||||||
Common Stocks and Other Equity Interests 86.3% | ||||||||||||||
Aerospace & Defense 0.6% | ||||||||||||||
B/E Aerospace Inc. | United States | 65,840 | $ | 3,040,163 | ||||||||||
| a | KLX Inc. | United States | 32,920 | 1,020,520 | ||||||||||
|
| |||||||||||||
| 4,060,683 | ||||||||||||||
|
| |||||||||||||
Auto Components 0.7% | ||||||||||||||
Cie Generale des Etablissements Michelin, B | France | 30,800 | 2,913,028 | |||||||||||
| a,b | International Automotive Components Group Brazil LLC | Brazil | 424,073 | 6,981 | ||||||||||
| a,b,c | International Automotive Components Group North America LLC | United States | 4,052,916 | 1,788,009 | ||||||||||
|
| |||||||||||||
| 4,708,018 | ||||||||||||||
|
| |||||||||||||
Automobiles 1.3% | ||||||||||||||
General Motors Co. | United States | 214,110 | 6,059,313 | |||||||||||
Hyundai Motor Co. | South Korea | 20,953 | 2,462,942 | |||||||||||
|
| |||||||||||||
| 8,522,255 | ||||||||||||||
|
| |||||||||||||
Banks 13.6% | ||||||||||||||
Barclays PLC | United Kingdom | 2,052,511 | 3,793,230 | |||||||||||
| d | BNP Paribas SA | France | 117,870 | 5,201,139 | ||||||||||
Capital Bank Financial Corp., A | United States | 78,494 | 2,260,627 | |||||||||||
| e | Capital Bank Financial Corp., B, 144A, non-voting | United States | 269,922 | 7,773,754 | ||||||||||
CIT Group Inc. | United States | 174,912 | 5,581,442 | |||||||||||
Citigroup Inc. | United States | 229,050 | 9,709,429 | |||||||||||
Citizens Financial Group Inc. | United States | 310,923 | 6,212,242 | |||||||||||
| a | Commerzbank AG | Germany | 276,968 | 1,790,418 | ||||||||||
HSBC Holdings PLC | United Kingdom | 586,355 | 3,642,619 | |||||||||||
JPMorgan Chase & Co. | United States | 131,280 | 8,157,739 | |||||||||||
KB Financial Group Inc. | South Korea | 56,047 | 1,585,034 | |||||||||||
PNC Financial Services Group Inc. | United States | 105,531 | 8,589,168 | |||||||||||
Societe Generale SA | France | 118,614 | 3,714,005 | |||||||||||
Standard Chartered PLC | United Kingdom | 374,211 | 2,817,201 | |||||||||||
SunTrust Banks Inc. | United States | 111,578 | 4,583,624 | |||||||||||
Wells Fargo & Co. | United States | 256,320 | 12,131,626 | |||||||||||
|
| |||||||||||||
| 87,543,297 | ||||||||||||||
|
| |||||||||||||
Beverages 1.3% | ||||||||||||||
PepsiCo Inc. | United States | 76,807 | 8,136,933 | |||||||||||
|
| |||||||||||||
Chemicals 0.3% | ||||||||||||||
Syngenta AG | Switzerland | 4,660 | 1,785,991 | |||||||||||
|
| |||||||||||||
Communications Equipment 2.6% | ||||||||||||||
Cisco Systems Inc. | United States | 359,180 | 10,304,874 | |||||||||||
Nokia Corp., ADR | Finland | 519,486 | 2,955,876 | |||||||||||
Nokia OYJ, A | Finland | 611,269 | 3,463,630 | |||||||||||
|
| |||||||||||||
| 16,724,380 | ||||||||||||||
|
| |||||||||||||
Construction Materials 0.5% | ||||||||||||||
| a | LafargeHolcim Ltd., B | Switzerland | 78,676 | 3,267,621 | ||||||||||
|
| |||||||||||||
Consumer Finance 0.4% | ||||||||||||||
| a | Ally Financial Inc. | United States | 151,600 | 2,587,812 | ||||||||||
|
| |||||||||||||
Diversified Financial Services 0.4% | ||||||||||||||
Voya Financial Inc. | United States | 101,650 | 2,516,854 | |||||||||||
|
| |||||||||||||
| Semiannual Report | MGD-11 |
FRANKLIN TEMPLETON VARIABLE INSURANCE PRODUCTS TRUST
STATEMENT OF INVESTMENTS (UNAUDITED)
Franklin Mutual Global Discovery VIP Fund (continued)
| Country | Shares/Units | Value | ||||||||||||
Common Stocks and Other Equity Interests (continued) | ||||||||||||||
Diversified Telecommunication Services 0.9% | ||||||||||||||
China Telecom Corp. Ltd., H | China | 13,642,104 | $ | 6,083,906 | ||||||||||
| a,f,g | Global Crossing Holdings Ltd., Contingent Distribution | United States | 2,236,777 | — | ||||||||||
|
| |||||||||||||
| 6,083,906 | ||||||||||||||
|
| |||||||||||||
Energy Equipment & Services 1.3% | ||||||||||||||
Baker Hughes Inc. | United States | 178,964 | 8,076,645 | |||||||||||
|
| |||||||||||||
Food & Staples Retailing 4.1% | ||||||||||||||
CVS Health Corp. | United States | 46,236 | 4,426,635 | |||||||||||
Empire Co. Ltd., A | Canada | 252,979 | 3,761,107 | |||||||||||
Metro AG | Germany | 226,924 | 6,918,987 | |||||||||||
| a | Rite Aid Corp. | United States | 391,098 | 2,929,324 | ||||||||||
Walgreens Boots Alliance Inc. | United States | 102,904 | 8,568,816 | |||||||||||
|
| |||||||||||||
| 26,604,869 | ||||||||||||||
|
| |||||||||||||
Health Care Equipment & Supplies 4.8% | ||||||||||||||
Medtronic PLC | United States | 168,500 | 14,620,745 | |||||||||||
St. Jude Medical Inc. | United States | 103,840 | 8,099,520 | |||||||||||
Stryker Corp. | United States | 69,848 | 8,369,886 | |||||||||||
|
| |||||||||||||
| 31,090,151 | ||||||||||||||
|
| |||||||||||||
Health Care Providers & Services 0.4% | ||||||||||||||
Cigna Corp. | United States | 20,116 | 2,574,647 | |||||||||||
|
| |||||||||||||
Hotels, Restaurants & Leisure 1.7% | ||||||||||||||
Accor SA | France | 233,913 | 9,006,625 | |||||||||||
Sands China Ltd. | Hong Kong | 648,800 | 2,165,886 | |||||||||||
|
| |||||||||||||
| 11,172,511 | ||||||||||||||
|
| |||||||||||||
Independent Power & Renewable Electricity Producers 0.7% | ||||||||||||||
NRG Energy Inc. | United States | 299,277 | 4,486,162 | |||||||||||
|
| |||||||||||||
Industrial Conglomerates 1.8% | ||||||||||||||
Jardine Strategic Holdings Ltd. | Hong Kong | 103,903 | 3,135,793 | |||||||||||
Koninklijke Philips NV | Netherlands | 328,294 | 8,160,512 | |||||||||||
|
| |||||||||||||
| 11,296,305 | ||||||||||||||
|
| |||||||||||||
Insurance 8.4% | ||||||||||||||
| a | Alleghany Corp. | United States | 2,730 | 1,500,353 | ||||||||||
The Allstate Corp. | United States | 98,929 | 6,920,084 | |||||||||||
American International Group Inc. | United States | 204,833 | 10,833,617 | |||||||||||
China Pacific Insurance Group Co. Ltd., H | China | 845,908 | 2,845,697 | |||||||||||
Chubb Ltd. | United States | 88,840 | 11,612,276 | |||||||||||
MetLife Inc. | United States | 100,526 | 4,003,951 | |||||||||||
NN Group NV | Netherlands | 323,882 | 8,913,625 | |||||||||||
XL Group PLC | Ireland | 235,290 | 7,837,510 | |||||||||||
|
| |||||||||||||
| 54,467,113 | ||||||||||||||
|
| |||||||||||||
Internet Software & Services 0.4% | ||||||||||||||
| a | LinkedIn Corp., A | United States | 13,756 | 2,603,323 | ||||||||||
|
| |||||||||||||
IT Services 0.7% | ||||||||||||||
Xerox Corp. | United States | 503,738 | 4,780,474 | |||||||||||
|
| |||||||||||||
Machinery 0.7% | ||||||||||||||
Caterpillar Inc. | United States | 58,695 | 4,449,668 | |||||||||||
|
| |||||||||||||
| MGD-12 | Semiannual Report |
FRANKLIN TEMPLETON VARIABLE INSURANCE PRODUCTS TRUST
STATEMENT OF INVESTMENTS (UNAUDITED)
Franklin Mutual Global Discovery VIP Fund (continued)
| Country | Shares/Units | Value | ||||||||||||
Common Stocks and Other Equity Interests (continued) | ||||||||||||||
Marine 1.3% | ||||||||||||||
A.P. Moeller-Maersk AS, B | Denmark | 6,595 | $ | 8,567,811 | ||||||||||
|
| |||||||||||||
Media 4.5% | ||||||||||||||
CBS Corp., B | United States | 91,632 | 4,988,446 | |||||||||||
| a | Charter Communications Inc., A | United States | 30,386 | 6,947,455 | ||||||||||
| a | DISH Network Corp., A | United States | 90,990 | 4,767,876 | ||||||||||
| a | Liberty Global PLC LiLAC, C | United Kingdom | 10,735 | 348,784 | ||||||||||
| a | Liberty Global PLC, C | United Kingdom | 86,040 | 2,465,046 | ||||||||||
Time Warner Inc. | United States | 66,132 | 4,863,347 | |||||||||||
Twenty-First Century Fox Inc., B | United States | 170,160 | 4,636,860 | |||||||||||
|
| |||||||||||||
| 29,017,814 | ||||||||||||||
|
| |||||||||||||
Metals & Mining 1.1% | ||||||||||||||
Freeport-McMoRan Inc., B | United States | 186,260 | 2,074,937 | |||||||||||
ThyssenKrupp AG | Germany | 242,203 | 4,841,686 | |||||||||||
|
| |||||||||||||
| 6,916,623 | ||||||||||||||
|
| |||||||||||||
Multiline Retail 0.3% | ||||||||||||||
Macy’s Inc. | United States | 58,280 | 1,958,791 | |||||||||||
|
| |||||||||||||
Oil, Gas & Consumable Fuels 7.0% | ||||||||||||||
Anadarko Petroleum Corp. | United States | 29,831 | 1,588,501 | |||||||||||
Apache Corp. | United States | 70,011 | 3,897,512 | |||||||||||
BP PLC | United Kingdom | 1,028,014 | 6,005,958 | |||||||||||
China Shenhua Energy Co. Ltd., H | China | 2,009,534 | 3,693,515 | |||||||||||
CONSOL Energy Inc. | United States | 219,381 | 3,529,840 | |||||||||||
Kinder Morgan Inc. | United States | 296,590 | 5,552,165 | |||||||||||
Marathon Oil Corp. | United States | 444,196 | 6,667,382 | |||||||||||
Royal Dutch Shell PLC, A (EUR Traded) | United Kingdom | 327,191 | 8,959,297 | |||||||||||
Royal Dutch Shell PLC, A (GBP Traded) | United Kingdom | 179,410 | 4,898,138 | |||||||||||
| a,b,c | Warrior Met Coal LLC, A | United States | 1,841 | 185,603 | ||||||||||
| a,b,c | Warrior Met Coal LLC, B | United States | 4,306 | 434,115 | ||||||||||
|
| |||||||||||||
| 45,412,026 | ||||||||||||||
|
| |||||||||||||
Paper & Forest Products 0.0%† | ||||||||||||||
| a | Verso Corp. | United States | 36,624 | 732 | ||||||||||
|
| |||||||||||||
Pharmaceuticals 7.8% | ||||||||||||||
Eli Lilly & Co. | United States | 133,748 | 10,532,655 | |||||||||||
GlaxoSmithKline PLC | United Kingdom | 262,323 | 5,612,244 | |||||||||||
Merck & Co. Inc. | United States | 316,208 | 18,216,743 | |||||||||||
Novartis AG, ADR | Switzerland | 129,601 | 10,693,378 | |||||||||||
Teva Pharmaceutical Industries Ltd., ADR | Israel | 100,252 | 5,035,658 | |||||||||||
|
| |||||||||||||
| 50,090,678 | ||||||||||||||
|
| |||||||||||||
Semiconductors & Semiconductor Equipment 0.2% | ||||||||||||||
SK Hynix Inc. | South Korea | 53,632 | 1,507,432 | |||||||||||
|
| |||||||||||||
Software 6.4% | ||||||||||||||
| a | Check Point Software Technologies Ltd. | Israel | 95,512 | 7,610,396 | ||||||||||
Microsoft Corp. | United States | 386,252 | 19,764,515 | |||||||||||
Open Text Corp. | Canada | 86,150 | 5,096,634 | |||||||||||
Symantec Corp. | United States | 425,161 | 8,732,807 | |||||||||||
|
| |||||||||||||
| 41,204,352 | ||||||||||||||
|
| |||||||||||||
| Semiannual Report | MGD-13 |
FRANKLIN TEMPLETON VARIABLE INSURANCE PRODUCTS TRUST
STATEMENT OF INVESTMENTS (UNAUDITED)
Franklin Mutual Global Discovery VIP Fund (continued)
| Country | Shares/Units | Value | ||||||||||||
Common Stocks and Other Equity Interests (continued) | ||||||||||||||
Specialty Retail 0.8% | ||||||||||||||
Kingfisher PLC | United Kingdom | 1,151,830 | $ | 4,953,117 | ||||||||||
|
| |||||||||||||
Technology Hardware, Storage & Peripherals 2.3% | ||||||||||||||
EMC Corp. | United States | 299,800 | 8,145,566 | |||||||||||
Hewlett Packard Enterprise Co. | United States | 190,760 | 3,485,185 | |||||||||||
HP Inc. | United States | 190,760 | 2,394,038 | |||||||||||
Lenovo Group Ltd. | China | 1,500,454 | 903,160 | |||||||||||
|
| |||||||||||||
| 14,927,949 | ||||||||||||||
|
| |||||||||||||
Tobacco 5.3% | ||||||||||||||
Altria Group Inc. | United States | 131,874 | 9,094,031 | |||||||||||
British American Tobacco PLC | United Kingdom | 188,332 | 12,161,833 | |||||||||||
Philip Morris International Inc. | United States | 41,509 | 4,222,296 | |||||||||||
Reynolds American Inc. | United States | 159,669 | 8,610,949 | |||||||||||
|
| |||||||||||||
| 34,089,109 | ||||||||||||||
|
| |||||||||||||
Wireless Telecommunication Services 1.7% | ||||||||||||||
Vodafone Group PLC | United Kingdom | 3,618,505 | 10,983,918 | |||||||||||
|
| |||||||||||||
Total Common Stocks and Other Equity Interests | 557,169,970 | |||||||||||||
|
| |||||||||||||
Preferred Stocks 1.7% | ||||||||||||||
Automobiles 0.8% | ||||||||||||||
| h | Volkswagen AG, 0.157%, pfd. | Germany | 40,296 | 4,843,885 | ||||||||||
|
| |||||||||||||
Diversified Financial Services 0.9% | ||||||||||||||
| a,b | Hightower Holding LLC, pfd., A, Series 2 | United States | 2,172,000 | 5,821,394 | ||||||||||
|
| |||||||||||||
Total Preferred Stocks (Cost $12,871,859) | 10,665,279 | |||||||||||||
|
| |||||||||||||
| Principal Amount* | ||||||||||||||
Corporate Bonds, Notes and Senior Floating Rate Interests 3.7% | ||||||||||||||
| e | Avaya Inc., senior note, 144A, 10.50%, 3/01/21 | United States | 1,270,000 | 285,750 | ||||||||||
| i,j | Belk Inc., Closing Date Term Loan, 5.75%, 12/12/22 | United States | 1,945,125 | 1,556,100 | ||||||||||
iHeartCommunications Inc., | ||||||||||||||
senior secured note, first lien, 9.00%, 12/15/19 | United States | 5,184,000 | 3,959,280 | |||||||||||
i,jTranche D Term Loan, 7.21%, 1/30/19 | United States | 6,889,154 | 5,063,528 | |||||||||||
i,jTranche E Term Loan, 7.96%, 7/30/19 | United States | 2,213,881 | 1,628,586 | |||||||||||
| e | Valeant Pharmaceuticals International, | |||||||||||||
senior bond, 144A, 6.75%, 8/15/21 | United States | 487,000 | 417,602 | |||||||||||
senior bond, 144A, 7.25%, 7/15/22 | United States | 241,000 | 207,911 | |||||||||||
senior note, 144A, 6.375%, 10/15/20 | United States | 2,995,000 | 2,590,675 | |||||||||||
| i,j,k | Veritas Software Corp., | |||||||||||||
Term B1, 6.625%, 6/15/23 | United States | 20,948 | EUR | 19,840 | ||||||||||
Term Loan B1, 6.625%, 1/27/23 | United States | 2,004,775 | 1,754,178 | |||||||||||
Term Loan B2, 8.625%, 1/27/23 | United States | 1,935,027 | 1,661,705 | |||||||||||
| e | Veritas U.S. Inc./Veritas Bermuda Ltd., senior note, 144A, 10.50%, 2/01/24 | United States | 2,419,000 | 2,068,245 | ||||||||||
| e | Western Digital Corp., senior note, 144A, 10.50%, 4/01/24 | United States | 2,318,000 | 2,486,055 | ||||||||||
|
| |||||||||||||
Total Corporate Bonds, Notes and Senior Floating Rate Interests (Cost $27,363,872) | 23,699,455 | |||||||||||||
|
| |||||||||||||
| MGD-14 | Semiannual Report |
FRANKLIN TEMPLETON VARIABLE INSURANCE PRODUCTS TRUST
STATEMENT OF INVESTMENTS (UNAUDITED)
Franklin Mutual Global Discovery VIP Fund (continued)
| Country | Principal Amount* | Value | ||||||||||||
Corporate Bonds, Notes and Senior Floating Rate Interests in Reorganization 0.8% | ||||||||||||||
| b,l | Broadband Ventures III LLC, secured promissory note, | United States | 595 | $ | — | |||||||||
| i,j,l | Caesars Entertainment Operating Co. Inc., Term B-7 Loans, | United States | 1,176,090 | 1,188,831 | ||||||||||
| i,j,l | Texas Competitive Electric Holdings Co. LLC, Term Loans, | United States | 5,912,264 | 1,983,074 | ||||||||||
| e,l | Texas Competitive Electric Holdings Co. LLC/Texas Competitive Electric Holdings Finance Inc., senior secured note, first lien, 144A, 11.50%, 10/01/20 | United States | 5,895,000 | 2,019,037 | ||||||||||
| e,l,m | Walter Energy Inc., second lien, 144A, PIK, 11.50%, 4/01/20 | United States | 801,340 | 280 | ||||||||||
|
| |||||||||||||
Total Corporate Bonds, Notes and Senior Floating Rate Interests in Reorganization (Cost $12,095,094) | 5,191,222 | |||||||||||||
|
| |||||||||||||
| Shares | ||||||||||||||
Companies in Liquidation 0.1% | ||||||||||||||
| a | Adelphia Recovery Trust | United States | 5,379,562 | 11,297 | ||||||||||
| a,f | Adelphia Recovery Trust, Arahova Contingent Value Vehicle, Contingent Distribution | United States | 386,774 | 3,868 | ||||||||||
| a,f,g | Century Communications Corp., Contingent Distribution | United States | 1,074,000 | — | ||||||||||
| a,b | FIM Coinvestor Holdings I, LLC | United States | 2,077,368 | — | ||||||||||
| a,n | Lehman Brothers Holdings Inc., Bankruptcy Claim | United States | 17,348,669 | 542,146 | ||||||||||
| a,g | NewPage Corp., Litigation Trust | United States | 4,854,000 | — | ||||||||||
| a,f,g | Tribune Media Litigation Trust, Contingent Distribution | United States | 56,925 | — | ||||||||||
|
| |||||||||||||
Total Companies in Liquidation (Cost $1,632,483) | 557,311 | |||||||||||||
|
| |||||||||||||
| Principal Amount* | ||||||||||||||
Municipal Bonds (Cost $2,115,492) 0.2% | ||||||||||||||
Puerto Rico Commonwealth GO, Refunding, Series A, | United States | 2,261,000 | 1,512,044 | |||||||||||
|
| |||||||||||||
Total Investments before Short Term Investments | 598,795,281 | |||||||||||||
|
| |||||||||||||
Short Term Investments 7.5% | ||||||||||||||
U.S. Government and Agency Securities 6.7% | ||||||||||||||
| o | FHLB, 7/01/16 | United States | 11,900,000 | 11,900,000 | ||||||||||
| o,p | U.S. Treasury Bill, 7/07/16 - 12/08/16 | United States | 31,000,000 | 30,982,921 | ||||||||||
|
| |||||||||||||
Total U.S. Government and Agency Securities (Cost $42,871,955) | 42,882,921 | |||||||||||||
|
| |||||||||||||
Total Investments before Money Market Funds and Repurchase Agreements (Cost $592,111,324) | 641,678,202 | |||||||||||||
|
| |||||||||||||
| Shares | ||||||||||||||
| q | Investments from Cash Collateral Received for Loaned Securities 0.8% | |||||||||||||
Money Market Funds (Cost $4,344,000) 0.7% | ||||||||||||||
| a,r | Institutional Fiduciary Trust Money Market Portfolio | United States | 4,344,000 | 4,344,000 | ||||||||||
|
| |||||||||||||
| Semiannual Report | MGD-15 |
FRANKLIN TEMPLETON VARIABLE INSURANCE PRODUCTS TRUST
STATEMENT OF INVESTMENTS (UNAUDITED)
Franklin Mutual Global Discovery VIP Fund (continued)
| Country | Principal Amount* | Value | ||||||||||||
Investments from Cash Collateral Received for Loaned Securities (continued) | ||||||||||||||
Repurchase Agreements (Cost $1,086,324) 0.1% | ||||||||||||||
| s | Joint Repurchase Agreement, 0.40%, 7/01/16 | United States | 1,086,324 | $ | 1,086,324 | |||||||||
BNP Paribas Securities Corp. | ||||||||||||||
Collateralized by oU.S. Treasury Bill, 10/27/16; U.S. Treasury Bond, 8.75% - 9.00%, 11/15/18 - 5/15/20; U.S. Treasury Note, 0.363% - 4.75%, 9/15/16 - 3/31/21; U.S. Treasury Note, Index Linked, 2.625%, 7/15/17; and U.S. Treasury Strips, 8/15/16 - 2/15/21 (valued at $1,108,051) | ||||||||||||||
|
| |||||||||||||
Total Investments from Cash Collateral Received for Loaned Securities (Cost $5,430,324) | 5,430,324 | |||||||||||||
|
| |||||||||||||
Total Investments (Cost $597,541,648) 100.3% | 647,108,526 | |||||||||||||
Securities Sold Short (0.6)% | (3,554,567 | ) | ||||||||||||
Other Assets, less Liabilities 0.3% | 1,866,113 | |||||||||||||
|
| |||||||||||||
Net Assets 100.0% | $ | 645,420,072 | ||||||||||||
|
| |||||||||||||
| Shares | ||||||||||||||
| t | Securities Sold Short (Proceeds $3,486,096) (0.6)% | |||||||||||||
Common Stocks (0.6)% | ||||||||||||||
Health Care Equipment & Supplies (0.6)% | ||||||||||||||
Abbott Laboratories | United States | 90,424 | $ | (3,554,567 | ) | |||||||||
|
| |||||||||||||
†Rounds to less than 0.1% of net assets.
*The principal amount is stated in U.S. dollars unless otherwise indicated.
aNon-income producing.
bSee Note 8 regarding restricted securities.
cAt June 30, 2016, pursuant to the Fund’s policies and the requirements of applicable securities law, the Fund is restricted from trading this security at period end.
dA portion or all of the security is on loan at June 30, 2016. See Note 1(h).
eSecurity was purchased pursuant to Rule 144A under the Securities Act of 1933 and may be sold in transactions exempt from registration only to qualified institutional buyers or in a public offering registered under the Securities Act of 1933. These securities have been deemed liquid under guidelines approved by the Trust’s Board of Trustees. At June 30, 2016, the aggregate value of these securities was $17,849,309, representing 2.8% of net assets.
fContingent distributions represent the right to receive additional distributions, if any, during the reorganization of the underlying company. Shares represent total underlying principal of debt securities.
gSecurity has been deemed illiquid because it may not be able to be sold within seven days. At June 30, 2016, the aggregate value of these securities was $-.
hVariable rate security. The rate shown represents the yield at period end.
iSee Note 1(i) regarding senior floating rate interests.
jThe coupon rate shown represents the rate at period end.
kSecurity purchased on a when-issued or delayed delivery basis. See Note 1(d).
lSee Note 7 regarding credit risk and defaulted securities.
mIncome may be received in additional securities and/or cash.
nBankruptcy claims represent the right to receive distributions, if any, during the liquidation of the underlying pool of assets. Shares represent amount of allowed unsecured claims.
oThe security is traded on a discount basis with no stated coupon rate.
pA portion or all of the security has been segregated as collateral for securities sold short and open forward contracts. At June 30, 2016, the aggregate value of these securities and/or cash pledged amounted to $5,374,722, representing 0.8% of net assets.
qSee Note 1(h) regarding securities on loan.
rSee Note 3(e) regarding investments in affiliated management investment companies.
sSee Note 1(c) regarding joint repurchase agreement.
tSee Note 1(g) regarding securities sold short.
| MGD-16 | Semiannual Report |
FRANKLIN TEMPLETON VARIABLE INSURANCE PRODUCTS TRUST
STATEMENT OF INVESTMENTS (UNAUDITED)
Franklin Mutual Global Discovery VIP Fund (continued)
At June 30, 2016 , the Fund had the following futures contracts outstanding. See Note 1(d).
| Futures Contracts | ||||||||||||||||||||||||
| Description | Type | Number of Contracts | Notional Value | Expiration Date | Unrealized Appreciation | Unrealized Depreciation | ||||||||||||||||||
| Currency Contracts | ||||||||||||||||||||||||
EUR/USD | Short | 207 | $ | 28,740,656 | 9/19/16 | $ | 802,876 | — | ||||||||||||||||
GBP/USD | Short | 219 | 18,133,200 | 9/19/16 | 1,725,498 | — | ||||||||||||||||||
|
|
|
| |||||||||||||||||||||
Total Futures Contracts |
| $ | 46,873,856 | $ | 2,528,374 | — | ||||||||||||||||||
|
|
|
| |||||||||||||||||||||
Net unrealized appreciation (depreciation) |
| $ | 2,528,374 | |||||||||||||||||||||
|
| |||||||||||||||||||||||
At June, 30, 2016 the Fund had the following forward exchange contracts outstanding. See Note 1(d).
| Forward Exchange Contracts | ||||||||||||||||||||||||||||
| Currency | Counterpartya | Type | Quantity | Contract Amount | Settlement Date | Unrealized Appreciation | Unrealized Depreciation | |||||||||||||||||||||
| OTC Forward Exchange Contracts | ||||||||||||||||||||||||||||
South Korean Won | BOFA | Buy | 203,895,016 | $ | 174,909 | 7/12/16 | $ | 2,402 | $ | (459 | ) | |||||||||||||||||
South Korean Won | BOFA | Sell | 2,460,910,507 | 2,141,843 | 7/12/16 | 7,390 | (64 | ) | ||||||||||||||||||||
South Korean Won | FBCO | Sell | 1,958,645,921 | 1,706,881 | 7/12/16 | 8,012 | — | |||||||||||||||||||||
South Korean Won | HSBC | Buy | 202,880,750 | 172,291 | 7/12/16 | 3,682 | — | |||||||||||||||||||||
South Korean Won | HSBC | Sell | 2,263,081,028 | 1,969,641 | 7/12/16 | 9,993 | (3,279 | ) | ||||||||||||||||||||
Canadian Dollar | HSBC | Buy | 83,520 | 64,125 | 7/19/16 | 519 | — | |||||||||||||||||||||
Canadian Dollar | HSBC | Sell | 170,991 | 130,596 | 7/19/16 | — | (1,750 | ) | ||||||||||||||||||||
Canadian Dollar | SSBT | Buy | 578,177 | 446,271 | 7/19/16 | 2,107 | (872 | ) | ||||||||||||||||||||
Canadian Dollar | SSBT | Sell | 5,350,408 | 4,176,476 | 7/19/16 | 35,506 | (221 | ) | ||||||||||||||||||||
British Pound | BOFA | Buy | 1,168,799 | 1,657,685 | 8/19/16 | — | (98,482 | ) | ||||||||||||||||||||
British Pound | BOFA | Sell | 87,210 | 116,861 | 8/19/16 | 622 | (101 | ) | ||||||||||||||||||||
British Pound | BONY | Sell | 52,452 | 70,658 | 8/19/16 | 686 | — | |||||||||||||||||||||
British Pound | FBCO | Sell | 25,065 | 33,872 | 8/19/16 | 434 | — | |||||||||||||||||||||
British Pound | HSBC | Sell | 149,357 | 199,942 | 8/19/16 | 881 | (184 | ) | ||||||||||||||||||||
British Pound | SSBT | Buy | 57,587 | 81,039 | 8/19/16 | — | (4,217 | ) | ||||||||||||||||||||
British Pound | SSBT | Sell | 15,088,998 | 21,954,930 | 8/19/16 | 1,826,109 | (230 | ) | ||||||||||||||||||||
Euro | BOFA | Buy | 1,239,103 | 1,380,666 | 8/19/16 | 6,260 | (9,036 | ) | ||||||||||||||||||||
Euro | BOFA | Sell | 17,838 | 20,208 | 8/19/16 | 372 | — | |||||||||||||||||||||
Euro | BONY | Buy | 1,354,681 | 1,510,659 | 8/19/16 | 5,025 | (9,271 | ) | ||||||||||||||||||||
Euro | FBCO | Buy | 1,885,685 | 2,096,660 | 8/19/16 | 10,708 | (10,476 | ) | ||||||||||||||||||||
Euro | HSBC | Buy | 1,332,250 | 1,484,817 | 8/19/16 | 6,289 | (9,636 | ) | ||||||||||||||||||||
Euro | SSBT | Buy | 1,500,925 | 1,673,164 | 8/19/16 | 7,238 | (11,366 | ) | ||||||||||||||||||||
Euro | SSBT | Sell | 42,127,397 | 48,151,109 | 8/19/16 | 1,305,204 | — | |||||||||||||||||||||
|
| |||||||||||||||||||||||||||
Total Forward Exchange Contracts |
| $ | 3,239,439 | $ | (159,644 | ) | ||||||||||||||||||||||
|
| |||||||||||||||||||||||||||
Net unrealized appreciation (depreciation) |
| $ | 3,079,795 | |||||||||||||||||||||||||
|
| |||||||||||||||||||||||||||
aMay be comprised of multiple contracts with the same counterparty, currency and settlement date.
See Abbreviations on page MGD-34.
| Semiannual Report | MGD-17 |
FRANKLIN TEMPLETON VARIABLE INSURANCE PRODUCTS TRUST
Financial Statements
Statement of Assets and Liabilities
June 30, 2016 (unaudited)
| Franklin Mutual Global Discovery VIP Fund | ||||
Assets: | ||||
Investments in securities: | ||||
Cost - Unaffiliated issuers | $ | 592,111,324 | ||
Cost - Non-controlled affiliates (Note 3e) | 4,344,000 | |||
Cost - Repurchase agreements | 1,086,324 | |||
|
| |||
Total cost of investments | $ | 597,541,648 | ||
|
| |||
Value - Unaffiliated issuers | $ | 641,678,202 | ||
Value - Non-controlled affiliates (Note 3e) | 4,344,000 | |||
Value - Repurchase agreements | 1,086,324 | |||
|
| |||
Total value of investments (includes securities loaned in the amount of $5,201,095) | 647,108,526 | |||
Cash | 382,648 | |||
Restricted cash (Note 1e) | 3,400,000 | |||
Foreign currency, at value (cost and $558,534) | 554,999 | |||
Receivables: | ||||
Investment securities sold | 3,144,833 | |||
Capital shares sold | 47,895 | |||
Dividends and interest | 2,591,334 | |||
European Union tax reclaims | 295,461 | |||
Due from brokers | 5,061,455 | |||
Variation margin | 330,769 | |||
Unrealized appreciation on OTC forward exchange contracts | 3,239,439 | |||
Other assets | 103,577 | |||
|
| |||
Total assets | 666,260,936 | |||
|
| |||
Liabilities: | ||||
Payables: | ||||
Investment securities purchased | 7,117,834 | |||
Capital shares redeemed | 229,641 | |||
Management fees | 496,718 | |||
Distribution fees | 277,424 | |||
Securities sold short, at value (proceeds $3,486,096) | 3,554,567 | |||
Payable upon return of securities loaned | 5,430,324 | |||
Due to brokers | 3,400,000 | |||
Unrealized depreciation on OTC forward exchange contracts | 159,644 | |||
Accrued expenses and other liabilities | 174,712 | |||
|
| |||
Total liabilities | 20,840,864 | |||
|
| |||
Net assets, at value | $ | 645,420,072 | ||
|
| |||
Net assets consist of: | ||||
Paid-in capital | $ | 507,790,976 | ||
Undistributed net investment income | 19,021,183 | |||
Net unrealized appreciation (depreciation) | 55,053,830 | |||
Accumulated net realized gain (loss) | 63,554,083 | |||
|
| |||
Net assets, at value | $ | 645,420,072 | ||
|
| |||
| MGD-18 | Semiannual Report | The accompanying notes are an integral part of these financial statements. |
FRANKLIN TEMPLETON VARIABLE INSURANCE PRODUCTS TRUST
FINANCIAL STATEMENTS
Statement of Assets and Liabilities (continued)
June 30, 2016 (unaudited)
| Franklin Mutual Global Discovery VIP Fund | ||||
| Class 1: | ||||
Net assets, at value | $ | 2,754,446 | ||
|
| |||
Shares outstanding | 139,328 | |||
|
| |||
Net asset value and maximum offering price per share | $ | 19.77 | ||
|
| |||
| Class 2: | ||||
Net assets, at value | $ | 597,644,787 | ||
|
| |||
Shares outstanding | 31,014,267 | |||
|
| |||
Net asset value and maximum offering price per share | $ | 19.27 | ||
|
| |||
| Class 4: | ||||
Net assets, at value | $ | 45,020,839 | ||
|
| |||
Shares outstanding | 2,303,695 | |||
|
| |||
Net asset value and maximum offering price per share | $ | 19.54 | ||
|
| |||
| The accompanying notes are an integral part of these financial statements. | Annual Report | MGD-19 |
FRANKLIN TEMPLETON VARIABLE INSURANCE PRODUCTS TRUST
FINANCIAL STATEMENTS
Statement of Operations
for the six months ended June 30, 2016 (unaudited)
| Franklin Mutual Global Discovery VIP Fund | ||||
Investment income: | ||||
Dividends (net of foreign taxes of $591,941) | $ | 11,213,920 | ||
Interest | 1,416,949 | |||
Income from securities loaned (net of fees and rebates) | 231,423 | |||
|
| |||
Total investment income | 12,862,292 | |||
|
| |||
Expenses: | ||||
Management fees (Note 3a) | 3,003,533 | |||
Distribution fees: (Note 3c) | ||||
Class 2 | 739,006 | |||
Class 4 | 79,762 | |||
Custodian fees (Note 4) | 14,338 | |||
Reports to shareholders | 73,761 | |||
Professional fees | 69,711 | |||
Trustees’ fees and expenses | 1,639 | |||
Dividends on securities sold short | 10,364 | |||
Other | 18,135 | |||
|
| |||
Total expenses | 4,010,249 | |||
Expense reductions (Note 4) | (588 | ) | ||
Expenses waived/paid by affiliates (Note 3e) | (6,619 | ) | ||
|
| |||
Net expenses | 4,003,042 | |||
|
| |||
Net investment income | 8,859,250 | |||
|
| |||
Realized and unrealized gains (losses): | ||||
Net realized gain (loss) from: | ||||
Investments | 17,460,328 | |||
Foreign currency transactions | (1,249,979 | ) | ||
Futures contracts | (430,004 | ) | ||
Securities sold short | (125,155 | ) | ||
|
| |||
Net realized gain (loss) | 15,655,190 | |||
|
| |||
Net change in unrealized appreciation (depreciation) on: | ||||
Investments | (33,204,832 | ) | ||
Translation of other assets and liabilities denominated in foreign currencies | 2,231,725 | |||
Futures contracts | 1,985,026 | |||
|
| |||
Net change in unrealized appreciation (depreciation) | (28,988,081 | ) | ||
|
| |||
Net realized and unrealized gain (loss) | (13,332,891 | ) | ||
|
| |||
Net increase (decrease) in net assets resulting from operations | $ | (4,473,641 | ) | |
|
| |||
| MGD-20 | Semiannual Report | The accompanying notes are an integral part of these financial statements. |
FRANKLIN TEMPLETON VARIABLE INSURANCE PRODUCTS TRUST
FINANCIAL STATEMENTS
Statements of Changes in Net Assets
| Franklin Mutual Global Discovery VIP Fund | ||||||||
| Six Months Ended June 30, 2016 (unaudited) | Year Ended December 31, 2015 | |||||||
Increase (decrease) in net assets: | ||||||||
Operations: | ||||||||
Net investment income | $ | 8,859,250 | $ | 10,694,516 | ||||
Net realized gain (loss) | 15,655,190 | 57,004,189 | ||||||
Net change in unrealized appreciation (depreciation) | (28,988,081 | ) | (93,151,143 | ) | ||||
|
| |||||||
Net increase (decrease) in net assets resulting from operations | (4,473,641 | ) | (25,452,438 | ) | ||||
|
| |||||||
Distributions to shareholders from: | ||||||||
Net investment income: | ||||||||
Class 1 | — | (79,470 | ) | |||||
Class 2 | — | (18,967,567 | ) | |||||
Class 4 | — | (1,406,194 | ) | |||||
Net realized gains: | ||||||||
Class 1 | — | (146,560 | ) | |||||
Class 2 | — | (38,175,344 | ) | |||||
Class 4 | — | (3,020,502 | ) | |||||
|
| |||||||
Total distributions to shareholders | — | (61,795,637 | ) | |||||
|
| |||||||
Capital share transactions: (Note 2) | ||||||||
Class 1 | 128,335 | 643,019 | ||||||
Class 2 | (27,582,757 | ) | 24,374,278 | |||||
Class 4 | (3,704,488 | ) | (4,702,254 | ) | ||||
|
| |||||||
Total capital share transactions | (31,158,910 | ) | 20,315,043 | |||||
|
| |||||||
Net increase (decrease) in net assets | (35,632,551 | ) | (66,933,032 | ) | ||||
Net assets: | ||||||||
Beginning of period | 681,052,623 | 747,985,655 | ||||||
|
| |||||||
End of period | $ | 645,420,072 | $ | 681,052,623 | ||||
|
| |||||||
Undistributed net investment income included in net assets: | ||||||||
End of period | $ | 19,021,183 | $ | 10,161,933 | ||||
|
| |||||||
| The accompanying notes are an integral part of these financial statements. | Semiannual Report | MGD-21 |
FRANKLIN TEMPLETON VARIABLE INSURANCE PRODUCTS TRUST
Notes to Financial Statements (unaudited)
Franklin Mutual Global Discovery VIP Fund
1. Organization and Significant Accounting Policies
Franklin Templeton Variable Insurance Products Trust (Trust) is registered under the Investment Company Act of 1940 (1940 Act) as an open-end management investment company, consisting of nineteen separate funds and applies the specialized accounting and reporting guidance in U.S. Generally Accepted Accounting Principles (U.S. GAAP). Franklin Mutual Global Discovery VIP Fund (Fund) is included in this report. The financial statements of the remaining funds in the Trust are presented separately. Shares of the Fund are generally sold only to insurance company separate accounts to fund the benefits of variable life insurance policies or variable annuity contracts. At June 30, 2016, 51.94% of the Fund’s shares were held through one insurance company. Investment activities of these insurance company separate accounts could have a material impact on the Fund. The Fund offers three classes of shares: Class 1, Class 2 and Class 4. Each class of shares differs by its distribution fees, voting rights on matters affecting a single class and its exchange privilege.
The following summarizes the Fund’s significant accounting policies.
a. Financial Instrument Valuation
The Fund’s investments in financial instruments are carried at fair value daily. Fair value is the price that would be received to sell an asset or paid to transfer a liability in an orderly transaction between market participants on the measurement date. The Fund calculates the net asset value (NAV) per share as of 4 p.m. Eastern time each day the New York Stock Exchange (NYSE) is open for trading. Under compliance policies and procedures approved by the Trust’s Board of Trustees (the Board), the Fund’s administrator has responsibility for oversight of valuation, including leading the cross-functional Valuation Committee (VC). The VC provides administration and oversight of the Fund’s valuation policies and procedures, which are approved annually by the Board. Among other things, these procedures allow the Fund to utilize independent pricing services, quotations from securities and financial instrument dealers, and other market sources to determine fair value.
Equity securities and derivative financial instruments (derivatives) listed on an exchange or on the NASDAQ National Market System are valued at the last quoted sale price or the official closing price of the day, respectively. Foreign equity securities are valued as of the close of trading on the foreign
stock exchange on which the security is primarily traded or as of 4 p.m. Eastern time whichever is earlier. The value is then converted into its U.S. dollar equivalent at the foreign exchange rate in effect at 4 p.m. Eastern time on the day that the value of the security is determined. Over-the-counter (OTC) securities are valued within the range of the most recent quoted bid and ask prices. Securities that trade in multiple markets or on multiple exchanges are valued according to the broadest and most representative market. Certain equity securities are valued based upon fundamental characteristics or relationships to similar securities.
Debt securities generally trade in the OTC market rather than on a securities exchange. The Fund’s pricing services use multiple valuation techniques to determine fair value. In instances where sufficient market activity exists, the pricing services may utilize a market-based approach through which quotes from market makers are used to determine fair value. In instances where sufficient market activity may not exist or is limited, the pricing services also utilize proprietary valuation models which may consider market characteristics such as benchmark yield curves, credit spreads, estimated default rates, anticipated market interest rate volatility, coupon rates, anticipated timing of principal repayments, underlying collateral, and other unique security features in order to estimate the relevant cash flows, which are then discounted to calculate the fair value. Securities denominated in a foreign currency are converted into their U.S. dollar equivalent at the foreign exchange rate in effect at 4 p.m. Eastern time on the date that the values of the foreign debt securities are determined.
Investments in open-end mutual funds are valued at the closing NAV. Repurchase agreements are valued at cost, which approximates fair value.
Certain derivatives trade in the OTC market. The Fund’s pricing services use various techniques including industry standard option pricing models and proprietary discounted cash flow models to determine the fair value of those instruments. The Fund’s net benefit or obligation under the derivative contract, as measured by the fair value of the contract, is included in net assets.
The Fund has procedures to determine the fair value of financial instruments for which market prices are not reliable or readily available. Under these procedures, the VC convenes on a regular basis to review such financial instruments and considers a
| MGD-22 | Semiannual Report |
FRANKLIN TEMPLETON VARIABLE INSURANCE PRODUCTS TRUST
NOTES TO FINANCIAL STATEMENTS (UNAUDITED)
Franklin Mutual Global Discovery VIP Fund (continued)
number of factors, including significant unobservable valuation inputs, when arriving at fair value. The VC primarily employs a market-based approach which may use related or comparable assets or liabilities, recent transactions, market multiples, book values, and other relevant information for the investment to determine the fair value of the investment. An income-based valuation approach may also be used in which the anticipated future cash flows of the investment are discounted to calculate fair value. Discounts may also be applied due to the nature or duration of any restrictions on the disposition of the investments. Due to the inherent uncertainty of valuations of such investments, the fair values may differ significantly from the values that would have been used had an active market existed. The VC employs various methods for calibrating these valuation approaches including a regular review of key inputs and assumptions, transactional back-testing or disposition analysis, and reviews of any related market activity.
Trading in securities on foreign securities stock exchanges and OTC markets may be completed before 4 p.m. Eastern time. In addition, trading in certain foreign markets may not take place on every NYSE business day. Occasionally, events occur between the time at which trading in a foreign security is completed and the close of the NYSE that might call into question the reliability of the value of a portfolio security held by the Fund. As a result, differences may arise between the value of the Fund’s portfolio securities as determined at the foreign market close and the latest indications of value at the close of the NYSE. In order to minimize the potential for these differences, the VC monitors price movements following the close of trading in foreign stock markets through a series of country specific market proxies (such as baskets of American Depositary Receipts, futures contracts and exchange traded funds). These price movements are measured against established trigger thresholds for each specific market proxy to assist in determining if an event has occurred that may call into question the reliability of the values of the foreign securities held by the Fund. If such an event occurs, the securities may be valued using fair value procedures, which may include the use of independent pricing services.
When the last day of the reporting period is a non-business day, certain foreign markets may be open on those days that the NYSE is closed, which could result in differences between the value of the Fund’s portfolio securities on the last business day and the last calendar day of the reporting period. Any significant security valuation changes due to an open foreign market are
adjusted and reflected by the Fund for financial reporting purposes.
b. Foreign Currency Translation
Portfolio securities and other assets and liabilities denominated in foreign currencies are translated into U.S. dollars based on the exchange rate of such currencies against U.S. dollars on the date of valuation. The Fund may enter into foreign currency exchange contracts to facilitate transactions denominated in a foreign currency. Purchases and sales of securities, income and expense items denominated in foreign currencies are translated into U.S. dollars at the exchange rate in effect on the transaction date. Portfolio securities and assets and liabilities denominated in foreign currencies contain risks that those currencies will decline in value relative to the U.S. dollar. Occasionally, events may impact the availability or reliability of foreign exchange rates used to convert the U.S. dollar equivalent value. If such an event occurs, the foreign exchange rate will be valued at fair value using procedures established and approved by the Board.
The Fund does not separately report the effect of changes in foreign exchange rates from changes in market prices on securities held. Such changes are included in net realized and unrealized gain or loss from investments in the Statement of Operations.
Realized foreign exchange gains or losses arise from sales of foreign currencies, currency gains or losses realized between the trade and settlement dates on securities transactions and the difference between the recorded amounts of dividends, interest, and foreign withholding taxes and the U.S. dollar equivalent of the amounts actually received or paid. Net unrealized foreign exchange gains and losses arise from changes in foreign exchange rates on foreign denominated assets and liabilities other than investments in securities held at the end of the reporting period.
c. Joint Repurchase Agreement
The Fund enters into a joint repurchase agreement whereby its uninvested cash balance is deposited into a joint cash account with other funds managed by the investment manager or an affiliate of the investment manager and is used to invest in one or more repurchase agreements. The value and face amount of the joint repurchase agreement are allocated to the funds based on their pro-rata interest. A repurchase agreement is accounted for as a loan by the Fund to the seller, collateralized by securities which are delivered to the Fund’s custodian. The fair
| Semiannual Report | MGD-23 |
FRANKLIN TEMPLETON VARIABLE INSURANCE PRODUCTS TRUST
NOTES TO FINANCIAL STATEMENTS (UNAUDITED)
Franklin Mutual Global Discovery VIP Fund (continued)
1. Organization and Significant Accounting Policies (continued)
c. Joint Repurchase Agreement (continued)
value, including accrued interest, of the initial collateralization is required to be at least 102% of the dollar amount invested by the funds, with the value of the underlying securities marked to market daily to maintain coverage of at least 100%. Repurchase agreements are subject to the terms of Master Repurchase Agreements (MRAs) with approved counterparties (sellers). The MRAs contain various provisions, including but not limited to events of default and maintenance of collateral for repurchase agreements. In the event of default by either the seller or the Fund, certain MRAs may permit the non-defaulting party to net and close-out all transactions, if any, traded under such agreements. The Fund may sell securities it holds as collateral and apply the proceeds towards the repurchase price and any other amounts owed by the seller to the Fund in the event of default by the seller. This could involve costs or delays in addition to a loss on the securities if their value falls below the repurchase price owed by the seller. The joint repurchase agreement held by the Fund at period end, as indicated in the Statement of Investments, had been entered into on June 30, 2016.
d. Securities Purchased on a When-Issued or Delayed Delivery Basis
The Fund purchases securities on a when-issued or delayed delivery basis, with payment and delivery scheduled for a future date. These transactions are subject to market fluctuations and are subject to the risk that the value at delivery may be more or less than the trade date purchase price. Although the Fund will generally purchase these securities with the intention of holding the securities, it may sell the securities before the settlement date. Sufficient assets have been segregated for these securities.
e. Derivative Financial Instruments
The Fund invested in derivatives in order to manage risk or gain exposure to various other investments or markets. Derivatives are financial contracts based on an underlying or notional amount, require no initial investment or an initial net investment that is smaller than would normally be required to have a similar response to changes in market factors, and require or permit net settlement. Derivatives contain various risks including the
potential inability of the counterparty to fulfill their obligations under the terms of the contract, the potential for an illiquid secondary market, and/or the potential for market movements
which expose the Fund to gains or losses in excess of the amounts shown in the Statement of Assets and Liabilities. Realized gain and loss and unrealized appreciation and depreciation on these contracts for the period are included in the Statement of Operations.
Derivative counterparty credit risk is managed through a formal evaluation of the creditworthiness of all potential counterparties. The Fund attempts to reduce its exposure to counterparty credit risk on OTC derivatives, whenever possible, by entering into International Swaps and Derivatives Association (ISDA) master agreements with certain counterparties. These agreements contain various provisions, including but not limited to collateral requirements, events of default, or early termination. Termination events applicable to the counterparty include certain deteriorations in the credit quality of the counterparty. Termination events applicable to the Fund include failure of the Fund to maintain certain net asset levels and/or limit the decline in net assets over various periods of time. In the event of default or early termination, the ISDA master agreement gives the non-defaulting party the right to net and close-out all transactions traded, whether or not arising under the ISDA agreement, to one net amount payable by one counterparty to the other. However, absent an event of default or early termination, OTC derivative assets and liabilities are presented gross and not offset in the Statement of Assets and Liabilities. Early termination by the counterparty may result in an immediate payment by the Fund of any net liability owed to that counterparty under the ISDA agreement. At June 30, 2016, the Fund had OTC derivatives in a net liability position for such contracts of $94,656.
Collateral requirements differ by type of derivative. Collateral or initial margin requirements are set by the broker or exchange clearing house for exchange traded and centrally cleared derivatives. Initial margin deposited is held at the exchange and can be in the form of cash and/or securities. For OTC derivatives traded under an ISDA master agreement, posting of collateral is required by either the Fund or the applicable counterparty if the total net exposure of all OTC derivatives with the applicable counterparty exceeds the minimum transfer amount, which typically ranges from $100,000 to $250,000, and can vary depending on the counterparty and the type of the agreement. Generally, collateral is determined at the close of Fund business each day and any additional collateral required due to changes in derivative values may be delivered by the Fund or the counterparty within a few business days. Collateral pledged
| MGD-24 | Semiannual Report |
FRANKLIN TEMPLETON VARIABLE INSURANCE PRODUCTS TRUST
NOTES TO FINANCIAL STATEMENTS (UNAUDITED)
Franklin Mutual Global Discovery VIP Fund (continued)
and/or received by the Fund for OTC derivatives, if any, is held in segregated accounts with the Fund’s custodian/counterparty broker and can be in the form of cash and/or securities. Unrestricted cash may be invested according to the Fund’s investment objectives. To the extent that the amounts due to the Fund from its counterparties are not subject to collateralization or are not fully collateralized, the Fund bears the risk of loss from counterparty non-performance.
The Fund entered into exchange traded futures contracts primarily to manage exposure to certain foreign currencies. A futures contract is an agreement between the Fund and a counterparty to buy or sell an asset for a specified price on a future date. Required initial margins are pledged by the Fund, and the daily change in fair value is accounted for as a variation margin payable or receivable in the Statement of Assets and Liabilities.
The Fund entered into OTC forward exchange contracts primarily to manage exposure to certain foreign currencies. A forward exchange contract is an agreement between the Fund and a counterparty to buy or sell a foreign currency at a specific exchange rate on a future date.
See Note 9 regarding other derivative information.
f. Restricted Cash
At June 30, 2016, the Fund held restricted cash in connection with investments in certain derivative securities. Restricted cash is held in a segregated account with the Fund’s custodian and is reflected in the Statement of Assets and Liabilities.
g. Securities Sold Short
The Fund is engaged in selling securities short, which obligates the Fund to replace a borrowed security with the same security at current fair value. The Fund incurs a loss if the price of the security increases between the date of the short sale and the date on which the Fund replaces the borrowed security. The Fund realizes a gain if the price of the security declines between those dates. Gains are limited to the price at which the Fund sold the security short, while losses are potentially unlimited in size.
The Fund is required to establish a margin account with the broker lending the security sold short. While the short sale is outstanding, the broker retains the proceeds of the short sale to the extent necessary to meet margin requirements until the short position is closed out. A deposit must also be maintained with the Fund’s custodian/counterparty broker consisting of cash
and/or securities having a value equal to a specified percentage of the value of the securities sold short. The Fund is obligated to pay fees for borrowing the securities sold short and is required to pay the counterparty any dividends and/or interest due on securities sold short. Such dividends and/or interest and any security borrowing fees are recorded as an expense to the Fund.
h. Securities Lending
The Fund participates in an agency based securities lending program to earn additional income. The Fund receives cash collateral against the loaned securities in an amount equal to at least 102% of the fair value of the loaned securities. Collateral is maintained over the life of the loan in an amount not less than 100% of the fair value of loaned securities, as determined at the close of Fund business each day; any additional collateral required due to changes in security values is delivered to the Fund on the next business day. The collateral is deposited into a joint cash account with other funds and is used to invest in a money market fund managed by Franklin Advisers, Inc., an affiliate of the Fund, and/or a joint repurchase agreement. The Fund may receive income from the investment of cash collateral, in addition to lending fees and rebates paid by the borrower. Income from securities loaned, net of fees paid to the securities lending agent and/or third-party vendor, is reported separately in the Statement of Operations. The Fund bears the market risk with respect to the collateral investment, securities loaned, and the risk that the agent may default on its obligations to the Fund. If the borrower defaults on its obligation to return the securities loaned, the Fund has the right to repurchase the securities in the open market using the collateral received. The securities lending agent has agreed to indemnify the Fund in the event of default by a third party borrower.
i. Senior Floating Rate Interests
The Fund invests in senior secured corporate loans that pay interest at rates which are periodically reset by reference to a base lending rate plus a spread. These base lending rates are generally the prime rate offered by a designated U.S. bank or the London InterBank Offered Rate (LIBOR). Senior secured corporate loans often require prepayment of principal from excess cash flows or at the discretion of the borrower. As a result, actual maturity may be substantially less than the stated maturity. Senior secured corporate loans in which the Fund invests are generally readily marketable, but may be subject to certain restrictions on resale.
| Semiannual Report | MGD-25 |
FRANKLIN TEMPLETON VARIABLE INSURANCE PRODUCTS TRUST
NOTES TO FINANCIAL STATEMENTS (UNAUDITED)
Franklin Mutual Global Discovery VIP Fund (continued)
1. Organization and Significant Accounting Policies (continued)
j. Income and Deferred Taxes
It is the Fund’s policy to qualify as a regulated investment company under the Internal Revenue Code. The Fund intends to distribute to shareholders substantially all of its taxable income and net realized gains to relieve it from federal income and if applicable, excise taxes. As a result, no provision for U.S. federal income taxes is required.
The Fund may be subject to foreign taxation related to income received, capital gains on the sale of securities and certain foreign currency transactions in the foreign jurisdictions in which it invests. Foreign taxes, if any, are recorded based on the tax regulations and rates that exist in the foreign markets in which the Fund invests. When a capital gain tax is determined to apply, the Fund records an estimated deferred tax liability in an amount that would be payable if the securities were disposed of on the valuation date. As a result of several court cases, in certain countries across the European Union, the Fund filed additional tax reclaims for previously withheld taxes on dividends earned in those countries (EU reclaims). These additional filings are subject to various administrative proceedings by the local jurisdictions’ tax authorities within the European Union, as well as a number of related judicial proceedings. Income recognized, if any, for EU reclaims is reflected as other income in the Statement of Operations and any related receivable, if any, is reflected as European Union tax reclaims in the Statement of Assets and Liabilities. When uncertainty exists as to the ultimate resolution of these proceedings, the likelihood of receipt of these EU reclaims, and the potential timing of payment, no amounts are reflected in the financial statements.
The Fund may recognize an income tax liability related to its uncertain tax positions under U.S. GAAP when the uncertain tax position has a less than 50% probability that it will be sustained upon examination by the tax authorities based on its technical merits. As of June 30, 2016, the Fund has determined that no tax liability is required in its financial statements related to uncertain tax positions for any open tax years (or expected to be taken in future tax years). Open tax years are those that
remain subject to examination and are based on each tax jurisdiction’s statute of limitation.
k. Security Transactions, Investment Income, Expenses and Distributions
Security transactions are accounted for on trade date. Realized gains and losses on security transactions are determined on a specific identification basis. Interest income and estimated expenses are accrued daily. Amortization of premium and accretion of discount on debt securities are included in interest income. Dividend income and dividends declared on securities sold short are recorded on the ex-dividend date except for certain dividends from foreign securities where the dividend rate is not available. In such cases, the dividend is recorded as soon as the information is received by the Fund. Distributions to shareholders are recorded on the ex-dividend date and are determined according to income tax regulations (tax basis). Distributable earnings determined on a tax basis may differ from earnings recorded in accordance with U.S. GAAP. These differences may be permanent or temporary. Permanent differences are reclassified among capital accounts to reflect their tax character. These reclassifications have no impact on net assets or the results of operations. Temporary differences are not reclassified, as they may reverse in subsequent periods.
Common expenses incurred by the Trust are allocated among the Funds based on the ratio of net assets of each Fund to the combined net assets of the Trust. Fund specific expenses are charged directly to the fund that incurred the expense.
Realized and unrealized gains and losses and net investment income, not including class specific expenses, are allocated daily to each class of shares based upon the relative proportion of net assets of each class. Differences in per share distributions, by class, are generally due to differences in class specific expenses.
l. Accounting Estimates
The preparation of financial statements in accordance with U.S. GAAP requires management to make estimates and assumptions that affect the reported amounts of assets and liabilities at the date of the financial statements and the amounts of income and expenses during the reporting period. Actual results could differ from those estimates.
| MGD-26 | Semiannual Report |
FRANKLIN TEMPLETON VARIABLE INSURANCE PRODUCTS TRUST
NOTES TO FINANCIAL STATEMENTS (UNAUDITED)
Franklin Mutual Global Discovery VIP Fund (continued)
m. Guarantees and Indemnifications
Under the Trust’s organizational documents, its officers and trustees are indemnified by the Trust against certain liabilities arising out of the performance of their duties to the Trust. Additionally, in the normal course of business, the Trust, on behalf of the Fund, enters into contracts with service providers
that contain general indemnification clauses. The Trust’s maximum exposure under these arrangements is unknown as this would involve future claims that may be made against the Trust that have not yet occurred. Currently, the Trust expects the risk of loss to be remote.
2. Shares of Beneficial Interest
At June 30, 2016, there were an unlimited number of shares authorized (without par value). Transactions in the Fund’s shares were as follows:
| Six Months Ended June 30, 2016 | Year Ended December 31, 2015 | |||||||||||||||||||
| Shares | Amount | Shares | Amount | |||||||||||||||||
| Class 1 Shares: | ||||||||||||||||||||
Shares sold | 13,955 | $ | 266,819 | 29,371 | $ | 659,819 | ||||||||||||||
Shares issued in reinvestment of distributions | — | — | 11,573 | 226,030 | ||||||||||||||||
Shares redeemed | (7,227 | ) | (138,484 | ) | (10,639 | ) | (242,830 | ) | ||||||||||||
|
| |||||||||||||||||||
Net increase (decrease) | 6,728 | $ | 128,335 | 30,305 | $ | 643,019 | ||||||||||||||
|
| |||||||||||||||||||
| Class 2 Shares: | ||||||||||||||||||||
Shares sold | 754,545 | $ | 14,161,497 | 2,941,446 | $ | 64,431,215 | ||||||||||||||
Shares issued in reinvestment of distributions | — | — | 2,996,482 | 57,142,910 | ||||||||||||||||
Shares redeemed | (2,228,840 | ) | (41,744,254 | ) | (4,457,652 | ) | (97,199,847 | ) | ||||||||||||
|
| |||||||||||||||||||
Net increase (decrease) | (1,474,295 | ) | $ | (27,582,757 | ) | 1,480,276 | $ | 24,374,278 | ||||||||||||
|
| |||||||||||||||||||
| Class 4 Shares: | ||||||||||||||||||||
Shares sold | 79,340 | $ | 1,477,095 | 121,580 | $ | 2,592,251 | ||||||||||||||
Shares issued in reinvestment of distributions | — | — | 228,652 | 4,426,697 | ||||||||||||||||
Shares redeemed | (271,273 | ) | (5,181,583 | ) | (532,685 | ) | (11,721,202 | ) | ||||||||||||
|
| |||||||||||||||||||
Net increase (decrease) | (191,933 | ) | $ | (3,704,488 | ) | (182,453 | ) | $ | (4,702,254 | ) | ||||||||||
|
| |||||||||||||||||||
3. Transactions With Affiliates
Franklin Resources, Inc. is the holding company for various subsidiaries that together are referred to as Franklin Templeton Investments. Certain officers and trustees of the Fund are also officers and/or directors of the following subsidiaries:
| Subsidiary | Affiliation | |
Franklin Mutual Advisers, LLC (Franklin Mutual) | Investment manager | |
Franklin Templeton Services, LLC (FT Services) | Administrative manager | |
Franklin Templeton Distributors, Inc. (Distributors) | Principal underwriter | |
Franklin Templeton Investor Services, LLC (Investor Services) | Transfer agent |
| Semiannual Report | MGD-27 |
FRANKLIN TEMPLETON VARIABLE INSURANCE PRODUCTS TRUST
NOTES TO FINANCIAL STATEMENTS (UNAUDITED)
Franklin Mutual Global Discovery VIP Fund (continued)
3. Transactions With Affiliates (continued)
a. Management Fees
The Fund pays an investment management fee to Franklin Mutual based on the average daily net assets of the Fund as follows:
| Annualized Fee Rate | Net Assets | |
0.950% | Up to and including $200 million | |
0.935% | Over $200 million, up to and including $700 million | |
0.900% | Over $700 million, up to and including $1.2 billion | |
0.875% | Over $1.2 billion, up to and including $4 billion | |
0.845% | Over $4 billion, up to and including $7 billion | |
0.825% | Over $7 billion, up to and including $10 billion | |
0.805% | In excess of $10 billion |
For the period ended June 30, 2016, the annualized effective investment management fee rate was 0.940% of the Fund’s average daily net assets.
b. Administrative Fees
Under an agreement with Franklin Mutual, FT Services provides administrative services to the Fund. The fee is paid by Franklin Mutual based on the Fund’s average daily net assets, and is not an additional expense of the Fund.
c. Distribution Fees
The Board has adopted a distribution plans for Class 2 and Class 4 shares pursuant to Rule 12b-1 under the 1940 Act. Under the Fund’s compensation distribution plans, the Fund pays Distributors for costs incurred in connection with the servicing, sale and distribution of the Fund’s shares up to 0.35% per year of its average daily net assets of each class. The Board has agreed to limit the current rate to 0.25% per year for Class 2. The plan year, for purposes of monitoring compliance with the maximum annual plan rates, is February 1 through January 31.
d. Transfer Agent Fees
Investor Services, under terms of an agreement, performs shareholder servicing for the Fund and is not paid by the Fund for the services.
e. Investments in Affiliated Management Investment Companies
The Fund invests in one or more affiliated management investment companies for purposes other than exercising a controlling influence over the management or policies. Management fees paid by the Fund are waived on assets invested in the affiliated management investment companies, as noted in the Statement of Operations, in an amount not to exceed the management and administrative fees paid directly or indirectly by each affiliate.
| Number of Shares Held at Beginning of Period | Gross Additions | Gross Reductions | Number of Shares Held at End of Period | Value at End of Period | Investment Income | Realized Gain (Loss) | % of Affiliated Fund Shares Outstanding Held at End of Period | |||||||||||||||||||||||||
| Non-Controlled Affiliates | ||||||||||||||||||||||||||||||||
Institutional Fiduciary Trust Money Market Portfolio | — | 74,008,000 | (69,664,000 | ) | 4,344,000 | $ | 4,344,000 | $ | — | $ | — | —%a | ||||||||||||||||||||
|
| |||||||||||||||||||||||||||||||
a Amount rounds to less than 0.1%.
| MGD-28 | Semiannual Report |
FRANKLIN TEMPLETON VARIABLE INSURANCE PRODUCTS TRUST
NOTES TO FINANCIAL STATEMENTS (UNAUDITED)
Franklin Mutual Global Discovery VIP Fund (continued)
4. Expense Offset Arrangement
The Fund has entered into an arrangement with its custodian whereby credits realized as a result of uninvested cash balances are used to reduce a portion of the Fund’s custodian expenses. During the period ended June 30, 2016, the custodian fees were reduced as noted in the Statement of Operations.
5. Income Taxes
At June 30, 2016, the cost of investments and net unrealized appreciation (depreciation) for income tax purposes were as follows:
Cost of investments | $ | 597,705,934 | ||
|
| |||
Unrealized appreciation | $ | 127,653,884 | ||
Unrealized depreciation | (78,251,292 | ) | ||
|
| |||
Net unrealized appreciation (depreciation) | $ | 49,402,592 | ||
|
|
Differences between income and/or capital gains as determined on a book basis and a tax basis are primarily due to differing treatments of foreign currency transactions.
6. Investment Transactions
Purchases and sales of investments (excluding short term securities and securities sold short) for the period ended June 30, 2016, aggregated $53,520,394 and $96,425,420, respectively.
At June 30, 2016, in connection with securities lending transactions, the Fund loaned equity investments and received $5,430,324 of cash collateral. The gross amount of recognized liability for such transactions is included in payable upon return of securities loaned in the Statement of Assets and Liabilities. The agreements can be terminated at any time.
7. Credit Risk And Defaulted Securities
The Fund may purchase the pre-default or defaulted debt of distressed companies. Distressed companies are financially troubled and are about to be or are already involved in financial restructuring or bankruptcy. Risks associated with purchasing these securities include the possibility that the bankruptcy or other restructuring process takes longer than expected, or that distributions in restructuring are less than anticipated, either or both of which may result in unfavorable consequences to the Fund. If it becomes probable that the income on debt securities, including those of distressed companies, will not be collected, the Fund discontinues accruing income and recognizes an adjustment for uncollectible interest.
At June 30, 2016, the aggregate long value of distressed company securities for which interest recognition has been discontinued was $5,191,222, representing 0.8% of the Fund’s net assets. For information as to specific securities, see the accompanying Statement of Investments.
8. Restricted Securities
The Fund invests in securities that are restricted under the Securities Act of 1933 (1933 Act) or which are subject to legal, contractual, or other agreed upon restrictions on resale. Restricted securities are often purchased in private placement transactions, and cannot be sold without prior registration unless the sale is pursuant to an exemption under the 1933 Act. Disposal of these securities may require greater effort and expense, and prompt sale at an acceptable price may be difficult. The Fund may have registration rights for restricted securities. The issuer generally incurs all registration costs.
| Semiannual Report | MGD-29 |
FRANKLIN TEMPLETON VARIABLE INSURANCE PRODUCTS TRUST
NOTES TO FINANCIAL STATEMENTS (UNAUDITED)
Franklin Mutual Global Discovery VIP Fund (continued)
8. Restricted Securities (continued)
At June 30, 2016, the Fund held investments in restricted securities, excluding certain securities exempt from registration under the 1933 Act deemed to be liquid, as follows:
| Principal Amount/ Shares/ Units | Issuer | Acquisition Date | Cost | Value | ||||||||||
| 595 | Broadband Ventures III LLC, secured promissory note, 5.00%, 2/01/12 | 7/01/10 - 11/30/12 | $ | 595 | $ | — | ||||||||
| 2,077,368 | FIM Coinvestor Holdings I, LLC | 11/20/06 - 6/02/09 | — | — | ||||||||||
| 2,172,000 | Hightower Holding LLC, pfd., A, Series 2 | 6/10/10 - 5/10/12 | 5,430,000 | 5,821,394 | ||||||||||
| 424,073 | International Automotive Components Group Brazil LLC | 4/13/06 - 12/26/08 | 281,629 | 6,981 | ||||||||||
| 4,052,916 | International Automotive Components Group North America LLC | 1/12/06 - 3/18/13 | 3,247,714 | 1,788,009 | ||||||||||
| 1,841 | Warrior Met Coal LLC, A | 9/19/14 - 12/04/14 | 2,420,000 | 185,603 | ||||||||||
| 4,306 | Warrior Met Coal LLC, B | 03/31/16 - 06/23/16 | 344,500 | 434,115 | ||||||||||
|
| |||||||||||||
Total Restricted Securities (Value is 1.3% of Net Assets) | $ | 11,724,438 | $ | 8,236,102 | ||||||||||
|
| |||||||||||||
9. Other Derivative Information
At June 30, 2016, the Fund’s investments in derivative contracts are reflected in the Statement of Assets and Liabilities as follows:
Asset Derivatives | Liability Derivatives | |||||||||||
Derivative Contracts as Hedging Instruments | Statement of Assets and Liabilities Location | Fair Value | Statement of Assets and Liabilities Location | Fair Value | ||||||||
Foreign exchange contracts | Variation margin | 2,528,374 | a | Variation margin | — | |||||||
Unrealized appreciation on OTC forward exchange contracts | 3,239,439 | Unrealized depreciation on | 159,644 | |||||||||
|
|
|
| |||||||||
Totals | $ | 5,767,813 | $ | 159,644 | ||||||||
|
|
|
| |||||||||
aThis amount reflects the cumulative appreciation (depreciation) of futures contracts as reported in the Statement of Investments. Only the variation margin receivable/payable at year end is separately reported within the Statement of Assets and Liabilities. Prior variation margin movements were recorded to cash upon receipt or payment.
For the period ended June 30, 2016, the effect of derivative contracts in the Fund’s Statement of Operations was as follows:
| Derivative Contracts Not Accounted for as Hedging Instruments | Statement of Operations Locations | Net Realized Gain (Loss) for the Period | Statement of Operations Locations | Net Change in Unrealized Appreciation (Depreciation) for the Period | ||||||||
Net realized gain (loss) from: | Net change in unrealized appreciation (depreciation) on: | |||||||||||
Foreign exchange contracts | Foreign currency transactions | (1,201,867 | )a | Translation of other assets and liabilities denominated in foreign currencies | 2,253,295 | a | ||||||
Futures contracts | (430,004 | ) | Futures contracts | 1,985,026 | ||||||||
|
|
|
| |||||||||
Totals | $ | (1,631,871 | ) | $ | 4,238,321 | |||||||
|
|
|
| |||||||||
aForward exchange contracts are included in net realized gain (loss) from foreign currency transactions and net change in unrealized appreciation (depreciation) on translation of other assets and liabilities denominated in foreign currencies in the Statement of Operations.
| MGD-30 | Semiannual Report |
FRANKLIN TEMPLETON VARIABLE INSURANCE PRODUCTS TRUST
NOTES TO FINANCIAL STATEMENTS (UNAUDITED)
Franklin Mutual Global Discovery VIP Fund (continued)
For the period ended June, 30 2016, the average month end fair value of derivatives represented 0.5% of average month end net assets. The average month end number of open derivative contracts for the period was 51.
See Note 1(d) regarding derivative financial instruments.
10. Credit Facility
The Fund, together with other U.S. registered and foreign investment funds (collectively, Borrowers), managed by Franklin Templeton Investments, are borrowers in a joint syndicated senior unsecured credit facility totaling $2 billion (Global Credit Facility) which matures on February 10, 2017. This Global Credit Facility provides a source of funds to the Borrowers for temporary and emergency purposes, including the ability to meet future unanticipated or unusually large redemption requests.
Under the terms of the Global Credit Facility, the Fund shall, in addition to interest charged on any borrowings made by the Fund and other costs incurred by the Fund, pay its share of fees and expenses incurred in connection with the implementation and maintenance of the Global Credit Facility, based upon its relative share of the aggregate net assets of all of the Borrowers, including an annual commitment fee of 0.07% based upon the unused portion of the Global Credit Facility. Effective February 12, 2016, the annual commitment fee is 0.15%. These fees are reflected in other expenses in the Statement of Operations. During the period ended June 30, 2016, the Fund did not use the Global Credit Facility.
11. Fair Value Measurements
The Fund follows a fair value hierarchy that distinguishes between market data obtained from independent sources (observable inputs) and the Fund’s own market assumptions (unobservable inputs). These inputs are used in determining the value of the Fund’s financial instruments and are summarized in the following fair value hierarchy:
| • | Level 1 – quoted prices in active markets for identical financial instruments |
| • | Level 2 – other significant observable inputs (including quoted prices for similar financial instruments, interest rates, prepayment speed, credit risk, etc.) |
| • | Level 3 – significant unobservable inputs (including the Fund’s own assumptions in determining the fair value of financial instruments) |
The input levels are not necessarily an indication of the risk or liquidity associated with financial instruments at that level.
For movements between the levels within the fair value hierarchy, the Fund has adopted a policy of recognizing the transfers as of the date of the underlying event which caused the movement.
| Semiannual Report | MGD-31 |
FRANKLIN TEMPLETON VARIABLE INSURANCE PRODUCTS TRUST
NOTES TO FINANCIAL STATEMENTS (UNAUDITED)
Franklin Mutual Global Discovery VIP Fund (continued)
11. Fair Value Measurements (continued)
A summary of inputs used as of June 30, 2016, in valuing the Fund’s assets and liabilities carried at fair value, is as follows:
| Level 1 | Level 2 | Level 3 | Total | |||||||||||||
| Assets: | ||||||||||||||||
Investments in Securities: | ||||||||||||||||
Equity Investments:a | ||||||||||||||||
Auto Components | $ | 2,913,028 | $ | — | $ | 1,794,990 | $ | 4,708,018 | ||||||||
Banks | 79,769,543 | 7,773,754 | — | 87,543,297 | ||||||||||||
Diversified Financial Services | 2,516,854 | — | 5,821,394 | 8,338,248 | ||||||||||||
Oil, Gas & Consumable Fuels | 44,792,308 | — | 619,718 | 45,412,026 | ||||||||||||
All Other Equity Investmentsb | 421,833,660 | — | — | c | 421,833,660 | |||||||||||
Corporate Bonds, Notes and Senior Floating Rate Interests | — | 23,699,455 | — | 23,699,455 | ||||||||||||
Corporate Notes and Senior Floating Rate Interests in Reorganization | — | 5,191,222 | — | c | 5,191,222 | |||||||||||
Companies in Liquidation | 11,297 | 546,014 | — | c | 557,311 | |||||||||||
Municipal Bonds | — | 1,512,044 | — | 1,512,044 | ||||||||||||
Short Term Investments | 35,326,921 | 12,986,324 | — | 48,313,245 | ||||||||||||
|
| |||||||||||||||
Total Investments in Securities | $ | 587,163,611 | $ | 51,708,813 | $ | 8,236,102 | $ | 647,108,526 | ||||||||
|
| |||||||||||||||
Other Financial Instruments: | ||||||||||||||||
Futures Contracts | $ | 2,528,374 | $ | — | $ | — | $ | 2,528,375 | ||||||||
Forward Exchange Contracts | — | 3,239,439 | — | 3,239,439 | ||||||||||||
|
| |||||||||||||||
Total Other Financial Instruments | $ | 2,528,374 | $ | 3,239,439 | $ | — | $ | 5,767,814 | ||||||||
|
| |||||||||||||||
| Liabilities: | ||||||||||||||||
Other Financial Instruments: | ||||||||||||||||
Securities Sold Short | $ | 3,554,567 | $ | — | $ | — | $ | 3,554,567 | ||||||||
Forward Exchange Contracts | — | 159,644 | — | 159,644 | ||||||||||||
|
| |||||||||||||||
Total Other Financial Instruments | $ | 3,554,567 | $ | 159,644 | $ | — | $ | 3,714,211 | ||||||||
|
| |||||||||||||||
aIncludes common and preferred stocks as well as other equity investments.
bFor detailed categories, see the accompanying Statement of Investments.
cIncludes securities determined to have no value at June 30, 2016.
| MGD-32 | Semiannual Report |
FRANKLIN TEMPLETON VARIABLE INSURANCE PRODUCTS TRUST
NOTES TO FINANCIAL STATEMENTS (UNAUDITED)
Franklin Mutual Global Discovery VIP Fund (continued)
A reconciliation of assets in which Level 3 inputs are used in determining fair value is presented when there are significant Level 3 financial instruments at the end of the period. At June 30, 2016, the reconciliation of assets is as follows:
| Balance at Beginning of Period | Purchases | Sales | Transfers Into Level 3a | Transfers Out of Level 3b | Cost Basis Adjustments | Net Realized Gain (Loss) | Net Unrealized | Balance at End of Period | Net Change in Held at Period End | |||||||||||||||||||||||||||||||
| Assets | ||||||||||||||||||||||||||||||||||||||||
Investments in Securities: | ||||||||||||||||||||||||||||||||||||||||
Equity Investments:c | ||||||||||||||||||||||||||||||||||||||||
Auto Components | $ | 2,192,388 | $ | — | $ | — | $ | — | $ | — | $ | — | $ | — | $ | (397,398 | ) | $ | 1,794,990 | $ | (397,398 | ) | ||||||||||||||||||
Diversified Financial Services | 5,157,849 | — | — | — | — | — | — | 663,545 | 5,821,394 | 663,545 | ||||||||||||||||||||||||||||||
Oil, Gas & Consumable Fuels | — | 344,500 | — | 221,058 | — | — | — | 54,160 | 619,718 | 54,160 | ||||||||||||||||||||||||||||||
Corporate Bonds and Notes in Reorganization | 2,053 | d | — | — | — | (280 | ) | — | — | (1,773 | ) | — | d | — | ||||||||||||||||||||||||||
|
| |||||||||||||||||||||||||||||||||||||||
| Total Investments in Securities | $ | 7,352,290 | $ | 344,500 | $ | — | $ | 221,058 | $ | (280 | ) | $ | — | $ | — | $ | 318,534 | $ | 8,236,102 | $ | 320,307 | |||||||||||||||||||
|
| |||||||||||||||||||||||||||||||||||||||
aThe investments were transferred into Level 3 as result of the unavailability of other significant observable valuation inputs. May include amounts related to a corporate action.
bThe investments were transferred out of Level 3 as a result of the availability of other significant observable valuation inputs.
cIncludes common and preferred stocks as well as other equity investments.
dIncludes securities determined to have no value.
Significant unobservable valuation inputs developed by the VC for material Level 3 financial instruments and impact to fair value as a result of changes in unobservable valuation inputs as of June 30, 2016, are as follows:
| Description | Fair Value at End of Year | Valuation Technique | Unobservable Input | Amount/ Range | Impact to Fair Value if Input Increasesa | |||||||||||
| Assets: | ||||||||||||||||
Investments in Securities | ||||||||||||||||
Equity Investments:b | ||||||||||||||||
Auto Components | $ | 1,788,009 | Market comparables | Discount for lack of marketability Average EV / EBITDA multiple |
| 10% 3.2x |
|
| Decrease Increase | c d | ||||||
Diversified Financial Services | 5,821,394 | Discounted Cash Flow Model | Cost of Equity Long-term revenue growth rate Adjusted EBITDA margin | | 17% 6.2% - 24.3% | |
| Decrease Increase Increase | d d d | |||||||
All Other Investmentse | 626,699 | |||||||||||||||
Total | $ | 8,236,102 | ||||||||||||||
aRepresents the directional change in the fair value of the Level 3 financial instruments that would result from a significant and reasonable increase in the corresponding input. A significant and reasonable decrease in input would have the opposite effect. Significant impacts, if any, to fair value and/or net assets have been indicated.
bIncludes common and preferred stocks.
cRepresents a significant impact to fair value but not net assets.
dRepresents a significant impact to fair value and net assets.
eIncludes fair value of immaterial financial instruments developed using various valuation techniques and unobservable inputs. May also include financial instruments with values derived using prior transaction prices or third party pricing information without adjustment for which such inputs are also unobservable.
| Semiannual Report | MGD-33 |
FRANKLIN TEMPLETON VARIABLE INSURANCE PRODUCTS TRUST
NOTES TO FINANCIAL STATEMENTS (UNAUDITED)
Franklin Mutual Global Discovery VIP Fund (continued)
11. Fair Value Measurements (continued)
Abbreviations List
| EBITDA | Earnings before interest, taxes, depreciation and amortization | |
| EV | Enterprise value | |
12. Subsequent Events
The Fund has evaluated subsequent events through the issuance of the financial statements and determined that no events have occurred that require disclosure.
Abbreviations
| Counterparty | Currency | Selected Portfolio | ||||||||
| BOFA | Bank of America N.A. | EUR | Euro | ADR | American Depositary Receipt | |||||
| BONY | Bank of New York Mellon | GBP | British Pound | FHLB | Federal Home Loan Bank | |||||
| FBCO | Credit Suisse Group AG | USD | United States Dollar | GO | General Obligation | |||||
| HSBC | HSBC Bank USA, N.A. | PIK | Payment-In-Kind | |||||||
| SSBT | State Street Bank and Trust Co. | |||||||||
| MGD-34 | Semiannual Report |
Franklin Mutual Shares VIP Fund
We are pleased to bring you Franklin Mutual Shares VIP Fund’s semiannual report for the period ended June 30, 2016.
Class 4 Performance Summary as of June 30, 2016
The Fund’s Class 4 shares delivered a +4.35% total return* for the six-month period ended June 30, 2016.
*The Fund has a fee waiver associated with any investment in a Franklin Templeton money fund and/or Franklin Templeton fund, as applicable, contractually guaranteed through at least the Fund’s current fiscal year-end. Fund investment results reflect the fee waiver, to the extent applicable; without this reduction, the results would have been lower.
Performance reflects the Fund’s Class 4 operating expenses, but does not include any contract fees, expenses or sales charges. If they had been included, performance would be lower. These charges and deductions, particularly for variable life policies, can have a significant effect on contract values and insurance benefits. See the contract prospectus for a complete description of these expenses, including sales charges.
Performance data represent past performance, which does not guarantee future results. Investment return and principal value will fluctuate, and you may have a gain or loss when you sell your shares. Current performance may differ from figures shown.
| Semiannual Report | MS-1 |
FRANKLIN MUTUAL SHARES VIP FUND
Fund Goals and Main Investments
The Fund seeks capital appreciation, with income as a secondary goal, by investing primarily in equity securities of companies the Fund’s managers believe are at prices below their intrinsic value. The Fund may invest up to 35% of its assets in foreign securities.
Fund Risks
All investments involve risks, including possible loss of principal. Value securities may not increase in price as anticipated or may decline further in value. The Fund’s investments in foreign securities involve special risks including currency fluctuations, and economic and political uncertainties. The Fund may also invest in companies engaged in mergers, reorganizations or liquidations, which involve special risks as pending deals may not be completed on time or on favorable terms, as well as lower rated bonds, which entail higher credit risk. The Fund is actively managed but there is no guarantee that the manager’s investment decisions will produce the desired results. The Fund’s prospectus also includes a description of the main investment risks.
Performance Overview
You can find the Fund’s six-month total return in the Performance Summary. In comparison, the Fund’s benchmark, the Standard & Poor’s® 500 Index, generated a +3.84% total return for the period under review.1
Economic and Market Overview
The global economy expanded during the six months under review. An improvement in commodity prices including a rally in crude oil prices, accommodative monetary policy from various global central banks, finalization of the new debt deal for Greece and encouraging Chinese trade data toward period-end boosted market sentiment. However, global equity market volatility increased after the U.S. Federal Reserve’s (Fed’s) June decision to keep its federal funds target range unchanged, while providing a cautious stance on further interest rate hikes. In addition, global economic concerns and the U.K.’s historic referendum to leave the European Union (EU), also known as the “Brexit,” contributed to volatile global stock markets.
Oil prices fell at the beginning of the review period, largely due to a strong global supply, but recovered in the period’s second half amid oilfield outages and continued demand growth. Meanwhile, commodity prices increased for most of the review period as oversupply for a host of commodities shrank and the market appeared to be on the path of rebalancing after hitting a glut-induced bottom earlier in the year. Gold prices continued to rise following the Brexit referendum as some investors turned to safe haven investing. The U.S. dollar generally depreciated against most currencies during the period, which increased returns of many foreign assets in U.S. dollar terms. In this environment, global developed market stocks overall, as measured by the MSCI World Index, rose slightly during the period.2
The U.S. economy grew moderately, as measured by gross domestic product (GDP) in 2016’s first and second quarters, driven by consumer spending and exports. A decline in private inventory investment and non-residential fixed investment contributed to the moderation. The Fed maintained its target interest rate during the review period after raising it for the first time in nine years at its December 2015 meeting. The Fed kept its target rate unchanged in its June meeting mainly due to a substantial slowdown in job additions toward period-end. The Fed expects economic conditions to evolve in a manner that could warrant only gradual increases in the federal funds rate.
In Europe, slower U.K. economic growth continued in 2016’s first quarter as output slowed in construction, production and agriculture. Immediate effects of the Brexit materialized as U.K. stocks significantly declined and the pound sterling hit a three-decade low amid intensified selling. Credit rating agencies Standard & Poor’s and Fitch also downgraded the U.K.’s credit rating. In the eurozone, despite investors’ concerns about banking sector weakness, low corporate earnings and post-Brexit political repercussions, some regions benefited due to rising consumer spending resulting from a cheaper euro, low inflation and signs of sustained economic growth. The eurozone’s annual inflation rate remained in negative territory for most of the review period; however, it rose marginally above zero in June.
Japan’s economy posted mixed results, contracting in 2015’s fourth quarter stemming from declining private and household consumption. However, the economy expanded during 2016’s
1. Source: Morningstar. One cannot invest directly in an index, and an index is not representative of the Fund’s portfolio. Please see Index Descriptions following the Fund Summaries.
2. Please see Index Descriptions following the Fund Summaries.
| MS-2 | Semiannual Report |
FRANKLIN MUTUAL SHARES VIP FUND
first quarter as private consumption increased and business investment decreased less than anticipated. The Bank of Japan (BOJ) took several actions during the review period. In January, to boost lending and support inflation, the BOJ introduced a negative interest rate on excess reserves held at the central bank by financial institutions. In April, the BOJ further reduced its GDP and inflation forecasts for fiscal year 2016, and decided against additional quantitative easing measures. However, after the U.K.’s vote in June to leave the EU, the BOJ hinted at carrying out flexible open market operations to stabilize its financial markets.
In emerging markets, economic growth generally moderated during the review period. Brazil’s economy witnessed its longest recession since the 1930s amid political and economic turmoil, while Russia’s economy continued to contract. The Bank of Russia reduced its key interest rate in an attempt to revive its economy. China’s economic growth slowed marginally in 2016’s first quarter compared to the previous quarter, but remained largely in line with the government’s target. The People’s Bank of China cut its cash reserve requirement ratio for the country’s banks and effectively devalued the renminbi against the U.S. dollar to the lowest level in more than five years. Overall, emerging market stocks, as measured by the MSCI Emerging Markets Index, rose for the six-month period under review.2
Investment Strategy
At Franklin Mutual Series, we are committed to our distinctive value approach to investing. Our major investment strategy is investing in undervalued stocks. When selecting undervalued equities, we are attracted to what we believe are fundamentally strong companies with healthy balance sheets, high-quality assets, substantial free cash flow and shareholder-oriented management teams and whose stocks are trading at discounts to our assessment of the companies’ intrinsic or business value. We also look for asset-rich companies whose shares may be trading at depressed levels due to concerns over short-term earnings disappointments, litigation, management strategy or other perceived negatives. While the vast majority of our undervalued equity investments are made in publicly traded companies globally, we may invest occasionally in privately held companies as well.
We complement this more traditional investment strategy with two others. One is distressed investing, which is complex and can take many forms. The most common distressed investment the Fund undertakes is the purchase of financially troubled or
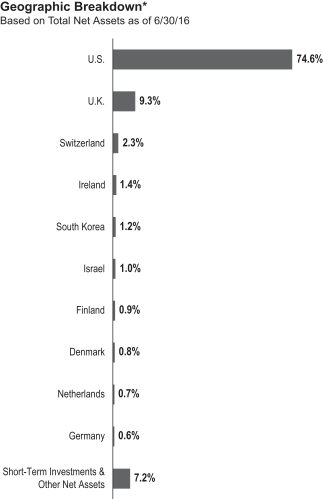
*Figures are stated as a percentage of total and may not equal 100% or may be negative due to rounding, use of any derivatives, unsettled trades or other factors.
bankrupt companies’ debt at a substantial discount to face value. After the financially distressed company is reorganized, often in bankruptcy court, the old debt is typically replaced with new securities issued by the financially stronger company.
The other piece of our investment strategy is participating in arbitrage situations, another highly specialized field. When companies announce proposed mergers or takeovers, commonly referred to as “deals,” the target company may trade at a discount to the bid it ultimately accepts. One form of arbitrage involves purchasing the target company’s stock when it is trading below the value we believe it would receive in a deal. In keeping with our commitment to a relatively conservative investment approach, we typically focus our arbitrage efforts on announced deals, and eschew rumored deals or other situations we consider relatively risky.
| Semiannual Report | MS-3 |
FRANKLIN MUTUAL SHARES VIP FUND
In addition, it is our practice to hedge the Fund’s currency exposure when we deem it advantageous for our shareholders.
What is meant by “hedge”?
To hedge an investment is to take a position intended to offset potential losses/gains that may be incurred by a companion financial instrument.
Manager’s Discussion
Economic and political uncertainty influenced markets during the six months under review. The year 2016 began with severe economic uncertainty. Brent oil prices plunged below US$30 per barrel as fears of a global recession spread. Global equity markets dropped from the start of the year, continuing a downward move from mid-2015 highs, before bottoming in mid-February. Commodity and equity prices rose over the following four months, before a late June surprise: the Brexit, ending a 43-year relationship with the rest of the EU. Uncertainty about the future status of the U.K. as well as implications for the EU and the global economy weighed on markets at the end of the period.
Equity prices are typically forward looking, reflecting investors’ beliefs about how various factors and events will play out in the future. Global equity prices at period-end were down from mid-2015 highs, reflecting increased uncertainty among investors regarding the consequences of the Brexit in addition to long-standing concerns about China, commodity prices, interest rates and geopolitical events.
Following the momentous decision by U.K. voters on June 23 to leave the EU, we believe it is probable that the U.K. will face a heightened risk of an economic slowdown, as businesses will likely put investment decisions on hold while waiting for greater clarity. The negative impact on the rest of the EU will likely be less severe, although economic growth in the region was already running at a modest pace before the vote, and we do not believe the region will be immune. Among the region’s equity markets, we believe that financial and domestically oriented cyclical stocks were being perceived by some investors as more vulnerable. Those stocks that were viewed as defensive, as well as stocks with what we consider attractive dividend yields, will likely remain in favor among many investors, in our view, causing them to trade at even higher valuation multiples. Within the U.K., large multinational companies that generate most of their earnings abroad should benefit from the precipitous fall of the British pound that followed the Brexit vote. In this respect, the Fund’s exposure to U.K. equities was
| Top 10 Sectors/Industries | ||||
| Based on Equity Securities | ||||
| 6/30/16 | ||||
% of Total Net Assets | ||||
| Insurance | 10.2% | |||
| Banks | 8.9% | |||
| Pharmaceuticals | 8.1% | |||
| Oil, Gas & Consumable Fuels | 6.6% | |||
| Media | 6.4% | |||
| Software | 6.4% | |||
| Tobacco | 6.3% | |||
| Health Care Equipment & Supplies | 5.6% | |||
| Food & Staples Retailing | 3.9% | |||
| Technology Hardware, Storage & Peripherals | 3.4% | |||
predominantly through a number of these global companies. Also, the Fund has only a modest exposure to European financials, particularly in banks.
Although the Brexit vote is clearly a negative surprise, we do not believe it will usher in a new global financial crisis similar to the one experienced eight years ago. While markets reacted brutally to the U.K.’s decision to leave the EU, we have not seen any systemic shock like the one that followed the fall of Lehman Brothers in 2008. We also believe that, eventually, the U.K. and the EU will come to an acceptable agreement concerning trade relations.
Three of the Fund’s larger positions at period-end were in health care.3 Merck, Medtronic and Switzerland-based Novartis are global companies that meet important customer needs with products protected by intellectual property. This focus on innovation that improves the lives of customers gives us confidence in the sustainability of their businesses. In addition, we feel that each has strong financial characteristics, including the ability to invest in research and development and acquisitions, while also providing material returns to shareholders, and trading at valuations that are attractive from our perspective as value investors.
The Fund also featured three information technology firms among its larger positions: Microsoft, Symantec and Samsung Electronics.4 Microsoft features a strong global business based on innovation and meeting customer needs, including its fast-growing cloud business, while also returning excess capital to shareholders through dividends and share buybacks. Symantec
3. The health care sector comprises health care equipment and supplies, health care providers and services, and pharmaceuticals in the SOI.
4. The information technology sector comprises communications equipment; Internet software and services; IT services; software; and technology hardware, storage and peripherals in the SOI.
| MS-4 | Semiannual Report |
FRANKLIN MUTUAL SHARES VIP FUND
also competes through innovation in providing security software to individuals and enterprises. Following a restructuring of its activities, the company is now focused on the fast-growing market for web-related security, while also returning capital to shareholders. South Korea-based Samsung Electronics, another meaningful position of the Fund in this sector, competes in more capital intensive commodity markets such as memory semiconductors and smartphones. In these areas, we believe that Samsung has advantages of scale and expertise relative to many of its competitors. In our view, these firms, like the health care firms mentioned previously, share these positive attributes as well as valuations that we, as value investors, find compelling.
Merger and acquisition (M&A) activity continued to be strong in the first half of 2016, helping to support valuations. Although deal volumes remained near historical highs, regulators globally continued to be more aggressive in their scrutiny of potentially negative effects of high concentration. We were disappointed to see regulators successfully sue to block the merger of Office Depot and Staples. Less surprising was the collapse of Halliburton’s attempt to acquire Baker Hughes (a Fund holding) on antitrust grounds, or the largest failure, Pfizer’s withdrawn attempt to acquire Allergan in the face of the U.S. Treasury Department’s new rules on tax inversions. We continue to be active in this space and work to ensure the potential rewards are big enough to outweigh the clear risks that exist in the current environment.
Credit spreads widened dramatically across industries and geographies during the period under review. This was particularly apparent in subinvestment-grade credit, which created additional challenges for sectors, including energy, metals and mining that were already experiencing distress. The precipitous decline in commodity prices globally over the past two years resulted in heightened bankruptcy activity. Dislocations in debt capital markets created some unique opportunities, in our view, especially in stressed and event-driven credit situations where we feel that the yield reached attractive levels and that cheap enterprise valuation protected the downside. By the end of the period, credit spreads had tightened materially from their intra-period highs. Although the current environment seems less attractive to us than a few months ago, volatility remained at heightened levels. In our experience, we believe that patience will be rewarded and the increase in global risk premiums will result in more opportunities.
Turning to Fund performance, top contributors included British American Tobacco, medical technology company Stryker and White Mountains Insurance Group.
Shares of U.K.-based British American Tobacco rose as many equity market investors showed a preference for defensive stocks (perceived to be less sensitive to economic conditions and/or having an attractive dividend yield, such as consumer staples) amid tepid global economic conditions, the low interest-rate environment and the late June U.K. referendum result in favor of leaving the EU. In our view, British American Tobacco remains an attractive position given the current management team, its portfolio of brands and track record of returning capital to shareholders.
U.S.-based medical technology company Stryker announced solid quarterly results in January and May that reflected strong organic growth, market share gains in many of its business segments and operating margin leverage that drove earnings growth. Along with the earnings results in May, Stryker raised its sales and earnings guidance for 2016. Beyond earnings, Stryker announced two strategic acquisitions in February. In our view, the deals were priced at full valuation but involved good-quality assets that offer Stryker the potential to enhance the value of existing assets and drive further value for Stryker shareholders.
White Mountains Insurance Group is a U.S.-based company that invests capital primarily in companies associated with the insurance and reinsurance industry. The insurer’s stock price rallied in February due in part to solid quarterly results and the authorization of a significant stock buyback program near the end of February.
During the period under review, Fund investments that detracted from performance included pharmaceutical services provider Teva Pharmaceutical Industries, global insurer American International Group (AIG) and bank holding company Barclays.
Shares of Israel-based Teva Pharmaceutical Industries followed the broad-based retreat in global financial markets in January and early February. The stock slid further in March after the company announced a delay in the closing of its acquisition of Allergan’s generics unit. Teva has been working to obtain approval from the U.S. Federal Trade Commission, including multiple asset sales agreements in June, in an effort to close the deal in July 2016. In our view, a delay of three to four months will delay the potential realization of synergies but not have a meaningful impact on the expected medium-term value of the deal. Heightened concerns around generic price deflation were also a significant drag on the stock price despite Teva’s management stating that the company did not experience the sharp price declines affecting some competitors.
| Semiannual Report | MS-5 |
FRANKLIN MUTUAL SHARES VIP FUND
Shares of U.S.-based insurer AIG declined as investors were frustrated by the January announcement of a US$3.6 billion reserve shortfall and uncertainty regarding the company’s ability to hit its financial targets. Management is under pressure from activist investors, most notably Carl Icahn, to show rapid improvement or spin off non-core assets to simplify the company. The stock also participated in the global equity market sell-off in late June as investors reacted negatively to the U.K. referendum result in favor of leaving the EU.
Shares of U.K.-based bank Barclays dropped sharply in late June after the U.K. Brexit vote. Investors feared the decision could lead to an increase in bad loans and reduced investment banking revenues if the U.K. economy slips into recession. Barclays’ stock had already significantly declined in January and early February as Europe’s financial sector was hindered by the detrimental effects of low interest rates, ongoing concerns about the health of the global economy, and challenging conditions in capital markets. In addition, the bank’s share price was negatively impacted by a disappointing strategic update in early March that included limited downsizing of the investment banking unit and a dividend cut to fund an accelerated rundown of its non-core activities.
During the period, the Fund held currency forwards and futures to somewhat hedge the currency risk of the portfolio’s non-U.S. dollar investments. The currency forwards had a positive impact on the Fund’s performance, and currency futures had a negligible impact.
What is a currency forward?
A currency forward is an agreement between the Fund and a counterparty to buy or sell a foreign currency in exchange for another currency at a specific exchange rate on a future date.
What is a future?
A future is an agreement between the Fund and a counterparty made through a U.S. or foreign futures exchange to buy or sell an underlying instrument or asset at a specific price on a future date.
| Top 10 Equity Holdings | ||||
| 6/30/16 | ||||
| Company Sector/Industry, Country | % of Total Net Assets | |||
| Medtronic PLC Health Care Equipment & Supplies, U.S. | 3.4% | |||
| Microsoft Corp. Software, U.S. | 3.4% | |||
| Merck & Co. Inc. Pharmaceuticals, U.S. | 3.3% | |||
| Eli Lilly & Co. Pharmaceuticals, U.S. | 2.1% | |||
| White Mountains Insurance Group Ltd. Insurance, U.S. | 2.0% | |||
| PNC Financial Services Group Inc. Banks, U.S. | 1.9% | |||
| British American Tobacco PLC Tobacco, U.K. | 1.9% | |||
| Royal Dutch Shell PLC Oil, Gas & Consumable Fuels, U.K. | 1.9% | |||
| American International Group Inc. Insurance, U.S. | 1.8% | |||
| Symantec Corp. Software, U.S. | 1.7% | |||
The dollar value, number of shares or principal amount, and names of all portfolio holdings are listed in the Fund’s Statement of Investments (SOI).
Thank you for your participation in Franklin Mutual Shares VIP Fund. We look forward to serving your future investment needs.
The foregoing information reflects our analysis, opinions and portfolio holdings as of June 30, 2016, the end of the reporting period. The way we implement our main investment strategies and the resulting portfolio holdings may change depending on factors such as market and economic conditions. These opinions may not be relied upon as investment advice or an offer for a particular security. The information is not a complete analysis of every aspect of any market, country, industry, security or the Fund. Statements of fact are from sources considered reliable, but the investment manager makes no representation or warranty as to their completeness or accuracy. Although historical performance is no guarantee of future results, these insights may help you understand our investment management philosophy.
| MS-6 | Semiannual Report |
FRANKLIN MUTUAL SHARES VIP FUND
Class 4 Fund Expenses
As an investor in a variable insurance contract (Contract) that indirectly provides for investment in an underlying mutual fund, you can incur transaction and/or ongoing expenses at both the Fund level and the Contract level.
| • | Transaction expenses can include sales charges (loads) on purchases, surrender fees, transfer fees and premium taxes. |
| • | Ongoing expenses can include management fees, distribution and service (12b-1) fees, contract fees, annual maintenance fees, mortality and expense risk fees and other fees and expenses. All mutual funds and Contracts have some types of ongoing expenses. |
The expenses shown in the table are meant to highlight ongoing expenses at the Fund level only and do not include ongoing expenses at the Contract level, or transaction expenses at either the Fund or Contract levels. While the Fund does not have transaction expenses, if the transaction and ongoing expenses at the Contract level were included, the expenses shown below would be higher. You should consult your Contract prospectus or disclosure document for more information.
The table shows Fund-level ongoing expenses and can help you understand these expenses and compare them with those of other mutual funds offered through the Contract. The table assumes a $1,000 investment held for the six months indicated. Please refer to the Fund prospectus for additional information on operating expenses.
Actual Fund Expenses
The first line (Actual) of the table provides actual account values and expenses. The “Ending Account Value” is derived from the Fund’s actual return, which includes the effect of ongoing Fund expenses, but does not include the effect of ongoing Contract expenses.
You can estimate the Fund-level expenses you incurred during the period by following these steps. Of course, your account value and expenses will differ from those in this illustration:
| 1. | Divide your account value by $1,000. |
If an account had an $8,600 value, then $8,600 ÷ $1,000 = 8.6.
| 2. | Multiply the result by the number under the heading “Fund-Level Expenses Incurred During Period.” |
If Fund-Level Expenses Incurred During Period were $7.50, then 8.6 × $7.50 = $64.50.
In this illustration, the estimated expenses incurred this period at the Fund level are $64.50.
Hypothetical Example for Comparison with Other Mutual Funds
Information in the second line (Hypothetical) of the table can help you compare ongoing expenses of the Fund with those of other mutual funds offered through the Contract. This information may not be used to estimate the actual ending account balance or expenses you incurred during the period. The hypothetical “Ending Account Value” is based on the Fund’s actual expense ratio and an assumed 5% annual rate of return before expenses, which does not represent the Fund’s actual return. The figure under the heading “Fund-Level Expenses Incurred During Period” shows the hypothetical expenses your account would have incurred under this scenario. You can compare this figure with the 5% hypothetical examples that appear in shareholder reports of other funds offered through a Contract.
| Class 4 | Beginning Account Value 1/1/16 | Ending Account Value 6/30/16 | Fund-Level Expenses 1/1/16–6/30/16 | |||||||||
Actual | $ | 1,000 | $ | 1,043.50 | $ | 5.39 | ||||||
Hypothetical (5% return before expenses) | $ | 1,000 | $ | 1,019.59 | $ | 5.32 | ||||||
*Expenses are calculated using the most recent six-month annualized expense ratio, net expense waivers, for the Fund’s Class 4 shares (1.06%), which does not include any ongoing expenses of the Contract for which the Fund is an investment option, multiplied by the average account value over the period, multiplied by 182/366 to reflect the one-half year period.
| Semiannual Report | MS-7 |
FRANKLIN TEMPLETON VARIABLE INSURANCE PRODUCTS TRUST
Financial Highlights
Franklin Mutual Shares VIP Fund
Six Months Ended (unaudited) | Year Ended December 31, | |||||||||||||||||||||||
| 2015 | 2014 | 2013 | 2012 | 2011 | ||||||||||||||||||||
| Class 1 | ||||||||||||||||||||||||
| Per share operating performance (for a share outstanding throughout the period) | ||||||||||||||||||||||||
Net asset value, beginning of period | $19.48 | $22.91 | $21.92 | $17.45 | $15.57 | $16.14 | ||||||||||||||||||
|
| |||||||||||||||||||||||
| Income from investment operationsa: | ||||||||||||||||||||||||
Net investment incomeb | 0.31 | c | 0.44 | 0.62 | d | 0.42 | 0.35 | 0.38 | e | |||||||||||||||
Net realized and unrealized gains (losses) | 0.57 | (1.54 | ) | 1.01 | 4.52 | 1.92 | (0.53 | ) | ||||||||||||||||
|
| |||||||||||||||||||||||
Total from investment operations | 0.88 | (1.10 | ) | 1.63 | 4.94 | 2.27 | (0.15 | ) | ||||||||||||||||
|
| |||||||||||||||||||||||
| Less distributions from: | ||||||||||||||||||||||||
Net investment income | — | (0.77 | ) | (0.52 | ) | (0.47 | ) | (0.39 | ) | (0.42 | ) | |||||||||||||
Net realized gains | — | (1.56 | ) | (0.12 | ) | — | — | — | ||||||||||||||||
|
| |||||||||||||||||||||||
Total distributions | — | (2.33 | ) | (0.64 | ) | (0.47 | ) | (0.39 | ) | (0.42 | ) | |||||||||||||
|
| |||||||||||||||||||||||
Net asset value, end of period | $20.36 | $19.48 | $22.91 | $21.92 | $17.45 | $15.57 | ||||||||||||||||||
|
| |||||||||||||||||||||||
Total returnf | 4.52% | (4.69)% | 7.38% | 28.53% | 14.61% | (0.79)% | ||||||||||||||||||
| Ratios to average net assetsg | ||||||||||||||||||||||||
Expensesh | 0.71% | i,j | 0.73% | i,j | 0.73% | i | 0.71% | i | 0.71% | 0.73% | i | |||||||||||||
Expenses incurred in connection with securities sold short | —% | k | 0.02% | 0.03% | —% | k | —% | k | —% | k | ||||||||||||||
Net investment income | 3.29% | c | 2.00% | 2.83% | d | 2.08% | 2.06% | 2.28% | e | |||||||||||||||
| Supplemental data | ||||||||||||||||||||||||
Net assets, end of period (000’s) | $573,679 | $643,438 | $656,463 | $552,163 | $449,343 | $1,170,781 | ||||||||||||||||||
Portfolio turnover rate | 13.90% | 19.88% | 21.33% | 24.05% | 34.07% | l | 41.02% | |||||||||||||||||
aThe amount shown for a share outstanding throughout the period may not correlate with the Statement of Operations for the period due to the timing of sales and repurchases of the Fund’s shares in relation to income earned and/or fluctuating fair value of the investments of the Fund.
bBased on average daily shares outstanding.
cNet investment income per share includes approximately $0.06 per share related to income received in the form of special dividends in connection with certain Fund holdings. Excluding this amount, the ratio of net investment income to average net assets would have been 2.69%.
dNet investment income per share includes approximately $0.23 per share related to income received in the form of special dividends in connection with certain Fund holdings. Excluding this amount, the ratio of net investment income to average net assets would have been 1.79%.
eNet investment income per share includes approximately $0.02 per share related to income received that had previously been deemed uncollectible. Excluding this amount, the ratio of net investment income to average net assets would have been 2.14%.
fTotal return does not include fees, charges or expenses imposed by the variable annuity and life insurance contracts for which Franklin Templeton Variable Insurance Products Trust serves as an underlying investment vehicle. Total return is not annualized for periods less than one year.
gRatios are annualized for periods less than one year.
hIncludes dividend and/or interest expense on securities sold short and security borrowing fees, if any. See below for the ratios of such expenses to average net assets for the periods presented. See Note 1(f).
iBenefit of expense reduction rounds to less than 0.01%.
jBenefit of waiver and payments by affiliates rounds to less than 0.01%.
kRounds to less than 0.01%.
lExcludes the value of portfolio securities delivered as a result of a redemption in-kind.
| MS-8 | Semiannual Report | The accompanying notes are an integral part of these financial statements. |
FRANKLIN TEMPLETON VARIABLE INSURANCE PRODUCTS TRUST
FINANCIAL HIGHLIGHTS
Franklin Mutual Shares VIP Fund (continued)
Six Months Ended (unaudited) | Year Ended December 31, | |||||||||||||||||||||||
| 2015 | 2014 | 2013 | 2012 | 2011 | ||||||||||||||||||||
| Class 2 | ||||||||||||||||||||||||
| Per share operating performance (for a share outstanding throughout the period) | ||||||||||||||||||||||||
Net asset value, beginning of period | $19.20 | $22.60 | $21.63 | $17.23 | $15.38 | $15.95 | ||||||||||||||||||
|
| |||||||||||||||||||||||
| Income from investment operationsa: | ||||||||||||||||||||||||
Net investment incomeb | 0.29 | c | 0.38 | 0.58 | d | 0.36 | 0.30 | 0.32 | e | |||||||||||||||
Net realized and unrealized gains (losses) | 0.55 | (1.51 | ) | 0.97 | 4.46 | 1.90 | (0.51 | ) | ||||||||||||||||
|
| |||||||||||||||||||||||
Total from investment operations | 0.84 | (1.13 | ) | 1.55 | 4.82 | 2.20 | (0.19 | ) | ||||||||||||||||
|
| |||||||||||||||||||||||
| Less distributions from: | ||||||||||||||||||||||||
Net investment income | — | (0.71 | ) | (0.46 | ) | (0.42 | ) | (0.35 | ) | (0.38 | ) | |||||||||||||
Net realized gains | — | (1.56 | ) | (0.12 | ) | — | — | — | ||||||||||||||||
|
| |||||||||||||||||||||||
Total distributions | — | (2.27 | ) | (0.58 | ) | (0.42 | ) | (0.35 | ) | (0.38 | ) | |||||||||||||
|
| |||||||||||||||||||||||
Net asset value, end of period | $20.04 | $19.20 | $22.60 | $21.63 | $17.23 | $15.38 | ||||||||||||||||||
|
| |||||||||||||||||||||||
Total returnf | 4.37% | (4.94)% | 7.12% | 28.26% | 14.24% | (1.04)% | ||||||||||||||||||
| Ratios to average net assetsg | ||||||||||||||||||||||||
Expensesh | 0.96% | i,j | 0.98% | i,j | 0.98% | i | 0.96% | i | 0.96% | 0.98% | i | |||||||||||||
Expenses incurred in connection with securities sold short | —% | k | 0.02% | 0.03% | —% | k | —% | k | —% | k | ||||||||||||||
Net investment income | 3.04% | c | 1.75% | 2.58% | d | 1.83% | 1.81% | 2.03% | e | |||||||||||||||
| Supplemental data | ||||||||||||||||||||||||
Net assets, end of period (000’s) | $3,497,123 | $3,353,505 | $4,218,342 | $4,558,547 | $4,069,803 | $3,913,220 | ||||||||||||||||||
Portfolio turnover rate | 13.90% | 19.88% | 21.33% | 24.05% | 34.07% | l | 41.02% | |||||||||||||||||
aThe amount shown for a share outstanding throughout the period may not correlate with the Statement of Operations for the period due to the timing of sales and repurchases of the Fund’s shares in relation to income earned and/or fluctuating fair value of the investments of the Fund.
bBased on average daily shares outstanding.
cNet investment income per share includes approximately $0.06 per share related to income received in the form of special dividends in connection with certain Fund holdings. Excluding this amount, the ratio of net investment income to average net assets would have been 2.44%.
dNet investment income per share includes approximately $0.23 per share related to income received in the form of special dividends in connection with certain Fund holdings. Excluding this amount, the ratio of net investment income to average net assets would have been 1.54%.
eNet investment income per share includes approximately $0.02 per share related to income received that had previously been deemed uncollectible. Excluding this amount, the ratio of net investment income to average net assets would have been 1.89%.
fTotal return does not include fees, charges or expenses imposed by the variable annuity and life insurance contracts for which Franklin Templeton Variable Insurance Products Trust serves as an underlying investment vehicle. Total return is not annualized for periods less than one year.
gRatios are annualized for periods less than one year.
hIncludes dividend and/or interest expense on securities sold short and security borrowing fees, if any. See below for the ratios of such expenses to average net assets for the periods presented. See Note 1(f).
iBenefit of expense reduction rounds to less than 0.01%.
jBenefit of waiver and payments by affiliates rounds to less than 0.01%.
kRounds to less than 0.01%.
lExcludes the value of portfolio securities delivered as a result of a redemption in-kind.
| The accompanying notes are an integral part of these financial statements. | Semiannual Report | MS-9 |
FRANKLIN TEMPLETON VARIABLE INSURANCE PRODUCTS TRUST
FINANCIAL HIGHLIGHTS
Franklin Mutual Shares VIP Fund (continued)
Six Months Ended (unaudited) | Year Ended December 31, | |||||||||||||||||||||||
| 2015 | 2014 | 2013 | 2012 | 2011 | ||||||||||||||||||||
| Class 4 | ||||||||||||||||||||||||
| Per share operating performance (for a share outstanding throughout the period) | ||||||||||||||||||||||||
Net asset value, beginning of period | $19.32 | $22.72 | $21.74 | $17.31 | $15.45 | $16.03 | ||||||||||||||||||
|
| |||||||||||||||||||||||
| Income from investment operationsa: | ||||||||||||||||||||||||
Net investment incomeb | 0.28 | c | 0.36 | 0.57 | d | 0.34 | 0.28 | 0.30 | e | |||||||||||||||
Net realized and unrealized gains (losses) | 0.56 | (1.52 | ) | 0.96 | 4.49 | 1.91 | (0.51 | ) | ||||||||||||||||
|
| |||||||||||||||||||||||
Total from investment operations | 0.84 | (1.16 | ) | 1.53 | 4.83 | 2.19 | (0.21 | ) | ||||||||||||||||
|
| |||||||||||||||||||||||
| Less distributions from: | ||||||||||||||||||||||||
Net investment income | — | (0.68 | ) | (0.43 | ) | (0.40 | ) | (0.33 | ) | (0.37 | ) | |||||||||||||
Net realized gains | — | (1.56 | ) | (0.12 | ) | — | — | — | ||||||||||||||||
|
| |||||||||||||||||||||||
Total distributions | — | (2.24 | ) | (0.55 | ) | (0.40 | ) | (0.33 | ) | (0.37 | ) | |||||||||||||
|
| |||||||||||||||||||||||
Net asset value, end of period | $20.16 | $19.32 | $22.72 | $21.74 | $17.31 | $15.45 | ||||||||||||||||||
|
| |||||||||||||||||||||||
Total returnf | 4.35% | (5.05)% | 7.04% | 28.05% | 14.20% | (1.12)% | ||||||||||||||||||
| Ratios to average net assetsg | ||||||||||||||||||||||||
Expensesh | 1.06% | i,j | 1.08% | i,j | 1.08% | i | 1.06% | i | 1.06% | 1.08% | i | |||||||||||||
Expenses incurred in connection with securities sold short | —% | k | 0.02% | 0.03% | —% | k | —% | k | —% | k | ||||||||||||||
Net investment income | 2.94% | c | 1.65% | 2.48% | d | 1.73% | 1.71% | 1.93%e | ||||||||||||||||
| Supplemental data | ||||||||||||||||||||||||
Net assets, end of period (000’s) | $124,453 | $130,978 | $158,020 | $188,153 | $165,015 | $162,049 | ||||||||||||||||||
Portfolio turnover rate | 13.90% | 19.88% | 21.33% | 24.05% | 34.07% | l | 41.02% | |||||||||||||||||
aThe amount shown for a share outstanding throughout the period may not correlate with the Statement of Operations for the period due to the timing of sales and repurchases of the Fund’s shares in relation to income earned and/or fluctuating fair value of the investments of the Fund.
bBased on average daily shares outstanding.
cNet investment income per share includes approximately $0.06 per share related to income received in the form of special dividends in connection with certain Fund holdings. Excluding this amount, the ratio of net investment income to average net assets would have been 2.34%.
dNet investment income per share includes approximately $0.23 per share related to income received in the form of special dividends in connection with certain Fund holdings. Excluding this amount, the ratio of net investment income to average net assets would have been 1.44%.
eNet investment income per share includes approximately $0.02 per share related to income received that had previously been deemed uncollectible. Excluding this amount, the ratio of net investment income to average net assets would have been 1.79%.
fTotal return does not include fees, charges or expenses imposed by the variable annuity and life insurance contracts for which Franklin Templeton Variable Insurance Products Trust serves as an underlying investment vehicle. Total return is not annualized for periods less than one year.
gRatios are annualized for periods less than one year.
hIncludes dividend and/or interest expense on securities sold short and security borrowing fees, if any. See below for the ratios of such expenses to average net assets for the periods presented. See Note 1(f).
iBenefit of expense reduction rounds to less than 0.01%.
jBenefit of waiver and payments by affiliates rounds to less than 0.01%.
kRounds to less than 0.01%.
lExcludes the value of portfolio securities delivered as a result of a redemption in-kind.
| MS-10 | Semiannual Report | The accompanying notes are an integral part of these financial statements. |
FRANKLIN TEMPLETON VARIABLE INSURANCE PRODUCTS TRUST
Statement of Investments, June 30, 2016 (unaudited)
Franklin Mutual Shares VIP Fund
| ||||||||||||||
| Country | Shares/Units | Value | ||||||||||||
Common Stocks and Other Equity Interests 86.7% | ||||||||||||||
Aerospace & Defense 1.1% | ||||||||||||||
B/E Aerospace Inc. | United States | 403,812 | $ | 18,646,019 | ||||||||||
Huntington Ingalls Industries Inc. | United States | 128,388 | 21,573,036 | |||||||||||
| a | KLX Inc. | United States | 224,586 | 6,962,166 | ||||||||||
|
| |||||||||||||
| 47,181,221 | ||||||||||||||
|
| |||||||||||||
Auto Components 0.2% | ||||||||||||||
| a,b | International Automotive Components Group Brazil LLC | Brazil | 1,730,515 | 28,490 | ||||||||||
| a,b,c | International Automotive Components Group North America LLC | United States | 15,382,424 | 6,786,202 | ||||||||||
|
| |||||||||||||
| 6,814,692 | ||||||||||||||
|
| |||||||||||||
Automobiles 1.2% | ||||||||||||||
General Motors Co. | United States | 1,770,350 | 50,100,905 | |||||||||||
|
| |||||||||||||
Banks 8.9% | ||||||||||||||
Barclays PLC | United Kingdom | 10,534,300 | 19,468,360 | |||||||||||
CIT Group Inc. | United States | 1,024,773 | 32,700,506 | |||||||||||
Citigroup Inc. | United States | 970,749 | 41,150,050 | |||||||||||
Citizens Financial Group Inc. | United States | 1,937,906 | 38,719,362 | |||||||||||
Columbia Banking System Inc. | United States | 86,923 | 2,439,059 | |||||||||||
| a | FCB Financial Holdings Inc., A | United States | 493,723 | 16,786,582 | ||||||||||
Guaranty Bancorp | United States | 209,583 | 3,500,036 | |||||||||||
JPMorgan Chase & Co. | United States | 1,010,070 | 62,765,750 | |||||||||||
PNC Financial Services Group Inc. | United States | 997,559 | 81,191,327 | |||||||||||
State Bank Financial Corp. | United States | 352,200 | 7,167,270 | |||||||||||
SunTrust Banks Inc. | United States | 820,282 | 33,697,185 | |||||||||||
Wells Fargo & Co. | United States | 698,860 | 33,077,044 | |||||||||||
|
| |||||||||||||
| 372,662,531 | ||||||||||||||
|
| |||||||||||||
Beverages 1.2% | ||||||||||||||
PepsiCo Inc. | United States | 469,472 | 49,735,864 | |||||||||||
|
| |||||||||||||
Chemicals 0.3% | ||||||||||||||
| a,d,e | Dow Corning Corp., Contingent Distribution | United States | 100,000 | — | ||||||||||
FMC Corp. | United States | 265,145 | 12,278,865 | |||||||||||
|
| |||||||||||||
| 12,278,865 | ||||||||||||||
|
| |||||||||||||
Communications Equipment 2.5% | ||||||||||||||
Cisco Systems Inc. | United States | 2,331,170 | 66,881,267 | |||||||||||
Nokia Corp., ADR | Finland | 3,299,845 | 18,776,118 | |||||||||||
Nokia OYJ, A | Finland | 3,670,248 | 20,796,707 | |||||||||||
|
| |||||||||||||
| 106,454,092 | ||||||||||||||
|
| |||||||||||||
Construction Materials 0.5% | ||||||||||||||
| a | LafargeHolcim Ltd., B | Switzerland | 547,060 | 22,720,841 | ||||||||||
|
| |||||||||||||
Consumer Finance 0.4% | ||||||||||||||
| a | Ally Financial Inc. | United States | 943,970 | 16,113,568 | ||||||||||
|
| |||||||||||||
Containers & Packaging 1.9% | ||||||||||||||
International Paper Co. | United States | 1,163,335 | 49,302,137 | |||||||||||
WestRock Co. | United States | 742,632 | 28,866,106 | |||||||||||
|
| |||||||||||||
| 78,168,243 | ||||||||||||||
|
| |||||||||||||
Diversified Financial Services 0.6% | ||||||||||||||
Voya Financial Inc. | United States | 959,810 | 23,764,896 | |||||||||||
|
| |||||||||||||
| Semiannual Report | MS-11 |
FRANKLIN TEMPLETON VARIABLE INSURANCE PRODUCTS TRUST
STATEMENT OF INVESTMENTS (UNAUDITED)
Franklin Mutual Shares VIP Fund (continued)
| Country | Shares/Units | Value | ||||||||||||
Common Stocks and Other Equity Interests (continued) | ||||||||||||||
Diversified Telecommunication Services 0.7% | ||||||||||||||
| a,d,e | Global Crossing Holdings Ltd., Contingent Distribution | United States | 9,005,048 | $ | — | |||||||||
Koninklijke KPN NV | Netherlands | 8,378,890 | 30,271,984 | |||||||||||
|
| |||||||||||||
| 30,271,984 | ||||||||||||||
|
| |||||||||||||
Electrical Equipment 0.1% | ||||||||||||||
| a | Sensata Technologies Holding NV | United States | 78,547 | 2,740,505 | ||||||||||
|
| |||||||||||||
Energy Equipment & Services 1.2% | ||||||||||||||
Baker Hughes Inc. | United States | 1,088,065 | 49,104,373 | |||||||||||
|
| |||||||||||||
Food & Staples Retailing 3.9% | ||||||||||||||
CVS Health Corp. | United States | 431,273 | 41,290,077 | |||||||||||
The Kroger Co. | United States | 1,298,210 | 47,761,146 | |||||||||||
| a | Rite Aid Corp. | United States | 2,439,970 | 18,275,375 | ||||||||||
Walgreens Boots Alliance Inc. | United States | 654,058 | 54,463,410 | |||||||||||
|
| |||||||||||||
| 161,790,008 | ||||||||||||||
|
| |||||||||||||
Health Care Equipment & Supplies 6.1% | ||||||||||||||
Medtronic PLC | United States | 1,650,202 | 143,188,028 | |||||||||||
St. Jude Medical Inc. | United States | 647,790 | 50,527,620 | |||||||||||
Stryker Corp. | United States | 507,821 | 60,852,190 | |||||||||||
|
| |||||||||||||
| 254,567,838 | ||||||||||||||
|
| |||||||||||||
Health Care Providers & Services 0.4% | ||||||||||||||
Cigna Corp. | United States | 142,154 | 18,194,290 | |||||||||||
|
| |||||||||||||
Household Products 0.2% | ||||||||||||||
Energizer Holdings Inc. | United States | 196,162 | 10,100,381 | |||||||||||
|
| |||||||||||||
Independent Power & Renewable Electricity Producers 0.4% | ||||||||||||||
NRG Energy Inc. | United States | 1,162,434 | 17,424,886 | |||||||||||
|
| |||||||||||||
Insurance 10.2% | ||||||||||||||
| a | Alleghany Corp. | United States | 108,258 | 59,496,432 | ||||||||||
The Allstate Corp. | United States | 613,700 | 42,928,315 | |||||||||||
American International Group Inc. | United States | 1,447,756 | 76,571,815 | |||||||||||
Chubb Ltd. | United States | 492,785 | 64,411,927 | |||||||||||
MetLife Inc. | United States | 1,019,123 | 40,591,669 | |||||||||||
White Mountains Insurance Group Ltd. | United States | 100,879 | 84,940,118 | |||||||||||
XL Group PLC | Ireland | 1,746,940 | 58,190,571 | |||||||||||
|
| |||||||||||||
| 427,130,847 | ||||||||||||||
|
| |||||||||||||
Internet Software & Services 0.4% | ||||||||||||||
| a | LinkedIn Corp., A | United States | 86,421 | 16,355,174 | ||||||||||
|
| |||||||||||||
IT Services 0.8% | ||||||||||||||
Xerox Corp. | United States | 3,596,839 | 34,134,002 | |||||||||||
|
| |||||||||||||
Machinery 1.8% | ||||||||||||||
Caterpillar Inc. | United States | 622,346 | 47,180,050 | |||||||||||
CNH Industrial NV | United Kingdom | 888,427 | 6,389,990 | |||||||||||
CNH Industrial NV, special voting | United Kingdom | 1,844,814 | 13,268,780 | |||||||||||
Federal Signal Corp. | United States | 757,221 | 9,753,007 | |||||||||||
|
| |||||||||||||
| 76,591,827 | ||||||||||||||
|
| |||||||||||||
| MS-12 | Semiannual Report |
FRANKLIN TEMPLETON VARIABLE INSURANCE PRODUCTS TRUST
STATEMENT OF INVESTMENTS (UNAUDITED)
Franklin Mutual Shares VIP Fund (continued)
| Country | Shares/Units | Value | ||||||||||||
Common Stocks and Other Equity Interests (continued) | ||||||||||||||
Marine 0.8% | ||||||||||||||
A.P. Moeller-Maersk AS, B | Denmark | 25,629 | $ | 33,295,592 | ||||||||||
|
| |||||||||||||
Media 6.4% | ||||||||||||||
CBS Corp., B | United States | 971,977 | 52,914,428 | |||||||||||
| a | Charter Communications Inc., A | United States | 244,513 | 55,905,452 | ||||||||||
| a | DISH Network Corp., A | United States | 559,965 | 29,342,166 | ||||||||||
Relx PLC | United Kingdom | 2,868,050 | 52,621,789 | |||||||||||
Time Warner Inc. | United States | 396,698 | 29,173,171 | |||||||||||
Twenty-First Century Fox Inc., B | United States | 1,768,325 | 48,186,856 | |||||||||||
|
| |||||||||||||
| 268,143,862 | ||||||||||||||
|
| |||||||||||||
Metals & Mining 1.0% | ||||||||||||||
Freeport-McMoRan Inc., B | United States | 1,660,406 | 18,496,923 | |||||||||||
ThyssenKrupp AG | Germany | 1,147,037 | 22,929,498 | |||||||||||
|
| |||||||||||||
| 41,426,421 | ||||||||||||||
|
| |||||||||||||
Multiline Retail 0.5% | ||||||||||||||
Macy’s Inc. | United States | 677,570 | 22,773,128 | |||||||||||
|
| |||||||||||||
Oil, Gas & Consumable Fuels 6.6% | ||||||||||||||
Anadarko Petroleum Corp. | United States | 175,487 | 9,344,683 | |||||||||||
Apache Corp. | United States | 355,280 | 19,778,437 | |||||||||||
BP PLC | United Kingdom | 4,322,322 | 25,252,268 | |||||||||||
CONSOL Energy Inc. | United States | 1,236,955 | 19,902,606 | |||||||||||
Kinder Morgan Inc. | United States | 2,649,790 | 49,604,069 | |||||||||||
Marathon Oil Corp. | United States | 3,204,744 | 48,103,207 | |||||||||||
Royal Dutch Shell PLC, A (EUR Traded) | United Kingdom | 1,916,196 | 52,470,172 | |||||||||||
Royal Dutch Shell PLC, A (GBP Traded) | United Kingdom | 1,048,110 | 28,614,834 | |||||||||||
| a,b,c | Warrior Met Coal LLC, A | United States | 12,324 | 1,242,461 | ||||||||||
| a,b,c | Warrior Met Coal LLC, B | United States | 28,821 | 2,905,629 | ||||||||||
The Williams Cos. Inc. | United States | 845,109 | 18,279,708 | |||||||||||
|
| |||||||||||||
| 275,498,074 | ||||||||||||||
|
| |||||||||||||
Personal Products 0.3% | ||||||||||||||
| a | Edgewell Personal Care Co. | United States | 171,722 | 14,495,054 | ||||||||||
|
| |||||||||||||
Pharmaceuticals 8.1% | ||||||||||||||
Eli Lilly & Co. | United States | 1,132,890 | 89,215,088 | |||||||||||
Merck & Co. Inc. | United States | 2,381,018 | 137,170,447 | |||||||||||
Novartis AG, ADR | Switzerland | 868,321 | 71,645,166 | |||||||||||
Teva Pharmaceutical Industries Ltd., ADR | Israel | 844,197 | 42,404,015 | |||||||||||
|
| |||||||||||||
| 340,434,716 | ||||||||||||||
|
| |||||||||||||
Real Estate Investment Trusts (REITs) 0.4% | ||||||||||||||
Alexander’s Inc. | United States | 40,126 | 16,420,763 | |||||||||||
|
| |||||||||||||
Real Estate Management & Development 0.0%† | ||||||||||||||
| a | Forestar Group Inc. | United States | 161,671 | 1,922,268 | ||||||||||
|
| |||||||||||||
Software 6.4% | ||||||||||||||
CA Inc. | United States | 1,584,119 | 52,006,627 | |||||||||||
Microsoft Corp. | United States | 2,773,357 | 141,912,677 | |||||||||||
Symantec Corp. | United States | 3,540,461 | 72,721,069 | |||||||||||
|
| |||||||||||||
| 266,640,373 | ||||||||||||||
|
| |||||||||||||
| Semiannual Report | MS-13 |
FRANKLIN TEMPLETON VARIABLE INSURANCE PRODUCTS TRUST
STATEMENT OF INVESTMENTS (UNAUDITED)
Franklin Mutual Shares VIP Fund (continued)
| Country | Shares/Units | Value | ||||||||||||
Common Stocks and Other Equity Interests (continued) |
| |||||||||||||
Specialty Retail 0.3% | ||||||||||||||
| a | Office Depot Inc. | United States | 3,432,180 | $ | 11,360,516 | |||||||||
|
| |||||||||||||
Technology Hardware, Storage & Peripherals 3.4% | ||||||||||||||
EMC Corp. | United States | 1,779,400 | 48,346,298 | |||||||||||
Hewlett Packard Enterprise Co. | United States | 1,418,347 | 25,913,199 | |||||||||||
HP Inc. | United States | 1,418,347 | 17,800,255 | |||||||||||
Samsung Electronics Co. Ltd. | South Korea | 41,741 | 51,599,602 | |||||||||||
|
| |||||||||||||
| 143,659,354 | ||||||||||||||
|
| |||||||||||||
Tobacco 6.3% | ||||||||||||||
Altria Group Inc. | United States | 822,008 | 56,685,672 | |||||||||||
British American Tobacco PLC | United Kingdom | 1,256,027 | 81,109,906 | |||||||||||
Imperial Brands PLC | United Kingdom | 1,103,817 | 59,660,613 | |||||||||||
Philip Morris International Inc. | United States | 187,960 | 19,119,291 | |||||||||||
Reynolds American Inc. | United States | 889,694 | 47,981,197 | |||||||||||
|
| |||||||||||||
| 264,556,679 | ||||||||||||||
|
| |||||||||||||
Wireless Telecommunication Services 1.2% | ||||||||||||||
Vodafone Group PLC | United Kingdom | 17,026,844 | 51,684,731 | |||||||||||
|
| |||||||||||||
Total Common Stocks and Other Equity Interests | 3,636,713,364 | |||||||||||||
|
| |||||||||||||
| Principal Amount* | ||||||||||||||
Corporate Bonds, Notes and Senior Floating Rate Interests 4.5% | ||||||||||||||
Avaya Inc., | ||||||||||||||
fsenior note, 144A, 10.50%, 3/01/21 | United States | 22,449,000 | 5,051,025 | |||||||||||
fsenior secured note, 144A, 7.00%, 4/01/19 | United States | 12,923,000 | 9,272,253 | |||||||||||
g,hTerm B-3 Loan, 5.134%, 10/26/17 | United States | 12,791,927 | 9,932,931 | |||||||||||
g,hTerm B-6 Loan, 6.50%, 3/30/18 | United States | 6,741,721 | 4,986,770 | |||||||||||
g,hTerm B-7 Loan, 6.25%, 5/29/20 | United States | 6,441,346 | 4,578,721 | |||||||||||
g,hBelk Inc., Closing Date Term Loan, 5.75%, 12/12/22 | United States | 11,827,358 | 9,461,886 | |||||||||||
iHeartCommunications Inc., | ||||||||||||||
senior secured note, first lien, 9.00%, 12/15/19 | United States | 26,449,000 | 20,200,424 | |||||||||||
g,hTranche D Term Loan, 7.21%, 1/30/19 | United States | 34,746,619 | 25,538,765 | |||||||||||
g,hTranche E Term Loan, 7.96%, 7/30/19 | United States | 11,168,253 | 8,215,646 | |||||||||||
g,hToys R Us-Delaware Inc., | ||||||||||||||
FILO Loans, 8.25%, 10/24/19 | United States | 2,560,000 | 2,486,784 | |||||||||||
Term B-4 Loan, 9.75%, 4/24/20 | United States | 21,350,214 | 18,539,095 | |||||||||||
f Valeant Pharmaceuticals International, | ||||||||||||||
senior bond, 144A, 6.75%, 8/15/21 | United States | 2,964,000 | 2,541,630 | |||||||||||
senior bond, 144A, 7.25%, 7/15/22 | United States | 1,460,000 | 1,259,542 | |||||||||||
senior note, 144A, 6.375%, 10/15/20 | United States | 18,159,000 | 15,707,535 | |||||||||||
g,h,iVeritas Software Corp., | ||||||||||||||
Term B1, 6.625%, 6/15/23 | United States | 130,673 | EUR | 123,767 | ||||||||||
Term Loan B1, 6.625%, 1/27/23 | United States | 12,657,595 | 11,075,396 | |||||||||||
Term Loan B2, 8.625%, 1/27/23 | United States | 12,220,990 | 10,494,775 | |||||||||||
f Veritas U.S. Inc./Veritas Bermuda Ltd., senior note, 144A, 10.50%, 2/01/24 | United States | 15,122,000 | 12,929,310 | |||||||||||
f Western Digital Corp., senior note, 144A, 10.50%, 4/01/24 | United States | 14,089,000 | 15,110,453 | |||||||||||
|
| |||||||||||||
Total Corporate Bonds, Notes and Senior Floating Rate Interests (Cost $225,180,826) | 187,506,708 | |||||||||||||
|
| |||||||||||||
| MS-14 | Semiannual Report |
FRANKLIN TEMPLETON VARIABLE INSURANCE PRODUCTS TRUST
STATEMENT OF INVESTMENTS (UNAUDITED)
Franklin Mutual Shares VIP Fund (continued)
| Country | Principal Amount* | Value | ||||||||||||
Corporate Bonds, Notes and Senior Floating Rate Interests in Reorganization 1.7% | ||||||||||||||
| b,j | Broadband Ventures III LLC, secured promissory note, | United States | 1,754 | $ | — | |||||||||
| g,h,j | Caesars Entertainment Operating Co. Inc., | |||||||||||||
Term B-5-B Loans, 1.50%, 3/01/17 | United States | 3,251,752 | 3,208,396 | |||||||||||
Term B-6-B Loans, 1.50%, 3/01/17 | United States | 15,503,483 | 15,542,242 | |||||||||||
Term B-7 Loans, 1.50%, 3/01/17 | United States | 9,850,500 | 9,957,210 | |||||||||||
| j | Samson Investment Co., senior note, 9.75%, 2/15/20 | United States | 16,690,000 | 375,525 | ||||||||||
| g,h,j | Texas Competitive Electric Holdings Co. LLC, Term Loans, | United States | 90,618,405 | 30,394,954 | ||||||||||
| f,j | Texas Competitive Electric Holdings Co. LLC/Texas Competitive Electric Holdings Finance Inc., senior secured note, first lien, 144A, 11.50%, 10/01/20 | United States | 39,308,000 | 13,462,990 | ||||||||||
| f,j,k | Walter Energy Inc., second lien, 144A, PIK, 11.50%, 4/01/20 | United States | 5,419,860 | 1,897 | ||||||||||
|
| |||||||||||||
Total Corporate Bonds, Notes and Senior Floating Rate Interests in Reorganization (Cost $151,787,519) | 72,943,214 | |||||||||||||
|
| |||||||||||||
| Shares | ||||||||||||||
Companies in Liquidation 0.1% | ||||||||||||||
| a | Adelphia Recovery Trust | United States | 29,283,354 | 61,495 | ||||||||||
| a,d | Adelphia Recovery Trust, Arahova Contingent Value Vehicle, Contingent Distribution | United States | 1,955,453 | 19,555 | ||||||||||
| a,b,c,l | CB FIM Coinvestors LLC | United States | 6,400,507 | — | ||||||||||
| a,d,e | Century Communications Corp., Contingent Distribution | United States | 5,487,000 | — | ||||||||||
| a,b | FIM Coinvestor Holdings I, LLC | United States | 8,006,950 | — | ||||||||||
| a,m | Lehman Brothers Holdings Inc., Bankruptcy Claim | United States | 144,058,799 | 4,501,837 | ||||||||||
| a,d,e | Tribune Media Litigation Trust, Contingent Distribution | United States | 394,052 | — | ||||||||||
| a,d,e | Tropicana Litigation Trust, Contingent Distribution | United States | 18,305,000 | — | ||||||||||
|
| |||||||||||||
Total Companies in Liquidation (Cost $11,547,282) | 4,582,887 | |||||||||||||
|
| |||||||||||||
| Principal Amount* | ||||||||||||||
Municipal Bonds (Cost $17,936,522) 0.3% | ||||||||||||||
Puerto Rico Commonwealth GO, Refunding, Series A, | United States | 20,409,000 | 13,648,519 | |||||||||||
|
| |||||||||||||
Total Investments before Short Term Investments (Cost $3,350,334,168) | 3,915,394,692 | |||||||||||||
|
| |||||||||||||
Short Term Investments 6.7% | ||||||||||||||
U.S. Government and Agency Securities 6.7% | ||||||||||||||
| n | FHLB, 7/01/16 | United States | 20,000,000 | 20,000,000 | ||||||||||
| n,o | U.S. Treasury Bill, 7/07/16 - 12/08/16 | United States | 259,200,000 | 259,061,072 | ||||||||||
|
| |||||||||||||
Total U.S. Government and Agency Securities (Cost $278,985,270) | 279,061,072 | |||||||||||||
|
| |||||||||||||
Total Investments (Cost $3,629,319,438) 100.0% | 4,194,455,764 | |||||||||||||
| Semiannual Report | MS-15 |
FRANKLIN TEMPLETON VARIABLE INSURANCE PRODUCTS TRUST
STATEMENT OF INVESTMENTS (UNAUDITED)
Franklin Mutual Shares VIP Fund (continued)
| Country | Principal Amount* | Value | ||||||||||||
Securities Sold Short (0.5)% | $ | (22,174,574 | ) | |||||||||||
Other Assets, less Liabilities 0.5% | 22,974,164 | |||||||||||||
|
| |||||||||||||
Net Assets 100.0% | $ | 4,195,255,354 | ||||||||||||
|
| |||||||||||||
| Shares | ||||||||||||||
| p | Securities Sold Short (Proceeds $21,743,820) (0.5)% | |||||||||||||
Common Stocks (0.5)% | ||||||||||||||
Health Care Equipment & Supplies (0.5)% | ||||||||||||||
Abbott Laboratories | United States | 564,095 | $ | (22,174,574 | ) | |||||||||
|
| |||||||||||||
†Rounds to less than 0.1% of net assets.
*The principal amount is stated in U.S. dollars unless otherwise indicated.
aNon-income producing.
bSee Note 8 regarding restricted securities.
cAt June 30, 2016, pursuant to the Fund’s policies and the requirements of applicable securities law, the Fund is restricted from trading these securities at period end.
dContingent distributions represent the right to receive additional distributions, if any, during the reorganization of the underlying company. Shares represent total underlying principal of debt securities.
eSecurity has been deemed illiquid because it may not be able to be sold within seven days. At June 30, 2016, the aggregate value of these securities was $-.
fSecurity was purchased pursuant to Rule 144A under the Securities Act of 1933 and may be sold in transactions exempt from registration only to qualified institutional buyers or in a public offering registered under the Securities Act of 1933. These securities have been deemed liquid under guidelines approved by the Trust’s Board of Trustees. At June 30, 2016, the aggregate value of these securities was $75,336,635, representing 1.8% of net assets.
gSee Note 1(h) regarding senior floating rate interests.
hThe coupon rate shown represents the rate at period end.
iSecurity purchased on a when-issued or delayed delivery basis. See Note 1(c).
jSee Note 7 regarding credit risk and defaulted securities.
kIncome may be received in additional securities and/or cash.
lSee Note 10 regarding holdings of 5% voting securities.
mBankruptcy claims represent the right to receive distributions, if any, during the liquidation of the underlying pool of assets. Shares represent amount of allowed unsecured claims.
nThe security is traded on a discount basis with no stated coupon rate.
oA portion or all of the security has been segregated as collateral for securities sold short and open forward contracts. At June 30, 2016, the aggregate value of these securities and/or cash pledged amounted to $33,235,061, representing 0.8% of net assets.
pSee Note 1(f) regarding securities sold short.
| MS-16 | Semiannual Report |
FRANKLIN TEMPLETON VARIABLE INSURANCE PRODUCTS TRUST
STATEMENT OF INVESTMENTS (UNAUDITED)
Franklin Mutual Shares VIP Fund (continued)
At June 30, 2016, the Fund had the following futures contracts outstanding. See Note 1(d).
| Futures Contracts | ||||||||||||||||||||||||
| Description | Type | Number of Contracts | Notional Value | Expiration Date | Unrealized Appreciation | Unrealized Depreciation | ||||||||||||||||||
| Currency Contracts | ||||||||||||||||||||||||
EUR/USD | Short | 497 | $ | 69,005,344 | 9/19/16 | $ | 1,926,039 | $ | — | |||||||||||||||
GBP/USD | Short | 1,349 | 111,697,200 | 9/19/16 | 10,629,372 | — | ||||||||||||||||||
|
| |||||||||||||||||||||||
Total Futures Contracts |
| $ | 12,555,411 | $ | — | |||||||||||||||||||
|
| |||||||||||||||||||||||
Net unrealized appreciation (depreciation) |
| $ | 12,555,411 | |||||||||||||||||||||
|
| |||||||||||||||||||||||
At June 30, 2016, the Fund had the following forward exchange contracts outstanding. See Note 1(d).
| Forward Exchange Contracts | ||||||||||||||||||||||||||||
| Currency | Counterpartya | Type | Quantity | Contract Amount | Settlement Date | Unrealized Appreciation | Unrealized Depreciation | |||||||||||||||||||||
| OTC Forward Exchange Contracts | ||||||||||||||||||||||||||||
South Korean Won | BOFA | Sell | 12,942,780,859 | $ | 11,220,901 | 7/12/16 | $ | 33,133 | $ | (38,398 | ) | |||||||||||||||||
South Korean Won | FBCO | Sell | 9,054,928,438 | 7,891,005 | 7/12/16 | 37,042 | — | |||||||||||||||||||||
South Korean Won | HSBC | Sell | 36,293,597,203 | 31,573,074 | 7/12/16 | 156,317 | (63,180 | ) | ||||||||||||||||||||
British Pound | BOFA | Buy | 4,483,316 | 6,353,843 | 8/19/16 | — | (373,001 | ) | ||||||||||||||||||||
British Pound | BOFA | Sell | 1,356,985 | 1,817,068 | 8/19/16 | 8,622 | (1,802 | ) | ||||||||||||||||||||
British Pound | BONY | Sell | 1,897,833 | 2,550,433 | 8/19/16 | 18,683 | — | |||||||||||||||||||||
British Pound | FBCO | Sell | 347,504 | 469,600 | 8/19/16 | 6,022 | — | |||||||||||||||||||||
British Pound | HSBC | Sell | 4,479,387 | 5,994,889 | 8/19/16 | 22,575 | (3,286 | ) | ||||||||||||||||||||
British Pound | SSBT | Sell | 102,928,697 | 149,011,570 | 8/19/16 | 11,750,243 | (47,793 | ) | ||||||||||||||||||||
Euro | BOFA | Buy | 2,951,888 | 3,282,507 | 8/19/16 | 8,370 | (8,360 | ) | ||||||||||||||||||||
Euro | BOFA | Sell | 1,408,000 | 1,569,212 | 8/19/16 | 3,507 | — | |||||||||||||||||||||
Euro | BONY | Buy | 1,516,875 | 1,691,941 | 8/19/16 | 5,711 | (10,878 | ) | ||||||||||||||||||||
Euro | BONY | Sell | 491,475 | 546,486 | 8/19/16 | — | (37 | ) | ||||||||||||||||||||
Euro | FBCO | Buy | 1,860,238 | 2,074,960 | 8/19/16 | 7,347 | (13,712 | ) | ||||||||||||||||||||
Euro | HSBC | Buy | 1,326,645 | 1,474,820 | 8/19/16 | 7,147 | (6,729 | ) | ||||||||||||||||||||
Euro | HSBC | Sell | 1,084,139 | 1,205,963 | 8/19/16 | 394 | — | |||||||||||||||||||||
Euro | SSBT | Buy | 1,840,384 | 2,051,318 | 8/19/16 | 8,226 | (13,027 | ) | ||||||||||||||||||||
Euro | SSBT | Sell | 74,262,081 | 84,862,540 | 8/19/16 | 2,282,682 | — | |||||||||||||||||||||
|
| |||||||||||||||||||||||||||
Total Forward Exchange Contracts |
| $ | 14,356,021 | $ | (580,203 | ) | ||||||||||||||||||||||
|
| |||||||||||||||||||||||||||
Net unrealized appreciation (depreciation) |
| $ | 13,775,818 | |||||||||||||||||||||||||
|
| |||||||||||||||||||||||||||
aMay be comprised of multiple contracts with the same counterparty, currency and settlement date.
See Abbreviations on page MS-32.
| The accompanying notes are an integral part of these financial statements. | Semiannual Report | MS-17 |
FRANKLIN TEMPLETON VARIABLE INSURANCE PRODUCTS TRUST
Financial Statements
Statement of Assets and Liabilities
June 30, 2016 (unaudited)
| Franklin Mutual Shares VIP Fund | ||||
Assets: | ||||
Investments in securities: | ||||
Cost | $ | 3,629,319,438 | ||
|
| |||
Value | $ | 4,194,455,764 | ||
Cash | 377,405 | |||
Restricted cash (Note 1e) | 14,230,000 | |||
Foreign currency, at value (cost $1,829,635) | 1,818,195 | |||
Receivables: | ||||
Investment securities sold | 13,211,093 | |||
Capital shares sold | 152,485 | |||
Dividends and interest | 15,769,792 | |||
European Union tax reclaims | 1,176,537 | |||
Due from brokers | 29,107,255 | |||
Variation margin | 1,740,831 | |||
Unrealized appreciation on OTC forward exchange contracts | 14,356,021 | |||
Other assets | 1,965 | |||
|
| |||
Total assets | 4,286,397,343 | |||
|
| |||
Liabilities: | ||||
Payables: | ||||
Investment securities purchased | 47,351,119 | |||
Capital shares redeemed | 2,367,018 | |||
Management fees | 2,320,697 | |||
Distribution fees | 1,491,134 | |||
Securities sold short, at value (proceeds $21,743,820) | 22,174,574 | |||
Due to brokers | 14,230,000 | |||
Unrealized depreciation on OTC forward exchange contracts | 580,203 | |||
Accrued expenses and other liabilities | 627,244 | |||
|
| |||
Total liabilities | 91,141,989 | |||
|
| |||
Net assets, at value | $ | 4,195,255,354 | ||
|
| |||
Net assets consist of: | ||||
Paid-in capital | $ | 3,073,799,095 | ||
Undistributed net investment income | 137,448,740 | |||
Net unrealized appreciation (depreciation) | 590,764,634 | |||
Accumulated net realized gain (loss) | 393,242,885 | |||
|
| |||
Net assets, at value | $ | 4,195,255,354 | ||
|
| |||
| MS-18 | Semiannual Report | The accompanying notes are an integral part of these financial statements. |
FRANKLIN TEMPLETON VARIABLE INSURANCE PRODUCTS TRUST
FINANCIAL STATEMENTS
Statement of Assets and Liabilities (continued)
June 30, 2016 (unaudited)
| Franklin Mutual Shares VIP Fund | ||||
| Class 1: | ||||
Net assets, at value | $ | 573,679,228 | ||
|
| |||
Shares outstanding | 28,182,444 | |||
|
| |||
Net asset value and maximum offering price per share | $ | 20.36 | ||
|
| |||
| Class 2: | ||||
Net assets, at value | $ | 3,497,122,865 | ||
|
| |||
Shares outstanding | 174,515,262 | |||
|
| |||
Net asset value and maximum offering price per share | $ | 20.04 | ||
|
| |||
| Class 4: | ||||
Net assets, at value | $ | 124,453,261 | ||
|
| |||
Shares outstanding | 6,174,619 | |||
|
| |||
Net asset value and maximum offering price per share | $ | 20.16 | ||
|
| |||
| The accompanying notes are an integral part of these financial statements. | Semiannual Report | MS-19 |
FRANKLIN TEMPLETON VARIABLE INSURANCE PRODUCTS TRUST
FINANCIAL STATEMENTS
Statement of Operations
for the six months ended June 30, 2016 (unaudited)
| Franklin Mutual Shares VIP Fund | ||||
Investment income: | ||||
Dividends | $ | 64,649,928 | ||
Interest | 13,823,664 | |||
Income from securities loaned (net of fees and rebates) | 348,125 | |||
|
| |||
Total investment income | 78,821,717 | |||
|
| |||
Expenses: | ||||
Management fees (Note 3a) | 13,574,515 | |||
Distribution fees: (Note 3c) | ||||
Class 2 | 4,065,160 | |||
Class 4 | 216,451 | |||
Custodian fees (Note 4) | 48,568 | |||
Reports to shareholders | 198,500 | |||
Professional fees | 91,752 | |||
Trustees’ fees and expenses | 10,526 | |||
Dividends on securities sold short | 65,460 | |||
Other | 45,146 | |||
|
| |||
Total expenses | 18,316,078 | |||
Expense reductions (Note 4) | (3,132 | ) | ||
Expenses waived/paid by affiliates (Note 3e) | (6,015 | ) | ||
|
| |||
Net expenses | 18,306,931 | |||
|
| |||
Net investment income | 60,514,786 | |||
|
| |||
Realized and unrealized gains (losses): | ||||
Net realized gain (loss) from: | ||||
Investments | 75,479,023 | |||
Foreign currency transactions | 1,084,479 | |||
Futures contracts | 2,138,093 | |||
Securities sold short | (763,869 | ) | ||
|
| |||
Net realized gain (loss) | 77,937,726 | |||
|
| |||
Net change in unrealized appreciation (depreciation) on: | ||||
Investments | 1,901,159 | |||
Translation of other assets and liabilities denominated in foreign currencies | 8,436,769 | |||
Futures contracts | 9,293,172 | |||
|
| |||
Net change in unrealized appreciation (depreciation) | 19,631,100 | |||
|
| |||
Net realized and unrealized gain (loss) | 97,568,826 | |||
|
| |||
Net increase (decrease) in net assets resulting from operations | $ | 158,083,612 | ||
|
| |||
| MS-20 | Semiannual Report | The accompanying notes are an integral part of these financial statements. |
FRANKLIN TEMPLETON VARIABLE INSURANCE PRODUCTS TRUST
FINANCIAL STATEMENTS
Statements of Changes in Net Assets
| Franklin Mutual Shares VIP Fund | ||||||||
| Six Months Ended June 30, 2016 (unaudited) | Year Ended December 31, 2015 | |||||||
Increase (decrease) in net assets: | ||||||||
Operations: | ||||||||
Net investment income | $ | 60,514,786 | $ | 84,027,000 | ||||
Net realized gain (loss) | 77,937,726 | 361,237,169 | ||||||
Net change in unrealized appreciation (depreciation) | 19,631,100 | (663,206,334 | ) | |||||
|
| |||||||
Net increase (decrease) in net assets resulting from operations | 158,083,612 | (217,942,165 | ) | |||||
|
| |||||||
Distributions to shareholders from: | ||||||||
Net investment income: | ||||||||
Class 1 | — | (22,253,593 | ) | |||||
Class 2 | — | (115,505,343 | ) | |||||
Class 4 | — | (4,240,573 | ) | |||||
Net realized gains: | ||||||||
Class 1 | — | (44,812,385 | ) | |||||
Class 2 | — | (254,851,880 | ) | |||||
Class 4 | — | (9,773,474 | ) | |||||
|
| |||||||
Total distributions to shareholders | — | (451,437,248 | ) | |||||
|
| |||||||
Capital share transactions: (Note 2) | ||||||||
Class 1 | (86,685,734 | ) | 85,321,567 | |||||
Class 2 | 7,573,914 | (314,542,720 | ) | |||||
Class 4 | (11,637,728 | ) | (6,302,871 | ) | ||||
|
| |||||||
Total capital share transactions | (90,749,548 | ) | (235,524,024 | ) | ||||
|
| |||||||
Net increase (decrease) in net assets | 67,334,064 | (904,903,437 | ) | |||||
Net assets: | ||||||||
Beginning of period | 4,127,921,290 | 5,032,824,727 | ||||||
|
| |||||||
End of period | $ | 4,195,255,354 | $ | 4,127,921,290 | ||||
|
| |||||||
Undistributed net investment income included in net assets: | ||||||||
End of period | $ | 137,448,740 | $ | 77,363,379 | ||||
|
| |||||||
| The accompanying notes are an integral part of these financial statements. | Semiannual Report | MS-21 |
FRANKLIN TEMPLETON VARIABLE INSURANCE PRODUCTS TRUST
Notes to Financial Statements (unaudited)
Franklin Mutual Shares VIP Fund
1. Organization and Significant Accounting Policies
Franklin Templeton Variable Insurance Products Trust (Trust) is registered under the Investment Company Act of 1940 (1940 Act) as an open-end management investment company, consisting of nineteen separate funds and applies the specialized accounting and reporting guidance in U.S. Generally Accepted Accounting Principles (U.S. GAAP). Franklin Mutual Shares VIP Fund (Fund) is included in this report. The financial statements of the remaining funds in the Trust are presented separately. Shares of the Fund are generally sold only to insurance company separate accounts to fund the benefits of variable life insurance policies or variable annuity contracts. The Fund offers three classes of shares: Class 1, Class 2 and Class 4. Each class of shares differs by its distribution fees, voting rights on matters affecting a single class and its exchange privilege.
The following summarizes the Fund’s significant accounting policies.
a. Financial Instrument Valuation
The Fund’s investments in financial instruments are carried at fair value daily. Fair value is the price that would be received to sell an asset or paid to transfer a liability in an orderly transaction between market participants on the measurement date. The Fund calculates the net asset value (NAV) per share as of 4 p.m. Eastern time each day the New York Stock Exchange (NYSE) is open for trading. Under compliance policies and procedures approved by the Trust’s Board of Trustees (the Board), the Fund’s administrator has responsibility for oversight of valuation, including leading the cross-functional Valuation Committee (VC). The VC provides administration and oversight of the Fund’s valuation policies and procedures, which are approved annually by the Board. Among other things, these procedures allow the Fund to utilize independent pricing services, quotations from securities and financial instrument dealers, and other market sources to determine fair value.
Equity securities and derivative financial instruments (derivatives) listed on an exchange or on the NASDAQ National Market System are valued at the last quoted sale price or the official closing price of the day, respectively. Foreign equity securities are valued as of the close of trading on the foreign stock exchange on which the security is primarily traded or as of 4 p.m. Eastern time whichever is earlier. The value is then converted into its U.S. dollar equivalent at the foreign exchange
rate in effect at 4 p.m. Eastern time on the day that the value of the security is determined. Over-the-counter (OTC) securities are valued within the range of the most recent quoted bid and ask prices. Securities that trade in multiple markets or on multiple exchanges are valued according to the broadest and most representative market. Certain equity securities are valued based upon fundamental characteristics or relationships to similar securities.
Debt securities generally trade in the OTC market rather than on a securities exchange. The Fund’s pricing services use multiple valuation techniques to determine fair value. In instances where sufficient market activity exists, the pricing services may utilize a market-based approach through which quotes from market makers are used to determine fair value. In instances where sufficient market activity may not exist or is limited, the pricing services also utilize proprietary valuation models which may consider market characteristics such as benchmark yield curves, credit spreads, estimated default rates, anticipated market interest rate volatility, coupon rates, anticipated timing of principal repayments, underlying collateral, and other unique security features in order to estimate the relevant cash flows, which are then discounted to calculate the fair value. Securities denominated in a foreign currency are converted into their U.S. dollar equivalent at the foreign exchange rate in effect at 4 p.m. Eastern time on the date that the values of the foreign debt securities are determined.
Certain derivatives trade in the OTC market. The Fund’s pricing services use various techniques including industry standard option pricing models and proprietary discounted cash flow models to determine the fair value of those instruments. The Fund’s net benefit or obligation under the derivative contract, as measured by the fair value of the contract, is included in net assets.
The Fund has procedures to determine the fair value of financial instruments for which market prices are not reliable or readily available. Under these procedures, the VC convenes on a regular basis to review such financial instruments and considers a number of factors, including significant unobservable valuation inputs, when arriving at fair value. The VC primarily employs a market-based approach which may use related or comparable assets or liabilities, recent transactions, market multiples, book values, and other relevant information for the investment to determine the fair value of the investment. An income-based valuation approach may also be used in which the anticipated
| MS-22 | Semiannual Report |
FRANKLIN TEMPLETON VARIABLE INSURANCE PRODUCTS TRUST
NOTES TO FINANCIAL STATEMENTS (UNAUDITED)
Franklin Mutual Shares VIP Fund (continued)
future cash flows of the investment are discounted to calculate fair value. Discounts may also be applied due to the nature or duration of any restrictions on the disposition of the investments. Due to the inherent uncertainty of valuations of such investments, the fair values may differ significantly from the values that would have been used had an active market existed. The VC employs various methods for calibrating these valuation approaches including a regular review of key inputs and assumptions, transactional back-testing or disposition analysis, and reviews of any related market activity.
Trading in securities on foreign securities stock exchanges and OTC markets may be completed before 4 p.m. Eastern time. In addition, trading in certain foreign markets may not take place on every NYSE business day. Occasionally, events occur between the time at which trading in a foreign security is completed and the close of the NYSE that might call into question the reliability of the value of a portfolio security held by the Fund. As a result, differences may arise between the value of the Fund’s portfolio securities as determined at the foreign market close and the latest indications of value at the close of the NYSE. In order to minimize the potential for these differences, the VC monitors price movements following the close of trading in foreign stock markets through a series of country specific market proxies (such as baskets of American Depositary Receipts, futures contracts and exchange traded funds). These price movements are measured against established trigger thresholds for each specific market proxy to assist in determining if an event has occurred that may call into question the reliability of the values of the foreign securities held by the Fund. If such an event occurs, the securities may be valued using fair value procedures, which may include the use of independent pricing services.
When the last day of the reporting period is a non-business day, certain foreign markets may be open on those days that the NYSE is closed, which could result in differences between the value of the Fund’s portfolio securities on the last business day and the last calendar day of the reporting period. Any significant security valuation changes due to an open foreign market are adjusted and reflected by the Fund for financial reporting purposes.
b. Foreign Currency Translation
Portfolio securities and other assets and liabilities denominated in foreign currencies are translated into U.S. dollars based on the exchange rate of such currencies against U.S. dollars on the date of valuation. The Fund may enter into foreign currency
exchange contracts to facilitate transactions denominated in a foreign currency. Purchases and sales of securities, income and expense items denominated in foreign currencies are translated into U.S. dollars at the exchange rate in effect on the transaction date. Portfolio securities and assets and liabilities denominated in foreign currencies contain risks that those currencies will decline in value relative to the U.S. dollar. Occasionally, events may impact the availability or reliability of foreign exchange rates used to convert the U.S. dollar equivalent value. If such an event occurs, the foreign exchange rate will be valued at fair value using procedures established and approved by the Board.
The Fund does not separately report the effect of changes in foreign exchange rates from changes in market prices on securities held. Such changes are included in net realized and unrealized gain or loss from investments in the Statement of Operations.
Realized foreign exchange gains or losses arise from sales of foreign currencies, currency gains or losses realized between the trade and settlement dates on securities transactions and the difference between the recorded amounts of dividends, interest, and foreign withholding taxes and the U.S. dollar equivalent of the amounts actually received or paid. Net unrealized foreign exchange gains and losses arise from changes in foreign exchange rates on foreign denominated assets and liabilities other than investments in securities held at the end of the reporting period.
c. Securities Purchased on a When-Issued or Delayed Delivery Basis
The Fund purchases securities on a when-issued or delayed delivery basis, with payment and delivery scheduled for a future date. These transactions are subject to market fluctuations and are subject to the risk that the value at delivery may be more or less than the trade date purchase price. Although the Fund will generally purchase these securities with the intention of holding the securities, it may sell the securities before the settlement date. Sufficient assets have been segregated for these securities.
d. Derivative Financial Instruments
The Fund invested in derivatives in order to manage risk or gain exposure to various other investments or markets. Derivatives are financial contracts based on an underlying or notional amount, require no initial investment or an initial net investment that is smaller than would normally be required to have a similar response to changes in market factors, and require or permit net
| Semiannual Report | MS-23 |
FRANKLIN TEMPLETON VARIABLE INSURANCE PRODUCTS TRUST
NOTES TO FINANCIAL STATEMENTS (UNAUDITED)
Franklin Mutual Shares VIP Fund (continued)
1. Organization and Significant Accounting Policies (continued)
d. Derivative Financial Instruments (continued)
settlement. Derivatives contain various risks including the potential inability of the counterparty to fulfill their obligations under the terms of the contract, the potential for an illiquid secondary market, and/or the potential for market movements which expose the Fund to gains or losses in excess of the amounts shown in the Statement of Assets and Liabilities. Realized gain and loss and unrealized appreciation and depreciation on these contracts for the period are included in the Statement of Operations.
Derivative counterparty credit risk is managed through a formal evaluation of the creditworthiness of all potential counterparties. The Fund attempts to reduce its exposure to counterparty credit risk on OTC derivatives, whenever possible, by entering into International Swaps and Derivatives Association (ISDA) master agreements with certain counterparties. These agreements contain various provisions, including but not limited to collateral requirements, events of default, or early termination. Termination events applicable to the counterparty include certain deteriorations in the credit quality of the counterparty. Termination events applicable to the Fund include failure of the Fund to maintain certain net asset levels and/or limit the decline in net assets over various periods of time. In the event of default or early termination, the ISDA master agreement gives the non-defaulting party the right to net and close-out all transactions traded, whether or not arising under the ISDA agreement, to one net amount payable by one counterparty to the other. However, absent an event of default or early termination, OTC derivative assets and liabilities are presented gross and not offset in the Statement of Assets and Liabilities. Early termination by the counterparty may result in an immediate payment by the Fund of any net liability owed to that counterparty under the ISDA agreement. At June 30, 2016, the Fund had OTC derivatives in a net liability position of $367,929 and the aggregate value of collateral pledged for such contracts was $189,850.
Collateral requirements differ by type of derivative. Collateral or initial margin requirements are set by the broker or exchange clearing house for exchange traded and centrally cleared derivatives. Initial margin deposited is held at the exchange and can be in the form of cash and/or securities. For OTC derivatives traded under an ISDA master agreement, posting of collateral is required by either the Fund or the applicable
counterparty if the total net exposure of all OTC derivatives with the applicable counterparty exceeds the minimum transfer amount, which typically ranges from $100,000 to $250,000, and can vary depending on the counterparty and the type of the agreement. Generally, collateral is determined at the close of Fund business each day and any additional collateral required due to changes in derivative values may be delivered by the Fund or the counterparty within a few business days. Collateral pledged and/or received by the Fund for OTC derivatives, if any, is held in segregated accounts with the Fund’s custodian/counterparty broker and can be in the form of cash and/or securities. Unrestricted cash may be invested according to the Fund’s investment objectives. To the extent that the amounts due to the Fund from its counterparties are not subject to collateralization or are not fully collateralized, the Fund bears the risk of loss from counterparty non-performance.
At June 30, 2016, the Fund received $315,449 in United Kingdom Treasury Bonds as collateral for derivatives.
The Fund entered into exchange traded futures contracts primarily to manage exposure to certain foreign currencies. A futures contract is an agreement between the Fund and a counterparty to buy or sell an asset for a specified price on a future date. Required initial margins are pledged by the Fund, and the daily change in fair value is accounted for as a variation margin payable or receivable in the Statement of Assets and Liabilities.
The Fund entered into OTC forward exchange contracts primarily to manage exposure to certain foreign currencies. A forward exchange contract is an agreement between the Fund and a counterparty to buy or sell a foreign currency at a specific exchange rate on a future date.
See Note 9 regarding other derivative information.
e. Restricted Cash
At June 30, 2016, the Fund held restricted cash in connection with investments in certain derivative securities. Restricted cash is held in a segregated account with the Fund’s custodian and is reflected in the Statement of Assets and Liabilities.
f. Securities Sold Short
The Fund is engaged in selling securities short, which obligates the Fund to replace a borrowed security with the same security at current fair value. The Fund incurs a loss if the price of the security increases between the date of the short sale and the date
| MS-24 | Semiannual Report |
FRANKLIN TEMPLETON VARIABLE INSURANCE PRODUCTS TRUST
NOTES TO FINANCIAL STATEMENTS (UNAUDITED)
Franklin Mutual Shares VIP Fund (continued)
on which the Fund replaces the borrowed security. The Fund realizes a gain if the price of the security declines between those dates. Gains are limited to the price at which the Fund sold the security short, while losses are potentially unlimited in size.
The Fund is required to establish a margin account with the broker lending the security sold short. While the short sale is outstanding, the broker retains the proceeds of the short sale to the extent necessary to meet margin requirements until the short position is closed out. A deposit must also be maintained with the Fund’s custodian/counterparty broker consisting of cash and/or securities having a value equal to a specified percentage of the value of the securities sold short. The Fund is obligated to pay fees for borrowing the securities sold short and is required to pay the counterparty any dividends and/or interest due on securities sold short. Such dividends and/or interest and any security borrowing fees are recorded as an expense to the Fund.
g. Securities Lending
The Fund participates in an agency based securities lending program to earn additional income. The Fund receives cash collateral against the loaned securities in an amount equal to at least 102% of the fair value of the loaned securities. Collateral is maintained over the life of the loan in an amount not less than 100% of the fair value of loaned securities, as determined at the close of Fund business each day; any additional collateral required due to changes in security values is delivered to the Fund on the next business day. The collateral is deposited into a joint cash account with other funds and is used to invest in a money market fund managed by Franklin Advisers, Inc., an affiliate of the Fund, and/or a joint repurchase agreement. The Fund may receive income from the investment of cash collateral, in addition to lending fees and rebates paid by the borrower. Income from securities loaned, net of fees paid to the securities lending agent and/or third-party vendor, is reported separately in the Statement of Operations. The Fund bears the market risk with respect to the collateral investment, securities loaned, and the risk that the agent may default on its obligations to the Fund. If the borrower defaults on its obligation to return the securities loaned, the Fund has the right to repurchase the securities in the open market using the collateral received. The securities lending agent has agreed to indemnify the Fund in the event of default by a third party borrower. At June 30, 2016, the Fund had no securities on loan.
h. Senior Floating Rate Interests
The Fund invests in senior secured corporate loans that pay interest at rates which are periodically reset by reference to a base lending rate plus a spread. These base lending rates are generally the prime rate offered by a designated U.S. bank or the London InterBank Offered Rate (LIBOR). Senior secured corporate loans often require prepayment of principal from excess cash flows or at the discretion of the borrower. As a result, actual maturity may be substantially less than the stated maturity. Senior secured corporate loans in which the Fund invests are generally readily marketable, but may be subject to certain restrictions on resale.
i. Income and Deferred Taxes
It is the Fund’s policy to qualify as a regulated investment company under the Internal Revenue Code. The Fund intends to distribute to shareholders substantially all of its taxable income and net realized gains to relieve it from federal income and if applicable, excise taxes. As a result, no provision for U.S. federal income taxes is required.
The Fund may be subject to foreign taxation related to income received, capital gains on the sale of securities and certain foreign currency transactions in the foreign jurisdictions in which it invests. Foreign taxes, if any, are recorded based on the tax regulations and rates that exist in the foreign markets in which the Fund invests. When a capital gain tax is determined to apply, the Fund records an estimated deferred tax liability in an amount that would be payable if the securities were disposed of on the valuation date. As a result of several court cases, in certain countries across the European Union, the Fund filed additional tax reclaims for previously withheld taxes on dividends earned in those countries (EU reclaims). These additional filings are subject to various administrative proceedings by the local jurisdictions’ tax authorities within the European Union, as well as a number of related judicial proceedings. Income recognized, if any, for EU reclaims is reflected as other income in the Statement of Operations and any related receivable, if any, is reflected as European Union tax reclaims in the Statement of Assets and Liabilities. When uncertainty exists as to the ultimate resolution of these proceedings, the likelihood of receipt of these EU reclaims, and the potential timing of payment, no amounts are reflected in the financial statements.
The Fund may recognize an income tax liability related to its uncertain tax positions under U.S. GAAP when the uncertain
| Semiannual Report | MS-25 |
FRANKLIN TEMPLETON VARIABLE INSURANCE PRODUCTS TRUST
NOTES TO FINANCIAL STATEMENTS (UNAUDITED)
Franklin Mutual Shares VIP Fund (continued)
1. Organization and Significant Accounting Policies (continued)
i. Income and Deferred Taxes (continued)
tax position has a less than 50% probability that it will be sustained upon examination by the tax authorities based on its technical merits. As of June 30, 2016, the Fund has determined that no tax liability is required in its financial statements related to uncertain tax positions for any open tax years (or expected to be taken in future tax years). Open tax years are those that remain subject to examination and are based on each tax jurisdiction’s statute of limitation.
j. Security Transactions, Investment Income, Expenses and Distributions
Security transactions are accounted for on trade date. Realized gains and losses on security transactions are determined on a specific identification basis. Interest income and estimated expenses are accrued daily. Amortization of premium and accretion of discount on debt securities are included in interest income. Dividend income and dividends declared on securities sold short are recorded on the ex-dividend date except for certain dividends from foreign securities where the dividend rate is not available. In such cases, the dividend is recorded as soon as the information is received by the Fund. Distributions to shareholders are recorded on the ex-dividend date and are determined according to income tax regulations (tax basis). Distributable earnings determined on a tax basis may differ from earnings recorded in accordance with U.S. GAAP. These differences may be permanent or temporary. Permanent differences are reclassified among capital accounts to reflect their tax character. These reclassifications have no impact on net assets or the results of operations. Temporary differences are not reclassified, as they may reverse in subsequent periods.
Common expenses incurred by the Trust are allocated among the Funds based on the ratio of net assets of each Fund to the combined net assets of the Trust. Fund specific expenses are charged directly to the fund that incurred the expense.
Realized and unrealized gains and losses and net investment income, not including class specific expenses, are allocated daily to each class of shares based upon the relative proportion of net assets of each class. Differences in per share distributions, by class, are generally due to differences in class specific expenses.
k. Accounting Estimates
The preparation of financial statements in accordance with U.S. GAAP requires management to make estimates and assumptions that affect the reported amounts of assets and liabilities at the date of the financial statements and the amounts of income and expenses during the reporting period. Actual results could differ from those estimates.
l. Guarantees and Indemnifications
Under the Trust’s organizational documents, its officers and trustees are indemnified by the Trust against certain liabilities arising out of the performance of their duties to the Trust. Additionally, in the normal course of business, the Trust, on behalf of the Fund, enters into contracts with service providers that contain general indemnification clauses. The Trust’s maximum exposure under these arrangements is unknown as this would involve future claims that may be made against the Trust that have not yet occurred. Currently, the Trust expects the risk of loss to be remote.
| MS-26 | Semiannual Report |
FRANKLIN TEMPLETON VARIABLE INSURANCE PRODUCTS TRUST
NOTES TO FINANCIAL STATEMENTS (UNAUDITED)
Franklin Mutual Shares VIP Fund (continued)
2. Shares of Beneficial Interest
At June 30, 2016, there were an unlimited number of shares authorized (without par value). Transactions in the Fund’s shares were as follows:
| Six Months Ended June 30, 2016 | Year Ended December 31, 2015 | |||||||||||||||||||
| Shares | Amount | Shares | Amount | |||||||||||||||||
| Class 1 Shares: | ||||||||||||||||||||
Shares sold | 1,416,640 | $ | 27,184,561 | 5,200,808 | $ | 114,565,674 | ||||||||||||||
Shares issued in reinvestment of distributions | — | — | 3,480,331 | 67,065,978 | ||||||||||||||||
Shares redeemed | (6,268,532 | ) | (113,870,295 | ) | (4,296,684 | ) | (96,310,085 | ) | ||||||||||||
|
| |||||||||||||||||||
Net increase (decrease) | (4,851,892 | ) | $ | (86,685,734 | ) | 4,384,455 | $ | 85,321,567 | ||||||||||||
|
| |||||||||||||||||||
| Class 2 Shares: | ||||||||||||||||||||
Shares sold | 16,366,410 | $ | 322,602,853 | 8,995,477 | $ | 199,602,688 | ||||||||||||||
Shares issued in reinvestment of distributions | — | — | 19,482,232 | 370,357,223 | ||||||||||||||||
Shares redeemed | (16,526,753 | ) | (315,028,939 | ) | (40,426,538 | ) | (884,502,631 | ) | ||||||||||||
|
| |||||||||||||||||||
Net increase (decrease) | (160,343 | ) | $ | 7,573,914 | (11,948,829 | ) | $ | (314,542,720 | ) | |||||||||||
|
| |||||||||||||||||||
| Class 4 Shares: | ||||||||||||||||||||
Shares sold | 121,047 | $ | 2,291,311 | 465,090 | $ | 9,850,242 | ||||||||||||||
Shares issued in reinvestment of distributions | — | — | 732,186 | 14,014,047 | ||||||||||||||||
Shares redeemed | (725,906 | ) | (13,929,039 | ) | (1,372,567 | ) | (30,167,160 | ) | ||||||||||||
|
| |||||||||||||||||||
Net increase (decrease) | (604,859 | ) | $ | (11,637,728 | ) | (175,291 | ) | $ | (6,302,871 | ) | ||||||||||
|
| |||||||||||||||||||
3. Transactions With Affiliates
Franklin Resources, Inc. is the holding company for various subsidiaries that together are referred to as Franklin Templeton Investments. Certain officers and trustees of the Fund are also officers and/or directors of the following subsidiaries:
| Subsidiary | Affiliation | |
Franklin Mutual Advisers, LLC (Franklin Mutual) | Investment manager | |
Franklin Templeton Services, LLC (FT Services) | Administrative manager | |
Franklin Templeton Distributors, Inc. (Distributors) | Principal underwriter | |
Franklin Templeton Investor Services, LLC (Investor Services) | Transfer agent |
a. Management Fees
The Fund pays an investment management fee to Franklin Mutual based on the average daily net assets of the Fund as follows:
| Annualized Fee Rate | Net Assets | |
0.750% | Up to and including $200 million | |
0.735% | Over $200 million, up to and including $700 million | |
0.700% | Over $700 million, up to and including $1.2 billion | |
0.675% | Over $1.2 billion, up to and including $5 billion | |
0.645% | Over $5 billion, up to and including $10 billion | |
0.625% | Over $10 billion, up to and including $15 billion | |
0.605% | Over $15 billion, up to and including $20 billion | |
0.585% | In excess of $20 billion |
| Semiannual Report | MS-27 |
FRANKLIN TEMPLETON VARIABLE INSURANCE PRODUCTS TRUST
NOTES TO FINANCIAL STATEMENTS (UNAUDITED)
Franklin Mutual Shares VIP Fund (continued)
3. Transactions With Affiliates (continued)
a. Management Fees (continued)
For the period ended June 30, 2016, the annualized effective investment management fee rate was 0.689% of the Fund’s average daily net assets.
b. Administrative Fees
Under an agreement with Franklin Mutual, FT Services provides administrative services to the Fund. The fee is paid by Franklin Mutual based on Fund’s average daily net assets, and is not an additional expense of the Fund.
c. Distribution Fees
The Board has adopted distribution plans for Class 2 and Class 4 shares pursuant to Rule 12b-1 under the 1940 Act. Under the Fund’s compensation distribution plans, the Fund pays Distributors for costs incurred in connection with the servicing, sale and distribution of the Fund’s shares up to 0.35% per year of its average daily net assets of each class. The Board has agreed to limit the current rate to 0.25% per year for Class 2. The plan year, for purposes of monitoring compliance with the maximum annual plan rates, is February 1 through January 31.
d. Transfer Agent Fees
Investor Services, under terms of an agreement, performs shareholder servicing for the Fund and is not paid by the Fund for the services.
e. Investments in Affiliated Management Investment Companies
The Fund invests in one or more affiliated management investment companies for purposes other than exercising a controlling influence over the management or policies. Management fees paid by the Fund are waived on assets invested in the affiliated management investment companies, as noted in the Statement of Operations, in an amount not to exceed the management and administrative fees paid directly or indirectly by each affiliate.
| Number of Shares Held at Beginning of Period | Gross Additions | Gross Reductions | Number of Shares Held at End of Period | Value at End of Period | Investment Income | Realized Gain (Loss) | % of Affiliated Fund Shares Outstanding Held at End of Period | |||||||||||||||||||||||||
| Non-Controlled Affiliates | ||||||||||||||||||||||||||||||||
Institutional Fiduciary Trust Money Market Portfolio | — | 50,978,000 | (50,978,000 | ) | — | $ | — | $ | — | $ | — | —% | ||||||||||||||||||||
|
| |||||||||||||||||||||||||||||||
f. Other Affiliated Transactions
At June 30, 2016, Franklin Templeton Variable Insurance Products Trust – Franklin Founding Funds Allocation VIP Fund owned 7.8% of the Fund’s outstanding shares.
4. Expense Offset Arrangement
The Fund has entered into an arrangement with its custodian whereby credits realized as a result of uninvested cash balances are used to reduce a portion of the Fund’s custodian expenses. During the period ended June 30, 2016, the custodian fees were reduced as noted in the Statement of Operations.
| MS-28 | Semiannual Report |
FRANKLIN TEMPLETON VARIABLE INSURANCE PRODUCTS TRUST
NOTES TO FINANCIAL STATEMENTS (UNAUDITED)
Franklin Mutual Shares VIP Fund (continued)
5. Income Taxes
At June 30, 2016, the cost of investments and net unrealized appreciation (depreciation) for income tax purposes were as follows:
Cost of investments | $ | 3,657,681,618 | ||
|
| |||
Unrealized appreciation | $ | 1,018,936,970 | ||
Unrealized depreciation | (482,162,824 | ) | ||
|
| |||
Net unrealized appreciation (depreciation) | $ | 536,774,146 | ||
|
|
Differences between income and/or capital gains as determined on a book basis and a tax basis are primarily due to differing treatments of foreign currency transactions.
6. Investment Transactions
Purchases and sales of investments (excluding short term securities and securities sold short) for the period ended June 30, 2016, aggregated $547,316,857 and $526,557,935, respectively.
7. Credit Risk And Defaulted Securities
The Fund may purchase the pre-default or defaulted debt of distressed companies. Distressed companies are financially troubled and are about to be or are already involved in financial restructuring or bankruptcy. Risks associated with purchasing these securities include the possibility that the bankruptcy or other restructuring process takes longer than expected, or that distributions in restructuring are less than anticipated, either or both of which may result in unfavorable consequences to the Fund. If it becomes probable that the income on debt securities, including those of distressed companies, will not be collected, the Fund discontinues accruing income and recognizes an adjustment for uncollectible interest.
At June 30, 2016, the aggregate long value of distressed company securities for which interest recognition has been discontinued was $72,943,214, representing 1.7% of the Fund’s net assets. For information as to specific securities, see the accompanying Statement of Investments.
8. Restricted Securities
The Fund invests in securities that are restricted under the Securities Act of 1933 (1933 Act) or which are subject to legal, contractual, or other agreed upon restrictions on resale. Restricted securities are often purchased in private placement transactions, and cannot be sold without prior registration unless the sale is pursuant to an exemption under the 1933 Act. Disposal of these securities may require greater effort and expense, and prompt sale at an acceptable price may be difficult. The Fund may have registration rights for restricted securities. The issuer generally incurs all registration costs.
| Semiannual Report | MS-29 |
FRANKLIN TEMPLETON VARIABLE INSURANCE PRODUCTS TRUST
NOTES TO FINANCIAL STATEMENTS (UNAUDITED)
Franklin Mutual Shares VIP Fund (continued)
8. Restricted Securities (continued)
At June 30, 2016, the Fund held investments in restricted securities, excluding certain securities exempt from registration under the 1933 Act deemed to be liquid, as follows:
| Principal Amount/ Shares/ Units | Issuer | Acquisition Dates | Cost | Value | ||||||||||
| 1,754 | Broadband Ventures III LLC, secured promissory note, 5.00%, 2/01/12 | 7/01/10 - 11/30/12 | $ | 1,754 | $ | — | ||||||||
| 6,400,507 | CB FIM Coinvestors LLC | 1/15/09 - 6/02/09 | — | — | ||||||||||
| 8,006,950 | FIM Coinvestor Holdings I, LLC | 11/20/06 - 6/02/09 | — | — | ||||||||||
| 1,730,515 | International Automotive Components Group Brazil LLC | 4/13/06 - 12/26/08 | 1,149,241 | 28,490 | ||||||||||
| 15,382,424 | International Automotive Components Group North America LLC | 1/12/06 - 3/18/13 | 12,591,586 | 6,786,202 | ||||||||||
| 12,324 | Warrior Met Coal LLC, A | 9/19/14 - 12/04/14 | 16,187,328 | 1,242,461 | ||||||||||
| 28,821 | Warrior Met Coal LLC, B | 3/31/16 - 6/23/16 | 2,305,674 | 2,905,629 | ||||||||||
|
| |||||||||||||
Total Restricted Securities (Value is 0.3% of Net Assets) | $ | 32,235,583 | $ | 10,962,782 | ||||||||||
|
| |||||||||||||
9. Other Derivative Information
At June 30, 2016, the Fund’s investments in derivative contracts are reflected in the Statement of Assets and Liabilities as follows:
Asset Derivatives | Liability Derivatives | |||||||||||
| Derivative Contracts Not Accounted for as Hedging Instruments | Statement of Assets and Liabilities Location | Fair Value | Statement of Assets and Liabilities Location | Fair Value | ||||||||
Foreign exchange contracts | Variation margin | $ | 12,555,411 | a | Variation margin | $ | — | |||||
Unrealized appreciation on OTC forward exchange contracts | 14,356,021 | Unrealized depreciation on | $ | 580,203 | ||||||||
|
|
|
| |||||||||
Totals | $ | 26,911,432 | $ | 580,203 | ||||||||
|
|
|
| |||||||||
aThis amount reflects the cumulative appreciation (depreciation) of futures contracts as reported in the Statement of Investments. Only the variation margin receivable/payable at period end is separately reported within the Statement of Assets and Liabilities. Prior variation margin movements were recorded to cash upon receipt or payment.
For the period ended June 30, 2016, the effect of derivative contracts in the Fund’s Statement of Operations was as follows:
| Derivative Contracts Not Accounted for as Hedging Instruments | Statement of Operations Locations | Net Realized Gain (Loss) for the Period | Statement of Operations Locations | Net Change in Unrealized Appreciation (Depreciation) for the Period | ||||||||
Net realized gain (loss) from: | Net change in unrealized appreciation (depreciation) on: | |||||||||||
Foreign exchange contracts | Foreign currency transactions | 1,396,057 | a | Translation of other assets and liabilities denominated in foreign currencies | 8,627,990 | a | ||||||
Futures contracts | 2,138,093 | Futures contracts | 9,293,172 | |||||||||
|
|
|
| |||||||||
Totals | $ | 3,534,150 | $ | 17,921,162 | ||||||||
|
|
|
| |||||||||
aForward exchange contracts are included in net realized gain (loss) from foreign currency transactions and net change in unrealized appreciation (depreciation) on translation of other assets and liabilities denominated in foreign currencies in the Statement of Operations.
| MS-30 | Semiannual Report |
FRANKLIN TEMPLETON VARIABLE INSURANCE PRODUCTS TRUST
NOTES TO FINANCIAL STATEMENTS (UNAUDITED)
Franklin Mutual Shares VIP Fund (continued)
For the period ended June, 30 2016, the average month end fair value of derivatives represented 0.4% of average month end net assets. The average month end number of open derivative contracts for the period was 39.
See Note 1(d) regarding derivative financial instruments.
10. Holdings of 5% Voting Securities of Portfolio Companies
The 1940 Act defines “affiliated companies” to include investments in portfolio companies in which a fund owns 5% or more of the outstanding voting securities. Investments in “affiliated companies” for the Fund for the period ended June 30, 2016, were as shown below.
| Name of Issuer | Number of Shares Held at Beginning of Period | Gross Additions | Gross Reductions | Number of Shares Held at End of Period | Value at End of Period | Investment Income | Realized Gain (Loss) | |||||||||||||||||||||
| Non-Controlled Affiliates | ||||||||||||||||||||||||||||
CB FIM Coinvestors LLC (Value is 0.0% of Net Assets) | 6,400,507 | — | — | 6,400,507 | $ | — | $ | — | $ | — | ||||||||||||||||||
|
| |||||||||||||||||||||||||||
11. Credit Facility
The Fund, together with other U.S. registered and foreign investment funds (collectively, Borrowers), managed by Franklin Templeton Investments, are borrowers in a joint syndicated senior unsecured credit facility totaling $2 billion (Global Credit Facility) which matures on February 10, 2017. This Global Credit Facility provides a source of funds to the Borrowers for temporary and emergency purposes, including the ability to meet future unanticipated or unusually large redemption requests.
Under the terms of the Global Credit Facility, the Fund shall, in addition to interest charged on any borrowings made by the Fund and other costs incurred by the Fund, pay its share of fees and expenses incurred in connection with the implementation and maintenance of the Global Credit Facility, based upon its relative share of the aggregate net assets of all of the Borrowers, including an annual commitment fee of 0.07% based upon the unused portion of the Global Credit Facility. Effective February 12, 2016, the annual commitment fee is 0.15%. These fees are reflected in other expenses in the Statement of Operations. During the period ended June 30, 2016, the Fund did not use the Global Credit Facility.
12. Fair Value Measurements
The Fund follows a fair value hierarchy that distinguishes between market data obtained from independent sources (observable inputs) and the Fund’s own market assumptions (unobservable inputs). These inputs are used in determining the value of the Fund’s financial instruments and are summarized in the following fair value hierarchy:
| • | Level 1 – quoted prices in active markets for identical financial instruments |
| • | Level 2 – other significant observable inputs (including quoted prices for similar financial instruments, interest rates, prepayment speed, credit risk, etc.) |
| • | Level 3 – significant unobservable inputs (including the Fund’s own assumptions in determining the fair value of financial instruments) |
The input levels are not necessarily an indication of the risk or liquidity associated with financial instruments at that level.
For movements between the levels within the fair value hierarchy, the Fund has adopted a policy of recognizing the transfers as of the date of the underlying event which caused the movement.
| Semiannual Report | MS-31 |
FRANKLIN TEMPLETON VARIABLE INSURANCE PRODUCTS TRUST
NOTES TO FINANCIAL STATEMENTS (UNAUDITED)
Franklin Mutual Shares VIP Fund (continued)
12. Fair Value Measurements (continued)
A summary of inputs used as of June 30, 2016, in valuing the Fund’s assets and liabilities carried at fair value, is as follows:
| Level 1 | Level 2 | Level 3 | Total | |||||||||||||
| Assets: | ||||||||||||||||
Investments in Securities: | ||||||||||||||||
Equity Investments:a | ||||||||||||||||
Auto Components | $ | — | $ | — | $ | 6,814,692 | $ | 6,814,692 | ||||||||
Machinery | 63,323,047 | 13,268,780 | — | 76,591,827 | ||||||||||||
Oil, Gas & Consumable Fuels | 271,349,984 | — | 4,148,090 | 275,498,074 | ||||||||||||
All other Equity Investmentsb | 3,277,808,771 | — | — | c | 3,277,808,771 | |||||||||||
Corporate Bonds, Notes and Senior Floating Rate Interests | — | 187,506,708 | — | 187,506,708 | ||||||||||||
Corporate Bonds, Notes and Senior Floating Rate Interests in Reorganization | — | 72,943,214 | — | c | 72,943,214 | |||||||||||
Companies in Liquidation | 61,495 | 4,521,392 | — | c | 4,582,887 | |||||||||||
Municipal Bonds | — | 13,648,519 | — | 13,648,519 | ||||||||||||
Short Term Investments | 259,061,072 | 20,000,000 | — | 279,061,072 | ||||||||||||
|
| |||||||||||||||
Total Investments in Securities | $ | 3,871,604,369 | $ | 311,888,613 | $ | 10,962,782 | $ | 4,194,455,764 | ||||||||
|
| |||||||||||||||
Other Financial Instruments: | ||||||||||||||||
Futures Contracts | $ | 12,555,411 | $ | — | $ | — | $ | 12,555,411 | ||||||||
Forward Exchange Contracts | — | 14,356,021 | — | 14,356,021 | ||||||||||||
|
| |||||||||||||||
Total Other Financial Instruments | $ | 12,555,411 | $ | 14,356,021 | $ | — | $ | 26,911,432 | ||||||||
|
| |||||||||||||||
| Liabilities: | ||||||||||||||||
Other Financial Instruments: | ||||||||||||||||
Securities Sold Short | $ | 22,174,574 | $ | — | $ | — | $ | 22,174,574 | ||||||||
Forward Exchange Contracts | — | 580,203 | — | 580,203 | ||||||||||||
|
| |||||||||||||||
Total Other Financial Instruments | $ | 22,174,574 | $ | 580,203 | $ | — | $ | 22,754,777 | ||||||||
|
| |||||||||||||||
aIncludes common stocks as well as other equity investments.
bFor detailed categories, see the accompanying Statement of Investments.
cIncludes securities determined to have no value at June 30, 2016.
A reconciliation of assets in which Level 3 inputs are used in determining fair value is presented when there are significant Level 3 financial instruments at the end of the period.
13. Subsequent Events
The Fund has evaluated subsequent events through the issuance of the financial statements and determined that no events have occurred that require disclosure.
Abbreviations
| Counterparty | Currency | Selected Portfolio | ||||||||
| BOFA | Bank of America Corp. | CAD | Canadian Dollar | ADR | American Depositary Receipt | |||||
| BONY | Bank of New York Mellon | EUR | Euro | FHLB | Federal Home Loan Bank | |||||
| FBCO | Credit Suisse Group AG | GBP | British Pound | GO | General Obligation | |||||
| HSBC | HSBC Bank USA, N.A. | PIK | Payment-In-Kind | |||||||
| SSBT | State Street Bank and Trust Co., N.A. | |||||||||
BOFA | Bank of America Corp. | |||||||||
| MS-32 | Semiannual Report |
Franklin Rising Dividends VIP Fund
We are pleased to bring you Franklin Rising Dividends VIP Fund’s semiannual report for the period ended June 30, 2016.
Class 4 Performance Summary as of June 30, 2016
The Fund’s Class 4 shares delivered a +9.90% total return* for the six-month period ended June 30, 2016.
*The Fund has a fee waiver associated with any investment in a Franklin Templeton money fund and/or Franklin Templeton fund, as applicable, contractually guaranteed through at least the Fund’s current fiscal year-end. Fund investment results reflect the fee waiver, to the extent applicable; without this reduction, the results would have been lower.
Performance reflects the Fund’s Class 4 operating expenses, but does not include any contract fees, expenses or sales charges. If they had been included, performance would be lower. These charges and deductions, particularly for variable life policies, can have a significant effect on contract values and insurance benefits. See the contract prospectus for a complete description of these expenses, including sales charges.
Performance data represent past performance, which does not guarantee future results. Investment return and principal value will fluctuate, and you may have a gain or loss when you sell your shares. Current performance may differ from figures shown.
| Semiannual Report | FRD-1 |
FRANKLIN RISING DIVIDENDS VIP FUND
Fund Goal and Main Investments
The Fund seeks long-term capital appreciation, with preservation of capital as an important consideration. Under normal market conditions, the Fund invests at least 80% of its net assets in equity securities of financially sound companies that have paid consistently rising dividends.
Fund Risks
All investments involve risks, including possible loss of principal. Value securities may not increase in price as anticipated or may decline further in value. While smaller and midsized companies may offer substantial opportunities for capital growth, they also involve heightened risks and should be considered speculative. Historically, smaller- and midsized-company securities have been more volatile in price than larger company securities, especially over the short term. The Fund is actively managed but there is no guarantee that the manager’s investment decisions will produce the desired results. The Fund’s prospectus also includes a description of the main investment risks.
Performance Overview
You can find the Fund’s six-month total return in the Performance Summary. In comparison, the Standard & Poor’s® 500 Index (S&P 500®) rose +3.84% for the same period.1 Please note the Fund employs a bottom-up stock selection process, and the managers invest in securities without regard to benchmark comparisons.
Economic and Market Overview
For the six-month period ended June 30, 2016, the U.S. economy grew moderately, as measured by gross domestic product in 2016’s first and second quarters, driven by consumer spending and exports. A decline in private inventory investment and nonresidential fixed investment contributed to the moderation. Although the unemployment rate rose from 4.7% in May to 4.9% in June, the increase was due to additional people entering the labor force, and for the entire period under review, unemployment declined slightly.2 Home sales and prices rose amid relatively low mortgage rates. Monthly retail sales grew during most of the review period, and rose to the highest level in April in more than a year, due to a broad-based increase across most retail categories. Inflation, as measured by the
Consumer Price Index, remained subdued overall even though it spiked to the highest level in three years in April mainly due to a rebound in energy prices.
After raising its target range for the federal funds rate to 0.25%–0.50% at its December meeting, the Federal Reserve (Fed) maintained the rate through period-end. Although the Fed indicated a potential interest rate hike in June, subsequent reports showed job additions slowed substantially in May. Consequently, at its June meeting, the Fed kept the federal funds rate unchanged, and indicated that in determining the timing and size of future adjustments to the target range, it will assess realized and expected economic conditions relative to its objectives of maximum employment and 2.00% inflation. The Fed expects economic conditions to evolve in a manner that could warrant only gradual increases in the federal funds rate.
U.S. equity markets rose for the period under review, as investors generally remained confident due to the Fed’s continued caution surrounding further interest rate increases, the European Central Bank expanding its quantitative easing measures and cutting its benchmark interest rate to zero, the People’s Bank of China introducing further easing measures and the Bank of Japan adopting a negative interest rate policy. The rally in crude oil prices near period-end also boosted investor confidence. However, the U.K.’s historic referendum to leave the European Union, also known as the “Brexit”, global economic growth concerns and China’s slowing economy weighed on market sentiment. Despite periods of volatility, the broad U.S. stock market ended the six-month period higher, as measured by the S&P 500.
Investment Strategy
We are a research-driven, fundamental investment adviser, pursuing a disciplined value-oriented strategy. As bottom-up investors concentrating primarily on individual securities, we seek fundamentally sound companies that we believe meet our screening criteria, which include consistent, substantial dividend increases; reinvested earnings; and strong balance sheets. We attempt to acquire such stocks at attractive prices, often when they are out of favor with other investors. In following these criteria, we do not necessarily focus on companies whose securities pay a high dividend but rather on companies that consistently raise their dividends.
1. Source: Morningstar. One cannot invest directly in an index, and an index is not representative of the Fund’s portfolio. Please see Index Descriptions following the Fund Summaries.
2. Source: Bureau of Labor Statistics.
| FRD-2 | Semiannual Report |
FRANKLIN RISING DIVIDENDS VIP FUND
Manager’s Discussion
During the six-month period ended June 30, 2016, some holdings that contributed to absolute performance included Albemarle, Stryker and West Pharmaceutical Services. Shares of Albemarle, a specialty and fine chemicals producer, rebounded strongly over the period, as general economic concerns waned and the company continued to report solid results over the period. Although the company’s 2016 outlook was more cautious than expected, the stock was supported by ongoing strength in a key business and expectations for a significant improvement in free cash flow generation. In addition, Albemarle reported that it had signed a memorandum of understanding with the Chilean government to significantly increase lithium production over a longer timeline. The company has 22 consecutive years of dividend increases. Medical products manufacturer Stryker experienced a share price increase due to strong quarterly results. Revenue growth was solid across all segments. In our analysis, future growth drivers include the rollout of Stryker-branded implants on its robotic surgery platform, greater penetration in Europe and expansion in the trauma, extremities and neurotechnology categories. The company has 23 consecutive years of dividend increases. Shares of West Pharmaceuticals, a manufacturer of packaging components for the pharmaceutical industry, increased due to solid earnings reports. Biotechnology firms have also been embracing the company’s high-value products. Additionally, the new chief executive officer reorganized marketing efforts around customer groups, rather than by product lines, which we believe is a more effective strategy. The company has 23 consecutive years of dividend increases.
Conversely, some holdings that detracted from absolute performance included Roper Technologies, Perrigo and Abbott Laboratories. Roper Technologies, a diversified industrial company, experienced an abrupt decline in share price early in the period, caused by concerns related to the company’s exposure to challenged oil and gas markets, weaker-than-expected quarterly results and broader industrial market weakness. However, management commented that these headwinds are manageable and are expected to be more than offset by strong growth in the majority of the business over the coming year. The company has 23 consecutive years of dividend increases. Shares of Perrigo, a specialty pharmaceuticals manufacturer, fell due to news of the departure of its chief executive officer and a concurrent reduction in guidance. Margins for the company’s prescriptions segment were hurt by an unusual spike in approvals for competitor drugs. We believe margins will likely recover as Perrigo’s own drugs gain approval and with new management’s focus on improving operational
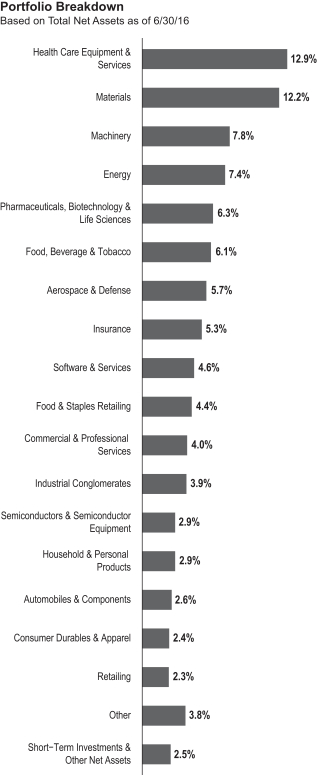
| Semiannual Report | FRD-3 |
FRANKLIN RISING DIVIDENDS VIP FUND
efficiency at its recently acquired, underperforming European subsidiary. The company has 14 consecutive years of dividend increases. Abbott, a diversified healthcare products company, experienced a share price decline partially due to the announcement that it would acquire St. Jude Medical, a cardiovascular devices manufacturer. We believe investors may have regarded the deal as diluting Abbott’s growth rate and emerging markets focus. However, in our view, management’s track record suggests a strong likelihood of delivering on promised synergies. The acquisition also expanded Abbott’s product base, which we believe may position it well in an environment where its hospital clients are consolidating their purchasing power. The company has 44 consecutive years of dividend increases.
During the period, the Fund did not initiate any new positions. However, we added to several holdings including Microsoft, a software and hardware services provider (11 years of consecutive dividend increases); the aforementioned Perrigo; and General Dynamics, an aerospace and defense company (19 years). Positions we exited included Knowles, which we received as a spinoff from Dover; California Resources, which we received as a spinoff from Occidental Petroleum; and Teleflex. We also reduced several holdings including the aforementioned West Pharmaceutical, Wal-Mart and Johnson & Johnson.
Our 10 largest positions on June 30, 2016, represented 30.9% of the Fund’s total net assets. It is interesting to note how these 10 companies would respond to the Fund’s screening criteria based on a simple average of statistical measures. On average, these 10 companies have raised their dividends 30 years in a row and by 341% over the past 10 years. Their most recent year-over-year dividend increases averaged 9.4% with a yield of 2.0% on June 30, 2016, and a dividend payout ratio of 38.4%, based on estimates of calendar year 2016 operating earnings. The average price/earnings ratio was 19.7 times calendar year 2016 estimates versus 17.8 for that of the unmanaged S&P 500.
Top 10 Holdings | ||||
| 6/30/16 | ||||
| Company Sector/Industry | % of Total Net Assets | |||
| Praxair Inc. Materials | 3.3% | |||
| Roper Technologies Inc. Industrial Conglomerates | 3.3% | |||
| Microsoft Corp. Software & Services | 3.3% | |||
| Albemarle Corp. Materials | 3.3% | |||
| Dover Corp. Machinery | 3.1% | |||
| Medtronic PLC Health Care Equipment & Services | 3.1% | |||
| Air Products and Chemicals Inc. Materials | 3.0% | |||
| Stryker Corp. Health Care Equipment & Services | 2.9% | |||
| Becton, Dickinson and Co. Health Care Equipment & Services | 2.9% | |||
| United Technologies Corp. Aerospace & Defense | 2.7% | |||
Thank you for your participation in Franklin Rising Dividends VIP Fund. We look forward to serving your future investment needs.
The foregoing information reflects our analysis, opinions and portfolio holdings as of June 30, 2016, the end of the reporting period. The way we implement our main investment strategies and the resulting portfolio holdings may change depending on factors such as market and economic conditions. These opinions may not be relied upon as investment advice or an offer for a particular security. The information is not a complete analysis of every aspect of any market, country, industry, security or the Fund. Statements of fact are from sources considered reliable, but the investment manager makes no representation or warranty as to their completeness or accuracy. Although historical performance is no guarantee of future results, these insights may help you understand our investment management philosophy.
| FRD-4 | Semiannual Report |
FRANKLIN RISING DIVIDENDS VIP FUND
Class 4 Fund Expenses
As an investor in a variable insurance contract (Contract) that indirectly provides for investment in an underlying mutual fund, you can incur transaction and/or ongoing expenses at both the Fund level and the Contract level.
| • | Transaction expenses can include sales charges (loads) on purchases, surrender fees, transfer fees and premium taxes. |
| • | Ongoing expenses can include management fees, distribution and service (12b-1) fees, contract fees, annual maintenance fees, mortality and expense risk fees and other fees and expenses. All mutual funds and Contracts have some types of ongoing expenses. |
The expenses shown in the table are meant to highlight ongoing expenses at the Fund level only and do not include ongoing expenses at the Contract level, or transaction expenses at either the Fund or Contract levels. While the Fund does not have transaction expenses, if the transaction and ongoing expenses at the Contract level were included, the expenses shown below would be higher. You should consult your Contract prospectus or disclosure document for more information.
The table shows Fund-level ongoing expenses and can help you understand these expenses and compare them with those of other mutual funds offered through the Contract. The table assumes a $1,000 investment held for the six months indicated. Please refer to the Fund prospectus for additional information on operating expenses.
Actual Fund Expenses
The first line (Actual) of the table provides actual account values and expenses. The “Ending Account Value” is derived from the Fund’s actual return, which includes the effect of ongoing Fund expenses, but does not include the effect of ongoing Contract expenses.
You can estimate the Fund-level expenses you incurred during the period by following these steps. Of course, your account value and expenses will differ from those in this illustration:
| 1. | Divide your account value by $1,000. |
If an account had an $8,600 value, then $8,600 ÷ $1,000 = 8.6.
| 2. | Multiply the result by the number under the heading “Fund-Level Expenses Incurred During Period.” |
If Fund-Level Expenses Incurred During Period were $7.50, then 8.6 × $7.50 = $64.50.
In this illustration, the estimated expenses incurred this period at the Fund level are $64.50.
Hypothetical Example for Comparison with Other Mutual Funds
Information in the second line (Hypothetical) of the table can help you compare ongoing expenses of the Fund with those of other mutual funds offered through the Contract. This information may not be used to estimate the actual ending account balance or expenses you incurred during the period. The hypothetical “Ending Account Value” is based on the Fund’s actual expense ratio and an assumed 5% annual rate of return before expenses, which does not represent the Fund’s actual return. The figure under the heading “Fund-Level Expenses Incurred During Period” shows the hypothetical expenses your account would have incurred under this scenario. You can compare this figure with the 5% hypothetical examples that appear in shareholder reports of other funds offered through a Contract.
| Class 4 | Beginning Account Value 1/1/16 | Ending Account Value 6/30/16 | Fund-Level Expenses 1/1/16–6/30/16 | |||||||||
Actual | $ | 1,000 | $ | 1,099.00 | $ | 5.11 | ||||||
Hypothetical (5% return before expenses) | $ | 1,000 | $ | 1,019.99 | $ | 4.92 | ||||||
*Expenses are calculated using the most recent six-month annualized expense ratio, net of expenses waivers, for the Fund’s Class 4 shares (0.98%), which does not include any ongoing expenses of the Contract for which the Fund is an investment option, multiplied by the average account value over the period, multiplied by 182/366 to reflect the one-half year period.
| Semiannual Report | FRD-5 |
FRANKLIN TEMPLETON VARIABLE INSURANCE PRODUCTS TRUST
Financial Highlights
Franklin Rising Dividends VIP Fund
Six Months Ended (unaudited) | Year Ended December 31, | |||||||||||||||||||||||
| 2015 | 2014 | 2013 | 2012 | 2011 | ||||||||||||||||||||
| Class 1 | ||||||||||||||||||||||||
| Per share operating performance (for a share outstanding throughout the period) | ||||||||||||||||||||||||
Net asset value, beginning of period | $25.26 | $29.63 | $28.14 | $22.03 | $20.01 | $19.15 | ||||||||||||||||||
|
| |||||||||||||||||||||||
| Income from investment operationsa: | ||||||||||||||||||||||||
Net investment incomeb | 0.22 | 0.45 | 0.45 | 0.40 | 0.41 | 0.36 | ||||||||||||||||||
Net realized and unrealized gains (losses) | 2.28 | (1.33 | ) | 2.03 | 6.16 | 2.00 | 0.83 | |||||||||||||||||
|
| |||||||||||||||||||||||
Total from investment operations | 2.50 | (0.88 | ) | 2.48 | 6.56 | 2.41 | 1.19 | |||||||||||||||||
|
| |||||||||||||||||||||||
| Less distributions from: | ||||||||||||||||||||||||
Net investment income | (0.44 | ) | (0.48 | ) | (0.44 | ) | (0.45 | ) | (0.39 | ) | (0.33 | ) | ||||||||||||
Net realized gains | (3.18 | ) | (3.01 | ) | (0.55 | ) | — | — | — | |||||||||||||||
|
| |||||||||||||||||||||||
Total distributions | (3.62 | ) | (3.49 | ) | (0.99 | ) | (0.45 | ) | (0.39 | ) | (0.33 | ) | ||||||||||||
|
| |||||||||||||||||||||||
Net asset value, end of period | $24.14 | $25.26 | $29.63 | $28.14 | $22.03 | $20.01 | ||||||||||||||||||
|
| |||||||||||||||||||||||
Total returnc | 10.08% | (3.42)% | 9.01% | 30.05% | 12.18% | 6.29% | ||||||||||||||||||
| Ratios to average net assetsd | ||||||||||||||||||||||||
Expenses before waiver and payments by affiliates | 0.64% | 0.63% | 0.62% | 0.61% | 0.63% | 0.63% | ||||||||||||||||||
Expenses net of waiver and payments by affiliates | 0.63% | 0.63% | e | 0.62% | e | 0.61% | 0.63% | 0.63% | ||||||||||||||||
Net investment income | 1.67% | 1.65% | 1.58% | 1.59% | 1.96% | 1.87% | ||||||||||||||||||
| Supplemental data | ||||||||||||||||||||||||
Net assets, end of period (000’s) | $173,216 | $143,376 | $160,480 | $168,380 | $141,455 | $140,297 | ||||||||||||||||||
Portfolio turnover rate | 3.71% | 4.74% | 8.61% | 0.07% | 11.19% | 12.76% | ||||||||||||||||||
aThe amount shown for a share outstanding throughout the period may not correlate with the Statement of Operations for the period due to the timing of sales and repurchases of the Fund’s shares in relation to income earned and/or fluctuating fair value of the investments of the Fund.
bBased on average daily shares outstanding.
cTotal return does not include fees, charges or expenses imposed by the variable annuity and life insurance contracts for which Franklin Templeton Variable Insurance Products Trust serves as an underlying investment vehicle. Total return is not annualized for periods less than one year.
dRatios are annualized for periods less than one year.
eBenefit of waiver and payments by affiliates rounds to less than 0.01%.
| FRD-6 | Semiannual Report | The accompanying notes are an integral part of these financial statements. |
FRANKLIN TEMPLETON VARIABLE INSURANCE PRODUCTS TRUST
FINANCIAL HIGHLIGHTS
Franklin Rising Dividends VIP Fund (continued)
Six Months Ended June 30, 2016 (unaudited) | Year Ended December 31, | |||||||||||||||||||||||
| 2015 | 2014 | 2013 | 2012 | 2011 | ||||||||||||||||||||
| Class 2 | ||||||||||||||||||||||||
Per share operating performance (for a share outstanding throughout the period) | ||||||||||||||||||||||||
Net asset value, beginning of period | $24.72 | $29.06 | $27.62 | $21.64 | $19.65 | $18.82 | ||||||||||||||||||
|
| |||||||||||||||||||||||
| Income from investment operationsa: | ||||||||||||||||||||||||
Net investment incomeb | 0.18 | 0.37 | 0.37 | 0.33 | 0.35 | 0.31 | ||||||||||||||||||
Net realized and unrealized gains (losses) | 2.23 | (1.29 | ) | 1.99 | 6.04 | 1.98 | 0.81 | |||||||||||||||||
|
| |||||||||||||||||||||||
Total from investment operations | 2.41 | (0.92 | ) | 2.36 | 6.37 | 2.33 | 1.12 | |||||||||||||||||
|
| |||||||||||||||||||||||
| Less distributions from: | ||||||||||||||||||||||||
Net investment income | (0.37 | ) | (0.41 | ) | (0.37 | ) | (0.39 | ) | (0.34 | ) | (0.29 | ) | ||||||||||||
Net realized gains | (3.18 | ) | (3.01 | ) | (0.55 | ) | — | — | — | |||||||||||||||
|
| |||||||||||||||||||||||
Total distributions | (3.55 | ) | (3.42 | ) | (0.92 | ) | (0.39 | ) | (0.34 | ) | (0.29 | ) | ||||||||||||
|
| |||||||||||||||||||||||
Net asset value, end of period | $23.58 | $24.72 | $29.06 | $27.62 | $21.64 | $19.65 | ||||||||||||||||||
|
| |||||||||||||||||||||||
Total returnc | 9.93% | (3.65)% | 8.72% | 29.69% | 11.96% | 6.00% | ||||||||||||||||||
| Ratios to average net assetsd | ||||||||||||||||||||||||
Expenses before waiver and payments by affiliates | 0.89% | 0.88% | 0.87% | 0.86% | 0.88% | 0.88% | ||||||||||||||||||
Expenses net of waiver and payments by affiliates | 0.88% | 0.88% | e | 0.87% | e | 0.86% | 0.88% | 0.88% | ||||||||||||||||
Net investment income | 1.42% | 1.40% | 1.33% | 1.34% | 1.71% | 1.62% | ||||||||||||||||||
| Supplemental data | ||||||||||||||||||||||||
Net assets, end of period (000’s) | $1,513,384 | $1,310,783 | $1,667,816 | $1,752,012 | $1,550,084 | $1,523,396 | ||||||||||||||||||
Portfolio turnover rate | 3.71% | 4.74% | 8.61% | 0.07% | 11.19% | 12.76% | ||||||||||||||||||
aThe amount shown for a share outstanding throughout the period may not correlate with the Statement of Operations for the period due to the timing of sales and repurchases of the Fund’s shares in relation to income earned and/or fluctuating fair value of the investments of the Fund.
bBased on average daily shares outstanding.
cTotal return does not include fees, charges or expenses imposed by the variable annuity and life insurance contracts for which Franklin Templeton Variable Insurance Products Trust serves as an underlying investment vehicle. Total return is not annualized for periods less than one year.
dRatios are annualized for periods less than one year.
eBenefit of waiver and payments by affiliates rounds to less than 0.01%.
| The accompanying notes are an integral part of these financial statements. | Semiannual Report | FRD-7 |
FRANKLIN TEMPLETON VARIABLE INSURANCE PRODUCTS TRUST
FINANCIAL HIGHLIGHTS
Franklin Rising Dividends VIP Fund (continued)
Six Months Ended (unaudited) | Year Ended December 31, | |||||||||||||||||||||||
| 2015 | 2014 | 2013 | 2012 | 2011 | ||||||||||||||||||||
| Class 4 | ||||||||||||||||||||||||
| Per share operating performance (for a share outstanding throughout the period) | ||||||||||||||||||||||||
Net asset value, beginning of period | $24.81 | $29.19 | $27.76 | $21.78 | $19.83 | $19.04 | ||||||||||||||||||
|
| |||||||||||||||||||||||
| Income from investment operationsa: | ||||||||||||||||||||||||
Net investment incomeb | 0.16 | 0.35 | 0.35 | 0.32 | 0.35 | 0.31 | ||||||||||||||||||
Net realized and unrealized gains (losses) | 2.25 | (1.31 | ) | 2.00 | 6.07 | 1.96 | 0.80 | |||||||||||||||||
|
| |||||||||||||||||||||||
Total from investment operations | 2.41 | (0.96 | ) | 2.35 | 6.39 | 2.31 | 1.11 | |||||||||||||||||
|
| |||||||||||||||||||||||
| Less distributions from: | ||||||||||||||||||||||||
Net investment income | (0.36 | ) | (0.41 | ) | (0.37 | ) | (0.41 | ) | (0.36 | ) | (0.32 | ) | ||||||||||||
Net realized gains | (3.18 | ) | (3.01 | ) | (0.55 | ) | — | — | — | |||||||||||||||
|
| |||||||||||||||||||||||
Total distributions | (3.54 | ) | (3.42 | ) | (0.92 | ) | (0.41 | ) | (0.36 | ) | (0.32 | ) | ||||||||||||
|
| |||||||||||||||||||||||
Net asset value, end of period | $23.68 | $24.81 | $29.19 | $27.76 | $21.78 | $19.83 | ||||||||||||||||||
|
| |||||||||||||||||||||||
Total returnc | 9.90% | (3.75)% | 8.62% | 29.57% | 11.78% | 5.89% | ||||||||||||||||||
| Ratios to average net assetsd | ||||||||||||||||||||||||
Expenses before waiver and payments by affiliates | 0.99% | 0.98% | 0.97% | 0.96% | 0.98% | 0.98% | ||||||||||||||||||
Expenses net of waiver and payments by affiliates | 0.98% | 0.98% | e | 0.97% | e | 0.96% | 0.98% | 0.98% | ||||||||||||||||
Net investment income | 1.32% | 1.30% | 1.23% | 1.24% | 1.61% | 1.52% | ||||||||||||||||||
| Supplemental data | ||||||||||||||||||||||||
Net assets, end of period (000’s) | $24,216 | $20,453 | $15,503 | $12,028 | $6,432 | $3,020 | ||||||||||||||||||
Portfolio turnover rate | 3.71% | 4.74% | 8.61% | 0.07% | 11.19% | 12.76% | ||||||||||||||||||
aThe amount shown for a share outstanding throughout the period may not correlate with the Statement of Operations for the period due to the timing of sales and repurchases of the Fund’s shares in relation to income earned and/or fluctuating fair value of the investments of the Fund.
bBased on average daily shares outstanding.
cTotal return does not include fees, charges or expenses imposed by the variable annuity and life insurance contracts for which Franklin Templeton Variable Insurance Products Trust serves as an underlying investment vehicle. Total return is not annualized for periods less than one year.
dRatios are annualized for periods less than one year.
eBenefit of waiver and payments by affiliates rounds to less than 0.01%.
| FRD-8 | Semiannual Report | The accompanying notes are an integral part of these financial statements. |
FRANKLIN TEMPLETON VARIABLE INSURANCE PRODUCTS TRUST
Statement of Investments, June 30, 2016 (unaudited)
Franklin Rising Dividends VIP Fund
| ||||||||||
| Shares | Value | |||||||||
Common Stocks 97.5% | ||||||||||
Aerospace & Defense 5.7% | ||||||||||
General Dynamics Corp. | 157,911 | $ | 21,987,528 | |||||||
Honeywell International Inc. | 251,900 | 29,301,008 | ||||||||
United Technologies Corp. | 453,011 | 46,456,278 | ||||||||
|
| |||||||||
| 97,744,814 | ||||||||||
|
| |||||||||
Automobiles & Components 2.6% | ||||||||||
Johnson Controls Inc. | 1,015,500 | 44,946,030 | ||||||||
|
| |||||||||
Commercial & Professional Services 4.0% | ||||||||||
ABM Industries Inc. | 779,288 | 28,428,426 | ||||||||
Brady Corp., A | 204,079 | 6,236,654 | ||||||||
Cintas Corp. | 194,675 | 19,103,458 | ||||||||
Matthews International Corp., A | 251,442 | 13,990,233 | ||||||||
|
| |||||||||
| 67,758,771 | ||||||||||
|
| |||||||||
Consumer Durables & Apparel 2.4% | ||||||||||
Leggett & Platt Inc. | 332,800 | 17,009,408 | ||||||||
NIKE Inc., B | 445,100 | 24,569,520 | ||||||||
|
| |||||||||
| 41,578,928 | ||||||||||
|
| |||||||||
Consumer Services 1.8% | ||||||||||
McDonald’s Corp. | 207,045 | 24,915,795 | ||||||||
Yum! Brands Inc. | 72,900 | 6,044,868 | ||||||||
|
| |||||||||
| 30,960,663 | ||||||||||
|
| |||||||||
Diversified Financials 0.3% | ||||||||||
State Street Corp. | 110,500 | 5,958,160 | ||||||||
|
| |||||||||
Energy 7.4% | ||||||||||
Chevron Corp. | 290,700 | 30,474,081 | ||||||||
EOG Resources Inc. | 33,600 | 2,802,912 | ||||||||
Exxon Mobil Corp. | 358,500 | 33,605,790 | ||||||||
Occidental Petroleum Corp. | 370,790 | 28,016,892 | ||||||||
Schlumberger Ltd. | 398,000 | 31,473,840 | ||||||||
|
| |||||||||
| 126,373,515 | ||||||||||
| �� |
|
| ||||||||
Food & Staples Retailing 4.4% | ||||||||||
CVS Health Corp. | 203,000 | 19,435,220 | ||||||||
Wal-Mart Stores Inc. | 381,800 | 27,879,036 | ||||||||
Walgreens Boots Alliance Inc. | 326,000 | 27,146,020 | ||||||||
|
| |||||||||
| 74,460,276 | ||||||||||
|
| |||||||||
Food, Beverage & Tobacco 6.1% | ||||||||||
Archer-Daniels-Midland Co. | 713,000 | 30,580,570 | ||||||||
Bunge Ltd. | 307,700 | 18,200,455 | ||||||||
McCormick & Co. Inc. | 208,900 | 22,283,363 | ||||||||
PepsiCo Inc. | 308,500 | 32,682,490 | ||||||||
|
| |||||||||
| 103,746,878 | ||||||||||
|
| |||||||||
Health Care Equipment & Services 12.9% | ||||||||||
Abbott Laboratories | 641,800 | 25,229,158 | ||||||||
Becton, Dickinson and Co. | 295,400 | 50,096,886 | ||||||||
DENTSPLY SIRONA Inc. | 4,000 | 248,160 | ||||||||
Medtronic PLC | 602,000 | 52,235,540 | ||||||||
Stryker Corp. | 420,200 | 50,352,566 | ||||||||
| Semiannual Report | FRD-9 |
FRANKLIN TEMPLETON VARIABLE INSURANCE PRODUCTS TRUST
STATEMENT OF INVESTMENTS (UNAUDITED)
Franklin Rising Dividends VIP Fund (continued)
| Shares | Value | |||||||||
Common Stocks (continued) | ||||||||||
Health Care Equipment & Services (continued) | ||||||||||
West Pharmaceutical Services Inc. | 567,318 | $ | 43,048,090 | |||||||
|
| |||||||||
| 221,210,400 | ||||||||||
|
| |||||||||
Household & Personal Products 2.9% | ||||||||||
Colgate-Palmolive Co. | 191,000 | 13,981,200 | ||||||||
The Procter & Gamble Co. | 415,300 | 35,163,451 | ||||||||
|
| |||||||||
| 49,144,651 | ||||||||||
|
| |||||||||
Industrial Conglomerates 3.9% | ||||||||||
Carlisle Cos. Inc. | 101,061 | 10,680,127 | ||||||||
Roper Technologies Inc. | 333,043 | 56,803,814 | ||||||||
|
| |||||||||
| 67,483,941 | ||||||||||
|
| |||||||||
Insurance 5.3% | ||||||||||
Aflac Inc. | 276,200 | 19,930,592 | ||||||||
Arthur J. Gallagher & Co. | 660,000 | 31,416,000 | ||||||||
Erie Indemnity Co., A | 277,385 | 27,555,426 | ||||||||
Old Republic International Corp. | 449,208 | 8,665,222 | ||||||||
RLI Corp. | 41,300 | 2,840,614 | ||||||||
|
| |||||||||
| 90,407,854 | ||||||||||
|
| |||||||||
Machinery 7.8% | ||||||||||
Donaldson Co. Inc. | 350,068 | 12,028,337 | ||||||||
Dover Corp. | 771,976 | 53,513,376 | ||||||||
Hillenbrand Inc. | 888,300 | 26,684,532 | ||||||||
Pentair PLC (United Kingdom) | 704,800 | 41,082,792 | ||||||||
|
| |||||||||
| 133,309,037 | ||||||||||
|
| |||||||||
Materials 12.2% | ||||||||||
Air Products and Chemicals Inc. | 364,000 | 51,702,560 | ||||||||
Albemarle Corp. | 706,700 | 56,048,377 | ||||||||
Bemis Co. Inc. | 147,499 | 7,594,723 | ||||||||
Ecolab Inc. | 115,600 | 13,710,160 | ||||||||
Nucor Corp. | 447,055 | 22,088,988 | ||||||||
Praxair Inc. | 506,460 | 56,921,039 | ||||||||
|
| |||||||||
| 208,065,847 | ||||||||||
|
| |||||||||
Media 0.9% | ||||||||||
John Wiley & Sons Inc., A | 310,700 | 16,212,326 | ||||||||
|
| |||||||||
Pharmaceuticals, Biotechnology & Life Sciences 6.3% | ||||||||||
AbbVie Inc. | 300,800 | 18,622,528 | ||||||||
Johnson & Johnson | 381,800 | 46,312,340 | ||||||||
Perrigo Co. PLC | 208,500 | 18,904,695 | ||||||||
Pfizer Inc. | 669,700 | 23,580,137 | ||||||||
Roche Holding AG, ADR (Switzerland) | 25,000 | 823,750 | ||||||||
|
| |||||||||
| 108,243,450 | ||||||||||
|
| |||||||||
Retailing 2.3% | ||||||||||
The Gap Inc. | 556,300 | 11,804,686 | ||||||||
Ross Stores Inc. | 174,300 | 9,881,067 | ||||||||
Target Corp. | 100,800 | 7,037,856 | ||||||||
Tiffany & Co. | 161,500 | 9,793,360 | ||||||||
|
| |||||||||
| 38,516,969 | ||||||||||
|
| |||||||||
| FRD-10 | Semiannual Report |
FRANKLIN TEMPLETON VARIABLE INSURANCE PRODUCTS TRUST
STATEMENT OF INVESTMENTS (UNAUDITED)
Franklin Rising Dividends VIP Fund (continued)
| Shares | Value | |||||||||
Common Stocks (continued) | ||||||||||
Semiconductors & Semiconductor Equipment 2.9% | ||||||||||
Linear Technology Corp. | 375,000 | $ | 17,448,750 | |||||||
QUALCOMM Inc. | 210,300 | 11,265,771 | ||||||||
Texas Instruments Inc. | 347,200 | 21,752,080 | ||||||||
|
| |||||||||
| 50,466,601 | ||||||||||
|
| |||||||||
Software & Services 4.6% | ||||||||||
Accenture PLC, A | 202,000 | 22,884,580 | ||||||||
Microsoft Corp. | 1,107,900 | 56,691,243 | ||||||||
|
| |||||||||
| 79,575,823 | ||||||||||
|
| |||||||||
Trading Companies & Distributors 0.4% | ||||||||||
W.W. Grainger Inc. | 28,100 | 6,385,725 | ||||||||
|
| |||||||||
Transportation 0.4% | ||||||||||
United Parcel Service Inc., B | 55,900 | 6,021,548 | ||||||||
|
| |||||||||
Total Common Stocks (Cost $997,198,060) | 1,668,572,207 | |||||||||
|
| |||||||||
Short Term Investments (Cost $42,377,646) 2.5% | ||||||||||
Money Market Funds 2.5% | ||||||||||
| a,b | Institutional Fiduciary Trust Money Market Portfolio | 42,377,646 | 42,377,646 | |||||||
|
| |||||||||
Total Investments (Cost $1,039,575,706) 100.0% | 1,710,949,853 | |||||||||
Other Assets, less Liabilities (0.0)%† | (133,591 | ) | ||||||||
|
| |||||||||
Net Assets 100.0% | $ | 1,710,816,262 | ||||||||
|
| |||||||||
See Abbreviations on page FRD-20.
†Rounds to less than 0.1% of net assets.
aNon-income producing.
bSee Note 3(e) regarding investments in affiliated management investment companies.
| The accompanying notes are an integral part of these financial statements. | Semiannual Report | FRD-11 |
FRANKLIN TEMPLETON VARIABLE INSURANCE PRODUCTS TRUST
Financial Statements
Statement of Assets and Liabilities
June 30, 2016 (unaudited)
| Franklin Rising Dividends VIP Fund | ||||
Assets: | ||||
Investments in securities: | ||||
Cost - Unaffiliated issuers | $ | 997,198,060 | ||
Cost - Non-controlled affiliates (Note 3e) | 42,377,646 | |||
|
| |||
Total cost of investments | $ | 1,039,575,706 | ||
|
| |||
Value - Unaffiliated issuers | $ | 1,668,572,207 | ||
Value - Non-controlled affiliates (Note 3e) | 42,377,646 | |||
|
| |||
Total value of investments | 1,710,949,853 | |||
Receivables: | ||||
Capital shares sold | 727,638 | |||
Dividends | 2,080,600 | |||
Other assets | 662 | |||
|
| |||
Total assets | 1,713,758,753 | |||
|
| |||
Liabilities: | ||||
Payables: | ||||
Capital shares redeemed | 1,322,632 | |||
Management fees | 834,652 | |||
Distribution fees | 632,986 | |||
Accrued expenses and other liabilities | 152,221 | |||
|
| |||
Total liabilities | 2,942,491 | |||
|
| |||
Net assets, at value | $ | 1,710,816,262 | ||
|
| |||
Net assets consist of: | ||||
Paid-in capital | $ | 999,791,522 | ||
Undistributed net investment income | 11,352,134 | |||
Net unrealized appreciation (depreciation) | 671,374,147 | |||
Accumulated net realized gain (loss) | 28,298,459 | |||
|
| |||
Net assets, at value | $ | 1,710,816,262 | ||
|
| |||
| Class 1: | ||||
Net assets, at value | $ | 173,215,641 | ||
|
| |||
Shares outstanding | 7,176,527 | |||
|
| |||
Net asset value and maximum offering price per share | $ | 24.14 | ||
|
| |||
| Class 2: | ||||
Net assets, at value | $ | 1,513,384,354 | ||
|
| |||
Shares outstanding | 64,177,767 | |||
|
| |||
Net asset value and maximum offering price per share | $ | 23.58 | ||
|
| |||
| Class 4: | ||||
Net assets, at value | $ | 24,216,267 | ||
|
| |||
Shares outstanding | 1,022,765 | |||
|
| |||
Net asset value and maximum offering price per share | $ | 23.68 | ||
|
| |||
| FRD-12 | Semiannual Report | The accompanying notes are an integral part of these financial statements. |
FRANKLIN TEMPLETON VARIABLE INSURANCE PRODUCTS TRUST
FINANCIAL STATEMENTS
Statement of Operations
for the six months ended June 30, 2016 (unaudited)
| Franklin Rising Dividends VIP Fund | ||||
Investment income: | ||||
Dividends | $ | 17,805,404 | ||
|
| |||
Expenses: | ||||
Management fees (Note 3a) | 4,796,393 | |||
Distribution fees: (Note 3c) | ||||
Class 2 | 1,710,039 | |||
Class 4 | 36,700 | |||
Custodian fees (Note 4) | 6,285 | |||
Reports to shareholders | 95,519 | |||
Professional fees | 26,737 | |||
Trustees’ fees and expenses | 3,792 | |||
Other | 14,814 | |||
|
| |||
Total expenses | 6,690,279 | |||
Expenses waived/paid by affiliates (Note 3e) | (68,753 | ) | ||
|
| |||
Net expenses | 6,621,526 | |||
|
| |||
Net investment income | 11,183,878 | |||
|
| |||
Realized and unrealized gains (losses): | ||||
Net realized gain (loss) from: | ||||
Investments | 28,396,610 | |||
Foreign currency transactions | (295 | ) | ||
|
| |||
Net realized gain (loss) | 28,396,315 | |||
|
| |||
Net change in unrealized appreciation (depreciation) on investments | 111,088,473 | |||
|
| |||
Net realized and unrealized gain (loss) | 139,484,788 | |||
|
| |||
Net increase (decrease) in net assets resulting from operations | $ | 150,668,666 | ||
|
| |||
| The accompanying notes are an integral part of these financial statements. | Semiannual Report | FRD-13 |
FRANKLIN TEMPLETON VARIABLE INSURANCE PRODUCTS TRUST
FINANCIAL STATEMENTS
Statements of Changes in Net Assets
| Franklin Rising Dividends VIP Fund | ||||||||
| Six Months Ended June 30, 2016 (unaudited) | Year Ended December 31, 2015 | |||||||
Increase (decrease) in net assets: | ||||||||
Operations: | ||||||||
Net investment income | $ | 11,183,878 | $ | 23,865,895 | ||||
Net realized gain (loss) | 28,396,315 | 200,231,316 | ||||||
Net change in unrealized appreciation (depreciation) | 111,088,473 | (288,246,073 | ) | |||||
|
| |||||||
Net increase (decrease) in net assets resulting from operations | 150,668,666 | (64,148,862 | ) | |||||
|
| |||||||
Distributions to shareholders from: | ||||||||
Net investment income: | ||||||||
Class 1 | (2,718,521 | ) | (2,507,451 | ) | ||||
Class 2 | (20,665,957 | ) | (22,189,853 | ) | ||||
Class 4 | (304,600 | ) | (275,517 | ) | ||||
Net realized gains: | ||||||||
Class 1 | (19,761,965 | ) | (15,606,236 | ) | ||||
Class 2 | (177,746,238 | ) | (164,222,373 | ) | ||||
Class 4 | (2,696,441 | ) | (2,002,122 | ) | ||||
|
| |||||||
Total distributions to shareholders | (223,893,722 | ) | (206,803,552 | ) | ||||
|
| |||||||
Capital share transactions: (Note 2) | ||||||||
Class 1 | 35,543,569 | 6,114,953 | ||||||
Class 2 | 269,153,106 | (112,317,852 | ) | |||||
Class 4 | 4,732,993 | 7,967,834 | ||||||
|
| |||||||
Total capital share transactions | 309,429,668 | (98,235,065 | ) | |||||
|
| |||||||
Net increase (decrease) in net assets | 236,204,612 | (369,187,479 | ) | |||||
Net assets: | ||||||||
Beginning of period | 1,474,611,650 | 1,843,799,129 | ||||||
|
| |||||||
End of period | $ | 1,710,816,262 | $ | 1,474,611,650 | ||||
|
| |||||||
Undistributed net investment income included in net assets: | ||||||||
End of period | $ | 11,352,134 | $ | 23,857,334 | ||||
|
| |||||||
| FRD-14 | Semiannual Report | The accompanying notes are an integral part of these financial statements. |
FRANKLIN TEMPLETON VARIABLE INSURANCE PRODUCTS TRUST
Notes to Financial Statements (unaudited)
Franklin Rising Dividends VIP Fund
1. Organization and Significant Accounting Policies
Franklin Templeton Variable Insurance Products Trust (Trust) is registered under the Investment Company Act of 1940 (1940 Act) as an open-end management investment company, consisting of nineteen separate funds and applies the specialized accounting and reporting guidance in U.S. Generally Accepted Accounting Principles (U.S. GAAP). Franklin Rising Dividends VIP Fund (Fund) is included in this report. The financial statements of the remaining funds in the Trust are presented separately. Shares of the Fund are generally sold only to insurance company separate accounts to fund the benefits of variable life insurance policies or variable annuity contracts. The Fund offers three classes of shares: Class 1, Class 2 and Class 4. Each class of shares differs by its distribution fees, voting rights on matters affecting a single class and its exchange privilege.
The following summarizes the Fund’s significant accounting policies.
a. Financial Instrument Valuation
The Fund’s investments in financial instruments are carried at fair value daily. Fair value is the price that would be received to sell an asset or paid to transfer a liability in an orderly transaction between market participants on the measurement date. The Fund calculates the net asset value (NAV) per share as of 4 p.m. Eastern time each day the New York Stock Exchange (NYSE) is open for trading. Under compliance policies and procedures approved by the Trust’s Board of Trustees (the Board), the Fund’s administrator has responsibility for oversight of valuation, including leading the cross-functional Valuation Committee (VC). The VC provides administration and oversight of the Fund’s valuation policies and procedures, which are approved annually by the Board. Among other things, these procedures allow the Fund to utilize independent pricing services, quotations from securities and financial instrument dealers, and other market sources to determine fair value.
Equity securities listed on an exchange or on the NASDAQ National Market System are valued at the last quoted sale price or the official closing price of the day, respectively. Foreign equity securities are valued as of the close of trading on the foreign stock exchange on which the security is primarily traded or as of 4 p.m. Eastern time whichever is earlier. The value is then converted into its U.S. dollar equivalent at the foreign exchange rate in effect at 4 p.m. Eastern time on the day that the value of the security is determined. Over-the-counter (OTC)
securities are valued within the range of the most recent quoted bid and ask prices. Securities that trade in multiple markets or on multiple exchanges are valued according to the broadest and most representative market. Certain equity securities are valued based upon fundamental characteristics or relationships to similar securities.
Investments in open-end mutual funds are valued at the closing NAV.
The Fund has procedures to determine the fair value of financial instruments for which market prices are not reliable or readily available. Under these procedures, the VC convenes on a regular basis to review such financial instruments and considers a number of factors, including significant unobservable valuation inputs, when arriving at fair value. The VC primarily employs a market-based approach which may use related or comparable assets or liabilities, recent transactions, market multiples, book values, and other relevant information for the investment to determine the fair value of the investment. An income-based valuation approach may also be used in which the anticipated future cash flows of the investment are discounted to calculate fair value. Discounts may also be applied due to the nature or duration of any restrictions on the disposition of the investments. Due to the inherent uncertainty of valuations of such investments, the fair values may differ significantly from the values that would have been used had an active market existed. The VC employs various methods for calibrating these valuation approaches including a regular review of key inputs and assumptions, transactional back-testing or disposition analysis, and reviews of any related market activity.
Trading in securities on foreign securities stock exchanges and OTC markets may be completed before 4 p.m. Eastern time. In addition, trading in certain foreign markets may not take place on every NYSE business day. Occasionally, events occur between the time at which trading in a foreign security is completed and the close of the NYSE that might call into question the reliability of the value of a portfolio security held by the Fund. As a result, differences may arise between the value of the Fund’s portfolio securities as determined at the foreign market close and the latest indications of value at the close of the NYSE. In order to minimize the potential for these differences, the VC monitors price movements following the close of trading in foreign stock markets through a series of country specific market proxies (such as baskets of American Depositary Receipts, futures contracts and exchange traded funds).
| Semiannual Report | FRD-15 |
FRANKLIN TEMPLETON VARIABLE INSURANCE PRODUCTS TRUST
NOTES TO FINANCIAL STATEMENTS (UNAUDITED)
Franklin Rising Dividends VIP Fund (continued)
1. Organization and Significant Accounting Policies (continued)
a. Financial Instrument Valuation (continued)
These price movements are measured against established trigger thresholds for each specific market proxy to assist in determining if an event has occurred that may call into question the reliability of the values of the foreign securities held by the Fund. If such an event occurs, the securities may be valued using fair value procedures, which may include the use of independent pricing services.
When the last day of the reporting period is a non-business day, certain foreign markets may be open on those days that the NYSE is closed, which could result in differences between the value of the Fund’s portfolio securities on the last business day and the last calendar day of the reporting period. Any significant security valuation changes due to an open foreign market are adjusted and reflected by the Fund for financial reporting purposes.
b. Foreign Currency Translation
Portfolio securities and other assets and liabilities denominated in foreign currencies are translated into U.S. dollars based on the exchange rate of such currencies against U.S. dollars on the date of valuation. The Fund may enter into foreign currency exchange contracts to facilitate transactions denominated in a foreign currency. Purchases and sales of securities, income and expense items denominated in foreign currencies are translated into U.S. dollars at the exchange rate in effect on the transaction date. Portfolio securities and assets and liabilities denominated in foreign currencies contain risks that those currencies will decline in value relative to the U.S. dollar. Occasionally, events may impact the availability or reliability of foreign exchange rates used to convert the U.S. dollar equivalent value. If such an event occurs, the foreign exchange rate will be valued at fair value using procedures established and approved by the Board.
The Fund does not separately report the effect of changes in foreign exchange rates from changes in market prices on securities held. Such changes are included in net realized and unrealized gain or loss from investments in the Statement of Operations.
Realized foreign exchange gains or losses arise from sales of foreign currencies, currency gains or losses realized between the trade and settlement dates on securities transactions and the
difference between the recorded amounts of dividends, interest, and foreign withholding taxes and the U.S. dollar equivalent of the amounts actually received or paid. Net unrealized foreign exchange gains and losses arise from changes in foreign exchange rates on foreign denominated assets and liabilities other than investments in securities held at the end of the reporting period.
c. Income and Deferred Taxes
It is the Fund’s policy to qualify as a regulated investment company under the Internal Revenue Code. The Fund intends to distribute to shareholders substantially all of its taxable income and net realized gains to relieve it from federal income and if applicable, excise taxes. As a result, no provision for U.S. federal income taxes is required.
The Fund may be subject to foreign taxation related to income received, capital gains on the sale of securities and certain foreign currency transactions in the foreign jurisdictions in which it invests. Foreign taxes, if any, are recorded based on the tax regulations and rates that exist in the foreign markets in which the Fund invests. When a capital gain tax is determined to apply, the Fund records an estimated deferred tax liability in an amount that would be payable if the securities were disposed of on the valuation date.
The Fund may recognize an income tax liability related to its uncertain tax positions under U.S. GAAP when the uncertain tax position has a less than 50% probability that it will be sustained upon examination by the tax authorities based on its technical merits. As of June 30, 2016, the Fund has determined that no tax liability is required in its financial statements related to uncertain tax positions for any open tax years (or expected to be taken in future tax years). Open tax years are those that remain subject to examination and are based on each tax jurisdiction’s statute of limitation.
d. Security Transactions, Investment Income, Expenses and Distributions
Security transactions are accounted for on trade date. Realized gains and losses on security transactions are determined on a specific identification basis. Estimated expenses are accrued daily. Dividend income is recorded on the ex-dividend date except for certain dividends from foreign securities where the dividend rate is not available. In such cases, the dividend is recorded as soon as the information is received by the Fund.
| FRD-16 | Semiannual Report |
FRANKLIN TEMPLETON VARIABLE INSURANCE PRODUCTS TRUST
NOTES TO FINANCIAL STATEMENTS (UNAUDITED)
Franklin Rising Dividends VIP Fund (continued)
Distributions to shareholders are recorded on the ex-dividend date and are determined according to income tax regulations (tax basis). Distributable earnings determined on a tax basis may differ from earnings recorded in accordance with U.S. GAAP. These differences may be permanent or temporary. Permanent differences are reclassified among capital accounts to reflect their tax character. These reclassifications have no impact on net assets or the results of operations. Temporary differences are not reclassified, as they may reverse in subsequent periods.
Common expenses incurred by the Trust are allocated among the Funds based on the ratio of net assets of each Fund to the combined net assets of the Trust. Fund specific expenses are charged directly to the fund that incurred the expense.
Realized and unrealized gains and losses and net investment income, not including class specific expenses, are allocated daily to each class of shares based upon the relative proportion of net assets of each class. Differences in per share distributions, by class, are generally due to differences in class specific expenses.
e. Accounting Estimates
The preparation of financial statements in accordance with U.S. GAAP requires management to make estimates and assumptions that affect the reported amounts of assets and liabilities at the date of the financial statements and the amounts of income and expenses during the reporting period. Actual results could differ from those estimates.
f. Guarantees and Indemnifications
Under the Trust’s organizational documents, its officers and trustees are indemnified by the Trust against certain liabilities arising out of the performance of their duties to the Trust. Additionally, in the normal course of business, the Trust, on behalf of the Fund, enters into contracts with service providers that contain general indemnification clauses. The Trust’s maximum exposure under these arrangements is unknown as this would involve future claims that may be made against the Trust that have not yet occurred. Currently, the Trust expects the risk of loss to be remote.
2. Shares of Beneficial Interest
At June 30, 2016, there were an unlimited number of shares authorized (without par value). Transactions in the Fund’s shares were as follows:
| Six Months Ended June 30, 2016 | Year Ended December 31, 2015 | |||||||||||||||||
| Shares | Amount | Shares | Amount | |||||||||||||||
| Class 1 Shares: | ||||||||||||||||||
Shares sold | 1,036,049 | $ | 25,362,123 | 379,085 | $ | 9,885,431 | ||||||||||||
Shares issued in reinvestment of distributions | 944,162 | 22,480,486 | 689,257 | 18,113,687 | ||||||||||||||
Shares redeemed | (480,135 | ) | (12,299,040 | ) | (808,697 | ) | (21,884,165 | ) | ||||||||||
|
| |||||||||||||||||
Net increase (decrease) | 1,500,076 | $ | 35,543,569 | 259,645 | $ | 6,114,953 | ||||||||||||
|
| |||||||||||||||||
| Class 2 Shares: | ||||||||||||||||||
Shares sold | 7,138,983 | $ | 182,931,863 | 4,959,597 | $ | 130,929,237 | ||||||||||||
Shares issued in reinvestment of distributions | 8,526,523 | 198,412,195 | 7,239,310 | 186,412,226 | ||||||||||||||
Shares redeemed | (4,512,098 | ) | (112,190,952 | ) | (16,563,559 | ) | (429,659,315 | ) | ||||||||||
|
| |||||||||||||||||
Net increase (decrease) | 11,153,408 | $ | 269,153,106 | (4,364,652 | ) | $ | (112,317,852 | ) | ||||||||||
|
| |||||||||||||||||
| Class 4 Shares: | ||||||||||||||||||
Shares sold | 160,992 | $ | 4,041,048 | 322,291 | $ | 8,758,972 | ||||||||||||
Shares issued in reinvestment of distributions | 128,469 | 3,001,041 | 88,076 | 2,277,639 | ||||||||||||||
Shares redeemed | (91,042 | ) | (2,309,096 | ) | (117,097 | ) | (3,068,777 | ) | ||||||||||
|
| |||||||||||||||||
Net increase (decrease) | 198,419 | $ | 4,732,993 | 293,270 | $ | 7,967,834 | ||||||||||||
|
| |||||||||||||||||
| Semiannual Report | FRD-17 |
FRANKLIN TEMPLETON VARIABLE INSURANCE PRODUCTS TRUST
NOTES TO FINANCIAL STATEMENTS (UNAUDITED)
Franklin Rising Dividends VIP Fund (continued)
3. Transactions With Affiliates
Franklin Resources, Inc. is the holding company for various subsidiaries that together are referred to as Franklin Templeton Investments. Certain officers and trustees of the Fund are also officers and/or directors of the following subsidiaries:
| Subsidiary | Affiliation | |
Franklin Advisory Services, LLC (Advisory Services) | Investment manager | |
Franklin Templeton Services, LLC (FT Services) | Administrative manager | |
Franklin Templeton Distributors, Inc. (Distributors) | Principal underwriter | |
Franklin Templeton Investor Services, LLC (Investor Services) | Transfer agent |
a. Management Fees
The Fund pays an investment management fee to Advisory Services based on the average daily net assets of the Fund as follows:
| Annualized Fee Rate | Net Assets | |
0.750% | Up to and including $500 million | |
0.625% | Over $500 million, up to and including $1 billion | |
0.500% | In excess of $1 billion |
For the period ended June 30, 2016, the annualized effective investment management fee rate was 0.620% of the Fund’s average daily net assets.
b. Administrative Fees
Under an agreement with Advisory Services, FT Services provides administrative services to the Fund. The fee is paid by Advisory Services based on the Fund’s average daily net assets, and is not an additional expense of the Fund.
c. Distribution Fees
The Board has adopted distribution plans for Class 2 and Class 4 shares pursuant to Rule 12b-1 under the 1940 Act. Under the Fund’s compensation distribution plans, the Fund pays Distributors for costs incurred in connection with the servicing, sale and distribution of the Fund’s shares up to 0.35% per year of its average daily net assets of each class. The Board has agreed to limit the current rate to 0.25% per year for Class 2. The plan year, for purposes of monitoring compliance with the maximum annual plan rates, is February 1 through January 31.
d. Transfer Agent Fees
Investor Services, under terms of an agreement, performs shareholder servicing for the Fund and is not paid by the Fund for the services.
e. Investments in Affiliated Management Investment Companies
The Fund invests in one or more affiliated management investment companies for purposes other than exercising a controlling influence over the management or policies. Management fees paid by the Fund are waived on assets invested in the affiliated management investment companies, as noted in the Statement of Operations, in an amount not to exceed the management and administrative fees paid directly or indirectly by each affiliate. Prior to January 1, 2014, the waiver was accounted for as a reduction to management fees.
| FRD-18 | Semiannual Report |
FRANKLIN TEMPLETON VARIABLE INSURANCE PRODUCTS TRUST
NOTES TO FINANCIAL STATEMENTS (UNAUDITED)
Franklin Rising Dividends VIP Fund (continued)
| Number of Shares Held at Beginning of Period | Gross Additions | Gross Reductions | Number Held at | Value at End of Period | Investment Income | Realized Gain (Loss) | % of Affiliated Fund Shares Outstanding Held at End of Period | |||||||||||||||||||||||||
| Non-Controlled Affiliates | ||||||||||||||||||||||||||||||||
Institutional Fiduciary Trust Money Market Portfolio | 292,061 | 171,295,976 | (129,210,391 | ) | 42,377,646 | $ | 42,377,646 | $ | — | $ | — | 0.2% | ||||||||||||||||||||
|
| |||||||||||||||||||||||||||||||
4. Expense Offset Arrangement
The Fund has entered into an arrangement with its custodian whereby credits realized as a result of uninvested cash balances are used to reduce a portion of the Fund’s custodian expenses. During the period ended June 30, 2016, there were no credits earned.
5. Income Taxes
At June 30, 2016, the cost of investments and net unrealized appreciation (depreciation) for income tax purposes were as follows:
Cost of investments | $ | 1,039,627,088 | ||
|
| |||
Unrealized appreciation | $ | 703,297,133 | ||
Unrealized depreciation | (31,974,368 | ) | ||
|
| |||
Net unrealized appreciation (depreciation) | $ | 671,322,765 | ||
|
|
Differences between income and/or capital gains as determined on a book basis and a tax basis are primarily due to differing treatment of wash sales.
6. Investment Transactions
Purchases and sales of investments (excluding short term securities) for the period ended June 30, 2016, aggregated $135,059,575 and $56,433,669, respectively.
7. Credit Facility
The Fund, together with other U.S. registered and foreign investment funds (collectively, Borrowers), managed by Franklin Templeton Investments, are borrowers in a joint syndicated senior unsecured credit facility totaling $2 billion (Global Credit Facility) which matures on February 10, 2017. This Global Credit Facility provides a source of funds to the Borrowers for temporary and emergency purposes, including the ability to meet future unanticipated or unusually large redemption requests.
Under the terms of the Global Credit Facility, the Fund shall, in addition to interest charged on any borrowings made by the Fund and other costs incurred by the Fund, pay its share of fees and expenses incurred in connection with the implementation and maintenance of the Global Credit Facility, based upon its relative share of the aggregate net assets of all of the Borrowers, including an annual commitment fee of 0.07% based upon the unused portion of the Global Credit Facility. Effective February 12, 2016, the annual commitment fee is 0.15%. These fees are reflected in other expenses in the Statement of Operations. During the period ended June 30, 2016, the Fund did not use the Global Credit Facility.
| Semiannual Report | FRD-19 |
FRANKLIN TEMPLETON VARIABLE INSURANCE PRODUCTS TRUST
NOTES TO FINANCIAL STATEMENTS (UNAUDITED)
Franklin Rising Dividends VIP Fund (continued)
8. Fair Value Measurements
The Fund follows a fair value hierarchy that distinguishes between market data obtained from independent sources (observable inputs) and the Fund’s own market assumptions (unobservable inputs). These inputs are used in determining the value of the Fund’s financial instruments and are summarized in the following fair value hierarchy:
| • | Level 1 – quoted prices in active markets for identical financial instruments |
| • | Level 2 – other significant observable inputs (including quoted prices for similar financial instruments, interest rates, prepayment speed, credit risk, etc.) |
| • | Level 3 – significant unobservable inputs (including the Fund’s own assumptions in determining the fair value of financial instruments) |
The input levels are not necessarily an indication of the risk or liquidity associated with financial instruments at that level.
For movements between the levels within the fair value hierarchy, the Fund has adopted a policy of recognizing the transfers as of the date of the underlying event which caused the movement.
At June 30, 2016, all of the Fund’s investments in financial instruments carried at fair value were valued using Level 1 inputs. For detailed categories, see the accompanying Statement of Investments.
9. Subsequent Events
The Fund has evaluated subsequent events through the issuance of the financial statements and determined that no events have occurred that require disclosure.
Abbreviations
| Selected Portfolio | ||
| ADR | American Depositary Receipt | |
| FRD-20 | Semiannual Report |
Franklin Small Cap Value VIP Fund
We are pleased to bring you Franklin Small Cap Value VIP Fund’s semiannual report for the period ended June 30, 2016.
Class 4 Performance Summary as of June 30, 2016
The Fund’s Class 4 shares delivered a +11.20% total return* for the six-month period ended June 30, 2016.
*The Fund has a fee waiver associated with any investment in a Franklin Templeton money fund and/or Franklin Templeton fund, as applicable, contractually guaranteed through at least the Fund’s current fiscal year-end. Fund investment results reflect the fee waiver, to the extent applicable; without this reduction, the results would have been lower.
Performance reflects the Fund’s Class 4 operating expenses, but does not include any contract fees, expenses or sales charges. If they had been included, performance would be lower. These charges and deductions, particularly for variable life policies, can have a significant effect on contract values and insurance benefits. See the contract prospectus for a complete description of these expenses, including sales charges.
Performance data represent past performance, which does not guarantee future results. Investment return and principal value will fluctuate, and you may have a gain or loss when you sell your shares. Current performance may differ from figures shown.
| Semiannual Report | FSV-1 |
FRANKLIN SMALL CAP VALUE VIP FUND
Fund Goal and Main Investments
The Fund seeks long-term total return. Under normal market conditions, the Fund invests at least 80% of its net assets in investments of small capitalization companies. For this Fund, small capitalization companies are those with market capitalizations under $3.5 billion at the time of purchase. The Fund generally invests in equity securities of companies that the manager believes are undervalued and have the potential for capital appreciation.
Fund Risks
All investments involve risks, including possible loss of principal. The Fund’s investments in smaller company stocks carry special risks as such stocks have historically exhibited greater price volatility than large-company stocks, particularly over the short term. Additionally, smaller companies often have relatively small revenues, limited product lines and a small market share. In addition, the Fund may invest up to 25% of its total assets in foreign securities, which involve special risks, including currency fluctuations and economic and political uncertainty. The Fund also may invest in equity real estate investment trusts (REITs). The Fund is actively managed but there is no guarantee that the manager’s investment decisions will produce the desired results. The Fund’s prospectus also includes a description of the main investment risks.
Performance Overview
You can find the Fund’s six-month total return in the Performance Summary. For comparison, the Fund’s benchmark, the Russell 2500TM Value Index, posted a +7.84% total return for the same period.1 Please note the Fund employs a bottom-up stock selection process, and the managers invest in securities without regard to benchmark comparisons.
Economic and Market Overview
For the six-month period ended June 30, 2016, the U.S. economy grew moderately, as measured by gross domestic product in 2016’s first and second quarters, driven by consumer spending and exports. A decline in private inventory investment and nonresidential fixed investment contributed to the moderation. Although the unemployment rate rose from 4.7% in May to 4.9% in June, the increase was due to additional people entering the labor force, and for the entire period under review,
unemployment declined slightly.2 Home sales and prices rose amid relatively low mortgage rates. Monthly retail sales grew during most of the review period, and rose to the highest level in April in more than a year, due to a broad-based increase across most retail categories. Inflation, as measured by the Consumer Price Index, remained subdued overall even though it spiked to the highest level in three years in April mainly due to a rebound in energy prices.
After raising its target range for the federal funds rate to 0.25%–0.50% at its December meeting, the Federal Reserve (Fed) maintained the rate through period-end. Although the Fed indicated a potential interest rate hike in June, subsequent reports showed job additions slowed substantially in May. Consequently, at its June meeting, the Fed kept the federal funds rate unchanged, and indicated that in determining the timing and size of future adjustments to the target range, it will assess realized and expected economic conditions relative to its objectives of maximum employment and 2.00% inflation. The Fed expects economic conditions to evolve in a manner that could warrant only gradual increases in the federal funds rate.
U.S. equity markets rose for the period under review, as investors generally remained confident due to the Fed’s continued caution surrounding further interest rate increases, the European Central Bank expanding its quantitative easing measures and cutting its benchmark interest rate to zero, the People’s Bank of China introducing further easing measures and the Bank of Japan adopting a negative interest rate policy. The rally in crude oil prices near period-end also boosted investor confidence. However, the U.K.’s historic referendum to leave the European Union (also known as the “Brexit”), global economic growth concerns and China’s slowing economy weighed on market sentiment. Despite periods of volatility, the broad U.S. stock market ended the six-month period higher, as measured by the Standard & Poor’s® 500 Index.3
Investment Strategy
We generally invest in stocks that we believe are undervalued and have the potential for capital appreciation. We consider a stock price a “value” when it trades at less than the price at which we believe it would trade if the market reflected all factors relating to the company’s worth. Accordingly, we invest in companies that we believe have, for example, stock prices that are low relative to current or historical or future earnings, book
1. Source: Morningstar. One cannot invest directly in an index, and an index is not representative of the Fund’s portfolio. Please see Index Descriptions following the Fund Summaries.
2. Source: Bureau of Labor Statistics.
3. Please see Index Descriptions following the Fund Summaries.
| FSV-2 | Semiannual Report |
FRANKLIN SMALL CAP VALUE VIP FUND
value, cash flow or sales; recent sharp price declines but the potential for good long-term earnings prospects; and valuable intangibles not reflected in the stock price. Companies in which we may invest include those that may be considered out of favor, such as companies attempting to recover from bankruptcy, business setbacks, adverse events or cyclical downturns, or that may be considered potential takeover targets.
Manager’s Discussion
For the six-month period ended June 30, 2016, some contributors to absolute Fund performance included Axiall (sold by period-end), Universal Forest Products and Astec Industries. Axiall, a chemical and building products manufacturer, was the subject of an all cash takeover offer by Westlake Chemical at a premium to Axiall’s then share price. Universal Forest Products, a building and construction infrastructure products manufacturer and distributor, finished with a strong year of sales and earnings growth due to continued unit growth in its retail, industrial and construction end markets and well received new product introductions. Astec Industries, a leading manufacturer of road paving and construction related equipment, benefited from optimism related to additional funding directed to federal transportation spending, strong sales of its recently developed line of wood pellet making equipment and increased profitability due to better product mix and increased overhead absorption.
Detractors from absolute Fund performance included AAR, Bristow Group (sold by period-end) and Invacare. Shares of AAR, a provider of aerospace maintenance, repair and supply chain products and services to commercial and government customers, benefited from strong commercial demand due to growth in air travel. In addition, lower fuel prices are incentivizing airlines to increase utilization of older aircraft, which should result in demand for maintenance services. However, these positive developments were offset by continued uncertainty regarding the company’s military airlift business due to reduced activity in the Middle East and pricing pressure due to a global surplus of helicopters. Bristow Group, a provider of helicopter transportation services to the offshore oil and gas industry, along with search and rescue operations to government entities, reported weak earnings and cut its dividend as weak energy prices and pricing pressures caused by a global surplus of helicopters affected both revenues and profitability. Invacare, a medical equipment manufacturer and distributor, saw its share price negatively impacted by the issuance of a convertible bond, a competitive pricing
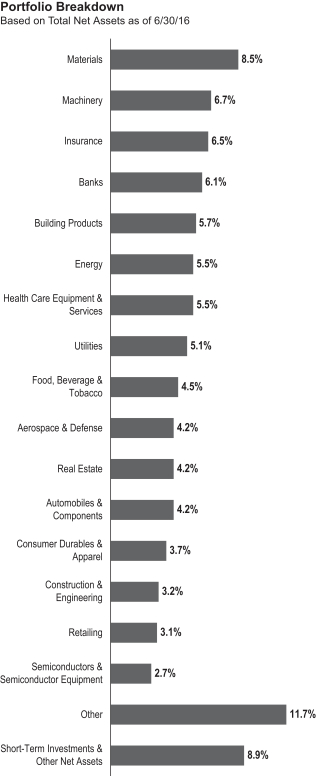
| Semiannual Report | FSV-3 |
FRANKLIN SMALL CAP VALUE VIP FUND
| Top 10 Holdings | ||||
| 6/30/16 | ||||
| Company Sector/Industry | % of Total Net Assets | |||
Maple Leaf Foods Inc. (Canada) Food, Beverage & Tobacco | 2.8% | |||
LTC Properties Inc. Real Estate | 2.7% | |||
IDACORP Inc. Utilities | 2.6% | |||
Spire Inc. Utilities | 2.4% | |||
Astec Industries Inc. Machinery | 2.4% | |||
Sensient Technologies Corp. Materials | 2.4% | |||
Drew Industries Inc. Automobiles & Components | 2.2% | |||
Universal Forest Products Inc. Building Products | 2.1% | |||
AAR Corp. Aerospace & Defense | 2.1% | |||
Carlisle Cos. Inc. Industrial Conglomerates | 2.0% | |||
The dollar value, number of shares or principal amount, and names of all portfolio holdings are listed in the Fund’s Statement of Investments.
environment and ongoing expenses related to U.S. Food and Drug Administration compliance issues at one of its plants.
During the period, we initiated several positions including Cubic, a transit and defense systems provider; Spirit Airlines, an airline operator; and Brinker International, a restaurant operator. The Fund also added to holdings including Lakeland Financial, a bank; Esterline Technologies, a specialized manufacturing company serving the aerospace and defense markets; and Brandywine Realty, a real estate investment trust; among several others. Conversely, we exited some positions including the aforementioned Axiall, StanCorp Financial and Ingram Micro. We reduced our positions in Regal Beloit, La-Z-Boy and Teleflex, among others.
Thank you for your continued participation in Franklin Small Cap Value VIP Fund. We look forward to serving your future investment needs.
The foregoing information reflects our analysis, opinions and portfolio holdings as of June 30, 2016, the end of the reporting period. The way we implement our main investment strategies and the resulting portfolio holdings may change depending on factors such as market and economic conditions. These opinions may not be relied upon as investment advice or an offer for a particular security. The information is not a complete analysis of every aspect of any market, country, industry, security or the Fund. Statements of fact are from sources considered reliable, but the investment manager makes no representation or warranty as to their completeness or accuracy. Although historical performance is no guarantee of future results, these insights may help you understand our investment management philosophy.
| FSV-4 | Semiannual Report |
FRANKLIN SMALL CAP VALUE VIP FUND
Class 4 Fund Expenses
As an investor in a variable insurance contract (Contract) that indirectly provides for investment in an underlying mutual fund, you can incur transaction and/or ongoing expenses at both the Fund level and the Contract level.
| • | Transaction expenses can include sales charges (loads) on purchases, surrender fees, transfer fees and premium taxes. |
| • | Ongoing expenses can include management fees, distribution and service (12b-1) fees, contract fees, annual maintenance fees, mortality and expense risk fees and other fees and expenses. All mutual funds and Contracts have some types of ongoing expenses. |
The expenses shown in the table are meant to highlight ongoing expenses at the Fund level only and do not include ongoing expenses at the Contract level, or transaction expenses at either the Fund or Contract levels. While the Fund does not have transaction expenses, if the transaction and ongoing expenses at the Contract level were included, the expenses shown below would be higher. You should consult your Contract prospectus or disclosure document for more information.
The table shows Fund-level ongoing expenses and can help you understand these expenses and compare them with those of other mutual funds offered through the Contract. The table assumes a $1,000 investment held for the six months indicated. Please refer to the Fund prospectus for additional information on operating expenses.
Actual Fund Expenses
The first line (Actual) of the table provides actual account values and expenses. The “Ending Account Value” is derived from the Fund’s actual return, which includes the effect of ongoing Fund expenses, but does not include the effect of ongoing Contract expenses.
You can estimate the Fund-level expenses you incurred during the period by following these steps. Of course, your account value and expenses will differ from those in this illustration:
| 1. | Divide your account value by $1,000. |
If an account had an $8,600 value,
then $8,600 ÷ $1,000 = 8.6.
| 2. | Multiply the result by the number under the heading “Fund-Level Expenses Incurred During Period.” |
If Fund-Level Expenses Incurred During Period were $7.50, then 8.6 × $7.50 = $64.50.
In this illustration, the estimated expenses incurred this period at the Fund level are $64.50.
Hypothetical Example for Comparison with Other Mutual Funds
Information in the second line (Hypothetical) of the table can help you compare ongoing expenses of the Fund with those of other mutual funds offered through the Contract. This information may not be used to estimate the actual ending account balance or expenses you incurred during the period. The hypothetical “Ending Account Value” is based on the Fund’s actual expense ratio and an assumed 5% annual rate of return before expenses, which does not represent the Fund’s actual return. The figure under the heading “Fund-Level Expenses Incurred During Period” shows the hypothetical expenses your account would have incurred under this scenario. You can compare this figure with the 5% hypothetical examples that appear in shareholder reports of other funds offered through a Contract.
| Class 4 | Beginning Account Value 1/1/16 | Ending Account Value 6/30/16 | Fund-Level Expenses Incurred During Period* 1/1/16–6/30/16 | |||||||||
Actual | $ | 1,000 | $ | 1,112.00 | $ | 5.20 | ||||||
Hypothetical (5% return before expenses) | $ | 1,000 | $ | 1,019.44 | $ | 4.97 | ||||||
*Expenses are calculated using the most recent six-month annualized expense ratio, net of expenses waivers, for the Fund’s Class 4 shares (0.99%), which does not include any ongoing expenses of the Contract for which the Fund is an investment option, multiplied by the average account value over the period, multiplied by 182/366 to reflect the one-half year period.
| Semiannual Report | FSV-5 |
SUPPLEMENT DATED JULY 18, 2016
TOTHE PROSPECTUSES DATED MAY 1, 2016
OF
FRANKLIN GLOBAL REAL ESTATE VIP FUND
FRANKLIN SMALL CAP VALUE VIP FUND
(Series of Franklin Templeton Variable Insurance Products Trust)
IMPORTANT NOTICE REGARDING CHANGE IN INVESTMENT POLICY
The prospectus of Franklin Small Cap Value VIP Fund is amended as follows:
I. The first paragraph under the “FUND SUMMARIES” – “Principal Investment Strategies” section, on page FSV-S1, is replaced with the following:
Under normal market conditions, the Fund invests at least 80% of its net assets in investments of small-capitalization (small-cap) companies. Small-cap companies are companies with market capitalizations (the total market value of a company’s outstanding stock) under $3.5 billion at the time of purchase. Effective September 30, 2016, the definition of small-cap companies will be revised to read as follows: Small-cap companies are companies with market capitalizations (the total market value of a company’s outstanding stock) not exceeding either: 1) the highest market capitalization in the Russell 2000 Index; or 2) the 12-month average of the highest market capitalization in the Russell 2000 Index, whichever is greater, at the time of purchase. As of May 31, 2016, the highest market capitalization in the Russell 2000 Index was $5.96 billion.
II. The “Performance” section, on page FSV-S3, is revised to add the following:
| 1 Year | 5 Years | 10 Years | ||||||||||
| Russell 2000 Value Index (index reflects no deduction for fees, expenses or taxes) 1 | -7.47% | 7.67% | 5.58% | |||||||||
| 1. | Performance figures as of December 31, 2015. The Russell 2000 Value Index is replacing the Russell 2500 Value Index as the Fund’s benchmark. The investment manager believes the composition of the Russell 2000 Value Index more accurately reflects the Fund’s holdings. |
No one index is representative of the Fund’s portfolio.
III. Effective September 30, 2016, the first paragraph under the “FUND DETAILS” – “Principal Investment Policies and Practices” section on page FSV D-1 is replaced with the following:
Under normal market conditions, the Fund invests at least 80% of its net assets in investments of small-capitalization (small-cap) companies. Shareholders will be given at least 60 days’ advance notice of any change to this 80% policy. Small-cap companies are companies with market capitalizations (the total market value of a company’s outstanding stock) under $3.5 billion at the time of purchase. Effective September 30, 2016, the definition of small-cap companies will be revised to read as follows: Under normal market conditions, the Fund invests at least 80% of its net assets in investments of small-capitalization (small-cap) companies. Small-cap companies are companies with market capitalizations (the total market value of a company’s outstanding stock) not exceeding either: 1) the highest market capitalization in the Russell 2000 Index; or 2) the 12-month average of the highest market capitalization
| FSV-6 |
in the Russell 2000 Index, whichever is greater, at the time of purchase. As of May 31, 2016, the highest market capitalization in the Russell 2000 Index was $5.96 billion.
The prospectus of Franklin Global Real Estate VIP Fund is amended as follows:
The “FUND DETAILS” – “Management” section, on page FGR D-6, is revised to show the address of Franklin Templeton Institutional, LLC (FT Institutional) as 280 Park Avenue, New York, NY 10017.
Please keep this supplement with your prospectuses for future reference.
| FSV-7 |
FRANKLIN TEMPLETON VARIABLE INSURANCE PRODUCTS TRUST
Financial Highlights
Franklin Small Cap Value VIP Fund
| �� | Six Months Ended (unaudited) | Year Ended December 31, | ||||||||||||||||||||||
| 2015 | 2014 | 2013 | 2012 | 2011 | ||||||||||||||||||||
| Class 1 | ||||||||||||||||||||||||
Per share operating performance (for a share outstanding throughout the period) | ||||||||||||||||||||||||
Net asset value, beginning of period | $18.12 | $22.81 | $24.54 | $18.58 | $15.82 | $16.55 | ||||||||||||||||||
|
| |||||||||||||||||||||||
| Income from investment operationsa: | ||||||||||||||||||||||||
Net investment incomeb | 0.08 | 0.21 | 0.19 | 0.19 | 0.29 | c | 0.16 | |||||||||||||||||
Net realized and unrealized gains (losses) | 1.93 | (1.53 | ) | 0.06 | 6.45 | 2.64 | (0.74 | ) | ||||||||||||||||
|
| |||||||||||||||||||||||
Total from investment operations | 2.01 | (1.32 | ) | 0.25 | 6.64 | 2.93 | (0.58 | ) | ||||||||||||||||
|
| |||||||||||||||||||||||
| Less distributions from: | ||||||||||||||||||||||||
Net investment income | (0.21 | ) | (0.20 | ) | (0.20 | ) | (0.32 | ) | (0.17 | ) | (0.15 | ) | ||||||||||||
Net realized gains | (2.92 | ) | (3.17 | ) | (1.78 | ) | (0.36 | ) | — | — | ||||||||||||||
|
| |||||||||||||||||||||||
Total distributions | (3.13 | ) | (3.37 | ) | (1.98 | ) | (0.68 | ) | (0.17 | ) | (0.15 | ) | ||||||||||||
|
| |||||||||||||||||||||||
Net asset value, end of period | $17.00 | $18.12 | $22.81 | $24.54 | $18.58 | $15.82 | ||||||||||||||||||
|
| |||||||||||||||||||||||
Total returnd | 11.34% | (7.18)% | 0.88% | 36.50% | 18.75% | (3.53)% | ||||||||||||||||||
| Ratios to average net assetse | ||||||||||||||||||||||||
Expenses before waiver and payments by affiliates | 0.67% | 0.65% | 0.63% | 0.63% | 0.67% | 0.66% | ||||||||||||||||||
Expenses net of waiver and payments by affiliates | 0.64% | 0.64% | f | 0.63% | f,g | 0.63% | 0.67% | 0.66% | ||||||||||||||||
Net investment income | 0.88% | 1.04% | 0.82% | 0.90% | 1.70% | c | 1.02% | |||||||||||||||||
| Supplemental data | ||||||||||||||||||||||||
Net assets, end of period (000’s) | $49,070 | $45,897 | $57,843 | $62,408 | $40,133 | $39,374 | ||||||||||||||||||
Portfolio turnover rate | 18.06% | 27.05% | 19.45% | 10.44% | 5.84% | 14.39% | ||||||||||||||||||
aThe amount shown for a share outstanding throughout the period may not correlate with the Statement of Operations for the period due to the timing of sales and repurchases of the Fund’s shares in relation to income earned and/or fluctuating fair value of the investments of the Fund.
bBased on average daily shares outstanding.
cNet investment income per share includes approximately $0.10 per share related to income received in the form of special dividends in connection with certain fund holdings. Excluding this amount, the ratio of net investment income to average net assets would have been 1.10%.
dTotal return does not include fees, charges or expenses imposed by the variable annuity and life insurance contracts for which Franklin Templeton Variable Insurance Products Trust serves as an underlying investment vehicle. Total return is not annualized for periods less than one year.
eRatios are annualized for periods less than one year.
fBenefit of expense reduction rounds to less than 0.01%.
gBenefit of waiver and payments by affiliates rounds to less than 0.01%.
| FSV-8 | Semiannual Report | The accompanying notes are an integral part of these financial statements. |
FRANKLIN TEMPLETON VARIABLE INSURANCE PRODUCTS TRUST
FINANCIAL HIGHLIGHTS
Franklin Small Cap Value VIP Fund (continued)
Six Months Ended (unaudited) | Year Ended December 31, | |||||||||||||||||||||||
| 2015 | 2014 | 2013 | 2012 | 2011 | ||||||||||||||||||||
| Class 2 | ||||||||||||||||||||||||
Per share operating performance (for a share outstanding throughout the period) | ||||||||||||||||||||||||
Net asset value, beginning of period | $17.68 | $22.32 | $24.07 | $18.23 | $15.53 | $16.25 | ||||||||||||||||||
|
| |||||||||||||||||||||||
| Income from investment operationsa: | ||||||||||||||||||||||||
Net investment incomeb | 0.06 | 0.16 | 0.13 | 0.14 | 0.24 | c | 0.12 | |||||||||||||||||
Net realized and unrealized gains (losses) | 1.88 | (1.49 | ) | 0.05 | 6.34 | 2.59 | (0.73 | ) | ||||||||||||||||
|
| |||||||||||||||||||||||
Total from investment operations | 1.94 | (1.33 | ) | 0.18 | 6.48 | 2.83 | (0.61 | ) | ||||||||||||||||
|
| |||||||||||||||||||||||
| Less distributions from: | ||||||||||||||||||||||||
Net investment income | (0.16 | ) | (0.14 | ) | (0.15 | ) | (0.28 | ) | (0.13 | ) | (0.11 | ) | ||||||||||||
Net realized gains | (2.92 | ) | (3.17 | ) | (1.78 | ) | (0.36 | ) | — | — | ||||||||||||||
|
| |||||||||||||||||||||||
Total distributions | (3.08 | ) | (3.31 | ) | (1.93 | ) | (0.64 | ) | (0.13 | ) | (0.11 | ) | ||||||||||||
|
| |||||||||||||||||||||||
Net asset value, end of period | $16.54 | $17.68 | $22.32 | $24.07 | $18.23 | $15.53 | ||||||||||||||||||
|
| |||||||||||||||||||||||
Total returnd | 11.22% | (7.39)% | 0.57% | 36.24% | 18.39% | (3.76)% | ||||||||||||||||||
| Ratios to average net assetse | ||||||||||||||||||||||||
Expenses before waiver and payments by affiliates | 0.92% | 0.90% | 0.88% | 0.88% | 0.92% | 0.91% | ||||||||||||||||||
Expenses net of waiver and payments by affiliates | 0.89% | 0.89% | f | 0.88% | f,g | 0.88% | 0.92% | 0.91% | ||||||||||||||||
Net investment income | 0.63% | 0.79% | 0.57% | 0.65% | 1.45% | c | 0.77% | |||||||||||||||||
| Supplemental data | ||||||||||||||||||||||||
Net assets, end of period (000’s) | $1,243,228 | $1,172,173 | $1,445,325 | $1,606,802 | $1,286,573 | $1,211,168 | ||||||||||||||||||
Portfolio turnover rate | 18.06% | 27.05% | 19.45% | 10.44% | 5.84% | 14.39% | ||||||||||||||||||
aThe amount shown for a share outstanding throughout the period may not correlate with the Statement of Operations for the period due to the timing of sales and repurchases of the Fund’s shares in relation to income earned and/or fluctuating fair value of the investments of the Fund.
bBased on average daily shares outstanding.
cNet investment income per share includes approximately $0.10 per share related to income received in the form of special dividends in connection with certain fund holdings. Excluding this amount, the ratio of net investment income to average net assets would have been 0.85%.
dTotal return does not include fees, charges or expenses imposed by the variable annuity and life insurance contracts for which Franklin Templeton Variable Insurance Products Trust serves as an underlying investment vehicle. Total return is not annualized for periods less than one year.
eRatios are annualized for periods less than one year.
fBenefit of expense reduction rounds to less than 0.01%.
gBenefit of waiver and payments by affiliates rounds to less than 0.01%.
| The accompanying notes are an integral part of these financial statements. | Semiannual Report | FSV-9 |
FRANKLIN TEMPLETON VARIABLE INSURANCE PRODUCTS TRUST
FINANCIAL HIGHLIGHTS
Franklin Small Cap Value VIP Fund (continued)
Six Months Ended (unaudited) | Year Ended December 31, | |||||||||||||||||||||||
| 2015 | 2014 | 2013 | 2012 | 2011 | ||||||||||||||||||||
| Class 4 | ||||||||||||||||||||||||
Per share operating performance (for a share outstanding throughout the period) | ||||||||||||||||||||||||
Net asset value, beginning of period | $17.96 | $22.63 | $24.37 | $18.44 | $15.71 | $16.44 | ||||||||||||||||||
|
| |||||||||||||||||||||||
| Income from investment operationsa: | ||||||||||||||||||||||||
Net investment incomeb | 0.05 | 0.14 | 0.11 | 0.12 | 0.22 | c | 0.11 | |||||||||||||||||
Net realized and unrealized gains (losses) | 1.92 | (1.52 | ) | 0.05 | 6.42 | 2.63 | (0.75 | ) | ||||||||||||||||
|
| |||||||||||||||||||||||
Total from investment operations | 1.97 | (1.38 | ) | 0.16 | 6.54 | 2.85 | (0.64 | ) | ||||||||||||||||
|
| |||||||||||||||||||||||
| Less distributions from: | ||||||||||||||||||||||||
Net investment income | (0.14 | ) | (0.12 | ) | (0.12 | ) | (0.25 | ) | (0.12 | ) | (0.09 | ) | ||||||||||||
Net realized gains | (2.92 | ) | (3.17 | ) | (1.78 | ) | (0.36 | ) | — | — | ||||||||||||||
|
| |||||||||||||||||||||||
Total distributions | (3.06 | ) | (3.29 | ) | (1.90 | ) | (0.61 | ) | (0.12 | ) | (0.09 | ) | ||||||||||||
|
| |||||||||||||||||||||||
Net asset value, end of period | $16.87 | $17.96 | $22.63 | $24.37 | $18.44 | $15.71 | ||||||||||||||||||
|
| |||||||||||||||||||||||
Total returnd | 11.20% | (7.52)% | 0.48% | 36.12% | 18.27% | (3.87)% | ||||||||||||||||||
| Ratios to average net assetse | ||||||||||||||||||||||||
Expenses before waiver and payments by affiliates | 1.02% | 1.00% | 0.98% | 0.98% | 1.02% | 1.01% | ||||||||||||||||||
Expenses net of waiver and payments by affiliates | 0.99% | 0.99% | f | 0.98% | f,g | 0.98% | 1.02% | 1.01% | ||||||||||||||||
Net investment income | 0.53% | 0.69% | 0.47% | 0.55% | 1.35% | c | 0.67% | |||||||||||||||||
| Supplemental data | ||||||||||||||||||||||||
Net assets, end of period (000’s) | $27,397 | $26,128 | $30,452 | $35,936 | $32,424 | $34,284 | ||||||||||||||||||
Portfolio turnover rate | 18.06% | 27.05% | 19.45% | 10.44% | 5.84% | 14.39% | ||||||||||||||||||
aThe amount shown for a share outstanding throughout the period may not correlate with the Statement of Operations for the period due to the timing of sales and repurchases of the Fund’s shares in relation to income earned and/or fluctuating fair value of the investments of the Fund.
bBased on average daily shares outstanding.
cNet investment income per share includes approximately $0.10 per share related to income received in the form of special dividends in connection with certain fund holdings. Excluding this amount, the ratio of net investment income to average net assets would have been 0.75%.
dTotal return does not include fees, charges or expenses imposed by the variable annuity and life insurance contracts for which Franklin Templeton Variable Insurance Products Trust serves as an underlying investment vehicle. Total return is not annualized for periods less than one year.
eRatios are annualized for periods less than one year.
fBenefit of expense reduction rounds to less than 0.01%.
gBenefit of waiver and payments by affiliates rounds to less than 0.01%.
| FSV-10 | Semiannual Report | The accompanying notes are an integral part of these financial statements. |
FRANKLIN TEMPLETON VARIABLE INSURANCE PRODUCTS TRUST
Statement of Investments, June 30, 2016 (unaudited)
Franklin Small Cap Value VIP Fund
| ||||||||||
| Shares | Value | |||||||||
Common Stocks 90.5% | ||||||||||
Aerospace & Defense 4.2% | ||||||||||
AAR Corp. | 1,209,300 | $ | 28,225,062 | |||||||
Cubic Corp. | 397,200 | 15,951,552 | ||||||||
| a | Esterline Technologies Corp. | 185,900 | 11,533,236 | |||||||
|
| |||||||||
| 55,709,850 | ||||||||||
|
| |||||||||
Automobiles & Components 4.2% | ||||||||||
Drew Industries Inc. | 335,700 | 28,480,788 | ||||||||
Gentex Corp. | 440,700 | 6,808,815 | ||||||||
Thor Industries Inc. | 251,900 | 16,308,006 | ||||||||
Winnebago Industries Inc. | 149,000 | 3,415,080 | ||||||||
|
| |||||||||
| 55,012,689 | ||||||||||
|
| |||||||||
Banks 6.1% | ||||||||||
BNC Bancorp. | 327,646 | 7,440,841 | ||||||||
Chemical Financial Corp. | 591,154 | 22,044,132 | ||||||||
Columbia Banking System Inc. | 453,000 | 12,711,180 | ||||||||
EverBank Financial Corp. | 783,400 | 11,641,324 | ||||||||
Lakeland Financial Corp. | 362,200 | 17,027,022 | ||||||||
Peoples Bancorp Inc. | 257,000 | 5,600,030 | ||||||||
TrustCo Bank Corp. NY | 684,300 | 4,386,363 | ||||||||
|
| |||||||||
| 80,850,892 | ||||||||||
|
| |||||||||
Building Products 5.7% | ||||||||||
| a | Armstrong Flooring Inc. | 240,600 | 4,078,170 | |||||||
| a | Gibraltar Industries Inc. | 496,800 | 15,683,976 | |||||||
Griffon Corp. | 436,600 | 7,361,076 | ||||||||
Insteel Industries Inc. | 82,400 | 2,355,816 | ||||||||
Simpson Manufacturing Co. Inc. | 433,400 | 17,322,998 | ||||||||
Universal Forest Products Inc. | 306,888 | 28,445,449 | ||||||||
|
| |||||||||
| 75,247,485 | ||||||||||
|
| |||||||||
Commercial & Professional Services 2.5% | ||||||||||
| a | Huron Consulting Group Inc. | 171,300 | 10,349,946 | |||||||
McGrath RentCorp | 488,218 | 14,934,588 | ||||||||
MSA Safety Inc. | 153,113 | 8,043,026 | ||||||||
|
| |||||||||
| 33,327,560 | ||||||||||
|
| |||||||||
Construction & Engineering 3.2% | ||||||||||
Argan Inc. | 12,200 | 508,984 | ||||||||
EMCOR Group Inc. | 338,000 | 16,649,880 | ||||||||
Granite Construction Inc. | 561,900 | 25,594,545 | ||||||||
|
| |||||||||
| 42,753,409 | ||||||||||
|
| |||||||||
Consumer Durables & Apparel 3.7% | ||||||||||
| a | BRP Inc. (Canada) | 824,200 | 13,184,904 | |||||||
Brunswick Corp. | 49,900 | 2,261,468 | ||||||||
| a | Crocs Inc. | 1,318,000 | 14,867,040 | |||||||
Hooker Furniture Corp. | 179,000 | 3,846,710 | ||||||||
La-Z-Boy Inc. | 296,500 | 8,248,630 | ||||||||
| a | M/I Homes Inc. | 376,300 | 7,085,729 | |||||||
|
| |||||||||
| 49,494,481 | ||||||||||
|
| |||||||||
Consumer Services 0.8% | ||||||||||
Brinker International Inc. | 246,300 | 11,214,039 | ||||||||
|
| |||||||||
| Semiannual Report | FSV-11 |
FRANKLIN TEMPLETON VARIABLE INSURANCE PRODUCTS TRUST
STATEMENT OF INVESTMENTS (UNAUDITED)
Franklin Small Cap Value VIP Fund (continued)
| Shares | Value | |||||||||
Common Stocks (continued) | ||||||||||
Electrical Equipment 2.0% | ||||||||||
EnerSys | 280,110 | $ | 16,658,142 | |||||||
Regal Beloit Corp. | 167,500 | 9,220,875 | ||||||||
|
| |||||||||
| 25,879,017 | ||||||||||
|
| |||||||||
Energy 4.9% | ||||||||||
Energen Corp. | 280,107 | 13,503,958 | ||||||||
| a | Helix Energy Solutions Group Inc. | 599,600 | 4,053,296 | |||||||
Hunting PLC (United Kingdom) | 2,086,200 | 13,352,348 | ||||||||
| a | Natural Gas Services Group Inc. | 51,800 | 1,186,220 | |||||||
| a | Oil States International Inc. | 567,900 | 18,672,552 | |||||||
| a | Unit Corp. | 940,700 | 14,637,292 | |||||||
|
| |||||||||
| 65,405,666 | ||||||||||
|
| |||||||||
Food, Beverage & Tobacco 4.5% | ||||||||||
AGT Food and Ingredients Inc. (Canada) | 116,600 | 3,202,642 | ||||||||
Dairy Crest Group PLC (United Kingdom) | 484,804 | 3,474,602 | ||||||||
GrainCorp Ltd. (Australia) | 408,300 | 2,628,275 | ||||||||
| a | Landec Corp. | 848,600 | 9,130,936 | |||||||
Maple Leaf Foods Inc. (Canada) | 1,704,400 | 36,393,775 | ||||||||
| a | Omega Protein Corp. | 222,700 | 4,451,773 | |||||||
|
| |||||||||
| 59,282,003 | ||||||||||
|
| |||||||||
Health Care Equipment & Services 5.5% | ||||||||||
Hill-Rom Holdings Inc. | 407,400 | 20,553,330 | ||||||||
Invacare Corp. | 213,300 | 2,587,329 | ||||||||
STERIS PLC | 357,500 | 24,578,125 | ||||||||
Teleflex Inc. | 141,900 | 25,160,289 | ||||||||
|
| |||||||||
| 72,879,073 | ||||||||||
|
| |||||||||
Industrial Conglomerates 2.0% | ||||||||||
Carlisle Cos. Inc. | 245,400 | 25,933,872 | ||||||||
|
| |||||||||
Insurance 6.5% | ||||||||||
Arthur J. Gallagher & Co. | 168,200 | 8,006,320 | ||||||||
Aspen Insurance Holdings Ltd. | 466,400 | 21,631,632 | ||||||||
Endurance Specialty Holdings Ltd. | 116,300 | 7,810,708 | ||||||||
The Hanover Insurance Group Inc. | 183,200 | 15,502,384 | ||||||||
Old Republic International Corp. | 877,800 | 16,932,762 | ||||||||
Validus Holdings Ltd. | 317,800 | 15,441,902 | ||||||||
|
| |||||||||
| 85,325,708 | ||||||||||
|
| |||||||||
Machinery 6.7% | ||||||||||
Astec Industries Inc. | 561,900 | 31,550,685 | ||||||||
Franklin Electric Co. Inc. | 134,464 | 4,444,035 | ||||||||
Hillenbrand Inc. | 277,500 | 8,336,100 | ||||||||
| b | Lindsay Corp. | 132,800 | 9,011,808 | |||||||
Mueller Industries Inc. | 692,700 | 22,083,276 | ||||||||
Mueller Water Products Inc., A | 860,100 | 9,822,342 | ||||||||
Watts Water Technologies Inc., A | 55,000 | 3,204,300 | ||||||||
|
| |||||||||
| 88,452,546 | ||||||||||
|
| |||||||||
Materials 8.5% | ||||||||||
A Schulman Inc. | 4,766 | 116,386 | ||||||||
AptarGroup Inc. | 65,000 | 5,143,450 | ||||||||
Carpenter Technology Corp. | 164,800 | 5,426,864 | ||||||||
| FSV-12 | Semiannual Report |
FRANKLIN TEMPLETON VARIABLE INSURANCE PRODUCTS TRUST
STATEMENT OF INVESTMENTS (UNAUDITED)
Franklin Small Cap Value VIP Fund (continued)
| Shares | Value | |||||||||
Common Stocks (continued) | ||||||||||
Materials (continued) | ||||||||||
| a | Detour Gold Corp. (Canada) | 700,700 | $ | 17,526,990 | ||||||
H.B. Fuller Co. | 513,640 | 22,595,024 | ||||||||
Minerals Technologies Inc. | 106,100 | 6,026,480 | ||||||||
OceanaGold Corp. (Australia) | 2,871,800 | 10,957,336 | ||||||||
RPM International Inc. | 147,900 | 7,387,605 | ||||||||
Sensient Technologies Corp. | 443,800 | 31,527,552 | ||||||||
Stepan Co. | 86,600 | 5,155,298 | ||||||||
|
| |||||||||
| 111,862,985 | ||||||||||
|
| |||||||||
Pharmaceuticals, Biotechnology & Life Sciences 1.9% | ||||||||||
Gerresheimer AG (Germany) | 336,000 | 25,729,351 | ||||||||
|
| |||||||||
Real Estate 4.2% | ||||||||||
Brandywine Realty Trust | 1,151,700 | 19,348,560 | ||||||||
LTC Properties Inc. | 689,800 | 35,683,354 | ||||||||
|
| |||||||||
| 55,031,914 | ||||||||||
|
| |||||||||
Retailing 3.1% | ||||||||||
Caleres Inc. | 430,400 | 10,419,984 | ||||||||
The Cato Corp., A | 366,200 | 13,813,064 | ||||||||
| a | Genesco Inc. | 174,708 | 11,235,471 | |||||||
| a | West Marine Inc. | 610,700 | 5,123,773 | |||||||
|
| |||||||||
| 40,592,292 | ||||||||||
|
| |||||||||
Semiconductors & Semiconductor Equipment 2.7% | ||||||||||
Cohu Inc. | 736,000 | 7,985,600 | ||||||||
MKS Instruments Inc. | 458,400 | 19,738,704 | ||||||||
| a | Photronics Inc. | 840,800 | 7,491,528 | |||||||
|
| |||||||||
| 35,215,832 | ||||||||||
|
| |||||||||
Software & Services 0.7% | ||||||||||
Mentor Graphics Corp. | 408,900 | 8,693,214 | ||||||||
|
| |||||||||
Telecommunication Services 0.1% | ||||||||||
| a | ORBCOMM Inc. | 175,900 | 1,750,205 | |||||||
|
| |||||||||
Transportation 1.7% | ||||||||||
| a | SAIA Inc. | 368,000 | 9,251,520 | |||||||
| a | Spirit Airlines Inc. | 284,600 | 12,770,002 | |||||||
|
| |||||||||
| 22,021,522 | ||||||||||
|
| |||||||||
Utilities 5.1% | ||||||||||
Connecticut Water Service Inc. | 29,200 | 1,641,040 | ||||||||
IDACORP Inc. | 412,689 | 33,572,250 | ||||||||
Spire Inc. | 452,000 | 32,019,680 | ||||||||
|
| |||||||||
| 67,232,970 | ||||||||||
|
| |||||||||
Total Common Stocks (Cost $903,759,714) | 1,194,898,575 | |||||||||
|
| |||||||||
| Principal Amount | ||||||||||
Corporate Bonds (Cost $9,106,623) 0.6% | ||||||||||
Energy 0.6% | ||||||||||
Unit Corp., senior sub. note, 6.625%, 5/15/21 | $ | 9,632,000 | 7,488,880 | |||||||
|
| |||||||||
Total Investments before Short Term Investments (Cost $912,866,337) | 1,202,387,455 | |||||||||
|
| |||||||||
| Semiannual Report | FSV-13 |
FRANKLIN TEMPLETON VARIABLE INSURANCE PRODUCTS TRUST
STATEMENT OF INVESTMENTS (UNAUDITED)
Franklin Small Cap Value VIP Fund (continued)
| Shares | Value | |||||||||
Short Term Investments 9.4% | ||||||||||
Money Market Funds (Cost $118,437,435) 9.0% | ||||||||||
| a,c | Institutional Fiduciary Trust Money Market Portfolio | 118,437,435 | $ | 118,437,435 | ||||||
|
| |||||||||
| d | Investments from Cash Collateral Received for Loaned Securities 0.4% |
| ||||||||
Money Market Funds (Cost $4,833,000) 0.3% | ||||||||||
| a,c | Institutional Fiduciary Trust Money Market Portfolio | 4,833,000 | 4,833,000 | |||||||
|
| |||||||||
| Principal Amount | ||||||||||
Repurchase Agreements (Cost $1,208,821) 0.1% | ||||||||||
| e | Joint Repurchase Agreement, 0.40%, 7/01/16 (Maturity Value $1,208,834) | $ | 1,208,821 | 1,208,821 | ||||||
BNP Paribas Securities Corp. | ||||||||||
Collateralized by fU.S. Treasury Bill, 10/27/16; U.S. Treasury Bond, 8.75% - 9.00%, 11/15/18 - 5/15/20; U.S. Treasury Note, 0.363% - 4.75%, 9/15/16 - 3/31/21; U.S. Treasury Note, Index Linked, 2.625%, 7/15/17; and U.S. Treasury Strips, 8/15/16 - 2/15/21 (valued at $1,232,998) | ||||||||||
|
| |||||||||
Total Investments from Cash Collateral Received for Loaned Securities (Cost $6,041,821) | 6,041,821 | |||||||||
|
| |||||||||
Total Investments (Cost $1,037,345,593) 100.5% | 1,326,866,711 | |||||||||
Other Assets, less Liabilities (0.5)% | (7,171,548 | ) | ||||||||
|
| |||||||||
Net Assets 100.0% | $ | 1,319,695,163 | ||||||||
|
| |||||||||
aNon-income producing.
bA portion or all of the security is on loan at June 30, 2016. See Note 1(d).
cSee Note 3(e) regarding investments in affiliated management investment companies.
dSee Note 1(d) regarding securities on loan.
eSee Note 1(c) regarding joint repurchase agreement.
fThe security is traded on a discount basis with no stated coupon rate.
| FSV-14 | Semiannual Report | The accompanying notes are an integral part of these financial statements. |
FRANKLIN TEMPLETON VARIABLE INSURANCE PRODUCTS TRUST
Financial Statements
Statement of Assets and Liabilities
June 30, 2016 (unaudited)
Franklin Small VIP Fund | ||||
Assets: | ||||
Investments in securities: | ||||
Cost - Unaffiliated issuers | $ | 912,866,337 | ||
Cost - Non-controlled affiliates (Note 3e) | 123,270,435 | |||
Cost - Repurchase agreements | 1,208,821 | |||
|
| |||
Total cost of investments | $ | 1,037,345,593 | ||
|
| |||
Value - Unaffiliated issuers | $ | 1,202,387,455 | ||
Value - Non-controlled affiliates (Note 3e) | 123,270,435 | |||
Value - Repurchase agreements | 1,208,821 | |||
|
| |||
Total value of investments (Includes securities loaned in the amount of $5,835,960) | 1,326,866,711 | |||
Receivables: | ||||
Investment securities sold | 1,683,518 | |||
Capital shares sold | 295,150 | |||
Dividends and interest | 732,797 | |||
Other assets | 550 | |||
|
| |||
Total assets | 1,329,578,726 | |||
|
| |||
Liabilities: | ||||
Payables: | ||||
Investment securities purchased | 1,377,885 | |||
Capital shares redeemed | 1,124,980 | |||
Management fees | 647,235 | |||
Distribution fees | 521,659 | |||
Payable upon return of securities loaned | 6,041,821 | |||
Accrued expenses and other liabilities | 169,983 | |||
|
| |||
Total liabilities | 9,883,563 | |||
|
| �� | ||
Net assets, at value | $ | 1,319,695,163 | ||
|
| |||
Net assets consist of: | ||||
Paid-in capital | $ | 989,821,505 | ||
Undistributed net investment income | 4,257,803 | |||
Net unrealized appreciation (depreciation) | 289,513,430 | |||
Accumulated net realized gain (loss) | 36,102,425 | |||
|
| |||
Net assets, at value | $ | 1,319,695,163 | ||
|
| |||
| Class 1: | ||||
Net assets, at value | $ | 49,069,903 | ||
|
| |||
Shares outstanding | 2,886,310 | |||
|
| |||
Net asset value and maximum offering price per share | $ | 17.00 | ||
|
| |||
| Class 2: | ||||
Net assets, at value | $ | 1,243,228,035 | ||
|
| |||
Shares outstanding | 75,171,623 | |||
|
| |||
Net asset value and maximum offering price per share | $ | 16.54 | ||
|
| |||
| Class 4: | ||||
Net assets, at value | $ | 27,397,225 | ||
|
| |||
Shares outstanding | 1,623,966 | |||
|
| |||
Net asset value and maximum offering price per share | $ | 16.87 | ||
|
| |||
| The accompanying notes are an integral part of these financial statements. | Semiannual Report | FSV-15 |
FRANKLIN TEMPLETON VARIABLE INSURANCE PRODUCTS TRUST
FINANCIAL STATEMENTS
Statement of Operations
for the six months ended June 30, 2016 (unaudited)
| Franklin Small Cap Value VIP Fund | ||||
Investment income: | ||||
Dividends | $ | 8,917,088 | ||
Interest | 360,339 | |||
Income from securities loaned (net of fees and rebates) | 90,055 | |||
|
| |||
Total investment income | 9,367,482 | |||
|
| |||
Expenses: | ||||
Management fees (Note 3a) | 3,909,296 | |||
Distribution fees: (Note 3c) | ||||
Class 2 | 1,445,260 | |||
Class 4 | 44,858 | |||
Custodian fees (Note 4) | 8,581 | |||
Reports to shareholders | 125,666 | |||
Professional fees | 25,171 | |||
Trustees’ fees and expenses | 3,150 | |||
Other | 11,641 | |||
|
| |||
Total expenses | 5,573,623 | |||
Expenses waived/paid by affiliates (Note 3e) | (147,166 | ) | ||
|
| |||
Net expenses | 5,426,457 | |||
|
| |||
Net investment income | 3,941,025 | |||
|
| |||
Realized and unrealized gains (losses): | ||||
Net realized gain (loss) from: | ||||
Investments | 37,653,256 | |||
Foreign currency transactions | (102,440 | ) | ||
|
| |||
Net realized gain (loss) | 37,550,816 | |||
|
| |||
Net change in unrealized appreciation (depreciation) on: | ||||
Investments | 92,102,341 | |||
Translation of other assets and liabilities denominated in foreign currencies | (7,306 | ) | ||
|
| |||
Net change in unrealized appreciation (depreciation) | 92,095,035 | |||
|
| |||
Net realized and unrealized gain (loss) | 129,645,851 | |||
|
| |||
Net increase (decrease) in net assets resulting from operations | $ | 133,586,876 | ||
|
| |||
| FSV-16 | Semiannual Report | The accompanying notes are an integral part of these financial statements. |
FRANKLIN TEMPLETON VARIABLE INSURANCE PRODUCTS TRUST
FINANCIAL STATEMENTS
Statements of Changes in Net Assets
| Franklin Small Cap Value VIP Fund | ||||||||
| Six Months Ended June 30, 2016 (unaudited) | Year Ended December 31,2015 | |||||||
Increase (decrease) in net assets: | ||||||||
Operations: | ||||||||
Net investment income | $ | 3,941,025 | $ | 11,196,499 | ||||
Net realized gain (loss) | 37,550,816 | 195,958,536 | ||||||
Net change in unrealized appreciation (depreciation) | 92,095,035 | (310,285,782 | ) | |||||
|
| |||||||
Net increase (decrease) in net assets resulting from operations | 133,586,876 | (103,130,747 | ) | |||||
|
| |||||||
Distributions to shareholders from: | ||||||||
Net investment income: | ||||||||
Class 1 | (515,096 | ) | (483,179 | ) | ||||
Class 2 | (10,103,275 | ) | (8,399,662 | ) | ||||
Class 4 | (189,568 | ) | (155,331 | ) | ||||
Net realized gains: | ||||||||
Class 1 | (7,134,342 | ) | (7,665,840 | ) | ||||
Class 2 | (185,669,944 | ) | (193,180,034 | ) | ||||
Class 4 | (4,020,473 | ) | (4,250,502 | ) | ||||
|
| |||||||
Total distributions to shareholders | (207,632,698 | ) | (214,134,548 | ) | ||||
|
| |||||||
Capital share transactions: (Note 2) | ||||||||
Class 1 | 5,767,197 | (165,713 | ) | |||||
Class 2 | 141,046,017 | 25,699,762 | ||||||
Class 4 | 2,730,004 | 2,309,001 | ||||||
|
| |||||||
Total capital share transactions | 149,543,218 | 27,843,050 | ||||||
|
| |||||||
Net increase (decrease) in net assets | 75,497,396 | (289,422,245 | ) | |||||
Net assets: | ||||||||
Beginning of period | 1,244,197,767 | 1,533,620,012 | ||||||
|
| |||||||
End of period | $ | 1,319,695,163 | $ | 1,244,197,767 | ||||
|
| |||||||
Undistributed net investment income included in net assets: | ||||||||
End of period | $ | 4,257,803 | $ | 11,124,717 | ||||
|
| |||||||
| The accompanying notes are an integral part of these financial statements. | Semiannual Report | FSV-17 |
FRANKLIN TEMPLETON VARIABLE INSURANCE PRODUCTS TRUST
Notes to Financial Statements (unaudited)
Franklin Small Cap Value VIP Fund
1. Organization and Significant Accounting Policies
Franklin Templeton Variable Insurance Products Trust (Trust) is registered under the Investment Company Act of 1940 (1940 Act) as an open-end management investment company, consisting of nineteen separate funds and applies the specialized accounting and reporting guidance in U.S. Generally Accepted Accounting Principles (U.S. GAAP). Franklin Small Cap Value VIP Fund (Fund) is included in this report. The financial statements of the remaining funds in the Trust are presented separately. Shares of the Fund are generally sold only to insurance company separate accounts to fund the benefits of variable life insurance policies or variable annuity contracts. The Fund offers three classes of shares: Class 1, Class 2, and Class 4. Each class of shares differs by its distribution fees, voting rights on matters affecting a single class and its exchange privilege.
The following summarizes the Fund’s significant accounting policies.
a. Financial Instrument Valuation
The Fund’s investments in financial instruments are carried at fair value daily. Fair value is the price that would be received to sell an asset or paid to transfer a liability in an orderly transaction between market participants on the measurement date. The Fund calculates the net asset value (NAV) per share as of 4 p.m. Eastern time each day the New York Stock Exchange (NYSE) is open for trading. Under compliance policies and procedures approved by the Trust’s Board of Trustees (the Board), the Fund’s administrator has responsibility for oversight of valuation, including leading the cross-functional Valuation Committee (VC). The VC provides administration and oversight of the Fund’s valuation policies and procedures, which are approved annually by the Board. Among other things, these procedures allow the Fund to utilize independent pricing services, quotations from securities and financial instrument dealers, and other market sources to determine fair value.
Equity securities listed on an exchange or on the NASDAQ National Market System are valued at the last quoted sale price or the official closing price of the day, respectively. Foreign equity securities are valued as of the close of trading on the foreign stock exchange on which the security is primarily traded or as of 4 p.m. Eastern time whichever is earlier. The value is then converted into its U.S. dollar equivalent at the foreign exchange rate in effect at 4 p.m. Eastern time on the day that the value of the security is determined. Over-the-counter (OTC) securities
are valued within the range of the most recent quoted bid and ask prices. Securities that trade in multiple markets or on multiple exchanges are valued according to the broadest and most representative market. Certain equity securities are valued based upon fundamental characteristics or relationships to similar securities.
Debt securities generally trade in the OTC market rather than on a securities exchange. The Fund’s pricing services use multiple valuation techniques to determine fair value. In instances where sufficient market activity exists, the pricing services may utilize a market-based approach through which quotes from market makers are used to determine fair value. In instances where sufficient market activity may not exist or is limited, the pricing services also utilize proprietary valuation models which may consider market characteristics such as benchmark yield curves, credit spreads, estimated default rates, anticipated market interest rate volatility, coupon rates, anticipated timing of principal repayments, underlying collateral, and other unique security features in order to estimate the relevant cash flows, which are then discounted to calculate the fair value.
Investments in open-end mutual funds are valued at the closing NAV. Repurchase agreements are valued at cost, which approximates fair value.
The Fund has procedures to determine the fair value of financial instruments for which market prices are not reliable or readily available. Under these procedures, the VC convenes on a regular basis to review such financial instruments and considers a number of factors, including significant unobservable valuation inputs, when arriving at fair value. The VC primarily employs a market-based approach which may use related or comparable assets or liabilities, recent transactions, market multiples, book values, and other relevant information for the investment to determine the fair value of the investment. An income-based valuation approach may also be used in which the anticipated future cash flows of the investment are discounted to calculate fair value. Discounts may also be applied due to the nature or duration of any restrictions on the disposition of the investments. Due to the inherent uncertainty of valuations of such investments, the fair values may differ significantly from the values that would have been used had an active market existed. The VC employs various methods for calibrating these valuation approaches including a regular review of key inputs and assumptions, transactional back-testing or disposition analysis, and reviews of any related market activity.
| FSV-18 | Semiannual Report |
FRANKLIN TEMPLETON VARIABLE INSURANCE PRODUCTS TRUST
NOTES TO FINANCIAL STATEMENTS (UNAUDITED)
Franklin Small Cap Value VIP Fund (continued)
Trading in securities on foreign securities stock exchanges and OTC markets may be completed before 4 p.m. Eastern time. In addition, trading in certain foreign markets may not take place on every NYSE business day. Occasionally, events occur between the time at which trading in a foreign security is completed and the close of the NYSE that might call into question the reliability of the value of a portfolio security held by the Fund. As a result, differences may arise between the value of the Fund’s portfolio securities as determined at the foreign market close and the latest indications of value at the close of the NYSE. In order to minimize the potential for these differences, the VC monitors price movements following the close of trading in foreign stock markets through a series of country specific market proxies (such as baskets of American Depositary Receipts, futures contracts and exchange traded funds). These price movements are measured against established trigger thresholds for each specific market proxy to assist in determining if an event has occurred that may call into question the reliability of the values of the foreign securities held by the Fund. If such an event occurs, the securities may be valued using fair value procedures, which may include the use of independent pricing services.
When the last day of the reporting period is a non-business day, certain foreign markets may be open on those days that the NYSE is closed, which could result in differences between the value of the Fund’s portfolio securities on the last business day and the last calendar day of the reporting period. Any significant security valuation changes due to an open foreign market are adjusted and reflected by the Fund for financial reporting purposes.
b. Foreign Currency Translation
Portfolio securities and other assets and liabilities denominated in foreign currencies are translated into U.S. dollars based on the exchange rate of such currencies against U.S. dollars on the date of valuation. The Fund may enter into foreign currency exchange contracts to facilitate transactions denominated in a foreign currency. Purchases and sales of securities, income and expense items denominated in foreign currencies are translated into U.S. dollars at the exchange rate in effect on the transaction date. Portfolio securities and assets and liabilities denominated in foreign currencies contain risks that those currencies will decline in value relative to the U.S. dollar. Occasionally, events may impact the availability or reliability of foreign exchange rates used to convert the U.S. dollar equivalent value. If such an
event occurs, the foreign exchange rate will be valued at fair value using procedures established and approved by the Board.
The Fund does not separately report the effect of changes in foreign exchange rates from changes in market prices on securities held. Such changes are included in net realized and unrealized gain or loss from investments in the Statement of Operations.
Realized foreign exchange gains or losses arise from sales of foreign currencies, currency gains or losses realized between the trade and settlement dates on securities transactions and the difference between the recorded amounts of dividends, interest, and foreign withholding taxes and the U.S. dollar equivalent of the amounts actually received or paid. Net unrealized foreign exchange gains and losses arise from changes in foreign exchange rates on foreign denominated assets and liabilities other than investments in securities held at the end of the reporting period.
c. Joint Repurchase Agreement
The Fund enters into a joint repurchase agreement whereby its uninvested cash balance is deposited into a joint cash account with other funds managed by the investment manager or an affiliate of the investment manager and is used to invest in one or more repurchase agreements. The value and face amount of the joint repurchase agreement are allocated to the funds based on their pro-rata interest. A repurchase agreement is accounted for as a loan by the Fund to the seller, collateralized by securities which are delivered to the Fund’s custodian. The fair value, including accrued interest, of the initial collateralization is required to be at least 102% of the dollar amount invested by the funds, with the value of the underlying securities marked to market daily to maintain coverage of at least 100%. Repurchase agreements are subject to the terms of Master Repurchase Agreements (MRAs) with approved counterparties (sellers). The MRAs contain various provisions, including but not limited to events of default and maintenance of collateral for repurchase agreements. In the event of default by either the seller or the Fund, certain MRAs may permit the non-defaulting party to net and close-out all transactions, if any, traded under such agreements. The Fund may sell securities it holds as collateral and apply the proceeds towards the repurchase price and any other amounts owed by the seller to the Fund in the event of default by the seller. This could involve costs or delays in addition to a loss on the securities if their value falls below the repurchase price owed by the seller. The joint repurchase agreement held
| Semiannual Report | FSV-19 |
FRANKLIN TEMPLETON VARIABLE INSURANCE PRODUCTS TRUST
NOTES TO FINANCIAL STATEMENTS (UNAUDITED)
Franklin Small Cap Value VIP Fund (continued)
1. Organization and Significant Accounting Policies (continued)
c. Joint Repurchase Agreement (continued)
by the Fund at period end, as indicated in the Statement of Investments, had been entered into on June 30, 2016.
d. Securities Lending
The Fund participates in an agency based securities lending program to earn additional income. The Fund receives cash collateral against the loaned securities in an amount equal to at least 102% of the fair value of the loaned securities. Collateral is maintained over the life of the loan in an amount not less than 100% of the fair value of loaned securities, as determined at the close of Fund business each day; any additional collateral required due to changes in security values is delivered to the Fund on the next business day. The collateral is deposited into a joint cash account with other funds and is used to invest in a money market fund managed by Franklin Advisers, Inc., an affiliate of the Fund, and/or a joint repurchase agreement. The Fund may receive income from the investment of cash collateral, in addition to lending fees and rebates paid by the borrower. Income from securities loaned, net of fees paid to the securities lending agent and/or third-party vendor, is reported separately in the Statement of Operations. The Fund bears the market risk with respect to the collateral investment, securities loaned, and the risk that the agent may default on its obligations to the Fund. If the borrower defaults on its obligation to return the securities loaned, the Fund has the right to repurchase the securities in the open market using the collateral received. The securities lending agent has agreed to indemnify the Fund in the event of default by a third party borrower.
e. Income and Deferred Taxes
It is the Fund’s policy to qualify as a regulated investment company under the Internal Revenue Code. The Fund intends to distribute to shareholders substantially all of its taxable income and net realized gains to relieve it from federal income and if applicable, excise taxes. As a result, no provision for U.S. federal income taxes is required.
The Fund may be subject to foreign taxation related to income received, capital gains on the sale of securities and certain foreign currency transactions in the foreign jurisdictions in which it invests. Foreign taxes, if any, are recorded based on the tax regulations and rates that exist in the foreign markets in which
the Fund invests. When a capital gain tax is determined to apply, the Fund records an estimated deferred tax liability in an amount that would be payable if the securities were disposed of on the valuation date.
The Fund may recognize an income tax liability related to its uncertain tax positions under U.S. GAAP when the uncertain tax position has a less than 50% probability that it will be sustained upon examination by the tax authorities based on its technical merits. As of June 30, 2016, the Fund has determined that no tax liability is required in its financial statements related to uncertain tax positions for any open tax years (or expected to be taken in future tax years). Open tax years are those that remain subject to examination and are based on each tax jurisdiction’s statute of limitation.
f. Security Transactions, Investment Income, Expenses and Distributions
Security transactions are accounted for on trade date. Realized gains and losses on security transactions are determined on a specific identification basis. Interest income and estimated expenses are accrued daily. Amortization of premium and accretion of discount on debt securities are included in interest income. Dividend income is recorded on the ex-dividend date except for certain dividends from foreign securities where the dividend rate is not available. In such cases, the dividend is recorded as soon as the information is received by the Fund. Distributions to shareholders are recorded on the ex-dividend date and are determined according to income tax regulations (tax basis). Distributable earnings determined on a tax basis may differ from earnings recorded in accordance with U.S. GAAP. These differences may be permanent or temporary. Permanent differences are reclassified among capital accounts to reflect their tax character. These reclassifications have no impact on net assets or the results of operations. Temporary differences are not reclassified, as they may reverse in subsequent periods.
Common expenses incurred by the Trust are allocated among the Funds based on the ratio of net assets of each Fund to the combined net assets of the Trust. Fund specific expenses are charged directly to the fund that incurred the expense.
Realized and unrealized gains and losses and net investment income, not including class specific expenses, are allocated daily to each class of shares based upon the relative proportion of net assets of each class. Differences in per share distributions, by class, are generally due to differences in class specific expenses.
| FSV-20 | Semiannual Report |
FRANKLIN TEMPLETON VARIABLE INSURANCE PRODUCTS TRUST
NOTES TO FINANCIAL STATEMENTS (UNAUDITED)
Franklin Small Cap Value VIP Fund (continued)
g. Accounting Estimates
The preparation of financial statements in accordance with U.S. GAAP requires management to make estimates and assumptions that affect the reported amounts of assets and liabilities at the date of the financial statements and the amounts of income and expenses during the reporting period. Actual results could differ from those estimates.
h. Guarantees and Indemnifications
Under the Trust’s organizational documents, its officers and trustees are indemnified by the Trust against certain liabilities
arising out of the performance of their duties to the Trust. Additionally, in the normal course of business, the Trust, on behalf of the Fund, enters into contracts with service providers that contain general indemnification clauses. The Trust’s maximum exposure under these arrangements is unknown as this would involve future claims that may be made against the Trust that have not yet occurred. Currently, the Trust expects the risk of loss to be remote.
2. Shares of Beneficial Interest
At June 30, 2016, there were an unlimited number of shares authorized (without par value). Transactions in the Fund’s shares were as follows:
| Six Months Ended June 30, 2016 | Year Ended December 31, 2015 | |||||||||||||||||||
| Shares | Amount | Shares | Amount | |||||||||||||||||
| Class 1 Shares: | ||||||||||||||||||||
Shares sold | 69,382 | $ | 1,262,552 | 97,924 | $ | 2,017,340 | ||||||||||||||
Shares issued in reinvestment of distributions | 456,683 | 7,649,438 | 407,044 | 8,149,019 | ||||||||||||||||
Shares redeemed | (173,182 | ) | (3,144,793 | ) | (507,751 | ) | (10,332,072 | ) | ||||||||||||
|
| |||||||||||||||||||
Net increase (decrease) | 352,883 | $ | 5,767,197 | (2,783 | ) | $ | (165,713 | ) | ||||||||||||
|
| |||||||||||||||||||
| Class 2 Shares: | ||||||||||||||||||||
Shares sold | 2,756,238 | $ | 49,544,180 | 3,551,318 | $ | 71,764,155 | ||||||||||||||
Shares issued in reinvestment of distributions | 12,018,000 | 195,773,219 | 10,305,710 | 201,579,696 | ||||||||||||||||
Shares redeemed | (5,914,169 | ) | (104,271,382 | ) | (12,288,306 | ) | (247,644,089 | ) | ||||||||||||
|
| |||||||||||||||||||
Net increase (decrease) | 8,860,069 | $ | 141,046,017 | 1,568,722 | $ | 25,699,762 | ||||||||||||||
|
| |||||||||||||||||||
| Class 4 Shares: | ||||||||||||||||||||
Shares sold | 122,353 | $ | 2,213,903 | 220,435 | $ | 4,535,105 | ||||||||||||||
Shares issued in reinvestment of distributions | 253,312 | 4,210,041 | 221,510 | 4,405,833 | ||||||||||||||||
Shares redeemed | (206,169 | ) | (3,693,940 | ) | (332,844 | ) | (6,631,937 | ) | ||||||||||||
|
| |||||||||||||||||||
Net increase (decrease) | 169,496 | $ | 2,730,004 | 109,101 | $ | 2,309,001 | ||||||||||||||
|
| |||||||||||||||||||
3. Transactions With Affiliates
Franklin Resources, Inc. is the holding company for various subsidiaries that together are referred to as Franklin Templeton Investments. Certain officers and trustees of the Fund are also officers and/or directors of the following subsidiaries:
| Subsidiary | Affiliation | |
Franklin Advisory Services, LLC (Advisory Services) | Investment manager | |
Franklin Templeton Services, LLC (FT Services) | Administrative manager | |
Franklin Templeton Distributors, Inc. (Distributors) | Principal underwriter | |
Franklin Templeton Investor Services, LLC (Investor Services) | Transfer agent |
| Semiannual Report | FSV-21 |
FRANKLIN TEMPLETON VARIABLE INSURANCE PRODUCTS TRUST
NOTES TO FINANCIAL STATEMENTS (UNAUDITED)
Franklin Small Cap Value VIP Fund (continued)
3. Transactions With Affiliates (continued)
a. Management Fees
The Fund pays an investment management fee to Advisory Services based on the average daily net assets of the Fund as follows:
| Annualized Fee Rate | Net Assets | |
0.750% | Up to and including $200 million | |
0.635% | Over $200 million, up to and including $700 million | |
0.600% | Over $700 million, up to and including $1.2 billion | |
0.575% | Over $1.2 billion, up to and including $1.3 billion | |
0.475% | In excess of $1.3 billion |
For the period ended June 30, 2016, the effective management fee rate was 0.637% of the Fund’s average daily net assets.
b. Administrative Fees
Under an agreement with Advisory Services, FT Services provides administrative services to the Fund. The fee is paid by Advisory Services based on the Fund’s average daily net assets, and is not an additional expense of the Fund.
c. Distribution Fees
The Board has adopted distribution plans for Class 2 and Class 4 shares pursuant to Rule 12b-1 under the 1940 Act. Under the Fund’s compensation distribution plans, the Fund pays Distributors for costs incurred in connection with the servicing, sale and distribution of the Fund’s shares up to 0.35% per year of its average daily net assets of each class. The Board has agreed to limit the current rate to 0.25% per year for Class 2. The plan year, for purposes of monitoring compliance with the maximum annual plan rates, is February 1 through January 31.
d. Transfer Agent Fees
Investor Services, under terms of an agreement, performs shareholder servicing for the Fund and is not paid by the Fund for the services.
e. Investments in Affiliated Management Investment Companies
The Fund invests in one or more affiliated management investment companies for purposes other than exercising a controlling influence over the management or policies. Management fees paid by the Fund are waived on assets invested in the affiliated management investment companies, as noted in the Statement of Operations, in an amount not to exceed the management and administrative fees paid directly or indirectly by each affiliate. Prior to January 1, 2014, the waiver was accounted for as a reduction to management fees.
Number of Shares Held at Beginning of Period | Gross Additions | Gross Reductions | Number of Shares Held at End of Period | Value at End of Period | Investment Income | Realized Gain (Loss) | % of Affiliated Fund Shares Outstanding Held at End of Period | |||||||||||||||||||||||
| Non-Controlled Affiliates | ||||||||||||||||||||||||||||||
Institutional Fiduciary Trust Money | 103,357,618 | 156,371,810 | (136,458,993 | ) | 123,270,435 | $ | 123,270,435 | $ | — | $ | — | 0.6% | ||||||||||||||||||
|
|
|
|
|
| |||||||||||||||||||||||||
| FSV-22 | Semiannual Report |
FRANKLIN TEMPLETON VARIABLE INSURANCE PRODUCTS TRUST
NOTES TO FINANCIAL STATEMENTS (UNAUDITED)
Franklin Small Cap Value VIP Fund (continued)
4. Expense Offset Arrangement
The Fund has entered into an arrangement with its custodian whereby credits realized as a result of uninvested cash balances are used to reduce a portion of the Fund’s custodian expenses. During the period ended June 30, 2016, there were no credits earned.
5. Income taxes
At June 30, 2016, the cost of investments and net unrealized appreciation (depreciation) for income tax purposes were as follows:
Cost of investments | $ | 1,040,055,242 | ||
|
| |||
Unrealized appreciation | $ | 349,012,578 | ||
Unrealized depreciation | (62,201,109 | ) | ||
|
| |||
Net unrealized appreciation (depreciation) | $ | 286,811,469 | ||
|
|
Differences between income and/or capital gains as determined on a book basis and a tax basis are primarily due to differing treatments of passive foreign investment company shares and wash sales.
6. Investment Transactions
Purchases and sales of investments (excluding short term securities) for the period ended June 30, 2016, aggregated $207,892,601 and $277,013,252, respectively.
At June 30, 2016, in connection with securities lending transactions, the Fund loaned equity investments and received $6,041,821 of cash collateral. The gross amount of recognized liability for such transactions is included in payable upon return of securities loaned in the Statement of Assets and Liabilities. The agreements can be terminated at any time.
7. Credit Facility
The Fund, together with other U.S. registered and foreign investment funds (collectively, Borrowers), managed by Franklin Templeton Investments, are borrowers in a joint syndicated senior unsecured credit facility totaling $2 billion (Global Credit Facility) which matures on February 10, 2017. This Global Credit Facility provides a source of funds to the Borrowers for temporary and emergency purposes, including the ability to meet future unanticipated or unusually large redemption requests.
Under the terms of the Global Credit Facility, the Fund shall, in addition to interest charged on any borrowings made by the Fund and other costs incurred by the Fund, pay its share of fees and expenses incurred in connection with the implementation and maintenance of the Global Credit Facility, based upon its relative share of the aggregate net assets of all of the Borrowers, including an annual commitment fee of 0.07% based upon the unused portion of the Global Credit Facility. Effective February 12, 2016, the annual commitment fee is 0.15%. These fees are reflected in other expenses in the Statement of Operations. During the period ended June 30, 2016, the Fund did not use the Global Credit Facility.
8. Fair Value Measurements
The Fund follows a fair value hierarchy that distinguishes between market data obtained from independent sources (observable inputs) and the Fund’s own market assumptions (unobservable inputs). These inputs are used in determining the value of the Fund’s financial instruments and are summarized in the following fair value hierarchy:
| • | Level 1 – quoted prices in active markets for identical financial instruments |
| • | Level 2 – other significant observable inputs (including quoted prices for similar financial instruments, interest rates, prepayment speed, credit risk, etc.) |
| • | Level 3 – significant unobservable inputs (including the Fund’s own assumptions in determining the fair value of financial instruments) |
| Semiannual Report | FSV-23 |
FRANKLIN TEMPLETON VARIABLE INSURANCE PRODUCTS TRUST
NOTES TO FINANCIAL STATEMENTS (UNAUDITED)
Franklin Small Cap Value VIP Fund (continued)
8. Fair Value Measurements (continued)
The input levels are not necessarily an indication of the risk or liquidity associated with financial instruments at that level.
For movements between the levels within the fair value hierarchy, the Fund has adopted a policy of recognizing the transfers as of the date of the underlying event which caused the movement.
A summary of inputs used as of June 30, 2016, in valuing the Fund’s assets carried at fair value, is as follows:
| Level 1 | Level 2 | Level 3 | Total | |||||||||||||
| Assets: | ||||||||||||||||
Investments in Securities | ||||||||||||||||
Equity Investmentsa | $ | 1,194,898,575 | $ | — | $ | — | $ | 1,194,898,575 | ||||||||
Corporate Bonds | — | 7,488,880 | — | 7,488,880 | ||||||||||||
Short Term Investments | 123,270,435 | 1,208,821 | — | 124,479,256 | ||||||||||||
|
| |||||||||||||||
Total Investments in Securities | $ | 1,318,169,010 | $ | 8,697,701 | $ | — | $ | 1,326,866,711 | ||||||||
|
| |||||||||||||||
aFor detailed categories, see the accompanying Statement of Investments.
9. Subsequent Events
The Fund has evaluated subsequent events through the issuance of the financial statements and determined that no events have occurred that require disclosure.
| FSV-24 | Semiannual Report |
Franklin Small-Mid Cap Growth VIP Fund
This semiannual report for Franklin Small-Mid Cap Growth VIP Fund covers the period ended June 30, 2016.
Class 4 Performance Summary as of June 30, 2016
The Fund’s Class 4 shares had a -0.73% total return* for the six-month period ended June 30, 2016.
*The Fund has a fee waiver associated with any investment in a Franklin Templeton money fund and/or Franklin Templeton fund, as applicable, contractually guaranteed through at least its current fiscal year-end. Fund investment results reflect the fee waiver, to the extent applicable; without this reduction, the results would have been lower.
Performance reflects the Fund’s Class 4 operating expenses, but does not include any contract fees, expenses or sales charges. If they had been included, performance would be lower. These charges and deductions, particularly for variable life policies, can have a significant effect on contract values and insurance benefits. See the contract prospectus for a complete description of these expenses, including sales charges.
Performance data represent past performance, which does not guarantee future results. Investment return and principal value will fluctuate, and you may have a gain or loss when you sell your shares. Current performance may differ from figures shown.
| Semiannual Report | FSC-1 |
FRANKLIN SMALL-MID CAP GROWTH VIP FUND
Fund Goal and Main Investments
The Fund seeks long-term capital growth. Under normal market conditions, the Fund invests at least 80% of its net assets in equity securities of small-capitalization and mid-capitalization companies. For this Fund, small cap companies are those within the market capitalization range of companies in the Russell 2500TM Index at the time of purchase, and midcap companies are those within the market capitalization range of companies in the Russell Midcap® Index at the time of purchase.1
Fund Risks
All investments involve risks, including possible loss of principal. Growth stock prices reflect projections of future earnings or revenues, and can, therefore, fall dramatically if the company fails to meet those projections. Smaller, midsized and relatively new or unseasoned companies can be particularly sensitive to changing economic conditions, and their prospects for growth are less certain than those of larger, more established companies. Historically, these securities have experienced more price volatility than larger company stocks, especially over the short term. To the extent the Fund focuses on particular countries, regions, industries, sectors or types of investment from time to time, it may be subject to greater risks of adverse developments in such areas of focus than a fund that invests in a wider variety of countries, regions, industries, sectors or investments. From time to time, the trading market for a particular security or type of security in which the Fund invests may become less liquid or even illiquid. The Fund is actively managed but there is no guarantee that the manager’s investment decisions will produce the desired results. The Fund’s prospectus also includes a description of the main investment risks.
Performance Overview
You can find the Fund’s six-month total return in the Performance Summary. In comparison, the Fund’s narrow benchmark, the Russell Midcap® Growth Index, generated a +2.15% total return, and its broad benchmark, the Standard & Poor’s® 500 Index (S&P 500®), produced a +3.84% total return for the same period.2
Economic and Market Overview
For the six-month period ended June 30, 2016, the U.S. economy grew moderately, as measured by gross domestic product in 2016’s first and second quarters, driven by consumer spending and exports. A decline in private inventory investment and nonresidential fixed investment contributed to the moderation. Although the unemployment rate rose from 4.7% in May to 4.9% in June, the increase was due to additional people entering the labor force, and for the entire period under review, unemployment declined slightly.3 Home sales and prices rose amid relatively low mortgage rates. Monthly retail sales grew during most of the review period, and rose to the highest level in April in more than a year, due to a broad-based increase across most retail categories. Inflation, as measured by the Consumer Price Index, remained subdued overall even though it spiked to the highest level in three years in April mainly due to a rebound in energy prices.
After raising its target range for the federal funds rate to 0.25%–0.50% at its December meeting, the Federal Reserve (Fed) maintained the rate through period-end. Although the Fed indicated a potential interest rate hike in June, subsequent reports showed job additions slowed substantially in May. Consequently, at its June meeting, the Fed kept the federal funds rate unchanged, and indicated that in determining the timing and size of future adjustments to the target range, it will assess realized and expected economic conditions relative to its objectives of maximum employment and 2.00% inflation. The Fed expects economic conditions to evolve in a manner that could warrant only gradual increases in the federal funds rate.
U.S. equity markets rose for the period under review, as investors generally remained confident due to the Fed’s continued caution surrounding further interest rate increases, the European Central Bank expanding its quantitative easing measures and cutting its benchmark interest rate to zero, the People’s Bank of China introducing further easing measures and the Bank of Japan adopting a negative interest rate policy. The rally in crude oil prices near period-end also boosted investor confidence. However, the U.K.’s historic referendum to leave the European Union (also known as the “Brexit”), global economic growth concerns and China’s slowing economy weighed on market sentiment. Despite periods of volatility, the broad U.S. stock market ended the six-month period higher, as measured by the S&P 500.
1. Please see Index Descriptions following the Fund Summaries.
2. Source: Morningstar. One cannot invest directly in an index, and an index is not representative of the Fund’s portfolio. Please see Index Descriptions following the Fund Summaries.
3. Bureau of Labor Statistics.
| FSC-2 | Semiannual Report |
FRANKLIN SMALL-MID CAP GROWTH VIP FUND
Investment Strategy
We use fundamental, bottom-up research to seek companies meeting our criteria of growth potential, quality and valuation. In seeking sustainable growth characteristics, we look for companies we believe can produce sustainable earnings and cash flow growth, evaluating the long-term market opportunity and competitive structure of an industry to target leaders and emerging leaders. We define quality companies as those with strong and improving competitive positions in attractive markets. We also believe important attributes of quality are experienced and talented management teams as well as financial strength reflected in the capital structure, gross and operating margins, free cash flow generation and returns on capital employed. Our valuation analysis includes a range of potential outcomes based on an assessment of multiple scenarios. In assessing value, we consider whether security prices fully reflect the balance of the sustainable growth opportunities relative to business and financial risks.
Manager’s Discussion
For the six-month period ended June 30, 2016, some sectors represented in the Fund’s portfolio contributed to absolute performance. Relative to the Fund’s narrow benchmark, the Russell Midcap® Growth Index, key contributors included an overweighted position in energy and stock selection in the materials and consumer staples sectors. In energy, the Fund’s holding in natural gas provider EQT benefited from a sharp rebound in natural gas prices following a record warm winter that caused prices to decrease. The company also had a strong balance sheet and large cash position, which enabled EQT to add to its Marcellus Shale position through acquisitions at what we considered attractive values. In the materials and consumer staples sectors, positions in construction materials manufacturer Martin Marietta Materials and private label packaged food company TreeHouse Foods aided the Fund’s relative performance. Martin Marietta Materials experienced boosted performance as a stronger residential construction environment and the passage of a federal highway bill in December 2015 supported strong demand for cement and other construction materials. The company has enjoyed solid profit margins and meaningful pricing growth for its products. In addition, Martin Marietta sold its California cement plant, which contributed to margin expansion, and purchased additional assets in Colorado, which led the company to benefit from the Denver metropolitan area’s strong housing environment. Share buybacks also supported the company’s share price, as did disciplined capital allocation, in
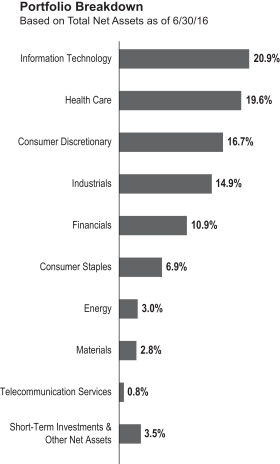
our view. TreeHouse serves an array of customers including Wal-Mart, Safeway and Whole Foods, and near the beginning of the period, expanded its base by acquiring ConAgra’s private brands business at what we believed was an attractive price. In our analysis, this acquisition will benefit TreeHouse for many years. Additionally, during the period the company was able to double its revenue base, broaden its portfolio and ultimately increase its value proposition to retailers. We further believe there are substantial cost and revenue synergies, which are not fully appreciated in consensus expectations.
Other notable contributors to the Fund’s relative performance included oil and natural gas provider Concho Resources and geospatial information products and services provider DigitalGlobe. Concho Resources improved drilling efficiencies during the period. This improvement along with the company’s overall operational performance supported 2017 guidance for double-digit production growth, well above the market’s perceived value. The company continued to be relatively conservative in drilling its
| Semiannual Report | FSC-3 |
FRANKLIN SMALL-MID CAP GROWTH VIP FUND
Permian oil acreage on the western side of the basin, traditionally drilling shorter horizontal wells and using smaller hydraulic fracturing activities than its peers. However, the company began to move toward bigger and longer horizontal wells, which can provide more upside to reserves and production in the long term. Shares of DigitalGlobe increased due to strong revenue and earnings per share. This period, however, did follow a year of underperformance for the company, but we believe management has improved its ability to set reasonable and achievable expectations. The company renewed two of its three largest contracts, captured new contracts and the increased global threat environment provided further upside potential to revenue and profitability due to some shorter cycle sales. In the first quarter of 2016, management increased its focus on costs and being more capital efficient.
In contrast, key detractors from the Fund’s relative performance included an overweighted position in the health care sector along with stock selection in the health care, industrials and financials sectors. In health care, shares of specialty pharmaceuticals manufacturer Perrigo fell due to news of the departure of its chief executive officer and a concurrent reduction in guidance. Margins for the company’s prescriptions segment were hurt by an unusual spike in approvals for competitor drugs. We believe margins will likely recover as Perrigo’s own drugs gain approval and with new management’s focus on improving operational efficiency at its recently acquired, underperforming European subsidiary.
Within industrials, Robert Half International (RHI), a specialized staffing company, generally met expectations during the period. However, earnings guidance consistently declined due to slowing growth in the demand for the company’s temporary staffing services, which management attributed to a cautious approach to hiring by clients amid global economic uncertainty. Moreover, we believe the lower-than-expected U.S. May nonfarm payroll report and the Brexit contributed to greater economic uncertainty, which could further extend the cautious hiring approach of RHI’s clients. In the financials sector, shares of financial advisory and asset management company Lazard, which is heavily tied to the U.K. and Europe in general, was negatively impacted by the Brexit.
| Top 10 Holdings | ||||
| 6/30/16 | ||||
Company Sector/Industry | % of Total Net Assets | |||
| Constellation Brands Inc Consumer Staples | 2.2% | |||
| Electronic Arts Inc. Information Technology | 2.0% | |||
| Intercontinental Exchange Inc. Financials | 1.9% | |||
| Roper Technologies Inc. Industrials | 1.8% | |||
| Equinix Inc. Financials | 1.8% | |||
| Monster Beverage Corp. Consumer Staples | 1.8% | |||
| Edwards Lifesciences Corp. Health Care | 1.6% | |||
| NXP Semiconductors NV (Netherlands) Information Technology | 1.6% | |||
| The Cooper Cos. Inc. Health Care | 1.5% | |||
| Willis Towers Watson PLC Financials | 1.5% | |||
The dollar value, number of shares or principal amount, and names of all portfolio holdings are listed in the Fund’s Statement of Investments (SOI).
Thank you for your participation in Franklin Small-Mid Cap Growth VIP Fund. We look forward to serving your future investment needs.
The foregoing information reflects our analysis, opinions and portfolio holdings as of June 30, 2016, the end of the reporting period. The way we implement our main investment strategies and the resulting portfolio holdings may change depending on factors such as market and economic conditions. These opinions may not be relied upon as investment advice or an offer for a particular security. The information is not a complete analysis of every aspect of any market, country, industry, security or the Fund. Statements of fact are from sources considered reliable, but the investment manager makes no representation or warranty as to their completeness or accuracy. Although historical performance is no guarantee of future results, these insights may help you understand our investment management philosophy.
| FSC-4 | Semiannual Report |
FRANKLIN SMALL-MID CAP GROWTH VIP FUND
Class 4 Fund Expenses
As an investor in a variable insurance contract (Contract) that indirectly provides for investment in an underlying mutual fund, you can incur transaction and/or ongoing expenses at both the Fund level and the Contract level.
| • | Transaction expenses can include sales charges (loads) on purchases, surrender fees, transfer fees and premium taxes. |
| • | Ongoing expenses can include management fees, distribution and service (12b-1) fees, contract fees, annual maintenance fees, mortality and expense risk fees and other fees and expenses. All mutual funds and Contracts have some types of ongoing expenses. |
The expenses shown in the table are meant to highlight ongoing expenses at the Fund level only and do not include ongoing expenses at the Contract level, or transaction expenses at either the Fund or Contract levels. While the Fund does not have transaction expenses, if the transaction and ongoing expenses at the Contract level were included, the expenses shown below would be higher. You should consult your Contract prospectus or disclosure document for more information.
The table shows Fund-level ongoing expenses and can help you understand these expenses and compare them with those of other mutual funds offered through the Contract. The table assumes a $1,000 investment held for the six months indicated. Please refer to the Fund prospectus for additional information on operating expenses.
Actual Fund Expenses
The first line (Actual) of the table provides actual account values and expenses. The “Ending Account Value” is derived from the Fund’s actual return, which includes the effect of ongoing Fund expenses, but does not include the effect of ongoing Contract expenses.
You can estimate the Fund-level expenses you incurred during the period by following these steps. Of course, your account value and expenses will differ from those in this illustration:
| 1. | Divide your account value by $1,000. |
If an account had an $8,600 value, then $8,600 ÷ $1,000 = 8.6.
| 2. | Multiply the result by the number under the heading “Fund-Level Expenses Incurred During Period.” |
If Fund-Level Expenses Incurred During Period were $7.50, then 8.6 × $7.50 = $64.50.
In this illustration, the estimated expenses incurred this period at the Fund level are $64.50.
Hypothetical Example for Comparison with Other Mutual Funds
Information in the second line (Hypothetical) of the table can help you compare ongoing expenses of the Fund with those of other mutual funds offered through the Contract. This information may not be used to estimate the actual ending account balance or expenses you incurred during the period. The hypothetical “Ending Account Value” is based on the Fund’s actual expense ratio and an assumed 5% annual rate of return before expenses, which does not represent the Fund’s actual return. The figure under the heading “Fund-Level Expenses Incurred During Period” shows the hypothetical expenses your account would have incurred under this scenario. You can compare this figure with the 5% hypothetical examples that appear in shareholder reports of other funds offered through a Contract.
| Class 4 | Beginning Account Value 1/1/16 | Ending Account Value 6/30/16 | Fund-Level Expenses 1/1/16–6/30/16 | |||||||||
Actual | $ | 1,000 | $ | 992.70 | $ | 5.85 | ||||||
Hypothetical (5% return before expenses) | $ | 1,000 | $ | 1,019.00 | $ | 5.92 | ||||||
*Expenses are calculated using the most recent six-month annualized expense ratio, net of expense waivers, for the Fund’s Class 4 shares (1.18%), which does not include any ongoing expenses of the Contract for which the Fund is an investment option, multiplied by the average account value over the period, multiplied by 182/366 to reflect the one-half year period.
| Semiannual Report | FSC-5 |
FRANKLIN TEMPLETON VARIABLE INSURANCE PRODUCTS TRUST
Financial Highlights
Franklin Small-Mid Cap Growth VIP Fund
Six Months Ended (unaudited) | Year Ended December 31, | |||||||||||||||||||||||
| 2015 | 2014 | 2013 | 2012 | 2011 | ||||||||||||||||||||
| Class 1 | ||||||||||||||||||||||||
| Per share operating performance (for a share outstanding throughout the period) | ||||||||||||||||||||||||
Net asset value, beginning of period | $19.09 | $24.95 | $28.38 | $21.87 | $21.19 | $22.21 | ||||||||||||||||||
|
| |||||||||||||||||||||||
| Income from investment operationsa: | ||||||||||||||||||||||||
Net investment income (loss)b | (0.01 | ) | — | c,d | (0.07 | ) | (0.09 | ) | (0.01 | )e | (0.05 | ) | ||||||||||||
Net realized and unrealized gains (losses) | (0.09 | ) | (0.03 | ) | 2.04 | 8.19 | 2.27 | (0.97 | ) | |||||||||||||||
|
| |||||||||||||||||||||||
Total from investment operations | (0.10 | ) | (0.03 | ) | 1.97 | 8.10 | 2.26 | (1.02 | ) | |||||||||||||||
|
| |||||||||||||||||||||||
Less distributions from net realized gains | (2.06 | ) | (5.83 | ) | (5.40 | ) | (1.59 | ) | (1.58 | ) | — | |||||||||||||
|
| |||||||||||||||||||||||
Net asset value, end of period | $16.93 | $19.09 | $24.95 | $28.38 | $21.87 | $21.19 | ||||||||||||||||||
|
| |||||||||||||||||||||||
Total returnf | (0.53)% | (2.44)% | 7.78% | 38.50% | 11.12% | (4.59)% | ||||||||||||||||||
| Ratios to average net assetsg | ||||||||||||||||||||||||
Expenses before waiver and payments by affiliates | 0.84% | 0.81% | 0.80% | 0.80% | 0.80% | 0.79% | ||||||||||||||||||
Expenses net of waiver and payments by affiliates | 0.83% | h | 0.81% | i | 0.80% | i | 0.80% | h | 0.80% | 0.79% | ||||||||||||||
Net investment income (loss) | (0.08)% | 0.01% | d | (0.29)% | (0.35)% | (0.03)% | e | (0.21)% | ||||||||||||||||
| Supplemental data | ||||||||||||||||||||||||
Net assets, end of period (000’s) | $81,189 | $87,866 | $99,803 | $98,020 | $75,977 | $76,384 | ||||||||||||||||||
Portfolio turnover rate | 14.04% | 37.85% | 48.73% | 42.77% | 41.44% | 45.00% | ||||||||||||||||||
aThe amount shown for a share outstanding throughout the period may not correlate with the Statement of Operations for the period due to the timing of sales and repurchases of the Fund’s shares in relation to income earned and/or fluctuating fair value of the investments of the Fund.
bBased on average daily shares outstanding.
cAmount rounds to less than $0.01 per share.
dNet investment income per share includes approximately $0.05 per share related to income received in the form of special dividends in connection with certain Fund holdings. Excluding this amount, the ratio of net investment income to average net assets would have been (0.24)%.
eNet investment income per share includes approximately $0.03 per share related to income received in the form of special dividends in connection with certain Fund holdings. Excluding this amount, the ratio of net investment income to average net assets would have been (0.16)%.
fTotal return does not include fees, charges or expenses imposed by the variable annuity and life insurance contracts for which Franklin Templeton Variable Insurance Products Trust serves as an underlying investment vehicle. Total return is not annualized for periods less than one year.
gRatios are annualized for periods less than one year.
hBenefit of expense reduction rounds to less than 0.01%.
iBenefit of waiver and payments by affiliates rounds to less than 0.01%.
| FSC-6 | Semiannual Report | The accompanying notes are an integral part of these financial statements. |
FRANKLIN TEMPLETON VARIABLE INSURANCE PRODUCTS TRUST
FINANCIAL HIGHLIGHTS
Franklin Small-Mid Cap Growth VIP Fund (continued)
Six Months Ended (unaudited) | Year Ended December 31, | |||||||||||||||||||||||
| 2015 | 2014 | 2013 | 2012 | 2011 | ||||||||||||||||||||
| Class 2 | ||||||||||||||||||||||||
| Per share operating performance (for a share outstanding throughout the period) | ||||||||||||||||||||||||
Net asset value, beginning of period | $17.69 | $23.56 | $27.16 | $21.04 | $20.49 | $21.54 | ||||||||||||||||||
|
| |||||||||||||||||||||||
| Income from investment operationsa: | ||||||||||||||||||||||||
Net investment income (loss)b | (0.03 | ) | (0.05 | )c | (0.13 | ) | (0.14 | ) | (0.06 | )d | (0.10 | ) | ||||||||||||
Net realized and unrealized gains (losses) | (0.08 | ) | 0.01 | 1.93 | 7.85 | 2.19 | (0.95 | ) | ||||||||||||||||
|
| |||||||||||||||||||||||
Total from investment operations | (0.11 | ) | (0.04 | ) | 1.80 | 7.71 | 2.13 | (1.05 | ) | |||||||||||||||
|
| |||||||||||||||||||||||
Less distributions from net realized gains | (2.06 | ) | (5.83 | ) | (5.40 | ) | (1.59 | ) | (1.58 | ) | — | |||||||||||||
|
| |||||||||||||||||||||||
Net asset value, end of period | $15.52 | $17.69 | $23.56 | $27.16 | $21.04 | $20.49 | ||||||||||||||||||
|
| |||||||||||||||||||||||
Total returne | (0.63)% | (2.66)% | 7.47% | 38.15% | 10.85% | (4.87)% | ||||||||||||||||||
| Ratios to average net assetsf | ||||||||||||||||||||||||
Expenses before waiver and payments by affiliates | 1.09% | 1.06% | 1.05% | 1.05% | 1.05% | 1.04% | ||||||||||||||||||
Expenses net of waiver and payments by affiliates | 1.08% | g | 1.06% | h | 1.05% | h | 1.05% | g | 1.05% | 1.04% | ||||||||||||||
Net investment income (loss) | (0.33)% | (0.24)% | c | (0.54)% | (0.60)% | (0.28)% | d | (0.46)% | ||||||||||||||||
| Supplemental data | ||||||||||||||||||||||||
Net assets, end of period (000’s) | $447,066 | $478,649 | $582,772 | $660,806 | $670,193 | $717,086 | ||||||||||||||||||
Portfolio turnover rate | 14.04% | 37.85% | 48.73% | 42.77% | 41.44% | 45.00% | ||||||||||||||||||
aThe amount shown for a share outstanding throughout the period may not correlate with the Statement of Operations for the period due to the timing of sales and repurchases of the Fund’s shares in relation to income earned and/or fluctuating fair value of the investments of the Fund.
bBased on average daily shares outstanding.
cNet investment income per share includes approximately $0.05 per share related to income received in the form of special dividends in connection with certain Fund holdings. Excluding this amount, the ratio of net investment income to average net assets would have been (0.49)%.
dNet investment income per share includes approximately $0.03 per share related to income received in the form of special dividends in connection with certain Fund holdings. Excluding this amount, the ratio of net investment income to average net assets would have been (0.41)%.
eTotal return does not include fees, charges or expenses imposed by the variable annuity and life insurance contracts for which Franklin Templeton Variable Insurance Products Trust serves as an underlying investment vehicle. Total return is not annualized for periods less than one year.
fRatios are annualized for periods less than one year.
gBenefit of expense reduction rounds to less than 0.01%.
hBenefit of waiver and payments by affiliates rounds to less than 0.01%.
| The accompanying notes are an integral part of these financial statements. | Semiannual Report | FSC-7 |
FRANKLIN TEMPLETON VARIABLE INSURANCE PRODUCTS TRUST
FINANCIAL HIGHLIGHTS
Franklin Small-Mid Cap Growth VIP Fund (continued)
| Six Months Ended June 30, 2016 (unaudited) | Year Ended December 31, | |||||||||||||||||||||||
| 2015 | 2014 | 2013 | 2012 | 2011 | ||||||||||||||||||||
| Class 4 | ||||||||||||||||||||||||
| Per share operating performance (for a share outstanding throughout the period) | ||||||||||||||||||||||||
Net asset value, beginning of period | $18.23 | $24.14 | $27.72 | $21.47 | $20.90 | $21.98 | ||||||||||||||||||
|
| |||||||||||||||||||||||
| Income from investment operationsa: | ||||||||||||||||||||||||
Net investment income (loss)b | (0.04 | ) | (0.07 | )c | (0.16 | ) | (0.17 | ) | (0.09 | )d | (0.12 | ) | ||||||||||||
Net realized and unrealized gains (losses) | (0.09 | ) | (0.01 | ) | 1.98 | 8.01 | 2.24 | (0.96 | ) | |||||||||||||||
|
| |||||||||||||||||||||||
Total from investment operations | (0.13 | ) | (0.08 | ) | 1.82 | 7.84 | 2.15 | (1.08 | ) | |||||||||||||||
|
| |||||||||||||||||||||||
Less distributions from net realized gains | (2.06 | ) | (5.83 | ) | (5.40 | ) | (1.59 | ) | (1.58 | ) | — | |||||||||||||
|
| |||||||||||||||||||||||
Net asset value, end of period | $16.04 | $18.23 | $24.14 | $27.72 | $21.47 | $20.90 | ||||||||||||||||||
|
| |||||||||||||||||||||||
Total returne | (0.73)% | (2.77)% | 7.39% | 37.99% | 10.79% | (4.91)% | ||||||||||||||||||
| Ratios to average net assetsf | ||||||||||||||||||||||||
Expenses before waiver and payments by affiliates | 1.19% | 1.16% | 1.15% | 1.15% | 1.15% | 1.14% | ||||||||||||||||||
Expenses net of waiver and payments by affiliates | 1.18% | g | 1.16% | h | 1.15% | h | 1.15% | g | 1.15% | 1.14% | ||||||||||||||
Net investment income (loss) | (0.43)% | (0.34)% | c | (0.64)% | (0.70)% | (0.38)% | d | (0.56)% | ||||||||||||||||
| Supplemental data | ||||||||||||||||||||||||
Net assets, end of period (000’s) | $13,845 | $15,105 | $16,384 | $19,132 | $12,000 | $12,664 | ||||||||||||||||||
Portfolio turnover rate | 14.04% | 37.85% | 48.73% | 42.77% | 41.44% | 45.00% | ||||||||||||||||||
aThe amount shown for a share outstanding throughout the period may not correlate with the Statement of Operations for the period due to the timing of sales and repurchases of the Fund’s shares in relation to income earned and/or fluctuating fair value of the investments of the Fund.
bBased on average daily shares outstanding.
cNet investment income per share includes approximately $0.05 per share related to income received in the form of special dividends in connection with certain Fund holdings. Excluding this amount, the ratio of net investment income to average net assets would have been (0.59)%.
dNet investment income per share includes approximately $0.03 per share related to income received in the form of special dividends in connection with certain Fund holdings. Excluding this amount, the ratio of net investment income to average net assets would have been (0.51)%.
eTotal return does not include fees, charges or expenses imposed by the variable annuity and life insurance contracts for which Franklin Templeton Variable Insurance Products Trust serves as an underlying investment vehicle. Total return is not annualized for periods less than one year.
fRatios are annualized for periods less than one year.
gBenefit of expense reduction rounds to less than 0.01%.
hBenefit of waiver and payments by affiliates rounds to less than 0.01%.
| FSC-8 | Semiannual Report | The accompanying notes are an integral part of these financial statements. |
FRANKLIN TEMPLETON VARIABLE INSURANCE PRODUCTS TRUST
Statement of Investments, June 30, 2016 (unaudited)
Franklin Small-Mid Cap Growth VIP Fund
| ||||||||||
| Shares | Value | |||||||||
Common Stocks 96.2% | ||||||||||
Consumer Discretionary 16.4% | ||||||||||
Advance Auto Parts Inc. | 21,200 | $ | 3,426,555 | |||||||
| a | Buffalo Wild Wings Inc. | 30,500 | 4,237,975 | |||||||
Delphi Automotive PLC (United Kingdom) | 62,900 | 3,937,540 | ||||||||
Dick’s Sporting Goods Inc. | 142,600 | 6,425,556 | ||||||||
| a | Dollar Tree Inc. | 82,000 | 7,727,680 | |||||||
| a | Global Eagle Entertainment Inc. | 299,100 | 1,986,024 | |||||||
| a | Grand Canyon Education Inc. | 105,500 | 4,211,560 | |||||||
Hanesbrands Inc. | 210,500 | 5,289,865 | ||||||||
| a | IMAX Corp. (Canada) | 141,000 | 4,156,680 | |||||||
L Brands Inc. | 91,300 | 6,128,969 | ||||||||
| b | Marriott International Inc., A | 62,800 | 4,173,688 | |||||||
Newell Brands Inc. | 91,616 | 4,449,789 | ||||||||
| a | Norwegian Cruise Line Holdings Ltd. | 107,400 | 4,278,816 | |||||||
| a | NVR Inc. | 2,300 | 4,094,782 | |||||||
| a | O’Reilly Automotive Inc. | 15,700 | 4,256,270 | |||||||
Polaris Industries Inc. | 40,300 | 3,294,928 | ||||||||
Ross Stores Inc. | 71,600 | 4,059,004 | ||||||||
Tractor Supply Co. | 60,100 | 5,479,918 | ||||||||
| a,b | Under Armour Inc., A | 58,176 | 2,334,603 | |||||||
| a | Under Armour Inc., C | 51,036 | 1,857,700 | |||||||
| a,b | Zoe’s Kitchen Inc. | 88,700 | 3,217,149 | |||||||
|
| |||||||||
| 89,025,051 | ||||||||||
|
| |||||||||
Consumer Staples 6.9% | ||||||||||
Constellation Brands Inc., A | 73,200 | 12,107,280 | ||||||||
| a | Monster Beverage Corp. | 60,300 | 9,690,813 | |||||||
Pinnacle Foods Inc. | 38,300 | 1,772,907 | ||||||||
| a | TreeHouse Foods Inc. | 65,600 | 6,733,840 | |||||||
| a | WhiteWave Foods Co., A | 150,200 | 7,050,388 | |||||||
|
| |||||||||
| 37,355,228 | ||||||||||
|
| |||||||||
Energy 3.0% | ||||||||||
Cabot Oil & Gas Corp., A | 184,900 | 4,759,326 | ||||||||
| a | Concho Resources Inc. | 50,400 | 6,011,208 | |||||||
EQT Corp. | 34,600 | 2,679,078 | ||||||||
| a | Matador Resources Co. | 5,100 | 100,980 | |||||||
Superior Energy Services Inc. | 143,000 | 2,632,630 | ||||||||
|
| |||||||||
| 16,183,222 | ||||||||||
|
| |||||||||
Financials 10.9% | ||||||||||
| a | Affiliated Managers Group Inc. | 42,800 | 6,024,956 | |||||||
Arthur J. Gallagher & Co. | 105,200 | 5,007,520 | ||||||||
| a | CBRE Group Inc. | 150,500 | 3,985,240 | |||||||
Equinix Inc. | 25,225 | 9,780,489 | ||||||||
Intercontinental Exchange Inc. | 39,208 | 10,035,680 | ||||||||
Lazard Ltd. LP, A | 143,400 | 4,270,452 | ||||||||
Moody’s Corp. | 37,100 | 3,476,641 | ||||||||
| a | Signature Bank | 56,500 | 7,057,980 | |||||||
| a | SVB Financial Group | 12,000 | 1,141,920 | |||||||
Willis Towers Watson PLC | 66,400 | 8,254,184 | ||||||||
|
| |||||||||
| 59,035,062 | ||||||||||
|
| |||||||||
| Semiannual Report | FSC-9 |
FRANKLIN TEMPLETON VARIABLE INSURANCE PRODUCTS TRUST
STATEMENT OF INVESTMENTS (UNAUDITED)
Franklin Small-Mid Cap Growth VIP Fund (continued)
| Shares | Value | |||||||||
Common Stocks (continued) | ||||||||||
Health Care 19.6% | ||||||||||
| a,b | Acadia Pharmaceuticals Inc. | 38,970 | $ | 1,264,966 | ||||||
| a | Akorn Inc. | 175,100 | 4,987,723 | |||||||
| a | BioMarin Pharmaceutical Inc. | 31,047 | 2,415,457 | |||||||
| a,b | Celldex Therapeutics Inc. | 137,000 | 601,430 | |||||||
| a | Cerner Corp. | 87,700 | 5,139,220 | |||||||
The Cooper Cos. Inc. | 48,200 | 8,269,674 | ||||||||
| a | DaVita HealthCare Partners Inc. | 79,400 | 6,139,208 | |||||||
DENTSPLY SIRONA Inc. | 75,100 | 4,659,204 | ||||||||
| a | DexCom Inc. | 79,027 | 6,269,212 | |||||||
| a | Edwards Lifesciences Corp. | 89,500 | 8,925,835 | |||||||
| a | Envision Healthcare Holdings Inc. | 77,943 | 1,977,414 | |||||||
| a,b | Heron Therapeutics Inc. | 83,742 | 1,511,543 | |||||||
| a | Hologic Inc. | 195,600 | 6,767,760 | |||||||
| a | Impax Laboratories Inc. | 96,700 | 2,786,894 | |||||||
| a | Incyte Corp. | 35,800 | 2,863,284 | |||||||
| a | Insulet Corp. | 60,985 | 1,844,186 | |||||||
| a | Mallinckrodt PLC | 94,326 | 5,733,134 | |||||||
| a | Medivation Inc. | 49,794 | 3,002,578 | |||||||
| a | Mettler-Toledo International Inc. | 18,600 | 6,787,512 | |||||||
| a | Neurocrine Biosciences Inc. | 25,615 | 1,164,202 | |||||||
| a | Nevro Corp. | 71,900 | 5,303,344 | |||||||
| a,b | Penumbra Inc. | 26,569 | 1,580,856 | |||||||
Perrigo Co. PLC | 29,090 | 2,637,590 | ||||||||
| a | Pfenex Inc. | 159,200 | 1,332,504 | |||||||
| a | Quintiles Transnational Holdings Inc. | 124,200 | 8,112,744 | |||||||
| a,b | Revance Therapeutics Inc. | 109,200 | 1,485,120 | |||||||
| a | SciClone Pharmaceuticals Inc. | 81,342 | 1,062,327 | |||||||
| a,b | TherapeuticsMD Inc. | 175,000 | 1,487,500 | |||||||
|
| |||||||||
| 106,112,421 | ||||||||||
|
| |||||||||
Industrials 14.9% | ||||||||||
Acuity Brands Inc. | 15,800 | 3,917,768 | ||||||||
Allegiant Travel Co. | 12,492 | 1,892,538 | ||||||||
AMETEK Inc. | 174,600 | 8,071,758 | ||||||||
B/E Aerospace Inc. | 108,600 | 5,014,605 | ||||||||
| a | DigitalGlobe Inc. | 235,100 | 5,028,789 | |||||||
Dun & Bradstreet Corp. | 48,900 | 5,957,976 | ||||||||
| a | Genesee & Wyoming Inc. | 112,200 | 6,614,190 | |||||||
| a | HD Supply Holdings Inc. | 211,000 | 7,347,020 | |||||||
Hexcel Corp. | 120,200 | 5,005,128 | ||||||||
| a | IHS Inc., A | 60,500 | 6,994,405 | |||||||
J.B. Hunt Transport Services Inc. | 37,000 | 2,994,410 | ||||||||
Robert Half International Inc. | 155,000 | 5,914,800 | ||||||||
Roper Technologies Inc. | 57,370 | 9,785,027 | ||||||||
| a | Sensata Technologies Holding NV | 68,400 | 2,386,476 | |||||||
| a | Verisk Analytics Inc. | 46,100 | 3,737,788 | |||||||
|
| |||||||||
| 80,662,678 | ||||||||||
|
| |||||||||
Information Technology 20.9% | ||||||||||
| a | 2U Inc. | 170,700 | 5,020,287 | |||||||
| a | Alliance Data Systems Corp. | 18,600 | 3,644,112 | |||||||
Analog Devices Inc. | 20,000 | 1,132,800 | ||||||||
| FSC-10 | Semiannual Report |
FRANKLIN TEMPLETON VARIABLE INSURANCE PRODUCTS TRUST
STATEMENT OF INVESTMENTS (UNAUDITED)
Franklin Small-Mid Cap Growth VIP Fund (continued)
| Shares | Value | |||||||||
Common Stocks (continued) | ||||||||||
Information Technology (continued) | ||||||||||
| a | ANSYS Inc. | 35,800 | $ | 3,248,850 | ||||||
| a | Atlassian Corp. PLC (Australia) | 57,400 | 1,486,660 | |||||||
| a | Bottomline Technologies (de) Inc. | 95,400 | 2,053,962 | |||||||
Cognex Corp. | 125,200 | 5,396,120 | ||||||||
| a | CoStar Group Inc. | 37,600 | 8,221,616 | |||||||
CSRA Inc. | 212,400 | 4,976,532 | ||||||||
| a | Electronic Arts Inc. | 146,300 | 11,083,688 | |||||||
Fidelity National Information Services Inc. | 69,200 | 5,098,656 | ||||||||
| a | FleetCor Technologies Inc. | 38,900 | 5,567,757 | |||||||
| a | GoDaddy Inc., A | �� | 133,300 | 4,157,627 | ||||||
| a | Integrated Device Technology Inc. | 40,000 | 805,200 | |||||||
Intersil Corp., A | 383,800 | 5,196,652 | ||||||||
Lam Research Corp. | 41,300 | 3,471,678 | ||||||||
Microchip Technology Inc. | 56,000 | 2,842,560 | ||||||||
| a | NXP Semiconductors NV (Netherlands) | 110,068 | 8,622,727 | |||||||
| a | Palo Alto Networks Inc. | 44,400 | 5,445,216 | |||||||
| a | Proofpoint Inc. | 38,200 | 2,410,038 | |||||||
| a | Red Hat Inc. | 80,200 | 5,822,520 | |||||||
| a | ServiceNow Inc. | 70,800 | 4,701,120 | |||||||
| a | Vantiv Inc., A | 117,500 | 6,650,500 | |||||||
| a | ViaSat Inc. | 54,452 | 3,887,873 | |||||||
| a | Workday Inc., A | 35,400 | 2,643,318 | |||||||
|
| |||||||||
| 113,588,069 | ||||||||||
|
| |||||||||
Materials 2.8% | ||||||||||
| a | Axalta Coating Systems Ltd. | 268,800 | 7,131,264 | |||||||
Martin Marietta Materials Inc. | 42,600 | 8,179,200 | ||||||||
|
| |||||||||
| 15,310,464 | ||||||||||
|
| |||||||||
Telecommunication Services 0.8% | ||||||||||
| a | SBA Communications Corp. | 41,800 | 4,511,892 | |||||||
|
| |||||||||
Total Common Stocks (Cost $393,093,579) | 521,784,087 | |||||||||
|
| |||||||||
Preferred Stocks 0.3% | ||||||||||
Consumer Discretionary 0.3% | ||||||||||
| a,c | DraftKings Inc., pfd., D | 115,528 | 440,462 | |||||||
| a,c | DraftKings Inc., pfd., D-1 | 284,105 | 1,083,178 | |||||||
|
| |||||||||
Total Preferred Stocks (Cost $2,800,003) | 1,523,640 | |||||||||
|
| |||||||||
Total Investments before Short Term Investments (Cost $395,893,582) | 523,307,727 | |||||||||
|
| |||||||||
Short Term Investments 5.3% | ||||||||||
Money Market Funds (Cost $12,543,362) 2.3% | ||||||||||
| a,d | Institutional Fiduciary Trust Money Market Portfolio | 12,543,362 | 12,543,362 | |||||||
|
| |||||||||
| Semiannual Report | FSC-11 |
FRANKLIN TEMPLETON VARIABLE INSURANCE PRODUCTS TRUST
STATEMENT OF INVESTMENTS (UNAUDITED)
Franklin Small-Mid Cap Growth VIP Fund (continued)
| Shares | Value | |||||||||
| e | Investments from Cash Collateral Received for Loaned Securities | |||||||||
Money Market Funds 3.0% | ||||||||||
| a,d | Institutional Fiduciary Trust Money Market Portfolio | 15,832,625 | $ | 15,832,625 | ||||||
|
| |||||||||
Total Investments (Cost $424,269,569) 101.8% | 551,683,714 | |||||||||
Other Assets, less Liabilities (1.8)% | (9,583,463 | ) | ||||||||
|
| |||||||||
Net Assets 100.0% | $ | 542,100,251 | ||||||||
|
| |||||||||
aNon-income producing.
bA portion or all of the security is on loan at June 30, 2016. See Note 1(c).
cSee Note 7 regarding restricted securities.
dSee Note 3(e) regarding investments in affiliated management investment companies.
eSee Note 1(c) regarding securities on loan.
| FSC-12 | Semiannual Report | The accompanying notes are an integral part of these financial statements. |
FRANKLIN TEMPLETON VARIABLE INSURANCE PRODUCTS TRUST
Financial Statements
Statement of Assets and Liabilities
June 30, 2016 (unaudited)
| Franklin Small-Mid Cap Growth VIP Fund | ||||
Assets: | ||||
Investments in securities: | ||||
Cost - Unaffiliated issuers | $ | 395,893,582 | ||
Cost - Non-controlled affiliates (Note 3e) | 28,375,987 | |||
|
| |||
Total cost of investments | $ | 424,269,569 | ||
|
| |||
Value - Unaffiliated issuers | $ | 523,307,727 | ||
Value - Non-controlled affiliates (Note 3e) | 28,375,987 | |||
|
| |||
Total value of investments (includes securities loaned in the amount of $15,819,120) | 551,683,714 | |||
Receivables: | ||||
Investment securities sold | 7,518,557 | |||
Capital shares sold | 94,175 | |||
Dividends and interest | 348,175 | |||
Due from custodian | 76,823 | |||
Other assets | 246 | |||
|
| |||
Total assets | 559,721,690 | |||
|
| |||
Liabilities: | ||||
Payables: | ||||
Investment securities purchased | 345,979 | |||
Capital shares redeemed | 391,506 | |||
Management fees | 346,915 | |||
Distribution fees | 194,501 | |||
Payable upon return of securities loaned | 16,180,800 | |||
Accrued expenses and other liabilities | 161,738 | |||
|
| |||
Total liabilities | 17,621,439 | |||
|
| |||
Net assets, at value | $ | 542,100,251 | ||
|
| |||
Net assets consist of: | ||||
Paid-in capital | $ | 411,627,629 | ||
Undistributed net investment income (loss) | (793,998 | ) | ||
Net unrealized appreciation (depreciation) | 127,414,145 | |||
Accumulated net realized gain (loss) | 3,852,475 | |||
|
| |||
Net assets, at value | $ | 542,100,251 | ||
|
| |||
| Class 1: | ||||
Net assets, at value | $ | 81,189,094 | ||
|
| |||
Shares outstanding | 4,794,490 | |||
|
| |||
Net asset value and maximum offering price per share | $ | 16.93 | ||
|
| |||
| Class 2: | ||||
Net assets, at value | $ | 447,065,712 | ||
|
| |||
Shares outstanding | 28,810,093 | |||
|
| |||
Net asset value and maximum offering price per share | $ | 15.52 | ||
|
| |||
| Class 4: | ||||
Net assets, at value | $ | 13,845,445 | ||
|
| |||
Shares outstanding | 862,966 | |||
|
| |||
Net asset value and maximum offering price per share | $ | 16.04 | ||
|
| |||
| The accompanying notes are an integral part of these financial statements. | Semiannual Report | FSC-13 |
FRANKLIN TEMPLETON VARIABLE INSURANCE PRODUCTS TRUST
FINANCIAL STATEMENTS
Statement of Operations
for the six months ended June 30, 2016 (unaudited)
| Franklin Small-Mid Cap Growth VIP Fund | ||||
Investment income: | ||||
Dividends | $ | 1,836,503 | ||
Income from securities loaned (net of fees and rebates) | 148,426 | |||
|
| |||
Total investment income | 1,984,929 | |||
|
| |||
Expenses: | ||||
Management fees (Note 3a) | 2,108,719 | |||
Distribution fees: (Note 3c) | ||||
Class 2 | 547,142 | |||
Class 4 | 24,059 | |||
Custodian fees (Note 4) | 2,526 | |||
Reports to shareholders | 103,068 | |||
Professional fees | 21,432 | |||
Trustees’ fees and expenses | 1,502 | |||
Other | 6,613 | |||
|
| |||
Total expenses | 2,815,061 | |||
Expense reductions (Note 4) | (24 | ) | ||
Expenses waived/paid by affiliates (Note 3e) | (36,110 | ) | ||
|
| |||
Net expenses | 2,778,927 | |||
|
| |||
Net investment income (loss) | (793,998 | ) | ||
|
| |||
Realized and unrealized gains (losses): | ||||
Net realized gain (loss) from investments | 4,815,924 | |||
|
| |||
Net change in unrealized appreciation (depreciation) on investments | (9,384,738 | ) | ||
|
| |||
Net realized and unrealized gain (loss) | (4,568,814 | ) | ||
|
| |||
Net increase (decrease) in net assets resulting from operations | $ | (5,362,812 | ) | |
|
| |||
| FSC-14 | Semiannual Report | The accompanying notes are an integral part of these financial statements. |
FRANKLIN TEMPLETON VARIABLE INSURANCE PRODUCTS TRUST
FINANCIAL STATEMENTS
Statements of Changes in Net Assets
| Franklin Small-Mid Cap Growth VIP Fund | ||||||||
| Six Months Ended June 30, 2016 (unaudited) | Year Ended December 31, 2015 | |||||||
Increase (decrease) in net assets: | ||||||||
Operations: | ||||||||
Net investment income (loss) | $ | (793,998 | ) | $ | (1,403,843 | ) | ||
Net realized gain (loss) | 4,815,924 | 63,022,161 | ||||||
Net change in unrealized appreciation (depreciation) | (9,384,738 | ) | (74,279,798 | ) | ||||
|
| |||||||
Net increase (decrease) in net assets resulting from operations | (5,362,812 | ) | (12,661,480 | ) | ||||
|
| |||||||
Distributions to shareholders from: | ||||||||
Net realized gains: | ||||||||
Class 1 | (8,833,462 | ) | (22,509,343 | ) | ||||
Class 2 | (52,547,749 | ) | (135,758,632 | ) | ||||
Class 4 | (1,581,894 | ) | (4,098,814 | ) | ||||
|
| |||||||
Total distributions to shareholders | (62,963,105 | ) | (162,366,789 | ) | ||||
|
| |||||||
Capital share transactions: (Note 2) | ||||||||
Class 1 | 2,842,337 | 12,480,207 | ||||||
Class 2 | 25,516,987 | 41,958,103 | ||||||
Class 4 | 446,499 | 3,251,391 | ||||||
|
| |||||||
Total capital share transactions | 28,805,823 | 57,689,701 | ||||||
|
| |||||||
Net increase (decrease) in net assets | (39,520,094 | ) | (117,338,568 | ) | ||||
Net assets: | ||||||||
Beginning of period | 581,620,345 | 698,958,913 | ||||||
|
| |||||||
End of period | $ | 542,100,251 | $ | 581,620,345 | ||||
|
| |||||||
Undistributed net investment income (loss) included in net assets: | ||||||||
End of period | $ | (793,998 | ) | $ | — | |||
|
| |||||||
| The accompanying notes are an integral part of these financial statements. | Semiannual Report | FSC-15 |
FRANKLIN TEMPLETON VARIABLE INSURANCE PRODUCTS TRUST
Notes to Financial Statements (unaudited)
Franklin Small-Mid Cap Growth VIP Fund
1. Organization and Significant Accounting Policies
Franklin Templeton Variable Insurance Products Trust (Trust) is registered under the Investment Company Act of 1940 (1940 Act) as an open-end management investment company, consisting of nineteen separate funds and applies the specialized accounting and reporting guidance in U.S. Generally Accepted Accounting Principles (U.S. GAAP). Franklin Small-Mid Cap Growth VIP Fund (Fund) is included in this report. The financial statements of the remaining funds in the Trust are presented separately. Shares of the Fund are generally sold only to insurance company separate accounts to fund the benefits of variable life insurance policies or variable annuity contracts. The Fund offers three classes of shares: Class 1, Class 2 and Class 4. Each class of shares differs by its distribution fees, voting rights on matters affecting a single class and its exchange privilege.
The following summarizes the Fund’s significant accounting policies.
a. Financial Instrument Valuation
The Fund’s investments in financial instruments are carried at fair value daily. Fair value is the price that would be received to sell an asset or paid to transfer a liability in an orderly transaction between market participants on the measurement date. The Fund calculates the net asset value (NAV) per share as of 4 p.m. Eastern time each day the New York Stock Exchange (NYSE) is open for trading. Under compliance policies and procedures approved by the Trust’s Board of Trustees (the Board), the Fund’s administrator has responsibility for oversight of valuation, including leading the cross-functional Valuation Committee (VC). The VC provides administration and oversight of the Fund’s valuation policies and procedures, which are approved annually by the Board. Among other things, these procedures allow the Fund to utilize independent pricing services, quotations from securities and financial instrument dealers, and other market sources to determine fair value.
Equity securities listed on an exchange or on the NASDAQ National Market System are valued at the last quoted sale price or the official closing price of the day, respectively. Foreign equity securities are valued as of the close of trading on the foreign stock exchange on which the security is primarily traded or as of 4 p.m. Eastern time whichever is earlier. The value is then converted into its U.S. dollar equivalent at the foreign exchange rate in effect at 4 p.m. Eastern time on the day that the
value of the security is determined. Over-the-counter [(OTC)] securities are valued within the range of the most recent quoted bid and ask prices. Securities that trade in multiple markets or on multiple exchanges are valued according to the broadest and most representative market. Certain equity securities are valued based upon fundamental characteristics or relationships to similar securities.
Investments in open-end mutual funds are valued at the closing NAV.
The Fund has procedures to determine the fair value of financial instruments for which market prices are not reliable or readily available. Under these procedures, the VC convenes on a regular basis to review such financial instruments and considers a number of factors, including significant unobservable valuation inputs, when arriving at fair value. The VC primarily employs a market-based approach which may use related or comparable assets or liabilities, recent transactions, market multiples, book values, and other relevant information for the investment to determine the fair value of the investment. An income-based valuation approach may also be used in which the anticipated future cash flows of the investment are discounted to calculate fair value. Discounts may also be applied due to the nature or duration of any restrictions on the disposition of the investments. Due to the inherent uncertainty of valuations of such investments, the fair values may differ significantly from the values that would have been used had an active market existed. The VC employs various methods for calibrating these valuation approaches including a regular review of key inputs and assumptions, transactional back-testing or disposition analysis, and reviews of any related market activity.
Trading in securities on foreign securities stock exchanges and OTC markets may be completed before 4 p.m. Eastern time. In addition, trading in certain foreign markets may not take place on every NYSE business day. Occasionally, events occur between the time at which trading in a foreign security is completed and the close of the NYSE that might call into question the reliability of the value of a portfolio security held by the Fund. As a result, differences may arise between the value of the Fund’s portfolio securities as determined at the foreign market close and the latest indications of value at the close of the NYSE. In order to minimize the potential for these differences, the VC monitors price movements following the close of trading in foreign stock markets through a series of country specific market proxies (such as baskets of American
| FSC-16 | Semiannual Report |
FRANKLIN TEMPLETON VARIABLE INSURANCE PRODUCTS TRUST
NOTES TO FINANCIAL STATEMENTS (UNAUDITED)
Franklin Small-Mid Cap Growth VIP Fund (continued)
Depositary Receipts, futures contracts and exchange traded funds). These price movements are measured against established trigger thresholds for each specific market proxy to assist in determining if an event has occurred that may call into question the reliability of the values of the foreign securities held by the Fund. If such an event occurs, the securities may be valued using fair value procedures, which may include the use of independent pricing services.
When the last day of the reporting period is a non-business day, certain foreign markets may be open on those days that the NYSE is closed, which could result in differences between the value of the Fund’s portfolio securities on the last business day and the last calendar day of the reporting period. Any significant security valuation changes due to an open foreign market are adjusted and reflected by the Fund for financial reporting purposes.
b. Foreign Currency Translation
Portfolio securities and other assets and liabilities denominated in foreign currencies are translated into U.S. dollars based on the exchange rate of such currencies against U.S. dollars on the date of valuation. The Fund may enter into foreign currency exchange contracts to facilitate transactions denominated in a foreign currency. Purchases and sales of securities, income and expense items denominated in foreign currencies are translated into U.S. dollars at the exchange rate in effect on the transaction date. Portfolio securities and assets and liabilities denominated in foreign currencies contain risks that those currencies will decline in value relative to the U.S. dollar. Occasionally, events may impact the availability or reliability of foreign exchange rates used to convert the U.S. dollar equivalent value. If such an event occurs, the foreign exchange rate will be valued at fair value using procedures established and approved by the Board.
The Fund does not separately report the effect of changes in foreign exchange rates from changes in market prices on securities held. Such changes are included in net realized and unrealized gain or loss from investments in the Statement of Operations.
Realized foreign exchange gains or losses arise from sales of foreign currencies, currency gains or losses realized between the trade and settlement dates on securities transactions and the difference between the recorded amounts of dividends, interest, and foreign withholding taxes and the U.S. dollar equivalent of the amounts actually received or paid. Net unrealized foreign
exchange gains and losses arise from changes in foreign exchange rates on foreign denominated assets and liabilities other than investments in securities held at the end of the reporting period.
c. Securities Lending
The Fund participates in an agency based securities lending program to earn additional income. The Fund receives cash collateral against the loaned securities in an amount equal to at least 102% of the fair value of the loaned securities. Collateral is maintained over the life of the loan in an amount not less than 100% of the fair value of loaned securities, as determined at the close of Fund business each day; any additional collateral required due to changes in security values is delivered to the Fund on the next business day. The collateral is deposited into a joint cash account with other funds and is used to invest in a money market fund managed by Franklin Advisers, Inc., an affiliate of the Fund, and/or uninvested cash as included in due from custodian in the Statement of Assets and Liabilities. The Fund may receive income from the investment of cash collateral, in addition to lending fees and rebates paid by the borrower. Income from securities loaned, net of fees paid to the securities lending agent and/or third-party vendor, is reported separately in the Statement of Operations. The Fund bears the market risk with respect to the collateral investment, securities loaned, and the risk that the Fund has the right to repurchase the securities in the open market using the collateral received. The securities lending agent has agreed to indemnify the Fund in the event of default by a third party borrower.
d. Income and Deferred Taxes
It is the Fund’s policy to qualify as a regulated investment company under the Internal Revenue Code. The Fund intends to distribute to shareholders substantially all of its taxable income and net realized gains to relieve it from federal income and if applicable, excise taxes. As a result, no provision for U.S. federal income taxes is required.
The Fund may be subject to foreign taxation related to income received, capital gains on the sale of securities and certain foreign currency transactions in the foreign jurisdictions in which it invests. Foreign taxes, if any, are recorded based on the tax regulations and rates that exist in the foreign markets in which the Fund invests. When a capital gain tax is determined to apply, the Fund records an estimated deferred tax liability in an amount that would be payable if the securities were disposed of on the valuation date.
| Semiannual Report | FSC-17 |
FRANKLIN TEMPLETON VARIABLE INSURANCE PRODUCTS TRUST
NOTES TO FINANCIAL STATEMENTS (UNAUDITED)
Franklin Small-Mid Cap Growth VIP Fund (continued)
1. Organization and Significant Accounting Policies (continued)
d. Income and Deferred Taxes (continued)
The Fund may recognize an income tax liability related to its uncertain tax positions under U.S. GAAP when the uncertain tax position has a less than 50% probability that it will be sustained upon examination by the tax authorities based on its technical merits. As of June 30, 2016, the Fund has determined that no tax liability is required in its financial statements related to uncertain tax positions for any open tax years (or expected to be taken in future tax returns). Open tax years are those that remain subject to examination and are based on each tax jurisdiction’s statute of limitation.
e. Security Transactions, Investment Income, Expenses and Distributions
Security transactions are accounted for on trade date. Realized gains and losses on security transactions are determined on a specific identification basis. Dividend income is recorded on the ex-dividend date except for certain dividends from foreign securities where the dividend rate is not available. In such cases, the dividend is recorded as soon as the information is received by the Fund. Distributions to shareholders are recorded on the ex-dividend date and are determined according to income tax regulations (tax basis). Distributable earnings determined on a tax basis may differ from earnings recorded in accordance with U.S. GAAP. These differences may be permanent or temporary. Permanent differences are reclassified among capital accounts to reflect their tax character. These reclassifications have no impact on net assets or the results of operations. Temporary differences are not reclassified, as they may reverse in subsequent periods.
Common expenses incurred by the Trust are allocated among the Funds based on the ratio of net assets of each Fund to the combined net assets of the Trust. Fund specific expenses are charged directly to the fund that incurred the expense.
Realized and unrealized gains and losses and net investment income, not including class specific expenses, are allocated daily to each class of shares based upon the relative proportion of net assets of each class. Differences in per share distributions, by class, are generally due to differences in class specific expenses.
f. Accounting Estimates
The preparation of financial statements in accordance with U.S. GAAP requires management to make estimates and assumptions that affect the reported amounts of assets and liabilities at the date of the financial statements and the amounts of income and expenses during the reporting period. Actual results could differ from those estimates.
g. Guarantees and Indemnifications
Under the Trust’s organizational documents, its officers and trustees are indemnified by the Trust against certain liabilities arising out of the performance of their duties to the Trust. Additionally, in the normal course of business, the Trust, on behalf of the Fund, enters into contracts with service providers that contain general indemnification clauses. The Trust’s maximum exposure under these arrangements is unknown as this would involve future claims that may be made against the Trust that have not yet occurred. Currently, the Trust expects the risk of loss to be remote.
| FSC-18 | Semiannual Report |
FRANKLIN TEMPLETON VARIABLE INSURANCE PRODUCTS TRUST
NOTES TO FINANCIAL STATEMENTS (UNAUDITED)
Franklin Small-Mid Cap Growth VIP Fund (continued)
2. Shares of Beneficial Interest
At June 30, 2016, there were an unlimited number of shares authorized (without par value). Transactions in the Fund’s shares were as follows:
| Six Months Ended June 30, 2016 | Year Ended December 31, 2015 | |||||||||||||||||||
| Shares | Amount | Shares | Amount | |||||||||||||||||
| Class 1 Shares: | ||||||||||||||||||||
Shares sold | 76,632 | $ | 1,376,820 | 195,710 | $ | 4,581,670 | ||||||||||||||
Shares issued in reinvestment of distributions | 521,764 | 8,833,462 | 1,062,262 | 22,509,343 | ||||||||||||||||
Shares redeemed | (406,483 | ) | (7,367,945 | ) | (655,587 | ) | (14,610,806 | ) | ||||||||||||
|
| |||||||||||||||||||
Net increase (decrease) | 191,913 | $ | 2,842,337 | 602,385 | $ | 12,480,207 | ||||||||||||||
|
| |||||||||||||||||||
| Class 2 Shares: | ||||||||||||||||||||
Shares sold | 644,220 | $ | 10,808,921 | 1,198,268 | $ | 26,202,656 | ||||||||||||||
Shares issued in reinvestment of distributions | 3,385,809 | 52,547,749 | 6,905,322 | 135,758,632 | ||||||||||||||||
Shares redeemed | (2,279,883 | ) | (37,839,683 | ) | (5,776,970 | ) | (120,003,185 | ) | ||||||||||||
|
| |||||||||||||||||||
Net increase (decrease) | 1,750,146 | $ | 25,516,987 | 2,326,620 | $ | 41,958,103 | ||||||||||||||
|
| |||||||||||||||||||
| Class 4 Shares: | ||||||||||||||||||||
Shares sold | 61,135 | $ | 1,034,422 | 239,982 | $ | 5,202,958 | ||||||||||||||
Shares issued in reinvestment of distributions | 98,560 | 1,581,894 | 202,211 | 4,098,814 | ||||||||||||||||
Shares redeemed | (125,457 | ) | (2,169,817 | ) | (292,263 | ) | (6,050,381 | ) | ||||||||||||
|
| |||||||||||||||||||
Net increase (decrease) | 34,238 | $ | 446,499 | 149,930 | $ | 3,251,391 | ||||||||||||||
|
| |||||||||||||||||||
3. Transactions With Affiliates
Franklin Resources, Inc. is the holding company for various subsidiaries that together are referred to as Franklin Templeton Investments. Certain officers and trustees of the Fund are also officers and/or directors of the following subsidiaries:
| Subsidiary | Affiliation | |
Franklin Advisers, Inc. (Advisers) | Investment manager | |
Franklin Templeton Services, LLC (FT Services) | Administrative manager | |
Franklin Templeton Distributors, Inc. (Distributors) | Principal underwriter | |
Franklin Templeton Investor Services, LLC (Investor Services) | Transfer agent |
a. Management Fees
The Fund pays an investment management fee to Advisers based on the average daily net assets of the Fund as follows:
| Annualized Fee Rate | Net Assets | |
0.800% | Up to and including $500 million | |
0.700% | Over $500 million, up to and including $1 billion | |
0.650% | Over $1 billion, up to and including $1.5 billion | |
0.600% | Over $1.5 billion, up to and including $6.5 billion | |
0.575% | Over $6.5 billion, up to and including $11.5 billion | |
0.550% | Over $11.5 billion, up to and including $16.5 billion | |
0.540% | Over $16.5 billion, up to and including $19 billion | |
0.530% | Over $19 billion, up to and including $21.5 billion | |
0.520% | In excess of $21.5 billion |
| Semiannual Report | FSC-19 |
FRANKLIN TEMPLETON VARIABLE INSURANCE PRODUCTS TRUST
NOTES TO FINANCIAL STATEMENTS (UNAUDITED)
Franklin Small-Mid Cap Growth VIP Fund (continued)
3. Transactions With Affiliates (continued)
a. Management Fees (continued)
For the period ended June 30, 2016, the annualized effective investment management fee rate was 0.793% of the Fund’s average daily net assets.
b. Administrative Fees
Under an agreement with Advisers, FT Services provides administrative services to the Fund. The fee is paid by Advisers based on the Fund’s average daily net assets, and is not an additional expense of the Fund.
c. Distribution Fees
The Board has adopted distribution plans for Class 2 and Class 4 shares pursuant to Rule 12b-1 under the 1940 Act. Under the Fund’s compensation distribution plans, the Fund pays Distributors for costs incurred in connection with the servicing, sale and distribution of the Fund’s shares up to per year of its average daily net assets of each class. The Board has agreed to limit the current rate to 0.25% per year for Class 2. The plan year, for purposes of monitoring compliance with the maximum annual plan rates, is February 1 through January 31.
d. Transfer Agent Fees
Investor Services, under terms of an agreement, performs shareholder servicing for the Fund and is not paid by the Fund for the services.
e. Investments in Affiliated Management Investment Companies
The Fund invests in one or more affiliated management investment companies for purposes other than exercising a controlling influence over the management or policies. Management fees paid by the Fund are waived on assets invested in the affiliated management investment companies, as noted in the Statement of Operations, in an amount not to exceed the management and administrative fees paid directly or indirectly by each affiliate. Prior to January 1, 2014, the waiver was accounted for as a reduction to management fees.
| Number of Shares Held at Beginning of Period | Gross Additions | Gross Reductions | Number of Shares Held at End of Period | Value at End of Period | Investment Income | Realized Gain (Loss) | % of Affiliated Fund Shares Outstanding Held at End of Year | |||||||||||||||||||||||||
| Non-Controlled Affiliates | ||||||||||||||||||||||||||||||||
Institutional Fiduciary Trust Money Market Portfolio | 33,143,168 | 148,397,175 | (153,164,356 | ) | 28,375,987 | $ | 28,375,987 | $ | — | $ | — | 0.1% | ||||||||||||||||||||
|
| |||||||||||||||||||||||||||||||
4. Expense Offset Arrangement
The Fund has entered into an arrangement with its custodian whereby credits realized as a result of uninvested cash balances are used to reduce a portion of the Fund’s custodian expenses. During the period ended June 30, 2016, the custodian fees were reduced as noted in the Statement of Operations.
| FSC-20 | Semiannual Report |
FRANKLIN TEMPLETON VARIABLE INSURANCE PRODUCTS TRUST
NOTES TO FINANCIAL STATEMENTS (UNAUDITED)
Franklin Small-Mid Cap Growth VIP Fund (continued)
5. Income Taxes
At June 30, 2016, the cost of investments and net unrealized appreciation (depreciation) for income tax purposes were as follows:
Cost of investments | $ | 425,102,628 | ||
|
| |||
Unrealized appreciation | $ | 153,725,600 | ||
Unrealized depreciation | (27,144,514 | ) | ||
|
| |||
Net unrealized appreciation (depreciation) | $ | 126,581,086 | ||
|
|
Differences between income and/or capital gains as determined on a book basis and a tax basis are primarily due to differing treatments of wash sales.
6. Investment Transactions
Purchases and sales of investments (excluding short term securities) for the period ended June 30, 2016, aggregated $74,960,730 and $115,974,275, respectively.
At June 30, 2016, in connection with securities lending transactions, the Fund loaned equity investments and received $16,180,800 of cash collateral. The gross amount of recognized liability for such transactions is included in payable upon return of securities loaned in the Statement of Assets and Liabilities. The agreements can be terminated at any time.
7. Restricted Securities
The Fund invests in securities that are restricted under the Securities Act of 1933 (1933 Act) or which are subject to legal, contractual, or other agreed upon restrictions on resale. Restricted securities are often purchased in private placement transactions, and cannot be sold without prior registration unless the sale is pursuant to an exemption under the 1933 Act. Disposal of these securities may require greater effort and expense, and prompt sale at an acceptable price may be difficult. The Fund may have registration rights for restricted securities. The issuer generally incurs all registration costs.
At June 30, 2016, the Fund held investments in restricted securities, excluding certain securities exempt from registration under the 1933 Act deemed to be liquid, as follows:
| Shares | Issuer | Acquisition Date | Cost | Value | ||||||||||
| 115,528 | DraftKings Inc., pfd., D | 8/07/15 | $ | 622,222 | $ | 440,462 | ||||||||
| 284,105 | DraftKings Inc., pfd., D-1 | 8/07/15 | 2,177,781 | 1,083,178 | ||||||||||
|
| |||||||||||||
Total Restricted Securities (Value is 0.3% of Net Assets) | $ | 2,800,003 | $ | 1,523,640 | ||||||||||
|
| |||||||||||||
8. Credit Facility
The Fund, together with other U.S. registered and foreign investment funds (collectively, Borrowers), managed by Franklin Templeton Investments, are borrowers in a joint syndicated senior unsecured credit facility totaling $2 billion (Global Credit Facility) which matures on February 10, 2017. This Global Credit Facility provides a source of funds to the Borrowers for temporary and emergency purposes, including the ability to meet future unanticipated or unusually large redemption requests.
Under the terms of the Global Credit Facility, the Fund shall, in addition to interest charged on any borrowings made by the Fund and other costs incurred by the Fund, pay its share of fees and expenses incurred in connection with the implementation and maintenance of the Global Credit Facility, based upon its relative share of the aggregate net assets of all of the Borrowers, including an annual commitment fee of 0.07% based upon the unused portion of the Global Credit Facility. Effective February 12, 2016, the annual commitment fee is 0.15%. These fees are reflected in other expenses in the Statement of Operations. During the period ended June 30, 2016, the Fund did not use the Global Credit Facility.
| Semiannual Report | FSC-21 |
FRANKLIN TEMPLETON VARIABLE INSURANCE PRODUCTS TRUST
NOTES TO FINANCIAL STATEMENTS (UNAUDITED)
Franklin Small-Mid Cap Growth VIP Fund (continued)
9. Fair Value Measurements
The Fund follows a fair value hierarchy that distinguishes between market data obtained from independent sources (observable inputs) and the Fund’s own market assumptions (unobservable inputs). These inputs are used in determining the value of the Fund’s financial instruments and are summarized in the following fair value hierarchy:
| • | Level 1 – quoted prices in active markets for identical financial instruments |
| • | Level 2 – other significant observable inputs (including quoted prices for similar financial instruments, interest rates, prepayment speed, credit risk, etc.) |
| • | Level 3 – significant unobservable inputs (including the Fund’s own assumptions in determining the fair value of financial instruments) |
The input levels are not necessarily an indication of the risk or liquidity associated with financial instruments at that level.
For movements between the levels within the fair value hierarchy, the Fund has adopted a policy of recognizing the transfers as of the date of the underlying event which caused the movement.
A summary of inputs used as of June 30, 2016, in valuing the Fund’s assets carried at fair value, is as follows:
| Level 1 | Level 2 | Level 3 | Total | |||||||||||||
| Assets: | ||||||||||||||||
Investments in Securities: | ||||||||||||||||
Equity Investments:a | ||||||||||||||||
Consumer Discretionary | $ | 89,025,051 | $ | — | $ | 1,523,640 | $ | 90,548,691 | ||||||||
All Other Equity Investmentsb | 432,759,036 | — | — | 432,759,036 | ||||||||||||
Short Term Investments | 28,375,987 | — | — | 28,375,987 | ||||||||||||
|
| |||||||||||||||
Total Investments in Securities | $ | 550,160,074 | $ | — | $ | 1,523,640 | $ | 551,683,714 | ||||||||
|
| |||||||||||||||
aIncludes common and preferred stocks.
bFor detailed categories, see the accompanying Statement of Investments.
10. Subsequent Events
The Fund has evaluated subsequent events through the issuance of the financial statements and determined that no events have occurred that require disclosure.
| FSC-22 | Semiannual Report |
Franklin Strategic Income VIP Fund
This semiannual report for Franklin Strategic Income VIP Fund covers the period ended June 30, 2016.
Class 4 Performance Summary as of June 30, 2016
The Fund’s Class 4 shares delivered a +4.20% total return* for the six-month period ended June 30, 2016.
*The Fund has a fee waiver associated with any investment in a Franklin Templeton money fund and/or Franklin Templeton fund, as applicable, contractually guaranteed through at least its current fiscal year-end. Fund investment results reflect the fee waiver, to the extent applicable; without this reduction, the results would have been lower.
Performance reflects the Fund’s Class 4 operating expenses, but does not include any contract fees, expenses or sales charges. If they had been included, performance would be lower. These charges and deductions, particularly for variable life policies, can have a significant effect on contract values and insurance benefits. See the contract prospectus for a complete description of these expenses, including sales charges.
Performance data represent past performance, which does not guarantee future results. Investment return and principal value will fluctuate, and you may have a gain or loss when you sell your shares. Current performance may differ from figures shown.
| Semiannual Report | FSI-1 |
FRANKLIN STRATEGIC INCOME VIP FUND
Fund Goals and Main Investments
The Fund seeks a high level of current income, with capital appreciation over the long term as a secondary goal. Under normal market conditions, the Fund invests primarily to predominantly in U.S. and foreign debt securities, including those in emerging markets.
Fund Risks
All investments involve risks, including possible loss of principal. Bond prices generally move in the opposite direction of interest rates. Thus, as prices of bonds in the Fund adjust to a rise in interest rates, the Fund’s share price may decline. Changes in the financial strength of a bond issuer or in a bond’s credit rating may affect its value. High yields reflect the higher credit risks associated with certain lower rated securities held in the portfolio. Floating rate loans and high yield corporate bonds are rated below investment grade and are subject to greater risk of default, which could result in loss of principal—a risk that may be heightened in a slowing economy. The risks of foreign securities include currency fluctuations and political uncertainty. Investments in developing markets involve heightened risks related to the same factors, in addition to those associated with their relatively small size and lesser liquidity. Investing in derivative securities and the use of foreign currency techniques involve special risks as such may not achieve the anticipated benefits and/or may result in losses to the Fund. The Fund is actively managed but there is no guarantee that the manager’s investment decisions will produce the desired results. The Fund’s prospectus also includes a description of the main investment risks.
Performance Overview
You can find the Fund’s six-month total return in the Performance Summary. For comparison, the Fund’s benchmark, the Barclays U.S. Aggregate Bond Index, had a +5.31% total return for the period under review.1 The Fund’s peers, as measured by the Lipper Multi-Sector Income Funds Classification Average, produced a +4.32% return.2
Economic and Market Overview
The U.S. economy grew moderately, as measured by gross domestic product in 2016’s first and second quarters, driven by consumer spending and exports. A decline in private inventory
investment and nonresidential fixed investment contributed to the moderation. Although the unemployment rate rose from 4.7% in May to 4.9% in June, the increase was due to additional people entering the labor force, and for the entire period under review, unemployment declined slightly.3 Home sales remained strong and prices rose through most of the period amid relatively low mortgage rates. Monthly retail sales grew during most of the review period, and rose to the highest level in April in more than a year, due to a broad-based increase across most retail categories. Inflation, as measured by the Consumer Price Index, remained subdued overall even though it spiked to the highest level in three years in April mainly due to a rebound in energy prices.
After raising its target range for the federal funds rate to 0.25%–0.50% at its December meeting, the Federal Reserve (Fed) maintained the rate through-period end. Although the Fed hinted at an interest rate hike in June, subsequent reports showed job additions slowed substantially in May. Consequently, at its June meeting, the Fed kept the federal funds rate unchanged, and indicated that in determining the timing and size of future adjustments to the target range, it will assess realized and expected economic conditions relative to its objectives of maximum employment and 2.00% inflation. The Fed expects economic conditions to evolve in a manner that could warrant only gradual increases in the federal funds rate.
The 10-year Treasury yield, which moves inversely to price, declined during the period. It declined from a period high of 2.27% on December 31, 2015, and remained relatively low through period-end, reflecting investors’ concerns about global economic uncertainty. Negative interest rates in Japan and Europe, and central banks’ purchases of government bonds, also put downward pressure on U.S. yields. It touched a period low of 1.46% on June 27, 2016, and ended the period at 1.49%, after the Fed kept short-term interest rates unchanged and fears of Britain’s exit from the European Union boosted safe-haven buying by investors.
Investment Strategy
We allocate our investments among the various types of debt available based on our assessment of changing economic, global market, industry and issuer conditions. We use a top-down analysis of macroeconomic trends, combined with a bottom-up fundamental analysis of market sectors, industries
1. Source: Morningstar.
2. Source: Lipper, a Thomson Reuters Company.
One cannot invest directly in an index, and an index is not representative of the Fund’s portfolio. Please see Index Descriptions following the Fund Summaries.
3. Source: Bureau of Labor Statistics.
| FSI-2 | Semiannual Report |
FRANKLIN STRATEGIC INCOME VIP FUND
and issuers, seeking to take advantage of varying sector reactions to economic events. For example, we may evaluate business cycles, yield curves, country risk, and the relative interest rates among currencies, and values between and within markets. In selecting debt securities, we generally conduct our own analysis of the security’s intrinsic value rather than simply
relying on the coupon rate or rating. We may also enter into various transactions involving certain currency-, interest rate- or credit-related derivative instruments.
What is the yield curve?
The yield curve is a line that plots the interest rates, at a set point in time, of bonds having equal credit quality but differing maturity dates. The most frequently reported yield curve compares three-month, two-year and 30-year U.S. Treasury debt.
Manager’s Discussion
The Fund allocated assets across the broad fixed income markets on a global basis. During the period, we maintained large allocations to credit-sensitive securities, primarily noninvestment-grade credit, with a smaller exposure to investment-grade corporate bonds. The Fund also held positions in select non-U.S. dollar global government bonds. Conversely, the Fund sought to maintain a relatively low sensitivity to U.S. interest rates, with its sector exposure favoring the spread sectors of the fixed income market.
During the period, most spread sectors posted strong positive returns and delivered positive absolute performance. Corporate credit, both investment grade and below investment grade, was among the strongest performers during a period that largely lacked volatility until the end. Hard-currency emerging market issues also benefited results.
The Fund’s overweighted exposure to corporate credit in general, particularly noninvestment-grade corporate bonds, was a major contributor to absolute performance. The Fund’s position in non-U.S. dollar denominated bonds was also additive to our results as were our positions in municipal bonds and agency mortgage-backed securities. In contrast, our currency positions detracted from performance, mostly driven by our short Japanese yen exposure, as the yen strengthened versus the U.S. dollar during the period.
| Asset Allocation* | ||||||||
| Based on Total Net Assets | ||||||||
| 6/30/16 | 12/31/15 | |||||||
| High Yield Corporate Bonds & Preferred Securities | 28.0% | 29.3% | ||||||
| Floating Rate Loans | 20.7% | 20.0% | ||||||
| Investment-Grade Corporate Bonds | 13.6% | 10.1% | ||||||
| International Government & Agency Bonds (Non-$US) | 10.2% | 13.4% | ||||||
| Mortgage-Backed Securities | 9.5% | 3.9% | ||||||
| U.S. Treasury Securities | 4.3% | 4.0% | ||||||
| Commercial Mortgage-Backed Securities | 2.8% | 4.1% | ||||||
| International Government & Agency Bonds ($US) | 2.3% | 2.3% | ||||||
| Municipal Bonds | 1.0% | 2.6% | ||||||
| Equity | 0.7% | 1.0% | ||||||
| Asset-Backed Securities | 0.4% | 0.2% | ||||||
| Convertibles | 0.0% | ** | 0.0% | ** | ||||
| Others | 0.0% | 1.8% | ||||||
| Short-Term Investments & Other Net Assets | 6.4% | 7.4% | ||||||
*Figures reflect certain derivatives held in the portfolio (or their underlying reference assets) and may not total 100% or may be negative due to rounding, use of any derivatives, unsettled trades or other factors. The breakdown may not match the Statement of Investments (SOI).
**Rounds to less than 0.1%.
The dollar value, number of shares or principal amount, and names of all portfolio holdings are listed in the Fund’s SOI.
| Semiannual Report | FSI-3 |
FRANKLIN STRATEGIC INCOME VIP FUND
The portfolio utilized derivatives, including currency forwards and credit derivatives. Currency forwards are typically used to take long and short positions in currencies and as a tool to hedge currency risk. Credit derivatives can be used to hedge against credit risk or to otherwise enhance Fund returns by taking long or short positions in individual credits or baskets of credits in various sectors including in the corporate, municipal, sovereign and securitized markets.
What is a currency forward?
A currency forward is an agreement between the Fund and a counterparty to buy or sell a foreign currency in exchange for another currency at a specific exchange rate on a future date.
What is a credit derivative?
A credit derivative is a contract agreement between the Fund and a counterparty that is principally used by the Fund to gain or increase exposure to certain high yield securities or segments of the high yield bond market and/or to hedge against credit risk.
Thank you for your participation in Franklin Strategic Income VIP Fund. We look forward to serving your future investment needs.
The foregoing information reflects our analysis, opinions and portfolio holdings as of June 30, 2016, the end of the reporting period. The way we implement our main investment strategies and the resulting portfolio holdings may change depending on factors such as market and economic conditions. These opinions may not be relied upon as investment advice or an offer for a particular security. The information is not a complete analysis of every aspect of any market, country, industry, security or the Fund. Statements of fact are from sources considered reliable, but the investment manager makes no representation or warranty as to their completeness or accuracy. Although historical performance is no guarantee of future results, these insights may help you understand our investment management philosophy.
| FSI-4 | Semiannual Report |
FRANKLIN STRATEGIC INCOME VIP FUND
Class 4 Fund Expenses
As an investor in a variable insurance contract (Contract) that indirectly provides for investment in an underlying mutual fund, you can incur transaction and/or ongoing expenses at both the Fund level and the Contract level.
| • | Transaction expenses can include sales charges (loads) on purchases, surrender fees, transfer fees and premium taxes. |
| • | Ongoing expenses can include management fees, distribution and service (12b-1) fees, contract fees, annual maintenance fees, mortality and expense risk fees and other fees and expenses. All mutual funds and Contracts have some types of ongoing expenses. |
The expenses shown in the table are meant to highlight ongoing expenses at the Fund level only and do not include ongoing expenses at the Contract level, or transaction expenses at either the Fund or Contract levels. While the Fund does not have transaction expenses, if the transaction and ongoing expenses at the Contract level were included, the expenses shown below would be higher. You should consult your Contract prospectus or disclosure document for more information.
The table shows Fund-level ongoing expenses and can help you understand these expenses and compare them with those of other mutual funds offered through the Contract. The table assumes a $1,000 investment held for the six months indicated. Please refer to the Fund prospectus for additional information on operating expenses.
Actual Fund Expenses
The first line (Actual) of the table provides actual account values and expenses. The “Ending Account Value” is derived from the Fund’s actual return, which includes the effect of ongoing Fund expenses, but does not include the effect of ongoing Contract expenses.
You can estimate the Fund-level expenses you incurred during the period by following these steps. Of course, your account value and expenses will differ from those in this illustration:
| 1. | Divide your account value by $1,000. |
If an account had an $8,600 value, then $8,600 ÷ $1,000 = 8.6.
| 2. | Multiply the result by the number under the heading “Fund-Level Expenses Incurred During Period.” |
If Fund-Level Expenses Incurred During Period were $7.50, then 8.6 × $7.50 = $64.50.
In this illustration, the estimated expenses incurred this period at the Fund level are $64.50.
Hypothetical Example for Comparison with Other Mutual Funds
Information in the second line (Hypothetical) of the table can help you compare ongoing expenses of the Fund with those of other mutual funds offered through the Contract. This information may not be used to estimate the actual ending account balance or expenses you incurred during the period. The hypothetical “Ending Account Value” is based on the Fund’s actual expense ratio and an assumed 5% annual rate of return before expenses, which does not represent the Fund’s actual return. The figure under the heading “Fund-Level Expenses Incurred During Period” shows the hypothetical expenses your account would have incurred under this scenario. You can compare this figure with the 5% hypothetical examples that appear in shareholder reports of other funds offered through a Contract.
| Class 4 | Beginning Account Value 1/1/16 | Ending Account Value 6/30/16 | Fund-Level Expenses 1/1/16–6/30/16 | |||||||||
Actual | $ | 1,000 | $ | 1,042.00 | $ | 4.82 | ||||||
Hypothetical (5% return before expenses) | $ | 1,000 | $ | 1,020.14 | $ | 4.77 | ||||||
*Expenses are calculated using the most recent six-month annualized expense ratio, net of expense waivers, for the Fund’s Class 4 shares (0.95%), which does not include any ongoing expenses of the Contract for which the Fund is an investment option, multiplied by the average account value over the period, multiplied by 182/366 to reflect the one-half year period.
| Semiannual Report | FSI-5 |
FRANKLIN TEMPLETON VARIABLE INSURANCE PRODUCTS TRUST
Consolidated Financial Highlights
Franklin Strategic Income VIP Fund
Six Months Ended (unaudited) | Year Ended December 31, | |||||||||||||||||||||||
| 2015 | 2014 | 2013 | 2012 | 2011 | ||||||||||||||||||||
Class 1 | ||||||||||||||||||||||||
Per share operating performance (for a share outstanding throughout the period) | ||||||||||||||||||||||||
Net asset value, beginning of period | $10.55 | $11.90 | $12.64 | $13.17 | $12.55 | $12.99 | ||||||||||||||||||
|
| |||||||||||||||||||||||
| Income from investment operationsa: | ||||||||||||||||||||||||
Net investment incomeb | 0.24 | 0.53 | 0.54 | 0.59 | 0.65 | 0.69 | ||||||||||||||||||
Net realized and unrealized gains (losses) | 0.21 | (0.91 | ) | (0.25 | ) | (0.15 | ) | 0.92 | (0.32 | ) | ||||||||||||||
|
| |||||||||||||||||||||||
Total from investment operations | 0.45 | (0.38 | ) | 0.29 | 0.44 | 1.57 | 0.37 | |||||||||||||||||
|
| |||||||||||||||||||||||
| Less distributions from: | ||||||||||||||||||||||||
Net investment income and net foreign currency gains | (0.39 | ) | (0.77 | ) | (0.78 | ) | (0.80 | ) | (0.93 | ) | (0.81 | ) | ||||||||||||
Net realized gains | — | (0.20 | ) | (0.25 | ) | (0.17 | ) | (0.02 | ) | — | ||||||||||||||
|
| |||||||||||||||||||||||
Total distributions | (0.39 | ) | (0.97 | ) | (1.03 | ) | (0.97 | ) | (0.95 | ) | (0.81 | ) | ||||||||||||
|
| |||||||||||||||||||||||
Net asset value, end of period | $10.61 | $10.55 | $11.90 | $12.64 | $13.17 | $12.55 | ||||||||||||||||||
|
| |||||||||||||||||||||||
Total returnc | 4.32% | (3.62)% | 2.12% | 3.52% | 13.12% | 2.78% | ||||||||||||||||||
| Ratios to average net assetsd | ||||||||||||||||||||||||
Expenses before waiver and payments by affiliates | 0.67% | e | 0.63% | 0.63% | 0.60% | 0.58% | 0.60% | |||||||||||||||||
Expenses net of waiver and payments by affiliates | 0.60% | e,f | 0.62% | f | 0.62% | f | 0.60% | f | 0.58% | 0.60% | f | |||||||||||||
Net investment income | 4.48% | 4.71% | 4.34% | 4.58% | 5.04% | 5.36% | ||||||||||||||||||
| Supplemental data | ||||||||||||||||||||||||
Net assets, end of period (000’s) | $417,298 | $441,658 | $574,850 | $705,493 | $1,019,537 | $1,043,690 | ||||||||||||||||||
Portfolio turnover rate | 56.48% | 85.85% | 55.64% | 48.06% | 49.98% | 55.65% | ||||||||||||||||||
Portfolio turnover rate excluding mortgage dollar rollsg | 30.10% | 51.47% | 48.86% | 47.01% | 48.75% | 55.65% | ||||||||||||||||||
aThe amount shown for a share outstanding throughout the period may not correlate with the Consolidated Statement of Operations for the period due to the timing of sales and repurchases of the Fund’s shares in relation to income earned and/or fluctuating fair value of the investments of the Fund.
bBased on average daily shares outstanding.
cTotal return does not include fees, charges or expenses imposed by the variable annuity and life insurance contracts for which Franklin Templeton Variable Insurance Products Trust serves as an underlying investment vehicle. Total return is not annualized for periods less than one year.
dRatios are annualized for periods less than one year.
eRatios are adjusted to exclude the effects of annualization for non-recurring expenses.
fBenefit of expense reduction rounds to less than 0.01%.
gSee Note 1(h) regarding mortgage dollar rolls.
| FSI-6 | Semiannual Report | The accompanying notes are an integral part of these consolidated financial statements. | |||||
FRANKLIN TEMPLETON VARIABLE INSURANCE PRODUCTS TRUST
CONSOLIDATED FINANCIAL HIGHLIGHTS
Franklin Strategic Income VIP Fund (continued)
Six Months Ended (unaudited) | Year Ended December 31, | |||||||||||||||||||||||
| 2015 | 2014 | 2013 | 2012 | 2011 | ||||||||||||||||||||
| Class 2 | ||||||||||||||||||||||||
Per share operating performance (for a share outstanding throughout the period) | ||||||||||||||||||||||||
Net asset value, beginning of period | $10.21 | $11.55 | $12.30 | $12.84 | $12.27 | $12.72 | ||||||||||||||||||
|
| |||||||||||||||||||||||
| Income from investment operationsa: | ||||||||||||||||||||||||
Net investment incomeb | 0.22 | 0.49 | 0.49 | 0.54 | 0.60 | 0.64 | ||||||||||||||||||
Net realized and unrealized gains (losses) | 0.20 | (0.89 | ) | (0.24 | ) | (0.13 | ) | 0.89 | (0.30 | ) | ||||||||||||||
|
| |||||||||||||||||||||||
Total from investment operations | 0.42 | (0.40 | ) | 0.25 | 0.41 | 1.49 | 0.34 | |||||||||||||||||
|
| |||||||||||||||||||||||
| Less distributions from: | ||||||||||||||||||||||||
Net investment income and net foreign currency gains | (0.36 | ) | (0.74 | ) | (0.75 | ) | (0.78 | ) | (0.90 | ) | (0.79 | ) | ||||||||||||
Net realized gains | — | (0.20 | ) | (0.25 | ) | (0.17 | ) | (0.02 | ) | — | ||||||||||||||
|
| |||||||||||||||||||||||
Total distributions | (0.36 | ) | (0.94 | ) | (1.00 | ) | (0.95 | ) | (0.92 | ) | (0.79 | ) | ||||||||||||
|
| |||||||||||||||||||||||
Net asset value, end of period | $10.27 | $10.21 | $11.55 | $12.30 | $12.84 | $12.27 | ||||||||||||||||||
|
| |||||||||||||||||||||||
Total returnc | 4.19% | (3.87)% | 1.86% | 3.32% | 12.75% | 2.57% | ||||||||||||||||||
| Ratios to average net assetsd | ||||||||||||||||||||||||
Expenses before waiver and payments by affiliates | 0.92% | e | 0.88% | 0.88% | 0.85% | 0.83% | 0.85% | |||||||||||||||||
Expenses net of waiver and payments by affiliates | 0.85% | e,f | 0.87% | f | 0.87% | f | 0.85% | f | 0.83% | 0.85% | f | |||||||||||||
Net investment income | 4.23% | 4.46% | 4.09% | 4.33% | 4.79% | 5.11% | ||||||||||||||||||
| Supplemental data | ||||||||||||||||||||||||
Net assets, end of period (000’s) | $202,076 | $202,192 | $206,571 | $175,307 | $158,451 | $123,749 | ||||||||||||||||||
Portfolio turnover rate | 56.48% | 85.85% | 55.64% | 48.06% | 49.98% | 55.65% | ||||||||||||||||||
Portfolio turnover rate excluding mortgage dollar rollsg | 30.10% | 51.47% | 48.86% | 47.01% | 48.75% | 55.65% | ||||||||||||||||||
aThe amount shown for a share outstanding throughout the period may not correlate with the Consolidated Statement of Operations for the period due to the timing of sales and repurchases of the Fund’s shares in relation to income earned and/or fluctuating fair value of the investments of the Fund.
bBased on average daily shares outstanding.
cTotal return does not include fees, charges or expenses imposed by the variable annuity and life insurance contracts for which Franklin Templeton Variable Insurance Products Trust serves as an underlying investment vehicle. Total return is not annualized for periods less than one year.
dRatios are annualized for periods less than one year.
eRatios are adjusted to exclude the effects of annualization for non-recurring expenses.
fBenefit of expense reduction rounds to less than 0.01%.
gSee Note 1(h) regarding mortgage dollar rolls.
| The accompanying notes are an integral part of these consolidated financial statements. | Semiannual Report | FSI-7 |
FRANKLIN TEMPLETON VARIABLE INSURANCE PRODUCTS TRUST
CONSOLIDATED FINANCIAL HIGHLIGHTS
Franklin Strategic Income VIP Fund (continued)
Six Months Ended (unaudited) | Year Ended December 31, | |||||||||||||||||||||||
| 2015 | 2014 | 2013 | 2012 | 2011 | ||||||||||||||||||||
| Class 4 | ||||||||||||||||||||||||
Per share operating performance (for a share outstanding throughout the period) | ||||||||||||||||||||||||
Net asset value, beginning of period | $10.44 | $11.78 | $12.51 | �� | $13.04 | $12.44 | $12.88 | |||||||||||||||||
|
| |||||||||||||||||||||||
| Income from investment operationsa: | ||||||||||||||||||||||||
Net investment incomeb | 0.22 | 0.49 | 0.49 | 0.54 | 0.60 | 0.64 | ||||||||||||||||||
Net realized and unrealized gains (losses) | 0.22 | (0.91 | ) | (0.25 | ) | (0.14 | ) | 0.91 | (0.31 | ) | ||||||||||||||
|
| |||||||||||||||||||||||
Total from investment operations | 0.44 | (0.42 | ) | 0.24 | 0.40 | 1.51 | 0.33 | |||||||||||||||||
|
| |||||||||||||||||||||||
| Less distributions from: | ||||||||||||||||||||||||
Net investment income and net foreign currency gains | (0.35 | ) | (0.72 | ) | (0.72 | ) | (0.76 | ) | (0.89 | ) | (0.77 | ) | ||||||||||||
Net realized gains | — | (0.20 | ) | (0.25 | ) | (0.17 | ) | (0.02 | ) | — | ||||||||||||||
|
| |||||||||||||||||||||||
Total distributions | (0.35 | ) | (0.92 | ) | (0.97 | ) | (0.93 | ) | (0.91 | ) | (0.77 | ) | ||||||||||||
|
| |||||||||||||||||||||||
Net asset value, end of period | $10.53 | $10.44 | $11.78 | $12.51 | $13.04 | $12.44 | ||||||||||||||||||
|
| |||||||||||||||||||||||
Total returnc | 4.20% | (3.98)% | 1.75% | 3.17% | 12.67% | 2.46% | ||||||||||||||||||
| Ratios to average net assetsd | ||||||||||||||||||||||||
Expenses before waiver and payments by affiliates | 1.02% | e | 0.98% | 0.98% | 0.95% | 0.93% | 0.95% | |||||||||||||||||
Expenses net of waiver and payments by affiliates | 0.95% | e,f | 0.97% | f | 0.97% | f | 0.95% | f | 0.93% | 0.95% | f | |||||||||||||
Net investment income | 4.13% | 4.36% | 3.99% | 4.23% | 4.69% | 5.01% | ||||||||||||||||||
| Supplemental data | ||||||||||||||||||||||||
Net assets, end of period (000’s) | $86,558 | $92,965 | $113,986 | $134,970 | $196,479 | $188,786 | ||||||||||||||||||
Portfolio turnover rate | 56.48% | 85.85% | 55.64% | 48.06% | 49.98% | 55.65% | ||||||||||||||||||
Portfolio turnover rate excluding mortgage dollar rollsg | 30.10% | 51.47% | 48.86% | 47.01% | 48.75% | 55.65% | ||||||||||||||||||
aThe amount shown for a share outstanding throughout the period may not correlate with the Consolidated Statement of Operations for the period due to the timing of sales and repurchases of the Fund’s shares in relation to income earned and/or fluctuating fair value of the investments of the Fund.
bBased on average daily shares outstanding.
cTotal return does not include fees, charges or expenses imposed by the variable annuity and life insurance contracts for which Franklin Templeton Variable Insurance Products Trust serves as an underlying investment vehicle. Total return is not annualized for periods less than one year.
dRatios are annualized for periods less than one year.
eRatios are adjusted to exclude the effects of annualization for non-recurring expenses.
fBenefit of expense reduction rounds to less than 0.01%.
gSee Note 1(h) regarding mortgage dollar rolls.
| FSI-8 | Semiannual Report | The accompanying notes are an integral part of these consolidated financial statements. |
FRANKLIN TEMPLETON VARIABLE INSURANCE PRODUCTS TRUST
Consolidated Statement of Investments, June 30, 2016 (unaudited)
Franklin Strategic Income VIP Fund
| ||||||||||||||
| Country | Shares/Units | Value | ||||||||||||
Common Stocks and Other Equity Interests 0.7% | ||||||||||||||
Consumer Services 0.7% | ||||||||||||||
| a,b,c | Turtle Bay Resort | United States | 1,901,449 | $ | 4,943,766 | |||||||||
|
| |||||||||||||
Energy 0.0%† | ||||||||||||||
| a,d | Warrior Met Coal LLC, A | United States | 1,499 | 151,124 | ||||||||||
|
| |||||||||||||
Health Care Equipment & Services 0.0%† | ||||||||||||||
| a | New Millennium Holdco Inc. | United States | 9,504 | 32,670 | ||||||||||
|
| |||||||||||||
Transportation 0.0%† | ||||||||||||||
| a,e | CEVA Holdings LLC | United Kingdom | 224 | 78,498 | ||||||||||
|
| |||||||||||||
Total Common Stocks and Other Equity Interests | 5,206,058 | |||||||||||||
|
| |||||||||||||
Management Investment Companies 8.0% | ||||||||||||||
Diversified Financials 8.0% | ||||||||||||||
| f | Franklin Lower Tier Floating Rate Fund | United States | 3,089,922 | 30,652,026 | ||||||||||
| f | Franklin Middle Tier Floating Rate Fund | United States | 2,637,222 | 25,554,680 | ||||||||||
|
| |||||||||||||
Total Management Investment Companies | 56,206,706 | |||||||||||||
|
| |||||||||||||
Convertible Preferred Stocks 0.0%† | ||||||||||||||
Transportation 0.0%† | ||||||||||||||
| a,e | CEVA Holdings LLC, cvt. pfd., A-1 | United Kingdom | 6 | 3,150 | ||||||||||
| a,e | CEVA Holdings LLC, cvt. pfd., A-2 | United Kingdom | 486 | 169,928 | ||||||||||
|
| |||||||||||||
Total Convertible Preferred Stocks (Cost $731,856) | 173,078 | |||||||||||||
|
| |||||||||||||
| Principal Amount* | ||||||||||||||
Corporate Bonds 41.7% | ||||||||||||||
Automobiles & Components 0.7% | ||||||||||||||
Fiat Chrysler Automobiles NV, senior note, 5.25%, 4/15/23 | United Kingdom | 3,500,000 | 3,485,738 | |||||||||||
The Goodyear Tire & Rubber Co., | ||||||||||||||
senior bond, 5.00%, 5/31/26 | United States | 1,000,000 | 1,021,250 | |||||||||||
senior note, 5.125%, 11/15/23 | United States | 400,000 | 415,000 | |||||||||||
|
| |||||||||||||
| 4,921,988 | ||||||||||||||
|
| |||||||||||||
Banks 4.3% | ||||||||||||||
Bank of America Corp., senior note, | ||||||||||||||
5.65%, 5/01/18 | United States | 1,500,000 | 1,608,174 | |||||||||||
3.50%, 4/19/26 | United States | 3,800,000 | 3,939,008 | |||||||||||
CIT Group Inc., senior note, | ||||||||||||||
5.375%, 5/15/20 | United States | 1,000,000 | 1,045,000 | |||||||||||
5.00%, 8/15/22 | United States | 2,500,000 | 2,550,000 | |||||||||||
Citigroup Inc., | ||||||||||||||
senior note, 3.875%, 10/25/23 | United States | 3,000,000 | 3,224,772 | |||||||||||
senior note, 3.30%, 4/27/25 | United States | 300,000 | 308,026 | |||||||||||
senior note, 3.40%, 5/01/26 | United States | 3,100,000 | 3,187,854 | |||||||||||
sub. bond, 5.50%, 9/13/25 | United States | 500,000 | 561,758 | |||||||||||
sub. note, 4.05%, 7/30/22 | United States | 300,000 | 317,550 | |||||||||||
| Semiannual Report | FSI-9 |
FRANKLIN TEMPLETON VARIABLE INSURANCE PRODUCTS TRUST
CONSOLIDATED STATEMENT OF INVESTMENTS (UNAUDITED)
Franklin Strategic Income VIP Fund (continued)
| Country | Principal Amount* | Value | ||||||||||||
Corporate Bonds (continued) | ||||||||||||||
Banks (continued) | ||||||||||||||
JPMorgan Chase & Co., | ||||||||||||||
g junior sub. bond, R, 6.00% to 8/01/23, FRN thereafter, Perpetual | United States | 1,500,000 | $ | 1,535,625 | ||||||||||
g junior sub. bond, X, 6.10% to 10/01/24, FRN thereafter, Perpetual | United States | 500,000 | 516,250 | |||||||||||
senior bond, 3.30%, 4/01/26 | United States | 400,000 | 414,649 | |||||||||||
senior note, 4.25%, 10/15/20 | United States | 1,000,000 | 1,090,696 | |||||||||||
sub. note, 3.375%, 5/01/23 | United States | 1,000,000 | 1,021,221 | |||||||||||
sub. note, 3.875%, 9/10/24 | United States | 1,000,000 | 1,036,445 | |||||||||||
Royal Bank of Scotland Group PLC, sub. note, 6.125%, 12/15/22 | United Kingdom | 700,000 | 734,619 | |||||||||||
Wells Fargo & Co., | ||||||||||||||
g junior sub. bond, S, 5.90% to 6/15/24, FRN thereafter, Perpetual | United States | 1,500,000 | 1,545,000 | |||||||||||
senior note, 2.60%, 7/22/20 | United States | 700,000 | 719,882 | |||||||||||
senior note, 3.00%, 4/22/26 | United States | 5,000,000 | 5,103,080 | |||||||||||
|
| |||||||||||||
| 30,459,609 | ||||||||||||||
|
| |||||||||||||
Capital Goods 0.4% | ||||||||||||||
| h | Bombardier Inc., senior bond, 144A, 7.50%, 3/15/25 | Canada | 500,000 | 435,000 | ||||||||||
| e | Erickson Air-Crane Inc., Purchase Price Notes, 6.00%, 11/02/20 | United States | 136,004 | 102,346 | ||||||||||
Navistar International Corp., senior bond, 8.25%, 11/01/21 | United States | 1,400,000 | 990,500 | |||||||||||
TransDigm Inc., | ||||||||||||||
senior sub. bond, 6.50%, 7/15/24 | United States | 500,000 | 505,000 | |||||||||||
senior sub. bond, 6.50%, 5/15/25 | United States | 200,000 | 201,250 | |||||||||||
h senior sub. bond, 144A, 6.375%, 6/15/26 | United States | 400,000 | 399,500 | |||||||||||
senior sub. note, 6.00%, 7/15/22 | United States | 400,000 | 404,072 | |||||||||||
|
| |||||||||||||
| 3,037,668 | ||||||||||||||
|
| |||||||||||||
Commercial & Professional Services 0.1% | ||||||||||||||
United Rentals North America Inc., senior bond, 5.875%, 9/15/26 | United States | 700,000 | 698,250 | |||||||||||
|
| |||||||||||||
Consumer Durables & Apparel 0.7% | ||||||||||||||
| h | Hanesbrands Inc., senior bond, 144A, 4.875%, 5/15/26 | United States | 1,500,000 | 1,512,900 | ||||||||||
KB Home, senior note, | ||||||||||||||
4.75%, 5/15/19 | United States | 1,000,000 | 1,007,500 | |||||||||||
7.00%, 12/15/21 | United States | 1,200,000 | 1,212,000 | |||||||||||
Toll Brothers Finance Corp., senior bond, 5.625%, 1/15/24 | United States | 1,100,000 | 1,146,750 | |||||||||||
|
| |||||||||||||
| 4,879,150 | ||||||||||||||
|
| |||||||||||||
Consumer Services 1.7% | ||||||||||||||
| h | 1011778 BC ULC/New Red Finance Inc., secured note, second lien, 144A, 6.00%, 4/01/22 | Canada | 2,000,000 | 2,079,380 | ||||||||||
| h,i | Fontainebleau Las Vegas, senior secured bond, first lien, 144A, 11.00%, 6/15/15 | United States | 2,500,000 | 4,937 | ||||||||||
| h | International Game Technology PLC, senior secured bond, 144A, 6.50%, 2/15/25 | United States | 3,300,000 | 3,333,000 | ||||||||||
| h | KFC Holding Co./Pizza Hut Holdings LLC/Taco Bell of America LLC, senior note, 144A, | |||||||||||||
5.00%, 6/01/24 | United States | 900,000 | 924,750 | |||||||||||
5.25%, 6/01/26 | United States | 800,000 | 822,000 | |||||||||||
Marriott International Inc., senior bond, 3.75%, 10/01/25 | United States | 3,000,000 | 3,212,886 | |||||||||||
MGM Resorts International, senior note, 6.75%, 10/01/20 | United States | 200,000 | 219,500 | |||||||||||
| h | Wynn Las Vegas LLC/Wynn Las Vegas Capital Corp., senior bond, 144A, 5.50%, 3/01/25 | United States | 700,000 | 679,875 | ||||||||||
| h | Wynn Macau Ltd., senior note, 144A, 5.25%, 10/15/21 | Macau | 1,300,000 | 1,257,750 | ||||||||||
|
| |||||||||||||
| 12,534,078 | ||||||||||||||
|
| |||||||||||||
| FSI-10 | Semiannual Report |
FRANKLIN TEMPLETON VARIABLE INSURANCE PRODUCTS TRUST
CONSOLIDATED STATEMENT OF INVESTMENTS (UNAUDITED)
Franklin Strategic Income VIP Fund (continued)
| Country | Principal Amount* | Value | ||||||||||||
Corporate Bonds (continued) | ||||||||||||||
Diversified Financials 2.8% | ||||||||||||||
AerCap Ireland Capital Ltd./AerCap Global Aviation Trust, senior note, | ||||||||||||||
4.25%, 7/01/20 | Netherlands | 1,300,000 | $ | 1,331,720 | ||||||||||
4.625%, 10/30/20 | Netherlands | 500,000 | 517,753 | |||||||||||
5.00%, 10/01/21 | Netherlands | 1,100,000 | 1,150,847 | |||||||||||
Capital One Financial Corp., senior note, 3.20%, 2/05/25 | United States | 800,000 | 809,342 | |||||||||||
Deutsche Bank AG, sub. bond, 4.296% to 5/24/23, FRN thereafter, 5/24/28 | Germany | 2,700,000 | 2,379,105 | |||||||||||
E*TRADE Financial Corp., senior note, | ||||||||||||||
5.375%, 11/15/22 | United States | 700,000 | 742,000 | |||||||||||
4.625%, 9/15/23 | United States | 800,000 | 814,000 | |||||||||||
The Goldman Sachs Group Inc., senior note, 3.50%, 1/23/25 | United States | 3,000,000 | 3,089,472 | |||||||||||
| h | Lincoln Finance Ltd., senior secured note, 144A, 6.875%, 4/15/21 | Netherlands | 600,000 | EUR | 714,969 | |||||||||
Morgan Stanley, | ||||||||||||||
senior note, 3.875%, 1/27/26 | United States | 3,200,000 | 3,413,779 | |||||||||||
sub. bond, 3.95%, 4/23/27 | United States | 1,000,000 | 1,010,883 | |||||||||||
Navient Corp., senior note, | ||||||||||||||
8.45%, 6/15/18 | United States | 1,000,000 | 1,085,000 | |||||||||||
5.50%, 1/15/19 | United States | 1,500,000 | 1,512,375 | |||||||||||
5.875%, 3/25/21 | United States | 700,000 | 663,684 | |||||||||||
6.125%, 3/25/24 | United States | 500,000 | 441,250 | |||||||||||
|
| |||||||||||||
| 19,676,179 | ||||||||||||||
|
| |||||||||||||
Energy 5.3% | ||||||||||||||
Access Midstream Partner LP/ACMP Finance Corp., senior note, 6.125%, 7/15/22 | United States | 600,000 | 616,073 | |||||||||||
Apache Corp., senior bond, 2.625%, 1/15/23 | United States | 1,900,000 | 1,885,516 | |||||||||||
| i | BreitBurn Energy Partners LP/BreitBurn Finance Corp., senior bond, 7.875%, 4/15/16 | United States | 2,300,000 | 494,500 | ||||||||||
| h | California Resources Corp., secured note, second lien, 144A, 8.00%, 12/15/22 | United States | 716,000 | 509,255 | ||||||||||
| h | Calumet Specialty Products Partners LP/Calumet Finance Corp., senior note, 144A, 11.50%, 1/15/21 | United States | 800,000 | 902,000 | ||||||||||
CGG SA, senior note, | ||||||||||||||
6.50%, 6/01/21 | France | 1,800,000 | 801,000 | |||||||||||
6.875%, 1/15/22 | France | 200,000 | 88,000 | |||||||||||
| c,i | CHC Helicopter SA, | |||||||||||||
senior note, 9.375%, 6/01/21 | Canada | 260,000 | 37,700 | |||||||||||
senior secured note, first lien, 9.25%, 10/15/20 | Canada | 2,205,000 | 992,250 | |||||||||||
| h | Cheniere Corpus Christi Holdings LLC, senior secured note, 144A, 7.00%, 6/30/24 | United States | 800,000 | 822,504 | ||||||||||
| h | Chesapeake Energy Corp., secured note, second lien, 144A, 8.00%, 12/15/22 | United States | 755,000 | 643,638 | ||||||||||
Clayton Williams Energy Inc., senior note, 7.75%, 4/01/19 | United States | 1,300,000 | 988,000 | |||||||||||
CONSOL Energy Inc., senior note, 5.875%, 4/15/22 | United States | 2,500,000 | 2,196,875 | |||||||||||
Energy Transfer Equity LP, senior note, first lien, 7.50%, 10/15/20 | United States | 1,900,000 | 2,023,500 | |||||||||||
Energy Transfer Partners LP, senior note, 5.20%, 2/01/22 | United States | 1,000,000 | 1,054,889 | |||||||||||
| i | Energy XXI Gulf Coast Inc., | |||||||||||||
senior note, 9.25%, 12/15/17 | United States | 1,500,000 | 172,500 | |||||||||||
senior note, 6.875%, 3/15/24 | United States | 800,000 | 92,000 | |||||||||||
h senior secured note, second lien, 144A, 11.00%, 3/15/20 | United States | 700,000 | 283,500 | |||||||||||
| h | EnQuest PLC, senior note, 144A, 7.00%, 4/15/22 | United Kingdom | 1,100,000 | 672,375 | ||||||||||
| Semiannual Report | FSI-11 |
FRANKLIN TEMPLETON VARIABLE INSURANCE PRODUCTS TRUST
CONSOLIDATED STATEMENT OF INVESTMENTS (UNAUDITED)
Franklin Strategic Income VIP Fund (continued)
| Country | Principal Amount* | Value | ||||||||||||
Corporate Bonds (continued) | ||||||||||||||
Energy (continued) | ||||||||||||||
Freeport-McMoRan Oil & Gas LLC/FCX Oil & Gas Inc., senior note, 6.875%, 2/15/23 | United States | 672,000 | $ | 651,840 | ||||||||||
| h,j | Gaz Capital SA, (OJSC Gazprom), loan participation, senior note, 144A, 3.85%, 2/06/20 | Russia | 1,500,000 | 1,518,577 | ||||||||||
| i | Halcon Resources Corp., | |||||||||||||
senior note, 8.875%, 5/15/21 | United States | 1,400,000 | 287,000 | |||||||||||
h senior secured note, third lien, 144A, 13.00%, 2/15/22 | United States | 1,000,000 | 535,000 | |||||||||||
| h | Kinder Morgan Finance Co. LLC, senior secured note, 144A, 6.00%, 1/15/18 | United States | 2,000,000 | 2,105,168 | ||||||||||
Kinder Morgan Inc., senior note, 6.50%, 9/15/20 | United States | 1,500,000 | 1,654,812 | |||||||||||
| h,i | Linn Energy LLC/Finance Corp., senior secured note, second lien, 144A, 12.00%, 12/15/20 | United States | 2,000,000 | 695,000 | ||||||||||
| h | LUKOIL International Finance BV, senior note, 144A, 4.563%, 4/24/23 | Russia | 2,500,000 | 2,537,225 | ||||||||||
Martin Midstream Partners LP/Martin Midstream Finance Corp., senior note, 7.25%, 2/15/21 | United States | 2,000,000 | 1,860,000 | |||||||||||
| i | Midstates Petroleum Co. Inc./LLC, senior note, 9.25%, 6/01/21 | United States | 1,500,000 | 22,500 | ||||||||||
PBF Holding Co. LLC, first lien, 8.25%, 2/15/20 | United States | 1,000,000 | 1,042,500 | |||||||||||
| h,i | Peabody Energy Corp., secured note, second lien, 144A, 10.00%, 3/15/22 | United States | 3,000,000 | 405,000 | ||||||||||
| i | Penn Virginia Corp., senior note, 8.50%, 5/01/20 | United States | 1,500,000 | 585,000 | ||||||||||
Regency Energy Partners LP/Regency Energy Finance Corp., | ||||||||||||||
5.875%, 3/01/22 | United States | 200,000 | 212,639 | |||||||||||
5.00%, 10/01/22 | United States | 500,000 | 513,774 | |||||||||||
Sabine Pass Liquefaction LLC, | ||||||||||||||
first lien, 5.625%, 2/01/21 | United States | 2,000,000 | 2,030,000 | |||||||||||
first lien, 5.625%, 4/15/23 | United States | 900,000 | 907,875 | |||||||||||
senior secured note, first lien, 5.75%, 5/15/24 | United States | 300,000 | 299,250 | |||||||||||
Sanchez Energy Corp., senior note, | ||||||||||||||
7.75%, 6/15/21 | United States | 900,000 | 767,250 | |||||||||||
6.125%, 1/15/23 | United States | 300,000 | 233,250 | |||||||||||
| c | W&T Offshore Inc., senior note, 8.50%, 6/15/19 | United States | 2,000,000 | 500,000 | ||||||||||
Weatherford International Ltd., senior note, | ||||||||||||||
7.75%, 6/15/21 | United States | 800,000 | 782,000 | |||||||||||
8.25%, 6/15/23 | United States | 1,000,000 | 952,500 | |||||||||||
WPX Energy Inc., senior note, 8.25%, 8/01/23 | United States | 900,000 | 906,750 | |||||||||||
|
| |||||||||||||
| 37,280,985 | ||||||||||||||
|
| |||||||||||||
Food & Staples Retailing 0.8% | ||||||||||||||
| h | Cencosud SA, senior note, 144A, | |||||||||||||
4.875%, 1/20/23 | Chile | 1,500,000 | 1,544,288 | |||||||||||
5.15%, 2/12/25 | Chile | 1,500,000 | 1,543,725 | |||||||||||
Walgreens Boots Alliance Inc., senior note, 3.80%, 11/18/24 | United States | 2,500,000 | 2,654,522 | |||||||||||
|
| |||||||||||||
| 5,742,535 | ||||||||||||||
|
| |||||||||||||
Food, Beverage & Tobacco 1.1% | ||||||||||||||
Anheuser-Busch InBev Finance Inc., senior note, 3.30%, 2/01/23 | Belgium | 1,300,000 | 1,369,673 | |||||||||||
| h | JBS USA LLC/Finance Inc., senior note, 144A, | |||||||||||||
8.25%, 2/01/20 | United States | 2,500,000 | 2,600,000 | |||||||||||
5.75%, 6/15/25 | United States | 500,000 | 472,500 | |||||||||||
| h | Post Holdings Inc., senior note, 144A, | |||||||||||||
6.75%, 12/01/21 | United States | 1,700,000 | 1,802,000 | |||||||||||
| FSI-12 | Semiannual Report |
FRANKLIN TEMPLETON VARIABLE INSURANCE PRODUCTS TRUST
CONSOLIDATED STATEMENT OF INVESTMENTS (UNAUDITED)
Franklin Strategic Income VIP Fund (continued)
| Country | Principal Amount* | Value | ||||||||||||
Corporate Bonds (continued) | ||||||||||||||
Food, Beverage & Tobacco (continued) | ||||||||||||||
| h | Post Holdings Inc., senior note, 144A, (continued) | |||||||||||||
6.00%, 12/15/22 | United States | 500,000 | $ | 514,375 | ||||||||||
7.75%, 3/15/24 | United States | 1,000,000 | 1,101,250 | |||||||||||
|
| |||||||||||||
| 7,859,798 | ||||||||||||||
|
| |||||||||||||
Health Care Equipment & Services 1.9% | ||||||||||||||
Alere Inc., senior sub. note, 6.50%, 6/15/20 | United States | 900,000 | 900,000 | |||||||||||
CHS/Community Health Systems Inc., | ||||||||||||||
senior note, 8.00%, 11/15/19 | United States | 1,500,000 | 1,471,875 | |||||||||||
senior note, 6.875%, 2/01/22 | United States | 400,000 | 352,000 | |||||||||||
senior secured note, first lien, 5.125%, 8/15/18 | United States | 121,000 | 123,269 | |||||||||||
DaVita HealthCare Partners Inc., | ||||||||||||||
senior bond, 5.125%, 7/15/24 | United States | 500,000 | 506,487 | |||||||||||
senior bond, 5.00%, 5/01/25 | United States | 900,000 | 894,375 | |||||||||||
senior note, 5.75%, 8/15/22 | United States | 1,500,000 | 1,575,000 | |||||||||||
HCA Inc., | ||||||||||||||
senior bond, 5.875%, 5/01/23 | United States | 1,500,000 | 1,603,125 | |||||||||||
senior note, 7.50%, 2/15/22 | United States | 700,000 | 797,650 | |||||||||||
senior secured bond, first lien, 5.875%, 3/15/22 | United States | 1,000,000 | 1,090,000 | |||||||||||
senior secured bond, first lien, 5.25%, 4/15/25 | United States | 600,000 | 628,500 | |||||||||||
| h | MPH Acquisition Holdings LLC, senior note, 144A, 7.125%, 6/01/24 | United States | 400,000 | 421,000 | ||||||||||
Stryker Corp., senior bond, 3.50%, 3/15/26 | United States | 500,000 | 531,782 | |||||||||||
Tenet Healthcare Corp., senior note, | ||||||||||||||
5.00%, 3/01/19 | United States | 500,000 | 486,250 | |||||||||||
5.50%, 3/01/19 | United States | 1,200,000 | 1,188,000 | |||||||||||
8.125%, 4/01/22 | United States | 1,000,000 | 1,029,800 | |||||||||||
|
| |||||||||||||
| 13,599,113 | ||||||||||||||
|
| |||||||||||||
Insurance 1.1% | ||||||||||||||
MetLife Inc., senior note, | ||||||||||||||
3.60%, 4/10/24 | United States | 2,400,000 | 2,534,844 | |||||||||||
3.00%, 3/01/25 | United States | 300,000 | 304,233 | |||||||||||
| h | Nippon Life Insurance Co., sub. bond, 144A, 5.10% to 10/16/24, FRN thereafter, 10/16/44 | Japan | 3,500,000 | 3,784,847 | ||||||||||
Prudential Financial Inc., 3.50%, 5/15/24 | United States | 800,000 | 833,075 | |||||||||||
|
| |||||||||||||
| 7,456,999 | ||||||||||||||
|
| |||||||||||||
Materials 5.0% | ||||||||||||||
ArcelorMittal, senior note, | ||||||||||||||
6.50%, 3/01/21 | France | 2,700,000 | 2,787,682 | |||||||||||
6.125%, 6/01/25 | France | 300,000 | 300,000 | |||||||||||
| h | Ardagh Packaging Finance PLC/Ardagh MP Holdings USA Inc., senior note, 144A, | |||||||||||||
7.00%, 11/15/20 | Luxembourg | 105,882 | 104,294 | |||||||||||
6.75%, 1/31/21 | Luxembourg | 200,000 | 201,500 | |||||||||||
6.00%, 6/30/21 | Luxembourg | 1,300,000 | 1,296,750 | |||||||||||
| h | Barminco Finance Pty. Ltd., senior note, 144A, 9.00%, 6/01/18 | Australia | 1,500,000 | 1,246,410 | ||||||||||
| h | Cemex Finance LLC, senior secured note, first lien, 144A, 6.00%, 4/01/24 | Mexico | 1,000,000 | 972,090 | ||||||||||
| h | Cemex SAB de CV, | |||||||||||||
first lien, 144A, 5.70%, 1/11/25 | Mexico | 1,500,000 | 1,427,130 | |||||||||||
secured note, 144A, 5.875%, 3/25/19 | Mexico | 1,000,000 | 1,025,200 | |||||||||||
| Semiannual Report | FSI-13 |
FRANKLIN TEMPLETON VARIABLE INSURANCE PRODUCTS TRUST
CONSOLIDATED STATEMENT OF INVESTMENTS (UNAUDITED)
Franklin Strategic Income VIP Fund (continued)
| Country | Principal Amount* | Value | ||||||||||||
Corporate Bonds (continued) | ||||||||||||||
Materials (continued) | ||||||||||||||
| h | Ceramtec Group GmbH, senior note, 144A, 8.25%, 8/15/21 | Germany | 1,200,000 | EUR | $ | 1,410,917 | ||||||||
The Chemours Co., | ||||||||||||||
senior bond, 7.00%, 5/15/25 | United States | 500,000 | 421,875 | |||||||||||
senior note, 6.625%, 5/15/23 | United States | 2,000,000 | 1,710,000 | |||||||||||
| h | First Quantum Minerals Ltd., senior note, 144A, | |||||||||||||
6.75%, 2/15/20 | Canada | 700,000 | 588,000 | |||||||||||
7.00%, 2/15/21 | Canada | 825,000 | 667,219 | |||||||||||
| h | FMG Resources (August 2006) Pty. Ltd., senior secured note, 144A, 9.75%, 3/01/22 | Australia | 1,700,000 | 1,887,000 | ||||||||||
Freeport-McMoRan Inc., senior note, 4.55%, 11/14/24 | United States | 2,500,000 | 2,200,000 | |||||||||||
| h | Glencore Finance Canada Ltd., senior bond, 144A, | Switzerland | 1,000,000 | 1,001,165 | ||||||||||
| h | Glencore Funding LLC, senior note, 144A, | |||||||||||||
4.125%, 5/30/23 | Switzerland | 600,000 | 552,811 | |||||||||||
4.625%, 4/29/24 | Switzerland | 250,000 | 234,250 | |||||||||||
| h | INVISTA Finance LLC, senior secured note, 144A, 4.25%, 10/15/19 | United States | 3,000,000 | 2,940,000 | ||||||||||
Novelis Inc., senior note, 8.75%, 12/15/20 | Canada | 1,600,000 | 1,668,720 | |||||||||||
| h | Owens-Brockway Glass Container Inc., senior note, 144A, | |||||||||||||
5.00%, 1/15/22 | United States | 1,400,000 | 1,407,000 | |||||||||||
5.875%, 8/15/23 | United States | 700,000 | 736,606 | |||||||||||
Reynolds Group Issuer Inc./Reynolds Group Issuer LLC/Reynolds Group Issuer Luxembourg SA, | ||||||||||||||
first lien, 5.75%, 10/15/20 | United States | 700,000 | 724,794 | |||||||||||
h first lien, 144A, 5.125%, 7/15/23 | United States | 700,000 | 709,625 | |||||||||||
h senior note, 144A, 8.25%, 2/15/21 | United States | 1,000,000 | 1,046,300 | |||||||||||
h senior note, 144A, 7.00%, 7/15/24 | United States | 300,000 | 309,413 | |||||||||||
| h | Sealed Air Corp., | |||||||||||||
senior bond, 144A, 5.125%, 12/01/24 | United States | 1,000,000 | 1,031,250 | |||||||||||
senior bond, 144A, 5.50%, 9/15/25 | United States | 400,000 | 417,500 | |||||||||||
senior note, 144A, 4.875%, 12/01/22 | United States | 1,000,000 | 1,032,500 | |||||||||||
Steel Dynamics Inc., | ||||||||||||||
senior bond, 5.50%, 10/01/24 | United States | 1,000,000 | 1,025,000 | |||||||||||
senior note, 5.125%, 10/01/21 | United States | 1,000,000 | 1,026,250 | |||||||||||
| h | U.S. Coatings Acquisition Inc./Flash Dutch 2 BV, 144A, | United States | 1,000,000 | EUR | 1,155,735 | |||||||||
| i | Verso Paper Holdings LLC/Inc., senior secured note, first lien, 11.75%, 1/15/16 | United States | 451,000 | 77,798 | ||||||||||
|
| |||||||||||||
| 35,342,784 | ||||||||||||||
|
| |||||||||||||
Media 4.1% | ||||||||||||||
21st Century Fox America Inc., senior note, 3.00%, 9/15/22 | United States | 500,000 | 522,824 | |||||||||||
| h | Altice U.S. Finance I Corp., senior secured bond, 144A, | United States | 1,200,000 | 1,203,000 | ||||||||||
AMC Networks Inc., senior note, 5.00%, 4/01/24 | United States | 1,100,000 | 1,092,987 | |||||||||||
CCO Holdings LLC/CCO Holdings Capital Corp., senior bond, | ||||||||||||||
5.25%, 9/30/22 | United States | 2,700,000 | 2,777,625 | |||||||||||
h144A, 5.375%, 5/01/25 | United States | 900,000 | 915,750 | |||||||||||
Clear Channel Worldwide Holdings Inc., | ||||||||||||||
senior note, 6.50%, 11/15/22 | United States | 1,000,000 | 1,005,000 | |||||||||||
senior sub. note, 7.625%, 3/15/20 | United States | 200,000 | 183,500 | |||||||||||
senior sub. note, 7.625%, 3/15/20 | United States | 500,000 | 478,250 | |||||||||||
| FSI-14 | Semiannual Report |
FRANKLIN TEMPLETON VARIABLE INSURANCE PRODUCTS TRUST
CONSOLIDATED STATEMENT OF INVESTMENTS (UNAUDITED)
Franklin Strategic Income VIP Fund (continued)
| Country | Principal Amount* | Value | ||||||||||||
Corporate Bonds (continued) | ||||||||||||||
Media (continued) | ||||||||||||||
CSC Holdings LLC, senior note, | ||||||||||||||
6.75%, 11/15/21 | United States | 2,500,000 | $ | 2,556,250 | ||||||||||
5.25%, 6/01/24 | United States | 200,000 | 182,000 | |||||||||||
DISH DBS Corp., senior note, | ||||||||||||||
6.75%, 6/01/21 | United States | 500,000 | 519,375 | |||||||||||
5.875%, 7/15/22 | United States | 500,000 | 487,500 | |||||||||||
5.875%, 11/15/24 | United States | 500,000 | 468,750 | |||||||||||
Gannett Co. Inc., | ||||||||||||||
senior bond, 6.375%, 10/15/23 | United States | 1,000,000 | 1,066,250 | |||||||||||
h senior bond, 144A, 5.50%, 9/15/24 | United States | 300,000 | 310,125 | |||||||||||
senior note, 5.125%, 7/15/20 | United States | 1,000,000 | 1,033,750 | |||||||||||
iHeartCommunications Inc., | ||||||||||||||
senior secured bond, first lien, 9.00%, 3/01/21 | United States | 2,400,000 | 1,701,000 | |||||||||||
senior secured note, first lien, 9.00%, 9/15/22 | United States | 700,000 | 488,250 | |||||||||||
| h | Sirius XM Radio Inc., senior bond, 144A, | |||||||||||||
6.00%, 7/15/24 | United States | 1,700,000 | 1,761,625 | |||||||||||
5.375%, 4/15/25 | United States | 800,000 | 798,500 | |||||||||||
Time Warner Cable Inc., senior note, 4.00%, 9/01/21 | United States | 1,300,000 | 1,382,545 | |||||||||||
| h | Unitymedia Hessen GmbH & Co. KG/Unitymedia NRW GmbH, senior secured note, first lien, 144A, 5.625%, 4/15/23 | Germany | 640,000 | EUR | 751,893 | |||||||||
| h | Unitymedia KabelBW GmbH, senior bond, 144A, 6.125%, 1/15/25 | Germany | 1,700,000 | 1,717,170 | ||||||||||
| h | Univision Communications Inc., senior secured note, first lien, 144A, 5.125%, 2/15/25 | United States | 2,500,000 | 2,481,250 | ||||||||||
| h | Virgin Media Finance PLC, senior bond, 144A, 6.375%, 10/15/24 | United Kingdom | 900,000 | GBP | 1,200,954 | |||||||||
| h | Virgin Media Secured Finance PLC, senior secured bond, first lien, 144A, 5.50%, 1/15/25 | United Kingdom | 1,900,000 | 1,873,875 | ||||||||||
|
| |||||||||||||
| 28,959,998 | ||||||||||||||
|
| |||||||||||||
Pharmaceuticals, Biotechnology & Life Sciences 3.1% | ||||||||||||||
AbbVie Inc., senior note, 3.60%, 5/14/25 | United States | 2,500,000 | 2,624,522 | |||||||||||
Actavis Funding SCS, senior bond, 3.80%, 3/15/25 | United States | 2,200,000 | 2,293,232 | |||||||||||
Baxalta Inc., senior note, 4.00%, 6/23/25 | United States | 2,500,000 | 2,610,692 | |||||||||||
Biogen Inc., senior note, 3.625%, 9/15/22 | United States | 1,500,000 | 1,594,682 | |||||||||||
| h | Endo Finance LLC/Endo Ltd./Endo Finco Inc., | |||||||||||||
senior bond, 144A, 6.00%, 2/01/25 | United States | 1,200,000 | 1,047,000 | |||||||||||
senior note, 144A, 6.00%, 7/15/23 | United States | 700,000 | 619,500 | |||||||||||
Gilead Sciences Inc., senior bond, 3.65%, 3/01/26 | United States | 3,000,000 | 3,267,981 | |||||||||||
Grifols Worldwide Operations Ltd., senior note, 5.25%, 4/01/22 | United States | 800,000 | 818,000 | |||||||||||
| h | Jaguar Holding Co. II/Pharmaceutical Product Development LLC, senior note, 144A, 6.375%, 8/01/23 | United States | 1,400,000 | 1,435,000 | ||||||||||
| h | Valeant Pharmaceuticals International, senior note, 144A, | United States | 2,400,000 | 2,076,000 | ||||||||||
| h | Valeant Pharmaceuticals International Inc., | |||||||||||||
senior bond, 144A, 6.125%, 4/15/25 | United States | 300,000 | 241,500 | |||||||||||
senior note, 144A, 5.50%, 3/01/23 | United States | 400,000 | 323,250 | |||||||||||
Zoetis Inc., senior bond, 3.25%, 2/01/23 | United States | 2,500,000 | 2,551,518 | |||||||||||
|
| |||||||||||||
| 21,502,877 | ||||||||||||||
|
| |||||||||||||
Real Estate 0.6% | ||||||||||||||
American Tower Corp., senior bond, 3.375%, 10/15/26 | United States | 1,400,000 | 1,411,018 | |||||||||||
Equinix Inc., senior bond, | ||||||||||||||
5.375%, 4/01/23 | United States | 2,500,000 | 2,593,750 | |||||||||||
| Semiannual Report | FSI-15 |
FRANKLIN TEMPLETON VARIABLE INSURANCE PRODUCTS TRUST
CONSOLIDATED STATEMENT OF INVESTMENTS (UNAUDITED)
Franklin Strategic Income VIP Fund (continued)
| Country | Principal Amount* | Value | ||||||||||||
Corporate Bonds (continued) | ||||||||||||||
Real Estate (continued) | ||||||||||||||
Equinix Inc., senior bond, (continued) | ||||||||||||||
5.875%, 1/15/26 | United States | 200,000 | $ | 209,000 | ||||||||||
|
| |||||||||||||
| 4,213,768 | ||||||||||||||
|
| |||||||||||||
Retailing 0.8% | ||||||||||||||
| h | Argos Merger Sub Inc., senior note, 144A, 7.125%, 3/15/23 | United States | 1,400,000 | 1,443,750 | ||||||||||
| h | Dollar Tree Inc., senior note, 144A, 5.75%, 3/01/23 | United States | 900,000 | 960,750 | ||||||||||
| h,i | Edcon Ltd., secured note, 144A, 9.50%, 3/01/18 | South Africa | 1,800,000 | EUR | 609,363 | |||||||||
Netflix Inc., senior bond, 5.875%, 2/15/25 | United States | 2,300,000 | 2,423,625 | |||||||||||
|
| |||||||||||||
| 5,437,488 | ||||||||||||||
|
| |||||||||||||
Semiconductors & Semiconductor Equipment 0.2% | ||||||||||||||
| h | Qorvo Inc., senior bond, 144A, 7.00%, 12/01/25 | United States | 1,400,000 | 1,484,000 | ||||||||||
|
| |||||||||||||
Software & Services 0.7% | ||||||||||||||
| h | BMC Software Finance Inc., senior note, 144A, 8.125%, 7/15/21 | United States | 2,600,000 | 1,963,000 | ||||||||||
| h | First Data Corp., | |||||||||||||
second lien, 144A, 5.75%, 1/15/24 | United States | 2,100,000 | 2,089,500 | |||||||||||
senior note, 144A, 7.00%, 12/01/23 | United States | 700,000 | 713,125 | |||||||||||
|
| |||||||||||||
| 4,765,625 | ||||||||||||||
|
| |||||||||||||
Technology Hardware & Equipment 0.5% | ||||||||||||||
| h,k | CommScope Holdings Co. Inc., senior note, 144A, PIK, | United States | 92,000 | 95,198 | ||||||||||
| h | CommScope Technologies Finance LLC, senior bond, 144A, | United States | 1,000,000 | 1,030,000 | ||||||||||
| h | Diamond 1 Finance Corp./Diamond 2 Finance Corp., | |||||||||||||
5.875%, 6/15/21 | United States | 300,000 | 307,734 | |||||||||||
7.125%, 6/15/24 | United States | 200,000 | 209,200 | |||||||||||
| h | Western Digital Corp., senior note, 144A, 10.50%, 4/01/24 | United States | 2,000,000 | 2,145,000 | ||||||||||
|
| |||||||||||||
| 3,787,132 | ||||||||||||||
|
| |||||||||||||
Telecommunication Services 3.5% | ||||||||||||||
AT&T Inc., senior bond, 3.40%, 5/15/25 | United States | 1,900,000 | 1,948,060 | |||||||||||
CenturyLink Inc., | ||||||||||||||
senior bond, 6.75%, 12/01/23 | United States | 700,000 | 690,375 | |||||||||||
senior bond, 5.625%, 4/01/25 | United States | 900,000 | 804,375 | |||||||||||
senior note, 6.00%, 4/01/17 | United States | 500,000 | 514,375 | |||||||||||
senior note, 6.45%, 6/15/21 | United States | 500,000 | 509,375 | |||||||||||
| h | Digicel Group Ltd., senior note, 144A, 8.25%, 9/30/20 | Bermuda | 1,200,000 | 1,005,696 | ||||||||||
| h | Digicel Ltd., senior note, 144A, | |||||||||||||
6.00%, 4/15/21 | Bermuda | 1,000,000 | 861,250 | |||||||||||
6.75%, 3/01/23 | Bermuda | 300,000 | 256,826 | |||||||||||
Intelsat Jackson Holdings SA, | ||||||||||||||
senior bond, 6.625%, 12/15/22 | Luxembourg | 1,600,000 | 1,088,000 | |||||||||||
senior note, 7.25%, 10/15/20 | Luxembourg | 1,000,000 | 717,500 | |||||||||||
senior note, 7.50%, 4/01/21 | Luxembourg | 500,000 | 347,500 | |||||||||||
| h | Millicom International Cellular SA, senior note, 144A, | Luxembourg | 2,200,000 | 2,266,990 | ||||||||||
Sprint Communications Inc., senior note, | ||||||||||||||
8.375%, 8/15/17 | United States | 1,200,000 | 1,236,000 | |||||||||||
6.00%, 11/15/22 | United States | 500,000 | 395,950 | |||||||||||
| FSI-16 | Semiannual Report |
FRANKLIN TEMPLETON VARIABLE INSURANCE PRODUCTS TRUST
CONSOLIDATED STATEMENT OF INVESTMENTS (UNAUDITED)
Franklin Strategic Income VIP Fund (continued)
| Country | Principal Amount* | Value | ||||||||||||
Corporate Bonds (continued) | ||||||||||||||
Telecommunication Services (continued) | ||||||||||||||
Sprint Communications Inc., senior note, (continued) | ||||||||||||||
h 144A, 9.00%, 11/15/18 | United States | 1,500,000 | $ | 1,603,125 | ||||||||||
h 144A, 7.00%, 3/01/20 | United States | 800,000 | 841,592 | |||||||||||
Sprint Corp., senior bond, 7.875%, 9/15/23 | United States | 500,000 | 411,250 | |||||||||||
T-Mobile USA Inc., | ||||||||||||||
senior bond, 6.50%, 1/15/24 | United States | 500,000 | 528,125 | |||||||||||
senior bond, 6.375%, 3/01/25 | United States | 1,300,000 | 1,363,375 | |||||||||||
senior note, 6.542%, 4/28/20 | United States | 1,400,000 | 1,443,764 | |||||||||||
senior note, 6.125%, 1/15/22 | United States | 200,000 | 210,500 | |||||||||||
senior note, 6.00%, 4/15/24 | United States | 200,000 | 208,500 | |||||||||||
Verizon Communications Inc., senior note, 5.15%, 9/15/23 | United States | 2,000,000 | 2,333,726 | |||||||||||
| h | Wind Acquisition Finance SA, senior secured note, 144A, | |||||||||||||
4.00%, 7/15/20 | Italy | 1,200,000 | EUR | 1,320,938 | ||||||||||
7.00%, 4/23/21 | Italy | 1,500,000 | EUR | 1,632,459 | ||||||||||
|
| |||||||||||||
| 24,539,626 | ||||||||||||||
|
| |||||||||||||
Transportation 0.3% | ||||||||||||||
| h | Florida East Coast Holdings Corp., | |||||||||||||
secured note, first lien, 144A, 6.75%, 5/01/19 | United States | 900,000 | 900,000 | |||||||||||
senior note, 144A, 9.75%, 5/01/20 | United States | 400,000 | 342,000 | |||||||||||
| h | Stena International SA, senior secured bond, first lien, 144A, 5.75%, 3/01/24 | Sweden | 900,000 | 742,500 | ||||||||||
|
| |||||||||||||
| 1,984,500 | ||||||||||||||
|
| |||||||||||||
Utilities 2.0% | ||||||||||||||
Calpine Corp., | ||||||||||||||
senior bond, 5.75%, 1/15/25 | United States | 1,200,000 | 1,171,500 | |||||||||||
senior note, 5.375%, 1/15/23 | United States | 1,300,000 | 1,274,000 | |||||||||||
| g,h | EDF SA, sub. note, 144A, 5.25% to 1/29/23, FRN thereafter, | France | 3,000,000 | 2,879,745 | ||||||||||
Exelon Corp., senior bond, 3.95%, 6/15/25 | United States | 1,800,000 | 1,928,786 | |||||||||||
| h | InterGen NV, secured bond, 144A, 7.00%, 6/30/23 | Netherlands | 2,500,000 | 1,781,250 | ||||||||||
Sempra Energy, | ||||||||||||||
senior bond, 3.55%, 6/15/24 | United States | 700,000 | 735,237 | |||||||||||
senior note, 3.75%, 11/15/25 | United States | 1,100,000 | 1,177,866 | |||||||||||
The Southern Co., senior bond, 3.25%, 7/01/26 | United States | 2,100,000 | 2,187,692 | |||||||||||
| h,i | Texas Competitive Electric Holdings Co. LLC/Texas Competitive Electric Holdings Finance Inc., senior secured note, first lien, 144A, 11.50%, 10/01/20 | United States | 3,000,000 | 1,027,500 | ||||||||||
|
| |||||||||||||
| 14,163,576 | ||||||||||||||
|
| |||||||||||||
Total Corporate Bonds (Cost $315,755,484) | 294,327,726 | |||||||||||||
|
| |||||||||||||
| l,m | Senior Floating Rate Interests 11.1% | |||||||||||||
Automobiles & Components 0.3% | ||||||||||||||
TI Group Automotive Systems LLC, Initial U.S. Term Loan, 4.50%, 6/25/22 | United States | 2,120,934 | 2,083,818 | |||||||||||
|
| |||||||||||||
Capital Goods 0.3% | ||||||||||||||
Doncasters U.S. Finance LLC, Second Lien Term Loan, 9.50%, 10/09/20 | United States | 76,701 | 71,572 | |||||||||||
| n | Leidos (Abacus Innovations Corp.), B Term Loan, 5.25%, 8/31/23 | United States | 161,767 | 161,868 | ||||||||||
Sensus USA Inc., Term Loan, 6.50%, 4/05/23 | United States | 1,780,000 | 1,766,650 | |||||||||||
| Semiannual Report | FSI-17 |
FRANKLIN TEMPLETON VARIABLE INSURANCE PRODUCTS TRUST
CONSOLIDATED STATEMENT OF INVESTMENTS (UNAUDITED)
Franklin Strategic Income VIP Fund (continued)
| Country | Principal Amount* | Value | ||||||||||||
| l,m | Senior Floating Rate Interests (continued) | |||||||||||||
Capital Goods (continued) | ||||||||||||||
Ventia Pty. Ltd., Term B Loans, 5.50%, 5/21/22 | Australia | 42,394 | $ | 42,765 | ||||||||||
|
| |||||||||||||
| 2,042,855 | ||||||||||||||
|
| |||||||||||||
Commercial & Professional Services 0.1% | ||||||||||||||
Kar Auction Services Inc., Tranche B-3 Term Loan, 4.25%, 3/09/23 | United States | 888,834 | 894,574 | |||||||||||
|
| |||||||||||||
Consumer Durables & Apparel 0.1% | ||||||||||||||
| n | Prime Security Services Borrower LLC, Term Loan B, 4.75%, 5/02/22 | United States | 672,857 | 674,539 | ||||||||||
|
| |||||||||||||
Consumer Services 0.9% | ||||||||||||||
| n | Affinity Gaming LLC, Initial Term Loan, 6.50%, 6/22/23 | United States | 558,303 | 558,478 | ||||||||||
| c,e | Fitness International LLC, Term B Loan, 5.50%, 7/01/20 | United States | 3,919,925 | 3,890,525 | ||||||||||
| n | KFC Holding Co./Pizza Hut Holdings LLC/Taco Bell of America LLC (Yum Brands), Term B Loans, 5.25%, 6/16/23 | United States | 320,000 | 321,100 | ||||||||||
| n | Travelport Finance Luxembourg S.A.R.L., Term Loan B, 6.50%, 9/02/21 | Luxembourg | 500,000 | 496,875 | ||||||||||
| c,k | Turtle Bay Holdings LLC, Term Loan B, PIK, 3.25%, 6/30/17 | United States | 1,173,614 | 1,158,948 | ||||||||||
|
| |||||||||||||
| 6,425,926 | ||||||||||||||
|
| |||||||||||||
Diversified Financials 0.3% | ||||||||||||||
First Eagle Investment Management, Initial Term Loans, 4.75%, 12/01/22 | United States | 880,187 | 866,251 | |||||||||||
Guggenheim Partners Investment Management Holdings LLC, Initial Term Loan, 4.25%, 7/22/20 | United States | 917,876 | 918,019 | |||||||||||
|
| |||||||||||||
| 1,784,270 | ||||||||||||||
|
| |||||||||||||
Energy 1.6% | ||||||||||||||
| c,e | Bowie Resource Holdings LLC, | |||||||||||||
First Lien Initial Term Loan, 8.75%, 8/16/20 | United States | 2,964,578 | 2,490,245 | |||||||||||
Second Lien Initial Term Loan, 12.50%, 2/16/21 | United States | 1,248,332 | 1,017,391 | |||||||||||
| n | Fieldwood Energy LLC, Loans, 3.875%, 10/01/18 | United States | 3,706,974 | 3,243,602 | ||||||||||
| c | Foresight Energy LLC, Term Loans, 7.50%, 8/21/20 | United States | 1,372,000 | 1,131,900 | ||||||||||
McDermott Finance LLC, Term Loan, 8.25%, 4/16/19 | United States | 148,504 | 148,690 | |||||||||||
OSG Bulk Ships Inc., Initial Term Loan, 5.25%, 8/05/19 | United States | 1,074,903 | 1,041,312 | |||||||||||
OSG International Inc., Initial Term Loan, 5.75%, 8/05/19 | United States | 1,958,429 | 1,938,845 | |||||||||||
|
| |||||||||||||
| 11,011,985 | ||||||||||||||
|
| |||||||||||||
Health Care Equipment & Services 0.3% | ||||||||||||||
Community Health Systems Inc., 2018 Term F Loans, 3.924%, 12/31/18 | United States | 1,968,070 | 1,955,770 | |||||||||||
Cotiviti Corp., Second Lien Initial Term Loan, 8.00%, 5/13/22 | United States | 27,678 | 27,713 | |||||||||||
New Millennium Holdco Inc., Closing Date Term Loan, 7.50%, 12/18/20 | United States | 323,713 | 237,524 | |||||||||||
Team Health Inc., Tranche B Term Loan, 3.75%, 11/23/22 | United States | 107,221 | 107,279 | |||||||||||
|
| |||||||||||||
| 2,328,286 | ||||||||||||||
|
| |||||||||||||
Materials 1.1% | ||||||||||||||
| n | The Chemours Co. LLC, Tranche B Term Loan, 3.75%, 5/12/22 | United States | 3,239,023 | 3,136,453 | ||||||||||
Cyanco Intermediate Corp., Initial Term Loan, 5.50%, 5/01/20 | United States | 181,753 | 174,634 | |||||||||||
FMG America Finance Inc. (Fortescue Metals Group), Loans, 4.25%, 6/30/19 | Australia | 1,794,164 | 1,721,276 | |||||||||||
Huntsman International LLC, Extended Term Loan B, 3.46% - 3.557%, 4/19/19 | United States | 374,700 | 373,763 | |||||||||||
Novelis Inc., Initial Term Loan, 4.00%, 6/02/22 | Canada | 794,039 | 788,381 | |||||||||||
| FSI-18 | Semiannual Report |
FRANKLIN TEMPLETON VARIABLE INSURANCE PRODUCTS TRUST
CONSOLIDATED STATEMENT OF INVESTMENTS (UNAUDITED)
Franklin Strategic Income VIP Fund (continued)
| Country | Principal Amount* | Value | ||||||||||||
| l,m | Senior Floating Rate Interests (continued) | |||||||||||||
Materials (continued) | ||||||||||||||
OCI Beaumont LLC, Term B-3 Loan, 7.75%, 8/20/19 | United States | 1,741,027 | $ | 1,741,027 | ||||||||||
|
| |||||||||||||
| 7,935,534 | ||||||||||||||
|
| |||||||||||||
Media 1.4% | ||||||||||||||
| n | Charter Communications Operating LLC (CCO Safari), Term A Loan, 4.50%, 5/18/21 | United States | 1,020,000 | 1,009,800 | ||||||||||
CSC Holdings Inc. (Cablevision), Initial Term Loans, 5.00%, 10/09/22 | United States | 1,880,685 | 1,888,208 | |||||||||||
Radio One Inc., Term Loan B, 5.14%, 12/31/18 | United States | 6,799,164 | 6,782,166 | |||||||||||
|
| |||||||||||||
| 9,680,174 | ||||||||||||||
|
| |||||||||||||
Pharmaceuticals, Biotechnology & Life Sciences 1.5% | ||||||||||||||
| n | Endo Luxembourg Finance Co. I S.A.R.L. and Endo LLC, 2015 Incremental Term B Loans, 3.75%, 9/25/22 | United States | 2,787,868 | 2,749,782 | ||||||||||
Grifols Worldwide Operations USA Inc., US Tranche B Term Loan, 3.46%, 2/27/21 | United States | 2,738,822 | 2,741,624 | |||||||||||
Valeant Pharmaceuticals International Inc., | ||||||||||||||
nSeries C-2 Tranche B Term Loan, 4.75%, 12/11/19 | United States | 675,627 | 657,891 | |||||||||||
Series D-2 Tranche B Term Loan, 4.50%, 2/13/19 | United States | 1,299,537 | 1,265,424 | |||||||||||
Series F-1 Tranche B Term Loan, 5.00%, 4/01/22 | United States | 3,317,217 | 3,230,601 | |||||||||||
|
| |||||||||||||
| 10,645,322 | ||||||||||||||
|
| |||||||||||||
Retailing 0.6% | ||||||||||||||
Ascena Retail Group Inc., Tranche B Term Loan, 5.25%, 8/21/22 | United States | 3,700,559 | 3,536,347 | |||||||||||
PetSmart Inc., Term Loans, 4.25%, 3/10/22 | United States | 349,118 | 348,265 | |||||||||||
|
| |||||||||||||
| 3,884,612 | ||||||||||||||
|
| |||||||||||||
Semiconductors & Semiconductor Equipment 0.8% | ||||||||||||||
Avago Technologies Cayman Finance Ltd., Term B-1 Dollar Loans, 4.25%, 2/01/23 | United States | 2,835,743 | 2,839,092 | |||||||||||
MACOM Technology Solutions Holdings Inc., Initial Term Loan, 4.50%, 5/07/21 | United States | 513,128 | 515,694 | |||||||||||
| n | MKS Instruments Inc., Tranche B-1 Term Loans, 4.25%, 4/29/23 | United States | 549,856 | 551,116 | ||||||||||
ON Semiconductor Corp., Closing Date Term Loans, 5.25%, 3/31/23 | United States | 1,758,635 | 1,770,882 | |||||||||||
|
| |||||||||||||
| 5,676,784 | ||||||||||||||
|
| |||||||||||||
Software & Services 0.7% | ||||||||||||||
Match Group Inc., Term B-1 Loans, 5.50%, 11/16/22 | United States | 398,817 | 402,805 | |||||||||||
MoneyGram International Inc., Term Loan, 4.25%, 3/27/20 | United States | 5,087,411 | 4,842,580 | |||||||||||
|
| |||||||||||||
| 5,245,385 | ||||||||||||||
|
| |||||||||||||
Technology Hardware & Equipment 0.5% | ||||||||||||||
Ciena Corp., Term Loan, 3.75%, 7/15/19 | United States | 226,374 | 225,384 | |||||||||||
Dell International LLC, Term B-2 Loan, 4.00%, 4/29/20 | United States | 1,337,611 | 1,336,942 | |||||||||||
Western Digital Corp., U.S. Term B Loan, 6.25%, 4/29/23 | United States | 1,641,833 | 1,651,069 | |||||||||||
| n | Zebra Technologies Corp., Refinancing Term Loan, 4.00%, 10/27/21 | United States | 385,821 | 387,187 | ||||||||||
|
| |||||||||||||
| 3,600,582 | ||||||||||||||
|
| |||||||||||||
Telecommunication Services 0.2% | ||||||||||||||
Intelsat Jackson Holdings SA, Tranche B-2 Term Loan, 3.75%, 6/30/19 | Luxembourg | 559,178 | 508,153 | |||||||||||
Windstream Corp., Tranche B-5 Term Loan, 3.50%, 8/08/19 | United States | 563,930 | 562,051 | |||||||||||
|
| |||||||||||||
| 1,070,204 | ||||||||||||||
|
| |||||||||||||
| Semiannual Report | FSI-19 |
FRANKLIN TEMPLETON VARIABLE INSURANCE PRODUCTS TRUST
CONSOLIDATED STATEMENT OF INVESTMENTS (UNAUDITED)
Franklin Strategic Income VIP Fund (continued)
| Country | Principal Amount* | Value | ||||||||||||
| l,m | Senior Floating Rate Interests (continued) | |||||||||||||
Transportation 0.2% | ||||||||||||||
| n | The Hertz Corp., Term Loan B, 5.25%, 6/17/23 | United States | 333,319 | $ | 333,893 | |||||||||
Navios Maritime Midstream Partners LP, Initial Term Loan, 5.50%, 6/18/20 | Marshall Islands | 1,292,085 | 1,240,401 | |||||||||||
Navios Maritime Partners LP, Initial Term Loan, 5.25%, 6/27/18 | Marshall Islands | 61,049 | 53,265 | |||||||||||
|
| |||||||||||||
| 1,627,559 | ||||||||||||||
|
| |||||||||||||
Utilities 0.2% | ||||||||||||||
Calpine Corp., Term Loan (B6), 4.00%, 1/15/23 | United States | 632,118 | 628,957 | |||||||||||
| n | EFS Cogen Holdings I LLC (Linden), Term Loan B, 6.75%, 6/30/23 | United States | 181,098 | 181,550 | ||||||||||
| n | NRG Energy Inc., Term Loan B, 5.25%, 6/20/23 | United States | 870,000 | 863,475 | ||||||||||
|
| |||||||||||||
| 1,673,982 | ||||||||||||||
|
| |||||||||||||
Total Senior Floating Rate Interests | 78,286,391 | |||||||||||||
|
| |||||||||||||
Foreign Government and Agency Securities 11.7% | ||||||||||||||
Government of Hungary, senior note, 6.25%, 1/29/20 | Hungary | 1,500,000 | 1,669,057 | |||||||||||
Government of Indonesia, | ||||||||||||||
6.125%, 5/15/28 | Indonesia | 34,000,000,000 | IDR | 2,267,096 | ||||||||||
FR34, 12.80%, 6/15/21 | Indonesia | 17,235,000,000 | IDR | 1,601,207 | ||||||||||
senior bond, FR53, 8.25%, 7/15/21 | Indonesia | 46,000,000,000 | IDR | 3,626,037 | ||||||||||
senior bond, FR70, 8.375%, 3/15/24 | Indonesia | 26,500,000,000 | IDR | 2,118,495 | ||||||||||
Government of Malaysia, | ||||||||||||||
senior bond, 3.814%, 2/15/17 | Malaysia | 2,500,000 | MYR | 625,096 | ||||||||||
senior bond, 4.24%, 2/07/18 | Malaysia | 1,800,000 | MYR | 456,165 | ||||||||||
senior note, 3.172%, 7/15/16 | Malaysia | 32,500,000 | MYR | 8,071,378 | ||||||||||
senior note, 3.394%, 3/15/17 | Malaysia | 16,000,000 | MYR | 3,992,035 | ||||||||||
senior note, 4.012%, 9/15/17 | Malaysia | 23,400,000 | MYR | 5,891,106 | ||||||||||
Government of Mexico, | ||||||||||||||
7.25%, 12/15/16 | Mexico | 930,330 | o MXN | 5,155,013 | ||||||||||
7.75%, 12/14/17 | Mexico | 345,000 | o MXN | 1,976,363 | ||||||||||
senior note, 8.50%, 12/13/18 | Mexico | 1,405,000 | o MXN | 8,310,105 | ||||||||||
senior note, M, 5.00%, 6/15/17 | Mexico | 750,000 | o MXN | 4,125,023 | ||||||||||
| h | Government of Serbia, senior note, 144A, | |||||||||||||
4.875%, 2/25/20 | Serbia | 4,000,000 | 4,132,660 | |||||||||||
7.25%, 9/28/21 | Serbia | 200,000 | 229,513 | |||||||||||
Government of Sri Lanka, | ||||||||||||||
A, 6.40%, 8/01/16 | Sri Lanka | 19,500,000 | LKR | 133,617 | ||||||||||
B, 6.40%, 10/01/16 | Sri Lanka | 16,000,000 | LKR | 109,076 | ||||||||||
Government of the Philippines, senior note, 2.875%, 5/22/17 | Philippines | 77,000,000 | PHP | 1,643,149 | ||||||||||
| h | Government of Ukraine, 144A, | |||||||||||||
7.75%, 9/01/22 | Ukraine | 500,000 | 485,638 | |||||||||||
7.75%, 9/01/23 | Ukraine | 969,000 | 937,532 | |||||||||||
7.75%, 9/01/24 | Ukraine | 969,000 | 930,807 | |||||||||||
7.75%, 9/01/25 | Ukraine | 969,000 | 926,863 | |||||||||||
7.75%, 9/01/26 | Ukraine | 969,000 | 922,997 | |||||||||||
7.75%, 9/01/27 | Ukraine | 969,000 | 919,581 | |||||||||||
a,p VRI, GDP Linked Securities, 5/31/40 | Ukraine | 1,952,000 | 641,720 | |||||||||||
| q | Government of Uruguay, senior bond, Index Linked, 4.375%, 12/15/28 | Uruguay | 193,402,842 | UYU | 5,699,379 | |||||||||
Nota Do Tesouro Nacional, | ||||||||||||||
10.00%, 1/01/21 | Brazil | 5,000 | r BRL | 1,454,115 | ||||||||||
| FSI-20 | Semiannual Report |
FRANKLIN TEMPLETON VARIABLE INSURANCE PRODUCTS TRUST
CONSOLIDATED STATEMENT OF INVESTMENTS (UNAUDITED)
Franklin Strategic Income VIP Fund (continued)
| Country | Principal Amount* | Value | ||||||||||||
Foreign Government and Agency Securities (continued) |
| |||||||||||||
Nota Do Tesouro Nacional, (continued) | ||||||||||||||
10.00%,1/01/23 | Brazil | 4,000 | r BRL | $ | 1,136,570 | |||||||||
sIndex Linked, 6.00%, 8/15/16 | Brazil | 1,604 | r BRL | 1,442,889 | ||||||||||
sIndex Linked, 6.00%, 8/15/18 | Brazil | 5,525 | r BRL | 4,946,158 | ||||||||||
sIndex Linked, 6.00%, 5/15/23 | Brazil | 3,350 | r BRL | 2,975,643 | ||||||||||
senior note, 10.00%, 1/01/17 | Brazil | 7,500 | r BRL | 2,294,065 | ||||||||||
| q | Uruguay Notas del Tesoro, 18, Index Linked, 2.25%, 8/23/17 | Uruguay | 30,349,593 | UYU | 957,103 | |||||||||
|
| |||||||||||||
Total Foreign Government and Agency Securities (Cost $92,839,860) | 82,803,251 | |||||||||||||
|
| |||||||||||||
U.S. Government and Agency Securities 4.3% | ||||||||||||||
U.S. Treasury Bond, | ||||||||||||||
7.875%, 2/15/21 | United States | 900,000 | 1,181,004 | |||||||||||
6.50%, 11/15/26 | United States | 2,400,000 | 3,557,390 | |||||||||||
qIndex Linked, 0.625%, 1/15/24 | United States | 4,880,214 | 5,115,553 | |||||||||||
U.S. Treasury Note, | ||||||||||||||
4.625%, 2/15/17 | United States | 600,000 | 615,668 | |||||||||||
3.75%, 11/15/18 | United States | 7,000,000 | 7,516,250 | |||||||||||
2.75%, 2/15/24 | United States | 4,000,000 | 4,417,344 | |||||||||||
qIndex Linked, 2.125%, 1/15/19 | United States | 779,956 | 837,118 | |||||||||||
qIndex Linked, 0.625%, 7/15/21 | United States | 1,698,247 | 1,789,594 | |||||||||||
qIndex Linked, 0.125%, 7/15/24 | United States | 5,057,578 | 5,115,300 | |||||||||||
|
| |||||||||||||
Total U.S. Government and Agency Securities | 30,145,221 | |||||||||||||
|
| |||||||||||||
Asset-Backed Securities and Commercial | ||||||||||||||
Banks 2.5% | ||||||||||||||
Banc of America Commercial Mortgage Trust, 2006-4, AJ, 5.695%, 7/10/46 | United States | 1,807,000 | 1,763,154 | |||||||||||
| l | Bear Stearns Adjustable Rate Mortgage Trust, 2004-4, A6, FRN, 2.977%, 6/25/34 | United States | 1,634,821 | 1,623,410 | ||||||||||
Bear Stearns Commercial Mortgage Securities Trust, | ||||||||||||||
l2006-PW11, AJ, FRN, 5.429%, 3/11/39 | United States | 1,000,000 | 962,266 | |||||||||||
2006-PW13, AJ, 5.611%, 9/11/41 | United States | 2,310,000 | 2,311,541 | |||||||||||
| l | CD Mortgage Trust, 2006-CD3, AJ, FRN, 5.688%, 10/15/48 | United States | 2,700,000 | 1,622,295 | ||||||||||
Citigroup Commercial Mortgage Trust, | ||||||||||||||
2006-C5, AJ, 5.482%, 10/15/49 | United States | 1,667,000 | 1,492,074 | |||||||||||
l2007-C6, AM, FRN, 5.712%, 12/10/49 | United States | 1,700,000 | 1,707,817 | |||||||||||
CSAIL Commercial Mortgage Trust, 2015-C1, A4, 3.505%, 4/15/50 | United States | 915,000 | 991,765 | |||||||||||
| l | CWABS Asset-Backed Certificates Trust, 2005-11, AF4, FRN, 5.21%, 3/25/34 | United States | 1,275,000 | 1,275,535 | ||||||||||
| l | Greenwich Capital Commercial Funding Corp., 2006-GG7, AJ, FRN, 5.773%, 7/10/38 | United States | 1,560,000 | 1,441,838 | ||||||||||
JP Morgan Chase Commercial Mortgage Securities Trust, | ||||||||||||||
2006-CB17, AM, 5.464%, 12/12/43 | United States | 760,000 | 741,827 | |||||||||||
l2006-LDP7, AJ, FRN, 5.988%, 4/17/45 | United States | 635,000 | 478,342 | |||||||||||
| l | Merrill Lynch Mortgage Investors Trust, 2005-A6, 2A3, FRN, 0.833%, 8/25/35 | United States | 251,535 | 242,543 | ||||||||||
| l | Morgan Stanley Capital I Trust, 2006-HQ8, AJ, FRN, 5.421%, 3/12/44 | United States | 79,193 | 79,093 | ||||||||||
Wells Fargo Mortgage Backed Securities Trust, | ||||||||||||||
l2004-W, A9, FRN, 2.766%, 11/25/34 | United States | 864,206 | 875,515 | |||||||||||
| Semiannual Report | FSI-21 |
FRANKLIN TEMPLETON VARIABLE INSURANCE PRODUCTS TRUST
CONSOLIDATED STATEMENT OF INVESTMENTS (UNAUDITED)
Franklin Strategic Income VIP Fund (continued)
| Country | Principal Amount* | Value | ||||||||||||
Asset-Backed Securities and Commercial Mortgage-Backed Securities (continued) | ||||||||||||||
Banks (continued) | ||||||||||||||
Wells Fargo Mortgage Backed Securities Trust, (continued) | ||||||||||||||
2007-3, 3A1, 5.50%, 4/25/22 | United States | 198,389 | $ | 203,376 | ||||||||||
|
| |||||||||||||
| 17,812,391 | ||||||||||||||
|
| |||||||||||||
Diversified Financials 3.5% | ||||||||||||||
| h,l | Atrium X, 10A, C, 144A, FRN, 3.233%, 7/16/25 | United States | 1,400,000 | 1,345,736 | ||||||||||
| h,l | Atrium XI, 11A, C, 144A, FRN, 3.838%, 10/23/25 | Cayman Islands | 1,820,000 | 1,808,461 | ||||||||||
Banc of America Commercial Mortgage Trust, 2015-UBS7, | ||||||||||||||
A3, 3.441%, 9/15/48 | United States | 1,050,000 | 1,135,627 | |||||||||||
A4, 3.705%, 9/15/48 | United States | 1,170,000 | 1,288,498 | |||||||||||
| h,l | BCAP LLC Trust, 2009-RR1, 2A2, 144A, FRN, 2.896%, 5/26/35 | United States | 440,000 | 412,999 | ||||||||||
| h,l | Catamaran CLO Ltd., 2013-1A, C, 144A, FRN, 3.234%, 1/27/25 | United States | 1,130,000 | 1,078,235 | ||||||||||
| h,l | Cent CDO Ltd., 2007-15A, A2B, 144A, FRN, 0.996%, 3/11/21 | United States | 1,251,000 | 1,177,792 | ||||||||||
| h,l | Cent CLO LP, 2013-17A, D, 144A, FRN, 3.637%, 1/30/25 | United States | 784,314 | 764,918 | ||||||||||
| h,l | CIFC Funding Ltd., 2007-3A, A1J, 144A, FRN, 1.036%, 7/26/21 | United States | 960,000 | 948,355 | ||||||||||
| h | Core Industrial Trust, 2015-CALW, A, 144A, 3.04%, 2/10/34 | United States | 1,410,000 | 1,486,331 | ||||||||||
| h,l | CT CDO IV Ltd., 2006-4A, A1, 144A, FRN, 0.758%, 10/20/43 | United States | 21,284 | 21,238 | ||||||||||
| h,l | Cumberland Park CLO Ltd., 2015-2A, | |||||||||||||
B, 144A, FRN, 2.734%, 7/20/26 | United States | 1,080,000 | 1,077,991 | |||||||||||
C, 144A, FRN, 3.484%, 7/20/26 | United States | 190,000 | 185,814 | |||||||||||
| h,l | Eaton Vance CDO Ltd., 2014-1A, | |||||||||||||
B, 144A, FRN, 2.678%, 7/15/26 | United States | 426,000 | 419,504 | |||||||||||
C, 144A, FRN, 3.628%, 7/15/26 | United States | 167,100 | 161,724 | |||||||||||
| h,l | Eleven Madison Trust Mortgage Trust, 2015-11MD, A, 144A, FRN, 3.555%, 9/10/35 | United States | 1,350,000 | 1,472,160 | ||||||||||
| l | FHLMC Structured Agency Credit Risk Debt Notes, | |||||||||||||
2014-DN1, M2, FRN, 2.653%, 2/25/24 | United States | 1,500,000 | 1,521,069 | |||||||||||
2014-HQ2, M2, FRN, 2.653%, 9/25/24 | United States | 1,000,000 | 1,001,237 | |||||||||||
2015-HQ1, M2, FRN, 2.653%, 3/25/25 | United States | 1,000,000 | 1,004,720 | |||||||||||
| h | G-Force LLC, 2005-RRA, C, 144A, 5.20%, 8/22/36 | United States | 2,000,000 | 1,935,460 | ||||||||||
| l | Impac Secured Assets Trust, 2007-2, FRN, 0.703%, 4/25/37 | United States | 260,144 | 242,513 | ||||||||||
| h,l | Invitation Homes Trust, 2015-SFR1, A, 144A, FRN, 1.896%, 3/17/32 | United States | 1,443,976 | 1,446,434 | ||||||||||
| l | MortgageIT Trust, 2004-1, A2, FRN, 1.353%, 11/25/34 | United States | 315,540 | 299,456 | ||||||||||
| h,l | Newcastle CDO Ltd., 2004-5A, 1, 144A, FRN, 0.98%, 12/24/39 | United States | 4,628 | 4,619 | ||||||||||
| l | Opteum Mortgage Acceptance Corp. Trust, 2005-4, 1APT, FRN, 0.763%, 11/25/35 | United States | 500,881 | 470,402 | ||||||||||
| l | Structured Asset Securities Corp., 2005-2XS, 2A2, FRN, 1.946%, 2/25/35 | United States | 300,701 | 287,980 | ||||||||||
| l | Thornburg Mortgage Securities Trust, 2005-1, A3, FRN, 2.537%, 4/25/45 | United States | 246,796 | 247,413 | ||||||||||
| h,l | Voya CLO Ltd., | |||||||||||||
2013-1A, B, 144A, FRN, 3.528%, 4/15/24 | United States | 270,000 | 264,789 | |||||||||||
2013-2A, B, 144A, FRN, 3.318%, 4/25/25 | United States | 1,080,000 | 1,041,422 | |||||||||||
|
| |||||||||||||
| 24,552,897 | ||||||||||||||
|
| |||||||||||||
Total Asset-Backed Securities and Commercial Mortgage-Backed Securities (Cost $41,999,135) | 42,365,288 | |||||||||||||
|
| |||||||||||||
Mortgage-Backed Securities 7.9% | ||||||||||||||
| l | Federal Home Loan Mortgage Corp. (FHLMC) Adjustable | |||||||||||||
FHLMC, 2.688%, 1/01/33 | United States | 48,274 | 50,398 | |||||||||||
|
| |||||||||||||
| FSI-22 | Semiannual Report |
FRANKLIN TEMPLETON VARIABLE INSURANCE PRODUCTS TRUST
CONSOLIDATED STATEMENT OF INVESTMENTS (UNAUDITED)
Franklin Strategic Income VIP Fund (continued)
| Country | Principal Amount* | Value | ||||||||||||
Mortgage-Backed Securities (continued) | ||||||||||||||
Federal Home Loan Mortgage Corp. (FHLMC) Fixed Rate 3.0% | ||||||||||||||
FHLMC Gold 15 Year, 5.50%, 7/01/17 - 7/01/19 | United States | 43,932 | $ | 45,746 | ||||||||||
FHLMC Gold 15 Year, 6.00%, 5/01/17 | United States | 1,005 | 1,017 | |||||||||||
| n | FHLMC Gold 30 Year, 3.00%, 7/01/46 | United States | 5,750,000 | 5,959,936 | ||||||||||
| n | FHLMC Gold 30 Year, 3.50%, 7/01/46 | United States | 5,448,000 | 5,744,150 | ||||||||||
| n | FHLMC Gold 30 Year, 4.00%, 7/01/46 | United States | 7,635,000 | 8,171,900 | ||||||||||
FHLMC Gold 30 Year, 5.00%, 4/01/34 - 8/01/35 | United States | 335,427 | 371,927 | |||||||||||
FHLMC Gold 30 Year, 5.50%, 3/01/33 - 1/01/35 | United States | 254,078 | 285,021 | |||||||||||
FHLMC Gold 30 Year, 6.00%, 4/01/33 - 2/01/36 | United States | 257,253 | 295,373 | |||||||||||
FHLMC Gold 30 Year, 6.50%, 11/01/27 - 6/01/36 | United States | 46,687 | 53,991 | |||||||||||
FHLMC Gold 30 Year, 7.00%, 9/01/21 - 4/01/30 | United States | 21,201 | 23,230 | |||||||||||
FHLMC Gold 30 Year, 7.50%, 8/01/30 - 7/01/31 | United States | 1,105 | 1,200 | |||||||||||
|
| |||||||||||||
| 20,953,491 | ||||||||||||||
|
| |||||||||||||
| l | Federal National Mortgage Association (FNMA) Adjustable | |||||||||||||
FNMA, 2.522% - 2.53%, 12/01/34 - 4/01/20 | United States | 139,563 | 147,278 | |||||||||||
|
| |||||||||||||
Federal National Mortgage Association (FNMA) Fixed Rate 3.4% | ||||||||||||||
FNMA 15 Year, 2.50%, 7/01/22 - 6/01/27 | United States | 462,076 | 479,614 | |||||||||||
FNMA 15 Year, 4.50%, 6/01/19 - 3/01/20 | United States | 72,297 | 74,329 | |||||||||||
FNMA 15 Year, 5.00%, 10/01/17 - 6/01/18 | United States | 37,997 | 39,079 | |||||||||||
FNMA 15 Year, 5.50%, 1/01/17 - 11/01/18 | United States | 165,262 | 169,129 | |||||||||||
| n | FNMA 30 Year, 3.00%, 7/01/46 | United States | 5,750,000 | 5,967,422 | ||||||||||
| n | FNMA 30 Year, 3.50%, 7/01/46 | United States | 6,327,000 | 6,675,232 | ||||||||||
| n | FNMA 30 Year, 4.00%, 7/01/46 | United States | 8,100,000 | 8,683,612 | ||||||||||
| n | FNMA 30 Year, 4.50%, 7/01/46 | United States | 1,620,000 | 1,768,489 | ||||||||||
FNMA 30 Year, 5.00%, 4/01/30 | United States | 90,806 | 100,812 | |||||||||||
FNMA 30 Year, 6.50%, 6/01/28 - 10/01/37 | United States | 244,557 | 284,386 | |||||||||||
|
| |||||||||||||
| 24,242,104 | ||||||||||||||
|
| |||||||||||||
Government National Mortgage Association (GNMA) Fixed | ||||||||||||||
GNMA I SF 30 Year, 5.00%, 11/15/33 - 7/15/34 | United States | 335,582 | 379,891 | |||||||||||
GNMA I SF 30 Year, 6.50%, 2/15/32 | United States | 2,049 | 2,339 | |||||||||||
GNMA I SF 30 Year, 7.00%, 10/15/28 - 6/15/32 | United States | 17,722 | 18,125 | |||||||||||
GNMA I SF 30 Year, 7.50%, 9/15/30 | United States | 1,443 | 1,734 | |||||||||||
| n | GNMA II SF 30 Year, 3.00%, 7/01/46 | United States | 4,400,000 | 4,599,031 | ||||||||||
| n | GNMA II SF 30 Year, 3.50%, 7/01/46 | United States | 4,770,000 | 5,062,163 | ||||||||||
GNMA II SF 30 Year, 5.00%, 9/20/33 - 11/20/33 | United States | 95,437 | 107,424 | |||||||||||
GNMA II SF 30 Year, 6.00%, 11/20/34 | United States | 112,692 | 132,880 | |||||||||||
GNMA II SF 30 Year, 6.50%, 4/20/31 - 2/20/34 | United States | 53,970 | 64,632 | |||||||||||
GNMA II SF 30 Year, 7.50%, 1/20/28 - 4/20/32 | United States | 12,636 | 15,010 | |||||||||||
|
| |||||||||||||
| 10,383,229 | ||||||||||||||
|
| |||||||||||||
Total Mortgage-Backed Securities | 55,776,500 | |||||||||||||
|
| |||||||||||||
Municipal Bonds 1.0% | ||||||||||||||
Illinois State GO, Build America Bonds, 7.35%, 7/01/35 | United States | 1,000,000 | 1,111,660 | |||||||||||
New York City HDC Capital Fund Grant Program Revenue, New York City Housing Authority Program, Series B1, 5.00%, 7/01/33 | United States | 500,000 | 599,150 | |||||||||||
| Semiannual Report | FSI-23 |
FRANKLIN TEMPLETON VARIABLE INSURANCE PRODUCTS TRUST
CONSOLIDATED STATEMENT OF INVESTMENTS (UNAUDITED)
Franklin Strategic Income VIP Fund (continued)
| Country | Principal Amount* | Value | ||||||||||||
Municipal Bonds (continued) | ||||||||||||||
Port Authority of New York and New Jersey Revenue, Consolidated, One Hundred Ninety-First Series, 4.823%, 6/01/45 | United States | 2,415,000 | $ | 2,668,020 | ||||||||||
Puerto Rico Electric Power Authority Power Revenue, | ||||||||||||||
Series A, 6.75%, 7/01/36 | United States | 3,465,000 | 2,286,900 | |||||||||||
Series XX, 5.25%, 7/01/40 | United States | 165,000 | 108,900 | |||||||||||
|
| |||||||||||||
Total Municipal Bonds (Cost $7,293,734) | 6,774,630 | |||||||||||||
|
| |||||||||||||
| Shares | ||||||||||||||
Escrows and Litigation Trusts (Cost $—) 0.0% | ||||||||||||||
Materials 0.0% | ||||||||||||||
| a,e | NewPage Corp., Litigation Trust | United States | 2,500,000 | — | ||||||||||
|
| |||||||||||||
Total Investments before Short Term Investments (Cost $684,786,330) | 652,064,849 | |||||||||||||
|
| |||||||||||||
Short Term Investments (Cost $104,709,404) 14.8% | ||||||||||||||
Money Market Funds 14.8% | ||||||||||||||
| a,f | Institutional Fiduciary Trust Money Market Portfolio | United States | 104,709,404 | 104,709,404 | ||||||||||
|
| |||||||||||||
Total Investments (Cost $789,495,734) 107.2% | 756,774,253 | |||||||||||||
Other Assets, less Liabilities (7.2)% | (50,842,338 | ) | ||||||||||||
|
| |||||||||||||
Net Assets 100.0% | $ | 705,931,915 | ||||||||||||
|
| |||||||||||||
†Rounds to less than 0.1% of net assets.
*The principal amount is stated in U.S. dollars unless otherwise indicated.
aNon-income producing.
bThe security is owned by FT Holdings Corporation III, a wholly-owned subsidiary of the Fund. See Note 1(g).
cAt June 30, 2016, pursuant to the Fund’s policies and the requirements of applicable securities law, the Fund is restricted from trading these securities at period end.
dSee Note 8 regarding restricted securities.
eSecurity has been deemed illiquid because it may not be able to be sold within seven days. At June 30, 2016, the aggregate value of these securities was $7,752,083, representing 1.1% of net assets.
fSee Note 3(e) regarding investments in affiliated management investment companies.
gPerpetual security with no stated maturity date.
hSecurity was purchased pursuant to Rule 144A under the Securities Act of 1933 and may be sold in transactions exempt from registration only to qualified institutional buyers or in a public offering registered under the Securities Act of 1933. These securities have been deemed liquid under guidelines approved by the Trust’s Board of Trustees. At June 30, 2016, the aggregate value of these securities was $137,428,129, representing 19.5% of net assets.
iSee Note 7 regarding defaulted securities.
jSee Note 1(f) regarding loan participation notes.
kIncome may be received in additional securities and/or cash.
lThe coupon rate shown represents the rate at period end.
mSee Note 1(i) regarding senior floating rate interests.
nA portion or all of the security purchased on a when-issued, delayed delivery or to-be-announced (TBA) basis. See Note 1(c).
oPrincipal amount is stated in 100 Mexican Peso Units.
pThe principal represents the notional amount. See Note 1(d) regarding value recovery instruments.
qPrincipal amount of security is adjusted for inflation. See Note 1(k).
rPrincipal amount is stated in 1,000 Brazilian Real Units.
sRedemption price at maturity is adjusted for inflation. See Note 1(k).
| FSI-24 | Semiannual Report |
FRANKLIN TEMPLETON VARIABLE INSURANCE PRODUCTS TRUST
CONSOLIDATED STATEMENT OF INVESTMENTS (UNAUDITED)
Franklin Strategic Income VIP Fund (continued)
At June 30, 2016, the Fund had the following forward exchange contracts outstanding. See Note 1(d).
| Forward Exchange Contracts | ||||||||||||||||||||||||||||
| Currency | Counterpartya | Type | Quantity | Contract Amount | Settlement Date | Unrealized Appreciation | Unrealized Depreciation | |||||||||||||||||||||
| OTC Forward Exchange Contracts | ||||||||||||||||||||||||||||
Australian Dollar | DBAB | Sell | 8,308,345 | $ | 5,802,542 | 8/18/16 | $ | — | $ | (383,192 | ) | |||||||||||||||||
Chilean Peso | BZWS | Buy | 477,650,000 | 647,705 | 8/18/16 | 70,672 | — | |||||||||||||||||||||
Chilean Peso | BZWS | Sell | 477,650,000 | 709,469 | 8/18/16 | — | (8,908 | ) | ||||||||||||||||||||
Chilean Peso | DBAB | Buy | 454,000,000 | 623,416 | 8/18/16 | 59,391 | — | |||||||||||||||||||||
Chilean Peso | DBAB | Sell | 454,000,000 | 670,804 | 8/18/16 | — | (12,004 | ) | ||||||||||||||||||||
Chilean Peso | JPHQ | Buy | 234,301,000 | 323,085 | 8/18/16 | 29,300 | — | |||||||||||||||||||||
Chilean Peso | JPHQ | Sell | 234,301,000 | 348,533 | 8/18/16 | — | (3,852 | ) | ||||||||||||||||||||
Chilean Peso | MSCO | Buy | 220,380,000 | 303,805 | 8/18/16 | 27,643 | — | |||||||||||||||||||||
Chilean Peso | MSCO | Sell | 220,380,000 | 327,946 | 8/18/16 | — | (3,501 | ) | ||||||||||||||||||||
Euro | BZWS | Sell | 299,944 | 334,112 | 8/18/16 | 3,604 | (3,019 | ) | ||||||||||||||||||||
Euro | DBAB | Buy | 1,289,108 | 1,462,493 | 8/18/16 | — | (29,050 | ) | ||||||||||||||||||||
Euro | DBAB | Sell | 3,531,984 | 4,031,451 | 8/18/16 | 104,007 | — | |||||||||||||||||||||
Euro | HSBC | Sell | 142,717 | 162,622 | 8/18/16 | 3,925 | — | |||||||||||||||||||||
Euro | JPHQ | Buy | 1,062,400 | 1,206,378 | 8/18/16 | — | (25,027 | ) | ||||||||||||||||||||
Euro | JPHQ | Sell | 7,087,804 | 7,848,994 | 8/18/16 | 57,724 | (90,121 | ) | ||||||||||||||||||||
Indian Rupee | CITI | Buy | 4,537,000 | 65,849 | 8/18/16 | 794 | — | |||||||||||||||||||||
Indian Rupee | DBAB | Buy | 301,181,000 | 4,393,596 | 8/18/16 | 30,384 | — | |||||||||||||||||||||
Indian Rupee | HSBC | Buy | 144,338,000 | 2,094,283 | 8/18/16 | 25,865 | — | |||||||||||||||||||||
Japanese Yen | BZWS | Sell | 136,513,000 | 1,164,191 | 8/18/16 | — | (159,717 | ) | ||||||||||||||||||||
Japanese Yen | CITI | Sell | 127,820,000 | 1,090,170 | 8/18/16 | — | (149,433 | ) | ||||||||||||||||||||
Japanese Yen | DBAB | Buy | 1,324,000,000 | 11,733,532 | 8/18/16 | 1,106,665 | — | |||||||||||||||||||||
Japanese Yen | DBAB | Sell | 2,059,291,000 | 18,221,995 | 8/18/16 | — | (1,749,078 | ) | ||||||||||||||||||||
Japanese Yen | GSCO | Sell | 42,760,000 | 364,691 | 8/18/16 | — | (49,997 | ) | ||||||||||||||||||||
Japanese Yen | HSBC | Sell | 413,980,000 | 3,603,788 | 8/18/16 | — | (411,004 | ) | ||||||||||||||||||||
Japanese Yen | JPHQ | Sell | 566,799,000 | 5,016,492 | 8/18/16 | — | (480,343 | ) | ||||||||||||||||||||
Australian Dollar | DBAB | Sell | 1,950,000 | 1,403,025 | 10/20/16 | — | (45,581 | ) | ||||||||||||||||||||
British Pound | DBAB | Sell | 687,472 | 1,004,878 | 10/20/16 | 87,088 | — | |||||||||||||||||||||
British Pound | JPHQ | Sell | 250,000 | 360,156 | 10/20/16 | 26,401 | — | |||||||||||||||||||||
Euro | BZWS | Sell | 2,261,311 | 2,564,440 | 10/20/16 | 43,686 | — | |||||||||||||||||||||
Euro | CITI | Sell | 1,058,200 | 1,198,832 | 10/20/16 | 19,223 | — | |||||||||||||||||||||
Euro | DBAB | Buy | 576,388 | 655,353 | 10/20/16 | — | (12,835 | ) | ||||||||||||||||||||
Euro | DBAB | Sell | 6,800,000 | 7,761,470 | 10/20/16 | 181,297 | — | |||||||||||||||||||||
Euro | GSCO | Sell | 369,000 | 419,405 | 10/20/16 | 8,070 | — | |||||||||||||||||||||
Euro | JPHQ | Sell | 6,561,135 | 7,435,275 | 10/20/16 | 121,372 | — | |||||||||||||||||||||
Japanese Yen | BZWS | Sell | 60,047,000 | 544,496 | 10/20/16 | — | (39,375 | ) | ||||||||||||||||||||
Japanese Yen | CITI | Sell | 31,757,000 | 287,547 | 10/20/16 | — | (21,244 | ) | ||||||||||||||||||||
Japanese Yen | DBAB | Sell | 27,184,000 | 246,234 | 10/20/16 | — | (18,091 | ) | ||||||||||||||||||||
Japanese Yen | HSBC | Sell | 147,626,000 | 1,337,059 | 10/20/16 | — | (98,392 | ) | ||||||||||||||||||||
Japanese Yen | JPHQ | Sell | 366,653,000 | 3,320,591 | 10/20/16 | — | (244,583 | ) | ||||||||||||||||||||
Euro | CITI | Sell | 1,073,000 | 1,209,808 | 12/15/16 | 11,008 | — | |||||||||||||||||||||
Euro | JPHQ | Sell | 1,230,591 | 1,398,321 | 12/15/16 | 23,454 | — | |||||||||||||||||||||
Indian Rupee | DBAB | Buy | 96,375,000 | 1,399,782 | 12/15/16 | — | (11,191 | ) | ||||||||||||||||||||
Japanese Yen | DBAB | Sell | 405,702,500 | 3,856,744 | 12/15/16 | — | (97,476 | ) | ||||||||||||||||||||
Japanese Yen | JPHQ | Sell | 425,150,000 | 4,037,243 | 12/15/16 | — | (106,523 | ) | ||||||||||||||||||||
Japanese Yen | MSCO | Sell | 12,500,000 | 118,568 | 12/15/16 | — | (3,265 | ) | ||||||||||||||||||||
|
| |||||||||||||||||||||||||||
Total Forward Exchange Contracts |
| $ | 2,041,573 | $ | (4,256,802 | ) | ||||||||||||||||||||||
|
| |||||||||||||||||||||||||||
Net unrealized appreciation (depreciation) |
| $ | (2,215,229 | ) | ||||||||||||||||||||||||
|
| |||||||||||||||||||||||||||
aMay be comprised of multiple contracts with the same counterparty, currency and settlement date.
| Semiannual Report | FSI-25 |
FRANKLIN TEMPLETON VARIABLE INSURANCE PRODUCTS TRUST
CONSOLIDATED STATEMENT OF INVESTMENTS (UNAUDITED)
Franklin Strategic Income VIP Fund (continued)
At June 30, 2016, the Fund had the following credit default swap contracts outstanding. See Note 1(d).
Credit Default Swap Contracts
| Description | Periodic Payment Rate | Counterparty / Exchange | Notional Amounta | Expiration Date | Unamortized Upfront Payments (Receipts) | Unrealized Appreciation | Unrealized Depreciation | Value | Ratingb | |||||||||||||||||||||||||||
| Centrally Cleared Swap Contracts | ||||||||||||||||||||||||||||||||||||
| Contracts to Sell Protectionc | ||||||||||||||||||||||||||||||||||||
| Traded Index | ||||||||||||||||||||||||||||||||||||
CDX.NA.HY.26 | 5.00 | % | ICE | $ | 12,100,000 | 6/20/21 | $ | 347,130 | $ | 64,218 | $ | — | $ | 411,348 | | Non Investment Grade | | |||||||||||||||||||
|
| |||||||||||||||||||||||||||||||||||
| OTC Swap Contracts | ||||||||||||||||||||||||||||||||||||
| Contracts to Sell Protectionc | ||||||||||||||||||||||||||||||||||||
| Traded Index | ||||||||||||||||||||||||||||||||||||
MCDX.NA.26 | 1.00 | % | CITI | 2,100,000 | 6/20/21 | 5,636 | 1,619 | — | 7,255 | | Investment Grade | | ||||||||||||||||||||||||
MCDX.NA.26 | 1.00 | % | GSCO | 10,000,000 | 6/20/21 | 24,461 | 10,084 | — | 34,545 | | Investment Grade | | ||||||||||||||||||||||||
|
| |||||||||||||||||||||||||||||||||||
Total OTC Swap Contracts |
| 30,097 | 11,703 | — | 41,800 | |||||||||||||||||||||||||||||||
|
| |||||||||||||||||||||||||||||||||||
Total Credit Default Swap Contracts |
| $ | 377,227 | $ | 75,921 | $ | — | $ | 453,148 | |||||||||||||||||||||||||||
|
| |||||||||||||||||||||||||||||||||||
Net unrealized appreciation (depreciation) |
| $ | 75,921 | |||||||||||||||||||||||||||||||||
|
| |||||||||||||||||||||||||||||||||||
aFor contracts to sell protection, the notional amount is equal to the maximum potential amount of the future payments and no recourse provisions have been entered into in association with the contracts.
bBased on internal ratings for index swaps. Internal ratings based on mapping into equivalent ratings from external vendors.
cThe Fund enters contracts to sell protection to create a long credit position. Performance triggers include failure to pay or bankruptcy of the underlying securities for traded index swaps.
See Note 9 regarding other derivative information.
See Abbreviations on page FSI-44.
| FSI-26 | Semiannual Report | The accompanying notes are an integral part of these consolidated financial statements. |
FRANKLIN TEMPLETON VARIABLE INSURANCE PRODUCTS TRUST
Consolidated Financial Statements
Consolidated Statement of Assets and Liabilities
June 30, 2016 (unaudited)
| Franklin Strategic Income VIP Fund | ||||
Assets: | ||||
Investments in securities: | ||||
Cost - Unaffiliated issuers | $ | 628,163,783 | ||
Cost - Non-controlled affiliates (Note 3e) | 161,331,951 | |||
|
| |||
Total cost of investments | $ | 789,495,734 | ||
|
| |||
Value - Unaffiliated issuers | $ | 595,858,143 | ||
Value - Non-controlled affiliates (Note 3e) | 160,916,110 | |||
|
| |||
Total value of investments | 756,774,253 | |||
Cash | 991,647 | |||
Restricted Cash (Note 1e) | 56,000 | |||
Foreign currency, at value (cost $15,794) | 15,994 | |||
Receivables: | ||||
Investment securities sold | 1,638,134 | |||
Capital shares sold | 187,293 | |||
Dividends and interest | 5,227,831 | |||
Due from brokers | 2,601,571 | |||
Variation margin | 59,964 | |||
OTC swap contracts (upfront payments $31,271) | 30,097 | |||
Unrealized appreciation on OTC forward exchange contracts | 2,041,573 | |||
Unrealized appreciation on OTC swap contracts | 11,703 | |||
Other assets | 334 | |||
|
| |||
Total assets | 769,636,394 | |||
|
| |||
Liabilities: | ||||
Payables: | ||||
Investment securities purchased | 58,393,757 | |||
Capital shares redeemed | 316,049 | |||
Management fees | 295,436 | |||
Distribution fees | 134,436 | |||
Due to brokers | 56,000 | |||
Unrealized depreciation on OTC forward exchange contracts | 4,256,802 | |||
Deferred tax | 52,292 | |||
Accrued expenses and other liabilities | 199,707 | |||
|
| |||
Total liabilities | 63,704,479 | |||
|
| |||
Net assets, at value | $ | 705,931,915 | ||
|
| |||
Net assets consist of: | ||||
Paid-in capital | $ | 757,767,362 | ||
Undistributed net investment income | 13,248,509 | |||
Net unrealized appreciation (depreciation) | (34,861,315 | ) | ||
Accumulated net realized gain (loss) | (30,222,641 | ) | ||
|
| |||
Net assets, at value | $ | 705,931,915 | ||
|
| |||
| The accompanying notes are an integral part of these consolidated financial statements. | Semiannual Report | FSI-27 |
FRANKLIN TEMPLETON VARIABLE INSURANCE PRODUCTS TRUST
CONSOLIDATED FINANCIAL STATEMENTS
Consolidated Statement of Assets and Liabilities (continued)
June 30, 2016 (unaudited)
| Franklin Strategic Income VIP Fund | ||||
| Class 1: | ||||
Net assets, at value | $ | 417,297,638 | ||
|
| |||
Shares outstanding | 39,318,343 | |||
|
| |||
Net asset value and maximum offering price per share | $ | 10.61 | ||
|
| |||
| Class 2: | ||||
Net assets, at value | $ | 202,076,361 | ||
|
| |||
Shares outstanding | 19,670,006 | |||
|
| |||
Net asset value and maximum offering price per share | $ | 10.27 | ||
|
| |||
| Class 4: | ||||
Net assets, at value | $ | 86,557,916 | ||
|
| |||
Shares outstanding | 8,219,183 | |||
|
| |||
Net asset value and maximum offering price per share | $ | 10.53 | ||
|
| |||
| FSI-28 | Semiannual Report | The accompanying notes are an integral part of these consolidated financial statements. |
FRANKLIN TEMPLETON VARIABLE INSURANCE PRODUCTS TRUST
CONSOLIDATED FINANCIAL STATEMENTS
Consolidated Statement of Operations
for the six months ended June 30, 2016 (unaudited)
| Franklin Strategic Income VIP Fund | ||||
Investment income: | ||||
Dividends: | ||||
Unaffiliated issuers | $ | 1,521,849 | ||
Non-controlled affiliates (Note 3e) | 1,053,032 | |||
Interest | 15,424,708 | |||
|
| |||
Total investment income | 17,999,589 | |||
|
| |||
Expenses: | ||||
Management fees (Note 3a) | 2,105,551 | |||
Distribution fees: (Note 3c) | ||||
Class 2 | 246,406 | |||
Class 4 | 154,951 | |||
Custodian fees (Note 4) | 41,507 | |||
Reports to shareholders | 89,215 | |||
Professional fees | 46,166 | |||
Trustees’ fees and expenses | 1,858 | |||
Other | 117,667 | |||
|
| |||
Total expenses | 2,803,321 | |||
Expense reductions (Note 4) | (546 | ) | ||
Expenses waived/paid by affiliates (Note 3e) | (259,879 | ) | ||
|
| |||
Net expenses | 2,542,896 | |||
|
| |||
Net investment income | 15,456,693 | |||
|
| |||
Realized and unrealized gains (losses): | ||||
Net realized gain (loss) from: | ||||
Investments: | ||||
Unaffiliated issuers | (11,436,886 | ) | ||
Non-controlled affiliates (Note 3e) | (40,253 | ) | ||
Foreign currency transactions | (2,874,372 | ) | ||
Swap contracts | 173,507 | |||
|
| |||
Net realized gain (loss) | (14,178,004 | ) | ||
|
| |||
Net change in unrealized appreciation (depreciation) on: | ||||
Investments | 31,055,144 | |||
Translation of other assets and liabilities denominated in foreign currencies | (2,744,114 | ) | ||
Swap contracts | 33,313 | |||
Change in deferred taxes on unrealized appreciation | (46,106 | ) | ||
|
| |||
Net change in unrealized appreciation (depreciation) | 28,298,237 | |||
|
| |||
Net realized and unrealized gain (loss) | 14,120,233 | |||
|
| |||
Net increase (decrease) in net assets resulting from operations | $ | 29,576,926 | ||
|
| |||
| The accompanying notes are an integral part of these consolidated financial statements. | Semiannual Report | FSI-29 |
FRANKLIN TEMPLETON VARIABLE INSURANCE PRODUCTS TRUST
CONSOLIDATED FINANCIAL STATEMENTS
Consolidated Statements of Changes in Net Assets
| Franklin Strategic Income VIP Fund | ||||||||
| Six Months Ended June 30, 2016 (unaudited) | Year Ended December 31, 2015 | |||||||
Increase (decrease) in net assets: | ||||||||
Operations: | ||||||||
Net investment income | $ | 15,456,693 | $ | 38,231,958 | ||||
Net realized gain (loss) | (14,178,004 | ) | (11,348,194 | ) | ||||
Net change in unrealized appreciation (depreciation) | 28,298,237 | (55,936,500 | ) | |||||
|
| |||||||
Net increase (decrease) in net assets resulting from operations | 29,576,926 | (29,052,736 | ) | |||||
|
| |||||||
Distributions to shareholders from: | ||||||||
Net investment income and net foreign currency gains: | ||||||||
Class 1 | (15,028,685 | ) | (33,228,366 | ) | ||||
Class 2 | (6,934,919 | ) | (13,693,486 | ) | ||||
Class 4 | (2,790,452 | ) | (6,782,412 | ) | ||||
Net realized gains: | ||||||||
Class 1 | — | (8,524,986 | ) | |||||
Class 2 | — | (3,636,551 | ) | |||||
Class 4 | — | (1,855,841 | ) | |||||
|
| |||||||
Total distributions to shareholders | (24,754,056 | ) | (67,721,642 | ) | ||||
|
| |||||||
Capital share transactions: (Note 2) | ||||||||
Class 1 | (27,179,498 | ) | (74,671,750 | ) | ||||
Class 2 | (1,330,842 | ) | 21,200,703 | |||||
Class 4 | (7,196,285 | ) | (8,346,246 | ) | ||||
|
| |||||||
Total capital share transactions | (35,706,625 | ) | (61,817,293 | ) | ||||
|
| |||||||
Net increase (decrease) in net assets | (30,883,755 | ) | (158,591,671 | ) | ||||
Net assets: | ||||||||
Beginning of period | 736,815,670 | 895,407,341 | ||||||
|
| |||||||
End of period | $ | 705,931,915 | $ | 736,815,670 | ||||
|
| |||||||
Undistributed net investment income included in net assets: | ||||||||
End of period | $ | 13,248,509 | $ | 23,766,482 | ||||
|
| |||||||
| FSI-30 | Semiannual Report | The accompanying notes are an integral part of these consolidated financial statements. |
FRANKLIN TEMPLETON VARIABLE INSURANCE PRODUCTS TRUST
Notes to Consolidated Financial Statements (unaudited)
Franklin Strategic Income VIP Fund
1. Organization and Significant Accounting Policies
Franklin Templeton Variable Insurance Products Trust (Trust) is registered under the Investment Company Act of 1940 (1940 Act) as an open-end management investment company, consisting of nineteen separate funds and applies the specialized accounting and reporting guidance in U.S. Generally Accepted Accounting Principles (U.S. GAAP). Franklin Strategic Income VIP Fund (Fund) is included in this report. The financial statements of the remaining funds in the Trust are presented separately. Shares of the Fund are generally sold only to insurance company separate accounts to fund the benefits of variable life insurance policies or variable annuity contracts. At June 30, 2016, 72.20% of the Fund’s shares were held through one insurance company. Investment activities of these insurance company separate accounts could have a material impact on the Fund. The Fund offers three classes of shares: Class 1, Class 2 and Class 4. Each class of shares differs by its distribution fees, voting rights on matters affecting a single class and its exchange privilege.
The following summarizes the Fund’s significant accounting policies.
a. Financial Instrument Valuation
The Fund’s investments in financial instruments are carried at fair value daily. Fair value is the price that would be received to sell an asset or paid to transfer a liability in an orderly transaction between market participants on the measurement date. The Fund calculates the net asset value (NAV) per share as of 4 p.m. Eastern time each day the New York Stock Exchange (NYSE) is open for trading. Under compliance policies and procedures approved by the Trust’s Board of Trustees (the Board), the Fund’s administrator has responsibility for oversight of valuation, including leading the cross-functional Valuation Committee (VC). The VC provides administration and oversight of the Fund’s valuation policies and procedures, which are approved annually by the Board. Among other things, these procedures allow the Fund to utilize independent pricing services, quotations from securities and financial instrument dealers, and other market sources to determine fair value.
Equity securities and derivative financial instruments (derivatives) listed on an exchange or on the NASDAQ National Market System are valued at the last quoted sale price or the official closing price of the day, respectively. Foreign equity securities are valued as of the close of trading on the foreign
stock exchange on which the security is primarily traded or as of 4 p.m. Eastern time whichever is earlier. The value is then converted into its U.S. dollar equivalent at the foreign exchange rate in effect at 4 p.m. Eastern time on the day that the value of the security is determined. Over-the-counter (OTC) securities are valued within the range of the most recent quoted bid and ask prices. Securities that trade in multiple markets or on multiple exchanges are valued according to the broadest and most representative market. Certain equity securities are valued based upon fundamental characteristics or relationships to similar securities.
Debt securities generally trade in the OTC market rather than on a securities exchange. The Fund’s pricing services use multiple valuation techniques to determine fair value. In instances where sufficient market activity exists, the pricing services may utilize a market-based approach through which quotes from market makers are used to determine fair value. In instances where sufficient market activity may not exist or is limited, the pricing services also utilize proprietary valuation models which may consider market characteristics such as benchmark yield curves, credit spreads, estimated default rates, anticipated market interest rate volatility, coupon rates, anticipated timing of principal repayments, underlying collateral, and other unique security features in order to estimate the relevant cash flows, which are then discounted to calculate the fair value. Securities denominated in a foreign currency are converted into their U.S. dollar equivalent at the foreign exchange rate in effect at 4 p.m. Eastern time on the date that the values of the foreign debt securities are determined.
Investments in open-end mutual funds are valued at the closing NAV.
Certain derivatives trade in the OTC market. The Fund’s pricing services use various techniques including industry standard option pricing models and proprietary discounted cash flow models to determine the fair value of those instruments. The Fund’s net benefit or obligation under the derivative contract, as measured by the fair value of the contract, is included in net assets.
The Fund has procedures to determine the fair value of financial instruments for which market prices are not reliable or readily available. Under these procedures, the VC convenes on a regular basis to review such financial instruments and considers a number of factors, including significant unobservable
| Semiannual Report | FSI-31 |
FRANKLIN TEMPLETON VARIABLE INSURANCE PRODUCTS TRUST
NOTES TO CONSOLIDATED FINANCIAL STATEMENTS (UNAUDITED)
Franklin Strategic Income VIP Fund (continued)
1. Organization and Significant Accounting Policies (continued)
a. Financial Instrument Valuation (continued)
valuation inputs, when arriving at fair value. The VC primarily employs a market-based approach which may use related or comparable assets or liabilities, recent transactions, market multiples, book values, and other relevant information for the investment to determine the fair value of the investment. An income-based valuation approach may also be used in which the anticipated future cash flows of the investment are discounted to calculate fair value. Discounts may also be applied due to the nature or duration of any restrictions on the disposition of the investments. Due to the inherent uncertainty of valuations of such investments, the fair values may differ significantly from the values that would have been used had an active market existed. The VC employs various methods for calibrating these valuation approaches including a regular review of key inputs and assumptions, transactional back-testing or disposition analysis, and reviews of any related market activity.
Trading in securities on foreign securities stock exchanges and OTC markets may be completed before 4 p.m. Eastern time. In addition, trading in certain foreign markets may not take place on every NYSE business day. Occasionally, events occur between the time at which trading in a foreign security is completed and the close of the NYSE that might call into question the reliability of the value of a portfolio security held by the Fund. As a result, differences may arise between the value of the Fund’s portfolio securities as determined at the foreign market close and the latest indications of value at the close of the NYSE. In order to minimize the potential for these differences, the VC monitors price movements following the close of trading in foreign stock markets through a series of country specific market proxies (such as baskets of American Depositary Receipts, futures contracts and exchange traded funds). These price movements are measured against established trigger thresholds for each specific market proxy to assist in determining if an event has occurred that may call into question the reliability of the values of the foreign securities held by the Fund. If such an event occurs, the securities may be valued using fair value procedures, which may include the use of independent pricing services.
When the last day of the reporting period is a non-business day, certain foreign markets may be open on those days that the NYSE is closed, which could result in differences between the value of the Fund’s portfolio securities on the last business day
and the last calendar day of the reporting period. Any significant security valuation changes due to an open foreign market are adjusted and reflected by the Fund for financial reporting purposes.
b. Foreign Currency Translation
Portfolio securities and other assets and liabilities denominated in foreign currencies are translated into U.S. dollars based on the exchange rate of such currencies against U.S. dollars on the date of valuation. The Fund may enter into foreign currency exchange contracts to facilitate transactions denominated in a foreign currency. Purchases and sales of securities, income and expense items denominated in foreign currencies are translated into U.S. dollars at the exchange rate in effect on the transaction date. Portfolio securities and assets and liabilities denominated in foreign currencies contain risks that those currencies will decline in value relative to the U.S. dollar. Occasionally, events may impact the availability or reliability of foreign exchange rates used to convert the U.S. dollar equivalent value. If such an event occurs, the foreign exchange rate will be valued at fair value using procedures established and approved by the Board.
The Fund does not separately report the effect of changes in foreign exchange rates from changes in market prices on securities held. Such changes are included in net realized and unrealized gain or loss from investments in the Consolidated Statement of Operations.
Realized foreign exchange gains or losses arise from sales of foreign currencies, currency gains or losses realized between the trade and settlement dates on securities transactions and the difference between the recorded amounts of dividends, interest, and foreign withholding taxes and the U.S. dollar equivalent of the amounts actually received or paid. Net unrealized foreign exchange gains and losses arise from changes in foreign exchange rates on foreign denominated assets and liabilities other than investments in securities held at the end of the reporting period.
c. Securities Purchased on a When-Issued or Delayed Delivery and TBA Basis
The Fund purchases securities on a when issued or delayed delivery and to-be-announced (TBA) basis, with payment and delivery scheduled for a future date. These transactions are subject to market fluctuations and are subject to the risk that the value at delivery may be more or less than the trade date purchase price.
| FSI-32 | Semiannual Report |
FRANKLIN TEMPLETON VARIABLE INSURANCE PRODUCTS TRUST
NOTES TO CONSOLIDATED FINANCIAL STATEMENTS (UNAUDITED)
Franklin Strategic Income VIP Fund (continued)
Although the Fund will generally purchase these securities with the intention of holding the securities, it may sell the securities before the settlement date. Sufficient assets have been segregated for these securities.
d. Derivative Financial Instruments
The Fund invested in derivatives in order to manage risk or gain exposure to various other investments or markets. Derivatives are financial contracts based on an underlying or notional amount, require no initial investment or an initial net investment that is smaller than would normally be required to have a similar response to changes in market factors, and require or permit net settlement. Derivatives contain various risks including the potential inability of the counterparty to fulfill their obligations under the terms of the contract, the potential for an illiquid secondary market, and/or the potential for market movements which expose the Fund to gains or losses in excess of the amounts shown in the Consolidated Statement of Assets and Liabilities. Realized gain and loss and unrealized appreciation and depreciation on these contracts for the period are included in the Consolidated Statement of Operations.
Derivative counterparty credit risk is managed through a formal evaluation of the creditworthiness of all potential counterparties. The Fund attempts to reduce its exposure to counterparty credit risk on OTC derivatives, whenever possible, by entering into International Swaps and Derivatives Association (ISDA) master agreements with certain counterparties. These agreements contain various provisions, including but not limited to collateral requirements, events of default, or early termination. Termination events applicable to the counterparty include certain deteriorations in the credit quality of the counterparty. Termination events applicable to the Fund include failure of the Fund to maintain certain net asset levels and/or limit the decline in net assets over various periods of time. In the event of default or early termination, the ISDA master agreement gives the non-defaulting party the right to net and close-out all transactions traded, whether or not arising under the ISDA agreement, to one net amount payable by one counterparty to the other. However, absent an event of default or early termination, OTC derivative assets and liabilities are presented gross and not offset in the Consolidated Statement of Assets and Liabilities. Early termination by the counterparty may result in an immediate payment by the Fund of any net liability owed to that counterparty under the ISDA agreement.
Collateral requirements differ by type of derivative. Collateral or initial margin requirements are set by the broker or exchange clearing house for exchange traded and centrally cleared derivatives. Initial margin deposited is held at the exchange and can be in the form of cash and/or securities. For OTC derivatives traded under an ISDA master agreement, posting of collateral is required by either the Fund or the applicable counterparty if the total net exposure of all OTC derivatives with the applicable counterparty exceeds the minimum transfer amount, which typically ranges from $100,000 to $250,000, and can vary depending on the counterparty and the type of the agreement. Generally, collateral is determined at the close of Fund business each day and any additional collateral required due to changes in derivative values may be delivered by the Fund or the counterparty within a few business days. Collateral pledged and/or received by the Fund for OTC derivatives, if any, is held in segregated accounts with the Fund’s custodian/counterparty broker and can be in the form of cash and/or securities. Unrestricted cash may be invested according to the Fund’s investment objectives. To the extent that the amounts due to the Fund from its counterparties are not subject to collateralization or are not fully collateralized, the Fund bears the risk of loss from counterparty non-performance.
The Fund entered into OTC forward exchange contracts primarily to manage and/or gain exposure to certain foreign currencies. A forward exchange contract is an agreement between the Fund and a counterparty to buy or sell a foreign currency at a specific exchange rate on a future date.
The Fund entered into credit default swap contracts primarily to manage exposure to credit risk. A credit default swap is an agreement between the Fund and a counterparty whereby the buyer of the contract receives credit protection and the seller of the contract guarantees the credit worthiness of a referenced debt obligation. These agreements may be privately negotiated in the over-the-counter market (OTC credit default swaps) or may be executed in a multilateral trade facility platform, such as a registered exchange (centrally cleared credit default swaps). The underlying referenced debt obligation may be a single issuer of corporate or sovereign debt, a credit index, a basket of issuers or indices, or a tranche of a credit index or basket of issuers or indices. In the event of a default of the underlying referenced debt obligation, the buyer is entitled to receive the notional amount of the credit default swap contract from the seller in exchange for the referenced debt obligation, a net
| Semiannual Report | FSI-33 |
FRANKLIN TEMPLETON VARIABLE INSURANCE PRODUCTS TRUST
NOTES TO CONSOLIDATED FINANCIAL STATEMENTS (UNAUDITED)
Franklin Strategic Income VIP Fund (continued)
1. Organization and Significant Accounting Policies (continued)
d. Derivative Financial Instruments (continued)
settlement amount equal to the notional amount of the credit default swap less the recovery value of the referenced debt obligation, or other agreed upon amount. For centrally cleared credit default swaps, required initial margins are pledged by the Fund,
and the daily change in fair value is accounted for as a variation margin payable or receivable in the Consolidated Statement of Assets and Liabilities. Over the term of the contract, the buyer pays the seller a periodic stream of payments, provided that no event of default has occurred. Such periodic payments are accrued daily as an unrealized appreciation or depreciation until the payments are made, at which time they are realized. Upfront payments and receipts are reflected in the Consolidated Statement of Assets and Liabilities and represent compensating factors between stated terms of the credit default swap agreement and prevailing market conditions (credit spreads and other relevant factors). These upfront payments and receipts are amortized over the term of the contract as a realized gain or loss in the Consolidated Statement of Operations.
The Fund invests in value recovery instruments (VRI) primarily to gain exposure to growth risk. Periodic payments from VRI are dependent on established benchmarks for underlying variables. VRI has a notional amount, which is used to calculate amounts of payments to holders. Payments are recorded upon receipt as realized gains in the Consolidated Statement of Operations. The risks of investing in VRI include growth risk, liquidity, and the potential loss of investment.
See Note 9 regarding other derivative information.
e. Restricted Cash
At June 30, 2016, the Fund held restricted cash in connection with investments in certain derivative securities. Restricted cash is held in a segregated account with the Fund’s custodian and is reflected in the Consolidated Statement of Assets and Liabilities.
f. Loan Participation Notes
The Fund invests in loan participation notes (Participations). Participations are loans originally issued to a borrower by one or more financial institutions (the Lender) and subsequently sold to other investors, such as the Fund. Participations typically result in the Fund having a contractual relationship only with the
Lender and not with the borrower. The Fund has the right to receive from the Lender any payments of principal, interest and fees which the Lender received from the borrower. The Fund generally has no rights to either enforce compliance by the borrower with the terms of the loan agreement or to any collateral relating to the original loan. As a result, the Fund assumes the credit risk of both the borrower and the Lender that is selling the Participation. The Participations may also involve interest rate risk and liquidity risk, including the potential default or insolvency of the borrower and/or the Lender.
g. Investments in FT Holdings Corporation III (FT Subsidiary)
The Fund invests in certain financial instruments through its investment in FT Subsidiary. FT Subsidiary is a Delaware Corporation, is a wholly-owned subsidiary of the Fund, and is able to invest in certain financial instruments consistent with the investment objective of the Fund. At June 30, 2016, FT Subsidiary’s investment, Turtle Bay Resort, as well as any other assets and liabilities of FT Subsidiary are reflected in the Fund’s Consolidated Statement of Investments and Consolidated Statement of Assets and Liabilities. The financial statements have been consolidated and include the accounts of the Fund and FT Subsidiary. All intercompany transactions and balances have been eliminated. At June 30, 2016, the net assets of FT Subsidiary were $4,946,757, representing less than 1% of the Fund’s consolidated net assets. The Fund’s investment in FT Subsidiary is limited to 25% of consolidated assets.
h. Mortgage Dollar Rolls
The Fund enters into mortgage dollar rolls, typically on a TBA basis. Mortgage dollar rolls are agreements between the Fund and a financial institution where the Fund sells (or buys) mortgage-backed securities for delivery on a specified date and simultaneously contracts to repurchase (or sell) substantially similar (same type, coupon, and maturity) securities at a future date and at a predetermined price. Gains or losses are realized on the initial sale, and the difference between the repurchase price and the sale price is recorded as an unrealized gain or loss to the Fund upon entering into the mortgage dollar roll. In addition, the Fund may invest the cash proceeds that are received from the initial sale. During the period between the sale and repurchase, the Fund is not entitled to principal and interest paid on the mortgage backed securities. Transactions in mortgage dollar rolls are accounted for as purchases and sales and may result in an increase to the Fund’s portfolio turnover rate. The risks of mortgage dollar roll transactions include the potential inability of the counterparty to fulfill its obligations.
| FSI-34 | Semiannual Report |
FRANKLIN TEMPLETON VARIABLE INSURANCE PRODUCTS TRUST
NOTES TO CONSOLIDATED FINANCIAL STATEMENTS (UNAUDITED)
Franklin Strategic Income VIP Fund (continued)
i. Senior Floating Rate Interests
The Fund invests in senior secured corporate loans that pay interest at rates which are periodically reset by reference to a base lending rate plus a spread. These base lending rates are generally the prime rate offered by a designated U.S. bank or the London InterBank Offered Rate (LIBOR). Senior secured corporate loans often require prepayment of principal from excess cash flows or at the discretion of the borrower. As a result, actual maturity may be substantially less than the stated maturity. Senior secured corporate loans in which the Fund invests are generally readily marketable, but may be subject to certain restrictions on resale.
j. Income and Deferred Taxes
It is the Fund’s policy to qualify as a regulated investment company under the Internal Revenue Code. The Fund intends to distribute to shareholders substantially all of its taxable income and net realized gains to relieve it from federal income and if applicable, excise taxes. As a result, no provision for U.S. federal income taxes is required.
The Fund may be subject to foreign taxation related to income received, capital gains on the sale of securities and certain foreign currency transactions in the foreign jurisdictions in which it invests. Foreign taxes, if any, are recorded based on the tax regulations and rates that exist in the foreign markets in which the Fund invests. When a capital gain tax is determined to apply, the Fund records an estimated deferred tax liability in an amount that would be payable if the securities were disposed of on the valuation date.
The Fund may recognize an income tax liability related to its uncertain tax positions under U.S. GAAP when the uncertain tax position has a less than 50% probability that it will be sustained upon examination by the tax authorities based on its technical merits. As of June 30, 2016, the Fund has determined that no tax liability is required in its financial statements related to uncertain tax positions for any open tax years (or expected to be taken in future tax years). Open tax years are those that remain subject to examination and are based on each tax jurisdiction’s statute of limitation.
k. Security Transactions, Investment Income, Expenses and Distributions
Security transactions are accounted for on trade date. Realized gains and losses on security transactions are determined on a
specific identification basis. Interest income and estimated expenses are accrued daily. Amortization of premium and accretion of discount on debt securities are included in interest income. Paydown gains and losses are recorded as an adjustment to interest income. Facility fees are recognized as income over the expected term of the loan. Dividend income is recorded on the ex-dividend date. Distributions to shareholders are recorded on the ex-dividend date and are determined according to income tax regulations (tax basis). Distributable earnings determined on a tax basis may differ from earnings recorded in accordance with U.S. GAAP. These differences may be permanent or temporary. Permanent differences are reclassified among capital accounts to reflect their tax character. These reclassifications have no impact on net assets or the results of operations. Temporary differences are not reclassified, as they may reverse in subsequent periods.
Common expenses incurred by the Trust are allocated among the Funds based on the ratio of net assets of each Fund to the combined net assets of the Trust. Fund specific expenses are charged directly to the fund that incurred the expense.
Realized and unrealized gains and losses and net investment income, not including class specific expenses, are allocated daily to each class of shares based upon the relative proportion of net assets of each class. Differences in per share distributions, by class, are generally due to differences in class specific expenses.
Inflation-indexed bonds are adjusted for inflation through periodic increases or decreases in the security’s interest accruals, face amount, or principal redemption value, by amounts corresponding to the rate of inflation as measured by an index. Any increase or decrease in the face amount or principal redemption value will be included as interest income in the Consolidated Statement of Operations.
l. Accounting Estimates
The preparation of financial statements in accordance with U.S. GAAP requires management to make estimates and assumptions that affect the reported amounts of assets and liabilities at the date of the financial statements and the amounts of income and expenses during the reporting period. Actual results could differ from those estimates.
| Semiannual Report | FSI-35 |
FRANKLIN TEMPLETON VARIABLE INSURANCE PRODUCTS TRUST
NOTES TO CONSOLIDATED FINANCIAL STATEMENTS (UNAUDITED)
Franklin Strategic Income VIP Fund (continued)
1. Organization and Significant Accounting Policies (continued)
m. Guarantees and Indemnifications
Under the Trust’s organizational documents, its officers and trustees are indemnified by the Trust against certain liabilities arising out of the performance of their duties to the Trust.
Additionally, in the normal course of business, the Trust, on behalf of the Fund, enters into contracts with service providers that contain general indemnification clauses. The Trust’s maximum exposure under these arrangements is unknown as this would involve future claims that may be made against the Trust that have not yet occurred. Currently, the Trust expects the risk of loss to be remote.
2. Shares of Beneficial Interest
At June 30, 2016, there were an unlimited number of shares authorized (without par value). Transactions in the Fund’s shares were as follows:
| Six Months Ended June 30, 2016 | Year Ended December 31, 2015 | |||||||||||||||||||
| Shares | Amount | Shares | Amount | |||||||||||||||||
| Class 1 Shares: | ||||||||||||||||||||
Shares sold | 218,687 | $ | 2,335,020 | 342,063 | $ | 3,944,392 | ||||||||||||||
Shares issued in reinvestment of distributions | 1,427,226 | 15,028,685 | 3,778,584 | 41,753,352 | ||||||||||||||||
Shares redeemed | (4,200,110 | ) | (44,543,203 | ) | (10,556,150 | ) | (120,369,494 | ) | ||||||||||||
|
| |||||||||||||||||||
Net increase (decrease) | (2,554,197 | ) | $ | (27,179,498 | ) | (6,435,503 | ) | $ | (74,671,750 | ) | ||||||||||
|
| |||||||||||||||||||
| Class 2 Shares: | ||||||||||||||||||||
Shares sold | 1,375,480 | $ | 14,106,061 | 4,486,606 | $ | 49,551,393 | ||||||||||||||
Shares issued in reinvestment of distributions | 679,894 | 6,934,919 | 1,618,117 | 17,330,037 | ||||||||||||||||
Shares redeemed | (2,194,026 | ) | (22,371,822 | ) | (4,183,880 | ) | (45,680,727 | ) | ||||||||||||
|
| |||||||||||||||||||
Net increase (decrease) | (138,652 | ) | $ | (1,330,842 | ) | 1,920,843 | $ | 21,200,703 | ||||||||||||
|
| |||||||||||||||||||
| Class 4 Shares: | ||||||||||||||||||||
Shares sold | 81,563 | $ | 853,837 | 512,101 | $ | 6,000,050 | ||||||||||||||
Shares issued in reinvestment of distributions | 267,029 | 2,790,452 | 788,162 | 8,638,254 | ||||||||||||||||
Shares redeemed | (1,032,538 | ) | (10,840,574 | ) | (2,071,680 | ) | (22,984,550 | ) | ||||||||||||
|
| |||||||||||||||||||
Net increase (decrease) | (683,946 | ) | $ | (7,196,285 | ) | (771,417 | ) | $ | (8,346,246 | ) | ||||||||||
|
| |||||||||||||||||||
3. Transactions with Affiliates
Franklin Resources, Inc. is the holding company for various subsidiaries that together are referred to as Franklin Templeton Investments. Certain officers and trustees of the Fund are also officers and/or directors of the following subsidiaries:
| Subsidiary | Affiliation | |
Franklin Advisers, Inc. (Advisers) | Investment manager | |
Franklin Templeton Services, LLC (FT Services) | Administrative manager | |
Franklin Templeton Distributors, Inc. (Distributors) | Principal underwriter | |
Franklin Templeton Investor Services, LLC (Investor Services) | Transfer agent |
| FSI-36 | Semiannual Report |
FRANKLIN TEMPLETON VARIABLE INSURANCE PRODUCTS TRUST
NOTES TO CONSOLIDATED FINANCIAL STATEMENTS (UNAUDITED)
Franklin Strategic Income VIP Fund (continued)
a. Management Fees
The Fund pays an investment management fee to Advisers based on the average daily net assets of the Fund as follows:
| Annualized Fee Rate | Net Assets | |
0.625% | Up to and including $500 million | |
0.525% | Over $500 million, up to and including $1 billion | |
0.480% | Over $1 billion, up to and including $1.5 billion | |
0.435% | Over $1.5 billion, up to and including $6.5 billion | |
0.415% | Over $6.5 billion, up to and including $11.5 billion | |
0.400% | Over $11.5 billion, up to and including $16.5 billion | |
0.390% | Over $16.5 billion, up to and including $19 billion | |
0.380% | Over $19 billion, up to and including $21.5 billion | |
0.370% | In excess of $21.5 billion |
For the period ended June 30, 2016, the annualized effective investment management fee rate was 0.595% of the Fund’s average daily net assets.
b. Administrative Fees
Under an agreement with Advisers, FT Services provides administrative services to the Fund. The fee is paid by Advisers based on the Fund’s average daily net assets, and is not an additional expense of the Fund.
c. Distribution Fees
The Board has adopted distribution plans for Class 2 and Class 4 shares pursuant to Rule 12b-1 under the 1940 Act. Under the Fund’s compensation distribution plans, the Fund pays Distributors for costs incurred in connection with the servicing, sale and distribution of the Fund’s shares up to 0.25% and 0.35% per year of its average daily net assets of Class 2 and Class 4, respectively. The plan year, for purposes of monitoring compliance with the maximum annual plan rates, is February 1 through January 31.
d. Transfer Agent Fees
Investor Services, under terms of an agreement, performs shareholder servicing for the Fund and is not paid by the Fund for the services.
e. Investments in Affiliated Management Investment Companies
The Fund invests in one or more affiliated management investment companies for purposes other than exercising a controlling influence over the management or policies. Management fees paid by the Fund are waived on assets invested in the affiliated management investment companies, as noted in the Consolidated Statement of Operations, in an amount not to exceed the management and administrative fees paid directly or indirectly by each affiliate. Prior to January 1, 2014, the waiver was accounted for as a reduction to management fees.
| Semiannual Report | FSI-37 |
FRANKLIN TEMPLETON VARIABLE INSURANCE PRODUCTS TRUST
NOTES TO CONSOLIDATED FINANCIAL STATEMENTS (UNAUDITED)
Franklin Strategic Income VIP Fund (continued)
3. Transactions with Affiliates (continued)
e. Investments in Affiliated Management Investment Companies (continued)
| Number of Shares Held at Beginning of Period | Gross Additions | Gross Reductions | Number of Shares Held at End of Period | Value at End of Period | Investment Income | Realized Gain (Loss) | % of Affiliated of Period | |||||||||||||||||||||||||
| Non-Controlled Affiliates | ||||||||||||||||||||||||||||||||
Franklin Lower Tier Floating Rate Fund | 3,135,765 | 46,063 | (91,906 | ) | 3,089,922 | $ | 30,652,026 | $ | 257,407 | $ | (7,353 | ) | 7.1% | |||||||||||||||||||
Franklin Middle Tier Floating Rate Fund | 2,704,835 | 26,387 | (94,000 | ) | 2,637,222 | 25,554,680 | 795,625 | (32,900 | ) | 7.4% | ||||||||||||||||||||||
Institutional Fiduciary Trust Money Market Portfolio | 63,296,131 | 106,708,771 | (65,295,498 | ) | 104,709,404 | 104,709,404 | — | — | 0.5% | |||||||||||||||||||||||
|
| |||||||||||||||||||||||||||||||
Total | $ | 160,916,110 | $ | 1,053,032 | $ | (40,253 | ) | |||||||||||||||||||||||||
|
| |||||||||||||||||||||||||||||||
4. Expense Offset Arrangement
The Fund has entered into an arrangement with its custodian whereby credits realized as a result of uninvested cash balances are used to reduce a portion of the Fund’s custodian expenses. During the period ended June 30, 2016, the custodian fees were reduced as noted in the Consolidated Statement of Operations.
5. Income Taxes
For tax purposes, capital losses may be carried over to offset future capital gains, if any. At December 31, 2015, the capital loss carryforwards were as follows:
Capital loss carryforwards: | ||||
Short term | $ | 1,542,457 | ||
Long term | 15,007,905 | |||
|
| |||
Total capital loss carryforwards | $ | 16,550,362 | ||
|
|
At June 30, 2016, the cost of investments and net unrealized appreciation (depreciation) for income tax purposes were as follows:
Cost of investments | $ | 791,055,209 | ||
|
| |||
Unrealized appreciation | $ | 21,540,419 | ||
Unrealized depreciation | (55,821,375 | ) | ||
|
| |||
Net unrealized appreciation (depreciation) | $ | (34,280,956 | ) | |
|
|
Differences between income and/or capital gains as determined on a book basis and a tax basis are primarily due to differing treatments of foreign currency transactions and bond discounts and premiums.
6. Investment Transactions
Purchases and sales of investments (excluding short term securities) for the period ended June 30, 2016, aggregated $430,620,784 and $473,133,896, respectively.
7. Credit Risk and Defaulted Securities
At June 30, 2016, the Fund had 49.3% of its portfolio invested in high yield, senior secured floating rate notes, or other securities rated below investment grade. These securities may be more sensitive to economic conditions causing greater price volatility and are potentially subject to a greater risk of loss due to default than higher rated securities.
| FSI-38 | Semiannual Report |
FRANKLIN TEMPLETON VARIABLE INSURANCE PRODUCTS TRUST
NOTES TO CONSOLIDATED FINANCIAL STATEMENTS (UNAUDITED)
Franklin Strategic Income VIP Fund (continued)
The Fund held defaulted securities and/or other securities for which the income has been deemed uncollectible. At June 30, 2016, the aggregate value of these securities was $6,321,548, representing 0.9% of the Fund’s net assets. The Fund discontinues accruing income on securities for which income has been deemed uncollectible and provides an estimate for losses on interest receivable. The securities have been identified in the accompanying Consolidated Statement of Investments.
8. Restricted Securities
The Fund invests in securities that are restricted under the Securities Act of 1933 (1933 Act) or which are subject to legal, contractual, or other agreed upon restrictions on resale. Restricted securities are often purchased in private placement transactions, and cannot be sold without prior registration unless the sale is pursuant to an exemption under the 1933 Act. Disposal of these securities may require greater effort and expense, and prompt sale at an acceptable price may be difficult. The Fund may have registration rights for restricted securities. The issuer generally incurs all registration costs.
At June 30, 2016, the Fund held investments in restricted securities, excluding certain securities exempt from registration under the 1933 Act deemed to be liquid, as follows:
| Units | Issuer | Acquisition Date | Cost | Value | ||||||||||
| 1,499 | Warrior Met Coal LLC, A (Value is 0.0%a of Net Assets) | 3/31/16 | $ | 2,911,693 | $ | 151,124 | ||||||||
|
| |||||||||||||
aRounds to less than 0.1% of net assets.
9. Other Derivative Information
At June 30, 2016, the Fund’s investments in derivative contracts are reflected in the Consolidated Statement of Assets and Liabilities as follows:
Asset Derivatives | Liability Derivatives | |||||||||||
| Derivative Contracts Not Accounted for as Hedging Instruments | Consolidated Statement of Assets and Liabilities Location | Fair Value | Consolidated Statement of Assets and Liabilities Location | Fair Value | ||||||||
Foreign exchange contracts | Unrealized appreciation on OTC forward exchange contracts | $ | 2,041,573 | Unrealized depreciation on OTC forward exchange contracts | $ | 4,256,802 | ||||||
Credit contracts | Variation margin | 64,218 | a | Variation margin | — | |||||||
| OTC swap contracts (upfront payments) | 30,097 | OTC swap contracts (upfront receipts) | — | |||||||||
| Unrealized appreciation on OTC swap contracts | 11,703 | Unrealized depreciation on OTC swap contracts | — | |||||||||
Value recovery instruments | Investments in securities, at value | 641,720 | ||||||||||
|
|
|
| |||||||||
Totals | $ | 2,789,311 | $ | 4,256,802 | ||||||||
|
|
|
| |||||||||
aThis amount reflects the cumulative appreciation (depreciation) of centrally cleared swap contracts as reported in the Consolidated Statement of Investments. Only the variation margin receivable/payable at period end is separately reported within the Consolidated Statement of Assets and Liabilities. Prior variation margin movements were recorded to cash upon receipt or payment.
| Semiannual Report | FSI-39 |
FRANKLIN TEMPLETON VARIABLE INSURANCE PRODUCTS TRUST
NOTES TO CONSOLIDATED FINANCIAL STATEMENTS (UNAUDITED)
Franklin Strategic Income VIP Fund (continued)
9. Other Derivative Information (continued)
For the period ended June 30, 2016, the effect of derivative contracts in the Fund’s Consolidated Statement of Operations was as follows:
| Derivative Contracts Not Accounted for as Hedging Instruments | Consolidated Statement of Operations Locations | Net Realized Gain (Loss) for the Period | Consolidated Statement of Operations Locations | Net Change in Unrealized Appreciation (Depreciation) for the Period | ||||||||
| Net realized gain (loss) from: | Net change in unrealized appreciation (depreciation) on: | |||||||||||
Foreign exchange contracts | Foreign currency transactions | $ | (3,157,029 | )a | Translation of other assets and liabilities denominated in foreign currencies | $ | (2,759,069 | )a | ||||
Credit contracts | Swap contracts | 173,507 | Swap contracts | 33,313 | ||||||||
Value recovery instruments | Investments | — | Investments | (146,400 | ) | |||||||
|
|
|
| |||||||||
Totals | $ | (2,983,522 | ) | $ | (2,872,156 | ) | ||||||
|
|
|
| |||||||||
aForward exchange contracts are included in net realized gain (loss) from foreign currency transactions and net change in unrealized appreciation (depreciation) on translation of other assets and liabilities denominated in foreign currencies in the Consolidated Statement of Operations.
At June 30, 2016, the Fund’s OTC derivative assets and liabilities are as follows:
| Gross and Net Amounts of Assets and Liabilities Presented in the Consolidated Statement of Assets and Liabilities | ||||||||
| Assetsa | Liabilitiesa | |||||||
| Derivatives | ||||||||
Forward exchange contracts | $ | 2,041,573 | $ | 4,256,802 | ||||
Swap contracts | 41,800 | — | ||||||
|
| |||||||
Total | $ | 2,083,373 | $ | 4,256,802 | ||||
|
| |||||||
aAbsent an event of default or early termination, OTC derivative assets and liabilities are presented gross and not offset in the Consolidated Statement of Assets and Liabilities.
| FSI-40 | Semiannual Report |
FRANKLIN TEMPLETON VARIABLE INSURANCE PRODUCTS TRUST
NOTES TO CONSOLIDATED FINANCIAL STATEMENTS (UNAUDITED)
Franklin Strategic Income VIP Fund (continued)
At June 30, 2016, the Fund’s OTC derivative assets, which may be offset against the Fund’s OTC derivative liabilities and collateral received from the counterparty, are as follows:
| Amounts Not Offset in the Consolidated Statement of Assets and Liabilities | ||||||||||||||||||||
| Gross and Net Amounts of Assets Presented in the Consolidated Statement of Assets and Liabilities | Financial Instruments Available for Offset | Financial Instruments Collateral Received | Cash Collateral Receiveda | Net Amount (Not less than zero) | ||||||||||||||||
| Counterparty | ||||||||||||||||||||
BZWS | $ | 117,962 | $ | (117,962 | ) | $ | — | $ | — | $ | — | |||||||||
CITI | 38,280 | (38,280 | ) | — | — | — | ||||||||||||||
DBAB | 1,568,832 | (1,568,832 | ) | — | — | — | ||||||||||||||
GSCO | 42,615 | (42,615 | ) | — | — | — | ||||||||||||||
HSBC | 29,790 | (29,790 | ) | — | — | — | ||||||||||||||
JPHQ | 258,251 | (258,251 | ) | — | — | — | ||||||||||||||
MSCO | 27,643 | (6,766 | ) | — | (20,877 | ) | — | |||||||||||||
|
| |||||||||||||||||||
Total | $ | 2,083,373 | $ | (2,062,496 | ) | $ | — | $ | (20,877 | ) | $ | — | ||||||||
|
| |||||||||||||||||||
aIn some instances, the collateral amount disclosed in the table above was adjusted due to the requirement to limit collateral amounts to avoid the effect of overcollateralization. Actual collateral received and/or pledged may be more than the amounts disclosed herein.
At June 30, 2016, the Fund’s OTC derivative liabilities, which may be offset against the Fund’s OTC derivative assets and collateral pledged to the counterparty, are as follows:
| Amounts Not Offset in the Consolidated Statement of Assets and Liabilities | ||||||||||||||||||||
Gross and Net Assets and Liabilities | Financial Instruments Available for Offset | Financial Instruments Collateral Pledged | Cash Collateral Pledgeda | Net Amount (Not less than zero) | ||||||||||||||||
| Counterparty | ||||||||||||||||||||
BZWS | $ | 211,019 | $ | (117,962 | ) | $ | — | $ | — | $ | 93,057 | |||||||||
CITI | 170,677 | (38,280 | ) | — | — | �� | 132,397 | |||||||||||||
DBAB | 2,358,498 | (1,568,832 | ) | — | (780,000 | ) | 9,666 | |||||||||||||
GSCO | 49,997 | (42,615 | ) | — | — | 7,382 | ||||||||||||||
HSBC | 509,396 | (29,790 | ) | — | (330,000 | ) | 149,606 | |||||||||||||
JPHQ | 950,449 | (258,251 | ) | — | (692,198 | ) | — | |||||||||||||
MSCO | 6,766 | (6,766 | ) | — | — | — | ||||||||||||||
|
| |||||||||||||||||||
Total | $ | 4,256,802 | $ | (2,062,496 | ) | $ | — | $ | (1,802,198 | ) | $ | 392,108 | ||||||||
|
| |||||||||||||||||||
aIn some instances, the collateral amounts disclosed in the table above were adjusted due to the requirement to limit collateral amounts to avoid the effect of overcollateralization. Actual collateral received and/or pledged may be more than the amounts disclosed herein.
For the period ended June, 30 2016, the average month end fair value of derivatives represented 0.7% of average month end net assets. The average month end number of open derivative contracts for the period was 56.
See Note 1(d) regarding derivative financial instruments.
See Abbreviations on page FSI-44.
| Semiannual Report | FSI-41 |
FRANKLIN TEMPLETON VARIABLE INSURANCE PRODUCTS TRUST
NOTES TO CONSOLIDATED FINANCIAL STATEMENTS (UNAUDITED)
Franklin Strategic Income VIP Fund (continued)
10. Credit Facility
The Fund, together with other U.S. registered and foreign investment funds (collectively, Borrowers), managed by Franklin Templeton Investments, are borrowers in a joint syndicated senior unsecured credit facility totaling $2 billion (Global Credit Facility) which matures on February 10, 2017. This Global Credit Facility provides a source of funds to the Borrowers for temporary and emergency purposes, including the ability to meet future unanticipated or unusually large redemption requests.
Under the terms of the Global Credit Facility, the Fund shall, in addition to interest charged on any borrowings made by the Fund and other costs incurred by the Fund, pay its share of fees and expenses incurred in connection with the implementation and maintenance of the Global Credit Facility, based upon its relative share of the aggregate net assets of all of the Borrowers, including an annual commitment fee of 0.07% based upon the unused portion of the Global Credit Facility. Effective February 12, 2016, the annual commitment fee is 0.15%. These fees are reflected in other expenses in the Consolidated Statement of Operations. During the period ended June 30, 2016, the Fund did not use the Global Credit Facility.
11. Fair Value Measurements
The Fund follows a fair value hierarchy that distinguishes between market data obtained from independent sources (observable inputs) and the Fund’s own market assumptions (unobservable inputs). These inputs are used in determining the value of the Fund’s financial instruments and are summarized in the following fair value hierarchy:
| • | Level 1 – quoted prices in active markets for identical financial instruments |
| • | Level 2 – other significant observable inputs (including quoted prices for similar financial instruments, interest rates, prepayment speed, credit risk, etc.) |
| • | Level 3 – significant unobservable inputs (including the Fund’s own assumptions in determining the fair value of financial instruments) |
The input levels are not necessarily an indication of the risk or liquidity associated with financial instruments at that level.
For movements between the levels within the fair value hierarchy, the Fund has adopted a policy of recognizing the transfers as of the date of the underlying event which caused the movement.
| FSI-42 | Semiannual Report |
FRANKLIN TEMPLETON VARIABLE INSURANCE PRODUCTS TRUST
NOTES TO CONSOLIDATED FINANCIAL STATEMENTS (UNAUDITED)
Franklin Strategic Income VIP Fund (continued)
A summary of inputs used as of June 30, 2016, in valuing the Fund’s assets and liabilities carried at fair value, is as follows:
| Level 1 | Level 2 | Level 3 | Total | |||||||||||||
| Assets: | ||||||||||||||||
Investments in Securities: | ||||||||||||||||
Equity Investments:a | ||||||||||||||||
Consumer Services | $ | — | $ | 4,943,766 | $ | — | $ | 4,943,766 | ||||||||
Energy | — | — | 151,124 | 151,124 | ||||||||||||
Health Care Equipment & Services | — | 32,670 | — | 32,670 | ||||||||||||
Transportation | — | — | 251,576 | 251,576 | ||||||||||||
Management Investment Companies | 56,206,706 | — | — | 56,206,706 | ||||||||||||
Corporate Bonds | — | 294,197,943 | 129,783 | 294,327,726 | ||||||||||||
Senior Floating Rate Interests | — | 78,286,391 | — | 78,286,391 | ||||||||||||
Foreign Government and Agency Securities | — | 82,803,251 | — | 82,803,251 | ||||||||||||
U.S. Government and Agency Securities | — | 30,145,221 | — | 30,145,221 | ||||||||||||
Asset-Backed Securities and Commercial Mortgage-Backed Securities | — | 42,365,288 | — | 42,365,288 | ||||||||||||
Mortgage-Backed Securities | — | 55,776,500 | — | 55,776,500 | ||||||||||||
Municipal Bonds | — | 6,774,630 | — | 6,774,630 | ||||||||||||
Escrows and Litigation Trusts | — | — | — | b | — | |||||||||||
Short Term Investments | 104,709,404 | — | — | 104,709,404 | ||||||||||||
|
| |||||||||||||||
Total Investments in Securities | $ | 160,916,110 | $ | 595,325,660 | $ | 532,483 | $ | 756,774,253 | ||||||||
|
| |||||||||||||||
Other Financial Instruments: | ||||||||||||||||
Forward Exchange Contracts | $ | — | $ | 2,041,573 | $ | — | $ | 2,041,573 | ||||||||
Swap Contracts | — | 75,921 | — | 75,921 | ||||||||||||
|
| |||||||||||||||
Total Other Financial Instruments | $ | — | $ | 2,117,494 | $ | — | $ | 2,117,494 | ||||||||
|
| |||||||||||||||
| Liabilities: | ||||||||||||||||
Other Financial Instruments: | ||||||||||||||||
Forward Exchange Contracts | $ | — | $ | 4,256,802 | $ | — | $ | 4,256,802 | ||||||||
|
| |||||||||||||||
aIncludes common and convertible preferred stocks and management investment companies as well as other equity investments.
bIncludes securities determined to have no value at June 30, 2016.
A reconciliation of assets in which Level 3 inputs are used in determining fair value is presented when there are significant Level 3 financial instruments at the end of the period.
12. Subsequent Events
The Fund has evaluated subsequent events through the issuance of the financial statements and determined that no events have occurred that require disclosure.
| Semiannual Report | FSI-43 |
FRANKLIN TEMPLETON VARIABLE INSURANCE PRODUCTS TRUST
NOTES TO CONSOLIDATED FINANCIAL STATEMENTS (UNAUDITED)
Franklin Strategic Income VIP Fund (continued)
Abbreviations
Counterparty/Exchange | Currency | Selected Portfolio | ||||||||
| BZWS | Barclays Bank PLC | BRL | Brazilian Real | CDO | Collateralized Debt Obligation | |||||
| CITI | Citigroup, Inc. | EUR | Euro | CLO | Collateralized Loan Obligation | |||||
| DBAB | Deutsche Bank AG | GBP | British Pound | FRN | Floating Rate Note | |||||
| GSCO | The Goldman Sachs Group, Inc. | IDR | Indonesian Rupiah | GDP | Gross Domestic Product | |||||
| HSBC | HSBC Bank USA, N.A. | LKR | Sri Lankan Rupee | GO | General Obligation | |||||
ICE | Intercontinental Exchange | MXN | Mexican Peso | HDC | Housing Development Corp. | |||||
JPHQ | JP Morgan Chase & Co. | MYR | Malaysian Ringgit | PIK | Payment-In-Kind | |||||
| MSCO | Morgan Stanley | PHP | Philippine Peso | SF | Single Family | |||||
| UYU | Uruguayan Peso | VRI | Value Recovery Instrument | |||||||
| FSI-44 | Semiannual Report |
Templeton Developing Markets VIP Fund
We are pleased to bring you Templeton Developing Markets VIP Fund’s semiannual report for the period ended June 30, 2016.
Class 4 Performance Summary as of June 30, 2016
The Fund’s Class 4 shares delivered a +10.49% total return* for the six-month period ended June 30, 2016.
*The Fund has a fee waiver associated with any investment in a Franklin Templeton money fund and/or other Franklin Templeton fund, as applicable, contractually guaranteed through at least the Fund’s current fiscal year-end. Fund investment results reflect the fee waiver, to the extent applicable; without this reduction, the results would have been lower.
Performance reflects the Fund’s Class 4 operating expenses, but does not include any contract fees, expenses or sales charges. If they had been included, performance would be lower. These charges and deductions, particularly for variable life policies, can have a significant effect on contract values and insurance benefits. See the contract prospectus for a complete description of these expenses, including sales charges.
Performance data represent past performance, which does not guarantee future results. Investment return and principal value will fluctuate, and you may have a gain or loss when you sell your shares. Current performance may differ from figures shown.
| Semiannual Report | TD-1 |
TEMPLETON DEVELOPING MARKETS VIP FUND
Fund Goal and Main Investments
The Fund seeks long-term capital appreciation. Under normal market conditions, the Fund invests at least 80% of its net assets in emerging market investments.
Fund Risks
All investments involve risks, including possible loss of principal. Special risks are associated with foreign investing, including currency fluctuations, economic instability and political developments. Investments in developing markets, of which frontier markets are a subset, involve heightened risks related to the same factors, in addition to those associated with these markets’ smaller size, lesser liquidity and lack of established legal, political, business and social frameworks to support securities markets. Because these frameworks are typically even less developed in frontier markets, as well as various factors including the increased potential for extreme price volatility, illiquidity, trade barriers and exchange controls, the risks associated with developing markets are magnified in frontier markets. The Fund is designed for the aggressive portion of a well-diversified portfolio. The Fund is actively managed but there is no guarantee that the manager’s investment decisions will produce the desired results. The Fund’s prospectus also includes a description of the main investment risks.
Performance Overview
You can find the Fund’s six-month total return in the Performance Summary. In comparison, the MSCI Emerging Markets (EM) Index generated a +6.60% total return, and the Standard & Poor’s®/International Finance Corporation Investable Composite Index produced a +6.11% total return for the same period.1 Please note index performance numbers are for reference and we do not attempt to track an index but rather undertake investments on the basis of fundamental research.
Economic and Market Overview
The global economy grew moderately during the six months under review amid a generally weak recovery in developed markets and slowing growth in emerging markets. Nonetheless, emerging market economies overall continued to grow faster than developed market economies. India’s economy expanded in 2016’s first quarter at the fastest annual rate in one and a half years, driven by private spending. China’s economy grew in 2016’s first half at an annual rate that was within the government’s targeted range, aided by fiscal and monetary
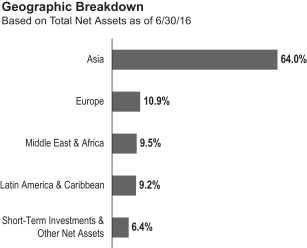
stimulus measures. Russia’s economy remained in recession in 2016’s first quarter amid declines in manufacturing, construction and wholesale and retail trade, as did Brazil’s economy, amid weakness in investment and domestic consumption.
Several emerging market central banks, including those of Mexico and South Africa, raised their benchmark interest rates to control inflation and support their currencies, while some, including South Korea and Hungary, lowered their benchmark interest rates to promote economic growth. The Reserve Bank of India cut its benchmark interest rate to a five-year low and took steps to increase monetary liquidity. The Bank of Russia reduced its key interest rate in June, citing lower inflation expectations amid an economic recession. Although the People’s Bank of China (PBOC) left its benchmark interest rate unchanged, it employed other monetary easing measures that included cutting the cash reserve requirement ratio for the country’s banks in February and effectively devaluing the renminbi against the U.S. dollar to the lowest level in more than five years.
Emerging market stocks recovered from the heightened volatility in early 2016 caused by a plunge in China’s domestic market on January 4, which triggered the country’s new circuit-breaker system and halted trading. Further hurting stocks were a collapse in crude oil prices and investor concerns about global economic growth. However, emerging market stocks began to rebound in late January as crude oil prices rose and the PBOC implemented monetary stimulus measures. Further bolstering investor sentiment during the period were monetary easing measures by other major central banks, notably the Bank of Japan and the European
1. Source: Morningstar. One cannot invest directly in an index, and an index is not representative of the Fund’s portfolio. Please see Index Descriptions following the Fund Summaries.
| TD-2 | Semiannual Report |
TEMPLETON DEVELOPING MARKETS VIP FUND
Central Bank (ECB); the finalization of a new debt deal for Greece; and a price increase in most commodities. Although the U.K.’s referendum vote to leave the European Union led to stock declines globally, emerging market stocks overall rebounded by period-end as many investors grew optimistic that the Bank of England and the ECB would introduce additional monetary easing measures. In this environment, emerging market stocks, as measured by the MSCI EM Index, generated a +6.60% total return, with all major regions posting positive returns.1
Investment Strategy
We employ a fundamental research, value-oriented, long-term investment approach. We focus on the market price of a company’s securities relative to our evaluation of its long-term earnings, asset value and cash flow potential. We also consider a company’s profit and loss outlook, balance sheet strength, cash flow trends and asset value in relation to the current price. Our analysis considers the company’s corporate governance behavior as well as its position in its sector, the economic framework and political environment. We invest in securities without regard to benchmark comparisons.
Manager’s Discussion
During the six months under review, key contributors to the Fund’s absolute performance included our investments in Banco Bradesco, Itau Unibanco Holding and TSMC (Taiwan Semiconductor Manufacturing Co.).
Banco Bradesco and Itau Unibanco, two of Brazil’s largest financial conglomerates, provide a full range of banking and financial services. The initiation of impeachment proceedings against President Dilma Rousseff, which led to her suspension for up to 180 days, boosted investor confidence about the Brazilian market overall as many investors grew optimistic about the takeover of Vice President Michel Temer as acting president. Although both companies reported weaker-than-expected first quarter 2016 net income, largely due to higher loan-loss provisions, their stocks participated in the Brazilian stock market’s substantial rally in 2016’s first half. Other favorable factors included the Brazilian real’s appreciation, an improvement in business sentiment and some positive economic data.
TSMC is the world’s largest independent integrated circuit foundry. Its better-than-expected first quarter 2016 revenues and agreement with Apple to be the exclusive supplier of processors for the next-generation iPhones, leading to higher
revenue growth expectations for 2016’s second half, supported share price performance. Additionally, development of technologies in other areas, such as mobile computing and high-performance computing devices, led many investors to adopt a positive view on the company.
In contrast, key detractors from the Fund’s absolute performance included our positions in Brilliance China Automotive Holdings, China Life Insurance and Baidu.
Chinese shares experienced substantial weakness in early January, as the effect of growth concerns were exacerbated by uncertainty about the country’s foreign exchange policy. This uncertainty resulted in the renminbi’s devaluation, and Chinese authorities’ equity market intervention, which further rattled investor confidence. The renminbi continued to weaken against the U.S. dollar during the period, reaching the lowest level in more than five years. A rebound in Chinese stocks in the latter part of the reporting period failed to completely offset earlier declines.
Brilliance China Automotive is a major Chinese automobile manufacturer with a joint venture with German luxury automobile manufacturer BMW for the production and sale of BMW 3-series and 5-series vehicles in China. Reduced earnings in 2016’s first quarter, resulting from lower sales and higher-than-expected selling expenses, hurt the company’s share price. Investor sentiment, however, improved later in the period due to expectations that new product launches could drive sales and profitability in 2016’s second half.
China Life Insurance is one of China’s largest life insurance companies. Disappointing earnings in 2016’s first quarter, due mainly to lower investment income combined with concerns
| Top 10 Countries | ||||
| 6/30/16 | ||||
| % of Total Net Assets | ||||
| China | 17.7% | |||
| South Korea | 12.5% | |||
| India | 10.3% | |||
| Taiwan | 9.9% | |||
| South Africa | 8.5% | |||
| Brazil | 8.2% | |||
| U.K. | 5.2% | |||
| Thailand | 4.7% | |||
| Russia | 3.3% | |||
| Hong Kong | 3.2% | |||
| Semiannual Report | TD-3 |
TEMPLETON DEVELOPING MARKETS VIP FUND
about a lower interest rate environment and the renminbi’s depreciation, hurt the company’s stock price. Further dampening market sentiment were worries that the company’s recent acquisitions of commercial banks might raise its risk profile.
Baidu is China’s leading Internet search engine and online marketing solutions provider, with the largest website in China and among the largest globally. The company also operates an e-commerce platform with an online payment tool; develops and markets web application software; and provides a variety of services and products, including entertainment products and human resource related services. Its shares fell after the company was criticized for misleading users with search results, leading the Chinese government to institute new Internet regulations, which prompted the company to lower its second quarter 2016 revenue outlook.
In the past six months, we increased the Fund’s investments notably in South Korea, Russia, Taiwan and Saudi Arabia2 as we continued to invest in opportunities we considered more attractive. In sector terms, we increased investments largely in information technology (IT), energy, materials and consumer discretionary.3 Key purchases included an additional investment in South Korea-based Samsung Electronics, a leading global electronics manufacturer, as well as new positions in Alibaba Group Holding, China’s largest e-commerce company, and Saudi Basic Industries,2 one of the world’s largest petrochemical producers and one of the Middle East’s largest steel manufacturers.
Conversely, we reduced the Fund’s investments largely in South Africa, India and China, primarily through China H shares, as we sought to focus on opportunities we considered to be more attractively valued within our investment universe.4 We also conducted some sales in Thailand. In sector terms, some of the largest sales were in consumer staples, telecommunication services and financials.5 Key sales included reducing the Fund’s
holdings in Belgium-listed Anheuser-Busch InBev, a global brewer; and Tata Consultancy Services, an Indian IT consulting and services firm. We also closed the Fund’s position in China Construction Bank, a Chinese financial and banking services provider.
Thank you for your participation in Templeton Developing Markets VIP Fund. We look forward to serving your future investment needs.
| Top 10 Holdings | ||||
| 6/30/16 | ||||
Company Sector/Industry, Country | % of Total Net Assets | |||
| Taiwan Semiconductor Manufacturing Co. Ltd. Semiconductors & Semiconductor Equipment, Taiwan | 5.9 | % | ||
Samsung Electronics Co. Ltd. Technology Hardware, Storage & Peripherals, | 5.3 | % | ||
Unilever PLC Personal Products, U.K. | 5.2 | % | ||
Naspers Ltd. Media, South Africa | 5.0 | % | ||
Tencent Holdings Ltd. Internet Software & Services, China | 4.0 | % | ||
Itau Unibanco Holding SA Banks, Brazil | 3.0 | % | ||
| Brilliance China Automotive Holdings Ltd. Automobiles, China | 3.1 | % | ||
Banco Bradesco SA Banks, Brazil | 2.8 | % | ||
China Mobile Ltd. Wireless Telecommunication Services, China | 2.1 | % | ||
Hon Hai Precision Industry Co. Ltd. Electronic Equipment, Instruments & Components, Taiwan | 2.1 | % | ||
The dollar value, number of shares or principal amount, and names of all portfolio holdings are listed in the Fund’s Statement of Investments (SOI).
2. Investments were made through participatory notes, which are equity access products structured as debt obligations and are issued or backed by banks and broker-dealers and designed to replicate equity market exposure in frontier markets where direct investment is either impossible or difficult due to local investment restrictions.
3. The IT sector comprises electronic equipment, instruments and components; Internet software and services; IT services; semiconductors and semiconductor equipment; software; and technology hardware, storage and peripherals in the SOI. The energy sector comprises oil, gas and consumable fuels in the SOI. The materials sector comprises chemicals, construction materials, metals and mining, and paper and forest products in the SOI. The consumer discretionary sector comprises auto components; automobiles; distributors; hotels, restaurants and leisure; Internet and catalog retail; media; and textiles, apparel and luxury goods in the SOI.
4. “China H” denotes shares of China-incorporated, Hong Kong Stock Exchange-listed companies with most businesses in China.
5. The consumer staples sector comprises beverages, food and staples retailing, food products and personal products in the SOI. The telecommunication services sector comprises diversified telecommunication services and wireless telecommunication services in the SOI. The financials sector comprises banks, capital markets, diversified financial services, insurance, and real estate management and development in the SOI.
| TD-4 | Semiannual Report |
TEMPLETON DEVELOPING MARKETS VIP FUND
The foregoing information reflects our analysis, opinions and portfolio holdings as of June 30, 2016, the end of the reporting period. The way we implement our main investment strategies and the resulting portfolio holdings may change depending on factors such as market and economic conditions. These opinions may not be relied upon as investment advice or an offer for a particular security. The information is not a complete analysis of every aspect of any market, country, industry, security or the Fund. Statements of fact are from sources considered reliable, but the investment manager makes no representation or warranty as to their completeness or accuracy. Although historical performance is no guarantee of future results, these insights may help you understand our investment management philosophy.
| Semiannual Report | TD-5 |
TEMPLETON DEVELOPING MARKETS VIP FUND
Class 4 Fund Expenses
As an investor in a variable insurance contract (Contract) that indirectly provides for investment in an underlying mutual fund, you can incur transaction and/or ongoing expenses at both the Fund level and the Contract level.
| • | Transaction expenses can include sales charges (loads) on purchases, surrender fees, transfer fees and premium taxes. |
| • | Ongoing expenses can include management fees, distribution and service (12b-1) fees, contract fees, annual maintenance fees, mortality and expense risk fees and other fees and expenses. All mutual funds and Contracts have some types of ongoing expenses. |
The expenses shown in the table are meant to highlight ongoing expenses at the Fund level only and do not include ongoing expenses at the Contract level, or transaction expenses at either the Fund or Contract levels. While the Fund does not have transaction expenses, if the transaction and ongoing expenses at the Contract level were included, the expenses shown below would be higher. You should consult your Contract prospectus or disclosure document for more information.
The table shows Fund-level ongoing expenses and can help you understand these expenses and compare them with those of other mutual funds offered through the Contract. The table assumes a $1,000 investment held for the six months indicated. Please refer to the Fund prospectus for additional information on operating expenses.
Actual Fund Expenses
The first line (Actual) of the table provides actual account values and expenses. The “Ending Account Value” is derived from the Fund’s actual return, which includes the effect of ongoing Fund expenses, but does not include the effect of ongoing Contract expenses.
You can estimate the Fund-level expenses you incurred during the period by following these steps. Of course, your account value and expenses will differ from those in this illustration:
| 1. | Divide your account value by $1,000. |
If an account had an $8,600 value, then $8,600 ÷ $1,000 = 8.6.
| 2. | Multiply the result by the number under the heading “Fund-Level Expenses Incurred During Period.” |
If Fund-Level Expenses Incurred During Period were $7.50, then 8.6 × $7.50 = $64.50.
In this illustration, the estimated expenses incurred this period at the Fund level are $64.50.
Hypothetical Example for Comparison with Other Mutual Funds
Information in the second line (Hypothetical) of the table can help you compare ongoing expenses of the Fund with those of other mutual funds offered through the Contract. This information may not be used to estimate the actual ending account balance or expenses you incurred during the period. The hypothetical “Ending Account Value” is based on the Fund’s actual expense ratio and an assumed 5% annual rate of return before expenses, which does not represent the Fund’s actual return. The figure under the heading “Fund-Level Expenses Incurred During Period” shows the hypothetical expenses your account would have incurred under this scenario. You can compare this figure with the 5% hypothetical examples that appear in shareholder reports of other funds offered through a Contract.
| Class 4 | Beginning Account Value 1/1/16 | Ending Account Value 6/30/16 | Fund-Level Expenses 1/1/16–6/30/16 | |||||||||
Actual | $ | 1,000 | $ | 1,104.90 | $ | 8.93 | ||||||
Hypothetical (5% return before expenses) | $ | 1,000 | $ | 1,016.36 | $ | 8.56 | ||||||
*Expenses are calculated using the most recent six-month annualized expense ratio, net of expense waivers, for the Fund’s Class 4 shares (1.71%), which does not include any ongoing expenses of the Contract for which the Fund is an investment option, multiplied by the average account value over the period, multiplied by 182/366 to reflect the one-half year period.
| TD-6 | Semiannual Report |
FRANKLIN TEMPLETON VARIABLE INSURANCE PRODUCTS TRUST
Financial Highlights
Templeton Developing Markets VIP Fund
Six Months Ended (unaudited) | Year Ended December 31, | |||||||||||||||||||||||
| 2015 | 2014 | 2013 | 2012 | 2011 | ||||||||||||||||||||
| Class 1 | ||||||||||||||||||||||||
| Per share operating performance (for a share outstanding throughout the period) | ||||||||||||||||||||||||
Net asset value, beginning of period | $6.37 | $9.27 | $10.26 | $10.58 | $9.50 | $11.40 | ||||||||||||||||||
|
| |||||||||||||||||||||||
| Income from investment operationsa: | ||||||||||||||||||||||||
Net investment incomeb | 0.03 | 0.06 | 0.15 | c | 0.13 | 0.19 | 0.17 | |||||||||||||||||
Net realized and unrealized gains (losses) | 0.65 | (1.63 | ) | (0.97 | ) | (0.22 | ) | 1.06 | (1.94 | ) | ||||||||||||||
|
| |||||||||||||||||||||||
Total from investment operations | 0.68 | (1.57 | ) | (0.82 | ) | (0.09 | ) | 1.25 | (1.77 | ) | ||||||||||||||
|
| |||||||||||||||||||||||
| Less distributions from: | ||||||||||||||||||||||||
Net investment income | (0.08 | ) | (0.20 | ) | (0.17 | ) | (0.23 | ) | (0.17 | ) | (0.13 | ) | ||||||||||||
Net realized gains | — | (1.13 | ) | — | — | — | — | |||||||||||||||||
|
| |||||||||||||||||||||||
Total distributions | (0.08 | ) | (1.33 | ) | (0.17 | ) | (0.23 | ) | (0.17 | ) | (0.13 | ) | ||||||||||||
|
| |||||||||||||||||||||||
Redemption fees | — | — | — | d | — | d | — | d | — | d | ||||||||||||||
|
| |||||||||||||||||||||||
Net asset value, end of period | $6.97 | $6.37 | $9.27 | $10.26 | $10.58 | $9.50 | ||||||||||||||||||
|
| |||||||||||||||||||||||
Total returne | 10.65% | (19.42)% | (8.09)% | (0.73)% | 13.40% | (15.67)% | ||||||||||||||||||
| Ratios to average net assetsf | ||||||||||||||||||||||||
Expenses before waiver and payments by affiliates | 1.38% | 1.33% | 1.36% | 1.35% | 1.35% | 1.40% | ||||||||||||||||||
Expenses net of waiver and payments by affiliates | 1.36% | 1.32% | 1.36% | g | 1.35% | 1.35% | 1.40% | |||||||||||||||||
Net investment income | 1.09% | 0.74% | 1.51% | c | 1.25% | 1.93% | 1.57% | |||||||||||||||||
| Supplemental data | ||||||||||||||||||||||||
Net assets, end of period (000’s) | $81,400 | $77,000 | $114,487 | $145,707 | $203,568 | $232,544 | ||||||||||||||||||
Portfolio turnover rate | 11.14% | 71.69% | 82.87% | 44.59% | 24.45% | 14.90% | ||||||||||||||||||
aThe amount shown for a share outstanding throughout the period may not correlate with the Statement of Operations for the period due to the timing of sales and repurchases of the Fund’s shares in relation to income earned and/or fluctuating fair value of the investments of the Fund.
bBased on average daily shares outstanding.
cNet investment income per share includes approximately $0.04 per share related to income received in the form of special dividends in connection with certain fund holdings. Excluding this amount, the ratio of net investment income to average net assets would have been 1.11%.
dAmount rounds to less than $0.01 per share.
eTotal return does not include fees, charges or expenses imposed by the variable annuity and life insurance contracts for which Franklin Templeton Variable Insurance Products Trust serves as an underlying investment vehicle. Total return is not annualized for periods less than one year.
fRatios are annualized for periods less than one year.
gBenefit of waiver and payments by affiliates rounds to less than 0.01%.
| The accompanying notes are an integral part of these financial statements. | Semiannual Report | TD-7 |
FRANKLIN TEMPLETON VARIABLE INSURANCE PRODUCTS TRUST
FINANCIAL HIGHLIGHTS
Templeton Developing Markets VIP Fund (continued)
Six Months Ended (unaudited) | Year Ended December 31, | |||||||||||||||||||||||
| 2015 | 2014 | 2013 | 2012 | 2011 | ||||||||||||||||||||
| Class 2 | ||||||||||||||||||||||||
Per share operating performance (for a share outstanding throughout the period) | ||||||||||||||||||||||||
Net asset value, beginning of period | $6.32 | $9.20 | $10.19 | $10.50 | $9.42 | $11.30 | ||||||||||||||||||
|
| |||||||||||||||||||||||
| Income from investment operationsa: | ||||||||||||||||||||||||
Net investment incomeb | 0.03 | 0.04 | 0.12 | c | 0.10 | 0.17 | 0.14 | |||||||||||||||||
Net realized and unrealized gains (losses) | 0.64 | (1.61 | ) | (0.96 | ) | (0.21 | ) | 1.05 | (1.92 | ) | ||||||||||||||
|
| |||||||||||||||||||||||
Total from investment operations | 0.67 | (1.57 | ) | (0.84 | ) | (0.11 | ) | 1.22 | (1.78 | ) | ||||||||||||||
|
| |||||||||||||||||||||||
| Less distributions from: | ||||||||||||||||||||||||
Net investment income | (0.06 | ) | (0.18 | ) | (0.15 | ) | (0.20 | ) | (0.14 | ) | (0.10 | ) | ||||||||||||
Net realized gains | — | (1.13 | ) | — | — | — | — | |||||||||||||||||
|
| |||||||||||||||||||||||
Total distributions | (0.06 | ) | (1.31 | ) | (0.15 | ) | (0.20 | ) | (0.14 | ) | (0.10 | ) | ||||||||||||
|
| |||||||||||||||||||||||
Redemption fees | — | — | — | d | — | d | — | d | — | d | ||||||||||||||
|
| |||||||||||||||||||||||
Net asset value, end of period | $6.93 | $6.32 | $9.20 | $10.19 | $10.50 | $9.42 | ||||||||||||||||||
|
| |||||||||||||||||||||||
Total returne | 10.58% | (19.60)% | (8.39)% | (0.92)% | 13.16% | (15.86)% | ||||||||||||||||||
| Ratios to average net assetsf | ||||||||||||||||||||||||
Expenses before waiver and payments by affiliates | 1.63% | 1.58% | 1.61% | 1.60% | 1.60% | 1.65% | ||||||||||||||||||
Expenses net of waiver and payments by affiliates | 1.61% | 1.57% | 1.61% | g | 1.60% | 1.60% | 1.65% | |||||||||||||||||
Net investment income | 0.84% | 0.49% | 1.26% | c | 1.00% | 1.68% | 1.32% | |||||||||||||||||
| Supplemental data | ||||||||||||||||||||||||
Net assets, end of period (000’s) | $209,100 | $192,120 | $250,813 | $274,683 | $291,638 | $295,223 | ||||||||||||||||||
Portfolio turnover rate | 11.14% | 71.69% | 82.87% | 44.59% | 24.45% | 14.90% | ||||||||||||||||||
aThe amount shown for a share outstanding throughout the period may not correlate with the Statement of Operations for the period due to the timing of sales and repurchases of the Fund’s shares in relation to income earned and/or fluctuating fair value of the investments of the Fund.
bBased on average daily shares outstanding.
cNet investment income per share includes approximately $0.04 per share related to income received in the form of special dividends in connection with certain fund holdings. Excluding this amount, the ratio of net investment income to average net assets would have been 0.86%.
dAmount rounds to less than $0.01 per share.
eTotal return does not include fees, charges or expenses imposed by the variable annuity and life insurance contracts for which Franklin Templeton Variable Insurance Products Trust serves as an underlying investment vehicle. Total return is not annualized for periods less than one year.
fRatios are annualized for periods less than one year.
gBenefit of waiver and payments by affiliates rounds to less than 0.01%.
| TD-8 | Semiannual Report | The accompanying notes are an integral part of these financial statements. |
FRANKLIN TEMPLETON VARIABLE INSURANCE PRODUCTS TRUST
FINANCIAL HIGHLIGHTS
Templeton Developing Markets VIP Fund (continued)
Six Months Ended (unaudited) | Year Ended December 31, | |||||||||||||||||||||||
| 2015 | 2014 | 2013 | 2012 | 2011 | ||||||||||||||||||||
| Class 4 | ||||||||||||||||||||||||
| Per share operating performance (for a share outstanding throughout the period) | ||||||||||||||||||||||||
Net asset value, beginning of period | $6.34 | $9.22 | $10.20 | $10.50 | $9.42 | $11.30 | ||||||||||||||||||
|
| |||||||||||||||||||||||
| Income from investment operationsa: | ||||||||||||||||||||||||
Net investment incomeb | 0.02 | 0.03 | 0.12 | c | 0.10 | 0.16 | 0.13 | |||||||||||||||||
Net realized and unrealized gains (losses) | 0.64 | (1.62 | ) | (0.97 | ) | (0.21 | ) | 1.04 | (1.91 | ) | ||||||||||||||
|
| |||||||||||||||||||||||
Total from investment operations | 0.66 | (1.59 | ) | (0.85 | ) | (0.11 | ) | 1.20 | (1.78 | ) | ||||||||||||||
|
| |||||||||||||||||||||||
| Less distributions from: | ||||||||||||||||||||||||
Net investment income | (0.04 | ) | (0.16 | ) | (0.13 | ) | (0.19 | ) | (0.12 | ) | (0.10 | ) | ||||||||||||
Net realized gains | — | (1.13 | ) | — | — | — | — | |||||||||||||||||
|
| |||||||||||||||||||||||
Total distributions | (0.04 | ) | (1.29 | ) | (0.13 | ) | (0.19 | ) | (0.12 | ) | (0.10 | ) | ||||||||||||
|
| |||||||||||||||||||||||
Redemption fees | — | — | — | d | — | d | — | d | — | d | ||||||||||||||
|
| |||||||||||||||||||||||
Net asset value, end of period | $6.96 | $6.34 | $9.22 | $10.20 | $10.50 | $9.42 | ||||||||||||||||||
|
| |||||||||||||||||||||||
Total returne | 10.49% | (19.70)% | (8.48)% | (1.07)% | 13.06% | (15.88)% | ||||||||||||||||||
| Ratios to average net assetsf | ||||||||||||||||||||||||
Expenses before waiver and payments by affiliates | 1.73% | 1.68% | 1.71% | 1.70% | 1.70% | 1.75% | ||||||||||||||||||
Expenses net of waiver and payments by affiliates | 1.71% | 1.67% | 1.71% | g | 1.70% | 1.70% | 1.75% | |||||||||||||||||
Net investment income | 0.74% | 0.39% | 1.16% | c | 0.90% | 1.58% | 1.22% | |||||||||||||||||
| Supplemental data | ||||||||||||||||||||||||
Net assets, end of period (000’s) | $6,872 | $7,109 | $11,106 | $15,225 | $23,341 | $24,380 | ||||||||||||||||||
Portfolio turnover rate | 11.14% | 71.69% | 82.87% | 44.59% | 24.45% | 14.90% | ||||||||||||||||||
aThe amount shown for a share outstanding throughout the period may not correlate with the Statement of Operations for the period due to the timing of sales and repurchases of the Fund’s shares in relation to income earned and/or fluctuating fair value of the investments of the Fund.
bBased on average daily shares outstanding.
cNet investment income per share includes approximately $0.04 per share related to income received in the form of special dividends in connection with certain fund holdings. Excluding this amount, the ratio of net investment income to average net assets would have been 0.76%.
dAmount rounds to less than $0.01 per share.
eTotal return does not include fees, charges or expenses imposed by the variable annuity and life insurance contracts for which Franklin Templeton Variable Insurance Products Trust serves as an underlying investment vehicle. Total return is not annualized for periods less than one year.
fRatios are annualized for periods less than one year.
gBenefit of waiver and payments by affiliates rounds to less than 0.01%.
| The accompanying notes are an integral part of these financial statements. | Semiannual Report | TD-9 |
FRANKLIN TEMPLETON VARIABLE INSURANCE PRODUCTS TRUST
Statement of Investments, June 30, 2016 (unaudited)
| Templeton Developing Markets VIP Fund | ||||||||||||||
| Industry | Shares | Value | ||||||||||||
Common Stocks 86.8% | ||||||||||||||
Argentina 0.3% | ||||||||||||||
| a | Grupo Clarin SA, B, GDR, Reg S | Media | 9,190 | $ | 182,881 | |||||||||
MercadoLibre Inc. | Internet Software & Services | 5,600 | 787,753 | |||||||||||
|
| |||||||||||||
| 970,634 | ||||||||||||||
|
| |||||||||||||
Belgium 1.4% | ||||||||||||||
Anheuser-Busch InBev NV | Beverages | 31,970 | 4,173,048 | |||||||||||
|
| |||||||||||||
Brazil 2.4% | ||||||||||||||
CETIP SA - Mercados Organizados | Capital Markets | 160,600 | 2,190,045 | |||||||||||
Duratex SA | Paper & Forest Products | 175,743 | 465,189 | |||||||||||
M Dias Branco SA | Food Products | 72,900 | 2,404,120 | |||||||||||
Mahle-Metal Leve SA Industria e Comercio | Auto Components | 132,600 | 947,674 | |||||||||||
Totvs SA | Software | 112,200 | 1,067,074 | |||||||||||
|
| |||||||||||||
| 7,074,102 | ||||||||||||||
|
| |||||||||||||
Cambodia 1.1% | ||||||||||||||
NagaCorp Ltd. | Hotels, Restaurants & Leisure | 4,824,000 | 3,208,352 | |||||||||||
|
| |||||||||||||
China 17.7% | ||||||||||||||
| b | Alibaba Group Holding Ltd., ADR | Internet Software & Services | 36,690 | 2,917,956 | ||||||||||
| b | Baidu Inc., ADR | Internet Software & Services | 33,200 | 5,482,980 | ||||||||||
Brilliance China Automotive Holdings Ltd. | Automobiles | 8,909,300 | 9,083,330 | |||||||||||
China Life Insurance Co. Ltd., H | Insurance | 855,000 | 1,831,564 | |||||||||||
China Mobile Ltd. | Wireless Telecommunication Services | 550,500 | 6,297,247 | |||||||||||
China Petroleum and Chemical Corp., H | Oil, Gas & Consumable Fuels | 8,024,000 | 5,781,330 | |||||||||||
COSCO Pacific Ltd. | Transportation Infrastructure | 1,046,200 | 1,038,318 | |||||||||||
Dah Chong Hong Holdings Ltd. | Distributors | 1,746,100 | 821,461 | |||||||||||
NetEase Inc., ADR | Internet Software & Services | 20,103 | 3,884,302 | |||||||||||
Poly Culture Group Corp. Ltd., H | Media | 229,200 | 529,983 | |||||||||||
Tencent Holdings Ltd. | Internet Software & Services | 522,100 | 11,863,997 | |||||||||||
Uni-President China Holdings Ltd. | Food Products | 3,563,300 | 2,994,505 | |||||||||||
|
| |||||||||||||
| 52,526,973 | ||||||||||||||
|
| |||||||||||||
Hong Kong 3.2% | ||||||||||||||
Dairy Farm International Holdings Ltd. | Food & Staples Retailing | 454,133 | 3,060,856 | |||||||||||
MGM China Holdings Ltd. | Hotels, Restaurants & Leisure | 2,612,800 | 3,381,154 | |||||||||||
Sands China Ltd. | Hotels, Restaurants & Leisure | 936,000 | 3,124,645 | |||||||||||
|
| |||||||||||||
| 9,566,655 | ||||||||||||||
|
| |||||||||||||
Hungary 1.0% | ||||||||||||||
Richter Gedeon Nyrt | Pharmaceuticals | 145,180 | 2,884,456 | |||||||||||
|
| |||||||||||||
India 10.3% | ||||||||||||||
Bajaj Holdings and Investment Ltd. | Diversified Financial Services | 25,190 | 621,374 | |||||||||||
Biocon Ltd. | Biotechnology | 476,812 | 5,235,454 | |||||||||||
Dr. Reddy’s Laboratories Ltd. | Pharmaceuticals | 84,890 | 4,252,687 | |||||||||||
Glenmark Pharmaceuticals Ltd. | Pharmaceuticals | 91,248 | 1,080,113 | |||||||||||
ICICI Bank Ltd. | Banks | 1,348,450 | 4,805,206 | |||||||||||
Infosys Ltd. | IT Services | 183,099 | 3,175,707 | |||||||||||
Oil & Natural Gas Corp. Ltd. | Oil, Gas & Consumable Fuels | 722,700 | 2,315,722 | |||||||||||
Reliance Industries Ltd. | Oil, Gas & Consumable Fuels | 206,000 | 2,957,536 | |||||||||||
Tata Chemicals Ltd. | Chemicals | 238,500 | 1,520,661 | |||||||||||
Tata Consultancy Services Ltd. | IT Services | 97,300 | 3,680,039 | |||||||||||
| b | Tata Motors Ltd., A | Automobiles | 252,016 | 1,089,208 | ||||||||||
|
| |||||||||||||
| 30,733,707 | ||||||||||||||
|
| |||||||||||||
| TD-10 | Semiannual Report |
FRANKLIN TEMPLETON VARIABLE INSURANCE PRODUCTS TRUST
STATEMENT OF INVESTMENTS (UNAUDITED)
Templeton Developing Markets VIP Fund (continued)
| Industry | Shares | Value | ||||||||||||
Common Stocks (continued) | ||||||||||||||
Indonesia 3.1% | ||||||||||||||
Astra International Tbk PT | Automobiles | 10,115,100 | $ | 5,665,222 | ||||||||||
Bank Danamon Indonesia Tbk PT | Banks | 5,707,000 | 1,529,066 | |||||||||||
Semen Indonesia (Persero) Tbk PT | Construction Materials | 2,764,700 | 1,956,476 | |||||||||||
|
| |||||||||||||
| 9,150,764 | ||||||||||||||
|
| |||||||||||||
Mexico 0.6% | ||||||||||||||
America Movil SAB de CV, L, ADR | Wireless Telecommunication Services | 82,000 | 1,005,320 | |||||||||||
Nemak SAB de CV | Auto Components | 652,700 | 764,463 | |||||||||||
| b | Telesites SAB de CV | Diversified Telecommunication Services | 82,000 | 50,690 | ||||||||||
|
| |||||||||||||
| 1,820,473 | ||||||||||||||
|
| |||||||||||||
Nigeria 0.0%† | ||||||||||||||
Nigerian Breweries PLC | Beverages | 167,352 | 79,635 | |||||||||||
|
| |||||||||||||
Pakistan 1.0% | ||||||||||||||
Habib Bank Ltd. | Banks | 1,550,000 | 2,915,036 | |||||||||||
|
| |||||||||||||
Peru 0.1% | ||||||||||||||
| b | Compania de Minas Buenaventura SA, ADR | Metals & Mining | 29,800 | 356,110 | ||||||||||
|
| |||||||||||||
Philippines 0.4% | ||||||||||||||
| b | Bloomberry Resorts Corp. | Hotels, Restaurants & Leisure | 9,038,300 | 1,274,135 | ||||||||||
|
| |||||||||||||
Russia 3.3% | ||||||||||||||
LUKOIL PJSC, ADR | Oil, Gas & Consumable Fuels | 41,300 | 1,725,101 | |||||||||||
LUKOIL PJSC, ADR (London Stock Exchange). | Oil, Gas & Consumable Fuels | 38,600 | 1,612,322 | |||||||||||
| a,b | Mail.ru Group Ltd., GDR, Reg S | Internet Software & Services | 170,359 | 3,100,534 | ||||||||||
| b | Yandex NV, A | Internet Software & Services | 150,078 | 3,279,204 | ||||||||||
|
| |||||||||||||
| 9,717,161 | ||||||||||||||
|
| |||||||||||||
Singapore 0.1% | ||||||||||||||
DBS Group Holdings Ltd. | Banks | 25,196 | 294,828 | |||||||||||
|
| |||||||||||||
South Africa 8.5% | ||||||||||||||
Massmart Holdings Ltd. | Food & Staples Retailing | 190,769 | 1,632,387 | |||||||||||
MTN Group Ltd. | Wireless Telecommunication Services | 317,596 | 3,082,568 | |||||||||||
Naspers Ltd., N | Media | 97,448 | 14,823,942 | |||||||||||
Remgro Ltd. | Diversified Financial Services | 331,043 | 5,725,189 | |||||||||||
|
| |||||||||||||
| 25,264,086 | ||||||||||||||
|
| |||||||||||||
South Korea 12.5% | ||||||||||||||
Daelim Industrial Co. Ltd. | Construction & Engineering | 38,487 | 2,537,443 | |||||||||||
Fila Korea Ltd. | Textiles, Apparel & Luxury Goods | 33,470 | 2,639,297 | |||||||||||
Hankook Tire Co. Ltd. | Auto Components | 21,600 | 955,636 | |||||||||||
Hanon Systems | Auto Components | 196,951 | 1,793,974 | |||||||||||
Hyundai Development Co. | Construction & Engineering | 113,940 | 3,909,231 | |||||||||||
iMarketkorea Inc. | Trading Companies & Distributors | 70,490 | 709,340 | |||||||||||
Interpark Holdings Corp. | Internet & Catalog Retail | 112,922 | 583,839 | |||||||||||
KT Skylife Co. Ltd. | Media | 176,060 | 2,474,254 | |||||||||||
Samsung Electronics Co. Ltd. | Technology Hardware, Storage & Peripherals | 12,667 | 15,658,757 | |||||||||||
SK Hynix Inc. | Semiconductors & Semiconductor Equipment | 185,090 | 5,202,315 | |||||||||||
Youngone Corp. | Textiles, Apparel & Luxury Goods | 22,200 | 797,300 | |||||||||||
|
| |||||||||||||
| 37,261,386 | ||||||||||||||
|
| |||||||||||||
Taiwan 9.9% | ||||||||||||||
Catcher Technology Co. Ltd. | Technology Hardware, Storage & Peripherals | 308,000 | 2,271,386 | |||||||||||
| Semiannual Report | TD-11 |
FRANKLIN TEMPLETON VARIABLE INSURANCE PRODUCTS TRUST
STATEMENT OF INVESTMENTS (UNAUDITED)
Templeton Developing Markets VIP Fund (continued)
| Industry | Shares | Value | ||||||||||||
Common Stocks (continued) | ||||||||||||||
Taiwan (continued) | ||||||||||||||
Hon Hai Precision Industry Co. Ltd. | Electronic Equipment, Instruments & Components | 2,455,000 | $ | 6,289,008 | ||||||||||
Largan Precision Co. Ltd. | Electronic Equipment, Instruments & Components | 14,000 | 1,280,236 | |||||||||||
Pegatron Corp. | Technology Hardware, Storage & Peripherals | 973,800 | 2,050,105 | |||||||||||
Taiwan Semiconductor Manufacturing Co. Ltd. | Semiconductors & Semiconductor Equipment | 3,483,000 | 17,574,523 | |||||||||||
|
| |||||||||||||
| 29,465,258 | ||||||||||||||
|
| |||||||||||||
Thailand 4.7% | ||||||||||||||
Kasikornbank PCL, fgn. | Banks | 604,100 | 2,967,177 | |||||||||||
Kiatnakin Bank PCL, fgn. | Banks | 1,009,800 | 1,250,749 | |||||||||||
Land and Houses PCL, fgn. | Real Estate Management & Development | 4,853,900 | 1,250,791 | |||||||||||
PTT Exploration and Production PCL, fgn. | Oil, Gas & Consumable Fuels | 584,500 | 1,393,846 | |||||||||||
Siam Commercial Bank PCL, fgn. | Banks | 306,400 | 1,212,688 | |||||||||||
Thai Beverage PCL, fgn. | Beverages | 8,564,600 | 5,786,677 | |||||||||||
|
| |||||||||||||
| 13,861,928 | ||||||||||||||
|
| |||||||||||||
United Kingdom 5.2% | ||||||||||||||
Unilever PLC | Personal Products | 321,139 | 15,325,519 | |||||||||||
|
| |||||||||||||
Total Common Stocks (Cost $240,029,348) | 257,924,246 | |||||||||||||
|
| |||||||||||||
| c | Participatory Notes 1.0% | |||||||||||||
Saudi Arabia 1.0% | ||||||||||||||
| d | Deutsche Bank AG/London, Samba Financial Group, 144A, 9/27/16 | Banks | 143,055 | 762,766 | ||||||||||
| d | HSBC Bank PLC, | |||||||||||||
Saudi Basic Industries Corp., 144A, 10/31/16 | Chemicals | 102,390 | 2,211,064 | |||||||||||
Savola Al-Azizia United Co., 144A, 2/06/17 | Food Products | 2,500 | 24,394 | |||||||||||
|
| |||||||||||||
Total Participatory Notes (Cost $3,135,038) | 2,998,224 | |||||||||||||
|
| |||||||||||||
Preferred Stocks 5.8% | ||||||||||||||
Brazil 5.8% | ||||||||||||||
| e | Banco Bradesco SA, 4.4%, ADR, pfd. | Banks | 1,054,850 | 8,238,378 | ||||||||||
| e | Itau Unibanco Holding SA, 3.8%, ADR, pfd. | Banks | 964,711 | 9,106,872 | ||||||||||
|
| |||||||||||||
Total Preferred Stocks (Cost $13,340,627) | 17,345,250 | |||||||||||||
|
| |||||||||||||
Total Investments before Short Term Investments (Cost $256,505,013) | 278,267,720 | |||||||||||||
|
| |||||||||||||
| TD-12 | Semiannual Report |
FRANKLIN TEMPLETON VARIABLE INSURANCE PRODUCTS TRUST
STATEMENT OF INVESTMENTS (UNAUDITED)
Templeton Developing Markets VIP Fund (continued)
| Shares | Value | |||||||||
Short Term Investments (Cost $19,660,526) 6.6% | ||||||||||
Money Market Funds 6.6% | ||||||||||
United States 6.6% | ||||||||||
| b,f | Institutional Fiduciary Trust Money Market Portfolio | 19,660,526 | $ | 19,660,526 | ||||||
|
| |||||||||
Total Investments (Cost $276,165,539) 100.2% | 297,928,246 | |||||||||
Other Assets, less Liabilities (0.2)% | (555,483 | ) | ||||||||
|
| |||||||||
Net Assets 100.0% | $ | 297,372,763 | ||||||||
|
| |||||||||
See Abbreviations on page TD-24.
†Rounds to less than 0.1% of net assets.
aSecurity was purchased pursuant to Regulation S under the Securities Act of 1933, which exempts from registration securities offered and sold outside of the United States. Such a security cannot be sold in the United States without either an effective registration statement filed pursuant to the Securities Act of 1933, or pursuant to an exemption from registration. These securities have been deemed liquid under guidelines approved by the Trust’s Board of Trustees. At June 30, 2016, the aggregate value of these securities was $3,283,415, representing 1.1% of net assets.
bNon-income producing.
cSee Note 1(c) regarding Participatory Notes.
dSecurity was purchased pursuant to Rule 144A under the Securities Act of 1933 and may be sold in transactions exempt from registration only to qualified institutional buyers or in a public offering registered under the Securities Act of 1933. These securities have been deemed liquid under guidelines approved by the Trust’s Board of Trustees. At June 30, 2016, the aggregate value of these securities was $2,998,224, representing 1.0% of net assets.
eVariable rate security. The rate shown represents the yield at period end.
fSee Note 3(e) regarding investments in affiliated management investment companies.
| The accompanying notes are an integral part of these financial statements. | Semiannual Report | TD-13 |
FRANKLIN TEMPLETON VARIABLE INSURANCE PRODUCTS TRUST
Financial Statements
Statement of Assets and Liabilities
June 30, 2016 (unaudited)
| Templeton Developing Markets VIP Fund | ||||
Assets: | ||||
Investments in securities: | ||||
Cost - Unaffiliated issuers | $ | 256,505,013 | ||
Cost - Non-controlled affiliates (Note 3e) | 19,660,526 | |||
|
| |||
Total cost of investments | $ | 276,165,539 | ||
|
| |||
Value - Unaffiliated issuers | $ | 278,267,720 | ||
Value - Non-controlled affiliates (Note 3e) | 19,660,526 | |||
|
| |||
Total value of investments | 297,928,246 | |||
Cash | 66,447 | |||
Foreign currency, at value (cost $145,410) | 145,191 | |||
Receivables: | ||||
Investment securities sold | 631,136 | |||
Capital shares sold | 48,269 | |||
Dividends | 942,318 | |||
Foreign tax | 51,726 | |||
Other assets | 122 | |||
|
| |||
Total assets | 299,813,455 | |||
|
| |||
Liabilities: | ||||
Payables: | ||||
Investment securities purchased | 1,404,468 | |||
Capital shares redeemed | 356,909 | |||
Management fees | 290,870 | |||
Distribution fees | 86,818 | |||
Deferred tax | 181,511 | |||
Accrued expenses and other liabilities | 120,116 | |||
|
| |||
Total liabilities | 2,440,692 | |||
|
| |||
Net assets, at value | $ | 297,372,763 | ||
|
| |||
Net assets consist of: | ||||
Paid-in capital | $ | 324,511,157 | ||
Distributions in excess of net investment income | (4,380,311 | ) | ||
Net unrealized appreciation (depreciation) | 21,535,884 | |||
Accumulated net realized gain (loss) | (44,293,967 | ) | ||
|
| |||
Net assets, at value | $ | 297,372,763 | ||
|
| |||
| TD-14 | Semiannual Report | The accompanying notes are an integral part of these financial statements. |
FRANKLIN TEMPLETON VARIABLE INSURANCE PRODUCTS TRUST
FINANCIAL STATEMENTS
Statement of Assets and Liabilities (continued)
June 30, 2016 (unaudited)
| Templeton Developing Markets VIP Fund | ||||
| Class 1: | ||||
Net assets, at value | $ | 81,400,243 | ||
|
| |||
Shares outstanding | 11,675,684 | |||
|
| |||
Net asset value and maximum offering price per share | $ | 6.97 | ||
|
| |||
| Class 2: | ||||
Net assets, at value | $ | 209,100,296 | ||
|
| |||
Shares outstanding | 30,194,223 | |||
|
| |||
Net asset value and maximum offering price per share | $ | 6.93 | ||
|
| |||
| Class 4: | ||||
Net assets, at value | $ | 6,872,224 | ||
|
| |||
Shares outstanding | 987,522 | |||
|
| |||
Net asset value and maximum offering price per share | $ | 6.96 | ||
|
| |||
| The accompanying notes are an integral part of these financial statements. | Semiannual Report | TD-15 |
FRANKLIN TEMPLETON VARIABLE INSURANCE PRODUCTS TRUST
FINANCIAL STATEMENTS
Statement of Operations
for the six months ended June 30, 2016 (unaudited)
| Templeton Developing Markets VIP Fund | ||||
Investment income: | ||||
Dividends (net of foreign taxes of $512,365) | $ | 3,333,470 | ||
|
| |||
Expenses: | ||||
Management fees (Note 3a) | 1,695,727 | |||
Distribution fees: (Note 3c) | ||||
Class 2 | 238,127 | |||
Class 4 | 11,849 | |||
Custodian fees (Note 4) | 36,749 | |||
Reports to shareholdersr | 107,600 | |||
Professional fees | 32,423 | |||
Trustees’ fees and expenses | 747 | |||
Other | 9,497 | |||
|
| |||
Total expenses | 2,132,719 | |||
Expenses waived/paid by affiliates (Note 3e) | (35,065 | ) | ||
|
| |||
Net expenses | 2,097,654 | |||
|
| |||
Net investment income | 1,235,816 | |||
|
| |||
Realized and unrealized gains (losses): | ||||
Net realized gain (loss) from: | ||||
Investments | 3,017,201 | |||
Foreign currency transactions | 17,003 | |||
|
| |||
Net realized gain (loss) | 3,034,204 | |||
|
| |||
Net change in unrealized appreciation (depreciation) on: | ||||
Investments | 23,613,299 | |||
Translation of other assets and liabilities denominated in foreign currencies | (5,840 | ) | ||
Change in deferred taxes on unrealized appreciation | (61,659 | ) | ||
|
| |||
Net change in unrealized appreciation (depreciation) | 23,545,800 | |||
|
| |||
Net realized and unrealized gain (loss) | 26,580,004 | |||
|
| |||
Net increase (decrease) in net assets resulting from operations | $ | 27,815,820 | ||
|
| |||
| TD-16 | Semiannual Report | The accompanying notes are an integral part of these financial statements. |
FRANKLIN TEMPLETON VARIABLE INSURANCE PRODUCTS TRUST
FINANCIAL STATEMENTS
Statements of Changes in Net Assets
| Templeton Developing Markets VIP Fund | ||||||||
| Six Months Ended June 30, 2016 (unaudited) | Year Ended December 31, 2015 | |||||||
Increase (decrease) in net assets: | ||||||||
Operations: | ||||||||
Net investment income | $ | 1,235,816 | $ | 1,869,006 | ||||
Net realized gain (loss) | 3,034,204 | (40,238,876 | ) | |||||
Net change in unrealized appreciation (depreciation) | 23,545,800 | (29,184,006 | ) | |||||
|
| |||||||
Net increase (decrease) in net assets resulting from operations | 27,815,820 | (67,553,876 | ) | |||||
|
| |||||||
Distributions to shareholders from: | ||||||||
Net investment income: | ||||||||
Class 1 | (875,960 | ) | (2,280,023 | ) | ||||
Class 2 | (1,674,699 | ) | (4,605,588 | ) | ||||
Class 4 | (44,436 | ) | (178,865 | ) | ||||
Net realized gains: | ||||||||
Class 1 | — | (12,555,712 | ) | |||||
Class 2 | — | (29,329,089 | ) | |||||
Class 4 | — | (1,242,906 | ) | |||||
|
| |||||||
Total distributions to shareholders | (2,595,095 | ) | (50,192,183 | ) | ||||
|
| |||||||
Capital share transactions: (Note 2) | ||||||||
Class 1 | (2,381,952 | ) | (3,228,881 | ) | ||||
Class 2 | (833,043 | ) | 21,548,017 | |||||
Class 4 | (862,694 | ) | (748,959 | ) | ||||
|
| |||||||
Total capital share transactions | (4,077,689 | ) | 17,570,177 | |||||
|
| |||||||
Net increase (decrease) in net assets | 21,143,036 | (100,175,882 | ) | |||||
Net assets: | ||||||||
Beginning of period | 276,229,727 | 376,405,609 | ||||||
|
| |||||||
End of period | $ | 297,372,763 | $ | 276,229,727 | ||||
|
| |||||||
Distributions in excess of net investment income included in net assets: | ||||||||
End of period | $ | (4,380,311 | ) | $ | (3,021,032 | ) | ||
|
| |||||||
| The accompanying notes are an integral part of these financial statements. | Semiannual Report | TD-17 |
FRANKLIN TEMPLETON VARIABLE INSURANCE PRODUCTS TRUST
Notes to Financial Statements (unaudited)
Templeton Developing Markets VIP Fund
1. Organization and Significant Accounting Policies
Franklin Templeton Variable Insurance Products Trust (Trust) is registered under the Investment Company Act of 1940 (1940 Act) as an open-end management investment company, consisting of nineteen separate funds and applies the specialized accounting and reporting guidance in U.S. Generally Accepted Accounting Principles (U.S. GAAP). Templeton Developing Markets VIP Fund (Fund) is included in this report. The financial statements of the remaining funds in the Trust are presented separately. Shares of the Fund are generally sold only to insurance company separate accounts to fund the benefits of variable life insurance policies or variable annuity contracts. The Fund offers three classes of shares: Class 1, Class 2 and Class 4. Each class of shares differs by its distribution fees, voting rights on matters affecting a single class and its exchange privilege.
The following summarizes the Fund’s significant accounting policies.
a. Financial Instrument Valuation
The Fund’s investments in financial instruments are carried at fair value daily. Fair value is the price that would be received to sell an asset or paid to transfer a liability in an orderly transaction between market participants on the measurement date. The Fund calculates the net asset value (NAV) per share as of 4 p.m. Eastern time each day the New York Stock Exchange (NYSE) is open for trading. Under compliance policies and procedures approved by the Trust’s Board of Trustees (the Board), the Fund’s administrator has responsibility for oversight of valuation, including leading the cross-functional Valuation Committee (VC). The VC provides administration and oversight of the Fund’s valuation policies and procedures, which are approved annually by the Board. Among other things, these procedures allow the Fund to utilize independent pricing services, quotations from securities and financial instrument dealers, and other market sources to determine fair value.
Equity securities listed on an exchange or on the NASDAQ National Market System are valued at the last quoted sale price or the official closing price of the day, respectively. Foreign equity securities are valued as of the close of trading on the foreign stock exchange on which the security is primarily traded or as of 4 p.m. Eastern time whichever is earlier. The value is then converted into its U.S. dollar equivalent at the foreign exchange rate in effect at 4 p.m. Eastern time on the day that the value of the security is determined. Over-the-counter (OTC)
securities are valued within the range of the most recent quoted bid and ask prices. Securities that trade in multiple markets or on multiple exchanges are valued according to the broadest and most representative market. Certain equity securities are valued based upon fundamental characteristics or relationships to similar securities.
Investments in open-end mutual funds are valued at the closing NAV.
The Fund has procedures to determine the fair value of financial instruments for which market prices are not reliable or readily available. Under these procedures, the VC convenes on a regular basis to review such financial instruments and considers a number of factors, including significant unobservable valuation inputs, when arriving at fair value. The VC primarily employs a market-based approach which may use related or comparable assets or liabilities, recent transactions, market multiples, book values, and other relevant information for the investment to determine the fair value of the investment. An income-based valuation approach may also be used in which the anticipated future cash flows of the investment are discounted to calculate fair value. Discounts may also be applied due to the nature or duration of any restrictions on the disposition of the investments. Due to the inherent uncertainty of valuations of such investments, the fair values may differ significantly from the values that would have been used had an active market existed. The VC employs various methods for calibrating these valuation approaches including a regular review of key inputs and assumptions, transactional back-testing or disposition analysis, and reviews of any related market activity.
Trading in securities on foreign securities stock exchanges and OTC markets may be completed before 4 p.m. Eastern time. In addition, trading in certain foreign markets may not take place on every NYSE business day. Occasionally, events occur between the time at which trading in a foreign security is completed and the close of the NYSE that might call into question the reliability of the value of a portfolio security held by the Fund. As a result, differences may arise between the value of the Fund’s portfolio securities as determined at the foreign market close and the latest indications of value at the close of the NYSE. In order to minimize the potential for these differences, the VC monitors price movements following the close of trading in foreign stock markets through a series of country specific market proxies (such as baskets of American Depositary Receipts, futures contracts and exchange traded funds).
| TD-18 | Semiannual Report |
FRANKLIN TEMPLETON VARIABLE INSURANCE PRODUCTS TRUST
NOTES TO FINANCIAL STATEMENTS (UNAUDITED)
Templeton Developing Markets VIP Fund (continued)
These price movements are measured against established trigger thresholds for each specific market proxy to assist in determining if an event has occurred that may call into question the reliability of the values of the foreign securities held by the Fund. If such an event occurs, the securities may be valued using fair value procedures, which may include the use of independent pricing services.
When the last day of the reporting period is a non-business day, certain foreign markets may be open on those days that the NYSE is closed, which could result in differences between the value of the Fund’s portfolio securities on the last business day and the last calendar day of the reporting period. Any significant security valuation changes due to an open foreign market are adjusted and reflected by the Fund for financial reporting purposes.
b. Foreign Currency Translation
Portfolio securities and other assets and liabilities denominated in foreign currencies are translated into U.S. dollars based on the exchange rate of such currencies against U.S. dollars on the date of valuation. The Fund may enter into foreign currency exchange contracts to facilitate transactions denominated in a foreign currency. Purchases and sales of securities, income and expense items denominated in foreign currencies are translated into U.S. dollars at the exchange rate in effect on the transaction date. Portfolio securities and assets and liabilities denominated in foreign currencies contain risks that those currencies will decline in value relative to the U.S. dollar. Occasionally, events may impact the availability or reliability of foreign exchange rates used to convert the U.S. dollar equivalent value. If such an event occurs, the foreign exchange rate will be valued at fair value using procedures established and approved by the Board.
The Fund does not separately report the effect of changes in foreign exchange rates from changes in market prices on securities held. Such changes are included in net realized and unrealized gain or loss from investments in the Statement of Operations.
Realized foreign exchange gains or losses arise from sales of foreign currencies, currency gains or losses realized between the trade and settlement dates on securities transactions and the difference between the recorded amounts of dividends, interest, and foreign withholding taxes and the U.S. dollar equivalent of the amounts actually received or paid. Net unrealized foreign exchange gains and losses arise from changes in foreign
exchange rates on foreign denominated assets and liabilities other than investments in securities held at the end of the reporting period.
c. Participatory Notes
The Fund invests in Participatory Notes (P-Notes). P-notes are promissory notes that are designed to offer a return linked to the performance of a particular underlying equity security or market. P-Notes are issued by banks or broker-dealers and allow the Fund to gain exposure to common stocks in markets where direct investment is not allowed. Income received from P-Notes is recorded as dividend income in the Statement of Operations. P-Notes may contain various risks including the potential inability of the counterparty to fulfill their obligations under the terms of the contract. These securities may be more volatile and less liquid than other investments held by the Fund.
d. Securities Lending
The Fund participates in an agency based securities lending program to earn additional income. The Fund receives cash collateral against the loaned securities in an amount equal to at least 102% of the fair value of the loaned securities. Collateral is maintained over the life of the loan in an amount not less than 100% of the fair value of loaned securities, as determined at the close of Fund business each day; any additional collateral required due to changes in security values is delivered to the Fund on the next business day. The collateral is deposited into a joint cash account with other funds and is used to invest in a money market fund managed by Franklin Advisers, Inc., an affiliate of the Fund. The Fund may receive income from the investment of cash collateral, in addition to lending fees and rebates paid by the borrower. Income from securities loaned, net of fees paid to the securities lending agent and/or third-party vendor, is reported separately in the Statement of Operations. The Fund bears the market risk with respect to the collateral investment, securities loaned, and the risk that the agent may default on its obligations to the Fund. If the borrower defaults on its obligation to return the securities loaned, the Fund has the right to repurchase the securities in the open market using the collateral received. The securities lending agent has agreed to indemnify the Fund in the event of default by a third party borrower. At June 30, 2016, the Fund had no securities on loan.
e. Income and Deferred Taxes
It is the Fund’s policy to qualify as a regulated investment company under the Internal Revenue Code. The Fund intends to
| Semiannual Report | TD-19 |
FRANKLIN TEMPLETON VARIABLE INSURANCE PRODUCTS TRUST
NOTES TO FINANCIAL STATEMENTS (UNAUDITED)
Templeton Developing Markets VIP Fund (continued)
1. Organization and Significant Accounting Policies (continued)
e. Income and Deferred Taxes (continued)
distribute to shareholders substantially all of its taxable income and net realized gains to relieve it from federal income and if applicable, excise taxes. As a result, no provision for U.S. federal income taxes is required.
The Fund may be subject to foreign taxation related to income received, capital gains on the sale of securities and certain foreign currency transactions in the foreign jurisdictions in which it invests. Foreign taxes, if any, are recorded based on the tax regulations and rates that exist in the foreign markets in which the Fund invests. When a capital gain tax is determined to apply, the Fund records an estimated deferred tax liability in an amount that would be payable if the securities were disposed of on the valuation date.
The Fund may recognize an income tax liability related to its uncertain tax positions under U.S. GAAP when the uncertain tax position has a less than 50% probability that it will be sustained upon examination by the tax authorities based on its technical merits. As of June 30, 2016, the Fund has determined that no tax liability is required in its financial statements related to uncertain tax positions for any open tax years (or expected to be taken in future tax years). Open tax years are those that remain subject to examination and are based on each tax jurisdiction’s statute of limitation.
f. Security Transactions, Investment Income, Expenses and Distributions
Security transactions are accounted for on trade date. Realized gains and losses on security transactions are determined on a specific identification basis. Estimated expenses are accrued daily. Dividend income is recorded on the ex-dividend date except for certain dividends from foreign securities where the dividend rate is not available. In such cases, the dividend is recorded as soon as the information is received by the Fund. Distributions to shareholders are recorded on the ex-dividend
date and are determined according to income tax regulations (tax basis). Distributable earnings determined on a tax basis may differ from earnings recorded in accordance with U.S. GAAP. These differences may be permanent or temporary. Permanent differences are reclassified among capital accounts to reflect their tax character. These reclassifications have no impact on net assets or the results of operations. Temporary differences are not reclassified, as they may reverse in subsequent periods.
Common expenses incurred by the Trust are allocated among the Funds based on the ratio of net assets of each Fund to the combined net assets of the Trust. Fund specific expenses are charged directly to the fund that incurred the expense.
Realized and unrealized gains and losses and net investment income, not including class specific expenses, are allocated daily to each class of shares based upon the relative proportion of net assets of each class. Differences in per share distributions, by class, are generally due to differences in class specific expenses.
g. Accounting Estimates
The preparation of financial statements in accordance with U.S. GAAP requires management to make estimates and assumptions that affect the reported amounts of assets and liabilities at the date of the financial statements and the amounts of income and expenses during the reporting period. Actual results could differ from those estimates.
h. Guarantees and Indemnifications
Under the Trust’s organizational documents, its officers and trustees are indemnified by the Trust against certain liabilities arising out of the performance of their duties to the Trust. Additionally, in the normal course of business, the Trust, on behalf of the Fund, enters into contracts with service providers that contain general indemnification clauses. The Trust’s maximum exposure under these arrangements is unknown as this would involve future claims that may be made against the Trust that have not yet occurred. Currently, the Trust expects the risk of loss to be remote.
| TD-20 | Semiannual Report |
FRANKLIN TEMPLETON VARIABLE INSURANCE PRODUCTS TRUST
NOTES TO FINANCIAL STATEMENTS (UNAUDITED)
Templeton Developing Markets VIP Fund (continued)
2. Shares of Beneficial Interest
At June 30, 2016, there were an unlimited number of shares authorized (without par value). Transactions in the Fund’s shares were as follows:
| Six Months Ended June 30, 2016 | Year Ended December 31, 2015 | |||||||||||||||||||
| Shares | Amount | Shares | Amount | |||||||||||||||||
| Class 1 Shares: | ||||||||||||||||||||
Shares sold | 778,391 | $ | 5,167,288 | 1,121,738 | $ | 9,288,141 | ||||||||||||||
Shares issued in reinvestment of distributions | 130,351 | 875,960 | 1,921,727 | 14,835,735 | ||||||||||||||||
Shares redeemed | (1,315,296 | ) | (8,425,200 | ) | (3,309,863 | ) | (27,352,757 | ) | ||||||||||||
|
| |||||||||||||||||||
Net increase (decrease) | (406,554 | ) | $ | (2,381,952 | ) | (266,398 | ) | $ | (3,228,881 | ) | ||||||||||
|
| |||||||||||||||||||
| Class 2 Shares: | ||||||||||||||||||||
Shares sold | 3,196,718 | $ | 20,939,741 | 4,635,193 | $ | 35,599,642 | ||||||||||||||
Shares issued in reinvestment of distributions | 251,079 | 1,674,699 | 4,430,114 | 33,934,677 | ||||||||||||||||
Shares redeemed | (3,648,421 | ) | (23,447,483 | ) | (5,930,164 | ) | (47,986,302 | ) | ||||||||||||
|
| |||||||||||||||||||
Net increase (decrease) | (200,624 | ) | $ | (833,043 | ) | 3,135,143 | $ | 21,548,017 | ||||||||||||
|
| |||||||||||||||||||
| Class 4 Shares: | ||||||||||||||||||||
Shares sold | 29,812 | $ | 196,593 | 96,241 | $ | 723,497 | ||||||||||||||
Shares issued in reinvestment of distributions | 6,622 | 44,436 | 184,886 | 1,421,771 | ||||||||||||||||
Shares redeemed | (169,843 | ) | (1,103,723 | ) | (364,639 | ) | (2,894,227 | ) | ||||||||||||
|
| |||||||||||||||||||
Net increase (decrease) | (133,409 | ) | $ | (862,694 | ) | (83,512 | ) | $ | (748,959 | ) | ||||||||||
|
| |||||||||||||||||||
3. Transactions With Affiliates
Franklin Resources, Inc. is the holding company for various subsidiaries that together are referred to as Franklin Templeton Investments. Certain officers and trustees of the Fund are also officers and/or trustees of the following subsidiaries:
| Subsidiary | Affiliation | |
Templeton Asset Management Ltd. (TAML) | Investment manager | |
Franklin Templeton Services, LLC (FT Services) | Administrative manager | |
Franklin Templeton Distributors, Inc. (Distributors) | Principal underwriter | |
Franklin Templeton Investor Services, LLC (Investor Services) | Transfer agent |
a. Management Fees
The Fund pays an investment management fee to TAML based on the average daily net assets of the Fund as follows:
| Annualized Fee Rate | Net Assets | |
1.250% | Up to and including $200 million | |
1.235% | Over $200 million, up to and including $700 million | |
1.200% | Over $700 million, up to and including $1 billion | |
1.150% | Over $1 billion, up to and including $1.2 billion | |
1.125% | Over $1.2 billion, up to and including $5 billion | |
1.075% | Over $5 billion, up to and including $10 billion | |
1.025% | Over $10 billion, up to and including $15 billion | |
0.975% | Over $15 billion, up to and including $20 billion | |
0.925% | In excess of $20 billion |
| Semiannual Report | TD-21 |
FRANKLIN TEMPLETON VARIABLE INSURANCE PRODUCTS TRUST
NOTES TO FINANCIAL STATEMENTS (UNAUDITED)
Templeton Developing Markets VIP Fund (continued)
3. Transactions With Affiliates (continued)
a. Management Fees (continued)
For the period ended June 30, 2016, the annualized effective investment management fee rate was 1.245% of the Fund’s average daily net assets.
b. Administrative Fees
Under an agreement with TAML, FT Services provides administrative services to the Fund. The fee is paid by TAML based on Fund’s average daily net assets, and is not an additional expense of the Fund.
c. Distribution Fees
The Board has adopted distribution plans for Class 2 and Class 4 shares pursuant to Rule 12b-1 under the 1940 Act. Under the Fund’s compensation distribution plans, the Fund pays Distributors for costs incurred in connection with the servicing, sale and distribution of the Fund’s shares up to 0.25% and 0.35% per year of its average daily net assets of Class 2 and Class 4, respectively. The plan year, for purposes of monitoring compliance with the maximum annual plan rates, is February 1 through January 31.
d. Transfer Agent Fees
Investor Services, under terms of an agreement, performs shareholder servicing for the Fund and is not paid by the Fund for the services.
e. Investments in Affiliated Management Investment Companies
The Fund invests in one or more affiliated management investment companies for purposes other than exercising a controlling influence over the management or policies. Management fees paid by the Fund are waived on assets invested in the affiliated management investment companies, as noted in the Statement of Operations, in an amount not to exceed the management and administrative fees paid directly or indirectly by each affiliate. Prior to January 1, 2014, the waiver was accounted for as a reduction to management fees.
| Number of Shares Held at Beginning of Period | Gross Additions | Gross Reductions | Number of Shares Held at End of Period | Value at End of Period | Investment Income | Realized Gain (Loss) | % of Affiliated Fund Shares Outstanding Held at End of Period | |||||||||||||||||||||||
| Non-Controlled Affiliates | ||||||||||||||||||||||||||||||
Institutional Fiduciary Trust Money Market Portfolio | 36,108,301 | 25,230,444 | (41,678,219 | ) | 19,660,526 | $ | 19,660,526 | $ | — | $ | — | 0.1% | ||||||||||||||||||
|
|
|
|
|
| |||||||||||||||||||||||||
4. Expense Offset Arrangement
The Fund has entered into an arrangement with its custodian whereby credits realized as a result of uninvested cash balances are used to reduce a portion of the Fund’s custodian expenses. During the period ended June 30, 2016, there were no credits earned.
5. Income Taxes
For tax purposes, capital losses may be carried over to offset future capital gains, if any.
| TD-22 | Semiannual Report |
FRANKLIN TEMPLETON VARIABLE INSURANCE PRODUCTS TRUST
NOTES TO FINANCIAL STATEMENTS (UNAUDITED)
Templeton Developing Markets VIP Fund (continued)
At December 31, 2015, capital loss carryforwards were as follows:
Capital loss carryforwards not subject to expiration: | ||||
Short term | $ | 22,864,241 | ||
Long term | 18,453,194 | |||
|
| |||
Total capital loss carryforwards | $ | 41,317,435 | ||
|
|
At June 30, 2016, the cost of investments and net unrealized appreciation (depreciation) for income tax purposes were as follows:
Cost of investments | $ | 286,569,446 | ||
|
| |||
Unrealized appreciation | $ | 43,397,312 | ||
Unrealized depreciation | (32,038,512 | ) | ||
|
| |||
Net unrealized appreciation (depreciation) | $ | 11,358,800 | ||
|
|
Differences between income and/or capital gains as determined on a book basis and a tax basis are primarily due to differing treatments of corporate actions and wash sales.
6. Investment Transactions
Purchases and sales of investments (excluding short term securities) for the period ended June 30, 2016, aggregated $38,758,493 and $28,055,332, respectively.
7. Concentration of Risk
Investing in foreign securities may include certain risks and considerations not typically associated with investing in U.S. securities, such as fluctuating currency values and changing local and regional economic, political and social conditions, which may result in greater market volatility. In addition, certain foreign securities may not be as liquid as U.S. securities.
8. Credit Facility
The Fund, together with other U.S. registered and foreign investment funds (collectively, Borrowers), managed by Franklin Templeton Investments, are borrowers in a joint syndicated senior unsecured credit facility totaling $2 billion (Global Credit Facility) which matures on February 10, 2017. This Global Credit Facility provides a source of funds to the Borrowers for temporary and emergency purposes, including the ability to meet future unanticipated or unusually large redemption requests.
Under the terms of the Global Credit Facility, the Fund shall, in addition to interest charged on any borrowings made by the Fund and other costs incurred by the Fund, pay its share of fees and expenses incurred in connection with the implementation and maintenance of the Global Credit Facility, based upon its relative share of the aggregate net assets of all of the Borrowers, including an annual commitment fee of 0.07% based upon the unused portion of the Global Credit Facility. Effective February 12, 2016, the annual commitment fee is 0.15%. These fees are reflected in other expenses in the Statement of Operations. During the period ended June 30, 2016, the Fund did not use the Global Credit Facility.
9. Fair Value Measurements
The Fund follows a fair value hierarchy that distinguishes between market data obtained from independent sources (observable inputs) and the Fund’s own market assumptions (unobservable inputs). These inputs are used in determining the value of the Fund’s financial instruments and are summarized in the following fair value hierarchy:
| • | Level 1 – quoted prices in active markets for identical financial instruments |
| • | Level 2 – other significant observable inputs (including quoted prices for similar financial instruments, interest rates, prepayment speed, credit risk, etc.) |
| Semiannual Report | TD-23 |
FRANKLIN TEMPLETON VARIABLE INSURANCE PRODUCTS TRUST
NOTES TO FINANCIAL STATEMENTS (UNAUDITED)
Templeton Developing Markets VIP Fund (continued)
9. Fair Value Measurements (continued)
| • | Level 3 – significant unobservable inputs (including the Fund’s own assumptions in determining the fair value of financial instruments) |
The input levels are not necessarily an indication of the risk or liquidity associated with financial instruments at that level.
For movements between the levels within the fair value hierarchy, the Fund has adopted a policy of recognizing the transfers as of the date of the underlying event which caused the movement.
A summary of inputs used as of June 30, 2016, in valuing the Fund’s assets carried at fair value, is as follows:
| Level 1 | Level 2 | Level 3 | Total | |||||||||||||
| Assets: | ||||||||||||||||
Investments in Securities | ||||||||||||||||
Equity Investments:a | ||||||||||||||||
Russia | $ | 7,992,060 | $ | 1,725,101 | $ | — | $ | 9,717,161 | ||||||||
All Other Equity Investmentsb | 265,552,335 | — | — | 265,552,335 | ||||||||||||
Participatory Notes | — | 2,998,224 | — | 2,998,224 | ||||||||||||
Short Term Investments | 19,660,526 | — | — | 19,660,526 | ||||||||||||
|
| |||||||||||||||
Total Investments in Securities | $ | 293,204,921 | $ | 4,723,325 | $ | — | $ | 297,928,246 | ||||||||
|
| |||||||||||||||
aIncludes common and preferred stocks.
bFor detailed categories, see the accompanying Statement of Investments.
10. Subsequent Events
The Fund has evaluated subsequent events through the issuance of the financial statements and determined that no events have occurred that require disclosure.
Abbreviations
| Selected Portfolio | ||
| ADR | American Depositary Receipt | |
| GDR | Global Depositary Receipt | |
| TD-24 | Semiannual Report |
FRANKLIN TEMPLETON VARIABLE INSURANCE PRODUCTS TRUST
Tax Information (unaudited)
Templeton Developing Markets VIP Fund
At December 31, 2015, more than 50% of the Fund’s total assets were invested in securities of foreign issuers. In most instances, foreign taxes were withheld from income paid to the Fund on these investments. As shown in the table below, the Fund hereby reports to shareholders the foreign source income and foreign taxes paid, pursuant to Section 853 of the Internal Revenue Code. This written statement will allow shareholders of record on June 14, 2016, to treat their proportionate share of foreign taxes paid by the Fund as having been paid directly by them. The shareholder shall consider these amounts as foreign taxes paid in the tax year in which they receive the Fund distribution.
The following table provides a detailed analysis of foreign tax paid, and foreign source income as reported by the Fund, to Class 1, Class 2, and Class 4 shareholders of record.
| Class | Foreign Tax Paid Per Share | Foreign Source Income Per Share | ||
Class 1 | $0.0167 | $0.1053 | ||
Class 2 | $0.0167 | $0.0864 | ||
Class 4 | $0.0167 | $0.0739 |
Foreign Tax Paid Per Share (Column 1) is the amount per share available to you, as a tax credit (assuming you held your shares in the Fund for a minimum of 16 days during the 31-day period beginning 15 days before the ex-dividend date of the Fund’s distribution to which the foreign taxes relate), or, as a tax deduction.
Foreign Source Income Per Share (Column 2) is the amount per share of income dividends attributable to foreign securities held by the Fund, plus any foreign taxes withheld on these dividends.
| Semiannual Report | TD-25 |
Templeton Foreign VIP Fund
This semiannual report for Templeton Foreign VIP Fund covers the period ended June 30, 2016.
Class 4 Performance Summary as of June 30, 2016
The Fund’s Class 4 shares had a -2.52% total return* for the six-month period ended June 30, 2016.
*The Fund has a fee waiver associated with any investment in a Franklin Templeton money fund and/or other Franklin Templeton fund, as applicable, contractually guaranteed through at least the Fund’s current fiscal year-end. Fund investment results reflect the fee waiver, to the extent applicable; without this reduction, the results would have been lower.
Performance reflects the Fund’s Class 4 operating expenses, but does not include any contract fees, expenses or sales charges. If they had been included, performance would be lower. These charges and deductions, particularly for variable life policies, can have a significant effect on contract values and insurance benefits. See the contract prospectus for a complete description of these expenses, including sales charges.
Performance data represent past performance, which does not guarantee future results. Investment return and principal value will fluctuate, and you may have a gain or loss when you sell your shares. Current performance may differ from figures shown.
| Semiannual Report | TF-1 |
TEMPLETON FOREIGN VIP FUND
Fund Goal and Main Investments
The Fund seeks long-term capital growth. Under normal market conditions, the Fund invests at least 80% of its net assets in investments of issuers located outside the U.S., including those in emerging markets.
Fund Risks
All investments involve risks, including possible loss of principal. Special risks are associated with foreign investing, including currency fluctuations, economic instability and political developments; investments in emerging markets involve heightened risks related to the same factors. In addition, smaller company stocks have historically experienced more price volatility than larger company stocks, especially over the short term. To the extent the Fund focuses on particular countries, regions, industries, sectors or types of investment from time to time, it may be subject to greater risks of adverse developments in such areas of focus than a fund that invests in a wider variety of countries, regions, industries, sectors or investments. The Fund is actively managed but there is no guarantee that the manager’s investment decisions will produce the desired results. The Fund’s prospectus also includes a description of the main investment risks.
Performance Overview
You can find the Fund’s six-month total return in the Performance Summary. In comparison, the Fund’s new benchmark, the MSCI All Country World (ACW) ex USA Index, had a -0.67% total return for the same period, while its old benchmark, the MSCI EAFE Index, had a -4.04% total return.1 We believe the new index better represents the Fund’s investable universe and is more in line with the Fund’s mandates. Please note, index performance information is provided for reference and we do not attempt to track the index but rather undertake investments on the basis of fundamental research.
Economic and Market Overview
The global economy expanded during the six months under review. An improvement in commodity prices including a rally in crude oil prices, accommodative monetary policy from various global central banks, finalization of the new debt deal for Greece and encouraging Chinese trade data toward period-end boosted market sentiment. However, global equity market volatility increased after the U.S. Federal Reserve’s (Fed’s) June
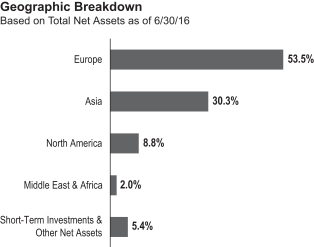
decision to keep its federal funds target range unchanged, while providing a cautious stance on further interest rate hikes. In addition, global economic concerns and the U.K.’s historic referendum to leave the European Union (EU), also known as the “Brexit”, contributed to volatile global stock markets.
Oil prices fell at the beginning of the review period, largely due to strong global supply, but recovered in the period’s second half amid oilfield outages and continued demand growth. Meanwhile, commodity prices increased for most of the review period as oversupply for a host of commodities shrank and the market appeared to be on the path of rebalancing after hitting a glut-induced bottom earlier in the year. Gold prices continued to rise following the Brexit referendum as some investors turned to safe haven investing. The U.S. dollar generally depreciated against most currencies during the period, which increased returns of many foreign assets in U.S. dollar terms. In this environment, global developed market stocks overall, as measured by the MSCI World Index, rose slightly during the period.2
The U.S. economy grew moderately, as measured by gross domestic product (GDP) in 2016’s first and second quarters, driven by consumer spending and exports. A decline in private inventory investment and nonresidential fixed investment contributed to the moderation. The Fed maintained its target interest rate during the review period after raising it for the first time in nine years at its December meeting. The Fed kept its target rate unchanged in its June meeting mainly due to a substantial slowdown in job additions toward period-end. The Fed expects economic conditions to evolve in a manner that could warrant only gradual increases in the federal funds rate.
1. Source: Morningstar. One cannot invest directly in an index, and an index is not representative of the Fund’s portfolio. Please see Index Descriptions following the Fund Summaries.
2. Please see Index Descriptions following the Fund Summaries.
| TF-2 | Semiannual Report |
TEMPLETON FOREIGN VIP FUND
In Europe, slower U.K. economic growth continued in 2016’s first quarter as output slowed in construction, production and agriculture. Immediate effects of the Brexit materialized as U.K. stocks significantly declined and the pound sterling hit a three-decade low amid intensified selling. Credit rating agencies Standard & Poor’s and Fitch also downgraded the U.K.’s credit rating. In the eurozone, despite investors’ concerns about banking sector weakness, low corporate earnings and post-Brexit political repercussions, some regions benefited due to rising consumer spending resulting from a cheaper euro, low inflation and signs of sustained economic growth. The eurozone’s annual inflation rate remained in negative territory for most of the review period; however, it rose marginally above zero in June.
Japan’s economy posted mixed results, contracting in 2015’s fourth quarter stemming from declining private and household consumption. However, the economy expanded during 2016’s first quarter as private consumption increased and business investment decreased less than initially believed. The Bank of Japan (BOJ) took several actions during the review period. In January, to boost lending and support inflation, the BOJ introduced a negative interest rate on excess reserves held at the central bank by financial institutions. In April, the BOJ further reduced its GDP and inflation forecasts for fiscal year 2016, and decided against additional quantitative easing measures. However, after the U.K.’s vote in June to leave the EU, the BOJ hinted at carrying out flexible open market operations to stabilize its financial markets.
In emerging markets, economic growth generally moderated during the review period. Brazil’s economy witnessed its longest recession since the 1930s amid political and economic turmoil, while Russia’s economy continued to contract. The Bank of Russia reduced its key interest rate in an attempt to revive its economy. China’s economic growth slowed marginally in 2016’s first quarter compared to the previous quarter, but remained largely in line with the government’s target. The People’s Bank of China cut its cash reserve requirement ratio for the country’s banks and effectively devalued the renminbi against the U.S. dollar to the lowest level in more than five years. Overall, emerging market stocks, as measured by the MSCI Emerging Markets Index, rose for the six-month period.2
Investment Strategy
Our investment philosophy is bottom up, value oriented and long term. In choosing investments, we generally focus on the market price of a company’s securities relative to our evaluation of the company’s potential long-term earnings, asset value and cash flow. Among factors we consider are a company’s historical value measures, including price/earnings ratio, profit margins and liquidation value. We do in-depth research to construct a bargain list from which we buy.
Manager’s Discussion
For the six-month period ended June 30, 2016, the Fund underperformed its benchmark, the MSCI ACW ex USA Index. However, the Fund had several notable contributors to its relative resulted including stock selection in the materials sector, particularly in metals and mining.3 In metals and mining, precious metals streaming company Silver Wheaton (Canada) and gold, copper and nickel extractor Barrick Gold (Canada) helped the Fund’s performance. Shares of Silver Wheaton increased during the period on news of strong earnings in the first quarter of 2016 following record sales and production volumes for the 2015 calendar year. In 2016, operating cash flows and revenues continued to improve relative to prior periods and at period end the company’s stock price nearly doubled. Additionally, in May 2016, new management was elected during Silver Wheaton’s 2016 Annual and Special Meeting of Shareholders.
An overweighted position in energy and stock selection in the information technology (IT) sectors also aided relative performance.4 Within both sectors, some of the Fund’s largest relative contributors included oil and gas drilling company Precision Drilling (Canada) and multinational electronics company Samsung Electronics (Korea). Other individual contributors included Glencore (Switzerland), Posco Daewoo (South Korea) and Subsea 7 (U.K.). Despite recent difficulties surrounding the volatility of oil prices and demand, Precision’s share price increased during the period under review. The company, however, continued to report lesser earnings in both the first and second quarters of 2016, compared to the respective 2015 quarters, which was primarily attributed to contract cancellations and lack of demand for oil drillings in North America. Nonetheless, in 2016 investors began to recognize the long-term value of the organization and potential rebound, which has continued to drive the share price since the beginning of the period. Shares
3. The materials sector comprises chemicals, construction materials, and metals and mining in the SOI.
4. The energy sector comprises energy equipment and services and oil, gas and consumable fuels in the SOI. The information technology sector comprises electronic equipment, instruments and components; Internet software and services; semiconductors and semiconductor equipment; and technology hardware, storage and peripherals in the SOI.
| Semiannual Report | TF-3 |
TEMPLETON FOREIGN VIP FUND
of Samsung Electronics increased after consecutive reported earnings in 2015’s fourth quarter and 2016’s first quarter. Strong sales of Samsung’s new flagship mobile phone models—the Galaxy S7 and the Galaxy S7 Edge—boosted its first quarter’s operating performance.
In contrast, stock selection in the financials sector and specifically an overweighting in banks weighed on relative results.5 Within the financials sector, the Fund’s position in Credit Suisse (Switzerland), AXA (France) and Aegon (Netherlands) hindered results. Shares of Credit Suisse, a financial services provider, declined during the period surrounding investor uncertainty stemming partially from the events surrounding the Brexit. The company nonetheless has been combatting these effects by implementing significant cost-savings initiatives. Further, in May 2016, the company announced a change in management, which the company expects to strengthen the international wealth management division’s investment capabilities.
An overweighted position in the health care sector and an underweighted position in the consumer staples sector along with stock selection in both sectors impacted relative results.6 Within health care, positions in pharmaceutical manufacturer Teva Pharmaceutical Industries (Israel), QIAGEN (Netherlands) and MorphoSys (Germany) hurt relative results. Teva’s shares declined largely due to a delay in its acquisition of Allergan’s generics portfolio amid longer-than-anticipated deliberations with the U.S. Federal Trade Commission and the FDA. Among individual holdings, general goods retailer Marks and Spencer (U.K.), automobile manufacturer Nissan Motor (Japan) and financial services provider Aviva (U.K.) detracted from the Fund’s relative returns. Shares of Marks and Spencer declined during the period on continued news of disappointing sales in its clothing retail division. The company restructured its strategic vision in early 2016, focusing on customer retention, sales growth and continued support of its growth food sales division, but these efforts yielded little turnaround by the end of the period.
From a geographic perspective, stock selection in North America and Asia, specifically in Canada, South Korea and Japan, contributed to the Fund’s relative performance. Although the Fund’s overall position in Europe detracted, some investments, such as those in Spain and Ireland contributed. Conversely, stock selection in the eurozone (including the U.K.), an overweighted allocation in Israel and an underweighted allocation in Brazil hindered returns.
| Top 10 Holdings | ||||
| 6/30/16 | ||||
| Company Sector/Industry, Country | % of Total Net Assets | |||
Samsung Electronics Co. Ltd. Technology Hardware, Storage & Peripherals, South Korea | 4.3% | |||
| Silver Wheaton Corp. Metals & Mining, Canada | 2.7% | |||
| BP PLC Oil, Gas & Consumable Fuels, U.K. | 2.4% | |||
| Hana Financial Group Inc. Banks, South Korea | 2.0% | |||
| Teva Pharmaceutical Industries Ltd., ADR Pharmaceuticals, Israel | 1.9% | |||
| Royal Dutch Shell PLC Oil, Gas & Consumable Fuels, U.K. | 1.9% | |||
| BNP Paribas SA Banks, France | 1.9% | |||
| Nissan Motor Co. Ltd. Automobiles, Japan | 1.9% | |||
| SoftBank Group Corp. Wireless Telecommunication Services, Japan | 1.9% | |||
| Roche Holding AG Pharmaceuticals, Switzerland | 1.8% | |||
The dollar value, numbers of shares or principal amount, and names of all portfolio holdings are listed in the Fund’s Statement of Investments (SOI).
Thank you for your participation in Templeton Foreign VIP Fund. We look forward to serving your future investment needs.
The foregoing information reflects our analysis, opinions and portfolio holdings as of June 30, 2016, the end of the reporting period. The way we implement our main investment strategies and the resulting portfolio holdings may change depending on factors such as market and economic conditions. These opinions may not be relied upon as investment advice or an offer for a particular security. The information is not a complete analysis of every aspect of any market, country, industry, security or the Fund. Statements of fact are from sources considered reliable, but the investment manager makes no representation or warranty as to their completeness or accuracy. Although historical performance is no guarantee of future results, these insights may help you understand our investment management philosophy.
5. The financials sector comprises banks, capital markets, diversified financial services and insurance in the SOI.
6. The health care sector comprises health care equipment and supplies, health care providers and services, life sciences tools and services and pharmaceuticals in the SOI. The consumer staples sector comprises beverages and food and staples retailing in the SOI.
| TF-4 | Semiannual Report |
TEMPLETON FOREIGN VIP FUND
Class 4 Fund Expenses
As an investor in a variable insurance contract (Contract) that indirectly provides for investment in an underlying mutual fund, you can incur transaction and/or ongoing expenses at both the Fund level and the Contract level.
| • | Transaction expenses can include sales charges (loads) on purchases, surrender fees, transfer fees and premium taxes. |
| • | Ongoing expenses can include management fees, distribution and service (12b-1) fees, contract fees, annual maintenance fees, mortality and expense risk fees and other fees and expenses. All mutual funds and Contracts have some types of ongoing expenses. |
The expenses shown in the table are meant to highlight ongoing expenses at the Fund level only and do not include ongoing expenses at the Contract level, or transaction expenses at either the Fund or Contract levels. While the Fund does not have transaction expenses, if the transaction and ongoing expenses at the Contract level were included, the expenses shown below would be higher. You should consult your Contract prospectus or disclosure document for more information.
The table shows Fund-level ongoing expenses and can help you understand these expenses and compare them with those of other mutual funds offered through the Contract. The table assumes a $1,000 investment held for the six months indicated. Please refer to the Fund prospectus for additional information on operating expenses.
Actual Fund Expenses
The first line (Actual) of the table provides actual account values and expenses. The “Ending Account Value” is derived from the Fund’s actual return, which includes the effect of ongoing Fund expenses, but does not include the effect of ongoing Contract expenses.
You can estimate the Fund-level expenses you incurred during the period by following these steps. Of course, your account value and expenses will differ from those in this illustration:
| 1. | Divide your account value by $1,000. |
If an account had an $8,600 value,
then $8,600 ÷ $1,000 = 8.6.
| 2. | Multiply the result by the number under the heading “Fund-Level Expenses Incurred During Period.” |
If Fund-Level Expenses Incurred During Period were $7.50, then 8.6 × $7.50 = $64.50.
In this illustration, the estimated expenses incurred this period at the Fund level are $64.50.
Hypothetical Example for Comparison with Other Mutual Funds
Information in the second line (Hypothetical) of the table can help you compare ongoing expenses of the Fund with those of other mutual funds offered through the Contract. This information may not be used to estimate the actual ending account balance or expenses you incurred during the period. The hypothetical “Ending Account Value” is based on the Fund’s actual expense ratio and an assumed 5% annual rate of return before expenses, which does not represent the Fund’s actual return. The figure under the heading “Fund-Level Expenses Incurred During Period” shows the hypothetical expenses your account would have incurred under this scenario. You can compare this figure with the 5% hypothetical examples that appear in shareholder reports of other funds offered through a Contract.
| Class 4 | Beginning Account Value 1/1/16 | Ending Account Value 6/30/16 | Fund-Level Expenses Incurred During Period* 1/1/16–6/30/16 | |||||||||
Actual | $ | 1,000 | $ | 974.80 | $ | 5.55 | ||||||
Hypothetical (5% return before expenses) | $ | 1,000 | $ | 1,019.24 | $ | 5.67 | ||||||
*Expenses are calculated using the most recent six-month annualized expense ratio, net of expense waivers, for the Fund’s Class 4 shares (1.13%), which does not include any ongoing expenses of the Contract for which the Fund is an investment option, multiplied by the average account value over the period, multiplied by 182/366 to reflect the one-half year period.
| Semiannual Report | TF-5 |
SUPPLEMENT DATED JUNE 27, 2016
TO THE PROSPECTUSES DATED MAY 1, 2016
OF
TEMPLETON FOREIGN VIP FUND
TEMPLETON GROWTH VIP FUND
(Series of Franklin Templeton Variable Insurance Products Trust)
Effective June 30, 2016, the prospectus is amended as follows:
I. The benchmark for the Templeton Foreign VIP Fund has changed from the MSCI EAFE Index to the MSCI ACWI EX USA Index. The “Fund Summary – Performance – Average Annual Total Returns” table on page TF-S4 is revised to add the following:
| 1 Year | 5 Years | 10 Years | ||||
| MSCI All Country World ex-US Index (index reflects no deduction for fees, expenses or taxes)1 | -5.25% | 1.51% | 3.38% |
| 1. | Performance figures as of December 31, 2015. The MSCI All Country World ex-US Index is replacing the MSCI EAFE Index as the Fund’s benchmark. The investment manager believes the composition of the MSCI All Country World ex-US Index more accurately reflects the Fund’s holdings. |
II. The benchmark for the Templeton Growth VIP Fund has changed from the MSCI World Index to the MSCI ACWI Index. The “Fund Summary – Performance – Average Annual Total Returns” table on page TG-S3 is revised to add the following:
| 1 Year | 5 Years | 10 Years | ||||
| MSCI All Country World Index (index reflects no deduction for fees, expenses or taxes)1 | -1.84% | 6.66% | 5.31% |
| 1. | Performance figures as of December 31, 2015. The MSCI All Country World Index is replacing the MSCI World Index as the Fund’s benchmark. The investment manager believes the composition of the MSCI All Country World Index more accurately reflects the Fund’s holdings. |
Please keep this supplement with your prospectus for future reference.
| TF-6 |
FRANKLIN TEMPLETON VARIABLE INSURANCE PRODUCTS TRUST
Financial Highlights
Templeton Foreign VIP Fund
Six Months Ended (unaudited) | Year Ended December 31, | |||||||||||||||||||||||
| 2015 | 2014 | 2013 | 2012 | 2011 | ||||||||||||||||||||
| Class 1 | ||||||||||||||||||||||||
| Per share operating performance (for a share outstanding throughout the period) | ||||||||||||||||||||||||
Net asset value, beginning of period | $13.46 | $15.34 | $17.56 | $14.63 | $12.78 | $14.54 | ||||||||||||||||||
|
| |||||||||||||||||||||||
| Income from investment operationsa: | ||||||||||||||||||||||||
Net investment incomeb | 0.23 | 0.31 | 0.53 | c | 0.34 | 0.38 | 0.42 | |||||||||||||||||
Net realized and unrealized gains (losses) | (0.55 | ) | (1.16 | ) | (2.39 | ) | 3.00 | 1.91 | (1.90 | ) | ||||||||||||||
|
| |||||||||||||||||||||||
Total from investment operations | (0.32 | ) | (0.85 | ) | (1.86 | ) | 3.34 | 2.29 | (1.48 | ) | ||||||||||||||
|
| |||||||||||||||||||||||
| Less distributions from: | ||||||||||||||||||||||||
Net investment income | (0.29 | ) | (0.53 | ) | (0.36 | ) | (0.41 | ) | (0.44 | ) | (0.28 | ) | ||||||||||||
Net realized gains | (0.23 | ) | (0.50 | ) | — | — | — | — | ||||||||||||||||
|
| |||||||||||||||||||||||
Total distributions | (0.52 | ) | (1.03 | ) | (0.36 | ) | (0.41 | ) | (0.44 | ) | (0.28 | ) | ||||||||||||
|
| |||||||||||||||||||||||
Redemption fees | — | — | — | d | — | d | — | d | — | d | ||||||||||||||
|
| |||||||||||||||||||||||
Net asset value, end of period | $12.62 | $13.46 | $15.34 | $17.56 | $14.63 | $12.78 | ||||||||||||||||||
|
| |||||||||||||||||||||||
Total returne | (2.34)% | (6.31)% | (10.89)% | 23.27% | 18.60% | (10.44)% | ||||||||||||||||||
| Ratios to average net assetsf | ||||||||||||||||||||||||
Expenses before waiver and payments by affiliates | 0.80% | 0.78% | 0.77% | 0.78% | 0.79% | 0.79% | ||||||||||||||||||
Expenses net of waiver and payments by affiliates | 0.78% | 0.78% | g | 0.77% | g | 0.78% | 0.79% | 0.79% | h | |||||||||||||||
Net investment income | 3.63% | 2.05% | 3.11% | c | 2.16% | 2.84% | 2.92% | |||||||||||||||||
| Supplemental data | ||||||||||||||||||||||||
Net assets, end of period (000’s) | $199,506 | $214,172 | $248,355 | $298,468 | $265,924 | $254,292 | ||||||||||||||||||
Portfolio turnover rate | 9.77% | 15.15% | 25.71% | 23.61% | 12.53% | 21.09% | ||||||||||||||||||
aThe amount shown for a share outstanding throughout the period may not correlate with the Statement of Operations for the period due to the timing of sales and repurchases of the Fund’s shares in relation to income earned and/or fluctuating fair value of the investments of the Fund.
bBased on average daily shares outstanding.
cNet investment income per share includes approximately $0.16 per share related to income received in the form of special dividends in connection with certain Fund holdings. Excluding these amounts, the ratio of net investment income to average net assets would have been 2.13%.
dAmount rounds to less than $0.01 per share.
eTotal return does not include fees, charges or expenses imposed by the variable annuity and life insurance contracts for which Franklin Templeton Variable Insurance Products Trust serves as an underlying investment vehicle. Total return is not annualized for periods less than one year.
fRatios are annualized for periods less than one year.
gBenefit of waiver and payments by affiliates rounds to less than 0.01%.
hBenefit of expense reduction rounds to less than 0.01%.
| The accompanying notes are an integral part of these financial statements. | Semiannual Report | TF-7 |
FRANKLIN TEMPLETON VARIABLE INSURANCE PRODUCTS TRUST
FINANCIAL HIGHLIGHTS
Templeton Foreign VIP Fund (continued)
Six Months Ended (unaudited) | Year Ended December 31, | |||||||||||||||||||||||
| 2015 | 2014 | 2013 | 2012 | 2011 | ||||||||||||||||||||
| Class 2 | ||||||||||||||||||||||||
| Per share operating performance (for a share outstanding throughout the period) | ||||||||||||||||||||||||
Net asset value, beginning of period | $13.20 | $15.05 | $17.24 | $14.37 | $12.56 | $14.29 | ||||||||||||||||||
|
| |||||||||||||||||||||||
| Income from investment operationsa: | ||||||||||||||||||||||||
Net investment incomeb | 0.21 | 0.27 | 0.48 | c | 0.30 | 0.34 | 0.37 | |||||||||||||||||
Net realized and unrealized gains (losses) | (0.54 | ) | (1.13 | ) | (2.35 | ) | 2.94 | 1.87 | (1.86 | ) | ||||||||||||||
|
| |||||||||||||||||||||||
Total from investment operations | (0.33 | ) | (0.86 | ) | (1.87 | ) | 3.24 | 2.21 | (1.49 | ) | ||||||||||||||
|
| |||||||||||||||||||||||
| Less distributions from: | ||||||||||||||||||||||||
Net investment income | (0.26 | ) | (0.49 | ) | (0.32 | ) | (0.37 | ) | (0.40 | ) | (0.24 | ) | ||||||||||||
Net realized gains | (0.23 | ) | (0.50 | ) | — | — | — | — | ||||||||||||||||
|
| |||||||||||||||||||||||
Total distributions | (0.49 | ) | (0.99 | ) | (0.32 | ) | (0.37 | ) | (0.40 | ) | (0.24 | ) | ||||||||||||
|
| |||||||||||||||||||||||
Redemption fees | — | — | — | d | — | d | — | d | — | d | ||||||||||||||
|
| |||||||||||||||||||||||
Net asset value, end of period | $12.38 | $13.20 | $15.05 | $17.24 | $14.37 | $12.56 | ||||||||||||||||||
|
| |||||||||||||||||||||||
Total returne | (2.51)% | (6.49)% | (11.13)% | 22.97% | 18.23% | (10.63)% | ||||||||||||||||||
| Ratios to average net assetsf | ||||||||||||||||||||||||
Expenses before waiver and payments by affiliates | 1.05% | 1.03% | 1.02% | 1.03% | 1.04% | 1.04% | ||||||||||||||||||
Expenses net of waiver and payments by affiliates | 1.03% | 1.03% | g | 1.02% | g | 1.03% | 1.04% | 1.04% | h | |||||||||||||||
Net investment income | 3.38% | 1.80% | 2.86% | c | 1.91% | 2.59% | 2.67% | |||||||||||||||||
| Supplemental data | ||||||||||||||||||||||||
Net assets, end of period (000’s) | $1,426,801 | $1,456,854 | $1,645,571 | $1,873,586 | $1,744,231 | $1,679,412 | ||||||||||||||||||
Portfolio turnover rate | 9.77% | 15.15% | 25.71% | 23.61% | 12.53% | 21.09% | ||||||||||||||||||
aThe amount shown for a share outstanding throughout the period may not correlate with the Statement of Operations for the period due to the timing of sales and repurchases of the Fund’s shares in relation to income earned and/or fluctuating fair value of the investments of the Fund.
bBased on average daily shares outstanding.
cNet investment income per share includes approximately $0.16 per share related to income received in the form of special dividends in connection with certain Fund holdings. Excluding these amounts, the ratio of net investment income to average net assets would have been 1.88%.
dAmount rounds to less than $0.01 per share.
eTotal return does not include fees, charges or expenses imposed by the variable annuity and life insurance contracts for which Franklin Templeton Variable Insurance Products Trust serves as an underlying investment vehicle. Total return is not annualized for periods less than one year.
fRatios are annualized for periods less than one year.
gBenefit of waiver and payments by affiliates rounds to less than 0.01%.
hBenefit of expense reduction rounds to less than 0.01%.
| TF-8 | Semiannual Report | The accompanying notes are an integral part of these financial statements. |
FRANKLIN TEMPLETON VARIABLE INSURANCE PRODUCTS TRUST
FINANCIAL HIGHLIGHTS
Templeton Foreign VIP Fund (continued)
Six Months Ended (unaudited) | Year Ended December 31, | |||||||||||||||||||||||
| 2015 | 2014 | 2013 | 2012 | 2011 | ||||||||||||||||||||
| Class 4 | ||||||||||||||||||||||||
| Per share operating performance (for a share outstanding throughout the period) | ||||||||||||||||||||||||
Net asset value, beginning of period | $13.29 | $15.16 | $17.37 | $14.48 | $12.66 | $14.43 | ||||||||||||||||||
|
| |||||||||||||||||||||||
| Income from investment operationsa: | ||||||||||||||||||||||||
Net investment incomeb | 0.21 | 0.25 | 0.46 | c | 0.28 | 0.33 | 0.36 | |||||||||||||||||
Net realized and unrealized gains (losses) | (0.55 | ) | (1.14 | ) | (2.36 | ) | 2.97 | 1.89 | (1.88 | ) | ||||||||||||||
|
| |||||||||||||||||||||||
Total from investment operations | (0.34 | ) | (0.89 | ) | (1.90 | ) | 3.25 | 2.22 | (1.52 | ) | ||||||||||||||
|
| |||||||||||||||||||||||
| Less distributions from: | ||||||||||||||||||||||||
Net investment income | (0.24 | ) | (0.48 | ) | (0.31 | ) | (0.36 | ) | (0.40 | ) | (0.25 | ) | ||||||||||||
Net realized gains | (0.23 | ) | (0.50 | ) | — | — | — | — | ||||||||||||||||
|
| |||||||||||||||||||||||
Total distributions | (0.47 | ) | (0.98 | ) | (0.31 | ) | (0.36 | ) | (0.40 | ) | (0.25 | ) | ||||||||||||
|
| |||||||||||||||||||||||
Redemption fees | — | — | — | d | — | d | — | d | — | d | ||||||||||||||
|
| |||||||||||||||||||||||
Net asset value, end of period | $12.48 | $13.29 | $15.16 | $17.37 | $14.48 | $12.66 | ||||||||||||||||||
|
| |||||||||||||||||||||||
Total returne | (2.52)% | (6.65)% | (11.22)% | 22.86% | 18.14% | (10.74)% | ||||||||||||||||||
| Ratios to average net assetsf | ||||||||||||||||||||||||
Expenses before waiver and payments by affiliates | 1.15% | 1.13% | 1.12% | 1.13% | 1.14% | 1.14% | ||||||||||||||||||
Expenses net of waiver and payments by affiliates | 1.13% | 1.13% | g | 1.12% | g | 1.13% | 1.14% | 1.14% | h | |||||||||||||||
Net investment income | 3.28% | 1.70% | 2.76% | c | 1.81% | 2.49% | 2.57% | |||||||||||||||||
| Supplemental data | ||||||||||||||||||||||||
Net assets, end of period (000’s) | $465,647 | $472,189 | $503,143 | $513,098 | $416,277 | $353,346 | ||||||||||||||||||
Portfolio turnover rate | 9.77% | 15.15% | 25.71% | 23.61% | 12.53% | 21.09% | ||||||||||||||||||
aThe amount shown for a share outstanding throughout the period may not correlate with the Statement of Operations for the period due to the timing of sales and repurchases of the Fund’s shares in relation to income earned and/or fluctuating fair value of the investments of the Fund.
bBased on average daily shares outstanding.
cNet investment income per share includes approximately $0.16 per share related to income received in the form of special dividends in connection with certain Fund holdings. Excluding these amounts, the ratio of net investment income to average net assets would have been 1.78%.
dAmount rounds to less than $0.01 per share.
eTotal return does not include fees, charges or expenses imposed by the variable annuity and life insurance contracts for which Franklin Templeton Variable Insurance Products Trust serves as an underlying investment vehicle. Total return is not annualized for periods less than one year.
fRatios are annualized for periods less than one year.
gBenefit of waiver and payments by affiliates rounds to less than 0.01%.
hBenefit of expense reduction rounds to less than 0.01%.
| The accompanying notes are an integral part of these financial statements. | Semiannual Report | TF-9 |
FRANKLIN TEMPLETON VARIABLE INSURANCE PRODUCTS TRUST
Statement of Investments, June 30, 2016 (unaudited)
Templeton Foreign VIP Fund
| ||||||||||||||
| Country | Shares | Value | ||||||||||||
Common Stocks 94.6% | ||||||||||||||
Aerospace & Defense 1.2% | ||||||||||||||
BAE Systems PLC | United Kingdom | 3,520,780 | $ | 24,599,746 | ||||||||||
|
| |||||||||||||
Airlines 0.7% | ||||||||||||||
Deutsche Lufthansa AG | Germany | 1,235,150 | 14,436,153 | |||||||||||
|
| |||||||||||||
Auto Components 3.0% | ||||||||||||||
Cie Generale des Etablissements Michelin, B | France | 308,070 | 29,136,902 | |||||||||||
Hyundai Mobis Co. Ltd. | South Korea | 121,198 | 26,495,043 | |||||||||||
Sumitomo Rubber Industries Ltd. | Japan | 485,500 | 6,407,519 | |||||||||||
|
| |||||||||||||
| 62,039,464 | ||||||||||||||
|
| |||||||||||||
Automobiles 3.6% | ||||||||||||||
Hero Motocorp Ltd. | India | 199,386 | 9,387,598 | |||||||||||
Hyundai Motor Co. | South Korea | 102,386 | 12,035,067 | |||||||||||
Nissan Motor Co. Ltd. | Japan | 4,424,800 | 39,327,271 | |||||||||||
Toyota Motor Corp., ADR | Japan | 136,317 | 13,630,337 | |||||||||||
|
| |||||||||||||
| 74,380,273 | ||||||||||||||
|
| |||||||||||||
Banks 12.7% | ||||||||||||||
Bangkok Bank PCL, fgn. | Thailand | 3,061,900 | 14,123,798 | |||||||||||
Barclays PLC | United Kingdom | 10,039,930 | 18,554,718 | |||||||||||
BNP Paribas SA | France | 918,660 | 40,536,848 | |||||||||||
Hana Financial Group Inc. | South Korea | 2,065,805 | 41,665,914 | |||||||||||
HSBC Holdings PLC | United Kingdom | 4,928,400 | 30,109,901 | |||||||||||
ING Groep NV, IDR | Netherlands | 1,388,234 | 14,143,648 | |||||||||||
KB Financial Group Inc., ADR | South Korea | 1,216,406 | 34,618,915 | |||||||||||
Societe Generale SA | France | 400,690 | 12,546,281 | |||||||||||
Standard Chartered PLC | United Kingdom | 2,939,781 | 22,131,778 | |||||||||||
UniCredit SpA | Italy | 7,093,840 | 15,511,401 | |||||||||||
United Overseas Bank Ltd. | Singapore | 1,574,400 | 21,532,055 | |||||||||||
|
| |||||||||||||
| 265,475,257 | ||||||||||||||
|
| |||||||||||||
Beverages 0.8% | ||||||||||||||
Suntory Beverage & Food Ltd. | Japan | 386,100 | 17,272,157 | |||||||||||
|
| |||||||||||||
Building Products 1.0% | ||||||||||||||
Compagnie de Saint-Gobain | France | 539,170 | 20,559,809 | |||||||||||
|
| |||||||||||||
Capital Markets 1.6% | ||||||||||||||
Credit Suisse Group AG | Switzerland | 1,208,852 | 12,768,430 | |||||||||||
GAM Holding AG | Switzerland | 654,050 | 6,935,168 | |||||||||||
UBS Group AG | Switzerland | 1,130,080 | 14,552,920 | |||||||||||
|
| |||||||||||||
| 34,256,518 | ||||||||||||||
|
| |||||||||||||
Chemicals 0.8% | ||||||||||||||
Johnson Matthey PLC | United Kingdom | 420,711 | 15,712,939 | |||||||||||
|
| |||||||||||||
Construction & Engineering 1.5% | ||||||||||||||
| a | Carillion PLC | United Kingdom | 3,835,100 | 11,955,883 | ||||||||||
Sinopec Engineering Group Co. Ltd. | China | 21,447,000 | 19,184,525 | |||||||||||
|
| |||||||||||||
| 31,140,408 | ||||||||||||||
|
| |||||||||||||
Construction Materials 1.1% | ||||||||||||||
CRH PLC | Ireland | 829,830 | 23,947,815 | |||||||||||
|
| |||||||||||||
Diversified Financial Services 0.4% | ||||||||||||||
Deutsche Boerse AG | Germany | 109,190 | 8,912,713 | |||||||||||
|
| |||||||||||||
| TF-10 | Semiannual Report |
FRANKLIN TEMPLETON VARIABLE INSURANCE PRODUCTS TRUST
STATEMENT OF INVESTMENTS (UNAUDITED)
Templeton Foreign VIP Fund (continued)
| Country | Shares | Value | ||||||||||||
Common Stocks (continued) | ||||||||||||||
Diversified Telecommunication Services 3.0% | ||||||||||||||
China Telecom Corp. Ltd., H | China | 53,618,357 | $ | 23,911,930 | ||||||||||
Telefonica SA, ADR | Spain | 2,390,332 | 22,660,347 | |||||||||||
Telenor ASA | Norway | 948,934 | 15,608,363 | |||||||||||
|
| |||||||||||||
| 62,180,640 | ||||||||||||||
|
| |||||||||||||
Electrical Equipment 1.2% | ||||||||||||||
ABB Ltd. | Switzerland | 1,255,890 | 24,600,570 | |||||||||||
|
| |||||||||||||
Electronic Equipment, Instruments & Components 1.1% | ||||||||||||||
Kingboard Chemical Holdings Ltd. | Hong Kong | 11,646,000 | 23,086,503 | |||||||||||
|
| |||||||||||||
Energy Equipment & Services 7.1% | ||||||||||||||
Ensign Energy Services Inc. | Canada | 2,009,500 | 11,275,346 | |||||||||||
Petrofac Ltd. | United Kingdom | 2,312,160 | 23,924,345 | |||||||||||
Precision Drilling Corp. | Canada | 4,296,000 | 22,775,018 | |||||||||||
SBM Offshore NV | Netherlands | 2,879,260 | 33,508,326 | |||||||||||
| b | Subsea 7 SA | United Kingdom | 2,173,050 | 21,118,505 | ||||||||||
Technip SA | France | 315,910 | 17,116,701 | |||||||||||
Tenaris SA | Italy | 1,320,175 | 19,063,920 | |||||||||||
|
| |||||||||||||
| 148,782,161 | ||||||||||||||
|
| |||||||||||||
Food & Staples Retailing 1.8% | ||||||||||||||
Metro AG | Germany | 500,660 | 15,265,287 | |||||||||||
| b | Tesco PLC | United Kingdom | 9,230,860 | 21,527,442 | ||||||||||
|
| |||||||||||||
| 36,792,729 | ||||||||||||||
|
| |||||||||||||
Health Care Equipment & Supplies 0.7% | ||||||||||||||
Getinge AB, B | Sweden | 737,270 | 15,054,154 | |||||||||||
|
| |||||||||||||
Health Care Providers & Services 1.9% | ||||||||||||||
Shanghai Pharmaceuticals Holding Co. Ltd., H | China | 6,579,500 | 14,484,576 | |||||||||||
Sinopharm Group Co. Ltd. | China | 5,173,200 | 24,637,620 | |||||||||||
|
| |||||||||||||
| 39,122,196 | ||||||||||||||
|
| |||||||||||||
Household Durables 0.4% | ||||||||||||||
Haier Electronics Group Co. Ltd. | China | 5,826,000 | 8,905,949 | |||||||||||
|
| |||||||||||||
Industrial Conglomerates 1.2% | ||||||||||||||
Siemens AG | Germany | 238,364 | 24,290,366 | |||||||||||
|
| |||||||||||||
Insurance 6.3% | ||||||||||||||
Aegon NV | Netherlands | 4,546,720 | 17,814,610 | |||||||||||
Aviva PLC | United Kingdom | 3,272,090 | 17,185,876 | |||||||||||
AXA SA | France | 1,317,458 | 26,036,474 | |||||||||||
China Life Insurance Co. Ltd., H | China | 5,057,000 | 10,833,007 | |||||||||||
Chubb Ltd. | United States | 190,979 | 24,962,865 | |||||||||||
Muenchener Rueckversicherungs-Gesellschaft AG | Germany | 69,590 | 11,605,523 | |||||||||||
NN Group NV | Netherlands | 463,600 | 12,758,833 | |||||||||||
Swiss Re AG | Switzerland | 133,120 | 11,558,160 | |||||||||||
|
| |||||||||||||
| 132,755,348 | ||||||||||||||
|
| |||||||||||||
Internet Software & Services 0.7% | ||||||||||||||
| b | Baidu Inc., ADR | China | 85,110 | 14,055,917 | ||||||||||
|
| |||||||||||||
Life Sciences Tools & Services 1.2% | ||||||||||||||
| b | MorphoSys AG | Germany | 195,900 | 8,117,005 | ||||||||||
| b | QIAGEN NV | Netherlands | 829,071 | 17,939,832 | ||||||||||
|
| |||||||||||||
| 26,056,837 | ||||||||||||||
|
| |||||||||||||
| Semiannual Report | TF-11 |
FRANKLIN TEMPLETON VARIABLE INSURANCE PRODUCTS TRUST
STATEMENT OF INVESTMENTS (UNAUDITED)
Templeton Foreign VIP Fund (continued)
| Country | Shares | Value | ||||||||||||
Common Stocks (continued) | ||||||||||||||
Metals & Mining 5.8% | ||||||||||||||
Barrick Gold Corp. | Canada | 1,328,790 | $ | 28,369,666 | ||||||||||
Glencore PLC | Switzerland | 10,884,600 | 22,183,924 | |||||||||||
HudBay Minerals Inc. | Canada | 2,956,000 | 14,115,409 | |||||||||||
Silver Wheaton Corp. | Canada | 2,430,900 | 57,212,034 | |||||||||||
|
| |||||||||||||
| 121,881,033 | ||||||||||||||
|
| |||||||||||||
Multiline Retail 0.6% | ||||||||||||||
Marks & Spencer Group PLC | United Kingdom | 2,982,260 | 12,673,251 | |||||||||||
|
| |||||||||||||
Oil, Gas & Consumable Fuels 9.5% | ||||||||||||||
BP PLC | United Kingdom | 8,425,285 | 49,222,976 | |||||||||||
Eni SpA | Italy | 1,623,262 | 26,161,259 | |||||||||||
Kunlun Energy Co. Ltd. | China | 9,276,000 | 7,651,838 | |||||||||||
LUKOIL PJSC, ADR | Russia | 160,535 | 6,705,547 | |||||||||||
PTT Exploration and Production PCL, fgn. | Thailand | 4,120,100 | 9,825,125 | |||||||||||
Royal Dutch Shell PLC, A | United Kingdom | 16,803 | 458,745 | |||||||||||
Royal Dutch Shell PLC, B | United Kingdom | 1,461,343 | 40,179,199 | |||||||||||
Suncor Energy Inc. | Canada | 922,000 | 25,574,243 | |||||||||||
Total SA, B | France | 695,596 | 33,492,690 | |||||||||||
|
| |||||||||||||
| 199,271,622 | ||||||||||||||
|
| |||||||||||||
Pharmaceuticals 10.4% | ||||||||||||||
Bayer AG | Germany | 216,810 | 21,658,343 | |||||||||||
GlaxoSmithKline PLC | United Kingdom | 1,330,855 | 28,472,848 | |||||||||||
Merck KGaA | Germany | 238,710 | 24,124,258 | |||||||||||
Novartis AG | Switzerland | 166,850 | 13,700,469 | |||||||||||
Roche Holding AG | Switzerland | 144,650 | 37,951,916 | |||||||||||
Sanofi | France | 455,845 | 37,906,909 | |||||||||||
Teva Pharmaceutical Industries Ltd., ADR | Israel | 809,648 | 40,668,619 | |||||||||||
UCB SA | Belgium | 164,360 | 12,259,389 | |||||||||||
|
| |||||||||||||
| 216,742,751 | ||||||||||||||
|
| |||||||||||||
Semiconductors & Semiconductor Equipment 1.4% | ||||||||||||||
| a | GCL-Poly Energy Holdings Ltd. | China | 141,417,000 | 18,592,031 | ||||||||||
Infineon Technologies AG | Germany | 764,445 | 11,009,232 | |||||||||||
|
| |||||||||||||
| 29,601,263 | ||||||||||||||
|
| |||||||||||||
Specialty Retail 0.5% | ||||||||||||||
Kingfisher PLC | United Kingdom | 2,345,266 | 10,085,148 | |||||||||||
|
| |||||||||||||
Technology Hardware, Storage & Peripherals 6.0% | ||||||||||||||
CANON Inc. | Japan | 533,600 | 15,048,269 | |||||||||||
Konica Minolta Inc. | Japan | 883,700 | 6,332,007 | |||||||||||
Quanta Computer Inc. | Taiwan | 7,299,000 | 13,825,151 | |||||||||||
Samsung Electronics Co. Ltd. | South Korea | 73,014 | 90,258,818 | |||||||||||
|
| |||||||||||||
| 125,464,245 | ||||||||||||||
|
| |||||||||||||
Trading Companies & Distributors 2.0% | ||||||||||||||
ITOCHU Corp. | Japan | 1,944,700 | 23,340,166 | |||||||||||
Posco Daewoo Corp. | South Korea | 869,005 | 18,846,509 | |||||||||||
|
| |||||||||||||
| 42,186,675 | ||||||||||||||
|
| |||||||||||||
| TF-12 | Semiannual Report |
FRANKLIN TEMPLETON VARIABLE INSURANCE PRODUCTS TRUST
STATEMENT OF INVESTMENTS (UNAUDITED)
Templeton Foreign VIP Fund (continued)
| Country | Shares | Value | ||||||||||||
Common Stocks (continued) | ||||||||||||||
Wireless Telecommunication Services 3.4% | ||||||||||||||
China Mobile Ltd. | China | 1,370,500 | $ | 15,677,342 | ||||||||||
SoftBank Group Corp. | Japan | 691,900 | 38,783,918 | |||||||||||
Vodafone Group PLC, ADR | United Kingdom | 562,353 | 17,371,084 | |||||||||||
|
| |||||||||||||
| 71,832,344 | ||||||||||||||
|
| |||||||||||||
Total Common Stocks (Cost $2,075,756,553) | 1,978,154,954 | |||||||||||||
|
| |||||||||||||
Short Term Investments 4.9% | ||||||||||||||
Money Market Funds (Cost $96,144,526) 4.6% | ||||||||||||||
| b,c | Institutional Fiduciary Trust Money Market Portfolio | United States | 96,144,526 | 96,144,526 | ||||||||||
|
| |||||||||||||
| d | Investments from Cash Collateral Received for Loaned Securities (Cost $7,952,392) 0.3% | |||||||||||||
Money Market Funds 0.3% | ||||||||||||||
| b,c | Institutional Fiduciary Trust Money Market Portfolio | United States | 7,952,392 | 7,952,392 | ||||||||||
|
| |||||||||||||
Total Investments (Cost $2,179,853,471) 99.5% | 2,082,251,872 | |||||||||||||
Other Assets, less Liabilities 0.5% | 9,702,033 | |||||||||||||
|
| |||||||||||||
Net Assets 100.0% | $ | 2,091,953,905 | ||||||||||||
|
| |||||||||||||
See Abbreviations on page TF-23.
aA portion or all of the security is on loan at June 30, 2016. See Note 1(c).
bNon-income producing.
cSee Note 3(e) regarding investments in affiliated management investment companies.
dSee Note 1(c) regarding securities on loan.
| The accompanying notes are an integral part of these financial statements. | Semiannual Report | TF-13 |
FRANKLIN TEMPLETON VARIABLE INSURANCE PRODUCTS TRUST
Financial Statements
Statements of Assets and Liabilities
June 30, 2016 (unaudited)
| Templeton Foreign VIP Fund | ||||
Assets: | ||||
Investments in securities: | ||||
Cost - Unaffiliated issuers | $ | 2,075,756,553 | ||
Cost - Non-controlled affiliates (Note 3e) | 104,096,918 | |||
|
| |||
Total cost of investments | $ | 2,179,853,471 | ||
|
| |||
Value - Unaffiliated issuers | $ | 1,978,154,954 | ||
Value - Non-controlled affiliates (Note 3e) | 104,096,918 | |||
|
| |||
Total value of investments (includes securities loaned in the amount $7,113,392) | 2,082,251,872 | |||
Cash | 390,128 | |||
Foreign currency, at value (cost and $832,589) | 832,971 | |||
Receivables: | ||||
Capital shares sold | 12,368,417 | |||
Dividends | 7,050,048 | |||
European Union tax reclaims | 911,264 | |||
Other assets | 929 | |||
|
| |||
Total assets | 2,103,805,629 | |||
|
| |||
Liabilities: | ||||
Payables: | ||||
Investment securities purchased | 837,392 | |||
Capital shares redeemed | 477,473 | |||
Management fees | 1,271,163 | |||
Distribution fees | 876,960 | |||
Payable upon return of securities loaned | 7,952,392 | |||
Deferred tax | 33,155 | |||
Accrued expenses and other liabilities | 403,189 | |||
|
| |||
Total liabilities | 11,851,724 | |||
|
| |||
Net assets, at value | $ | 2,091,953,905 | ||
|
| |||
Net assets consist of: | ||||
Paid-in capital | $ | 2,217,200,126 | ||
Undistributed net investment income | 35,402,855 | |||
Net unrealized appreciation (depreciation) | (97,800,662 | ) | ||
Accumulated net realized gain (loss) | (62,848,414 | ) | ||
|
| |||
Net assets, at value | $ | 2,091,953,905 | ||
|
| |||
| Class 1: | ||||
Net assets, at value | $ | 199,506,011 | ||
|
| |||
Shares outstanding | 15,809,200 | |||
|
| |||
Net asset value and maximum offering price per share | $ | 12.62 | ||
|
| |||
| Class 2: | ||||
Net assets, at value | $ | 1,426,800,919 | ||
|
| |||
Shares outstanding | 115,215,844 | |||
|
| |||
Net asset value and maximum offering price per share | $ | 12.38 | ||
|
| |||
| Class 4: | ||||
Net assets, at value | $ | 465,646,975 | ||
|
| |||
Shares outstanding | 37,304,306 | |||
|
| |||
Net asset value and maximum offering price per share | $ | 12.48 | ||
|
| |||
| TF-14 | Semiannual Report | The accompanying notes are an integral part of these financial statements. |
FRANKLIN TEMPLETON VARIABLE INSURANCE PRODUCTS TRUST
FINANCIAL STATEMENTS
Statements of Operations
for the six months ended June 30, 2016 (unaudited)
| Templeton Foreign VIP Fund | ||||
Investment income: | ||||
Dividends (net of foreign taxes of $4,947,590) | $ | 44,477,165 | ||
Income from securities loaned (net of fees and rebates) | 630,762 | |||
|
| |||
Total investment income | 45,107,927 | |||
|
| |||
Expenses: | ||||
Management fees (Note 3a) | 7,750,108 | |||
Distribution fees: (Note 3c) | ||||
Class 2 | 1,740,923 | |||
Class 4 | 792,740 | |||
Custodian fees (Note 4) | 109,911 | |||
Reports to shareholders | 176,552 | |||
Professional fees | 81,601 | |||
Trustees’ fees and expenses | 5,210 | |||
Other | 27,294 | |||
|
| |||
Total expenses | 10,684,339 | |||
Expenses waived/paid by affiliates (Note 3e) | (179,099 | ) | ||
|
| |||
Net expenses | 10,505,240 | |||
|
| |||
Net investment income | 34,602,687 | |||
|
| |||
Realized and unrealized gains (losses): | ||||
Net realized gain (loss) from: | ||||
Investments | (58,413,743 | ) | ||
Foreign currency transactions | 229,870 | |||
|
| |||
Net realized gain (loss) | (58,183,873 | ) | ||
|
| |||
Net change in unrealized appreciation (depreciation) on: | ||||
Investments | (31,139,542 | ) | ||
Translation of other assets and liabilities denominated in foreign currencies | (32,859 | ) | ||
Change in deferred taxes on unrealized appreciation | 55,339 | |||
|
| |||
Net change in unrealized appreciation (depreciation) | (31,117,062 | ) | ||
|
| |||
Net realized and unrealized gain (loss) | (89,300,935 | ) | ||
|
| |||
Net increase (decrease) in net assets resulting from operations | $ | (54,698,248 | ) | |
|
| |||
| The accompanying notes are an integral part of these financial statements. | Semiannual Report | TF-15 |
FRANKLIN TEMPLETON VARIABLE INSURANCE PRODUCTS TRUST
FINANCIAL STATEMENTS
Statements of Changes in Net Assets
| Templeton Foreign VIP Fund | ||||||||
| Six Months Ended June 30, 2016 (unaudited) | Year Ended December 31, 2015 | |||||||
Increase (decrease) in net assets: | ||||||||
Operations: | ||||||||
Net investment income | $ | 34,602,687 | $ | 42,572,642 | ||||
Net realized gain (loss) | (58,183,873 | ) | 36,800,340 | |||||
Net change in unrealized appreciation (depreciation) | (31,117,062 | ) | (219,790,040 | ) | ||||
|
| |||||||
Net increase (decrease) in net assets resulting from operations | (54,698,248 | ) | (140,417,058 | ) | ||||
|
| |||||||
Distributions to shareholders from: | ||||||||
Net investment income: | ||||||||
Class 1 | (4,469,747 | ) | (8,346,614 | ) | ||||
Class 2 | (28,417,976 | ) | (51,791,116 | ) | ||||
Class 4 | (8,605,853 | ) | (15,312,865 | ) | ||||
Net realized gains: | ||||||||
Class 1 | (3,504,221 | ) | (7,826,999 | ) | ||||
Class 2 | (25,453,391 | ) | (52,898,439 | ) | ||||
Class 4 | (8,118,929 | ) | (16,028,658 | ) | ||||
|
| |||||||
Total distributions to shareholders | (78,570,117 | ) | (152,204,691 | ) | ||||
|
| |||||||
Capital share transactions: (Note 2) | ||||||||
Class 1 | (1,643,566 | ) | (4,016,954 | ) | ||||
Class 2 | 61,864,384 | 11,936,472 | ||||||
Class 4 | 21,786,823 | 30,848,243 | ||||||
|
| |||||||
Total capital share transactions | 82,007,641 | 38,767,761 | ||||||
|
| |||||||
Net increase (decrease) in net assets | (51,260,724 | ) | (253,853,988 | ) | ||||
Net assets: | ||||||||
Beginning of period | 2,143,214,629 | 2,397,068,617 | ||||||
|
| |||||||
End of period | $ | 2,091,953,905 | $ | 2,143,214,629 | ||||
|
| |||||||
Undistributed net investment income included in net assets: | ||||||||
End of period | $ | 35,402,855 | $ | 42,293,744 | ||||
|
| |||||||
| TF-16 | Semiannual Report | The accompanying notes are an integral part of these financial statements. |
FRANKLIN TEMPLETON VARIABLE INSURANCE PRODUCTS TRUST
Notes to Financial Statements (unaudited)
Templeton Foreign VIP Fund
1. Organization and Significant Accounting Policies
Franklin Templeton Variable Insurance Products Trust (Trust) is registered under the Investment Company Act of 1940 (1940 Act) as an open-end management investment company, consisting of nineteen separate funds and applies the specialized accounting and reporting guidance in U.S. Generally Accepted Accounting Principles (U.S. GAAP). Templeton Foreign VIP Fund (Fund) is included in this report. The financial statements of the remaining funds in the Trust are presented separately. Shares of the Fund are generally sold only to insurance company separate accounts to fund the benefits of variable life insurance policies or variable annuity contracts. The Fund offers three classes of shares: Class 1, Class 2, and Class 4. Each class of shares differs by its distribution fees, voting rights on matters affecting a single class and its exchange privilege.
The following summarizes the Fund’s significant accounting policies.
a. Financial Instrument Valuation
The Fund’s investments in financial instruments are carried at fair value daily. Fair value is the price that would be received to sell an asset or paid to transfer a liability in an orderly transaction between market participants on the measurement date. The Fund calculates the net asset value (NAV) per share as of 4 p.m. Eastern time each day the New York Stock Exchange (NYSE) is open for trading. Under compliance policies and procedures approved by the Trust’s Board of Trustees (the Board), the Fund’s administrator has responsibility for oversight of valuation, including leading the cross-functional Valuation Committee (VC). The VC provides administration and oversight of the Fund’s valuation policies and procedures, which are approved annually by the Board. Among other things, these procedures allow the Fund to utilize independent pricing services, quotations from securities and financial instrument dealers, and other market sources to determine fair value.
Equity securities listed on an exchange or on the NASDAQ National Market System are valued at the last quoted sale price or the official closing price of the day, respectively. Foreign equity securities are valued as of the close of trading on the foreign stock exchange on which the security is primarily traded or as of 4 p.m. Eastern time whichever is earlier. The value is then converted into its U.S. dollar equivalent at the foreign exchange rate in effect at 4 p.m. Eastern time on the day that the value of the security is determined. Over-the-counter (OTC)
securities are valued within the range of the most recent quoted bid and ask prices. Securities that trade in multiple markets or on multiple exchanges are valued according to the broadest and most representative market. Certain equity securities are valued based upon fundamental characteristics or relationships to similar securities.
Investments in open-end mutual funds are valued at the closing NAV.
The Fund has procedures to determine the fair value of financial instruments for which market prices are not reliable or readily available. Under these procedures, the VC convenes on a regular basis to review such financial instruments and considers a number of factors, including significant unobservable valuation inputs, when arriving at fair value. The VC primarily employs a market-based approach which may use related or comparable assets or liabilities, recent transactions, market multiples, book values, and other relevant information for the investment to determine the fair value of the investment. An income-based valuation approach may also be used in which the anticipated future cash flows of the investment are discounted to calculate fair value. Discounts may also be applied due to the nature or duration of any restrictions on the disposition of the investments. Due to the inherent uncertainty of valuations of such investments, the fair values may differ significantly from the values that would have been used had an active market existed. The VC employs various methods for calibrating these valuation approaches including a regular review of key inputs and assumptions, transactional back-testing or disposition analysis, and reviews of any related market activity.
Trading in securities on foreign securities stock exchanges and OTC markets may be completed before 4 p.m. Eastern time. In addition, trading in certain foreign markets may not take place on every NYSE business day. Occasionally, events occur between the time at which trading in a foreign security is completed and the close of the NYSE that might call into question the reliability of the value of a portfolio security held by the Fund. As a result, differences may arise between the value of the Fund’s portfolio securities as determined at the foreign market close and the latest indications of value at the close of the NYSE. In order to minimize the potential for these differences, the VC monitors price movements following the close of trading in foreign stock markets through a series of country specific market proxies (such as baskets of American Depositary Receipts, futures contracts and exchange traded funds).
| Semiannual Report | TF-17 |
FRANKLIN TEMPLETON VARIABLE INSURANCE PRODUCTS TRUST
NOTES TO FINANCIAL STATEMENTS (UNAUDITED)
Templeton Foreign VIP Fund (continued)
1. Organization and Significant Accounting Policies (continued)
a. Financial Instrument Valuation (continued)
These price movements are measured against established trigger thresholds for each specific market proxy to assist in determining if an event has occurred that may call into question the reliability of the values of the foreign securities held by the Fund. If such an event occurs, the securities may be valued using fair value procedures, which may include the use of independent pricing services.
When the last day of the reporting period is a non-business day, certain foreign markets may be open on those days that the NYSE is closed, which could result in differences between the value of the Fund’s portfolio securities on the last business day and the last calendar day of the reporting period. Any significant security valuation changes due to an open foreign market are adjusted and reflected by the Fund for financial reporting purposes.
b. Foreign Currency Translation
Portfolio securities and other assets and liabilities denominated in foreign currencies are translated into U.S. dollars based on the exchange rate of such currencies against U.S. dollars on the date of valuation. The Fund may enter into foreign currency exchange contracts to facilitate transactions denominated in a foreign currency. Purchases and sales of securities, income and expense items denominated in foreign currencies are translated into U.S. dollars at the exchange rate in effect on the transaction date. Portfolio securities and assets and liabilities denominated in foreign currencies contain risks that those currencies will decline in value relative to the U.S. dollar. Occasionally, events may impact the availability or reliability of foreign exchange rates used to convert the U.S. dollar equivalent value. If such an event occurs, the foreign exchange rate will be valued at fair value using procedures established and approved by the Board.
The Fund does not separately report the effect of changes in foreign exchange rates from changes in market prices on securities held. Such changes are included in net realized and unrealized gain or loss from investments in the Statement of Operations.
Realized foreign exchange gains or losses arise from sales of foreign currencies, currency gains or losses realized between the trade and settlement dates on securities transactions and the difference between the recorded amounts of dividends, interest, and foreign withholding taxes and the U.S. dollar equivalent of the
amounts actually received or paid. Net unrealized foreign exchange gains and losses arise from changes in foreign exchange rates on foreign denominated assets and liabilities other than investments in securities held at the end of the reporting period.
c. Securities Lending
The Fund participates in an agency based securities lending program to earn additional income. The Fund receives cash collateral against the loaned securities in an amount equal to at least 102% of the fair value of the loaned securities. Collateral is maintained over the life of the loan in an amount not less than 100% of the fair value of loaned securities, as determined at the close of Fund business each day; any additional collateral required due to changes in security values is delivered to the Fund on the next business day. The collateral is deposited into a joint cash account with other funds and is used to invest in a money market fund managed by Franklin Advisers, Inc., an affiliate of the Fund. The Fund may receive income from the investment of cash collateral, in addition to lending fees and rebates paid by the borrower. Income from securities loaned, net of fees paid to the securities lending agent and/or third-party vendor, is reported separately in the Statement of Operations. The Fund bears the market risk with respect to the collateral investment, securities loaned, and the risk that the agent may default on its obligations to the Fund. If the borrower defaults on its obligation to return the securities loaned, the Fund has the right to repurchase the securities in the open market using the collateral received. The securities lending agent has agreed to indemnify the Fund in the event of default by a third party borrower.
d. Income and Deferred Taxes
It is the Fund’s policy to qualify as a regulated investment company under the Internal Revenue Code. The Fund intends to distribute to shareholders substantially all of its taxable income and net realized gains to relieve it from federal income and if applicable, excise taxes. As a result, no provision for U.S. federal income taxes is required.
The Fund may be subject to foreign taxation related to income received, capital gains on the sale of securities and certain foreign currency transactions in the foreign jurisdictions in which it invests. Foreign taxes, if any, are recorded based on the tax regulations and rates that exist in the foreign markets in which the Fund invests. When a capital gain tax is determined to apply, the Fund records an estimated deferred tax liability in
| TF-18 | Semiannual Report |
FRANKLIN TEMPLETON VARIABLE INSURANCE PRODUCTS TRUST
NOTES TO FINANCIAL STATEMENTS (UNAUDITED)
Templeton Foreign VIP Fund (continued)
an amount that would be payable if the securities were disposed of on the valuation date. As a result of several court cases, in certain countries across the European Union, the Fund filed additional tax reclaims for previously withheld taxes on dividends earned in those countries (EU reclaims). These additional filings are subject to various administrative proceedings by the local jurisdictions’ tax authorities within the European Union, as well as a number of related judicial proceedings. Income recognized, if any, for EU reclaims is reflected as other income in the Statement of Operations and any related receivable, if any, is reflected as European Union tax reclaims in the Statement of Assets and Liabilities. When uncertainty exists as to the ultimate resolution of these proceedings, the likelihood of receipt of these EU reclaims, and the potential timing of payment, no amounts are reflected in the financial statements.
The Fund may recognize an income tax liability related to its uncertain tax positions under U.S. GAAP when the uncertain tax position has a less than 50% probability that it will be sustained upon examination by the tax authorities based on its technical merits. As of June 30, 2016, the Fund has determined that no tax liability is required in its financial statements related to uncertain tax positions for any open tax years (or expected to be taken in future tax years). Open tax years are those that remain subject to examination and are based on each tax jurisdiction’s statute of limitation.
e. Security Transactions, Investment Income, Expenses and Distributions
Security transactions are accounted for on trade date. Realized gains and losses on security transactions are determined on a specific identification basis. Interest income and estimated expenses are accrued daily. Dividend income is recorded on the ex-dividend date except for certain dividends from foreign securities where the dividend rate is not available. In such cases, the dividend is recorded as soon as the information is received by the Fund. Distributions to shareholders are recorded on the ex-dividend date and are determined according to income tax regulations (tax basis). Distributable earnings determined on a tax basis may differ from earnings recorded in accordance with U.S. GAAP. These differences may be permanent or temporary. Permanent differences are reclassified among capital accounts to reflect their tax character. These reclassifications have no
impact on net assets or the results of operations. Temporary differences are not reclassified, as they may reverse in subsequent periods.
Common expenses incurred by the Trust are allocated among the Funds based on the ratio of net assets of each Fund to the combined net assets of the Trust. Fund specific expenses are charged directly to the fund that incurred the expense.
Realized and unrealized gains and losses and net investment income, not including class specific expenses, are allocated daily to each class of shares based upon the relative proportion of net assets of each class. Differences in per share distributions, by class, are generally due to differences in class specific expenses.
f. Accounting Estimates
The preparation of financial statements in accordance with U.S. GAAP requires management to make estimates and assumptions that affect the reported amounts of assets and liabilities at the date of the financial statements and the amounts of income and expenses during the reporting period. Actual results could differ from those estimates.
g. Redemption Fees
Redemptions and exchanges of interests in an insurance company subaccount that invested in Class 3 shares of the Fund were subject to a 1.0% short term trading fee if the interest in the subaccount had been held for less than 60 days. Such fees were retained by the Fund and accounted for as an addition to paid-in capital, allocated to each class of shares based upon the relative proportion of net assets of each class. There were no redemption fees for the period.
h. Guarantees and Indemnifications
Under the Trust’s organizational documents, its officers and trustees are indemnified by the Trust against certain liabilities arising out of the performance of their duties to the Trust. Additionally, in the normal course of business, the Trust, on behalf of the Fund, enters into contracts with service providers that contain general indemnification clauses. The Trust’s maximum exposure under these arrangements is unknown as this would involve future claims that may be made against the Trust that have not yet occurred. Currently, the Trust expects the risk of loss to be remote.
| Semiannual Report | TF-19 |
FRANKLIN TEMPLETON VARIABLE INSURANCE PRODUCTS TRUST
NOTES TO FINANCIAL STATEMENTS (UNAUDITED)
Templeton Foreign VIP Fund (continued)
2. Shares of Beneficial Interest
At June 30, 2016, there were an unlimited number of shares authorized (without par value). Transactions in the Fund’s shares were as follows:
| Six Months Ended June 30, 2016 | Year Ended December 31, 2015 | |||||||||||||||||||
| Shares | Amount | Shares | Amount | |||||||||||||||||
| Class 1 Shares: | ||||||||||||||||||||
Shares sold | 187,606 | $ | 2,408,488 | 454,466 | $ | 6,842,816 | ||||||||||||||
Shares issued in reinvestment of distributions | 633,861 | 7,973,968 | 1,057,790 | 16,173,612 | ||||||||||||||||
Shares redeemed | (924,389 | ) | (12,026,022 | ) | (1,792,103 | ) | (27,033,382 | ) | ||||||||||||
|
| |||||||||||||||||||
Net increase (decrease) | (102,922 | ) | $ | (1,643,566 | ) | (279,847 | ) | $ | (4,016,954 | ) | ||||||||||
|
| |||||||||||||||||||
| Class 2 Shares: | ||||||||||||||||||||
Shares sold | 8,819,370 | $ | 113,983,326 | 14,594,828 | $ | 213,082,680 | ||||||||||||||
Shares issued in reinvestment of distributions | 4,365,589 | 53,871,367 | 6,974,654 | 104,689,555 | ||||||||||||||||
Shares redeemed | (8,362,774 | ) | (105,990,309 | ) | (20,492,400 | ) | (305,835,763 | ) | ||||||||||||
|
| |||||||||||||||||||
Net increase (decrease) | 4,822,185 | $ | 61,864,384 | 1,077,082 | $ | 11,936,472 | ||||||||||||||
|
| |||||||||||||||||||
| Class 4 Shares: | ||||||||||||||||||||
Shares sold | 2,906,866 | $ | 36,677,027 | 5,690,434 | $ | 80,692,209 | ||||||||||||||
Shares issued on reinvestment of distributions | 1,344,436 | 16,724,782 | 2,072,852 | 31,341,523 | ||||||||||||||||
Shares redeemed | (2,473,404 | ) | (31,614,986 | ) | (5,429,602 | ) | (81,185,489 | ) | ||||||||||||
|
| |||||||||||||||||||
Net increase (decrease) | 1,777,898 | $ | 21,786,823 | 2,333,684 | $ | 30,848,243 | ||||||||||||||
|
| |||||||||||||||||||
3. Transactions With Affiliates
Franklin Resources, Inc. is the holding company for various subsidiaries that together are referred to as Franklin Templeton Investments. Certain officers and trustees of the Fund are also officers and/or directors of the following subsidiaries:
| Subsidiary | Affiliation | |
Templeton Investment Counsel, LLC (TIC) | Investment manager | |
Franklin Templeton Services, LLC (FT Services) | Administrative manager | |
Franklin Templeton Distributors, Inc. (Distributors) | Principal underwriter | |
Franklin Templeton Investor Services, LLC (Investor Services) | Transfer agent |
a. Management Fees
The Fund pays an investment management fee to TIC based on the average daily net assets of the Fund as follows:
| Annualized Fee Rate | Net Assets | |
0.900% | Up to and including $200 million | |
0.810% | Over $200 million, up to and including $700 million | |
0.775% | Over $700 million, up to and including $1.2 billion | |
0.750% | Over $1.2 billion, up to and including $1.3 billion | |
0.675% | Over $1.3 billion, up to and including $10 billion | |
0.655% | Over $10 billion, up to and including $15 billion | |
0.635% | Over $15 billion, up to and including $20 billion | |
0.615% | In excess of $20 billion |
| TF-20 | Semiannual Report |
FRANKLIN TEMPLETON VARIABLE INSURANCE PRODUCTS TRUST
NOTES TO FINANCIAL STATEMENTS (UNAUDITED)
Templeton Foreign VIP Fund (continued)
For the period ended June 30, 2016, the annualized effective investment management fee rate was 0.758% of the Fund’s average daily net assets.
b. Administrative Fees
Under an agreement with TIC, FT Services provides administrative services to the Fund. The fee is paid by TIC based on the Fund’s average daily net assets, and is not an additional expense of the Fund.
c. Distribution Fees
The Board has adopted distribution plans for Class 2 and Class 4 shares pursuant to Rule 12b-1 under the 1940 Act. Under the Fund’s compensation distribution plans, the Fund pays Distributors for costs incurred in connection with the servicing, sale and distribution of the Fund’s shares up to 0.25% and 0.35% per year of its average daily net assets of Class 2 and Class 4, respectively. The plan year, for purposes of monitoring compliance with the maximum annual plan rates, is February 1 through January 31.
d. Transfer Agent Fees
Investor Services, under terms of an agreement, performs shareholder servicing for the Fund and is not paid by the Fund for the services.
e. Investments in Affiliated Management Investment Companies
The Fund invests in one or more affiliated management investment companies for purposes other than exercising a controlling influence over the management or policies. Management fees paid by the Fund are waived on assets invested in the affiliated management investment companies, as noted in the Statement of Operations, in an amount not to exceed the management and administrative fees paid directly or indirectly by each affiliate. Prior to January 1, 2014, the waiver was accounted for as a reduction to management fees.
| Number of Shares Held at Beginning of Period | Gross Additions | Gross Reductions | Number of Shares Held at End of Period | Value at End of Period | Investment Income | Realized Gain (Loss) | % of Affiliated Fund Shares Outstanding Held at End of Period | |||||||||||||||||||||||||
| Non-Controlled Affiliates | ||||||||||||||||||||||||||||||||
Institutional Fiduciary Trust Money Market Portfolio | 71,421,269 | 685,470,192 | (652,794,543 | ) | 104,096,918 | $ | 104,096,918 | $ | — | $ | — | 0.5% | ||||||||||||||||||||
|
| |||||||||||||||||||||||||||||||
4. Expense Offset Arrangement
The Fund has entered into an arrangement with its custodian whereby credits realized as a result of uninvested cash balances are used to reduce a portion of the Fund’s custodian expenses. During the period ended June 30, 2016, there were no credits earned.
5. Income Taxes
At June 30, 2016, the cost of investments and net unrealized appreciation (depreciation) for income tax purposes were as follows:
Cost of investments | $ | 2,184,560,139 | ||
|
| |||
Unrealized appreciation | $ | 267,302,947 | ||
Unrealized depreciation | (369,611,214 | ) | ||
|
| |||
Net unrealized appreciation (depreciation) | $ | (102,308,267 | ) | |
|
|
Differences between income and/or capital gains as determined on a book basis and a tax basis are primarily due to differing treatment of foreign capital gains tax.
| Semiannual Report | TF-21 |
FRANKLIN TEMPLETON VARIABLE INSURANCE PRODUCTS TRUST
NOTES TO FINANCIAL STATEMENTS (UNAUDITED)
Templeton Foreign VIP Fund (continued)
6. Investment Transactions
Purchases and sales of investments (excluding short term securities) for the period ended June 30, 2016, aggregated $199,100,919 and $194,372,981, respectively.
At June 30, 2016, in connection with securities lending transactions, the Fund loaned equity investments and received $7,952,392 of cash collateral. The gross amount of recognized liability for such transactions is included in payable upon return of securities loaned in the Statement of Assets and Liabilities. The agreements can be terminated at any time.
7. Concentration of Risk
Investing in foreign securities may include certain risks and considerations not typically associated with investing in U.S. securities, such as fluctuating currency values and changing local and regional economic, political and social conditions, which may result in greater market volatility. In addition, certain foreign securities may not be as liquid as U.S. securities.
8. Credit Facility
The Fund, together with other U.S. registered and foreign investment funds (collectively, Borrowers), managed by Franklin Templeton Investments, are borrowers in a joint syndicated senior unsecured credit facility totaling $2 billion (Global Credit Facility) which matures on February 10, 2017. This Global Credit Facility provides a source of funds to the Borrowers for temporary and emergency purposes, including the ability to meet future unanticipated or unusually large redemption requests.
Under the terms of the Global Credit Facility, the Fund shall, in addition to interest charged on any borrowings made by the Fund and other costs incurred by the Fund, pay its share of fees and expenses incurred in connection with the implementation and maintenance of the Global Credit Facility, based upon its relative share of the aggregate net assets of all of the Borrowers, including an annual commitment fee of 0.07% based upon the unused portion of the Global Credit Facility. Effective February 12, 2016, the annual commitment fee is 0.15%. These fees are reflected in other expenses in the Statement of Operations. During the period ended June 30, 2016, the Fund did not use the Global Credit Facility.
9. Fair Value Measurements
The Fund follows a fair value hierarchy that distinguishes between market data obtained from independent sources (observable inputs) and the Fund’s own market assumptions (unobservable inputs). These inputs are used in determining the value of the Fund’s financial instruments and are summarized in the following fair value hierarchy:
| • | Level 1 – quoted prices in active markets for identical financial instruments |
| • | Level 2 – other significant observable inputs (including quoted prices for similar financial instruments, interest rates, prepayment speed, credit risk, etc.) |
| • | Level 3 – significant unobservable inputs (including the Fund’s own assumptions in determining the fair value of financial instruments) |
The input levels are not necessarily an indication of the risk or liquidity associated with financial instruments at that level.
For movements between the levels within the fair value hierarchy, the Fund has adopted a policy of recognizing the transfers as of the date of the underlying event which caused the movement.
A summary of inputs used as of June 30, 2016, in valuing the Fund’s assets carried at fair value were valued using Level 1 inputs. For detailed categories, see the accompanying Statement of Investments.
| TF-22 | Semiannual Report |
FRANKLIN TEMPLETON VARIABLE INSURANCE PRODUCTS TRUST
NOTES TO FINANCIAL STATEMENTS (UNAUDITED)
Templeton Foreign VIP Fund (continued)
10. Subsequent Events
The Fund has evaluated subsequent events through the issuance of the financial statements and determined that no events have occurred that require disclosure.
Abbreviations
| Selected Portfolio | ||
| ADR | American��Depositary Receipt | |
| IDR | International Depositary Receipt | |
| Semiannual Report | TF-23 |
FRANKLIN TEMPLETON VARIABLE INSURANCE PRODUCTS TRUST
Tax Information (unaudited)
Templeton Foreign VIP Fund
At December 31, 2015, more than 50% of the Fund’s total assets were invested in securities of foreign issuers. In most instances, foreign taxes were withheld from income paid to the Fund on these investments. As shown in the table below, the Fund hereby reports to shareholders the foreign source income and foreign taxes paid, pursuant to Section 853 of the Internal Revenue Code. This written statement will allow shareholders of record on June 14, 2016, to treat their proportionate share of foreign taxes paid by the Fund as having been paid directly by them. The shareholder shall consider these amounts as foreign taxes paid in the tax year in which they receive the Fund distribution.
The following table provides a detailed analysis of foreign tax paid, and foreign source income as reported by the Fund, to Class 1, Class 2, and Class 4 shareholders of record.
| Class | Foreign Tax Paid Per Share | Foreign Source Income Per Share | ||
Class 1 | $0.0241 | $0.3139 | ||
Class 2 | $0.0241 | $0.2779 | ||
Class 4 | $0.0241 | $0.2651 |
Foreign Tax Paid Per Share (Column 1) is the amount per share available to you, as a tax credit (assuming you held your shares in the Fund for a minimum of 16 days during the 31-day period beginning 15 days before the ex-dividend date of the Fund’s distribution to which the foreign taxes relate), or, as a tax deduction.
Foreign Source Income Per Share (Column 2) is the amount per share of income dividends attributable to foreign securities held by the Fund, plus any foreign taxes withheld on these dividends.
| TF-24 | Semiannual Report |
Templeton Global Bond VIP Fund
This semiannual report for Templeton Global Bond VIP Fund covers the period ended June 30, 2016.
Class 4 Performance Summary as of June 30, 2016
The Fund’s Class 4 shares had a -1.89% total return* for the six-month period ended June 30, 2016.
*The Fund has a fee waiver associated with any investment in a Franklin Templeton money fund and/or Franklin Templeton fund, as applicable, contractually guaranteed through at least the Fund’s current fiscal year-end. Fund investment results reflect the fee waiver, to the extent applicable; without this reduction, the results would have been lower.
Performance reflects the Fund’s Class 4 operating expenses, but does not include any contract fees, expenses or sales charges. If they had been included, performance would be lower. These charges and deductions, particularly for variable life policies, can have a significant effect on contract values and insurance benefits. See the contract prospectus for a complete description of these expenses, including sales charges.
Performance data represent past performance, which does not guarantee future results. Investment return and principal value will fluctuate, and you may have a gain or loss when you sell your shares. Current performance may differ from figures shown.
| Semiannual Report | TGB-1 |
TEMPLETON GLOBAL BOND VIP FUND
Fund Goal and Main Investments
The Fund seeks high current income, consistent with preservation of capital, with capital appreciation as a secondary consideration. Under normal market conditions, the Fund invests at least 80% of its net assets in bonds, which include debt securities of any maturity, such as bonds, notes, bills and debentures.
Fund Risks
All investments involve risks, including possible loss of principal. Currency rates may fluctuate significantly over short periods of time, and can reduce returns. Derivatives, including currency management strategies, involve costs and can create economic leverage in the portfolio that may result in significant volatility and cause the Fund to participate in losses (as well as enable gains) on an amount that exceeds the Fund’s initial investment. The Fund may not achieve the anticipated benefits and may realize losses when a counterparty fails to perform as promised. Foreign securities involve special risks, including currency fluctuations and economic and political uncertainties. Investments in emerging markets involve heightened risks related to the same factors, in addition to those associated with these markets’ smaller size and lesser liquidity. Sovereign debt securities are subject to various risks in addition to those relating to debt securities and foreign securities generally, including, but not limited to, the risk that a government entity may be unwilling or unable to pay interest and repay principal on its sovereign debt, or otherwise meet its obligations when due. Investments in lower rated bonds include higher risk of default and loss of principal. Changes in interest rates will affect the value of the Fund’s portfolio and its share price and yield. Bond prices generally move in the opposite direction of interest rates. As prices of bonds in the Fund adjust to a rise in interest rates, the Fund’s share price may decline. The markets for particular securities or types of securities are or may become relatively illiquid. Reduced liquidity will have an adverse impact on the security’s value and on the Fund’s ability to sell such securities when necessary to meet the Fund’s liquidity needs or in response to a specific market event. The Fund is also nondiversified, which involves the risk of greater price fluctuation than a more diversified portfolio. Changes in the financial strength of a bond issuer or in a bond’s credit rating may affect its value. The Fund is actively managed but there is no guarantee that the manager’s investment decisions will produce the desired results. The Fund’s prospectus also includes a description of the main investment risks.
Performance Overview
You can find the Fund’s six-month total return in the Performance Summary. For comparison, the Fund’s benchmarks, the J.P. Morgan (JPM) Global Government Bond Index (GGBI) posted a +10.58% total return and the Citigroup World Government Bond Index, posted a +10.74% total return for the same period.1
Economic and Market Overview
Global markets experienced periods of heightened volatility during the six-month period, as declines in oil prices and concerns about economic conditions in China and growth across the globe appeared at times to have negative effects on investor sentiment. Despite the near-term volatility, our medium-term investment convictions remained intact and we held the view that global market fundamentals would eventually re-emerge. During the second half of the period, a number of emerging markets recovered from the extraordinarily low valuation levels of January and February to achieve what we viewed as compelling positive appreciation for the full six-month period.
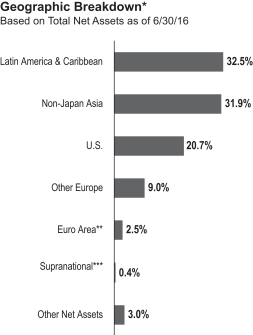
*Figures are stated as a percentage of total and may not equal 100% or may be negative due to rounding, use of any derivatives, unsettled trades or other factors.
**The Fund’s euro area investments were in Slovenia and Portugal.
***The Fund’s supranational investment was denominated in the Mexican peso.
1. Source: Morningstar. One cannot invest directly in an index, and an index is not representative of the Fund’s portfolio. Please see Index Descriptions following the Fund Summaries.
| TGB-2 | Semiannual Report |
TEMPLETON GLOBAL BOND VIP FUND
During the first two months of the year, markets appeared to regard emerging economies as being in near-crisis condition, reacting as if conditions were worse than the 2008 global financial crisis or the Asian financial crisis of 1997 and 1998. However, several emerging market economies were in far better shape, in our assessment, with larger foreign reserves and more diversified, growing economies. We were focused on the opportunities in specific emerging market currencies and believed that fears of a systemic crisis across the asset class were exaggerated. Over the final weeks of February, risk appetites returned and several local-currency markets rallied, creating a positive trend for global markets that largely carried into March and April, and through much of the remaining months of the period.
The U.S. Federal Reserve (Fed) passed on raising rates at its January, March, April and June meetings, while indicating that rate hikes would likely be more gradual than previously envisioned. The 10-year U.S. Treasury yield declined from 2.27% at the beginning of the period to 1.78% by the end of March. The result of the Fed’s dovishness was an implicit easing of policy, as markets essentially eliminated previously priced-in rate hikes for 2016. Consequently, the U.S. dollar weakened as the Japanese yen and euro notably strengthened. We believed the periods of yen and euro strength would prove temporary as we expected fundamentals to ultimately re-emerge in the currency valuations. Given U.S. labor market strength and underlying inflation pressures, we anticipated that the Fed would ultimately have to make a firmer commitment to rate hikes that would fortify the divergences in monetary policies between the easings of the European Central Bank and the Bank of Japan and the tightening of the Fed.
In May, market expectations for U.S. interest rate hikes increased sharply after hawkish-sounding comments were released in the Fed meeting minutes on May 18. However, those sentiments proved temporary, as the 10-year Treasury yield declined to 1.60% on June 15, the same day that the Fed announced rates would remain unchanged at 0.25%. Yields temporarily surged higher in the weeks after the Fed’s meeting due to growing expectations for a rate hike in the second half of 2016. However, the U.K.’s June 23 referendum vote to leave the European Union quickly altered global market sentiments—risk aversion escalated sharply, driving yields significantly lower as investors sought perceived safe havens amid the growing uncertainties surrounding the Brexit. Nonetheless, a number
of emerging market currencies rallied in the final weeks of the period, culminating in positive appreciations in a select number of markets such as Brazil, Indonesia and Malaysia.
Investment Strategy
We invest selectively in bonds around the world based upon our assessment of changing market, political and economic conditions. While seeking opportunities, we monitor various factors including changes in interest rates, currency exchange rates and credit risks. We seek to manage the Fund’s exposure to various currencies and may utilize currency forward contracts.
What is a currency forward contract?
A currency forward contract is an agreement between the Fund and a counterparty to buy or sell a foreign currency in exchange for another currency at a specific exchange rate on a future date.
Manager’s Discussion
Overall, we continued to position our strategies for rising rates by maintaining low portfolio duration and aiming at a negative correlation with U.S. Treasury returns. We also continued to actively seek select duration exposures that we believe can offer positive real yields without taking undue interest-rate risk, favoring countries that we believe have solid underlying fundamentals and prudent fiscal, monetary and financial policies. When investing globally, investment opportunities may take time to materialize, which may require weathering short-term volatility as the longer term investing theses develop. During the period, we shifted out of markets that we were previously contrarian on to reallocate to positions that we believe have fundamentally attractive valuations for the medium term ahead. We also maintained our exposures to several of our strongest investment convictions and added to those types of positions as prices became cheaper during periods of heightened volatility. Despite the persistence of volatility during the period, we remained encouraged by the vast set of what we considered fundamentally attractive valuations across the global bond and currency markets. We were positioned for depreciation of the euro and the Japanese yen, rising U.S. Treasury yields, and currency appreciation in select emerging markets. During the period, we used currency forward contracts to actively manage exposure to currencies. We also used interest rate swaps to tactically manage duration exposures.
| Semiannual Report | TGB-3 |
TEMPLETON GLOBAL BOND VIP FUND
What is duration?
Duration is a measure of a bond’s price sensitivity to interest rate changes. In general, a portfolio of securities with a lower duration can be expected to be less sensitive to interest rate changes than a portfolio with a higher duration.
What is an interest rate swap?
An interest rate swap is an agreement between two parties to exchange interest rate obligations, generally one based on an interest rate fixed to maturity and the other based on an interest rate that changes in accordance with changes in a designated benchmark (for example, LIBOR, prime, commercial paper or other benchmarks).
During the period, the Fund’s negative absolute performance was primarily attributable to currency positions. Interest rate strategies contributed to absolute return while sovereign credit exposures had a largely neutral effect. Among currencies, the Fund’s net-negative positions in the Japanese yen and the euro detracted from absolute performance. However, currency positions in Asia ex-Japan and Latin America contributed. The Fund maintained a defensive approach regarding interest rates in developed and emerging markets. Select duration exposures in Latin America and Asia ex-Japan contributed to absolute performance, while negative duration exposure to U.S. Treasuries detracted.
Relative to the JPM GGBI benchmark, the Fund’s underperformance was primarily attributable to interest rate strategies followed by currency positions. Sovereign credit exposures had a largely neutral effect on relative return. The Fund maintained a defensive approach regarding interest rates in developed and emerging markets. Select underweighted duration exposures in Europe detracted from relative performance, as did underweighted duration exposures in Japan and the U.S. However, select duration exposures in Latin America and Asia ex-Japan contributed to relative return. Among currencies, the Fund’s underweighted positions in the Japanese yen and the euro detracted from relative performance. However, overweighted currency positions in Asia ex-Japan and Latin America contributed to relative return, as did underweighted exposure to the British pound.
Thank you for your participation in Templeton Global Bond VIP Fund. We look forward to serving your future investment needs.
The foregoing information reflects our analysis, opinions and portfolio holdings as of June 30, 2016, the end of the reporting period. The way we implement our main investment strategies and the resulting portfolio holdings may change depending on factors such as market and economic conditions. These opinions may not be relied upon as investment advice or an offer for a particular security. The information is not a complete analysis of every aspect of any market, country, industry, security or the Fund. Statements of fact are from sources considered reliable, but the investment manager makes no representation or warranty as to their completeness or accuracy. Although historical performance is no guarantee of future results, these insights may help you understand our investment management philosophy.
| Currency Breakdown* | ||||
| 6/30/16 | ||||
| % of Total Net Assets | ||||
| Americas | 139.5% | |||
| U.S. Dollar | 103.6% | |||
| Mexican Peso | 21.3% | |||
| Brazilian Real | 9.4% | |||
| Chilean Peso | 3.0% | |||
| Peruvian Nuevo Sol | 0.1% | |||
| Asia Pacific | 2.4% | |||
| Malaysian Ringgit | 14.4% | |||
| Indonesian Rupiah | 9.7% | |||
| Indian Rupee | 6.8% | |||
| Philippine Peso | 2.7% | |||
| Sri Lankan Rupee | 1.2% | |||
| Singapore Dollar | 0.1% | |||
| Japanese Yen | -32.5% | |||
| Europe | -33.0% | |||
| Polish Zloty | 3.1% | |||
| Euro | -36.1% | |||
| Australia & New Zealand | -8.9% | |||
| Australian Dollar | -8.9% | |||
*Figures are stated as a percentage of total and may not equal 100% or may be negative due to rounding, use of any derivatives, unsettled trades or other factors.
The dollar value, number of shares or principal amount, and names of all portfolio holdings are listed in the Fund’s Statement of Investments (SOI).
| TGB-4 | Semiannual Report |
TEMPLETON GLOBAL BOND VIP FUND
Class 4 Fund Expenses
As an investor in a variable insurance contract (Contract) that indirectly provides for investment in an underlying mutual fund, you can incur transaction and/or ongoing expenses at both the Fund level and the Contract level.
| • | Transaction expenses can include sales charges (loads) on purchases, surrender fees, transfer fees and premium taxes. |
| • | Ongoing expenses can include management fees, distribution and service (12b-1) fees, contract fees, annual maintenance fees, mortality and expense risk fees and other fees and expenses. All mutual funds and Contracts have some types of ongoing expenses. |
The expenses shown in the table are meant to highlight ongoing expenses at the Fund level only and do not include ongoing expenses at the Contract level, or transaction expenses at either the Fund or Contract levels. While the Fund does not have transaction expenses, if the transaction and ongoing expenses at the Contract level were included, the expenses shown below would be higher. You should consult your Contract prospectus or disclosure document for more information.
The table shows Fund-level ongoing expenses and can help you understand these expenses and compare them with those of other mutual funds offered through the Contract. The table assumes a $1,000 investment held for the six months indicated. Please refer to the Fund prospectus for additional information on operating expenses.
Actual Fund Expenses
The first line (Actual) of the table provides actual account values and expenses. The “Ending Account Value” is derived from the Fund’s actual return, which includes the effect of ongoing Fund expenses, but does not include the effect of ongoing Contract expenses.
You can estimate the Fund-level expenses you incurred during the period by following these steps. Of course, your account value and expenses will differ from those in this illustration:
| 1. | Divide your account value by $1,000. |
If an account had an $8,600 value, then $8,600 ÷ $1,000 = 8.6.
| 2. | Multiply the result by the number under the heading “Fund-Level Expenses Incurred During Period.” |
If Fund-Level Expenses Incurred During Period were $7.50, then 8.6 × $7.50 = $64.50.
In this illustration, the estimated expenses incurred this period at the Fund level are $64.50.
Hypothetical Example for Comparison with Other Mutual Funds
Information in the second line (Hypothetical) of the table can help you compare ongoing expenses of the Fund with those of other mutual funds offered through the Contract. This information may not be used to estimate the actual ending account balance or expenses you incurred during the period. The hypothetical “Ending Account Value” is based on the Fund’s actual expense ratio and an assumed 5% annual rate of return before expenses, which does not represent the Fund’s actual return. The figure under the heading “Fund-Level Expenses Incurred During Period” shows the hypothetical expenses your account would have incurred under this scenario. You can compare this figure with the 5% hypothetical examples that appear in shareholder reports of other funds offered through a Contract.
| Class 4 | Beginning Account Value 1/1/16 | Ending Account Value 6/30/16 | Fund-Level Expenses 1/1/16–6/30/16 | |||||||||
Actual | $ | 1,000 | $ | 981.10 | $ | 4.09 | ||||||
Hypothetical (5% return before expenses) | $ | 1,000 | $ | 1,020.74 | $ | 4.17 | ||||||
*Expenses are calculated using the most recent six-month annualized expense ratio, net of expense waivers, for the Fund’s Class 4 shares (0.83%), which does not include any ongoing expenses of the Contract for which the Fund is an investment option, multiplied by the average account value over the period, multiplied by 182/366 to reflect the one-half year period.
| Semiannual Report | TGB-5 |
FRANKLIN TEMPLETON VARIABLE INSURANCE PRODUCTS TRUST
Financial Highlights
Templeton Global Bond VIP Fund
Six Months Ended June 30, 2016 (unaudited) | Year Ended December 31, | |||||||||||||||||||||||
| 2015 | 2014 | 2013 | 2012 | 2011 | ||||||||||||||||||||
| Class 1 | ||||||||||||||||||||||||
Per share operating performance (for a share outstanding throughout the period) | ||||||||||||||||||||||||
Net asset value, beginning of period | $16.34 | $18.56 | $19.15 | $20.01 | $18.61 | $19.94 | ||||||||||||||||||
|
| |||||||||||||||||||||||
| Income from investment operationsa: | ||||||||||||||||||||||||
Net investment incomeb | 0.29 | 0.52 | 0.58 | 0.64 | 0.72 | 0.87 | ||||||||||||||||||
Net realized and unrealized gains (losses) | (0.57 | ) | (1.22 | ) | (0.16 | ) | (0.30 | ) | 1.99 | (0.92 | ) | |||||||||||||
|
| |||||||||||||||||||||||
Total from investment operations | (0.28 | ) | (0.70 | ) | 0.42 | 0.34 | 2.71 | (0.05 | ) | |||||||||||||||
|
| |||||||||||||||||||||||
| Less distributions from: | ||||||||||||||||||||||||
Net investment income and net foreign currency gains | — | (1.43 | ) | (1.01 | ) | (0.96 | ) | (1.28 | ) | (1.15 | ) | |||||||||||||
Net realized gains | (0.01 | ) | (0.09 | ) | — | (0.24 | ) | (0.03 | ) | (0.13 | ) | |||||||||||||
|
| |||||||||||||||||||||||
Total distributions | (0.01 | ) | (1.52 | ) | (1.01 | ) | (1.20 | ) | (1.31 | ) | (1.28 | ) | ||||||||||||
|
| |||||||||||||||||||||||
Redemption fees | — | — | — | c | — | c | — | c | — | c | ||||||||||||||
|
| |||||||||||||||||||||||
Net asset value, end of period | $16.05 | $16.34 | $18.56 | $19.15 | $20.01 | $18.61 | ||||||||||||||||||
|
| |||||||||||||||||||||||
Total returnd | (1.69)% | (4.10)% | 2.12% | 1.89% | 15.31% | (0.61)% | ||||||||||||||||||
| Ratios to average net assetse | ||||||||||||||||||||||||
Expenses before waiver and payments by affiliates | 0.52% | 0.52% | 0.51% | 0.51% | 0.55% | 0.56% | ||||||||||||||||||
Expenses net of waiver and payments by affiliatesf | 0.48% | 0.52% | g | 0.51% | 0.51% | 0.55% | 0.56% | |||||||||||||||||
Net investment income | 3.70% | 2.99% | 3.08% | 3.26% | 3.71% | 4.40% | ||||||||||||||||||
| Supplemental data | ||||||||||||||||||||||||
Net assets, end of period (000’s) | $278,297 | $292,802 | $323,491 | $280,963 | $307,142 | $269,819 | ||||||||||||||||||
Portfolio turnover rate | 26.80% | 51.58% | 39.14% | 34.39% | 43.26% | 34.18% | ||||||||||||||||||
aThe amount shown for a share outstanding throughout the period may not correlate with the Statement of Operations for the period due to the timing of sales and repurchases of the Fund’s shares in relation to income earned and/or fluctuating fair value of the investments of the Fund.
bBased on average daily shares outstanding.
cAmount rounds to less than $0.01 per share.
dTotal return does not include fees, charges or expenses imposed by the variable annuity and life insurance contracts for which Franklin Templeton Variable Insurance Products Trust serves as an underlying investment vehicle. Total return is not annualized for periods less than one year.
eRatios are annualized for periods less than one year.
fBenefit of expense reduction rounds to less than 0.01%.
gBenefit of waiver and payments by affiliates rounds to less than 0.01%.
| TGB-6 | Semiannual Report | The accompanying notes are an integral part of these financial statements. |
FRANKLIN TEMPLETON VARIABLE INSURANCE PRODUCTS TRUST
FINANCIAL HIGHLIGHTS
Templeton Global Bond VIP Fund (continued)
Six Months Ended June 30, 2016 (unaudited) | Year Ended December 31, | |||||||||||||||||||||||
| 2015 | 2014 | 2013 | 2012 | 2011 | ||||||||||||||||||||
| Class 2 | ||||||||||||||||||||||||
Per share operating performance (for a share outstanding throughout the period) | ||||||||||||||||||||||||
Net asset value, beginning of period | $15.80 | $17.99 | $18.60 | $19.47 | $18.15 | $19.49 | ||||||||||||||||||
|
| |||||||||||||||||||||||
| Income from investment operationsa: | ||||||||||||||||||||||||
Net investment incomeb | 0.26 | 0.46 | 0.52 | 0.57 | 0.65 | 0.79 | ||||||||||||||||||
Net realized and unrealized gains (losses) | (0.56 | ) | (1.17 | ) | (0.17 | ) | (0.27 | ) | 1.94 | (0.89 | ) | |||||||||||||
|
| |||||||||||||||||||||||
Total from investment operations | (0.30 | ) | (0.71 | ) | 0.35 | 0.30 | 2.59 | (0.10 | ) | |||||||||||||||
|
| |||||||||||||||||||||||
| Less distributions from: | ||||||||||||||||||||||||
Net investment income and net foreign currency gains | — | (1.39 | ) | (0.96 | ) | (0.93 | ) | (1.24 | ) | (1.11 | ) | |||||||||||||
Net realized gains | (0.01 | ) | (0.09 | ) | — | (0.24 | ) | (0.03 | ) | (0.13 | ) | |||||||||||||
|
| |||||||||||||||||||||||
Total distributions | (0.01 | ) | (1.48 | ) | (0.96 | ) | (1.17 | ) | (1.27 | ) | (1.24 | ) | ||||||||||||
|
| |||||||||||||||||||||||
Redemption fees | — | — | — | c | — | c | — | c | — | c | ||||||||||||||
|
| |||||||||||||||||||||||
Net asset value, end of period | $15.49 | $15.80 | $17.99 | $18.60 | $19.47 | $18.15 | ||||||||||||||||||
|
| |||||||||||||||||||||||
Total returnd | (1.88)% | (4.30)% | 1.83% | 1.63% | 15.07% | (0.87)% | ||||||||||||||||||
| Ratios to average net assetse | ||||||||||||||||||||||||
Expenses before waiver and payments by affiliates | 0.77% | 0.77% | 0.76% | 0.76% | 0.80% | 0.81% | ||||||||||||||||||
Expenses net of waiver and payments by affiliatesf | 0.73% | 0.77% | g | 0.76% | 0.76% | 0.80% | 0.81% | |||||||||||||||||
Net investment income | 3.45% | 2.74% | 2.83% | 3.01% | 3.46% | 4.15% | ||||||||||||||||||
| Supplemental data | ||||||||||||||||||||||||
Net assets, end of period (000’s) | $2,845,200 | $2,971,667 | $3,177,638 | $2,826,039 | $2,418,229 | $1,812,814 | ||||||||||||||||||
Portfolio turnover rate | 26.80% | 51.58% | 39.14% | 34.39% | 43.26% | 34.18% | ||||||||||||||||||
aThe amount shown for a share outstanding throughout the period may not correlate with the Statement of Operations for the period due to the timing of sales and repurchases of the Fund’s shares in relation to income earned and/or fluctuating fair value of the investments of the Fund.
bBased on average daily shares outstanding.
cAmount rounds to less than $0.01 per share.
dTotal return does not include fees, charges or expenses imposed by the variable annuity and life insurance contracts for which Franklin Templeton Variable Insurance Products Trust serves as an underlying investment vehicle. Total return is not annualized for periods less than one year.
eRatios are annualized for periods less than one year.
fBenefit of expense reduction rounds to less than 0.01%.
gBenefit of waiver and payments by affiliates rounds to less than 0.01%.
| The accompanying notes are an integral part of these financial statements. | Semiannual Report | TGB-7 |
FRANKLIN TEMPLETON VARIABLE INSURANCE PRODUCTS TRUST
FINANCIAL HIGHLIGHTS
Templeton Global Bond VIP Fund (continued)
Six Months Ended June 30, 2016 (unaudited) | Year Ended December 31, | |||||||||||||||||||||||
| 2015 | 2014 | 2013 | 2012 | 2011 | ||||||||||||||||||||
| Class 4 | ||||||||||||||||||||||||
Per share operating performance (for a share outstanding throughout the period) | ||||||||||||||||||||||||
Net asset value, beginning of period | $16.18 | $18.38 | $18.97 | $19.82 | $18.44 | $19.78 | ||||||||||||||||||
|
| |||||||||||||||||||||||
| Income from investment operationsa: | ||||||||||||||||||||||||
Net investment incomeb | 0.26 | 0.46 | 0.51 | 0.56 | 0.64 | 0.79 | ||||||||||||||||||
Net realized and unrealized gains (losses) | (0.57 | ) | (1.21 | ) | (0.18 | ) | (0.28 | ) | 1.98 | (0.91 | ) | |||||||||||||
|
| |||||||||||||||||||||||
Total from investment operations | (0.31 | ) | (0.75 | ) | 0.33 | 0.28 | 2.62 | (0.12 | ) | |||||||||||||||
|
| |||||||||||||||||||||||
| Less distributions from: | ||||||||||||||||||||||||
Net investment income and net foreign currency gains | — | (1.36 | ) | (0.92 | ) | (0.89 | ) | (1.21 | ) | (1.09 | ) | |||||||||||||
Net realized gains | (0.01 | ) | (0.09 | ) | — | (0.24 | ) | (0.03 | ) | (0.13 | ) | |||||||||||||
|
| |||||||||||||||||||||||
Total distributions | (0.01 | ) | (1.45 | ) | (0.92 | ) | (1.13 | ) | (1.24 | ) | (1.22 | ) | ||||||||||||
|
| |||||||||||||||||||||||
Redemption fees | — | — | — | c | — | c | — | c | — | c | ||||||||||||||
|
| |||||||||||||||||||||||
Net asset value, end of period | $15.86 | $16.18 | $18.38 | $18.97 | $19.82 | $18.44 | ||||||||||||||||||
|
| |||||||||||||||||||||||
Total returnd | (1.89)% | (4.39)% | 1.69% | 1.54% | 14.97% | (0.96)% | ||||||||||||||||||
| Ratios to average net assetse | ||||||||||||||||||||||||
Expenses before waiver and payments by affiliates | 0.87% | 0.87% | 0.86% | 0.86% | 0.90% | 0.91% | ||||||||||||||||||
Expenses net of waiver and payments by affiliatesf | 0.83% | 0.87% | g | 0.86% | 0.86% | 0.90% | 0.91% | |||||||||||||||||
Net investment income | 3.35% | 2.64% | 2.73% | 2.91% | 3.36% | 4.05% | ||||||||||||||||||
| Supplemental data | ||||||||||||||||||||||||
Net assets, end of period (000’s) | $96,735 | $103,045 | $111,199 | $118,145 | $163,241 | $151,695 | ||||||||||||||||||
Portfolio turnover rate | 26.80% | 51.58% | 39.14% | 34.39% | 43.26% | 34.18% | �� | |||||||||||||||||
aThe amount shown for a share outstanding throughout the period may not correlate with the Statement of Operations for the period due to the timing of sales and repurchases of the Fund’s shares in relation to income earned and/or fluctuating fair value of the investments of the Fund.
bBased on average daily shares outstanding.
cAmount rounds to less than $0.01 per share.
dTotal return does not include fees, charges or expenses imposed by the variable annuity and life insurance contracts for which Franklin Templeton Variable Insurance Products Trust serves as an underlying investment vehicle. Total return is not annualized for periods less than one year.
eRatios are annualized for periods less than one year.
fBenefit of expense reduction rounds to less than 0.01%.
gBenefit of waiver and payments by affiliates rounds to less than 0.01%.
| TGB-8 | Semiannual Report | The accompanying notes are an integral part of these financial statements. |
FRANKLIN TEMPLETON VARIABLE INSURANCE PRODUCTS TRUST
Statement of Investments, June 30, 2016 (unaudited)
Templeton Global Bond VIP Fund
| ||||||||||
| Principal Amount* | Value | |||||||||
Foreign Government and Agency Securities 73.1% | ||||||||||
Brazil 9.4% | ||||||||||
Letra Tesouro Nacional, Strip, | ||||||||||
7/01/16 | 1,190a | BRL | $ | 370,384 | ||||||
10/01/16 | 4,700a | BRL | 1,414,899 | |||||||
1/01/17 | 46,660a | BRL | 13,610,764 | |||||||
1/01/18 | 28,770a | BRL | 7,476,406 | |||||||
1/01/19 | 38,960a | BRL | 9,069,720 | |||||||
7/01/19 | 102,840a | BRL | 22,653,959 | |||||||
Nota Do Tesouro Nacional, | ||||||||||
10.00%, 1/01/21 | 6,620a | BRL | 1,925,248 | |||||||
10.00%, 1/01/23 | 402,350a | BRL | 114,324,685 | |||||||
10.00%, 1/01/25 | 48,340a | BRL | 13,540,807 | |||||||
10.00%, 1/01/27 | 26,400a | BRL | 7,283,180 | |||||||
b Index Linked, 6.00%, 8/15/16 | 14,388a | BRL | 12,942,824 | |||||||
b Index Linked, 6.00%, 5/15/17 | 202a | BRL | 181,350 | |||||||
b Index Linked, 6.00%, 8/15/18 | 15,665a | BRL | 14,023,811 | |||||||
b Index Linked, 6.00%, 5/15/19 | 8,578a | BRL | 7,698,535 | |||||||
b Index Linked, 6.00%, 8/15/20 | 1,090a | BRL | 971,979 | |||||||
b Index Linked, 6.00%, 8/15/22 | 18,770a | BRL | 16,711,621 | |||||||
b Index Linked, 6.00%, 5/15/23 | 5,716a | BRL | 5,077,246 | |||||||
b Index Linked, 6.00%, 8/15/24 | 3,110a | BRL | 2,793,389 | |||||||
b Index Linked, 6.00%, 5/15/45 | 10,825a | BRL | 9,704,744 | |||||||
senior note, 10.00%, 1/01/17 | 113,220a | BRL | 34,631,210 | |||||||
senior note, 10.00%, 1/01/19 | 21,390a | BRL | 6,364,291 | |||||||
|
| |||||||||
| 302,771,052 | ||||||||||
|
| |||||||||
Colombia 2.1% | ||||||||||
Government of Colombia, senior bond, | ||||||||||
7.75%, 4/14/21 | 2,386,000,000 | COP | 841,625 | |||||||
4.375%, 3/21/23 | 362,000,000 | COP | 106,348 | |||||||
9.85%, 6/28/27 | 576,000,000 | COP | 232,217 | |||||||
Titulos De Tesoreria B, | ||||||||||
5.00%, 11/21/18 | 2,882,000,000 | COP | 950,301 | |||||||
7.75%, 9/18/30 | 71,450,000,000 | COP | 24,741,106 | |||||||
senior bond, 11.25%, 10/24/18 | 5,135,000,000 | COP | 1,921,086 | |||||||
senior bond, 7.00%, 5/04/22 | 7,908,000,000 | COP | 2,699,847 | |||||||
senior bond, 10.00%, 7/24/24 | 17,731,000,000 | COP | 7,056,364 | |||||||
senior bond, 7.50%, 8/26/26 | 47,952,000,000 | COP | 16,323,369 | |||||||
senior bond, 6.00%, 4/28/28 | 25,729,000,000 | COP | 7,737,907 | |||||||
senior note, 7.00%, 9/11/19 | 4,056,000,000 | COP | 1,397,178 | |||||||
senior note, B, 11.00%, 7/24/20 | 9,167,000,000 | COP | 3,595,649 | |||||||
|
| |||||||||
| 67,602,997 | ||||||||||
|
| |||||||||
India 4.6% | ||||||||||
Government of India, | ||||||||||
senior bond, 7.80%, 5/03/20 | 270,800,000 | INR | 4,078,219 | |||||||
senior bond, 8.35%, 5/14/22 | 212,700,000 | INR | 3,265,328 | |||||||
senior bond, 9.15%, 11/14/24 | 2,409,000,000 | INR | 39,009,150 | |||||||
senior bond, 8.33%, 7/09/26 | 1,482,000,000 | INR | 23,004,175 | |||||||
senior bond, 8.15%, 11/24/26 | 2,159,000,000 | INR | 33,031,960 | |||||||
senior bond, 8.28%, 9/21/27 | 217,800,000 | INR | 3,362,982 | |||||||
senior bond, 8.60%, 6/02/28 | 747,500,000 | INR | 11,819,469 | |||||||
senior note, 7.28%, 6/03/19 | 28,000,000 | INR | 416,333 | |||||||
| Semiannual Report | TGB-9 |
FRANKLIN TEMPLETON VARIABLE INSURANCE PRODUCTS TRUST
STATEMENT OF INVESTMENTS (UNAUDITED)
Templeton Global Bond VIP Fund (continued)
| Principal Amount* | Value | |||||||||
Foreign Government and Agency Securities (continued) | ||||||||||
India (continued) | ||||||||||
senior note, 7.16%, 5/20/23 | 133,700,000 | INR | $ | 1,939,313 | ||||||
senior note, 8.83%, 11/25/23 | 1,805,900,000 | INR | 28,516,766 | |||||||
|
| |||||||||
| 148,443,695 | ||||||||||
|
| |||||||||
Indonesia 5.8% | ||||||||||
Government of Indonesia, | ||||||||||
7.875%, 4/15/19 | 187,065,000,000 | IDR | 14,420,111 | |||||||
6.125%, 5/15/28 | 37,000,000 | IDR | 2,467 | |||||||
8.375%, 3/15/34 | 81,180,000,000 | IDR | 6,528,195 | |||||||
FR31, 11.00%, 11/15/20 | 243,080,000,000 | IDR | 20,973,404 | |||||||
FR34, 12.80%, 6/15/21 | 392,506,000,000 | IDR | 36,465,535 | |||||||
FR35, 12.90%, 6/15/22 | 71,229,000,000 | IDR | 6,825,049 | |||||||
FR36, 11.50%, 9/15/19 | 49,810,000,000 | IDR | 4,229,845 | |||||||
FR39, 11.75%, 8/15/23 | 5,491,000,000 | IDR | 513,775 | |||||||
FR40, 11.00%, 9/15/25 | 46,856,000,000 | IDR | 4,379,729 | |||||||
FR43, 10.25%, 7/15/22 | 147,832,000,000 | IDR | 12,766,417 | |||||||
FR44, 10.00%, 9/15/24 | 4,454,000,000 | IDR | 389,862 | |||||||
FR46, 9.50%, 7/15/23 | 226,780,000,000 | IDR | 19,180,916 | |||||||
FR47, 10.00%, 2/15/28 | 12,000,000 | IDR | 1,083 | |||||||
FR48, 9.00%, 9/15/18 | 16,920,000,000 | IDR | 1,325,427 | |||||||
FR61, 7.00%, 5/15/22 | 244,849,000,000 | IDR | 18,249,012 | |||||||
senior bond, 5.625%, 5/15/23 | 258,951,000,000 | IDR | 17,790,944 | |||||||
senior bond, 7.00%, 5/15/27 | 25,000,000 | IDR | 1,828 | |||||||
senior bond, 9.00%, 3/15/29 | 20,350,000,000 | IDR | 1,718,873 | |||||||
senior bond, FR53, 8.25%, 7/15/21 | 90,288,000,000 | IDR | 7,117,123 | |||||||
senior bond, FR56, 8.375%, 9/15/26 | 42,188,000,000 | IDR | 3,416,549 | |||||||
senior bond, FR70, 8.375%, 3/15/24 | 136,475,000,000 | IDR | 10,910,248 | |||||||
senior note, 8.50%, 10/15/16 | 3,358,000,000 | IDR | 255,890 | |||||||
|
| |||||||||
| 187,462,282 | ||||||||||
|
| |||||||||
Lithuania 0.4% | ||||||||||
| c | Government of Lithuania, 144A, 7.375%, 2/11/20 | 10,170,000 | 12,020,940 | |||||||
|
| |||||||||
Malaysia 4.1% | ||||||||||
Government of Malaysia, | ||||||||||
3.314%, 10/31/17 | 153,634,000 | MYR | 38,373,215 | |||||||
senior bond, 3.814%, 2/15/17 | 63,785,000 | MYR | 15,948,705 | |||||||
senior bond, 4.24%, 2/07/18 | 44,360,000 | MYR | 11,241,942 | |||||||
senior note, 3.394%, 3/15/17 | 125,470,000 | MYR | 31,305,037 | |||||||
senior note, 4.012%, 9/15/17 | 147,790,000 | MYR | 37,207,119 | |||||||
|
| |||||||||
| 134,076,018 | ||||||||||
|
| |||||||||
Mexico 19.6% | ||||||||||
Government of Mexico, | ||||||||||
7.25%, 12/15/16 | 18,216,300d | MXN | 100,937,589 | |||||||
7.75%, 12/14/17 | 33,461,300d | MXN | 191,685,973 | |||||||
senior note, 8.50%, 12/13/18 | 55,958,000d | MXN | 330,972,871 | |||||||
| e | Mexican Udibonos, Index Linked, | |||||||||
3.50%, 12/14/17 | 610,890f | MXN | 3,458,462 | |||||||
4.00%, 6/13/19 | 419,299f | MXN | 2,428,177 | |||||||
2.50%, 12/10/20 | 330,219f | MXN | 1,828,220 | |||||||
|
| |||||||||
| 631,311,292 | ||||||||||
|
| |||||||||
| TGB-10 | Semiannual Report |
FRANKLIN TEMPLETON VARIABLE INSURANCE PRODUCTS TRUST
STATEMENT OF INVESTMENTS (UNAUDITED)
Templeton Global Bond VIP Fund (continued)
| Principal Amount* | Value | |||||||||
Foreign Government and Agency Securities (continued) | ||||||||||
Peru 0.1% | ||||||||||
Government of Peru, senior bond, 7.84%, 8/12/20 | 11,090,000 | PEN | $ | 3,691,942 | ||||||
|
| |||||||||
Philippines 1.4% | ||||||||||
Government of the Philippines, | ||||||||||
senior bond, 9.125%, 9/04/16 | 31,840,000 | PHP | 682,949 | |||||||
senior note, 2.875%, 5/22/17 | 101,890,000 | PHP | 2,174,291 | |||||||
senior note, 5.875%, 1/31/18 | 32,450,000 | PHP | 718,705 | |||||||
senior note, 5.00%, 8/18/18 | 64,060,000 | PHP | 1,417,038 | |||||||
senior note, 3.875%, 11/22/19 | 764,340,000 | PHP | 16,708,779 | |||||||
senior note, 3.375%, 8/20/20 | 731,340,000 | PHP | 15,834,992 | |||||||
senior note, 5-72, 2.125%, 5/23/18 | 352,258,000 | PHP | 7,449,464 | |||||||
|
| |||||||||
| 44,986,218 | ||||||||||
|
| |||||||||
Poland 3.1% | ||||||||||
Government of Poland, | ||||||||||
4.75%, 10/25/16 | 215,845,000 | PLN | 55,265,733 | |||||||
5.75%, 9/23/22 | 48,750,000 | PLN | 14,760,339 | |||||||
g FRN, 1.75%, 1/25/17 | 59,279,000 | PLN | 15,053,642 | |||||||
g FRN, 1.75%, 1/25/21 | 60,135,000 | PLN | 15,040,801 | |||||||
|
| |||||||||
| 100,120,515 | ||||||||||
|
| |||||||||
Portugal 2.4% | ||||||||||
Government of Portugal, | ||||||||||
c 144A, 5.125%, 10/15/24 | 28,820,000 | 29,000,557 | ||||||||
h Reg S, 3.875%, 2/15/30 | 41,530,000 | EUR | 48,381,443 | |||||||
h senior bond, Reg S, 4.95%, 10/25/23 | 284,900 | EUR | 365,856 | |||||||
h senior bond, Reg S, 5.65%, 2/15/24 | 712,400 | EUR | 941,738 | |||||||
|
| |||||||||
| 78,689,594 | ||||||||||
|
| |||||||||
Serbia 1.4% | ||||||||||
| c | Government of Serbia, senior note, 144A, | |||||||||
5.25%, 11/21/17 | 4,590,000 | 4,743,008 | ||||||||
4.875%, 2/25/20 | 6,700,000 | 6,922,205 | ||||||||
7.25%, 9/28/21 | 29,750,000 | 34,140,059 | ||||||||
|
| |||||||||
| 45,805,272 | ||||||||||
|
| |||||||||
Slovenia 0.1% | ||||||||||
| c | Government of Slovenia, senior note, 144A, 5.50%, 10/26/22 | 2,027,000 | 2,306,979 | |||||||
|
| |||||||||
South Korea 13.0% | ||||||||||
Korea Monetary Stabilization Bond, senior note, | ||||||||||
2.46%, 8/02/16 | 49,449,700,000 | KRW | 42,943,519 | |||||||
1.56%, 8/09/16 | 33,975,300,000 | KRW | 29,483,154 | |||||||
2.22%, 10/02/16 | 9,647,500,000 | KRW | 8,389,786 | |||||||
1.61%, 11/09/16 | 33,034,700,000 | KRW | 28,695,117 | |||||||
2.07%, 12/02/16 | 36,552,800,000 | KRW | 31,821,142 | |||||||
1.57%, 1/09/17 | 2,940,100,000 | KRW | 2,554,865 | |||||||
1.96%, 2/02/17 | 16,503,100,000 | KRW | 14,378,201 | |||||||
1.70%, 8/02/17 | 9,221,100,000 | KRW | 8,038,830 | |||||||
1.56%, 10/02/17 | 54,756,600,000 | KRW | 47,689,839 | |||||||
1.49%, 2/02/18 | 11,176,000,000 | KRW | 9,733,243 | |||||||
Korea Treasury Bond, senior note, | ||||||||||
5.00%, 9/10/16 | 2,806,000,000 | KRW | 2,451,305 | |||||||
| Semiannual Report | TGB-11 |
FRANKLIN TEMPLETON VARIABLE INSURANCE PRODUCTS TRUST
STATEMENT OF INVESTMENTS (UNAUDITED)
Templeton Global Bond VIP Fund (continued)
| Principal Amount* | Value | |||||||||
Foreign Government and Agency Securities (continued) | ||||||||||
South Korea (continued) | ||||||||||
3.00%, 12/10/16 | 54,968,060,000 | KRW | $ | 48,052,254 | ||||||
2.00%, 12/10/17 | 49,196,500,000 | KRW | 43,141,744 | |||||||
1.75%, 12/10/18 | 12,303,900,000 | KRW | 10,806,520 | |||||||
1.50%, 6/10/19 | 32,658,800,000 | KRW | 28,548,955 | |||||||
2.75%, 9/10/19 | 1,850,000,000 | KRW | 1,679,675 | |||||||
2.00%, 3/10/21 | 64,648,810,000 | KRW | 57,923,032 | |||||||
1.375%, 9/10/21 | 2,884,000,000 | KRW | 2,513,351 | |||||||
|
| |||||||||
| 418,844,532 | ||||||||||
|
| |||||||||
Sri Lanka 1.2% | ||||||||||
Government of Sri Lanka, | ||||||||||
8.25%, 3/01/17 | 41,710,000 | LKR | 283,016 | |||||||
8.00%, 6/15/17 | 40,210,000 | LKR | 269,694 | |||||||
10.60%, 7/01/19 | 1,071,930,000 | LKR | 7,208,465 | |||||||
10.60%, 9/15/19 | 704,060,000 | LKR | 4,712,123 | |||||||
8.00%, 11/01/19 | 40,210,000 | LKR | 249,202 | |||||||
9.25%, 5/01/20 | 153,220,000 | LKR | 972,179 | |||||||
11.20%, 7/01/22 | 69,990,000 | LKR | 464,018 | |||||||
A, 6.40%, 8/01/16 | 109,200,000 | LKR | 748,258 | |||||||
A, 5.80%, 1/15/17 | 112,300,000 | LKR | 755,579 | |||||||
A, 7.50%, 8/15/18 | 63,830,000 | LKR | 408,106 | |||||||
A, 8.00%, 11/15/18 | 512,300,000 | LKR | 3,287,617 | |||||||
A, 9.00%, 5/01/21 | 861,720,000 | LKR | 5,311,460 | |||||||
A, 11.00%, 8/01/21 | 575,640,000 | LKR | 3,813,123 | |||||||
B, 6.40%, 10/01/16 | 119,100,000 | LKR | 811,931 | |||||||
B, 8.50%, 7/15/18 | 146,350,000 | LKR | 956,991 | |||||||
C, 8.50%, 4/01/18 | 483,480,000 | LKR | 3,184,198 | |||||||
D, 8.50%, 6/01/18 | 633,000,000 | LKR | 4,150,244 | |||||||
|
| |||||||||
| 37,586,204 | ||||||||||
|
| |||||||||
| i | Supranational 0.4% | |||||||||
Inter-American Development Bank, senior note, 7.50%, 12/05/24 | 200,000,000 | MXN | 12,312,321 | |||||||
|
| |||||||||
Ukraine 4.0% | ||||||||||
| c | Government of Ukraine, 144A, | |||||||||
7.75%, 9/01/19 | 4,249,000 | 4,206,510 | ||||||||
7.75%, 9/01/20 | 14,822,000 | 14,553,722 | ||||||||
7.75%, 9/01/21 | 14,769,000 | 14,418,605 | ||||||||
7.75%, 9/01/22 | 14,769,000 | 14,344,760 | ||||||||
7.75%, 9/01/23 | 14,769,000 | 14,289,377 | ||||||||
7.75%, 9/01/24 | 14,769,000 | 14,186,880 | ||||||||
7.75%, 9/01/25 | 14,769,000 | 14,126,770 | ||||||||
7.75%, 9/01/26 | 14,658,000 | 13,962,111 | ||||||||
7.75%, 9/01/27 | 14,658,000 | 13,910,442 | ||||||||
j,kVRI, GDP Linked Securities, 5/31/40 | 29,978,000 | 9,855,268 | ||||||||
|
| |||||||||
| 127,854,445 | ||||||||||
|
| |||||||||
Total Foreign Government and Agency Securities | 2,355,886,298 | |||||||||
|
| |||||||||
| TGB-12 | Semiannual Report |
FRANKLIN TEMPLETON VARIABLE INSURANCE PRODUCTS TRUST
STATEMENT OF INVESTMENTS (UNAUDITED)
Templeton Global Bond VIP Fund (continued)
| Principal Amount* | Value | |||||||||
Quasi-Sovereign and Corporate Bonds 0.1% | ||||||||||
South Korea 0.0%† | ||||||||||
The Export-Import Bank of Korea, senior note, 4.625%, 2/20/17 | 230,000 | EUR | $ | 262,687 | ||||||
|
| |||||||||
Ukraine 0.1% | ||||||||||
| c,l | Ukreximbank, (BIZ Finance PLC), loan participation, senior note, 144A, 9.75%, 1/22/25 | 2,480,000 | 2,368,400 | |||||||
|
| |||||||||
Total Quasi-Sovereign and Corporate Bonds (Cost $2,474,227) | 2,631,087 | |||||||||
|
| |||||||||
Total Investments before Short Term Investments (Cost $2,458,126,886) | 2,358,517,385 | |||||||||
|
| |||||||||
Short Term Investments 23.8% | ||||||||||
Foreign Government and Agency Securities 3.1% | ||||||||||
Malaysia 0.3% | ||||||||||
| m | Bank of Negara Monetary Note, 9/15/16 | 15,520,000 | MYR | 3,832,081 | ||||||
| m | Malaysia Treasury Bill, 1/20/17 | 16,710,000 | MYR | 4,098,898 | ||||||
|
| |||||||||
| 7,930,979 | ||||||||||
|
| |||||||||
Mexico 1.3% | ||||||||||
| m | Mexico Treasury Bill, 8/18/16 - 3/30/17 | 74,675,640n | MXN | 40,110,408 | ||||||
|
| |||||||||
Philippines 1.0% | ||||||||||
| m | Philippine Treasury Bill, 7/06/16 - 6/07/17 | 1,587,780,000 | PHP | 33,529,477 | ||||||
|
| |||||||||
South Korea 0.5% | ||||||||||
Korea Monetary Stabilization Bond, senior note, | ||||||||||
1.57%, 7/09/16 | 5,579,800,000 | KRW | 4,840,835 | |||||||
1.52%, 9/09/16 | 8,119,500,000 | KRW | 7,047,210 | |||||||
1.53%, 10/08/16 | 5,289,000,000 | KRW | 4,591,575 | |||||||
|
| |||||||||
| 16,479,620 | ||||||||||
|
| |||||||||
Total Foreign Government and Agency Securities (Cost $99,521,036) | 98,050,484 | |||||||||
|
| |||||||||
Total Investments before Money Market Funds and Repurchase Agreements (Cost $2,557,647,922) | 2,456,567,869 | |||||||||
|
| |||||||||
| Shares | ||||||||||
Money Market Funds (Cost $409,277,955) 12.7% | ||||||||||
United States 12.7% | ||||||||||
| j,o | Institutional Fiduciary Trust Money Market Portfolio | 409,277,955 | 409,277,955 | |||||||
| Principal Amount* | ||||||||||
Repurchase Agreements (Cost $256,694,916) 8.0% | ||||||||||
United States 8.0% | ||||||||||
| p | Joint Repurchase Agreement, 0.382%, 7/01/16 (Maturity Value $256,697,640) | 256,694,916 | 256,694,916 | |||||||
BNP Paribas Securities Corp. (Maturity Value $83,254,745) | ||||||||||
Deutsche Bank Securities Inc. (Maturity Value $25,667,197) | ||||||||||
HSBC Securities (USA) Inc. (Maturity Value $141,532,811) | ||||||||||
Merrill Lynch, Pierce, Fenner & Smith Inc. (Maturity Value $6,242,887) | ||||||||||
Collateralized by U.S. Government Agency Securities, 0.187% - 5.50%, 7/18/16 - 5/06/21; U.S. Government Agency Securities, Strips, 6/01/17; and U.S. Treasury Note, 0.75% - 3.25%, 11/30/16 - 9/30/20 (valued at $261,936,697) | ||||||||||
|
| |||||||||
| Semiannual Report | TGB-13 |
FRANKLIN TEMPLETON VARIABLE INSURANCE PRODUCTS TRUST
STATEMENT OF INVESTMENTS (UNAUDITED)
Templeton Global Bond VIP Fund (continued)
| Value | ||||||||||
Total Investments (Cost $3,223,620,793) 97.0% | $ | 3,122,540,740 | ||||||||
Other Assets, less Liabilities 3.0% | 97,691,358 | |||||||||
|
| |||||||||
Net Assets 100.0% | $ | 3,220,232,098 | ||||||||
|
| |||||||||
†Rounds to less than 0.1% of net assets.
*The principal amount is stated in U.S. dollars unless otherwise indicated.
aPrincipal amount is stated in 1,000 Brazilian Real Units.
bRedemption price at maturity is adjusted for inflation. See Note 1(h).
cSecurity was purchased pursuant to Rule 144A under the Securities Act of 1933 and may be sold in transactions exempt from registration only to qualified institutional buyers or in a public offering registered under the Securities Act of 1933. These securities have been deemed liquid under guidelines approved by the Trust’s Board of Trustees. At June 30, 2016, the aggregate value of these securities was $219,356,593, representing 6.8% of net assets.
dPrincipal amount is stated in 100 Mexican Peso Units.
ePrincipal amount of security is adjusted for inflation. See Note 1(h).
fPrincipal amount is stated in Unidad de Inversion Units.
gThe coupon rate shown represents the rate at period end.
hSecurity was purchased pursuant to Regulation S under the Securities Act of 1933, which exempts from registration securities offered and sold outside of the United States. Such a security cannot be sold in the United States without either an effective registration statement filed pursuant to the Securities Act of 1933, or pursuant to an exemption from registration. These securities have been deemed liquid under guidelines approved by the Trust’s Board of Trustees. At June 30, 2016, the aggregate value of these securities was $49,689,037, representing 1.5% of net assets.
iA supranational organization is an entity formed by two or more central governments through international treaties.
jNon-income producing.
kThe principal represents the notional amount. See Note 1(d) regarding value recovery instruments.
lSee Note 1(f) regarding loan participation notes.
mThe security is traded on a discount basis with no stated coupon rate.
nPrincipal amount is stated in 10 Mexican Peso Units.
oSee Note 3(e) regarding investments in affiliated management investment companies.
pSee Note 1(c) regarding joint repurchase agreement.
| TGB-14 | Semiannual Report |
FRANKLIN TEMPLETON VARIABLE INSURANCE PRODUCTS TRUST
STATEMENT OF INVESTMENTS (UNAUDITED)
Templeton Global Bond VIP Fund (continued)
At June 30, 2016, the Fund had the following forward exchange contracts outstanding. See Note 1(d).
| Forward Exchange Contracts | ||||||||||||||||||||||||||||||||
| Currency | Counterpartya | Type | Quantity | Contract Amount* | Settlement Date | Unrealized Appreciation | Unrealized Depreciation | |||||||||||||||||||||||||
| OTC Forward Exchange Contracts | ||||||||||||||||||||||||||||||||
Chilean Peso | MSCO | Buy | 1,967,876,500 | 2,822,138 | 7/05/16 | $ | 149,633 | $ | — | |||||||||||||||||||||||
Chilean Peso | MSCO | Sell | 1,967,876,500 | 2,914,293 | 7/05/16 | — | (57,477 | ) | ||||||||||||||||||||||||
Malaysian Ringgit | JPHQ | Buy | 5,661,200 | 1,476,193 | 7/05/16 | — | (70,731 | ) | ||||||||||||||||||||||||
Malaysian Ringgit | JPHQ | Sell | 5,661,200 | 1,380,780 | 7/05/16 | — | (24,681 | ) | ||||||||||||||||||||||||
Euro | BZWS | Buy | 16,339,700 | 18,128,897 | 7/06/16 | 11,417 | — | |||||||||||||||||||||||||
Euro | BZWS | Sell | 16,339,700 | 18,109,435 | 7/06/16 | 66,567 | (97,446 | ) | ||||||||||||||||||||||||
Chilean Peso | DBAB | Buy | 3,166,824,000 | 4,654,219 | 7/07/16 | 127,220 | — | |||||||||||||||||||||||||
Chilean Peso | DBAB | Sell | 3,166,824,000 | 4,772,907 | 7/07/16 | — | (8,532 | ) | ||||||||||||||||||||||||
Euro | DBAB | Sell | 2,285,618 | 2,467,942 | 7/07/16 | — | (69,643 | ) | ||||||||||||||||||||||||
Japanese Yen | DBAB | Sell | 770,370,000 | 6,512,224 | 7/07/16 | — | (948,800 | ) | ||||||||||||||||||||||||
Japanese Yen | JPHQ | Sell | 1,415,975,000 | 11,849,064 | 7/07/16 | — | (1,864,636 | ) | ||||||||||||||||||||||||
Chilean Peso | DBAB | Buy | 1,148,389,500 | 1,679,055 | 7/11/16 | 54,185 | — | |||||||||||||||||||||||||
Chilean Peso | DBAB | Sell | 1,148,389,500 | 1,730,806 | 7/11/16 | — | (2,435 | ) | ||||||||||||||||||||||||
Chilean Peso | MSCO | Buy | 4,089,449,500 | 6,036,667 | 7/11/16 | 135,454 | — | |||||||||||||||||||||||||
Euro | BZWS | Sell | 8,485,276 | 9,677,525 | 7/11/16 | 255,423 | — | |||||||||||||||||||||||||
Japanese Yen | BZWS | Sell | 1,689,110,000 | 15,816,599 | 7/11/16 | — | (544,439 | ) | ||||||||||||||||||||||||
Malaysian Ringgit | HSBC | Buy | 4,010,000 | 1,032,016 | 7/11/16 | — | (36,633 | ) | ||||||||||||||||||||||||
Chilean Peso | DBAB | Buy | 1,148,389,500 | 1,689,181 | 7/14/16 | 43,565 | — | |||||||||||||||||||||||||
Euro | JPHQ | Sell | 3,907,000 | 4,452,788 | 7/14/16 | 113,945 | — | |||||||||||||||||||||||||
Euro | DBAB | Sell | 19,913,000 | 22,085,343 | 7/15/16 | 175,066 | (204,545 | ) | ||||||||||||||||||||||||
Euro | JPHQ | Sell | 29,033,000 | 31,700,842 | 7/15/16 | — | (542,398 | ) | ||||||||||||||||||||||||
Japanese Yen | BZWS | Sell | 1,089,820,000 | 9,271,907 | 7/15/16 | — | (1,285,604 | ) | ||||||||||||||||||||||||
Japanese Yen | JPHQ | Sell | 708,450,000 | 6,021,982 | 7/15/16 | — | (841,050 | ) | ||||||||||||||||||||||||
Malaysian Ringgit | JPHQ | Buy | 1,700,000 | 383,574 | 7/15/16 | 38,367 | — | |||||||||||||||||||||||||
Chilean Peso | DBAB | Buy | 1,231,460,000 | 1,817,519 | 7/18/16 | 39,862 | — | |||||||||||||||||||||||||
Chilean Peso | MSCO | Buy | 2,285,090,000 | 3,316,483 | 7/18/16 | 130,061 | — | |||||||||||||||||||||||||
Euro | BZWS | Sell | 1,161,439 | 1,306,125 | 7/18/16 | 16,119 | — | |||||||||||||||||||||||||
Euro | GSCO | Sell | 3,095,000 | 3,472,466 | 7/18/16 | 34,860 | — | |||||||||||||||||||||||||
Euro | HSBC | Sell | 6,919,000 | 7,821,065 | 7/18/16 | 136,155 | — | |||||||||||||||||||||||||
Euro | MSCO | Sell | 9,679,000 | 10,685,616 | 7/18/16 | — | (64,817 | ) | ||||||||||||||||||||||||
Indian Rupee | JPHQ | Buy | 82,107,000 | 1,218,838 | 7/18/16 | — | (6,332 | ) | ||||||||||||||||||||||||
Euro | BZWS | Sell | 30,339,000 | 33,233,341 | 7/19/16 | — | (465,344 | ) | ||||||||||||||||||||||||
Japanese Yen | HSBC | Sell | 536,380,000 | 4,567,074 | 7/19/16 | — | (629,693 | ) | ||||||||||||||||||||||||
Japanese Yen | SCNY | Sell | 707,660,000 | 6,072,094 | 7/19/16 | — | (784,136 | ) | ||||||||||||||||||||||||
Malaysian Ringgit | JPHQ | Buy | 25,688,213 | 6,142,186 | 7/19/16 | 233,009 | — | |||||||||||||||||||||||||
Euro | BZWS | Sell | 8,551,980 | 9,552,391 | 7/20/16 | 53,025 | — | |||||||||||||||||||||||||
Euro | HSBC | Sell | 12,569,000 | 14,251,486 | 7/20/16 | 290,097 | — | |||||||||||||||||||||||||
Indian Rupee | DBAB | Buy | 491,655,000 | 7,302,787 | 7/20/16 | — | (44,865 | ) | ||||||||||||||||||||||||
Malaysian Ringgit | DBAB | Buy | 11,455,000 | 2,644,275 | EUR | 7/20/16 | — | (94,423 | ) | |||||||||||||||||||||||
Chilean Peso | DBAB | Buy | 1,801,070,000 | 2,612,897 | 7/21/16 | 102,838 | — | |||||||||||||||||||||||||
Euro | BZWS | Sell | 2,638,000 | 2,892,343 | 7/21/16 | — | (38,003 | ) | ||||||||||||||||||||||||
Euro | UBSW | Sell | 678,250 | 773,724 | 7/21/16 | 20,309 | — | |||||||||||||||||||||||||
Chilean Peso | BZWS | Buy | 3,010,700,000 | 4,416,135 | 7/22/16 | 123,104 | — | |||||||||||||||||||||||||
Euro | BZWS | Sell | 2,771,748 | 3,148,674 | 7/22/16 | 69,642 | — | |||||||||||||||||||||||||
Euro | MSCO | Sell | 12,182,000 | 13,316,753 | 7/22/16 | — | (215,776 | ) | ||||||||||||||||||||||||
Malaysian Ringgit | DBAB | Buy | 12,933,000 | 2,660,126 | EUR | 7/22/16 | 254,385 | — | ||||||||||||||||||||||||
Chilean Peso | DBAB | Buy | 3,444,155,000 | 5,060,841 | 7/25/16 | 130,440 | — | |||||||||||||||||||||||||
Euro | BZWS | Sell | 744,197 | 836,232 | 7/25/16 | 9,438 | — | |||||||||||||||||||||||||
Euro | DBAB | Sell | 1,759,000 | 1,939,720 | 7/25/16 | — | (14,507 | ) | ||||||||||||||||||||||||
Euro | JPHQ | Sell | 28,236,000 | 30,741,663 | 7/25/16 | — | (628,174 | ) | ||||||||||||||||||||||||
Indian Rupee | DBAB | Buy | 79,271,000 | 1,179,663 | 7/25/16 | — | (10,468 | ) | ||||||||||||||||||||||||
Japanese Yen | CITI | Sell | 913,412,000 | 7,426,235 | 7/25/16 | — | (1,425,089 | ) | ||||||||||||||||||||||||
Japanese Yen | JPHQ | Sell | 1,407,000,000 | 11,437,165 | 7/25/16 | — | (2,197,222 | ) | ||||||||||||||||||||||||
Malaysian Ringgit | HSBC | Buy | 14,613,000 | 3,376,776 | 7/25/16 | 249,278 | — | |||||||||||||||||||||||||
| Semiannual Report | TGB-15 |
FRANKLIN TEMPLETON VARIABLE INSURANCE PRODUCTS TRUST
STATEMENT OF INVESTMENTS (UNAUDITED)
Templeton Global Bond VIP Fund (continued)
| Forward Exchange Contracts | ||||||||||||||||||||||||||||||||
| Currency | Counterpartya | Type | Quantity | Contract Amount* | Settlement Date | Unrealized Appreciation | Unrealized Depreciation | |||||||||||||||||||||||||
| OTC Forward Exchange Contracts (continued) | ||||||||||||||||||||||||||||||||
Chilean Peso | JPHQ | Buy | 337,685,000 | 502,867 | 7/26/16 | $ | 6,068 | $ | — | |||||||||||||||||||||||
Malaysian Ringgit | HSBC | Buy | 7,209,825 | 1,664,510 | 7/26/16 | 124,484 | — | |||||||||||||||||||||||||
Euro | DBAB | Sell | 9,260,000 | 10,267,408 | 7/27/16 | 77,536 | (98,639 | ) | ||||||||||||||||||||||||
Indian Rupee | DBAB | Buy | 229,138,000 | 3,401,440 | 7/27/16 | — | (22,984 | ) | ||||||||||||||||||||||||
Malaysian Ringgit | DBAB | Buy | 16,628,000 | 3,850,411 | EUR | 7/27/16 | — | (152,228 | ) | |||||||||||||||||||||||
Malaysian Ringgit | JPHQ | Buy | 9,715,000 | 2,481,481 | 7/27/16 | — | (70,931 | ) | ||||||||||||||||||||||||
Chilean Peso | DBAB | Buy | 3,155,970,500 | 4,674,343 | 7/28/16 | 81,211 | — | |||||||||||||||||||||||||
Euro | BOFA | Sell | 25,428,600 | 28,887,907 | 7/28/16 | 633,888 | — | |||||||||||||||||||||||||
Euro | CITI | Sell | 10,044,053 | 11,332,905 | 7/28/16 | 186,148 | (13,310 | ) | ||||||||||||||||||||||||
Euro | GSCO | Sell | 11,263,000 | 12,418,809 | 7/28/16 | — | (95,644 | ) | ||||||||||||||||||||||||
Chilean Peso | MSCO | Buy | 1,967,876,500 | 2,908,135 | 7/29/16 | 56,866 | — | |||||||||||||||||||||||||
Euro | BOFA | Sell | 39,711,800 | 44,736,002 | 7/29/16 | 630,289 | (20,188 | ) | ||||||||||||||||||||||||
Euro | BZWS | Sell | 30,572,361 | 33,792,253 | 7/29/16 | — | (178,330 | ) | ||||||||||||||||||||||||
Euro | CITI | Sell | 4,998,400 | 5,466,595 | 7/29/16 | — | (87,394 | ) | ||||||||||||||||||||||||
Euro | DBAB | Sell | 57,063,000 | 62,503,957 | 7/29/16 | — | (901,789 | ) | ||||||||||||||||||||||||
Euro | GSCO | Sell | 30,376,000 | 33,605,273 | 7/29/16 | — | (147,123 | ) | ||||||||||||||||||||||||
Euro | HSBC | Sell | 25,974,891 | 28,819,142 | 7/29/16 | — | (42,947 | ) | ||||||||||||||||||||||||
Euro | JPHQ | Sell | 11,263,000 | 12,561,511 | 7/29/16 | 46,591 | — | |||||||||||||||||||||||||
Indian Rupee | DBAB | Buy | 609,812,988 | 9,032,794 | 7/29/16 | — | (44,729 | ) | ||||||||||||||||||||||||
Indian Rupee | HSBC | Buy | 679,529,000 | 10,064,711 | 7/29/16 | — | (49,097 | ) | ||||||||||||||||||||||||
Indian Rupee | JPHQ | Buy | 358,075,000 | 5,307,960 | 7/29/16 | — | (30,274 | ) | ||||||||||||||||||||||||
Japanese Yen | BZWS | Sell | 1,079,470,000 | 8,837,430 | 7/29/16 | — | (1,624,360 | ) | ||||||||||||||||||||||||
Japanese Yen | DBAB | Sell | 897,860,782 | 7,617,123 | 7/29/16 | — | (1,084,583 | ) | ||||||||||||||||||||||||
Malaysian Ringgit | HSBC | Buy | 3,005,000 | 701,038 | 7/29/16 | 44,545 | — | |||||||||||||||||||||||||
Malaysian Ringgit | JPHQ | Buy | 17,021,000 | 4,322,245 | 7/29/16 | — | (99,091 | ) | ||||||||||||||||||||||||
Malaysian Ringgit | JPHQ | Buy | 16,628,000 | 3,780,122 | EUR | 7/29/16 | — | (74,650 | ) | |||||||||||||||||||||||
Chilean Peso | MSCO | Buy | 1,941,852,000 | 2,777,447 | 8/03/16 | 147,010 | — | |||||||||||||||||||||||||
Euro | BOFA | Sell | 32,701,000 | 37,465,536 | 8/03/16 | 1,123,050 | — | |||||||||||||||||||||||||
Chilean Peso | MSCO | Buy | 2,286,905,000 | 3,437,714 | 8/04/16 | 6,087 | — | |||||||||||||||||||||||||
Euro | BZWS | Sell | 16,622,598 | 18,460,333 | 8/05/16 | — | (14,655 | ) | ||||||||||||||||||||||||
Euro | HSBC | Sell | 11,263,000 | 12,433,226 | 8/05/16 | — | (84,901 | ) | ||||||||||||||||||||||||
Euro | JPHQ | Sell | 5,724,900 | 6,320,433 | 8/05/16 | — | (42,439 | ) | ||||||||||||||||||||||||
Indian Rupee | HSBC | Buy | 240,033,500 | 3,570,344 | 8/05/16 | — | (36,719 | ) | ||||||||||||||||||||||||
Chilean Peso | DBAB | Buy | 3,166,824,000 | 4,762,141 | 8/08/16 | 4,993 | — | |||||||||||||||||||||||||
Malaysian Ringgit | DBAB | Buy | 143,249,150 | 32,381,471 | EUR | 8/08/16 | — | (461,907 | ) | |||||||||||||||||||||||
Malaysian Ringgit | HSBC | Buy | 21,208,085 | 5,290,119 | 8/08/16 | — | (29,590 | ) | ||||||||||||||||||||||||
Malaysian Ringgit | JPHQ | Buy | 1,100,000 | 274,794 | 8/08/16 | — | (1,946 | ) | ||||||||||||||||||||||||
Chilean Peso | DBAB | Buy | 760,285,000 | 1,122,192 | 8/09/16 | 22,189 | — | |||||||||||||||||||||||||
Euro | CITI | Sell | 6,421,600 | 7,364,227 | 8/09/16 | 225,975 | — | |||||||||||||||||||||||||
Euro | GSCO | Sell | 2,990,000 | 3,420,620 | 8/09/16 | 96,935 | — | |||||||||||||||||||||||||
Indian Rupee | DBAB | Buy | 457,757,494 | 6,785,060 | 8/09/16 | — | (50,837 | ) | ||||||||||||||||||||||||
Indian Rupee | JPHQ | Buy | 60,607,000 | 898,807 | 8/09/16 | — | (7,197 | ) | ||||||||||||||||||||||||
Euro | CITI | Sell | 7,698,954 | 8,456,146 | 8/10/16 | — | (102,325 | ) | ||||||||||||||||||||||||
Indian Rupee | DBAB | Buy | 39,609,000 | 586,600 | 8/10/16 | — | (3,998 | ) | ||||||||||||||||||||||||
Japanese Yen | CITI | Sell | 751,731,000 | 6,085,265 | 8/10/16 | — | (1,203,106 | ) | ||||||||||||||||||||||||
Malaysian Ringgit | HSBC | Buy | 1,320,000 | 316,965 | 8/10/16 | 10,434 | — | |||||||||||||||||||||||||
South Korean Won | HSBC | Buy | 21,363,430,000 | 18,182,416 | 8/10/16 | 340,909 | — | |||||||||||||||||||||||||
South Korean Won | HSBC | Sell | 21,363,430,000 | 17,707,680 | 8/10/16 | — | (815,646 | ) | ||||||||||||||||||||||||
Euro | BOFA | Sell | 2,643,000 | 3,022,648 | 8/11/16 | 84,475 | — | |||||||||||||||||||||||||
Euro | DBAB | Sell | 4,845,000 | 5,348,614 | 8/11/16 | — | (37,482 | ) | ||||||||||||||||||||||||
Euro | JPHQ | Sell | 6,343,900 | 6,981,462 | 8/11/16 | — | (70,933 | ) | ||||||||||||||||||||||||
Euro | MSCO | Sell | 4,572,000 | 5,225,407 | 8/11/16 | 142,801 | — | |||||||||||||||||||||||||
Malaysian Ringgit | HSBC | Buy | 2,230,000 | 535,993 | 8/11/16 | 17,096 | — | |||||||||||||||||||||||||
Euro | GSCO | Sell | 2,279,000 | 2,603,062 | 8/12/16 | 69,448 | — | |||||||||||||||||||||||||
Euro | SCNY | Sell | 629,000 | 718,708 | 8/12/16 | 19,435 | — | |||||||||||||||||||||||||
Malaysian Ringgit | HSBC | Buy | 6,100,000 | 1,427,234 | 8/12/16 | 85,656 | — | |||||||||||||||||||||||||
| TGB-16 | Semiannual Report |
FRANKLIN TEMPLETON VARIABLE INSURANCE PRODUCTS TRUST
STATEMENT OF INVESTMENTS (UNAUDITED)
Templeton Global Bond VIP Fund (continued)
| Forward Exchange Contracts | ||||||||||||||||||||||||||||||||
| Currency | Counterpartya | Type | Quantity | Contract Amount* | Settlement Date | Unrealized Appreciation | Unrealized Depreciation | |||||||||||||||||||||||||
| OTC Forward Exchange Contracts (continued) | ||||||||||||||||||||||||||||||||
South Korean Won | HSBC | Buy | 11,980,000,000 | 1,262,275,045 | JPY | 8/12/16 | $ | — | $ | (1,852,044 | ) | |||||||||||||||||||||
Euro | DBAB | Sell | 7,243,000 | 8,300,116 | 8/15/16 | 247,034 | — | |||||||||||||||||||||||||
Euro | MSCO | Sell | 1,962,500 | 2,215,790 | 8/15/16 | 33,797 | — | |||||||||||||||||||||||||
Euro | SCNY | Sell | 4,346,000 | 4,971,172 | 8/15/16 | 139,100 | — | |||||||||||||||||||||||||
Chilean Peso | MSCO | Buy | 2,572,200,000 | 3,735,785 | 8/16/16 | 133,452 | — | |||||||||||||||||||||||||
Euro | JPHQ | Sell | 3,942,000 | 4,456,687 | 8/16/16 | 73,640 | — | |||||||||||||||||||||||||
Euro | MSCO | Sell | 5,391,000 | 6,165,687 | 8/16/16 | 171,520 | — | |||||||||||||||||||||||||
Indian Rupee | DBAB | Buy | 239,338,000 | 3,544,031 | 8/16/16 | — | (27,251 | ) | ||||||||||||||||||||||||
Indian Rupee | HSBC | Buy | 402,232,000 | 5,955,666 | 8/16/16 | — | (45,357 | ) | ||||||||||||||||||||||||
Japanese Yen | JPHQ | Sell | 1,518,680,000 | 13,576,704 | 8/16/16 | — | (1,150,524 | ) | ||||||||||||||||||||||||
Chilean Peso | DBAB | Buy | 2,509,219,500 | 3,674,090 | 8/17/16 | 100,070 | — | |||||||||||||||||||||||||
Euro | MSCO | Sell | 1,962,500 | 2,200,335 | 8/17/16 | 18,183 | — | |||||||||||||||||||||||||
Singapore Dollar | BZWS | Buy | 4,886,000 | 3,473,377 | 8/17/16 | 152,637 | — | |||||||||||||||||||||||||
Singapore Dollar | BZWS | Sell | 4,886,000 | 3,453,858 | 8/17/16 | — | (172,157 | ) | ||||||||||||||||||||||||
Singapore Dollar | HSBC | Buy | 3,667,000 | 2,607,181 | 8/17/16 | 114,185 | — | |||||||||||||||||||||||||
Chilean Peso | MSCO | Buy | 2,572,200,000 | 3,699,091 | 8/18/16 | 169,450 | — | |||||||||||||||||||||||||
Euro | BZWS | Sell | 7,066,000 | 7,910,210 | 8/18/16 | 53,065 | — | |||||||||||||||||||||||||
Japanese Yen | DBAB | Sell | 838,612,000 | 6,811,781 | 8/18/16 | — | (1,321,106 | ) | ||||||||||||||||||||||||
Euro | DBAB | Sell | 5,073,398 | 5,755,922 | 8/19/16 | 114,275 | — | |||||||||||||||||||||||||
Euro | UBSW | Sell | 3,245,000 | 3,687,245 | 8/19/16 | 78,786 | — | |||||||||||||||||||||||||
Chilean Peso | MSCO | Buy | 3,307,630,000 | 4,732,961 | 8/22/16 | 239,863 | — | |||||||||||||||||||||||||
Euro | DBAB | Sell | 3,964,000 | 4,421,366 | 8/22/16 | 12,893 | — | |||||||||||||||||||||||||
Euro | JPHQ | Sell | 23,160,581 | 26,068,128 | 8/22/16 | 310,611 | — | |||||||||||||||||||||||||
Japanese Yen | HSBC | Sell | 1,621,372,000 | 13,158,351 | 8/22/16 | — | (2,567,865 | ) | ||||||||||||||||||||||||
Japanese Yen | JPHQ | Sell | 1,135,828,000 | 9,216,653 | 8/22/16 | — | (1,800,114 | ) | ||||||||||||||||||||||||
Chilean Peso | JPHQ | Buy | 931,485,000 | 1,319,290 | 8/23/16 | 81,016 | — | |||||||||||||||||||||||||
Euro | DBAB | Sell | 3,887,000 | 4,368,599 | 8/23/16 | 45,602 | — | |||||||||||||||||||||||||
Indian Rupee | JPHQ | Buy | 378,455,000 | 5,551,579 | 8/23/16 | 2,729 | — | |||||||||||||||||||||||||
Euro | GSCO | Sell | 4,454,000 | 5,017,609 | 8/24/16 | 63,832 | — | |||||||||||||||||||||||||
Japanese Yen | BZWS | Sell | 376,247,000 | 3,069,400 | 8/24/16 | — | (580,186 | ) | ||||||||||||||||||||||||
Japanese Yen | DBAB | Sell | 371,821,000 | 3,310,962 | 8/24/16 | — | (295,692 | ) | ||||||||||||||||||||||||
Euro | BOFA | Sell | 2,680,925 | 3,004,237 | 8/26/16 | 22,271 | — | |||||||||||||||||||||||||
Euro | JPHQ | Sell | 4,730,771 | 5,297,574 | 8/26/16 | 35,586 | — | |||||||||||||||||||||||||
Euro | SCNY | Sell | 13,581,483 | 15,820,526 | 8/26/16 | 713,982 | — | |||||||||||||||||||||||||
Japanese Yen | JPHQ | Sell | 1,135,833,000 | 9,641,146 | 8/26/16 | — | (1,377,138 | ) | ||||||||||||||||||||||||
Euro | DBAB | Sell | 9,808,244 | 10,968,903 | 8/29/16 | 58,099 | — | |||||||||||||||||||||||||
Euro | JPHQ | Sell | 17,833,294 | 20,419,019 | 8/29/16 | 581,057 | — | |||||||||||||||||||||||||
Japanese Yen | DBAB | Sell | 685,950,000 | 5,766,709 | 8/29/16 | — | (888,096 | ) | ||||||||||||||||||||||||
Japanese Yen | JPHQ | Sell | 751,903,000 | 6,318,592 | 8/29/16 | — | (976,062 | ) | ||||||||||||||||||||||||
Malaysian Ringgit | JPHQ | Buy | 8,340,000 | 1,972,564 | 8/30/16 | 94,798 | — | |||||||||||||||||||||||||
Chilean Peso | CITI | Buy | 3,039,493,000 | 4,371,170 | 8/31/16 | 194,841 | — | |||||||||||||||||||||||||
Chilean Peso | DBAB | Buy | 1,359,282,000 | 1,944,888 | 8/31/16 | 97,064 | — | |||||||||||||||||||||||||
Euro | BZWS | Sell | 13,673,773 | 15,143,840 | 8/31/16 | — | (68,240 | ) | ||||||||||||||||||||||||
Euro | DBAB | Sell | 1,058,312 | 1,196,951 | 8/31/16 | 19,578 | — | |||||||||||||||||||||||||
Euro | SCNY | Sell | 11,263,000 | 12,662,653 | 8/31/16 | 132,559 | — | |||||||||||||||||||||||||
Japanese Yen | BZWS | Sell | 1,576,550,000 | 14,065,037 | 8/31/16 | — | (1,231,363 | ) | ||||||||||||||||||||||||
Japanese Yen | JPHQ | Sell | 372,662,000 | 3,118,471 | 8/31/16 | — | (497,264 | ) | ||||||||||||||||||||||||
Euro | HSBC | Sell | 18,537,726 | 20,481,036 | 9/01/16 | — | (143,020 | ) | ||||||||||||||||||||||||
Japanese Yen | HSBC | Sell | 1,247,125,000 | 11,075,710 | 9/01/16 | — | (1,024,997 | ) | ||||||||||||||||||||||||
Chilean Peso | DBAB | Buy | 4,798,143,500 | 6,901,883 | 9/02/16 | 304,744 | — | |||||||||||||||||||||||||
Euro | DBAB | Sell | 1,732,000 | 1,894,115 | 9/02/16 | — | (32,890 | ) | ||||||||||||||||||||||||
Chilean Peso | DBAB | Buy | 1,271,380,000 | 1,818,856 | 9/06/16 | 90,032 | — | |||||||||||||||||||||||||
Chilean Peso | MSCO | Buy | 1,941,852,000 | 2,769,524 | 9/06/16 | 146,029 | — | |||||||||||||||||||||||||
Euro | DBAB | Sell | 13,545,300 | 14,936,912 | 9/06/16 | 45,436 | (181,297 | ) | ||||||||||||||||||||||||
Euro | JPHQ | Sell | 20,765,000 | 23,527,472 | 9/06/16 | 420,850 | — | |||||||||||||||||||||||||
Indian Rupee | JPHQ | Buy | 139,661,000 | 2,032,911 | 9/06/16 | 12,185 | — | |||||||||||||||||||||||||
| Semiannual Report | TGB-17 |
FRANKLIN TEMPLETON VARIABLE INSURANCE PRODUCTS TRUST
STATEMENT OF INVESTMENTS (UNAUDITED)
Templeton Global Bond VIP Fund (continued)
| Forward Exchange Contracts | ||||||||||||||||||||||||||||||||
| Currency | Counterpartya | Type | Quantity | Contract Amount* | Settlement Date | Unrealized Appreciation | Unrealized Depreciation | |||||||||||||||||||||||||
| OTC Forward Exchange Contracts (continued) | ||||||||||||||||||||||||||||||||
South Korean Won | GSCO | Sell | 44,346,000,000 | 37,075,495 | 9/07/16 | $ | — | $ | (1,362,823 | ) | ||||||||||||||||||||||
Euro | GSCO | Sell | 2,033,100 | 2,315,091 | 9/08/16 | 52,542 | — | |||||||||||||||||||||||||
Chilean Peso | JPHQ | Buy | 612,933,000 | 892,721 | 9/09/16 | 27,311 | — | |||||||||||||||||||||||||
Euro | CITI | Sell | 31,404,613 | 35,772,995 | 9/09/16 | 822,758 | — | |||||||||||||||||||||||||
Euro | HSBC | Sell | 3,999,292 | 4,555,573 | 9/09/16 | 104,756 | — | |||||||||||||||||||||||||
Euro | MSCO | Sell | 5,225,000 | 5,955,836 | 9/09/16 | 140,927 | — | |||||||||||||||||||||||||
Euro | SCNY | Sell | 2,400,751 | 2,734,600 | 9/09/16 | 62,800 | — | |||||||||||||||||||||||||
Japanese Yen | BZWS | Sell | 1,712,605,900 | 15,172,051 | 9/09/16 | — | (1,451,075 | ) | ||||||||||||||||||||||||
Chilean Peso | DBAB | Buy | 1,866,989,500 | 2,749,009 | 9/12/16 | 52,655 | — | |||||||||||||||||||||||||
Chilean Peso | JPHQ | Buy | 1,792,000,000 | 2,617,166 | 9/13/16 | 71,728 | — | |||||||||||||||||||||||||
Euro | GSCO | Sell | 8,105,300 | 9,207,621 | 9/13/16 | 185,777 | — | |||||||||||||||||||||||||
Australian Dollar | CITI | Sell | 28,906,000 | 20,823,304 | 9/14/16 | — | (677,069 | ) | ||||||||||||||||||||||||
Indian Rupee | CITI | Buy | 69,318,000 | 1,026,857 | 9/14/16 | — | (13,059 | ) | ||||||||||||||||||||||||
Indian Rupee | DBAB | Buy | 258,123,000 | 3,822,912 | 9/14/16 | — | (47,778 | ) | ||||||||||||||||||||||||
Malaysian Ringgit | HSBC | Buy | 796,554,000 | 192,404,348 | 9/14/16 | 4,956,588 | — | |||||||||||||||||||||||||
Euro | BOFA | Sell | 17,769,000 | 20,039,345 | 9/15/16 | 259,450 | — | |||||||||||||||||||||||||
Euro | CITI | Sell | 861,168 | 972,216 | 9/15/16 | 13,590 | — | |||||||||||||||||||||||||
Euro | JPHQ | Sell | 541,000 | 609,623 | 9/16/16 | 7,375 | — | |||||||||||||||||||||||||
Japanese Yen | CITI | Sell | 286,112,008 | 2,532,682 | 9/16/16 | — | (245,282 | ) | ||||||||||||||||||||||||
South Korean Won | CITI | Sell | 11,790,000,000 | 9,730,131 | 9/19/16 | — | (488,078 | ) | ||||||||||||||||||||||||
South Korean Won | HSBC | Sell | 35,487,000,000 | 29,068,644 | 9/19/16 | — | (1,687,387 | ) | ||||||||||||||||||||||||
Chilean Peso | DBAB | Buy | 1,757,372,000 | 2,526,412 | 9/20/16 | 108,890 | — | |||||||||||||||||||||||||
Chilean Peso | JPHQ | Buy | 1,501,938,000 | 2,172,471 | 9/20/16 | 79,789 | — | |||||||||||||||||||||||||
Japanese Yen | BZWS | Sell | 981,707,504 | 8,158,168 | 9/20/16 | — | (1,375,278 | ) | ||||||||||||||||||||||||
Japanese Yen | CITI | Sell | 1,866,452,000 | 16,830,045 | 9/23/16 | — | (1,297,649 | ) | ||||||||||||||||||||||||
Japanese Yen | MSCO | Sell | 575,230,000 | 5,189,124 | 9/23/16 | — | (397,729 | ) | ||||||||||||||||||||||||
Japanese Yen | BZWS | Sell | 983,714,840 | 8,775,137 | 9/26/16 | — | (780,352 | ) | ||||||||||||||||||||||||
Japanese Yen | DBAB | Sell | 725,287,000 | 6,536,355 | 9/26/16 | — | (508,850 | ) | ||||||||||||||||||||||||
South Korean Won | HSBC | Sell | 35,125,000,000 | 30,192,977 | 9/26/16 | — | (247,313 | ) | ||||||||||||||||||||||||
Malaysian Ringgit | HSBC | Buy | 20,347,000 | 5,046,254 | 9/28/16 | — | (7,124 | ) | ||||||||||||||||||||||||
Philippine Peso | JPHQ | Buy | 123,740,000 | 2,651,382 | 9/28/16 | — | (35,591 | ) | ||||||||||||||||||||||||
South Korean Won | HSBC | Sell | 35,292,000,000 | 30,115,198 | 9/28/16 | — | (469,245 | ) | ||||||||||||||||||||||||
Chilean Peso | DBAB | Buy | 1,407,243,000 | 2,044,371 | 9/30/16 | 63,992 | — | |||||||||||||||||||||||||
Euro | DBAB | Sell | 14,880,000 | 16,867,968 | 10/03/16 | 292,069 | — | |||||||||||||||||||||||||
Australian Dollar | GSCO | Sell | 127,700,540 | 97,063,903 | 10/06/16 | 2,152,181 | — | |||||||||||||||||||||||||
Japanese Yen | JPHQ | Sell | 1,415,975,000 | 12,775,637 | 10/06/16 | — | (984,554 | ) | ||||||||||||||||||||||||
Euro | JPHQ | Sell | 6,370,000 | 7,197,399 | 10/07/16 | 100,262 | — | |||||||||||||||||||||||||
Japanese Yen | JPHQ | Sell | 1,415,975,000 | 11,884,369 | 10/07/16 | — | (1,876,403 | ) | ||||||||||||||||||||||||
Euro | DBAB | Sell | 18,880,000 | 21,406,750 | 10/11/16 | 368,218 | — | |||||||||||||||||||||||||
Japanese Yen | HSBC | Sell | 2,816,800,000 | 23,703,454 | 10/11/16 | — | (3,675,479 | ) | ||||||||||||||||||||||||
Chilean Peso | DBAB | Buy | 1,148,389,500 | 1,717,475 | 10/12/16 | 1,100 | — | |||||||||||||||||||||||||
Euro | HSBC | Sell | 8,692,000 | 9,857,684 | 10/13/16 | 171,160 | — | |||||||||||||||||||||||||
Japanese Yen | BZWS | Sell | 1,426,300,000 | 12,005,387 | 10/13/16 | — | (1,859,235 | ) | ||||||||||||||||||||||||
Japanese Yen | DBAB | Sell | 1,406,600,000 | 11,843,058 | 10/13/16 | — | (1,830,066 | ) | ||||||||||||||||||||||||
Malaysian Ringgit | DBAB | Buy | 60,000,000 | 12,390,550 | EUR | 10/17/16 | 1,039,478 | — | ||||||||||||||||||||||||
South Korean Won | HSBC | Sell | 60,991,000,000 | 52,676,081 | 10/18/16 | — | (177,368 | ) | ||||||||||||||||||||||||
Japanese Yen | JPHQ | Sell | 652,895,000 | 5,559,439 | 10/19/16 | — | (788,759 | ) | ||||||||||||||||||||||||
Japanese Yen | BZWS | Sell | 735,200,000 | 6,190,767 | 10/24/16 | — | (959,204 | ) | ||||||||||||||||||||||||
Euro | BZWS | Sell | 5,604,306 | 6,239,134 | 10/27/16 | — | (9,916 | ) | ||||||||||||||||||||||||
Malaysian Ringgit | JPHQ | Buy | 7,468,000 | 1,900,496 | 10/31/16 | — | (53,055 | ) | ||||||||||||||||||||||||
South Korean Won | HSBC | Sell | 15,755,000,000 | 13,644,827 | 11/02/16 | — | (7,712 | ) | ||||||||||||||||||||||||
Euro | DBAB | Sell | 224,556 | 250,110 | 11/04/16 | — | (360 | ) | ||||||||||||||||||||||||
Euro | DBAB | Sell | 15,875,000 | 17,454,563 | 11/09/16 | — | (256,004 | ) | ||||||||||||||||||||||||
Japanese Yen | CITI | Sell | 341,992,119 | 2,841,410 | 11/09/16 | — | (486,781 | ) | ||||||||||||||||||||||||
Euro | CITI | Sell | 5,658,426 | 6,115,910 | 11/14/16 | — | (198,046 | ) | ||||||||||||||||||||||||
Euro | JPHQ | Sell | 8,969,211 | 9,693,161 | 11/14/16 | — | (315,135 | ) | ||||||||||||||||||||||||
| TGB-18 | Semiannual Report |
FRANKLIN TEMPLETON VARIABLE INSURANCE PRODUCTS TRUST
STATEMENT OF INVESTMENTS (UNAUDITED)
Templeton Global Bond VIP Fund (continued)
| Forward Exchange Contracts | ||||||||||||||||||||||||||||||||
| Currency | Counterpartya | Type | Quantity | Contract Amount* | Settlement Date | Unrealized Appreciation | Unrealized Depreciation | |||||||||||||||||||||||||
| OTC Forward Exchange Contracts (continued) | ||||||||||||||||||||||||||||||||
Japanese Yen | CITI | Sell | 796,524,000 | 6,545,517 | 11/14/16 | $ | — | $ | (1,207,715 | ) | ||||||||||||||||||||||
Japanese Yen | GSCO | Sell | 490,555,000 | 4,525,332 | 11/14/16 | — | (249,649 | ) | ||||||||||||||||||||||||
Japanese Yen | HSBC | Sell | 413,563,000 | 3,395,845 | 11/14/16 | — | (629,708 | ) | ||||||||||||||||||||||||
Japanese Yen | JPHQ | Sell | 335,950,000 | 2,756,377 | 11/14/16 | — | (513,704 | ) | ||||||||||||||||||||||||
Japanese Yen | SCNY | Sell | 366,681,000 | 3,382,728 | 11/14/16 | — | (186,483 | ) | ||||||||||||||||||||||||
South Korean Won | CITI | Sell | 11,823,000,000 | 10,113,340 | 11/14/16 | — | (131,677 | ) | ||||||||||||||||||||||||
Australian Dollar | JPHQ | Sell | 100,287,000 | 73,349,912 | 11/16/16 | — | (1,080,926 | ) | ||||||||||||||||||||||||
Japanese Yen | CITI | Sell | 366,680,000 | 3,022,295 | 11/16/16 | — | (547,208 | ) | ||||||||||||||||||||||||
Japanese Yen | MSCO | Sell | 300,000,000 | 2,471,475 | 11/16/16 | — | (448,922 | ) | ||||||||||||||||||||||||
Japanese Yen | SCNY | Sell | 340,600,700 | 3,146,084 | 11/16/16 | — | (169,547 | ) | ||||||||||||||||||||||||
South Korean Won | CITI | Sell | 13,902,000,000 | 11,881,036 | 11/16/16 | — | (165,456 | ) | ||||||||||||||||||||||||
Euro | DBAB | Sell | 2,768,730 | 3,008,834 | 11/17/16 | — | (81,026 | ) | ||||||||||||||||||||||||
South Korean Won | HSBC | Sell | 48,866,000,000 | 41,653,667 | 11/17/16 | — | (690,078 | ) | ||||||||||||||||||||||||
Euro | DBAB | Sell | 2,240,000 | 2,430,960 | 11/18/16 | — | (68,946 | ) | ||||||||||||||||||||||||
Japanese Yen | DBAB | Sell | 796,770,000 | 6,561,180 | 11/18/16 | — | (1,195,758 | ) | ||||||||||||||||||||||||
South Korean Won | HSBC | Sell | 26,952,000,000 | 22,962,300 | 11/18/16 | — | (392,311 | ) | ||||||||||||||||||||||||
Australian Dollar | CITI | Sell | 13,307,000 | 9,632,937 | 11/21/16 | — | (241,515 | ) | ||||||||||||||||||||||||
Japanese Yen | CITI | Sell | 2,094,073,000 | 18,183,218 | 11/21/16 | — | (2,206,170 | ) | ||||||||||||||||||||||||
Malaysian Ringgit | HSBC | Buy | 4,326,000 | 1,067,489 | 11/21/16 | 1,916 | — | |||||||||||||||||||||||||
South Korean Won | DBAB | Sell | 13,920,000,000 | 11,832,609 | 11/23/16 | — | (229,318 | ) | ||||||||||||||||||||||||
Japanese Yen | HSBC | Sell | 207,909,000 | 1,911,631 | 11/25/16 | — | (113,062 | ) | ||||||||||||||||||||||||
South Korean Won | HSBC | Sell | 35,277,000,000 | 29,594,799 | 11/25/16 | — | (973,230 | ) | ||||||||||||||||||||||||
Euro | DBAB | Sell | 837,570 | 904,626 | 11/28/16 | — | (30,502 | ) | ||||||||||||||||||||||||
Japanese Yen | BOFA | Sell | 1,085,075,000 | 9,933,219 | 11/28/16 | — | (634,972 | ) | ||||||||||||||||||||||||
Japanese Yen | SCNY | Sell | 937,086,000 | 8,597,316 | 11/28/16 | — | (529,521 | ) | ||||||||||||||||||||||||
Malaysian Ringgit | HSBC | Buy | 3,317,000 | 809,716 | 11/30/16 | 10,009 | — | |||||||||||||||||||||||||
Euro | GSCO | Sell | 463,000 | 496,405 | 12/02/16 | — | (20,607 | ) | ||||||||||||||||||||||||
South Korean Won | HSBC | Sell | 42,561,000,000 | 35,916,456 | 12/02/16 | — | (962,767 | ) | ||||||||||||||||||||||||
Japanese Yen | HSBC | Sell | 2,052,400,000 | 19,199,252 | 12/09/16 | — | (799,593 | ) | ||||||||||||||||||||||||
Australian Dollar | JPHQ | Sell | 29,260,000 | 20,823,728 | 12/12/16 | — | (872,818 | ) | ||||||||||||||||||||||||
Japanese Yen | CITI | Sell | 2,595,800,000 | 24,453,268 | 12/12/16 | — | (843,744 | ) | ||||||||||||||||||||||||
Australian Dollar | JPHQ | Sell | 43,169,000 | 31,855,053 | 12/13/16 | — | (154,028 | ) | ||||||||||||||||||||||||
Japanese Yen | DBAB | Sell | 595,700,000 | 5,630,541 | 12/13/16 | — | (175,017 | ) | ||||||||||||||||||||||||
Japanese Yen | HSBC | Sell | 1,798,900,000 | 16,986,780 | 12/13/16 | — | (544,894 | ) | ||||||||||||||||||||||||
Japanese Yen | JPHQ | Sell | 1,666,680,000 | 15,731,782 | 12/13/16 | — | (511,306 | ) | ||||||||||||||||||||||||
Australian Dollar | CITI | Sell | 29,097,000 | 21,477,078 | 12/14/16 | — | (97,105 | ) | ||||||||||||||||||||||||
Australian Dollar | JPHQ | Sell | 14,544,000 | 10,411,759 | 12/14/16 | — | (371,996 | ) | ||||||||||||||||||||||||
Euro | MSCO | Sell | 1,412,000 | 1,567,461 | 12/14/16 | — | (10,019 | ) | ||||||||||||||||||||||||
Malaysian Ringgit | JPHQ | Buy | 13,361,013 | 3,270,350 | 12/14/16 | 29,963 | — | |||||||||||||||||||||||||
Euro | JPHQ | Sell | 5,095,000 | 5,670,378 | 12/15/16 | — | (21,964 | ) | ||||||||||||||||||||||||
South Korean Won | CITI | Sell | 8,844,000,000 | 7,525,528 | 12/15/16 | — | (137,631 | ) | ||||||||||||||||||||||||
Japanese Yen | HSBC | Sell | 1,455,540,000 | 13,828,045 | 12/16/16 | — | (359,121 | ) | ||||||||||||||||||||||||
South Korean Won | DBAB | Sell | 13,919,000,000 | 11,838,099 | 12/20/16 | — | (222,335 | ) | ||||||||||||||||||||||||
Malaysian Ringgit | JPHQ | Buy | 5,661,200 | 1,373,578 | 1/05/17 | 23,649 | — | |||||||||||||||||||||||||
Japanese Yen | GSCO | Sell | 329,010,000 | 2,808,307 | 1/10/17 | — | (401,832 | ) | ||||||||||||||||||||||||
Japanese Yen | JPHQ | Sell | 1,415,975,000 | 12,041,525 | 1/10/17 | — | (1,774,092 | ) | ||||||||||||||||||||||||
Euro | BZWS | Sell | 6,181,000 | 6,804,230 | 1/11/17 | — | (108,846 | ) | ||||||||||||||||||||||||
Euro | CITI | Sell | 5,040,000 | 5,555,718 | 1/13/17 | — | (81,662 | ) | ||||||||||||||||||||||||
Euro | SCNY | Sell | 15,572,000 | 17,132,314 | 1/13/17 | — | (285,400 | ) | ||||||||||||||||||||||||
Japanese Yen | CITI | Sell | 138,680,000 | 1,190,938 | 1/17/17 | — | (162,533 | ) | ||||||||||||||||||||||||
Japanese Yen | SCNY | Sell | 415,980,000 | 3,561,503 | 1/17/17 | — | (498,326 | ) | ||||||||||||||||||||||||
Euro | JPHQ | Sell | 27,973,000 | 30,980,237 | 1/19/17 | — | (315,729 | ) | ||||||||||||||||||||||||
Japanese Yen | JPHQ | Sell | 652,895,000 | 5,639,417 | 1/19/17 | — | (733,131 | ) | ||||||||||||||||||||||||
Euro | DBAB | Sell | 6,791,000 | 7,496,824 | 1/23/17 | — | (102,088 | ) | ||||||||||||||||||||||||
Euro | JPHQ | Sell | 300,000 | 331,089 | 1/23/17 | — | (4,601 | ) | ||||||||||||||||||||||||
Japanese Yen | DBAB | Sell | 858,140,000 | 7,434,611 | 1/23/17 | — | (942,549 | ) | ||||||||||||||||||||||||
| Semiannual Report | TGB-19 |
FRANKLIN TEMPLETON VARIABLE INSURANCE PRODUCTS TRUST
STATEMENT OF INVESTMENTS (UNAUDITED)
Templeton Global Bond VIP Fund (continued)
| Forward Exchange Contracts | ||||||||||||||||||||||||||||||||
| Currency | Counterpartya | Type | Quantity | Contract Amount* | Settlement Date | Unrealized Appreciation | Unrealized Depreciation | |||||||||||||||||||||||||
| OTC Forward Exchange Contracts (continued) | ||||||||||||||||||||||||||||||||
Euro | GSCO | Sell | 4,711,000 | 5,169,804 | 1/27/17 | $ | — | $ | (102,485 | ) | ||||||||||||||||||||||
Japanese Yen | GSCO | Sell | 944,420,000 | 8,062,147 | 1/27/17 | — | (1,158,742 | ) | ||||||||||||||||||||||||
Japanese Yen | JPHQ | Sell | 490,100,000 | 4,183,918 | 1/27/17 | — | (601,196 | ) | ||||||||||||||||||||||||
Japanese Yen | DBAB | Sell | 8,368,505,770 | 71,452,406 | 1/30/17 | — | (10,263,615 | ) | ||||||||||||||||||||||||
Japanese Yen | HSBC | Sell | 1,162,462,488 | 9,927,092 | 1/31/17 | — | (1,424,466 | ) | ||||||||||||||||||||||||
Euro | BZWS | Sell | 7,003,000 | 7,935,274 | 2/08/17 | 94,202 | — | |||||||||||||||||||||||||
Japanese Yen | JPHQ | Sell | 1,719,500,000 | 14,857,666 | 2/08/17 | — | (1,938,750 | ) | ||||||||||||||||||||||||
Japanese Yen | SCNY | Sell | 1,720,000,000 | 14,894,096 | 2/08/17 | — | (1,907,204 | ) | ||||||||||||||||||||||||
Euro | CITI | Sell | 6,572,000 | 7,450,118 | 2/09/17 | 91,335 | — | |||||||||||||||||||||||||
Euro | GSCO | Sell | 2,045,000 | 2,308,396 | 2/09/17 | 18,574 | — | |||||||||||||||||||||||||
Japanese Yen | BZWS | Sell | 1,720,220,000 | 14,916,280 | 2/09/17 | — | (1,887,836 | ) | ||||||||||||||||||||||||
Japanese Yen | CITI | Sell | 366,860,000 | 3,181,787 | 2/09/17 | — | (401,917 | ) | ||||||||||||||||||||||||
Japanese Yen | JPHQ | Sell | 1,723,960,000 | 14,912,633 | 2/09/17 | — | (1,928,018 | ) | ||||||||||||||||||||||||
Euro | DBAB | Sell | 1,738,000 | 1,957,544 | 2/10/17 | 11,399 | — | |||||||||||||||||||||||||
Euro | HSBC | Sell | 1,800,000 | 2,025,432 | 2/10/17 | 9,861 | — | |||||||||||||||||||||||||
Euro | BZWS | Sell | 6,341,000 | 7,266,152 | 2/13/17 | 164,905 | — | |||||||||||||||||||||||||
Euro | GSCO | Sell | 2,038,000 | 2,324,074 | 2/16/17 | 41,461 | — | |||||||||||||||||||||||||
Euro | SCNY | Sell | 657,000 | 748,606 | 2/16/17 | 12,748 | — | |||||||||||||||||||||||||
Japanese Yen | CITI | Sell | 2,056,230,000 | 18,507,416 | 2/16/17 | — | (1,584,627 | ) | ||||||||||||||||||||||||
Japanese Yen | GSCO | Sell | 1,205,250,280 | 10,779,075 | 2/16/17 | — | (997,788 | ) | ||||||||||||||||||||||||
Japanese Yen | HSBC | Sell | 1,035,240,000 | 9,188,657 | 2/16/17 | — | (926,985 | ) | ||||||||||||||||||||||||
Japanese Yen | JPHQ | Sell | 1,034,700,000 | 9,137,311 | 2/16/17 | — | (973,054 | ) | ||||||||||||||||||||||||
Malaysian Ringgit | HSBC | Buy | 4,899,000 | 1,146,904 | 2/21/17 | 59,811 | — | |||||||||||||||||||||||||
Euro | BZWS | Sell | 9,798,000 | 11,006,583 | 2/22/17 | 29,971 | — | |||||||||||||||||||||||||
Japanese Yen | BZWS | Sell | 343,460,000 | 3,106,268 | 2/27/17 | — | (251,250 | ) | ||||||||||||||||||||||||
Japanese Yen | HSBC | Sell | 1,131,678,000 | 10,219,095 | 2/27/17 | — | (843,705 | ) | ||||||||||||||||||||||||
Euro | BOFA | Sell | 2,694,506 | 3,004,590 | 2/28/17 | — | (14,755 | ) | ||||||||||||||||||||||||
Euro | DBAB | Sell | 1,530,900 | 1,708,714 | 2/28/17 | — | (6,745 | ) | ||||||||||||||||||||||||
Euro | DBAB | Sell | 2,579,651 | 2,881,651 | 3/01/17 | — | (9,107 | ) | ||||||||||||||||||||||||
Japanese Yen | DBAB | Sell | 229,660,000 | 2,063,933 | 3/01/17 | — | (181,303 | ) | ||||||||||||||||||||||||
Japanese Yen | JPHQ | Sell | 848,300,000 | 7,609,846 | 3/03/17 | — | (684,090 | ) | ||||||||||||||||||||||||
Japanese Yen | HSBC | Sell | 400,800,000 | 3,569,012 | 3/06/17 | — | (350,128 | ) | ||||||||||||||||||||||||
Euro | DBAB | Sell | 1,536,000 | 1,702,687 | 3/07/17 | — | (18,963 | ) | ||||||||||||||||||||||||
Malaysian Ringgit | JPHQ | Buy | 14,772,000 | 3,578,142 | 3/20/17 | 56,341 | — | |||||||||||||||||||||||||
Malaysian Ringgit | HSBC | Buy | 36,880,000 | 8,974,328 | 3/22/17 | 98,813 | — | |||||||||||||||||||||||||
Japanese Yen | JPHQ | Sell | 285,510,329 | 2,593,756 | 3/24/17 | — | (200,045 | ) | ||||||||||||||||||||||||
Philippine Peso | JPHQ | Buy | 17,950,000 | 377,061 | 3/29/17 | — | (231 | ) | ||||||||||||||||||||||||
Japanese Yen | JPHQ | Sell | 172,207,000 | 1,537,617 | 3/31/17 | — | (147,982 | ) | ||||||||||||||||||||||||
Malaysian Ringgit | HSBC | Buy | 7,790,000 | 1,927,979 | 3/31/17 | — | (12,219 | ) | ||||||||||||||||||||||||
Malaysian Ringgit | JPHQ | Buy | 3,956,000 | 1,010,447 | 4/11/17 | — | (38,007 | ) | ||||||||||||||||||||||||
Japanese Yen | CITI | Sell | 261,800,000 | 2,460,526 | 4/13/17 | — | (103,523 | ) | ||||||||||||||||||||||||
Japanese Yen | BOFA | Sell | 700,840,000 | 6,516,817 | 4/18/17 | — | (348,699 | ) | ||||||||||||||||||||||||
Japanese Yen | JPHQ | Sell | 1,233,160,000 | 11,517,702 | 4/20/17 | — | (563,571 | ) | ||||||||||||||||||||||||
Japanese Yen | JPHQ | Sell | 917,650,000 | 8,509,247 | 4/21/17 | — | (481,376 | ) | ||||||||||||||||||||||||
South Korean Won | HSBC | Sell | 46,898,000,000 | 41,144,010 | 4/25/17 | 510,334 | — | |||||||||||||||||||||||||
South Korean Won | HSBC | Sell | 13,067,000,000 | 11,402,766 | 4/26/17 | 81,179 | — | |||||||||||||||||||||||||
Indonesian Rupiah | JPHQ | Buy | 1,721,000,000,000 | 122,316,987 | 5/03/17 | 1,237,891 | — | |||||||||||||||||||||||||
Japanese Yen | BOFA | Sell | 1,105,661,700 | 10,312,085 | 5/18/17 | — | (533,720 | ) | ||||||||||||||||||||||||
Japanese Yen | CITI | Sell | 1,104,534,000 | 10,296,525 | 5/18/17 | — | (538,217 | ) | ||||||||||||||||||||||||
Japanese Yen | BOFA | Sell | 1,102,846,375 | 10,244,741 | 5/19/17 | — | (573,933 | ) | ||||||||||||||||||||||||
Japanese Yen | HSBC | Sell | 1,106,730,400 | 10,280,821 | 5/19/17 | — | (575,955 | ) | ||||||||||||||||||||||||
Japanese Yen | BOFA | Sell | 1,105,842,500 | 10,234,033 | 5/22/17 | — | (615,496 | ) | ||||||||||||||||||||||||
Japanese Yen | JPHQ | Sell | 715,709,000 | 6,644,716 | 5/22/17 | — | (377,175 | ) | ||||||||||||||||||||||||
Malaysian Ringgit | HSBC | Buy | 298,500 | 72,224 | 5/23/17 | 1,025 | — | |||||||||||||||||||||||||
Japanese Yen | CITI | Sell | 1,370,500,000 | 12,982,646 | 6/08/17 | — | (473,748 | ) | ||||||||||||||||||||||||
Japanese Yen | CITI | Sell | 310,702,000 | 2,980,098 | 6/16/17 | — | (71,660 | ) | ||||||||||||||||||||||||
| TGB-20 | Semiannual Report |
FRANKLIN TEMPLETON VARIABLE INSURANCE PRODUCTS TRUST
STATEMENT OF INVESTMENTS (UNAUDITED)
Templeton Global Bond VIP Fund (continued)
| Forward Exchange Contracts | ||||||||||||||||||||||||||||||||
| Currency | Counterpartya | Type | Quantity | Contract Amount* | Settlement Date | Unrealized Appreciation | Unrealized Depreciation | |||||||||||||||||||||||||
| OTC Forward Exchange Contracts (continued) | ||||||||||||||||||||||||||||||||
Japanese Yen | JPHQ | Sell | 702,800,000 | 6,738,029 | 6/16/17 | $ | — | $ | (164,969 | ) | ||||||||||||||||||||||
Japanese Yen | DBAB | Sell | 1,453,310,000 | 13,915,662 | 6/19/17 | — | (360,875 | ) | ||||||||||||||||||||||||
Japanese Yen | CITI | Sell | 1,086,780,000 | 10,588,528 | 6/20/17 | — | (87,896 | ) | ||||||||||||||||||||||||
Philippine Peso | JPHQ | Buy | 251,010,000 | 5,332,696 | 6/21/17 | — | (82,395 | ) | ||||||||||||||||||||||||
Japanese Yen | DBAB | Sell | 1,455,820,000 | 14,145,161 | 6/22/17 | — | (157,963 | ) | ||||||||||||||||||||||||
|
| |||||||||||||||||||||||||||||||
Total Forward Exchange Contracts |
| $ | 26,393,217 | $ | (121,021,815 | ) | ||||||||||||||||||||||||||
|
| |||||||||||||||||||||||||||||||
Net unrealized appreciation (depreciation) |
| $ | (94,628,598 | ) | ||||||||||||||||||||||||||||
|
| |||||||||||||||||||||||||||||||
aMay be comprised of multiple contracts with the same counterparty, currency and settlement date.
*In U.S. dollars unless otherwise indicated.
See Abbreviations on page TGB-37.
| The accompanying notes are an integral part of these financial statements. | Semiannual Report | TGB-21 |
FRANKLIN TEMPLETON VARIABLE INSURANCE PRODUCTS TRUST
STATEMENT OF INVESTMENTS (UNAUDITED)
Templeton Global Bond VIP Fund (continued)
At June 30, 2016, the Fund had the following interest rate swap contracts outstanding. See Note 1(d).
| Interest Rate Swap Contracts | ||||||||||||||||||||
| Description | Counterparty / Exchange | Notional Amount | Expiration Date | Unrealized Appreciation | Unrealized Depreciation | |||||||||||||||
| Centrally Cleared Swap Contracts | ||||||||||||||||||||
Receive Floating rate 3-month USD BBA LIBOR | LCH | $ | 183,490,000 | 10/17/17 | $ | — | $ | (660,008 | ) | |||||||||||
Receive Floating rate 3-month USD BBA LIBOR | CME | 13,090,000 | 10/04/23 | — | (1,542,641 | ) | ||||||||||||||
Receive Floating rate 3-month USD BBA LIBOR | CME | 13,090,000 | 10/04/23 | — | (1,561,802 | ) | ||||||||||||||
Receive Floating rate 3-month USD BBA LIBOR | CME | 13,090,000 | 10/07/23 | — | (1,532,664 | ) | ||||||||||||||
Receive Floating rate 3-month USD BBA LIBOR | LCH | 34,000,000 | 7/07/24 | — | (4,349,405 | ) | ||||||||||||||
Receive Floating rate 3-month USD BBA LIBOR | LCH | 114,670,000 | 1/22/25 | — | (6,871,359 | ) | ||||||||||||||
Receive Floating rate 3-month USD BBA LIBOR | LCH | 143,340,000 | 1/23/25 | — | (9,263,673 | ) | ||||||||||||||
Receive Floating rate 3-month USD BBA LIBOR | LCH | 84,590,000 | 1/27/25 | — | (5,486,360 | ) | ||||||||||||||
Receive Floating rate 3-month USD BBA LIBOR | LCH | 21,150,000 | 1/29/25 | — | (1,304,134 | ) | ||||||||||||||
Receive Floating rate 3-month USD BBA LIBOR | LCH | 17,910,000 | 1/30/25 | — | (1,108,943 | ) | ||||||||||||||
Receive Floating rate 3-month USD BBA LIBOR | LCH | 28,210,000 | 2/03/25 | — | (1,438,799 | ) | ||||||||||||||
Receive Floating rate 3-month USD BBA LIBOR | CME | 6,370,000 | 10/04/43 | — | (2,731,909 | ) | ||||||||||||||
Receive Floating rate 3-month USD BBA LIBOR | CME | 6,370,000 | 10/04/43 | — | (2,759,338 | ) | ||||||||||||||
Receive Floating rate 3-month USD BBA LIBOR | CME | 6,370,000 | 10/07/43 | — | (2,740,936 | ) | ||||||||||||||
|
| |||||||||||||||||||
Total Centrally Cleared Swap Contracts |
| — | (43,351,971 | ) | ||||||||||||||||
|
| |||||||||||||||||||
| OTC Swap Contracts | ||||||||||||||||||||
Receive Floating rate 3-month USD BBA LIBOR | JPHQ | 3,240,000 | 3/04/21 | — | (423,880 | ) | ||||||||||||||
Receive Floating rate 3-month USD BBA LIBOR | DBAB | 14,630,000 | 3/28/21 | — | (1,885,719 | ) | ||||||||||||||
Receive Floating rate 3-month USD BBA LIBOR | CITI | 7,460,000 | 2/25/41 | — | (4,120,780 | ) | ||||||||||||||
Receive Floating rate 3-month USD BBA LIBOR | JPHQ | 7,460,000 | 2/25/41 | — | (4,125,040 | ) | ||||||||||||||
Receive Floating rate 3-month USD BBA LIBOR | JPHQ | 5,600,000 | 2/28/41 | — | (3,069,988 | ) | ||||||||||||||
Receive Floating rate 3-month USD BBA LIBOR | JPHQ | 1,870,000 | 3/01/41 | — | (1,013,233 | ) | ||||||||||||||
|
| |||||||||||||||||||
Total OTC Swap Contracts |
| — | (14,638,640 | ) | ||||||||||||||||
|
| |||||||||||||||||||
Total Interest Rate Swap Contracts |
| — | (57,990,611 | ) | ||||||||||||||||
|
| |||||||||||||||||||
Net unrealized appreciation (depreciation) |
| $ | (57,990,611 | ) | ||||||||||||||||
|
| |||||||||||||||||||
See Abbreviations on page TGB-37.
| TGB-22 | Semiannual Report |
FRANKLIN TEMPLETON VARIABLE INSURANCE PRODUCTS TRUST
Financial Statements
Statement of Assets and Liabilities
June 30, 2016 (unaudited)
| Templeton Global Bond VIP Fund | ||||
Assets: | ||||
Investments in securities: | ||||
Cost - Unaffiliated issuers | $ | 2,557,647,922 | ||
Cost - Non-controlled affiliates (Note 3e) | 409,277,955 | |||
Cost - Repurchase agreements | 256,694,916 | |||
|
| |||
Total cost of investments | $ | 3,223,620,793 | ||
|
| |||
Value - Unaffiliated issuers | $ | 2,456,567,869 | ||
Value - Non-controlled affiliates (Note 3e) | 409,277,955 | |||
Value - Repurchase agreements | 256,694,916 | |||
|
| |||
Total value of investments | 3,122,540,740 | |||
Cash | 29,974,182 | |||
Restricted cash (Note 1e) | 1,600,000 | |||
Foreign currency, at value (cost $4,964,407) | 4,990,093 | |||
Receivables: | ||||
Investment securities sold | 6,752,572 | |||
Capital shares sold | 3,131,452 | |||
Interest | 33,722,605 | |||
Due from brokers | 135,469,596 | |||
Variation margin | 841,495 | |||
Unrealized appreciation on OTC forward exchange contracts | 26,393,217 | |||
Other assets | 1,549 | |||
|
| |||
Total assets | 3,365,417,501 | |||
|
| |||
Liabilities: | ||||
Payables: | ||||
Capital shares redeemed | 1,655,124 | |||
Management fees | 1,084,565 | |||
Distribution fees | 1,233,441 | |||
Due to Brokers | 1,600,000 | |||
Unrealized depreciation on OTC forward exchange contracts | 121,021,815 | |||
Unrealized depreciation on OTC swap contracts | 14,638,640 | |||
Deferred tax | 2,704,577 | |||
Accrued expenses and other liabilities | 1,247,241 | |||
|
| |||
Total liabilities | 145,185,403 | |||
|
| |||
Net assets, at value | $ | 3,220,232,098 | ||
|
| |||
Net assets consist of: | ||||
Paid-in capital | $ | 3,609,495,955 | ||
Undistributed net investment income | 16,213,348 | |||
Net unrealized appreciation (depreciation) | (254,899,959 | ) | ||
Accumulated net realized gain (loss) | (150,577,246 | ) | ||
|
| |||
Net assets, at value | $ | 3,220,232,098 | ||
|
| |||
| The accompanying notes are an integral part of these financial statements. | Semiannual Report | TGB-23 |
FRANKLIN TEMPLETON VARIABLE INSURANCE PRODUCTS TRUST
FINANCIAL STATEMENTS
Statement of Assets and Liabilities (continued)
June 30, 2016 (unaudited)
| Templeton Global Bond VIP Fund | ||||
| Class 1: | ||||
Net assets, at value | $ | 278,296,990 | ||
|
| |||
Shares outstanding | 17,342,308 | |||
|
| |||
Net asset value and maximum offering price per share | $ | 16.05 | ||
|
| |||
| Class 2: | ||||
Net assets, at value | $ | 2,845,199,990 | ||
|
| |||
Shares outstanding | 183,652,651 | |||
|
| |||
Net asset value and maximum offering price per share | $ | 15.49 | ||
|
| |||
| Class 4: | ||||
Net assets, at value | $ | 96,735,118 | ||
|
| |||
Shares outstanding | 6,099,715 | |||
|
| |||
Net asset value and maximum offering price per share | $ | 15.86 | ||
|
| |||
| TGB-24 | Semiannual Report | The accompanying notes are an integral part of these financial statements. |
FRANKLIN TEMPLETON VARIABLE INSURANCE PRODUCTS TRUST
FINANCIAL STATEMENTS
Statement of Operations
for the six months ended June 30, 2016 (unaudited)
| Templeton Global Bond VIP Fund | ||||
Investment income: | ||||
Interest (net of foreign taxes $2,033,094) | $ | 62,874,141 | ||
Inflation principal adjustments | 4,162,464 | |||
|
| |||
Total investment income | 67,036,605 | |||
|
| |||
Expenses: | ||||
Management fees (Note 3a) | 7,336,218 | |||
Distribution fees: (Note 3c) | ||||
Class 2 | 3,537,960 | |||
Class 4 | 171,420 | |||
Custodian fees (Note 4) | 636,673 | |||
Reports to shareholders | 213,242 | |||
Professional fees | 70,147 | |||
Trustees’ fees and expenses | 7,898 | |||
Other | 82,559 | |||
|
| |||
Total expenses | 12,056,117 | |||
Expense reductions (Note 4) | (16,136 | ) | ||
Expenses waived/paid by affiliates (Note 3e) | (629,909 | ) | ||
|
| |||
Net expenses | 11,410,072 | |||
|
| |||
Net investment income | 55,626,533 | |||
|
| |||
Realized and unrealized gains (losses): | ||||
Net realized gain (loss) from: | ||||
Investments | (80,174,616 | ) | ||
Foreign currency transactions | (65,130,361 | ) | ||
Swap contracts | (5,253,316 | ) | ||
|
| |||
Net realized gain (loss) | (150,558,293 | ) | ||
|
| |||
Net change in unrealized appreciation (depreciation) on: | ||||
Investments | 190,576,925 | |||
Translation of other assets and liabilities denominated in foreign currencies | (114,540,381 | ) | ||
Swap contracts | (42,663,972 | ) | ||
Change in deferred taxes on unrealized appreciation | (1,318,225 | ) | ||
|
| |||
Net change in unrealized appreciation (depreciation) | 32,054,347 | |||
|
| |||
Net realized and unrealized gain (loss) | (118,503,946 | ) | ||
|
| |||
Net increase (decrease) in net assets resulting from operations | $ | (62,877,413 | ) | |
|
| |||
| The accompanying notes are an integral part of these financial statements. | Semiannual Report | TGB-25 |
FRANKLIN TEMPLETON VARIABLE INSURANCE PRODUCTS TRUST
FINANCIAL STATEMENTS
Statements of Changes in Net Assets
| Templeton Global Bond VIP Fund | ||||||||
Six Months Ended June 30, 2016 | Year Ended December 31, 2015 | |||||||
Increase (decrease) in net assets: | ||||||||
Operations: | ||||||||
Net investment income | $ | 55,626,533 | $ | 97,606,372 | ||||
Net realized gain (loss) | (150,558,293 | ) | 69,448,149 | |||||
Net change in unrealized appreciation (depreciation) | 32,054,347 | (322,119,799 | ) | |||||
|
| |||||||
Net increase (decrease) in net assets resulting from operations | (62,877,413 | ) | (155,065,278 | ) | ||||
|
| |||||||
Distributions to shareholders from: | ||||||||
Net investment income and net foreign currency gains: | ||||||||
Class 1 | — | (24,254,176 | ) | |||||
Class 2 | — | (245,964,961 | ) | |||||
Class 4 | — | (8,346,133 | ) | |||||
Net realized gains: | ||||||||
Class 1 | (230,623 | ) | (1,526,914 | ) | ||||
Class 2 | (2,445,769 | ) | (15,975,209 | ) | ||||
Class 4 | (81,295 | ) | (550,981 | ) | ||||
|
| |||||||
Total distributions to shareholders | (2,757,687 | ) | (296,618,374 | ) | ||||
|
| |||||||
Capital share transactions: (Note 2) | ||||||||
Class 1 | (9,159,882 | ) | 8,052,024 | |||||
Class 2 | (68,229,811 | ) | 193,114,598 | |||||
Class 4 | (4,257,897 | ) | 5,703,235 | |||||
|
| |||||||
Total capital share transactions | (81,647,590 | ) | 206,869,857 | |||||
|
| |||||||
Net increase (decrease) in net assets | (147,282,690 | ) | (244,813,795 | ) | ||||
Net assets: | ||||||||
Beginning of period | 3,367,514,788 | 3,612,328,583 | ||||||
|
| |||||||
End of period | $ | 3,220,232,098 | $ | 3,367,514,788 | ||||
|
| |||||||
Undistributed net investment income (distributions in excess of net investment income) included in net assets: | ||||||||
End of period | $ | 16,213,348 | $ | (39,413,185 | ) | |||
|
| |||||||
| TGB-26 | Semiannual Report | The accompanying notes are an integral part of these financial statements. |
FRANKLIN TEMPLETON VARIABLE INSURANCE PRODUCTS TRUST
Notes to Financial Statements (unaudited)
Templeton Global Bond VIP Fund
1. Organization and Significant Accounting Policies
Franklin Templeton Variable Insurance Products Trust (Trust) is registered under the Investment Company Act of 1940 (1940 Act) as an open-end management investment company, consisting of nineteen separate funds and applies the specialized accounting and reporting guidance in U.S. Generally Accepted Accounting Principles (U.S. GAAP). Templeton Global Bond VIP Fund (Fund) is included in this report. The financial statements of the remaining funds in the Trust are presented separately. Shares of the Fund are generally sold only to insurance company separate accounts to fund the benefits of variable life insurance policies or variable annuity contracts. The Fund offers three classes of shares: Class 1, Class 2 and Class 4. Each class of shares differs by its distribution fees, voting rights on matters affecting a single class and its exchange privilege.
The following summarizes the Fund’s significant accounting policies.
a. Financial Instrument Valuation
The Fund’s investments in financial instruments are carried at fair value daily. Fair value is the price that would be received to sell an asset or paid to transfer a liability in an orderly transaction between market participants on the measurement date. The Fund calculates the net asset value (NAV) per share as of 4 p.m. Eastern time each day the New York Stock Exchange (NYSE) is open for trading. Under compliance policies and procedures approved by the Trust’s Board of Trustees (the Board), the Fund’s administrator has responsibility for oversight of valuation, including leading the cross-functional Valuation Committee (VC). The VC provides administration and oversight of the Fund’s valuation policies and procedures, which are approved annually by the Board. Among other things, these procedures allow the Fund to utilize independent pricing services, quotations from securities and financial instrument dealers, and other market sources to determine fair value.
Debt securities generally trade in the over-the-counter (OTC) market rather than on a securities exchange. The Fund’s pricing services use multiple valuation techniques to determine fair value. In instances where sufficient market activity exists, the pricing services may utilize a market-based approach through which quotes from market makers are used to determine fair value. In instances where sufficient market activity may not exist or is limited, the pricing services also utilize proprietary valuation models which may consider market characteristics
such as benchmark yield curves, credit spreads, estimated default rates, anticipated market interest rate volatility, coupon rates, anticipated timing of principal repayments, underlying collateral, and other unique security features in order to estimate the relevant cash flows, which are then discounted to calculate the fair value. Securities denominated in a foreign currency are converted into their U.S. dollar equivalent at the foreign exchange rate in effect at 4 p.m. Eastern time on the date that the values of the foreign debt securities are determined.
Investments in open-end mutual funds are valued at the closing NAV. Repurchase agreements are valued at cost, which approximates fair value.
Derivative financial instruments (derivatives) listed on an exchange are valued at the official closing price of the day. Certain derivatives trade in the OTC market. The Fund’s pricing services use various techniques including industry standard option pricing models and proprietary discounted cash flow models to determine the fair value of those instruments. The Fund’s net benefit or obligation under the derivative contract, as measured by the fair value of the contract, is included in net assets.
The Fund has procedures to determine the fair value of financial instruments for which market prices are not reliable or readily available. Under these procedures, the VC convenes on a regular basis to review such financial instruments and considers a number of factors, including significant unobservable valuation inputs, when arriving at fair value. The VC primarily employs a market-based approach which may use related or comparable assets or liabilities, recent transactions, market multiples, book values, and other relevant information for the investment to determine the fair value of the investment. An income-based valuation approach may also be used in which the anticipated future cash flows of the investment are discounted to calculate fair value. Discounts may also be applied due to the nature or duration of any restrictions on the disposition of the investments. Due to the inherent uncertainty of valuations of such investments, the fair values may differ significantly from the values that would have been used had an active market existed. The VC employs various methods for calibrating these valuation approaches including a regular review of key inputs and assumptions, transactional back-testing or disposition analysis, and reviews of any related market activity.
| Semiannual Report | TGB-27 |
FRANKLIN TEMPLETON VARIABLE INSURANCE PRODUCTS TRUST
NOTES TO FINANCIAL STATEMENTS (UNAUDITED)
Templeton Global Bond VIP Fund (continued)
1. Organization and Significant Accounting Policies (continued)
b. Foreign Currency Translation
Portfolio securities and other assets and liabilities denominated in foreign currencies are translated into U.S. dollars based on the exchange rate of such currencies against U.S. dollars on the date of valuation. The Fund may enter into foreign currency exchange contracts to facilitate transactions denominated in a foreign currency. Purchases and sales of securities, income and expense items denominated in foreign currencies are translated into U.S. dollars at the exchange rate in effect on the transaction date. Portfolio securities and assets and liabilities denominated in foreign currencies contain risks that those currencies will decline in value relative to the U.S. dollar. Occasionally, events may impact the availability or reliability of foreign exchange rates used to convert the U.S. dollar equivalent value. If such an event occurs, the foreign exchange rate will be valued at fair value using procedures established and approved by the Board.
The Fund does not separately report the effect of changes in foreign exchange rates from changes in market prices on securities held. Such changes are included in net realized and unrealized gain or loss from investments in the Statement of Operations.
Realized foreign exchange gains or losses arise from sales of foreign currencies, currency gains or losses realized between the trade and settlement dates on securities transactions and the difference between the recorded amounts of dividends, interest, and foreign withholding taxes and the U.S. dollar equivalent of the amounts actually received or paid. Net unrealized foreign exchange gains and losses arise from changes in foreign exchange rates on foreign denominated assets and liabilities other than investments in securities held at the end of the reporting period.
c. Joint Repurchase Agreement
The Fund enters into a joint repurchase agreement whereby its uninvested cash balance is deposited into a joint cash account with other funds managed by the investment manager or an affiliate of the investment manager and is used to invest in one or more repurchase agreements. The value and face amount of the joint repurchase agreement are allocated to the funds based on their pro-rata interest. A repurchase agreement is accounted for as a loan by the Fund to the seller, collateralized by securities which are delivered to the Fund’s custodian. The fair
value, including accrued interest, of the initial collateralization is required to be at least 102% of the dollar amount invested by the funds, with the value of the underlying securities marked to market daily to maintain coverage of at least 100%. Repurchase agreements are subject to the terms of Master Repurchase Agreements (MRAs) with approved counterparties (sellers). The MRAs contain various provisions, including but not limited to events of default and maintenance of collateral for repurchase agreements. In the event of default by either the seller or the Fund, certain MRAs may permit the non-defaulting party to net and close-out all transactions, if any, traded under such agreements. The Fund may sell securities it holds as collateral and apply the proceeds towards the repurchase price and any other amounts owed by the seller to the Fund in the event of default by the seller. This could involve costs or delays in addition to a loss on the securities if their value falls below the repurchase price owed by the seller. The joint repurchase agreement held by the Fund at period end, as indicated in the Statement of Investments, had been entered into on June 30, 2016.
d. Derivative Financial Instruments
The Fund invested in derivatives in order to manage risk or gain exposure to various other investments or markets. Derivatives are financial contracts based on an underlying or notional amount, require no initial investment or an initial net investment that is smaller than would normally be required to have a similar response to changes in market factors, and require or permit net settlement. Derivatives contain various risks including the potential inability of the counterparty to fulfill their obligations under the terms of the contract, the potential for an illiquid secondary market, and/or the potential for market movements which expose the Fund to gains or losses in excess of the amounts shown in the Statement of Assets and Liabilities. Realized gain and loss and unrealized appreciation and depreciation on these contracts for the period are included in the Statement of Operations.
Derivative counterparty credit risk is managed through a formal evaluation of the creditworthiness of all potential counterparties. The Fund attempts to reduce its exposure to counterparty credit risk on OTC derivatives, whenever possible, by entering into International Swaps and Derivatives Association (ISDA) master agreements with certain counterparties. These agreements contain various provisions, including but not limited to collateral requirements, events of default, or early termination. Termination events applicable to the counterparty include
| TGB-28 | Semiannual Report |
FRANKLIN TEMPLETON VARIABLE INSURANCE PRODUCTS TRUST
NOTES TO FINANCIAL STATEMENTS (UNAUDITED)
Templeton Global Bond VIP Fund (continued)
certain deteriorations in the credit quality of the counterparty. Termination events applicable to the Fund include failure of the Fund to maintain certain net asset levels and/or limit the decline in net assets over various periods of time. In the event of default or early termination, the ISDA master agreement gives the non-defaulting party the right to net and close-out all transactions traded, whether or not arising under the ISDA agreement, to one net amount payable by one counterparty to the other. However, absent an event of default or early termination, OTC derivative assets and liabilities are presented gross and not offset in the Statement of Assets and Liabilities. Early termination by the counterparty may result in an immediate payment by the Fund of any net liability owed to that counterparty under the ISDA agreement.
Collateral requirements differ by type of derivative. Collateral or initial margin requirements are set by the broker or exchange clearing house for exchange traded and centrally cleared derivatives. Initial margin deposited is held at the exchange and can be in the form of cash and/or securities. For OTC derivatives traded under an ISDA master agreement, posting of collateral is required by either the Fund or the applicable counterparty if the total net exposure of all OTC derivatives with the applicable counterparty exceeds the minimum transfer amount, which typically ranges from $100,000 to $250,000, and can vary depending on the counterparty and the type of the agreement. Generally, collateral is determined at the close of Fund business each day and any additional collateral required due to changes in derivative values may be delivered by the Fund or the counterparty within a few business days. Collateral pledged and/or received by the Fund for OTC derivatives, if any, is held in segregated accounts with the Fund’s custodian/counterparty broker and can be in the form of cash and/or securities. Unrestricted cash may be invested according to the Fund’s investment objectives. To the extent that the amounts due to the Fund from its counterparties are not subject to collateralization or are not fully collateralized, the Fund bears the risk of loss from counterparty non-performance.
The Fund entered into OTC forward exchange contracts primarily to manage and/or gain exposure to certain foreign currencies. A forward exchange contract is an agreement between the Fund and a counterparty to buy or sell a foreign currency at a specific exchange rate on a future date.
The Fund entered into interest rate swap contracts primarily to manage interest rate risk. An interest rate swap is an agreement
between the Fund and a counterparty to exchange cash flows based on the difference between two interest rates, applied to a notional amount. These agreements may be privately negotiated in the over-the-counter market (OTC interest rate swaps) or may be executed on a registered exchange (centrally cleared interest rate swaps). For centrally cleared interest rate swaps, required initial margins are pledged by the Fund, and the daily change in fair value is accounted for as a variation margin payable or receivable in the Statement of Assets and Liabilities. Over the term of the contract, contractually required payments to be paid and to be received are accrued daily and recorded as unrealized depreciation and appreciation until the payments are made, at which time they are realized.
The Fund invests in value recovery instruments (VRI) primarily to gain exposure to growth risk. Periodic payments from VRI are dependent on established benchmarks for underlying variables. VRI has a notional amount, which is used to calculate amounts of payments to holders. Payments are recorded upon receipt as realized gains in the Statement of Operations. The risks of investing in VRI include growth risk, liquidity, and the potential loss of investment.
See Note 9 regarding other derivative information.
e. Restricted Cash
At June 30, 2016, the Fund held restricted cash in connection with investments in certain derivative securities. Restricted cash is held in a segregated account with the Fund’s counterparty broker and is reflected in the Statement of Assets and Liabilities.
f. Loan Participation Notes
The Fund invests in loan participation notes (Participations). Participations are loans originally issued to a borrower by one or more financial institutions (the Lender) and subsequently sold to other investors, such as the Fund. Participations typically result in the Fund having a contractual relationship only with the Lender and not with the borrower. The Fund has the right to receive from the Lender any payments of principal, interest and fees which the Lender received from the borrower. The Fund generally has no rights to either enforce compliance by the borrower with the terms of the loan agreement or to any collateral relating to the original loan. As a result, the Fund assumes the credit risk of both the borrower and the Lender that is selling the Participation. The Participations may also involve interest rate risk and liquidity risk, including the potential default or insolvency of the borrower and/or the Lender.
| Semiannual Report | TGB-29 |
FRANKLIN TEMPLETON VARIABLE INSURANCE PRODUCTS TRUST
NOTES TO FINANCIAL STATEMENTS (UNAUDITED)
Templeton Global Bond VIP Fund (continued)
1. Organization and Significant Accounting Policies (continued)
g. Income and Deferred Taxes
It is the Fund’s policy to qualify as a regulated investment company under the Internal Revenue Code. The Fund intends to distribute to shareholders substantially all of its taxable income and net realized gains to relieve it from federal income and if applicable, excise taxes. As a result, no provision for U.S. federal income taxes is required.
The Fund may be subject to foreign taxation related to income received, capital gains on the sale of securities and certain foreign currency transactions in the foreign jurisdictions in which it invests. Foreign taxes, if any, are recorded based on the tax regulations and rates that exist in the foreign markets in which the Fund invests. When a capital gain tax is determined to apply, the Fund records an estimated deferred tax liability in an amount that would be payable if the securities were disposed of on the valuation date.
The Fund may recognize an income tax liability related to its uncertain tax positions under U.S. GAAP when the uncertain tax position has a less than 50% probability that it will be sustained upon examination by the tax authorities based on its technical merits. As of June 30, 2016, the Fund has determined that no tax liability is required in its financial statements related to uncertain tax positions for any open tax years (or expected to be taken in future tax years). Open tax years are those that remain subject to examination and are based on each tax jurisdiction’s statute of limitation.
h. Security Transactions, Investment Income, Expenses and Distributions
Security transactions are accounted for on trade date. Realized gains and losses on security transactions are determined on a specific identification basis. Interest income and estimated expenses are accrued daily. Amortization of premium and accretion of discount on debt securities are included in interest income. Distributions to shareholders are recorded on the ex-dividend date and are determined according to income tax regulations (tax basis). Distributable earnings determined on a tax basis may differ from earnings recorded in accordance with U.S. GAAP. These differences may be permanent or temporary. Permanent differences are reclassified among capital accounts to reflect their tax character. These reclassifications have no
impact on net assets or the results of operations. Temporary differences are not reclassified, as they may reverse in subsequent periods.
Common expenses incurred by the Trust are allocated among the Funds based on the ratio of net assets of each Fund to the combined net assets of the Trust. Fund specific expenses are charged directly to the fund that incurred the expense.
Realized and unrealized gains and losses and net investment income, not including class specific expenses, are allocated daily to each class of shares based upon the relative proportion of net assets of each class. Differences in per share distributions, by class, are generally due to differences in class specific expenses.
Inflation-indexed bonds are adjusted for inflation through periodic increases or decreases in the security’s interest accruals, face amount, or principal redemption value, by amounts corresponding to the rate of inflation as measured by an index. Any increase or decrease in the face amount or principal redemption value will be included as inflation principal adjustments in the Statement of Operations.
i. Accounting Estimates
The preparation of financial statements in accordance with U.S. GAAP requires management to make estimates and assumptions that affect the reported amounts of assets and liabilities at the date of the financial statements and the amounts of income and expenses during the reporting period. Actual results could differ from those estimates.
j. Guarantees and Indemnifications
Under the Trust’s organizational documents, its officers and trustees are indemnified by the Trust against certain liabilities arising out of the performance of their duties to the Trust. Additionally, in the normal course of business, the Trust, on behalf of the Fund, enters into contracts with service providers that contain general indemnification clauses. The Trust’s maximum exposure under these arrangements is unknown as this would involve future claims that may be made against the Trust that have not yet occurred. Currently, the Trust expects the risk of loss to be remote.
| TGB-30 | Semiannual Report |
FRANKLIN TEMPLETON VARIABLE INSURANCE PRODUCTS TRUST
NOTES TO FINANCIAL STATEMENTS (UNAUDITED)
Templeton Global Bond VIP Fund (continued)
2. Shares of Beneficial Interest
At June 30, 2016, there were an unlimited number of shares authorized (without par value). Transactions in the Fund’s shares were as follows:
| Six Months Ended June 30, 2016 | Year Ended December 31, 2015 | |||||||||||||||||||
| Shares | Amount | Shares | Amount | |||||||||||||||||
| Class 1 Shares: | ||||||||||||||||||||
Shares sold | 1,095,974 | $ | 17,496,721 | 3,348,667 | $ | 58,944,948 | ||||||||||||||
Shares issued in reinvestment of distributions | 14,671 | 230,623 | 1,514,753 | 25,781,090 | ||||||||||||||||
Shares redeemed | (1,684,007 | ) | (26,887,226 | ) | (4,380,221 | ) | (76,674,014 | ) | ||||||||||||
|
| |||||||||||||||||||
Net increase (decrease) | (573,362 | ) | $ | (9,159,882 | ) | 483,199 | $ | 8,052,024 | ||||||||||||
|
| |||||||||||||||||||
| Class 2 Shares: | ||||||||||||||||||||
Shares sold | 6,966,062 | $ | 107,599,786 | 15,666,500 | $ | 268,873,539 | ||||||||||||||
Shares issued in reinvestment of distributions | 161,118 | 2,445,769 | 15,904,078 | 261,940,170 | ||||||||||||||||
Shares redeemed | (11,574,219 | ) | (178,275,366 | ) | (20,123,134 | ) | (337,699,111 | ) | ||||||||||||
|
| |||||||||||||||||||
Net increase (decrease) | (4,447,039 | ) | $ | (68,229,811 | ) | 11,447,444 | $ | 193,114,598 | ||||||||||||
|
| |||||||||||||||||||
| Class 4 Shares: | ||||||||||||||||||||
Shares sold | 376,857 | $ | 5,953,469 | 1,068,838 | $ | 18,598,516 | ||||||||||||||
Shares issued in reinvestment of distributions | 5,231 | 81,295 | 527,080 | 8,897,114 | ||||||||||||||||
Shares redeemed | (651,097 | ) | (10,292,661 | ) | (1,276,578 | ) | (21,792,395 | ) | ||||||||||||
|
| |||||||||||||||||||
Net increase (decrease) | (269,009 | ) | $ | (4,257,897 | ) | 319,340 | $ | 5,703,235 | ||||||||||||
|
| |||||||||||||||||||
3. Transactions with Affiliates
Franklin Resources, Inc. is the holding company for various subsidiaries that together are referred to as Franklin Templeton Investments. Certain officers and trustees of the Fund are also officers and/or directors of the following subsidiaries:
| Subsidiary | Affiliation | |
Franklin Advisers, Inc. (Advisers) | Investment manager | |
Franklin Templeton Services, LLC (FT Services) | Administrative manager | |
Franklin Templeton Distributors, Inc. (Distributors) | Principal underwriter | |
Franklin Templeton Investor Services, LLC (Investor Services) | Transfer agent |
a. Management Fees
The Fund pays an investment management fee to Advisers based on the average daily net assets of the Fund as follows:
| Annualized Fee Rate | Net Assets | |
0.625% | Up to and including $100 million | |
0.500% | Over $100 million, up to and including $250 million | |
0.450% | Over $250 million, up to and including $7.5 billion | |
0.440% | Over $7.5 billion, up to and including $10 billion | |
0.430% | Over $10 billion, up to and including $12.5 billion | |
0.420% | Over $12.5 billion, up to and including $15 billion | |
0.400% | In excess of $15 billion |
For the period ended June 30, 2016, the effective management fee rate was 0.458% of the Fund’s average daily net assets.
| Semiannual Report | TGB-31 |
FRANKLIN TEMPLETON VARIABLE INSURANCE PRODUCTS TRUST
NOTES TO FINANCIAL STATEMENTS (UNAUDITED)
Templeton Global Bond VIP Fund (continued)
3. Transactions with Affiliates (continued)
b. Administrative Fees
Under an agreement with Advisers, FT Services provides administrative services to the Fund. The fee is paid by Advisers based on the Fund’s average daily net assets, and is not an additional expense of the Fund.
c. Distribution Fees
The Board has adopted distribution plans for Class 2 and Class 4 shares pursuant to Rule 12b-1 under the 1940 Act. Under the Fund’s compensation distribution plans, the Fund pays Distributors for costs incurred in connection with the servicing, sale and distribution of the Fund’s shares up to 0.25% and 0.35% per year of its average daily net assets of Class 2 and Class 4, respectively. The plan year, for purposes of monitoring compliance with the maximum annual plan rates, is February 1 through January 31.
d. Transfer Agent Fees
Investor Services, under terms of an agreement, performs shareholder servicing for the Fund and is not paid by the Fund for the services.
e. Investments in Affiliated Management Investment Companies
The Fund invests in one or more affiliated management investment companies for purposes other than exercising a controlling influence over the management or policies. Management fees paid by the Fund are waived on assets invested in the affiliated management investment companies, as noted in the Statement of Operations, in an amount not to exceed the management and administrative fees paid directly or indirectly by each affiliate.
Number of Shares | Gross Additions | Gross Reductions | Number of Shares End of | Value at End of | Investment Income | Realized Gain (Loss) | % of Affiliated Fund Shares Outstanding Held at End of Period | |||||||||||||||||||||||||
| Non-Controlled Affiliates | ||||||||||||||||||||||||||||||||
Institutional Fiduciary Trust Money | 420,632,565 | 339,715,815 | (351,070,425 | ) | 409,277,955 | $ | 409,277,955 | $ | — | $ | — | 2.1% | ||||||||||||||||||||
|
| |||||||||||||||||||||||||||||||
4. Expense Offset Arrangement
The Fund has entered into an arrangement with its custodian whereby credits realized as a result of uninvested cash balances are used to reduce a portion of the Fund’s custodian expenses. During the period ended June 30, 2016, the custodian fees were reduced as noted in the Statement of Operations.
5. Income Taxes
At June 30, 2016, the cost of investments and net unrealized appreciation (depreciation) for income tax purposes were as follows:
Cost of investments | $ | 3,242,512,437 | ||
|
| |||
Unrealized appreciation | $ | 74,103,507 | ||
Unrealized depreciation | (194,075,204 | ) | ||
|
| |||
Net unrealized appreciation (depreciation) | $ | (119,971,697 | ) | |
|
|
Differences between income and/or capital gains as determined on a book basis and a tax basis are primarily due to differing treatments of foreign currency transactions and inflation related adjustments on foreign securities.
6. Investment Transactions
Purchases and sales of investments (excluding short term securities) for the period ended June 30, 2016, aggregated $819,373,666 and $596,492,510, respectively.
| TGB-32 | Semiannual Report |
FRANKLIN TEMPLETON VARIABLE INSURANCE PRODUCTS TRUST
NOTES TO FINANCIAL STATEMENTS (UNAUDITED)
Templeton Global Bond VIP Fund (continued)
7. Credit Risk
At June 30, 2016, the Fund had 19.1% of its portfolio invested in high yield or other securities rated below investment grade. These securities may be more sensitive to economic conditions causing greater price volatility and are potentially subject to a greater risk of loss due to default than higher rated securities.
8. Concentration of Risk
Investing in foreign securities may include certain risks and considerations not typically associated with investing in U.S. securities, such as fluctuating currency values and changing local and regional economic, political and social conditions, which may result in greater market volatility. In addition, certain foreign securities may not be as liquid as U.S. securities.
9. Other Derivative Information
At June 30, 2016, the Fund’s investments in derivative contracts are reflected in the Statement of Assets and Liabilities as follows:
Asset Derivatives | Liability Derivatives | |||||||||||
| Derivative Contracts Not Accounted for as Hedging Instruments | Statement of Assets and Liabilities Location | Fair Value | Statement of Assets and Liabilities Location | Fair Value | ||||||||
Interest rate contracts | Variation margin | $ | — | a | Variation margin | $ | 43,351,971 | a | ||||
Unrealized appreciation on OTC swap contracts | — | Unrealized depreciation on OTC swap contracts | 14,638,640 | |||||||||
Foreign exchange contracts | Unrealized appreciation on OTC forward exchange contracts | 26,393,217 | Unrealized depreciation on OTC forward exchange contracts | 121,021,815 | ||||||||
Value Recovery Instruments | Investments in securities, at value | 9,855,268 | ||||||||||
|
|
|
| |||||||||
Totals | $ | 36,248,485 | $ | 179,012,426 | ||||||||
|
|
|
| |||||||||
aThis amount reflects the cumulative appreciation (depreciation) of centrally cleared swaps contracts as reported in the Statement of Investments. Only the variation margin receivable/payable at period end is separately reported within the Statement of Assets and Liabilities. Prior variation margin movements were recorded to cash upon receipt or payment.
For the period ended June 30, 2016, the effect of derivative contracts in the Fund’s Statement of Operations was as follows:
Derivative Contracts Not Accounted for as Hedging Instruments | Statement of Operations Locations | Net Realized Gain (Loss) for the Period | Statement of Operations Locations | Net Change in Unrealized Appreciation (Depreciation) for the Period | ||||||||
Net realized gain (loss) from: | Net change in unrealized appreciation (depreciation) on: | |||||||||||
Interest rate contracts | Swap contracts | $ | (5,253,316 | ) | Swap contracts | $ | (42,663,972 | ) | ||||
Foreign exchange contracts | Foreign currency transactions | (59,110,552 | )a | Translation of other assets and liabilities denominated in foreign currencies | (116,352,198 | )a | ||||||
Value Recovery Instruments | Investments | — | Investments | (2,248,351 | ) | |||||||
|
|
|
| |||||||||
Totals | $ | (64,363,868 | ) | $ | (161,264,521 | ) | ||||||
|
|
|
| |||||||||
aForward exchange contracts are included in net realized gain (loss) from foreign currency transactions and net change in unrealized appreciation (depreciation) on translation of other assets and liabilities denominated in foreign currencies in the Statement of Operations.
| Semiannual Report | TGB-33 |
FRANKLIN TEMPLETON VARIABLE INSURANCE PRODUCTS TRUST
NOTES TO FINANCIAL STATEMENTS (UNAUDITED)
Templeton Global Bond VIP Fund (continued)
9. Other Derivative Information (continued)
At June 30, 2016, the Fund’s OTC derivative assets and liabilities are as follows:
| Gross and Net Amounts of Assets and Liabilities Presented in the Statement of Assets and Liabilities | ||||||||
| Assetsa | Liabilitiesa | |||||||
| Derivatives | ||||||||
Forward Exchange Contracts | $ | 26,393,217 | $ | 121,021,815 | ||||
Swap Contracts | — | 14,638,640 | ||||||
|
| |||||||
Total | $ | 26,393,217 | $ | 135,660,455 | ||||
|
| |||||||
aAbsent an event of default or early termination, OTC derivative assets and liabilities are presented gross and not offset in the Statement of Assets and Liabilities.
At June 30, 2016, the Fund’s OTC derivative assets, which may be offset against the Fund’s OTC derivative liabilities and collateral received from the counterparty, are as follows:
| Amounts Not Offset in the Statement of Assets and Liabilities | ||||||||||||||||||||
| Gross and Net Amounts of Assets Presented in the Statement of Assets and Liabilities | Financial Instruments Available for Offset | Financial Instruments Collateral Received | Cash Collateral Received | Net Amount (Not less than zero) | ||||||||||||||||
| Counterparty | ||||||||||||||||||||
BOFA | $ | 2,753,423 | $ | (2,741,763 | ) | $ | — | $ | 630,000 | $ | 641,660 | |||||||||
BZWS | 1,099,515 | (1,099,515 | ) | — | — | — | ||||||||||||||
CITI | 1,534,647 | (1,534,647 | ) | — | — | — | ||||||||||||||
DBAB | 4,186,118 | (4,186,118 | ) | — | — | — | ||||||||||||||
GSCO | 2,715,610 | (2,715,610 | ) | — | 590,000 | 590,000 | ||||||||||||||
HSBC | 7,418,291 | (7,418,291 | ) | — | — | — | ||||||||||||||
JPHQ | 3,684,761 | (3,684,761 | ) | — | — | — | ||||||||||||||
MSCO | 1,821,133 | (1,194,740 | ) | — | 380,000 | 1,006,393 | ||||||||||||||
SCNY | 1,080,624 | (1,080,624 | ) | — | — | — | ||||||||||||||
UBSW | 99,095 | — | — | — | 99,095 | |||||||||||||||
|
| |||||||||||||||||||
Total | $ | 26,393,217 | $ | (25,656,069 | ) | $ | — | $ | 1,600,000 | $ | 2,337,148 | |||||||||
|
| |||||||||||||||||||
| TGB-34 | Semiannual Report |
FRANKLIN TEMPLETON VARIABLE INSURANCE PRODUCTS TRUST
NOTES TO FINANCIAL STATEMENTS (UNAUDITED)
Templeton Global Bond VIP Fund (continued)
At June 30, 2016, the Fund’s OTC derivative liabilities, which may be offset against the Fund’s OTC derivative assets and collateral pledged to the counterparty, are as follows:
| Amounts Not Offset in the Statement of Assets and Liabilities | ||||||||||||||||||||
Gross and Net Assets and Liabilities | Financial Instruments Available for Offset | Financial Instruments Collateral Pledged | Cash Collateral Pledgeda | Net Amount (Not less than zero) | ||||||||||||||||
| Counterparty | ||||||||||||||||||||
BOFA | $ | 2,741,763 | $ | (2,741,763 | ) | $ | — | $ | — | $ | — | |||||||||
BZWS | 14,983,119 | (1,099,515 | ) | — | (13,840,000 | ) | 43,604 | |||||||||||||
CITI | 19,441,972 | (1,534,647 | ) | — | (17,907,325 | ) | — | |||||||||||||
DBAB | 25,578,613 | (4,186,118 | ) | — | (21,392,495 | ) | — | |||||||||||||
GSCO | 4,536,693 | (2,715,610 | ) | — | — | 1,821,083 | ||||||||||||||
HSBC | 23,228,359 | (7,418,291 | ) | — | (13,830,000 | ) | 1,980,068 | |||||||||||||
JPHQ | 39,594,579 | (3,684,761 | ) | — | (35,909,818 | ) | — | |||||||||||||
MSCO | 1,194,740 | (1,194,740 | ) | — | — | — | ||||||||||||||
SCNY | 4,360,617 | (1,080,624 | ) | — | (3,279,993 | ) | — | |||||||||||||
UBSW | — | — | — | — | — | |||||||||||||||
|
| |||||||||||||||||||
Total | $ | 135,660,455 | $ | (25,656,069 | ) | $ | — | $ | (106,159,631 | ) | $ | 3,844,755 | ||||||||
|
| |||||||||||||||||||
aIn some instances, the collateral amounts disclosed in the table above were adjusted due to the requirement to limit collateral amounts to avoid the effect of overcollateralization. Actual collateral received and/or pledged may be more than the amounts disclosed herein.
For the period ended June, 30 2016, the average month end fair value of derivatives represented 5.6% of average month end net assets. The average month end number of open derivative contracts for the period was 402.
See Note 1(d) regarding derivative financial instruments.
See Abbreviations on page TGB-37
10. Credit Facility
The Fund, together with other U.S. registered and foreign investment funds (collectively, Borrowers), managed by Franklin Templeton Investments, are borrowers in a joint syndicated senior unsecured credit facility totaling $2 billion (Global Credit Facility) which matures on February 10, 2017. This Global Credit Facility provides a source of funds to the Borrowers for temporary and emergency purposes, including the ability to meet future unanticipated or unusually large redemption requests.
Under the terms of the Global Credit Facility, the Fund shall, in addition to interest charged on any borrowings made by the Fund and other costs incurred by the Fund, pay its share of fees and expenses incurred in connection with the implementation and maintenance of the Global Credit Facility, based upon its relative share of the aggregate net assets of all of the Borrowers, including an annual commitment fee of 0.07% based upon the unused portion of the Global Credit Facility. Effective February 12, 2016, the annual commitment fee is 0.15%. These fees are reflected in other expenses in the Statement of Operations. During the period ended June 30, 2016, the Fund did not use the Global Credit Facility.
| Semiannual Report | TGB-35 |
FRANKLIN TEMPLETON VARIABLE INSURANCE PRODUCTS TRUST
NOTES TO FINANCIAL STATEMENTS (UNAUDITED)
Templeton Global Bond VIP Fund (continued)
11. Fair Value Measurements
The Fund follows a fair value hierarchy that distinguishes between market data obtained from independent sources (observable inputs) and the Fund’s own market assumptions (unobservable inputs). These inputs are used in determining the value of the Fund’s financial instruments and are summarized in the following fair value hierarchy:
| • | Level 1 – quoted prices in active markets for identical financial instruments |
| • | Level 2 – other significant observable inputs (including quoted prices for similar financial instruments, interest rates, prepayment speed, credit risk, etc.) |
| • | Level 3 – significant unobservable inputs (including the Fund’s own assumptions in determining the fair value of financial instruments) |
The input levels are not necessarily an indication of the risk or liquidity associated with financial instruments at that level.
For movements between the levels within the fair value hierarchy, the Fund has adopted a policy of recognizing the transfers as of the date of the underlying event which caused the movement.
A summary of inputs used as of June 30, 2016, in valuing the Fund’s assets and liabilities carried at fair value, is as follows:
| Level 1 | Level 2 | Level 3 | Total | |||||||||||||
| Assets: | ||||||||||||||||
Investments in Securities: | ||||||||||||||||
Foreign Government and Agency Securitiesa | $ | — | $ | 2,355,886,298 | $ | — | $ | 2,355,886,298 | ||||||||
Quasi-Sovereign and Corporate Bondsa | — | 2,631,087 | — | 2,631,087 | ||||||||||||
Short Term Investments | 409,277,955 | 354,745,400 | — | 764,023,355 | ||||||||||||
|
| |||||||||||||||
Total Investments in Securities | $ | 409,277,955 | $ | 2,713,262,785 | $ | — | $ | 3,122,540,740 | ||||||||
|
| |||||||||||||||
Other Financial Instruments | ||||||||||||||||
Forward Exchange Contracts | $ | — | $ | 26,393,217 | $ | — | $ | 26,393,217 | ||||||||
|
| |||||||||||||||
| Liabilities: | ||||||||||||||||
Other Financial Instruments | ||||||||||||||||
Forward Exchange Contracts | $ | — | $ | 121,021,815 | $ | — | $ | 121,021,815 | ||||||||
Swap Contracts | — | 57,990,611 | — | 57,990,611 | ||||||||||||
|
| |||||||||||||||
Total Other Financial Instruments | $ | — | $ | 179,012,426 | $ | — | $ | 179,012,426 | ||||||||
|
| |||||||||||||||
aFor detailed categories, see the accompanying Statement of Investments.
12. Subsequent Events
The Fund has evaluated subsequent events through the issuance of the financial statements and determined that no events have occurred that require disclosure.
| TGB-36 | Semiannual Report |
FRANKLIN TEMPLETON VARIABLE INSURANCE PRODUCTS TRUST
NOTES TO FINANCIAL STATEMENTS (UNAUDITED)
Templeton Global Bond VIP Fund (continued)
Abbreviations
| Counterparty/Exchange | Currency | Selected Portfolio | ||||||||
| BOFA | Bank of America Corp. | BRL | Brazilian Real | BBA | British Bankers Association | |||||
| BZWS | Barclays Bank PLC | COP | Colombian Peso | FRN | Floating Rate Note | |||||
| CITI | Citigroup, Inc. | EUR | Euro | GDP | Gross Domestic Product | |||||
| CME | Chicago Mercantile Exchange | IDR | Indonesian Rupiah | LIBOR | London InterBank Offered Rate | |||||
| DBAB | Deutsche Bank AG | INR | Indian Rupee | VRI | Value Recovery Instrument | |||||
| GSCO | Goldman Sachs Group, Inc. | JPY | Japanese Yen | |||||||
| HSBC | HSBC Bank USA N.A. | KRW | South Korean Won | |||||||
| JPHQ | JP Morgan Chase & Co. | LKR | Sri Lankan Rupee | |||||||
| LCH | London Clearing House | MXN | Mexican Peso | |||||||
| MSCO | Morgan Stanley | MYR | Malaysian Ringgit | |||||||
| SCNY | Standard Chartered Bank | PEN | Peruvian Nuevo Sol | |||||||
| UBSW | UBS AG | PHP | Philippine Peso | |||||||
| PLN | Polish Zloty | |||||||||
| Semiannual Report | TGB-37 |
Templeton Growth VIP Fund
This semiannual report for Templeton Growth VIP Fund covers the period ended June 30, 2016.
Class 4 Performance Summary as of June 30, 2016
The Fund’s Class 4 shares had a -3.36% total return* for the six-month period ended June 30, 2016.
*The Fund has a fee waiver associated with any investment in a Franklin Templeton money fund and/or Franklin Templeton fund, as applicable, contractually guaranteed through at least the Fund’s current fiscal year-end. Fund investment results reflect the fee waiver, to the extent applicable; without this reduction, the results would have been lower.
Performance reflects the Fund’s Class 4 operating expenses, but does not include any contract fees, expenses or sales charges. If they had been included, performance would be lower. These charges and deductions, particularly for variable life policies, can have a significant effect on contract values and insurance benefits. See the contract prospectus for a complete description of these expenses, including sales charges.
Performance data represent past performance, which does not guarantee future results. Investment return and principal value will fluctuate, and you may have a gain or loss when you sell your shares. Current performance may differ from figures shown.
| Semiannual Report | TG-1 |
TEMPLETON GROWTH VIP FUND
Fund Goal and Main Investments
The Fund seeks long-term capital growth. Under normal market conditions, the Fund invests predominantly in equity securities of companies located anywhere in the world, including emerging markets.
Fund Risks
All investments involve risks, including possible loss of principal. Special risks are associated with foreign investing, including currency fluctuations, economic instability and political developments; investments in emerging markets involve heightened risks related to the same factors. In addition, smaller and midsized-company stocks have historically experienced more price volatility than larger company stocks, especially over the short term. Value securities may not increase in price as anticipated or may decline further in value. To the extent the Fund focuses on particular countries, regions, industries, sectors or types of investments from time to time, it may be subject to greater risks of adverse developments in such areas of focus than a fund that invests in a wider variety of countries, regions, industries, sectors or investments. The Fund is actively managed but there is no guarantee that the manager’s investment decisions will produce the desired results. The Fund’s prospectus also includes a description of the main investment risks.
Performance Overview
You can find the Fund’s six-month total return in the Performance Summary. For comparison, the Fund’s new benchmark, the MSCI All Country World Index (ACWI) returned +1.58%, while its old benchmark, the MSCI World Index returned +1.02% for the period under review.1 We believe the new index better represents the Fund’s investable universe and is more in line with the Fund’s mandates.
Economic and Market Overview
The global economy expanded during the six months under review. An improvement in commodity prices including a rally in crude oil prices, accommodative monetary policy from various global central banks, finalization of the new debt deal for Greece and encouraging Chinese trade data toward period-end boosted market sentiment. However, global equity market volatility increased after the U.S. Federal Reserve’s (Fed’s) June decision to keep its federal funds target range unchanged, while providing a cautious stance on further interest rate hikes. In
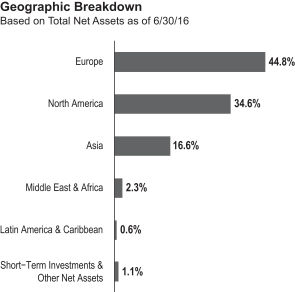
addition, global economic concerns and the U.K.’s historic referendum to leave the European Union (EU), also known as the “Brexit,” contributed to volatile global stock markets.
Oil prices fell at the beginning of the review period, largely due to strong global supply, but recovered in the period’s second half amid oilfield outages and continued demand growth. Meanwhile, commodity prices increased for most of the review period as oversupply for a host of commodities shrank and the market appeared to be on the path of rebalancing after hitting a glut-induced bottom earlier in the year. Gold prices continued to rise following the Brexit referendum as some investors turned to safe haven investing. The U.S. dollar generally depreciated against most currencies during the period, which increased returns of many foreign assets in U.S. dollar terms. In this environment, global developed market stocks overall, as measured by the MSCI World Index, rose slightly during the period.
The U.S. economy grew moderately, as measured by gross domestic product (GDP) in 2016’s first and second quarters, driven by consumer spending and exports. A decline in private inventory investment and nonresidential fixed investment contributed to the moderation. The Fed maintained its target interest rate during the review period after raising it for the first time in nine years at its December meeting. The Fed kept its target rate unchanged in its June meeting mainly due to a substantial slowdown in job additions toward period-end. The Fed expects economic conditions to evolve in a manner that could warrant only gradual increases in the federal funds rate.
1. Source: Morningstar. One cannot invest directly in an index, and an index is not representative of the Fund’s portfolio. Please see Index Descriptions following the Fund Summaries.
| TG-2 | Semiannual Report |
TEMPLETON GROWTH VIP FUND
In Europe, slower U.K. economic growth continued in 2016’s first quarter as output slowed in construction, production and agriculture. Immediate effects of the Brexit materialized as U.K. stocks significantly declined and the pound sterling hit a three-decade low amid intensified selling. Credit rating agencies Standard & Poor’s and Fitch also downgraded the U.K.’s credit rating. In the eurozone, despite investors’ concerns about banking sector weakness, low corporate earnings and post-Brexit political repercussions, some regions benefited due to rising consumer spending resulting from a cheaper euro, low inflation and signs of sustained economic growth. The eurozone’s annual inflation rate remained in negative territory for most of the review period; however, it rose marginally above zero in June.
Japan’s economy posted mixed results, contracting in 2015’s fourth quarter stemming from declining private and household consumption. However, the economy expanded during 2016’s first quarter as private consumption increased and business investment decreased less than initially believed. The Bank of Japan (BOJ) took several actions during the review period. In January, to boost lending and support inflation, the BOJ introduced a negative interest rate on excess reserves held at the central bank by financial institutions. In April, the BOJ further reduced its GDP and inflation forecasts for fiscal year 2016, and decided against additional quantitative easing measures. However, after the U.K.’s vote in June to leave the EU, the BOJ hinted at carrying out flexible open market operations to stabilize its financial markets.
In emerging markets, economic growth generally moderated during the review period. Brazil’s economy witnessed its longest recession since the 1930s amid political and economic turmoil, while Russia’s economy continued to contract. The Bank of Russia reduced its key interest rate in an attempt to revive its economy. China’s economic growth slowed marginally in 2016’s first quarter compared to the previous quarter, but remained largely in line with the government’s target. The People’s Bank of China cut its cash reserve requirement ratio for the country’s banks and effectively devalued the renminbi against the U.S. dollar to the lowest level in more than five years. Overall, emerging market stocks, as measured by the MSCI Emerging Markets Index, rose for the six-month period.2
Investment Strategy
Our investment philosophy is bottom up, value oriented and long term. In choosing investments, we will focus on the market price of a company’s securities relative to our evaluation of the
Top 10 Holdings | ||||
| 6/30/16 | ||||
| Company Sector/Industry | % of Total Net Assets | |||
| Samsung Electronics Co. Ltd. Technology Hardware, Storage & Peripherals, South Korea | 4.3% | |||
| Royal Dutch Shell PLC Oil, Gas & Consumable Fuels, U.K. | 2.8% | |||
| Citigroup Inc. Banks, U.S. | 2.4% | |||
| Teva Pharmaceutical Industries Ltd. Pharmaceuticals, Israel | 2.3% | |||
Microsoft Corp. Software, U.S. | 2.3% | |||
| Amgen Inc. Biotechnology, U.S. | 2.2% | |||
| Total SA Oil, Gas & Consumable Fuels, France | 2.0% | |||
| Oracle Corp. Software, U.S. | 1.9% | |||
| BP PLC Oil, Gas & Consumable Fuels, U.K. | 1.7% | |||
| Cisco Systems Inc. Communications Equipment, U.S. | 1.7% | |||
The dollar value, number of shares or principal amount, and names of all portfolio holdings are listed in the Fund’s Statement of Investments (SOI).
company’s potential long-term earnings, asset value and cash flow. Among factors we may consider are a company’s historical value measures, including price/earnings ratio, profit margins and liquidation value. We do in-depth research to construct a bargain list from which we buy.
Manager’s Discussion
Global equities finished the period slightly higher during the period under review, recouping losses early in the period and weathering late volatility related to the U.K.’s Brexit referendum. Investors also evaluated modest economic improvements and sustained policy resolve against continued global deflationary pressures, Chinese financial volatility and mounting uncertainty about the future of Europe. The Fund trailed its benchmark, the MSCI ACWI, during the period as the increasingly uncertain, low-conviction environment continued to primarily favor expensive momentum stocks, pressuring the Fund’s value-oriented holdings.
At the sector level, stock selection and an overweighted allocation in the financials sector was among the Fund’s largest
2. Please see Index Descriptions following the Fund Summaries.
| Semiannual Report | TG-3 |
TEMPLETON GROWTH VIP FUND
relative detractors, pressured by European banks that faltered in the wake of the U.K.’s Brexit vote.3 Moreover, the European financials sector accounted for most of the Fund’s biggest detractors. We maintained exposure to select European banks in recent quarters based on their historically cheap valuations and our view that they are showing solid restructuring and recapitalization progress in a stabilizing regulatory environment. We were also encouraged by European banks’ ability to adjust business models to increase fee-based income and manage the margin challenges associated with a low-to-negative interest rate environment. We believe European banks today are far better capitalized and supported by policymakers than they were in the crises of 2008 and 2011, and have passed stress tests that subject their balance sheets to highly adverse conditions. The major tail risk for the sector is a potential eurozone breakup; while we believe this remains a low probability event, we will continue to monitor and assess the situation as it would likely require a broad portfolio repositioning before the risk is fully priced.
In health care, stock selection and a slightly overweighted allocation also detracted from the Fund’s relative returns.4 Additionally, the sector held one of the Fund’s largest detractors, U.S. biotechnology firm Allergan. Pfizer cancelled its planned acquisition of Allergan after the U.S. government issued new rules related to mergers that could result in the reduction of a company’s tax rate. Nonetheless, we believe these events will eventually support the stock given Allergan’s double-digit organic growth potential and robust free cash flow yield. The company is also in the process of selling its generics business to Israeli pharmaceuticals firm Teva Pharmaceutical Industries (also a detractor from the Fund’s returns), which should increase cash flow and provide flexibility to support earnings growth over and above the currently healthy sales growth expectations.
In 2015, the Fund reduced holdings in health care to realize profits throughout the year. However, opportunities began to resurface in 2016 as the market reacted to fears of political interference with drug pricing and corporate tax strategy. We believe such fears are generally overstated, but nonetheless have attempted to address these concerns within the Fund by focusing our investments on what we consider well-run, highly innovative companies capable of dealing with pricing and
competitive pressures on a case-by-case basis. Within health care, we continue to favor firms we believe have sound business models, solid product portfolios, attractive research and development pipelines, and the ability to grow revenues, increase cash flows and generate high capital returns for shareholders through dividends and buybacks. We see little direct threat to our pharmaceuticals holdings from Brexit and will continue using volatility to selectively increase exposure where warranted.
The Fund’s stock selection and an underweighted allocation in industrials also detracted, pressured by German airline Deutsche Lufthansa.5 Shares of Deutsche Lufthansa declined after management highlighted the need to reduce fares and curb capacity to remain competitive with discount airlines. Management has continued to aggressively restructure to preserve profitability in this environment, though cost-cutting efforts have met stiff resistance from labor unions. Encouragingly, the company reported some recent progress in labor negotiations—though a breakthrough has remained elusive—and management bolstered its credibility with investors through a sensible strategic vision and restructuring initiatives. Although, in our analysis, the stock remained cheap, we recognized that this is a cyclical industry that will need to closely manage supply after a period of strong demand. Further, even though longer term cyclical risks were beginning to increase, a number of shorter term catalysts existed, including progress with labor negotiations and restructuring initiatives, and we will continue to monitor Lufthansa closely should future strength create opportunities.
Stock selection and an underweighting in the defensive consumer staples sector also detracted from the Fund’s relative returns during a period of rising risk aversion.6 Investors seeking safety and quality in an uncertain environment crowded into consumer staples, bidding up valuations to near-record levels relative to more cyclical parts of the market. We found scarce long-term value in a competitive, commoditized, low-margin industry trading at what we considered historically high valuations.
Turning to the Fund’s relative contributors, stock selection and an overweighting in the energy sector aided returns.7 Most of the Fund’s biggest contributors during the period were in the sector, led by U.S. oilfield services firm Halliburton, U.K. oil
3. The financials sector comprises banks, capital markets, consumer finance and insurance in the SOI.
4. The health care sector comprises biotechnology, health care equipment and supplies, life sciences tools and services, and pharmaceuticals in the SOI.
5. The industrials sector comprises aerospace and defense, air freight and logistics, airlines, commercial services and supplies, construction and engineering, industrial conglomerates and machinery in the SOI.
6. The consumer staples sector comprises food and staples retailing in the SOI.
7. The energy sector comprises energy equipment and services and oil, gas and consumable fuels in the SOI.
| TG-4 | Semiannual Report |
TEMPLETON GROWTH VIP FUND
and gas producer Royal Dutch Shell and U.S. oil and gas exploration and production firm Apache. We believe the energy sector exemplifies how the Fund has been able to successfully adapt to changing circumstances to position the portfolio for positive long-term performance. In 2014, the Fund’s energy holdings were slightly overweighted as Saudi Arabia declined to cut output in a bid to protect market share, eventually pushing oil prices significantly lower. Although our long-term oil price assumptions were already below the market’s, we used these events to reassess our forecasts and reduced our price target even further, ensuring that companies in the Fund are those we believe have the financial capacity to sustain a period of low energy prices over a longer term.
Over the past year we continued to see value in select energy stocks, and we added to our exposure during the lows of the first quarter of 2016. At period-end, the Fund was significantly overweighted in energy. This is a sector that we believed would be generally insulated—even during events similar to Brexit. We continued to believe a modest downturn in global gross domestic product and a somewhat softer demand from the U.K. or the eurozone are unlikely to materially impact oil prices. At the stock level, earnings recovered from trough levels as companies slashed capital expenditures and focused on harvesting growth from the previous investment cycle.
Stock selection and an underweighted allocation in the information technology sector also supported the Fund’s relative returns, led by South Korean semiconductor and consumer electronics manufacturer Samsung Electronics.8 Shares of the company increased as analysts upgraded earnings forecasts following strong sales of the Galaxy S7 smartphone, better-than-expected semiconductor pricing, growing memory storage demand and an indication by Apple that it may use Samsung as its primary vendor for new iPhone displays. The stock also benefited from an intergenerational leadership transition that supports deployment of the company’s cash holdings. Management recently announced a share repurchase and treasury stock cancellation plan and targeted an increase in capital investment in 2016. Although we believe Samsung, given its maturity, is unlikely to generate the rate of growth it has achieved in the past, with its improving cash flow dynamics, more generous shareholder returns, industry leading technology, market share, profitability and research and development capabilities, we believe Samsung remains an attractive investment over the Fund’s long-term horizon. More generally, every major
tier in the technology sector—computer, storage, networking, database, apps—is being disrupted by a new set of technologies and our approach is to identify mature tech companies that we believe offer value in their ability to adapt to change as well as new tech entrants we expect to emerge as winners.
Other key contributors to Fund performance included stock selection and underweighted allocations in the consumer discretionary and materials sectors.9 In consumer discretionary, U.S. cable operator Comcast surged to a record high after reporting the biggest gain in video subscribers in nearly a decade, demonstrating remarkable resilience in the face of cord-cutting trends. U.S. clothing retailer Michael Kors Holdings, also a contribitor in the consumer discretionary sector, reported strong sales growth during an otherwise lackluster holiday retail period and achieved significant progress with an accessories revamp and strengthened e-commerce platform. Within the materials sector, Swiss miner and commodities trader Glencore was among the Fund’s top contributors, surging after overhauling its balance sheet and delivering on profit targets in its resilient marketing business. The stock doubled year-to-date during the period, and was no longer an outright bargain in our analyis, although we expect shares could trade higher over our investment horizon as underlying commodity fundamentals improve and investors begin to recognize the value in Glencore’s diverse array of businesses.
From a regional standpoint, stock selection and an overweighting in Europe and stock selection and an underweighting in the U.S. detracted from relative performance. Nonetheless, we continued to find investment opportunities we feel are attractive in Europe, where multinational corporations with diverse revenue streams and strong operating leverage traded at what we considered depressed valuations. Conversely, in Asia, stock selection and an underweighted allocation in Japan and stock selection and an overweighted allocation in South Korea contributed to the Fund’s relative returns.
Despite the Brexit setback and accompanying uncertainty, we remained both disciplined in our analysis and thoughtful in our response to changing circumstances. The opportunities for long-term investors today in equity markets are both highly compelling and largely specific to value. Few times in history has the gap between the market’s cheapest and most expensive stocks been so wide. We remain focused on identifying undervalued
8. The information technology sector comprises communications equipment; Internet software and services; software; and technology hardware, storage and peripherals in the SOI.
9. The consumer discretionary sector comprises auto components; automobiles; media; specialty retail; and textiles, apparel and luxury goods in the SOI. The materials sector comprises chemicals, construction materials, and metals and mining in the SOI.
| Semiannual Report | TG-5 |
TEMPLETON GROWTH VIP FUND
securities capable of generating superior investment returns over a long-term horizon.
Thank you for your participation in Templeton Growth VIP Fund. We look forward to serving your future investment needs.
The foregoing information reflects our analysis, opinions and portfolio holdings as of June 30, 2016, the end of the reporting period. The way we implement our main investment strategies and the resulting portfolio holdings may change depending on factors such as market and economic conditions. These opinions may not be relied upon as investment advice or an offer for a particular security. The information is not a complete analysis of every aspect of any market, country, industry, security or the Fund. Statements of fact are from sources considered reliable, but the investment manager makes no representation or warranty as to their completeness or accuracy. Although historical performance is no guarantee of future results, these insights may help you understand our investment management philosophy.
| TG-6 | Semiannual Report |
TEMPLETON GROWTH VIP FUND
Class 4 Fund Expenses
As an investor in a variable insurance contract (Contract) that indirectly provides for investment in an underlying mutual fund, you can incur transaction and/or ongoing expenses at both the Fund level and the Contract level.
| • | Transaction expenses can include sales charges (loads) on purchases, surrender fees, transfer fees and premium taxes. |
| • | Ongoing expenses can include management fees, distribution and service (12b-1) fees, contract fees, annual maintenance fees, mortality and expense risk fees and other fees and expenses. All mutual funds and Contracts have some types of ongoing expenses. |
The expenses shown in the table are meant to highlight ongoing expenses at the Fund level only and do not include ongoing expenses at the Contract level, or transaction expenses at either the Fund or Contract levels. While the Fund does not have transaction expenses, if the transaction and ongoing expenses at the Contract level were included, the expenses shown below would be higher. You should consult your Contract prospectus or disclosure document for more information.
The table shows Fund-level ongoing expenses and can help you understand these expenses and compare them with those of other mutual funds offered through the Contract. The table assumes a $1,000 investment held for the six months indicated. Please refer to the Fund prospectus for additional information on operating expenses.
Actual Fund Expenses
The first line (Actual) of the table provides actual account values and expenses. The “Ending Account Value” is derived from the Fund’s actual return, which includes the effect of ongoing Fund expenses, but does not include the effect of ongoing Contract expenses.
You can estimate the Fund-level expenses you incurred during the period by following these steps. Of course, your account value and expenses will differ from those in this illustration:
| 1. | Divide your account value by $1,000. |
If an account had an $8,600 value,
then $8,600 ÷ $1,000 = 8.6.
| 2. | Multiply the result by the number under the heading “Fund-Level Expenses Incurred During Period.” |
If Fund-Level Expenses Incurred During Period were $7.50, then 8.6 × $7.50 = $64.50.
In this illustration, the estimated expenses incurred this period at the Fund level are $64.50.
Hypothetical Example for Comparison with Other Mutual Funds
Information in the second line (Hypothetical) of the table can help you compare ongoing expenses of the Fund with those of other mutual funds offered through the Contract. This information may not be used to estimate the actual ending account balance or expenses you incurred during the period. The hypothetical “Ending Account Value” is based on the Fund’s actual expense ratio and an assumed 5% annual rate of return before expenses, which does not represent the Fund’s actual return. The figure under the heading “Fund-Level Expenses Incurred During Period” shows the hypothetical expenses your account would have incurred under this scenario. You can compare this figure with the 5% hypothetical examples that appear in shareholder reports of other funds offered through a Contract.
| Class 4 | Beginning Account Value 1/1/16 | Ending Account Value 6/30/16 | Fund-Level Expenses Incurred During Period* 1/1/16–6/30/16 | |||||||||
Actual | $ | 1,000 | $ | 966.40 | $ | 5.72 | ||||||
Hypothetical (5% return before expenses) | $ | 1,000 | $ | 1,019.05 | $ | 5.87 | ||||||
*Expenses are calculated using the most recent six-month annualized expense ratio, net of expense waivers, for the Fund’s Class 4 shares (1.17%), which does not include any ongoing expenses of the Contract for which the Fund is an investment option, multiplied by the average account value over the period, multiplied by 182/366 to reflect the one-half year period.
| Semiannual Report | TG-7 |
SUPPLEMENT DATED JUNE 27, 2016
TO THE PROSPECTUSES DATED MAY 1, 2016
OF
TEMPLETON FOREIGN VIP FUND
TEMPLETON GROWTH VIP FUND
(Series of Franklin Templeton Variable Insurance Products Trust)
Effective June 30, 2016, the prospectus is amended as follows:
I. The benchmark for the Templeton Foreign VIP Fund has changed from the MSCI EAFE Index to the MSCI ACWI EX USA Index. The “Fund Summary – Performance – Average Annual Total Returns” table on page TF-S4 is revised to add the following:
| 1 Year | 5 Years | 10 Years | ||||||||||
| MSCI All Country World ex-US Index (index reflects no deduction for fees, expenses or taxes)1 | -5.25% | 1.51% | 3.38% | |||||||||
| 1. | Performance figures as of December 31, 2015. The MSCI All Country World ex-US Index is replacing the MSCI EAFE Index as the Fund’s benchmark. The investment manager believes the composition of the MSCI All Country World ex-US Index more accurately reflects the Fund’s holdings. |
II. The benchmark for the Templeton Growth VIP Fund has changed from the MSCI World Index to the MSCI ACWI Index. The “Fund Summary – Performance – Average Annual Total Returns” table on page TG-S3 is revised to add the following:
| 1 Year | 5 Years | 10 Years | ||||||||||
| MSCI All Country World Index (index reflects no deduction for fees, expenses or taxes)1 | -1.84% | 6.66% | 5.31% | |||||||||
| 1. | Performance figures as of December 31, 2015. The MSCI All Country World Index is replacing the MSCI World Index as the Fund’s benchmark. The investment manager believes the composition of the MSCI All Country World Index more accurately reflects the Fund’s holdings. |
Please keep this supplement with your prospectus for future reference.
| TG-8 |
FRANKLIN TEMPLETON VARIABLE INSURANCE PRODUCTS TRUST
Financial Highlights
Templeton Growth VIP Fund
Six Months Ended (unaudited) | Year Ended December 31, | |||||||||||||||||||||||
| 2015 | 2014 | 2013 | 2012 | 2011 | ||||||||||||||||||||
| Class 1 | ||||||||||||||||||||||||
| Per share operating performance (for a share outstanding throughout the period) | ||||||||||||||||||||||||
Net asset value, beginning of period | $13.54 | $14.85 | $15.47 | $12.16 | $10.27 | $11.19 | ||||||||||||||||||
|
| |||||||||||||||||||||||
| Income from investment operationsa: | ||||||||||||||||||||||||
Net investment incomeb | 0.18 | 0.28 | 0.38 | c | 0.22 | 0.27 | 0.25 | |||||||||||||||||
Net realized and unrealized gains (losses) | (0.61 | ) | (1.17 | ) | (0.75 | ) | 3.49 | 1.88 | (0.99 | ) | ||||||||||||||
|
| |||||||||||||||||||||||
Total from investment operations | (0.43 | ) | (0.89 | ) | (0.37 | ) | 3.71 | 2.15 | (0.74 | ) | ||||||||||||||
|
| |||||||||||||||||||||||
| Less distributions from: | ||||||||||||||||||||||||
Net investment income | (0.31 | ) | (0.42 | ) | (0.25 | ) | (0.40 | ) | (0.26 | ) | (0.18 | ) | ||||||||||||
Net realized gains | (0.52 | ) | — | — | — | — | — | |||||||||||||||||
|
| |||||||||||||||||||||||
Total distributions | (0.83 | ) | (0.42 | ) | (0.25 | ) | (0.40 | ) | (0.26 | ) | (0.18 | ) | ||||||||||||
|
| |||||||||||||||||||||||
Net asset value, end of period | $12.28 | $13.54 | $14.85 | $15.47 | $12.16 | $10.27 | ||||||||||||||||||
|
| |||||||||||||||||||||||
Total returnd | (3.12)% | (6.24)% | (2.53)% | 31.05% | 21.40% | (6.80)% | ||||||||||||||||||
| Ratios to average net assetse | ||||||||||||||||||||||||
Expenses | 0.82% | f | 0.80% | f | 0.78% | 0.78% | g | 0.78% | g | 0.78% | g | |||||||||||||
Net investment income | 2.78% | 1.96% | 2.46% | c | 1.62% | 2.31% | 2.22% | |||||||||||||||||
| Supplemental data | ||||||||||||||||||||||||
Net assets, end of period (000’s) | $431,610 | $468,548 | $572,860 | $588,409 | $476,954 | $1,200,682 | ||||||||||||||||||
Portfolio turnover rate | 11.45% | 20.92% | 17.46% | 11.60% | 18.73% | h | 42.13% | h | ||||||||||||||||
aThe amount shown for a share outstanding throughout the period may not correlate with the Statement of Operations for the period due to the timing of sales and repurchases of the Fund’s shares in relation to income earned and/or fluctuating fair value of the investments of the Fund.
bBased on average daily shares outstanding.
cNet investment income per share includes approximately $0.09 per share related to income received in the form of special dividends in connection with certain Fund holdings. Excluding this amount, the ratio of net investment income to average net assets would have been 1.88%.
dTotal return does not include fees, charges or expenses imposed by the variable annuity and life insurance contracts for which Franklin Templeton Variable Insurance Products Trust serves as an underlying investment vehicle. Total return is not annualized for periods less than one year.
eRatios are annualized for periods less than one year.
fBenefit of waiver and payments by affiliates rounds to less than 0.01%.
gBenefit of expense reduction rounds to less than 0.01%.
hExcludes the value of portfolio securities delivered as a result of redemption in-kind.
| The accompanying notes are an integral part of these financial statements. | Semiannual Report | TG-9 |
FRANKLIN TEMPLETON VARIABLE INSURANCE PRODUCTS TRUST
FINANCIAL HIGHLIGHTS
Templeton Growth VIP Fund (continued)
Six Months Ended (unaudited) | Year Ended December 31, | |||||||||||||||||||||||
| 2015 | 2014 | 2013 | 2012 | 2011 | ||||||||||||||||||||
| Class 2 | ||||||||||||||||||||||||
| Per share operating performance (for a share outstanding throughout the period) | ||||||||||||||||||||||||
Net asset value, beginning of period | $13.32 | $14.61 | $15.23 | $11.97 | $10.11 | $11.01 | ||||||||||||||||||
|
| |||||||||||||||||||||||
| Income from investment operationsa: | ||||||||||||||||||||||||
Net investment incomeb | 0.16 | 0.25 | 0.34 | c | 0.19 | 0.21 | 0.21 | |||||||||||||||||
Net realized and unrealized gains (losses) | (0.60 | ) | (1.16 | ) | (0.75 | ) | 3.44 | 1.88 | (0.96 | ) | ||||||||||||||
|
| |||||||||||||||||||||||
Total from investment operations | (0.44 | ) | (0.91 | ) | (0.41 | ) | 3.63 | 2.09 | (0.75 | ) | ||||||||||||||
|
| |||||||||||||||||||||||
| Less distributions from: | ||||||||||||||||||||||||
Net investment income | (0.27 | ) | (0.38 | ) | (0.21 | ) | (0.37 | ) | (0.23 | ) | (0.15 | ) | ||||||||||||
Net realized gains | (0.52 | ) | — | — | — | — | — | |||||||||||||||||
|
| |||||||||||||||||||||||
Total distributions | (0.79 | ) | (0.38 | ) | (0.21 | ) | (0.37 | ) | (0.23 | ) | (0.15 | ) | ||||||||||||
|
| |||||||||||||||||||||||
Net asset value, end of period | $12.09 | $13.32 | $14.61 | $15.23 | $11.97 | $10.11 | ||||||||||||||||||
|
| |||||||||||||||||||||||
Total returnd | (3.26)% | (6.49)% | (2.81)% | 30.82% | 21.07% | (6.97)% | ||||||||||||||||||
| Ratios to average net assetse | ||||||||||||||||||||||||
Expenses | 1.07% | f | 1.05% | f | 1.03% | 1.03% | g | 1.03% | g | 1.03% | g | |||||||||||||
Net investment income | 2.53% | 1.71% | 2.21% | c | 1.37% | 2.06% | 1.97% | |||||||||||||||||
| Supplemental data | ||||||||||||||||||||||||
Net assets, end of period (000’s) | $833,994 | $921,895 | $1,171,896 | $1,450,304 | $1,352,554 | $1,254,193 | ||||||||||||||||||
Portfolio turnover rate | 11.45% | 20.92% | 17.46% | 11.60% | 18.73% | h | 42.13% | h | ||||||||||||||||
aThe amount shown for a share outstanding throughout the period may not correlate with the Statement of Operations for the period due to the timing of sales and repurchases of the Fund’s shares in relation to income earned and/or fluctuating fair value of the investments of the Fund.
bBased on average daily shares outstanding.
cNet investment income per share includes approximately $0.09 per share related to income received in the form of special dividends in connection with certain Fund holdings. Excluding this amount, the ratio of net investment income to average net assets would have been 1.63%.
dTotal return does not include fees, charges or expenses imposed by the variable annuity and life insurance contracts for which Franklin Templeton Variable Insurance Products Trust serves as an underlying investment vehicle. Total return is not annualized for periods less than one year.
eRatios are annualized for periods less than one year.
fBenefit of waiver and payments by affiliates rounds to less than 0.01%.
gBenefit of expense reduction rounds to less than 0.01%.
hExcludes the value of portfolio securities delivered as a result of redemption in-kind.
| TG-10 | Semiannual Report | The accompanying notes are an integral part of these financial statements. |
FRANKLIN TEMPLETON VARIABLE INSURANCE PRODUCTS TRUST
FINANCIAL HIGHLIGHTS
Templeton Growth VIP Fund (continued)
Six Months Ended (unaudited) | Year Ended December 31, | |||||||||||||||||||||||
| 2015 | 2014 | 2013 | 2012 | 2011 | ||||||||||||||||||||
| Class 4 | ||||||||||||||||||||||||
| Per share operating performance (for a share outstanding throughout the period) | ||||||||||||||||||||||||
Net asset value, beginning of period | $13.44 | $14.73 | $15.35 | $12.07 | $10.19 | $11.11 | ||||||||||||||||||
|
| |||||||||||||||||||||||
| Income from investment operationsa: | ||||||||||||||||||||||||
Net investment incomeb | 0.15 | 0.23 | 0.33 | c | 0.17 | 0.20 | 0.20 | |||||||||||||||||
Net realized and unrealized gains (losses) | (0.61 | ) | (1.16 | ) | (0.76 | ) | 3.47 | 1.90 | (0.98 | ) | ||||||||||||||
|
| |||||||||||||||||||||||
Total from investment operations | (0.46 | ) | (0.93 | ) | (0.43 | ) | 3.64 | 2.10 | (0.78 | ) | ||||||||||||||
|
| |||||||||||||||||||||||
| Less distributions from: | ||||||||||||||||||||||||
Net investment income | (0.25 | ) | (0.36 | ) | (0.19 | ) | (0.36 | ) | (0.22 | ) | (0.14 | ) | ||||||||||||
Net realized gains | (0.52 | ) | — | — | — | — | — | |||||||||||||||||
|
| |||||||||||||||||||||||
Total distributions | (0.77 | ) | (0.36 | ) | (0.19 | ) | (0.36 | ) | (0.22 | ) | (0.14 | ) | ||||||||||||
|
| |||||||||||||||||||||||
Net asset value, end of period | $12.21 | $13.44 | $14.73 | $15.35 | $12.07 | $10.19 | ||||||||||||||||||
|
| |||||||||||||||||||||||
Total returnd | (3.36)% | (6.54)% | (2.88)% | 30.64% | 21.02% | (7.14)% | ||||||||||||||||||
| Ratios to average net assetse | ||||||||||||||||||||||||
Expenses | 1.17% | f | 1.15% | f | 1.13% | 1.13% | g | 1.13% | g | 1.13% | g | |||||||||||||
Net investment income | 2.43% | 1.61% | 2.11% | c | 1.27% | 1.96% | 1.87% | |||||||||||||||||
| Supplemental data | ||||||||||||||||||||||||
Net assets, end of period (000’s) | $44,232 | $47,777 | $59,989 | $72,683 | $67,158 | $56,170 | ||||||||||||||||||
Portfolio turnover rate | 11.45% | 20.92% | 17.46% | 11.60% | 18.73% | h | 42.13% | h | ||||||||||||||||
aThe amount shown for a share outstanding throughout the period may not correlate with the Statement of Operations for the period due to the timing of sales and repurchases of the Fund’s shares in relation to income earned and/or fluctuating fair value of the investments of the Fund.
bBased on average daily shares outstanding.
cNet investment income per share includes approximately $0.09 per share related to income received in the form of special dividends in connection with certain Fund holdings. Excluding this amount, the ratio of net investment income to average net assets would have been 1.53%.
dTotal return does not include fees, charges or expenses imposed by the variable annuity and life insurance contracts for which Franklin Templeton Variable Insurance Products Trust serves as an underlying investment vehicle. Total return is not annualized for periods less than one year.
eRatios are annualized for periods less than one year.
fBenefit of waiver and payments by affiliates rounds to less than 0.01%.
gBenefit of expense reduction rounds to less than 0.01%.
hExcludes the value of portfolio securities delivered as a result of redemption in-kind.
| The accompanying notes are an integral part of these financial statements. | Semiannual Report | TG-11 |
FRANKLIN TEMPLETON VARIABLE INSURANCE PRODUCTS TRUST
Statement of Investments, June 30, 2016 (unaudited)
Templeton Growth VIP Fund
| ||||||||||||||
| Country | Shares | Value | ||||||||||||
Common Stocks 98.3% | ||||||||||||||
Aerospace & Defense 1.2% | ||||||||||||||
BAE Systems PLC | United Kingdom | 2,319,032 | $ | 16,203,114 | ||||||||||
|
| |||||||||||||
Air Freight & Logistics 0.7% | ||||||||||||||
United Parcel Service Inc., B | United States | 89,100 | 9,597,852 | |||||||||||
|
| |||||||||||||
Airlines 1.6% | ||||||||||||||
Deutsche Lufthansa AG | Germany | 1,844,334 | 21,556,158 | |||||||||||
|
| |||||||||||||
Auto Components 1.2% | ||||||||||||||
Cie Generale des Etablissements Michelin, B | France | 166,359 | 15,734,041 | |||||||||||
|
| |||||||||||||
Automobiles 3.5% | ||||||||||||||
Hero Motocorp Ltd. | India | 220,820 | 10,396,765 | |||||||||||
Hyundai Motor Co. | South Korea | 178,330 | 20,961,982 | |||||||||||
Nissan Motor Co. Ltd. | Japan | 1,696,510 | 15,078,446 | |||||||||||
|
| |||||||||||||
| 46,437,193 | ||||||||||||||
|
| |||||||||||||
Banks 16.6% | ||||||||||||||
Bangkok Bank PCL, NVDR | Thailand | 913,600 | 4,123,166 | |||||||||||
Barclays PLC | United Kingdom | 5,731,140 | 10,591,676 | |||||||||||
BNP Paribas SA | France | 428,187 | 18,894,206 | |||||||||||
Citigroup Inc. | United States | 737,470 | 31,261,353 | |||||||||||
Credit Agricole SA | France | 1,783,136 | 14,962,690 | |||||||||||
DBS Group Holdings Ltd. | Singapore | 932,690 | 10,913,758 | |||||||||||
HSBC Holdings PLC | United Kingdom | 3,242,064 | 19,807,285 | |||||||||||
ING Groep NV, IDR | Netherlands | 1,475,166 | 15,029,332 | |||||||||||
JPMorgan Chase & Co. | United States | 335,530 | 20,849,834 | |||||||||||
KB Financial Group Inc. | South Korea | 657,984 | 18,608,080 | |||||||||||
Standard Chartered PLC | United Kingdom | 2,883,083 | 21,704,934 | |||||||||||
SunTrust Banks Inc. | United States | 478,520 | 19,657,602 | |||||||||||
UniCredit SpA | Italy | 4,892,781 | 10,698,562 | |||||||||||
|
| |||||||||||||
| 217,102,478 | ||||||||||||||
|
| |||||||||||||
Biotechnology 3.1% | ||||||||||||||
Amgen Inc. | United States | 184,830 | 28,121,884 | |||||||||||
Gilead Sciences Inc. | United States | 141,830 | 11,831,459 | |||||||||||
|
| |||||||||||||
| 39,953,343 | ||||||||||||||
|
| |||||||||||||
Capital Markets 2.5% | ||||||||||||||
Credit Suisse Group AG | Switzerland | 1,308,590 | 13,821,906 | |||||||||||
Morgan Stanley | United States | 528,920 | 13,741,342 | |||||||||||
UBS Group AG | Switzerland | 451,380 | 5,812,772 | |||||||||||
|
| |||||||||||||
| 33,376,020 | ||||||||||||||
|
| |||||||||||||
Chemicals 1.0% | ||||||||||||||
Akzo Nobel NV | Netherlands | 204,762 | 12,811,524 | |||||||||||
|
| |||||||||||||
Commercial Services & Supplies 0.6% | ||||||||||||||
| a | Serco Group PLC | United Kingdom | 4,886,178 | 7,257,966 | ||||||||||
|
| |||||||||||||
Communications Equipment 2.4% | ||||||||||||||
Cisco Systems Inc. | United States | 778,890 | 22,346,354 | |||||||||||
Ericsson, B | Sweden | 1,155,432 | 8,784,010 | |||||||||||
|
| |||||||||||||
| 31,130,364 | ||||||||||||||
|
| |||||||||||||
Construction & Engineering 0.6% | ||||||||||||||
| b | FLSmidth & Co. A/S | Denmark | 216,580 | 7,689,518 | ||||||||||
|
| |||||||||||||
| TG-12 | Semiannual Report |
FRANKLIN TEMPLETON VARIABLE INSURANCE PRODUCTS TRUST
STATEMENT OF INVESTMENTS (UNAUDITED)
Templeton Growth VIP Fund (continued)
| Country | Shares | Value | ||||||||||||
Common Stocks (continued) | ||||||||||||||
Construction Materials 1.2% | ||||||||||||||
CRH PLC | Ireland | 552,471 | $ | 15,943,595 | ||||||||||
|
| |||||||||||||
Consumer Finance 1.4% | ||||||||||||||
Capital One Financial Corp. | United States | 286,660 | 18,205,777 | |||||||||||
|
| |||||||||||||
Diversified Telecommunication Services 3.0% | ||||||||||||||
China Telecom Corp. Ltd., ADR | China | 179,195 | 8,061,983 | |||||||||||
Singapore Telecommunications Ltd. | Singapore | 4,679,470 | 14,349,193 | |||||||||||
Telefonica SA | Spain | 1,787,635 | 16,786,209 | |||||||||||
|
| |||||||||||||
| 39,197,385 | ||||||||||||||
|
| |||||||||||||
Energy Equipment & Services 2.4% | ||||||||||||||
Baker Hughes Inc. | United States | 301,680 | 13,614,818 | |||||||||||
Halliburton Co. | United States | 375,850 | 17,022,247 | |||||||||||
Technip SA | France | 16,050 | 869,624 | |||||||||||
|
| |||||||||||||
| 31,506,689 | ||||||||||||||
|
| |||||||||||||
Food & Staples Retailing 2.6% | ||||||||||||||
Metro AG | Germany | 587,740 | 17,920,384 | |||||||||||
| a | Tesco PLC | United Kingdom | 6,655,808 | 15,522,120 | ||||||||||
|
| |||||||||||||
| 33,442,504 | ||||||||||||||
|
| |||||||||||||
Health Care Equipment & Supplies 1.9% | ||||||||||||||
Getinge AB, B | Sweden | 925,050 | 18,888,392 | |||||||||||
Medtronic PLC | United States | 74,440 | 6,459,159 | |||||||||||
|
| |||||||||||||
| 25,347,551 | ||||||||||||||
|
| |||||||||||||
Industrial Conglomerates 2.3% | ||||||||||||||
Siemens AG | Germany | 164,562 | 16,769,609 | |||||||||||
| a | Toshiba Corp. | Japan | 4,835,860 | 12,942,452 | ||||||||||
|
| |||||||||||||
| 29,712,061 | ||||||||||||||
|
| |||||||||||||
Insurance 3.9% | ||||||||||||||
Aegon NV | Netherlands | 3,053,986 | 11,965,894 | |||||||||||
American International Group Inc. | United States | 312,040 | 16,503,796 | |||||||||||
AXA SA | France | 474,608 | 9,379,516 | |||||||||||
China Life Insurance Co. Ltd., H | China | 6,041,230 | 12,941,405 | |||||||||||
|
| |||||||||||||
| 50,790,611 | ||||||||||||||
|
| |||||||||||||
Internet Software & Services 1.4% | ||||||||||||||
| a | Alphabet Inc., A | United States | 25,760 | 18,122,933 | ||||||||||
|
| |||||||||||||
Life Sciences Tools & Services 0.6% | ||||||||||||||
| a | QIAGEN NV | Netherlands | 385,000 | 8,330,813 | ||||||||||
|
| |||||||||||||
Machinery 0.5% | ||||||||||||||
| a | Navistar International Corp. | United States | 598,440 | 6,995,764 | ||||||||||
|
| |||||||||||||
Media 3.7% | ||||||||||||||
Comcast Corp., A | United States | 297,202 | 19,374,598 | |||||||||||
Sky PLC | United Kingdom | 1,074,857 | 12,153,658 | |||||||||||
Twenty-First Century Fox Inc., A | United States | 641,182 | 17,343,973 | |||||||||||
|
| |||||||||||||
| 48,872,229 | ||||||||||||||
|
| |||||||||||||
Metals & Mining 2.4% | ||||||||||||||
Glencore PLC | Switzerland | 8,733,900 | 17,800,578 | |||||||||||
MMC Norilsk Nickel PJSC, ADR | Russia | 1,040,760 | 13,831,701 | |||||||||||
|
| |||||||||||||
| 31,632,279 | ||||||||||||||
|
| |||||||||||||
| Semiannual Report | TG-13 |
FRANKLIN TEMPLETON VARIABLE INSURANCE PRODUCTS TRUST
STATEMENT OF INVESTMENTS (UNAUDITED)
Templeton Growth VIP Fund (continued)
| Country | Shares | Value | ||||||||||||
Common Stocks (continued) | ||||||||||||||
Oil, Gas & Consumable Fuels 11.8% | ||||||||||||||
Apache Corp. | United States | 305,930 | $ | 17,031,123 | ||||||||||
BP PLC | United Kingdom | 3,841,161 | 22,441,184 | |||||||||||
| a | Chesapeake Energy Corp. | United States | 2,179,440 | 9,328,003 | ||||||||||
Eni SpA | Italy | 866,889 | 13,971,194 | |||||||||||
Galp Energia SGPS SA, B | Portugal | 1,110,730 | 15,410,684 | |||||||||||
Kunlun Energy Co. Ltd. | China | 17,103,030 | 14,108,410 | |||||||||||
Royal Dutch Shell PLC, A | United Kingdom | 15,359 | 419,322 | |||||||||||
Royal Dutch Shell PLC, B | United Kingdom | 1,303,219 | 35,831,626 | |||||||||||
Total SA, B | France | 544,729 | 26,228,500 | |||||||||||
|
| |||||||||||||
| 154,770,046 | ||||||||||||||
|
| |||||||||||||
Pharmaceuticals 8.7% | ||||||||||||||
| a | Allergan PLC | United States | 93,324 | 21,566,243 | ||||||||||
Eli Lilly & Co. | United States | 175,170 | 13,794,638 | |||||||||||
Merck KGaA | Germany | 166,284 | 16,804,818 | |||||||||||
Roche Holding AG | Switzerland | 45,563 | 11,954,394 | |||||||||||
Sanofi | France | 227,717 | 18,936,366 | |||||||||||
Teva Pharmaceutical Industries Ltd., ADR | Israel | 609,830 | 30,631,761 | |||||||||||
|
| |||||||||||||
| 113,688,220 | ||||||||||||||
|
| |||||||||||||
Software 4.2% | ||||||||||||||
Microsoft Corp. | United States | 584,689 | 29,918,536 | |||||||||||
Oracle Corp. | United States | 627,880 | 25,699,128 | |||||||||||
|
| |||||||||||||
| 55,617,664 | ||||||||||||||
|
| |||||||||||||
Specialty Retail 0.3% | ||||||||||||||
Kingfisher PLC | United Kingdom | 871,388 | 3,747,156 | |||||||||||
|
| |||||||||||||
Technology Hardware, Storage & Peripherals 6.5% | ||||||||||||||
Apple Inc. | United States | 70,200 | 6,711,120 | |||||||||||
Hewlett Packard Enterprise Co. | United States | 677,340 | 12,375,002 | |||||||||||
HP Inc. | United States | 677,340 | 8,500,617 | |||||||||||
Samsung Electronics Co. Ltd. | South Korea | 46,020 | 56,889,238 | |||||||||||
|
| |||||||||||||
| 84,475,977 | ||||||||||||||
|
| |||||||||||||
Textiles, Apparel & Luxury Goods 1.2% | ||||||||||||||
| a | Michael Kors Holdings Ltd. | United States | 313,480 | 15,510,990 | ||||||||||
|
| |||||||||||||
Wireless Telecommunication Services 3.3% | ||||||||||||||
SoftBank Group Corp. | Japan | 346,820 | 19,440,726 | |||||||||||
| a | Turkcell Iletisim Hizmetleri AS, ADR | Turkey | 1,653,543 | 15,129,918 | ||||||||||
Vodafone Group PLC | United Kingdom | 2,681,677 | 8,140,191 | |||||||||||
|
| |||||||||||||
| 42,710,835 | ||||||||||||||
|
| |||||||||||||
Total Common Stocks (Cost $1,270,383,846) | 1,287,470,650 | |||||||||||||
|
| |||||||||||||
Preferred Stocks (Cost $13,187,730) 0.6% | ||||||||||||||
Oil, Gas & Consumable Fuels 0.6% | ||||||||||||||
| a | Petroleo Brasileiro SA, ADR, pfd. | Brazil | 1,315,652 | 7,643,938 | ||||||||||
|
| |||||||||||||
Total Investments before Short Term Investments (Cost $1,283,571,576) | 1,295,114,588 | |||||||||||||
|
| |||||||||||||
| TG-14 | Semiannual Report |
FRANKLIN TEMPLETON VARIABLE INSURANCE PRODUCTS TRUST
STATEMENT OF INVESTMENTS (UNAUDITED)
Templeton Growth VIP Fund (continued)
| Country | Principal Amount | Value | ||||||||||||
Short Term Investments 1.1% | ||||||||||||||
Time Deposits Cost ($12,500,000) 1.0% | ||||||||||||||
Royal Bank of Canada, 0.30%, 7/01/16 | United States | $ | 12,500,000 | $ | 12,500,000 | |||||||||
|
| |||||||||||||
Total Investments before Money Market Funds (Cost $1,296,071,576) | 1,307,614,588 | |||||||||||||
|
| |||||||||||||
| Shares | ||||||||||||||
| c | Investments from Cash Collateral Received for Loaned Securities (Cost $1,890,000) 0.1% | |||||||||||||
Money Market Funds 0.1% | ||||||||||||||
| a,d | Institutional Fiduciary Trust Money Market Portfolio | United States | 1,890,000 | 1,890,000 | ||||||||||
|
| |||||||||||||
Total Investments (Cost $1,297,961,576) 100.0% | 1,309,504,588 | |||||||||||||
Other Assets, less Liabilities 0.0%† | 331,365 | |||||||||||||
|
| |||||||||||||
Net Assets 100.0% | $ | 1,309,835,953 | ||||||||||||
|
| |||||||||||||
See Abbreviations on page TG-25.
†Rounds to less than 0.1% of net assets.
aNon-income producing.
bA portion or all of the security is on loan at June 30, 2016. See Note 1(c).
cSee Note 1(c) regarding securities on loan.
dSee Note 3(e) regarding investments in affiliated management investment companies.
| The accompanying notes are an integral part of these financial statements. | Semiannual Report | TG-15 |
FRANKLIN TEMPLETON VARIABLE INSURANCE PRODUCTS TRUST
Financial Statements
Statement of Assets and Liabilities
June 30, 2016 (unaudited)
| Templeton Growth VIP Fund | ||||
Assets: | ||||
Investments in securities: | ||||
Cost - Unaffiliated issuers | $ | 1,296,071,576 | ||
Cost - Non-controlled affiliates (Note 3e) | 1,890,000 | |||
|
| |||
Total cost of investments | $ | 1,297,961,576 | ||
|
| |||
Value - Unaffiliated issuers | $ | 1,307,614,588 | ||
Value - Non-controlled affiliates (Note 3e) | 1,890,000 | |||
|
| |||
Total value of investments (Includes securities loaned in the amount of $1,775,214) | 1,309,504,588 | |||
Cash | 609,409 | |||
Receivables: | ||||
Investment securities sold | 710,810 | |||
Capital shares sold | 170,327 | |||
Dividends and interest | 2,692,729 | |||
European Union tax reclaims | 776,715 | |||
Other assets | 614 | |||
|
| |||
Total assets | 1,314,465,192 | |||
|
| |||
Liabilities: | ||||
Payables: | ||||
Investment securities purchased | 869,326 | |||
Capital shares redeemed | 164,874 | |||
Management fees | 849,147 | |||
Distribution fees | 382,255 | |||
Trustees’ fees and expenses | 113 | |||
Payable upon return of securities loaned | 1,890,000 | |||
Deferred tax | 183,091 | |||
Accrued expenses and other liabilities | 290,433 | |||
|
| |||
Total liabilities | 4,629,239 | |||
|
| |||
Net assets, at value | $ | 1,309,835,953 | ||
|
| |||
Net assets consist of: | ||||
Paid-in capital | $ | 1,278,199,035 | ||
Undistributed net investment income | 17,326,375 | |||
Net unrealized appreciation (depreciation) | 11,297,284 | |||
Accumulated net realized gain (loss) | 3,013,259 | |||
|
| |||
Net assets, at value | $ | 1,309,835,953 | ||
|
| |||
| Class 1: | ||||
Net assets, at value | $ | 431,609,518 | ||
|
| |||
Shares outstanding | 35,152,726 | |||
|
| |||
Net asset value and maximum offering price per share | $ | 12.28 | ||
|
| |||
| Class 2: | ||||
Net assets, at value | $ | 833,994,449 | ||
|
| |||
Shares outstanding | 68,958,905 | |||
|
| |||
Net asset value and maximum offering price per share | $ | 12.09 | ||
|
| |||
| Class 4: | ||||
Net assets, at value | $ | 44,231,986 | ||
|
| |||
Shares outstanding | 3,621,488 | |||
|
| |||
Net asset value and maximum offering price per share | $ | 12.21 | ||
|
| |||
| TG-16 | Semiannual Report | The accompanying notes are an integral part of these financial statements. |
FRANKLIN TEMPLETON VARIABLE INSURANCE PRODUCTS TRUST
FINANCIAL STATEMENTS
Statement of Operations
for the six months ended June 30, 2016 (unaudited)
| Templeton Growth VIP Fund | ||||
Investment income: | ||||
Dividends (net of foreign taxes of $2,484,424) | $ | 23,319,623 | ||
Interest | 23,655 | |||
Income from securities loaned (net of fees and rebates) | 577,010 | |||
|
| |||
Total investment income | 23,920,288 | |||
|
| |||
Expenses: | ||||
Management fees (Note 3a) | 5,202,717 | |||
Distribution fees: (Note 3c) | ||||
Class 2 | 1,060,850 | |||
Class 4 | 78,194 | |||
Custodian fees (Note 4) | 54,578 | |||
Reports to shareholders | 116,592 | |||
Professional fees | 68,020 | |||
Trustees’ fees and expenses | 3,707 | |||
Other | 21,283 | |||
|
| |||
Total expenses | 6,605,941 | |||
Expenses waived/paid by affiliates (Note 3e) | (31,099 | ) | ||
|
| |||
Net expenses | 6,574,842 | |||
|
| |||
Net investment income | 17,345,446 | |||
|
| |||
Realized and unrealized gains (losses): | ||||
Net realized gain (loss) from: | ||||
Investments | 14,146,163 | |||
Foreign currency transactions | (103,604 | ) | ||
|
| |||
Net realized gain (loss) | 14,042,559 | |||
|
| |||
Net change in unrealized appreciation (depreciation) on: | ||||
Investments | (77,916,782 | ) | ||
Translation of other assets and liabilities denominated in foreign currencies | 13,821 | |||
Change in deferred taxes on unrealized appreciation | (87,409 | ) | ||
|
| |||
Net change in unrealized appreciation (depreciation) | (77,990,370 | ) | ||
|
| |||
Net realized and unrealized gain (loss) | (63,947,811 | ) | ||
|
| |||
Net increase (decrease) in net assets resulting from operations | $ | (46,602,365 | ) | |
|
| |||
| The accompanying notes are an integral part of these financial statements. | Semiannual Report | TG-17 |
FRANKLIN TEMPLETON VARIABLE INSURANCE PRODUCTS TRUST
FINANCIAL STATEMENTS
Statements of Changes in Net Assets
| Templeton Growth VIP Fund | ||||||||
| Six Months Ended June 30, 2016 (unaudited) | Year Ended December 31, 2015 | |||||||
Increase (decrease) in net assets: | ||||||||
Operations: | ||||||||
Net investment income | $ | 17,345,446 | $ | 29,759,073 | ||||
Net realized gain (loss) | 14,042,559 | 131,046,091 | ||||||
Net change in unrealized appreciation (depreciation) | (77,990,370 | ) | (259,448,984 | ) | ||||
|
| |||||||
Net increase (decrease) in net assets resulting from operations | (46,602,365 | ) | (98,643,820 | ) | ||||
|
| |||||||
Distributions to shareholders from: | ||||||||
Net investment income: | ||||||||
Class 1 | (10,324,588 | ) | (15,123,132 | ) | ||||
Class 2 | (17,569,557 | ) | (28,110,279 | ) | ||||
Class 4 | (854,329 | ) | (1,358,156 | ) | ||||
Net realized gains: | ||||||||
Class 1 | (17,221,955 | ) | — | |||||
Class 2 | (33,791,595 | ) | — | |||||
Class 4 | (1,749,579 | ) | — | |||||
|
| |||||||
Total distributions to shareholders | (81,511,603 | ) | (44,591,567 | ) | ||||
|
| |||||||
Capital share transactions: (Note 2) | ||||||||
Class 1 | 4,902,712 | (58,388,439 | ) | |||||
Class 2 | (5,619,491 | ) | (157,221,222 | ) | ||||
Class 4 | 447,131 | (7,679,959 | ) | |||||
|
| |||||||
Total capital share transactions | (269,648 | ) | (223,289,620 | ) | ||||
|
| |||||||
Net increase (decrease) in net assets | (128,383,616 | ) | (366,525,007 | ) | ||||
Net assets: | ||||||||
Beginning of period | 1,438,219,569 | 1,804,744,576 | ||||||
|
| |||||||
End of period | $ | 1,309,835,953 | $ | 1,438,219,569 | ||||
|
| |||||||
Undistributed net investment income included in net assets: | ||||||||
End of period | $ | 17,326,375 | $ | 28,729,403 | ||||
|
| |||||||
| TG-18 | Semiannual Report | The accompanying notes are an integral part of these financial statements. |
FRANKLIN TEMPLETON VARIABLE INSURANCE PRODUCTS TRUST
Notes to Financial Statements (unaudited)
Templeton Growth VIP Fund
1. Organization and Significant Accounting Policies
Franklin Templeton Variable Insurance Products Trust (Trust) is registered under the Investment Company Act of 1940 (1940 Act) as an open-end management investment company, consisting of nineteen separate funds and applies the specialized accounting and reporting guidance in U.S. Generally Accepted Accounting Principles (U.S. GAAP). Templeton Growth VIP Fund (Fund) is included in this report. The financial statements of the remaining funds in the Trust are presented separately. Shares of the Fund are generally sold only to insurance company separate accounts to fund the benefits of variable life insurance policies or variable annuity contracts. The Fund offers three classes of shares: Class 1, Class 2 and Class 4. Each class of shares differs by its distribution fees, voting rights on matters affecting a single class and its exchange privilege.
The following summarizes the Fund’s significant accounting policies.
a. Financial Instrument Valuation
The Fund’s investments in financial instruments are carried at fair value daily. Fair value is the price that would be received to sell an asset or paid to transfer a liability in an orderly transaction between market participants on the measurement date. The Fund calculates the net asset value (NAV) per share as of 4 p.m. Eastern time each day the New York Stock Exchange (NYSE) is open for trading. Under compliance policies and procedures approved by the Trust’s Board of Trustees (the Board), the Fund’s administrator has responsibility for oversight of valuation, including leading the cross-functional Valuation Committee (VC). The VC provides administration and oversight of the Fund’s valuation policies and procedures, which are approved annually by the Board. Among other things, these procedures allow the Fund to utilize independent pricing services, quotations from securities and financial instrument dealers, and other market sources to determine fair value.
Equity securities listed on an exchange or on the NASDAQ National Market System are valued at the last quoted sale price or the official closing price of the day, respectively. Foreign equity securities are valued as of the close of trading on the foreign stock exchange on which the security is primarily traded or as of 4 p.m. Eastern time whichever is earlier. The value is then converted into its U.S. dollar equivalent at the foreign exchange rate in effect at 4 p.m. Eastern time on the day that the value of the security is determined. Over-the-counter (OTC)
securities are valued within the range of the most recent quoted bid and ask prices. Securities that trade in multiple markets or on multiple exchanges are valued according to the broadest and most representative market. Certain equity securities are valued based upon fundamental characteristics or relationships to similar securities.
Investments in open-end mutual funds are valued at the closing NAV. Time deposits are valued at cost, which approximates fair value.
The Fund has procedures to determine the fair value of financial instruments for which market prices are not reliable or readily available. Under these procedures, the VC convenes on a regular basis to review such financial instruments and considers a number of factors, including significant unobservable valuation inputs, when arriving at fair value. The VC primarily employs a market-based approach which may use related or comparable assets or liabilities, recent transactions, market multiples, book values, and other relevant information for the investment to determine the fair value of the investment. An income-based valuation approach may also be used in which the anticipated future cash flows of the investment are discounted to calculate fair value. Discounts may also be applied due to the nature or duration of any restrictions on the disposition of the investments. Due to the inherent uncertainty of valuations of such investments, the fair values may differ significantly from the values that would have been used had an active market existed. The VC employs various methods for calibrating these valuation approaches including a regular review of key inputs and assumptions, transactional back-testing or disposition analysis, and reviews of any related market activity.
Trading in securities on foreign securities stock exchanges and OTC markets may be completed before 4 p.m. Eastern time. In addition, trading in certain foreign markets may not take place on every NYSE business day. Occasionally, events occur between the time at which trading in a foreign security is completed and the close of the NYSE that might call into question the reliability of the value of a portfolio security held by the Fund. As a result, differences may arise between the value of the Fund’s portfolio securities as determined at the foreign market close and the latest indications of value at the close of the NYSE. In order to minimize the potential for these differences, the VC monitors price movements following the close of trading in foreign stock markets through a series of country specific market proxies (such as baskets of American Depositary
| Semiannual Report | TG-19 |
FRANKLIN TEMPLETON VARIABLE INSURANCE PRODUCTS TRUST
NOTES TO FINANCIAL STATEMENTS (UNAUDITED)
Templeton Growth VIP Fund (continued)
1. Organization and Significant Accounting Policies (continued)
a. Financial Instrument Valuation (continued)
Receipts, futures contracts and exchange traded funds). These price movements are measured against established trigger thresholds for each specific market proxy to assist in determining if an event has occurred that may call into question the reliability of the values of the foreign securities held by the Fund. If such an event occurs, the securities may be valued using fair value procedures, which may include the use of independent pricing services.
When the last day of the reporting period is a non-business day, certain foreign markets may be open on those days that the NYSE is closed, which could result in differences between the value of the Fund’s portfolio securities on the last business day and the last calendar day of the reporting period. Any significant security valuation changes due to an open foreign market are adjusted and reflected by the Fund for financial reporting purposes.
b. Foreign Currency Translation
Portfolio securities and other assets and liabilities denominated in foreign currencies are translated into U.S. dollars based on the exchange rate of such currencies against U.S. dollars on the date of valuation. The Fund may enter into foreign currency exchange contracts to facilitate transactions denominated in a foreign currency. Purchases and sales of securities, income and expense items denominated in foreign currencies are translated into U.S. dollars at the exchange rate in effect on the transaction date. Portfolio securities and assets and liabilities denominated in foreign currencies contain risks that those currencies will decline in value relative to the U.S. dollar. Occasionally, events may impact the availability or reliability of foreign exchange rates used to convert the U.S. dollar equivalent value. If such an event occurs, the foreign exchange rate will be valued at fair value using procedures established and approved by the Board.
The Fund does not separately report the effect of changes in foreign exchange rates from changes in market prices on securities held. Such changes are included in net realized and unrealized gain or loss from investments in the Statement of Operations.
Realized foreign exchange gains or losses arise from sales of foreign currencies, currency gains or losses realized between the trade and settlement dates on securities transactions and the
difference between the recorded amounts of dividends, interest, and foreign withholding taxes and the U.S. dollar equivalent of the amounts actually received or paid. Net unrealized foreign exchange gains and losses arise from changes in foreign exchange rates on foreign denominated assets and liabilities other than investments in securities held at the end of the reporting period.
c. Securities Lending
The Fund participates in an agency based securities lending program to earn additional income. The Fund receives cash collateral against the loaned securities in an amount equal to at least 102% of the fair value of the loaned securities. Collateral is maintained over the life of the loan in an amount not less than 100% of the fair value of loaned securities, as determined at the close of Fund business each day; any additional collateral required due to changes in security values is delivered to the Fund on the next business day. The collateral is deposited into a joint cash account with other funds and is used to invest in a money market fund managed by Franklin Advisers, Inc., an affiliate of the Fund. The Fund may receive income from the investment of cash collateral, in addition to lending fees and rebates paid by the borrower. Income from securities loaned, net of fees paid to the securities lending agent and/or third-party vendor, is reported separately in the Statement of Operations. The Fund bears the market risk with respect to the collateral investment, securities loaned, and the risk that the agent may default on its obligations to the Fund. If the borrower defaults on its obligation to return the securities loaned, the Fund has the right to repurchase the securities in the open market using the collateral received. The securities lending agent has agreed to indemnify the Fund in the event of default by a third party borrower.
d. Income and Deferred Taxes
It is the Fund’s policy to qualify as a regulated investment company under the Internal Revenue Code. The Fund intends to distribute to shareholders substantially all of its taxable income and net realized gains to relieve it from federal income and if applicable, excise taxes. As a result, no provision for U.S. federal income taxes is required.
The Fund may be subject to foreign taxation related to income received, capital gains on the sale of securities and certain foreign currency transactions in the foreign jurisdictions in which it invests. Foreign taxes, if any, are recorded based on the
| TG-20 | Semiannual Report |
FRANKLIN TEMPLETON VARIABLE INSURANCE PRODUCTS TRUST
NOTES TO FINANCIAL STATEMENTS (UNAUDITED)
Templeton Growth VIP Fund (continued)
tax regulations and rates that exist in the foreign markets in which the Fund invests. When a capital gain tax is determined to apply, the Fund records an estimated deferred tax liability in an amount that would be payable if the securities were disposed of on the valuation date. As a result of several court cases, in certain countries across the European Union, the Fund filed additional tax reclaims for previously withheld taxes on dividends earned in those countries (EU reclaims). These additional filings are subject to various administrative proceedings by the local jurisdictions’ tax authorities within the European Union, as well as a number of related judicial proceedings. Income recognized, if any, for EU reclaims is reflected as other income in the Statement of Operations and any related receivable, if any, is reflected as European Union tax reclaims in the Statement of Assets and Liabilities. When uncertainty exists as to the ultimate resolution of these proceedings, the likelihood of receipt of these EU reclaims, and the potential timing of payment, no amounts are reflected in the financial statements.
The Fund may recognize an income tax liability related to its uncertain tax positions under U.S. GAAP when the uncertain tax position has a less than 50% probability that it will be sustained upon examination by the tax authorities based on its technical merits. As of June 30, 2016, the Fund has determined that no tax liability is required in its financial statements related to uncertain tax positions for any open tax years (or expected to be taken in future tax years). Open tax years are those that remain subject to examination and are based on each tax jurisdiction’s statute of limitation.
e. Security Transactions, Investment Income, Expenses and Distributions
Security transactions are accounted for on trade date. Realized gains and losses on security transactions are determined on a specific identification basis. Interest income and estimated expenses are accrued daily. Dividend income is recorded on the ex-dividend date except for certain dividends from foreign securities where the dividend rate is not available. In such cases, the dividend is recorded as soon as the information is received by the Fund. Distributions to shareholders are recorded on the
ex-dividend date and are determined according to income tax regulations (tax basis). Distributable earnings determined on a tax basis may differ from earnings recorded in accordance with U.S. GAAP. These differences may be permanent or temporary. Permanent differences are reclassified among capital accounts to reflect their tax character. These reclassifications have no impact on net assets or the results of operations. Temporary differences are not reclassified, as they may reverse in subsequent periods.
Common expenses incurred by the Trust are allocated among the Funds based on the ratio of net assets of each Fund to the combined net assets of the Trust. Fund specific expenses are charged directly to the fund that incurred the expense.
Realized and unrealized gains and losses and net investment income, not including class specific expenses, are allocated daily to each class of shares based upon the relative proportion of net assets of each class. Differences in per share distributions, by class, are generally due to differences in class specific expenses.
f. Accounting Estimates
The preparation of financial statements in accordance with U.S. GAAP requires management to make estimates and assumptions that affect the reported amounts of assets and liabilities at the date of the financial statements and the amounts of income and expenses during the reporting period. Actual results could differ from those estimates.
g. Guarantees and Indemnifications
Under the Trust’s organizational documents, its officers and trustees are indemnified by the Trust against certain liabilities arising out of the performance of their duties to the Trust. Additionally, in the normal course of business, the Trust, on behalf of the Fund, enters into contracts with service providers that contain general indemnification clauses. The Trust’s maximum exposure under these arrangements is unknown as this would involve future claims that may be made against the Trust that have not yet occurred. Currently, the Trust expects the risk of loss to be remote.
| Semiannual Report | TG-21 |
FRANKLIN TEMPLETON VARIABLE INSURANCE PRODUCTS TRUST
NOTES TO FINANCIAL STATEMENTS (UNAUDITED)
Templeton Growth VIP Fund (continued)
2. Shares of Beneficial Interest
At June 30, 2016, there were an unlimited number of shares authorized (without par value). Transactions in the Fund’s shares were as follows:
| Six Months Ended June 30, 2016 | Year Ended December 31, 2015 | |||||||||||||||||
| Shares | Amount | Shares | Amount | |||||||||||||||
| Class 1 Shares: | ||||||||||||||||||
Shares sold | 53,442 | $ | 681,940 | 326,516 | $ | 4,799,095 | ||||||||||||
Shares issued in reinvestment of distributions | 2,252,375 | 27,546,543 | 1,016,340 | 15,123,132 | ||||||||||||||
Shares redeemed | (1,760,451 | ) | (23,325,771 | ) | (5,310,550 | ) | (78,310,666 | ) | ||||||||||
|
| |||||||||||||||||
Net increase (decrease) | 545,366 | $ | 4,902,712 | (3,967,694 | ) | $ | (58,388,439 | ) | ||||||||||
|
| |||||||||||||||||
| Class 2 Shares: | ||||||||||||||||||
Shares sold | 2,201,679 | $ | 27,977,357 | 2,945,698 | $ | 42,909,317 | ||||||||||||
Shares issued in reinvestment of distributions | 4,262,336 | 51,361,152 | 1,917,482 | 28,110,279 | ||||||||||||||
Shares redeemed | (6,706,636 | ) | (84,958,000 | ) | (15,863,936 | ) | (228,240,818 | ) | ||||||||||
|
| |||||||||||||||||
Net increase (decrease) | (242,621 | ) | $ | (5,619,491 | ) | (11,000,756 | ) | $ | (157,221,222 | ) | ||||||||
|
| |||||||||||||||||
| Class 4 Shares: | ||||||||||||||||||
Shares sold | 237,607 | $ | 2,869,898 | 307,977 | $ | 4,289,876 | ||||||||||||
Shares issued in reinvestment of distributions | 213,961 | 2,603,908 | 91,767 | 1,358,156 | ||||||||||||||
Shares redeemed | (386,137 | ) | (5,026,675 | ) | (916,167 | ) | (13,327,991 | ) | ||||||||||
|
| |||||||||||||||||
Net increase (decrease) | 65,431 | $ | 447,131 | (516,423 | ) | $ | (7,679,959 | ) | ||||||||||
|
| |||||||||||||||||
3. Transactions With Affiliates
Franklin Resources, Inc. is the holding company for various subsidiaries that together are referred to as Franklin Templeton Investments. Certain officers and trustees of the Fund are also officers and/or directors of the following subsidiaries:
| Subsidiary | Affiliation | |
Templeton Global Advisors Limited (TGAL) | Investment manager | |
Franklin Templeton Services, LLC (FT Services) | Administrative manager | |
Franklin Templeton Distributors, Inc. (Distributors) | Principal underwriter | |
Franklin Templeton Investor Services, LLC (Investor Services) | Transfer agent |
a. Management Fees
The Fund pays an investment management fee to TGAL based on the average daily net assets of the Fund as follows:
| Annualized Fee Rate | Net Assets | |
1.000% | Up to and including $100 million | |
0.900% | Over $100 million, up to and including $250 million | |
0.800% | Over $250 million, up to and including $500 million | |
0.750% | Over $500 million, up to and including $1 billion | |
0.700% | Over $1 billion, up to and including $5 billion | |
0.675% | Over $5 billion, up to and including $10 billion | |
0.655% | Over $10 billion, up to and including $15 billion | |
0.635% | Over $15 billion, up to and including $20 billion | |
0.615% | In excess of $20 billion |
| TG-22 | Semiannual Report |
FRANKLIN TEMPLETON VARIABLE INSURANCE PRODUCTS TRUST
NOTES TO FINANCIAL STATEMENTS
Templeton Growth VIP Fund (continued)
For the period ended June 30, 2016, the effective management fee rate was 0.783% of the Fund’s average daily net assets.
b. Administrative Fees
Under an agreement with TGAL, FT Services provides administrative services to the Fund. The fee is paid by TGAL based on the Fund’s average daily net assets, and is not an additional expense of the Fund.
c. Distribution Fees
The Board has adopted distribution plans for Class 2 and Class 4 shares pursuant to Rule 12b-1 under the 1940 Act. Under the Fund’s compensation distribution plans, the Fund pays Distributors for costs incurred in connection with the servicing, sale and distribution of the Fund’s shares up to 0.35% per year of its average daily net assets of each class. The Board has agreed to limit the current rate to 0.25% per year for Class 2. The plan year, for purposes of monitoring compliance with the maximum annual plan rates, is February 1 through January 31.
d. Transfer Agent Fees
Investor Services, under terms of an agreement, performs shareholder servicing for the Fund and is not paid by the Fund for the services.
e. Investments in Affiliated Management Investment Companies
The Fund invests in one or more affiliated management investment companies for purposes other than exercising a controlling influence over the management or policies. Management fees paid by the Fund are waived on assets invested in the affiliated management investment companies, as noted in the Statement of Operations, in an amount not to exceed the management and administrative fees paid directly or indirectly by each affiliate.
| Number of Shares Held at Beginning of Period | Gross Additions | Gross Reductions | Number of Shares Held at End of Period | Value at End of Period | Investment Income | Realized Gain (Loss) | % of Affiliated Fund Shares Outstanding Held at End of Period | |||||||||||||||||||||||||
| Non-Controlled Affiliates | ||||||||||||||||||||||||||||||||
Institutional Fiduciary Trust Money | 8,864,598 | 260,839,711 | (267,814,309 | ) | 1,890,000 | $ | 1,890,000 | $ | — | $ | — | 0.0%a | ||||||||||||||||||||
|
| |||||||||||||||||||||||||||||||
aRounds to less than 0.1%
f. Other Affiliated Transactions
At June 30, 2016, Franklin Templeton Variable Insurance Products Trust — Franklin Founding Funds Allocation VIP Fund owned 23.9% of the Fund’s outstanding shares.
4. Expense Offset Arrangement
The Fund has entered into an arrangement with its custodian whereby credits realized as a result of uninvested cash balances are used to reduce a portion of the Fund’s custodian expenses. During the period ended June 30, 2016, there were no credits earned.
| Semiannual Report | TG-23 |
FRANKLIN TEMPLETON VARIABLE INSURANCE PRODUCTS TRUST
NOTES TO FINANCIAL STATEMENTS (UNAUDITED)
Templeton Growth VIP Fund (continued)
5. Income Taxes
At June 30, 2016, the cost of investments and net unrealized appreciation (depreciation) for income tax purposes were as follows:
Cost of investments | $ | 1,316,201,155 | ||
|
| |||
Unrealized appreciation | $ | 230,477,139 | ||
Unrealized depreciation | (237,173,706 | ) | ||
|
| |||
Net unrealized appreciation (depreciation) | $ | (6,696,567 | ) | |
|
|
Differences between income and/or capital gains as determined on a book basis and a tax basis are primarily due to differing treatments of foreign capital gains tax and wash sales.
6. Investment Transactions
Purchases and sales of investments (excluding short term securities) for the period ended June 30, 2016, aggregated $152,491,978 and $211,775,101, respectively.
At June 30, 2016, in connection with securities lending transactions, the Fund loaned equity investments and received $1,890,000 of cash collateral. The gross amount of recognized liability for such transactions is included in payable upon return of securities loaned in the Statement of Assets and Liabilities. The agreements can be terminated at any time.
7. Concentration of Risk
Investing in foreign securities may include certain risks and considerations not typically associated with investing in U.S. securities, such as fluctuating currency values and changing local and regional economic, political and social conditions, which may result in greater market volatility. In addition, certain foreign securities may not be as liquid as U.S. securities.
8. Credit Facility
The Fund, together with other U.S. registered and foreign investment funds (collectively, Borrowers), managed by Franklin Templeton Investments, are borrowers in a joint syndicated senior unsecured credit facility totaling $2 billion (Global Credit Facility) which matures on February 10, 2017. This Global Credit Facility provides a source of funds to the Borrowers for temporary and emergency purposes, including the ability to meet future unanticipated or unusually large redemption requests.
Under the terms of the Global Credit Facility, the Fund shall, in addition to interest charged on any borrowings made by the Fund and other costs incurred by the Fund, pay its share of fees and expenses incurred in connection with the implementation and maintenance of the Global Credit Facility, based upon its relative share of the aggregate net assets of all of the Borrowers, including an annual commitment fee of 0.07% based upon the unused portion of the Global Credit Facility. Effective February 12, 2016, the annual commitment fee is 0.15%. These fees are reflected in other expenses in the Statement of Operations. During the period ended June 30, 2016, the Fund did not use the Global Credit Facility.
9. Fair Value Measurements
The Fund follows a fair value hierarchy that distinguishes between market data obtained from independent sources (observable inputs) and the Fund’s own market assumptions (unobservable inputs). These inputs are used in determining the value of the Fund’s financial instruments and are summarized in the following fair value hierarchy:
| • | Level 1 – quoted prices in active markets for identical financial instruments |
| • | Level 2 – other significant observable inputs (including quoted prices for similar financial instruments, interest rates, prepayment speed, credit risk, etc.) |
| TG-24 | Semiannual Report |
FRANKLIN TEMPLETON VARIABLE INSURANCE PRODUCTS TRUST
NOTES TO FINANCIAL STATEMENTS
Templeton Growth VIP Fund (continued)
| • | Level 3 – significant unobservable inputs (including the Fund’s own assumptions in determining the fair value of financial instruments) |
The input levels are not necessarily an indication of the risk or liquidity associated with financial instruments at that level.
For movements between the levels within the fair value hierarchy, the Fund has adopted a policy of recognizing the transfers as of the date of the underlying event which caused the movement.
A summary of inputs used as of June 30, 2016, in valuing the Fund’s assets carried at fair value, is as follows:
| Level 1 | Level 2 | Level 3 | Total | |||||||||||||
| Assets: | ||||||||||||||||
Investments in Securities | ||||||||||||||||
Equity Investmentsa,b | $ | 1,295,114,588 | $ | — | $ | — | $ | 1,295,114,588 | ||||||||
Short Term Investments | 1,890,000 | 12,500,000 | — | 14,390,000 | ||||||||||||
|
| |||||||||||||||
Total Investments in Securities | $ | 1,297,004,588 | $ | 12,500,000 | $ | — | $ | 1,309,504,588 | ||||||||
|
| |||||||||||||||
aIncludes common and preferred stocks.
bFor detailed categories, see the accompanying Statement of Investments.
10. Subsequent Events
The Fund has evaluated subsequent events through the issuance of the financial statements and determined that no events have occurred that require disclosure.
Abbreviations
| ADR | American Depositary Receipt | |
| IDR | International Depositary Receipt | |
| Semiannual Report | TG-25 |
FRANKLIN TEMPLETON VARIABLE INSURANCE PRODUCTS TRUST
Tax Information (unaudited)
Templeton Growth VIP Fund
At December 31, 2015, more than 50% of the Fund’s total assets were invested in securities of foreign issuers. In most instances, foreign taxes were withheld from income paid to the Fund on these investments. As shown in the table below, the Fund hereby reports to shareholders the foreign source income and foreign taxes paid, pursuant to Section 853 of the Internal Revenue Code. This written statement will allow shareholders of record on June 14, 2016, to treat their proportionate share of foreign taxes paid by the Fund as having been paid directly by them. The shareholder shall consider these amounts as foreign taxes paid in the tax year in which they receive the Fund distribution.
The following table provides a detailed analysis of foreign tax paid, and foreign source income as reported by the Fund, to Class 1, Class 2, and Class 4 shareholders of record.
| Class | Foreign Tax Paid Per Share | Foreign Source Income Per Share | ||
Class 1 | $0.0227 | $0.2591 | ||
Class 2 | $0.0227 | $0.2276 | ||
Class 4 | $0.0227 | $0.2146 |
Foreign Tax Paid Per Share (Column 1) is the amount per share available to you, as a tax credit (assuming you held your shares in the Fund for a minimum of 16 days during the 31-day period beginning 15 days before the ex-dividend date of the Fund’s distribution to which the foreign taxes relate), or, as a tax deduction.
Foreign Source Income Per Share (Column 2) is the amount per share of income dividends attributable to foreign securities held by the Fund, plus any foreign taxes withheld on these dividends.
| TG-26 | Semiannual Report |
FRANKLIN TEMPLETON VARIABLE INSURANCE PRODUCTS TRUST
Index Descriptions
The indexes are unmanaged and include reinvestment of any income or distributions. They do not reflect any fees, expenses or sales charges.
For Russell Indexes: Russell Investment Group is the source and owner of the trademarks, service marks and copyrights related to the Russell Indexes. Russell® is a trademark of Russell Investment Group.
See www.franklintempletondatasources.com for additional data provider information.
Barclays U.S. Aggregate Bond Index is a market capitalization-weighted index representing the U.S. investment-grade, fixed-rate, taxable bond market with index components for government and corporate, mortgage pass-through and asset-backed securities. All issues included are SEC registered, taxable, dollar denominated and nonconvertible, must have at least one year to final maturity and must be rated investment grade (Baa3/BBB-/BBB- or higher) using the middle rating of Moody’s, Standard & Poor’s and Fitch, respectively.
Barclays U.S. Government Index: Intermediate Component is the intermediate component of the Barclays U.S. Government Index, which includes public obligations of the U.S. Treasury with at least one year to final maturity and publicly issued debt of U.S. government agencies, quasi-federal corporations, and corporate or foreign debt guaranteed by the U.S. government.
Bloomberg Commodity Index comprises exchange-traded futures on physical commodities, which are weighted to account for economic significance and market liquidity.
Citigroup World Government Bond Index is a market capitalization-weighted index consisting of investment-grade world government bond markets.
Consumer Price Index (CPI) is a commonly used measure of the inflation rate.
Credit Suisse (CS) High Yield Index is designed to mirror the investable universe of the U.S. dollar-denominated high yield debt market.
FTSE® EPRA®/NAREIT® Developed Index is a free float-adjusted index designed to measure the performance of publicly traded real estate securities in the North American, European and Asian real estate markets.
J.P. Morgan (JPM) Global Government Bond Index (GGBI) tracks total returns for liquid, fixed-rate, domestic government bonds with maturities greater than one year issued by developed countries globally.
Lipper Multi-Sector Income Funds Classification Average is calculated by averaging the total returns of all funds within the Lipper Multi-Sector Income Funds classification in the Lipper Open-End underlying funds universe. Lipper Multi-Sector Income Funds are defined as funds that seek current income by allocating assets among different fixed income securities sectors (not primarily in one sector except for defensive purposes), including U.S. and foreign governments, with a significant portion rated below investment grade. For the six-month period ended 6/30/16, there were 313 funds in this category. Lipper calculations do not include contract fees, expenses or sales charges, and may have been different if such charges had been considered.
Lipper VIP Equity Income Funds Classification Average is an equally weighted average calculation of performance figures for all funds within the Lipper Equity Income Funds classification in the Lipper VIP underlying funds universe. Lipper Equity Income Funds seek relatively high current income and growth of income through investing 60% or more of their portfolios in equities. For the six-month period ended 6/30/16, there were 72 funds in this category. Lipper calculations do not include contract fees, expenses or sales charges, and may have been different if such charges had been considered.
Lipper VIP General U.S. Government Funds Classification Average is an equally weighted average calculation of performance figures for all funds within the Lipper General U.S. Government Funds classification in the Lipper VIP underlying funds universe. Lipper General U.S. Government Funds invest primarily in U.S. government and agency issues. For the six-month period ended 6/30/16, there were 55 funds in this category. Lipper calculations do not include contract fees, expenses or sales charges, and may have been different if such charges had been considered.
Lipper VIP High Yield Funds Classification Average is an equally weighted average calculation of performance figures for all funds within the Lipper High Yield Funds Classification in the Lipper VIP underlying funds universe. Lipper High Yield Funds aim at high (relative) current yield from fixed income securities, have no quality or maturity restrictions, and tend to invest in lower grade debt issues. For the six-month period
| Semiannual Report | I-1 |
FRANKLIN TEMPLETON VARIABLE INSURANCE PRODUCTS TRUST
ended 6/30/16, there were 109 funds in this category. Lipper calculations do not include contract fees, expenses or sales charges, and may have been different if such charges had been considered.
MSCI All Country World Index (ACWI) is a free float-adjusted, market capitalization-weighted index designed to measure equity market performance in global developed and emerging markets.
MSCI All Country World Index (ACWI) ex USA Index captures large- and mid-capitalization representation across 22 of 23 developed markets countries (excluding the U.S.) and 23 emerging markets countries. The index covers approximately 85% of the global equity opportunity set outside the U.S.
MSCI Emerging Markets (EM) Index is a free float-adjusted, market capitalization-weighted index designed to measure equity market performance in global emerging markets.
MSCI Europe, Australasia, Far East (EAFE) Index is a free float-adjusted, market capitalization-weighted index designed to measure equity market performance in global developed markets excluding the U.S. and Canada.
MSCI World Index is a free float-adjusted, market capitalization-weighted index designed to measure equity market performance in global developed markets.
Russell 1000® Growth Index is market capitalization weighted and measures performance of those Russell 1000® Index companies with higher price-to-book ratios and higher forecasted growth values.
Russell 1000® Index is market capitalization weighted and measures performance of the largest companies in the Russell 3000® Index, which represents the majority of the U.S. market’s total capitalization.
Russell 2500TM Index is market capitalization weighted and measures performance of the smallest companies in the Russell 3000® Index, which represent a modest amount of the Russell 3000® Index’s total market capitalization.
Russell 2500TM Value Index is market capitalization weighted and measures performance of those Russell 2500TM Index companies with lower price-to-book ratios and lower forecasted growth values.
Russell 3000® Growth Index is market capitalization weighted and measures performance of those Russell 3000® Index companies with higher price-to-book ratios and higher forecasted growth values.
Russell Midcap® Growth Index is market capitalization weighted and measures performance of those Russell Midcap® Index companies with higher price-to-book ratios and higher forecasted growth values.
Russell Midcap® Index is market capitalization weighted and measures performance of the smallest companies in the Russell 1000® Index, which represent a modest amount of the Russell 1000® Index’s total market capitalization.
Standard & Poor’s® 500 Index (S&P 500®) is a market capitalization-weighted index of 500 stocks designed to measure total U.S. equity market performance.
Standard & Poor’s®/International Finance Corporation Investable (S&P/IFCI) Composite Index is a free float-adjusted, market capitalization-weighted index designed to measure equity performance in global emerging markets.
| I-2 | Semiannual Report |
FRANKLIN TEMPLETON VARIABLE INSURANCE PRODUCTS TRUST
Shareholder Information
Board Review of Investment Management Agreement
At a meeting held April 12, 2016, the Board of Trustees (Board), including a majority of trustees that are not “interested persons” as such term is defined in section 2(a)(19) of the Investment Company Act of 1940 (hereinafter referred to as “non-interested Trustees” or “independent Trustees”), approved renewal of the investment management agreement and investment sub-advisory agreement, as applicable, for each of the separate funds within the Trust (Fund(s)). In reaching this decision, the Board took into account information furnished throughout the year at regular Board meetings, as well as information prepared specifically in connection with the annual renewal review process. Information furnished and discussed throughout the year included investment performance reports and related financial information for each Fund, along with periodic reports on expenses, shareholder services, legal and compliance matters, risk control, pricing, brokerage commissions and execution, and other services provided by each Investment Manager and investment sub-adviser (Manager(s)) and their affiliates, as well as marketing support payments made to financial intermediaries. Information furnished specifically in connection with the renewal process included reports for each Fund prepared by Broadridge Financial Solutions, Inc. (Broadridge), an independent organization, as well as additional material, including a Fund profitability analysis prepared by management. The Broadridge reports, which utilize data from Lipper, Inc. (Lipper), compared each Fund’s investment performance and expenses with those of other mutual funds deemed comparable to the Fund as selected by Lipper. The Fund profitability analysis discussed the profitability to Franklin Templeton Investments (FTI) from its overall U.S. fund operations, as well as on an individual fund-by-fund basis. Additional material accompanying such profitability analysis included information on a fund-by-fund basis listing portfolio managers and other accounts they manage, as well as information on management fees charged by the Managers and their affiliates to U.S. mutual funds and other accounts, including management’s explanation of differences where relevant. Such material also included a memorandum prepared by management describing project initiatives and capital investments relating to the services provided to the Funds by the FTI organization, as well as a memorandum relating to economies of scale and an analysis concerning transfer agent fees charged by an affiliate of the Managers. The Board also received a report on all marketing support payments made by FTI to financial intermediaries during the past year, as well as a memorandum
relating to third-party servicing arrangements in response to a Guidance Update from the U.S. Securities and Exchange Commission (SEC) relating to mutual fund distribution and sub-accounting fees.
In considering such materials, the independent Trustees received assistance and advice from and met separately with independent counsel. While the investment management agreements and investment sub-advisory agreements, as applicable, for all Funds were considered at the same Board meeting, the Board dealt with each Fund separately. In approving continuance of the investment management agreement and investment sub-advisory agreement, as applicable, for each Fund, the Board, including a majority of independent Trustees, determined that the existing management fee structure was fair and reasonable and that continuance of each investment management agreement and investment sub-advisory agreement, as applicable, was in the best interests of such Fund and its shareholders. While attention was given to all information furnished, the following discusses some primary factors relevant to the Board’s decision.
NATURE, EXTENT AND QUALITY OF SERVICE. The Board was satisfied with the nature and quality of the overall services provided by the Managers and their affiliates to the Funds and their shareholders, except as noted later with respect to investment performance and expenses. The Board’s opinion was based, in part, upon periodic reports furnished it showing that the investment policies and restrictions for each Fund were consistently complied with as well as other reports periodically furnished the Board covering matters such as the compliance of portfolio managers and other management personnel with the code of ethics adopted throughout the Franklin Templeton fund complex, the adherence to fair value pricing procedures established by the Board, and the accuracy of net asset value calculations. Favorable consideration was given to management’s continual efforts and expenditures in establishing effective business continuity plans and developing strategies to address cybersecurity threats. Additionally, the Board noted the Managers’ continued attention to pricing and valuation issues, particularly with respect to complex securities. Among other factors taken into account by the Board was the Managers’ best execution trading policies, including a favorable report by an independent portfolio trading analytical firm that also covered FOREX transactions. Consideration was also given to the experience of each Fund’s portfolio management team, the number of accounts managed and general method of compensation. In this latter respect, the Board noted that a primary factor in management’s determination of a portfolio manager’s bonus
| Semiannual Report | SI-1 |
FRANKLIN TEMPLETON VARIABLE INSURANCE PRODUCTS TRUST
SHAREHOLDER INFORMATION
compensation was the relative investment performance of the funds he or she managed and that a portion of such bonus was required to be invested in a pre-designated list of funds within such person’s fund management area so as to be aligned with the interests of shareholders. The Board also took into account the quality of transfer agent and shareholder services provided Fund shareholders by an affiliate of the Manager and steps taken by FTI to enhance analytical support to the investment management groups and provide additional oversight of liquidity risk and complex securities. The Board also took into account, among other things, management’s efforts in establishing a global credit facility for the benefit of the Funds and other accounts managed by FTI to provide a source of cash for temporary and emergency purposes or to meet unusual redemption requests as well as the strong financial position of the Managers’ parent company and its commitment to the mutual fund business as evidenced by its continued introduction of new funds and reassessment of the fund offerings in response to the market environment.
INVESTMENT PERFORMANCE. The Board placed significant emphasis on the investment performance of each of the Funds in view of its importance to shareholders. While consideration was given to performance reports and discussions with portfolio managers at Board meetings throughout the year, particular attention in assessing performance was given to the Broadridge reports furnished for the agreement renewals of all Funds. The Broadridge reports prepared for each of the individual Funds showed the investment performance of Class 1 shares for those having such class of shares and Class 2 shares for those Funds that did not have Class 1 shares, in comparison to a performance universe selected by Lipper. Comparative performance for each Fund was shown for the one-year period ended January 31, 2016, and previous periods ended that date of up to 10 years unless otherwise noted. Performance was shown on a total return basis for each Fund. In certain cases, income return was indicated as well. The following summarizes the performance results for each of the Funds and the Board’s view of such performance.
Franklin Flex Cap Growth VIP Fund – The performance universe for this Fund consisted of the Fund and all multi-cap growth funds underlying variable insurance products as selected by Lipper. The Broadridge report showed the Fund’s comparative total return for the one-year period to be in the middle performing quintile of its performance universe, and on an annualized basis to be in the middle performing quintile of such universe for the previous three-year period, the lowest performing quintile of such
universe for the previous five-year period, and the second-lowest performing quintile of such universe for the previous 10-year period. The Board discussed with management the impact of measures it had taken to improve the performance of the Fund and found the Fund’s total return for the past year as shown in the Broadridge report to be acceptable, noting that it exceeded the median by 25 basis points.
Franklin Founding Funds Allocation VIP Fund – The performance universe for this Fund consisted of the Fund and all mixed-asset target allocation growth funds underlying variable insurance products as selected by Lipper. The Fund has been in operation less than 10 years. The Broadridge report showed its income return to be in the highest quintile of such Lipper universe for the one-year period, and on an annualized basis to also be in the highest quintile of such universe for each of the previous three- and five-year periods. The Broadridge report showed the Fund’s total return for the one-year period to be in the lowest performing quintile of such performance universe, and on an annualized basis to also be in the lowest performing quintile of such universe for the previous three- and five-year periods. In assessing the relevance of such comparative performance, the Board noted the Fund is not actively managed and that its performance reflects those of the three underlying funds in which it invests in equal portions, which are not perfectly aligned to the investment style of comparative funds. The Board found the Fund’s performance as shown in the Broadridge report to be acceptable in light of the unique investment strategy of the Fund.
Franklin High Income VIP Fund – The performance universe for this Fund consisted of the Fund and all high yield funds underlying variable insurance products as selected by Lipper. The Broadridge report showed the Fund’s income return for the one-year period to be in the second-highest quintile of such performance universe, and on an annualized basis to be in the highest and second-highest quintile of such universe for the previous three- and five-year periods, respectively, and to be in the middle quintile of such universe for the previous 10-year period. The Broadridge report showed the Fund’s total return to be in the lowest performing quintile of its performance universe for the one-year period, and on an annualized basis to be in the lowest performing quintile of such universe for the previous three-year period, and in the second-lowest performing quintile of such universe for the previous five- and 10-year periods. The Board found the Fund’s comparative performance as shown in the Broadridge report to be acceptable given the Fund’s income objective.
| SI-2 | Semiannual Report |
FRANKLIN TEMPLETON VARIABLE INSURANCE PRODUCTS TRUST
SHAREHOLDER INFORMATION
Franklin Income VIP Fund – The performance universe for this Fund consisted of the Fund and all mixed-asset target allocation moderate funds underlying variable insurance products as selected by Lipper. The Broadridge report showed the Fund’s income return to be in the highest quintile of such performance universe for the one-year period and to also be in the highest quintile of such universe for each of the previous three-, five- and 10-year periods on an annualized basis. The Broadridge report showed the Fund’s total return to be in the lowest performing quintile of its performance universe for the one-year period, and on an annualized basis to be in the lowest performing quintile of such universe for the previous three- and five-year periods, and the middle performing quintile of such universe for the previous 10-year period. The Board found the Fund’s comparative performance as shown in the Broadridge report to be acceptable, noting the Fund’s income objective.
Franklin Mutual Global Discovery VIP Fund – The performance universe for this Fund consisted of the Fund and all global multi-cap value funds underlying variable insurance products as selected by Lipper. The Broadridge report showed the Fund’s total return to be in the highest performing quintile of such universe for the one-year period, and on an annualized basis to also be in the highest performing quintile of such universe for the previous three-, five- and 10-year periods. The Board found the Fund’s overall comparative performance as set forth in the Broadridge report to be satisfactory.
Franklin Mutual Shares VIP Fund – The performance universe for this Fund consisted of the Fund and all large-cap value funds underlying variable insurance products as selected by Lipper. The Broadridge report showed the Fund’s total return for the one-year period to be in the second-lowest performing quintile of the performance universe, and on an annualized basis to be in the lowest performing quintile of such universe for the previous three- and five-year periods, and to be in the second-lowest performing quintile for the previous 10-year period. The Board found the Fund’s overall performance as set forth in the Broadridge report to be unacceptable, but acknowledged management’s explanation that the Fund is managed conservatively and the Fund’s cash holdings detract from relative performance in sharply rising markets. The Board indicated it would continue to monitor the Fund.
Franklin Rising Dividends VIP Fund – The performance universe for this Fund consisted of the Fund and all multi-cap core funds underlying variable insurance products as selected by Lipper. The Broadridge report showed the Fund’s comparative
total return to be in the highest performing quintile of the performance universe for the one-year period, and on an annualized basis to be in the middle performing quintile of such universe for the previous three-year period, the second-highest performing quintile of such universe for the previous five-year period, and the highest performing quintile of such universe for the previous 10-year period. The Board found the Fund’s comparative performance as set forth in the Broadridge report to be satisfactory.
Franklin Small Cap Value VIP Fund – The performance universe for this Fund consisted of the Fund and all small-cap value funds underlying variable insurance products as selected by Lipper. The Broadridge report showed the Fund’s total return for the one-year period to be in the highest performing quintile of such performance universe, and on an annualized basis to be in the second-lowest performing quintile of such universe for the previous three-year period, and in the second-highest performing quintile of such universe for each of the previous five- and 10-year periods. The Board found the Fund’s comparative performance as set forth in the Broadridge report to be satisfactory, noting the Fund’s improved performance over the past year.
Franklin Small-Mid Cap Growth VIP Fund – The performance universe for this Fund consisted of the Fund and all mid-cap growth funds underlying variable insurance products as selected by Lipper. The Broadridge report showed the Fund’s total return for the one-year period to be in the second-lowest performing quintile of such universe, and on an annualized basis to be in the middle performing quintile of such universe for the previous three-year period, and the second-lowest performing quintile of such universe for each of the previous five- and 10-year periods. The Board discussed with management its ongoing attention to the Fund. The Board found the Fund’s performance to be acceptable and noted that the three-year annualized total return performance was eight basis points above the median.
Franklin Strategic Income VIP Fund – The performance universe for this Fund consisted of the Fund and all general bond funds underlying variable insurance products as selected by Lipper. The Broadridge report showed the Fund’s income return to be in the highest quintile of such Lipper universe for the one-year period, and on an annualized basis to also be in the highest quintile of such universe during each of the previous three-, five- and 10-year periods. The Broadridge report showed the Fund’s total return to be in the lowest performing quintile of
| Semiannual Report | SI-3 |
FRANKLIN TEMPLETON VARIABLE INSURANCE PRODUCTS TRUST
SHAREHOLDER INFORMATION
such universe during the one-year period, and on an annualized basis to be in the second-lowest performing quintile of such universe for the previous three- and five-year periods, and the second-highest performing quintile of such universe for the previous 10-year period. The Board found the Fund’s performance as shown in the Broadridge report to be acceptable, noting its income orientation.
Templeton Developing Markets VIP Fund – The performance universe for this Fund consisted of the Fund and all emerging markets funds underlying variable insurance products as selected by Lipper. The Broadridge report showed the Fund’s comparative total return for the one-year period to be in the lowest performing quintile of such performance universe, and on an annualized basis to also be in the lowest performing quintile of such universe for the previous three-year period and in the second-lowest performing quintile of such universe for each of the previous five- and 10-year periods. The Board found the performance of the Fund as set forth in the Broadridge report to be unacceptable and discussed with management measures it was implementing to address the performance, including a more rigorous selling discipline. The Board concluded that continued monitoring is warranted in light of the Fund’s underperformance, but did not believe a portfolio management change was needed at this time given management’s attention to the Fund.
Templeton Foreign VIP Fund – The performance universe for this Fund consisted of the Fund and all international large-cap value funds underlying variable insurance products as selected by Lipper. The Broadridge report showed the Fund’s comparative total return for the one-year period to be in the lowest performing quintile of such performance universe and on an annualized basis to be in the lowest performing quintile of such universe for the previous three-year period, in the second-lowest performing quintile of such universe for the previous five-year period, and in the second-highest performing quintile of such universe for the previous 10-year period. The Board found the Fund’s comparative investment performance as set forth in the Broadridge report to be acceptable, noting that performance was in the highest or second-highest quintile in seven of the previous eight years.
Templeton Global Bond VIP Fund – The performance universe for this Fund consisted of the Fund and all global income funds underlying variable insurance products as selected by Lipper. The Broadridge report showed the Fund’s income return for the one-year period to be in the highest quintile of such Lipper universe, and on an annualized basis to also be in the
highest quintile of such universe for the previous three-, five- and 10-year periods. The Broadridge report showed the Fund’s total return for the one-year period to be in the second-lowest performing quintile of its performance universe, and on an annualized basis to be in the highest performing quintile of such universe for each of the previous three-, five- and 10-year annualized periods. The Board was satisfied with the Fund’s comparative performance as set forth in the Broadridge report.
Templeton Growth VIP Fund – The performance universe for this Fund consisted of the Fund and all global large-cap value funds underlying variable insurance products as selected by Lipper. The Broadridge report showed the Fund’s total return for the one-year period to be in the second-lowest performing quintile of such performance universe, and on an annualized basis to also be in the second-lowest performing quintile of such universe for each of the previous three- and five-year periods. (Although the Fund has been in operation for 10 years, Lipper comparative data is not available for this longer period.) The Board found the Fund’s comparative performance as set forth in the Broadridge report to be acceptable, noting that the Fund’s performance had been in the highest or second-highest quintile in three of the previous five one-year periods. They also observed that the Fund’s annualized performance was within 1% of the median for the five- year period and at the median for the 10-year period.
COMPARATIVE EXPENSES. Consideration was given to information contained in the Broadridge reports furnished for each Fund, which compared its management fee and total expense ratio with those of a group of other funds selected by Lipper as its appropriate Lipper expense group. Lipper expense data is based upon information taken from each fund’s most recent annual report, which reflects historical asset levels that may be quite different from those currently existing, particularly in a period of market volatility. While recognizing such inherent limitation and the fact that expense ratios generally increase as assets decline and decrease as assets grow, the Board believed the independent analysis conducted by Lipper to be an appropriate measure of comparative expenses. In reviewing comparative costs, Lipper provides information on the Funds’ contractual investment management fee rate in comparison with the contractual investment management fee rate that would have been charged by other funds within its Lipper expense group assuming they were similar in size to the Fund, as well as the actual total expense ratio of the Fund in comparison with those of its Lipper expense group. The Lipper contractual investment management fee analysis includes administrative charges at the
| SI-4 | Semiannual Report |
FRANKLIN TEMPLETON VARIABLE INSURANCE PRODUCTS TRUST
SHAREHOLDER INFORMATION
fund level as being part of a management fee, and actual total expenses, for comparative consistency, are shown by Lipper for the same class of shares for all funds within a particular Lipper expense group.
The results of such comparisons showed that both the contractual investment management fee rates and actual total expense ratios of the following Funds were in the least expensive quintiles of their respective Lipper expense groups: Franklin Small Cap Value VIP Fund, Franklin High Income VIP Fund, Franklin Income VIP Fund and Templeton Global Bond VIP Fund. The Board was satisfied with the comparative contractual investment management fees and expenses of these Funds as shown in their Broadridge reports.
The contractual investment management fee rates and actual total expense ratios of each of Franklin Mutual Global Discovery VIP Fund and Templeton Developing Markets VIP Fund were above the medians of their Lipper expense groups. In the case of contractual management fees, Franklin Mutual Global Discovery VIP Fund exceeds the median by 23.6 basis points, while the other Funds exceed the median by less than 16 basis points. The Board found the comparative contractual investment management fees and expenses of these Funds as shown in their Broadridge reports to be acceptable.
The contractual investment management fee rates of the following Funds were above the median of their Lipper expense groups, while the actual total expense ratios were at the median: Franklin Flex Cap Growth VIP Fund, Franklin Small-Mid Cap Growth VIP Fund and Templeton Growth VIP Fund. The Board found the comparative expenses of these Funds as shown in the Broadridge reports to be acceptable, noting that a fee waiver was in place for Franklin Flex Cap Growth VIP Fund.
The contractual investment management fee rates of the following Funds were at or above the median of their Lipper expense groups, while the actual total expense ratios were at or below the median: Franklin Founding Funds Allocation VIP Fund and Franklin Mutual Shares VIP Fund. The Board found the comparative expenses of these Funds as shown in their Broadridge reports to be acceptable, noting that a fee waiver was in place for Franklin Founding Funds Allocation VIP Fund.
The contractual investment management fee rate and actual total expense ratio for Franklin Rising Dividends VIP Fund were both below the median of its Lipper expense group. The Board found the comparative expenses of Franklin Rising Dividends VIP Fund as shown in the Broadridge reports to be acceptable.
The contractual investment management fee rates and actual total expense ratios for the following Funds were in the first or second quintiles of their expense groups, meaning they were among the least expensive of their peers: Franklin Strategic Income VIP Fund and Templeton Foreign VIP Fund. The Board was satisfied with the comparative expenses of these Funds as shown in their Broadridge reports.
MANAGEMENT PROFITABILITY. The Board also considered the level of profits realized by the Managers and their affiliates in connection with the operation of each Fund. In this respect, the Board reviewed the Fund profitability analysis that addresses the overall profitability of Franklin Templeton’s U.S. fund business, as well as its profits in providing management and other services to each of the individual funds during the 12-month period ended September 30, 2015, being the most recent fiscal year-end for Franklin Resources, Inc., the Managers’ parent. In reviewing the analysis, the Board recognized that allocation methodologies are inherently subjective and various allocation methodologies may be reasonable while producing different results. In this respect, the Board noted that while management continually makes refinements to its methodologies in response to organizational and product related changes, the overall approach as defined by the primary drivers and activity measurements has remained consistent with that used in the Funds’ profitability report presentations from prior years. Additionally, the Funds’ independent registered public accounting firm had been engaged by the Manager to periodically review the reasonableness of the allocation methodologies to be used solely by the Funds’ Board in reference to the profitability analysis. In reviewing and discussing such analysis, management discussed with the Board its belief that costs incurred in establishing the infrastructure necessary for the type of mutual fund operations conducted by the Managers and their affiliates may not be fully reflected in the expenses allocated to each Fund in determining its profitability, as well as the fact that the level of profits, to a certain extent, reflected operational cost savings and efficiencies initiated by management. The Board also took into account management’s expenditures in improving services provided the Funds, as well as the need to implement systems to meet additional regulatory and compliance requirements resulting from statutes such as the Sarbanes-Oxley and Dodd-Frank Acts and recent SEC and other regulatory requirements. In addition, the Board considered a third-party study comparing the profitability of the Managers’ parent on an overall basis to other publicly held managers broken down to show profitability from management operations exclusive of distribution expenses, as well as profitability including distribution
| Semiannual Report | SI-5 |
FRANKLIN TEMPLETON VARIABLE INSURANCE PRODUCTS TRUST
SHAREHOLDER INFORMATION
expenses. The Board also considered the extent to which the Managers and their affiliates might derive ancillary benefits from Fund operations, including potential benefits resulting from personnel and systems enhancements necessitated by fund growth, increased leverage with the service providers and counterparties, allocation of fund brokerage and the use of commission dollars to pay for research. Based upon its consideration of all these factors, the Board determined that the level of profits realized by the Managers and their affiliates from providing services to each Fund was not excessive in view of the nature, quality and extent of services provided.
ECONOMIES OF SCALE. The Board also considered whether economies of scale are realized by the Manager as the Funds grow larger and the extent to which this is reflected in the level of management fees charged. While recognizing that any precise determination is inherently subjective, the Board noted that based upon the Fund profitability analysis, it appears that as some funds get larger, at some point economies of scale do result in a Manager realizing a larger profit margin on management services provided such a fund. The Board also noted that economies of scale are shared with a fund and its shareholders through management fee breakpoints so that as a fund grows in size, its effective management fee rate declines. In the case of Franklin Founding Funds Allocation VIP Fund, the management fees of the underlying funds in which it invests have management fee breakpoints that extend beyond their existing asset sizes, and in the case of each of the other Funds, other than Franklin Rising Dividends VIP Fund, their management fees contain breakpoints that extend beyond their existing asset sizes. To the extent economies of scale may be realized by the Managers and their affiliates, the Board believed the schedule of investment management fees provides a sharing of benefits for each Fund and its shareholders. The investment management structure of the Franklin Rising Dividends VIP Fund provides for a fee of 0.750% on the first $500 million of net assets; 0.625% on the next $500 million of net assets; and 0.500% on assets in excess of $1 billion. This Fund had assets of approximately $1.5 billion at December 31, 2015, and in reviewing its fee structure, management stated its belief that this fee structure reaches a relatively low rate quickly, reflecting anticipated economies of scale. In support of such position, management pointed out the favorable management fee and total expense comparisons of this Fund within its Lipper expense group as previously discussed under “Comparative Expenses.” In light of such position and taking into account the fact that the reduced rate on assets in excess of the last breakpoint lowers the Fund’s overall investment management fee rate, the Board believed that
the schedule of investment management fees provides a sharing of benefits for the Fund and its shareholders, but intends to monitor future growth and the appropriateness of adding additional breakpoints.
Proxy Voting Policies and Procedures
The Trust’s investment manager has established Proxy Voting Policies and Procedures (Policies) that the Trust uses to determine how to vote proxies relating to portfolio securities. Shareholders may view the Trust’s complete Policies online at franklintempleton.com. Alternatively, shareholders may request copies of the Policies free of charge by calling the Proxy Group collect at (954) 527-7678 or by sending a written request to: Franklin Templeton Companies, LLC, 300 S.E. 2nd Street, Fort Lauderdale, FL 33301, Attention: Proxy Group. Copies of the Trust’s proxy voting records are also made available online at franklintempleton.com and posted on the U.S. Securities and Exchange Commission’s website at sec.gov and reflect the most recent 12-month period ended June 30.
Quarterly Statement of Investments
The Trust files a complete statement of investments with the U.S. Securities and Exchange Commission for the first and third quarters for each fiscal year on Form N-Q. Shareholders may view the filed Form N-Q by visiting the Commission’s website at sec.gov. The filed form may also be viewed and copied at the Commission’s Public Reference Room in Washington, DC. Information regarding the operations of the Public Reference Room may be obtained by calling (800) SEC-0330.
| SI-6 | Semiannual Report |

Semiannual Report
Franklin Templeton
Variable Insurance Products Trust
Investment Managers
Franklin Advisers, Inc.
Franklin Advisory Services, LLC
Franklin Mutual Advisers, LLC
Templeton Asset Management Ltd.
Templeton Global Advisors Limited
Templeton Investment Counsel, LLC
Fund Administrator
Franklin Templeton Services, LLC
Distributor
Franklin Templeton Distributors, Inc.
Franklin Templeton Variable Insurance Products Trust (FTVIP) shares are not offered to the public; they are offered and sold only to:
(1) insurance company separate accounts (Separate Account) to serve as the underlying investment vehicle for variable contracts;
(2) certain qualified plans; and (3) other mutual funds (funds of funds).
Authorized for distribution to investors in Separate Accounts only when accompanied or preceded by the current prospectus for the applicable contract, which includes the Separate Account and the FTVIP prospectuses. Investors should carefully consider a fund’s investment goals, risks, charges and expenses before investing. The prospectus contains this and other information; please read it carefully before investing.
To help ensure we provide you with quality service, all calls to and from our service areas are monitored and/or recorded.
| ©2016 Franklin Templeton Investments. All rights reserved. | VIP4 S 08/16 |
| Item 2. | Code of Ethics. |
| (a) | The Registrant has adopted a code of ethics that applies to its principal executive officers and principal financial and accounting officer. |
| (c) | N/A |
| (d) | N/A |
| (f) | Pursuant to Item 12(a)(1), the Registrant is attaching as an exhibit a copy of its code of ethics that applies to its principal executive officers and principal financial and accounting officer. |
| Item 3. | Audit Committee Financial Expert. |
| (a)(1) | The Registrant has an audit committee financial expert serving on its audit committee. | |
| (2) | The audit committee financial expert is John B. Wilson and he is “independent” as defined under the relevant Securities and Exchange Commission Rules and Releases. |
| Item 4. | Principal Accountant Fees and Services. N/A |
| Item 5. | Audit Committee of Listed Registrants. N/A |
| Item 6. | Schedule of Investments. N/A |
| Item 7. | Disclosure of Proxy Voting Policies and Procedures for Closed-End Management Investment Companies. N/A |
| Item 8. | Portfolio Managers of Closed-End Management Investment Companies. N/A |
| Item 9. | Purchases of Equity Securities by Closed-End Management Investment Company and Affiliated Purchasers. N/A |
| Item 10. | Submission of Matters to a Vote of Security Holders. |
There have been no changes to the procedures by which shareholders may recommend nominees to the Registrant’s Board of Trustees that would require disclosure herein.
| Item 11. | Controls and Procedures. |
(a) Evaluation of Disclosure Controls and Procedures. The Registrant maintains disclosure controls and procedures that are designed to ensure that information required to be disclosed in the Registrant’s filings under the Securities Exchange Act of 1934 and the Investment Company Act of 1940 is recorded, processed, summarized and reported within the periods specified in the rules and forms of the Securities and Exchange Commission. Such information is accumulated and communicated to the Registrant’s management, including its principal executive officer and principal financial officer, as appropriate, to allow timely decisions regarding required disclosure. The Registrant’s management, including the principal executive officer and the principal financial officer, recognizes that any set of controls and procedures, no matter how well designed and operated, can provide only reasonable assurance of achieving the desired control objectives.
Within 90 days prior to the filing date of this Shareholder Report on Form N-CSR, the Registrant had carried out an evaluation, under the supervision and with the participation of the Registrant’s management, including the Registrant’s principal executive officer and the Registrant’s principal financial officer, of the effectiveness of the design and operation of the Registrant’s disclosure controls and procedures. Based on such evaluation, the Registrant’s principal executive officer and principal financial officer concluded that the Registrant’s disclosure controls and procedures are effective.
(b) Changes in Internal Controls. There have been no changes in the Registrant’s internal controls or in other factors that could materially affect the internal controls over financial reporting subsequent to the date of their evaluation in connection with the preparation of this Shareholder Report on Form N-CSR.
| Item 12. | Exhibits. |
(a)(1) Code of Ethics
(a)(2) Certifications pursuant to Section 302 of the Sarbanes-Oxley Act of 2002 of Laura F. Fergerson, Chief Executive Officer – Finance and Administration, and Gaston Gardey, Chief Financial Officer and Chief Accounting Officer
(b) Certifications pursuant to Section 906 of the Sarbanes-Oxley Act of 2002 of Laura F. Fergerson, Chief Executive Officer – Finance and Administration, and Gaston Gardey, Chief Financial Officer and Chief Accounting Officer
SIGNATURES
Pursuant to the requirements of the Securities Exchange Act of 1934 and the Investment Company Act of 1940, the registrant has duly caused this report to be signed on its behalf by the undersigned, thereunto duly authorized.
Franklin Templeton Variable Insurance Products Trust
| By | /s/ LAURA F. FERGERSON | |
| Laura F. Fergerson | ||
Chief Executive Officer – Finance and Administration |
Date August 25, 2016
Pursuant to the requirements of the Securities Exchange Act of 1934 and the Investment Company Act of 1940, this report has been signed below by the following persons on behalf of the registrant and in the capacities and on the dates indicated.
| By | /s/ LAURA F. FERGERSON | |
| Laura F. Fergerson | ||
Chief Executive Officer – Finance and Administration |
Date August 25, 2016
| By | /s/ GASTON GARDEY | |
| Gaston Gardey | ||
Chief Financial Officer and Chief Accounting Officer |
Date August 25, 2016