UNITED STATES
SECURITIES AND EXCHANGE COMMISSION
Washington, DC 20549
FORM N-CSRS
CERTIFIED SHAREHOLDER REPORT OF REGISTERED MANAGEMENT INVESTMENT
COMPANIES
Investment Company Act file number 811-05583
Franklin Templeton Variable Insurance Products Trust
(Exact name of registrant as specified in charter)
One Franklin Parkway, San Mateo, CA 94403-1906
(Address of principal executive offices) (Zip code)
Craig S. Tyle, One Franklin Parkway, San Mateo, CA 94403-1906
(Name and address of agent for service)
Registrant’s telephone number, including area code: (650) 312-2000
Date of fiscal year end: 12/31
Date of reporting period: 06/30/17
| Item 1. | Reports to Stockholders. |
 | Semiannual Report June 30, 2017 |
Franklin Templeton
Variable Insurance Products Trust

Franklin Templeton Variable Insurance
Products Trust Semiannual Report
| Table of Contents | ||||
| Important Notes to Performance Information | i | |||
| Fund Summaries | ||||
| FFA-1 | ||||
| FGR-1 | ||||
| FGI-1 | ||||
| FI-1 | ||||
| FI-7 | ||||
| FLG-1 | ||||
| MGD-1 | ||||
| MS-1 | ||||
| FRD-1 | ||||
| FRD-6 | ||||
| FSV-1 | ||||
| FSV-7 | ||||
| FSC-1 | ||||
| FSI-1 | ||||
| FUS-1 | ||||
| TD-1 | ||||
| TF-1 | ||||
| TF-7 | ||||
| TGB-1 | ||||
| TG-1 | ||||
| Index Descriptions | I-1 | |||
| Shareholder Information | SI-1 | |||
*Not part of the semiannual report. Retain for your records.
| Not FDIC Insured | | | May Lose Value | | | No Bank Guarantee |
MASTER CLASS – 1
FRANKLIN TEMPLETON VARIABLE INSURANCE PRODUCTS TRUST
Performance Information
Performance data is historical and cannot predict or guarantee future results. Principal value and investment return will fluctuate with market conditions, and you may have a gain or loss when you withdraw your money. Inception dates of the funds may have preceded the effective dates of the subaccounts, contracts or their availability in all states.
When reviewing the index comparisons, please keep in mind that indexes have a number of inherent performance differentials over the funds. First, unlike the funds, which must hold a minimum amount of cash to maintain liquidity, indexes do not
have a cash component. Second, the funds are actively managed and, thus, are subject to management fees to cover salaries of securities analysts or portfolio managers in addition to other expenses. Indexes are unmanaged and do not include any commissions or other expenses typically associated with investing in securities. Third, indexes often contain a different mix of securities than the fund to which they are compared. Additionally, please remember that indexes are simply a measure of performance and cannot be invested in directly.
| i | Semiannual Report |
Franklin Founding Funds Allocation VIP Fund
This semiannual report for Franklin Founding Funds Allocation VIP Fund covers the period ended June 30, 2017.
Class 1 Performance Summary as of June 30, 2017
The Fund’s Class 1 Shares delivered a +6.74% total return* for the six-month period ended June 30, 2017.
*The Fund has an expense reduction contractually guaranteed through 4/30/18. Fund investment results reflect the expense reduction; without this reduction, the results would have been lower.
Performance reflects the Fund’s Class 1 operating expenses, but does not include any contract fees, expenses or sales charges. If they had been included, performance would be lower. These charges and deductions, particularly for variable life policies, can have a significant effect on contract values and insurance benefits. See the contract prospectus for a complete description of these expenses, including sales charges.
Performance data represent past performance, which does not guarantee future results. Investment return and principal value will fluctuate, and you may have a gain or loss when you sell your shares. Current performance may differ from figures shown.
| Semiannual Report | FFA-1 |
FRANKLIN FOUNDING FUNDS ALLOCATION VIP FUND
Fund Goal and Main Investments
The Fund seeks capital appreciation, with income as a secondary goal. Under normal market conditions, the Fund invests equal portions in Class 1 shares of Franklin Income VIP Fund, Franklin Mutual Shares VIP Fund and Templeton Growth VIP Fund.
Fund Risks
All investments involve risks, including possible loss of principal. Because the Fund invests in underlying funds that may engage in a variety of investment strategies involving certain risks, the Fund may be subject to these same risks. Stock prices fluctuate, sometimes rapidly and dramatically, due to factors affecting individual companies, particular industries or sectors, or general market conditions. Bonds are affected by changes in interest rates and the creditworthiness of their issuers. Bond prices generally move in the opposite direction of interest rates. Thus, as prices of bonds adjust to a rise in interest rates, the Fund’s share price may decline. Higher yielding, lower rated corporate bonds entail a greater degree of credit risk compared to investment-grade securities. Foreign investing carries additional risks such as currency and market volatility and political or social instability, risks that are heightened in developing countries. Value securities may not increase in price as anticipated or may decline further in value. The Fund’s prospectus also includes a description of the main investment risks.
Performance Overview
You can find the Fund’s six-month total return in the Performance Summary. In comparison, the Standard & Poor’s® 500 Index (S&P 500®) generated a +9.34% total return and the MSCI World Index produced a +11.02% total return for the same period.1
Economic and Market Overview
The global economy generally expanded during the period under review. In this environment, global developed and emerging market stocks rose, as measured by the MSCI All Country World Index. Global markets were aided by improved industrial commodity prices at certain points during the period, generally upbeat economic data across regions, investor optimism about pro-growth and pro-business policies in the
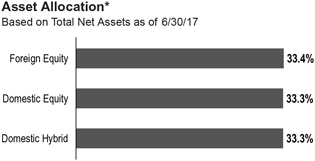
*The asset allocation is based on the Statement of Investments (SOI), which classifies each underlying fund into a broad asset class.
U.S, hopes of tax reforms under the Trump administration, Emmanuel Macron’s election as France’s president and encouraging corporate earnings reports.
However, investors expressed concerns about the timing and economic effects of the U.K.’s exit from the European Union (also known as “Brexit”) and the U.S. executive order banning entry from some Muslim-majority countries. Other headwinds included the health of European banks, concerns about political uncertainty in the U.S. and European Union, geopolitical tensions in certain regions, worries about global oversupply in oil production despite a pact to extend cuts, and hawkish comments from key central bankers around the world toward period-end.
U.S. economic growth decelerated in 2017’s first quarter, largely due to slower growth in consumer spending and declines in private inventory investment and government spending. However, growth accelerated in the second quarter due to increases in consumer spending, business investment and federal government spending. The unemployment rate decreased from 4.7% in December 2016 to 4.4% at period-end.2 Annual inflation, as measured by the Consumer Price Index, decreased from 2.1% to 1.6% during the period. After increasing its benchmark interest rate in March, the U.S. Federal Reserve (Fed), at its June meeting, made the widely anticipated increase to its target range for the federal funds rate from 0.75%–1.00% to 1.00%–1.25%, amid signs of a growing U.S. economy, a strengthening labor market and an improvement in business spending.
In Europe, the U.K.’s economy grew at a slower rate in 2017’s first quarter over the previous quarter, largely due to slower
1. Source: Morningstar.
One cannot invest directly in an index, and an index is not representative of the Fund’s portfolio. Please see Index Descriptions following the Fund Summaries.
2. Source: Bureau of Labor Statistics.
The dollar value, number of shares or principal amount, and names of all portfolio holdings are listed in the Fund’s Statement of Investments (SOI).
| FFA-2 | Semiannual Report |
FRANKLIN FOUNDING FUNDS ALLOCATION VIP FUND
growth in household spending. The eurozone’s growth increased in the first quarter over the previous quarter. The bloc’s annual inflation rate fluctuated during the reporting period and ended slightly higher from where it began. During the period, the European Central Bank kept its key policy rates unchanged.
In Asia, Japan’s quarterly gross domestic product (GDP) remained unchanged in 2017’s first quarter compared to 2016’s fourth quarter. In April 2017, the Bank of Japan (BOJ) slightly increased its GDP forecasts for the 2017–2018 fiscal year. However, the BOJ lowered its inflation forecast.
In emerging markets, Brazil’s quarterly GDP grew for the first time in two years, as its first-quarter 2017 GDP grew compared to the previous quarter. The country’s central bank cut its benchmark interest rate four times between January and June 2017 to spur economic growth. Russia’s GDP grew in 2017’s first quarter compared to the prior-year period. The Bank of Russia reduced its key interest rate in March, April and June 2017 to try to revive its economy. China’s economy grew faster in the first half of 2017 compared to the first half of 2016, driven by solid growth in industrial production, services, fixed-asset investment, retail sales, and imports and exports. The People’s Bank of China left its benchmark interest rate unchanged during the period. Overall, emerging market stocks, as measured by the MSCI Emerging Markets Index, rose during the period.
Investment Strategy
The Fund normally invests its assets in an equally weighted combination of Class 1 shares of Franklin Income VIP Fund, Franklin Mutual Shares VIP Fund and Templeton Growth VIP Fund. These underlying funds, in turn, invest in a variety of U.S. and foreign equity securities and, to a lesser extent, fixed
income and money market securities. As market conditions affect the underlying funds, we rebalance the Fund’s allocations seeking to maintain equal weightings of approximately 33 1⁄3% of total net assets in each underlying fund whenever the actual allocations exceed plus or minus 3% of the fixed allocation percentages.
Manager’s Discussion
The Fund’s performance can be attributed largely to its allocation among the underlying funds and their investments in domestic and foreign equities, fixed income securities, and short-term investments and other net assets.
During the six months under review, Franklin Income VIP Fund – Class 1 and Franklin Mutual Shares VIP Fund – Class 1 underperformed the S&P 500. Templeton Growth VIP Fund – Class 1 performed in line with the MSCI World Index.
Thank you for your participation in Franklin Founding Funds Allocation VIP Fund. We look forward to serving your future investment needs.
The foregoing information reflects our analysis, opinions and portfolio holdings as of June 30, 2017, the end of the reporting period. The way we implement our main investment strategies and the resulting portfolio holdings may change depending on factors such as market and economic conditions. These opinions may not be relied upon as investment advice or an offer for a particular security. The information is not a complete analysis of every aspect of any market, country, industry, security or the Fund. Statements of fact are from sources considered reliable, but the investment manager makes no representation or warranty as to their completeness or accuracy. Although historical performance is no guarantee of future results, these insights may help you understand our investment management philosophy.
| Semiannual Report | FFA-3 |
FRANKLIN FOUNDING FUNDS ALLOCATION VIP FUND
Class 1 Fund Expenses
As an investor in a variable insurance contract (Contract) that indirectly provides for investment in an underlying mutual fund, you can incur transaction and/or ongoing expenses at both the Fund level and the Contract Level: (1) transaction expenses can include sales charges (loads) on purchases, surrender fees, transfer fees and premium taxes; and (2) ongoing expenses can include management fees, distribution and service (12b-1) fees, contract fees, annual maintenance fees, mortality and expense risk fees and other fees and expenses. All mutual funds and Contracts have some types of ongoing expenses. The table below shows Fund-level ongoing expenses and can help you understand these costs and compare them with those of other mutual funds offered through the Contract. The table assumes a $1,000 investment held for the six months indicated. Please refer to the Fund prospectus for additional information on operating expenses.
Actual Fund Expenses
The table below provides information about the actual account values and actual expenses in the columns under the heading “Actual.” In these columns the Fund’s actual return, which includes the effect of ongoing Fund expenses but does not include the effect of ongoing Contract expenses, is used to calculate the “Ending Account Value.” You can estimate the Fund-level expenses you paid during the period by following these steps (of course, your account value and expenses will differ from those in this illustration): Divide your account value by $1,000 (if your account had an $8,600 value, then $8,600 ÷ $1,000 = 8.6). Then multiply the result by the number under the headings “Actual” and “Fund-Level Expenses Paid During Period” (if Fund-Level Expenses Paid During Period were $ 7.50, then 8.6 × $7.50 = $64.50). In this illustration, the estimated expenses paid this period at the Fund level are $64.50.
Hypothetical Example for Comparison with Other Mutual Funds
Under the heading “Hypothetical” in the table, information is provided about hypothetical account values and hypothetical expenses based on the Fund’s actual expense ratio and an assumed rate of return of 5% per year before expenses, which is not the Fund’s actual return. This information may not be used to estimate the actual ending account balance or expenses you paid for the period, but it can help you compare ongoing costs of investing in the Fund with those of other mutual funds offered through the Contract. To do so, compare this 5% hypothetical example with the 5% hypothetical examples that appear in the shareholder reports of other funds offered through the Contract.
Please note that expenses shown in the table are meant to highlight ongoing costs at the Fund level only and do not reflect any ongoing expenses at the Contract level, or transaction expenses at either the Fund or Contract levels. In addition, while the Fund does not have transaction expenses, if the transaction and ongoing expenses at the Contract level were included, the expenses shown below would be higher. You should consult your Contract prospectus or disclosure document for more information.
| Actual (actual return after expenses) | Hypothetical (5% annual return before expenses) | |||||||||||||||||||||||
| Share Class | | Beginning Account Value 1/1/17 | | | Ending Account Value 6/30/17 | | | Fund-Level Expenses Paid During Period 1/1/17–6/30/17 |
1,2 | | Ending Account Value 6/30/17 | | | Fund-Level Expenses Paid During Period 1/1/17–6/30/17 |
1,2 | | Net Annualized Expense Ratio | 2 | ||||||
Class 1 | $1,000 | $1,067.40 | $0.51 | $1,024.30 | $0.50 | 0.10% | ||||||||||||||||||
1. Expenses are equal to the annualized expense ratio for the six-month period as indicated above — in the far right column — multiplied by the simple average account value over the period indicated, and then multiplied by 181/365 to reflect the one-half year period.
2. Reflects expenses after fee waivers and expense reimbursements. Does not include any ongoing expenses of the Contract for which the Fund is an investment option or acquired fund fees and expenses.
| FFA-4 | Semiannual Report |
FRANKLIN TEMPLETON VARIABLE INSURANCE PRODUCTS TRUST
Financial Highlights
Franklin Founding Funds Allocation VIP Fund
| Six Months Ended June 30, 2017 | Year Ended December 31, | |||||||||||||||||||||||
| (unaudited) | 2016 | 2015 | 2014 | 2013 | 2012 | |||||||||||||||||||
| Class 1 | ||||||||||||||||||||||||
Per share operating performance (for a share outstanding throughout the period) | ||||||||||||||||||||||||
Net asset value, beginning of period | $7.13 | $6.80 | $7.47 | $7.47 | $8.55 | $7.63 | ||||||||||||||||||
|
| |||||||||||||||||||||||
| Income from investment operationsa: | ||||||||||||||||||||||||
Net investment incomeb,c | 0.15 | 0.21 | 0.26 | 0.22 | 0.30 | 0.26 | ||||||||||||||||||
Net realized and unrealized gains (losses) | 0.33 | 0.64 | (0.68 | ) | 0.02 | 1.42 | 0.90 | |||||||||||||||||
|
| |||||||||||||||||||||||
Total from investment operations | 0.48 | 0.85 | (0.42 | ) | 0.24 | 1.72 | 1.16 | |||||||||||||||||
|
| |||||||||||||||||||||||
| Less distributions from: | ||||||||||||||||||||||||
Net investment income | (0.22 | ) | (0.29 | ) | (0.24 | ) | (0.23 | ) | (1.15 | ) | (0.24 | ) | ||||||||||||
Net realized gains | (0.31 | ) | (0.23 | ) | (0.01 | ) | (0.01 | ) | (1.65 | ) | — | |||||||||||||
|
| |||||||||||||||||||||||
Total distributions | (0.53 | ) | (0.52 | ) | (0.25 | ) | (0.24 | ) | (2.80 | ) | (0.24 | ) | ||||||||||||
|
| |||||||||||||||||||||||
Net asset value, end of period | $7.08 | $7.13 | $6.80 | $7.47 | $7.47 | $8.55 | ||||||||||||||||||
|
| |||||||||||||||||||||||
Total returnd | 6.74% | 13.43% | (5.93)% | 3.05% | 24.14% | 15.56% | ||||||||||||||||||
| Ratios to average net assetse | ||||||||||||||||||||||||
Expenses before waiver and payments by affiliatesf | 0.11% | 0.11% | 0.11% | 0.11% | 0.11% | 0.11% | ||||||||||||||||||
Expenses net of waiver and payments by affiliatesf | 0.10% | 0.10% | 0.10% | 0.10% | 0.10% | 0.10% | ||||||||||||||||||
Net investment incomec | 3.98% | 3.09% | 3.51% | 2.88% | 3.67% | 4.06% | ||||||||||||||||||
| Supplemental data | ||||||||||||||||||||||||
Net assets, end of period (000’s) | $1,044 | $1,025 | $1,083 | $1,114 | $952 | $767 | ||||||||||||||||||
Portfolio turnover rate | 0.95% | 0.10% | 0.26% | 4.80% | 3.91% | 28.46% | g | |||||||||||||||||
aThe amount shown for a share outstanding throughout the period may not correlate with the Statement of Operations for the period due to the timing of sales and repurchases of the Fund’s shares in relation to income earned and/or fluctuating fair value of the investments of the Fund.
bBased on average daily shares outstanding.
cRecognition of net investment income by the Fund is affected by the timing of declaration of dividends by the Underlying Funds in which the Fund invests.
dTotal return does not include fees, charges or expenses imposed by the variable annuity and life insurance contracts for which Franklin Templeton Variable Insurance Products Trust serves as an underlying investment vehicle. Total return is not annualized for periods less than one year.
eRatios are annualized for periods less than one year.
fDoes not include expenses of the Underlying Funds in which the Fund invests. The weighted average indirect expenses of the Underlying Funds was 0.66% for the period ended June 30, 2017.
gExcludes the value of portfolio securities delivered as a result of a redemption in-kind.
| The accompanying notes are an integral part of these financial statements. | Semiannual Report | FFA-5 |
FRANKLIN TEMPLETON VARIABLE INSURANCE PRODUCTS TRUST
FINANCIAL HIGHLIGHTS
Franklin Founding Funds Allocation VIP Fund (continued)
| Six Months Ended June 30, 2017 (unaudited) | Year Ended December 31, | |||||||||||||||||||||||
| 2016 | 2015 | 2014 | 2013 | 2012 | ||||||||||||||||||||
| Class 2 | ||||||||||||||||||||||||
Per share operating performance (for a share outstanding throughout the period) | ||||||||||||||||||||||||
Net asset value, beginning of period | $7.08 | $6.75 | $7.42 | $7.42 | $8.51 | $7.59 | ||||||||||||||||||
|
| |||||||||||||||||||||||
| Income from investment operationsa: | ||||||||||||||||||||||||
Net investment incomeb,c | 0.14 | 0.19 | 0.24 | 0.20 | 0.27 | 0.25 | ||||||||||||||||||
Net realized and unrealized gains (losses) | 0.33 | 0.64 | (0.68 | ) | 0.02 | 1.42 | 0.89 | |||||||||||||||||
|
| |||||||||||||||||||||||
| Total from investment operations | 0.47 | 0.83 | (0.44 | ) | 0.22 | 1.69 | 1.14 | |||||||||||||||||
|
| |||||||||||||||||||||||
| Less distributions from: | ||||||||||||||||||||||||
Net investment income | (0.20 | ) | (0.27 | ) | (0.22 | ) | (0.21 | ) | (1.13 | ) | (0.22 | ) | ||||||||||||
Net realized gains | (0.31 | ) | (0.23 | ) | (0.01 | ) | (0.01 | ) | (1.65 | ) | — | |||||||||||||
|
| |||||||||||||||||||||||
| Total distributions | (0.51 | ) | (0.50 | ) | (0.23 | ) | (0.22 | ) | (2.78 | ) | (0.22 | ) | ||||||||||||
|
| |||||||||||||||||||||||
| Net asset value, end of period | $7.04 | $7.08 | $6.75 | $7.42 | $7.42 | $8.51 | ||||||||||||||||||
|
| |||||||||||||||||||||||
Total returnd | 6.67% | 13.18% | (6.21)% | 2.85% | 23.77% | 15.33% | ||||||||||||||||||
| Ratios to average net assetse | ||||||||||||||||||||||||
Expenses before waiver and payments by affiliatesf | 0.36% | 0.36% | 0.36% | 0.36% | 0.36% | 0.36% | ||||||||||||||||||
Expenses net of waiver and payments by affiliatesf | 0.35% | 0.35% | 0.35% | 0.35% | 0.35% | 0.35% | ||||||||||||||||||
Net investment incomec | 3.73% | 2.84% | 3.26% | 2.63% | 3.42% | 3.81% | ||||||||||||||||||
| Supplemental data | ||||||||||||||||||||||||
Net assets, end of period (000’s) | $484,342 | $474,669 | $480,715 | $557,704 | $547,506 | $472,686 | ||||||||||||||||||
Portfolio turnover rate | 0.95% | 0.10% | 0.26% | 4.80% | 3.91% | 28.46% | g | |||||||||||||||||
aThe amount shown for a share outstanding throughout the period may not correlate with the Statement of Operations for the period due to the timing of sales and repurchases of the Fund’s shares in relation to income earned and/or fluctuating fair value of the investments of the Fund.
bBased on average daily shares outstanding.
cRecognition of net investment income by the Fund is affected by the timing of declaration of dividends by the Underlying Funds in which the Fund invests.
dTotal return does not include fees, charges or expenses imposed by the variable annuity and life insurance contracts for which Franklin Templeton Variable Insurance Products Trust serves as an underlying investment vehicle. Total return is not annualized for periods less than one year.
eRatios are annualized for periods less than one year.
fDoes not include expenses of the Underlying Funds in which the Fund invests. The weighted average indirect expenses of the Underlying Funds was 0.66% for the period ended June 30, 2017.
gExcludes the value of portfolio securities delivered as a result of a redemption in-kind.
| FFA-6 | Semiannual Report | The accompanying notes are an integral part of these financial statements. |
FRANKLIN TEMPLETON VARIABLE INSURANCE PRODUCTS TRUST
FINANCIAL HIGHLIGHTS
Franklin Founding Funds Allocation VIP Fund (continued)
| Six Months Ended June 30, 2017 (unaudited) | Year Ended December 31, | |||||||||||||||||||||||
| 2016 | 2015 | 2014 | 2013 | 2012 | ||||||||||||||||||||
| Class 4 | ||||||||||||||||||||||||
| Per share operating performance (for a share outstanding throughout the period) | ||||||||||||||||||||||||
Net asset value, beginning of period | $7.21 | $6.87 | $7.54 | $7.54 | $8.49 | $7.58 | ||||||||||||||||||
|
| |||||||||||||||||||||||
| Income from investment operationsa: | ||||||||||||||||||||||||
Net investment incomeb,c | 0.14 | 0.19 | 0.23 | 0.20 | 0.26 | 0.30 | ||||||||||||||||||
Net realized and unrealized gains (losses) | 0.33 | 0.64 | (0.68 | ) | 0.02 | 1.43 | 0.83 | |||||||||||||||||
|
| |||||||||||||||||||||||
Total from investment operations | 0.47 | 0.83 | (0.45 | ) | 0.22 | 1.69 | 1.13 | |||||||||||||||||
|
| |||||||||||||||||||||||
| Less distributions from: | ||||||||||||||||||||||||
Net investment income | (0.19 | ) | (0.26 | ) | (0.21 | ) | (0.21 | ) | (0.99 | ) | (0.22 | ) | ||||||||||||
Net realized gains | (0.31 | ) | (0.23 | ) | (0.01 | ) | (0.01 | ) | (1.65 | ) | — | |||||||||||||
|
| |||||||||||||||||||||||
Total distributions | (0.50 | ) | (0.49 | ) | (0.22 | ) | (0.22 | ) | (2.64 | ) | (0.22 | ) | ||||||||||||
|
| |||||||||||||||||||||||
Net asset value, end of period | $7.18 | $7.21 | $6.87 | $7.54 | $7.54 | $8.49 | ||||||||||||||||||
|
| |||||||||||||||||||||||
Total returnd | 6.58% | 12.92% | (6.24)% | 2.75% | 23.68% | 15.17% | ||||||||||||||||||
| Ratios to average net assetse | ||||||||||||||||||||||||
Expenses before waiver and payments by affiliatesf | 0.46% | 0.46% | 0.46% | 0.46% | 0.46% | 0.46% | ||||||||||||||||||
Expenses net of waiver and payments by affiliatesf | 0.45% | 0.45% | 0.45% | 0.45% | 0.45% | 0.45% | ||||||||||||||||||
Net investment incomec | 3.63% | 2.74% | 3.16% | 2.53% | 3.32% | 3.71% | ||||||||||||||||||
| Supplemental data | ||||||||||||||||||||||||
Net assets, end of period (000’s) | $538,949 | $530,403 | $550,825 | $702,324 | $676,781 | $493,813 | ||||||||||||||||||
Portfolio turnover rate | 0.95% | 0.10% | 0.26% | 4.80% | 3.91% | 28.46% | g | |||||||||||||||||
aThe amount shown for a share outstanding throughout the period may not correlate with the Statement of Operations for the period due to the timing of sales and repurchases of the Fund’s shares in relation to income earned and/or fluctuating fair value of the investments of the Fund.
bBased on average daily shares outstanding.
cRecognition of net investment income by the Fund is affected by the timing of declaration of dividends by the Underlying Funds in which the Fund invests.
dTotal return does not include fees, charges or expenses imposed by the variable annuity and life insurance contracts for which Franklin Templeton Variable Insurance Products Trust serves as an underlying investment vehicle. Total return is not annualized for periods less than one year.
eRatios are annualized for periods less than one year.
fDoes not include expenses of the Underlying Funds in which the Fund invests. The weighted average indirect expenses of the Underlying Funds was 0.66% for the period ended June 30, 2017.
gExcludes the value of portfolio securities delivered as a result of a redemption in-kind.
| The accompanying notes are an integral part of these financial statements. | Semiannual Report | FFA-7 |
FRANKLIN TEMPLETON VARIABLE INSURANCE PRODUCTS TRUST
Statement of Investments, June 30, 2017 (unaudited)
Franklin Founding Funds Allocation VIP Fund
| ||||||||||
| Shares | Value | |||||||||
| Investments in Underlying Funds 100.0% | ||||||||||
| Domestic Equity 33.3% | ||||||||||
| a | Franklin Mutual Shares VIP Fund, Class 1 | 15,841,639 | $ | 341,070,503 | ||||||
|
| |||||||||
| Domestic Hybrid 33.3% | ||||||||||
| a | Franklin Income VIP Fund, Class 1 | 21,486,281 | 340,772,414 | |||||||
|
| |||||||||
| Foreign Equity 33.4% | ||||||||||
| a | Templeton Growth VIP Fund, Class 1 | 22,551,812 | 342,336,503 | |||||||
|
| |||||||||
Total Investments in Underlying Funds (Cost $731,637,333) | 1,024,179,420 | |||||||||
Other Assets, less Liabilities 0.0%† | 155,080 | |||||||||
|
| |||||||||
Net Assets 100.0% | $ | 1,024,334,500 | ||||||||
|
| |||||||||
†Rounds to less than 0.1% of net assets.
aSee Note 3(d) regarding investments in Underlying Funds.
| FFA-8 | Semiannual Report | The accompanying notes are an integral part of these financial statements. |
FRANKLIN TEMPLETON VARIABLE INSURANCE PRODUCTS TRUST
Financial Statements
Statement of Assets and Liabilities
June 30, 2017 (unaudited)
| Franklin Founding Funds Allocation VIP Fund | ||||
Assets: | ||||
Investments in securities: | ||||
Cost - Non-controlled affiliates (Note 3d) | $ | 731,637,333 | ||
|
| |||
Value - Non-controlled affiliates (Note 3d) | $ | 1,024,179,420 | ||
Cash | 1,313,852 | |||
Receivables: | ||||
Capital shares sold | 214,497 | |||
Other assets | 660 | |||
|
| |||
Total assets | 1,025,708,429 | |||
|
| |||
Liabilities: | ||||
Payables: | ||||
Capital shares redeemed | 707,949 | |||
Administrative fees | 72,991 | |||
Distribution fees | 520,941 | |||
Accrued expenses and other liabilities | 72,048 | |||
|
| |||
Total liabilities | 1,373,929 | |||
|
| |||
Net assets, at value | $ | 1,024,334,500 | ||
|
| |||
Net assets consist of: | ||||
Paid-in capital | $ | 754,682,686 | ||
Undistributed net investment income | 18,751,113 | |||
Net unrealized appreciation (depreciation) | 292,542,087 | |||
Accumulated net realized gain (loss) | (41,641,386 | ) | ||
|
| |||
Net assets, at value | $ | 1,024,334,500 | ||
|
| |||
| Class 1: | ||||
Net assets, at value | $ | 1,044,043 | ||
|
| |||
Shares outstanding | 147,392 | |||
|
| |||
Net asset value and maximum offering price per share | $ | 7.08 | ||
|
| |||
| Class 2: | ||||
Net assets, at value | $ | 484,341,517 | ||
|
| |||
Shares outstanding | 68,806,158 | |||
|
| |||
Net asset value and maximum offering price per share | $ | 7.04 | ||
|
| |||
| Class 4: | ||||
Net assets, at value | $ | 538,948,940 | ||
|
| |||
Shares outstanding | 75,038,282 | |||
|
| |||
Net asset value and maximum offering price per share | $ | 7.18 | ||
|
| |||
| The accompanying notes are an integral part of these financial statements. | Semiannual Report | FFA-9 |
FRANKLIN TEMPLETON VARIABLE INSURANCE PRODUCTS TRUST
FINANCIAL STATEMENTS
Statement of Operations
for the six months ended June 30, 2017 (unaudited)
| Franklin Founding Funds Allocation VIP Fund | ||||
Investment income: | ||||
Dividends from non-controlled affiliates (Note 3d) | $ | 20,804,234 | ||
|
| |||
Expenses: | ||||
Administrative fees (Note 3a) | 508,237 | |||
Distribution fees: (Note 3b) | ||||
Class 2 | 600,931 | |||
Class 4 | 938,723 | |||
Reports to shareholders | 43,311 | |||
Professional fees | 18,036 | |||
Trustees’ fees and expenses | 2,301 | |||
Other | 7,402 | |||
|
| |||
Total expenses | 2,118,941 | |||
Expenses waived/paid by affiliates (Note 3e) | (69,659 | ) | ||
|
| |||
Net expenses | 2,049,282 | |||
|
| |||
Net investment income | 18,754,952 | |||
|
| |||
Realized and unrealized gains (losses): | ||||
Net realized gain (loss) from: | ||||
Sale of investments: | ||||
Non-controlled affiliates (Note 3d) | 7,840,362 | |||
Net change in unrealized appreciation (depreciation) on investments | 39,646,992 | |||
|
| |||
Net realized and unrealized gain (loss) | 47,487,354 | |||
|
| |||
Net increase (decrease) in net assets resulting from operations | $ | 66,242,306 | ||
|
| |||
| FFA-10 | Semiannual Report | The accompanying notes are an integral part of these financial statements. |
FRANKLIN TEMPLETON VARIABLE INSURANCE PRODUCTS TRUST
FINANCIAL STATEMENTS
Statements of Changes in Net Assets
| Franklin Founding Funds Allocation VIP Fund | ||||||||
| Six Months Ended June 30, 2017 (unaudited) | Year Ended 2016 | |||||||
Increase (decrease) in net assets: | ||||||||
Operations: | ||||||||
Net investment income | $ | 18,754,952 | $ | 27,575,819 | ||||
Net realized gain (loss) | 7,840,362 | 45,677,726 | ||||||
Net change in unrealized appreciation (depreciation) | 39,646,992 | 46,468,720 | ||||||
|
| |||||||
Net increase (decrease) in net assets resulting from operations | 66,242,306 | 119,722,265 | ||||||
|
| |||||||
Distributions to shareholders from: | ||||||||
Net investment income: | ||||||||
Class 1 | (32,261 | ) | (42,944 | ) | ||||
Class 2 | (12,990,591 | ) | (18,199,650 | ) | ||||
Class 4 | (13,655,260 | ) | (19,362,702 | ) | ||||
Net realized gains: | ||||||||
Class 1 | (45,646 | ) | (33,890 | ) | ||||
Class 2 | (20,025,278 | ) | (15,405,932 | ) | ||||
Class 4 | (21,899,278 | ) | (17,041,267 | ) | ||||
|
| |||||||
Total distributions to shareholders | (68,648,314 | ) | (70,086,385 | ) | ||||
|
| |||||||
Capital share transactions: (Note 2) | ||||||||
Class 1 | 25,757 | (111,375 | ) | |||||
Class 2 | 11,311,225 | (29,371,071 | ) | |||||
Class 4 | 9,307,031 | (46,679,895 | ) | |||||
|
| |||||||
Total capital share transactions | 20,644,013 | (76,162,341 | ) | |||||
|
| |||||||
Net increase (decrease) in net assets | 18,238,005 | (26,526,461 | ) | |||||
Net assets: | ||||||||
Beginning of period | 1,006,096,495 | 1,032,622,956 | ||||||
|
| |||||||
End of period | $ | 1,024,334,500 | $ | 1,006,096,495 | ||||
|
| |||||||
Undistributed net investment income included in net assets: | ||||||||
End of period | $ | 18,751,113 | $ | 26,674,273 | ||||
|
| |||||||
| The accompanying notes are an integral part of these financial statements. | Semiannual Report | FFA-11 |
FRANKLIN TEMPLETON VARIABLE INSURANCE PRODUCTS TRUST
Notes to Financial Statements (unaudited)
Franklin Founding Funds Allocation VIP Fund
1. Organization and Significant Accounting Policies
Franklin Templeton Variable Insurance Products Trust (Trust) is registered under the Investment Company Act of 1940 (1940 Act) as an open-end management investment company, consisting of eighteen separate funds and applies the specialized accounting and reporting guidance in U.S. Generally Accepted Accounting Principles (U.S. GAAP). Franklin Founding Funds Allocation VIP Fund (Fund) is included in this report. The financial statements of the remaining funds in the Trust are presented separately. The Fund invests primarily in other funds of the Trust (Underlying Funds). Shares of the Fund are generally sold only to insurance company separate accounts to fund the benefits of variable life insurance policies or variable annuity contracts. The Fund offers three classes of shares: Class 1, Class 2 and Class 4. Each class of shares may differ by its distribution fees, voting rights on matters affecting a single class and its exchange privilege.
The accounting policies of the Underlying Funds are outlined in their respective shareholder reports. A copy of the Underlying Funds’ shareholder reports is available on the U.S. Securities and Exchange Commission (SEC) website at sec.gov or at the SEC’s Public Reference Room in Washington, D.C. The Underlying Funds’ shareholder reports are not covered by this report.
The following summarizes the Fund’s significant accounting policies.
a. Financial Instrument Valuation
The Fund’s investments in financial instruments are carried at fair value daily. Fair value is the price that would be received to sell an asset or paid to transfer a liability in an orderly transaction between market participants on the measurement date. The Fund calculates the net asset value (NAV) per share as of 4 p.m. Eastern time each day the New York Stock Exchange (NYSE) is open for trading. Under compliance policies and procedures approved by the Trust’s Board of Trustees (the Board), the Fund’s administrator has responsibility for oversight of valuation, including leading the cross-functional Valuation Committee (VC). The VC provides administration and oversight of the Fund’s valuation policies and procedures, which are approved annually by the Board. Investments in the Underlying Funds are valued at their closing NAV each trading day.
b. Income Taxes
It is the Fund’s policy to qualify as a regulated investment company under the Internal Revenue Code. The Fund intends to distribute to shareholders substantially all of its taxable income and net realized gains to relieve it from federal income and if applicable, excise taxes. As a result, no provision for U.S. federal income taxes is required.
The Fund may recognize an income tax liability related to its uncertain tax positions under U.S. GAAP when the uncertain tax position has a less than 50% probability that it will be sustained upon examination by the tax authorities based on its technical merits. As of June 30, 2017, the Fund has determined that no tax liability is required in its financial statements related to uncertain tax positions for any open tax years (or expected to be taken in future tax years). Open tax years are those that remain subject to examination and are based on each tax jurisdiction’s statute of limitation.
c. Security Transactions, Investment Income, Expenses and Distributions
Security transactions are accounted for on trade date. Realized gains and losses on security transactions are determined on a specific identification basis. Estimated expenses are accrued daily. Dividend income and realized gain distributions by Underlying Funds are recorded on the ex-dividend date. Distributions to shareholders are recorded on the ex-dividend date. Distributable earnings are determined according to income tax regulations (tax basis) and may differ from earnings recorded in accordance with U.S. GAAP. These differences may be permanent or temporary. Permanent differences are reclassified among capital accounts to reflect their tax character. These reclassifications have no impact on net assets or the results of operations. Temporary differences are not reclassified, as they may reverse in subsequent periods.
Common expenses incurred by the Trust are allocated among the Funds based on the ratio of net assets of each Fund to the combined net assets of the Trust. Fund specific expenses are charged directly to the Fund that incurred the expense.
The Fund indirectly bears its proportionate share of expenses from the Underlying Funds. Since the Underlying Funds have varied expense levels and the Fund may own different proportions of the Underlying Funds at different times, the amount of expenses incurred indirectly by the Fund will vary.
| FFA-12 | Semiannual Report |
FRANKLIN TEMPLETON VARIABLE INSURANCE PRODUCTS TRUST
NOTES TO FINANCIAL STATEMENTS (UNAUDITED)
Franklin Founding Funds Allocation VIP Fund (continued)
Realized and unrealized gains and losses and net investment income, not including class specific expenses, are allocated daily to each class of shares based upon the relative proportion of net assets of each class. Differences in per share distributions, by class, are generally due to differences in class specific expenses.
d. Accounting Estimates
The preparation of financial statements in accordance with U.S. GAAP requires management to make estimates and assumptions that affect the reported amounts of assets and liabilities at the date of the financial statements and the amounts of income and expenses during the reporting period. Actual results could differ from those estimates.
e. Guarantees and Indemnifications
Under the Trust’s organizational documents, its officers and trustees are indemnified by the Trust against certain liabilities arising out of the performance of their duties to the Trust. Additionally, in the normal course of business, the Trust, on behalf of the Fund, enters into contracts with service providers that contain general indemnification clauses. The Trust’s maximum exposure under these arrangements is unknown as this would involve future claims that may be made against the Trust that have not yet occurred. Currently, the Trust expects the risk of loss to be remote.
2. Shares of Beneficial Interest
At June 30, 2017, there were an unlimited number of shares authorized (without par value). Transactions in the Fund’s shares were as follows:
| Six Months Ended June 30, 2017 | Year Ended December 31, 2016 | |||||||||||||||||||
| Shares | Amount | Shares | Amount | |||||||||||||||||
| Class 1 Shares: | ||||||||||||||||||||
Shares sold | 11,245 | $ | 82,719 | 16,848 | $ | 112,841 | ||||||||||||||
Shares issued in reinvestment of distributions | 11,035 | 77,907 | 12,138 | 76,834 | ||||||||||||||||
Shares redeemed | (18,746 | ) | (134,869 | ) | (44,358 | ) | (301,050 | ) | ||||||||||||
|
| |||||||||||||||||||
Net increase (decrease) | 3,534 | $ | 25,757 | (15,372 | ) | $ | (111,375 | ) | ||||||||||||
|
| |||||||||||||||||||
| Class 2 Shares: | ||||||||||||||||||||
Shares sold | 2,050,451 | $ | 15,046,605 | 5,277,050 | $ | 35,702,809 | ||||||||||||||
Shares issued in reinvestment of distributions | 4,703,115 | 33,015,869 | 5,334,220 | 33,605,582 | ||||||||||||||||
Shares redeemed | (5,021,620 | ) | (36,751,249 | ) | (14,716,105 | ) | (98,679,462 | ) | ||||||||||||
|
| |||||||||||||||||||
Net increase (decrease) | 1,731,946 | $ | 11,311,225 | (4,104,835 | ) | $ | (29,371,071 | ) | ||||||||||||
|
| |||||||||||||||||||
| Class 4 Shares: | ||||||||||||||||||||
Shares sold | 1,747,334 | $ | 13,034,025 | 1,664,792 | $ | 11,425,501 | ||||||||||||||
Shares issued in reinvestment of distributions | 4,965,718 | 35,554,538 | 5,670,400 | 36,403,969 | ||||||||||||||||
Shares redeemed | (5,266,196 | ) | (39,281,532 | ) | (13,975,336 | ) | (94,509,365 | ) | ||||||||||||
|
| |||||||||||||||||||
Net increase (decrease) | 1,446,856 | $ | 9,307,031 | (6,640,144 | ) | $ | (46,679,895 | ) | ||||||||||||
|
| |||||||||||||||||||
3. Transactions with Affiliates
Franklin Resources, Inc. is the holding company for various subsidiaries that together are referred to as Franklin Templeton Investments. Certain officers and trustees of the Fund are also officers and/or directors of the following subsidiaries:
| Subsidiary | Affiliation | |
Franklin Templeton Services, LLC (FT Services) | Administrative manager | |
Franklin Templeton Distributors, Inc. (Distributors) | Principal underwriter | |
Franklin Templeton Investor Services, LLC (Investor Services) | Transfer agent |
| Semiannual Report | FFA-13 |
FRANKLIN TEMPLETON VARIABLE INSURANCE PRODUCTS TRUST
NOTES TO FINANCIAL STATEMENTS (UNAUDITED)
Franklin Founding Funds Allocation VIP Fund (continued)
3. Transactions with Affiliates (continued)
a. Administrative Fees
The Fund pays an administrative fee to FT Services of 0.10% per year of the average daily net assets of the Fund for administrative services including monitoring and rebalancing the percentage of the Fund’s investments in the Underlying Funds.
b. Distribution Fees
The Board has adopted distribution plans for Class 2 and Class 4 shares pursuant to Rule 12b-1 under the 1940 Act. Under the Fund’s compensation distribution plans, the Fund pays Distributors for costs incurred in connection with the servicing, sale and distribution of the Fund’s shares up to 0.35% per year of its average daily net assets of each class. The Board has agreed to limit the current rate to 0.25% per year for Class 2. The plan year, for purposes of monitoring compliance with the maximum annual plan rates, is February 1 through January 31.
c. Transfer Agent Fees
Investor Services, under terms of an agreement, performs shareholder servicing for the Fund and is not paid by the Fund for the services.
d. Investments in Underlying Funds
The Fund invests in Underlying Funds which are managed by affiliates of the Fund’s administrative manager, FT Services. The Fund does not invest in Underlying Funds for the purpose of exercising a controlling influence over the management or policies.
Investments in Underlying Funds for the period ended June 30, 2017, were as follows:
| Underlying Funds | Number of Shares Held at Beginning of Period | Gross Additions | Gross Reductions | Number of Shares Held at End of Period | Value at End of Period | Investment Income | Realized (Loss) | % of of Period | ||||||||||||||||||||||||
| Non-Controlled Affiliates | ||||||||||||||||||||||||||||||||
Franklin Income VIP Fund, Class 1 | 21,065,303 | 1,033,102 | (612,124 | ) | 21,486,281 | $ | 340,772,414 | $ | 14,527,615 | $ | 687,325 | 5.4% | ||||||||||||||||||||
Franklin Mutual Shares VIP Fund, Class 1 | 16,336,774 | 270,908 | (766,043 | ) | 15,841,639 | 341,070,503 | — | 948,854 | 7.7% | |||||||||||||||||||||||
Templeton Growth VIP Fund, Class 1 | 23,748,961 | 559,107 | (1,756,256 | ) | 22,551,812 | 342,336,503 | 6,276,619 | 6,204,183 | 24.1% | |||||||||||||||||||||||
|
| |||||||||||||||||||||||||||||||
Total | $ | 1,024,179,420 | $ | 20,804,234 | $ | 7,840,362 | ||||||||||||||||||||||||||
|
| |||||||||||||||||||||||||||||||
e. Waiver and Expense Reimbursements
FT Services has contractually agreed in advance to waive or limit its fees and to assume as its own expense certain expenses otherwise payable by the Fund so that the expenses (excluding distribution fees, and acquired fund fees and expenses) for each class of the Fund do not exceed 0.10%, based on the average net assets of each class (other than certain non-routine expenses or costs, including those relating to litigation, indemnification, reorganizations, and liquidations) until April 30, 2018. Total expenses waived or paid are not subject to recapture subsequent to the Fund’s fiscal year end.
4. Expense Offset Arrangement
The Funds has entered into an arrangement with its custodian whereby credits realized as a result of uninvested cash balances are used to reduce a portion of the Fund’s custodian expenses. During the period ended June 30, 2017, there were no credits earned.
| FFA-14 | Semiannual Report |
FRANKLIN TEMPLETON VARIABLE INSURANCE PRODUCTS TRUST
NOTES TO FINANCIAL STATEMENTS (UNAUDITED)
Franklin Founding Funds Allocation VIP Fund (continued)
5. Income Taxes
At June 30, 2017, the cost of investments and net unrealized appreciation (depreciation) for income tax purposes were as follows:
Cost of investments | $ | 781,101,859 | ||
|
| |||
Unrealized appreciation | $ | 292,542,087 | ||
Unrealized depreciation | (49,464,526 | ) | ||
|
| |||
Net unrealized appreciation (depreciation) | $ | 243,077,561 | ||
|
|
Differences between income and/or capital gains as determined on a book basis and a tax basis are primarily due to differing treatment of wash sales.
6. Investment Transactions
Purchases and sales of Underlying Funds (excluding short term securities) for the period ended June 30, 2017, aggregated $9,700,000 and $52,422,404, respectively.
7. Credit Facility
The Fund, together with other U.S. registered and foreign investment funds (collectively, Borrowers), managed by Franklin Templeton Investments, are borrowers in a joint syndicated senior unsecured credit facility totaling $2 billion (Global Credit Facility) which matures on February 9, 2018. This Global Credit Facility provides a source of funds to the Borrowers for temporary and emergency purposes, including the ability to meet future unanticipated or unusually large redemption requests.
Under the terms of the Global Credit Facility, the Fund shall, in addition to interest charged on any borrowings made by the Fund and other costs incurred by the Fund, pay its share of fees and expenses incurred in connection with the implementation and maintenance of the Global Credit Facility, based upon its relative share of the aggregate net assets of all of the Borrowers, including an annual commitment fee of 0.15% based upon the unused portion of the Global Credit Facility. These fees are reflected in other expenses in the Statement of Operations. During the period ended June 30, 2017, the Fund did not use the Global Credit Facility.
8. Fair Value Measurements
The Fund follows a fair value hierarchy that distinguishes between market data obtained from independent sources (observable inputs) and the Fund’s own market assumptions (unobservable inputs). These inputs are used in determining the value of the Fund’s financial instruments and are summarized in the following fair value hierarchy:
| • | Level 1 – quoted prices in active markets for identical financial instruments |
| • | Level 2 – other significant observable inputs (including quoted prices for similar financial instruments, interest rates, prepayment speed, credit risk, etc.) |
| • | Level 3 – significant unobservable inputs (including the Fund’s own assumptions in determining the fair value of financial instruments) |
The input levels are not necessarily an indication of the risk or liquidity associated with financial instruments at that level.
For movements between the levels within the fair value hierarchy, the Fund has adopted a policy of recognizing the transfers as of the date of the underlying event which caused the movement.
| Semiannual Report | FFA-15 |
FRANKLIN TEMPLETON VARIABLE INSURANCE PRODUCTS TRUST
NOTES TO FINANCIAL STATEMENTS (UNAUDITED)
Franklin Founding Funds Allocation VIP Fund (continued)
8. Fair Value Measurements (continued)
At June 30, 2017, all of the Fund’s investments in financial instruments carried at fair value were valued using Level 1 inputs. For detailed categories, see the accompanying Statement of Investments.
9. Investment Company Reporting Modernization
In October 2016, the U.S. Securities and Exchange Commission adopted new rules and amended existing rules (together, final rules) intended to modernize the reporting and disclosure of information by registered investment companies. In part, the final rules amend Regulation S-X and require standardized, enhanced disclosures about derivatives in investment company financial statements, as well as other amendments. The compliance date for the amendments to Regulation S-X is August 1, 2017. Management has reviewed the requirements and believes the adoption of the amendments to Regulation S-X will not have a material impact on the Fund’s financial statements and related disclosures.
10. Subsequent Events
The Fund has evaluated subsequent events through the issuance of the financial statements and determined that no events have occurred that require disclosure.
| FFA-16 | Semiannual Report |
FRANKLIN TEMPLETON VARIABLE INSURANCE PRODUCTS TRUST
Tax Information (unaudited)
Franklin Founding Funds Allocation VIP Fund
During the fiscal year ended December 31, 2016, the Fund, a qualified fund of funds under Section 852(g)(2) of Internal Revenue Code (Code), received an allocation of foreign taxes paid from one or more of its underlying funds. As shown in the table below, the Fund hereby reports to shareholders the foreign source income and foreign taxes paid by underlying funds, pursuant to Section 853 of the Code. This written statement will allow shareholders of record on June 14, 2017, to treat their proportionate share of foreign taxes paid by the underlying funds as having been paid directly by them. The shareholder shall consider these amounts as foreign taxes paid in the tax year in which they receive the Fund distribution.
The following table provides a detailed analysis of foreign tax paid, and foreign source income as reported by the Fund, to Class 1, Class 2, and Class 4 shareholders of record.
| Class | Foreign Tax Paid Per Share | Foreign Source Income Per Share | ||
Class 1 | $0.0040 | $0.0461 | ||
Class 2 | $0.0040 | $0.0461 | ||
Class 4 | $0.0040 | $0.0461 |
Foreign Tax Paid Per Share (Column 1) is the amount per share available to you, as a tax credit (assuming you held your shares in the Fund for a minimum of 16 days during the 31-day period beginning 15 days before the ex-dividend date of the Fund’s distribution to which the foreign taxes relate), or, as a tax deduction.
Foreign Source Income Per Share (Column 2) is the amount per share of income dividends attributable to foreign securities held by the Fund, plus any foreign taxes withheld on these dividends.
| Semiannual Report | FFA-17 |
This page intentionally left blank.
Franklin Global Real Estate VIP Fund
This semiannual report for Franklin Global Real Estate VIP Fund covers the period ended June 30, 2017.
Class 1 Performance Summary as of June 30, 2017
The Fund’s Class 1 Shares delivered a +5.34% total return for the six-month period ended June 30, 2017.
Performance reflects the Fund’s Class 1 operating expenses, but does not include any contract fees, expenses or sales charges. If they had been included, performance would be lower. These charges and deductions, particularly for variable life policies, can have a significant effect on contract values and insurance benefits. See the contract prospectus for a complete description of these expenses, including sales charges.
Performance data represent past performance, which does not guarantee future results. Investment return and principal value will fluctuate, and you may have a gain or loss when you sell your shares. Current performance may differ from figures shown.
| Semiannual Report | FGR-1 |
FRANKLIN GLOBAL REAL ESTATE VIP FUND
Fund Goal and Main Investments
The Fund seeks high total return. Under normal market conditions, the Fund invests at least 80% of its net assets in investments of companies located anywhere in the world that operate in the real estate sector.
Fund Risks
All investments involve risks, including possible loss of principal. The Fund concentrates in real estate securities, which involve special risks, such as declines in the value of real estate and increased susceptibility to adverse economic or regulatory developments affecting the sector. The Fund’s investments in REITs involve additional risks; since REITs typically are invested in a limited number of projects or in a particular market segment, they are more susceptible to adverse developments affecting a single project or market segment than more broadly diversified investments. Foreign investing, especially in emerging markets, involves additional risks such as currency and market volatility, as well as political and social instability. The Fund is actively managed but there is no guarantee that the manager’s investment decisions will produce the desired results. The Fund’s prospectus also includes a description of the main investment risks.
What is a REIT?
A REIT is a type of real estate company that is dedicated to owning and usually operating income-producing real estate properties such as apartments, hotels, industrial properties, office buildings or shopping centers. Equity REITs generally receive income from rents received, are generally operated by experienced property management teams and typically concentrate on a specific geographic region or property type.
Performance Overview
You can find the Fund’s six-month total return in the Performance Summary. In comparison, the FTSE EPRA/NAREIT Developed Index posted a +5.37% total return for the same period.1
Economic and Market Overview
The global economy generally expanded during the period under review. In this environment, global developed and emerging market stocks rose, as measured by the MSCI All
Country World Index. Global markets were aided by improved industrial commodity prices at certain points during the period, generally upbeat economic data across regions, investor optimism about pro-growth and pro-business policies in the U.S, hopes of tax reforms under the Trump administration, Emmanuel Macron’s election as France’s president and encouraging corporate earnings reports.
However, investors expressed concerns about the timing and economic effects of the U.K.’s exit from the European Union (also known as “Brexit”) and the U.S. executive order banning entry from some Muslim-majority countries. Other headwinds included the health of European banks, concerns about political
1. Source: Morningstar.
One cannot invest directly in an index, and an index is not representative of the Fund’s portfolio. Please see Index Descriptions following the Fund Summaries.
The dollar value, number of shares or principal amount, and names of all portfolio holdings are listed in the Fund’s Statement of Investments (SOI).
| FGR-2 | Semiannual Report |
FRANKLIN GLOBAL REAL ESTATE VIP FUND
uncertainty in the U.S. and European Union, geopolitical tensions in certain regions, worries about global oversupply in oil production despite a pact to extend cuts, and hawkish comments from key central bankers around the world toward period-end.
U.S. economic growth decelerated in 2017’s first quarter, largely due to slower growth in consumer spending and declines in private inventory investment and government spending. However, growth accelerated in the second quarter due to increases in consumer spending, business investment and federal government spending. The unemployment rate decreased from 4.7% in December 2016 to 4.4% at period-end.2 Annual inflation, as measured by the Consumer Price Index, decreased from 2.1% to 1.6% during the period. After increasing its benchmark interest rate in March, the U.S. Federal Reserve (Fed), at its June meeting, made the widely anticipated increase to its target range for the federal funds rate from 0.75%–1.00% to 1.00%–1.25%, amid signs of a growing U.S. economy, a strengthening labor market and an improvement in business spending.
In Europe, the U.K.’s economy grew at a slower rate in 2017’s first quarter over the previous quarter, largely due to slower growth in household spending. The eurozone’s growth increased in the first quarter over the previous quarter. The bloc’s annual inflation rate fluctuated during the reporting period and ended slightly higher from where it began. During the period, the European Central Bank kept its key policy rates unchanged.
In Asia, Japan’s quarterly gross domestic product (GDP) remained unchanged in 2017’s first quarter compared to 2016’s fourth quarter. In April 2017, the Bank of Japan (BOJ) slightly increased its GDP forecasts for the 2017–2018 fiscal year. However, the BOJ lowered its inflation forecast.
In emerging markets, Brazil’s quarterly GDP grew for the first time in two years, as its first-quarter 2017 GDP grew compared to the previous quarter. The country’s central bank cut its benchmark interest rate four times between January and June 2017 to spur economic growth. Russia’s GDP grew in 2017’s first quarter compared to the prior-year period. The Bank of Russia reduced its key interest rate in March, April and June 2017 to try to revive its economy. China’s economy grew faster in the first half of 2017 compared to the first half of 2016, driven by solid growth in industrial production, services,
| Top 10 Countries | ||||
| 6/30/17 | ||||
| % of Total Net Assets | ||||
| U.S. | 53.5% | |||
| Japan | 10.5% | |||
| Hong Kong | 8.0% | |||
| Australia | 6.2% | |||
| U.K. | 5.0% | |||
| Germany | 3.7% | |||
| France | 3.4% | |||
| Singapore | 2.9% | |||
| Sweden | 2.0% | |||
| Canada | 1.9% | |||
fixed-asset investment, retail sales, and imports and exports. The People’s Bank of China left its benchmark interest rate unchanged during the period. Overall, emerging market stocks, as measured by the MSCI Emerging Markets Index, rose during the period.3
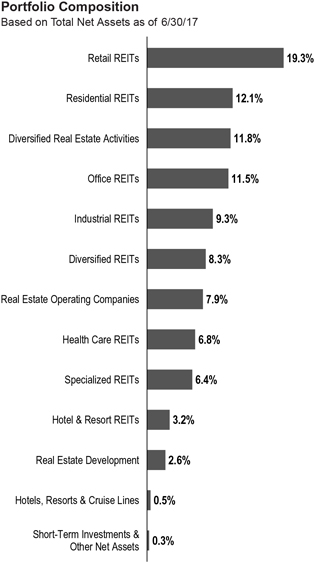
Global Real Estate Market Overview
According to the FTSE EPRA/NAREIT Developed Index, in U.S. dollar terms, most countries outpaced the index. Among the leaders were Israel, Italy, Austria and Singapore. In contrast, Japan lost value and the U.S. and Australia underperformed the index. At period-end, the U.S. was the index’s largest country weighting.
Investment Strategy
We seek to limit price volatility by investing across markets and property types and seek to provide a consistently high level of income in our pursuit of high total return. When selecting investments for the Fund’s portfolio, we apply a “bottom-up” stock selection process that incorporates macro-level views in the evaluation process. Our portfolio construction process combines bottom-up analysis of individual stock and real estate market fundamentals and top-down macro overlays to provide country/regional, property type, and company size perspectives in identifying international/local cyclical and thematic trends that highlight investment opportunities.
Manager’s Discussion
During the six months under review, key contributors to the Fund’s performance relative to the FTSE EPRA/NAREIT
2. Source: Bureau of Labor Statistics.
3. Please see Index Descriptions following the Fund Summaries.
| Semiannual Report | FGR-3 |
FRANKLIN GLOBAL REAL ESTATE VIP FUND
| Top 10 Holdings | ||||
| 6/30/17 | ||||
| Company Sector/Industry, Country | % of Total Net Assets | |||
Simon Property Group Inc. Retail REITs, U.S. | 4.1% | |||
Mitsui Fudosan Co. Ltd. Diversified Real Estate Activities, Japan | 2.9% | |||
Prologis Inc. Industrial REITs, U.S. | 2.8% | |||
AvalonBay Communities Inc. Residential REITs, U.S. | 2.6% | |||
Mitsubishi Estate Co. Ltd. Diversified Real Estate Activities, Japan | 2.4% | |||
Welltower Inc. Health Care REITs, U.S. | 2.4% | |||
Unibail-Rodamco SE Retail REITs, France | 2.3% | |||
Cheung Kong Property Holdings Ltd. Real Estate Development, Hong Kong | 2.2% | |||
Equity Residential Residential REITs, U.S. | 2.1% | |||
Sun Hung Kai Properties Ltd. Diversified Real Estate Activities, Hong Kong | 1.9% | |||
Developed Index included stock selection and an overweighting in the industrial property sector.4 Shares of PLA Administradora Industrial, a Mexican REIT that focuses on the industrial property segment, outperformed during the reporting period. Despite the recent political and economic uncertainty related to the future of the North American Free Trade Agreement after the recent election in the U.S., investor sentiment for the country recovered significantly as investor focus shifted back to the country’s healthy fundamentals, benefiting the Mexican real estate sector. The company’s recent quarterly core results were positive and stood out among its peers with strong year-over-year growth of both net operating income and funds from operations (FFO). At the beginning of 2017, the company closed a large industrial portfolio acquisition, which has not been fully captured in the company’s results. We believe it could add to earnings going forward. We remain bullish on the company given the company’s mostly U.S.-dollar denominated leases, diversified tenant profile, attractive stock valuation and continued external growth opportunities as the Mexican industrial property segment remains highly fragmented.
An overweighting in the specialty sector also boosted results, with holdings such as U.S.-based data center company Coresite Realty contributing notably.5 Shares of Coresite rose during the six-month period, and significantly outperformed the specialty sector and the global benchmark. The company reported strong third- and fourth-quarter financial results due to leasing success in its data center properties. We believe the FFO per-share financial result was positive since the company operates with a much lower leverage ratio than most U.S. REITs. Relative performance was supported further by the portfolio’s positioning in the hotel/resort and residential sectors.6
We bought German residential property operator ADO Properties at the initial public offering, as it seemed attractive to us in relation to net asset value, asset quality and location in comparison to the German residential peer group. The company has continued to look positive based on our internal analysis and with its strong operational performance. The company expects solid rental growth for 2017, which seems achievable to us after having reported strong growth in the first quarter of 2017. The Berlin residential market continues to appear attractive to us with low average rent levels, in combination with strong demand from urbanization and immigration, which has created a supply and demand mismatch, in our opinion.
In contrast, stock selection in the diversified sector detracted from relative performance.7 Shares of Japanese REIT Mitsubishi Estate underperformed the benchmark during the six-month period. The company saw a pullback in share price since its medium-term plan was announced in May. As the company continued to prioritize capital investment during its mid-term plan, the market was disappointed by the lack of details with regard to improving shareholder returns. Overall, Mitsubishi Estate has seen smooth preleasing progress for its new office buildings despite rising office supply in 2018 and beyond. We expect steady net asset value (NAV) and earnings growth for the company, mainly driven by contributions from new projects. Nevertheless, the prospect of share buybacks by the firm will remain a near-term focus for investors as long as the company continues to trade at a deep discount to NAV.
4. Industrial property holdings are in industrial REITs in the SOI.
5. Specialty holdings are in office REITs and specialized REITs in the SOI.
6. Hotel/resort holdings are in hotel and resort REITs and hotels, resorts and cruise lines in the SOI. Residential holdings are in real estate operating companies and residential REITs in the SOI.
7. Diversified holdings are in diversified real estate activities, diversified REITs, real estate development, real estate operating companies and residential REITs in the SOI.
| FGR-4 | Semiannual Report |
FRANKLIN GLOBAL REAL ESTATE VIP FUND
Stock selection in the office space sector also hampered results.8 Shares of Vornado Realty Trust, a dominant REIT in New York City with a portfolio of mainly Manhattan office and street retail assets (following its soon to be completed Washington, D.C. spin-off), underperformed during the reporting period. We believe the stock’s underperformance mainly reflected continued negative investor sentiment for New York REITs given the negative outlook for Manhattan office fundamentals due to upcoming supply pressures as large projects come online over the next few years as well as weak street retail fundamentals. We also believe management’s lack of capital allocation and investment decisions in recent years have been disappointing as the company has continued to maintain a large cash balance. The company has made significant progress on its simplification strategy laid out a few years back as it exited most of its non-core assets and will soon complete its spin-off of its Washington, D.C. portfolio. Nevertheless, Vornado has yet to announce further details about its highly anticipated development and re-development plans for New York City’s Penn Plaza district.
Relative returns were pressured further by positioning in the triple-net leasing and storage property sectors.9 Shares of CubeSmart, the third largest self-storage REIT in the U.S., underperformed during the reporting period after three years of outperformance. Similar to other storage REITs, CubeSmart’s underperformance mainly reflected deteriorating investor sentiment for the sector given the continued deceleration in the operating trends as fundamentals have peaked last year and top-line growth started to decelerate (albeit remaining higher than the REIT average) after many years of favorable demand and supply dynamics. Although the stock looked relatively attractive to us versus its peers, it started to underperform, reflecting negative investor sentiment as well as concerns about its exposure to New York City where supply has been rising. We currently have a negative bias for storage and therefore have maintained our portfolio’s overall underweighted position given our 12-month negative outlook for operating trends. We also think that acquisitions opportunities will likely be increasingly difficult going forward given the storage REITs’ recent loss of cost-of-capital advantage.
It is important to recognize the effect of currency movements on the Fund’s performance. In general, if the value of the U.S. dollar goes up compared with a foreign currency, an investment traded in that foreign currency will go down in value because it will be worth fewer U.S. dollars. This can have a negative effect on Fund performance. Conversely, when the U.S. dollar
weakens in relation to a foreign currency, an investment traded in that foreign currency will increase in value, which can contribute to Fund performance. For the six months ended June 30, 2017, the U.S. dollar declined in value relative to most currencies. As a result, the Fund’s performance was positively affected by the portfolio’s significant investment in securities with non-U.S. currency exposure. However, one cannot expect the same result in future periods.
Thank you for your participation in Franklin Global Real Estate VIP Fund. We look forward to serving your future investment needs.
The foregoing information reflects our analysis, opinions and portfolio holdings as of June 30, 2017, the end of the reporting period. The way we implement our main investment strategies and the resulting portfolio holdings may change depending on factors such as market and economic conditions. These opinions may not be relied upon as investment advice or an offer for a particular security. The information is not a complete analysis of every aspect of any market, country, industry, security or the Fund. Statements of fact are from sources considered reliable, but the investment manager makes no representation or warranty as to their completeness or accuracy. Although historical performance is no guarantee of future results, these insights may help you understand our investment management philosophy.
8. Office space holdings are in office REITs and real estate operating companies in the SOI.
9. Storage property holdings are in specialized REITs in the SOI.
| Semiannual Report | FGR-5 |
FRANKLIN GLOBAL REAL ESTATE VIP FUND
Class 1 Fund Expenses
As an investor in a variable insurance contract (Contract) that indirectly provides for investment in an underlying mutual fund, you can incur transaction and/or ongoing expenses at both the Fund level and the Contract Level: (1) transaction expenses can include sales charges (loads) on purchases, surrender fees, transfer fees and premium taxes; and (2) ongoing expenses can include management fees, distribution and service (12b-1) fees, contract fees, annual maintenance fees, mortality and expense risk fees and other fees and expenses. All mutual funds and Contracts have some types of ongoing expenses. The table below shows Fund-level ongoing expenses and can help you understand these costs and compare them with those of other mutual funds offered through the Contract. The table assumes a $1,000 investment held for the six months indicated. Please refer to the Fund prospectus for additional information on operating expenses.
Actual Fund Expenses
The table below provides information about the actual account values and actual expenses in the columns under the heading “Actual.” In these columns the Fund’s actual return, which includes the effect of ongoing Fund expenses but does not include the effect of ongoing Contract expenses, is used to calculate the “Ending Account Value.” You can estimate the Fund-level expenses you paid during the period by following these steps (of course, your account value and expenses will differ from those in this illustration): Divide your account value by $1,000 (if your account had an $8,600 value, then $8,600 ÷ $1,000 = 8.6). Then multiply the result by the number under the headings “Actual” and “Fund-Level Expenses Paid During Period” (if Fund-Level Expenses Paid During Period were $7.50, then 8.6 × $7.50= $64.50). In this illustration, the estimated expenses paid this period at the Fund level are $64.50.
Hypothetical Example for Comparison with Other Mutual Funds
Under the heading “Hypothetical” in the table, information is provided about hypothetical account values and hypothetical expenses based on the Fund’s actual expense ratio and an assumed rate of return of 5% per year before expenses, which is not the Fund’s actual return. This information may not be used to estimate the actual ending account balance or expenses you paid for the period, but it can help you compare ongoing costs of investing in the Fund with those of other mutual funds offered through the Contract. To do so, compare this 5% hypothetical example with the 5% hypothetical examples that appear in the shareholder reports of other funds offered through the Contract.
Please note that expenses shown in the table are meant to highlight ongoing costs at the Fund level only and do not reflect any ongoing expenses at the Contract level, or transaction expenses at either the Fund or Contract levels. In addition, while the Fund does not have transaction expenses, if the transaction and ongoing expenses at the Contract level were included, the expenses shown below would be higher. You should consult your Contract prospectus or disclosure document for more information.
| Actual (actual return after expenses) | Hypothetical (5% annual return before expenses) | |||||||||||||||||||||||
| Share Class | | Beginning Account Value 1/1/17 | | | Ending Account Value 6/30/17 | | | Fund-Level Expenses Paid During Period 1/1/17–6/30/17 | 1,2 | | Ending Account Value 6/30/17 | | | Fund-Level Expenses Paid During Period 1/1/17–6/30/17 | 1,2 | | Net Annualized Expense Ratio | 2 | ||||||
Class 1 | $1,000 | $1,053.40 | $5.80 | $1,019.14 | $5.71 | 1.14% | ||||||||||||||||||
1. Expenses are equal to the annualized expense ratio for the six-month period as indicated above — in the far right column — multiplied by the simple average account value over the period indicated, and then multiplied by 181/365 to reflect the one-half year period.
2. Reflects expenses after fee waivers and expense reimbursements. Does not include any ongoing expenses of the Contract for which the Fund is an investment option or acquired fund fees and expenses.
| FGR-6 | Semiannual Report |
FRANKLIN TEMPLETON VARIABLE INSURANCE PRODUCTS TRUST
Financial Highlights
Franklin Global Real Estate VIP Fund
| Six Months Ended June 30, 2017 | Year Ended December 31, | |||||||||||||||||||||||
| (unaudited) | 2016 | 2015 | 2014 | 2013 | 2012 | |||||||||||||||||||
| Class 1 | ||||||||||||||||||||||||
| Per share operating performance (for a share outstanding throughout the period) | ||||||||||||||||||||||||
Net asset value, beginning of period | $15.83 | $15.93 | $16.36 | $14.29 | $14.66 | $11.47 | ||||||||||||||||||
|
| |||||||||||||||||||||||
| Income from investment operationsa: | ||||||||||||||||||||||||
Net investment incomeb | (— | )c | 0.30 | d | 0.24 | 0.26 | 0.24 | 0.25 | ||||||||||||||||
Net realized and unrealized gains (losses) | 0.86 | (0.16 | ) | (0.12 | ) | 1.92 | 0.13 | 2.94 | ||||||||||||||||
|
| |||||||||||||||||||||||
Total from investment operations | 0.86 | 0.14 | 0.12 | 2.18 | 0.37 | 3.19 | ||||||||||||||||||
|
| |||||||||||||||||||||||
| Less distributions from net investment income and net foreign currency gains | (0.56 | ) | (0.24 | ) | (0.55 | ) | (0.11 | ) | (0.74 | ) | — | |||||||||||||
|
| |||||||||||||||||||||||
Net asset value, end of period | $16.13 | $15.83 | $15.93 | $16.36 | $14.29 | $14.66 | ||||||||||||||||||
|
| |||||||||||||||||||||||
Total returne | 5.34% | 0.81% | 0.83% | 15.27% | 2.61% | 27.81% | ||||||||||||||||||
| Ratios to average net assetsf | ||||||||||||||||||||||||
Expenses before waiver and payments by affiliates | 1.14% | 1.11% | 1.11% | 1.10% | 1.10% | 1.11% | ||||||||||||||||||
Expenses net of waiver and payments by affiliates | 1.14% | g | 1.11% | g | 1.11% | 1.10% | h | 1.10% | 1.07% | |||||||||||||||
Net investment income | 0.03% | 1.99% | d | 1.49% | 1.66% | 1.62% | 1.92% | |||||||||||||||||
| Supplemental data | ||||||||||||||||||||||||
Net assets, end of period (000’s) | $802 | $821 | $32,161 | $35,686 | $34,276 | $38,329 | ||||||||||||||||||
Portfolio turnover rate | 14.32% | 28.53% | i | 23.35% | 16.67% | 21.29% | 22.29% | |||||||||||||||||
aThe amount shown for a share outstanding throughout the period may not correlate with the Statement of Operations for the period due to the timing of sales and repurchases of the Fund’s shares in relation to income earned and/or fluctuating fair value of the investments of the Fund.
bBased on average daily shares outstanding.
cAmount rounds to less than $0.01 per share.
dNet investment income per share includes approximately $0.06 per share related to income received in the form of special dividends in connection with certain Fund holdings. Excluding this amount, the ratio of net investment income to average net assets would have been 1.59%.
eTotal return does not include fees, charges or expenses imposed by the variable annuity and life insurance contracts for which Franklin Templeton Variable Insurance Products Trust serves as an underlying investment vehicle. Total return is not annualized for periods less than one year.
fRatios are annualized for periods less than one year.
gBenefit of waiver and payments by affiliates rounds to less than 0.01%.
hBenefit of expense reduction rounds to less than 0.01%.
iExcludes the value of portfolio securities delivered as a result of redemption in-kind. See Note 9.
| The accompanying notes are an integral part of these financial statements. | Semiannual Report | FGR-7 |
FRANKLIN TEMPLETON VARIABLE INSURANCE PRODUCTS TRUST
FINANCIAL HIGHLIGHTS
Franklin Global Real Estate VIP Fund (continued)
Six Months Ended June 30, 2017 | Year Ended December 31, | |||||||||||||||||||||||
| (unaudited) | 2016 | 2015 | 2014 | 2013 | 2012 | |||||||||||||||||||
| Class 2 | ||||||||||||||||||||||||
Per share operating performance (for a share outstanding throughout the period) | ||||||||||||||||||||||||
Net asset value, beginning of period | $15.42 | $15.52 | $15.95 | $13.93 | $14.27 | $11.20 | ||||||||||||||||||
|
| |||||||||||||||||||||||
| Income from investment operationsa: | ||||||||||||||||||||||||
Net investment income (loss)b | (0.02 | ) | 0.28 | c | 0.20 | 0.21 | 0.20 | 0.21 | ||||||||||||||||
Net realized and unrealized gains (losses) | 0.83 | (0.19 | ) | (0.12 | ) | 1.88 | 0.13 | 2.86 | ||||||||||||||||
|
| |||||||||||||||||||||||
Total from investment operations | 0.81 | 0.09 | 0.08 | 2.09 | 0.33 | 3.07 | ||||||||||||||||||
|
| |||||||||||||||||||||||
Less distributions from net investment income and net foreign currency gains | (0.50 | ) | (0.19 | ) | (0.51 | ) | (0.07 | ) | (0.67 | ) | — | |||||||||||||
|
| |||||||||||||||||||||||
Net asset value, end of period | $15.73 | $15.42 | $15.52 | $15.95 | $13.93 | $14.27 | ||||||||||||||||||
|
| |||||||||||||||||||||||
Total returnd | 5.19% | 0.54% | 0.57% | 15.01% | 2.32% | 27.41% | ||||||||||||||||||
| Ratios to average net assetse | ||||||||||||||||||||||||
Expenses before waiver and payments by affiliates | 1.39% | 1.36% | 1.36% | 1.35% | 1.35% | 1.36% | ||||||||||||||||||
Expenses net of waiver and payments by affiliates | 1.39% | f | 1.36% | f | 1.36% | 1.35% | g | 1.35% | 1.32% | |||||||||||||||
Net investment income (loss) | (0.22)% | 1.74% | c | 1.24% | 1.41% | 1.37% | 1.67% | |||||||||||||||||
| Supplemental data | ||||||||||||||||||||||||
Net assets, end of period (000’s) | $188,888 | $193,707 | $287,473 | $333,554 | $328,825 | $344,044 | ||||||||||||||||||
Portfolio turnover rate | 14.32% | 28.53% | h | 23.35% | 16.67% | 21.29% | 22.29% | |||||||||||||||||
aThe amount shown for a share outstanding throughout the period may not correlate with the Statement of Operations for the period due to the timing of sales and repurchases of the Fund’s shares in relation to income earned and/or fluctuating fair value of the investments of the Fund.
bBased on average daily shares outstanding.
cNet investment income per share includes approximately $0.06 per share related to income received in the form of special dividends in connection with certain Fund holdings. Excluding this amount, the ratio of net investment income to average net assets would have been 1.34%.
dTotal return does not include fees, charges or expenses imposed by the variable annuity and life insurance contracts for which Franklin Templeton Variable Insurance Products Trust serves as an underlying investment vehicle. Total return is not annualized for periods less than one year.
eRatios are annualized for periods less than one year.
fBenefit of waiver and payments by affiliates rounds to less than 0.01%.
gBenefit of expense reduction rounds to less than 0.01%.
hExcludes the value of portfolio securities delivered as a result of redemption in-kind. See Note 9.
| FGR-8 | Semiannual Report | The accompanying notes are an integral part of these financial statements. |
FRANKLIN TEMPLETON VARIABLE INSURANCE PRODUCTS TRUST
Statement of Investments, June 30, 2017 (unaudited)
Franklin Global Real Estate VIP Fund
| ||||||||||||||
| Country | Shares | Value | ||||||||||||
| Common Stocks 99.7% | ||||||||||||||
| Diversified Real Estate Activities 11.8% | ||||||||||||||
CapitaLand Ltd. | Singapore | 845,895 | $ | 2,150,372 | ||||||||||
City Developments Ltd. | Singapore | 209,847 | 1,635,429 | |||||||||||
Mitsubishi Estate Co. Ltd. | Japan | 242,456 | 4,512,438 | |||||||||||
Mitsui Fudosan Co. Ltd. | Japan | 229,878 | 5,477,957 | |||||||||||
New World Development Co. Ltd. | Hong Kong | 1,915,585 | 2,431,360 | |||||||||||
Sun Hung Kai Properties Ltd. | Hong Kong | 241,171 | 3,542,930 | |||||||||||
Tokyo Tatemono Co. Ltd. | Japan | 131,232 | 1,717,327 | |||||||||||
The Wharf Holdings Ltd. | Hong Kong | 108,818 | 901,735 | |||||||||||
|
| |||||||||||||
| 22,369,548 | ||||||||||||||
|
| |||||||||||||
| Diversified REITs 8.3% | ||||||||||||||
Activia Properties Inc. | Japan | 262 | 1,119,180 | |||||||||||
GPT Group | Australia | 433,608 | 1,596,784 | |||||||||||
Hispania Activos Inmobiliarios SOCIMI SA | Spain | 110,674 | 1,829,892 | |||||||||||
Hulic REIT Inc. | Japan | 593 | 925,203 | |||||||||||
Kenedix Office Investment Corp. | Japan | 295 | 1,573,543 | |||||||||||
Land Securities Group PLC | United Kingdom | 176,731 | 2,331,936 | |||||||||||
Stockland | Australia | 538,813 | 1,814,369 | |||||||||||
United Urban Investment Corp. | Japan | 797 | 1,137,205 | |||||||||||
VEREIT Inc. | United States | 269,070 | 2,190,230 | |||||||||||
Washington REIT | United States | 38,300 | 1,221,770 | |||||||||||
|
| |||||||||||||
| 15,740,112 | ||||||||||||||
|
| |||||||||||||
| Health Care REITs 6.8% | ||||||||||||||
CareTrust REIT Inc. | United States | 65,100 | 1,206,954 | |||||||||||
HCP Inc. | United States | 101,789 | 3,253,177 | |||||||||||
Physicians Realty Trust | United States | 66,381 | 1,336,913 | |||||||||||
Ventas Inc. | United States | 38,617 | 2,683,109 | |||||||||||
Welltower Inc. | United States | 59,676 | 4,466,749 | |||||||||||
|
| |||||||||||||
| 12,946,902 | ||||||||||||||
|
| |||||||||||||
| Hotel & Resort REITs 3.2% | ||||||||||||||
Hoshino Resorts REIT Inc. | Japan | 132 | 677,103 | |||||||||||
Host Hotels & Resorts Inc. | United States | 132,006 | 2,411,750 | |||||||||||
Summit Hotel Properties Inc. | United States | 91,714 | 1,710,466 | |||||||||||
Sunstone Hotel Investors Inc. | United States | 80,709 | 1,301,029 | |||||||||||
|
| |||||||||||||
| 6,100,348 | ||||||||||||||
|
| |||||||||||||
| Hotels, Resorts & Cruise Lines 0.5% | ||||||||||||||
Hilton Worldwide Holdings Inc. | United States | 16,114 | 996,651 | |||||||||||
|
| |||||||||||||
| Industrial REITs 9.3% | ||||||||||||||
First Industrial Realty Trust Inc. | United States | 63,353 | 1,813,163 | |||||||||||
Frasers Logistics & Industrial Trust | Singapore | 1,029,466 | 807,542 | |||||||||||
Goodman Group | Australia | 412,174 | 2,493,841 | |||||||||||
Mapletree Logistics Trust | Singapore | 973,265 | 844,750 | |||||||||||
Nippon Prologis REIT Inc. | Japan | 616 | 1,311,023 | |||||||||||
PLA Administradora Industrial S de RL de CV | Mexico | 572,307 | 1,053,602 | |||||||||||
Prologis Inc. | United States | 89,469 | 5,246,462 | |||||||||||
Rexford Industrial Realty Inc. | United States | 56,674 | 1,555,135 | |||||||||||
Segro PLC | United Kingdom | 405,089 | 2,581,257 | |||||||||||
|
| |||||||||||||
| 17,706,775 | ||||||||||||||
|
| |||||||||||||
| Semiannual Report | FGR-9 |
FRANKLIN TEMPLETON VARIABLE INSURANCE PRODUCTS TRUST
STATEMENT OF INVESTMENTS (UNAUDITED)
Franklin Global Real Estate VIP Fund (continued)
| Country | Shares | Value | ||||||||||||
| Common Stocks (continued) | ||||||||||||||
| Office REITs 11.5% | ||||||||||||||
Alexandria Real Estate Equities Inc. | United States | 25,821 | $ | 3,110,656 | ||||||||||
Boston Properties Inc. | United States | 25,385 | 3,122,863 | |||||||||||
Brandywine Realty Trust | United States | 91,195 | 1,598,648 | |||||||||||
Derwent London PLC | United Kingdom | 40,021 | 1,383,513 | |||||||||||
Dexus | Australia | 303,103 | 2,209,082 | |||||||||||
Highwoods Properties Inc. | United States | 24,910 | 1,263,186 | |||||||||||
Japan Real Estate Investment Corp. | Japan | 308 | 1,530,622 | |||||||||||
Kilroy Realty Corp. | United States | 32,044 | 2,408,107 | |||||||||||
SL Green Realty Corp. | United States | 21,322 | 2,255,868 | |||||||||||
Vornado Realty Trust | United States | 30,127 | 2,828,925 | |||||||||||
|
| |||||||||||||
| 21,711,470 | ||||||||||||||
|
| |||||||||||||
| Real Estate Development 2.6% | ||||||||||||||
Cheung Kong Property Holdings Ltd. | Hong Kong | 524,127 | 4,104,943 | |||||||||||
| a | Howard Hughes Corp. | United States | 6,740 | 827,941 | ||||||||||
|
| |||||||||||||
| 4,932,884 | ||||||||||||||
|
| |||||||||||||
| Real Estate Operating Companies 7.9% | ||||||||||||||
ADO Properties SA | Germany | 13,736 | 581,077 | |||||||||||
| b | ADO Properties SA, 144A | Germany | 34,747 | 1,469,910 | ||||||||||
BUWOG AG | Austria | 64,135 | 1,842,810 | |||||||||||
Deutsche Wohnen AG | Germany | 87,288 | 3,339,111 | |||||||||||
Fabege AB | Sweden | 74,304 | 1,429,347 | |||||||||||
First Capital Realty Inc. | Canada | 57,764 | 880,621 | |||||||||||
Hemfosa Fastigheter AB | Sweden | 101,802 | 1,100,039 | |||||||||||
Hufvudstaden AB, A | Sweden | 79,945 | 1,326,167 | |||||||||||
Hysan Development Co. Ltd. | Hong Kong | 276,065 | 1,317,079 | |||||||||||
Vonovia SE | Germany | 42,576 | 1,690,707 | |||||||||||
|
| |||||||||||||
| 14,976,868 | ||||||||||||||
|
| |||||||||||||
| Residential REITs 12.1% | ||||||||||||||
American Homes 4 Rent, A | United States | 110,313 | 2,489,765 | |||||||||||
AvalonBay Communities Inc. | United States | 25,989 | 4,994,306 | |||||||||||
Camden Property Trust | United States | 19,800 | 1,693,098 | |||||||||||
Canadian Apartment Properties REIT | Canada | 66,775 | 1,729,458 | |||||||||||
Equity Lifestyle Properties Inc. | United States | 28,058 | 2,422,528 | |||||||||||
Equity Residential | United States | 60,533 | 3,984,887 | |||||||||||
Essex Property Trust Inc. | United States | 5,352 | 1,376,909 | |||||||||||
Mid-America Apartment Communities Inc. | United States | 26,600 | 2,803,108 | |||||||||||
Unite Group PLC | United Kingdom | 178,309 | 1,507,344 | |||||||||||
|
| |||||||||||||
| 23,001,403 | ||||||||||||||
|
| |||||||||||||
| Retail REITs 19.3% | ||||||||||||||
Agree Realty Corp. | United States | 21,721 | 996,342 | |||||||||||
GGP Inc. | United States | 97,474 | 2,296,488 | |||||||||||
Hammerson PLC | United Kingdom | 226,019 | 1,691,334 | |||||||||||
Kimco Realty Corp. | United States | 34,449 | 632,139 | |||||||||||
Klepierre | France | 52,307 | 2,144,045 | |||||||||||
Link REIT | Hong Kong | 378,237 | 2,877,561 | |||||||||||
The Macerich Co. | United States | 10,289 | 597,379 | |||||||||||
National Retail Properties Inc. | United States | 14,433 | 564,330 | |||||||||||
Realty Income Corp. | United States | 49,917 | 2,754,420 | |||||||||||
Regency Centers Corp. | United States | 39,939 | 2,501,779 | |||||||||||
Retail Properties of America Inc., A | United States | 94,400 | 1,152,624 | |||||||||||
| FGR-10 | Semiannual Report |
FRANKLIN TEMPLETON VARIABLE INSURANCE PRODUCTS TRUST
STATEMENT OF INVESTMENTS (UNAUDITED)
Franklin Global Real Estate VIP Fund (continued)
| Country | Shares | Value | ||||||||||||
| Common Stocks (continued) | ||||||||||||||
| Retail REITs (continued) | ||||||||||||||
Scentre Group | Australia | 860,027 | $ | 2,677,815 | ||||||||||
Simon Property Group Inc | United States | 48,226 | 7,801,038 | |||||||||||
Smart REIT | Canada | 41,430 | 1,026,680 | |||||||||||
Unibail-Rodamco SE | France | 17,354 | 4,373,858 | |||||||||||
Weingarten Realty Investors | United States | �� | 50,029 | 1,505,873 | ||||||||||
Westfield Corp | Australia | 148,018 | 913,784 | |||||||||||
|
| |||||||||||||
| 36,507,489 | ||||||||||||||
|
| |||||||||||||
Specialized REITs 6.4% | ||||||||||||||
American Tower Corp | United States | 10,300 | 1,362,896 | |||||||||||
Coresite Realty Corp | United States | 17,269 | 1,787,859 | |||||||||||
CubeSmart | United States | 47,193 | 1,134,520 | |||||||||||
CyrusOne Inc | United States | 21,467 | 1,196,785 | |||||||||||
Digital Realty Trust Inc | United States | 27,968 | 3,158,986 | |||||||||||
Public Storage | United States | 16,244 | 3,387,361 | |||||||||||
| 12,028,407 | ||||||||||||||
|
| |||||||||||||
| Total Common Stocks (Cost $129,191,453) | 189,018,857 | |||||||||||||
|
| |||||||||||||
| Principal Amount | ||||||||||||||
| Short Term Investments (Cost $207,476) 0.1% | ||||||||||||||
| Repurchase Agreements 0.1% | ||||||||||||||
| c | Joint Repurchase Agreement, 1.058%, 7/03/17 (Maturity Value $207,494) | |||||||||||||
BNP Paribas Securities Corp. (Maturity Value $93,098) | ||||||||||||||
Collateralized by U.S. Government Agency Securities, 0.875% - 1.875%, 12/15/17 - 6/11/21; dU.S. Treasury Bill, 11/30/17 - 1/04/18; and U.S. Treasury Note, 0.75% - 4.00%, 4/30/18 - 8/15/21 (valued at $211,840) | United States | $ | 207,476 | 207,476 | ||||||||||
|
| |||||||||||||
Total Investments (Cost $129,398,929) 99.8% | 189,226,333 | |||||||||||||
Other Assets, less Liabilities 0.2% | 463,341 | |||||||||||||
|
| |||||||||||||
Net Assets 100.0% | $ | 189,689,674 | ||||||||||||
|
| |||||||||||||
See Abbreviations on page FGR-22.
aNon-income producing.
bSecurity was purchased pursuant to Rule 144A under the Securities Act of 1933 and may be sold in transactions exempt from registration only to qualified institutional buyers or in a public offering registered under the Securities Act of 1933. This security has been deemed liquid under guidelines approved by the Trust’s Board of Trustees. At June 30, 2017, the value of this security was $1,469,910, representing 0.8% of net assets.
cSee Note 1(c) regarding joint repurchase agreement.
dThis security was issued on a discount basis with no stated coupon rate.
| The accompanying notes are an integral part of these financial statements. | Semiannual Report | FGR-11 |
FRANKLIN TEMPLETON VARIABLE INSURANCE PRODUCTS TRUST
Financial Statements
Statement of Assets and Liabilities
June 30, 2017 (unaudited)
| Franklin Global Real Estate VIP Fund | ||||
Assets: | ||||
Investments in securities: | ||||
Cost - Unaffiliated issuers | $ | 129,191,453 | ||
Cost - Repurchase agreements | 207,476 | |||
|
| |||
Total cost of investments. | $ | 129,398,929 | ||
|
| |||
Value - Unaffiliated issuers | $ | 189,018,857 | ||
Value - Repurchase agreements | 207,476 | |||
|
| |||
Total value of investments | 189,226,333 | |||
Cash | 55,325 | |||
Receivables: | ||||
Investment securities sold | 429,335 | |||
Capital shares sold | 529 | |||
Dividends | 779,887 | |||
European Union tax reclaims. | 82,199 | |||
Other assets | 126 | |||
|
| |||
Total assets | 190,573,734 | |||
|
| |||
Liabilities: | ||||
Payables: | ||||
Investment securities purchased | 367,200 | |||
Capital shares redeemed | 203,277 | |||
Management fees | 166,429 | |||
Distribution fees | 79,728 | |||
Trustees’ fees and expenses | 192 | |||
Accrued expenses and other liabilities | 67,234 | |||
|
| |||
Total liabilities | 884,060 | |||
|
| |||
Net assets, at value | $ | 189,689,674 | ||
|
| |||
Net assets consist of: | ||||
Paid-in capital | $ | 340,305,133 | ||
Distributions in excess of net investment income | (2,770,728 | ) | ||
Net unrealized appreciation (depreciation) | 59,828,763 | |||
Accumulated net realized gain (loss) | (207,673,494 | ) | ||
|
| |||
Net assets, at value | $ | 189,689,674 | ||
|
| |||
| Class 1: | ||||
Net assets, at value | $ | 801,627 | ||
|
| |||
Shares outstanding | 49,710 | |||
|
| |||
Net asset value and maximum offering price per share. | $ | 16.13 | ||
|
| |||
| Class 2: | ||||
Net assets, at value | $ | 188,888,047 | ||
|
| |||
Shares outstanding | 12,008,868 | |||
|
| |||
Net asset value and maximum offering price per share. | $ | 15.73 | ||
|
| |||
| FGR-12 | Semiannual Report | The accompanying notes are an integral part of these financial statements. |
FRANKLIN TEMPLETON VARIABLE INSURANCE PRODUCTS TRUST
FINANCIAL STATEMENTS
Statement of Operations
for the six months ended June 30, 2017 (unaudited)
Franklin Global Real Estate VIP Fund | ||||
Investment income: | ||||
Dividends (net of foreign taxes of $146,295) | $ | 1,110,636 | ||
Interest | 1,271 | |||
Income from securities loaned (net of fees and rebates) | 9,550 | |||
|
| |||
Total investment income | 1,121,457 | |||
|
| |||
Expenses: | ||||
Management fees (Note 3a) | 1,005,398 | |||
Distribution fees – Class 2 (Note 3c) | 237,484 | |||
Custodian fees (Note 4) | 9,829 | |||
Reports to shareholders | 28,362 | |||
Professional fees | 38,048 | |||
Trustees’ fees and expenses | 665 | |||
Other | 6,258 | |||
|
| |||
Total expenses | 1,326,044 | |||
Expenses waived/paid by affiliates (Note 3e) | (590 | ) | ||
|
| |||
Net expenses | 1,325,454 | |||
|
| |||
Net investment income (loss) | (203,997 | ) | ||
|
| |||
Realized and unrealized gains (losses): | ||||
Net realized gain (loss) from: | ||||
Investments | 5,610,610 | |||
Realized gain distributions from REITs | 2,007,071 | |||
Foreign currency transactions | 14,486 | |||
|
| |||
Net realized gain (loss) | 7,632,167 | |||
|
| |||
Net change in unrealized appreciation (depreciation) on: | ||||
Investments | 2,304,001 | |||
Translation of other assets and liabilities denominated in foreign currencies | 16,278 | |||
|
| |||
Net change in unrealized appreciation (depreciation) | 2,320,279 | |||
|
| |||
Net realized and unrealized gain (loss) | 9,952,446 | |||
|
| |||
Net increase (decrease) in net assets resulting from operations | $ | 9,748,449 | ||
|
| |||
| The accompanying notes are an integral part of these financial statements. | Semiannual Report | FGR-13 |
FRANKLIN TEMPLETON VARIABLE INSURANCE PRODUCTS TRUST
FINANCIAL STATEMENTS
Statements of Changes in Net Assets
| Franklin Global Real Estate VIP Fund | ||||||||
| Six Months Ended June 30, 2017 (unaudited) | Year Ended 2016 | |||||||
Increase (decrease) in net assets: | ||||||||
Operations: | ||||||||
Net investment income (loss) | $ | (203,997 | ) | $ | 5,028,687 | |||
Net realized gain (loss) | 7,632,167 | 52,315,717 | ||||||
Net change in unrealized appreciation (depreciation) | 2,320,279 | (53,945,685 | ) | |||||
|
| |||||||
Net increase (decrease) in net assets resulting from operations | 9,748,449 | 3,398,719 | ||||||
|
| |||||||
Distributions to shareholders from: | ||||||||
Net investment income: | ||||||||
Class 1 | (26,726 | ) | (442,226 | ) | ||||
Class 2 | (5,862,949 | ) | (3,274,922 | ) | ||||
|
| |||||||
Total distributions to shareholders | (5,889,675 | ) | (3,717,148 | ) | ||||
|
| |||||||
Capital share transactions: (Note 2) | ||||||||
Class 1 | (34,056 | ) | (31,539,337 | ) | ||||
Class 2 | (8,663,027 | ) | (93,248,371 | ) | ||||
|
| |||||||
Total capital share transactions | (8,697,083 | ) | (124,787,708 | ) | ||||
|
| |||||||
Net increase (decrease) in net assets. | (4,838,309 | ) | (125,106,137 | ) | ||||
Net assets: | ||||||||
Beginning of period | 194,527,983 | 319,634,120 | ||||||
|
| |||||||
End of period | $ | 189,689,674 | $ | 194,527,983 | ||||
|
| |||||||
Undistributed net investment income included in net assets: | ||||||||
End of period | $ | — | $ | 3,322,944 | ||||
|
| |||||||
Distributions in excess of net investment income included in net assets: | ||||||||
End of period | $ | (2,770,728 | ) | $ | — | |||
|
| |||||||
| FGR-14 | Semiannual Report | The accompanying notes are an integral part of these financial statements. |
FRANKLIN TEMPLETON VARIABLE INSURANCE PRODUCTS TRUST
Notes to Financial Statements (unaudited)
Franklin Global Real Estate VIP Fund
1. Organization and Significant Accounting Policies
Franklin Templeton Variable Insurance Products Trust (Trust) is registered under the Investment Company Act of 1940 (1940 Act) as an open-end management investment company, consisting of eighteen separate funds and applies the specialized accounting and reporting guidance in U.S. Generally Accepted Accounting Principles (U.S. GAAP). Franklin Global Real Estate VIP Fund (Fund) is included in this report. Shares of the Fund are generally sold only to insurance company separate accounts to fund the benefits of variable life insurance policies or variable annuity contracts. At June 30, 2017, 85.9% of the Fund’s shares were held through one insurance company. Investment activities of these insurance company separate accounts could have a material impact on the Fund. The Fund offers two classes of shares: Class 1 and Class 2. Each class of shares may differ by its distribution fees, voting rights on matters affecting a single class and its exchange privilege.
The following summarizes the Fund’s significant accounting policies.
a. Financial Instrument Valuation
The Fund’s investments in financial instruments are carried at fair value daily. Fair value is the price that would be received to sell an asset or paid to transfer a liability in an orderly transaction between market participants on the measurement date. The Fund calculates the net asset value (NAV) per share as of 4 p.m. Eastern time each day the New York Stock Exchange (NYSE) is open for trading. Under compliance policies and procedures approved by the Trust’s Board of Trustees (the Board), the Fund’s administrator has responsibility for oversight of valuation, including leading the cross-functional Valuation Committee (VC). The VC provides administration and oversight of the Fund’s valuation policies and procedures, which are approved annually by the Board. Among other things, these procedures allow the Fund to utilize independent pricing services, quotations from securities and financial instrument dealers, and other market sources to determine fair value.
Equity securities listed on an exchange or on the NASDAQ National Market System are valued at the last quoted sale price or the official closing price of the day, respectively. Foreign equity securities are valued as of the close of trading on the foreign stock exchange on which the security is primarily traded, or as of 4 p.m. Eastern time. The value is then converted
into its U.S. dollar equivalent at the foreign exchange rate in effect at 4 p.m. Eastern time on the day that the value of the security is determined. Over-the-counter (OTC) securities are valued within the range of the most recent quoted bid and ask prices. Securities that trade in multiple markets or on multiple exchanges are valued according to the broadest and most representative market. Certain equity securities are valued based upon fundamental characteristics or relationships to similar securities.
Investments in open-end mutual funds are valued at the closing NAV. Investments in repurchase agreements are valued at cost, which approximates fair value.
The Fund has procedures to determine the fair value of financial instruments for which market prices are not reliable or readily available. Under these procedures, the VC convenes on a regular basis to review such financial instruments and considers a number of factors, including significant unobservable valuation inputs, when arriving at fair value. The VC primarily employs a market-based approach which may use related or comparable assets or liabilities, recent transactions, market multiples, book values, and other relevant information for the investment to determine the fair value of the investment. An income-based valuation approach may also be used in which the anticipated future cash flows of the investment are discounted to calculate fair value. Discounts may also be applied due to the nature or duration of any restrictions on the disposition of the investments. Due to the inherent uncertainty of valuations of such investments, the fair values may differ significantly from the values that would have been used had an active market existed. The VC employs various methods for calibrating these valuation approaches including a regular review of key inputs and assumptions, transactional back-testing or disposition analysis, and reviews of any related market activity.
Trading in securities on foreign securities stock exchanges and OTC markets may be completed before 4 p.m. Eastern time. In addition, trading in certain foreign markets may not take place on every Fund’s business day. Occasionally, events occur between the time at which trading in a foreign security is completed and 4 p.m. Eastern time that might call into question the reliability of the value of a portfolio security held by the Fund. As a result, differences may arise between the value of the Fund’s portfolio securities as determined at the foreign market close and the latest indications of value at 4 p.m. Eastern time. In order to minimize the potential for these differences, the VC monitors price movements following the close of
| Semiannual Report | FGR-15 |
FRANKLIN TEMPLETON VARIABLE INSURANCE PRODUCTS TRUST
NOTES TO FINANCIAL STATEMENTS (UNAUDITED)
Franklin Global Real Estate VIP Fund (continued)
1. Organization and Significant Accounting Policies (continued)
a. Financial Instrument Valuation (continued)
trading in foreign stock markets through a series of country specific market proxies (such as baskets of American Depositary Receipts, futures contracts and exchange traded funds). These price movements are measured against established trigger thresholds for each specific market proxy to assist in determining if an event has occurred that may call into question the reliability of the values of the foreign securities held by the Fund. If such an event occurs, the securities may be valued using fair value procedures, which may include the use of independent pricing services.
When the last day of the reporting period is a non-business day, certain foreign markets may be open on those days that the Fund’s NAV is not calculated, which could result in differences between the value of the Fund’s portfolio securities on the last business day and the last calendar day of the reporting period. Any significant security valuation changes due to an open foreign market are adjusted and reflected by the Fund for financial reporting purposes.
b. Foreign Currency Translation
Portfolio securities and other assets and liabilities denominated in foreign currencies are translated into U.S. dollars based on the exchange rate of such currencies against U.S. dollars on the date of valuation. The Fund may enter into foreign currency exchange contracts to facilitate transactions denominated in a foreign currency. Purchases and sales of securities, income and expense items denominated in foreign currencies are translated into U.S. dollars at the exchange rate in effect on the transaction date. Portfolio securities and assets and liabilities denominated in foreign currencies contain risks that those currencies will decline in value relative to the U.S. dollar. Occasionally, events may impact the availability or reliability of foreign exchange rates used to convert the U.S. dollar equivalent value. If such an event occurs, the foreign exchange rate will be valued at fair value using procedures established and approved by the Board.
The Fund does not separately report the effect of changes in foreign exchange rates from changes in market prices on securities held. Such changes are included in net realized and unrealized gain or loss from investments in the Statement of Operations.
Realized foreign exchange gains or losses arise from sales of foreign currencies, currency gains or losses realized between the trade and settlement dates on securities transactions and the difference between the recorded amounts of dividends, interest, and foreign withholding taxes and the U.S. dollar equivalent of the amounts actually received or paid. Net unrealized foreign exchange gains and losses arise from changes in foreign exchange rates on foreign denominated assets and liabilities other than investments in securities held at the end of the reporting period.
c. Joint Repurchase Agreement
The Fund enters into a joint repurchase agreement whereby its uninvested cash balance is deposited into a joint cash account with other funds managed by the investment manager or an affiliate of the investment manager and is used to invest in one or more repurchase agreements. The value and face amount of the joint repurchase agreement are allocated to the funds based on their pro-rata interest. A repurchase agreement is accounted for as a loan by the Fund to the seller, collateralized by securities which are delivered to the Fund’s custodian. The fair value, including accrued interest, of the initial collateralization is required to be at least 102% of the dollar amount invested by the funds, with the value of the underlying securities marked to market daily to maintain coverage of at least 100%. Repurchase agreements are subject to the terms of Master Repurchase Agreements (MRAs) with approved counterparties (sellers). The MRAs contain various provisions, including but not limited to events of default and maintenance of collateral for repurchase agreements. In the event of default by either the seller or the Fund, certain MRAs may permit the non-defaulting party to net and close-out all transactions, if any, traded under such agreements. The Fund may sell securities it holds as collateral and apply the proceeds towards the repurchase price and any other amounts owed by the seller to the Fund in
the event of default by the seller. This could involve costs or delays in addition to a loss on the securities if their value falls below the repurchase price owed by the seller. The joint repurchase agreement held by the Fund at period end, as indicated in the Statement of Investments, had been entered into on June 30, 2017.
d. Securities Lending
The Fund participates in an agency based securities lending program to earn additional income. The Fund receives cash collateral against the loaned securities in an amount equal to at
| FGR-16 | Semiannual Report |
FRANKLIN TEMPLETON VARIABLE INSURANCE PRODUCTS TRUST
NOTES TO FINANCIAL STATEMENTS (UNAUDITED)
Franklin Global Real Estate VIP Fund (continued)
least 102% of the fair value of the loaned securities. Collateral is maintained over the life of the loan in an amount not less than 100% of the fair value of loaned securities, as determined at the close of Fund business each day; any additional collateral required due to changes in security values is delivered to the Fund on the next business day. The collateral is deposited into a joint cash account with other funds and is used to invest in a money market fund managed by Franklin Advisers, Inc., an affiliate of the Fund, and/or a joint repurchase agreement. The Fund may receive income from the investment of cash collateral, in addition to lending fees and rebates paid by the borrower. Income from securities loaned, net of fees paid to the securities lending agent and/or third-party vendor, is reported separately in the Statement of Operations. The Fund bears the market risk with respect to the collateral investment, securities loaned, and the risk that the agent may default on its obligations to the Fund. If the borrower defaults on its obligation to return the securities loaned, the Fund has the right to repurchase the securities in the open market using the collateral received. The securities lending agent has agreed to indemnify the Fund in the event of default by a third party borrower. At June 30, 2017, the Fund had no securities on loan.
e. Income and Deferred Taxes
It is the Fund’s policy to qualify as a regulated investment company under the Internal Revenue Code. The Fund intends to distribute to shareholders substantially all of its taxable income and net realized gains to relieve it from federal income and if applicable, excise taxes. As a result, no provision for U.S. federal income taxes is required.
The Fund may be subject to foreign taxation related to income received, capital gains on the sale of securities and certain foreign currency transactions in the foreign jurisdictions in which it invests. Foreign taxes, if any, are recorded based on the tax regulations and rates that exist in the foreign markets in which the Fund invests. When a capital gain tax is determined to apply, the Fund records an estimated deferred tax liability in an amount that would be payable if the securities were disposed of on the valuation date. As a result of several court cases, in certain countries across the European Union, the Fund filed additional tax reclaims for previously withheld taxes on dividends earned in those countries (EU reclaims). These additional filings are subject to various administrative proceedings by the local jurisdictions’ tax authorities within the European Union, as well as a number of related judicial proceedings. Income recognized, if any, for EU reclaims is
reflected as other income in the Statement of Operations and any related receivable, if any, is reflected as European Union tax reclaims in the Statement of Assets and Liabilities. When uncertainty exists as to the ultimate resolution of these proceedings, the likelihood of receipt of these EU reclaims, and the potential timing of payment, no amounts are reflected in the financial statements. For U.S. income tax purposes, when EU reclaims are received by the Fund and the Fund previously passed foreign tax credit on to its shareholders, the Fund must either amend historic tax reporting to shareholders or enter into a closing agreement with the Internal Revenue Service (IRS) in order to pay the associated tax liability on behalf of the Fund’s shareholders.
The Fund may recognize an income tax liability related to its uncertain tax positions under U.S. GAAP when the uncertain tax position has a less than 50% probability that it will be sustained upon examination by the tax authorities based on its technical merits. As of June 30, 2017, the Fund has determined that no tax liability is required in its financial statements related to uncertain tax positions for any open tax years (or expected to be taken in future tax years). Open tax years are those that remain subject to examination and are based on each tax jurisdiction’s statute of limitation.
f. Security Transactions, Investment Income, Expenses and Distributions
Security transactions are accounted for on trade date. Realized gains and losses on security transactions are determined on a specific identification basis. Interest income and estimated expenses are accrued daily. Dividend income is recorded on the ex-dividend date except for certain dividends from securities where the dividend rate is not available. In such cases, the dividend is recorded as soon as the information is received by the Fund. Distributions to shareholders are recorded on the ex-dividend date. Distributable earnings are determined according to income tax regulations (tax basis) and may differ from earnings recorded in accordance with U.S. GAAP. These differences may be permanent or temporary. Permanent differences are reclassified among capital accounts to reflect their tax character. These reclassifications have no impact on net assets or the results of operations. Temporary differences are not reclassified, as they may reverse in subsequent periods.
| Semiannual Report | FGR-17 |
FRANKLIN TEMPLETON VARIABLE INSURANCE PRODUCTS TRUST
NOTES TO FINANCIAL STATEMENTS (UNAUDITED)
Franklin Global Real Estate VIP Fund (continued)
1. Organization and Significant Accounting Policies (continued)
f. Security Transactions, Investment Income, Expenses and Distributions (continued)
Common expenses incurred by the Trust are allocated among the Funds based on the ratio of net assets of each Fund to the combined net assets of the Trust. Fund specific expenses are charged directly to the Fund that incurred the expense.
Realized and unrealized gains and losses and net investment income, not including class specific expenses, are allocated daily to each class of shares based upon the relative proportion of net assets of each class. Differences in per share distributions, by class, are generally due to differences in class specific expenses.
Distributions received by the Fund from certain securities may be a return of capital (ROC). Such distributions reduce the cost basis of the securities, and any distributions in excess of the cost basis are recognized as capital gains. For Real Estate Investment Trust (REIT) securities, the Fund records ROC estimates, if any, on the ex-dividend date and are adjusted once actual tax designations are known.
g. Accounting Estimates
The preparation of financial statements in accordance with U.S. GAAP requires management to make estimates and assumptions that affect the reported amounts of assets and liabilities at the date of the financial statements and the amounts of income and expenses during the reporting period. Actual results could differ from those estimates.
h. Guarantees and Indemnifications
Under the Trust’s organizational documents, its officers and trustees are indemnified by the Trust against certain liabilities arising out of the performance of their duties to the Trust. Additionally, in the normal course of business, the Trust, on behalf of the Fund, enters into contracts with service providers that contain general indemnification clauses. The Trust’s maximum exposure under these arrangements is unknown as this would involve future claims that may be made against the Trust that have not yet occurred. Currently, the Trust expects the risk of loss to be remote.
2. Shares of Beneficial Interest
At June 30, 2017, there were an unlimited number of shares authorized (without par value). Transactions in the Fund’s shares were as follows:
| Six Months Ended June 30, 2017 | Year Ended December 31, 2016 | |||||||||||||||||||
| Shares | Amount | Shares | Amount | |||||||||||||||||
| Class 1 Shares: | ||||||||||||||||||||
Shares sold | 1,548 | $ | 24,886 | 8,244 | $ | 135,524 | ||||||||||||||
Shares issued in reinvestment of distributions | 1,626 | 26,726 | 27,081 | 442,226 | ||||||||||||||||
Shares redeemed in-kind (Note 9) | — | — | (1,772,621 | ) | (28,376,646 | ) | ||||||||||||||
Shares redeemed | (5,344 | ) | (85,668 | ) | (230,198 | ) | (3,740,441 | ) | ||||||||||||
|
| |||||||||||||||||||
Net increase (decrease) | (2,170 | ) | $ | (34,056 | ) | (1,967,494 | ) | $ | (31,539,337 | ) | ||||||||||
|
| |||||||||||||||||||
| Class 2 Shares: | ||||||||||||||||||||
Shares sold | 90,874 | $ | 1,437,815 | 397,098 | $ | 6,351,063 | ||||||||||||||
Shares issued in reinvestment of distributions | 365,520 | 5,862,949 | 205,582 | 3,274,922 | ||||||||||||||||
Shares redeemed in-kind (Note 9) | — | — | (3,806,704 | ) | (59,402,467 | ) | ||||||||||||||
Shares redeemed | (1,008,056 | ) | (15,963,791 | ) | (2,762,366 | ) | (43,471,889 | ) | ||||||||||||
|
| |||||||||||||||||||
Net increase (decrease) | (551,662 | ) | $ | (8,663,027 | ) | (5,966,390 | ) | $ | (93,248,371 | ) | ||||||||||
|
| |||||||||||||||||||
| FGR-18 | Semiannual Report |
FRANKLIN TEMPLETON VARIABLE INSURANCE PRODUCTS TRUST
NOTES TO FINANCIAL STATEMENTS (UNAUDITED)
Franklin Global Real Estate VIP Fund (continued)
3. Transactions with Affiliates
Franklin Resources, Inc. is the holding company for various subsidiaries that together are referred to as Franklin Templeton Investments. Certain officers and trustees of the Fund are also officers and/or directors of the following subsidiaries:
| Subsidiary | Affiliation | |
Franklin Templeton Institutional, LLC (FT Institutional) | Investment manager | |
Franklin Templeton Services, LLC (FT Services) | Administrative manager | |
Franklin Templeton Distributors, Inc. (Distributors) | Principal underwriter | |
Franklin Templeton Investor Services, LLC (Investor Services) | Transfer agent |
a. Management Fees
The Fund pays an investment management fee to FT Institutional based on the average daily net assets of the Fund as follows:
| Annualized Fee Rate | Net Assets | |
1.050% | Up to and including $500 million | |
0.950% | Over $500 million, up to and including $1 billion | |
0.900% | Over $1 billion, up to and including $1.5 billion | |
0.850% | Over $1.5 billion, up to and including $6.5 billion | |
0.830% | Over $6.5 billion, up to and including $11.5 billion | |
0.810% | Over $11.5 billion, up to and including $16.5 billion | |
0.790% | Over $16.5 billion, up to and including $19 billion | |
0.780% | Over $19 billion, up to and including $21.5 billion | |
0.770% | In excess of $21.5 billion |
For the period ended June 30, 2017, the annualized effective investment management fee rate was 1.050% of the Fund’s average daily net assets.
b. Administrative Fees
Under an agreement with FT Institutional, FT Services provides administrative services to the Fund. The fee is paid by FT Institutional based on the Fund’s average daily net assets, and is not an additional expense of the Fund.
c. Distribution Fees
The Board has adopted a distribution plan for Class 2 shares pursuant to Rule 12b-1 under the 1940 Act. Under the Fund’s compensation distribution plan, the Fund pays Distributors for costs incurred in connection with the servicing, sale and distribution of the Fund’s shares up to 0.35% per year of its average daily net assets. The Board has agreed to limit the current rate to 0.25% per year for Class 2. The plan year, for purposes of monitoring compliance with the maximum annual plan rate, is February 1 through January 31.
d. Transfer Agent Fees
Investor Services, under terms of an agreement, performs shareholder servicing for the Fund and is not paid by the Fund for the services.
| Semiannual Report | FGR-19 |
FRANKLIN TEMPLETON VARIABLE INSURANCE PRODUCTS TRUST
NOTES TO FINANCIAL STATEMENTS (UNAUDITED)
Franklin Global Real Estate VIP Fund (continued)
3. Transactions with Affiliates (continued)
e. Investments in Affiliated Management Investment Companies
The Fund invests in one or more affiliated management investment companies for purposes other than exercising a controlling influence over the management or policies. Management fees paid by the Fund are waived on assets invested in the affiliated management investment companies, as noted in the Statement of Operations, in an amount not to exceed the management and administrative fees paid directly or indirectly by each affiliate. During the period ended June 30, 2017, the Fund held investments in affiliated management investment companies as follows:
| Number of Shares Held at Beginning of Period | Gross Additions | Gross Reductions | Number of Shares | Value at End of Period | Investment Income | Realized Gain (Loss) | % of Affiliated Fund Shares Outstanding Held at End of Period | |||||||||||||||||||||||||
| Non-Controlled Affiliates | ||||||||||||||||||||||||||||||||
Institutional Fiduciary Trust Money Market Portfolio, 0.58% | — | 5,292,000 | (5,292,000 | ) | — | $ | — | $ | — | $ | — | —% | ||||||||||||||||||||
|
| |||||||||||||||||||||||||||||||
4. Expense Offset Arrangement
The Fund has entered into an arrangement with its custodian whereby credits realized as a result of uninvested cash balances are used to reduce a portion of the Fund’s custodian expenses. During the period ended June 30, 2017, there were no credits earned.
5. Income Taxes
For tax purposes, capital losses may be carried over to offset future capital gains. Capital loss carryforwards with no expiration, if any, must be fully utilized before those losses with expiration dates.
At December 31, 2016, capital loss carryforwards were as follows:
Capital loss carryforwards subject to expiration: | ||||
2017 | $ | 207,448,609 | ||
2018 | 2,192,369 | |||
|
| |||
Total capital loss carryforwards | $ | 209,640,978 | ||
|
|
At June 30, 2017, the cost of investments and net unrealized appreciation (depreciation) for income tax purposes were as follows:
Cost of investments | $ | 139,851,365 | ||
|
| |||
Unrealized appreciation | $ | 62,206,332 | ||
Unrealized depreciation | (12,831,364 | ) | ||
|
| |||
Net unrealized appreciation (depreciation) | $ | 49,374,968 | ||
|
|
Differences between income and/or capital gains as determined on a book basis and a tax basis are primarily due to differing treatments of passive foreign investment company shares.
6. Investment Transactions
Purchases and sales of investments (excluding short term securities) for the period ended June 30, 2017, aggregated $27,427,507 and $38,822,258, respectively.
| FGR-20 | Semiannual Report |
FRANKLIN TEMPLETON VARIABLE INSURANCE PRODUCTS TRUST
NOTES TO FINANCIAL STATEMENTS (UNAUDITED)
Franklin Global Real Estate VIP Fund (continued)
7. Concentration of Risk
Investing in foreign securities may include certain risks and considerations not typically associated with investing in U.S. securities, such as fluctuating currency values and changing local and regional economic, political and social conditions, which may result in greater market volatility. In addition, certain foreign securities may not be as liquid as U.S. securities.
The Fund invests a large percentage of its total assets in REIT securities. Such concentration may subject the Fund to special risks associated with real estate securities. These securities may be more sensitive to economic or regulatory developments due to a variety of factors such as local, regional, national and global economic conditions, interest rates and tax considerations.
8. Credit Facility
The Fund, together with other U.S. registered and foreign investment funds (collectively, Borrowers), managed by Franklin Templeton Investments, are borrowers in a joint syndicated senior unsecured credit facility totaling $2 billion (Global Credit Facility) which matures on February 9, 2018. This Global Credit Facility provides a source of funds to the Borrowers for temporary and emergency purposes, including the ability to meet future unanticipated or unusually large redemption requests.
Under the terms of the Global Credit Facility, the Fund shall, in addition to interest charged on any borrowings made by the Fund and other costs incurred by the Fund, pay its share of fees and expenses incurred in connection with the implementation and maintenance of the Global Credit Facility, based upon its relative share of the aggregate net assets of all of the Borrowers, including an annual commitment fee of 0.15% based upon the unused portion of the Global Credit Facility. These fees are reflected in other expenses in the Statement of Operations. During the period ended June 30, 2017, the Fund did not use the Global Credit Facility.
9. Redemption In-Kind
During the year ended December 31, 2016, the Fund realized $27,545,389 of net gains resulting from a redemption in-kind in which a shareholder redeemed fund shares for cash and securities held by the Fund. Because such gains are not taxable to the Fund, and are not distributed to remaining shareholders, they have been reclassified from accumulated net realized gains to paid-in capital.
10. Fair Value Measurements
The Fund follows a fair value hierarchy that distinguishes between market data obtained from independent sources (observable inputs) and the Fund’s own market assumptions (unobservable inputs). These inputs are used in determining the value of the Fund’s financial instruments and are summarized in the following fair value hierarchy:
| • | Level 1 – quoted prices in active markets for identical financial instruments |
| • | Level 2 – other significant observable inputs (including quoted prices for similar financial instruments, interest rates, prepayment speed, credit risk, etc.) |
| • | Level 3 – significant unobservable inputs (including the Fund’s own assumptions in determining the fair value of financial instruments) |
The input levels are not necessarily an indication of the risk or liquidity associated with financial instruments at that level.
For movements between the levels within the fair value hierarchy, the Fund has adopted a policy of recognizing the transfers as of the date of the underlying event which caused the movement.
| Semiannual Report | FGR-21 |
FRANKLIN TEMPLETON VARIABLE INSURANCE PRODUCTS TRUST
NOTES TO FINANCIAL STATEMENTS (UNAUDITED)
Franklin Global Real Estate VIP Fund (continued)
10. Fair Value Measurements (continued)
A summary of inputs used as of June 30, 2017, in valuing the Fund’s assets carried at fair value, is as follows:
| Level 1 | Level 2 | Level 3 | Total | |||||||||||||
| Assets: | ||||||||||||||||
Investments in Securities: | ||||||||||||||||
Equity Investmentsa | $ | 189,018,857 | $ | — | $ | — | $ | 189,018,857 | ||||||||
Short Term Investments | — | 207,476 | — | 207,476 | ||||||||||||
|
| |||||||||||||||
Total Investments in Securities | $ | 189,018,857 | $ | 207,476 | $ | — | $ | 189,226,333 | ||||||||
|
| |||||||||||||||
aFor detailed categories, see the accompanyinfg Statement of Investments.
11. Investment Company Reporting Modernization
In October 2016, the U.S. Securities and Exchange Commission adopted new rules and amended existing rules (together, final rules) intended to modernize the reporting and disclosure of information by registered investment companies. In part, the final rules amend Regulation S-X and require standardized, enhanced disclosures about derivatives in investment company financial statements, as well as other amendments. The compliance date for the amendments to Regulation S-X is August 1, 2017. Management has reviewed the requirements and believes the adoption of the amendments to Regulation S-X will not have a material impact on the Fund’s financial statements and related disclosures.
12. Subsequent Events
The Fund has evaluated subsequent events through the issuance of the financial statements and determined that no events have occurred that require disclosure.
Abbreviations
| Selected Portfolio | ||
| REIT | Real Estate Investment Trust | |
| FGR-22 | Semiannual Report |
Franklin Growth and Income VIP Fund
This semiannual report for Franklin Growth and Income VIP Fund covers the period ended June 30, 2017.
Class 1 Performance Summary as of June 30, 2017
The Fund’s Class 1 Shares delivered a +5.61% total return* for the six-month period ended June 30, 2017.
*The Fund has an expense reduction contractually guaranteed through 4/30/18. Fund investment results reflect the expense reduction; without this reduction, the results would have been lower.
Performance reflects the Fund’s Class 1 operating expenses, but does not include any contract fees, expenses or sales charges. If they had been included, performance would be lower. These charges and deductions, particularly for variable life policies, can have a significant effect on contract values and insurance benefits. See the contract prospectus for a complete description of these expenses, including sales charges.
Performance data represent past performance, which does not guarantee future results. Investment return and principal value will fluctuate, and you may have a gain or loss when you sell your shares. Current performance may differ from figures shown.
| Semiannual Report | FGI-1 |
FRANKLIN GROWTH AND INCOME VIP FUND
Fund Goal and Main Investments
The Fund seeks capital appreciation with current income as a secondary goal. Under normal market conditions, the Fund invests predominantly in equity securities, including securities convertible into common stock.
Fund Risks
All investments involve risks, including possible loss of principal. Stock prices fluctuate, sometimes rapidly and dramatically, due to factors affecting individual companies, particular industries or sectors, or general market conditions. Convertible securities are subject to the risks of stocks when the underlying stock price is high relative to the conversion price and debt securities when the underlying stock price is low relative to the conversion price. The Fund’s investment in foreign securities also involves special risks, including currency fluctuations and economic as well as political uncertainty. The Fund is actively managed but there is no guarantee that the manager’s investment decisions will produce the desired results. The Fund’s prospectus also includes a description of the main investment risks.
Performance Overview
You can find the Fund’s six-month total return in the Performance Summary. In comparison, the Fund’s benchmark, the Standard & Poor’s® 500 Index (S&P 500®), produced a +9.34% total return.1 The Fund’s peers, as measured by the Lipper VIP Equity Income Funds Classification Average, had a +5.91% total return for the same period.2
Economic and Market Overview
U.S. economic growth decelerated in 2017’s first quarter, largely due to slower growth in consumer spending and declines in private inventory investment and government spending. However, growth accelerated in the second quarter due to increases in consumer spending, business investment and federal government spending. The manufacturing sector generally expanded, and the services sector also continued to grow. The unemployment rate decreased from 4.7% in December 2016 to 4.4% at period-end.3 Monthly retail sales were volatile, but grew for most of the period. Annual inflation,
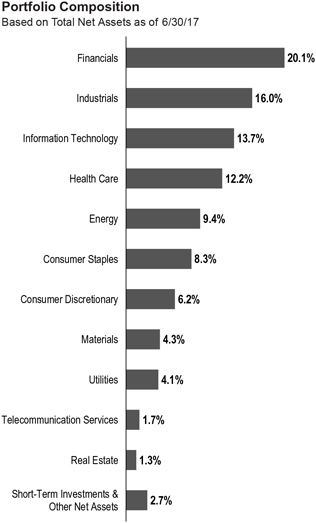
as measured by the Consumer Price Index, decreased from 2.1% to 1.6% during the period.
The U.S. Federal Reserve (Fed), at its March meeting, increased the federal funds target rate from 0.50%–0.75% to 0.75%–1.00%. The Fed again increased its target range by a quarter point to 1.00%–1.25% at its June meeting. The Fed made both of these increases amid signs of a growing U.S. economy, a strengthening labor market and an improvement in business spending.
U.S. equity markets rose during the period, benefiting from mostly upbeat economic data, better U.S. corporate earnings and signs of improvement in the Chinese and European
1. Source: Morningstar.
2. Source: Lipper, a Thomson Reuters Company.
One cannot invest directly in an index, and an index is not representative of the Fund’s portfolio. Please see Index Descriptions following the Fund Summaries.
3. Source: Bureau of Labor Statistics.
The dollar value, number of shares or principal amount, and names of all portfolio holdings are listed in the Fund’s Statement of Investments (SOI).
| FGI-2 | Semiannual Report |
FRANKLIN GROWTH AND INCOME VIP FUND
economies. Investor optimism arising from pro-growth and pro-business policy plans in the U.S. and the victory of Emmanuel Macron as France’s President also helped U.S. equities. However, concerns about the terms of the U.K.’s exit from the European Union (also known as “Brexit”), uncertainty about President Trump’s ability to implement reforms, and geopolitical tensions in the Middle East and the Korean peninsula curbed market sentiment. The broad U.S. stock market, as measured by the S&P 500, generated a +9.34% total return for the period.1
The 10-year Treasury yield, which moves inversely to its price, shifted throughout the period. It increased early during the period amid expectations of rate hikes by the Fed and upbeat economic data. During the latter part of the period, U.S. political uncertainty, geopolitical tensions in the Middle East and the Korean peninsula, resulted in a decline in the yield. However, in June, the yield rose again due to renewed optimism for improvement in economic growth. Overall, the U.S. Treasury yield fell from 2.45% on December 30, 2016, to 2.31% at period-end.
Investment Strategy
We seek to invest in a broadly diversified portfolio of equity securities that we consider to be financially strong, with a focus on “blue chip” companies. We apply a bottom-up approach to investing in individual securities. We will assess the market price of a company’s securities relative to our evaluation of the company’s long-term earnings, asset value and cash flow potential. We also consider a company’s price/earnings ratio, profit margins, balance sheet and liquidation value. We consider dividend yield in selecting stocks for the Fund because we believe that, over time, dividend income can contribute significantly to total return and can be a more consistent source of investment return than capital appreciation. We seek to take advantage of price dislocations that result from the market’s short-term focus and choose to invest in those companies that, in our opinion, offer the best trade-off between growth opportunity, business and financial risk, and valuation.
Manager’s Discussion
During the six months under review, most of the Fund’s sector allocations added to absolute returns, led by information technology (IT), health care and industrials. In contrast, the Fund’s energy sector allocation was the only significant detractor during the period.
In the IT sector, most of the Fund’s holdings rose in value and added to the Fund’s absolute results, led by Apple and Microsoft. Software and equipment company Apple benefited
from solid iPhone7 sales and anticipation of strong iPhone8 sales starting this fall. Software and services firm Microsoft performed well amid sustained growth in key commercial cloud initiatives, including Office 365, Azure and Dynamics 365, expanding cloud gross margins, better personal computer metrics, and good cost controls. In this favorable environment, management took the opportunity to increase the amount of capital for dividends and share repurchases — a theme we have seen across other sectors as well.
| Top 10 Holdings | ||||
| 6/30/17 | ||||
Company Sector/Industry | % of Total Net Assets | |||
JPMorgan Chase & Co. Financials | 3.9% | |||
Microsoft Corp. Information Technology | 3.6% | |||
Wells Fargo & Co. Financials | 2.9% | |||
Apple Inc. Information Technology | 2.8% | |||
U.S. Bancorp Financials | 2.6% | |||
PepsiCo Inc. Consumer Staples | 2.4% | |||
Chevron Corp. Energy | 2.4% | |||
General Electric Co. Industrials | 2.2% | |||
Raytheon Co. Industrials | 2.2% | |||
BlackRock Inc. Financials | 2.2% | |||
After underperforming in 2016, many health care sector stocks rallied, and all Fund investments in the sector gained value, led by medical technology company Medtronic and pharmaceutical company Allergan. Shares of Medtronic, which manufactures technologically-advanced medical devices, had been weak in late 2016 as growth disappointed. Medtronic’s results have since improved. Our convertible preferred stock position in Allergan was positively impacted by the company’s strong fourth-quarter 2016 results and outlook. Both revenue and earnings per share surpassed consensus forecasts.
In general, reports issued on first-quarter 2017 U.S. corporate earnings showed industrials stocks to be among the top recipients of upward revisions in terms of both earnings surprises and forward estimates. Unexpectedly high rates of profit expansion and relatively low levels of earnings misses for such firms played a fundamental role in supporting several
| Semiannual Report | FGI-3 |
FRANKLIN GROWTH AND INCOME VIP FUND
of the sector’s underlying equities held by the Fund. Most of the Fund’s industrials sector holdings advanced, led by Stanley Black & Decker, Raytheon and Illinois Tool Works (ITW). Despite higher restructuring expenses and additional funding on growth investments, Stanley Black & Decker, an industrial tools and household hardware manufacturer, reported better-than-expected quarterly results and claimed promising growth opportunities. Aerospace and defense contractor Raytheon’s stock performed well amid geopolitical destabilization, strong fundamental performance and an anticipated upturn in U.S. defense spending. Diversified industrial products and equipment manufacturer ITW posted better-than-expected earnings based on strong margin performance.
Other individual contributors to the Fund’s absolute performance included food and beverage company PepsiCo in consumer staples, bank JPMorgan Chase in financials, and consumer products manufacturer Newell Brands in consumer discretionary. Pepsi’s consistent earnings growth has been driven by impressive pricing-driven growth in its salty snacks business, as well as new price-pack architecture in its carbonated soft drink business. JPMorgan benefited from higher interest rates, solid cost controls and it passed its annual regulatory stress tests, adding to the firm’s overall credit quality and providing it with greater latitude to return excess capital to shareholders in the future through share buybacks and dividend increases. Shares of Newell Brands, a manufacturer of a wide range of well-known consumer and commercial products, rallied from increased first-quarter sales and earnings helped by the sales of its tools business, acquisition-related cost savings, international growth and strong e-commerce results.
As crude oil officially tipped into a bear market, given a West Texas Intermediate oil per-barrel price decline of about 20% in June 2017 from recent peak levels during March, energy equities suffered in tandem. The Fund’s energy sector holdings notably underperformed as oil prices fell, due mainly to disappointing supply/demand fundamentals despite the Organization of the Petroleum Exporting Countries’ (OPEC’s) decision to extend its global production-curtailment agreement. Increased drilling activity and rising U.S. shale oil production even in the face of lower prices caused oil supply growth to exceed expectations. This in turn prevented oil inventories from declining as much as anticipated, despite continued steady oil demand growth. Declines among the Fund’s energy sector positions were led by oil and gas exploration and production companies Chevron, Suncor Energy and Anadarko Petroleum,
and oilfield services provider Schlumberger. Investor sentiment about Anadarko was also negatively affected by an accident involving one of its assets.
Other individual detractors from the Fund’s absolute results included industrial conglomerate General Electric (GE) in industrials, Target and Mattel4 in consumer discretionary, and diversified telecommunication services provider Verizon Communications in telecommunication services. Shares of GE declined amid concerns about free cash flow, oil price volatility and guidance by the outgoing chief executive officer at the lower end of expectations. Target’s shares were negatively impacted by softer holiday traffic in stores and a decision to invest more heavily into the business, which will impact its profit margin profile. Similarly, Mattel’s holiday results were disappointing and the company’s efforts to improve the business appeared to us to be more challenging. Verizon has continued to face intense competition that has led the industry into unlimited data packages.
Thank you for your participation in Franklin Growth and Income VIP Fund. We look forward to serving your future investment needs.
The foregoing information reflects our analysis, opinions and portfolio holdings as of June 30, 2017, the end of the reporting period. The way we implement our main investment strategies and the resulting portfolio holdings may change depending on factors such as market and economic conditions. These opinions may not be relied upon as investment advice or an offer for a particular security. The information is not a complete analysis of every aspect of any market, country, industry, security or the Fund. Statements of fact are from sources considered reliable, but the investment manager makes no representation or warranty as to their completeness or accuracy. Although historical performance is no guarantee of future results, these insights may help you understand our investment management philosophy.
4. Not held at period-end.
| FGI-4 | Semiannual Report |
FRANKLIN GROWTH AND INCOME VIP FUND
Class 1 Fund Expenses
As an investor in a variable insurance contract (Contract) that indirectly provides for investment in an underlying mutual fund, you can incur transaction and/or ongoing expenses at both the Fund level and the Contract Level: (1) transaction expenses can include sales charges (loads) on purchases, surrender fees, transfer fees and premium taxes; and (2) ongoing expenses can include management fees, distribution and service (12b-1) fees, contract fees, annual maintenance fees, mortality and expense risk fees and other fees and expenses. All mutual funds and Contracts have some types of ongoing expenses. The table below shows Fund-level ongoing expenses and can help you understand these costs and compare them with those of other mutual funds offered through the Contract. The table assumes a $1,000 investment held for the six months indicated. Please refer to the Fund prospectus for additional information on operating expenses.
Actual Fund Expenses
The table below provides information about the actual account values and actual expenses in the columns under the heading “Actual.” In these columns the Fund’s actual return, which includes the effect of ongoing Fund expenses but does not include the effect of ongoing Contract expenses, is used to calculate the “Ending Account Value.” You can estimate the Fund-level expenses you paid during the period by following these steps (of course, your account value and expenses will differ from those in this illustration): Divide your account value by $1,000 (if your account had an $8,600 value, then $8,600 ÷ $1,000 = 8.6). Then multiply the result by the number under the headings “Actual” and “Fund-Level Expenses Paid During Period” (if Fund-Level Expenses Paid During Period were $7.50, then 8.6 × $7.50 = $64.50). In this illustration, the estimated expenses paid this period at the Fund level are $64.50.
Hypothetical Example for Comparison with Other Mutual Funds
Under the heading “Hypothetical” in the table, information is provided about hypothetical account values and hypothetical expenses based on the Fund’s actual expense ratio and an assumed rate of return of 5% per year before expenses, which is not the Fund’s actual return. This information may not be used to estimate the actual ending account balance or expenses you paid for the period, but it can help you compare ongoing costs of investing in the Fund with those of other mutual funds offered through the Contract. To do so, compare this 5% hypothetical example with the 5% hypothetical examples that appear in the shareholder reports of other funds offered through the Contract.
Please note that expenses shown in the table are meant to highlight ongoing costs at the Fund level only and do not reflect any ongoing expenses at the Contract level, or transaction expenses at either the Fund or Contract levels. In addition, while the Fund does not have transaction expenses, if the transaction and ongoing expenses at the Contract level were included, the expenses shown below would be higher. You should consult your Contract prospectus or disclosure document for more information.
| Actual (actual return after expenses) | Hypothetical (5% annual return before expenses) | |||||||||||||||||||||||
| Share Class | | Beginning Account Value 1/1/17 | | | Ending Account Value 6/30/17 | | | Fund-Level Expenses Paid During Period 1/1/17–6/30/17 | 1,2 | | Ending Account Value 6/30/17 | | | Fund-Level Expenses Paid During Period 1/1/17–6/30/17 | 1,2 | | Net Annualized Expense Ratio | 2 | ||||||
Class 1 | $1,000 | $1,056.10 | $3.01 | $1,021.87 | $2.96 | 0.59% | ||||||||||||||||||
1. Expenses are equal to the annualized expense ratio for the six-month period as indicated above — in the far right column — multiplied by the simple average account value over the period indicated, and then multiplied by 181/365 to reflect the one-half year period.
2. Reflects expenses after fee waivers and expense reimbursements. Does not include any ongoing expenses of the Contract for which the Fund is an investment option.
| Semiannual Report | FGI-5 |
FRANKLIN TEMPLETON VARIABLE INSURANCE PRODUCTS TRUST
Financial Highlights
Franklin Growth and Income VIP Fund
| Six Months Ended June 30, 2017 | Year Ended December 31, | |||||||||||||||||||||||
| (unaudited) | 2016 | 2015 | 2014 | 2013 | 2012 | |||||||||||||||||||
| Class 1 | ||||||||||||||||||||||||
Per share operating performance (for a share outstanding throughout the period) | ||||||||||||||||||||||||
Net asset value, beginning of period | $15.97 | $15.94 | $17.02 | $15.97 | $12.64 | $11.60 | ||||||||||||||||||
|
| |||||||||||||||||||||||
| Income from investment operationsa: | ||||||||||||||||||||||||
Net investment incomeb | 0.16 | 0.40 | 0.45 | 0.53 | c | 0.33 | 0.35 | |||||||||||||||||
Net realized and unrealized gains (losses) | 0.75 | 1.33 | (0.54 | ) | 0.95 | 3.40 | 1.08 | |||||||||||||||||
|
| |||||||||||||||||||||||
Total from investment operations | 0.91 | 1.73 | (0.09 | ) | 1.48 | 3.73 | 1.43 | |||||||||||||||||
|
| |||||||||||||||||||||||
| Less distributions from: | ||||||||||||||||||||||||
Net investment income | (1.03 | ) | (0.46 | ) | (0.61 | ) | (0.43 | ) | (0.40 | ) | (0.39 | ) | ||||||||||||
Net realized gains | (1.01 | ) | (1.24 | ) | (0.38 | ) | — | — | — | |||||||||||||||
|
| |||||||||||||||||||||||
Total distributions | (2.04 | ) | (1.70 | ) | (0.99 | ) | (0.43 | ) | (0.40 | ) | (0.39 | ) | ||||||||||||
|
| |||||||||||||||||||||||
Net asset value, end of period | $14.84 | $15.97 | $15.94 | $17.02 | $15.97 | $12.64 | ||||||||||||||||||
|
| |||||||||||||||||||||||
Total returnd | 5.61% | 11.86% | (0.62)% | 9.40% | 29.96% | 12.53% | ||||||||||||||||||
| Ratios to average net assetse | ||||||||||||||||||||||||
Expenses before waiver and payments by affiliates | 0.72% | 0.59% | 0.58% | 0.57% | 0.58% | 0.60% | ||||||||||||||||||
Expenses net of waiver and payments by affiliates | 0.59% | 0.59% | f,g | 0.58% | 0.57% | f | 0.58% | f | 0.60% | |||||||||||||||
Net investment income | 2.02% | 2.38% | 2.74% | 3.26% | c | 2.29% | 2.86% | |||||||||||||||||
| Supplemental data | ||||||||||||||||||||||||
Net assets, end of period (000’s) | $33,505 | $29,829 | $144,663 | $168,961 | $175,860 | $154,463 | ||||||||||||||||||
Portfolio turnover rate | 15.56% | 40.59% | h | 48.81% | 20.54% | 35.16% | 30.00% | |||||||||||||||||
aThe amount shown for a share outstanding throughout the period may not correlate with the Statement of Operations for the period due to the timing of sales and repurchases of the Fund’s shares in relation to income earned and/or fluctuating fair value of the investments of the Fund.
bBased on average daily shares outstanding.
cNet investment income per share includes approximately $0.12 per share related to income received in the form of special dividends in connection with certain Fund holdings. Excluding this amount, the ratio of net investment income to average net assets would have been 2.53%.
dTotal return does not include fees, charges or expenses imposed by the variable annuity and life insurance contracts for which Franklin Templeton Variable Insurance Products Trust serves as an underlying investment vehicle. Total return is not annualized for periods less than one year.
eRatios are annualized for periods less than one year.
fBenefit of expense reduction rounds to less than 0.01%.
gBenefit of waiver and payments by affiliates rounds to less than 0.01%.
hExcludes the value of portfolio securities delivered as a result of a redemption in-kind. See Note 8.
| FGI-6 | Semiannual Report | The accompanying notes are an integral part of these financial statements. |
FRANKLIN TEMPLETON VARIABLE INSURANCE PRODUCTS TRUST
FINANCIAL HIGHLIGHTS
Franklin Growth and Income VIP Fund (continued)
| Six Months Ended June 30, 2017 | Year Ended December 31, | |||||||||||||||||||||||
| (unaudited) | 2016 | 2015 | 2014 | 2013 | 2012 | |||||||||||||||||||
| Class 2 | ||||||||||||||||||||||||
Per share operating performance (for a share outstanding throughout the period) | ||||||||||||||||||||||||
Net asset value, beginning of period | $15.69 | $15.68 | $16.76 | $15.73 | $12.46 | $11.44 | ||||||||||||||||||
|
| |||||||||||||||||||||||
| Income from investment operationsa: | ||||||||||||||||||||||||
Net investment incomeb | 0.14 | 0.30 | 0.40 | 0.48 | c | 0.29 | 0.32 | |||||||||||||||||
Net realized and unrealized gains (losses) | 0.74 | 1.37 | (0.54 | ) | 0.94 | 3.35 | 1.05 | |||||||||||||||||
|
| |||||||||||||||||||||||
Total from investment operations | 0.88 | 1.67 | (0.14 | ) | 1.42 | 3.64 | 1.37 | |||||||||||||||||
|
| |||||||||||||||||||||||
| Less distributions from: | ||||||||||||||||||||||||
Net investment income | (0.97 | ) | (0.42 | ) | (0.56 | ) | (0.39 | ) | (0.37 | ) | (0.35 | ) | ||||||||||||
Net realized gains | (1.01 | ) | (1.24 | ) | (0.38 | ) | — | — | — | |||||||||||||||
|
| |||||||||||||||||||||||
Total distributions | (1.98 | ) | (1.66 | ) | (0.94 | ) | (0.39 | ) | (0.37 | ) | (0.35 | ) | ||||||||||||
|
| |||||||||||||||||||||||
Net asset value, end of period | $14.59 | $15.69 | $15.68 | $16.76 | $15.73 | $12.46 | ||||||||||||||||||
|
| |||||||||||||||||||||||
Total returnd | 5.51% | 11.62% | (0.91)% | 9.14% | 29.60% | 12.23% | ||||||||||||||||||
| Ratios to average net assetse | ||||||||||||||||||||||||
Expenses before waiver and payments by affiliates | 0.97% | 0.84% | 0.83% | 0.82% | 0.83% | 0.85% | ||||||||||||||||||
Expenses net of waiver and payments by affiliates | 0.84% | 0.84% | f,g | 0.83% | 0.82% | f | 0.83% | f | 0.85% | |||||||||||||||
Net investment income | 1.77% | 2.13% | 2.49% | 3.01% | c | 2.04% | 2.61% | |||||||||||||||||
| Supplemental data | ||||||||||||||||||||||||
Net assets, end of period (000’s) | $73,078 | $69,474 | $124,691 | $138,191 | $150,966 | $131,400 | ||||||||||||||||||
Portfolio turnover rate | 15.56% | 40.59% | h | 48.81% | 20.54% | 35.16% | 30.00% | |||||||||||||||||
aThe amount shown for a share outstanding throughout the period may not correlate with the Statement of Operations for the period due to the timing of sales and repurchases of the Fund’s shares in relation to income earned and/or fluctuating fair value of the investments of the Fund.
bBased on average daily shares outstanding.
cNet investment income per share includes approximately $0.12 per share related to income received in the form of special dividends in connection with certain Fund holdings. Excluding this amount, the ratio of net investment income to average net assets would have been 2.28%.
dTotal return does not include fees, charges or expenses imposed by the variable annuity and life insurance contracts for which Franklin Templeton Variable Insurance Products Trust serves as an underlying investment vehicle. Total return is not annualized for periods less than one year.
eRatios are annualized for periods less than one year.
fBenefit of expense reduction rounds to less than 0.01%.
gBenefit of waiver and payments by affiliates rounds to less than 0.01%.
hExcludes the value of portfolio securities delivered as a result of a redemption in-kind. See Note 8.
| The accompanying notes are an integral part of these financial statements. | Semiannual Report | FGI-7 |
FRANKLIN TEMPLETON VARIABLE INSURANCE PRODUCTS TRUST
Statement of Investments, June 30, 2017 (unaudited)
| Franklin Growth and Income VIP Fund | ||||||||||||||
| Country | Shares | Value | ||||||||||||
Common Stocks 85.6% | ||||||||||||||
Consumer Discretionary 5.0% | ||||||||||||||
Ford Motor Co. | United States | 56,807 | $ | 635,670 | ||||||||||
L Brands Inc. | United States | 10,800 | 582,012 | |||||||||||
Lowe’s Cos. Inc. | United States | 21,848 | 1,693,876 | |||||||||||
Newell Brands Inc. | United States | 28,119 | 1,507,741 | |||||||||||
Target Corp. | United States | 16,880 | 882,655 | |||||||||||
|
| |||||||||||||
| 5,301,954 | ||||||||||||||
|
| |||||||||||||
Consumer Staples 8.3% | ||||||||||||||
Anheuser-Busch InBev SA/NV, ADR | Belgium | 9,837 | 1,085,611 | |||||||||||
CVS Health Corp. | United States | 14,884 | 1,197,567 | |||||||||||
The Kraft Heinz Co. | United States | 18,481 | 1,582,713 | |||||||||||
PepsiCo Inc. | United States | 22,598 | 2,609,843 | |||||||||||
The Procter & Gamble Co. | United States | 14,500 | 1,263,675 | |||||||||||
Wal-Mart Stores Inc. | United States | 14,000 | 1,059,520 | |||||||||||
|
| |||||||||||||
| 8,798,929 | ||||||||||||||
|
| |||||||||||||
Energy 8.6% | ||||||||||||||
Anadarko Petroleum Corp. | United States | 18,718 | 848,674 | |||||||||||
Baker Hughes Inc. | United States | 13,000 | 708,630 | |||||||||||
BP PLC, ADR | United Kingdom | 12,786 | 443,035 | |||||||||||
Chevron Corp. | United States | 24,968 | 2,604,911 | |||||||||||
Exxon Mobil Corp. | United States | 18,277 | 1,475,502 | |||||||||||
Royal Dutch Shell PLC, A, ADR | United Kingdom | 19,113 | 1,016,621 | |||||||||||
Schlumberger Ltd. | United States | 14,457 | 951,849 | |||||||||||
Suncor Energy Inc. | Canada | 38,282 | 1,117,834 | |||||||||||
|
| |||||||||||||
| 9,167,056 | ||||||||||||||
|
| |||||||||||||
Financials 18.9% | ||||||||||||||
Arthur J. Gallagher & Co. | United States | 18,666 | 1,068,628 | |||||||||||
Bank of America Corp. | United States | 46,800 | 1,135,368 | |||||||||||
BB&T Corp. | United States | 36,176 | 1,642,752 | |||||||||||
BlackRock Inc. | United States | 5,461 | 2,306,781 | |||||||||||
The Charles Schwab Corp. | United States | 4,703 | 202,041 | |||||||||||
JPMorgan Chase & Co. | United States | 45,774 | 4,183,744 | |||||||||||
MetLife Inc. | United States | 30,000 | 1,648,200 | |||||||||||
Morgan Stanley | United States | 47,437 | 2,113,793 | |||||||||||
U.S. Bancorp. | United States | 53,255 | 2,765,000 | |||||||||||
Wells Fargo & Co. | United States | 55,750 | 3,089,107 | |||||||||||
|
| |||||||||||||
| 20,155,414 | ||||||||||||||
|
| |||||||||||||
Health Care 8.5% | ||||||||||||||
Eli Lilly & Co. | United States | 21,037 | 1,731,345 | |||||||||||
Johnson & Johnson | United States | 6,765 | 894,942 | |||||||||||
Medtronic PLC. | United States | 25,881 | 2,296,939 | |||||||||||
Merck & Co. Inc. | United States | 11,000 | 704,990 | |||||||||||
Pfizer Inc. | United States | 57,963 | 1,946,977 | |||||||||||
UnitedHealth Group Inc. | United States | 8,000 | 1,483,360 | |||||||||||
|
| |||||||||||||
| 9,058,553 | ||||||||||||||
|
| |||||||||||||
Industrials 16.0% | ||||||||||||||
Cummins Inc. | United States | 7,969 | 1,292,731 | |||||||||||
Deere & Co. | United States | 6,742 | 833,244 | |||||||||||
General Electric Co. | United States | 88,532 | 2,391,249 | |||||||||||
Illinois Tool Works Inc. | United States | 11,111 | 1,591,651 | |||||||||||
Lockheed Martin Corp. | United States | 6,169 | 1,712,576 | |||||||||||
| FGI-8 | Semiannual Report |
FRANKLIN TEMPLETON VARIABLE INSURANCE PRODUCTS TRUST
STATEMENT OF INVESTMENTS (UNAUDITED)
Franklin Growth and Income VIP Fund (continued)
| Country | Shares | Value | ||||||||||||
| Common Stocks (continued) | ||||||||||||||
| Industrials (continued) | ||||||||||||||
Norfolk Southern Corp. | United States | 7,300 | $ | 888,410 | ||||||||||
Raytheon Co. | United States | 14,416 | 2,327,896 | |||||||||||
Republic Services Inc. | United States | 31,980 | 2,038,085 | |||||||||||
Stanley Black & Decker Inc. | United States | 9,932 | 1,397,730 | |||||||||||
United Parcel Service Inc., B | United States | 8,317 | 919,777 | |||||||||||
United Technologies Corp. | United States | 13,634 | 1,664,848 | |||||||||||
|
| |||||||||||||
| 17,058,197 | ||||||||||||||
|
| |||||||||||||
| Information Technology 10.7% | ||||||||||||||
Apple Inc. | United States | 13,832 | 1,992,084 | |||||||||||
Broadcom Ltd. | United States | 3,241 | 755,315 | |||||||||||
Cisco Systems Inc. | United States | 47,289 | 1,480,146 | |||||||||||
Intel Corp. | United States | 20,962 | 707,258 | |||||||||||
Microsoft Corp. | United States | 55,576 | 3,830,854 | |||||||||||
Oracle Corp. | United States | 15,829 | 793,666 | |||||||||||
Texas Instruments Inc. | United States | 24,496 | 1,884,477 | |||||||||||
|
| |||||||||||||
| 11,443,800 | ||||||||||||||
|
| |||||||||||||
| Materials 4.2% | ||||||||||||||
BASF SE | Germany | 13,937 | 1,290,916 | |||||||||||
The Dow Chemical Co. | United States | 26,073 | 1,644,424 | |||||||||||
International Paper Co. | United States | 28,220 | 1,597,534 | |||||||||||
|
| |||||||||||||
| 4,532,874 | ||||||||||||||
|
| |||||||||||||
| Real Estate 1.3% | ||||||||||||||
Host Hotels & Resorts Inc. | United States | 73,141 | 1,336,286 | |||||||||||
|
| |||||||||||||
| Telecommunication Services 1.7% | ||||||||||||||
Rogers Communications Inc., B | Canada | 16,744 | 790,484 | |||||||||||
Verizon Communications Inc. | United States | 23,610 | 1,054,423 | |||||||||||
|
| |||||||||||||
| 1,844,907 | ||||||||||||||
|
| |||||||||||||
| Utilities 2.4% | ||||||||||||||
Dominion Energy Inc. | United States | 13,604 | 1,042,475 | |||||||||||
Xcel Energy Inc. | United States | 32,796 | 1,504,680 | |||||||||||
|
| |||||||||||||
| 2,547,155 | ||||||||||||||
|
| |||||||||||||
Total Common Stocks (Cost $66,460,271) | 91,245,125 | |||||||||||||
|
| |||||||||||||
| a | Equity-Linked Securities 6.8% | |||||||||||||
| Consumer Discretionary 1.2% | ||||||||||||||
| b | Wells Fargo Bank National Assn. into Amazon.com Inc., 5.00%, 144A | United States | 1,500 | 1,332,592 | ||||||||||
|
| |||||||||||||
| Energy 0.4% | ||||||||||||||
| b | Merrill Lynch International & Co. CV into Schlumberger Ltd., 7.00%, 144A | United States | 6,000 | 414,755 | ||||||||||
|
| |||||||||||||
| Financials 1.2% | ||||||||||||||
| b | UBS AG London into The Charles Schwab Corp., 6.50%, 144A | United States | 30,000 | 1,258,015 | ||||||||||
|
| |||||||||||||
| Health Care 0.9% | ||||||||||||||
| b | Merrill Lynch International & Co. CV into Gilead Sciences Inc., 7.25%, 144A | United States | 13,000 | 931,294 | ||||||||||
|
| |||||||||||||
| Semiannual Report | FGI-9 |
FRANKLIN TEMPLETON VARIABLE INSURANCE PRODUCTS TRUST
STATEMENT OF INVESTMENTS (UNAUDITED)
Franklin Growth and Income VIP Fund (continued)
| Country | Shares | Value | ||||||||||||
| a | Equity-Linked Securities (continued) | |||||||||||||
| Information Technology 3.1% | ||||||||||||||
| b | Barclays Bank PLC into Broadcom Ltd., 7.50%, 144A | United States | 4,500 | $ | 1,028,515 | |||||||||
| b | Goldman Sachs International into Apple Inc., 6.00%, 144A | United States | 7,000 | 1,042,216 | ||||||||||
| b | UBS AG into Intel Corp., 7.00%, 144A | United States | 35,000 | 1,198,446 | ||||||||||
|
| |||||||||||||
| 3,269,177 | ||||||||||||||
|
| |||||||||||||
| Total Equity-Linked Securities (Cost $7,245,362) | 7,205,833 | |||||||||||||
|
| |||||||||||||
| Convertible Preferred Stocks 4.9% | ||||||||||||||
| Energy 0.4% | ||||||||||||||
Hess Corp., 8.00%, cvt. pfd | United States | 8,500 | 472,770 | |||||||||||
|
| |||||||||||||
| Health Care 2.8% | ||||||||||||||
Allergan PLC, 5.50%, cvt. pfd | United States | 2,051 | 1,780,432 | |||||||||||
Becton Dickinson and Co., 6.125%, cvt. pfd., A | United States | 21,500 | 1,177,770 | |||||||||||
|
| |||||||||||||
| 2,958,202 | ||||||||||||||
|
| |||||||||||||
| Utilities 1.7% | ||||||||||||||
NextEra Energy Inc., 6.371%, cvt. pfd | United States | 28,277 | 1,813,687 | |||||||||||
|
| |||||||||||||
| Total Convertible Preferred Stocks (Cost $5,060,340) | 5,244,659 | |||||||||||||
|
| |||||||||||||
| Total Investments before Short Term Investments | ||||||||||||||
| (Cost $78,765,973) | 103,695,617 | |||||||||||||
|
| |||||||||||||
| Principal Amount | ||||||||||||||
| Short Term Investments (Cost $2,556,389) 2.4% | ||||||||||||||
| Repurchase Agreements 2.4% | ||||||||||||||
| c | Joint Repurchase Agreement, 1.058%, 7/03/17 (Maturity Value $2,556,614) | |||||||||||||
BNP Paribas Securities Corp. (Maturity Value $1,147,102) | ||||||||||||||
Collateralized by U.S. Government Agency Securities, | United States | $ | 2,556,389 | 2,556,389 | ||||||||||
|
| |||||||||||||
Total Investments (Cost $81,322,362) 99.7% | 106,252,006 | |||||||||||||
Other Assets, less Liabilities 0.3% | 330,240 | |||||||||||||
|
| |||||||||||||
Net Assets 100.0% | $ | 106,582,246 | ||||||||||||
|
| |||||||||||||
See Abbreviations on page FGI-20.
aSee Note 1(d) regarding equity-linked securities.
bSecurity was purchased pursuant to Rule 144A under the Securities Act of 1933 and may be sold in transactions exempt from registration only to qualified institutional buyers or in a public offering registered under the Securities Act of 1933. These securities have been deemed liquid under guidelines approved by the Trust’s Board of Trustees. At June 30, 2017, the aggregate value of these securities was $7,205,833, representing 6.8% of net assets.
cSee Note 1(c) regarding joint repurchase agreement.
dThe security was issued on a discount basis with no stated coupon rate.
| FGI-10 | Semiannual Report | The accompanying notes are an integral part of these financial statements. | |||
FRANKLIN TEMPLETON VARIABLE INSURANCE PRODUCTS TRUST
Financial Statements
Statement of Assets and Liabilities
June 30, 2017 (unaudited)
Franklin Growth and Income VIP Fund | ||||
Assets: | ||||
Investments in securities: | ||||
Cost - Unaffiliated issuers | $ | 78,765,973 | ||
Cost - Repurchase agreements | 2,556,389 | |||
|
| |||
Total cost of investments | $ | 81,322,362 | ||
|
| |||
Value - Unaffiliated issuers | $ | 103,695,617 | ||
Value - Repurchase agreements. | 2,556,389 | |||
|
| |||
Total value of investments | 106,252,006 | |||
Receivables: | ||||
Investment securities sold | 244,487 | |||
Capital shares sold | 36,387 | |||
Dividends | 187,132 | |||
Other assets | 66 | |||
|
| |||
Total assets | 106,720,078 | |||
|
| |||
Liabilities: | ||||
Payables: | ||||
Capital shares redeemed. | 32,833 | |||
Management fees | 43,557 | |||
Distribution fees | 30,400 | |||
Reports to shareholders | 10,007 | |||
Professional fees | 19,093 | |||
Accrued expenses and other liabilities | 1,942 | |||
|
| |||
Total liabilities. | 137,832 | |||
|
| |||
Net assets, at value | $ | 106,582,246 | ||
|
| |||
Net assets consist of: | ||||
Paid-in capital | $ | 78,748,223 | ||
Undistributed net investment income. | 898,482 | |||
Net unrealized appreciation (depreciation) | 24,929,377 | |||
Accumulated net realized gain (loss) | 2,006,164 | |||
|
| |||
Net assets, at value | $ | 106,582,246 | ||
|
| |||
| Class 1: | ||||
Net assets, at value | $ | 33,504,627 | ||
|
| |||
Shares outstanding | 2,257,392 | |||
|
| |||
Net asset value and maximum offering price per share | $ | 14.84 | ||
|
| |||
| Class 2: | ||||
Net assets, at value | $ | 73,077,619 | ||
|
| |||
Shares outstanding | 5,009,983 | |||
|
| |||
Net asset value and maximum offering price per share | $ | 14.59 | ||
|
| |||
| The accompanying notes are an integral part of these financial statements. | Semiannual Report | FGI-11 | |||||
FRANKLIN TEMPLETON VARIABLE INSURANCE PRODUCTS TRUST
FINANCIAL STATEMENTS
Statement of Operations
for the six months ended June 30, 2017 (unaudited)
| Franklin Growth and Income VIP Fund | ||||
Investment income: | ||||
Dividends | $ | 1,331,504 | ||
Interest | 12,293 | |||
|
| |||
Total investment income | 1,343,797 | |||
|
| |||
Expenses: | ||||
Management fees (Note 3a) | 319,579 | |||
Distribution fees - Class 2 (Note 3c) | 88,396 | |||
Custodian fees (Note 4) | 645 | |||
Reports to shareholders | 20,889 | |||
Professional fees | 22,083 | |||
Trustees’ fees and expenses | 420 | |||
Other | 5,747 | |||
|
| |||
Total expenses | 457,759 | |||
Expenses waived/paid by affiliates (Note 3e) | (65,377 | ) | ||
|
| |||
Net expenses | 392,382 | |||
|
| |||
Net investment income | 951,415 | |||
|
| |||
Realized and unrealized gains (losses): | ||||
Net realized gain (loss) from: | ||||
Investments | 2,054,401 | |||
Realized gain distributions from REITs | 30,229 | |||
Foreign currency transactions | 1,605 | |||
|
| |||
Net realized gain (loss) | 2,086,235 | |||
|
| |||
Net change in unrealized appreciation (depreciation) on: | ||||
Investments | 2,522,793 | |||
Translation of other assets and liabilities denominated in foreign currencies | 3,698 | |||
|
| |||
Net change in unrealized appreciation (depreciation) | 2,526,491 | |||
|
| |||
Net realized and unrealized gain (loss) | 4,612,726 | |||
|
| |||
Net increase (decrease) in net assets resulting from operations | $ | 5,564,141 | ||
|
| |||
| FGI-12 | Semiannual Report | The accompanying notes are an integral part of these financial statements. |
FRANKLIN TEMPLETON VARIABLE INSURANCE PRODUCTS TRUST
FINANCIAL STATEMENTS
Statements of Changes in Net Assets
| Franklin Growth and Income VIP Fund | ||||||||
| Six Months Ended June 30, 2017 (unaudited) | Year Ended December 31, 2016 | |||||||
Increase (decrease) in net assets: | ||||||||
Operations: | ||||||||
Net investment income | $ | 951,415 | $ | 5,508,394 | ||||
Net realized gain (loss) | 2,086,235 | 45,171,232 | ||||||
Net change in unrealized appreciation (depreciation) | 2,526,491 | (27,857,712 | ) | |||||
|
| |||||||
Net increase (decrease) in net assets resulting from operations | 5,564,141 | 22,821,914 | ||||||
|
| |||||||
Distributions to shareholders from: | ||||||||
Net investment income: | ||||||||
Class 1 | (2,052,142 | ) | (4,525,425 | ) | ||||
Class 2 | (4,282,950 | ) | (3,230,836 | ) | ||||
Net realized gains: | ||||||||
Class 1 | (2,005,313 | ) | (12,121,008 | ) | ||||
Class 2 | (4,458,397 | ) | (9,525,503 | ) | ||||
|
| |||||||
Total distributions to shareholders | (12,798,802 | ) | (29,402,772 | ) | ||||
|
| |||||||
Capital share transactions: (Note 2) | ||||||||
Class 1 | 5,975,714 | (110,461,648 | ) | |||||
Class 2 | 8,538,844 | (53,009,745 | ) | |||||
|
| |||||||
Total capital share transactions | 14,514,558 | (163,471,393 | ) | |||||
|
| |||||||
Net increase (decrease) in net assets. | 7,279,897 | (170,052,251 | ) | |||||
Net assets: | ||||||||
Beginning of period | 99,302,349 | 269,354,600 | ||||||
|
| |||||||
End of period | $ | 106,582,246 | $ | 99,302,349 | ||||
|
| |||||||
Undistributed net investment income included in net assets: | ||||||||
End of period | $ | 898,482 | $ | 6,282,159 | ||||
|
| |||||||
| The accompanying notes are an integral part of these financial statements. | Semiannual Report | FGI-13 | |||||
FRANKLIN TEMPLETON VARIABLE INSURANCE PRODUCTS TRUST
Notes to Financial Statements (unaudited)
Franklin Growth and Income VIP Fund
1. Organization and Significant Accounting Policies
Franklin Templeton Variable Insurance Products Trust (Trust) is registered under the Investment Company Act of 1940 (1940 Act) as an open-end management investment company, consisting of eighteen separate funds and applies the specialized accounting and reporting guidance in U.S. Generally Accepted Accounting Principles (U.S. GAAP). Franklin Growth and Income VIP Fund (Fund) is included in this report. Shares of the Fund are generally sold only to insurance company separate accounts to fund the benefits of variable life insurance policies or variable annuity contracts. The Fund offers two classes of shares: Class 1 and Class 2. Each class of shares may differ by its distribution fees, voting rights on matters affecting a single class, its exchange privilege.
The following summarizes the Fund’s significant accounting policies.
a. Financial Instrument Valuation
The Fund’s investments in financial instruments are carried at fair value daily. Fair value is the price that would be received to sell an asset or paid to transfer a liability in an orderly transaction between market participants on the measurement date. The Fund calculates the net asset value (NAV) per share as of 4 p.m. Eastern time each day the New York Stock Exchange (NYSE) is open for trading. Under compliance policies and procedures approved by the Trust’s Board of Trustees (the Board), the Fund’s administrator has responsibility for oversight of valuation, including leading the cross-functional Valuation Committee (VC). The VC provides administration and oversight of the Fund’s valuation policies and procedures, which are approved annually by the Board. Among other things, these procedures allow the Fund to utilize independent pricing services, quotations from securities and financial instrument dealers, and other market sources to determine fair value.
Equity securities listed on an exchange or on the NASDAQ National Market System are valued at the last quoted sale price or the official closing price of the day, respectively. Foreign equity securities are valued as of the close of trading on the foreign stock exchange on which the security is primarily traded, or as of 4 p.m. Eastern time. The value is then converted into its U.S. dollar equivalent at the foreign exchange rate in effect at 4 p.m. Eastern time on the day that the value of the security is determined. Over-the-counter (OTC) securities are valued within the range of the most recent quoted bid and ask prices.
Securities that trade in multiple markets or on multiple exchanges are valued according to the broadest and most representative market. Certain equity securities are valued based upon fundamental characteristics or relationships to similar securities.
Investments in repurchase agreements are valued at cost, which approximates fair value.
The Fund has procedures to determine the fair value of financial instruments for which market prices are not reliable or readily available. Under these procedures, the VC convenes on a regular basis to review such financial instruments and considers a number of factors, including significant unobservable valuation inputs, when arriving at fair value. The VC primarily employs a market-based approach which may use related or comparable assets or liabilities, recent transactions, market multiples, book values, and other relevant information for the investment to determine the fair value of the investment. An income-based valuation approach may also be used in which the anticipated future cash flows of the investment are discounted to calculate fair value. Discounts may also be applied due to the nature or duration of any restrictions on the disposition of the investments. Due to the inherent uncertainty of valuations of such investments, the fair values may differ significantly from the values that would have been used had an active market existed. The VC employs various methods for calibrating these valuation approaches including a regular review of key inputs and assumptions, transactional back-testing or disposition analysis, and reviews of any related market activity.
Trading in securities on foreign securities stock exchanges and OTC markets may be completed before 4 p.m. Eastern time. In addition, trading in certain foreign markets may not take place on every Fund’s business day. Occasionally, events occur between the time at which trading in a foreign security is completed and 4 p.m. Eastern time that might call into question the reliability of the value of a portfolio security held by the Fund. As a result, differences may arise between the value of the Fund’s portfolio securities as determined at the foreign market close and the latest indications of value at 4 p.m. Eastern time. In order to minimize the potential for these differences, the VC monitors price movements following the close of trading in foreign stock markets through a series of country specific market proxies (such as baskets of American Depositary Receipts, futures contracts and exchange traded funds). These price movements are measured against
| FGI-14 | Semiannual Report |
FRANKLIN TEMPLETON VARIABLE INSURANCE PRODUCTS TRUST
NOTES TO FINANCIAL STATEMENTS (UNAUDITED)
Franklin Growth and Income VIP Fund (continued)
established trigger thresholds for each specific market proxy to assist in determining if an event has occurred that may call into question the reliability of the values of the foreign securities held by the Fund. If such an event occurs, the securities may be valued using fair value procedures, which may include the use of independent pricing services.
When the last day of the reporting period is a non-business day, certain foreign markets may be open on those days that the Fund’s NAV is not calculated, which could result in differences between the value of the Fund’s portfolio securities on the last business day and the last calendar day of the reporting period. Any significant security valuation changes due to an open foreign market are adjusted and reflected by the Fund for financial reporting purposes.
b. Foreign Currency Translation
Portfolio securities and other assets and liabilities denominated in foreign currencies are translated into U.S. dollars based on the exchange rate of such currencies against U.S. dollars on the date of valuation. The Fund may enter into foreign currency exchange contracts to facilitate transactions denominated in a foreign currency. Purchases and sales of securities, income and expense items denominated in foreign currencies are translated into U.S. dollars at the exchange rate in effect on the transaction date. Portfolio securities and assets and liabilities denominated in foreign currencies contain risks that those currencies will decline in value relative to the U.S. dollar. Occasionally, events may impact the availability or reliability of foreign exchange rates used to convert the U.S. dollar equivalent value. If such an event occurs, the foreign exchange rate will be valued at fair value using procedures established and approved by the Board.
The Fund does not separately report the effect of changes in foreign exchange rates from changes in market prices on securities held. Such changes are included in net realized and unrealized gain or loss from investments in the Statement of Operations.
Realized foreign exchange gains or losses arise from sales of foreign currencies, currency gains or losses realized between the trade and settlement dates on securities transactions and the difference between the recorded amounts of dividends, interest, and foreign withholding taxes and the U.S. dollar equivalent of the amounts actually received or paid. Net unrealized foreign exchange gains and losses arise from changes in foreign
exchange rates on foreign denominated assets and liabilities other than investments in securities held at the end of the reporting period.
c. Joint Repurchase Agreement
The Fund enters into a joint repurchase agreement whereby its uninvested cash balance is deposited into a joint cash account with other funds managed by the investment manager or an affiliate of the investment manager and is used to invest in one or more repurchase agreements. The value and face amount of the joint repurchase agreement are allocated to the funds based on their pro-rata interest. A repurchase agreement is accounted for as a loan by the Fund to the seller, collateralized by securities which are delivered to the Fund’s custodian. The fair value, including accrued interest, of the initial collateralization is required to be at least 102% of the dollar amount invested by the funds, with the value of the underlying securities marked to market daily to maintain coverage of at least 100%. Repurchase agreements are subject to the terms of Master Repurchase Agreements (MRAs) with approved counterparties (sellers). The MRAs contain various provisions, including but not limited to events of default and maintenance of collateral for repurchase agreements. In the event of default by either the seller or the Fund, certain MRAs may permit the non-defaulting party to net and close-out all transactions, if any, traded under such agreements. The Fund may sell securities it holds as collateral and apply the proceeds towards the repurchase price and any other amounts owed by the seller to the Fund in the event of default by the seller. This could involve costs or delays in addition to a loss on the securities if their value falls below the repurchase price owed by the seller. The joint repurchase agreement held by the Fund at period end, as indicated in the Statement of Investments, had been entered into on June 30, 2017.
d. Equity-Linked Securities
The Fund invests in equity-linked securities. Equity-linked securities are hybrid financial instruments that generally combine both debt and equity characteristics into a single note form.
Income received from equity-linked securities is recorded as realized gains in the Statement of Operations and may be based on the performance of an underlying equity security, an equity index, or an option position. The risks of investing in equity-linked securities include unfavorable price movements in the underlying security and the credit risk of the issuing financial institution. There may be no guarantee of a return of
| Semiannual Report | FGI-15 |
FRANKLIN TEMPLETON VARIABLE INSURANCE PRODUCTS TRUST
NOTES TO FINANCIAL STATEMENTS (UNAUDITED)
Franklin Growth and Income VIP Fund (continued)
1. Organization and Significant Accounting Policies (continued)
d. Equity-Linked Securities (continued)
principal with equity-linked securities and the appreciation potential may be limited. Equity-linked securities may be more volatile and less liquid than other investments held by the Fund.
e. Income and Deferred Taxes
It is the Fund’s policy to qualify as a regulated investment company under the Internal Revenue Code. The Fund intends to distribute to shareholders substantially all of its taxable income and net realized gains to relieve it from federal income and if applicable, excise taxes. As a result, no provision for U.S. federal income taxes is required.
The Fund may be subject to foreign taxation related to income received, capital gains on the sale of securities and certain foreign currency transactions in the foreign jurisdictions in which it invests. Foreign taxes, if any, are recorded based on the tax regulations and rates that exist in the foreign markets in which the Fund invests. When a capital gain tax is determined to apply, the Fund records an estimated deferred tax liability in an amount that would be payable if the securities were disposed of on the valuation date. As a result of several court cases, in certain countries across the European Union, the Fund filed additional tax reclaims for previously withheld taxes on dividends earned in those countries (EU reclaims). These additional filings are subject to various administrative proceedings by the local jurisdictions’ tax authorities within the European Union, as well as a number of related judicial proceedings. Income recognized, if any, for EU reclaims is reflected as other income in the Statement of Operations and any related receivable, if any, is reflected as European Union tax reclaims in the Statement of Assets and Liabilities. When uncertainty exists as to the ultimate resolution of these proceedings, the likelihood of receipt of these EU reclaims, and the potential timing of payment, no amounts are reflected in the financial statements. For U.S. income tax purposes, when EU reclaims are received by the Fund and the Fund previously passed foreign tax credit on to its shareholders, the Fund must either amend historic tax reporting to shareholders or enter into a closing agreement with the Internal Revenue Service (IRS) in order to pay the associated tax liability on behalf of the Fund’s shareholders.
The Fund may recognize an income tax liability related to its uncertain tax positions under U.S. GAAP when the uncertain tax position has a less than 50% probability that it will be sustained upon examination by the tax authorities based on its technical merits. As of June 30, 2017, the Fund has determined that no tax liability is required in its financial statements related to uncertain tax positions for any open tax years (or expected to be taken in future tax years). Open tax years are those that remain subject to examination and are based on each tax jurisdiction’s statute of limitation.
f. Security Transactions, Investment Income, Expenses and Distributions
Security transactions are accounted for on trade date. Realized gains and losses on security transactions are determined on a specific identification basis. Interest income and estimated expenses are accrued daily. Dividend income and realized gain distributions are recorded on the ex-dividend date except for certain dividends from securities where the dividend rate is not available. In such cases, the dividend is recorded as soon as the information is received by the Fund. Distributions to shareholders are recorded on the ex-dividend date. Distributable earnings are determined according to income tax regulations (tax basis) and may differ from earnings recorded in accordance with U.S. GAAP. These differences may be permanent or temporary. Permanent differences are reclassified among capital accounts to reflect their tax character. These reclassifications have no impact on net assets or the results of operations. Temporary differences are not reclassified, as they may reverse in subsequent periods.
Common expenses incurred by the Trust are allocated among the Funds based on the ratio of net assets of each Fund to the combined net assets of the Trust. Fund specific expenses are charged directly to the Fund that incurred the expense.
Realized and unrealized gains and losses and net investment income, not including class specific expenses, are allocated daily to each class of shares based upon the relative proportion of net assets of each class. Differences in per share distributions, by class, are generally due to differences in class specific expenses.
g. Accounting Estimates
The preparation of financial statements in accordance with U.S. GAAP requires management to make estimates and assumptions that affect the reported amounts of assets and
| FGI-16 | Semiannual Report |
FRANKLIN TEMPLETON VARIABLE INSURANCE PRODUCTS TRUST
NOTES TO FINANCIAL STATEMENTS (UNAUDITED)
Franklin Growth and Income VIP Fund (continued)
liabilities at the date of the financial statements and the amounts of income and expenses during the reporting period. Actual results could differ from those estimates.
h. Guarantees and Indemnifications
Under the Trust’s organizational documents, its officers and trustees are indemnified by the Trust against certain liabilities arising out of the performance of their duties to the Trust.
Additionally, in the normal course of business, the Trust, on behalf of the Fund, enters into contracts with service providers that contain general indemnification clauses. The Trust’s maximum exposure under these arrangements is unknown as this would involve future claims that may be made against the Trust that have not yet occurred. Currently, the Trust expects the risk of loss to be remote.
2. Shares of Beneficial Interest
At June 30, 2017, there were an unlimited number of shares authorized (without par value). Transactions in the Fund’s shares were as follows:
| Six Months Ended June 30, 2017 | Year Ended December 31, 2016 | |||||||||||||||||||
| Shares | Amount | Shares | Amount | |||||||||||||||||
| Class 1 Shares: | ||||||||||||||||||||
Shares sold. | 188,670 | $ | 3,071,730 | 1,575,501 | $ | 23,479,446 | ||||||||||||||
Shares issued in reinvestment of distributions | 272,130 | 4,057,455 | 1,140,948 | 16,646,433 | ||||||||||||||||
Shares redeemed in-kind (Note 8) | — | — | (8,891,023 | ) | (134,564,738 | ) | ||||||||||||||
Shares redeemed | (71,318 | ) | (1,153,471 | ) | (1,034,562 | ) | (16,022,789 | ) | ||||||||||||
|
| |||||||||||||||||||
Net increase (decrease) | 389,482 | $ | 5,975,714 | (7,209,136 | ) | $ | (110,461,648 | ) | ||||||||||||
|
| |||||||||||||||||||
| Class 2 Shares: | ||||||||||||||||||||
Shares sold. | 243,235 | $ | 3,940,038 | 781,106 | $ | 11,854,554 | ||||||||||||||
Shares issued in reinvestment of distributions | 596,679 | 8,741,347 | 888,944 | 12,756,339 | ||||||||||||||||
Shares redeemed in-kind (Note 8) | — | — | (4,019,533 | ) | (59,794,978 | ) | ||||||||||||||
Shares redeemed | (258,564 | ) | (4,142,541 | ) | (1,173,608 | ) | (17,825,660 | ) | ||||||||||||
|
| |||||||||||||||||||
Net increase (decrease) | 581,350 | $ | 8,538,844 | (3,523,091 | ) | $ | (53,009,745 | ) | ||||||||||||
|
| |||||||||||||||||||
3. Transactions with Affiliates
Franklin Resources, Inc. is the holding company for various subsidiaries that together are referred to as Franklin Templeton Investments. Certain officers and trustees of the Fund are also officers and/or directors of the following subsidiaries:
| Subsidiary | Affiliation | |
Franklin Advisers, Inc. (Advisers) | Investment manager | |
Franklin Templeton Services, LLC (FT Services) | Administrative manager | |
Franklin Templeton Distributors, Inc. (Distributors) | Principal underwriter | |
Franklin Templeton Investor Services, LLC (Investor Services) | Transfer agent |
| Semiannual Report | FGI-17 |
FRANKLIN TEMPLETON VARIABLE INSURANCE PRODUCTS TRUST
NOTES TO FINANCIAL STATEMENTS (UNAUDITED)
Franklin Growth and Income VIP Fund (continued)
3. Transactions with Affiliates (continued)
a. Management Fees
The Fund pays an investment management fee to Advisers based on the average daily net assets of the Fund as follows:
| Annualized Fee Rate | Net Assets | |
0.625% | Up to and including $100 million | |
0.500% | Over $100 million, up to and including $250 million | |
0.450% | Over $250 million, up to and including $7.5 billion | |
0.440% | Over $7.5 billion, up to and including $10 billion | |
0.430% | Over $10 billion, up to and including $12.5 billion | |
0.420% | Over $12.5 billion, up to and including $15 billion | |
0.400% | In excess of $15 billion |
For the period ended June 30, 2017, the annualized effective investment management fee rate was 0.620% of the Fund’s average daily net assets.
b. Administrative Fees
Under an agreement with Advisers, FT Services provides administrative services to the Fund. The fee is paid by Advisers based on the Fund’s average daily net assets, and is not an additional expense of the Fund.
c. Distribution Fees
The Board has adopted a distribution plan for Class 2 shares pursuant to Rule 12b-1 under the 1940 Act. Under the Fund’s compensation distribution plan, the Fund pays Distributors for costs incurred in connection with the servicing, sale and distribution of the Fund’s shares up to 0.35% per year of its average daily net assets. The Board has agreed to limit the current rate to 0.25% per year for Class 2. The plan year, for purposes of monitoring compliance with the maximum annual plan rate, is February 1 through January 31.
d. Transfer Agent Fees
Investor Services, under terms of an agreement, performs shareholder servicing for the Fund and is not paid by the Fund for the services.
e. Waiver and Expense Reimbursements
Advisers has contractually agreed in advance to waive or limit its fees and to assume as its own expense certain expenses otherwise payable by the Fund so that the expenses (excluding distribution fees and acquired fund fees and expenses) for each class of the Fund do not exceed 0.64% based on the average net assets of each class (other than certain non-routine expenses or costs, including those relating to litigation, indemnification, reorganizations, and liquidations) until April 30, 2018. Total expenses waived or paid are not subject to recapture subsequent to the Fund’s fiscal year end.
In addition, Advisers has voluntarily agreed to waive or limit its fees and to assume as its own expense certain expenses otherwise payable by the Fund so that the expenses (excluding distribution fees and acquired fund fees and expenses) for each class of the Fund do not exceed 0.59% based on the average net assets of each class (other than certain non-routine expenses or costs, including those relating to litigation, indemnification, reorganizations, and liquidations). This waiver is voluntary and may be modified or discontinued by Advisers at any time, and without further notice.
| FGI-18 | Semiannual Report |
FRANKLIN TEMPLETON VARIABLE INSURANCE PRODUCTS TRUST
NOTES TO FINANCIAL STATEMENTS (UNAUDITED)
Franklin Growth and Income VIP Fund (continued)
4. Expense Offset Arrangement
The Fund has entered into an arrangement with its custodian whereby credits realized as a result of uninvested cash balances are used to reduce a portion of the Fund’s custodian expenses. During the period ended June 30, 2017, there were no credits earned.
5. Income Taxes
At June 30, 2017, the cost of investments and net unrealized appreciation (depreciation) for income tax purposes were as follows:
Cost of investments | $ | 81,405,090 | ||
|
| |||
Unrealized appreciation | $ | 26,851,061 | ||
Unrealized depreciation | (2,004,145 | ) | ||
|
| |||
Net unrealized appreciation (depreciation) | $ | 24,846,916 | ||
|
|
Differences between income and/or capital gains as determined on a book basis and a tax basis are primarily due to differing treatments of equity linked securities.
6. Investment Transactions
Purchases and sales of investments (excluding short term securities) for the period ended June 30, 2017, aggregated $19,216,352 and $15,556,636, respectively.
7. Credit Facility
The Fund, together with other U.S. registered and foreign investment funds (collectively, Borrowers), managed by Franklin Templeton Investments, are borrowers in a joint syndicated senior unsecured credit facility totaling $2 billion (Global Credit Facility) which matures on February 9, 2018. This Global Credit Facility provides a source of funds to the Borrowers for temporary and emergency purposes, including the ability to meet future unanticipated or unusually large redemption requests.
Under the terms of the Global Credit Facility, the Fund shall, in addition to interest charged on any borrowings made by the Fund and other costs incurred by the Fund, pay its share of fees and expenses incurred in connection with the implementation and maintenance of the Global Credit Facility, based upon its relative share of the aggregate net assets of all of the Borrowers, including an annual commitment fee of 0.15% based upon the unused portion of the Global Credit Facility. These fees are reflected in other expenses in the Statement of Operations. During the period ended June 30, 2017, the Fund did not use the Global Credit Facility.
8. Redemption In-Kind
During the year ended December 31, 2016, the Fund realized $38,040,305 of net gains resulting from a redemption in-kind in which a shareholder redeemed fund shares for cash and securities held by the Fund. Because such gains are not taxable to the Fund, and are not distributed to remaining shareholders, they have been reclassified from accumulated net realized gains to paid-in capital.
9. Fair Value Measurements
The Fund follows a fair value hierarchy that distinguishes between market data obtained from independent sources (observable inputs) and the Fund’s own market assumptions (unobservable inputs). These inputs are used in determining the value of the Fund’s financial instruments and are summarized in the following fair value hierarchy:
| • | Level 1 – quoted prices in active markets for identical financial instruments |
| Semiannual Report | FGI-19 |
FRANKLIN TEMPLETON VARIABLE INSURANCE PRODUCTS TRUST
NOTES TO FINANCIAL STATEMENTS (UNAUDITED)
Franklin Growth and Income VIP Fund (continued)
9. Fair Value Measurements (continued)
| • | Level 2 – other significant observable inputs (including quoted prices for similar financial instruments, interest rates, prepayment speed, credit risk, etc.) |
| • | Level 3 – significant unobservable inputs (including the Fund’s own assumptions in determining the fair value of financial instruments) |
The input levels are not necessarily an indication of the risk or liquidity associated with financial instruments at that level.
For movements between the levels within the fair value hierarchy, the Fund has adopted a policy of recognizing the transfers as of the date of the underlying event which caused the movement.
A summary of inputs used as of June 30, 2017, in valuing the Fund’s assets carried at fair value, is as follows:
| Level 1 | Level 2 | Level 3 | Total | |||||||||||||
| Assets: | ||||||||||||||||
Investments in Securities: | ||||||||||||||||
Equity Investmentsa,b | $ | 96,489,784 | $ | — | $ | — | $ | 96,489,784 | ||||||||
Equity-Linked Securitiesb | — | 7,205,833 | — | 7,205,833 | ||||||||||||
Short Term Investments | — | 2,556,389 | — | 2,556,389 | ||||||||||||
|
| |||||||||||||||
Total Investments in Securities | $ | 96,489,784 | $ | 9,762,222 | $ | — | $ | 106,252,006 | ||||||||
|
| |||||||||||||||
aIncludes common and convertible preferred stocks.
bFor detailed categories, see the accompanying Statement of Investments.
10. Investment Company Reporting Modernization
In October 2016, the U.S. Securities and Exchange Commission adopted new rules and amended existing rules (together, final rules) intended to modernize the reporting and disclosure of information by registered investment companies. In part, the final rules amend Regulation S-X and require standardized, enhanced disclosures about derivatives in investment company financial statements, as well as other amendments. The compliance date for the amendments to Regulation S-X is August 1, 2017. Management has reviewed the requirements and believes the adoption of the amendments to Regulation S-X will not have a material impact on the Fund’s financial statements and related disclosures.
11. Subsequent Events
The Fund has evaluated subsequent events through the issuance of the financial statements and determined that no events have occurred that require disclosure.
Abbreviations
| Selected Portfolio | ||||
| ADR | American Depositary Receipt | |||
| FGI-20 | Semiannual Report |
This semiannual report for Franklin Income VIP Fund covers the period ended June 30, 2017.
Class 1 Performance Summary as of June 30, 2017
The Fund’s Class 1 Shares delivered a +4.29% total return* for the six-month period ended June 30, 2017.
*Return information is based on net asset values calculated for shareholder transactions. Certain adjustments were made to the net assets of the Fund at 6/30/17 for financial reporting purposes, and as a result, the total returns based on those net asset values differ from the adjusted total returns reported in the Financial Highlights. The Fund has a fee waiver associated with any investment it makes in a Franklin Templeton money fund and/or other Franklin Templeton fund, contractually guaranteed through 4/30/18. Fund investment results reflect the fee waiver; without this waiver, the results would have been lower.
Performance reflects the Fund’s Class 1 operating expenses, but does not include any contract fees, expenses or sales charges. If they had been included, performance would be lower. These charges and deductions, particularly for variable life policies, can have a significant effect on contract values and insurance benefits. See the contract prospectus for a complete description of these expenses, including sales charges.
Performance data represent past performance, which does not guarantee future results. Investment return and principal value will fluctuate, and you may have a gain or loss when you sell your shares. Current performance may differ from figures shown.
| Semiannual Report | FI-1 |
FRANKLIN INCOME VIP FUND
Fund Goal and Main Investments
The Fund seeks to maximize income while maintaining prospects for capital appreciation. Under normal market conditions, the Fund invests in both equity and debt securities.
Fund Risks
All investments involve risks, including possible loss of principal. Stock prices fluctuate, sometimes rapidly and dramatically, due to factors affecting individual companies, particular industries or sectors, or general market conditions. The Fund’s share price and yield will be affected by interest rate movements. Bond prices generally move in the opposite direction of interest rates. Thus, as prices of bonds in the Fund adjust to a rise in interest rates, the Fund’s share price may decline. Changes in the financial strength of a bond issuer or in a bond’s credit rating may affect its value. The Fund’s portfolio includes a substantial portion of higher yielding, lower rated corporate bonds because of the relatively higher yields they offer. Floating rate loans are lower rated, higher yielding instruments, which are subject to increased risk of default and can potentially result in loss of principal. These securities carry a greater degree of credit risk relative to investment-grade securities. The Fund is actively managed but there is no guarantee that the manager’s investment decisions will produce the desired results. The Fund’s prospectus also includes a description of the main investment risks.
Performance Overview
You can find the Fund’s six-month total return in the Performance Summary. For comparison, the Fund’s equity benchmark, the Standard & Poor’s® 500 Index (S&P 500®), posted a +9.34% total return, and its fixed income benchmark, the Bloomberg Barclays U.S. Aggregate Bond Index, produced a +2.27% total return for the same period.1
Economic and Market Overview
U.S. economic growth decelerated in 2017’s first quarter, largely due to slower growth in consumer spending and declines in private inventory investment and government spending. However, growth accelerated in the second quarter due to increases in consumer spending, business investment and federal government spending. The manufacturing sector generally expanded, and the services sector also continued to
| Portfolio Composition | ||||
| 6/30/17 | ||||
| % of Total | ||||
| Net Assets | ||||
| Equity* | 55.1% | |||
| Energy | 8.2% | |||
| Utilities | 7.7% | |||
| Information Technology | 7.4% | |||
| Financials | 6.9% | |||
| Health Care | 6.6% | |||
| Industrials | 6.3% | |||
| Consumer Staples | 3.6% | |||
| Materials | 3.6% | |||
| Consumer Discretionary | 3.3% | |||
| Telecommunication Services | 1.1% | |||
| Real Estate | 0.4% | |||
| Fixed Income | 37.6% | |||
| Health Care | 8.1% | |||
| Energy | 7.0% | |||
| Consumer Discretionary | 5.0% | |||
| Financials | 3.7% | |||
| Information Technology | 2.9% | |||
| Utilities | 2.9% | |||
| Telecommunication Services | 2.8% | |||
| Industrials | 2.5% | |||
| Materials | 2.1% | |||
| Real Estate | 0.4% | |||
| Consumer Staples | 0.2% | |||
| Short-Term Investments & Other Net Assets | 7.3% | |||
*Includes convertible bonds.
grow. The unemployment rate decreased from 4.7% in December 2016 to 4.4% at period-end.2 Monthly retail sales were volatile, but grew for most of the period. Annual inflation, as measured by the Consumer Price Index, decreased from 2.1% to 1.6% during the period.
The U.S. Federal Reserve (Fed), at its March meeting, increased the federal funds target rate from 0.50%–0.75% to 0.75%–1.00%. The Fed again increased its target range by a quarter point to 1.00%–1.25% at its June meeting. The Fed made both of these increases amid signs of a growing U.S. economy, a strengthening labor market and an improvement in business spending.
1. Source: Morningstar.
One cannot invest directly in an index, and an index is not representative of the Fund’s portfolio. Please see Index Descriptions following the Fund Summaries.
2. Source: Bureau of Labor Statistics.
The dollar value, number of shares or principal amount, and names of all portfolio holdings are listed in the Fund’s Statement of Investments (SOI).
| FI-2 | Semiannual Report |
FRANKLIN INCOME VIP FUND
U.S. equity markets rose during the period, benefiting from mostly upbeat economic data, better U.S. corporate earnings and signs of improvement in the Chinese and European economies. Investor optimism arising from pro-growth and pro-business policy plans in the U.S. and the victory of Emmanuel Macron as France’s President also helped U.S. equities. However, concerns about the terms of the U.K.’s exit from the European Union (also known as “Brexit”), uncertainty about President Trump’s ability to implement reforms, and geopolitical tensions in the Middle East and the Korean peninsula curbed market sentiment. The broad U.S. stock market, as measured by the S&P 500, generated a +9.34% total return for the period.1
The 10-year Treasury yield, which moves inversely to its price, shifted throughout the period. It increased early during the period amid expectations of rate hikes by the Fed and upbeat economic data. During the latter part of the period, U.S. political uncertainty, and geopolitical tensions in the Middle East and the Korean peninsula, resulted in a decline in the yield. However, in June, the yield rose again due to renewed optimism for improvement in economic growth. Overall, the U.S. Treasury yield fell from 2.45% on December 30, 2016, to 2.31% at period-end.
Investment Strategy
We search for undervalued or out-of-favor securities we believe offer opportunities for income today and growth tomorrow. We generally perform independent analysis of the debt securities being considered for the Fund’s portfolio, rather than relying principally on ratings assigned by rating agencies. In analyzing debt and equity securities, we consider a variety of factors, including: a security’s relative value based on such factors as anticipated cash flow, interest or dividend coverage, asset coverage, and earnings prospects; the experience and strength of a company’s management; a company’s sensitivity to changes in interest rates and business conditions; a company’s debt maturity schedules and borrowing requirements; and a company’s changing financial condition and market recognition of the change.
Manager’s Discussion
During the six months under review, we adjusted the Fund’s asset mix after finding what we considered attractive opportunities in the fixed income sector, while realizing gains in our equity positions. We strategically reduced our equity weighting from 59.1% to 55.1%, and increased our fixed
| Top Five Equity Holdings | ||||
| 6/30/17 | ||||
Company Sector/Industry | % of Total Net Assets | |||
Royal Dutch Shell PLC Energy | 2.6% | |||
Wells Fargo & Co. Banks | 1.8% | |||
Chevron Corp. Energy | 1.8% | |||
General Electric Co. Industrials | 1.8% | |||
The Dow Chemical Co. Materials | 1.8% | |||
income weighting from 35.2% to 37.5%. Our cash position rose from 5.7% to 7.4% of total net assets.
Most of the Fund’s health care equities had strong performance in the first half of 2017. Pharmaceuticals, including Sanofi, AstraZeneca and Eli Lilly3 were among the top contributors, as was Medtronic, which manufactures technologically advanced medical devices. Although pharmaceutical and biotechnology stocks turned volatile as they occasionally came under selling pressure, they have collectively rebounded in 2017’s first half for a variety of reasons. Most importantly, the specter of U.S. government-mandated price caps on specialty medicines appears to have faded into the background for the time being, thereby reducing the heightened levels of policy-oriented risks that have hovered over the industry for more than a year.
Utility stocks responded positively to a combination of falling U.S. Treasury yields and robust first-quarter performance metrics within the sector, with the majority of utilities companies reporting earnings that were above analysts’ consensus expectations. As a result, most of the Fund’s related holdings — focused on large U.S. electric utility companies such as NextEra Energy and PG&E — traded higher.
In other contributing sectors, information technology (IT) dominated equities in the first half of 2017 despite selling off in June. Several holdings contributed positively to Fund returns, notably Apple, Microsoft and Oracle. Our consumer staples holdings all added to performance, with Philip Morris International as a notable contributor. Performance among industrials sector stocks was led by Deere, which reported standout results during the period and raised their outlook for the rest of the year driven by strength in their global agriculture and U.S. construction businesses. United Technologies also
3. Not held at period-end.
| Semiannual Report | FI-3 |
FRANKLIN INCOME VIP FUND
contributed to returns. Dow Chemical led contributors among materials sector companies as their merger with DuPont4 continued to move toward completion with several additional regulatory approvals, and management outlined their plan for meaningful cost and revenue synergies for the combined company.
As crude oil officially tipped into a bear market, given a West Texas Intermediate oil per-barrel price decline of about 20% in June 2017 from recent peak levels during March, energy equities suffered in tandem, while their corporate debt securities, also held by the Fund, tended to remain relatively buoyant. The Fund’s energy sector holdings notably underperformed as oil prices fell, due mainly to disappointing supply/demand fundamentals despite the Organization of the Petroleum Exporting Countries’ (OPEC’s) decision to extend its global production-curtailment agreement. Overall, increased drilling activity and rising U.S. shale oil production, even in the face of lower prices, caused oil supply growth to exceed expectations. This in turn prevented oil inventories from declining as much as anticipated, despite continued steady oil demand growth. Meanwhile, demand for natural gas was below estimates in 2017’s first half. Among the seven industries that constitute the energy sector, European integrated oil and gas companies held up much better than their U.S. counterparts and sector peers specializing in exploration, production or oilfield services. As a result, the Fund was supported by its positions in Europe-based global energy conglomerates but hindered by U.S.-based detractors such as Anadarko Petroleum, Chevron, Energy XXI Gulf Coast and Occidental Petroleum.
In other sectors, Target was the largest detractor in the consumer discretionary sector as well as for the Fund as a whole, as they transitioned to upgrading their in-store experience and online capabilities amid heightened competition from both online and brick-and-mortar peers. In the telecommunication services sector, most of the small overall decline was due to Verizon Communications. Although our industrials sector holdings contributed to overall Fund returns, General Electric was a notable detractor as it reported successive quarters of weaker-than-expected results before announcing a new chief executive officer in June. Intel and Qualcomm3 detracted from the otherwise strong returns generated by the Fund’s IT sector holdings.
Top Five Fixed Income Holdings and Senior Floating Rate Interests* | ||||
| 6/30/17 | ||||
Company Sector/Industry | % of Total Net Assets | |||
CHS/Community Health Systems Inc. Health Care | 2.5% | |||
Tenet Healthcare Corp. Health Care | 2.0% | |||
Weatherford International Ltd. Energy | 1.8% | |||
DISH DBS Corp. Consumer Discretionary | 1.7% | |||
Chesapeake Energy Corp. Energy | 1.5% | |||
*Does not include convertible bonds.
During the period, consumer non-cyclical holdings5 notably contributed to our fixed income returns, benefiting from hospital and health care facility operators CHS/Community Health Systems and Tenet Healthcare. Both holdings outperformed as investors gained comfort that any impact from a potential repeal of the Affordable Care Act would be less than initially feared, while both companies also benefited from the sale of a few of their hospital assets at attractive valuations. Similarly, our exposure to pharmaceutical companies such as Valeant Pharmaceuticals International also helped, as Valeant was also able to sell assets at attractive valuations and pay down debt, while posting improved operating results and raising guidance.
Communications6 was also a strong-performing sector, due to our exposure in Sprint and DISH DBS. The outperformance in Echostar DBS (an operating satellite company of DISH Network) and Sprint bonds was fueled by increased merger and acquisition speculation, due to a new Federal Communications Commission regime and a more favorable governmental regulatory landscape. Sprint’s earnings also surpassed market expectations with stable operating metrics and an improved liquidity profile during the period, while Echostar bonds were helped when the company used convertible securities to fund wireless spectrum purchases instead of raising debt.
Banking7 performed well, as earnings from banking institutions were relatively strong over the period. Strong earnings from
4. Not a Fund holding.
5. Consumer non-cyclical holdings are in consumer staples and health care in the fixed income section of the SOI.
6. Communications holdings are in consumer discretionary and telecommunication services in the fixed income section of the SOI.
7. Banking holdings are in financials in the fixed income section of the SOI.
| FI-4 | Semiannual Report |
FRANKLIN INCOME VIP FUND
our holdings in JPMorgan Chase and Citigroup exceeded consensus expectations as asset quality remained strong, core net interest income improved with rising interest rates, and capital markets businesses continued to produce improving results. Capital levels remained robust and ample core deposit funding continued to contribute to a positive fundamental credit profile. Both JPMorgan and Citigroup passed their annual regulatory stress tests, adding to confidence in the overall credit quality of these institutions and providing them with greater latitude to potentially return excess capital to shareholders in the future through share buybacks and dividend increases.
None of the Fund’s fixed income sector exposures detracted from performance during the period. A few of our fixed income energy positions hurt performance, as crude oil spot and futures prices were volatile during the period. Bill Barrett was one of our largest underperformers, as the company reinitiated their drilling program in late 2016 and the increase in planned capital spending for 2017 was not received favorably by the market. Although the company remained proactive at reducing debt and refinancing near-term maturities, negative sentiment increased at the end of the period, due to the retreat in oil prices. Similarly, Sanchez Energy bonds underperformed due to lower oil prices, despite a possibly transformational acquisition of assets from Anadarko Petroleum that we believe should ultimately improve the company’s long-term credit profile. However, the energy sector was still a solid performer within our overall fixed income exposure.
Our exposure to Talen Energy Supply within electric utilities also hurt performance due to unfavorable weather conditions and a poor outcome in the 2020-2021 electricity capacity auction for the PJM geographic region in the eastern U.S., where the company has more exposure. However, the weak performance from Talen was more than offset by the strong performance in our Dynegy bonds. The market apparently gained comfort that Dynegy would be able to address their large upcoming 2019 maturity from both asset sales and internally generated cash flow, and that the company might be acquired.
Thank you for your participation in Franklin Income VIP Fund. We look forward to serving your future investment needs.
The foregoing information reflects our analysis, opinions and portfolio holdings as of June 30, 2017, the end of the reporting period. The way we implement our main investment strategies and the resulting portfolio holdings may change depending on factors such as market and economic conditions. These opinions may not be relied upon as investment advice or an offer for a particular security. The information is not a complete analysis of every aspect of any market, country, industry, security or the Fund. Statements of fact are from sources considered reliable, but the investment manager makes no representation or warranty as to their completeness or accuracy. Although historical performance is no guarantee of future results, these insights may help you understand our investment management philosophy.
| Semiannual Report | FI-5 |
FRANKLIN INCOME VIP FUND
Class 1 Fund Expenses
As an investor in a variable insurance contract (Contract) that indirectly provides for investment in an underlying mutual fund, you can incur transaction and/or ongoing expenses at both the Fund level and the Contract Level: (1) transaction expenses can include sales charges (loads) on purchases, surrender fees, transfer fees and premium taxes; and (2) ongoing expenses can include management fees, distribution and service (12b-1) fees, contract fees, annual maintenance fees, mortality and expense risk fees and other fees and expenses. All mutual funds and Contracts have some types of ongoing expenses. The table below shows Fund-level ongoing expenses and can help you understand these costs and compare them with those of other mutual funds offered through the Contract. The table assumes a $1,000 investment held for the six months indicated. Please refer to the Fund prospectus for additional information on operating expenses.
Actual Fund Expenses
The table below provides information about the actual account values and actual expenses in the columns under the heading “Actual.” In these columns the Fund’s actual return, which includes the effect of ongoing Fund expenses but does not include the effect of ongoing Contract expenses, is used to calculate the “Ending Account Value.” You can estimate the Fund-level expenses you paid during the period by following these steps (of course, your account value and expenses will differ from those in this illustration): Divide your account value by $1,000 (if your account had an $8,600 value, then $8,600 ÷ $1,000 = 8.6). Then multiply the result by the number under the headings “Actual” and “Fund-Level Expenses Paid During Period” (if Fund-Level Expenses Paid During Period were $ 7.50, then 8.6 x $7.50= $64.50). In this illustration, the estimated expenses paid this period at the Fund level are $64.50.
Hypothetical Example for Comparison with Other Mutual Funds
Under the heading “Hypothetical” in the table, information is provided about hypothetical account values and hypothetical expenses based on the Fund’s actual expense ratio and an assumed rate of return of 5% per year before expenses, which is not the Fund’s actual return. This information may not be used to estimate the actual ending account balance or expenses you paid for the period, but it can help you compare ongoing costs of investing in the Fund with those of other mutual funds offered through the Contract. To do so, compare this 5% hypothetical example with the 5% hypothetical examples that appear in the shareholder reports of other funds offered through the Contract.
Please note that expenses shown in the table are meant to highlight ongoing costs at the Fund level only and do not reflect any ongoing expenses at the Contract level, or transaction expenses at either the Fund or Contract levels. In addition, while the Fund does not have transaction expenses, if the transaction and ongoing expenses at the Contract level were included, the expenses shown below would be higher. You should consult your Contract prospectus or disclosure document for more information.
| Actual (actual return after expenses) | Hypothetical (5% annual return before expenses) | |||||||||||||||||||||||
| Share Class | | Beginning Account Value 1/1/17 | | | Ending Account Value 6/30/17 | | | Fund-Level Expenses Paid During Period 1/1/17–6/30/17 | 1,2 | | Ending Account Value 6/30/17 | | | Fund-Level Expenses Paid During Period 1/1/17–6/30/17 | 1,2 | | Net Annualized Expense Ratio | 2 | ||||||
Class 1 | $ | 1,000 | $ | 1,042.90 | $ | 2.28 | $ | 1,022.56 | $ | 2.26 | 0.45% | |||||||||||||
1. Expenses are equal to the annualized expense ratio for the six-month period as indicated above — in the far right column — multiplied by the simple average account value over the period indicated, and then multiplied by 181/365 to reflect the one-half year period.
2. Reflects expenses after fee waivers and expense reimbursements. Does not include any ongoing expenses of the Contract for which the Fund is an investment option or acquired fund fees and expenses.
| FI-6 | Semiannual Report |
FI SA1 07/17
SUPPLEMENT DATED JULY 18, 2017
TO THE STATEMENT OF ADDITIONAL INFORMATION
DATED MAY 1, 2017
OF
FRANKLIN INCOME VIP FUND
(A series of Franklin Templeton Variable Insurance Products Trust)
The Statement of Additional Information is amended as follows:
The following bullet point is added as the last bullet point under the heading “The Funds – Goals, Additional Strategies and Risks – Franklin Income VIP Fund:”
| • | buy and sell exchange-traded options on indexes that measure stock volatility, such as the Chicago Board Options Exchange (CBOE) Volatility Index® (VIX®) |
Please keep this supplement with your Statement of Additional Information for future reference.
| FI-7 |
FRANKLIN TEMPLETON VARIABLE INSURANCE PRODUCTS TRUST
Financial Highlights
Franklin Income VIP Fund
Six Months Ended June 30, 2017 | Year Ended December 31, | |||||||||||||||||||||||
| (unaudited) | 2016 | 2015 | 2014 | 2013 | 2012 | |||||||||||||||||||
| Class 1 | ||||||||||||||||||||||||
Per share operating performance (for a share outstanding throughout the period) | ||||||||||||||||||||||||
Net asset value, beginning of period | $15.87 | $14.64 | $16.48 | $16.53 | $15.47 | $14.68 | ||||||||||||||||||
|
| |||||||||||||||||||||||
| Income from investment operationsa: | ||||||||||||||||||||||||
Net investment incomeb | 0.35 | 0.67 | 0.71 | 0.72 | 0.81 | 0.91 | ||||||||||||||||||
Net realized and unrealized gains (losses) | 0.36 | 1.34 | (1.78 | ) | 0.11 | 1.31 | 0.90 | |||||||||||||||||
|
| |||||||||||||||||||||||
Total from investment operations | 0.71 | 2.01 | (1.07 | ) | 0.83 | 2.12 | 1.81 | |||||||||||||||||
|
| |||||||||||||||||||||||
| Less distributions from net investment income | (0.71 | ) | (0.78 | ) | (0.77 | ) | (0.88 | ) | (1.06 | ) | (1.02 | ) | ||||||||||||
|
| |||||||||||||||||||||||
Net asset value, end of period | $15.87 | $15.87 | $14.64 | $16.48 | $16.53 | $15.47 | ||||||||||||||||||
|
| |||||||||||||||||||||||
Total returnc | 4.42% | 14.33% | (6.84)% | 4.92% | 14.18% | 12.91% | ||||||||||||||||||
| Ratios to average net assetsd | ||||||||||||||||||||||||
Expenses before waiver and payments by affiliates | 0.47% | 0.47% | 0.46% | 0.47% | 0.47% | 0.47% | ||||||||||||||||||
Expenses net of waiver and payments by affiliates | 0.45% | e | 0.44% | e | 0.46% | e,f | 0.47% | e | 0.47% | e | 0.47% | |||||||||||||
Net investment income | 4.26% | 4.47% | 4.47% | 4.26% | 5.07% | 6.03% | ||||||||||||||||||
| Supplemental data | ||||||||||||||||||||||||
Net assets, end of period (000’s) | $723,350 | $696,227 | $604,228 | $714,664 | $695,004 | $584,391 | ||||||||||||||||||
Portfolio turnover rate | 12.01% | 39.03% | 31.53% | 24.77% | 21.71% | 26.66% | g | |||||||||||||||||
aThe amount shown for a share outstanding throughout the period may not correlate with the Statement of Operations for the period due to the timing of sales and repurchases of the Fund’s shares in relation to income earned and/or fluctuating fair value of the investments of the Fund.
bBased on average daily shares outstanding.
cTotal return does not include fees, charges or expenses imposed by the variable annuity and life insurance contracts for which Franklin Templeton Variable Insurance Products Trust serves as an underlying investment vehicle. Total return is not annualized for periods less than one year.
dRatios are annualized for periods less than one year.
eBenefit of expense reduction rounds to less than 0.01%.
fBenefit of waiver and payments by affiliates rounds to less than 0.01%.
gExcludes the value of portfolio securities delivered as a result of a redemption in-kind.
| FI-8 | Semiannual Report | The accompanying notes are an integral part of these financial statements. |
FRANKLIN TEMPLETON VARIABLE INSURANCE PRODUCTS TRUST
FINANCIAL HIGHLIGHTS
Franklin Income VIP Fund (continued)
| Six Months Ended June 30, 2017 | Year Ended December 31, | |||||||||||||||||||||||
| (unaudited) | 2016 | 2015 | 2014 | 2013 | 2012 | |||||||||||||||||||
| Class 2 | ||||||||||||||||||||||||
Per share operating performance (for a share outstanding throughout the period) | ||||||||||||||||||||||||
Net asset value, beginning of period | $15.38 | $14.20 | $16.00 | $16.07 | $15.07 | $14.32 | ||||||||||||||||||
|
| |||||||||||||||||||||||
| Income from investment operationsa: | ||||||||||||||||||||||||
Net investment incomeb | 0.31 | 0.61 | 0.65 | 0.66 | 0.75 | 0.85 | ||||||||||||||||||
Net realized and unrealized gains (losses) | 0.35 | 1.31 | (1.73 | ) | 0.11 | 1.27 | 0.88 | |||||||||||||||||
|
| |||||||||||||||||||||||
Total from investment operations | 0.66 | 1.92 | (1.08 | ) | 0.77 | 2.02 | 1.73 | |||||||||||||||||
|
| |||||||||||||||||||||||
| Less distributions from net investment income | (0.67 | ) | (0.74 | ) | (0.72 | ) | (0.84 | ) | (1.02 | ) | (0.98 | ) | ||||||||||||
|
| |||||||||||||||||||||||
| Net asset value, end of period | $15.37 | $15.38 | $14.20 | $16.00 | $16.07 | $15.07 | ||||||||||||||||||
|
| |||||||||||||||||||||||
Total returnc | 4.25% | 14.02% | (7.05)% | 4.62% | 13.94% | 12.65% | ||||||||||||||||||
| Ratios to average net assetsd | ||||||||||||||||||||||||
Expenses before waiver and payments by affiliates | 0.72% | 0.72% | 0.71% | 0.72% | 0.72% | 0.72% | ||||||||||||||||||
Expenses net of waiver and payments by affiliates | 0.70% | e | 0.69% | e | 0.71% | e,f | 0.72% | e | 0.72% | e | 0.72% | |||||||||||||
Net investment income | 4.01% | 4.22% | 4.22% | 4.01% | 4.82% | 5.78% | ||||||||||||||||||
| Supplemental data | ||||||||||||||||||||||||
Net assets, end of period (000’s) | $5,090,255 | $5,088,556 | $4,907,599 | $6,022,804 | $6,188,045 | $6,182,997 | ||||||||||||||||||
Portfolio turnover rate | 12.01% | 39.03% | 31.53% | 24.77% | 21.71% | 26.66% | g | |||||||||||||||||
aThe amount shown for a share outstanding throughout the period may not correlate with the Statement of Operations for the period due to the timing of sales and repurchases of the Fund’s shares in relation to income earned and/or fluctuating fair value of the investments of the Fund.
bBased on average daily shares outstanding.
cTotal return does not include fees, charges or expenses imposed by the variable annuity and life insurance contracts for which Franklin Templeton Variable Insurance Products Trust serves as an underlying investment vehicle. Total return is not annualized for periods less than one year.
dRatios are annualized for periods less than one year.
eBenefit of expense reduction rounds to less than 0.01%.
fBenefit of waiver and payments by affiliates rounds to less than 0.01%.
gExcludes the value of portfolio securities delivered as a result of a redemption in-kind.
| The accompanying notes are an integral part of these financial statements. | Semiannual Report | FI-9 |
FRANKLIN TEMPLETON VARIABLE INSURANCE PRODUCTS TRUST
FINANCIAL HIGHLIGHTS
Franklin Income VIP Fund (continued)
Six Months Ended (unaudited) | Year Ended December 31, | |||||||||||||||||||||||
| 2016 | 2015 | 2014 | 2013 | 2012 | ||||||||||||||||||||
| Class 4 | ||||||||||||||||||||||||
Per share operating performance (for a share outstanding throughout the period) | ||||||||||||||||||||||||
Net asset value, beginning of period | $15.71 | $14.49 | $16.31 | $16.36 | $15.32 | $14.54 | ||||||||||||||||||
|
| |||||||||||||||||||||||
| Income from investment operationsa: | ||||||||||||||||||||||||
Net investment incomeb | 0.31 | 0.61 | 0.65 | 0.66 | 0.75 | 0.85 | ||||||||||||||||||
Net realized and unrealized gains (losses) | 0.36 | 1.33 | (1.76 | ) | 0.11 | 1.30 | 0.90 | |||||||||||||||||
|
| |||||||||||||||||||||||
Total from investment operations | 0.67 | 1.94 | (1.11 | ) | 0.77 | 2.05 | 1.75 | |||||||||||||||||
|
| |||||||||||||||||||||||
Less distributions from net investment income. | (0.65 | ) | (0.72 | ) | (0.71 | ) | (0.82 | ) | (1.01 | ) | (0.97 | ) | ||||||||||||
|
| |||||||||||||||||||||||
Net asset value, end of period | $15.73 | $15.71 | $14.49 | $16.31 | $16.36 | $15.32 | ||||||||||||||||||
|
| |||||||||||||||||||||||
Total returnc | 4.25% | 13.87% | (7.15)% | 4.52% | 13.85% | 12.56% | ||||||||||||||||||
| Ratios to average net assetsd | ||||||||||||||||||||||||
Expenses before waiver and payments by affiliates | 0.82% | 0.82% | 0.81% | 0.82% | 0.82% | 0.82% | ||||||||||||||||||
Expenses net of waiver and payments by affiliates | 0.80% | e | 0.79% | e | 0.81% | e,f | 0.82% | e | 0.82% | e | 0.82% | |||||||||||||
Net investment income | 3.91% | 4.12% | 4.12% | 3.91% | 4.72% | 5.68% | ||||||||||||||||||
| Supplemental data | ||||||||||||||||||||||||
Net assets, end of period (000’s) | $317,882 | $309,935 | $306,023 | $378,545 | $397,652 | $436,405 | ||||||||||||||||||
Portfolio turnover rate | 12.01% | 39.03% | 31.53% | 24.77% | 21.71% | 26.66% | g | |||||||||||||||||
aThe amount shown for a share outstanding throughout the period may not correlate with the Statement of Operations for the period due to the timing of sales and repurchases of the Fund’s shares in relation to income earned and/or fluctuating fair value of the investments of the Fund.
bBased on average daily shares outstanding.
cTotal return does not include fees, charges or expenses imposed by the variable annuity and life insurance contracts for which Franklin Templeton Variable Insurance Products Trust serves as an underlying investment vehicle. Total return is not annualized for periods less than one year.
dRatios are annualized for periods less than one year.
eBenefit of expense reduction rounds to less than 0.01%.
fBenefit of waiver and payments by affiliates rounds to less than 0.01%.
gExcludes the value of portfolio securities delivered as a result of a redemption in-kind.
| FI-10 | Semiannual Report | The accompanying notes are an integral part of these financial statements. |
FRANKLIN TEMPLETON VARIABLE INSURANCE PRODUCTS TRUST
Statement of Investments, June 30, 2017 (unaudited)
Franklin Income VIP Fund
| ||||||||||||||
| Country | Shares | Value | ||||||||||||
| Common Stocks 45.9% | ||||||||||||||
Consumer Discretionary 3.3% | ||||||||||||||
Ford Motor Co | United States | 7,138,995 | $ | 79,885,354 | ||||||||||
General Motors Co | United States | 1,000,000 | 34,930,000 | |||||||||||
Target Corp. | United States | 1,639,100 | 85,708,539 | |||||||||||
|
| |||||||||||||
| 200,523,893 | ||||||||||||||
|
| |||||||||||||
Consumer Staples 3.6% | ||||||||||||||
Anheuser-Busch InBev SA/NV, ADR | Belgium | 505,000 | 55,731,800 | |||||||||||
The Coca-Cola Co. | United States | 1,325,000 | 59,426,250 | |||||||||||
PepsiCo Inc. | United States | 584,000 | 67,446,160 | |||||||||||
Philip Morris International Inc. | United States | 350,000 | 41,107,500 | |||||||||||
|
| |||||||||||||
| 223,711,710 | ||||||||||||||
|
| |||||||||||||
Energy 7.5% | ||||||||||||||
Anadarko Petroleum Corp. | United States | 600,000 | 27,204,000 | |||||||||||
Baker Hughes Inc. | United States | 725,000 | 39,519,750 | |||||||||||
BP PLC, ADR | United Kingdom | 1,800,000 | 62,370,000 | |||||||||||
Chevron Corp | United States | 1,055,000 | 110,068,150 | |||||||||||
| a | Energy XXI Gulf Coast Inc. | United States | 510,163 | 9,473,727 | ||||||||||
| a | Halcon Resources Corp. | United States | 74,398 | 337,767 | ||||||||||
Occidental Petroleum Corp. | United States | 436,000 | 26,103,320 | |||||||||||
Royal Dutch Shell PLC, A, ADR | United Kingdom | 3,021,748 | 160,726,776 | |||||||||||
| a | Stone Energy Corp. | United States | 544,906 | 10,015,372 | ||||||||||
| a | W&T Offshore Inc. | United States | 2,000,000 | 3,920,000 | ||||||||||
| a | Weatherford International PLC | United States | 2,500,000 | 9,675,000 | ||||||||||
|
| |||||||||||||
| 459,413,862 | ||||||||||||||
|
| |||||||||||||
Financials 5.6% | ||||||||||||||
Bank of America Corp. | United States | 800,000 | 19,408,000 | |||||||||||
HSBC Holdings PLC | United Kingdom | 5,000,000 | 46,351,245 | |||||||||||
JPMorgan Chase & Co. | United States | 690,100 | 63,075,140 | |||||||||||
MetLife Inc. | United States | 1,245,108 | 68,406,233 | |||||||||||
U.S. Bancorp. | United States | 1,000,000 | 51,920,000 | |||||||||||
Wells Fargo & Co. | United States | 1,700,000 | 94,197,000 | |||||||||||
|
| |||||||||||||
| 343,357,618 | ||||||||||||||
|
| |||||||||||||
Health Care 4.9% | ||||||||||||||
AstraZeneca PLC | United Kingdom | 750,000 | 50,164,460 | |||||||||||
Medtronic PLC | United States | 335,000 | 29,731,250 | |||||||||||
Merck & Co. Inc. | United States | 250,000 | 16,022,500 | |||||||||||
| a | Mylan NV | United States | 628,000 | 24,378,960 | ||||||||||
Pfizer Inc. | United States | 2,638,975 | 88,643,170 | |||||||||||
Roche Holding AG | Switzerland | 136,500 | 34,767,458 | |||||||||||
Sanofi, ADR | France | 1,208,292 | 57,889,270 | |||||||||||
|
| |||||||||||||
| 301,597,068 | ||||||||||||||
|
| |||||||||||||
Industrials 5.1% | ||||||||||||||
| a,b | CEVA Holdings LLC | United States | 13,012 | 3,253,065 | ||||||||||
Deere & Co. | United States | 240,000 | 29,661,600 | |||||||||||
General Electric Co. | United States | 3,976,200 | 107,397,162 | |||||||||||
Republic Services Inc. | United States | 527,300 | 33,604,829 | |||||||||||
Union Pacific Corp. | United States | 500,000 | 54,455,000 | |||||||||||
United Technologies Corp. | United States | 700,000 | 85,477,000 | |||||||||||
|
| |||||||||||||
| 313,848,656 | ||||||||||||||
|
| |||||||||||||
| Semiannual Report | FI-11 |
FRANKLIN TEMPLETON VARIABLE INSURANCE PRODUCTS TRUST
STATEMENT OF INVESTMENTS (UNAUDITED)
Franklin Income VIP Fund (continued)
| Country | Shares | Value | ||||||||||||
| Common Stocks (continued) | ||||||||||||||
Information Technology 3.9% | ||||||||||||||
Apple Inc. | United States | 645,317 | $ | 92,938,554 | ||||||||||
Intel Corp. | United States | 1,207,000 | 40,724,180 | |||||||||||
Microsoft Corp. | United States | 1,000,000 | 68,930,000 | |||||||||||
Oracle Corp. | United States | 700,632 | 35,129,689 | |||||||||||
|
| |||||||||||||
| 237,722,423 | ||||||||||||||
|
| |||||||||||||
Materials 3.6% | ||||||||||||||
BASF SE | Germany | 387,500 | 35,892,208 | |||||||||||
The Dow Chemical Co. | United States | 1,700,000 | 107,219,000 | |||||||||||
Rio Tinto PLC, ADR | United Kingdom | 1,800,000 | 76,158,000 | |||||||||||
|
| |||||||||||||
| 219,269,208 | ||||||||||||||
|
| |||||||||||||
Real Estate 0.4% | ||||||||||||||
Host Hotels & Resorts Inc. | United States | 1,500,000 | 27,405,000 | |||||||||||
|
| |||||||||||||
Telecommunication Services 1.1% | ||||||||||||||
BCE Inc. | Canada | 466,000 | 20,996,335 | |||||||||||
Verizon Communications Inc. | United States | 1,075,000 | 48,009,500 | |||||||||||
|
| |||||||||||||
| 69,005,835 | ||||||||||||||
|
| |||||||||||||
Utilities 6.9% | ||||||||||||||
Dominion Energy Inc. | United States | 1,000,000 | 76,630,000 | |||||||||||
Duke Energy Corp. | United States | 702,500 | 58,721,975 | |||||||||||
Great Plains Energy Inc. | United States | 777,900 | 22,776,912 | |||||||||||
NextEra Energy Inc. | United States | 125,000 | 17,516,250 | |||||||||||
PG&E Corp. | United States | 935,300 | 62,075,861 | |||||||||||
PPL Corp. | United States | 450,000 | 17,397,000 | |||||||||||
Public Service Enterprise Group Inc. | United States | 823,500 | 35,418,735 | |||||||||||
Sempra Energy | United States | 368,300 | 41,525,825 | |||||||||||
The Southern Co. | United States | 1,062,100 | 50,853,348 | |||||||||||
Xcel Energy Inc. | United States | 810,964 | 37,207,028 | |||||||||||
|
| |||||||||||||
| 420,122,934 | ||||||||||||||
|
| |||||||||||||
Total Common Stocks (Cost $2,341,420,880) | 2,815,978,207 | |||||||||||||
|
| |||||||||||||
| c | Equity-Linked Securities 5.4% | |||||||||||||
| Energy 0.3% | ||||||||||||||
| d | Wells Fargo Bank National Assn. into Halliburton Co., 8.00%, 144A | United States | 435,000 | 19,413,871 | ||||||||||
|
| |||||||||||||
Health Care 0.5% | ||||||||||||||
| d | JPMorgan Chase & Co. into Merck & Co. Inc., 6.25%, 144A | United States | 500,000 | 31,526,534 | ||||||||||
|
| |||||||||||||
Industrials 1.1% | ||||||||||||||
| d | Morgan Stanley into Deere & Co., 6.00%, 144A. | United States | 550,000 | 66,142,381 | ||||||||||
|
| |||||||||||||
Information Technology 3.5% | ||||||||||||||
| d | Deutsche Bank AG/London into Apple Inc., 6.00%, 144A | United States | 410,000 | 60,655,427 | ||||||||||
| d | Goldman Sachs International into Analog Devices Inc., 6.50%, 144A | United States | 570,000 | 45,497,718 | ||||||||||
| d | Goldman Sachs International into Intel Corp., 6.00%, 144A | United States | 1,700,000 | 58,472,495 | ||||||||||
| d | Royal Bank of Canada into Texas Instruments Inc., 6.00%, 144A | United States | 725,000 | 51,326,520 | ||||||||||
|
| |||||||||||||
| 215,952,160 | ||||||||||||||
|
| |||||||||||||
Total Equity-Linked Securities (Cost $323,858,800) | 333,034,946 | |||||||||||||
|
| |||||||||||||
| FI-12 | Semiannual Report |
FRANKLIN TEMPLETON VARIABLE INSURANCE PRODUCTS TRUST
STATEMENT OF INVESTMENTS (UNAUDITED)
Franklin Income VIP Fund (continued)
| Country | Shares | Value | ||||||||||||||
Convertible Preferred Stocks 2.7% | ||||||||||||||||
Financials 1.2% | ||||||||||||||||
Bank of America Corp., 7.25%, cvt. pfd., L | United States | 34,600 | $ | 43,664,854 | ||||||||||||
| a | FNMA, 5.375%, cvt. pfd | United States | 475 | 8,431,250 | ||||||||||||
Wells Fargo & Co., 7.50%, cvt. pfd., A | United States | 15,000 | 19,666,650 | |||||||||||||
|
| |||||||||||||||
| 71,762,754 | ||||||||||||||||
|
| |||||||||||||||
Health Care 0.6% | ||||||||||||||||
Allergan PLC, 5.50%, cvt. pfd | United States | 9,500 | 8,246,760 | |||||||||||||
Becton Dickinson and Co., 6.125%, cvt. pfd., A | United States | 250,000 | 13,695,000 | |||||||||||||
Teva Pharmaceutical Industries Ltd., 7.00%, cvt. pfd | Israel | 25,000 | 14,862,500 | |||||||||||||
|
| |||||||||||||||
| 36,804,260 | ||||||||||||||||
|
| |||||||||||||||
Industrials 0.1% | ||||||||||||||||
| a,b | CEVA Holdings LLC, cvt. pfd., A-1 | United States | 397 | 148,875 | ||||||||||||
| a,b | CEVA Holdings LLC, cvt. pfd., A-2 | United States | 14,711 | 4,119,052 | ||||||||||||
|
| |||||||||||||||
| 4,267,927 | ||||||||||||||||
|
| |||||||||||||||
Utilities 0.8% | ||||||||||||||||
Dominion Energy Inc., 6.375%, cvt. pfd., A | United States | 162,000 | 7,743,600 | |||||||||||||
Great Plains Energy Inc., 7.00%, cvt. pfd | United States | 216,000 | 11,456,640 | |||||||||||||
| �� | NextEra Energy Inc., 6.371%, cvt. pfd | United States | 500,000 | 32,070,000 | ||||||||||||
|
| |||||||||||||||
| 51,270,240 | ||||||||||||||||
|
| |||||||||||||||
Total Convertible Preferred Stocks | 164,105,181 | |||||||||||||||
|
| |||||||||||||||
Preferred Stocks (Cost $4,945,000) 0.1% | ||||||||||||||||
Financials 0.1% | ||||||||||||||||
Morgan Stanley, 6.375%, pfd., I | United States | 197,800 | 5,645,212 | |||||||||||||
|
| |||||||||||||||
| Principal Amount* | ||||||||||||||||
Convertible Bonds 1.0% | ||||||||||||||||
Energy 0.4% | ||||||||||||||||
| d | Chesapeake Energy Corp., cvt., senior note, 144A, 5.50%, 9/15/26 | United States | 2,500,000 | 2,350,000 | ||||||||||||
Weatherford International Ltd., cvt., senior note, 5.875%, 7/01/21 | United States | 22,000,000 | 22,316,250 | |||||||||||||
|
| |||||||||||||||
| 24,666,250 | ||||||||||||||||
|
| |||||||||||||||
Health Care 0.6% | ||||||||||||||||
| d | Bayer Capital Corp BV, cvt., junior sub. note, 144A, 5.625%, 11/22/19 | Germany | 25,000,000 | EUR | 34,830,343 | |||||||||||
Impax Laboratories Inc., cvt., senior note, 2.00%, 6/15/22 | United States | 2,500,000 | 2,139,063 | |||||||||||||
|
| |||||||||||||||
| 36,969,406 | ||||||||||||||||
|
| |||||||||||||||
Total Convertible Bonds (Cost $53,096,406) | 61,635,656 | |||||||||||||||
|
| |||||||||||||||
Corporate Bonds 34.8% | ||||||||||||||||
Consumer Discretionary 3.9% | ||||||||||||||||
| d | 24 Hour Holdings III LLC, senior note, 144A, 8.00%, 6/01/22 | United States | 6,300,000 | 5,890,500 | ||||||||||||
CCO Holdings LLC/CCO Holdings Capital Corp., senior bond, 5.125%, 2/15/23 | United States | 10,000,000 | 10,343,750 | |||||||||||||
senior bond, 5.75%, 1/15/24 | United States | 9,000,000 | 9,506,250 | |||||||||||||
DISH DBS Corp., | ||||||||||||||||
senior bond, 5.00%, 3/15/23 | United States | 35,000,000 | 35,962,500 | |||||||||||||
senior note, 5.875%, 7/15/22 | United States | 40,000,000 | 43,100,000 | |||||||||||||
senior note, 5.875%, 11/15/24 | United States | 9,400,000 | 10,064,768 | |||||||||||||
senior note, 7.75%, 7/01/26 | United States | 10,000,000 | 11,875,000 | |||||||||||||
Fiat Chrysler Automobiles NV, senior note, 5.25%, 4/15/23 | United Kingdom | 11,300,000 | 11,504,925 | |||||||||||||
iHeartCommunications Inc., senior secured note, first lien, 9.00%, 12/15/19 | United States | 23,000,000 | 18,141,250 | |||||||||||||
| Semiannual Report | FI-13 |
FRANKLIN TEMPLETON VARIABLE INSURANCE PRODUCTS TRUST
STATEMENT OF INVESTMENTS (UNAUDITED)
Franklin Income VIP Fund (continued)
| Country | Principal Amount* | Value | ||||||||||||
Corporate Bonds (continued) | ||||||||||||||
| Consumer Discretionary (continued) | United States | 8,500,000 | $9,286,250 | |||||||||||
| d | International Game Technology PLC, senior secured note, 144A, 6.25%, 2/15/22 | |||||||||||||
KB Home, senior bond, 7.50%, 9/15/22 | United States | 6,500,000 | 7,369,375 | |||||||||||
| d | PetSmart Inc., senior note, 144A, 7.125%, 3/15/23 | United States | 3,000,000 | 2,677,500 | ||||||||||
| d | Shea Homes LP/Shea Homes Funding Corp., | |||||||||||||
senior bond, 144A, 6.125%, 4/01/25 | United States | 10,000,000 | 10,375,000 | |||||||||||
senior note, 144A, 5.875%, 4/01/23 | United States | 5,000,000 | 5,172,500 | |||||||||||
| d | Sirius XM Radio Inc., senior bond, 144A, 6.00%, 7/15/24 | United States | 7,500,000 | 7,987,500 | ||||||||||
| d | Univision Communications Inc., | |||||||||||||
senior secured note, first lien, 144A, 5.125%, 5/15/23 | United States | 10,000,000 | 10,121,800 | |||||||||||
senior secured note, first lien, 144A, 5.125%, 2/15/25 | United States | 7,140,000 | 7,095,375 | |||||||||||
| d | Virgin Media Secured Finance PLC, senior secured bond, first lien, 144A, 5.50%, 1/15/25 | United Kingdom | 7,000,000 | 7,297,500 | ||||||||||
| d | Wynn Las Vegas LLC/Wynn Las Vegas Capital Corp., senior bond, 144A, 5.50%, 3/01/25 | United States | 7,500,000 | 7,907,813 | ||||||||||
| d | Ziggo Secured Finance BV, secured bond, 144A, 5.50%, 1/15/27 | Netherlands | 7,500,000 | 7,743,750 | ||||||||||
|
| |||||||||||||
| 239,423,306 | ||||||||||||||
|
| |||||||||||||
| Consumer Staples 0.2% | ||||||||||||||
| d | JBS USA LLC/Finance Inc., senior note, 144A, 7.25%, 6/01/21 | United States | 12,500,000 | 12,556,250 | ||||||||||
|
| |||||||||||||
| Energy 6.8% | ||||||||||||||
| d | Ascent Resources Utica Holdings LLC/ARU Finance Corp., senior note, 144A, 10.00%, 4/01/22. | United States | 25,000,000 | 25,125,000 | ||||||||||
Bill Barrett Corp., | ||||||||||||||
senior bond, 7.00%, 10/15/22 | United States | 17,937,000 | 15,246,450 | |||||||||||
d senior note, 144A, 8.75%, 6/15/25. | United States | 23,400,000 | 19,714,500 | |||||||||||
Calumet Specialty Products Partners LP/Calumet Finance Corp., senior note, 6.50%, 4/15/21 | United States | 12,000,000 | 10,500,000 | |||||||||||
Chesapeake Energy Corp., | ||||||||||||||
d secured note, second lien, 144A, 8.00%, 12/15/22 | United States | 28,872,000 | 30,640,410 | |||||||||||
| �� | e senior bond, 6.125%, 2/15/21 | United States | 16,000,000 | 15,760,000 | ||||||||||
d,e senior bond, 144A, 8.00%, 6/15/27 | United States | 2,000,000 | 1,967,500 | |||||||||||
senior note, 5.375%, 6/15/21 | United States | 11,045,000 | 10,382,300 | |||||||||||
senior note, 4.875%, 4/15/22 | United States | 5,000,000 | 4,675,000 | |||||||||||
senior note, 5.75%, 3/15/23 | United States | 5,000,000 | 4,562,500 | |||||||||||
d,e senior note, 144A, 8.00%, 1/15/25 | United States | 15,000,000 | 15,037,500 | |||||||||||
f senior note, FRN, 4.408%, 4/15/19 | United States | 14,000,000 | 13,790,000 | |||||||||||
| d | Denbury Resources Inc., senior secured note, 144A, 9.00%, 5/15/21 | United States | 7,200,000 | 6,894,000 | ||||||||||
Ferrellgas LP/Ferrellgas Finance Corp., senior note, 6.50%, 5/01/21 | United States | 5,000,000 | 4,750,000 | |||||||||||
| d | Ferrellgas Partners LP/Ferrellgas Partners Finance Corp., senior note, 144A, 8.625%, 6/15/20. | United States | 6,600,000 | 6,270,000 | ||||||||||
| d | Halcon Resources Corp., senior note, 144A, 6.75%, 2/15/25 | United States | 2,000,000 | 1,810,000 | ||||||||||
Kinder Morgan Inc., | ||||||||||||||
senior bond, 7.75%, 1/15/32 | United States | 22,000,000 | 27,730,670 | |||||||||||
d senior secured bond, first lien, 144A, 5.625%, 11/15/23 | United States | 7,000,000 | 7,754,215 | |||||||||||
| d | McDermott International Inc., second lien, 144A, 8.00%, 5/01/21 | United States | 17,592,000 | 17,811,900 | ||||||||||
| d | NGPL PipeCo LLC, secured note, 144A, 7.119%, 12/15/17 | United States | 850,000 | 870,187 | ||||||||||
| g | Petroquest Energy Inc., secured note, second lien, PIK, 10.00%, 2/15/21 | United States | 1,710,028 | 1,235,495 | ||||||||||
Rex Energy Corp., second lien, 1.00% to 10/01/17, 8.00% thereafter, 10/01/20 | United States | 5,000,000 | 2,750,000 | |||||||||||
Sabine Pass Liquefaction LLC, | ||||||||||||||
first lien, 5.00%, 3/15/27 | United States | 12,200,000 | 12,997,441 | |||||||||||
senior secured bond, first lien, 5.875%, 6/30/26 | United States | 15,000,000 | 16,816,380 | |||||||||||
| FI-14 | Semiannual Report |
FRANKLIN TEMPLETON VARIABLE INSURANCE PRODUCTS TRUST
STATEMENT OF INVESTMENTS (UNAUDITED)
Franklin Income VIP Fund (continued)
| Country | Principal Amount* | Value | ||||||||||||
| Corporate Bonds (continued) | ||||||||||||||
| Energy (continued) | ||||||||||||||
Sanchez Energy Corp., senior note, 7.75%, 6/15/21 | United States | 27,000,000 | $ | 24,570,000 | ||||||||||
Stone Energy Corp., senior note, 7.50%, 5/31/22 | United States | 6,452,837 | 6,130,195 | |||||||||||
d Transocean Inc., senior note, 144A, 9.00%, 7/15/23 | United States | 10,000,000 | 10,425,000 | |||||||||||
| d,g | W&T Offshore Inc., | |||||||||||||
secured note, second lien, 144A, PIK, 9.00%, 5/15/20 | United States | 10,330,593 | 8,460,702 | |||||||||||
senior secured note, third lien, 144A, PIK, 10.00%, 6/15/21 | United States | 9,244,999 | 6,536,713 | |||||||||||
Weatherford International Ltd., | United States | 17,500,000 | 16,887,500 | |||||||||||
senior note, 5.125%, 9/15/20 | ||||||||||||||
senior note, 7.75%, 6/15/21 | United States | 30,000,000 | 30,262,500 | |||||||||||
senior note, 4.50%, 4/15/22 | United States | �� | 11,900,000 | 10,561,250 | ||||||||||
senior note, 8.25%, 6/15/23 | United States | 27,500,000 | 27,568,750 | |||||||||||
|
| |||||||||||||
| 416,494,058 | ||||||||||||||
|
| |||||||||||||
| Financials 3.4% | ||||||||||||||
| h | Bank of America Corp., | |||||||||||||
junior sub. bond, AA, 6.10% to 3/17/25, FRN thereafter, Perpetual | United States | 8,000,000 | 8,700,800 | |||||||||||
junior sub. bond, M, 8.125% to 5/15/18, FRN thereafter, Perpetual | United States | 5,000,000 | 5,205,500 | |||||||||||
junior sub. bond, U, 5.20% to 6/01/23, FRN thereafter, Perpetual | United States | 6,000,000 | 6,067,080 | |||||||||||
junior sub. bond, X, 6.25% to 9/05/24, FRN thereafter, Perpetual | United States | 6,000,000 | 6,502,500 | |||||||||||
| h | Citigroup Inc., | |||||||||||||
junior sub. bond, 5.35% to 5/15/23, FRN thereafter, Perpetual | United States | 10,000,000 | 10,237,500 | |||||||||||
junior sub. bond, 5.90% to 2/15/23, FRN thereafter, Perpetual | United States | 12,500,000 | 13,409,375 | |||||||||||
junior sub. bond, 5.95% to 1/30/23, FRN thereafter, Perpetual | United States | 4,500,000 | 4,792,500 | |||||||||||
junior sub. bond, M, 6.30% to 5/15/24, FRN thereafter, Perpetual | United States | 16,800,000 | 17,913,000 | |||||||||||
junior sub. bond, O, 5.875% to 3/27/20, FRN thereafter, Perpetual | United States | 25,000,000 | 26,286,500 | |||||||||||
junior sub. bond, Q, 5.95% to 8/15/20, FRN thereafter, Perpetual | United States | 10,000,000 | 10,540,950 | |||||||||||
| h | JPMorgan Chase & Co., | |||||||||||||
junior sub. bond, I, 7.90% to 4/30/19, FRN thereafter, Perpetual | United States | 50,000,000 | 52,037,500 | |||||||||||
junior sub. bond, R, 6.00% to 8/01/23, FRN thereafter, Perpetual | United States | 3,200,000 | 3,452,000 | |||||||||||
junior sub. bond, V, 5.00% to 7/30/19, FRN thereafter, Perpetual | United States | 10,000,000 | 10,262,500 | |||||||||||
| h | Morgan Stanley, junior sub. bond, 5.55% to 7/15/20, FRN thereafter, Perpetual | United States | 7,300,000 | 7,635,800 | ||||||||||
Navient Corp., senior note, 6.125%, 3/25/24 | United States | 5,000,000 | 5,175,000 | |||||||||||
| d | OneMain Financial Holdings Inc., | |||||||||||||
senior note, 144A, 6.75%, 12/15/19 | United States | 6,000,000 | 6,322,500 | |||||||||||
senior note, 144A, 7.25%, 12/15/21 | United States | 5,000,000 | 5,291,250 | |||||||||||
| h | Wells Fargo & Co., junior sub. bond, S, 5.90% to 6/15/24, FRN thereafter, Perpetual | United States | 7,900,000 | 8,470,775 | ||||||||||
|
| |||||||||||||
| 208,303,030 | ||||||||||||||
|
| |||||||||||||
| Health Care 7.8% | ||||||||||||||
CHS/Community Health Systems Inc., | ||||||||||||||
senior note, 8.00%, 11/15/19 | United States | 67,195,000 | 67,782,956 | |||||||||||
senior note, 7.125%, 7/15/20 | United States | 35,000,000 | 34,212,500 | |||||||||||
senior note, 6.875%, 2/01/22 | United States | 38,000,000 | 33,345,000 | |||||||||||
senior secured note, first lien, 6.25%, 3/31/23 | United States | 16,400,000 | 16,992,040 | |||||||||||
DaVita Inc., | ||||||||||||||
senior bond, 5.125%, 7/15/24 | United States | 5,000,000 | 5,084,375 | |||||||||||
senior bond, 5.00%, 5/01/25 | United States | 4,000,000 | 4,020,000 | |||||||||||
| d | Endo Dac/Endo Finance LLC/Endo Finco Inc., | |||||||||||||
senior bond, 144A, 6.00%, 2/01/25 | United States | 10,000,000 | 8,200,000 | |||||||||||
senior note, 144A, 6.00%, 7/15/23 | United States | 15,000,000 | 12,682,500 | |||||||||||
| Semiannual Report | FI-15 |
FRANKLIN TEMPLETON VARIABLE INSURANCE PRODUCTS TRUST
STATEMENT OF INVESTMENTS (UNAUDITED)
Franklin Income VIP Fund (continued)
| Country | Principal Amount* | Value | ||||||||||||
| Corporate Bonds (continued) | ||||||||||||||
| Health Care (continued) | ||||||||||||||
| d | Endo Finance LLC, senior note, 144A, 5.75%, 1/15/22 | United States | 22,500,000 | $ | 20,358,000 | |||||||||
HCA Inc., | ||||||||||||||
senior bond, 5.875%, 5/01/23 | United States | 7,500,000 | 8,184,375 | |||||||||||
senior note, 7.50%, 2/15/22 | United States | 25,000,000 | 28,843,750 | |||||||||||
senior secured note, first lien, 5.00%, 3/15/24 | United States | 10,400,000 | 11,037,000 | |||||||||||
Horizon Pharma Inc., senior note, 6.625%, 5/01/23 | United States | 9,000,000 | 8,505,000 | |||||||||||
Mallinckrodt International Finance SA, senior bond, 4.75%, 4/15/23 | United States | 5,000,000 | 4,287,500 | |||||||||||
| d | Mallinckrodt International Finance SA/Mallinckrodt CB LLC, | |||||||||||||
senior note, 144A, 5.75%, 8/01/22. | United States | 24,200,000 | 22,869,000 | |||||||||||
senior note, 144A, 5.625%, 10/15/23 | United States | 14,300,000 | 13,120,250 | |||||||||||
senior note, 144A, 5.50%, 4/15/25. | United States | 10,000,000 | 8,825,000 | |||||||||||
Tenet Healthcare Corp., | ||||||||||||||
senior note, 5.00%, 3/01/19 | United States | 10,000,000 | 10,503,600 | |||||||||||
senior note, 8.00%, 8/01/20 | United States | 5,000,000 | 5,068,750 | |||||||||||
senior note, 8.125%, 4/01/22 | United States | 48,000,000 | 51,120,000 | |||||||||||
senior note, 6.75%, 6/15/23 | United States | 53,200,000 | 53,333,000 | |||||||||||
| d | Valeant Pharmaceuticals International, senior note, 144A, 6.375%, 10/15/20 | United States | 7,500,000 | 7,303,125 | ||||||||||
| d | Valeant Pharmaceuticals International Inc., | United States | 3,000,000 | 3,153,750 | ||||||||||
first lien, 144A, 6.50%, 3/15/22 | ||||||||||||||
senior bond, 144A, 6.125%, 4/15/25 | United States | 9,400,000 | 7,990,000 | |||||||||||
senior note, 144A, 5.375%, 3/15/20 | United States | 17,000,000 | 16,447,500 | |||||||||||
senior note, 144A, 5.875%, 5/15/23 | United States | 12,500,000 | 10,781,250 | |||||||||||
senior note, 144A, 7.00%, 3/15/24. | United States | 4,500,000 | 4,741,875 | |||||||||||
|
| |||||||||||||
| 478,792,096 | ||||||||||||||
|
| |||||||||||||
| Industrials 1.8% | ||||||||||||||
| d | Bombardier Inc., | |||||||||||||
senior bond, 144A, 6.125%, 1/15/23 | Canada | 5,000,000 | 5,025,000 | |||||||||||
senior bond, 144A, 7.50%, 3/15/25 | Canada | 11,000,000 | 11,440,000 | |||||||||||
| d,g | CEVA Group PLC, senior secured note, first lien, PIK, 144A, 6.00%, 9/01/20 | United Kingdom | 13,009,180 | 12,553,859 | ||||||||||
| d | Cloud Crane LLC, secured note, second lien, 144A, 10.125%, 8/01/24 | United States | 4,400,000 | 4,840,000 | ||||||||||
Hertz Corp., senior note, 6.75%, 4/15/19 | United States | 3,474,000 | 3,474,000 | |||||||||||
Navistar International Corp., senior bond, 8.25%, 11/01/21 | United States | 5,675,000 | 5,760,125 | |||||||||||
TransDigm Inc., | ||||||||||||||
senior sub. bond, 6.50%, 7/15/24 | United States | 10,000,000 | 10,350,000 | |||||||||||
senior sub. bond, 6.375%, 6/15/26 | United States | 7,700,000 | 7,834,750 | |||||||||||
senior sub. note, 6.00%, 7/15/22 | United States | 7,700,000 | 7,950,250 | |||||||||||
United Rentals North America Inc., | ||||||||||||||
senior bond, 6.125%, 6/15/23 | United States | 11,400,000 | 11,898,750 | |||||||||||
senior bond, 5.75%, 11/15/24 | United States | 3,000,000 | 3,153,750 | |||||||||||
| d | XPO Logistics Inc., senior note, 144A, 6.50%, 6/15/22 | United States | 22,980,000 | 24,243,900 | ||||||||||
|
| |||||||||||||
| 108,524,384 | ||||||||||||||
|
| |||||||||||||
| Information Technology 2.9% | ||||||||||||||
| d | BMC Software Finance Inc., senior note, 144A, 8.125%, 7/15/21 | United States | 16,500,000 | 17,165,280 | ||||||||||
| d | CommScope Inc., senior bond, 144A, 5.50%, 6/15/24 | United States | 10,000,000 | 10,446,900 | ||||||||||
| d | Diamond 1 Finance Corp./Diamond 2 Finance Corp., | |||||||||||||
senior note, 144A, 7.125%, 6/15/24 | United States | 3,600,000 | 3,959,215 | |||||||||||
senior secured bond, first lien, 144A, 6.02%, 6/15/26 | United States | 16,200,000 | 17,876,587 | |||||||||||
senior secured note, first lien, 144A, 4.42%, 6/15/21 | United States | 12,500,000 | 13,188,225 | |||||||||||
senior secured note, first lien, 144A, 5.45%, 6/15/23 | United States | 21,100,000 | 22,922,702 | |||||||||||
| FI-16 | Semiannual Report |
FRANKLIN TEMPLETON VARIABLE INSURANCE PRODUCTS TRUST
STATEMENT OF INVESTMENTS (UNAUDITED)
Franklin Income VIP Fund (continued)
| Country | Principal Amount* | Value | ||||||||||||
| Corporate Bonds (continued) | ||||||||||||||
| Information Technology (continued) | ||||||||||||||
| d | First Data Corp., | |||||||||||||
secured note, second lien, 144A, 5.75%, 1/15/24 | United States | 5,000,000 | $ | 5,212,500 | ||||||||||
senior note, 144A, 7.00%, 12/01/23 | United States | 25,000,000 | 26,750,000 | |||||||||||
| d | Microsemi Corp., senior note, 144A, 9.125%, 4/15/23 | United States | 2,864,000 | 3,286,440 | ||||||||||
NCR Corp., | ||||||||||||||
senior note, 5.00%, 7/15/22 | United States | 5,500,000 | 5,637,500 | |||||||||||
senior note, 6.375%, 12/15/23 | United States | 7,000,000 | 7,525,000 | |||||||||||
Western Digital Corp., | ||||||||||||||
senior note, 10.50%, 4/01/24 | United States | 30,000,000 | 35,465,400 | |||||||||||
d senior secured note, 144A, 7.375%, 4/01/23. | United States | 10,000,000 | 11,012,500 | |||||||||||
|
| |||||||||||||
| 180,448,249 | ||||||||||||||
|
| |||||||||||||
| Materials 2.1% | ||||||||||||||
| d | Ardagh Packaging Finance PLC/Ardagh MP Holdings USA Inc., | |||||||||||||
senior note, 144A, 4.625%, 5/15/23 | Luxembourg | 15,000,000 | 15,412,500 | |||||||||||
senior note, 144A, 7.25%, 5/15/24. | Luxembourg | 10,200,000 | 11,169,000 | |||||||||||
| d | BWAY Holding Co., | |||||||||||||
secured note, 144A, 5.50%, 4/15/24 | United States | 10,000,000 | 10,237,500 | |||||||||||
senior note, 144A, 7.25%, 4/15/25. | United States | 23,300,000 | 23,707,750 | |||||||||||
| d | Cemex Finance LLC, senior secured note, first lien, 144A, 6.00%, 4/01/24 | Mexico | 14,700,000 | 15,645,063 | ||||||||||
| d | FMG Resources (August 2006) Pty. Ltd., | |||||||||||||
senior note, 144A, 4.75%, 5/15/22. | Australia | 4,400,000 | 4,422,000 | |||||||||||
senior note, 144A, 5.125%, 5/15/24 | Australia | 6,700,000 | 6,716,750 | |||||||||||
senior secured note, 144A, 9.75%, 3/01/22 | Australia | 27,000,000 | 30,881,250 | |||||||||||
| d | Platform Specialty Products Corp., senior note, 144A, 6.50%, 2/01/22 | United States | 3,500,000 | 3,631,250 | ||||||||||
| d | Reynolds Group Issuer Inc./Reynolds Group Issuer LLC/Reynolds Group | |||||||||||||
Issuer Luxembourg SA, first lien, 144A, 5.125%, 7/15/23 | United States | 4,300,000 | 4,472,000 | |||||||||||
|
| |||||||||||||
| 126,295,063 | ||||||||||||||
|
| |||||||||||||
| Real Estate 0.4% | ||||||||||||||
Equinix Inc., senior bond, 5.375%, 5/15/27 | United States | 16,500,000 | 17,634,375 | |||||||||||
Iron Mountain Inc., senior sub. bond, 5.75%, 8/15/24 | United States | 3,000,000 | 3,075,000 | |||||||||||
iStar Inc., senior note, 5.00%, 7/01/19 | United States | 3,500,000 | 3,537,188 | |||||||||||
|
| |||||||||||||
| 24,246,563 | ||||||||||||||
|
| |||||||||||||
| Telecommunication Services 2.8% | ||||||||||||||
Frontier Communications Corp., | ||||||||||||||
senior note, 9.25%, 7/01/21 | United States | 7,400,000 | 7,277,826 | |||||||||||
senior note, 7.125%, 1/15/23 | United States | 7,800,000 | 6,532,500 | |||||||||||
Sprint Capital Corp., senior note, 6.90%, 5/01/19 | United States | 13,500,000 | 14,475,240 | |||||||||||
Sprint Communications Inc., | ||||||||||||||
11.50%, 11/15/21 | United States | 30,000,000 | 38,550,000 | |||||||||||
senior note, 7.00%, 8/15/20 | United States | 7,500,000 | 8,268,750 | |||||||||||
d senior note, 144A, 9.00%, 11/15/18 | United States | 11,900,000 | 12,930,064 | |||||||||||
Sprint Corp., | ||||||||||||||
senior bond, 7.875%, 9/15/23 | United States | 37,500,000 | 43,218,750 | |||||||||||
senior bond, 7.125%, 6/15/24 | United States | 8,200,000 | 9,143,000 | |||||||||||
senior note, 7.625%, 2/15/25 | United States | 15,000,000 | 17,306,250 | |||||||||||
| d | Wind Acquisition Finance SA, secured note, second lien, 144A, 7.375%, 4/23/21 | Italy | 11,500,000 | 11,977,307 | ||||||||||
|
| |||||||||||||
| 169,679,687 | ||||||||||||||
|
| |||||||||||||
| Semiannual Report | FI-17 |
FRANKLIN TEMPLETON VARIABLE INSURANCE PRODUCTS TRUST
STATEMENT OF INVESTMENTS (UNAUDITED)
Franklin Income VIP Fund (continued)
| Country | Principal Amount* | Value | ||||||||||||
| Corporate Bonds (continued) | ||||||||||||||
Utilities 2.7% | ||||||||||||||
Calpine Corp., | ||||||||||||||
senior bond, 5.75%, 1/15/25 | United States | 22,000,000 | $ | 20,707,500 | ||||||||||
senior note, 5.375%, 1/15/23 | United States | 20,000,000 | 19,575,000 | |||||||||||
senior note, 5.50%, 2/01/24 | United States | 16,375,000 | 15,576,719 | |||||||||||
d senior secured bond, 144A, 5.25%, 6/01/26 | United States | 13,200,000 | 13,002,000 | |||||||||||
Dynegy Inc., | ||||||||||||||
senior note, 6.75%, 11/01/19 | United States | 43,000,000 | 44,558,750 | |||||||||||
senior note, 7.375%, 11/01/22 | United States | 20,000,000 | 19,850,000 | |||||||||||
senior note, 5.875%, 6/01/23 | United States | 8,000,000 | 7,520,000 | |||||||||||
| d | InterGen NV, secured bond, 144A, 7.00%, 6/30/23 | Netherlands | 25,000,000 | 24,187,500 | ||||||||||
|
| |||||||||||||
| 164,977,469 | ||||||||||||||
|
| |||||||||||||
Total Corporate Bonds (Cost $2,022,244,835) | 2,129,740,155 | |||||||||||||
|
| |||||||||||||
| f,i | Senior Floating Rate Interests 2.8% | |||||||||||||
Consumer Discretionary 1.1% | ||||||||||||||
Academy Ltd., Initial Term Loan, 5.172%–5.226%, 7/02/22 | United States | 1,588,454 | 1,252,231 | |||||||||||
Belk Inc., Closing Date Term Loan, 5.905, 12/12/22 | United States | 24,683,784 | 21,141,661 | |||||||||||
iHeartCommunications Inc., | ||||||||||||||
Tranche D Term Loan, 7.976, 1/30/19 | United States | 45,864,664 | 37,609,024 | |||||||||||
Tranche E Term Loan, 8.726, 7/30/19 | United States | 13,142,768 | 10,777,070 | |||||||||||
|
| |||||||||||||
| 70,779,986 | ||||||||||||||
|
| |||||||||||||
Energy 0.2% | ||||||||||||||
W&T Offshore Inc., Second Lien Term Loan, 9.00%, 5/15/20 | United States | 11,000,000 | 9,515,000 | |||||||||||
|
| |||||||||||||
Financials 0.3% | ||||||||||||||
First Eagle Investment Management LLC, Initial Term Loans, 4.796%, 12/01/22 | United States | 20,000,000 | 20,212,500 | |||||||||||
|
| |||||||||||||
Health Care 0.3% | ||||||||||||||
Vizient Inc., Term Loan B, 4.726%, 2/13/23 | United States | 17,597,059 | 17,784,028 | |||||||||||
|
| |||||||||||||
Industrials 0.7% | ||||||||||||||
CEVA Group PLC, Pre-Funded L/C, 6.50%, 3/19/21 | United Kingdom | 4,865,761 | 4,551,515 | |||||||||||
CEVA Intercompany BV, Dutch BV Term Loan, 6.672%, 3/19/21 | United Kingdom | 4,964,403 | 4,643,787 | |||||||||||
CEVA Logistics Canada ULC, Canadian Term Loan, 6.672%, 3/19/21 | Canada | 855,932 | 800,653 | |||||||||||
CEVA Logistics U.S. Holdings Inc., U.S. Term Loan, 6.672%, 3/19/21 | United Kingdom | 6,847,453 | 6,405,224 | |||||||||||
Commercial Barge Line Co., Initial Term Loan, 9.976%, 11/12/20 | United States | 9,375,000 | 8,167,969 | |||||||||||
Navistar Inc., Tranche B Term Loans, 5.09%, 8/07/20 | United States | 5,989,806 | 6,060,935 | |||||||||||
Vertiv Group Corp., Term B Loans, 5.226%, 11/30/23 | United States | 11,031,465 | 11,086,490 | |||||||||||
|
| |||||||||||||
| 41,716,573 | ||||||||||||||
|
| |||||||||||||
Utilities 0.2% | ||||||||||||||
Talen Energy Supply LLC, | ||||||||||||||
Term B-1 Loans, 5.226%, 7/15/23 | United States | 5,985,000 | 5,585,998 | |||||||||||
Tranche B-2 Term Loan, 5.226%, 4/13/24. | United States | 7,976,000 | 7,434,294 | |||||||||||
|
| |||||||||||||
| 13,020,292 | ||||||||||||||
|
| |||||||||||||
Total Senior Floating Rate Interests (Cost $184,108,769) | 173,028,379 | |||||||||||||
|
| |||||||||||||
| FI-18 | Semiannual Report |
FRANKLIN TEMPLETON VARIABLE INSURANCE PRODUCTS TRUST
STATEMENT OF INVESTMENTS (UNAUDITED)
Franklin Income VIP Fund (continued)
| Country | Shares | Value | ||||||||||||
Escrows and Litigation Trusts (Cost $62,602) 0.0% | ||||||||||||||
| a,b | Motors Liquidation Co., Escrow Account, cvt. pfd., C | United States | 1,400,000 | $ | — | |||||||||
|
| |||||||||||||
Total Investments before Short Term Investments | 5,683,167,736 | |||||||||||||
|
| |||||||||||||
Short Term Investments 6.7% | ||||||||||||||
| Money Market Funds (Cost $407,603,583) 6.6% | ||||||||||||||
| j,k | Institutional Fiduciary Trust Money Market Portfolio, 0.58% | United States | 407,603,583 | 407,603,583 | ||||||||||
|
| |||||||||||||
| l | Investments from Cash Collateral Received for Loaned Securities 0.1% | |||||||||||||
| Money Market Funds (Cost $3,903,000) 0.1% | ||||||||||||||
| j,k | Institutional Fiduciary Trust Money Market Portfolio, 0.58% | United States | 3,903,000 | 3,903,000 | ||||||||||
|
| |||||||||||||
| Principal Amount* | Value | |||||||||||||
| Repurchase Agreement (Cost $976,430) 0.0%† | ||||||||||||||
| m | Joint Repurchase Agreement, 1.08%, 7/03/17 (Maturity Value $976,518) | |||||||||||||
J.P. Morgan Securities LLC. | ||||||||||||||
Collateralized by nU.S. Treasury Bill, 4/26/18; U.S.Treasury Note 0.875% - 3.50%, 10/15/17 - 9/30/21; U.S. Treasury Notes, Index Linked, 0.125% -2.125%, 1/15/19 - 4/15/20 (Valued at $996,004) | United States | 976,430 | 976,430 | |||||||||||
|
| |||||||||||||
Total Investments from Cash Collateral Received for | 4,879,430 | |||||||||||||
|
| |||||||||||||
Total Investments (Cost $5,529,201,260) 99.4% | 6,095,650,749 | |||||||||||||
Other Assets, less Liabilities 0.6% | 35,837,124 | |||||||||||||
|
| |||||||||||||
Net Assets 100.0% | $ | 6,131,487,873 | ||||||||||||
|
| |||||||||||||
| Semiannual Report | FI-19 |
FRANKLIN TEMPLETON VARIABLE INSURANCE PRODUCTS TRUST
STATEMENT OF INVESTMENTS (UNAUDITED)
Franklin Income VIP Fund (continued)
See Abbreviations on page FI-32.
†Rounds to less than 0.1% of net assets.
*The principal amount is stated in U.S. dollars unless otherwise indicated.
aNon-income producing.
bSecurity has been deemed illiquid because it may not be able to be sold within seven days. At June 30, 2017, the aggregate value of these securities was $7,520,992, representing 0.1% of net assets.
cSee Note 1(d) regarding equity-linked securities.
dSecurity was purchased pursuant to Rule 144A under the Securities Act of 1933 and may be sold in transactions exempt from registration only to qualified institutional buyers or in a public offering registered under the Securities Act of 1933. These securities have been deemed liquid under guidelines approved by the Trust’s Board of Trustees. At June 30, 2017, the aggregate value of these securities was $1,150,045,696, representing 18.8% of net assets.
eA portion or all of the security is on loan at June 30, 2017. See Note 1(e).
fThe coupon rate shown represents the rate at period end.
gIncome may be received in additional securities and/or cash.
hPerpetual security with no stated maturity date.
iSee Note 1(f) regarding senior floating rate interests.
jSee Note 3(e) regarding investments in affiliated management investment companies.
kThe rate shown is the annualized seven-day yield at period end.
lSee Note 1(e) regarding securities on loan.
mSee Note 1(c) regarding joint repurchase agreement.
nThe security was issued on a discount basis with no stated coupon rate.
| FI-20 | Semiannual Report | The accompanying notes are an integral part of these financial statements. |
FRANKLIN TEMPLETON VARIABLE INSURANCE PRODUCTS TRUST
Financial Statements
Statement of Assets and Liabilities
June 30, 2017 (unaudited)
| Franklin Income VIP Fund | ||||
Assets: | ||||
Investments in securities: | ||||
Cost - Unaffiliated issuers | $ | 5,116,718,247 | ||
Cost - Non-controlled affiliates (Note 3e) | 411,506,583 | |||
Cost - Repurchase agreements | 976,430 | |||
|
| |||
Total cost of investments | $ | 5,529,201,260 | ||
|
| |||
Value - Unaffiliated issuers | $ | 5,683,167,736 | ||
Value - Non-controlled affiliates (Note 3e) | 411,506,583 | |||
Value - Repurchase agreements | 976,430 | |||
|
| |||
Total value of investments (includes securities loaned in the amount of $4,630,838) | 6,095,650,749 | |||
Cash. | 714,193 | |||
Receivables: | ||||
Investment securities sold | 2,787,304 | |||
Capital shares sold | 1,991,850 | |||
Dividends and interest | 42,189,604 | |||
Other assets | 3,974 | |||
|
| |||
Total assets | 6,143,337,674 | |||
|
| |||
Liabilities: | ||||
Payables: | ||||
Capital shares redeemed | 2,062,982 | |||
Management fees | 2,182,226 | |||
Distribution fees | 2,332,947 | |||
Payable upon return of securities loaned | 4,879,430 | |||
Accrued expenses and other liabilities | 392,216 | |||
|
| |||
Total liabilities | 11,849,801 | |||
|
| |||
Net assets, at value | $ | 6,131,487,873 | ||
|
| |||
Net assets consist of: | ||||
Paid-in capital | $ | 6,249,004,934 | ||
Undistributed net investment income | 126,111,214 | |||
Net unrealized appreciation (depreciation) | 566,539,892 | |||
Accumulated net realized gain (loss) | (810,168,167 | ) | ||
|
| |||
Net assets, at value | $ | 6,131,487,873 | ||
|
| |||
| Class 1: | ||||
Net assets, at value | $ | 723,350,098 | ||
|
| |||
Shares outstanding | 45,571,991 | |||
|
| |||
Net asset value and maximum offering price per share | $ | 15.87 | ||
|
| |||
| Class 2: | ||||
Net assets, at value | $ | 5,090,255,331 | ||
|
| |||
Shares outstanding | 331,137,932 | |||
|
| |||
Net asset value and maximum offering price per share | $ | 15.37 | ||
|
| |||
| Class 4: | ||||
Net assets, at value | $ | 317,882,444 | ||
|
| |||
Shares outstanding | 20,212,816 | |||
|
| |||
Net asset value and maximum offering price per share | $ | 15.73 | ||
|
| |||
| The accompanying notes are an integral part of these financial statements. | Semiannual Report | FI-21 | |||||
FRANKLIN TEMPLETON VARIABLE INSURANCE PRODUCTS TRUST
FINANCIAL STATEMENTS
Statement of Operations
for the six months ended June 30, 2017 (unaudited)
| Franklin Income VIP Fund | ||||
Investment income: | ||||
Dividends: | ||||
Unaffiliated issuers | $ | 58,114,109 | ||
Non-controlled affiliates (Note 3e) | 628,047 | |||
Interest. | 84,487,059 | |||
Income from securities loaned (net of fees and rebates) | 836,984 | |||
|
| |||
Total investment income | 144,066,199 | |||
|
| |||
Expenses: | ||||
Management fees (Note 3a) | 13,903,046 | |||
Distribution fees: (Note 3c) | ||||
Class 2 | 6,365,703 | |||
Class 4 | 549,101 | |||
Custodian fees (Note 4) | 32,884 | |||
Reports to shareholders | 231,441 | |||
Professional fees | 88,915 | |||
Trustees’ fees and expenses | 13,518 | |||
Other | 75,071 | |||
|
| |||
Total expenses | 21,259,679 | |||
Expense reductions (Note 4) | (420 | ) | ||
Expenses waived/paid by affiliates (Note 3e) | (706,480 | ) | ||
|
| |||
Net expenses | 20,552,779 | |||
|
| |||
Net investment income | 123,513,420 | |||
|
| |||
Realized and unrealized gains (losses): | ||||
Net realized gain (loss) from: | ||||
Investments | 86,072,780 | |||
Realized gain distributions from REITs | 307,701 | |||
Foreign currency transactions | 5,742 | |||
|
| |||
Net realized gain (loss) | 86,386,223 | |||
|
| |||
Net change in unrealized appreciation (depreciation) on: | ||||
Investments | 49,237,355 | |||
Translation of other assets and liabilities denominated in foreign currencies | 118,104 | |||
|
| |||
Net change in unrealized appreciation (depreciation) | 49,355,459 | |||
|
| |||
Net realized and unrealized gain (loss) | 135,741,682 | |||
|
| |||
Net increase (decrease) in net assets resulting from operations | $ | 259,255,102 | ||
|
| |||
| FI-22 | Semiannual Report | The accompanying notes are an integral part of these financial statements. |
FRANKLIN TEMPLETON VARIABLE INSURANCE PRODUCTS TRUST
FINANCIAL STATEMENTS
Statements of Changes in Net Assets
| Franklin Income VIP Fund | ||||||||
| Six Months Ended June 30, 2017 (unaudited) | Year Ended December 31, 2016 | |||||||
Increase (decrease) in net assets: | ||||||||
Operations: | ||||||||
Net investment income | $ | 123,513,420 | $ | 247,868,765 | ||||
Net realized gain (loss) | 86,386,223 | 23,444,659 | ||||||
Net change in unrealized appreciation (depreciation) | 49,355,459 | 499,690,603 | ||||||
|
| |||||||
Net increase (decrease) in net assets resulting from operations | 259,255,102 | 771,004,027 | ||||||
|
| |||||||
Distributions to shareholders from: | ||||||||
Net investment income: | ||||||||
Class 1 | (30,736,550 | ) | (33,648,017 | ) | ||||
Class 2 | (212,433,443 | ) | (243,664,392 | ) | ||||
Class 4 | (12,598,021 | ) | (14,419,491 | ) | ||||
|
| |||||||
Total distributions to shareholders | (255,768,014 | ) | (291,731,900 | ) | ||||
|
| |||||||
Capital share transactions: (Note 2) | ||||||||
Class 1 | 27,112,508 | 34,616,416 | ||||||
Class 2 | (1,335,421 | ) | (215,782,069 | ) | ||||
Class 4 | 7,506,111 | (21,239,696 | ) | |||||
|
| |||||||
Total capital share transactions | 33,283,198 | (202,405,349 | ) | |||||
|
| |||||||
Net increase (decrease) in net assets | 36,770,286 | 276,866,778 | ||||||
Net assets: | ||||||||
Beginning of period | 6,094,717,587 | 5,817,850,809 | ||||||
|
| |||||||
End of period | $ | 6,131,487,873 | $ | 6,094,717,587 | ||||
|
| |||||||
Undistributed net investment income included in net assets: | ||||||||
End of period | $ | 126,111,214 | $ | 258,365,808 | ||||
|
| |||||||
| The accompanying notes are an integral part of these financial statements. | Semiannual Report | FI-23 |
FRANKLIN TEMPLETON VARIABLE INSURANCE PRODUCTS TRUST
Notes to Financial Statements (unaudited)
Franklin Income VIP Fund
1. Organization and Significant Accounting Policies
Franklin Templeton Variable Insurance Products Trust (Trust) is registered under the Investment Company Act of 1940 (1940 Act) as an open-end management investment company, consisting of eighteen separate funds and applies the specialized accounting and reporting guidance in U.S. Generally Accepted Accounting Principles (U.S. GAAP). Franklin Income VIP Fund (Fund) is included in this report. Shares of the Fund are generally sold only to insurance company separate accounts to fund the benefits of variable life insurance policies or variable annuity contracts. The Fund offers three classes of shares: Class 1, Class 2, and Class 4. Each class of shares may differ by its distribution fees, voting rights on matters affecting a single class and its exchange privilege.
The following summarizes the Fund’s significant accounting policies.
a. Financial Instrument Valuation
The Fund’s investments in financial instruments are carried at fair value daily. Fair value is the price that would be received to sell an asset or paid to transfer a liability in an orderly transaction between market participants on the measurement date. The Fund calculates the net asset value (NAV) per share as of 4 p.m. Eastern time each day the New York Stock Exchange (NYSE) is open for trading. Under compliance policies and procedures approved by the Trust’s Board of Trustees (the Board), the Fund’s administrator has responsibility for oversight of valuation, including leading the cross-functional Valuation Committee (VC). The VC provides administration and oversight of the Fund’s valuation policies and procedures, which are approved annually by the Board. Among other things, these procedures allow the Fund to utilize independent pricing services, quotations from securities and financial instrument dealers, and other market sources to determine fair value.
Equity securities listed on an exchange or on the NASDAQ National Market System are valued at the last quoted sale price or the official closing price of the day, respectively. Foreign equity securities are valued as of the close of trading on the foreign stock exchange on which the security is primarily traded, or as of 4 p.m. Eastern time. The value is then converted into its U.S. dollar equivalent at the foreign exchange rate in effect at 4 p.m. Eastern time on the day that the value of the security is determined. Over-the-counter (OTC) securities are
valued within the range of the most recent quoted bid and ask prices. Securities that trade in multiple markets or on multiple exchanges are valued according to the broadest and most representative market. Certain equity securities are valued based upon fundamental characteristics or relationships to similar securities.
Debt securities generally trade in the OTC market rather than on a securities exchange. The Fund’s pricing services use multiple valuation techniques to determine fair value. In instances where sufficient market activity exists, the pricing services may utilize a market-based approach through which quotes from market makers are used to determine fair value. In instances where sufficient market activity may not exist or is limited, the pricing services also utilize proprietary valuation models which may consider market characteristics such as benchmark yield curves, credit spreads, estimated default rates, anticipated market interest rate volatility, coupon rates, anticipated timing of principal repayments, underlying collateral, and other unique security features in order to estimate the relevant cash flows, which are then discounted to calculate the fair value. Securities denominated in a foreign currency are converted into their U.S. dollar equivalent at the foreign exchange rate in effect at 4 p.m. Eastern time on the date that the values of the foreign debt securities are determined.
Investments in open-end mutual funds are valued at the closing NAV. Investments in repurchase agreements are valued at cost, which approximates fair value.
The Fund has procedures to determine the fair value of financial instruments for which market prices are not reliable or readily available. Under these procedures, the VC convenes on a regular basis to review such financial instruments and considers a number of factors, including significant unobservable valuation inputs, when arriving at fair value. The VC primarily employs a market-based approach which may use related or comparable assets or liabilities, recent transactions, market multiples, book values, and other relevant information for the investment to determine the fair value of the investment. An income-based valuation approach may also be used in which the anticipated future cash flows of the investment are discounted to calculate fair value. Discounts may also be applied due to the nature or duration of any restrictions on the disposition of the investments. Due to the inherent uncertainty of valuations of such investments, the fair values may differ significantly from the values that would have been used had an active market existed. The VC employs various methods for calibrating these
| FI-24 | Semiannual Report |
FRANKLIN TEMPLETON VARIABLE INSURANCE PRODUCTS TRUST
NOTES TO FINANCIAL STATEMENTS (UNAUDITED)
Franklin Income VIP Fund (continued)
valuation approaches including a regular review of key inputs and assumptions, transactional back-testing or disposition analysis, and reviews of any related market activity.
Trading in securities on foreign securities stock exchanges and OTC markets may be completed before 4 p.m. Eastern time. In addition, trading in certain foreign markets may not take place on every Fund’s business day. Occasionally, events occur between the time at which trading in a foreign security is completed and 4 p.m. Eastern time that might call into question the reliability of the value of a portfolio security held by the Fund. As a result, differences may arise between the value of the Fund’s portfolio securities as determined at the foreign market close and the latest indications of value at 4 p.m. Eastern time. In order to minimize the potential for these differences, the VC monitors price movements following the close of trading in foreign stock markets through a series of country specific market proxies (such as baskets of American Depositary Receipts, futures contracts and exchange traded funds). These price movements are measured against established trigger thresholds for each specific market proxy to assist in determining if an event has occurred that may call into question the reliability of the values of the foreign securities held by the Fund. If such an event occurs, the securities may be valued using fair value procedures, which may include the use of independent pricing services.
When the last day of the reporting period is a non-business day, certain foreign markets may be open on those days that the Fund’s NAV is not calculated, which could result in differences between the value of the Fund’s portfolio securities on the last business day and the last calendar day of the reporting period. Any significant security valuation changes due to an open foreign market are adjusted and reflected by the Fund for financial reporting purposes.
b. Foreign Currency Translation
Portfolio securities and other assets and liabilities denominated in foreign currencies are translated into U.S. dollars based on the exchange rate of such currencies against U.S. dollars on the date of valuation. The Fund may enter into foreign currency exchange contracts to facilitate transactions denominated in a foreign currency. Purchases and sales of securities, income and expense items denominated in foreign currencies are translated into U.S. dollars at the exchange rate in effect on the transaction date. Portfolio securities and assets and liabilities denominated in foreign currencies contain risks that those currencies will
decline in value relative to the U.S. dollar. Occasionally, events may impact the availability or reliability of foreign exchange rates used to convert the U.S. dollar equivalent value. If such an event occurs, the foreign exchange rate will be valued at fair value using procedures established and approved by the Board.
The Fund does not separately report the effect of changes in foreign exchange rates from changes in market prices on securities held. Such changes are included in net realized and unrealized gain or loss from investments in the Statement of Operations.
Realized foreign exchange gains or losses arise from sales of foreign currencies, currency gains or losses realized between the trade and settlement dates on securities transactions and the difference between the recorded amounts of dividends, interest, and foreign withholding taxes and the U.S. dollar equivalent of the amounts actually received or paid. Net unrealized foreign exchange gains and losses arise from changes in foreign exchange rates on foreign denominated assets and liabilities other than investments in securities held at the end of the reporting period.
c. Joint Repurchase Agreement
The Fund enters into a joint repurchase agreement whereby its uninvested cash balance is deposited into a joint cash account with other funds managed by the investment manager or an affiliate of the investment manager and is used to invest in one or more repurchase agreements. The value and face amount of the joint repurchase agreement are allocated to the funds based on their pro-rata interest. A repurchase agreement is accounted for as a loan by the Fund to the seller, collateralized by securities which are delivered to the Fund’s custodian. The fair value, including accrued interest, of the initial collateralization is required to be at least 102% of the dollar amount invested by the funds, with the value of the underlying securities marked to market daily to maintain coverage of at least 100%. Repurchase agreements are subject to the terms of Master Repurchase Agreements (MRAs) with approved counterparties (sellers). The MRAs contain various provisions, including but not limited to events of default and maintenance of collateral for repurchase agreements. In the event of default by either the seller or the Fund, certain MRAs may permit the non-defaulting party to net and close-out all transactions, if any, traded under such agreements. The Fund may sell securities it holds as collateral and apply the proceeds towards the repurchase price and any other amounts owed by the seller to the Fund in the event of
| Semiannual Report | FI-25 |
FRANKLIN TEMPLETON VARIABLE INSURANCE PRODUCTS TRUST
NOTES TO FINANCIAL STATEMENTS (UNAUDITED)
Franklin Income VIP Fund (continued)
1. Organization and Significant Accounting Policies (continued)
c. Joint Repurchase Agreement (continued)
default by the seller. This could involve costs or delays in addition to a loss on the securities if their value falls below the repurchase price owed by the seller. The joint repurchase agreement held by the Fund at period end, as indicated in the Statement of Investments, had been entered into on June 30, 2017.
d. Equity-Linked Securities
The Fund invests in equity-linked securities. Equity-linked securities are hybrid financial instruments that generally combine both debt and equity characteristics into a single note form. Income received from equity-linked securities is recorded as realized gains in the Statement of Operations and may be based on the performance of an underlying equity security, an equity index, or an option position. The risks of investing in equity-linked securities include unfavorable price movements in the underlying security and the credit risk of the issuing financial institution. There may be no guarantee of a return of principal with equity-linked securities and the appreciation potential may be limited. Equity-linked securities may be more volatile and less liquid than other investments held by the Fund.
e. Securities Lending
The Fund participates in an agency based securities lending program to earn additional income. The Fund receives cash collateral against the loaned securities in an amount equal to at least 102% of the fair value of the loaned securities. Collateral is maintained over the life of the loan in an amount not less than 100% of the fair value of loaned securities, as determined at the close of Fund business each day; any additional collateral required due to changes in security values is delivered to the Fund on the next business day. The collateral is deposited into a joint cash account with other funds and is used to invest in a money market fund managed by Franklin Advisers, Inc., an affiliate of the Fund, and/or a joint repurchase agreement. The Fund may receive income from the investment of cash collateral, in addition to lending fees and rebates paid by the borrower. Income from securities loaned, net of fees paid to the securities lending agent and/or third-party vendor, is reported separately in the Statement of Operations. The Fund bears the market risk with respect to the collateral investment, securities loaned, and the risk that the agent may default on its obligations
to the Fund. If the borrower defaults on its obligation to return the securities loaned, the Fund has the right to repurchase the securities in the open market using the collateral received. The securities lending agent has agreed to indemnify the Fund in the event of default by a third party borrower.
f. Senior Floating Rate Interests
The Fund invests in senior secured corporate loans that pay interest at rates which are periodically reset by reference to a base lending rate plus a spread. These base lending rates are generally the prime rate offered by a designated U.S. bank or the London InterBank Offered Rate (LIBOR). Senior secured corporate loans often require prepayment of principal from excess cash flows or at the discretion of the borrower. As a result, actual maturity may be substantially less than the stated maturity. Senior secured corporate loans in which the Fund invests are generally readily marketable, but may be subject to certain restrictions on resale.
g. Income and Deferred Taxes
It is the Fund’s policy to qualify as a regulated investment company under the Internal Revenue Code. The Fund intends to distribute to shareholders substantially all of its taxable income and net realized gains to relieve it from federal income and if applicable, excise taxes. As a result, no provision for U.S. federal income taxes is required.
The Fund may be subject to foreign taxation related to income received, capital gains on the sale of securities and certain foreign currency transactions in the foreign jurisdictions in which it invests. Foreign taxes, if any, are recorded based on the tax regulations and rates that exist in the foreign markets in which the Fund invests. When a capital gain tax is determined to apply, the Fund records an estimated deferred tax liability in an amount that would be payable if the securities were disposed of on the valuation date. As a result of several court cases, in certain countries across the European Union, the Fund filed additional tax reclaims for previously withheld taxes on dividends earned in those countries (EU reclaims). These additional filings are subject to various administrative proceedings by the local jurisdictions’ tax authorities within the European Union, as well as a number of related judicial proceedings. Income recognized, if any, for EU reclaims is reflected as other income in the Statement of Operations and any related receivable, if any, is reflected as European Union tax reclaims in the Statement of Assets and Liabilities. When uncertainty exists as to the ultimate resolution of these
| FI-26 | Semiannual Report |
FRANKLIN TEMPLETON VARIABLE INSURANCE PRODUCTS TRUST
NOTES TO FINANCIAL STATEMENTS (UNAUDITED)
Franklin Income VIP Fund (continued)
proceedings, the likelihood of receipt of these EU reclaims, and the potential timing of payment, no amounts are reflected in the financial statements. For U.S. income tax purposes, when EU reclaims are received by the Fund and the Fund previously passed foreign tax credit on to its shareholders, the Fund must either amend historic tax reporting to shareholders or enter into a closing agreement with the Internal Revenue Service (IRS) in order to pay the associated tax liability on behalf of the Fund’s shareholders.
The Fund may recognize an income tax liability related to its uncertain tax positions under U.S. GAAP when the uncertain tax position has a less than 50% probability that it will be sustained upon examination by the tax authorities based on its technical merits. As of June 30, 2017, the Fund has determined that no tax liability is required in its financial statements related to uncertain tax positions for any open tax years (or expected to be taken in future tax years). Open tax years are those that remain subject to examination and are based on each tax jurisdiction’s statute of limitation.
h. Security Transactions, Investment Income, Expenses and Distributions
Security transactions are accounted for on trade date. Realized gains and losses on security transactions are determined on a specific identification basis. Interest income and estimated expenses are accrued daily. Amortization of premium and accretion of discount on debt securities are included in interest income. Facility fees are recognized as income over the expected term of the loan. Dividend income is recorded on the ex-dividend date except for certain dividends from securities where the dividend rate is not available. In such cases, the dividend is recorded as soon as the information is received by the Fund. Distributions from realized capital gains and other distributions, if any, are recorded on the ex-dividend date. Distributions to shareholders are recorded on the ex-dividend date. Distributable earnings are determined according to income tax regulations (tax basis) and may differ from earnings
recorded in accordance with U.S. GAAP. These differences may be permanent or temporary. Permanent differences are reclassified among capital accounts to reflect their tax character. These reclassifications have no impact on net assets or the results of operations. Temporary differences are not reclassified, as they may reverse in subsequent periods.
Common expenses incurred by the Trust are allocated among the Funds based on the ratio of net assets of each Fund to the combined net assets of the Trust. Fund specific expenses are charged directly to the Fund that incurred the expense.
Realized and unrealized gains and losses and net investment income, not including class specific expenses, are allocated daily to each class of shares based upon the relative proportion of net assets of each class. Differences in per share distributions, by class, are generally due to differences in class specific expenses.
i. Accounting Estimates
The preparation of financial statements in accordance with U.S. GAAP requires management to make estimates and assumptions that affect the reported amounts of assets and liabilities at the date of the financial statements and the amounts of income and expenses during the reporting period. Actual results could differ from those estimates.
j. Guarantees and Indemnifications
Under the Trust’s organizational documents, its officers and trustees are indemnified by the Trust against certain liabilities arising out of the performance of their duties to the Trust. Additionally, in the normal course of business, the Trust, on behalf of the Fund, enters into contracts with service providers that contain general indemnification clauses. The Trust’s maximum exposure under these arrangements is unknown as this would involve future claims that may be made against the Trust that have not yet occurred. Currently, the Trust expects the risk of loss to be remote.
| Semiannual Report | FI-27 |
FRANKLIN TEMPLETON VARIABLE INSURANCE PRODUCTS TRUST
NOTES TO FINANCIAL STATEMENTS (UNAUDITED)
Franklin Income VIP Fund (continued)
2. Shares of Beneficial Interest
At June 30, 2017, there were an unlimited number of shares authorized (without par value). Transactions in the Fund’s shares were as follows:
| Six Months Ended June 30, 2017 | Year Ended December 31, 2016 | |||||||||||||||||||
| Shares | Amount | Shares | Amount | |||||||||||||||||
| Class 1 Shares: | ||||||||||||||||||||
Shares sold | 1,407,910 | $ | 22,868,571 | 6,134,123 | $ | 87,911,597 | ||||||||||||||
Shares issued in reinvestment of distributions | 1,925,849 | 30,736,550 | 2,331,810 | 33,648,017 | ||||||||||||||||
Shares redeemed | (1,622,291 | ) | (26,492,613 | ) | (5,877,695 | ) | (86,943,198 | ) | ||||||||||||
|
| |||||||||||||||||||
Net increase (decrease) | 1,711,468 | $ | 27,112,508 | 2,588,238 | $ | 34,616,416 | ||||||||||||||
|
| |||||||||||||||||||
| Class 2 Shares: | ||||||||||||||||||||
Shares sold | 7,863,112 | $ | 124,015,671 | 25,914,952 | $ | 378,696,453 | ||||||||||||||
Shares issued in reinvestment of distributions | 13,740,843 | 212,433,443 | 17,417,040 | 243,664,392 | ||||||||||||||||
Shares redeemed | (21,387,138 | ) | (337,784,535 | ) | (58,055,463 | ) | (838,142,914 | ) | ||||||||||||
|
| |||||||||||||||||||
Net increase (decrease) | 216,817 | $ | (1,335,421 | ) | (14,723,471 | ) | $ | (215,782,069 | ) | |||||||||||
|
| |||||||||||||||||||
| Class 4 Shares: | ||||||||||||||||||||
Shares sold | 1,694,853 | $ | 27,294,426 | 1,804,015 | $ | 26,579,870 | ||||||||||||||
Shares issued in reinvestment of distributions | 796,839 | 12,598,021 | 1,008,356 | 14,419,491 | ||||||||||||||||
Shares redeemed | (2,007,850 | ) | (32,386,336 | ) | (4,209,003 | ) | (62,239,057 | ) | ||||||||||||
|
| |||||||||||||||||||
Net increase (decrease) | 483,842 | $ | 7,506,111 | (1,396,632 | ) | $ | (21,239,696 | ) | ||||||||||||
|
| |||||||||||||||||||
3. Transactions with Affiliates
Franklin Resources, Inc. is the holding company for various subsidiaries that together are referred to as Franklin Templeton Investments. Certain officers and trustees of the Fund are also officers and/or directors of the following subsidiaries:
| Subsidiary | Affiliation | |
Franklin Advisers, Inc. (Advisers) | Investment manager | |
Franklin Templeton Services, LLC (FT Services) | Administrative manager | |
Franklin Templeton Distributors, Inc. (Distributors) | Principal underwriter | |
Franklin Templeton Investor Services, LLC (Investor Services) | Transfer agent |
a. Management Fees
The Fund pays an investment management fee to Advisers based on the average daily net assets of the Fund as follows:
| Annualized Fee Rate | Net Assets | |
0.625% | Up to and including $100 million | |
0.500% | Over $100 million, up to and including $250 million | |
0.450% | Over $250 million, up to and including $7.5 billion | |
0.440% | Over $7.5 billion, up to and including $10 billion | |
0.430% | Over $10 billion, up to and including $12.5 billion | |
0.420% | Over $12.5 billion, up to and including $15 billion | |
0.400% | In excess of $15 billion |
| FI-28 | Semiannual Report |
FRANKLIN TEMPLETON VARIABLE INSURANCE PRODUCTS TRUST
NOTES TO FINANCIAL STATEMENTS (UNAUDITED)
Franklin Income VIP Fund (continued)
For the period ended June 30, 2017, the annualized effective investment management fee rate was 0.454% of the Fund’s average daily net assets.
b. Administrative Fees
Under an agreement with Advisers, FT Services provides administrative services to the Fund. The fee is paid by Advisers based on the Fund’s average daily net assets, and is not an additional expense of the Fund.
c. Distribution Fees
The Board has adopted distribution plans for Class 2 and Class 4 shares pursuant to Rule 12b-1 under the 1940 Act. Under the Fund’s compensation distribution plans, the Fund pays Distributors for costs incurred in connection with the servicing, sale and distribution of the Fund’s shares up to 0.35%, per year of its average daily net assets of each class. The Board has agreed to limit the current rate to 0.25% per year for Class 2. The plan year, for purposes of monitoring compliance with the maximum annual plan rates, is February 1 through January 31.
d. Transfer Agent Fees
Investor Services, under terms of an agreement, performs shareholder servicing for the Fund and is not paid by the Fund for the services.
e. Investments in Affiliated Management Investment Companies
The Funds invest in one or more affiliated management investment companies for purposes other than exercising a controlling influence over the management or policies. Management fees paid by the Fund are waived on assets invested in the affiliated management investment companies, as noted in the Statement of Operations, in an amount not to exceed the management and administrative fees paid directly or indirectly by each affiliate. During the period ended June 30, 2017, the Fund held investments in affiliated management investment companies as follows:
Number of Shares Held at Beginning | Gross Additions | Gross Reductions | Number of Shares End of | Value at End of | Investment Income | Realized Gain (Loss) | % of Affiliated Fund Shares Outstanding Held at End of Period | |||||||||||||||||||||||||
Non-Controlled Affiliates | ||||||||||||||||||||||||||||||||
Institutional Fiduciary Trust Money Market Portfolio, 0.58% | 310,250,028 | 1,147,556,121 | (1,046,299,566 | ) | 411,506,583 | $ | 411,506,583 | $ | 628,047 | $ | — | 2.2% | ||||||||||||||||||||
|
| |||||||||||||||||||||||||||||||
f. Other Affiliated Transactions
At June 30, 2017, Franklin Templeton Variable Insurance Products Trust — Franklin Founding Funds Allocation VIP Fund owned 5.4% of the Fund’s outstanding shares.
4. Expense Offset Arrangement
The Fund has entered into an arrangement with its custodian whereby credits realized as a result of uninvested cash balances are used to reduce a portion of the Fund’s custodian expenses. During the period ended June 30, 2017, the custodian fees were reduced as noted in the Statement of Operations.
| Semiannual Report | FI-29 |
FRANKLIN TEMPLETON VARIABLE INSURANCE PRODUCTS TRUST
NOTES TO FINANCIAL STATEMENTS (UNAUDITED)
Franklin Income VIP Fund (continued)
5. Income Taxes
For tax purposes, capital losses may be carried over to offset future capital gains. Capital loss carryforwards with no expiration, if any, must be fully utilized before those losses with expiration dates.
At December 31, 2016, the capital loss carryforwards were as follows:
Capital loss carryforwards subject to expiration: | ||||
2017 | $ | 521,405,875 | ||
2018 | 157,561,044 | |||
Capital loss carryforwards not subject to expiration: | ||||
Short term | 135,162,624 | |||
Long term | 76,910,085 | |||
|
| |||
Total capital loss carryforwards | $ | 891,039,628 | ||
|
|
At June 30, 2017, the cost of investments and net unrealized appreciation (depreciation) for income tax purposes were as follows:
Cost of investments. | $ | 5,533,618,674 | ||
|
| |||
Unrealized appreciation | $ | 837,095,486 | ||
Unrealized depreciation | (275,063,411 | ) | ||
|
| |||
Net unrealized appreciation (depreciation) | $ | 562,032,075 | ||
|
|
Differences between income and/or capital gains as determined on a book basis and a tax basis are primarily due to differing treatment of bond discounts and premiums and wash sales.
6. Investment Transactions
Purchases and sales of investments (excluding short term securities) for the period ended June 30, 2017, aggregated $691,251,845 and $891,140,442, respectively.
At June 30, 2017, in connection with securities lending transactions, the Fund loaned corporate bonds and received $4,879,430 of cash collateral. The gross amount of recognized liability for such transactions is included in payable upon return of securities loaned in the Statement of Assets and Liabilities. The agreements can be terminated at any time.
7. Credit Risk
At June 30, 2017, the Fund had 33.10% of its portfolio invested in high yield, senior secured floating rate notes, or other securities rated below investment grade and unrated securities, if any. These securities may be more sensitive to economic conditions causing greater price volatility and are potentially subject to a greater risk of loss due to default than higher rated securities.
8. Credit Facility
The Fund, together with other U.S. registered and foreign investment funds (collectively, Borrowers), managed by Franklin Templeton Investments, are borrowers in a joint syndicated senior unsecured credit facility totaling $2 billion (Global Credit Facility) which matures on February 9, 2018. This Global Credit Facility provides a source of funds to the Borrowers for temporary and emergency purposes, including the ability to meet future unanticipated or unusually large redemption requests.
| FI-30 | Semiannual Report |
FRANKLIN TEMPLETON VARIABLE INSURANCE PRODUCTS TRUST
NOTES TO FINANCIAL STATEMENTS (UNAUDITED)
Franklin Income VIP Fund (continued)
Under the terms of the Global Credit Facility, the Fund shall, in addition to interest charged on any borrowings made by the Fund and other costs incurred by the Fund, pay its share of fees and expenses incurred in connection with the implementation and maintenance of the Global Credit Facility, based upon its relative share of the aggregate net assets of all of the Borrowers, including an annual commitment fee of 0.15% based upon the unused portion of the Global Credit Facility. These fees are reflected in other expenses in the Statement of Operations. During the period ended June 30, 2017, the Fund did not use the Global Credit Facility.
9. Fair Value Measurements
The Fund follows a fair value hierarchy that distinguishes between market data obtained from independent sources (observable inputs) and the Fund’s own market assumptions (unobservable inputs). These inputs are used in determining the value of the Fund’s financial instruments and are summarized in the following fair value hierarchy:
| • | Level 1 – quoted prices in active markets for identical financial instruments |
| • | Level 2 – other significant observable inputs (including quoted prices for similar financial instruments, interest rates, prepayment speed, credit risk, etc.) |
| • | Level 3 – significant unobservable inputs (including the Fund’s own assumptions in determining the fair value of financial instruments) |
The input levels are not necessarily an indication of the risk or liquidity associated with financial instruments at that level.
For movements between the levels within the fair value hierarchy, the Fund has adopted a policy of recognizing the transfers as of the date of the underlying event which caused the movement.
A summary of inputs used as of June 30, 2017, in valuing the Fund’s assets carried at fair value, is as follows:
| Level 1 | Level 2 | Level 3 | Total | |||||||||||||
| Assets: | ||||||||||||||||
Investments in Securities: | ||||||||||||||||
Equity Investments:a | ||||||||||||||||
Banks | $ | 338,282,889 | $ | 8,431,250 | $ | — | $ | 346,714,139 | ||||||||
Transportation | 54,455,000 | 7,520,992 | — | 61,975,992 | ||||||||||||
All Other Equity Investmentsb | 2,577,038,469 | — | — | 2,577,038,469 | ||||||||||||
Equity-Linked Securities | — | 333,034,946 | — | 333,034,946 | ||||||||||||
Convertible Bonds | — | 61,635,656 | — | 61,635,656 | ||||||||||||
Corporate Bonds | — | 2,129,740,155 | — | 2,129,740,155 | ||||||||||||
Senior Floating Rate Interests | — | 173,028,379 | — | 173,028,379 | ||||||||||||
Escrows and Litigation Trusts | — | — | — | c | — | |||||||||||
Short Term Investments | 411,506,583 | 976,430 | — | 412,483,013 | ||||||||||||
|
| |||||||||||||||
Total Investments in Securities | $ | 3,381,282,941 | $ | 2,714,367,808 | $ | — | $ | 6,095,650,749 | ||||||||
|
| |||||||||||||||
aIncludes common, preferred and convertible preferred stocks .
bFor detailed categories, see the accompanying Statement of Investments.
cIncludes securities determined to have no value at June 30, 2017.
A reconciliation of assets in which Level 3 inputs are used in determining fair value is presented when there are significant Level 3 financial instruments at the end of the period.
| Semiannual Report | FI-31 |
FRANKLIN TEMPLETON VARIABLE INSURANCE PRODUCTS TRUST
NOTES TO FINANCIAL STATEMENTS (UNAUDITED)
Franklin Income VIP Fund (continued)
10. New Accounting Pronouncements
In March 2017, the Financial Accounting Standards Board issued Accounting Standards Update (ASU) No. 2017-08, Receivables – Nonrefundable Fees and Other Costs (Subtopic 310-20): Premium Amortization on Purchased Callable Debt Securities. The amendments in the ASU shorten the amortization period for certain callable debt securities, held at a premium, to be amortized to the earliest call date. The ASU does not require an accounting change for securities held at a discount; which continues to be amortized to maturity. The ASU is effective for fiscal years and interim periods within those fiscal years beginning after December 15, 2018. Management is currently evaluating the impact, if any, of applying this provision.
11. Investment Company Reporting Modernization
In October 2016, the U.S. Securities and Exchange Commission adopted new rules and amended existing rules (together, final rules) intended to modernize the reporting and disclosure of information by registered investment companies. In part, the final rules amend Regulation S-X and require standardized, enhanced disclosures about derivatives in investment company financial statements, as well as other amendments. The compliance date for the amendments to Regulation S-X is August 1, 2017. Management has reviewed the requirements and believes the adoption of the amendments to Regulation S-X will not have a material impact on the Fund’s financial statements and related disclosures.
12. Subsequent Events
The Fund has evaluated subsequent events through the issuance of the financial statements and determined that no events have occurred that require disclosure.
Abbreviations
| Currency | Selected Portfolio | |||||
| EUR | Euro | ADR | American Depositary Receipt | |||
| FNMA | Federal National Mortgage Association | |||||
| FRN | Floating Rate Note | |||||
| PIK | Payment-In-Kind | |||||
| L/C | Letter of Credit | |||||
| FI-32 | Semiannual Report |
Franklin Large Cap Growth VIP Fund
We are pleased to bring you Franklin Large Cap Growth VIP Fund’s semiannual report for the period ended June 30, 2017.
Class 1 Performance Summary as of June 30, 2017
The Fund’s Class 1 Shares delivered a +15.74% total return for the six-month period ended June 30, 2017.
Performance reflects the Fund’s Class 1 operating expenses, but does not include any contract fees, expenses or sales charges. If they had been included, performance would be lower. These charges and deductions, particularly for variable life policies, can have a significant effect on contract values and insurance benefits. See the contract prospectus for a complete description of these expenses, including sales charges.
Performance data represent past performance, which does not guarantee future results. Investment return and principal value will fluctuate, and you may have a gain or loss when you sell your shares. Current performance may differ from figures shown.
| Semiannual Report | FLG-1 |
FRANKLIN LARGE CAP GROWTH VIP FUND
Fund Goal and Main Investments
The Fund seeks capital appreciation. Under normal market conditions, the Fund invests at least 80% of its net assets in investments of large capitalization companies. For this Fund, large capitalization companies are those with market capitalization values within those of the top 50% of companies in the Russell 1000® Index at the time of purchase.1
Fund Risks
All investments involve risks, including possible loss of principal. Stock prices fluctuate, sometimes rapidly and dramatically, due to factors affecting individual companies, particular industries or sectors, or general market conditions. The Fund may focus on particular sectors of the market from time to time, which can carry greater risks of adverse developments in such sectors. Smaller or midsized companies can be particularly sensitive to changing economic conditions, and their prospects for growth are less certain than those of larger, more established companies. Investments in foreign securities may involve special risks including currency fluctuations and economic and political uncertainty. The Fund is actively managed but there is no guarantee that the manager’s investment decisions will produce the desired results. The Fund’s prospectus also includes a description of the main investment risks.
Performance Overview
You can find the Fund’s six-month total return in the Performance Summary. In comparison, the Fund’s benchmark, the Standard & Poor’s® 500 Index (S&P 500®), generated a +9.34% total return.2
Economic and Market Overview
U.S. economic growth decelerated in 2017’s first quarter, largely due to slower growth in consumer spending and declines in private inventory investment and government spending. However, growth accelerated in the second quarter due to increases in consumer spending, business investment and federal government spending. The manufacturing sector generally expanded, and the services sector also continued to grow. The unemployment rate decreased from 4.7% in December 2016 to 4.4% at period-end.3 Monthly retail sales
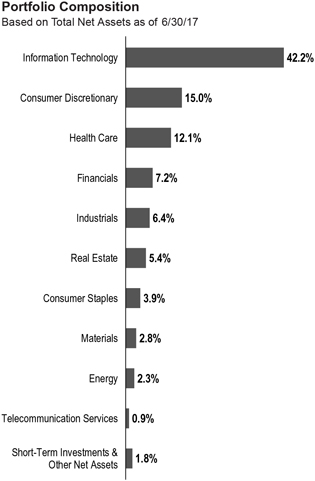
were volatile, but grew for most of the period. Annual inflation, as measured by the Consumer Price Index, decreased from 2.1% to 1.6% during the period.
The U.S. Federal Reserve (Fed), at its March meeting, increased the federal funds target rate from 0.50%–0.75% to 0.75%–1.00%. The Fed again increased its target range by a quarter point to 1.00%–1.25% at its June meeting. The Fed made both of these increases amid signs of a growing U.S. economy, a strengthening labor market and an improvement in business spending.
U.S. equity markets rose during the period, benefiting from mostly upbeat economic data, better U.S. corporate earnings and signs of improvement in the Chinese and European economies. Investor optimism arising from pro-growth and
1. Please see Index Descriptions following the Fund Summaries.
2. Source: Morningstar.
One cannot invest directly in an index, and an index is not representative of the Fund’s portfolio. Please see Index Descriptions following the Fund Summaries.
3. Source: Bureau of Labor Statistics.
The dollar value, number of shares or principal amount, and names of all portfolio holdings are listed in the Fund’s Statement of Investments (SOI).
| FLG-2 | Semiannual Report |
FRANKLIN LARGE CAP GROWTH VIP FUND
pro-business policy plans in the U.S. and the victory of Emmanuel Macron as France’s President also helped U.S. equities. However, concerns about the terms of the U.K.’s exit from the European Union (also known as “Brexit”), uncertainty about President Trump’s ability to implement reforms, and geopolitical tensions in the Middle East and the Korean peninsula curbed market sentiment. The broad U.S. stock market, as measured by the S&P 500, generated a +9.34% total return for the period.2
Investment Strategy
We are a research driven, fundamental investor, pursuing a growth strategy. As a “bottom-up” investor focusing primarily on individual securities, we seek companies that have identifiable drivers of future earnings growth and that present, in our opinion, the best trade-off between that potential earnings growth, business and financial risk, and valuation.
Manager’s Discussion
Looking back on the key factors impacting the Fund’s returns during the six months under review, we would like to remind shareholders that our investment strategy is primarily bottom-up and driven by individual stock selection. However, we recognize that a sector-based discussion can be a helpful way to organize a portfolio review of key performance drivers. We employed our long-held strategy: bottom-up, individual company, fundamental research aimed at opportunistically finding what we believed to be outstanding large-cap companies across all sectors, at valuations we believed understated their fair worth, with future growth potential being a key driver of estimated worth.
During the period under review, most sectors represented in the Fund’s portfolio contributed to absolute performance. Relative to the S&P 500, the information technology (IT) sector contributed significantly to performance, due to stock selection and an overweighted position. Security selection in the consumer discretionary and real estate sectors also benefited results.
In IT, computer software developer Facebook, Adobe Systems and ServiceNow4 contributed notably to relative performance. Facebook continued to generate strong user growth and engagement in its Facebook and Instagram platforms. Innovative advertising formats and targeting capabilities helped the company gain a larger share of clients’ advertising budgets. The company has been investing heavily into its business,
| Top 10 Holdings | ||||
| 6/30/17 | ||||
| Company Sector/Industry | % of Total Net Assets | |||
Amazon.com Inc. Consumer Discretionary | 5.8% | |||
Facebook Inc. Information Technology | 5.0% | |||
Apple Inc. Information Technology | 4.9% | |||
Alphabet Inc. Information Technology | 3.8% | |||
Mastercard Inc. Information Technology | 3.7% | |||
Visa Inc. Information Technology | 3.6% | |||
Microsoft Corp. Information Technology | 3.5% | |||
Celgene Corp. Health Care | 3.1% | |||
SBA Communications Corp. Real Estate | 2.4% | |||
Broadcom Ltd. Information Technology | 2.1% | |||
while sustaining high operating margins. Increased advertising on Instagram and the proliferation of video (and video ads) across both platforms drove revenue growth. Adobe Systems benefited from the successful transition of its creative cloud productivity tools from a license to a subscription model, with creative cloud revenues surpassing pre-transition levels, as well as from its marketing cloud’s robust growth. The company generated strong earnings and free cash flow growth, driven by rapid margin expansion. Cloud-based solutions provider ServiceNow contributed to the Fund’s performance. The company has been sustaining the growth of its core IT service management solutions segment, while also meaningfully growing its emerging IT operations and enterprise service management solutions platform.
Within the consumer discretionary sector, online marketplace Amazon.com helped performance. With e-commerce gaining momentum, the company continued to increase its e-commerce market share by expanding categories and regions, shortening delivery times and driving consumer loyalty through Amazon Prime. Amazon continues to invest heavily on its business, while creating significant longer term company and shareholder value. Cloud-computing leader Amazon Web Services
| Semiannual Report | FLG-3 |
FRANKLIN LARGE CAP GROWTH VIP FUND
generated strong growth and profitability, and now accounts for half of Amazon’s current operating income.
In the real estate sector, real estate investment trust (REIT) SBA Communications contributed to relative performance.4 Shares of SBA, which operates wireless telecommunications infrastructure, rebounded after underperforming with the REIT industry after the U.S. presidential election in November 2016. Fundamentally, industry growth seems to be accelerating as carriers look to deploy many spectrum bands that were recently acquired or won.
In contrast, relative to the S&P 500, a major detractor from the Fund’s relative performance was stock selection in the health care sector. Within the sector, pharmaceutical company Bristol-Myers Squibb hindered results. Company setbacks and competitors’ gains led many investors to believe that Bristol-Myers Squibb has lost its advantage in the lung cancer category. A competitor’s lung cancer drug approval for certain first-line lung cancer indications beat the company in this category and is likely to negatively impact future revenues, leading the company to change its head of research and development.
In the industrials sector, low-cost airline Allegiant Travel detracted from performance.4 Allegiant has been going through fleet transitions from MD-80s to Airbus planes. This has been depressing revenue and driving up costs. We believe this is a temporary period that sets them up to return to growth in 2018. The stock has struggled during the transition, but the company’s prospects look good starting next year, in our analysis.
Other individual detractors from the Fund’s relative performance included oil and gas exploration and production company Anadarko Petroleum and oilfield services firm Halliburton in the energy sector. Both companies’ shares declined along with crude oil prices. Investor sentiment about Anadarko was also negatively affected by an accident involving one of its assets. In financials, commercial bank Signature Bank hindered results. The company’s shares fell amid a flattening yield curve during the period (short-term interest rates rose, while long-term interest rates declined) that hurt future net interest income, ongoing decreases in taxi medallion (operating permit) collateral values and softer loan growth.
Thank you for your participation in Franklin Large Cap Growth VIP Fund. We look forward to serving your future investment needs.
The foregoing information reflects our analysis, opinions and portfolio holdings as of June 30, 2017, the end of the reporting period. The way we implement our main investment strategies and the resulting portfolio holdings may change depending on factors such as market and economic conditions. These opinions may not be relied upon as investment advice or an offer for a particular security. The information is not a complete analysis of every aspect of any market, country, industry, security or the Fund. Statements of fact are from sources considered reliable, but the investment manager makes no representation or warranty as to their completeness or accuracy. Although historical performance is no guarantee of future results, these insights may help you understand our investment management philosophy.
| FLG-4 | Semiannual Report |
FRANKLIN LARGE CAP GROWTH VIP FUND
Class 1 Fund Expenses
As an investor in a variable insurance contract (Contract) that indirectly provides for investment in an underlying mutual fund, you can incur transaction and/or ongoing expenses at both the Fund level and the Contract Level: (1) transaction expenses can include sales charges (loads) on purchases, surrender fees, transfer fees and premium taxes; and (2) ongoing expenses can include management fees, distribution and service (12b-1) fees, contract fees, annual maintenance fees, mortality and expense risk fees and other fees and expenses. All mutual funds and Contracts have some types of ongoing expenses. The table below shows Fund-level ongoing expenses and can help you understand these costs and compare them with those of other mutual funds offered through the Contract. The table assumes a $1,000 investment held for the six months indicated. Please refer to the Fund prospectus for additional information on operating expenses.
Actual Fund Expenses
The table below provides information about the actual account values and actual expenses in the columns under the heading “Actual.” In these columns the Fund’s actual return, which includes the effect of ongoing Fund expenses but does not include the effect of ongoing Contract expenses, is used to calculate the “Ending Account Value.” You can estimate the Fund-level expenses you paid during the period by following these steps (of course, your account value and expenses will differ from those in this illustration): Divide your account value by $1,000 (if your account had an $8,600 value, then $8,600 ÷ $1,000 = 8.6). Then multiply the result by the number under the headings “Actual” and “Fund-Level Expenses Paid During Period” (if Fund-Level Expenses Paid During Period were $ 7.50, then 8.6 x $7.50 = $64.50). In this illustration, the estimated expenses paid this period at the Fund level are $64.50.
Hypothetical Example for Comparison with Other Mutual Funds
Under the heading “Hypothetical” in the table, information is provided about hypothetical account values and hypothetical expenses based on the Fund’s actual expense ratio and an assumed rate of return of 5% per year before expenses, which is not the Fund’s actual return. This information may not be used to estimate the actual ending account balance or expenses you paid for the period, but it can help you compare ongoing costs of investing in the Fund with those of other mutual funds offered through the Contract. To do so, compare this 5% hypothetical example with the 5% hypothetical examples that appear in the shareholder reports of other funds offered through the Contract.
Please note that expenses shown in the table are meant to highlight ongoing costs at the Fund level only and do not reflect any ongoing expenses at the Contract level, or transaction expenses at either the Fund or Contract levels. In addition, while the Fund does not have transaction expenses, if the transaction and ongoing expenses at the Contract level were included, the expenses shown below would be higher. You should consult your Contract prospectus or disclosure document for more information.
| Actual (actual return after expenses) | Hypothetical (5% annual return before expenses) | |||||||||||||||||||||||
| Share Class | | Beginning Account Value 1/1/17 | | | Ending Account Value 6/30/17 | | | Fund-Level Expenses Paid During Period 1/1/17–6/30/17 | 1,2 | | Ending Account Value 6/30/17 | | | Fund-Level Expenses Paid During Period 1/1/17–6/30/17 | 1,2 | | Annualized Expense Ratio | 2 | ||||||
Class 1 | $1,000 | $1,157.40 | $4.49 | $1,020.63 | $4.21 | 0.84% | ||||||||||||||||||
1. Expenses are equal to the annualized expense ratio for the six-month period as indicated above — in the far right column — multiplied by the simple average account value over the period indicated, and then multiplied by 181/365 to reflect the one-half year period.
2. Does not include any ongoing expenses of the Contract for which the Fund is an investment option.
| Semiannual Report | FLG-5 |
FRANKLIN TEMPLETON VARIABLE INSURANCE PRODUCTS TRUST
Financial Highlights
Franklin Large Cap Growth VIP Fund
Six Months Ended June 30, 2017 | Year Ended December 31, | |||||||||||||||||||||||
| 2016 | 2015 | 2014 | 2013 | 2012 | ||||||||||||||||||||
| Class 1 | ||||||||||||||||||||||||
Per share operating performance (for a share outstanding throughout the period) | ||||||||||||||||||||||||
Net asset value, beginning of period | $17.85 | $18.42 | $23.26 | $20.91 | $16.43 | $14.75 | ||||||||||||||||||
|
| |||||||||||||||||||||||
| Income from investment operationsa: | ||||||||||||||||||||||||
Net investment income (loss)b | (0.01 | ) | (0.04 | ) | (0.06 | ) | 0.11 | 0.24 | 0.21 | |||||||||||||||
Net realized and unrealized gains (losses) | 2.83 | (0.26 | ) | 1.56 | 2.54 | 4.48 | 1.65 | |||||||||||||||||
|
| |||||||||||||||||||||||
Total from investment operations | 2.82 | (0.30 | ) | 1.50 | 2.65 | 4.72 | 1.86 | |||||||||||||||||
|
| |||||||||||||||||||||||
| Less distributions from: | ||||||||||||||||||||||||
Net investment income | (0.20 | ) | — | (0.13 | ) | (0.30 | ) | (0.24 | ) | (0.18 | ) | |||||||||||||
Net realized gains | (1.60 | ) | (0.27 | ) | (6.21 | ) | — | — | — | |||||||||||||||
|
| |||||||||||||||||||||||
Total distributions | (1.80 | ) | (0.27 | ) | (6.34 | ) | (0.30 | ) | (0.24 | ) | (0.18 | ) | ||||||||||||
|
| |||||||||||||||||||||||
Net asset value, end of period | $18.87 | $17.85 | $18.42 | $23.26 | $20.91 | $16.43 | ||||||||||||||||||
|
| |||||||||||||||||||||||
Total returnc | 15.74% | (1.49 | )% | 5.89% | 12.74% | 28.92% | 12.65% | |||||||||||||||||
| Ratios to average net assetsd | ||||||||||||||||||||||||
Expenses. | 0.84%e | 0.80%e | 0.78% | 0.79% | 0.79% | 0.80% | ||||||||||||||||||
Net investment income (loss) | (0.09)% | (0.19)% | (0.27)% | 0.50% | 1.27% | 1.31% | ||||||||||||||||||
| Supplemental data | ||||||||||||||||||||||||
Net assets, end of period (000’s) | $994 | $883 | $47,864 | $54,971 | $54,291 | $46,756 | ||||||||||||||||||
Portfolio turnover rate | 14.83% | 36.26%f | 23.23% | 93.53% | 28.27% | 33.88% | ||||||||||||||||||
aThe amount shown for a share outstanding throughout the period may not correlate with the Statement of Operations for the period due to the timing of sales and repurchases of the Fund’s shares in relation to income earned and/or fluctuating fair value of the investments of the Fund.
bBased on average daily shares outstanding.
cTotal return does not include fees, charges or expenses imposed by the variable annuity and life insurance contracts for which Franklin Templeton Variable Insurance Products Trust serves as an underlying investment vehicle. Total return is not annualized for periods less than one year.
dRatios are annualized for periods less than one year.
eBenefit of expense reduction rounds to less than 0.01%.
fExcludes the value of portfolio securities delivered as a result of a redemption in-kind. See Note 9.
| FLG-6 | Semiannual Report | The accompanying notes are an integral part of these financial statements. |
FRANKLIN TEMPLETON VARIABLE INSURANCE PRODUCTS TRUST
FINANCIAL HIGHLIGHTS
Franklin Large Cap Growth VIP Fund (continued)
| Six Months Ended June 30, 2017 (unaudited) | Year Ended December 31, | |||||||||||||||||||||||
| 2016 | 2015 | 2014 | 2013 | 2012 | ||||||||||||||||||||
| Class 2 | ||||||||||||||||||||||||
Per share operating performance (for a share outstanding throughout the period) | ||||||||||||||||||||||||
Net asset value, beginning of period | $17.48 | $18.09 | $22.94 | $20.62 | $16.20 | $14.54 | ||||||||||||||||||
|
| |||||||||||||||||||||||
| Income from investment operationsa: | ||||||||||||||||||||||||
Net investment income (loss)b | (0.03 | ) | (0.08 | ) | (0.11 | ) | 0.06 | 0.19 | 0.17 | |||||||||||||||
Net realized and unrealized gains (losses) | 2.77 | (0.26 | ) | 1.54 | 2.50 | 4.42 | 1.62 | |||||||||||||||||
|
| |||||||||||||||||||||||
Total from investment operations | 2.74 | (0.34 | ) | 1.43 | 2.56 | 4.61 | 1.79 | |||||||||||||||||
|
| |||||||||||||||||||||||
| Less distributions from: | ||||||||||||||||||||||||
Net investment income | (0.13 | ) | — | (0.07 | ) | (0.24 | ) | (0.19 | ) | (0.13 | ) | |||||||||||||
Net realized gains | (1.60 | ) | (0.27 | ) | (6.21 | ) | — | — | — | |||||||||||||||
|
| |||||||||||||||||||||||
Total distributions | (1.73 | ) | (0.27 | ) | (6.28 | ) | (0.24 | ) | (0.19 | ) | (0.13 | ) | ||||||||||||
|
| |||||||||||||||||||||||
Net asset value, end of period | $18.49 | $17.48 | $18.09 | $22.94 | $20.62 | $16.20 | ||||||||||||||||||
|
| |||||||||||||||||||||||
Total returnc | 15.66% | (1.79)% | 5.62% | 12.46% | 28.63% | 12.37% | ||||||||||||||||||
| Ratios to average net assetsd | ||||||||||||||||||||||||
Expenses | 1.09 | %e | 1.05 | %e | 1.03% | 1.04% | 1.04% | 1.05% | ||||||||||||||||
Net investment income (loss) | (0.34 | )% | (0.44 | )% | (0.52)% | 0.25% | 1.02% | 1.06% | ||||||||||||||||
| Supplemental data | ||||||||||||||||||||||||
Net assets, end of period (000’s) | $119,991 | $113,028 | $223,807 | $256,098 | $285,477 | $278,989 | ||||||||||||||||||
Portfolio turnover rate | 14.83% | 36.26%f | 23.23% | 93.53% | 28.27% | 33.88% | ||||||||||||||||||
aThe amount shown for a share outstanding throughout the period may not correlate with the Statement of Operations for the period due to the timing of sales and repurchases of the Fund’s shares in relation to income earned and/or fluctuating fair value of the investments of the Fund.
bBased on average daily shares outstanding.
cTotal return does not include fees, charges or expenses imposed by the variable annuity and life insurance contracts for which Franklin Templeton Variable Insurance Products Trust serves as an underlying investment vehicle. Total return is not annualized for periods less than one year.
dRatios are annualized for periods less than one year.
eBenefit of expense reduction rounds to less than 0.01%.
fExcludes the value of portfolio securities delivered as a result of a redemption in-kind. See Note 9.
| The accompanying notes are an integral part of these financial statements. | Semiannual Report | FLG-7 |
FRANKLIN TEMPLETON VARIABLE INSURANCE PRODUCTS TRUST
Statement of Investments, June 30, 2017 (unaudited)
Franklin Large Cap Growth VIP Fund
| ||||||||||
| Shares | Value | |||||||||
| Common Stocks 98.2% | ||||||||||
| Consumer Discretionary 15.0% | ||||||||||
| a | Altice USA Inc. | 24,664 | $ | 796,647 | ||||||
| a | Amazon.com Inc. | 7,219 | 6,987,992 | |||||||
| a | Charter Communications Inc., A | 5,539 | 1,865,812 | |||||||
Comcast Corp., A | 30,894 | 1,202,395 | ||||||||
Delphi Automotive PLC | 8,307 | 728,109 | ||||||||
Las Vegas Sands Corp. | 21,675 | 1,384,816 | ||||||||
Newell Brands Inc. | 11,123 | 596,415 | ||||||||
NIKE Inc., B | 11,847 | 698,973 | ||||||||
| a | The Priceline Group Inc. | 887 | 1,659,151 | |||||||
Starbucks Corp. | 15,833 | 923,222 | ||||||||
The Walt Disney Co. | 12,124 | 1,288,175 | ||||||||
|
| |||||||||
| 18,131,707 | ||||||||||
|
| |||||||||
| Consumer Staples 3.9% | ||||||||||
Constellation Brands Inc., A | 8,263 | 1,600,791 | ||||||||
| a | Hostess Brands Inc., A | 37,141 | 597,970 | |||||||
| a | Monster Beverage Corp. | 27,314 | 1,356,960 | |||||||
Pinnacle Foods Inc. | 19,940 | 1,184,436 | ||||||||
|
| |||||||||
| 4,740,157 | ||||||||||
|
| |||||||||
| Energy 2.3% | ||||||||||
Anadarko Petroleum Corp. | 21,205 | 961,435 | ||||||||
| a | Diamondback Energy Inc. | 6,618 | 587,744 | |||||||
Halliburton Co. | 20,166 | 861,290 | ||||||||
| a | Resolute Energy Corp. | 13,366 | 397,906 | |||||||
|
| |||||||||
| 2,808,375 | ||||||||||
|
| |||||||||
| Financials 7.2% | ||||||||||
| a | Athene Holding Ltd., A | 25,034 | 1,241,937 | |||||||
The Charles Schwab Corp. | 46,144 | 1,982,346 | ||||||||
Intercontinental Exchange Inc. | 9,994 | 658,804 | ||||||||
MarketAxess Holdings Inc. | 8,346 | 1,678,381 | ||||||||
S&P Global Inc. | 6,821 | 995,798 | ||||||||
| a | Signature Bank | 8,282 | 1,188,715 | |||||||
| a | SVB Financial Group | 5,659 | 994,796 | |||||||
|
| |||||||||
| 8,740,777 | ||||||||||
|
| |||||||||
| Health Care 12.1% | ||||||||||
| a,b | Acerta Pharma BV (Netherlands) | 9,780,975 | 326,401 | |||||||
Allergan PLC | 4,993 | 1,213,748 | ||||||||
| a | Biogen Inc. | 2,189 | 594,007 | |||||||
Bristol-Myers Squibb Co. | 25,121 | 1,399,742 | ||||||||
| a | Celgene Corp. | 29,245 | 3,798,048 | |||||||
| a | Edwards Lifesciences Corp. | 13,215 | 1,562,542 | |||||||
| a | Heron Therapeutics Inc. | 29,654 | 410,708 | |||||||
| a | Incyte Corp. | 10,944 | 1,377,959 | |||||||
Medtronic PLC | 8,622 | 765,203 | ||||||||
| a | Nevro Corp. | 8,509 | 633,325 | |||||||
| a | Tesaro Inc. | 6,634 | 927,831 | |||||||
UnitedHealth Group Inc. | 9,086 | 1,684,726 | ||||||||
|
| |||||||||
| 14,694,240 | ||||||||||
|
| |||||||||
| FLG-8 | Semiannual Report |
FRANKLIN TEMPLETON VARIABLE INSURANCE PRODUCTS TRUST
STATEMENT OF INVESTMENTS (UNAUDITED)
Franklin Large Cap Growth VIP Fund (continued)
| Shares | Value | |||||||||
Common Stocks (continued) | ||||||||||
Industrials 6.4% | ||||||||||
Allegiant Travel Co. | 3,090 | $ | 419,004 | |||||||
a Azul SA, ADR (Brazil) | 13,900 | 293,012 | ||||||||
Honeywell International Inc. | 9,684 | 1,290,780 | ||||||||
a IHS Markit Ltd. | 37,138 | 1,635,557 | ||||||||
Raytheon Co. | 11,235 | 1,814,228 | ||||||||
Rockwell Automation Inc. | 4,011 | 649,622 | ||||||||
Roper Technologies Inc. | 3,484 | 806,650 | ||||||||
a Univar Inc. | 27,928 | 815,498 | ||||||||
|
| |||||||||
| 7,724,351 | ||||||||||
|
| |||||||||
Information Technology 42.2% | ||||||||||
a Adobe Systems Inc. | 17,175 | 2,429,232 | ||||||||
a Alphabet Inc., A | 3,876 | 3,603,440 | ||||||||
a Alphabet Inc., C | 1,084 | 985,063 | ||||||||
Analog Devices Inc. | 10,418 | 810,520 | ||||||||
Apple Inc. | 41,101 | 5,919,366 | ||||||||
a Autodesk Inc. | 17,374 | 1,751,647 | ||||||||
Broadcom Ltd. | 10,881 | 2,535,817 | ||||||||
a CoStar Group Inc. | 4,719 | 1,243,928 | ||||||||
a Electronic Arts Inc. | 10,976 | 1,160,383 | ||||||||
a Facebook Inc., A | 39,719 | 5,996,774 | ||||||||
a Fiserv Inc. | 7,846 | 959,880 | ||||||||
a InterXion Holding NV (Netherlands) | 13,793 | 631,443 | ||||||||
KLA-Tencor Corp. | 6,030 | 551,805 | ||||||||
Mastercard Inc., A | 37,116 | 4,507,738 | ||||||||
Microsoft Corp. | 61,793 | 4,259,391 | ||||||||
Monolithic Power Systems | 6,352 | 612,333 | ||||||||
NVIDIA Corp. | 11,371 | 1,643,792 | ||||||||
a Palo Alto Networks Inc. | 5,828 | 779,845 | ||||||||
a Q2 Holdings Inc. | 7,805 | 288,395 | ||||||||
a Salesforce.com Inc. | 18,237 | 1,579,324 | ||||||||
a ServiceNow Inc. | 19,578 | 2,075,268 | ||||||||
a Tyler Technologies Inc. | 4,194 | 736,760 | ||||||||
Visa Inc., A | 46,274 | 4,339,576 | ||||||||
Xilinx Inc. | 14,649 | 942,224 | ||||||||
a Zendesk Inc. | 24,274 | 674,332 | ||||||||
|
| |||||||||
| 51,018,276 | ||||||||||
|
| |||||||||
Materials 2.8% | ||||||||||
a Axalta Coating Systems Ltd. | 24,793 | 794,368 | ||||||||
Ecolab Inc. | 6,090 | 808,447 | ||||||||
a Ingevity Corp. | 9,875 | 566,825 | ||||||||
Martin Marietta Materials Inc. | 5,415 | 1,205,271 | ||||||||
|
| |||||||||
| 3,374,911 | ||||||||||
|
| |||||||||
Real Estate 5.4% | ||||||||||
American Tower Corp. | 13,587 | 1,797,832 | ||||||||
Equinix Inc. | 4,255 | 1,826,076 | ||||||||
a SBA Communications Corp., A | 21,154 | 2,853,674 | ||||||||
|
| |||||||||
| 6,477,582 | ||||||||||
|
| |||||||||
Telecommunication Services 0.9% | ||||||||||
a T-Mobile U.S. Inc. | 18,967 | 1,149,780 | ||||||||
|
| |||||||||
Total Common Stocks (Cost $73,509,464) | 118,860,156 | |||||||||
|
| |||||||||
| Semiannual Report | FLG-9 |
FRANKLIN TEMPLETON VARIABLE INSURANCE PRODUCTS TRUST
STATEMENT OF INVESTMENTS (UNAUDITED)
Franklin Large Cap Growth VIP Fund (continued)
| Principal Amount | Value | |||||||||
Short Term Investments (Cost $1,763,258) 1.5% | ||||||||||
c Repurchase Agreements 1.5% | ||||||||||
Joint Repurchase Agreement, 1.058%, 7/03/17 (Maturity Value $1,763,414) | ||||||||||
Collateralized by U.S. Government Agency Securities, 0.875% - 1.875%, 12/15/17 - 6/11/21; | $ | 1,763,258 | $ | 1,763,258 | ||||||
|
| |||||||||
Total Investments (Cost $75,272,722) 99.7% | 120,623,414 | |||||||||
Other Assets, less Liabilities 0.3% | 361,550 | |||||||||
|
| |||||||||
Net Assets 100.0% | $ | 120,984,964 | ||||||||
|
|
See Abbreviations on page FLG-21.
aNon-income producing.
bSee Note 7 regarding restricted securities.
cSee Note 1(c) regarding joint repurchase agreement.
dThe security was issued on a discount basis with no stated coupon rate.
| FLG-10 | Semiannual Report | The accompanying notes are an integral part of these financial statements. |
FRANKLIN TEMPLETON VARIABLE INSURANCE PRODUCTS TRUST
Financial Statements
Statement of Assets and Liabilities
June 30, 2017 (unaudited)
| Franklin Large Cap Growth VIP Fund | ||||
Assets: | ||||
Investments in securities: | ||||
Cost - Unaffiliated issuers | $ | 73,509,464 | ||
Cost - Repurchase agreements | 1,763,258 | |||
|
| |||
Total cost of investments | $ | 75,272,722 | ||
|
| |||
Value - Unaffiliated issuers | $ | 118,860,156 | ||
Value - Repurchase agreements | 1,763,258 | |||
|
| |||
Total value of investments | 120,623,414 | |||
Receivables: | ||||
Investment securities sold | 855,227 | |||
Capital shares sold | 62 | |||
Dividends | 34,373 | |||
Other assets | 30,418 | |||
|
| |||
Total assets | 121,543,494 | |||
|
| |||
Liabilities: | ||||
Payables: | ||||
Capital shares redeemed | 392,372 | |||
Management fees | 75,974 | |||
Distribution fees | 51,041 | |||
Trustees’ fees and expenses | 218 | |||
Reports to shareholders | 28,398 | |||
Accrued expenses and other liabilities | 10,527 | |||
|
| |||
Total liabilities | 558,530 | |||
|
| |||
Net assets, at value | $ | 120,984,964 | ||
|
| |||
Net assets consist of: | ||||
Paid-in capital | $ | 70,323,665 | ||
Distributions in excess of net investment income | (204,663 | ) | ||
Net unrealized appreciation (depreciation) | 45,350,692 | |||
Accumulated net realized gain (loss) | 5,515,270 | |||
|
| |||
Net assets, at value | $ | 120,984,964 | ||
|
| |||
| Class 1: | ||||
Net assets, at value | $ | 994,232 | ||
|
| |||
Shares outstanding | 52,691 | |||
|
| |||
Net asset value and maximum offering price per share | $ | 18.87 | ||
|
| |||
| Class 2: | ||||
Net assets, at value | $ | 119,990,732 | ||
|
| |||
Shares outstanding | 6,490,892 | |||
|
| |||
Net asset value and maximum offering price per share | $ | 18.49 | ||
|
| |||
| The accompanying notes are an integral part of these financial statements. | Semiannual Report | FLG-11 |
FRANKLIN TEMPLETON VARIABLE INSURANCE PRODUCTS TRUST
FINANCIAL STATEMENTS
Statement of Operations
for the six months ended June 30, 2017 (unaudited)
| Franklin Large Cap Growth VIP Fund | ||||
Investment income: | ||||
Dividends | $ | 446,889 | ||
Interest | 5,479 | |||
|
| |||
Total investment income | 452,368 | |||
|
| |||
Expenses: | ||||
Management fees (Note 3a) | 452,620 | |||
Distribution fees - Class 2 (Note 3c) | 149,217 | |||
Custodian fees (Note 4) | 625 | |||
Reports to shareholders. | 29,724 | |||
Professional fees | 18,686 | |||
Trustees’ fees and expenses | 508 | |||
Other | 5,267 | |||
|
| |||
Total expenses | 656,647 | |||
Expense reductions (Note 4) | (22 | ) | ||
|
| |||
Net expenses | 656,625 | |||
|
| |||
Net investment income (loss) | (204,257 | ) | ||
|
| |||
Realized and unrealized gains (losses): | ||||
Net realized gain (loss) from investments | 5,716,100 | |||
Net change in unrealized appreciation (depreciation) on: | ||||
Investments | 11,916,481 | |||
Translation of other assets and liabilities denominated in foreign currencies | 28,483 | |||
|
| |||
Net change in unrealized appreciation (depreciation) | 11,944,964 | |||
|
| |||
Net realized and unrealized gain (loss) | 17,661,064 | |||
|
| |||
Net increase (decrease) in net assets resulting from operations | $ | 17,456,807 | ||
|
| |||
| FLG-12 | Semiannual Report | The accompanying notes are an integral part of these financial statements. |
FRANKLIN TEMPLETON VARIABLE INSURANCE PRODUCTS TRUST
FINANCIAL STATEMENTS
Statements of Changes in Net Assets
| Franklin Large Cap Growth VIP Fund | ||||||||
| Six Months Ended June 30, 2017 (unaudited) | Year Ended December 31, 2016 | |||||||
Increase (decrease) in net assets: | ||||||||
Operations: | ||||||||
Net investment income (loss) | $ | (204,257 | ) | $ | (854,138 | ) | ||
Net realized gain (loss) | 5,716,100 | 45,675,157 | ||||||
Net change in unrealized appreciation (depreciation) | 11,944,964 | (50,315,678 | ) | |||||
|
| |||||||
Net increase (decrease) in net assets resulting from operations | 17,456,807 | (5,494,659 | ) | |||||
|
| |||||||
Distributions to shareholders from: | ||||||||
Net investment income: | ||||||||
Class 1 | (9,601 | ) | — | |||||
Class 2 | (751,572 | ) | — | |||||
Net realized gains: | ||||||||
Class 1 | (77,085 | ) | (673,017 | ) | ||||
Class 2 | (9,605,025 | ) | (3,070,097 | ) | ||||
|
| |||||||
Total distributions to shareholders | (10,443,283 | ) | (3,743,114 | ) | ||||
|
| |||||||
Capital share transactions: (Note 2) | ||||||||
Class 1 | 59,427 | (45,655,781 | ) | |||||
Class 2 | 956 | (102,866,036 | ) | |||||
|
| |||||||
Total capital share transactions | 60,383 | (148,521,817 | ) | |||||
|
| |||||||
Net increase (decrease) in net assets | 7,073,907 | (157,759,590 | ) | |||||
Net assets: | ||||||||
Beginning of period | 113,911,057 | 271,670,647 | ||||||
|
| |||||||
End of period | $ | 120,984,964 | $ | 113,911,057 | ||||
|
| |||||||
Undistributed net investment income included in net assets: | ||||||||
End of period | $ | — | $ | 760,767 | ||||
|
| |||||||
Distributions in excess of net investment income included in net assets: | ||||||||
End of period | $ | (204,663 | ) | $ | — | |||
|
| |||||||
| The accompanying notes are an integral part of these financial statements. | Semiannual Report | FLG-13 |
FRANKLIN TEMPLETON VARIABLE INSURANCE PRODUCTS TRUST
Notes to Financial Statements (unaudited)
Franklin Large Cap Growth VIP Fund
1. Organization and Significant Accounting Policies
Franklin Templeton Variable Insurance Products Trust (Trust) is registered under the Investment Company Act of 1940 (1940 Act) as an open-end management investment company, consisting of eighteen separate funds and applies the specialized accounting and reporting guidance in U.S. Generally Accepted Accounting Principles (U.S. GAAP). Franklin Large Cap Growth VIP Fund (Fund) is included in this report. Shares of the Fund are generally sold only to insurance company separate accounts to fund the benefits of variable life insurance policies or variable annuity contracts. At June 30, 2017, 68.4% of the Fund’s shares were held through one insurance company. Investment activities of these insurance company separate accounts could have a material impact on the Fund. The Fund offers two classes of shares: Class 1 and Class 2. Each class of shares may differ by its distribution fees, voting rights on matters affecting a single class and its exchange privilege.
The following summarizes the Fund’s significant accounting policies.
a. Financial Instrument Valuation
The Fund’s investments in financial instruments are carried at fair value daily. Fair value is the price that would be received to sell an asset or paid to transfer a liability in an orderly transaction between market participants on the measurement date. The Fund calculates the net asset value (NAV) per share as of 4 p.m. Eastern time each day the New York Stock Exchange (NYSE) is open for trading. Under compliance policies and procedures approved by the Trust’s Board of Trustees (the Board), the Fund’s administrator has responsibility for oversight of valuation, including leading the cross-functional Valuation Committee (VC). The VC provides administration and oversight of the Fund’s valuation policies and procedures, which are approved annually by the Board. Among other things, these procedures allow the Fund to utilize independent pricing services, quotations from securities and financial instrument dealers, and other market sources to determine fair value.
Equity securities listed on an exchange or on the NASDAQ National Market System are valued at the last quoted sale price or the official closing price of the day, respectively. Foreign equity securities are valued as of the close of trading on the foreign stock exchange on which the security is primarily traded, or as of 4 p.m. Eastern time. The value is then converted
into its U.S. dollar equivalent at the foreign exchange rate in effect at 4 p.m. Eastern time on the day that the value of the security is determined. Over-the-counter (OTC) securities are valued within the range of the most recent quoted bid and ask prices. Securities that trade in multiple markets or on multiple exchanges are valued according to the broadest and most representative market. Certain equity securities are valued based upon fundamental characteristics or relationships to similar securities.
Investments in repurchase agreements are valued at cost, which approximates fair value.
The Fund has procedures to determine the fair value of financial instruments for which market prices are not reliable or readily available. Under these procedures, the VC convenes on a regular basis to review such financial instruments and considers a number of factors, including significant unobservable valuation inputs, when arriving at fair value. The VC primarily employs a market-based approach which may use related or comparable assets or liabilities, recent transactions, market multiples, book values, and other relevant information for the investment to determine the fair value of the investment. An income-based valuation approach may also be used in which the anticipated future cash flows of the investment are discounted to calculate fair value. Discounts may also be applied due to the nature or duration of any restrictions on the disposition of the investments. Due to the inherent uncertainty of valuations of such investments, the fair values may differ significantly from the values that would have been used had an active market existed. The VC employs various methods for calibrating these valuation approaches including a regular review of key inputs and assumptions, transactional back-testing or disposition analysis, and reviews of any related market activity.
Trading in securities on foreign securities stock exchanges and OTC markets may be completed before 4 p.m. Eastern time. In addition, trading in certain foreign markets may not take place on every Fund’s business day. Occasionally, events occur between the time at which trading in a foreign security is completed and 4 p.m. Eastern time that might call into question the reliability of the value of a portfolio security held by the Fund. As a result, differences may arise between the value of the Fund’s portfolio securities as determined at the foreign market close and the latest indications of value at 4 p.m. Eastern time. In order to minimize the potential for these differences, the VC monitors price movements following the close of trading in foreign stock markets through a series of country
| FLG-14 | Semiannual Report |
FRANKLIN TEMPLETON VARIABLE INSURANCE PRODUCTS TRUST
NOTES TO FINANCIAL STATEMENTS (UNAUDITED)
Franklin Large Cap Growth VIP Fund (continued)
specific market proxies (such as baskets of American Depositary Receipts, futures contracts and exchange traded funds). These price movements are measured against established trigger thresholds for each specific market proxy to assist in determining if an event has occurred that may call into question the reliability of the values of the foreign securities held by the Fund. If such an event occurs, the securities may be valued using fair value procedures, which may include the use of independent pricing services.
When the last day of the reporting period is a non-business day, certain foreign markets may be open on those days that the Fund’s NAV is not calculated, which could result in differences between the value of the Fund’s portfolio securities on the last business day and the last calendar day of the reporting period. Any significant security valuation changes due to an open foreign market are adjusted and reflected by the Fund for financial reporting purposes.
b. Foreign Currency Translation
Portfolio securities and other assets and liabilities denominated in foreign currencies are translated into U.S. dollars based on the exchange rate of such currencies against U.S. dollars on the date of valuation. The Fund may enter into foreign currency exchange contracts to facilitate transactions denominated in a foreign currency. Purchases and sales of securities, income and expense items denominated in foreign currencies are translated into U.S. dollars at the exchange rate in effect on the transaction date. Portfolio securities and assets and liabilities denominated in foreign currencies contain risks that those currencies will decline in value relative to the U.S. dollar. Occasionally, events may impact the availability or reliability of foreign exchange rates used to convert the U.S. dollar equivalent value. If such an event occurs, the foreign exchange rate will be valued at fair value using procedures established and approved by the Board.
The Fund does not separately report the effect of changes in foreign exchange rates from changes in market prices on securities held. Such changes are included in net realized and unrealized gain or loss from investments in the Statement of Operations.
Realized foreign exchange gains or losses arise from sales of foreign currencies, currency gains or losses realized between the trade and settlement dates on securities transactions and the difference between the recorded amounts of dividends, interest, and foreign withholding taxes and the U.S. dollar equivalent of
the amounts actually received or paid. Net unrealized foreign exchange gains and losses arise from changes in foreign exchange rates on foreign denominated assets and liabilities other than investments in securities held at the end of the reporting period.
c. Joint Repurchase Agreement
The Fund enters into a joint repurchase agreement whereby its uninvested cash balance is deposited into a joint cash account with other funds managed by the investment manager or an affiliate of the investment manager and is used to invest in one or more repurchase agreements. The value and face amount of the joint repurchase agreement are allocated to the funds based on their pro-rata interest. A repurchase agreement is accounted for as a loan by the Fund to the seller, collateralized by securities which are delivered to the Fund’s custodian. The fair value, including accrued interest, of the initial collateralization is required to be at least 102% of the dollar amount invested by the funds, with the value of the underlying securities marked to market daily to maintain coverage of at least 100%. Repurchase agreements are subject to the terms of Master Repurchase Agreements (MRAs) with approved counterparties (sellers). The MRAs contain various provisions, including but not limited to events of default and maintenance of collateral for repurchase agreements. In the event of default by either the seller or the Fund, certain MRAs may permit the non-defaulting party to net and close-out all transactions, if any, traded under such agreements. The Fund may sell securities it holds as collateral and apply the proceeds towards the repurchase price and any other amounts owed by the seller to the Fund in the event of default by the seller. This could involve costs or delays in addition to a loss on the securities if their value falls below the repurchase price owed by the seller. The joint repurchase agreement held by the Fund at period end, as indicated in the Statement of Investments, had been entered into on June 30, 2017.
d. Income and Deferred Taxes
It is the Fund’s policy to qualify as a regulated investment company under the Internal Revenue Code. The Fund intends to distribute to shareholders substantially all of its taxable income and net realized gains to relieve it from federal income and if applicable, excise taxes. As a result, no provision for U.S. federal income taxes is required.
| Semiannual Report | FLG-15 |
FRANKLIN TEMPLETON VARIABLE INSURANCE PRODUCTS TRUST
NOTES TO FINANCIAL STATEMENTS (UNAUDITED)
Franklin Large Cap Growth VIP Fund (continued)
1. Organization and Significant Accounting Policies (continued)
d. Income and Deferred Taxes (continued)
The Fund may be subject to foreign taxation related to income received, capital gains on the sale of securities and certain foreign currency transactions in the foreign jurisdictions in which it invests. Foreign taxes, if any, are recorded based on the tax regulations and rates that exist in the foreign markets in which the Fund invests. When a capital gain tax is determined to apply, the Fund records an estimated deferred tax liability in an amount that would be payable if the securities were disposed of on the valuation date.
The Fund may recognize an income tax liability related to its uncertain tax positions under U.S. GAAP when the uncertain tax position has a less than 50% probability that it will be sustained upon examination by the tax authorities based on its technical merits. As of June 30, 2017, the Fund has determined that no tax liability is required in its financial statements related to uncertain tax positions for any open tax years (or expected to be taken in future tax years). Open tax years are those that remain subject to examination and are based on each tax jurisdiction’s statute of limitation.
e. Security Transactions, Investment Income, Expenses and Distributions
Security transactions are accounted for on trade date. Realized gains and losses on security transactions are determined on a specific identification basis. Interest income and estimated expenses are accrued daily. Dividend income is recorded on the ex-dividend date except for certain dividends from securities where the dividend rate is not available. In such cases, the dividend is recorded as soon as the information is received by the Fund. Distributions to shareholders are recorded on the ex-dividend date. Distributable earnings are determined according to income tax regulations (tax basis) and may differ from earnings recorded in accordance with U.S. GAAP. These
differences may be permanent or temporary. Permanent differences are reclassified among capital accounts to reflect their tax character. These reclassifications have no impact on net assets or the results of operations. Temporary differences are not reclassified, as they may reverse in subsequent periods.
Common expenses incurred by the Trust are allocated among the Funds based on the ratio of net assets of each Fund to the combined net assets of the Trust. Fund specific expenses are charged directly to the Fund that incurred the expense.
Realized and unrealized gains and losses and net investment income, not including class specific expenses, are allocated daily to each class of shares based upon the relative proportion of net assets of each class. Differences in per share distributions, by class, are generally due to differences in class specific expenses.
f. Accounting Estimates
The preparation of financial statements in accordance with U.S. GAAP requires management to make estimates and assumptions that affect the reported amounts of assets and liabilities at the date of the financial statements and the amounts of income and expenses during the reporting period. Actual results could differ from those estimates.
g. Guarantees and Indemnifications
Under the Trust’s organizational documents, its officers and trustees are indemnified by the Trust against certain liabilities arising out of the performance of their duties to the Trust. Additionally, in the normal course of business, the Trust, on behalf of the Fund, enters into contracts with service providers that contain general indemnification clauses. The Trust’s maximum exposure under these arrangements is unknown as this would involve future claims that may be made against the Trust that have not yet occurred. Currently, the Trust expects the risk of loss to be remote.
| FLG-16 | Semiannual Report | �� |
FRANKLIN TEMPLETON VARIABLE INSURANCE PRODUCTS TRUST
NOTES TO FINANCIAL STATEMENTS (UNAUDITED)
Franklin Large Cap Growth VIP Fund (continued)
2. Shares of Beneficial Interest
At June 30, 2017, there were an unlimited number of shares authorized (without par value). Transactions in the Fund’s shares were as follows:
| Six Months Ended June 30, 2017 | Year Ended December 31, 2016 | |||||||||||||||||||
| Shares | Amount | Shares | Amount | |||||||||||||||||
| Class 1 Shares: | ||||||||||||||||||||
Shares sold | — | $ | — | 5,179 | $ | 86,575 | ||||||||||||||
Shares issued in reinvestment of distributions | 4,591 | 86,686 | 39,404 | 673,017 | ||||||||||||||||
Shares redeemed in-kind (Note 9) | — | — | (2,315,969 | ) | (41,560,066 | ) | ||||||||||||||
Shares redeemed | (1,331 | ) | (27,259 | ) | (277,582 | ) | (4,855,307 | ) | ||||||||||||
|
| |||||||||||||||||||
Net increase (decrease) | 3,260 | $ | 59,427 | (2,548,968 | ) | $ | (45,655,781 | ) | ||||||||||||
|
| |||||||||||||||||||
| Class 2 Shares: | ||||||||||||||||||||
Shares sold | 214,684 | $ | 4,053,983 | 490,428 | $ | 8,312,649 | ||||||||||||||
Shares issued in reinvestment of distributions | 559,816 | 10,356,597 | 183,399 | 3,070,097 | ||||||||||||||||
Shares redeemed in-kind (Note 9) | — | — | (3,930,777 | ) | (69,101,102 | ) | ||||||||||||||
Shares redeemed | (749,385 | ) | (14,409,624 | ) | (2,651,505 | ) | (45,147,680 | ) | ||||||||||||
|
| |||||||||||||||||||
Net increase (decrease) | 25,115 | $ | 956 | (5,908,455 | ) | $ | (102,866,036 | ) | ||||||||||||
|
| |||||||||||||||||||
3. Transactions with Affiliates
Franklin Resources, Inc. is the holding company for various subsidiaries that together are referred to as Franklin Templeton Investments. Certain officers and trustees of the Fund are also officers and/or directors of the following subsidiaries:
| Subsidiary | Affiliation | |
Franklin Advisers, Inc. (Advisers) | Investment manager | |
Franklin Templeton Services, LLC (FT Services) | Administrative manager | |
Franklin Templeton Distributors, Inc. (Distributors) | Principal underwriter | |
Franklin Templeton Investor Services, LLC (Investor Services) | Transfer agent |
a. Management Fees
The Fund pays an investment management fee to Advisers based on the average daily net assets of the Fund as follows:
| Annualized Fee Rate | Net Assets | |
0.750% | Up to and including $500 million | |
0.625% | Over $500 million, up to and including $1 billion | |
0.500% | In excess of $1 billion |
For the period ended June 30, 2017, the annualized effective investment management fee rate was 0.750% of the Fund’s average daily net assets.
b. Administrative Fees
Under an agreement with Advisers, FT Services provides administrative services to the Fund. The fee is paid by Advisers based on the Fund’s average daily net assets, and is not an additional expense of the Fund.
| Semiannual Report | FLG-17 |
FRANKLIN TEMPLETON VARIABLE INSURANCE PRODUCTS TRUST
NOTES TO FINANCIAL STATEMENTS (UNAUDITED)
Franklin Large Cap Growth VIP Fund (continued)
3. Transactions with Affiliates (continued)
c. Distribution Fees
The Board has adopted a distribution plan for Class 2 shares pursuant to Rule 12b-1 under the 1940 Act. Under the Fund’s compensation distribution plan, the Fund pays Distributors for costs incurred in connection with the servicing, sale and distribution of the Fund’s shares up to 0.35% per year of its average daily net assets. The Board has agreed to limit the current rate to 0.25% per year for Class 2. The plan year, for purposes of monitoring compliance with the maximum annual plan rate, is February 1 through January 31.
d. Transfer Agent Fees
Investor Services, under terms of an agreement, performs shareholder servicing for the Fund and is not paid by the Fund for the services.
4. Expense Offset Arrangement
The Fund has entered into an arrangement with its custodian whereby credits realized as a result of uninvested cash balances are used to reduce a portion of the Fund’s custodian expenses. During the period ended June 30, 2017, the custodian fees were reduced as noted in the Statement of Operations.
5. Income Taxes
At June 30, 2017, the cost of investments and net unrealized appreciation (depreciation) for income tax purposes were as follows:
Cost of investments | $ | 75,473,230 | ||
|
| |||
Unrealized appreciation | $ | 46,714,925 | ||
Unrealized depreciation | (1,564,741 | ) | ||
|
| |||
Net unrealized appreciation (depreciation) | $ | 45,150,184 | ||
|
|
Differences between income and/or capital gains as determined on a book basis and a tax basis are primarily due to differing treatments of passive foreign investment company shares and wash sales.
6. Investment Transactions
Purchases and sales of investments (excluding short term securities) for the period ended June 30, 2017, aggregated $17,591,772 and $28,188,122, respectively.
7. Restricted Securities
The Fund invests in securities that are restricted under the Securities Act of 1933 (1933 Act) or which are subject to legal, contractual, or other agreed upon restrictions on resale. Restricted securities are often purchased in private placement transactions, and cannot be sold without prior registration unless the sale is pursuant to an exemption under the 1933 Act. Disposal of these securities may require greater effort and expense, and prompt sale at an acceptable price may be difficult. The Fund may have registration rights for restricted securities. The issuer generally incurs all registration costs.
| FLG-18 | Semiannual Report |
FRANKLIN TEMPLETON VARIABLE INSURANCE PRODUCTS TRUST
NOTES TO FINANCIAL STATEMENTS (UNAUDITED)
Franklin Large Cap Growth VIP Fund (continued)
At June 30, 2017, investments in restricted securities, excluding certain securities exempt from registration under the 1933 Act deemed to be liquid, were as follows:
| Shares | Issuer | Acquisition Date | Cost | Value | ||||||||||
| 9,780,975 | Acerta Pharma BV (Value is 0.3% of Net Assets) | 5/06/15 | $ | 562,683 | $ | 326,401 | ||||||||
|
| |||||||||||||
8. Credit Facility
The Fund, together with other U.S. registered and foreign investment funds (collectively, Borrowers), managed by Franklin Templeton Investments, are borrowers in a joint syndicated senior unsecured credit facility totaling $2 billion (Global Credit Facility) which matures on February 9, 2018. This Global Credit Facility provides a source of funds to the Borrowers for temporary and emergency purposes, including the ability to meet future unanticipated or unusually large redemption requests.
Under the terms of the Global Credit Facility, the Fund shall, in addition to interest charged on any borrowings made by the Fund and other costs incurred by the Fund, pay its share of fees and expenses incurred in connection with the implementation and maintenance of the Global Credit Facility, based upon its relative share of the aggregate net assets of all of the Borrowers, including an annual commitment fee of 0.15% based upon the unused portion of the Global Credit Facility. These fees are reflected in other expenses in the Statement of Operations. During the period ended June 30, 2017, the Fund did not use the Global Credit Facility.
9. Redemption In-Kind
During the year ended December 31, 2016, the Fund realized $34,226,067 of net gains resulting from a redemption in-kind in which a shareholder redeemed fund shares for cash and securities held by the Fund. Because such gains are not taxable to the Fund and are not distributed to remaining shareholders, they have been reclassified from accumulated net realized gains to paid-in capital.
10. Fair Value Measurements
The Fund follows a fair value hierarchy that distinguishes between market data obtained from independent sources (observable inputs) and the Fund’s own market assumptions (unobservable inputs). These inputs are used in determining the value of the Fund’s financial instruments and are summarized in the following fair value hierarchy:
| • | Level 1 – quoted prices in active markets for identical financial instruments |
| • | Level 2 – other significant observable inputs (including quoted prices for similar financial instruments, interest rates, prepayment speed, credit risk, etc.) |
| • | Level 3 – significant unobservable inputs (including the Fund’s own assumptions in determining the fair value of financial instruments) |
The input levels are not necessarily an indication of the risk or liquidity associated with financial instruments at that level.
For movements between the levels within the fair value hierarchy, the Fund has adopted a policy of recognizing the transfers as of the date of the underlying event which caused the movement.
| Semiannual Report | FLG-19 |
FRANKLIN TEMPLETON VARIABLE INSURANCE PRODUCTS TRUST
NOTES TO FINANCIAL STATEMENTS (UNAUDITED)
Franklin Large Cap Growth VIP Fund (continued)
10. Fair Value Measurements (continued)
A summary of inputs used as of June 30, 2017, in valuing the Fund’s assets carried at fair value, is as follows:
| Level 1 | Level 2 | Level 3 | Total | |||||||||||||
| Assets: | ||||||||||||||||
Investments in Securities: | ||||||||||||||||
Equity Investments:a | ||||||||||||||||
Health Care | $ | 14,367,839 | $ | — | $ | 326,401 | $ | 14,694,240 | ||||||||
All Other Equity Investmentsb | 104,165,916 | — | — | 104,165,916 | ||||||||||||
Short Term Investments | — | 1,763,258 | — | 1,763,258 | ||||||||||||
|
| |||||||||||||||
Total Investments in Securities | $ | 118,533,755 | $ | 1,763,258 | $ | 326,401 | $ | 120,623,414 | ||||||||
|
| |||||||||||||||
| Receivables: | ||||||||||||||||
Investment Securities Sold | $ | — | $ | — | $ | 855,227 | $ | 855,227 | ||||||||
|
| |||||||||||||||
aIncludes common stocks.
bFor detailed categories, see the accompanying Statement of Investments.
A reconciliation of assets in which Level 3 inputs are used in determining fair value is presented when there are significant Level 3 financial instruments at the end of the period. At June 30, 2017, the reconciliation of assets is as follows:
| Balance at Beginning of Period | Purchases (Sales) | Transfers Into (Out of) Level 3 | Cost Basis Adjustments | Net Realized Gain (Loss) | Net Unrealized Appreciation (Depreciation) | Balance at End of Period | Net Change in Unrealized Appreciation (Depreciation) on Assets Held at Period End | |||||||||||||||||||||||||
| Assets: | ||||||||||||||||||||||||||||||||
Investments in Securities: | ||||||||||||||||||||||||||||||||
Equity Investments:a | ||||||||||||||||||||||||||||||||
Health Care | $364,322 | $— | $— | $— | $— | $(37,921) | $326,401 | $(37,921) | ||||||||||||||||||||||||
|
| |||||||||||||||||||||||||||||||
| Receivables: | ||||||||||||||||||||||||||||||||
Investment Securities Sold | $826,648 | $— | $— | $— | $— | $28,579 | $855,227 | $28,579 | ||||||||||||||||||||||||
|
| |||||||||||||||||||||||||||||||
aIncludes common stocks.
Level 3 investments include financial instruments with values derived using prior transaction prices or third party pricing information without adjustment for which such inputs are unobservable. They may also include fair value of immaterial financial instruments and/or other assets developed using various valuation techniques and unobservable inputs.
11. Investment Company Reporting Modernization
In October 2016, the U.S. Securities and Exchange Commission adopted new rules and amended existing rules (together, final rules) intended to modernize the reporting and disclosure of information by registered investment companies. In part, the final rules amend Regulation S-X and require standardized, enhanced disclosures about derivatives in investment company financial statements, as well as other amendments. The compliance date for the amendments to Regulation S-X is August 1, 2017. Management has reviewed the requirements and believes the adoption of the amendments to Regulation S-X will not have a material impact on the Fund’s financial statements and related disclosures.
| FLG-20 | Semiannual Report |
FRANKLIN TEMPLETON VARIABLE INSURANCE PRODUCTS TRUST
NOTES TO FINANCIAL STATEMENTS (UNAUDITED)
Franklin Large Cap Growth VIP Fund (continued)
12. Subsequent Events
The Fund has evaluated subsequent events through the issuance of the financial statements and determined that no events have occurred that require disclosure.
Abbreviations
| Selected Portfolio | ||||
| ADR | American Depositary Receipt | |||
| Semiannual Report | FLG-21 |
This page intentionally left blank.
Franklin Mutual Global Discovery VIP Fund
This semiannual report for Franklin Mutual Global Discovery VIP Fund covers the period ended June 30, 2017.
Class 1 Performance Summary as of June 30, 2017
The Fund’s Class 1 Shares delivered a +5.88% total return* for the six-month period ended June 30, 2017.
*Return information is based on net asset values calculated for shareholder transactions. Certain adjustments were made to the net assets of the Fund at 12/31/16 for financial reporting purposes, and as a result, the total returns based on those net asset values differ from the adjusted total returns reported in the Financial Highlights.
Performance reflects the Fund’s Class 1 operating expenses, but does not include any contract fees, expenses or sales charges. If they had been included, performance would be lower. These charges and deductions, particularly for variable life policies, can have a significant effect on contract values and insurance benefits. See the contract prospectus for a complete description of these expenses, including sales charges.
Performance data represent past performance, which does not guarantee future results. Investment return and principal value will fluctuate, and you may have a gain or loss when you sell your shares. Current performance may differ from figures shown.
| Semiannual Report | MGD-1 |
FRANKLIN MUTUAL GLOBAL DISCOVERY VIP FUND
Fund Goal and Main Investments
The Fund seeks capital appreciation. Under normal market conditions, the Fund invests primarily in U.S. and foreign equity securities that the investment manager believes are undervalued.
Fund Risks
All investments involve risks, including possible loss of principal. Value securities may not increase in price as anticipated, or may decline further in value. The Fund’s investments in foreign securities involve certain risks including currency fluctuations, and economic and political uncertainties. Derivatives involve costs and can create economic leverage in the Fund’s portfolio which may result in significant volatility and cause the Fund to participate in losses (as well as gains) in an amount that exceeds the Fund’s initial investment. Smaller company stocks have exhibited greater price volatility than larger company stocks, particularly over the short term. The Fund’s investments in companies engaged in mergers, reorganizations or liquidations also involve special risks as pending deals may not be completed on time or on favorable terms. The Fund may invest in lower rated bonds, which entail higher credit risk. The Fund is actively managed but there is no guarantee that the manager’s investment decisions will produce the desired results. The Fund’s prospectus also includes a description of the main investment risks.
Performance Overview
You can find the Fund’s six-month total return in the Performance Summary. In comparison, the Fund’s benchmark, the MSCI World Index, generated a +11.02% total return and the Standard & Poor’s 500 Index® posted a +9.34% total return for the same period.1
Economic and Market Overview
The global economy generally expanded during the period under review. In this environment, global developed and emerging market stocks rose, as measured by the MSCI All Country World Index. Global markets were aided by improved industrial commodity prices at certain points during the period, generally upbeat economic data across regions, investor optimism about pro-growth and pro-business policies in the U.S, hopes of tax reforms under the Trump administration,
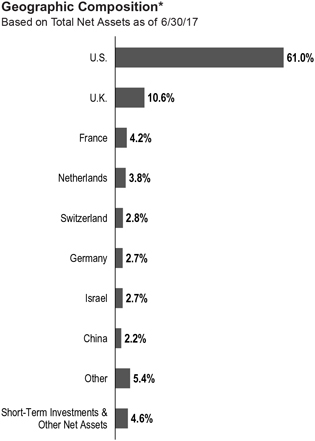
*Figures are stated as a percentage of total and may not equal 100% or may be negative due to rounding, use of any derivatives, unsettled trades or other factors.
Emmanuel Macron’s election as France’s president and encouraging corporate earnings reports.
However, investors expressed concerns about the timing and economic effects of the U.K.’s exit from the European Union (also known as “Brexit”). Other headwinds included the health of European banks, concerns about political uncertainty in the U.S. and European Union, geopolitical tensions in certain regions, worries about global oversupply in oil production despite a pact to extend cuts, and hawkish comments from key central bankers around the world toward period-end.
U.S. economic growth decelerated in 2017’s first quarter, largely due to slower growth in consumer spending and declines in private inventory investment and government spending. However, growth accelerated in the second quarter due to increases in consumer spending, business investment and federal government spending. The unemployment rate
1. Source: Morningstar.
One cannot invest directly in an index, and an index is not representative of the Fund’s portfolio. Please see Index Descriptions following the Fund Summaries
The dollar value, number of shares or principal amount, and names of all portfolio holdings are listed in the Fund’s Statement of Investments (SOI).
| MGD-2 | Semiannual Report |
FRANKLIN MUTUAL GLOBAL DISCOVERY VIP FUND
decreased from 4.7% in December 2016 to 4.4% at period-end.2 Annual inflation, as measured by the Consumer Price Index, decreased from 2.1% to 1.6% during the period. After increasing its benchmark interest rate in March, the U.S. Federal Reserve (Fed), at its June meeting, made the widely anticipated increase to its target range for the federal funds rate from 0.75%–1.00% to 1.00%–1.25%, amid signs of a growing U.S. economy, a strengthening labor market and an improvement in business spending.
In Europe, the U.K.’s economy grew at a slower rate in 2017’s first quarter over the previous quarter, largely due to slower growth in household spending. The eurozone’s growth increased in the first quarter over the previous quarter. The bloc’s annual inflation rate fluctuated during the reporting period and ended slightly higher from where it began. During the period, the European Central Bank kept its key policy rates unchanged.
In Asia, Japan’s quarterly gross domestic product (GDP) remained unchanged in 2017’s first quarter compared to 2016’s fourth quarter. In April 2017, the Bank of Japan (BOJ) slightly increased its GDP forecasts for the 2017–2018 fiscal year. However, the BOJ lowered its inflation forecast.
In emerging markets, Brazil’s quarterly GDP grew for the first time in two years, as its first-quarter 2017 GDP grew compared to the previous quarter. The country’s central bank cut its benchmark interest rate four times between January and June 2017 to spur economic growth. Russia’s GDP grew in 2017’s first quarter compared to the prior-year period. The Bank of Russia reduced its key interest rate in March, April and June 2017 to try to revive its economy. China’s economy grew faster in the first half of 2017 compared to the first half of 2016, driven by solid growth in industrial production, services, fixed-asset investment, retail sales, and imports and exports. The People’s Bank of China left its benchmark interest rate unchanged during the period. Overall, emerging market stocks, as measured by the MSCI Emerging Markets Index, rose during the period.
Investment Strategy
At Franklin Mutual Advisors, we are committed to our distinctive value approach to investing. Our major investment strategy is investing in undervalued stocks. When selecting undervalued equities, we are attracted to what we believe are fundamentally strong companies with healthy balance sheets, high-quality assets, substantial free cash flow and
shareholder-oriented management teams and whose stocks are trading at discounts to our assessment of the companies’ intrinsic or business value. We also look for asset-rich companies whose shares may be trading at depressed levels due to concerns over short-term earnings disappointments, litigation, management strategy or other perceived negatives. While the vast majority of our undervalued equity investments are made in publicly traded companies globally, we may invest occasionally in privately held companies as well.
We complement this more traditional investment strategy with two others. One is distressed investing, which is complex and can take many forms. The most common distressed investment the Fund undertakes is the purchase of financially troubled or bankrupt companies’ debt at a substantial discount to face value. After the financially distressed company is reorganized, often in bankruptcy court, the old debt is typically replaced with new securities issued by the financially stronger company.
The other piece of our investment strategy is participating in arbitrage situations, another highly specialized field. When companies announce proposed mergers or takeovers, commonly referred to as “deals,” the target company may trade at a discount to the bid it ultimately accepts. One form of arbitrage involves purchasing the target company’s stock when it is trading below the value we believe it would receive in a deal. In keeping with our commitment to a relatively conservative investment approach, we typically focus our arbitrage efforts on announced deals, and eschew rumored deals or other situations we consider relatively risky.
In addition, it is our practice to hedge the Fund’s currency exposure when we deem it advantageous for our shareholders.
What is meant by “hedge”?
To hedge an investment is to take a position intended to offset potential losses/gains that may be incurred by a companion financial instrument.
Manager’s Discussion
Many equity markets posted meaningful gains in 2017’s first half, across most regions and with minimal volatility. Global markets were aided by generally upbeat economic data, improved corporate earnings in the U.S., Europe and Japan, as well as improved industrial commodity prices at certain points during the period. However, those largely positive headline
2. Source: Bureau of Labor Statistics.
| Semiannual Report | MGD-3 |
FRANKLIN MUTUAL GLOBAL DISCOVERY VIP FUND
conditions overshadowed a fair amount of turbulence and uncertainty.
In the U.S., markets began 2017 rallying as investors hoped that a Republican sweep of U.S. elections in November 2016 would lead to a general loosening in regulations and tax reform, including lower corporate tax rates. However, political gridlock took hold. The political drama in Washington, D.C., tempered the rally in U.S. markets overall. Many stocks that led the way in the post-election rally subsequently gave back some or all of their outperformance, particularly value stocks dominated by companies in cyclical sectors most likely to benefit from acceleration in economic growth. In an environment of modest economic growth and low interest rates, investors continued to favor growth stocks. During the period, the Russell 1000® Growth Index generated a total return of +13.99%, while the Russell 1000® Value Index posted a total return of +4.66%.1 Within the Russell 1000® Growth Index, stocks with the largest weights were technology firms that dominated the headlines: Apple,3 Alphabet (a.k.a. Google),3 Microsoft, Amazon.com3 and Facebook.3
European equity markets started 2017 slowly, but political events combined with upbeat economic news sparked strong performance during the period, with the notable exception of the U.K. Elections in Europe produced generally positive outcomes, with voters in the Netherlands and France rejecting extremist candidates. Political stability in the European Union (EU) helped to support equity markets on the belief that it would help facilitate the ongoing economic recovery. In the U.K., however, a snap election resulting in no party having a majority in Parliament appeared to make a “hard Brexit,” in which the U.K. leaves the EU in March 2019 without a negotiated deal, even more likely than before.
As value investors, we managed to benefit from steady economic growth despite underlying market turbulence. We seek to invest prudently in securities that we believe represent good value, and then we adjust our views as the world around us changes.
The energy sector has been a significant area of investment for the Fund.4 Following an extended period of high prices, crude oil and natural gas prices have been significantly lower during the past few years. The benchmark oil price dropped from more than $100 a barrel to below $30, and has more recently stayed between $40 and $60. The impact on the sector, and the
| Top 10 Sectors/Industries | ||||
| 6/30/17 | ||||
| % of Total Net Assets | ||||
| Banks | 15.5% | |||
| Insurance | 8.8% | |||
| Pharmaceuticals | 8.5% | |||
| Oil, Gas & Consumable Fuels | 7.6% | |||
| Software | 6.0% | |||
| Media | 5.8% | |||
| Tobacco | 4.7% | |||
| Health Care Equipment & Supplies | 3.8% | |||
| Industrial Conglomerates | 3.2% | |||
| Food & Staples Retailing | 2.8% | |||
securities of companies in the sector, has been unsurprisingly quite dramatic. Although many uncertainties exist, we continue to expect demand for oil and gas to rise for a number of years, which we believe will require continued investment by the industry, not only to meet that growth but also to replace declining production in mature fields around the world. Accordingly, we expect some combination of higher prices or lower costs over time to provide the sufficient returns needed to justify the required investment.
After an initial period of distress, most companies within the energy sector appear to have made considerable progress in resizing their cost structures and strengthening their balance sheets. In aggregate, capital spending has been cut massively, and cash flow breakeven levels suggest an ability to fund a base level of investment activity given crude oil and gas prices as of period-end. From an investment standpoint, in many cases we are finding securities with reasonable prospects at current commodity prices, and substantively greater upside potential should our longer term price-versus-cost outlook come to pass. We expect continued commodity price volatility, but would look to use that to our advantage when seeking to buy or sell energy sector securities.
Our energy sector investment process has focused on finding situations where commodity price upside is not necessary to generate attractive security returns. One such area is within the infrastructure space. Companies such as Kinder Morgan and Williams provide critical pipelines, processing facilities, ports, and other assets used to bring vital commodities to market. Investors shunned these companies due to a combination of counterparty risk related to exploration and production
3. Not a Fund holding.
4. The energy sector comprises energy equipment and services and oil, gas and consumable fuels in the SOI.
| MGD-4 | Semiannual Report |
FRANKLIN MUTUAL GLOBAL DISCOVERY VIP FUND
companies, their own balance sheet concerns and dividend levels. As our analysis about the criticality of their assets and the flexibility of their funding options has, in our view, been proven, the securities of infrastructure companies have recovered significantly from their lows. Moreover, if expectations of an oil and gas supply glut from greater North American production hold true, more infrastructure investment should be needed to move this product to export markets.
Royal Dutch Shell, a leading integrated oil and gas company, is another investment held by the Fund for which fears about the impact of low commodity prices were overblown, in our view. The company used the initial phase of the price downturn to acquire BG Group, a major exploration and production company with significant positions and strength in liquefied natural gas and a great oil asset in the pre-salt Santos Basin in Brazil. The assets were highly complementary to Shell’s existing positions, allowing the post-merger company to prune other areas of its portfolio and still show considerable growth. Management, under the leadership of relatively new chief executive officer Ben van Beurden, has been focused on reducing costs so that the company can still grow, while funding all required capital expenditures and its dividend, at an oil price below $50 per barrel. As Shell shows continued progress in its efforts and demonstrates the resilience of its portfolio and balance sheet, we expect the shares to continue to benefit.
Merger and acquisition activity has remained healthy, with the number of deals remaining high, although the average size of deals fell. Very large deals may have been affected by ongoing political and regulatory uncertainty. Although many mega-deals were rumored, the largest deal actually announced during the period was Becton, Dickinson and Company’s3 takeover of C.R. Bard.3 Meanwhile, many large deals initiated in 2016 await regulatory approval, including Bayer’s3 acquisition of Monsanto, AT&T’s3 acquisition of Time Warner, and 21st Century Fox’s3 offer for Sky. Several key regulatory agencies remain short of members, including the Federal Communication Commission and the Federal Trade Commission, and these openings may be affecting regulatory approvals.
Credit spreads narrowed in 2016 and continued that trend in the first half of 2017 for higher quality credit, with the exception of a brief period of volatility in March and April. High yield credit has remained at levels seen at the start of 2017. The spread compression provided the Fund with the opportunity to exit
| Top 10 Holdings | ||||
6/30/17
| ||||
| Company Sector/Industry, Country | % of Total Net Assets | |||
| Medtronic PLC Health Care Equipment & Supplies, U.S. | 2.5% | |||
| Merck & Co. Inc. Pharmaceuticals, U.S. | 2.5% | |||
| Microsoft Corp. Software, U.S. | 2.5% | |||
| Citigroup Inc. Banks, U.S. | 2.2% | |||
| Time Warner Inc. Media, U.S. | 2.1% | |||
| Novartis AG Pharmaceuticals, Switzerland | 2.1% | |||
| Wells Fargo & Co. Banks, U.S. | 2.1% | |||
| Accor SA Hotels, Restaurants & Leisure, France | 2.0% | |||
| Eli Lilly & Co. Pharmaceuticals, U.S. | 2.0% | |||
| Royal Dutch Shell PLC Oil, Gas & Consumable Fuels, U.K. | 2.0% | |||
many of the opportunities that presented themselves in early 2016, including several “hung deals,” as prices improved, spreads shrank, and the risk-adjusted returns were no longer mispriced. As the year progressed and investors became more willing buyers of credit, mispriced risk became more difficult to find, in our opinion. However, we found what we viewed as value in some unloved industries like specialty pharmaceuticals, hospitals, media/broadcasting and telecommunications5 that faced increasing political or secular challenges. In sorting through these less-favored industries, we sought out securities that we believed could benefit most from liquidity-enhancing events like asset sales, the ability within existing agreements to issue secured debt, and free cash flow that could create a long enough runway to weather the storm and/or provide enough current recovery to create the enterprise at a significant discount to our assessment of its intrinsic value. In times when the credit markets fluctuate and value is difficult to easily identify, we believe our industry specific expertise, deep fundamental analysis with a focus on cash flow, and intensive credit and covenant review combine seamlessly and provide us with unique ways of looking at the same ideas others may disregard.
5. The telecommunication services sector comprises diversified telecommunication services and wireless telecommunication services in the SOI.
| Semiannual Report | MGD-5 |
FRANKLIN MUTUAL GLOBAL DISCOVERY VIP FUND
Turning to Fund performance, top contributors included U.S.-based medical device maker Medtronic, Israel-based information technology security company Check Point Software Technologies and Switzerland-based health care company Novartis.
Investors responded positively to quarterly results issued by Medtronic in February and May. On both occasions, earnings exceeded consensus expectations, driven by solid revenues and successful cost control efforts, which led to better operating profitability. The positive results led to improved investor confidence in Medtronic’s ability to deliver on future growth goals, especially given concerns following tough quarterly results issued in November 2016. Medtronic’s agreement in April to sell its medical supplies business to Cardinal Health3 provided additional support to Medtronic’s stock price. Medtronic obtained the medical supplies business as part of its 2014 acquisition of Covidien. The medical supplies business, in our view, was not core to Medtronic’s operations and had less attractive profitability and future growth prospects. In addition, Medtronic intends to use the after-tax proceeds for additional share buy-backs and to pay down debt.
Check Point’s stock rallied on positive quarterly results in January after the company showed results that exceeded expectations across most metrics. Billings growth reached a five-year high, demand for software licenses and advanced technology subscriptions grew at a strong pace, and discounting had a smaller negative impact. Earnings and revenue guidance for 2017 were also better than expected. In April, further improvement in billings growth that significantly exceeded investor expectations and improved demand from international markets showed the ongoing fundamental strength of the company.
Novartis is a Switzerland-based health care company with meaningful market positions in biopharmaceuticals, especially oncology, generic pharmaceuticals through its Sandoz division, and eye care through its Alcon division. Investors reacted positively to decent quarterly results in January and April when Novartis beat consensus expectations. Investors also reacted positively to news reports in April that the process of reviewing strategic options for its Alcon division may be moving along. Novartis has made substantial investments to turn around Alcon, but the process has taken longer than expected. We believe a sale or spin-off of Alcon may make sense at the right price. In June, Novartis made good progress on its pipeline with two positive late-stage trials, one for a drug to treating neovascular age-related macular degeneration and second for a cardiovascular treatment for heart attack patients.
During the period under review, Fund investments that detracted from performance included U.S.-based drugstore chain Rite Aid, U.S.-based Marathon Oil, and Canada-based Crescent Point Energy.
Shares of Rite Aid declined as a deal to be acquired by Walgreens Boots Alliance fell apart. The transaction was mired in antitrust review by the Federal Trade Commission (FTC) during much of the period as the FTC questioned whether Walgreens’ proposed divestitures were sufficient to maintain competition. In late June, Walgreens announced the immediate termination of the merger agreement. Instead, Rite Aid agreed to sell numerous stores and related distribution assets to Walgreens. The new agreement is also subject to antitrust review, but we believe FTC approval is likely.
Oil and gas exploration and production company Marathon Oil generally followed the path of declining oil prices. During the first half of 2017, oil prices retreated as U.S. crude oil production increased and data showed that worldwide supply had not yet begun to decline. The supply and price trends for crude oil prices overshadowed some moves by Marathon that we believe were positive. As part of its portfolio transformation effort, in March Marathon announced agreements to exit a Canadian oil sands asset, and two transactions to acquire acreage in the northern Delaware basin of New Mexico. Although we regard the price received for the oil sands asset to be merely adequate, we look favorably upon the continuing expansion of the company’s resource portfolio and increasing focus on predictable, higher return onshore assets. Additionally, the three transactions led to a further improvement in Marathon’s balance sheet. These favorable changes were nonetheless overshadowed by an oil market which remains both volatile and challenging.
Crescent Point Energy is an exploration and production company with significant exposure to oil production. The stock price generally followed the path of deteriorating crude oil prices during the period. A stronger Canadian dollar, which comprises a significant portion of the company’s cost base, further hurt the stock’s performance. We believe the stock is attractive as it trades at a significant discount to its peers, despite having decent assets, a good track record on operational execution and a healthy balance sheet. As Crescent Point Energy focuses on organic growth, we believe the stock’s discounted valuation should improve.
During the period, the Fund held currency forwards and futures seeking to hedge most of the currency risk of the portfolio’s non-U.S. dollar investments. The currency forwards had a negative impact on the Fund’s performance because of the
| MGD-6 | Semiannual Report |
FRANKLIN MUTUAL GLOBAL DISCOVERY VIP FUND
depreciation of the U.S. dollar versus the hedged currencies, while currency futures had a negligible impact.
What is a currency forward?
A currency forward is an agreement between the Fund and a counterparty to buy or sell a foreign currency in exchange for another currency at a specific exchange rate on a future date.
What is a future?
A future is an agreement between the Fund and a counterparty made through a U.S. or foreign futures exchange to buy or sell an underlying instrument or asset at a specific price on a future date.
Thank you for your participation in Franklin Mutual Global Discovery VIP Fund. We look forward to serving your future investment needs.
The foregoing information reflects our analysis, opinions and portfolio holdings as of June 30, 2017, the end of the reporting period. The way we implement our main investment strategies and the resulting portfolio holdings may change depending on factors such as market and economic conditions. These opinions may not be relied upon as investment advice or an offer for a particular security. The information is not a complete analysis of every aspect of any market, country, industry, security or the Fund. Statements of fact are from sources considered reliable, but the investment manager makes no representation or warranty as to their completeness or accuracy. Although historical performance is no guarantee of future results, these insights may help you understand our investment management philosophy.
| Semiannual Report | MGD-7 |
FRANKLIN MUTUAL GLOBAL DISCOVERY VIP FUND
Class 1 Fund Expenses
As an investor in a variable insurance contract (Contract) that indirectly provides for investment in an underlying mutual fund, you can incur transaction and/or ongoing expenses at both the Fund level and the Contract Level: (1) transaction expenses can include sales charges (loads) on purchases, surrender fees, transfer fees and premium taxes; and (2) ongoing expenses can include management fees, distribution and service (12b-1) fees, contract fees, annual maintenance fees, mortality and expense risk fees and other fees and expenses. All mutual funds and Contracts have some types of ongoing expenses. The table below shows Fund-level ongoing expenses and can help you understand these costs and compare them with those of other mutual funds offered through the Contract. The table assumes a $1,000 investment held for the six months indicated. Please refer to the Fund prospectus for additional information on operating expenses.
Actual Fund Expenses
The table below provides information about the actual account values and actual expenses in the columns under the heading “Actual.” In these columns the Fund’s actual return, which includes the effect of ongoing Fund expenses but does not include the effect of ongoing Contract expenses, is used to calculate the “Ending Account Value.” You can estimate the Fund-level expenses you paid during the period by following these steps (of course, your account value and expenses will differ from those in this illustration): Divide your account value by $1,000 (if your account had an $8,600 value, then $8,600 ÷ $1,000 = 8.6). Then multiply the result by the number under the headings “Actual” and “Fund-Level Expenses Paid During Period” (if Fund-Level Expenses Paid During Period were $ 7.50, then 8.6x$7.50 = $64.50). In this illustration, the estimated expenses paid this period at the Fund level are $64.50.
Hypothetical Example for Comparison with Other Mutual Funds
Under the heading “Hypothetical” in the table, information is provided about hypothetical account values and hypothetical expenses based on the Fund’s actual expense ratio and an assumed rate of return of 5% per year before expenses, which is not the Fund’s actual return. This information may not be used to estimate the actual ending account balance or expenses you paid for the period, but it can help you compare ongoing costs of investing in the Fund with those of other mutual funds offered through the Contract. To do so, compare this 5% hypothetical example with the 5% hypothetical examples that appear in the shareholder reports of other funds offered through the Contract.
Please note that expenses shown in the table are meant to highlight ongoing costs at the Fund level only and do not reflect any ongoing expenses at the Contract level, or transaction expenses at either the Fund or Contract levels. In addition, while the Fund does not have transaction expenses, if the transaction and ongoing expenses at the Contract level were included, the expenses shown below would be higher. You should consult your Contract prospectus or disclosure document for more information.
| Actual (actual return after expenses) | Hypothetical (5% annual return before expenses) | |||||||||||||||||||||||
| Share Class | Beginning Account Value 1/1/17 | Ending Account Value 6/30/17 | Fund-Level Expenses Paid During Period 1/1/17–6/30/171,2 | Ending Account Value 6/30/17 | Fund-Level Expenses Paid During Period 1/1/17–6/30/171,2 | Net Expense | ||||||||||||||||||
Class 1 | $1,000 | $1,059.80 | $5.06 | $1,019.89 | $4.96 | 0.99% | ||||||||||||||||||
1. Expenses are equal to the annualized expense ratio for the six-month period as indicated above–in the far right column–multiplied by the simple average account value over the period indicated, and then multiplied by 181/365 to reflect the one-half year period.
2. Reflects expenses after fee waivers and expense reimbursements. Does not include any ongoing expenses of the Contract for which the Fund is an investment option or acquired fund fees and expenses.
| MGD-8 | Semiannual Report |
FRANKLIN TEMPLETON VARIABLE INSURANCE PRODUCTS TRUST
FINANCIAL HIGHLIGHTS
Franklin Mutual Global Discovery VIP Fund
| Six Months Ended June 30, 2017 (unaudited) | Year Ended December 31, | |||||||||||||||||||||||
| 2016 | 2015 | 2014 | 2013 | 2012 | ||||||||||||||||||||
| Class 1 | ||||||||||||||||||||||||
Per share operating performance (for a share outstanding throughout the period) | ||||||||||||||||||||||||
Net asset value, beginning of period | $20.22 | $19.85 | $22.61 | $23.31 | $20.55 | $19.66 | ||||||||||||||||||
|
| |||||||||||||||||||||||
| Income from investment operationsa: | ||||||||||||||||||||||||
Net investment incomeb | 0.25 | 0.41 | 0.37 | 0.68 | c | 0.46 | 0.43 | |||||||||||||||||
Net realized and unrealized gains (losses) | 0.96 | 1.92 | (1.17 | ) | 0.76 | 5.03 | 2.21 | |||||||||||||||||
|
| |||||||||||||||||||||||
Total from investment operations | 1.21 | 2.33 | (0.80 | ) | 1.44 | 5.49 | 2.64 | |||||||||||||||||
|
| |||||||||||||||||||||||
| Less distributions from: | ||||||||||||||||||||||||
Net investment income | — | (0.39 | ) | (0.69 | ) | (0.57 | ) | (0.58 | ) | (0.64 | ) | |||||||||||||
Net realized gains | — | (1.57 | ) | (1.27 | ) | (1.57 | ) | (2.15 | ) | (1.11 | ) | |||||||||||||
|
| |||||||||||||||||||||||
Total distributions | — | (1.96 | ) | (1.96 | ) | (2.14 | ) | (2.73 | ) | (1.75 | ) | |||||||||||||
|
| |||||||||||||||||||||||
Net asset value, end of period | $21.43 | $20.22 | $19.85 | $22.61 | $23.31 | $20.55 | ||||||||||||||||||
|
| |||||||||||||||||||||||
Total returnd | 5.98% | 12.32% | (3.39 | )% | 5.98% | 27.95% | 13.63% | |||||||||||||||||
| Ratios to average net assetse | ||||||||||||||||||||||||
Expensesf | 0.99% | g,h | 1.01% | g,h | 1.02% | g,h | 1.00% | g | 0.97% | g | 0.99% | |||||||||||||
Expenses incurred in connection with securities sold short | —% | 0.01% | 0.02% | 0.03% | —% | i | —% | i | ||||||||||||||||
Net investment income | 2.37% | 2.10% | 1.71% | 2.85% | c | 2.13% | 2.12% | |||||||||||||||||
| Supplemental data | ||||||||||||||||||||||||
Net assets, end of period (000’s) | $3,271 | $3,084 | $2,632 | $2,313 | $2,465 | $1,136 | ||||||||||||||||||
Portfolio turnover rate | 9.98% | 17.54% | 21.88% | 22.18% | 15.58% | 25.63% | ||||||||||||||||||
aThe amount shown for a share outstanding throughout the period may not correlate with the Statement of Operations for the period due to the timing of sales and repurchases of the Fund’s shares in relation to income earned and/or fluctuating fair value of the investments of the Fund.
bBased on average daily shares outstanding.
cNet investment income per shares includes approximately $0.34 per share related to income received in the form of special dividends in connection with certain Fund holdings. Excluding this amount, the ratio of net investment income to average net assets would have been 1.40%.
dTotal return does not include fees, charges or expenses imposed by the variable annuity and life insurance contracts for which Franklin Templeton Variable Insurance Products Trust serves as an underlying investment vehicle. Total return is not annualized for periods less than one year.
eRatios are annualized for periods less than one year.
fIncludes dividend and/or interest expense on securities sold short and security borrowing fees, if any. See below for the ratios of such expenses to average net assets for the periods presented. See Note 1(d).
gBenefit of expense reduction rounds to less than 0.01%.
hBenefit of waiver and payments by affiliates rounds to less than 0.01%.
iRounds to less than 0.01%.
| The accompanying notes are an integral part of these financial statements. | Semiannual Report | MGD-9 |
FRANKLIN TEMPLETON VARIABLE INSURANCE PRODUCTS TRUST
FINANCIAL HIGHLIGHTS
Franklin Mutual Global Discovery VIP Fund (continued)
Six Months Ended (unaudited) | Year Ended December 31, | |||||||||||
| 2016 | 2015 | 2014 | 2013 | 2012 | ||||||||
| Class 2 | ||||||||||||
Per share operating performance (for a share outstanding throughout the period) | ||||||||||||
Net asset value, beginning of period | $19.69 | $19.37 | $22.11 | $22.84 | $20.17 | $19.30 | ||||||
| ||||||||||||
| Income from investment operationsa: | ||||||||||||
Net investment incomeb | 0.22 | 0.35 | 0.32 | 0.60c | 0.42 | 0.38 | ||||||
Net realized and unrealized gains (losses) | 0.93 | 1.87 | (1.16) | 0.75 | 4.92 | 2.15 | ||||||
| ||||||||||||
Total from investment operations | 1.15 | 2.22 | (0.84) | 1.35 | 5.34 | 2.53 | ||||||
| ||||||||||||
| Less distributions from: | ||||||||||||
Net investment income | — | (0.33) | (0.63) | (0.51) | (0.52) | (0.55) | ||||||
Net realized gains | — | (1.57) | (1.27) | (1.57) | (2.15) | (1.11) | ||||||
| ||||||||||||
Total distributions | — | (1.90) | (1.90) | (2.08) | (2.67) | (1.66) | ||||||
| ||||||||||||
Net asset value, end of period | $20.84 | $19.69 | $19.37 | $22.11 | $22.84 | $20.17 | ||||||
| ||||||||||||
Total returnd | 5.84% | 12.06% | (3.65)% | 5.71% | 27.61% | 13.36% | ||||||
| Ratios to average net assetse | ||||||||||||
Expensesf | 1.24%g,h | 1.26%g,h | 1.27%g,h | 1.25%g | 1.22%g | 1.24% | ||||||
Expenses incurred in connection with securities sold short | —% | 0.01% | 0.02% | 0.03% | —%i | —%i | ||||||
Net investment income | 2.12% | 1.85% | 1.46% | 2.60%c | 1.88% | 1.87% | ||||||
| Supplemental data | ||||||||||||
Net assets, end of period (000’s) | $640,102 | $630,397 | $629,366 | $685,711 | $684,780 | $660,465 | ||||||
Portfolio turnover rate | 9.98% | 17.54% | 21.88% | 22.18% | 15.58% | 25.63% | ||||||
aThe amount shown for a share outstanding throughout the period may not correlate with the Statement of Operations for the period due to the timing of sales and repurchases of the Fund’s shares in relation to income earned and/or fluctuating fair value of the investments of the Fund.
bBased on average daily shares outstanding.
cNet investment income per shares includes approximately $0.34 per share related to income received in the form of special dividends in connection with certain Fund holdings. Excluding this amount, the ratio of net investment income to average net assets would have been 1.15%.
dTotal return does not include fees, charges or expenses imposed by the variable annuity and life insurance contracts for which Franklin Templeton Variable Insurance Products Trust serves as an underlying investment vehicle. Total return is not annualized for periods less than one year.
eRatios are annualized for periods less than one year.
fIncludes dividend and/or interest expense on securities sold short and security borrowing fees, if any. See below for the ratios of such expenses to average net assets for the periods presented. See Note 1(d).
gBenefit of expense reduction rounds to less than 0.01%.
hBenefit of waiver and payments by affiliates rounds to less than 0.01%.
iRounds to less than 0.01%.
| MGD-10 | Semiannual Report | The accompanying notes are an integral part of these financial statements. |
FRANKLIN TEMPLETON VARIABLE INSURANCE PRODUCTS TRUST
FINANCIAL HIGHLIGHTS
Franklin Mutual Global Discovery VIP Fund (continued)
Six Months Ended June 30, 2017 | Year Ended December 31, | |||||||||||||||||||||||
| 2016 | 2015 | 2014 | 2013 | 2012 | ||||||||||||||||||||
| Class 4 | ||||||||||||||||||||||||
Per share operating performance (for a share outstanding throughout the period) | ||||||||||||||||||||||||
Net asset value, beginning of period | $20.02 | $19.66 | $22.39 | $23.10 | $20.38 | $19.50 | ||||||||||||||||||
|
| |||||||||||||||||||||||
| Income from investment operationsa: | ||||||||||||||||||||||||
Net investment incomeb | 0.21 | 0.34 | 0.30 | 0.61 | c | 0.40 | 0.36 | |||||||||||||||||
Net realized and unrealized gains (losses) | 0.95 | 1.89 | (1.17 | ) | 0.73 | 4.97 | 2.19 | |||||||||||||||||
|
| |||||||||||||||||||||||
Total from investment operations | 1.16 | 2.23 | (0.87 | ) | 1.34 | 5.37 | 2.55 | |||||||||||||||||
|
| |||||||||||||||||||||||
| Less distributions from: | ||||||||||||||||||||||||
Net investment income | — | (0.30 | ) | (0.59 | ) | (0.48 | ) | (0.50 | ) | (0.56 | ) | |||||||||||||
Net realized gains | — | (1.57 | ) | (1.27 | ) | (1.57 | ) | (2.15 | ) | (1.11 | ) | |||||||||||||
|
| |||||||||||||||||||||||
Total distributions | — | (1.87 | ) | (1.86 | ) | (2.05 | ) | (2.65 | ) | (1.67 | ) | |||||||||||||
|
| |||||||||||||||||||||||
Net asset value, end of period | $21.18 | $20.02 | $19.66 | $22.39 | $23.10 | $20.38 | ||||||||||||||||||
|
| |||||||||||||||||||||||
Total returnd | 5.79% | 11.91% | (3.74)% | 5.60% | 27.52% | 13.27% | ||||||||||||||||||
| Ratios to average net assetse | ||||||||||||||||||||||||
Expensesf | 1.34% | g,h | 1.36% | g,h | 1.37% | g,h | 1.35% | g | 1.32% | g | 1.34% | |||||||||||||
Expenses incurred in connection with securities | —% | 0.01% | 0.02% | 0.03% | —% | i | —% | i | ||||||||||||||||
Net investment income | 2.02% | 1.75% | 1.36% | 2.50% | c | 1.78% | 1.77% | |||||||||||||||||
| Supplemental data | ||||||||||||||||||||||||
Net assets, end of period (000’s) | $43,845 | $45,262 | $49,054 | $59,961 | $70,354 | $62,346 | ||||||||||||||||||
Portfolio turnover rate | 9.98% | 17.54% | 21.88% | 22.18% | 15.58% | 25.63% | ||||||||||||||||||
aThe amount shown for a share outstanding throughout the period may not correlate with the Statement of Operations for the period due to the timing of sales and repurchases of the Fund’s shares in relation to income earned and/or fluctuating fair value of the investments of the Fund.
bBased on average daily shares outstanding.
cNet investment income per shares includes approximately $0.34 per share related to income received in the form of special dividends in connection with certain Fund holdings. Excluding this amount, the ratio of net investment income to average net assets would have been 1.05%.
dTotal return does not include fees, charges or expenses imposed by the variable annuity and life insurance contracts for which Franklin Templeton Variable Insurance Products Trust serves as an underlying investment vehicle. Total return is not annualized for periods less than one year.
eRatios are annualized for periods less than one year.
fIncludes dividend and/or interest expense on securities sold short and security borrowing fees, if any. See below for the ratios of such expenses to average net assets for the periods presented. See Note 1(d).
gBenefit of expense reduction rounds to less than 0.01%.
hBenefit of waiver and payments by affiliates rounds to less than 0.01%.
iRounds to less than 0.01%.
| The accompanying notes are an integral part of these financial statements. | Semiannual Report | MGD-11 |
FRANKLIN TEMPLETON VARIABLE INSURANCE PRODUCTS TRUST
Statement of Investments, June 30, 2017 (unaudited)
Franklin Mutual Global Discovery VIP Fund
| Country | Shares/ Units | Value | ||||||||||||
| Common Stocks and Other Equity Interests 90.6% | ||||||||||||||
| Aerospace & Defense 0.5% | ||||||||||||||
| a | KLX Inc. | United States | 32,920 | $ | 1,646,000 | |||||||||
Rockwell Collins Inc. | United States | 20,416 | 2,145,313 | |||||||||||
|
| |||||||||||||
| 3,791,313 | ||||||||||||||
|
| |||||||||||||
| Auto Components 0.4% | ||||||||||||||
| a,b | International Automotive Components Group Brazil LLC. | Brazil | 424,073 | 10,372 | ||||||||||
| a,b,c | International Automotive Components Group North America LLC | United States | 4,052,916 | 2,494,635 | ||||||||||
|
| |||||||||||||
| 2,505,007 | ||||||||||||||
|
| |||||||||||||
| Automobiles 1.3% | ||||||||||||||
General Motors Co. | United States | 192,700 | 6,731,011 | |||||||||||
Hyundai Motor Co | South Korea | 17,572 | 2,447,952 | |||||||||||
|
| |||||||||||||
| 9,178,963 | ||||||||||||||
|
| |||||||||||||
| Banks 15.5% | ||||||||||||||
Barclays PLC | United Kingdom | 2,052,511 | 5,420,518 | |||||||||||
BNP Paribas SA | France | 117,870 | 8,490,210 | |||||||||||
Capital Bank Financial Corp., A | United States | 78,494 | 2,990,621 | |||||||||||
| d | Capital Bank Financial Corp., B, 144A, non-voting | United States | 269,922 | 10,284,028 | ||||||||||
CIT Group Inc | United States | 136,169 | 6,631,430 | |||||||||||
Citigroup Inc | United States | 229,050 | 15,318,864 | |||||||||||
Citizens Financial Group Inc | United States | 310,923 | 11,093,733 | |||||||||||
HSBC Holdings PLC | United Kingdom | 438,755 | 4,067,368 | |||||||||||
JPMorgan Chase & Co. | United States | 96,110 | 8,784,454 | |||||||||||
PNC Financial Services Group Inc. | United States | 62,732 | 7,833,345 | |||||||||||
Societe Generale SA | France | 118,614 | 6,382,785 | |||||||||||
| a | Standard Chartered PLC | United Kingdom | 374,211 | 3,788,295 | ||||||||||
| a | Unicaja Banco SA | Spain | 1,141,179 | 1,525,109 | ||||||||||
Wells Fargo & Co. | United States | 256,320 | 14,202,691 | |||||||||||
|
| |||||||||||||
| 106,813,451 | ||||||||||||||
|
| |||||||||||||
| Beverages 0.9% | ||||||||||||||
PepsiCo Inc. | United States | 55,497 | 6,409,348 | |||||||||||
|
| |||||||||||||
| Capital Markets 0.4% | ||||||||||||||
| a | Guotai Junan Securities Co. Ltd. | China | 1,275,797 | 2,666,710 | ||||||||||
|
| |||||||||||||
| Chemicals 1.1% | ||||||||||||||
Monsanto Co. | United States | 64,910 | 7,682,748 | |||||||||||
|
| |||||||||||||
| Communications Equipment 2.6% | ||||||||||||||
Cisco Systems Inc. | United States | 359,180 | 11,242,334 | |||||||||||
Nokia OYJ, A. | Finland | 611,269 | 3,738,979 | |||||||||||
Nokia OYJ, ADR | Finland | 519,486 | 3,200,034 | |||||||||||
|
| |||||||||||||
| 18,181,347 | ||||||||||||||
|
| |||||||||||||
| Construction Materials 0.7% | ||||||||||||||
LafargeHolcim Ltd., B. | Switzerland | 78,676 | 4,505,150 | |||||||||||
|
| |||||||||||||
| Consumer Finance 1.2% | ||||||||||||||
Ally Financial Inc | United States | 151,600 | 3,168,440 | |||||||||||
Capital One Financial Corp. | United States | 60,788 | 5,022,305 | |||||||||||
|
| |||||||||||||
| 8,190,745 | ||||||||||||||
|
| |||||||||||||
| Diversified Financial Services 1.3% | ||||||||||||||
| a,b | Hightower Holding LLC, B, Series II | United States | 1,775,736 | 5,533,549 | ||||||||||
Voya Financial Inc | United States | 101,650 | 3,749,869 | |||||||||||
|
| |||||||||||||
| 9,283,418 | ||||||||||||||
|
| |||||||||||||
| MGD-12 | Semiannual Report |
FRANKLIN TEMPLETON VARIABLE INSURANCE PRODUCTS TRUST
STATEMENT OF INVESTMENTS (UNAUDITED)
Franklin Mutual Global Discovery VIP Fund (continued)
| Country | Shares/ Units | Value | ||||||||||||
| Common Stocks and Other Equity Interests (continued) | ||||||||||||||
| Diversified Telecommunication Services 2.0% | ||||||||||||||
China Telecom Corp. Ltd., H | China | 13,642,104 | $ | 6,482,303 | ||||||||||
Koninklijke KPN NV | Netherlands | 979,670 | 3,134,398 | |||||||||||
| a | Telecom Italia SpA | Italy | 4,563,482 | 4,211,811 | ||||||||||
|
| |||||||||||||
| 13,828,512 | ||||||||||||||
|
| |||||||||||||
| Energy Equipment & Services 1.4% | ||||||||||||||
Baker Hughes Inc. | United States | 178,964 | 9,755,328 | |||||||||||
|
| |||||||||||||
| Food & Staples Retailing 2.8% | ||||||||||||||
CVS Health Corp. | United States | 84,991 | 6,838,376 | |||||||||||
Metro AG | Germany | 96,726 | 3,265,392 | |||||||||||
| a | Rite Aid Corp. | United States | 391,098 | 1,153,739 | ||||||||||
Walgreens Boots Alliance Inc. | United States | 102,904 | 8,058,412 | |||||||||||
|
| |||||||||||||
| 19,315,919 | ||||||||||||||
|
| |||||||||||||
| Health Care Equipment & Supplies 3.8% | ||||||||||||||
Medtronic PLC | United States | 196,610 | 17,449,137 | |||||||||||
Stryker Corp | United States | 62,868 | 8,724,821 | |||||||||||
|
| |||||||||||||
| 26,173,958 | ||||||||||||||
|
| |||||||||||||
| Hotels, Restaurants & Leisure 2.4% | ||||||||||||||
Accor SA | France | 292,594 | 13,717,875 | |||||||||||
Sands China Ltd | Hong Kong | 648,800 | 2,970,715 | |||||||||||
|
| |||||||||||||
| 16,688,590 | ||||||||||||||
|
| |||||||||||||
| Independent Power & Renewable Electricity Producers 0.5% | ||||||||||||||
Vistra Energy Corp. | United States | 199,533 | 3,350,159 | |||||||||||
|
| |||||||||||||
| Industrial Conglomerates 3.2% | ||||||||||||||
General Electric Co. | United States | 377,400 | 10,193,574 | |||||||||||
Koninklijke Philips NV. | Netherlands | 328,294 | 11,660,433 | |||||||||||
|
| |||||||||||||
| 21,854,007 | ||||||||||||||
|
| |||||||||||||
| Insurance 8.8% | ||||||||||||||
| a | Alleghany Corp. | United States | 2,730 | 1,623,804 | ||||||||||
American International Group Inc. | United States | 204,833 | 12,806,159 | |||||||||||
China Pacific Insurance Group Co. Ltd., H | China | 845,908 | 3,456,113 | |||||||||||
Chubb Ltd. | United States | 59,966 | 8,717,857 | |||||||||||
The Hartford Financial Services Group Inc | United States | 68,896 | 3,621,863 | |||||||||||
MetLife Inc | United States | 100,526 | 5,522,898 | |||||||||||
NN Group NV | Netherlands | 323,882 | 11,512,975 | |||||||||||
T&D Holdings Inc. | Japan | 199,721 | 3,035,276 | |||||||||||
XL Group Ltd. | Bermuda | 235,290 | 10,305,702 | |||||||||||
|
| |||||||||||||
| 60,602,647 | ||||||||||||||
|
| |||||||||||||
| IT Services 1.5% | ||||||||||||||
Cognizant Technology Solutions Corp., A | United States | 130,860 | 8,689,104 | |||||||||||
DXC Technology Co. | United States | 25,657 | 1,968,405 | |||||||||||
|
| |||||||||||||
| 10,657,509 | ||||||||||||||
|
| |||||||||||||
| Machinery 0.7% | ||||||||||||||
Caterpillar Inc | United States | 42,175 | 4,532,125 | |||||||||||
|
| |||||||||||||
| Media 5.8% | ||||||||||||||
| a | Charter Communications Inc., A | United States | 30,386 | 10,235,524 | ||||||||||
| a | DISH Network Corp., A. | United States | 124,103 | 7,788,704 | ||||||||||
Sky PLC. | United Kingdom | 538,425 | 6,971,176 | |||||||||||
Time Warner Inc. | United States | 146,582 | 14,718,299 | |||||||||||
|
| |||||||||||||
| 39,713,703 | ||||||||||||||
|
| |||||||||||||
| Semiannual Report | MGD-13 |
FRANKLIN TEMPLETON VARIABLE INSURANCE PRODUCTS TRUST
STATEMENT OF INVESTMENTS (UNAUDITED)
Franklin Mutual Global Discovery VIP Fund (continued)
| Country | Shares/ Units | Value | ||||||||||||
| Common Stocks and Other Equity Interests (continued) | ||||||||||||||
| Metals & Mining 1.5% | ||||||||||||||
a Freeport-McMoRan Inc. | United States | 186,260 | $ | 2,236,983 | ||||||||||
thyssenkrupp AG. | Germany | 242,203 | 6,881,827 | |||||||||||
b,c Warrior Met Coal Inc. | United States | 54,024 | 883,779 | |||||||||||
|
| |||||||||||||
| 10,002,589 | ||||||||||||||
|
| |||||||||||||
| Multi-Utilities 0.4% | ||||||||||||||
innogy SE | Germany | 63,784 | 2,511,026 | |||||||||||
|
| |||||||||||||
| Oil, Gas & Consumable Fuels 7.6% | ||||||||||||||
Apache Corp. | United States | 70,359 | 3,372,307 | |||||||||||
BP PLC | United Kingdom | 1,028,014 | 5,929,268 | |||||||||||
China Shenhua Energy Co. Ltd., H | China | 776,950 | 1,729,486 | |||||||||||
a CONSOL Energy Inc. | United States | 219,381 | 3,277,552 | |||||||||||
Crescent Point Energy Corp. | Canada | 506,700 | 3,877,996 | |||||||||||
JXTG Holdings Inc. | Japan | 392,812 | 1,713,587 | |||||||||||
Kinder Morgan Inc. | United States | 391,270 | 7,496,733 | |||||||||||
Marathon Oil Corp. | United States | 438,465 | 5,195,810 | |||||||||||
Royal Dutch Shell PLC, A (EUR Traded) | United Kingdom | 327,191 | 8,683,707 | |||||||||||
Royal Dutch Shell PLC, A (GBP Traded) | United Kingdom | 179,410 | 4,755,602 | |||||||||||
The Williams Cos. Inc. | United States | 196,601 | 5,953,078 | |||||||||||
|
| |||||||||||||
| 51,985,126 | ||||||||||||||
|
| |||||||||||||
| Pharmaceuticals 8.5% | ||||||||||||||
Eli Lilly & Co | United States | 165,580 | 13,627,234 | |||||||||||
GlaxoSmithKline PLC. | United Kingdom | 262,323 | 5,588,321 | |||||||||||
Merck & Co. Inc. | United States | 267,118 | 17,119,593 | |||||||||||
Novartis AG, ADR | Switzerland | 176,221 | 14,709,167 | |||||||||||
Teva Pharmaceutical Industries Ltd., ADR | Israel | 226,691 | 7,530,675 | |||||||||||
|
| |||||||||||||
| 58,574,990 | ||||||||||||||
|
| |||||||||||||
| Software 6.0% | ||||||||||||||
a Check Point Software Technologies Ltd. | Israel | 101,567 | 11,078,928 | |||||||||||
a Dell Technologies Inc., V | United States | 33,415 | 2,041,991 | |||||||||||
Microsoft Corp. | United States | 245,936 | 16,952,369 | |||||||||||
Symantec Corp | United States | 403,861 | 11,409,073 | |||||||||||
|
| |||||||||||||
| 41,482,361 | ||||||||||||||
|
| |||||||||||||
| Specialty Retail 0.7% | ||||||||||||||
Kingfisher PLC | United Kingdom | 1,151,830 | 4,511,451 | |||||||||||
|
| |||||||||||||
| Technology Hardware, Storage & Peripherals 0.9% | ||||||||||||||
Hewlett Packard Enterprise Co. | United States | 298,680 | 4,955,101 | |||||||||||
Lenovo Group Ltd. | China | 1,500,454 | 947,423 | |||||||||||
|
| |||||||||||||
| 5,902,524 | ||||||||||||||
|
| |||||||||||||
| Tobacco 4.7% | ||||||||||||||
Altria Group Inc. | United States | 118,684 | 8,838,397 | |||||||||||
British American Tobacco PLC | United Kingdom | 188,332 | 12,839,623 | |||||||||||
Reynolds American Inc. | United States | 159,669 | 10,384,872 | |||||||||||
|
| |||||||||||||
| 32,062,892 | ||||||||||||||
|
| |||||||||||||
| Wireless Telecommunication Services 1.5% | ||||||||||||||
Vodafone Group PLC. | United Kingdom | 3,618,505 | 10,263,176 | |||||||||||
|
| |||||||||||||
Total Common Stocks and Other Equity Interests | 622,976,792 | |||||||||||||
|
| |||||||||||||
Preferred Stocks (Cost $7,441,859) 0.9% | ||||||||||||||
| Automobiles 0.9% | ||||||||||||||
e Volkswagen AG, 1.545%, pfd. | Germany | 40,296 | 6,137,848 | |||||||||||
|
| |||||||||||||
| MGD-14 | Semiannual Report |
FRANKLIN TEMPLETON VARIABLE INSURANCE PRODUCTS TRUST
STATEMENT OF INVESTMENTS (UNAUDITED)
Franklin Mutual Global Discovery VIP Fund (continued)
| Country | Principal Amount | Value | ||||||||||||
Corporate Bonds, Notes and Senior Floating Rate Interests 3.2% | ||||||||||||||
f,g Avaya Inc., DIP Facility, 8.617% - 8.716%, 1/23/18. | United States | $ | 902,000 | $ | 931,597 | |||||||||
| f,g | Belk Inc., Closing Date Term Loan, 5.905%, 12/12/22 | United States | 944,186 | 808,695 | ||||||||||
CHS/Community Health Systems Inc., senior note, 6.875%, 2/01/22 | United States | 1,220,000 | 1,070,550 | |||||||||||
| f,g | Cumulus Media Holdings Inc., Term Loans, 4.48%, 12/23/20 | United States | 2,596,190 | 2,099,669 | ||||||||||
Frontier Communications Corp., | ||||||||||||||
senior note, 10.50%, 9/15/22 | United States | 442,000 | 422,663 | |||||||||||
senior note, 11.00%, 9/15/25 | United States | 4,065,000 | 3,765,206 | |||||||||||
iHeartCommunications Inc., | ||||||||||||||
senior secured note, first lien, 9.00%, 12/15/19 | United States | 5,184,000 | 4,088,880 | |||||||||||
f,g Tranche D Term Loan, 7.976%, 1/30/19 | United States | 6,889,154 | 5,649,106 | |||||||||||
f,g Tranche E Term Loan, 8.726%, 7/30/19 | United States | 2,213,881 | 1,815,382 | |||||||||||
| d | Valeant Pharmaceuticals International, senior bond, 144A, 6.75%, 8/15/21 | United States | 363,000 | 346,665 | ||||||||||
senior bond, 144A, 7.25%, 7/15/22 | United States | 241,000 | 227,444 | |||||||||||
| d | Valeant Pharmaceuticals International Inc., senior note, 144A, 7.50%, 7/15/21 | United States | 203,000 | 197,418 | ||||||||||
| d | Veritas U.S. Inc./Veritas Bermuda Ltd., senior note, 144A, 7.50%, 2/01/23 | United States | 336,000 | 362,040 | ||||||||||
|
| |||||||||||||
Total Corporate Bonds, Notes and Senior Floating Rate Interests (Cost $23,745,606) | 21,785,315 | |||||||||||||
|
| |||||||||||||
Corporate Notes and Senior Floating Rate Interests in Reorganization 0.4% | ||||||||||||||
h Avaya Inc., | ||||||||||||||
d senior note, 144A, 10.50%, 3/01/21 | United States | 1,270,000 | 130,175 | |||||||||||
f,g Term B-7 Loan, 4.13%, 5/29/20. | United States | 1,240,000 | 1,000,267 | |||||||||||
b,h Broadband Ventures III LLC, secured promissory note, 5.00%, 2/01/12 | United States | 595 | — | |||||||||||
f,g,h Caesars Entertainment Operating Co. Inc., Term B-7 Loans, 1.50%, 3/01/17 | United States | 1,110,195 | 1,383,581 | |||||||||||
|
| |||||||||||||
Total Corporate Notes and Senior Floating Rate Interests in Reorganization (Cost $3,171,682) | 2,514,023 | |||||||||||||
|
| |||||||||||||
| Shares | ||||||||||||||
Companies in Liquidation 0.1% | ||||||||||||||
a Adelphia Recovery Trust | United States | 5,379,562 | 3,497 | |||||||||||
a,i Adelphia Recovery Trust, Arahova Contingent Value Vehicle, Contingent Distribution | United States | 386,774 | 39 | |||||||||||
a,i,j Century Communications Corp., Contingent Distribution | United States | 1,074,000 | — | |||||||||||
a,b FIM Coinvestor Holdings I, LLC | United States | 2,077,368 | — | |||||||||||
a,k Lehman Brothers Holdings Inc., Bankruptcy Claim | United States | 17,348,669 | 385,140 | |||||||||||
a,j NewPage Corp., Litigation Trust | United States | 4,854,000 | — | |||||||||||
a,i,j Tribune Media, Litigation Trust, Contingent Distribution | United States | 56,997 | — | |||||||||||
a,j Vistra Energy Corp., Litigation Trust | United States | 11,807,264 | 136,964 | |||||||||||
a Vistra Energy Corp., Litigation Trust, TRA | United States | 199,534 | 214,499 | |||||||||||
|
| |||||||||||||
Total Companies in Liquidation | 740,139 | |||||||||||||
|
| |||||||||||||
| Principal Amount | ||||||||||||||
Municipal Bonds in Reorganization | ||||||||||||||
h Puerto Rico Commonwealth GO, Refunding, Series A, 8.00%, 7/01/35 | United States | $ | 2,261,000 | 1,379,210 | ||||||||||
|
| |||||||||||||
Total Investments before Short Term Investments | 655,533,327 | |||||||||||||
|
| |||||||||||||
| Semiannual Report | MGD-15 |
FRANKLIN TEMPLETON VARIABLE INSURANCE PRODUCTS TRUST
STATEMENT OF INVESTMENTS (UNAUDITED)
Franklin Mutual Global Discovery VIP Fund (continued)
| Country | Principal Amount | Value | ||||||||||||
Short Term Investments 3.9% | ||||||||||||||
U.S. Government and Agency Securities 3.9% | ||||||||||||||
| l FHLB, 7/03/17 | United States | $10,500,000 | $10,500,000 | |||||||||||
l U.S. Treasury Bill, | ||||||||||||||
m 8/17/17 - 8/24/17 | United States | 7,000,000 | 6,991,816 | |||||||||||
7/20/17 - 11/24/17 | United States | 9,000,000 | 8,971,884 | |||||||||||
|
| |||||||||||||
Total U.S. Government and Agency Securities | 26,463,700 | |||||||||||||
|
| |||||||||||||
Senior Floating Rate Interests in Reorganization | ||||||||||||||
f,g,h Avaya Inc., Term B-3 Loan, 7.63%, 10/26/17 | United States | 428,000 | 342,043 | |||||||||||
|
| |||||||||||||
Total Investments (Cost $546,641,509) 99.3% | 682,339,070 | |||||||||||||
Other Assets, less Liabilities 0.7% | 4,878,469 | |||||||||||||
|
| |||||||||||||
Net Assets 100.0% | $ | 687,217,539 | ||||||||||||
|
| |||||||||||||
†Rounds to less than 0.1% of net assets.
aNon-income producing.
bSee Note 8 regarding restricted securities.
cAt June 30, 2017, pursuant to the Fund’s policies and the requirements of applicable securities law, the Fund is restricted from trading these securities at period end.
dSecurity was purchased pursuant to Rule 144A under the Securities Act of 1933 and may be sold in transactions exempt from registration only to qualified institutional buyers or in a public offering registered under the Securities Act of 1933. These securities have been deemed liquid under guidelines approved by the Trust’s Board of Trustees. At June 30, 2017, the aggregate value of these securities was $11,547,770, representing 1.7% of net assets.
eVariable rate security. The rate shown represents the yield at period end.
fThe coupon rate shown represents the rate at period end.
gSee Note 1(f) regarding senior floating rate interests.
hSee Note 7 regarding credit risk and defaulted securities.
iContingent distributions represent the right to receive additional distributions, if any, during the reorganization of the underlying company. Shares represent total underlying principal of debt securities.
jSecurity has been deemed illiquid because it may not be able to be sold within seven days. At June 30, 2017, the aggregate value of these securities was $136,964, representing less than 0.1% of net assets.
kBankruptcy claims represent the right to receive distributions, if any, during the liquidation of the underlying pool of assets. Shares represent amount of allowed unsecured claims.
lThe security was issued on a discount basis with no stated coupon rate.
mA portion or all of the security has been segregated as collateral for open forward contracts. At June 30, 2017, the aggregate value of these securities and/or cash pledged amounted to $2,167,220, representing 0.3% of net assets.
| MGD-16 | Semiannual Report |
FRANKLIN TEMPLETON VARIABLE INSURANCE PRODUCTS TRUST
STATEMENT OF INVESTMENTS (UNAUDITED)
Franklin Mutual Global Discovery VIP Fund (continued)
At June 30, 2017, the Fund had the following futures contracts outstanding. See Note 1(c).
| Futures Contracts | ||||||||||||||||||||||||
| Description | Type | Number of Contracts | Notional Value | Expiration Date | Unrealized Appreciation | Unrealized Depreciation | ||||||||||||||||||
| Currency Contracts | ||||||||||||||||||||||||
EUR/USD | Short | 210 | $ | 30,100,875 | 9/18/17 | $— | $(528,589 | ) | ||||||||||||||||
GBP/USD | Short | 272 | 22,176,500 | 9/18/17 | — | (455,297 | ) | |||||||||||||||||
|
| |||||||||||||||||||||||
Total Futures Contracts |
| $— | $(983,886 | ) | ||||||||||||||||||||
|
| |||||||||||||||||||||||
Net unrealized appreciation (depreciation) |
| $(983,886 | ) | |||||||||||||||||||||
|
| |||||||||||||||||||||||
At June 30, 2017, the Fund had the following forward exchange contracts outstanding. See Note 1(c).
| Forward Exchange Contracts | ||||||||||||||||||||||||||||
| Currency | Counterpartya | Type | Quantity | Contract Amount | Settlement Date | Unrealized Appreciation | Unrealized Depreciation | |||||||||||||||||||||
| OTC Forward Exchange Contracts | ||||||||||||||||||||||||||||
South Korean Won | HSBK | Buy | 260,761,200 | $229,310 | 7/14/17 | $ | — | $ | (1,563 | ) | ||||||||||||||||||
South Korean Won | HSBK | Sell | 1,035,970,475 | 917,153 | 7/14/17 | 12,347 | — | |||||||||||||||||||||
South Korean Won | UBSW | Buy | 476,475,500 | 417,908 | 7/14/17 | — | (1,759 | ) | ||||||||||||||||||||
South Korean Won | UBSW | Sell | 2,528,563,225 | 2,228,965 | 7/14/17 | 20,540 | — | |||||||||||||||||||||
British Pound | SSBT | Buy | 280,000 | 363,504 | 8/14/17 | 1,741 | — | |||||||||||||||||||||
British Pound | SSBT | Sell | 32,778,165 | 41,564,353 | 8/14/17 | — | (1,193,020 | ) | ||||||||||||||||||||
Euro | HSBK | Sell | 27,040,031 | 30,255,686 | 8/18/17 | — | (712,169 | ) | ||||||||||||||||||||
Euro | SSBT | Sell | 27,040,046 | 30,247,671 | 8/18/17 | — | (720,200 | ) | ||||||||||||||||||||
Japanese Yen | UBSW | Sell | 329,365,603 | 2,968,790 | 8/28/17 | 33,214 | — | |||||||||||||||||||||
|
| |||||||||||||||||||||||||||
Total Forward Exchange Contracts |
| $ | 67,842 | $ | (2,628,711 | ) | ||||||||||||||||||||||
|
| |||||||||||||||||||||||||||
Net unrealized appreciation (depreciation) |
| $ | (2,560,869 | ) | ||||||||||||||||||||||||
|
| |||||||||||||||||||||||||||
aMay be comprised of multiple contracts with the same counterparty, currency and settlement date.
See Abbreviations on page MGD-32.
| The accompanying notes are an integral part of these financial statements. | Semiannual Report | MGD-17 |
FRANKLIN TEMPLETON VARIABLE INSURANCE PRODUCTS TRUST
Financial Statements
Statement of Assets and Liabilities
June 30, 2017 (unaudited)
| Franklin Mutual Global Discovery VIP Fund | ||||
Assets: | ||||
Investments in securities: | ||||
Cost - Unaffiliated issuers | $ | 546,641,509 | ||
|
| |||
Value - Unaffiliated issuers | $ | 682,339,070 | ||
Cash | 69,944 | |||
Foreign currency, at value (cost $2,410,931) | 2,411,245 | |||
Receivables: | ||||
Investment securities sold | 3,236,626 | |||
Capital shares sold | 72,010 | |||
Dividends and interest | 2,656,633 | |||
European Union tax reclaims | 293,821 | |||
Due from brokers | 1,056,090 | |||
Unrealized appreciation on OTC forward exchange contracts | 67,842 | |||
Other assets | 97,205 | |||
|
| |||
Total assets | 692,300,486 | |||
|
| |||
Liabilities: | ||||
Payables: | ||||
Investment securities purchased | 1,432,310 | |||
Capital shares redeemed | 106,659 | |||
Management fees | 530,886 | |||
Distribution fees | 295,111 | |||
Variation margin | 4,587 | |||
Unrealized depreciation on OTC forward exchange contracts | 2,628,711 | |||
Accrued expenses and other liabilities | 84,683 | |||
|
| |||
Total liabilities | 5,082,947 | |||
|
| |||
Net assets, at value | $ | 687,217,539 | ||
|
| |||
Net assets consist of: | ||||
Paid-in capital | $ | 493,808,371 | ||
Undistributed net investment income | 18,603,002 | |||
Net unrealized appreciation (depreciation) | 132,174,674 | |||
Accumulated net realized gain (loss) | 42,631,492 | |||
|
| |||
Net assets, at value | $ | 687,217,539 | ||
|
| |||
| Class 1: | ||||
Net assets, at value | $ | 3,271,106 | ||
|
| |||
Shares outstanding | 152,663 | |||
|
| |||
Net asset value and maximum offering price per share | $ | 21.43 | ||
|
| |||
| Class 2: | ||||
Net assets, at value | $ | 640,101,598 | ||
|
| |||
Shares outstanding | 30,716,058 | |||
|
| |||
Net asset value and maximum offering price per share | $ | 20.84 | ||
|
| |||
| Class 4: | ||||
Net assets, at value | $ | 43,844,835 | ||
|
| |||
Shares outstanding | 2,070,083 | |||
|
| |||
Net asset value and maximum offering price per share | $ | 21.18 | ||
|
| |||
| MGD-18 | Semiannual Report | The accompanying notes are an integral part of these financial statements. |
FRANKLIN TEMPLETON VARIABLE INSURANCE PRODUCTS TRUST
FINANCIAL STATEMENTS
Statement of Operations
for the six months ended June 30, 2017 (unaudited)
| Franklin Mutual Global Discovery VIP Fund | ||||
Investment income: | ||||
Dividends (net of foreign taxes of $618,962) | $ | 9,534,607 | ||
Interest | 1,483,780 | |||
Income from securities loaned (net of fees and rebates) | 496,876 | |||
|
| |||
Total investment income. | 11,515,263 | |||
|
| |||
Expenses: | ||||
Management fees (Note 3a) | 3,218,192 | |||
Distribution fees: (Note 3c) | ||||
Class 2 | 796,526 | |||
Class 4 | 78,158 | |||
Custodian fees (Note 4) | 12,069 | |||
Reports to shareholders | 68,940 | |||
Professional fees | 68,612 | |||
Trustees’ fees and expenses | 1,532 | |||
Other. | 17,393 | |||
|
| |||
Total expenses | 4,261,422 | |||
Expense reductions (Note 4) | (410 | ) | ||
Expenses waived/paid by affiliates (Note 3e) | (5,592 | ) | ||
|
| |||
Net expenses | 4,255,420 | |||
|
| |||
Net investment income | 7,259,843 | |||
|
| |||
Realized and unrealized gains (losses): | ||||
Net realized gain (loss) from: | ||||
Investments | 12,716,426 | |||
Foreign currency transactions | (3,825,440 | ) | ||
Futures contracts | (1,574,124 | ) | ||
Securities sold short | (62,176 | ) | ||
|
| |||
Net realized gain (loss) | 7,254,686 | |||
|
| |||
Net change in unrealized appreciation (depreciation) on: | ||||
Investments | 28,538,897 | |||
Translation of other assets and liabilities denominated in foreign currencies | (2,507,987 | ) | ||
Futures contracts | (1,559,330 | ) | ||
|
| |||
Net change in unrealized appreciation (depreciation) | 24,471,580 | |||
|
| |||
Net realized and unrealized gain (loss) | 31,726,266 | |||
|
| |||
Net increase (decrease) in net assets resulting from operations | $ | 38,986,109 | ||
|
| |||
| The accompanying notes are an integral part of these financial statements. | Semiannual Report | MGD-19 |
FRANKLIN TEMPLETON VARIABLE INSURANCE PRODUCTS TRUST
FINANCIAL STATEMENTS
Statements of Changes in Net Assets
| Franklin Mutual Global Discovery VIP Fund | ||||||||
Six Months Ended June 30, 2017 (unaudited) | Year Ended December 31, | |||||||
Increase (decrease) in net assets: | ||||||||
Operations: | ||||||||
Net investment income | $ | 7,259,843 | $12,072,848 | |||||
Net realized gain (loss) | 7,254,686 | 38,874,630 | ||||||
Net change in unrealized appreciation (depreciation) | 24,471,580 | 23,661,183 | ||||||
|
| |||||||
Net increase (decrease) in net assets resulting from operations | 38,986,109 | 74,608,661 | ||||||
|
| |||||||
Distributions to shareholders from: | ||||||||
Net investment income: | ||||||||
Class 1 | — | (54,304 | ) | |||||
Class 2 | — | (10,085,440 | ) | |||||
Class 4 | — | (662,593 | ) | |||||
Net realized gains: | ||||||||
Class 1 | — | (220,428 | ) | |||||
Class 2 | — | (47,823,620 | ) | |||||
Class 4 | — | (3,482,606 | ) | |||||
|
| |||||||
Total distributions to shareholders | — | (62,328,991 | ) | |||||
|
| |||||||
Capital share transactions: (Note 2) | ||||||||
Class 1 | 2,912 | 377,199 | ||||||
Class 2 | (26,557,034 | ) | (10,255,413 | ) | ||||
Class 4 | (3,957,289 | ) | (4,711,238 | ) | ||||
|
| |||||||
Total capital share transactions | (30,511,411 | ) | (14,589,452 | ) | ||||
|
| |||||||
Net increase (decrease) in net assets | 8,474,698 | (2,309,782 | ) | |||||
Net assets: | ||||||||
Beginning of period | 678,742,841 | 681,052,623 | ||||||
|
| |||||||
End of period | $ | 687,217,539 | $678,742,841 | |||||
|
| |||||||
Undistributed net investment income included in net assets: | ||||||||
End of period | $ | 18,603,002 | $11,343,159 | |||||
|
| |||||||
| MGD-20 | Semiannual Report | The accompanying notes are an integral part of these financial statements. |
FRANKLIN TEMPLETON VARIABLE INSURANCE PRODUCTS TRUST
Notes to Financial Statements (unaudited)
Franklin Mutual Global Discovery VIP Fund
1. Organization and Significant Accounting Policies
Franklin Templeton Variable Insurance Products Trust (Trust) is registered under the Investment Company Act of 1940 (1940 Act) as an open-end management investment company, consisting of eighteen separate funds and applies the specialized accounting and reporting guidance in U.S. Generally Accepted Accounting Principles (U.S. GAAP). Franklin Mutual Global Discovery VIP Fund (Fund) is included in this report. Shares of the Fund are generally sold only to insurance company separate accounts to fund the benefits of variable life insurance policies or variable annuity contracts. At June 30, 2017, 49.2% of the Fund’s shares were held through one insurance company. Investment activities of these insurance company separate accounts could have a material impact on the Fund. The Fund offers three classes of shares: Class 1, Class 2 and Class 4. Each class of shares may differ by its distribution fees, voting rights on matters affecting a single class and its exchange privilege.
The following summarizes the Fund’s significant accounting policies.
a. Financial Instrument Valuation
The Fund’s investments in financial instruments are carried at fair value daily. Fair value is the price that would be received to sell an asset or paid to transfer a liability in an orderly transaction between market participants on the measurement date. The Fund calculates the net asset value (NAV) per share as of 4 p.m. Eastern time each day the New York Stock Exchange (NYSE) is open for trading. Under compliance policies and procedures approved by the Trust’s Board of Trustees (the Board), the Fund’s administrator has responsibility for oversight of valuation, including leading the cross-functional Valuation Committee (VC). The VC provides administration and oversight of the Fund’s valuation policies and procedures, which are approved annually by the Board. Among other things, these procedures allow the Fund to utilize independent pricing services, quotations from securities and financial instrument dealers, and other market sources to determine fair value.
Equity securities and derivative financial instruments listed on an exchange or on the NASDAQ National Market System are valued at the last quoted sale price or the official closing price of the day, respectively. Foreign equity securities are valued as of the close of trading on the foreign stock exchange on which the security is primarily traded, or as of 4 p.m. Eastern time.
The value is then converted into its U.S. dollar equivalent at the foreign exchange rate in effect at 4 p.m. Eastern time on the day that the value of the security is determined. Over-the-counter (OTC) securities are valued within the range of the most recent quoted bid and ask prices. Securities that trade in multiple markets or on multiple exchanges are valued according to the broadest and most representative market. Certain equity securities are valued based upon fundamental characteristics or relationships to similar securities.
Debt securities generally trade in the OTC market rather than on a securities exchange. The Fund’s pricing services use multiple valuation techniques to determine fair value. In instances where sufficient market activity exists, the pricing services may utilize a market-based approach through which quotes from market makers are used to determine fair value. In instances where sufficient market activity may not exist or is limited, the pricing services also utilize proprietary valuation models which may consider market characteristics such as benchmark yield curves, credit spreads, estimated default rates, anticipated market interest rate volatility, coupon rates, anticipated timing of principal repayments, underlying collateral, and other unique security features in order to estimate the relevant cash flows, which are then discounted to calculate the fair value. Securities denominated in a foreign currency are converted into their U.S. dollar equivalent at the foreign exchange rate in effect at 4 p.m. Eastern time on the date that the values of the foreign debt securities are determined.
Certain derivative financial instruments trade in the OTC market. The Fund’s pricing services use various techniques including industry standard option pricing models and proprietary discounted cash flow models to determine the fair value of those instruments. The Fund’s net benefit or obligation under the derivative contract, as measured by the fair value of the contract, is included in net assets.
The Fund has procedures to determine the fair value of financial instruments for which market prices are not reliable or readily available. Under these procedures, the VC convenes on a regular basis to review such financial instruments and considers a number of factors, including significant unobservable valuation inputs, when arriving at fair value. The VC primarily employs a market-based approach which may use related or comparable assets or liabilities, recent transactions, market multiples, book values, and other relevant information for the investment to determine the fair value of the investment. An income-based valuation approach may also be used in which the
| Semiannual Report | MGD-21 |
FRANKLIN TEMPLETON VARIABLE INSURANCE PRODUCTS TRUST
NOTES TO FINANCIAL STATEMENTS (UNAUDITED)
Franklin Mutual Global Discovery VIP Fund (continued)
1. Organization and Significant Accounting Policies (continued)
a. Financial Instrument Valuation (continued)
anticipated future cash flows of the investment are discounted to calculate fair value. Discounts may also be applied due to the nature or duration of any restrictions on the disposition of the investments. Due to the inherent uncertainty of valuations of such investments, the fair values may differ significantly from the values that would have been used had an active market existed. The VC employs various methods for calibrating these valuation approaches including a regular review of key inputs and assumptions, transactional back-testing or disposition analysis, and reviews of any related market activity.
Trading in securities on foreign securities stock exchanges and OTC markets may be completed before 4 p.m. Eastern time. In addition, trading in certain foreign markets may not take place on every Fund’s business day. Occasionally, events occur between the time at which trading in a foreign security is completed and 4 p.m. Eastern time that might call into question the reliability of the value of a portfolio security held by the Fund. As a result, differences may arise between the value of the Fund’s portfolio securities as determined at the foreign market close and the latest indications of value at 4 p.m. Eastern time. In order to minimize the potential for these differences, the VC monitors price movements following the close of trading in foreign stock markets through a series of country specific market proxies (such as baskets of American Depositary Receipts, futures contracts and exchange traded funds). These price movements are measured against established trigger thresholds for each specific market proxy to assist in determining if an event has occurred that may call into question the reliability of the values of the foreign securities held by the Fund. If such an event occurs, the securities may be valued using fair value procedures, which may include the use of independent pricing services.
When the last day of the reporting period is a non-business day, certain foreign markets may be open on those days that the Fund’s NAV is not calculated, which could result in differences between the value of the Fund’s portfolio securities on the last business day and the last calendar day of the reporting period. Any significant security valuation changes due to an open foreign market are adjusted and reflected by the Fund for financial reporting purposes.
b. Foreign Currency Translation
Portfolio securities and other assets and liabilities denominated in foreign currencies are translated into U.S. dollars based on the exchange rate of such currencies against U.S. dollars on the date of valuation. The Fund may enter into foreign currency exchange contracts to facilitate transactions denominated in a foreign currency. Purchases and sales of securities, income and expense items denominated in foreign currencies are translated into U.S. dollars at the exchange rate in effect on the transaction date. Portfolio securities and assets and liabilities denominated in foreign currencies contain risks that those currencies will decline in value relative to the U.S. dollar. Occasionally, events may impact the availability or reliability of foreign exchange rates used to convert the U.S. dollar equivalent value. If such an event occurs, the foreign exchange rate will be valued at fair value using procedures established and approved by the Board.
The Fund does not separately report the effect of changes in foreign exchange rates from changes in market prices on securities held. Such changes are included in net realized and unrealized gain or loss from investments in the Statement of Operations.
Realized foreign exchange gains or losses arise from sales of foreign currencies, currency gains or losses realized between the trade and settlement dates on securities transactions and the difference between the recorded amounts of dividends, interest, and foreign withholding taxes and the U.S. dollar equivalent of the amounts actually received or paid. Net unrealized foreign exchange gains and losses arise from changes in foreign exchange rates on foreign denominated assets and liabilities other than investments in securities held at the end of the reporting period.
c. Derivative Financial Instruments
The Fund invested in derivative financial instruments in order to manage risk or gain exposure to various other investments or markets. Derivatives are financial contracts based on an underlying or notional amount, require no initial investment or an initial net investment that is smaller than would normally be required to have a similar response to changes in market factors, and require or permit net settlement. Derivatives contain various risks including the potential inability of the counterparty to fulfill their obligations under the terms of the contract, the potential for an illiquid secondary market, and/or the potential for market movements which expose the Fund to gains or losses in excess of the amounts shown in the Statement of Assets and
| MGD-22 | Semiannual Report |
FRANKLIN TEMPLETON VARIABLE INSURANCE PRODUCTS TRUST
NOTES TO FINANCIAL STATEMENTS (UNAUDITED)
Franklin Mutual Global Discovery VIP Fund (continued)
Liabilities. Realized gain and loss and unrealized appreciation and depreciation on these contracts for the period are included in the Statement of Operations.
Derivative counterparty credit risk is managed through a formal evaluation of the creditworthiness of all potential counter-parties. The Fund attempts to reduce its exposure to counterparty credit risk on OTC derivatives, whenever possible, by entering into International Swaps and Derivatives Association (ISDA) master agreements with certain counterparties. These agreements contain various provisions, including but not limited to collateral requirements, events of default, or early termination. Termination events applicable to the counterparty include certain deteriorations in the credit quality of the counterparty. Termination events applicable to the Fund include failure of the Fund to maintain certain net asset levels and/or limit the decline in net assets over various periods of time. In the event of default or early termination, the ISDA master agreement gives the non-defaulting party the right to net and close-out all transactions traded, whether or not arising under the ISDA agreement, to one net amount payable by one counterparty to the other. However, absent an event of default or early termination, OTC derivative assets and liabilities are presented gross and not offset in the Statement of Assets and Liabilities. Early termination by the counterparty may result in an immediate payment by the Fund of any net liability owed to that counterparty under the ISDA agreement. At June 30, 2017, the Fund had OTC derivatives in a net liability position of $2,612,864 and the aggregate value of collateral pledged for such contracts was $2,167,220.
Collateral requirements differ by type of derivative. Collateral or initial margin requirements are set by the broker or exchange clearing house for exchange traded and centrally cleared derivatives. Initial margin deposited is held at the exchange and can be in the form of cash and/or securities. For OTC derivatives traded under an ISDA master agreement, posting of collateral is required by either the Fund or the applicable counterparty if the total net exposure of all OTC derivatives with the applicable counterparty exceeds the minimum transfer amount, which typically ranges from $100,000 to $250,000, and can vary depending on the counterparty and the type of the agreement. Generally, collateral is determined at the close of Fund business each day and any additional collateral required due to changes in derivative values may be delivered by the Fund or the counterparty the next business day, or within a few business days. Collateral pledged and/or received by the Fund
for OTC derivatives, if any, is held in segregated accounts with the Fund’s custodian/counterparty broker and can be in the form of cash and/or securities. Unrestricted cash may be invested according to the Fund’s investment objectives. To the extent that the amounts due to the Fund from its counterparties are not subject to collateralization or are not fully collateralized, the Fund bears the risk of loss from counterparty non-performance.
The Fund entered into exchange traded futures contracts primarily to manage exposure to certain foreign currencies. A futures contract is an agreement between the Fund and a counterparty to buy or sell an asset at a specified price on a future date. Required initial margins are pledged by the Fund, and the daily change in fair value is accounted for as a variation margin payable or receivable in the Statement of Assets and Liabilities.
The Fund entered into OTC forward exchange contracts primarily to manage exposure to certain foreign currencies. A forward exchange contract is an agreement between the Fund and a counterparty to buy or sell a foreign currency at a specific exchange rate on a future date.
See Note 9 regarding other derivative information.
d. Securities Sold Short
The Fund is engaged in selling securities short, which obligates the Fund to replace a borrowed security with the same security at current fair value. The Fund incurs a loss if the price of the security increases between the date of the short sale and the date on which the Fund replaces the borrowed security. The Fund realizes a gain if the price of the security declines between those dates. Gains are limited to the price at which the Fund sold the security short, while losses are potentially unlimited in size.
The Fund is required to establish a margin account with the broker lending the security sold short. While the short sale is outstanding, the broker retains the proceeds of the short sale to the extent necessary to meet margin requirements until the short position is closed out. A deposit must also be maintained with the Fund’s custodian/counterparty broker consisting of cash and/or securities having a value equal to a specified percentage of the value of the securities sold short. The Fund is obligated to pay fees for borrowing the securities sold short and is required to pay the counterparty any dividends and/or interest due on securities sold short. Such dividends and/or interest and any security borrowing fees are recorded as an expense to the Fund. At June 30, 2017, the Fund had no securities sold short.
| Semiannual Report | MGD-23 |
FRANKLIN TEMPLETON VARIABLE INSURANCE PRODUCTS TRUST
NOTES TO FINANCIAL STATEMENTS (UNAUDITED)
Franklin Mutual Global Discovery VIP Fund (continued)
1. Organization and Significant Accounting Policies (continued)
e. Securities Lending
The Fund participates in an agency based securities lending program to earn additional income. The Fund receives cash collateral against the loaned securities in an amount equal to at least 102% of the fair value of the loaned securities. Collateral is maintained over the life of the loan in an amount not less than 100% of the fair value of loaned securities, as determined at the close of Fund business each day; any additional collateral required due to changes in security values is delivered to the Fund on the next business day. The collateral is deposited into a joint cash account with other funds and is used to invest in a money market fund managed by Franklin Advisers, Inc., an affiliate of the Fund, and/or a joint repurchase agreement. The Fund may receive income from the investment of cash collateral, in addition to lending fees and rebates paid by the borrower. Income from securities loaned, net of fees paid to the securities lending agent and/or third-party vendor, is reported separately in the Statement of Operations. The Fund bears the market risk with respect to the collateral investment, securities loaned, and the risk that the agent may default on its obligations to the Fund. If the borrower defaults on its obligation to return the securities loaned, the Fund has the right to repurchase the securities in the open market using the collateral received. The securities lending agent has agreed to indemnify the Fund in the event of default by a third party borrower. At June 30, 2017, the Fund had no securities on loan.
f. Senior Floating Rate Interests
The Fund invests in senior secured corporate loans that pay interest at rates which are periodically reset by reference to a base lending rate plus a spread. These base lending rates are generally the prime rate offered by a designated U.S. bank or the London InterBank Offered Rate (LIBOR). Senior secured corporate loans often require prepayment of principal from excess cash flows or at the discretion of the borrower. As a result, actual maturity may be substantially less than the stated maturity. Senior secured corporate loans in which the Fund invests are generally readily marketable, but may be subject to certain restrictions on resale.
g. Income and Deferred Taxes
It is the Fund’s policy to qualify as a regulated investment company under the Internal Revenue Code. The Fund intends to distribute to shareholders substantially all of its taxable income
and net realized gains to relieve it from federal income and if applicable, excise taxes. As a result, no provision for U.S. federal income taxes is required.
The Fund may be subject to foreign taxation related to income received, capital gains on the sale of securities and certain foreign currency transactions in the foreign jurisdictions in which it invests. Foreign taxes, if any, are recorded based on the tax regulations and rates that exist in the foreign markets in which the Fund invests. When a capital gain tax is determined to apply, the Fund records an estimated deferred tax liability in an amount that would be payable if the securities were disposed of on the valuation date. As a result of several court cases, in certain countries across the European Union, the Fund filed additional tax reclaims for previously withheld taxes on dividends earned in those countries (EU reclaims). These additional filings are subject to various administrative proceedings by the local jurisdictions’ tax authorities within the European Union, as well as a number of related judicial proceedings. Income recognized, if any, for EU reclaims is reflected as other income in the Statement of Operations and any related receivable, if any, is reflected as European Union tax reclaims in the Statement of Assets and Liabilities. When uncertainty exists as to the ultimate resolution of these proceedings, the likelihood of receipt of these EU reclaims, and the potential timing of payment, no amounts are reflected in the financial statements. For U.S. income tax purposes, EU reclaims received by the Fund and the Fund previously passed foreign tax credit on to its shareholders, the Fund must either amend historic tax reporting to shareholders or enter into a closing agreement with the Internal Revenue Service (IRS) in order to pay the associated tax liability on behalf of the Fund’s shareholders.
The Fund may recognize an income tax liability related to its uncertain tax positions under U.S. GAAP when the uncertain tax position has a less than 50% probability that it will be sustained upon examination by the tax authorities based on its technical merits. As of June 30, 2017, the Fund has determined that no tax liability is required in its financial statements related to uncertain tax positions for any open tax years (or expected to be taken in future tax years). Open tax years are those that remain subject to examination and are based on each tax jurisdiction’s statute of limitation.
| MGD-24 | Semiannual Report |
FRANKLIN TEMPLETON VARIABLE INSURANCE PRODUCTS TRUST
NOTES TO FINANCIAL STATEMENTS (UNAUDITED)
Franklin Mutual Global Discovery VIP Fund (continued)
h. Security Transactions, Investment Income, Expenses and Distributions
Security transactions are accounted for on trade date. Realized gains and losses on security transactions are determined on a specific identification basis. Interest income and estimated expenses are accrued daily. Amortization of premium and accretion of discount on debt securities are included in interest income. Dividend income is recorded on the ex-dividend date except for certain dividends from securities where the dividend rate is not available. In such cases, the dividend is recorded as soon as the information is received by the Fund. Distributions to shareholders are recorded on the ex-dividend date. Distributable earnings are determined according to income tax regulations (tax basis) and may differ from earnings recorded in accordance with U.S. GAAP. These differences may be permanent or temporary. Permanent differences are reclassified among capital accounts to reflect their tax character. These reclassifications have no impact on net assets or the results of operations. Temporary differences are not reclassified, as they may reverse in subsequent periods.
Common expenses incurred by the Trust are allocated among the Funds based on the ratio of net assets of each Fund to the combined net assets of the Trust. Fund specific expenses are charged directly to the Fund that incurred the expense.
Realized and unrealized gains and losses and net investment income, not including class specific expenses, are allocated daily to each class of shares based upon the relative proportion
of net assets of each class. Differences in per share distributions, by class, are generally due to differences in class specific expenses.
i. Accounting Estimates
The preparation of financial statements in accordance with U.S. GAAP requires management to make estimates and assumptions that affect the reported amounts of assets and liabilities at the date of the financial statements and the amounts of income and expenses during the reporting period. Actual results could differ from those estimates.
j. Guarantees and Indemnifications
Under the Trust’s organizational documents, its officers and trustees are indemnified by the Trust against certain liabilities arising out of the performance of their duties to the Trust. Additionally, in the normal course of business, the Trust, on behalf of the Fund, enters into contracts with service providers that contain general indemnification clauses. The Trust’s maximum exposure under these arrangements is unknown as this would involve future claims that may be made against the Trust that have not yet occurred. Currently, the Trust expects the risk of loss to be remote.
2. Shares of Beneficial Interest
At June 30, 2017, there were an unlimited number of shares authorized (without par value). Transactions in the Fund’s shares were as follows:
| Six Months Ended June 30, 2017 | Year Ended December 31, 2016 | |||||||||||||||||||
| Shares | Amount | Shares | Amount | |||||||||||||||||
| Class 1 Shares: | ||||||||||||||||||||
Shares sold | 10,515 | $ | 220,655 | 23,387 | $ | 453,227 | ||||||||||||||
Shares issued in reinvestment of distributions | — | — | 14,414 | 274,732 | ||||||||||||||||
Shares redeemed | (10,367 | ) | (217,743 | ) | (17,886 | ) | (350,760 | ) | ||||||||||||
|
| |||||||||||||||||||
Net increase (decrease) | 148 | $ | 2,912 | 19,915 | $ | 377,199 | ||||||||||||||
|
| |||||||||||||||||||
| Class 2 Shares: | ||||||||||||||||||||
Shares sold | 1,014,724 | $ | 20,703,140 | 1,329,879 | $ | 25,305,228 | ||||||||||||||
Shares issued in reinvestment of distributions | — | �� | — | 3,118,420 | 57,909,060 | |||||||||||||||
Shares redeemed | (2,311,605 | ) | (47,260,174 | ) | (4,923,922 | ) | (93,469,701 | ) | ||||||||||||
|
| |||||||||||||||||||
Net increase (decrease) | (1,296,881 | ) | $ | (26,557,034 | ) | (475,623 | ) | $ | (10,255,413 | ) | ||||||||||
|
| |||||||||||||||||||
| Semiannual Report | MGD-25 |
FRANKLIN TEMPLETON VARIABLE INSURANCE PRODUCTS TRUST
NOTES TO FINANCIAL STATEMENTS (UNAUDITED)
Franklin Mutual Global Discovery VIP Fund (continued)
2. Shares of Beneficial Interest (continued)
| Six Months Ended June 30, 2017 | Year Ended December 31, 2016 | |||||||||||||||||||
| Shares | Amount | Shares | Amount | |||||||||||||||||
| Class 4 Shares: | ||||||||||||||||||||
Shares sold | 52,602 | $ | 1,098,508 | 108,847 | $ | 2,055,482 | ||||||||||||||
Shares issued in reinvestment of distributions | — | — | 219,439 | 4,145,199 | ||||||||||||||||
Shares redeemed | (242,907 | ) | (5,055,797 | ) | (563,526 | ) | (10,911,919 | ) | ||||||||||||
|
| |||||||||||||||||||
Net increase (decrease) | (190,305 | ) | $ | (3,957,289 | ) | (235,240 | ) | $ | (4,711,238 | ) | ||||||||||
|
| |||||||||||||||||||
3. Transactions with Affiliates
Franklin Resources, Inc. is the holding company for various subsidiaries that together are referred to as Franklin Templeton Investments. Certain officers and trustees of the Fund are also officers and/or directors of the following subsidiaries:
| Subsidiary | Affiliation | |
Franklin Mutual Advisers, LLC (Franklin Mutual) | Investment manager | |
Franklin Templeton Services, LLC (FT Services) | Administrative manager | |
Franklin Templeton Distributors, Inc. (Distributors) | Principal underwriter | |
Franklin Templeton Investor Services, LLC (Investor Services) | Transfer agent |
a. Management Fees
The Fund pays an investment management fee to Franklin Mutual based on the average daily net assets of the Fund as follows:
| Annualized Fee Rate | Net Assets | |
0.950% | Up to and including $200 million | |
0.935% | Over $200 million, up to and including $700 million | |
0.900% | Over $700 million, up to and including $1.2 billion | |
0.875% | Over $1.2 billion, up to and including $4 billion | |
0.845% | Over $4 billion, up to and including $7 billion | |
0.825% | Over $7 billion, up to and including $10 billion | |
0.805% | In excess of $10 billion |
For the period ended June 30, 2017, the annualized effective investment management fee rate was 0.939% of the Fund’s average daily net assets.
b. Administrative Fees
Under an agreement with Franklin Mutual, FT Services provides administrative services to the Fund. The fee is paid by Franklin Mutual based on the Fund’s average daily net assets, and is not an additional expense of the Fund.
c. Distribution Fees
The Board has adopted distribution plans for Class 2 and Class 4 shares pursuant to Rule 12b-1 under the 1940 Act. Under the Fund’s compensation distribution plans, the Fund pays Distributors for costs incurred in connection with the servicing, sale and distribution of the Fund’s shares up to 0.35% per year of its average daily net assets of each class. The Board has agreed to limit the current rate to 0.25% per year for Class 2. The plan year, for purposes of monitoring compliance with the maximum annual plan rates, is February 1 through January 31.
| MGD-26 | Semiannual Report |
FRANKLIN TEMPLETON VARIABLE INSURANCE PRODUCTS TRUST
NOTES TO FINANCIAL STATEMENTS (UNAUDITED)
Franklin Mutual Global Discovery VIP Fund (continued)
d. Transfer Agent Fees
Investor Services, under terms of an agreement, performs shareholder servicing for the Fund and is not paid by the Fund for the services.
e. Investments in Affiliated Management Investment Companies
The Fund invests in one or more affiliated management investment companies for purposes other than exercising a controlling influence over the management or policies. Management fees paid by the Fund are waived on assets invested in the affiliated management investment companies, as noted in the Statement of Operations, in an amount not to exceed the management and administrative fees paid directly or indirectly by each affiliate. During the period ended June 30, 2017, the Fund held investments in affiliated management investment companies as follows:
| Number of Shares Held at Beginning of Period | Gross Additions | Gross Reductions | Number of Shares Held at End of Period | Value at End of Period | Investment Income | Realized Gain (Loss) | %of Affiliated Fund Shares Outstanding Held at End of Period | |||||||||||||||||||||||||
| Non-Controlled Affiliates | ||||||||||||||||||||||||||||||||
Institutional Fiduciary Trust Money Market Portfolio, 0.58% | — | 53,818,000 | (53,818,000 | ) | — | $ — | $ — | $ — | — | |||||||||||||||||||||||
|
| |||||||||||||||||||||||||||||||
4. Expense Offset Arrangement
The Fund has entered into an arrangement with its custodian whereby credits realized as a result of uninvested cash balances are used to reduce a portion of the Fund’s custodian expenses. During the period ended June 30, 2017, the custodian fees were reduced as noted in the Statement of Operations.
5. Income Taxes
At June 30, 2017, the cost of investments and net unrealized appreciation (depreciation) for income tax purposes were as follows:
Cost of investments | $546,784,806 | |||
|
| |||
Unrealized appreciation | $179,132,282 | |||
Unrealized depreciation | (43,578,018 | ) | ||
|
| |||
Net unrealized appreciation (depreciation) | $135,554,264 | |||
|
|
Differences between income and/or capital gains as determined on a book basis and a tax basis are primarily due to differing treatments of foreign currency transactions.
6. Investment Transactions
Purchases and sales of investments (excluding short term securities and securities sold short) for the period ended June 30, 2017, aggregated $65,403,589 and $74,914,385, respectively.
7. Credit Risk and Defaulted Securities
The Fund may purchase the pre-default or defaulted debt of distressed companies. Distressed companies are financially troubled and could be or are already involved in financial restructuring or bankruptcy. Risks associated with purchasing these securities include the possibility that the bankruptcy or other restructuring process takes longer than expected, or that distributions in restructuring are
| Semiannual Report | MGD-27 |
FRANKLIN TEMPLETON VARIABLE INSURANCE PRODUCTS TRUST
NOTES TO FINANCIAL STATEMENTS (UNAUDITED)
Franklin Mutual Global Discovery VIP Fund (continued)
7. Credit Risk and Defaulted Securities (continued)
less than anticipated, either or both of which may result in unfavorable consequences to the Fund. If it becomes probable that the income on debt securities, including those of distressed companies, will not be collected, the Fund discontinues accruing income and recognizes an adjustment for uncollectible interest.
At June 30, 2017, the aggregate long value of distressed company securities for which interest recognition has been discontinued was $4,235,276, representing 0.6% of the Fund’s net assets. For information as to specific securities, see the accompanying Statement of Investments.
8. Restricted Securities
The Fund invests in securities that are restricted under the Securities Act of 1933 (1933 Act) or which are subject to legal, contractual, or other agreed upon restrictions on resale. Restricted securities are often purchased in private placement transactions, and cannot be sold without prior registration unless the sale is pursuant to an exemption under the 1933 Act. Disposal of these securities may require greater effort and expense, and prompt sale at an acceptable price may be difficult. The Fund may have registration rights for restricted securities. The issuer generally incurs all registration costs.
At June 30, 2017, investments in restricted securities, excluding certain securities exempt from registration under the 1933 Act deemed to be liquid, were as follows:
| Principal Amount/ Shares/ Units | Issuer | Acquisition Date | Cost | Value | ||||||||||
| 595 | Broadband Ventures III LLC, secured promissory note, 5.00%, 2/01/12 | 7/01/10 - 11/30/12 | $ | 595 | $ | — | ||||||||
| 2,077,368 | FIM Coinvestor Holdings I, LLC | 11/20/06 - 6/02/09 | — | — | ||||||||||
| 1,775,736 | Hightower Holding LLC, B, Series II | 6/10/10 - 5/10/12 | 5,430,000 | 5,533,549 | ||||||||||
| 424,073 | International Automotive Components Group Brazil LLC. | 4/13/06 - 12/26/08 | 281,629 | 10,372 | ||||||||||
| 4,052,916 | International Automotive Components Group North America LLC. | 1/12/06 - 3/18/13 | 3,247,714 | 2,494,635 | ||||||||||
| 54,024 | Warrior Met Coal Inc. | 3/31/16 - 6/23/16 | 309,924 | 883,779 | ||||||||||
|
| |||||||||||||
Total Restricted Securities(Value is 1.3% of Net Assets) | $ | 9,269,862 | $ | 8,922,335 | ||||||||||
|
| |||||||||||||
9. Other Derivative Information
At June 30, 2017, the Fund’s investments in derivative contracts are reflected in the Statement of Assets and Liabilities as follows:
Asset Derivatives | Liability Derivatives | |||||||||||
Derivative Contracts Not Accounted for as Hedging Instruments | Statement of Assets and Liabilities Location | Fair Value | Statement of Assets and Liabilities Location | Fair Value | ||||||||
Foreign exchange contracts | Variation margin | $983,886 | a | |||||||||
| Unrealized appreciation on OTC forward exchange contracts | $67,842 | Unrealized depreciation on OTC forward exchange contracts | 2,628,711 | |||||||||
|
|
|
| |||||||||
Totals | $67,842 | $3,612,597 | ||||||||||
|
|
|
| |||||||||
aThis amount reflects the cumulative appreciation (depreciation) of futures contracts as reported in the Statement of Investments. Only the variation margin receivable/ payable at period end is separately reported within the Statement of Assets and Liabilities. Prior variation margin movements were recorded to cash upon receipt or payment.
| MGD-28 | Semiannual Report |
FRANKLIN TEMPLETON VARIABLE INSURANCE PRODUCTS TRUST
NOTES TO FINANCIAL STATEMENTS (UNAUDITED)
Franklin Mutual Global Discovery VIP Fund (continued)
For the period ended June 30, 2017, the effect of derivative contracts in the Fund’s Statement of Operations was as follows:
| Derivative Contracts Not Accounted for as Hedging Instruments | Statement of Operations Location | Net Realized Gain (Loss) for the Period | Statement of Operations Location | Net Change in Appreciation | ||||||||
| Net realized gain (loss) from: | Net change in unrealized appreciation (depreciation) on: | |||||||||||
Foreign exchange contracts | Foreign currency transactions | $(3,853,581 | )a | Translation of other assets and liabilities denominated in foreign currencies | $(2,564,897 | )a | ||||||
| Futures contracts | (1,574,124 | ) | Futures contracts | (1,559,330 | ) | |||||||
|
|
|
| |||||||||
Totals | $(5,427,705 | ) | $(4,124,227 | ) | ||||||||
|
|
|
| |||||||||
aForward exchange contracts are included in net realized gain (loss) from foreign currency transactions and net change in unrealized appreciation (depreciation) on translation of other assets and liabilities denominated in foreign currencies in the Statement of Operations.
For the period ended June 30, 2017, the average month end notional amount of futures contracts represented $50,148,120. The average month end contract value of forward exchange contracts was $100,725,638.
See Note 1(c) regarding derivative financial instruments.
10. Credit Facility
The Fund, together with other U.S. registered and foreign investment funds (collectively, Borrowers), managed by Franklin Templeton Investments, are borrowers in a joint syndicated senior unsecured credit facility totaling $2 billion (Global Credit Facility) which matures on February 9, 2018. This Global Credit Facility provides a source of funds to the Borrowers for temporary and emergency purposes, including the ability to meet future unanticipated or unusually large redemption requests.
Under the terms of the Global Credit Facility, the Fund shall, in addition to interest charged on any borrowings made by the Fund and other costs incurred by the Fund, pay its share of fees and expenses incurred in connection with the implementation and maintenance of the Global Credit Facility, based upon its relative share of the aggregate net assets of all of the Borrowers, including an annual commitment fee of 0.15% based upon the unused portion of the Global Credit Facility. These fees are reflected in other expenses in the Statement of Operations. During the period ended June 30, 2017, the Fund did not use the Global Credit Facility.
11. Fair Value Measurements
The Fund follows a fair value hierarchy that distinguishes between market data obtained from independent sources (observable inputs) and the Fund’s own market assumptions (unobservable inputs). These inputs are used in determining the value of the Fund’s financial instruments and are summarized in the following fair value hierarchy:
| • | Level 1 – quoted prices in active markets for identical financial instruments |
| • | Level 2 – other significant observable inputs (including quoted prices for similar financial instruments, interest rates, prepayment speed, credit risk, etc.) |
| • | Level 3 – significant unobservable inputs (including the Fund’s own assumptions in determining the fair value of financial instruments) |
The input levels are not necessarily an indication of the risk or liquidity associated with financial instruments at that level.
| Semiannual Report | MGD-29 |
FRANKLIN TEMPLETON VARIABLE INSURANCE PRODUCTS TRUST
NOTES TO FINANCIAL STATEMENTS (UNAUDITED)
Franklin Mutual Global Discovery VIP Fund (continued)
11. Fair Value Measurements (continued)
For movements between the levels within the fair value hierarchy, the Fund has adopted a policy of recognizing the transfers as of the date of the underlying event which caused the movement.
A summary of inputs used as of June 30, 2017, in valuing the Fund’s assets and liabilities carried at fair value, is as follows:
| Level 1 | Level 2 | Level 3 | Total | |||||||||||||
| Assets: | ||||||||||||||||
Investments in Securities: | ||||||||||||||||
Equity Investments:a | ||||||||||||||||
Auto Components | $ | — | $ | — | $ | 2,505,007 | $ | 2,505,007 | ||||||||
Diversified Financial Services | 3,749,869 | — | 5,533,549 | 9,283,418 | ||||||||||||
Metals & Mining | 9,118,810 | — | 883,779 | 10,002,589 | ||||||||||||
All Other Equity Investmentsb | 607,323,626 | — | — | 607,323,626 | ||||||||||||
Corporate Bonds, Notes and Senior Floating Rate Interests | — | 21,785,315 | — | 21,785,315 | ||||||||||||
Corporate Notes and Senior Floating Rate Interests in Reorganization | — | 2,514,023 | —c | 2,514,023 | ||||||||||||
Companies in Liquidation | — | 603,175 | 136,964c | 740,139 | ||||||||||||
Municipal Bonds in Reorganization | — | 1,379,210 | — | 1,379,210 | ||||||||||||
Short Term Investments | 15,963,700 | 10,842,043 | — | 26,805,743 | ||||||||||||
|
| |||||||||||||||
Total Investments in Securities | $ | 636,156,005 | $ | 37,123,766 | $ | 9,059,299 | $ | 682,339,070 | ||||||||
|
| |||||||||||||||
Other Financial Instruments: | ||||||||||||||||
Forward Exchange Contracts | $ | — | $ | 67,842 | $ | — | $ | 67,842 | ||||||||
|
| |||||||||||||||
| Liabilities: | ||||||||||||||||
Other Financial Instruments: | ||||||||||||||||
Futures Contracts | $ | 983,886 | $ | — | $ | — | $ | 983,886 | ||||||||
Forward Exchange Contracts | — | 2,628,711 | — | 2,628,711 | ||||||||||||
|
| |||||||||||||||
Total Other Financial Instruments | $ | 983,886 | $ | 2,628,711 | $ | — | $ | 3,612,597 | ||||||||
|
| |||||||||||||||
aIncludes common and preferred stocks as well as other equity investments.
bFor detailed categories, see the accompanying Statement of Investments.
cIncludes securities determined to have no value at June 30, 2017.
| Balance at Beginning of Period | Purchases | Sales | Transfer Level 3a | Transfer Out of Level 3b | Cost Basis Adjustments | Net Realized Gain (Loss) | Net Unrealized Appreciation (Depreciation) | Balance at End of Period | Net Change in Period End | |||||||||||||||||||||||||||||||
| Assets: | ||||||||||||||||||||||||||||||||||||||||
Investments in Securities: | ||||||||||||||||||||||||||||||||||||||||
Equity Investments:c | ||||||||||||||||||||||||||||||||||||||||
Auto Components | $ | 3,025,399 | $ | — | $ | — | $ | — | $ | — | $ | — | $ | — | $ | (520,392 | ) | $ | 2,505,007 | $ | (520,392 | ) | ||||||||||||||||||
Diversified Financial Services | 5,466,782 | — | — | — | — | — | — | 66,767 | 5,533,549 | 66,767 | ||||||||||||||||||||||||||||||
Metals & Mining | — | — | (564,683 | ) | 1,465,905 | — | — | (1,889,894 | ) | 1,872,451 | 883,779 | (40,031 | ) | |||||||||||||||||||||||||||
Oil, Gas & Consumable Fuels | 1,997,775 | — | — | — | (1,844,100 | ) | — | — | (153,675 | ) | — | — | ||||||||||||||||||||||||||||
| MGD-30 | Semiannual Report |
FRANKLIN TEMPLETON VARIABLE INSURANCE PRODUCTS TRUST
NOTES TO FINANCIAL STATEMENTS (UNAUDITED)
Franklin Mutual Global Discovery VIP Fund (continued)
| Balance at Beginning of Period | Purchases | Sales | Transfer Into Level 3a | Transfer Out of Level 3b | Cost Basis Adjustments | Net Realized Gain (Loss) | Net Unrealized Appreciation (Depreciation) | Balance of Period | Net Change in Unrealized Appreciation (Depreciation) on Assets Held at Period End | |||||||||||||||||||||||||||||||
Companies in Liquidation | $ | 136,964 | d | $— | $ | — | $ | — | $ | — | $— | $ | — | $ | — | $ | 136,964 | d | $ | — | ||||||||||||||||||||
|
| |||||||||||||||||||||||||||||||||||||||
Total | $ | 10,626,920 | $— | $ | (564,683 | ) | $ | 1,465,905 | $ | (1,844,100 | ) | $— | $ | (1,889,894 | ) | $ | 1,265,151 | $ | 9,059,299 | $ | (493,656 | ) | ||||||||||||||||||
|
| |||||||||||||||||||||||||||||||||||||||
aThe investments were transferred into Level 3 as a result of the unavailability of other significant observable valuation inputs. May include amounts related to a corporate action.
bThe investments were transferred out of Level 3 as a result of the availability of other significant observable valuation inputs. May include amounts related to a corporate action.
cIncludes common and preferred stocks as well as other equity investments.
dIncludes securities determined to have no value.
Significant unobservable valuation inputs for material Level 3 financial instruments and impact to fair value as a result of changes in unobservable valuation inputs as of June 30, 2017, are as follows:
| Description | Fair Value at End of Period | Valuation Technique | Unobservable Input | Amount | Impact to Fair Value if Input Increasesa | |||||||||||
| Assets: | ||||||||||||||||
Investments in Securities: | ||||||||||||||||
Equity Investments:b | ||||||||||||||||
Auto Components | $ | 2,494,634 | Market Comparables | EV / EBITDA multiple | 3.7x | Increase | ||||||||||
| ||||||||||||||||
Discounted Cash Flow | 3 Yr Forward EBITDA Growth Rate Discount Rate | |||||||||||||||
| 1.01x | Increasec | |||||||||||||||
| 10% | Decreasec | |||||||||||||||
| ||||||||||||||||
Diversified Financial Services | 5,533,549 | Market comparables | EV / Last 12 Months Revenue multiple | 2.1x | Increasec | |||||||||||
Revenue multiple EV / Last 12 Months EBITDA multiple | 11.3x | Increasec | ||||||||||||||
EV / Forward 12 Months EBITDA multiple | 9.1x | Increasec | ||||||||||||||
| Discount rate | 7.9% | Decrease | ||||||||||||||
| ||||||||||||||||
Metals & Mining | 883,779 | Market comparables | Discount for lack of marketability | 4.5% | Decrease | |||||||||||
| ||||||||||||||||
All Other Investmentsd | 147,337 | e | ||||||||||||||
Total | $ | 9,059,299 | ||||||||||||||
aRepresents the directional change in the fair value of the Level 3 financial instruments that would result from a significant and reasonable increase in the corresponding input. A significant and reasonable decrease in the input would have the opposite effect. Significant impacts, if any, to fair value and/or net assets have been indicated.
bIncludes common and preferred stocks.
cRepresents a significant impact to fair value but not net assets.
dIncludes fair value of immaterial investments developed using various valuation techniques and unobservable inputs. May also include investments with values derived using prior transaction prices or third party pricing information without adjustment for which such inputs are also unobservable.
eIncludes securities determined to have no value at June 30, 2017.
| Semiannual Report | MGD-31 |
FRANKLIN TEMPLETON VARIABLE INSURANCE PRODUCTS TRUST
NOTES TO FINANCIAL STATEMENTS (UNAUDITED)
Franklin Mutual Global Discovery VIP Fund (continued)
11. Fair Value Measurements (continued)
Abbreviations List
| EBITDA | Earnings before interest, taxes, depreciation and amortization | |
| EV | Enterprise value | |
12. New Accounting Pronouncements
In March 2017, the Financial Accounting Standards Board (FASB) issued Accounting Standards Update (ASU) No. 2017-08, Receivables — Nonrefundable Fees and Other Costs (Subtopic 310-20): Premium Amortization on Purchased Callable Debt Securities. The amendments in the ASU shorten the amortization period for certain callable debt securities, held at a premium, to be amortized to the earliest call date. The ASU does not require an accounting change for securities held at a discount; which continues to be amortized to maturity. The ASU is effective for fiscal years and interim periods within those fiscal years beginning after December 15, 2018. Management is currently evaluating the impact, if any, of applying this provision.
13. Investment Company Reporting Modernization
In October 2016, the U.S. Securities and Exchange Commission adopted new rules and amended existing rules (together, final rules) intended to modernize the reporting and disclosure of information by registered investment companies. In part, the final rules amend Regulation S-X and require standardized, enhanced disclosures about derivatives in investment company financial statements, as well as other amendments. The compliance date for the amendments to Regulation S-X is August 1, 2017. Management has reviewed the requirements and believes the adoption of the amendments to Regulation S-X will not have a material impact on the Fund’s financial statements and related disclosures.
14. Subsequent Events
The Fund has evaluated subsequent events through the issuance of the financial statements and determined that no events have occurred that require disclosure.
Abbreviations
| Counterparty | Currency | Selected Portfolio | ||||||||
| HSBK | HSBC Bank PLC | EUR | Euro | ADR | American Depositary Receipt | |||||
| SSBT | State Street Bank and Trust Co., N.A. | GBP | British Pound | DIP | Debtor-In-Possession | |||||
| UBSW | UBS AG | USD | United States Dollar | FHLB | Federal Home Loan Bank | |||||
| GO | General Obligation | |||||||||
| TRA | Tax Receivable Agreement Right | |||||||||
| MGD-32 | Semiannual Report |
Franklin Mutual Shares VIP Fund
This semiannual report for Franklin Mutual Shares VIP Fund covers the period ended June 30, 2017.
Class 1 Performance Summary as of June 30, 2017
The Fund’s Class 1 Shares delivered a +5.54% total return for the six-month period ended June 30, 2017.
Performance reflects the Fund’s Class 1 operating expenses, but does not include any contract fees, expenses or sales charges. If they had been included, performance would be lower. These charges and deductions, particularly for variable life policies, can have a significant effect on contract values and insurance benefits. See the contract prospectus for a complete description of these expenses, including sales charges.
Performance data represent past performance, which does not guarantee future results. Investment return and principal value will fluctuate, and you may have a gain or loss when you sell your shares. Current performance may differ from figures shown.
| Semiannual Report | MS-1 |
FRANKLIN MUTUAL SHARES VIP FUND
Fund Goal and Main Investments
The Fund seeks capital appreciation, with income as a secondary goal, by investing primarily in equity securities of companies the Fund’s managers believe are at prices below their intrinsic value. The Fund may invest up to 35% of its assets in foreign securities.
Fund Risks
All investments involve risks, including possible loss of principal. Value securities may not increase in price as anticipated or may decline further in value. The Fund’s investments in foreign securities involve special risks including currency fluctuations, and economic and political uncertainties. Derivatives involve costs and can create economic leverage in the Fund’s portfolio which may result in significant volatility and cause the Fund to participate in losses (as well as gains) in an amount that exceeds the Fund’s initial investment. The Fund may also invest in companies engaged in mergers, reorganizations or liquidations, which involve special risks as pending deals may not be completed on time or on favorable terms, as well as lower rated bonds, which entail higher credit risk. The Fund is actively managed but there is no guarantee that the manager’s investment decisions will produce the desired results. The Fund’s prospectus also includes a description of the main investment risks.
Performance Overview
You can find the Fund’s six-month total return in the Performance Summary. In comparison, the Fund’s benchmark, the Standard & Poor’s® 500 Index, generated a +9.34% total return for the period under review.1
Economic and Market Overview
The global economy generally expanded during the period under review. In this environment, global developed and emerging market stocks rose significantly, as measured by the MSCI All Country World Index. Global markets were aided by improved industrial commodity prices at certain points during the period, generally upbeat economic data across regions, investor optimism about pro-growth and pro-business policies in the U.S, hopes of tax reforms under the Trump administration, Emmanuel Macron’s election as France’s president and encouraging corporate earnings reports.
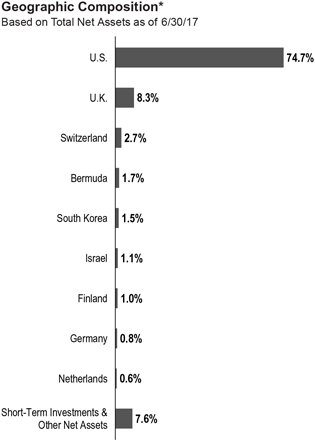
*Figures are stated as a percentage of total and may not equal 100% or may be negative due to rounding, use of any derivatives, unsettled trades or other factors.
However, investors expressed concerns about the timing and economic effects of the U.K.’s exit from the European Union (also known as “Brexit”). Other headwinds included the health of European banks, concerns about political uncertainty in the U.S. and European Union, geopolitical tensions in certain regions, worries about global oversupply in oil production despite a pact to extend cuts, and hawkish comments from key central bankers around the world toward period-end.
U.S. economic growth decelerated in 2017’s first quarter, largely due to slower growth in consumer spending and declines in private inventory investment and government spending. However, growth accelerated in the second quarter due to increases in consumer spending, business investment and federal government spending. The unemployment rate decreased from 4.7% in December 2016 to 4.4% at
1. Source: Morningstar.
One cannot invest directly in an index, and an index is not representative of the Fund’s portfolio. Please see Index Descriptions following the Fund Summaries.
The dollar value, number of shares or principal amount, and names of all portfolio holdings are listed in the Fund’s Statement of Investments (SOI).
| MS-2 | Semiannual Report |
FRANKLIN MUTUAL SHARES VIP FUND
period-end.2 Annual inflation, as measured by the Consumer Price Index, decreased from 2.1% to 1.6% during the period. After increasing its benchmark interest rate in March, the U.S. Federal Reserve (Fed), at its June meeting, made the widely anticipated increase to its target range for the federal funds rate from 0.75%–1.00% to 1.00%–1.25%, amid signs of a growing U.S. economy, a strengthening labor market and an improvement in business spending.
In Europe, the U.K.’s economy grew at a slower rate in 2017’s first quarter over the previous quarter, largely due to slower growth in household spending. The eurozone’s growth increased in the first quarter over the previous quarter. The bloc’s annual inflation rate fluctuated during the reporting period and ended slightly higher from where it began. During the period, the European Central Bank kept its key policy rates unchanged.
In Asia, Japan’s quarterly gross domestic product (GDP) remained unchanged in 2017’s first quarter compared to 2016’s fourth quarter. In April 2017, the Bank of Japan (BOJ) slightly increased its GDP forecasts for the 2017–2018 fiscal year. However, the BOJ lowered its inflation forecast.
In emerging markets, Brazil’s quarterly GDP grew for the first time in two years, as its first-quarter 2017 GDP grew compared to the previous quarter. The country’s central bank cut its benchmark interest rate four times between January and June 2017 to spur economic growth. Russia’s GDP grew in 2017’s first quarter compared to the prior-year period. The Bank of Russia reduced its key interest rate in March, April and June 2017 to try to revive its economy. China’s economy grew faster in the first half of 2017 compared to the first half of 2016, driven by solid growth in industrial production, services, fixed-asset investment, retail sales, and imports and exports. The People’s Bank of China left its benchmark interest rate unchanged during the period. Overall, emerging market stocks, as measured by the MSCI Emerging Markets Index, rose during the period.
Investment Strategy
At Franklin Mutual Advisors, we are committed to our distinctive value approach to investing. Our major investment strategy is investing in undervalued stocks. When selecting undervalued equities, we are attracted to what we believe are fundamentally strong companies with healthy balance sheets, high-quality assets, substantial free cash flow and shareholder-oriented management teams and whose stocks are trading at discounts to our assessment of the companies’
intrinsic or business value. We also look for asset-rich companies whose shares may be trading at depressed levels due to concerns over short-term earnings disappointments, litigation, management strategy or other perceived negatives. While the vast majority of our undervalued equity investments are made in publicly traded companies globally, we may invest occasionally in privately held companies as well.
We complement this more traditional investment strategy with two others. One is distressed investing, which is complex and can take many forms. The most common distressed investment the Fund undertakes is the purchase of financially troubled or bankrupt companies’ debt at a substantial discount to face value. After the financially distressed company is reorganized, often in bankruptcy court, the old debt is typically replaced with new securities issued by the financially stronger company.
The other piece of our investment strategy is participating in arbitrage situations, another highly specialized field. When companies announce proposed mergers or takeovers, commonly referred to as “deals,” the target company may trade at a discount to the bid it ultimately accepts. One form of arbitrage involves purchasing the target company’s stock when it is trading below the value we believe it would receive in a deal. In keeping with our commitment to a relatively conservative investment approach, we typically focus our arbitrage efforts on announced deals, and eschew rumored deals or other situations we consider relatively risky.
In addition, it is our practice to hedge the Fund’s currency exposure when we deem it advantageous for our shareholders.
What is meant by “hedge”?
To hedge an investment is to take a position intended to offset potential losses/gains that may be incurred by a companion financial instrument.
Manager’s Discussion
Many equity markets posted meaningful gains in 2017’s first half, across most regions and with minimal volatility. Global markets were aided by generally upbeat economic data, improved corporate earnings in the U.S., Europe and Japan, as well as improved industrial commodity prices at certain points during the period. However, those largely positive headline conditions overshadowed a fair amount of turbulence and uncertainty.
2. Source: Bureau of Labor Statistics.
| Semiannual Report | MS-3 |
FRANKLIN MUTUAL SHARES VIP FUND
In the U.S., markets began 2017 rallying as investors hoped that a Republican sweep of U.S. elections in November 2016 would lead to a general loosening in regulations and tax reform, including lower corporate tax rates. However, political gridlock took hold. The political drama in Washington, D.C., tempered the rally in U.S. markets overall. Many stocks that led the way in the post-election rally subsequently gave back some or all of their outperformance, particularly value stocks dominated by companies in cyclical sectors most likely to benefit from acceleration in economic growth. In an environment of modest economic growth and low interest rates, investors continued to favor growth stocks. During the period, the Russell 1000® Growth Index generated a total return of +13.99%, while the Russell 1000® Value Index posted a total return of +4.66%.1 Within the Russell 1000® Growth Index, stocks with the largest weights were technology firms that dominated the headlines: Apple,3 Alphabet (a.k.a. Google),3 Microsoft, Amazon.com3 and Facebook.3
European equity markets started 2017 slowly, but political events combined with upbeat economic news sparked strong performance during the period, with the notable exception of the U.K. Elections in Europe produced generally positive outcomes, with voters in the Netherlands and France rejecting extremist candidates. Political stability in the European Union (EU) helped to support equity markets on the belief that it would help facilitate the ongoing economic recovery. In the U.K., however, a snap election resulting in no party having a majority in Parliament appeared to make a “hard Brexit,” in which the U.K. leaves the EU in March 2019 without a negotiated deal, even more likely than before.
As value investors, we managed to benefit from steady economic growth despite underlying market turbulence. We seek to invest prudently in securities that we believe represent good value, and then we adjust our views as the world around us changes.
The energy sector has been a significant area of investment for the Fund.4 Following an extended period of high prices, crude oil and natural gas prices have been significantly lower during the past few years. The benchmark oil price dropped from more than $100 a barrel to below $30, and has more recently stayed between $40 and $60. The impact on the sector, and the securities of companies in the sector, has been unsurprisingly quite dramatic. Although many uncertainties exist, we continue to expect demand for oil and gas to rise for a number of years,
| Top 10 Sectors/Industries | ||||
| 6/30/17 | ||||
| % of Total Net Assets | ||||
| Banks | 9.5% | |||
| Insurance | 9.2% | |||
| Pharmaceuticals | 8.3% | |||
| Oil, Gas & Consumable Fuels | 7.4% | |||
| Media | 6.1% | |||
| Software | 5.7% | |||
| Health Care Equipment & Supplies | 5.2% | |||
| Tobacco | 4.7% | |||
| Food & Staples Retailing | 4.0% | |||
| Communications Equipment | 2.6% | |||
which we believe will require continued investment by the sector, not only to meet that growth but also to replace declining production in mature fields around the world. Accordingly, we expect some combination of higher prices or lower costs over time to provide the sufficient returns needed to justify the required investment.
After an initial period of distress, most companies within the energy sector appear to have made considerable progress in resizing their cost structures and strengthening their balance sheets. In aggregate, capital spending has been cut massively, and cash flow breakeven levels suggest an ability to fund a base level of investment activity given crude oil and gas prices as of period-end. From an investment standpoint, in many cases we are finding securities with reasonable prospects at current commodity prices, and substantively greater upside potential should our longer term price-versus-cost outlook come to pass. We expect continued commodity price volatility, but would look to use that to our advantage when seeking to buy or sell energy sector securities.
Our energy sector investment process has focused on finding situations where commodity price upside is not necessary to generate attractive security returns. One such area is within the infrastructure space. Companies such as Kinder Morgan and Williams provide critical pipelines, processing facilities, ports, and other assets used to bring vital commodities to market. Investors shunned these companies due to a combination of counterparty risk related to exploration and production companies, their own balance sheet concerns and dividend levels. As our analysis about the criticality of their assets and the flexibility of their funding options has, in our view, been
3. Not a Fund holding.
4. The energy sector comprises energy equipment and services and oil, gas and consumable fuels in the SOI.
| MS-4 | Semiannual Report |
FRANKLIN MUTUAL SHARES VIP FUND
| Top 10 Holdings | ||||
6/30/17
| ||||
| Company Sector/Industry, Country | % of Total Net Assets | |||
| Medtronic PLC Health Care Equipment & Supplies, U.S. | 3.6% | |||
| Merck & Co. Inc. Pharmaceuticals, U.S. | 2.8% | |||
| Eli Lilly & Co. Pharmaceuticals, U.S. | 2.4% | |||
| Microsoft Corp. Software, U.S. | 2.2% | |||
| Time Warner Inc. Media, U.S. | 2.1% | |||
| Symantec Corp. Software, U.S. | 2.0% | |||
| Novartis AG Pharmaceuticals, Switzerland | 2.0% | |||
| American International Group Inc. Insurance, U.S. | 2.0% | |||
| British American Tobacco PLC Tobacco, U.K. | 1.9% | |||
| Charter Communications Inc. Media, U.S. | 1.8% | |||
proven, the securities of infrastructure companies have recovered significantly from their lows. Moreover, if expectations of an oil and gas supply glut from greater North American production hold true, more infrastructure investment should be needed to move this product to export markets.
Royal Dutch Shell, a leading integrated oil and gas company, is another investment held by the Fund for which fears about the impact of low commodity prices were overblown, in our view. The company used the initial phase of the crude oil price downturn to acquire BG Group, a major exploration and production company with significant positions and strength in liquefied natural gas and a great oil asset in the pre-salt Santos Basin in Brazil. The assets were highly complementary to Shell’s existing positions, allowing the post-merger company to prune other areas of its portfolio and still show considerable growth. Management, under the leadership of relatively new chief executive officer Ben van Beurden, has been focused on reducing costs so that the company can still grow, while funding all required capital expenditures and its dividend, at an oil price below $50 per barrel. As Shell shows continued progress in its efforts and demonstrates the resilience of its portfolio and balance sheet, we expect the shares to continue to benefit.
Merger and acquisition activity has remained healthy, with the number of deals remaining high, although the average size of deals fell. Very large deals may have been affected by ongoing political and regulatory uncertainty. Although many mega-deals were rumored, the largest deal actually announced during the period was Becton, Dickinson and Company’s3 takeover of C.R. Bard.3 Meanwhile, many large deals initiated in 2016 await regulatory approval, including Bayer’s3 acquisition of Monsanto, AT&T’s3 acquisition of Time Warner, and 21st Century Fox’s3 offer for Sky. Several key regulatory agencies remain short of members, including the Federal Communication Commission and the Federal Trade Commission, and these openings may be affecting regulatory approvals.
Credit spreads narrowed in 2016 and continued that trend in the first half of 2017 for higher quality credit, with the exception of a brief period of volatility in March and April. High yield credit has remained at levels seen at the start of 2017. The spread compression provided the Fund with the opportunity to exit many of the opportunities that presented themselves in early 2016, including several “hung deals,” as prices improved, spreads shrank, and the risk-adjusted returns were no longer mispriced. As the year progressed and investors became more willing buyers of credit, mispriced risk became more difficult to find, in our opinion. However, we found what we viewed as value in some unloved industries like specialty pharmaceuticals, hospitals, media/broadcasting and telecommunications5 that faced increasing political or secular challenges. In sorting through these less-favored industries, we sought out securities that we believed could benefit most from liquidity-enhancing events like asset sales, the ability within existing agreements to issue secured debt, and free cash flow that could create a long enough runway to weather the storm and/or provide enough current recovery to create the enterprise at a significant discount to our assessment of its intrinsic value. In times when the credit markets fluctuate and value is difficult to easily identify, we believe our industry specific expertise, deep fundamental analysis with a focus on cash flow, and intensive credit and covenant review combine seamlessly and provide us with unique ways of looking at the same ideas others may disregard.
Turning to Fund performance, top positive contributors included U.S.-based medical device maker Medtronic, South Korea-based Samsung Electronics, and Switzerland-based health care company Novartis.
5. The telecommunication services sector comprises diversified telecommunication services and wireless telecommunication services in the SOI.
| Semiannual Report | MS-5 |
FRANKLIN MUTUAL SHARES VIP FUND
Investors responded positively to quarterly results issued by Medtronic in February and May. On both occasions, earnings exceeded consensus expectations, driven by solid revenues and successful cost control efforts, which led to better operating profitability. The positive results led to improved investor confidence in Medtronic’s ability to deliver on future growth goals, especially given concerns following tough quarterly results issued in November 2016. Medtronic’s agreement in April to sell its medical supplies business to Cardinal Health3 provided additional support to Medtronic’s stock price. Medtronic obtained the medical supplies business as part of its 2014 acquisition of Covidien. The medical supplies business, in our view, was not core to Medtronic’s operations and had less attractive profitability and future growth prospects. In addition, Medtronic intends to use the after-tax proceeds for additional share buybacks and to pay down debt.
Samsung Electronics is a low cost provider of commodity memory products (e.g., dynamic random-access memory and flash memory), which have seen very strong pricing recently. Samsung also produces smartphones, consumer electronics and other goods. In February, shares retreated as Samsung chief Jay Y. Lee was arrested for bribery as part of a wider government influence-peddling scandal that led to the impeachment of then president Park Geun-hye. However, the stock price rallied as investors turned their focus to Samsung’s better-than-expected earnings results announced in April. Samsung reported strong sales in its core businesses, including memory chips and OLED (organic light-emitting diode) displays. Despite adverse publicity surrounding its Note 7 smartphone in the fall of 2016, sales of its newest generation of smartphones have been running ahead of market expectations. Management also surprised investors in April by announcing a plan to cancel existing treasury shares held by the company.
Novartis has meaningful market positions in biopharmaceu-ticals, especially oncology, generic pharmaceuticals through its Sandoz division, and eye care through its Alcon division. Investors reacted positively to decent quarterly results in January and April when Novartis beat consensus expectations. Investors also reacted positively to news reports in April that the process of reviewing strategic options for its Alcon division may be moving along. Novartis has made substantial investments to turn around Alcon, but the process has taken longer than expected. We believe a sale or spin-off of Alcon may make sense at the right price. In June, Novartis made good progress on its pipeline with two positive late-stage trials, one for a drug to treating neovascular age-related macular degeneration and second for a cardiovascular treatment for heart attack patients.
During the period under review, Fund investments that detracted from performance included Cincinnati-based grocery retailer Kroger, U.S.-based oil and gas exploration and production company Marathon Oil and U.S.-based drugstore chain Rite Aid.
Kroger operates over 2,400 grocery and multi-department stores in 31 states. Kroger’s stock price declined as investors remained focused on the industry-wide impact of food price deflation, which is pressuring the revenue growth of grocery retailers. Quarterly results released in early March reflected the pressure of food price deflation on Kroger’s revenues. The stock price further declined in mid-June due to Kroger’s negative full-year earnings guidance update and the announced acquisition of Whole Foods3 by Amazon.com.3 Kroger reduced its full-year 2017 earning range due to a combination of higher costs and lower margins. The company selectively increased starting wages to lower employee turnover and improve productivity. In addition, Kroger decided to match major promotions by some competitors. Kroger’s management believes promotion activity will likely persist through 2017 as other grocery chains fight to maintain market share. In our view, the Whole Foods acquisition by Amazon was another sign of encroaching competition from non-traditional grocery retailers and hard discounters. Overall, we believe Kroger is still among the strongest grocery retailers, including a sharp management team, and that it has the capability to successfully adjust to the shifting competitive landscape.
Shares of Marathon Oil generally followed the path of declining oil prices. During the first half of 2017, oil prices retreated as U.S. crude oil production increased and data showed that worldwide supply had not yet begun to decline. The supply and price trends for crude oil prices overshadowed some moves by Marathon that we believe were positive. As part of its portfolio transformation effort, in March Marathon announced agreements to exit a Canadian oil sands asset, and two transactions to acquire acreage in the northern Delaware basin of New Mexico. Although we regard the price received for the oil sands asset to be merely adequate, we look favorably upon the continuing expansion of the company’s resource portfolio and increasing focus on predictable, higher return onshore assets. Additionally, the three transactions led to a further improvement in Marathon’s balance sheet. These favorable changes were nonetheless overshadowed by an oil market which remains both volatile and challenging.
Shares of Rite Aid declined as a deal to be acquired by Walgreens Boots Alliance fell apart. The transaction was mired in antitrust review by the Federal Trade Commission (FTC) during much of the period as the FTC questioned whether
| MS-6 | Semiannual Report |
FRANKLIN MUTUAL SHARES VIP FUND
Walgreens’ proposed divestitures were sufficient to maintain competition. In late June, Walgreens announced the immediate termination of the merger agreement. Instead, Rite Aid agreed to sell numerous stores and related distribution assets to Walgreens. The new agreement is also subject to antitrust review, but we believe FTC approval is likely.
During the period, the Fund held currency forwards and futures seeking to hedge most of the currency risk of the portfolio’s non-U.S. dollar investments. The currency forwards had a negative impact on the Fund’s performance because of the depreciation of the U.S. dollar versus the hedged currencies, while currency futures had a negligible impact.
What is a currency forward?
A currency forward is an agreement between the Fund and a counterparty to buy or sell a foreign currency in exchange for another currency at a specific exchange rate on a future date.
What is a future?
A future is an agreement between the Fund and a counterparty made through a U.S. or foreign futures exchange to buy or sell an underlying instrument or asset at a specific price on a future date.
Thank you for your participation in Franklin Mutual Shares VIP Fund. We look forward to serving your future investment needs.
The foregoing information reflects our analysis, opinions and portfolio holdings as of June 30, 2017, the end of the reporting period. The way we implement our main investment strategies and the resulting portfolio holdings may change depending on factors such as market and economic conditions. These opinions may not be relied upon as investment advice or an offer for a particular security. The information is not a complete analysis of every aspect of any market, country, industry, security or the Fund. Statements of fact are from sources considered reliable, but the investment manager makes no representation or warranty as to their completeness or accuracy. Although historical performance is no guarantee of future results, these insights may help you understand our investment management philosophy.
| Semiannual Report | MS-7 |
FRANKLIN MUTUAL SHARES VIP FUND
Class 1 Fund Expenses
As an investor in a variable insurance contract (Contract) that indirectly provides for investment in an underlying mutual fund, you can incur transaction and/or ongoing expenses at both the Fund level and the Contract Level: (1) transaction expenses can include sales charges (loads) on purchases, surrender fees, transfer fees and premium taxes; and (2) ongoing expenses can include management fees, distribution and service (12b-1) fees, contract fees, annual maintenance fees, mortality and expense risk fees and other fees and expenses. All mutual funds and Contracts have some types of ongoing expenses. The table below shows Fund-level ongoing expenses and can help you understand these costs and compare them with those of other mutual funds offered through the Contract. The table assumes a $1,000 investment held for the six months indicated. Please refer to the Fund prospectus for additional information on operating expenses.
Actual Fund Expenses
The table below provides information about the actual account values and actual expenses in the columns under the heading “Actual.” In these columns the Fund’s actual return, which includes the effect of ongoing Fund expenses but does not include the effect of ongoing Contract expenses, is used to calculate the “Ending Account Value.” You can estimate the Fund-level expenses you paid during the period by following these steps (of course, your account value and expenses will differ from those in this illustration): Divide your account value by $1,000 (if your account had an $8,600 value, then $8,600 ÷ $1,000 = 8.6). Then multiply the result by the number under the headings “Actual” and “Fund-Level Expenses Paid During Period” (if Fund-Level Expenses Paid During Period were $ 7.50, then 8.6 x $7.50 = $64.50). In this illustration, the estimated expenses paid this period at the Fund level are $64.50.
Hypothetical Example for Comparison with Other Mutual Funds
Under the heading “Hypothetical” in the table, information is provided about hypothetical account values and hypothetical expenses based on the Fund’s actual expense ratio and an assumed rate of return of 5% per year before expenses, which is not the Fund’s actual return. This information may not be used to estimate the actual ending account balance or expenses you paid for the period, but it can help you compare ongoing costs of investing in the Fund with those of other mutual funds offered through the Contract. To do so, compare this 5% hypothetical example with the 5% hypothetical examples that appear in the shareholder reports of other funds offered through the Contract.
Please note that expenses shown in the table are meant to highlight ongoing costs at the Fund level only and do not reflect any ongoing expenses at the Contract level, or transaction expenses at either the Fund or Contract levels. In addition, while the Fund does not have transaction expenses, if the transaction and ongoing expenses at the Contract level were included, the expenses shown below would be higher. You should consult your Contract prospectus or disclosure document for more information.
| Actual (actual return after expenses) | Hypothetical (5% annual return before expenses) | |||||||||||||||||||||||
| Share Class | | Beginning Account | | | Ending Account Value 6/30/17 |
| | Fund-Level Expenses Paid During Period 1/1/17–6/30/17 | 1,2 | | Ending Account Value 6/30/17 |
| | Fund-Level Expenses Paid During Period 1/1/17–6/30/17 |
1,2 | | Net Annualized | | ||||||
Class 1 | $1,000 | $1,055.40 | $3.62 | $1,021.27 | $3.56 | 0.71% | ||||||||||||||||||
1. Expenses are equal to the annualized expense ratio for the six-month period as indicated above — in the far right column — multiplied by the simple average account value over the period indicated, and then multiplied by 181/365 to reflect the one-half year period.
2. Reflects expenses after fee waivers and expense reimbursements. Does not include any ongoing expenses of the Contract for which the Fund is an investment option or acquired fund fees and expenses.
| MS-8 | Semiannual Report |
FRANKLIN TEMPLETON VARIABLE INSURANCE PRODUCTS TRUST
Financial Highlights
Franklin Mutual Shares VIP Fund
| Six Months Ended June 30, 2017 | Year Ended December 31, | |||||||||||||||||||||||
| (unaudited) | 2016 | 2015 | 2014 | 2013 | 2012 | |||||||||||||||||||
| Class 1 | ||||||||||||||||||||||||
Per share operating performance (for a share outstanding throughout the period) | ||||||||||||||||||||||||
Net asset value, beginning of period | $20.40 | $19.48 | $22.91 | $21.92 | $17.45 | $15.57 | ||||||||||||||||||
|
| |||||||||||||||||||||||
| Income from investment operationsa: | ||||||||||||||||||||||||
Net investment incomeb | 0.21 | 0.50 | 0.44 | 0.62c | 0.42 | 0.35 | ||||||||||||||||||
Net realized and unrealized gains (losses) | 0.92 | 2.56 | (1.54 | ) | 1.01 | 4.52 | 1.92 | |||||||||||||||||
|
| |||||||||||||||||||||||
Total from investment operations | 1.13 | 3.06 | (1.10 | ) | 1.63 | 4.94 | 2.27 | |||||||||||||||||
|
| |||||||||||||||||||||||
| Less distributions from: | ||||||||||||||||||||||||
Net investment income | — | (0.46 | ) | (0.77 | ) | (0.52 | ) | (0.47 | ) | (0.39 | ) | |||||||||||||
Net realized gains | — | (1.68 | ) | (1.56 | ) | (0.12 | ) | — | — | |||||||||||||||
|
| |||||||||||||||||||||||
Total distributions | — | (2.14 | ) | (2.33 | ) | (0.64 | ) | (0.47 | ) | (0.39 | ) | |||||||||||||
|
| |||||||||||||||||||||||
Net asset value, end of period | $21.53 | $20.40 | $19.48 | $22.91 | $21.92 | $17.45 | ||||||||||||||||||
|
| |||||||||||||||||||||||
Total returnd | 5.54% | 16.35% | (4.69)% | 7.38% | 28.53% | 14.61% | ||||||||||||||||||
| Ratios to average net assetse | ||||||||||||||||||||||||
Expensesf | 0.71% | g,h | 0.72% | g,h | 0.73% | g,h | 0.73% | g | 0.71% | g | 0.71% | |||||||||||||
Expenses incurred in connection with securities sold short | —% | 0.01% | 0.02% | 0.03% | —% | i | —% | i | ||||||||||||||||
Net investment income | 1.96% | 2.57% | 2.00% | 2.83% | c | 2.08% | 2.06% | |||||||||||||||||
| Supplemental data | ||||||||||||||||||||||||
Net assets, end of period (000’s) | $644,175 | $610,395 | $643,438 | $656,463 | $552,163 | $449,343 | ||||||||||||||||||
Portfolio turnover rate | 8.66% | 24.45% | 19.88% | 21.33% | 24.05% | 34.07% | j | |||||||||||||||||
aThe amount shown for a share outstanding throughout the period may not correlate with the Statement of Operations for the period due to the timing of sales and repurchases of the Fund’s shares in relation to income earned and/or fluctuating fair value of the investments of the Fund.
bBased on average daily shares outstanding.
cNet investment income per share includes approximately $0.23 per share related to income received in the form of special dividends in connection with certain Fund holdings. Excluding this amount, the ratio of net investment income to average net assets would have been 1.79%.
dTotal return does not include fees, charges or expenses imposed by the variable annuity and life insurance contracts for which Franklin Templeton Variable Insurance Products Trust serves as an underlying investment vehicle. Total return is not annualized for periods less than one year.
eRatios are annualized for periods less than one year. fIncludes dividend and/or interest expense on securities sold short and security borrowing fees, if any. See below for the ratios of such expenses to average net assets for the periods presented. See Note 1(f).
gBenefit of expense reduction rounds to less than 0.01%.
hBenefit of waiver and payments by affiliates rounds to less than 0.01%.
iRounds to less than 0.01%.
jExcludes the value of portfolio securities delivered as a result of a redemption in-kind.
| The accompanying notes are an integral part of these financial statements. | Semiannual Report | MS-9 |
FRANKLIN TEMPLETON VARIABLE INSURANCE PRODUCTS TRUST
FINANCIAL HIGHLIGHTS
Franklin Mutual Shares VIP Fund (continued)
| Six Months Ended June 30, 2017 | Year Ended December 31, | |||||||||||||||||||||||
| (unaudited) | 2016 | 2015 | 2014 | 2013 | 2012 | |||||||||||||||||||
| Class 2 | ||||||||||||||||||||||||
Per share operating performance (for a share outstanding throughout the period) | ||||||||||||||||||||||||
Net asset value, beginning of period | $20.08 | $19.20 | $22.60 | $21.63 | $17.23 | $15.38 | ||||||||||||||||||
|
| |||||||||||||||||||||||
| Income from investment operationsa: | ||||||||||||||||||||||||
Net investment incomeb | 0.18 | 0.45 | 0.38 | 0.58c | 0.36 | 0.30 | ||||||||||||||||||
Net realized and unrealized gains (losses) | 0.91 | 2.52 | (1.51 | ) | 0.97 | 4.46 | 1.90 | |||||||||||||||||
|
| |||||||||||||||||||||||
Total from investment operations | 1.09 | 2.97 | (1.13 | ) | 1.55 | 4.82 | 2.20 | |||||||||||||||||
|
| |||||||||||||||||||||||
| Less distributions from: | ||||||||||||||||||||||||
Net investment income | — | (0.41 | ) | (0.71 | ) | (0.46 | ) | (0.42 | ) | (0.35 | ) | |||||||||||||
Net realized gains | — | (1.68 | ) | (1.56 | ) | (0.12 | ) | — | — | |||||||||||||||
|
| |||||||||||||||||||||||
Total distributions | — | (2.09 | ) | (2.27 | ) | (0.58 | ) | (0.42 | ) | (0.35 | ) | |||||||||||||
|
| |||||||||||||||||||||||
Net asset value, end of period | $21.17 | $20.08 | $19.20 | $22.60 | $21.63 | $17.23 | ||||||||||||||||||
|
| |||||||||||||||||||||||
Total returnd | 5.43% | 16.06% | (4.94)% | 7.12% | 28.26% | 14.24% | ||||||||||||||||||
| Ratios to average net assetse | ||||||||||||||||||||||||
Expensesf | 0.96% | g,h | 0.97% | g,h | 0.98% | g,h | 0.98% | g | 0.96% | g | 0.96% | |||||||||||||
Expenses incurred in connection with securities sold short | —% | 0.01% | 0.02% | 0.03% | —%i | —% | i | |||||||||||||||||
Net investment income | 1.71% | 2.32% | 1.75% | 2.58%c | 1.83% | 1.81% | ||||||||||||||||||
| Supplemental data | ||||||||||||||||||||||||
Net assets, end of period (000’s) | $3,574,863 | $3,621,358 | $3,353,505 | $4,218,342 | $4,558,547 | $4,069,803 | ||||||||||||||||||
Portfolio turnover rate | 8.66% | 24.45% | 19.88% | 21.33% | 24.05% | 34.07% | j | |||||||||||||||||
aThe amount shown for a share outstanding throughout the period may not correlate with the Statement of Operations for the period due to the timing of sales and repurchases of the Fund’s shares in relation to income earned and/or fluctuating fair value of the investments of the Fund.
bBased on average daily shares outstanding.
cNet investment income per share includes approximately $0.23 per share related to income received in the form of special dividends in connection with certain Fund holdings. Excluding this amount, the ratio of net investment income to average net assets would have been 1.54%.
dTotal return does not include fees, charges or expenses imposed by the variable annuity and life insurance contracts for which Franklin Templeton Variable Insurance Products Trust serves as an underlying investment vehicle. Total return is not annualized for periods less than one year.
eRatios are annualized for periods less than one year.
fIncludes dividend and/or interest expense on securities sold short and security borrowing fees, if any. See below for the ratios of such expenses to average net assets for the periods presented. See Note 1(f).
gBenefit of expense reduction rounds to less than 0.01%.
hBenefit of waiver and payments by affiliates rounds to less than 0.01%. iRounds to less than 0.01%.
jExcludes the value of portfolio securities delivered as a result of a redemption in-kind.
| MS-10 | Semiannual Report | The accompanying notes are an integral part of these financial statements. |
FRANKLIN TEMPLETON VARIABLE INSURANCE PRODUCTS TRUST
FINANCIAL STATEMENTS
Franklin Mutual Shares VIP Fund (continued)
| Six Months Ended June 30, 2017 | Year Ended December 31, | |||||||||||||||||||||||
| (unaudited) | 2016 | 2015 | 2014 | 2013 | 2012 | |||||||||||||||||||
| Class 4 | ||||||||||||||||||||||||
Per share operating performance (for a share outstanding throughout the period) | ||||||||||||||||||||||||
Net asset value, beginning of period | $20.23 | $19.32 | $22.72 | $21.74 | $17.31 | $15.45 | ||||||||||||||||||
|
| |||||||||||||||||||||||
| Income from investment operationsa: | ||||||||||||||||||||||||
Net investment incomeb | 0.17 | 0.44 | 0.36 | 0.57 | c | 0.34 | 0.28 | |||||||||||||||||
Net realized and unrealized gains (losses) | 0.92 | 2.53 | (1.52 | ) | 0.96 | 4.49 | 1.91 | |||||||||||||||||
|
| |||||||||||||||||||||||
Total from investment operations | 1.09 | 2.97 | (1.16 | ) | 1.53 | 4.83 | 2.19 | |||||||||||||||||
|
| |||||||||||||||||||||||
| Less distributions from: | ||||||||||||||||||||||||
Net investment income | — | (0.38 | ) | (0.68 | ) | (0.43 | ) | (0.40 | ) | (0.33 | ) | |||||||||||||
Net realized gains | — | (1.68 | ) | (1.56 | ) | (0.12 | ) | — | — | |||||||||||||||
|
| |||||||||||||||||||||||
Total distributions | — | (2.06 | ) | (2.24 | ) | (0.55 | ) | (0.40 | ) | (0.33 | ) | |||||||||||||
|
| |||||||||||||||||||||||
Net asset value, end of period | $21.32 | $20.23 | $19.32 | $22.72 | $21.74 | $17.31 | ||||||||||||||||||
|
| |||||||||||||||||||||||
Total returnd | 5.39% | 15.94% | (5.05)% | 7.04% | 28.05% | 14.20% | ||||||||||||||||||
| Ratios to average net assetse | ||||||||||||||||||||||||
Expensesf | 1.06% | g,h | 1.07% | g,h | 1.08% | g,h | 1.08% | g | 1.06% | g | 1.06% | |||||||||||||
Expenses incurred in connection with securities sold short | —% | 0.01% | 0.02% | 0.03% | —% | i | —% | i | ||||||||||||||||
Net investment income | 1.61% | 2.22% | 1.65% | 2.48% | c | 1.73% | 1.71% | |||||||||||||||||
| Supplemental data | ||||||||||||||||||||||||
Net assets, end of period (000’s) | $120,304 | $122,476 | $130,978 | $158,020 | $188,153 | $165,015 | ||||||||||||||||||
Portfolio turnover rate | 8.66% | 24.45% | 19.88% | 21.33% | 24.05% | 34.07% | j | |||||||||||||||||
aThe amount shown for a share outstanding throughout the period may not correlate with the Statement of Operations for the period due to the timing of sales and repurchases of the Fund’s shares in relation to income earned and/or fluctuating fair value of the investments of the Fund.
bBased on average daily shares outstanding.
cNet investment income per share includes approximately $0.23 per share related to income received in the form of special dividends in connection with certain Fund holdings. Excluding this amount, the ratio of net investment income to average net assets would have been 1.44%.
dTotal return does not include fees, charges or expenses imposed by the variable annuity and life insurance contracts for which Franklin Templeton Variable Insurance Products Trust serves as an underlying investment vehicle. Total return is not annualized for periods less than one year.
eRatios are annualized for periods less than one year.
fIncludes dividend and/or interest expense on securities sold short and security borrowing fees, if any. See below for the ratios of such expenses to average net assets for the periods presented. See Note 1(f).
gBenefit of expense reduction rounds to less than 0.01%.
hBenefit of waiver and payments by affiliates rounds to less than 0.01%.
iRounds to less than 0.01%.
jExcludes the value of portfolio securities delivered as a result of a redemption in-kind.
| The accompanying notes are an integral part of these financial statements. | Semiannual Report | MS-11 |
FRANKLIN TEMPLETON VARIABLE INSURANCE PRODUCTS TRUST
Statement of Investments, June 30, 2017 (unaudited)
Franklin Mutual Shares VIP Fund
| ||||||||||||||
| Country | Shares/ Units | Value | ||||||||||||
Common Stocks and Other Equity Interests 87.0% | ||||||||||||||
Aerospace & Defense 0.6% | ||||||||||||||
| a | KLX Inc. | United States | 224,586 | $ | 11,229,300 | |||||||||
Rockwell Collins Inc. | United States | 125,222 | 13,158,328 | |||||||||||
|
| |||||||||||||
| 24,387,628 | ||||||||||||||
|
| |||||||||||||
Auto Components 0.7% | ||||||||||||||
The Goodyear Tire & Rubber Co. | United States | 632,638 | 22,117,024 | |||||||||||
| a,b | International Automotive Components Group Brazil LLC | Brazil | 1,730,515 | 42,327 | ||||||||||
| a,b,c | International Automotive Components Group North America LLC | United States | 15,382,424 | 9,468,128 | ||||||||||
|
| |||||||||||||
| 31,627,479 | ||||||||||||||
|
| |||||||||||||
Automobiles 1.2% | ||||||||||||||
General Motors Co. | United States | 1,510,630 | 52,766,306 | |||||||||||
|
| |||||||||||||
Banks 9.5% | ||||||||||||||
Barclays PLC | | United Kingdom | | 10,534,300 | 27,820,247 | |||||||||
CIT Group Inc. | United States | 757,326 | 36,881,776 | |||||||||||
Citigroup Inc. | United States | 926,419 | 61,958,903 | |||||||||||
Citizens Financial Group Inc. | United States | 1,851,966 | 66,078,147 | |||||||||||
| a | FCB Financial Holdings Inc., A | United States | 493,723 | 23,575,273 | ||||||||||
Guaranty Bancorp | United States | 209,583 | 5,700,658 | |||||||||||
JPMorgan Chase & Co. | United States | 757,320 | 69,219,048 | |||||||||||
PNC Financial Services Group Inc. | United States | 571,295 | 71,337,607 | |||||||||||
State Bank Financial Corp. | United States | 352,200 | 9,551,664 | |||||||||||
Wells Fargo & Co. | United States | 698,860 | 38,723,832 | |||||||||||
|
| |||||||||||||
| 410,847,155 | ||||||||||||||
|
| |||||||||||||
Beverages 0.8% | ||||||||||||||
PepsiCo Inc. | United States | 319,942 | 36,950,102 | |||||||||||
|
| |||||||||||||
Chemicals 1.1% | ||||||||||||||
| a,d,e | Dow Corning Corp., Contingent Distribution | United States | 100,000 | — | ||||||||||
Monsanto Co. | United States | 405,580 | 48,004,449 | |||||||||||
|
| |||||||||||||
| 48,004,449 | ||||||||||||||
|
| |||||||||||||
Communications Equipment 2.6% | ||||||||||||||
Cisco Systems Inc. | United States | 2,183,380 | 68,339,794 | |||||||||||
Nokia OYJ, A. | Finland | 3,670,248 | 22,449,985 | |||||||||||
Nokia OYJ, ADR | Finland | 3,299,845 | 20,327,045 | |||||||||||
|
| |||||||||||||
| 111,116,824 | ||||||||||||||
|
| |||||||||||||
Construction Materials 0.7% | ||||||||||||||
LafargeHolcim Ltd., B. | Switzerland | 547,060 | 31,325,783 | |||||||||||
|
| |||||||||||||
Consumer Finance 1.3% | ||||||||||||||
Ally Financial Inc. | United States | 943,970 | 19,728,973 | |||||||||||
Capital One Financial Corp. | United States | 436,885 | 36,095,439 | |||||||||||
|
| |||||||||||||
| 55,824,412 | ||||||||||||||
|
| |||||||||||||
Containers & Packaging 2.2% | ||||||||||||||
International Paper Co. | United States | 1,044,075 | 59,105,086 | |||||||||||
WestRock Co. | United States | 681,512 | 38,614,470 | |||||||||||
|
| |||||||||||||
| 97,719,556 | ||||||||||||||
|
| |||||||||||||
Diversified Financial Services 0.8% | ||||||||||||||
Voya Financial Inc. | United States | 959,810 | 35,407,391 | |||||||||||
|
| |||||||||||||
Diversified Telecommunication Services 0.6% | ||||||||||||||
Koninklijke KPN NV | Netherlands | 8,378,890 | 26,807,774 | |||||||||||
|
| |||||||||||||
| MS-12 | Semiannual Report |
FRANKLIN TEMPLETON VARIABLE INSURANCE PRODUCTS TRUST
STATEMENT OF INVESTMENTS (UNAUDITED)
Franklin Mutual Shares VIP Fund (continued)
| ||||||||||||||
| Country | Shares/ Units | Value | ||||||||||||
Common Stocks and Other Equity Interests (continued) | ||||||||||||||
Electrical Equipment 1.1% | ||||||||||||||
| a | Sensata Technologies Holding NV | United States | 1,104,530 | $ | 47,185,522 | |||||||||
|
| |||||||||||||
Energy Equipment & Services 1.3% | ||||||||||||||
Baker Hughes Inc. | United States | 1,003,685 | 54,710,870 | |||||||||||
| a,b | Gulfmark Offshore Inc. | United States | 48,169 | 10,067 | ||||||||||
|
| |||||||||||||
| 54,720,937 | ||||||||||||||
|
| |||||||||||||
Equity Real Estate Investment Trusts (REITs) 1.2% | ||||||||||||||
Alexander’s Inc. | United States | 40,126 | 16,911,504 | |||||||||||
Vornado Realty Trust | United States | 358,219 | 33,636,764 | |||||||||||
|
| |||||||||||||
| 50,548,268 | ||||||||||||||
|
| |||||||||||||
Food & Staples Retailing 4.0% | ||||||||||||||
CVS Health Corp. | United States | 821,861 | 66,126,936 | |||||||||||
The Kroger Co. | United States | 2,243,460 | 52,317,487 | |||||||||||
| a | Rite Aid Corp. | United States | 2,439,970 | 7,197,912 | ||||||||||
Walgreens Boots Alliance Inc. | United States | 628,158 | 49,191,053 | |||||||||||
|
| |||||||||||||
| 174,833,388 | ||||||||||||||
|
| |||||||||||||
Health Care Equipment & Supplies 5.2% | ||||||||||||||
Medtronic PLC | United States | 1,734,212 | 153,911,315 | |||||||||||
Stryker Corp. | United States | 512,391 | 71,109,623 | |||||||||||
|
| |||||||||||||
| 225,020,938 | ||||||||||||||
|
| |||||||||||||
Household Products 0.2% | ||||||||||||||
Energizer Holdings Inc. | United States | 196,162 | 9,419,699 | |||||||||||
|
| |||||||||||||
Independent Power & Renewable Electricity Producers 0.8% | ||||||||||||||
Vistra Energy Corp. | United States | 2,184,095 | 36,670,955 | |||||||||||
|
| |||||||||||||
Industrial Conglomerates 1.5% | ||||||||||||||
General Electric Co. | United States | 2,362,600 | 63,813,826 | |||||||||||
|
| |||||||||||||
Insurance 9.2% | ||||||||||||||
| a | Alleghany Corp. | United States | 102,188 | 60,781,422 | ||||||||||
American International Group Inc. | United States | 1,369,996 | 85,652,150 | |||||||||||
Chubb Ltd. | United States | 319,645 | 46,469,990 | |||||||||||
The Hartford Financial Services Group Inc. | United States | 441,878 | 23,229,527 | |||||||||||
MetLife Inc. | United States | 977,203 | 53,687,533 | |||||||||||
White Mountains Insurance Group Ltd. | United States | 65,521 | 56,913,506 | |||||||||||
XL Group Ltd. | Bermuda | 1,639,580 | 71,813,604 | |||||||||||
|
| |||||||||||||
| 398,547,732 | ||||||||||||||
|
| |||||||||||||
IT Services 1.6% | ||||||||||||||
Cognizant Technology Solutions Corp., A | United States | 822,270 | 54,598,728 | |||||||||||
DXC Technology Co. | United States | 177,792 | 13,640,202 | |||||||||||
|
| |||||||||||||
| 68,238,930 | ||||||||||||||
|
| |||||||||||||
Machinery 2.1% | ||||||||||||||
Caterpillar Inc. | United States | 445,006 | 47,820,345 | |||||||||||
CNH Industrial NV | United Kingdom | 888,427 | 10,061,799 | |||||||||||
CNH Industrial NV, special voting | United Kingdom | 1,844,814 | 20,893,272 | |||||||||||
Federal Signal Corp. | United States | 657,993 | 11,422,758 | |||||||||||
|
| |||||||||||||
| 90,198,174 | ||||||||||||||
|
| |||||||||||||
| Semiannual Report | MS-13 |
FRANKLIN TEMPLETON VARIABLE INSURANCE PRODUCTS TRUST
STATEMENT OF INVESTMENTS (UNAUDITED)
Franklin Mutual Shares VIP Fund (continued)
| Country | Shares/ Units | Value | ||||||||||||
| Common Stocks and Other Equity Interests (continued) | ||||||||||||||
| Media 6.1% | ||||||||||||||
| a | Charter Communications Inc., A | United States | 237,513 | $ | 80,006,254 | |||||||||
| a | DISH Network Corp., A. | United States | 778,183 | 48,838,765 | ||||||||||
Sky PLC | United Kingdom | 3,381,508 | 43,781,560 | |||||||||||
Time Warner Inc. | United States | 918,888 | 92,265,544 | |||||||||||
|
| |||||||||||||
| 264,892,123 | ||||||||||||||
|
| |||||||||||||
| Metals & Mining 0.9% | ||||||||||||||
thyssenkrupp AG | Germany | 1,147,037 | 32,591,299 | |||||||||||
| b,c | Warrior Met Coal Inc. | United States | 361,612 | 5,915,616 | ||||||||||
|
| |||||||||||||
| 38,506,915 | ||||||||||||||
|
| |||||||||||||
| Oil, Gas & Consumable Fuels 7.4% | ||||||||||||||
Anadarko Petroleum Corp. | United States | 512,870 | 23,253,526 | |||||||||||
Apache Corp. | United States | 653,346 | 31,314,874 | |||||||||||
BP PLC | United Kingdom | 4,322,322 | 24,929,821 | |||||||||||
| a | CONSOL Energy Inc. | United States | 1,236,955 | 18,480,108 | ||||||||||
Kinder Morgan Inc. | United States | 3,158,940 | 60,525,290 | |||||||||||
Marathon Oil Corp. | United States | 2,991,878 | 35,453,754 | |||||||||||
Royal Dutch Shell PLC, A (EUR Traded) | United Kingdom | 1,916,196 | 50,856,184 | |||||||||||
Royal Dutch Shell PLC, A (GBP Traded) | United Kingdom | 927,720 | 24,590,976 | |||||||||||
The Williams Cos. Inc. | United States | 1,751,598 | 53,038,387 | |||||||||||
|
| |||||||||||||
| 322,442,920 | ||||||||||||||
|
| |||||||||||||
| Pharmaceuticals 8.3% | ||||||||||||||
Eli Lilly & Co. | United States | 1,274,136 | 104,861,393 | |||||||||||
Merck & Co. Inc. | United States | 1,898,948 | 121,703,577 | |||||||||||
Novartis AG, ADR | Switzerland | 1,026,481 | 85,680,369 | |||||||||||
Teva Pharmaceutical Industries Ltd., ADR | Israel | 1,427,173 | 47,410,687 | |||||||||||
|
| |||||||||||||
| 359,656,026 | ||||||||||||||
|
| |||||||||||||
| Professional Services 0.8% | ||||||||||||||
RELX PLC | United Kingdom | 1,702,110 | 36,803,586 | |||||||||||
|
| |||||||||||||
| Software 5.7% | ||||||||||||||
CA Inc. | United States | 1,442,532 | 49,724,078 | |||||||||||
| a | Dell Technologies Inc., V | United States | 198,331 | 12,120,007 | ||||||||||
Microsoft Corp. | United States | 1,379,947 | 95,119,747 | |||||||||||
Symantec Corp. | United States | 3,140,461 | 88,718,023 | |||||||||||
|
| |||||||||||||
| 245,681,855 | ||||||||||||||
|
| |||||||||||||
| Technology Hardware, Storage & Peripherals 2.3% | ||||||||||||||
Hewlett Packard Enterprise Co. | United States | 2,069,667 | 34,335,775 | |||||||||||
Samsung Electronics Co. Ltd | South Korea | 30,959 | 64,274,273 | |||||||||||
|
| |||||||||||||
| 98,610,048 | ||||||||||||||
|
| |||||||||||||
| Tobacco 4.7% | ||||||||||||||
Altria Group Inc. | United States | 638,788 | 47,570,542 | |||||||||||
British American Tobacco PLC | United Kingdom | 1,188,947 | 81,057,022 | |||||||||||
Imperial Brands PLC | United Kingdom | 487,268 | 21,887,318 | |||||||||||
Reynolds American Inc. | United States | 849,494 | 55,251,090 | |||||||||||
|
| |||||||||||||
| 205,765,972 | ||||||||||||||
|
| |||||||||||||
| MS-14 | Semiannual Report |
FRANKLIN TEMPLETON VARIABLE INSURANCE PRODUCTS TRUST
STATEMENT OF INVESTMENTS (UNAUDITED)
Franklin Mutual Shares VIP Fund (continued)
| Country | Shares/ Units | Value | ||||||||||||
| Common Stocks and Other Equity Interests (continued) | ||||||||||||||
Wireless Telecommunication Services 0.5% | ||||||||||||||
Vodafone Group PLC | | United Kingdom | | 8,229,954 | $ | 23,342,642 | ||||||||
|
| |||||||||||||
Total Common Stocks and Other Equity Interests | 3,777,685,315 | |||||||||||||
|
| |||||||||||||
| Principal Amount | ||||||||||||||
Corporate Bonds, Notes and Senior Floating Rate Interests 3.3% | ||||||||||||||
| f,g | Avaya Inc., DIP Facility, 8.617% - 8.716%, 1/23/18. | United States | $ | 5,756,000 | 5,944,872 | |||||||||
| f,g | Belk Inc., Closing Date Term Loan, 5.905%, 12/12/22 | United States | 5,741,131 | 4,917,278 | ||||||||||
CHS/Community Health Systems Inc., senior note, 6.875%, 2/01/22 | United States | 7,784,000 | 6,830,460 | |||||||||||
| f,g | Cumulus Media Holdings Inc., Term Loans, 4.48%, 12/23/20 | United States | 16,442,442 | 13,297,825 | ||||||||||
Frontier Communications Corp., | ||||||||||||||
senior note, 10.50%, 9/15/22 | United States | 2,804,000 | 2,681,325 | |||||||||||
senior note, 11.00%, 9/15/25 | United States | 25,535,000 | 23,651,794 | |||||||||||
iHeartCommunications Inc., | ||||||||||||||
senior secured note, first lien, 9.00%, 12/15/19 | United States | 26,449,000 | 20,861,649 | |||||||||||
| f,g | Tranche D Term Loan, 7.976%, 1/30/19 | United States | 34,746,619 | 28,492,227 | ||||||||||
| f,g | Tranche E Term Loan, 8.726%, 7/30/19 | United States | 11,168,253 | 9,157,968 | ||||||||||
| f,g | Toys R Us-Delaware Inc., | |||||||||||||
FILO Loans, 8.422%, 10/24/19 | United States | 2,560,000 | 2,563,200 | |||||||||||
Term B-4 Loan, 9.952%, 4/24/20 | United States | 21,133,461 | 17,620,023 | |||||||||||
| h | Valeant Pharmaceuticals International, | |||||||||||||
senior bond, 144A, 6.75%, 8/15/21 | United States | 2,207,000 | 2,107,685 | |||||||||||
senior bond, 144A, 7.25%, 7/15/22 | United States | 1,460,000 | 1,377,875 | |||||||||||
| h | Valeant Pharmaceuticals International Inc., senior note, 144A, 7.50%, 7/15/21 | United States | 1,314,000 | 1,277,865 | ||||||||||
| h | Veritas U.S. Inc./Veritas Bermuda Ltd., senior note, 144A, 7.50%, 2/01/23 | United States | 2,386,000 | 2,570,915 | ||||||||||
|
| |||||||||||||
Total Corporate Bonds, Notes and Senior Floating Rate Interests (Cost $155,448,003) | 143,352,961 | |||||||||||||
|
| |||||||||||||
Corporate Notes and Senior Floating Rate Interests in Reorganization 1.6% | ||||||||||||||
| i | Avaya Inc., h senior note, 144A, 10.50%, 3/01/21 | United States | 22,449,000 | 2,301,023 | ||||||||||
| h | senior secured note, 144A, 7.00%, 4/01/19 | United States | 8,441,000 | 6,816,107 | ||||||||||
| f,g | Term B-3 Loan, 7.63%, 10/26/17 | United States | 15,539,927 | 12,418,997 | ||||||||||
| f,g,j | Term B-6 Loan, 4.13%, 3/30/18. | United States | 3,248,721 | 2,593,561 | ||||||||||
| f,g | Term B-7 Loan, 4.13%, 5/29/20. | United States | 15,158,619 | 12,227,958 | ||||||||||
| b,i | Broadband Ventures III LLC, secured promissory note, 5.00%, 2/01/12 | United States | 1,754 | — | ||||||||||
| f,g,i | Caesars Entertainment Operating Co. Inc., | |||||||||||||
Term B-5-B Loans, 1.50%, 3/01/17 | United States | 3,069,560 | 3,572,201 | |||||||||||
Term B-6-B Loans, 1.50%, 3/01/17 | United States | 14,634,842 | 17,433,755 | |||||||||||
Term B-7 Loans, 1.50%, 3/01/17 | United States | 9,298,589 | 11,588,366 | |||||||||||
|
| |||||||||||||
Total Corporate Notes and Senior Floating Rate Interests in Reorganization (Cost $82,557,205) | 68,951,968 | |||||||||||||
|
| |||||||||||||
| Semiannual Report | MS-15 |
FRANKLIN TEMPLETON VARIABLE INSURANCE PRODUCTS TRUST
STATEMENT OF INVESTMENTS (UNAUDITED)
Franklin Mutual Shares VIP Fund (continued)
| Country | Shares | Value | ||||||||||||
Companies in Liquidation 0.2% | ||||||||||||||
| a | Adelphia Recovery Trust. | United States | 29,283,354 | $ | 19,034 | |||||||||
| a,d | Adelphia Recovery Trust, Arahova Contingent Value Vehicle, Contingent Distribution | United States | 1,955,453 | 196 | ||||||||||
| a,b,c,k | CB FIM Coinvestors LLC | United States | 6,400,507 | — | ||||||||||
| a,d,e | Century Communications Corp., Contingent Distribution. | United States | 5,487,000 | — | ||||||||||
| a,b | FIM Coinvestor Holdings I, LLC | United States | 8,006,950 | — | ||||||||||
| a,l | Lehman Brothers Holdings Inc., Bankruptcy Claim. | United States | 144,058,799 | 3,198,105 | ||||||||||
| a,d,e | Tribune Media, Litigation Trust, Contingent Distribution. | United States | 394,551 | — | ||||||||||
| a,d,e | Tropicana, Litigation Trust, Contingent Distribution | United States | 18,305,000 | — | ||||||||||
| a,e | Vistra Energy Corp., Litigation Trust | United States | 129,926,405 | 1,507,146 | ||||||||||
| a | Vistra Energy Corp., Litigation Trust, TRA | United States | 2,184,095 | 2,347,902 | ||||||||||
|
| |||||||||||||
Total Companies in Liquidation (Cost $23,439,539) | 7,072,383 | |||||||||||||
|
| |||||||||||||
| Principal Amount | ||||||||||||||
Municipal Bonds in Reorganization (Cost $17,936,642) 0.3% | ||||||||||||||
| i | Puerto Rico Commonwealth GO, Refunding, Series A, 8.00%, 7/01/35 | United States | $ | 20,409,000 | 12,449,490 | |||||||||
|
| |||||||||||||
Total Investments before Short Term Investments (Cost $3,031,012,589) | 4,009,512,117 | |||||||||||||
|
| |||||||||||||
Short Term Investments 7.0% | ||||||||||||||
U.S. Government and Agency Securities 7.0% | ||||||||||||||
| m | FHLB, | |||||||||||||
7/03/17 | United States | 79,400,000 | 79,400,000 | |||||||||||
7/05/17 | United States | 25,000,000 | 24,998,625 | |||||||||||
| m | U.S. Treasury Bill, | |||||||||||||
| n | 9/07/17 | United States | 20,000,000 | 19,965,340 | ||||||||||
7/20/17 - 12/21/17 | United States | 182,000,000 | 181,519,880 | |||||||||||
|
| |||||||||||||
Total U.S. Government and Agency Securities (Cost $305,891,749) | 305,883,845 | |||||||||||||
|
| |||||||||||||
Total Investments (Cost $3,336,904,338) 99.4% | 4,315,395,962 | |||||||||||||
Other Assets, less Liabilities 0.6%. | 23,945,524 | |||||||||||||
|
| |||||||||||||
Net Assets 100.0% | $ | 4,339,341,486 | ||||||||||||
|
| |||||||||||||
| MS-16 | Semiannual Report |
FRANKLIN TEMPLETON VARIABLE INSURANCE PRODUCTS TRUST
STATEMENT OF INVESTMENTS (UNAUDITED)
Franklin Mutual Shares VIP Fund (continued)
aNon-income producing.
bSee Note 8 regarding restricted securities.
cAt June 30, 2017, pursuant to the Fund’s policies and the requirements of applicable securities law, the Fund is restricted from trading these securities at period end.
dContingent distributions represent the right to receive additional distributions, if any, during the reorganization of the underlying company. Shares represent total underlying principal of debt securities.
eSecurity has been deemed illiquid because it may not be able to be sold within seven days. At June 30, 2017, the aggregate value of these securities was $1,507,146, representing less than 0.1% of net assets.
fThe coupon rate shown represents the rate at period end.
gSee Note 1(h) regarding senior floating rate interests.
hSecurity was purchased pursuant to Rule 144A under the Securities Act of 1933 and may be sold in transactions exempt from registration only to qualified institutional buyers or in a public offering registered under the Securities Act of 1933. These securities have been deemed liquid under guidelines approved by the Trust’s Board of Trustees. At June 30, 2017, the aggregate value of these securities was $16,451,470, representing 0.4% of net assets.
iSee Note 7 regarding credit risk and defaulted securities.
jA portion or all of the security purchased on a delayed delivery basis. See Note 1(c).
kSee Note 10 regarding holdings of 5% voting securities.
lBankruptcy claims represent the right to receive distributions, if any, during the liquidation of the underlying pool of assets. Shares represent amount of allowed unsecured claims.
mThe security was issued on a discount basis with no stated coupon rate.
nA portion or all of the security has been segregated as collateral for open forward contracts. At June 30, 2017, the aggregate value of this security and/or cash pledged amounted to $4,636,950, representing 0.1% of net assets.
| Semiannual Report | MS-17 |
FRANKLIN TEMPLETON VARIABLE INSURANCE PRODUCTS TRUST
STATEMENT OF INVESTMENTS (UNAUDITED)
Franklin Mutual Shares VIP Fund (continued)
At June 30, 2017, the Fund had the following futures contracts outstanding. See Note 1(d).
Futures Contracts
| Description | Type | Number of Contracts | Notional Value | Expiration Date | Unrealized Appreciation | Unrealized Depreciation | ||||||||||||||||||
| Currency Contracts | ||||||||||||||||||||||||
EUR/USD | Short | 478 | $ | 68,515,325 | 9/18/17 | $ | — | $ | (1,204,813 | ) | ||||||||||||||
GBP/USD | Short | 1,341 | 109,333,406 | 9/18/17 | — | (2,226,903 | ) | |||||||||||||||||
|
|
|
| |||||||||||||||||||||
Total Futures Contracts | $ | — | $ | (3,431,716 | ) | |||||||||||||||||||
|
|
|
| |||||||||||||||||||||
Net unrealized appreciation (depreciation) | $ | (3,431,716 | ) | |||||||||||||||||||||
|
| |||||||||||||||||||||||
At June 30, 2017, the Fund had the following forward exchange contracts outstanding. See Note 1(d).
Forward Exchange Contracts
| Currency | Counterparty | a | Type | Quantity | | Contract Amount | | | Settlement Date | | | Unrealized Appreciation | | | Unrealized Depreciation | | ||||||||||||
| OTC Forward Exchange Contracts | ||||||||||||||||||||||||||||
South Korean Won | HSBK | Buy | 15,250,943,768 | $ | 13,569,615 | 7/14/17 | $ | — | $ | (249,579 | ) | |||||||||||||||||
South Korean Won | HSBK | Sell | 60,952,959,545 | 53,915,112 | 7/14/17 | 679,349 | — | |||||||||||||||||||||
South Korean Won | UBSW | Buy | 4,358,008,432 | 3,860,543 | 7/14/17 | — | (54,297 | ) | ||||||||||||||||||||
South Korean Won | UBSW | Sell | 30,193,573,135 | 26,576,768 | 7/14/17 | 205,975 | — | |||||||||||||||||||||
British Pound | BOFA | Buy | 3,152,268 | 4,051,573 | 8/14/17 | 60,393 | — | |||||||||||||||||||||
British Pound | HSBK | Buy | 1,233,497 | 1,572,528 | 8/14/17 | 36,503 | — | |||||||||||||||||||||
British Pound | SSBT | Buy | 1,373,006 | 1,756,049 | 8/14/17 | 34,964 | — | |||||||||||||||||||||
British Pound | SSBT | Sell | 100,115,134 | 126,950,995 | 8/14/17 | — | (3,643,870 | ) | ||||||||||||||||||||
British Pound | UBSW | Buy | 1,878,264 | 2,421,931 | 8/14/17 | 28,165 | — | |||||||||||||||||||||
Euro | BOFA | Buy | 352,190 | 402,582 | 8/18/17 | 767 | — | |||||||||||||||||||||
Euro | BOFA | Sell | 214,707 | 241,405 | 8/18/17 | — | (4,490 | ) | ||||||||||||||||||||
Euro | BONY | Buy | 360,418 | 412,172 | 8/18/17 | 600 | — | |||||||||||||||||||||
Euro | HSBK | Buy | 352,191 | 402,343 | 8/18/17 | 1,007 | — | |||||||||||||||||||||
Euro | HSBK | Sell | 49,200,330 | 55,051,332 | 8/18/17 | — | (1,295,817 | ) | ||||||||||||||||||||
Euro | SSBT | Buy | 352,190 | 402,761 | 8/18/17 | 588 | — | |||||||||||||||||||||
Euro | SSBT | Sell | 49,200,356 | 55,036,748 | 8/18/17 | — | (1,310,431 | ) | ||||||||||||||||||||
Euro | UBSW | Buy | 568,560 | 649,804 | 8/18/17 | 1,345 | — | |||||||||||||||||||||
|
|
|
| |||||||||||||||||||||||||
Total Forward Exchange Contracts | $ | 1,049,656 | $ | (6,558,484 | ) | |||||||||||||||||||||||
|
|
|
| |||||||||||||||||||||||||
Net unrealized appreciation (depreciation) | $ | (5,508,828 | ) | |||||||||||||||||||||||||
|
|
aMay be comprised of multiple contracts with the same counterparty, currency and settlement date.
See Abbreviations on page MS-33.
| MS-18 | Semiannual Report | The accompanying notes are an integral part of these financial statements. |
FRANKLIN TEMPLETON VARIABLE INSURANCE PRODUCTS TRUST
Financial Statements
Statement of Assets and Liabilities
June 30, 2017 (unaudited)
| Franklin Mutual Shares VIP Fund | ||||
Assets: | ||||
Investments in securities: | ||||
Cost - Unaffiliated issuers | $ | 3,336,904,338 | ||
|
| |||
Value - Unaffiliated issuers | $ | 4,315,395,962 | ||
Cash | 463,226 | |||
Restricted Cash (Note 1e) | 10,000 | |||
Foreign currency, at value (cost $1,784,392) | 1,789,328 | |||
Receivables: | ||||
Investment securities sold | 22,174,094 | |||
Capital shares sold | 180,283 | |||
Dividends and interest | 6,858,260 | |||
European Union tax reclaims | 1,170,006 | |||
Due from brokers | 4,002,180 | |||
Unrealized appreciation on OTC forward exchange contracts | 1,049,656 | |||
Other assets | 2,844 | |||
|
| |||
Total assets | 4,353,095,839 | |||
|
| |||
Liabilities: | ||||
Payables: | ||||
Investment securities purchased | 1,200,821 | |||
Capital shares redeemed | 1,475,011 | |||
Management fees | 2,464,268 | |||
Distribution fees | 1,571,337 | |||
Variation margin | 109,700 | |||
Due to brokers | 10,000 | |||
Unrealized depreciation on OTC forward exchange contracts | 6,558,484 | |||
Accrued expenses and other liabilities | 364,732 | |||
|
| |||
Total liabilities | 13,754,353 | |||
|
| |||
Net assets, at value | $ | 4,339,341,486 | ||
|
| |||
Net assets consist of: | ||||
Paid-in capital | $ | 2,959,304,020 | ||
Undistributed net investment income | 126,117,767 | |||
Net unrealized appreciation (depreciation) | 969,557,699 | |||
Accumulated net realized gain (loss) | 284,362,000 | |||
|
| |||
Net assets, at value | $ | 4,339,341,486 | ||
|
| |||
| Class 1: | ||||
Net assets, at value | $ | 644,174,599 | ||
|
| |||
Shares outstanding | 29,921,358 | |||
|
| |||
Net asset value and maximum offering price per share | $ | 21.53 | ||
|
| |||
| Class 2: | ||||
Net assets, at value | $ | 3,574,863,273 | ||
|
| |||
Shares outstanding | 168,887,196 | |||
|
| |||
Net asset value and maximum offering price per share | $ | 21.17 | ||
|
| |||
| Class 4: | ||||
Net assets, at value | $ | 120,303,614 | ||
|
| |||
Shares outstanding | 5,643,694 | |||
|
| |||
Net asset value and maximum offering price per share | $ | 21.32 | ||
|
| |||
| The accompanying notes are an integral part of these financial statements. | Semiannual Report | MS-19 |
FRANKLIN TEMPLETON VARIABLE INSURANCE PRODUCTS TRUST
FINANCIAL STATEMENTS
Statement of Operations
for the six months ended June 30, 2017 (unaudited)
| Franklin Mutual Shares VIP Fund | ||||
Investment income: | ||||
Dividends | $ | 47,545,108 | ||
Interest | 10,303,786 | |||
Income from securities loaned (net of fees and rebates) | 230,510 | |||
|
| |||
Total investment income | 58,079,404 | |||
|
| |||
Expenses: | ||||
Management fees (Note 3a) | 14,953,814 | |||
Distribution fees: (Note 3c) | ||||
Class 2 | 4,493,370 | |||
Class 4 | 209,827 | |||
Custodian fees (Note 4) | 53,022 | |||
Reports to shareholders | 234,143 | |||
Professional fees | 170,286 | |||
Trustees’ fees and expenses | 10,340 | |||
Other | 66,092 | |||
|
| |||
Total expenses | 20,190,894 | |||
Expense reductions (Note 4) | (2,566 | ) | ||
Expenses waived/paid by affiliates (Note 3e) | (5,064 | ) | ||
|
| |||
Net expenses | 20,183,264 | |||
|
| |||
Net investment income | 37,896,140 | |||
|
| |||
Realized and unrealized gains (losses): | ||||
Net realized gain (loss) from: | ||||
Investments | 147,157,592 | |||
Foreign currency transactions | (6,944,681 | ) | ||
Futures contracts | (3,891,018 | ) | ||
Securities sold short | (391,267 | ) | ||
|
| |||
Net realized gain (loss) | 135,930,626 | |||
|
| |||
Net change in unrealized appreciation (depreciation) on: | ||||
Investments | 73,010,433 | |||
Translation of other assets and liabilities denominated in foreign currencies | (8,774,420 | ) | ||
Futures contracts | (6,056,813 | ) | ||
|
| |||
Net change in unrealized appreciation (depreciation) | 58,179,200 | |||
|
| |||
Net realized and unrealized gain (loss) | 194,109,826 | |||
|
| |||
Net increase (decrease) in net assets resulting from operations | $ | 232,005,966 | ||
|
| |||
| MS-20 | Semiannual Report | The accompanying notes are an integral part of these financial statements. |
FRANKLIN TEMPLETON VARIABLE INSURANCE PRODUCTS TRUST
FINANCIAL STATEMENTS
Statements of Changes in Net Assets
| Franklin Mutual Shares VIP Fund | ||||||||
| Six Months Ended June 30, 2017 (unaudited) | Year Ended December 31, 2016 | |||||||
Increase (decrease) in net assets: | ||||||||
Operations: | ||||||||
Net investment income | $ | 37,896,140 | $ | 96,857,347 | ||||
Net realized gain (loss) | 135,930,626 | 177,041,416 | ||||||
Net change in unrealized appreciation (depreciation) | 58,179,200 | 340,244,965 | ||||||
|
| |||||||
Net increase (decrease) in net assets resulting from operations | 232,005,966 | 614,143,728 | ||||||
|
| |||||||
Distributions to shareholders from: | ||||||||
Net investment income: | ||||||||
Class 1 | — | (12,783,421 | ) | |||||
Class 2 | — | (69,990,186 | ) | |||||
Class 4 | — | (2,230,613 | ) | |||||
Net realized gains: | ||||||||
Class 1 | — | (46,218,042 | ) | |||||
Class 2 | — | (288,327,268 | ) | |||||
Class 4 | — | (9,935,345 | ) | |||||
|
| |||||||
Total distributions to shareholders | — | (429,484,875 | ) | |||||
|
| |||||||
Capital share transactions: (Note 2) | ||||||||
Class 1 | (151,228 | ) | (54,403,896 | ) | ||||
Class 2 | (238,211,624 | ) | 110,574,611 | |||||
Class 4 | (8,529,725 | ) | (14,522,761 | ) | ||||
|
| |||||||
Total capital share transactions | (246,892,577 | ) | 41,647,954 | |||||
|
| |||||||
Net increase (decrease) in net assets | (14,886,611 | ) | 226,306,807 | |||||
Net assets: | ||||||||
Beginning of period | 4,354,228,097 | 4,127,921,290 | ||||||
|
| |||||||
End of period | $ | 4,339,341,486 | $ | 4,354,228,097 | ||||
|
| |||||||
Undistributed net investment income included in net assets: | ||||||||
End of period | $ | 126,117,767 | $ | 88,221,627 | ||||
|
| |||||||
| The accompanying notes are an integral part of these financial statements. | Semiannual Report | MS-21 |
FRANKLIN TEMPLETON VARIABLE INSURANCE PRODUCTS TRUST
Notes to Financial Statements (unaudited)
Franklin Mutual Shares VIP Fund
1. Organization and Significant Accounting Policies
Franklin Templeton Variable Insurance Products Trust (Trust) is registered under the Investment Company Act of 1940 (1940 Act) as an open-end management investment company, consisting of eighteen separate funds and applies the specialized accounting and reporting guidance in U.S. Generally Accepted Accounting Principles (U.S. GAAP). Franklin Mutual Shares VIP Fund (Fund) is included in this report. Shares of the Fund are generally sold only to insurance company separate accounts to fund the benefits of variable life insurance policies or variable annuity contracts. The Fund offers three classes of shares: Class 1, Class 2 and Class 4. Each class of shares may differ by its distribution fees, voting rights on matters affecting a single class and its exchange privilege.
The following summarizes the Fund’s significant accounting policies.
a. Financial Instrument Valuation
The Fund’s investments in financial instruments are carried at fair value daily. Fair value is the price that would be received to sell an asset or paid to transfer a liability in an orderly transaction between market participants on the measurement date. The Fund calculates the net asset value (NAV) per share as of 4 p.m. Eastern time each day the New York Stock Exchange (NYSE) is open for trading. Under compliance policies and procedures approved by the Trust’s Board of Trustees (the Board), the Fund’s administrator has responsibility for oversight of valuation, including leading the cross-functional Valuation Committee (VC). The VC provides administration and oversight of the Fund’s valuation policies and procedures, which are approved annually by the Board. Among other things, these procedures allow the Fund to utilize independent pricing services, quotations from securities and financial instrument dealers, and other market sources to determine fair value.
Equity securities and derivative financial instruments listed on an exchange or on the NASDAQ National Market System are valued at the last quoted sale price or the official closing price of the day, respectively. Foreign equity securities are valued as of the close of trading on the foreign stock exchange on which the security is primarily traded, or as of 4 p.m. Eastern time. The value is then converted into its U.S. dollar equivalent at the foreign exchange rate in effect at 4 p.m. Eastern time on the day that the value of the security is determined. Over-the-counter
(OTC) securities are valued within the range of the most recent quoted bid and ask prices. Securities that trade in multiple markets or on multiple exchanges are valued according to the broadest and most representative market. Certain equity securities are valued based upon fundamental characteristics or relationships to similar securities.
Debt securities generally trade in the OTC market rather than on a securities exchange. The Fund’s pricing services use multiple valuation techniques to determine fair value. In instances where sufficient market activity exists, the pricing services may utilize a market-based approach through which quotes from market makers are used to determine fair value. In instances where sufficient market activity may not exist or is limited, the pricing services also utilize proprietary valuation models which may consider market characteristics such as benchmark yield curves, credit spreads, estimated default rates, anticipated market interest rate volatility, coupon rates, anticipated timing of principal repayments, underlying collateral, and other unique security features in order to estimate the relevant cash flows, which are then discounted to calculate the fair value.
Investments in open-end mutual funds are valued at the closing NAV.
Certain derivative financial instruments trade in the OTC market. The Fund’s pricing services use various techniques including industry standard option pricing models and proprietary discounted cash flow models to determine the fair value of those instruments. The Fund’s net benefit or obligation under the derivative contract, as measured by the fair value of the contract, is included in net assets.
The Fund has procedures to determine the fair value of financial instruments for which market prices are not reliable or readily available. Under these procedures, the VC convenes on a regular basis to review such financial instruments and considers a number of factors, including significant unobservable valuation inputs, when arriving at fair value. The VC primarily employs a market-based approach which may use related or comparable assets or liabilities, recent transactions, market multiples, book values, and other relevant information for the investment to determine the fair value of the investment. An income-based valuation approach may also be used in which the anticipated future cash flows of the investment are discounted to calculate fair value. Discounts may also be applied due to the nature or duration of any restrictions on the disposition of the investments. Due to the inherent uncertainty of valuations of
| MS-22 | Semiannual Report |
FRANKLIN TEMPLETON VARIABLE INSURANCE PRODUCTS TRUST
NOTES TO FINANCIAL STATEMENTS (UNAUDITED)
Franklin Mutual Shares VIP Fund (continued)
such investments, the fair values may differ significantly from the values that would have been used had an active market existed. The VC employs various methods for calibrating these valuation approaches including a regular review of key inputs and assumptions, transactional back-testing or disposition analysis, and reviews of any related market activity.
Trading in securities on foreign securities stock exchanges and OTC markets may be completed before 4 p.m. Eastern time. In addition, trading in certain foreign markets may not take place on every Fund’s business day. Occasionally, events occur between the time at which trading in a foreign security is completed and 4 p.m. Eastern time that might call into question the reliability of the value of a portfolio security held by the Fund. As a result, differences may arise between the value of the Fund’s portfolio securities as determined at the foreign market close and the latest indications of value at 4 p.m. Eastern time. In order to minimize the potential for these differences, the VC monitors price movements following the close of trading in foreign stock markets through a series of country specific market proxies (such as baskets of American Depositary Receipts, futures contracts and exchange traded funds). These price movements are measured against established trigger thresholds for each specific market proxy to assist in determining if an event has occurred that may call into question the reliability of the values of the foreign securities held by the Fund. If such an event occurs, the securities may be valued using fair value procedures, which may include the use of independent pricing services.
When the last day of the reporting period is a non-business day, certain foreign markets may be open on those days that the Fund’s NAV is not calculated, which could result in differences between the value of the Fund’s portfolio securities on the last business day and the last calendar day of the reporting period. Any significant security valuation changes due to an open foreign market are adjusted and reflected by the Fund for financial reporting purposes.
b. Foreign Currency Translation
Portfolio securities and other assets and liabilities denominated in foreign currencies are translated into U.S. dollars based on the exchange rate of such currencies against U.S. dollars on the date of valuation. The Fund may enter into foreign currency exchange contracts to facilitate transactions denominated in a foreign currency. Purchases and sales of securities, income and expense items denominated in foreign currencies are translated
into U.S. dollars at the exchange rate in effect on the transaction date. Portfolio securities and assets and liabilities denominated in foreign currencies contain risks that those currencies will decline in value relative to the U.S. dollar. Occasionally, events may impact the availability or reliability of foreign exchange rates used to convert the U.S. dollar equivalent value. If such an event occurs, the foreign exchange rate will be valued at fair value using procedures established and approved by the Board.
The Fund does not separately report the effect of changes in foreign exchange rates from changes in market prices on securities held. Such changes are included in net realized and unrealized gain or loss from investments in the Statement of Operations.
Realized foreign exchange gains or losses arise from sales of foreign currencies, currency gains or losses realized between the trade and settlement dates on securities transactions and the difference between the recorded amounts of dividends, interest, and foreign withholding taxes and the U.S. dollar equivalent of the amounts actually received or paid. Net unrealized foreign exchange gains and losses arise from changes in foreign exchange rates on foreign denominated assets and liabilities other than investments in securities held at the end of the reporting period.
c. Securities Purchased on a Delayed Delivery Basis
The Fund purchases securities on a delayed delivery basis, with payment and delivery scheduled for a future date. These transactions are subject to market fluctuations and are subject to the risk that the value at delivery may be more or less than the trade date purchase price. Although the Fund will generally purchase these securities with the intention of holding the securities, it may sell the securities before the settlement date. Sufficient assets have been segregated for these securities.
d. Derivative Financial Instruments
The Fund invested in derivative financial instruments in order to manage risk or gain exposure to various other investments or markets. Derivatives are financial contracts based on an underlying or notional amount, require no initial investment or an initial net investment that is smaller than would normally be required to have a similar response to changes in market factors, and require or permit net settlement. Derivatives contain various risks including the potential inability of the counterparty to fulfill their obligations under the terms of the contract, the potential for an illiquid secondary market, and/or the potential
| Semiannual Report | MS-23 |
FRANKLIN TEMPLETON VARIABLE INSURANCE PRODUCTS TRUST
NOTES TO FINANCIAL STATEMENTS (UNAUDITED)
Franklin Mutual Shares VIP Fund (continued)
1. Organization and Significant Accounting Policies (continued)
d. Derivative Financial Instruments (continued)
for market movements which expose the Fund to gains or losses in excess of the amounts shown in the Statement of Assets and Liabilities. Realized gain and loss and unrealized appreciation and depreciation on these contracts for the period are included in the Statement of Operations.
Derivative counterparty credit risk is managed through a formal evaluation of the creditworthiness of all potential counter-parties. The Fund attempts to reduce its exposure to counterparty credit risk on OTC derivatives, whenever possible, by entering into International Swaps and Derivatives Association (ISDA) master agreements with certain counterparties. These agreements contain various provisions, including but not limited to collateral requirements, events of default, or early termination. Termination events applicable to the counterparty include certain deteriorations in the credit quality of the counterparty. Termination events applicable to the Fund include failure of the Fund to maintain certain net asset levels and/or limit the decline in net assets over various periods of time. In the event of default or early termination, the ISDA master agreement gives the non-defaulting party the right to net and close-out all transactions traded, whether or not arising under the ISDA agreement, to one net amount payable by one counterparty to the other. However, absent an event of default or early termination, OTC derivative assets and liabilities are presented gross and not offset in the Statement of Assets and Liabilities. Early termination by the counterparty may result in an immediate payment by the Fund of any net liability owed to that counterparty under the ISDA agreement. At June 30, 2017, the Fund had OTC derivatives in a net liability position of $5,747,286 and the aggregate value of collateral pledged for such contracts was $4,636,950.
Collateral requirements differ by type of derivative. Collateral or initial margin requirements are set by the broker or exchange clearing house for exchange traded and centrally cleared derivatives. Initial margin deposited is held at the exchange and can be in the form of cash and/or securities. For OTC derivatives traded under an ISDA master agreement, posting of collateral is required by either the Fund or the applicable counterparty if the total net exposure of all OTC derivatives with the applicable counterparty exceeds the minimum transfer amount, which typically ranges from $100,000 to $250,000, and
can vary depending on the counterparty and the type of the agreement. Generally, collateral is determined at the close of Fund business each day and any additional collateral required due to changes in derivative values may be delivered by the Fund or the counterparty the next business day, or within a few business days. Collateral pledged and/or received by the Fund, if any, is held in segregated accounts with the Fund’s custodian/counterparty broker and can be in the form of cash and/or securities. Unrestricted cash may be invested according to the Fund’s investment objectives. To the extent that the amounts due to the Fund from its counterparties are not subject to collateralization or are not fully collateralized, the Fund bears the risk of loss from counterparty non-performance.
The Fund entered into exchange traded futures contracts primarily to manage exposure to certain foreign currencies. A futures contract is an agreement between the Fund and a counterparty to buy or sell an asset at a specified price on a future date. Required initial margins are pledged by the Fund, and the daily change in fair value is accounted for as a variation margin payable or receivable in the Statement of Assets and Liabilities.
The Fund entered into OTC forward exchange contracts primarily to manage exposure to certain foreign currencies. A forward exchange contract is an agreement between the Fund and a counterparty to buy or sell a foreign currency at a specific exchange rate on a future date.
See Note 9 regarding other derivative information.
e. Restricted Cash
At June 30, 2017, the Fund held restricted cash in connection with investments in certain derivative securities. Restricted cash is held in a segregated account with the Fund’s custodian and is reflected in the Statement of Assets and Liabilities.
f. Securities Sold Short
The Fund is engaged in selling securities short, which obligates the Fund to replace a borrowed security with the same security at current fair value. The Fund incurs a loss if the price of the security increases between the date of the short sale and the date on which the Fund replaces the borrowed security. The Fund realizes a gain if the price of the security declines between those dates. Gains are limited to the price at which the Fund sold the security short, while losses are potentially unlimited in size.
| MS-24 | Semiannual Report |
FRANKLIN TEMPLETON VARIABLE INSURANCE PRODUCTS TRUST
NOTES TO FINANCIAL STATEMENTS (UNAUDITED)
Franklin Mutual Shares VIP Fund (continued)
The Fund is required to establish a margin account with the broker lending the security sold short. While the short sale is outstanding, the broker retains the proceeds of the short sale to the extent necessary to meet margin requirements until the short position is closed out. A deposit must also be maintained with the Fund’s custodian/counterparty broker consisting of cash and/or securities having a value equal to a specified percentage of the value of the securities sold short. The Fund is obligated to pay fees for borrowing the securities sold short and is required to pay the counterparty any dividends and/or interest due on securities sold short. Such dividends and/or interest and any security borrowing fees are recorded as an expense to the Fund. At June 30, 2017, the Fund had no securities sold short.
g. Securities Lending
The Fund participates in an agency based securities lending program to earn additional income. The Fund receives cash collateral against the loaned securities in an amount equal to at least 102% of the fair value of the loaned securities. Collateral is maintained over the life of the loan in an amount not less than 100% of the fair value of loaned securities, as determined at the close of Fund business each day; any additional collateral required due to changes in security values is delivered to the Fund on the next business day. The collateral is deposited into a joint cash account with other funds and is used to invest in a money market fund managed by Franklin Advisers, Inc., an affiliate of the Fund, and/or a joint repurchase agreement. The Fund may receive income from the investment of cash collateral, in addition to lending fees and rebates paid by the borrower. Income from securities loaned, net of fees paid to the securities lending agent and/or third-party vendor, is reported separately in the Statement of Operations. The Fund bears the market risk with respect to the collateral investment, securities loaned, and the risk that the agent may default on its obligations to the Fund. If the borrower defaults on its obligation to return the securities loaned, the Fund has the right to repurchase the securities in the open market using the collateral received. The securities lending agent has agreed to indemnify the Fund in the event of default by a third party borrower. At June 30, 2017, the Fund had no securities on loan.
h. Senior Floating Rate Interests
The Fund invests in senior secured corporate loans that pay interest at rates which are periodically reset by reference to a base lending rate plus a spread. These base lending rates are generally the prime rate offered by a designated U.S. bank or
the London InterBank Offered Rate (LIBOR). Senior secured corporate loans often require prepayment of principal from excess cash flows or at the discretion of the borrower. As a result, actual maturity may be substantially less than the stated maturity. Senior secured corporate loans in which the Fund invests are generally readily marketable, but may be subject to certain restrictions on resale.
i. Income and Deferred Taxes
It is the Fund’s policy to qualify as a regulated investment company under the Internal Revenue Code. The Fund intends to distribute to shareholders substantially all of its taxable income and net realized gains to relieve it from federal income and if applicable, excise taxes. As a result, no provision for U.S. federal income taxes is required.
The Fund may be subject to foreign taxation related to income received, capital gains on the sale of securities and certain foreign currency transactions in the foreign jurisdictions in which it invests. Foreign taxes, if any, are recorded based on the tax regulations and rates that exist in the foreign markets in which the Fund invests. When a capital gain tax is determined to apply, the Fund records an estimated deferred tax liability in an amount that would be payable if the securities were disposed of on the valuation date. As a result of several court cases, in certain countries across the European Union, the Fund filed additional tax reclaims for previously withheld taxes on dividends earned in those countries (EU reclaims). These additional filings are subject to various administrative proceedings by the local jurisdictions’ tax authorities within the European Union, as well as a number of related judicial proceedings. Income recognized, if any, for EU reclaims is reflected as other income in the Statement of Operations and any related receivable, if any, is reflected as European Union tax reclaims in the Statement of Assets and Liabilities. When uncertainty exists as to the ultimate resolution of these proceedings, the likelihood of receipt of these EU reclaims, and the potential timing of payment, no amounts are reflected in the financial statements. For U.S. income tax purposes, when EU reclaims are received by the Fund and the Fund previously passed foreign tax credit on to its shareholders, the Fund must either amend historic tax reporting to shareholders or enter into a closing agreement with the Internal Revenue Service (IRS) in order to pay the associated tax liability on behalf of the Fund’s shareholders.
| Semiannual Report | MS-25 |
FRANKLIN TEMPLETON VARIABLE INSURANCE PRODUCTS TRUST
NOTES TO FINANCIAL STATEMENTS (UNAUDITED)
Franklin Mutual Shares VIP Fund (continued)
1. Organization and Significant Accounting Policies (continued)
i. Income and Deferred Taxes (continued)
The Fund may recognize an income tax liability related to its uncertain tax positions under U.S. GAAP when the uncertain tax position has a less than 50% probability that it will be sustained upon examination by the tax authorities based on its technical merits. As of June 30, 2017, the Fund has determined that no tax liability is required in its financial statements related to uncertain tax positions for any open tax years (or expected to be taken in future tax years). Open tax years are those that remain subject to examination and are based on each tax jurisdiction’s statute of limitation.
j. Security Transactions, Investment Income, Expenses and Distributions
Security transactions are accounted for on trade date. Realized gains and losses on security transactions are determined on a specific identification basis. Interest income and estimated expenses are accrued daily. Amortization of premium and accretion of discount on debt securities are included in interest income. Dividend income is recorded on the ex-dividend date except for certain dividends from securities where the dividend rate is not available. In such cases, the dividend is recorded as soon as the information is received by the Fund. Distributions to shareholders are recorded on the ex-dividend date. Distributable earnings are determined according to income tax regulations (tax basis) and may differ from earnings recorded in accordance with U.S. GAAP. These differences may be permanent or temporary. Permanent differences are reclassified among capital accounts to reflect their tax character. These reclassifications have no impact on net assets or the results of operations. Temporary differences are not reclassified, as they may reverse in subsequent periods.
Common expenses incurred by the Trust are allocated among the Funds based on the ratio of net assets of each Fund to the combined net assets of the Trust. Fund specific expenses are charged directly to the Fund that incurred the expense.
Realized and unrealized gains and losses and net investment income, not including class specific expenses, are allocated daily to each class of shares based upon the relative proportion of net assets of each class. Differences in per share distributions, by class, are generally due to differences in class specific expenses.
k. Accounting Estimates
The preparation of financial statements in accordance with U.S. GAAP requires management to make estimates and assumptions that affect the reported amounts of assets and liabilities at the date of the financial statements and the amounts of income and expenses during the reporting period. Actual results could differ from those estimates.
l. Guarantees and Indemnifications
Under the Trust’s organizational documents, its officers and trustees are indemnified by the Trust against certain liabilities arising out of the performance of their duties to the Trust. Additionally, in the normal course of business, the Trust, on behalf of the Fund, enters into contracts with service providers that contain general indemnification clauses. The Trust’s maximum exposure under these arrangements is unknown as this would involve future claims that may be made against the Trust that have not yet occurred. Currently, the Trust expects the risk of loss to be remote.
| MS-26 | Semiannual Report |
FRANKLIN TEMPLETON VARIABLE INSURANCE PRODUCTS TRUST
NOTES TO FINANCIAL STATEMENTS (UNAUDITED)
Franklin Mutual Shares VIP Fund (continued)
2. Shares of Beneficial Interest
At June 30, 2017, there were an unlimited number of shares authorized (without par value). Transactions in the Fund’s shares were as follows:
| Six Months Ended June 30, 2017 | Year Ended December 31, 2016 | |||||||||||||||||||
| Shares | Amount | Shares | Amount | |||||||||||||||||
| Class 1 Shares: | ||||||||||||||||||||
Shares sold | 1,296,286 | $ | 27,319,254 | 2,468,008 | $ | 48,112,430 | ||||||||||||||
Shares issued in reinvestment of distributions | — | — | 3,058,655 | 59,001,463 | ||||||||||||||||
Shares redeemed | (1,297,867 | ) | (27,470,482 | ) | (8,638,060 | ) | (161,517,789 | ) | ||||||||||||
|
| |||||||||||||||||||
Net increase (decrease) | (1,581 | ) | $ | (151,228 | ) | (3,111,397 | ) | $ | (54,403,896 | ) | ||||||||||
|
| |||||||||||||||||||
| Class 2 Shares: | ||||||||||||||||||||
Shares sold | 1,601,314 | $ | 33,376,951 | 19,363,703 | $ | 382,884,835 | ||||||||||||||
Shares issued in reinvestment of distributions | — | — | 18,848,893 | 358,317,454 | ||||||||||||||||
Shares redeemed | (13,052,336 | ) | (271,588,575 | ) | (32,549,983 | ) | (630,627,678 | ) | ||||||||||||
|
| |||||||||||||||||||
Net increase (decrease) | (11,451,022 | ) | $ | (238,211,624 | ) | 5,662,613 | $ | 110,574,611 | ||||||||||||
|
| |||||||||||||||||||
| Class 4 Shares: | ||||||||||||||||||||
Shares sold | 295,511 | $ | 6,220,300 | 203,267 | $ | 3,894,989 | ||||||||||||||
Shares issued in reinvestment of distributions | — | — | 634,967 | 12,165,958 | ||||||||||||||||
Shares redeemed | (705,187 | ) | (14,750,025 | ) | (1,564,342 | ) | (30,583,708 | ) | ||||||||||||
|
| |||||||||||||||||||
Net increase (decrease) | (409,676 | ) | $ | (8,529,725 | ) | (726,108 | ) | $ | (14,522,761 | ) | ||||||||||
|
| |||||||||||||||||||
3. Transactions with Affiliates
Franklin Resources, Inc. is the holding company for various subsidiaries that together are referred to as Franklin Templeton Investments. Certain officers trustees of the Fund are also officers and/or directors of the following subsidiaries:
| Subsidiary | Affiliation | |
Franklin Mutual Advisers, LLC (Franklin Mutual) | Investment manager | |
Franklin Templeton Services, LLC (FT Services) | Administrative manager | |
Franklin Templeton Distributors, Inc. (Distributors) | Principal underwriter | |
Franklin Templeton Investor Services, LLC (Investor Services) | Transfer agent |
a. Management Fees
The Fund pays an investment management fee to Franklin Mutual based on the average daily net assets of the Fund as follows:
| Annualized Fee Rate | Net Assets | |
0.750% | Up to and including $200 million | |
0.735% | Over $200 million, up to and including $700 million | |
0.700% | Over $700 million, up to and including $1.2 billion | |
0.675% | Over $1.2 billion, up to and including $5 billion | |
0.645% | Over $5 billion, up to and including $10 billion | |
0.625% | Over $10 billion, up to and including $15 billion | |
0.605% | Over $15 billion, up to and including $20 billion | |
0.585% | In excess of $20 billion |
| Semiannual Report | MS-27 |
FRANKLIN TEMPLETON VARIABLE INSURANCE PRODUCTS TRUST
NOTES TO FINANCIAL STATEMENTS (UNAUDITED)
Franklin Mutual Shares VIP Fund (continued)
3. Transactions with Affiliates (continued)
a. Management Fees (continued)
For the period ended June 30, 2017, the annualized effective investment management fee rate was 0.688% of the Fund’s average daily net assets.
b. Administrative Fees
Under an agreement with Franklin Mutual, FT Services provides administrative services to the Fund. The fee is paid by Franklin Mutual based on Fund’s average daily net assets, and is not an additional expense of the Fund.
c. Distribution Fees
The Board has adopted distribution plans for Class 2 and Class 4 shares pursuant to Rule 12b-1 under the 1940 Act. Under the Fund’s compensation distribution plans, the Fund pays Distributors for costs incurred in connection with the servicing, sale and distribution of the Fund’s shares up to 0.35% per year of its average daily net assets of of each class. The Board has agreed to limit the current rate to 0.25% per year for Class 2. The plan year, for purposes of monitoring compliance with the maximum annual plan rates, is February 1 through January 31.
d. Transfer Agent Fees
Investor Services, under terms of an agreement, performs shareholder servicing for the Fund and is not paid by the Fund for the services.
e. Investments in Affiliated Management Investment Companies
The Fund invests in one or more affiliated management investment companies for purposes other than exercising a controlling influence over the management or policies. Management fees paid by the Fund are waived on assets invested in the affiliated management investment companies, as noted in the Statement of Operations, in an amount not to exceed the management and administrative fees paid directly or indirectly by each affiliate. During the period ended June 30, 2017, the Fund held investments in affiliated management investment companies as follows:
Number of Shares Held at Beginning of Period | Gross Additions | Gross Reductions | Number of Shares Held at End of Period | Value at End of Period | Investment Income | Realized Gain (Loss) | % of Affiliated Fund Shares Outstanding Held at End of Period | |||||||||||||||||||||||||
| Non-Controlled Affiliates | ||||||||||||||||||||||||||||||||
Institutional Fiduciary Trust Money Market Portfolio, 0.58% | — | 86,287,000 | (86,287,000 | ) | — | $ | — | $ | — | $ | — | —% | ||||||||||||||||||||
|
| |||||||||||||||||||||||||||||||
f. Other Affiliated Transactions
At June 30, 2017, Franklin Templeton Variable Insurance Products Trust – Franklin Founding Funds Allocation VIP Fund owned 7.7% of the Fund’s outstanding shares.
4. Expense Offset Arrangement
The Fund has entered into an arrangement with its custodian whereby credits realized as a result of uninvested cash balances are used to reduce a portion of the Funds’ custodian expenses. During the period ended June 30, 2017, the custodian fees were reduced as noted in the Statements of Operations.
| MS-28 | Semiannual Report |
FRANKLIN TEMPLETON VARIABLE INSURANCE PRODUCTS TRUST
NOTES TO FINANCIAL STATEMENTS (UNAUDITED)
Franklin Mutual Shares VIP Fund (continued)
5. Income Taxes
At June 30, 2017, the cost of investments and net unrealized appreciation (depreciation) for income tax purposes were as follows:
Cost of investments. | $ | 3,360,338,989 | ||
|
| |||
Unrealized appreciation | $ | 1,233,181,771 | ||
Unrealized depreciation | (278,124,798 | ) | ||
|
| |||
Net unrealized appreciation (depreciation) | $ | 955,056,973 | ||
|
|
Differences between income and/or capital gains as determined on a book basis and a tax basis are primarily due to differing treatments of foreign currency transactions.
6. Investment Transactions
Purchases and sales of investments (excluding short term securities) for the period ended June 30, 2017, aggregated $350,876,789 and $513,592,020, respectively.
7. Credit Risk and Defaulted Securities
The Fund may purchase the pre-default or defaulted debt of distressed companies. Distressed companies are financially troubled and could be or are already involved in financial restructuring or bankruptcy. Risks associated with purchasing these securities include the possibility that the bankruptcy or other restructuring process takes longer than expected, or that distributions in restructuring are less than anticipated, either or both of which may result in unfavorable consequences to the Fund. If it becomes probable that the income on debt securities, including those of distressed companies, will not be collected, the Fund discontinues accruing income and recognizes an adjustment for uncollectible interest.
At June 30, 2017, the aggregate long value of distressed company securities for which interest recognition has been discontinued was $81,401,458, representing 1.9% of the Fund’s net assets. For information as to specific securities, see the accompanying Statement of Investments.
8. Restricted Securities
The Fund invests in securities that are restricted under the Securities Act of 1933 (1933 Act) or which are subject to legal, contractual, or other agreed upon restrictions on resale. Restricted securities are often purchased in private placement transactions, and cannot be sold without prior registration unless the sale is pursuant to an exemption under the 1933 Act. Disposal of these securities may require greater effort and expense, and prompt sale at an acceptable price may be difficult. The Fund may have registration rights for restricted securities. The issuer generally incurs all registration costs.
At June 30, 2017, investments in restricted securities, excluding certain securities exempt from registration under the 1933 Act deemed to be liquid, were as follows:
| Principal Amount/ Shares | Issuer | Acquisition Date | Cost | Value | ||||||||||
| 1,754 | Broadband Ventures III LLC, secured promissory note, 5.00%, 2/01/12 | 7/01/10 - 11/30/12 | $ | 1,754 | $ | — | ||||||||
| 6,400,507 | CB FIM Coinvestors LLC. | 1/15/09 - 6/02/09 | — | — | ||||||||||
| 8,006,950 | FIM Coinvestor Holdings I, LLC | 11/20/06 - 6/02/09 | — | — | ||||||||||
| 48,169 | Gulfmark Offshore Inc | 1/06/17 | 86,699 | 10,067 | ||||||||||
| 1,730,515 | International Automotive Components Group Brazil LLC | 4/13/06 - 12/26/08 | 1,149,241 | 42,327 | ||||||||||
| Semiannual Report | MS-29 |
FRANKLIN TEMPLETON VARIABLE INSURANCE PRODUCTS TRUST
NOTES TO FINANCIAL STATEMENTS (UNAUDITED)
Franklin Mutual Shares VIP Fund (continued)
8. Restricted Securities (continued)
| Principal Amount/ Shares | Issuer | Acquisition Date | Cost | Value | ||||||||||
| 15,382,424 | International Automotive Components Group North America LLC | 1/12/06 - 3/18/13 | $ | 12,591,586 | $ | 9,468,128 | ||||||||
| 361,612 | Warrior Met Coal Inc. | 3/31/16 | 2,074,365 | 5,915,616 | ||||||||||
|
| |||||||||||||
Total Restricted Securities (Value is 0.4% of Net Assets) | $ | 15,903,645 | $ | 15,436,138 | ||||||||||
|
| |||||||||||||
9. Other Derivative Information
At June 30, 2017, the Fund’s investments in derivative contracts are reflected in the Statement of Assets and Liabilities as follows:
Asset Derivatives | Liability Derivatives | |||||||||||
| Derivative Contracts Not Accounted for as Hedging Instruments | Statement of Assets and Liabilities Location | Fair Value | Statement of Assets and Liabilities Location | Fair Value | ||||||||
Foreign exchange contracts | Variation margin | $ | 3,431,716 | a | ||||||||
| Unrealized appreciation on OTC forward exchange contracts | $ | 1,049,656 | Unrealized depreciation on OTC forward exchange contracts | 6,558,484 | ||||||||
|
|
|
| |||||||||
Totals | $ | 1,049,656 | $ | 9,990,200 | ||||||||
|
|
|
| |||||||||
aThis amount reflects the cumulative appreciation (depreciation) of futures contracts as reported in the Statement of Investments. Only the variation margin receivable/ payable at year end is separately reported within the Statement of Assets and Liabilities. Prior variation margin movements were recorded to cash upon receipt or payment.
For the period ended June 30, 2017, the effect of derivative contracts in the Fund’s Statement of Operations was as follows:
| Derivative Contracts Not Accounted for as Hedging Instruments | Statement of Operations Location | Net Realized Gain (Loss) for the Period | Statement of Operations Location | Net Change in Unrealized Appreciation (Depreciation) for the Period | ||||||||
| Net realized gain (loss) from: | Net change in unrealized appreciation (depreciation) on: | |||||||||||
Foreign exchange contracts | Foreign currency transactions | $ | (7,525,031 | )a | Translation of other assets and liabilities denominated in foreign currencies | $ | (8,921,806 | )a | ||||
| Futures contracts | (3,891,018 | ) | Futures contracts | (6,056,813 | ) | |||||||
|
|
|
| |||||||||
Totals | $ | (11,416,049 | ) | $ | (14,978,619 | ) | ||||||
|
|
|
| |||||||||
aForward exchange contracts are included in net realized gain (loss) from foreign currency transactions and net change in unrealized appreciation (depreciation) on translation of other assets and liabilities denominated in foreign currencies in the Statement of Operations.
For the period ended June 30, 2017, the average month end notional amount of futures contracts represented $171,522,326. The average month end contract value of forward exchange contracts was $285,137,395.
See Notes 1(d) regarding derivative financial instruments.
| MS-30 | Semiannual Report |
FRANKLIN TEMPLETON VARIABLE INSURANCE PRODUCTS TRUST
NOTES TO FINANCIAL STATEMENTS (UNAUDITED)
Franklin Mutual Shares VIP Fund (continued)
10. Holdings of 5% Voting Securities of Portfolio Companies
The 1940 Act defines “affiliated companies” to include investments in portfolio companies in which a fund owns 5% or more of the outstanding voting securities. During the period ended June 30, 2017, investments in “affiliated companies” were as follows:
| Name of Issuer | Number of Shares Held at Beginning of Period | Gross Additions | Gross Reductions | Number of Shares of Period | Value at End of Period | Investment Income | Realized Gain (Loss) | |||||||||||||||||||||
CB FIM Coinvestors LLC (Value is 0.0% of Net Assets) | 6,400,507 | — | — | 6,400,507 | $ | — | $ | — | $ | — | ||||||||||||||||||
|
| |||||||||||||||||||||||||||
11. Credit Facility
The Fund, together with other U.S. registered and foreign investment funds (collectively, Borrowers), managed by Franklin Templeton Investments, are borrowers in a joint syndicated senior unsecured credit facility totaling $2 billion (Global Credit Facility) which matures on February 9, 2018. This Global Credit Facility provides a source of funds to the Borrowers for temporary and emergency purposes, including the ability to meet future unanticipated or unusually large redemption requests.
Under the terms of the Global Credit Facility, the Fund shall, in addition to interest charged on any borrowings made by the Fund and other costs incurred by the Fund, pay its share of fees and expenses incurred in connection with the implementation and maintenance of the Global Credit Facility, based upon its relative share of the aggregate net assets of all of the Borrowers, including an annual commitment fee of 0.15% based upon the unused portion of the Global Credit Facility. These fees are reflected in other expenses in the Statement of Operations. During the period ended June 30, 2017, the Fund did not use the Global Credit Facility.
12. Fair Value Measurements
The Fund follows a fair value hierarchy that distinguishes between market data obtained from independent sources (observable inputs) and the Fund’s own market assumptions (unobservable inputs). These inputs are used in determining the value of the Fund’s financial instruments and are summarized in the following fair value hierarchy:
| • | Level 1 – quoted prices in active markets for identical financial instruments |
| • | Level 2 – other significant observable inputs (including quoted prices for similar financial instruments, interest rates, prepayment speed, credit risk, etc.) |
| • | Level 3 – significant unobservable inputs (including the Fund’s own assumptions in determining the fair value of financial instruments) |
The input levels are not necessarily an indication of the risk or liquidity associated with financial instruments at that level. For movements between the levels within the fair value hierarchy, the Fund has adopted a policy of recognizing the transfers as of the date of the underlying event which caused the movement.
| Semiannual Report | MS-31 |
FRANKLIN TEMPLETON VARIABLE INSURANCE PRODUCTS TRUST
NOTES TO FINANCIAL STATEMENTS
Franklin Mutual Shares VIP Fund (continued)
12. Fair Value Measurements (continued)
A summary of inputs used as of June 30, 2017, in valuing the Fund’s assets and liabilities carried at fair value, is as follows:
| Level 1 | Level 2 | Level 3 | Total | |||||||||||||
| Assets: | ||||||||||||||||
Investments in Securities: | ||||||||||||||||
Equity Investments:a | ||||||||||||||||
Auto Components | $ | 22,117,024 | $ | — | $ | 9,510,455 | $ | 31,627,479 | ||||||||
Energy Equipment & Services | 54,710,870 | — | 10,067 | 54,720,937 | ||||||||||||
Machinery | 69,304,902 | 20,893,272 | — | 90,198,174 | ||||||||||||
Metals & Mining | 32,591,299 | — | 5,915,616 | 38,506,915 | ||||||||||||
All Other Equity Investmentsb | 3,562,631,810 | — | — | c | 3,562,631,810 | |||||||||||
Corporate Bonds, Notes and Senior Floating | ||||||||||||||||
Rate Interests | — | 143,352,961 | — | 143,352,961 | ||||||||||||
Corporate Notes and Senior Floating Rate | ||||||||||||||||
Interests in Reorganization | — | 68,951,968 | — | c | 68,951,968 | |||||||||||
Companies in Liquidation | — | 5,565,237 | 1,507,146 | c | 7,072,383 | |||||||||||
Municipal Bonds in Reorganization | — | 12,449,490 | — | 12,449,490 | ||||||||||||
Short Term Investments | 201,485,220 | 104,398,625 | — | 305,883,845 | ||||||||||||
|
| |||||||||||||||
Total Investments in Securities | $ | 3,942,841,125 | $ | 355,611,553 | $ | 16,943,284 | $ | 4,315,395,962 | ||||||||
|
| |||||||||||||||
Other Financial Instruments: | ||||||||||||||||
Forward Exchange Contracts | $ | — | $ | 1,049,656 | $ | — | $ | 1,049,656 | ||||||||
|
| |||||||||||||||
| Liabilities: | ||||||||||||||||
Other Financial Instruments: | ||||||||||||||||
Futures Contracts | $ | 3,431,716 | $ | — | $ | — | $ | 3,431,716 | ||||||||
Forward Exchange Contracts | — | 6,558,484 | — | 6,558,484 | ||||||||||||
|
| |||||||||||||||
Total Other Financial Instruments | $ | 3,431,716 | $ | 6,558,484 | $ | — | $ | 9,990,200 | ||||||||
|
| |||||||||||||||
aIncludes common stocks and other equity investments.
bFor detailed categories, see the accompanying Statement of Investments.
cIncludes securities determined to have no value at June 30, 2017.
A reconciliation of assets in which Level 3 inputs are used in determining fair value is presented when there are significant Level 3 financial instruments at the end of the period.
13. New Accounting Pronouncements
In March 2017, the Financial Accounting Standards Board (FASB) issued Accounting Standards Update (ASU) No. 2017-08, Receivables — Nonrefundable Fees and Other Costs (Subtopic 310-20): Premium Amortization on Purchased Callable Debt Securities. The amendments in the ASU shorten the amortization period for certain callable debt securities, held at a premium, to be amortized to the earliest call date. The ASU does not require an accounting change for securities held at a discount; which continues to be amortized to maturity. The ASU is effective for fiscal years and interim periods within those fiscal years beginning after December 15, 2018. Management is currently evaluating the impact, if any, of applying this provision.
14. Investment Company Reporting Modernization
In October 2016, the U.S. Securities and Exchange Commission adopted new rules and amended existing rules (together, final rules) intended to modernize the reporting and disclosure of information by registered investment companies. In part, the final rules amend Regulation S-X and require standardized, enhanced disclosures about derivatives in investment company financial statements, as
| MS-32 | Semiannual Report |
FRANKLIN TEMPLETON VARIABLE INSURANCE PRODUCTS TRUST
NOTES TO FINANCIAL STATEMENTS (UNAUDITED)
Franklin Mutual Shares VIP Fund (continued)
well as other amendments. The compliance date for the amendments to Regulation S-X is August 1, 2017. Management has reviewed the requirements and believes the adoption of the amendments to Regulation S-X will not have a material impact on the Fund’s financial statements and related disclosures.
15. Subsequent Events
The Fund has evaluated subsequent events through the issuance of the financial statements and determined that no events have occurred that require disclosure.
Abbreviations
| Counterparty | Currency | Selected Portfolio | ||||||||
| BOFA | Bank of America Corp. | EUR | Euro | ADR | American Depositary Receipt | |||||
| BONY | The Bank of New York Mellon Corp. | GBP | British Pound | DIP | Debtor-In-Possession | |||||
| HSBK | HSBC Bank PLC | USD | United States Dollar | FHLB | Federal Home Loan Bank | |||||
| SSBT | State Street Bank | GO | General Obligation | |||||||
| UBSW | UBS AG | TRA | Tax Receivable Agreement | |||||||
| Semiannual Report | MS-33 |
This page intentionally left blank.
Franklin Rising Dividends VIP Fund
This semiannual report for Franklin Rising Dividends VIP Fund covers the period ended June 30, 2017.
Class 1 Performance Summary as of June 30, 2017
The Fund’s Class 1 Shares delivered a +8.31% total return* for the six-month period ended June 30, 2017.
*The Fund has a fee waiver associated with any investment it makes in a Franklin Templeton money fund and/or other Franklin Templeton fund, contractually guaranteed through 4/30/18. Fund investment results reflect the fee waiver; without this waiver, the results would have been lower.
Performance reflects the Fund’s Class 1 operating expenses, but does not include any contract fees, expenses or sales charges. If they had been included, performance would be lower. These charges and deductions, particularly for variable life policies, can have a significant effect on contract values and insurance benefits. See the contract prospectus for a complete description of these expenses, including sales charges.
Performance data represent past performance, which does not guarantee future results. Investment return and principal value will fluctuate, and you may have a gain or loss when you sell your shares. Current performance may differ from figures shown.
| Semiannual Report | FRD-1 |
FRANKLIN RISING DIVIDENDS VIP FUND
Fund Goal and Main Investments
The Fund seeks long-term capital appreciation, with preservation of capital as an important consideration. Under normal market conditions, the Fund invests at least 80% of its net assets in equity securities of companies that have paid rising dividends.
Fund Risks
All investments involve risks, including possible loss of principal. Value securities may not increase in price as anticipated or may decline further in value. While smaller and midsized companies may offer substantial opportunities for capital growth, they also involve heightened risks and should be considered speculative. Historically, smaller- and midsized-company securities have been more volatile in price than larger company securities, especially over the short term. The Fund is actively managed but there is no guarantee that the manager’s investment decisions will produce the desired results. The Fund’s prospectus also includes a description of the main investment risks.
Performance Overview
You can find the Fund’s six-month total return in the Performance Summary. In comparison, the Standard & Poor’s® 500 Index (S&P 500®) rose +9.34% for the same period.1 Please note the Fund employs a bottom-up stock selection process, and the managers invest in securities without regard to benchmark comparisons.
Economic and Market Overview
U.S. economic growth decelerated in 2017’s first quarter, largely due to slower growth in consumer spending and declines in private inventory investment and government spending. However, growth accelerated in the second quarter due to increases in consumer spending, business investment and federal government spending. The manufacturing sector generally expanded, and the services sector also continued to grow. The unemployment rate decreased from 4.7% in December 2016 to 4.4% at period-end.2 Monthly retail sales were volatile, but grew for most of the period. Annual inflation, as measured by the Consumer Price Index, decreased from 2.1% to 1.6% during the period.
The U.S. Federal Reserve (Fed), at its March meeting, increased the federal funds target rate from 0.50%–0.75% to 0.75%–1.00%. The Fed again increased its target range by a quarter point to 1.00%–1.25% at its June meeting. The Fed made both of these increases amid signs of a growing U.S. economy, a strengthening labor market and an improvement in business spending.
U.S. equity markets rose during the period, benefiting from mostly upbeat economic data, better U.S. corporate earnings and signs of improvement in the Chinese and European economies. Investor optimism arising from pro-growth and pro-business policy plans in the U.S. and the victory of Emmanuel Macron as France’s President also helped U.S. equities. However, concerns about the terms of the U.K.’s exit from the European Union (also known as “Brexit”), uncertainty about President Trump’s ability to implement reforms, and geopolitical tensions in the Middle East and the Korean peninsula curbed market sentiment. The broad U.S. stock market, as measured by the S&P 500, generated a +9.34% total return for the period.1
Investment Strategy
We are a research-driven, fundamental investment adviser, pursuing a disciplined value-oriented strategy. As bottom-up investors concentrating primarily on individual securities, we seek fundamentally sound companies that we believe meet our screening criteria, which include consistent, substantial dividend increases; reinvested earnings; and strong balance sheets. We attempt to acquire such stocks at attractive prices, often when they are out of favor with other investors. In following these criteria, we do not necessarily focus on companies whose securities pay a high dividend but rather on companies that consistently raise their dividends.
Manager’s Discussion
During the six-month period ended June 30, 2017, some holdings that contributed to absolute performance included Roper Technologies, Albemarle and Medtronic.
Roper Technologies, a diversified industrial company, enjoyed strong stock price performance after reporting robust financial results during the period. Headwinds facing the energy and industrial technology segments have moderated and the
1. Source: Morningstar.
One cannot invest directly in an index, and an index is not representative of the Fund’s portfolio. Please see Index Descriptions following the Fund Summaries.
2. Source: Bureau of Labor Statistics.
The dollar value, number of shares or principal amount, and names of all portfolio holdings are listed in the Fund’s Statement of Investments (SOI).
| FRD-2 | Semiannual Report |
FRANKLIN RISING DIVIDENDS VIP FUND
segments generated better-than-expected results, while the remaining segments have continued to perform well. The company expects to build on its strong performance in the RF (radio frequency) Technology and Software segment, which was driven by large project wins. The company has grown its dividend for 24 consecutive years.
Shares of Albemarle, a specialty chemicals producer, performed well over the period, as the company continued to report strong revenue and earnings growth driven by robust demand in the company’s lithium business. Albemarle also benefited from stronger-than-expected performance in its bromine business, while the company’s Refining Solutions business experienced more mixed performance during the period. Management continues to focus on expanding the company’s market leading position in lithium. The company has increased its dividend for 23 consecutive years.
Shares of Medtronic, a developer of therapeutic and diagnostic medical products, rose after reporting good earnings during the period. We believe top-line growth could remain solid, based on a regular stream of innovation. Overall financial performance could be further bolstered by margin expansion driven by factory consolidation and the creation of shared service centers. Medtronic has benefited from improved access to its overseas cash via the company’s recent relocation of its legal domicile to a lower-tax nation, particularly from the perspective of meeting its dividend obligations. The company has grown its dividend for 40 consecutive years.
Conversely, some holdings that detracted from absolute performance included Schlumberger, Matthews International and Occidental Petroleum.
Despite reporting earnings in line with expectations, shares of Schlumberger, a global oilfield services company, declined over the period as the oil markets remained in a position of significant oversupply, reducing prospects for a near-term rebound in oil prices. Oil services providers such as Schlumberger tend to benefit later in an oil price rebound as their diverse activities tend to lead to a slower return to growth. Despite the current headwinds, we believe that Schlumberger could be uniquely well-positioned to benefit from the recovery in oil prices if it takes shape, given the company’s scale and scope of activities.
Despite announcing financial results largely in line with expectations, shares in Matthews International, a small industrial conglomerate with activities ranging from branding products and services, marketing display equipment and a range of death-care products, were weak during the period,
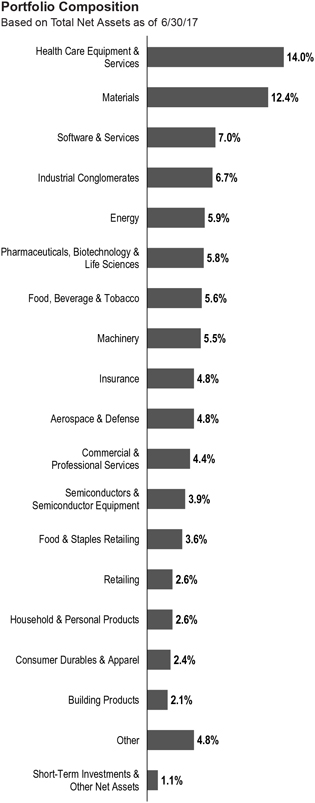
largely driven by slower-than-expected activity in the SGK Brand Solutions business. We believe that the company remains on track to meet its full-year financial earnings guidance and continues to enjoy a number of potential
| Semiannual Report | FRD-3 |
FRANKLIN RISING DIVIDENDS VIP FUND
performance catalysts, including acquisition integration synergies, the benefits of a recent investment in an enterprise resource planning system and product innovation. Matthews has raised its dividend for 22 consecutive years.
Shares in Occidental Petroleum, an oil and gas producer, were weak during the period as the energy sector continued to struggle in a lower oil price environment. Despite stronger-than-expected earnings over the period, Occidental’s share performance could not escape an industry-wide downdraft. We believe the market does not fully appreciate the strength of Occidental’s position in the Permian Basin, which could resume production growth despite low oil prices. Although Occidental has been slow to increase its production in the basin, management expects strong growth in the region going forward that could drive long-term overall production growth. Occidental has increased its dividend for 14 consecutive years.
During the period, the Fund initiated a new position in Comcast, a telecommunications conglomerate (9 consecutive years of dividend increases). We added to existing positions including Analog Devices, an integrated circuits manufacturer (14 consecutive years of dividend increases), Accenture, a management consultant and professional services company (12 consecutive years of dividend increases) and Texas Instruments, a semiconductor designer and manufacturer (13 consecutive years of dividend increases).
We exited positions in Qualcomm, along with Adient and Yum China Holdings, both of which we received as the result of spinoffs. We also reduced several holdings including Dover, Erie Indemnity and Hillenbrand. Additionally, Linear Technology was acquired by Analog Devices, during the period.
Our 10 largest positions on June 30, 2017, represented 34.1% of the Fund’s total net assets. It is interesting to note how these 10 companies would respond to the Fund’s screening criteria based on a simple average of statistical measures. On average, these 10 companies have raised their dividends 28 years in a row and by 260% over the past 10 years. Their most recent year-over-year dividend increases averaged 8.9% with a dividend yield of 1.7% on June 30, 2017, and a dividend payout ratio of 36.8%, based on estimates of calendar year 2017 operating earnings. Their average price/earnings ratio was 23.2 times calendar year 2017 estimates versus 18.6 for that of the unmanaged S&P 500.
| Top 10 Holdings | ||||
6/30/17
| ||||
| Company Sector/Industry | % of Total Net Assets | |||
| Roper Technologies Inc. Industrial Conglomerates | 4.3% | |||
| Microsoft Corp. Software & Services | 4.3% | |||
| Albemarle Corp. Materials | 4.2% | |||
| Stryker Corp. Health Care Equipment & Services | 3.3% | |||
| Becton, Dickinson and Co. Health Care Equipment & Services | 3.2% | |||
| United Technologies Corp. Aerospace & Defense | 3.1% | |||
| Medtronic PLC Health Care Equipment & Services | 3.0% | |||
| Praxair Inc. Materials | 3.0% | |||
| West Pharmaceutical Services Inc. Health Care Equipment & Services | 2.9% | |||
| Air Products and Chemicals Inc. Materials | 2.8% | |||
Thank you for your participation in Franklin Rising Dividends VIP Fund. We look forward to continuing to serve your investment needs.
The foregoing information reflects our analysis, opinions and portfolio holdings as of June 30, 2017, the end of the reporting period. The way we implement our main investment strategies and the resulting portfolio holdings may change depending on factors such as market and economic conditions. These opinions may not be relied upon as investment advice or an offer for a particular security. The information is not a complete analysis of every aspect of any market, country, industry, security or the Fund. Statements of fact are from sources considered reliable, but the investment manager makes no representation or warranty as to their completeness or accuracy. Although historical performance is no guarantee of future results, these insights may help you understand our investment management philosophy.
| FRD-4 | Semiannual Report |
FRANKLIN RISING DIVIDENDS VIP FUND
Class 1 Fund Expenses
As an investor in a variable insurance contract (Contract) that indirectly provides for investment in an underlying mutual fund, you can incur transaction and/or ongoing expenses at both the Fund level and the Contract Level: (1) transaction expenses can include sales charges (loads) on purchases, surrender fees, transfer fees and premium taxes; and (2) ongoing expenses can include management fees, distribution and service (12b-1) fees, contract fees, annual maintenance fees, mortality and expense risk fees and other fees and expenses. All mutual funds and Contracts have some types of ongoing expenses. The table below shows Fund-level ongoing expenses and can help you understand these costs and compare them with those of other mutual funds offered through the Contract. The table assumes a $1,000 investment held for the six months indicated. Please refer to the Fund prospectus for additional information on operating expenses.
Actual Fund Expenses
The table below provides information about the actual account values and actual expenses in the columns under the heading “Actual.” In these columns the Fund’s actual return, which includes the effect of ongoing Fund expenses but does not include the effect of ongoing Contract expenses, is used to calculate the “Ending Account Value.” You can estimate the Fund-level expenses you paid during the period by following these steps (of course, your account value and expenses will differ from those in this illustration): Divide your account value by $1,000 (if your account had an $8,600 value, then $8,600 ÷ $1,000 = 8.6). Then multiply the result by the number under the headings “Actual” and “Fund-Level Expenses Paid During Period” (if Fund-Level Expenses Paid During Period were $7.50, then 8.6 × $7.50 = $64.50). In this illustration, the estimated expenses paid this period at the Fund level are $64.50.
Hypothetical Example for Comparison with Other Mutual Funds
Under the heading “Hypothetical” in the table, information is provided about hypothetical account values and hypothetical expenses based on the Fund’s actual expense ratio and an assumed rate of return of 5% per year before expenses, which is not the Fund’s actual return. This information may not be used to estimate the actual ending account balance or expenses you paid for the period, but it can help you compare ongoing costs of investing in the Fund with those of other mutual funds offered through the Contract. To do so, compare this 5% hypothetical example with the 5% hypothetical examples that appear in the shareholder reports of other funds offered through the Contract.
Please note that expenses shown in the table are meant to highlight ongoing costs at the Fund level only and do not reflect any ongoing expenses at the Contract level, or transaction expenses at either the Fund or Contract levels. In addition, while the Fund does not have transaction expenses, if the transaction and ongoing expenses at the Contract level were included, the expenses shown below would be higher. You should consult your Contract prospectus or disclosure document for more information.
| Actual (actual return after expenses) | Hypothetical (5% annual return before expenses) | |||||||||||||||||||||||
| Share Class | | Beginning Account Value 1/1/17 | | | Ending Account Value 6/30/17 | | | Fund-Level Expenses Paid | | | Ending Account Value 6/30/17 | | | Fund-Level Expenses Paid | | | Net Annualized Ratio | 2 | ||||||
Class 1 | $1,000 | $1,083.10 | $3.20 | $1,021.72 | $3.11 | 0.62 | % | |||||||||||||||||
1. Expenses are equal to the annualized expense ratio for the six-month period as indicated above — in the far right column — multiplied by the simple average account value over the period indicated, and then multiplied by 181/365 to reflect the one-half year period.
2. Reflects expenses after fee waivers and expense reimbursements. Does not include any ongoing expenses of the Contract for which the Fund is an investment option or acquired fund fees and expenses.
| Semiannual Report | FRD-5 |
FRD1 P1 P2 P4 06/17
TO THE PROSPECTUSES DATED MAY 1, 2017
OF
FRANKLIN RISING DIVIDENDS VIP FUND
(a series of Franklin Templeton Variable Insurance Products Trust)
Effective June 30, 2017, the Prospectus is amended as follows:
I. The section in the Fund Summary under the heading “Portfolio Managers” on page FRD-S4 is revised as follows:
Portfolio Managers
Donald G. Taylor, CPA President and Chief Investment Officer of Advisory Services and portfolio manager of the Fund since 1996.
Nicholas P. B. Getaz, CFA Research Analyst of Advisory Services and portfolio manager of the Fund since 2014.
II. In the Fund Details, under the heading “Management”, the portfolio manager information on page FRD-D6 is revised as follows:
Franklin Advisory Services, LLC (Advisory Services), 101 John F. Kennedy Parkway, Short Hills, NJ 07078, is the Fund’s investment manager.
The Fund is managed by a team of dedicated professionals focused on investments that have paid rising dividends. The portfolio managers of the team are as follows:
Donald G. Taylor, CPA President and Chief Investment Officer of Advisory Services | Mr. Taylor has been the lead portfolio manager of the Fund since 1996. He has primary responsibility for the investments of the Fund. He has final authority over all aspects of the Fund’s investment portfolio, including but not limited to, purchases and sales of individual securities, portfolio risk assessment, and the management of daily cash balances in accordance with anticipated investment management requirements. The degree to which he may perform these functions, and the nature of these functions, may change from time to time. He joined Franklin Templeton Investments in 1996. | |
Nicholas P. B. Getaz, CFA Research Analyst of Advisory Services | Mr. Getaz has been portfolio manager of the Fund since 2014, providing support to the lead portfolio manager(s) as needed. He joined Franklin Templeton Investments in 2011. | |
Please keep this supplement with your prospectus for future reference.
| FRD-6 |
FRANKLIN TEMPLETON VARIABLE INSURANCE PRODUCTS TRUST
Financial Highlights
Franklin Rising Dividends VIP Fund
Six Months Ended (unaudited) | Year Ended December 31, | |||||||||||||||||||||||
| 2016 | 2015 | 2014 | 2013 | 2012 | ||||||||||||||||||||
| Class 1 | ||||||||||||||||||||||||
Per share operating performance (for a share outstanding throughout the period) | ||||||||||||||||||||||||
Net asset value, beginning of period | $25.51 | $25.26 | $29.63 | $28.14 | $22.03 | $20.01 | ||||||||||||||||||
|
| |||||||||||||||||||||||
| Income from investment operationsa: | ||||||||||||||||||||||||
Net investment incomeb | 0.20 | 0.42 | 0.45 | 0.45 | 0.40 | 0.41 | ||||||||||||||||||
Net realized and unrealized gains (losses) | 1.93 | 3.45 | (1.33 | ) | 2.03 | 6.16 | 2.00 | |||||||||||||||||
|
| |||||||||||||||||||||||
Total from investment operations | 2.13 | 3.87 | (0.88 | ) | 2.48 | 6.56 | 2.41 | |||||||||||||||||
|
| |||||||||||||||||||||||
| Less distributions from: | ||||||||||||||||||||||||
Net investment income | (0.48 | ) | (0.44 | ) | (0.48 | ) | (0.44 | ) | (0.45 | ) | (0.39 | ) | ||||||||||||
Net realized gains | (0.98 | ) | (3.18 | ) | (3.01 | ) | (0.55 | ) | — | — | ||||||||||||||
|
| |||||||||||||||||||||||
Total distributions | (1.46 | ) | (3.62 | ) | (3.49 | ) | (0.99 | ) | (0.45 | ) | (0.39 | ) | ||||||||||||
|
| |||||||||||||||||||||||
Net asset value, end of period | $26.18 | $25.51 | $25.26 | $29.63 | $28.14 | $22.03 | ||||||||||||||||||
|
| |||||||||||||||||||||||
Total returnc | 8.31% | 16.33% | (3.42)% | 9.01% | 30.05% | 12.18% | ||||||||||||||||||
| Ratios to average net assetsd | ||||||||||||||||||||||||
Expenses before waiver and payments by affiliates | 0.62% | 0.63% | 0.63% | 0.62% | 0.61% | 0.63% | ||||||||||||||||||
Expenses net of waiver and payments by affiliates | 0.62% | e | 0.62% | f | 0.63% | e | 0.62% | e | 0.61% | 0.63% | ||||||||||||||
Net investment income | 1.52% | 1.67% | 1.65% | 1.58% | 1.59% | 1.96% | ||||||||||||||||||
| Supplemental data | ||||||||||||||||||||||||
Net assets, end of period (000’s) | $201,553 | $181,072 | $143,376 | $160,480 | $168,380 | $141,455 | ||||||||||||||||||
Portfolio turnover rate | 2.82% | 6.66% | 4.74% | 8.61% | 0.07% | 11.19% | ||||||||||||||||||
aThe amount shown for a share outstanding throughout the period may not correlate with the Statement of Operations for the period due to the timing of sales and repurchases of the Fund’s shares in relation to income earned and/or fluctuating fair value of the investments of the Fund.
bBased on average daily shares outstanding.
cTotal return does not include fees, charges or expenses imposed by the variable annuity and life insurance contracts for which Franklin Templeton Variable Insurance Products Trust serves as an underlying investment vehicle. Total return is not annualized for periods less than one year.
dRatios are annualized for periods less than one year.
eBenefit of waiver and payments by affiliates rounds to less than 0.01%.
fBenefit of expense reduction rounds to less than 0.01%.
| The accompanying notes are an integral part of these financial statements. | Semiannual Report | FRD-7 |
FRANKLIN TEMPLETON VARIABLE INSURANCE PRODUCTS TRUST
FINANCIAL HIGHLIGHTS
Franklin Rising Dividends VIP Fund (continued)
Six Months Ended (unaudited) | Year Ended December 31, | |||||||||||||||||||||||
| 2016 | 2015 | 2014 | 2013 | 2012 | ||||||||||||||||||||
| Class 2 | ||||||||||||||||||||||||
Per share operating performance (for a share outstanding throughout the period) | ||||||||||||||||||||||||
Net asset value, beginning of period | $24.89 | $24.72 | $29.06 | $27.62 | $21.64 | $19.65 | ||||||||||||||||||
|
| |||||||||||||||||||||||
| Income from investment operationsa: | ||||||||||||||||||||||||
Net investment incomeb | 0.16 | 0.35 | 0.37 | 0.37 | 0.33 | 0.35 | ||||||||||||||||||
Net realized and unrealized gains (losses) | 1.88 | 3.37 | (1.29 | ) | 1.99 | 6.04 | 1.98 | |||||||||||||||||
|
| |||||||||||||||||||||||
Total from investment operations | 2.04 | 3.72 | (0.92 | ) | 2.36 | 6.37 | 2.33 | |||||||||||||||||
|
| |||||||||||||||||||||||
| Less distributions from: | ||||||||||||||||||||||||
Net investment income | (0.41 | ) | (0.37 | ) | (0.41 | ) | (0.37 | ) | (0.39 | ) | (0.34 | ) | ||||||||||||
Net realized gains | (0.98 | ) | (3.18 | ) | (3.01 | ) | (0.55 | ) | — | — | ||||||||||||||
|
| |||||||||||||||||||||||
Total distributions | (1.39 | ) | (3.55 | ) | (3.42 | ) | (0.92 | ) | (0.39 | ) | (0.34 | ) | ||||||||||||
|
| |||||||||||||||||||||||
Net asset value, end of period | $25.54 | $24.89 | $24.72 | $29.06 | $27.62 | $21.64 | ||||||||||||||||||
|
| |||||||||||||||||||||||
Total returnc | 8.19% | 16.04% | (3.65)% | 8.72% | 29.69% | 11.96% | ||||||||||||||||||
| Ratios to average net assetsd | ||||||||||||||||||||||||
Expenses before waiver and payments by affiliates | 0.87% | 0.88% | 0.88% | 0.87% | 0.86% | 0.88% | ||||||||||||||||||
Expenses net of waiver and payments by affiliates | 0.87% | e | 0.87% | f | 0.88% | e | 0.87% | e | 0.86% | 0.88% | ||||||||||||||
Net investment income | 1.27% | 1.42% | 1.40% | 1.33% | 1.34% | 1.71% | ||||||||||||||||||
| Supplemental data | ||||||||||||||||||||||||
Net assets, end of period (000’s) | $1,560,939 | $1,530,374 | $1,310,783 | $1,667,816 | $1,752,012 | $1,550,084 | ||||||||||||||||||
Portfolio turnover rate | 2.82% | 6.66% | 4.74% | 8.61% | 0.07% | 11.19% | ||||||||||||||||||
aThe amount shown for a share outstanding throughout the period may not correlate with the Statement of Operations for the period due to the timing of sales and repurchases of the Fund’s shares in relation to income earned and/or fluctuating fair value of the investments of the Fund.
bBased on average daily shares outstanding.
cTotal return does not include fees, charges or expenses imposed by the variable annuity and life insurance contracts for which Franklin Templeton Variable Insurance Products Trust serves as an underlying investment vehicle. Total return is not annualized for periods less than one year.
dRatios are annualized for periods less than one year.
eBenefit of waiver and payments by affiliates rounds to less than 0.01%.
fBenefit of expense reduction rounds to less than 0.01%.
| FRD-8 | Semiannual Report | The accompanying notes are an integral part of these financial statements. |
FRANKLIN TEMPLETON VARIABLE INSURANCE PRODUCTS TRUST
FINANCIAL HIGHLIGHTS
Franklin Rising Dividends VIP Fund (continued)
Six Months Ended (unaudited) | Year Ended December 31, | |||||||||||||||||||||||
| 2016 | 2015 | 2014 | 2013 | 2012 | ||||||||||||||||||||
| Class 4 | ||||||||||||||||||||||||
Per share operating performance (for a share outstanding throughout the period) | ||||||||||||||||||||||||
Net asset value, beginning of period | $24.98 | $24.81 | $29.19 | $27.76 | $21.78 | $19.83 | ||||||||||||||||||
|
| |||||||||||||||||||||||
| Income from investment operationsa: | ||||||||||||||||||||||||
Net investment incomeb | 0.15 | 0.32 | 0.35 | 0.35 | 0.32 | 0.35 | ||||||||||||||||||
Net realized and unrealized gains (losses) | 1.89 | 3.39 | (1.31 | ) | 2.00 | 6.07 | 1.96 | |||||||||||||||||
|
| |||||||||||||||||||||||
Total from investment operations | 2.04 | 3.71 | (0.96 | ) | 2.35 | 6.39 | 2.31 | |||||||||||||||||
|
| |||||||||||||||||||||||
| Less distributions from: | ||||||||||||||||||||||||
Net investment income | (0.41 | ) | (0.36 | ) | (0.41 | ) | (0.37 | ) | (0.41 | ) | (0.36 | ) | ||||||||||||
Net realized gains | (0.98 | ) | (3.18 | ) | (3.01 | ) | (0.55 | ) | — | — | ||||||||||||||
|
| |||||||||||||||||||||||
Total distributions | (1.39 | ) | (3.54 | ) | (3.42 | ) | (0.92 | ) | (0.41 | ) | (0.36 | ) | ||||||||||||
|
| |||||||||||||||||||||||
Net asset value, end of period | $25.63 | $24.98 | $24.81 | $29.19 | $27.76 | $21.78 | ||||||||||||||||||
|
| |||||||||||||||||||||||
Total returnc | 8.13% | 15.93% | (3.75)% | 8.62% | 29.57% | 11.78% | ||||||||||||||||||
| Ratios to average net assetsd | ||||||||||||||||||||||||
Expenses before waiver and payments by affiliates | 0.97% | 0.98% | 0.98% | 0.97% | 0.96% | 0.98% | ||||||||||||||||||
Expenses net of waiver and payments by affiliates | 0.97% | e | 0.97% | f | 0.98% | e | 0.97% | e | 0.96% | 0.98% | ||||||||||||||
Net investment income | 1.17% | 1.32% | 1.30% | 1.23% | 1.24% | 1.61% | ||||||||||||||||||
| Supplemental data | ||||||||||||||||||||||||
Net assets, end of period (000’s) | $31,735 | $28,579 | $20,453 | $15,503 | $12,028 | $6,432 | ||||||||||||||||||
Portfolio turnover rate | 2.82% | 6.66% | 4.74% | 8.61% | 0.07% | 11.19% | ||||||||||||||||||
aThe amount shown for a share outstanding throughout the period may not correlate with the Statement of Operations for the period due to the timing of sales and repurchases of the Fund’s shares in relation to income earned and/or fluctuating fair value of the investments of the Fund.
bBased on average daily shares outstanding.
cTotal return does not include fees, charges or expenses imposed by the variable annuity and life insurance contracts for which Franklin Templeton Variable Insurance Products Trust serves as an underlying investment vehicle. Total return is not annualized for periods less than one year.
dRatios are annualized for periods less than one year.
eBenefit of waiver and payments by affiliates rounds to less than 0.01%.
fBenefit of expense reduction rounds to less than 0.01%.
| The accompanying notes are an integral part of these financial statements. | Semiannual Report | FRD-9 |
FRANKLIN TEMPLETON VARIABLE INSURANCE PRODUCTS TRUST
Statement of Investments, June 30, 2017 (unaudited)
Franklin Rising Dividends VIP Fund
| ||||||||||
| Shares | Value | |||||||||
| Common Stocks 98.9% | ||||||||||
| Aerospace & Defense 4.8% | ||||||||||
General Dynamics Corp. | 157,911 | $ | 31,282,169 | |||||||
United Technologies Corp. | 453,011 | 55,317,173 | ||||||||
|
| |||||||||
| 86,599,342 | ||||||||||
|
| |||||||||
| Building Products 2.1% | ||||||||||
Johnson Controls International PLC | 848,653 | 36,797,594 | ||||||||
|
| |||||||||
| Commercial & Professional Services 4.4% | ||||||||||
ABM Industries Inc. | 779,288 | 32,356,038 | ||||||||
Brady Corp., A | 174,279 | 5,908,058 | ||||||||
Cintas Corp. | 194,675 | 24,536,837 | ||||||||
Matthews International Corp., A | 251,442 | 15,400,822 | ||||||||
|
| |||||||||
| 78,201,755 | ||||||||||
|
| |||||||||
| Consumer Durables & Apparel 2.4% | ||||||||||
Leggett & Platt Inc. | 332,800 | 17,481,984 | ||||||||
NIKE Inc., B | 445,100 | 26,260,900 | ||||||||
|
| |||||||||
| 43,742,884 | ||||||||||
|
| |||||||||
| Consumer Services 2.0% | ||||||||||
McDonald’s Corp. | 201,545 | 30,868,632 | ||||||||
Yum! Brands Inc. | 72,900 | 5,377,104 | ||||||||
|
| |||||||||
| 36,245,736 | ||||||||||
|
| |||||||||
| Diversified Financials 0.6% | ||||||||||
State Street Corp. | 110,500 | 9,915,165 | ||||||||
|
| |||||||||
| Energy 5.9% | ||||||||||
Chevron Corp. | 252,900 | 26,385,057 | ||||||||
EOG Resources Inc. | 33,600 | 3,041,472 | ||||||||
Exxon Mobil Corp. | 358,500 | 28,941,705 | ||||||||
Occidental Petroleum Corp. | 370,790 | 22,199,197 | ||||||||
Schlumberger Ltd. | 398,000 | 26,204,320 | ||||||||
|
| |||||||||
| 106,771,751 | ||||||||||
|
| |||||||||
| Food & Staples Retailing 3.6% | ||||||||||
CVS Health Corp. | 210,200 | 16,912,692 | ||||||||
Wal-Mart Stores Inc. | 294,100 | 22,257,488 | ||||||||
Walgreens Boots Alliance Inc. | 315,300 | 24,691,143 | ||||||||
|
| |||||||||
| 63,861,323 | ||||||||||
|
| |||||||||
| Food, Beverage & Tobacco 5.6% | ||||||||||
Archer-Daniels-Midland Co. | 548,000 | 22,676,240 | ||||||||
Bunge Ltd. | 307,700 | 22,954,420 | ||||||||
McCormick & Co. Inc. | 208,900 | 20,369,839 | ||||||||
PepsiCo Inc. | 301,000 | 34,762,490 | ||||||||
|
| |||||||||
| 100,762,989 | ||||||||||
|
| |||||||||
| Health Care Equipment & Services 14.0% | ||||||||||
Abbott Laboratories | 641,800 | 31,197,898 | ||||||||
Becton, Dickinson and Co. | 291,200 | 56,816,032 | ||||||||
DENTSPLY SIRONA Inc. | 4,000 | 259,360 | ||||||||
Medtronic PLC | 602,000 | 53,427,500 | ||||||||
Stryker Corp. | 420,200 | 58,315,356 | ||||||||
West Pharmaceutical Services Inc. | 547,218 | 51,723,046 | ||||||||
|
| |||||||||
| 251,739,192 | ||||||||||
|
| |||||||||
| FRD-10 | Semiannual Report |
FRANKLIN TEMPLETON VARIABLE INSURANCE PRODUCTS TRUST
STATEMENT OF INVESTMENTS (UNAUDITED)
Franklin Rising Dividends VIP Fund (continued)
| Shares | Value | |||||||||
| Common Stocks (continued) | ||||||||||
| Household & Personal Products 2.6% | ||||||||||
Colgate-Palmolive Co. | 202,300 | $ | 14,996,499 | |||||||
The Procter & Gamble Co. | 355,200 | 30,955,680 | ||||||||
|
| |||||||||
| 45,952,179 | ||||||||||
|
| |||||||||
| Industrial Conglomerates 6.7% | ||||||||||
Carlisle Cos. Inc. | 101,061 | 9,641,219 | ||||||||
Honeywell International Inc. | 257,900 | 34,375,491 | ||||||||
Roper Technologies Inc. | 333,043 | 77,109,446 | ||||||||
|
| |||||||||
| 121,126,156 | ||||||||||
|
| |||||||||
| Insurance 4.8% | ||||||||||
Aflac Inc. | 276,200 | 21,455,216 | ||||||||
Arthur J. Gallagher & Co. | 611,900 | 35,031,275 | ||||||||
Erie Indemnity Co., A | 179,185 | 22,410,668 | ||||||||
Old Republic International Corp. | 300,808 | 5,874,780 | ||||||||
RLI Corp. | 33,800 | 1,846,156 | ||||||||
|
| |||||||||
| 86,618,095 | ||||||||||
|
| |||||||||
| Machinery 5.5% | ||||||||||
Donaldson Co. Inc. | 350,068 | 15,942,097 | ||||||||
Dover Corp. | 487,776 | 39,129,391 | ||||||||
Hillenbrand Inc. | 113,200 | 4,086,520 | ||||||||
Pentair PLC (United Kingdom) | 586,000 | 38,992,440 | ||||||||
|
| |||||||||
| 98,150,448 | ||||||||||
|
| |||||||||
| Materials 12.4% | ||||||||||
Air Products and Chemicals Inc. | 353,900 | 50,628,934 | ||||||||
Albemarle Corp. | 706,700 | 74,585,118 | ||||||||
Bemis Co. Inc. | 58,899 | 2,724,079 | ||||||||
Ecolab Inc. | 115,600 | 15,345,900 | ||||||||
Nucor Corp. | 447,055 | 25,871,073 | ||||||||
Praxair Inc. | 400,560 | 53,094,228 | ||||||||
|
| |||||||||
| 222,249,332 | ||||||||||
|
| |||||||||
| Media 1.5% | ||||||||||
Comcast Corp., A | 276,300 | 10,753,596 | ||||||||
John Wiley & Sons Inc., A | 310,700 | 16,389,425 | ||||||||
|
| |||||||||
| 27,143,021 | ||||||||||
|
| |||||||||
| Pharmaceuticals, Biotechnology & Life Sciences 5.8% | ||||||||||
AbbVie Inc. | 206,400 | 14,966,064 | ||||||||
Johnson & Johnson | 372,800 | 49,317,712 | ||||||||
Perrigo Co. PLC | 208,500 | 15,745,920 | ||||||||
Pfizer Inc. | 669,700 | 22,495,223 | ||||||||
Roche Holding AG, ADR (Switzerland) | 25,000 | 795,000 | ||||||||
|
| |||||||||
| 103,319,919 | ||||||||||
|
| |||||||||
| Retailing 2.6% | ||||||||||
The Gap Inc. | 556,300 | 12,233,037 | ||||||||
Ross Stores Inc. | 185,000 | 10,680,050 | ||||||||
Target Corp. | 164,600 | 8,606,934 | ||||||||
Tiffany & Co. | 161,500 | 15,160,005 | ||||||||
|
| |||||||||
| 46,680,026 | ||||||||||
|
| |||||||||
| Semiannual Report | FRD-11 |
FRANKLIN TEMPLETON VARIABLE INSURANCE PRODUCTS TRUST
STATEMENT OF INVESTMENTS (UNAUDITED)
Franklin Rising Dividends VIP Fund (continued)
Shares | Value | |||||||||
Common Stocks (continued) | ||||||||||
| Semiconductors & Semiconductor Equipment 3.9% | ||||||||||
Analog Devices Inc. | 410,437 | $ | 31,931,999 | |||||||
Texas Instruments Inc. | 429,300 | 33,026,049 | ||||||||
Versum Materials Inc. | 182,000 | 5,915,000 | ||||||||
|
| |||||||||
| 70,873,048 | ||||||||||
|
| |||||||||
| Software & Services 7.0% | ||||||||||
Accenture PLC, A | 332,000 | 41,061,760 | ||||||||
Microsoft Corp. | 1,107,900 | 76,367,547 | ||||||||
Visa Inc., A | 89,500 | 8,393,310 | ||||||||
|
| |||||||||
| 125,822,617 | ||||||||||
|
| |||||||||
| Trading Companies & Distributors 0.3% | ||||||||||
W.W. Grainger Inc. | 28,100 | 5,072,893 | ||||||||
|
| |||||||||
| Transportation 0.4% | ||||||||||
United Parcel Service Inc., B | 64,800 | 7,166,232 | ||||||||
|
| |||||||||
Total Common Stocks (Cost $985,663,699) | 1,774,811,697 | |||||||||
|
| |||||||||
Short Term Investments (Cost $19,398,755) 1.1% | ||||||||||
Money Market Funds 1.1% | ||||||||||
| a,b | Institutional Fiduciary Trust Money Market Portfolio, 0.58% | 19,398,755 | 19,398,755 | |||||||
|
| |||||||||
Total Investments (Cost $1,005,062,454) 100.0% | 1,794,210,452 | |||||||||
Other Assets, less Liabilities 0.0%† | 16,827 | |||||||||
|
| |||||||||
Net Assets 100.0% | $ | 1,794,227,279 | ||||||||
|
| |||||||||
See Abbreviations on page FRD-21.
†Rounds to less than 0.1% of net assets.
aSee Note 3(e) regarding investments in affiliated management investment companies.
bThe rate shown is the annualized seven-day yield at period end.
| FRD-12 | Semiannual Report | The accompanying notes are an integral part of these financial statements. |
FRANKLIN TEMPLETON VARIABLE INSURANCE PRODUCTS TRUST
Financial Statements
Statement of Assets and Liabilities
June 30, 2017 (unaudited)
| Franklin Rising Dividends VIP Fund | ||||
Assets: | ||||
Investments in securities: | ||||
Cost - Unaffiliated issuers | $ | 985,663,699 | ||
Cost - Non-controlled affiliates (Note 3e) | 19,398,755 | |||
|
| |||
Total cost of investments. | $ | 1,005,062,454 | ||
|
| |||
Value - Unaffiliated issuers | $ | 1,774,811,697 | ||
Value - Non-controlled affiliates (Note 3e) | 19,398,755 | |||
|
| |||
Total value of investments | 1,794,210,452 | |||
Receivables: | ||||
Investment securities sold | 12,648 | |||
Capital shares sold. | 175,214 | |||
Dividends | 2,239,339 | |||
Other assets | 1,134 | |||
|
| |||
Total assets | 1,796,638,787 | |||
|
| |||
Liabilities: | ||||
Payables: | ||||
Capital shares redeemed | 708,030 | |||
Management fees | 892,018 | |||
Distribution fees | 674,865 | |||
Accrued expenses and other liabilities | 136,595 | |||
|
| |||
Total liabilities | 2,411,508 | |||
|
| |||
Net assets, at value | $ | 1,794,227,279 | ||
|
| |||
Net assets consist of: | ||||
Paid-in capital | $ | 943,005,193 | ||
Undistributed net investment income | 7,413,743 | |||
Net unrealized appreciation (depreciation) | 789,147,998 | |||
Accumulated net realized gain (loss) | 54,660,345 | |||
|
| |||
Net assets, at value | $ | 1,794,227,279 | ||
|
| |||
| Class 1: | ||||
Net assets, at value | $ | 201,553,486 | ||
|
| |||
Shares outstanding | 7,699,457 | |||
|
| |||
Net asset value and maximum offering price per share | $ | 26.18 | ||
|
| |||
| Class 2: | ||||
Net assets, at value | $ | 1,560,938,529 | ||
|
| |||
Shares outstanding | 61,124,550 | |||
|
| |||
Net asset value and maximum offering price per share | $ | 25.54 | ||
|
| |||
| Class 4: | ||||
Net assets, at value | $ | 31,735,264 | ||
|
| |||
Shares outstanding | 1,238,298 | |||
|
| |||
Net asset value and maximum offering price per share | $ | 25.63 | ||
|
| |||
| The accompanying notes are an integral part of these financial statements. | Semiannual Report | FRD-13 |
FRANKLIN TEMPLETON VARIABLE INSURANCE PRODUCTS TRUST
FINANCIAL STATEMENTS
Statement of Operations
for the six months ended June 30, 2017 (unaudited)
Franklin Rising VIP Fund | ||||
Investment income: | ||||
Dividends: | ||||
Unaffiliated issuers | $18,811,309 | |||
Non-controlled affiliates (Note 3e) | 31,560 | |||
|
| |||
Total investment income | 18,842,869 | |||
|
| |||
Expenses: | ||||
Management fees (Note 3a) | 5,344,227 | |||
Distribution fees: (Note 3c) | ||||
Class 2 | 1,932,257 | |||
Class 4 | 52,554 | |||
Custodian fees (Note 4) | 7,692 | |||
Reports to shareholders | 81,667 | |||
Professional fees | 30,824 | |||
Trustees’ fees and expenses | 3,771 | |||
Other | 16,966 | |||
|
| |||
Total expenses | 7,469,958 | |||
Expenses waived/paid by affiliates (Note 3e) | (35,044 | ) | ||
|
| |||
Net expenses | 7,434,914 | |||
|
| |||
Net investment income | 11,407,955 | |||
|
| |||
Realized and unrealized gains (losses): | ||||
Net realized gain (loss) from: | ||||
Investments | 54,716,933 | |||
Foreign currency transactions | 196 | |||
|
| |||
Net realized gain (loss) | 54,717,129 | |||
|
| |||
Net change in unrealized appreciation (depreciation) on investments | 73,327,848 | |||
|
| |||
Net realized and unrealized gain (loss) | 128,044,977 | |||
|
| |||
Net increase (decrease) in net assets resulting from operations | $139,452,932 | |||
|
| |||
| FRD-14 | Semiannual Report | The accompanying notes are an integral part of these financial statements. |
FRANKLIN TEMPLETON VARIABLE INSURANCE PRODUCTS TRUST
FINANCIAL STATEMENTS
Statements of Changes in Net Assets
Franklin Rising Dividends VIP Fund | ||||
Six Months Ended (unaudited) | Year Ended December 31, 2016 | |||
Increase (decrease) in net assets: | ||||
Operations: | ||||
Net investment income | $11,407,955 | $23,756,244 | ||
Net realized gain (loss) | 54,717,129 | 65,501,800 | ||
Net change in unrealized appreciation (depreciation) | 73,327,848 | 155,534,476 | ||
| ||||
Net increase (decrease) in net assets resulting from operations | 139,452,932 | 244,792,520 | ||
| ||||
Distributions to shareholders from: | ||||
Net investment income: | ||||
Class 1 | (3,388,715) | (2,718,521) | ||
Class 2 | (24,052,908) | (20,665,957) | ||
Class 4 | (476,793) | (304,600) | ||
Net realized gains: | ||||
Class 1 | (7,011,086) | (19,761,965) | ||
Class 2 | (57,291,559) | (177,746,237) | ||
Class 4 | (1,158,380) | (2,696,441) | ||
| ||||
Total distributions to shareholders | (93,379,441) | (223,893,721) | ||
| ||||
Capital share transactions: (Note 2) | ||||
Class 1 | 15,829,733 | 33,560,724 | ||
Class 2 | (10,163,140) | 203,254,702 | ||
Class 4 | 2,461,470 | 7,699,850 | ||
| ||||
Total capital share transactions | 8,128,063 | 244,515,276 | ||
| ||||
Net increase (decrease) in net assets. | 54,201,554 | 265,414,075 | ||
Net assets: | ||||
Beginning of period | 1,740,025,725 | 1,474,611,650 | ||
| ||||
End of period | $1,794,227,279 | $1,740,025,725 | ||
| ||||
Undistributed net investment income included in net assets: | ||||
End of period | $7,413,743 | $23,924,204 | ||
| ||||
| The accompanying notes are an integral part of these financial statements. | Semiannual Report | FRD-15 |
FRANKLIN TEMPLETON VARIABLE INSURANCE PRODUCTS TRUST
Notes to Financial Statements (unaudited)
Franklin Rising Dividends VIP Fund
1. Organization and Significant Accounting Policies
Franklin Templeton Variable Insurance Products Trust (Trust) is registered under the Investment Company Act of 1940 (1940 Act) as an open-end management investment company, consisting of eighteen separate funds and applies the specialized accounting and reporting guidance in U.S. Generally Accepted Accounting Principles (U.S. GAAP). Franklin Rising Dividends VIP Fund (Fund) is included in this report. Shares of the Fund are generally sold only to insurance company separate accounts to fund the benefits of variable life insurance policies or variable annuity contracts. The Fund offers three classes of shares: Class 1, Class 2 and Class 4. Each class of shares may differ by its distribution fees, voting rights on matters affecting a single class and its exchange privilege.
The following summarizes the Fund’s significant accounting policies.
a. Financial Instrument Valuation
The Fund’s investments in financial instruments are carried at fair value daily. Fair value is the price that would be received to sell an asset or paid to transfer a liability in an orderly transaction between market participants on the measurement date. The Fund calculates the net asset value (NAV) per share as of 4 p.m. Eastern time each day the New York Stock Exchange (NYSE) is open for trading. Under compliance policies and procedures approved by the Trust’s Board of Trustees (the Board), the Fund’s administrator has responsibility for oversight of valuation, including leading the cross-functional Valuation Committee (VC). The VC provides administration and oversight of the Fund’s valuation policies and procedures, which are approved annually by the Board. Among other things, these procedures allow the Fund to utilize independent pricing services, quotations from securities and financial instrument dealers, and other market sources to determine fair value.
Equity securities listed on an exchange or on the NASDAQ National Market System are valued at the last quoted sale price or the official closing price of the day, respectively. Foreign equity securities are valued as of the close of trading on the foreign stock exchange on which the security is primarily traded, or as of 4 p.m. Eastern time. The value is then converted into its U.S. dollar equivalent at the foreign exchange rate in effect at 4 p.m. Eastern time on the day that the value of the security is determined. Over-the-counter (OTC) securities are
valued within the range of the most recent quoted bid and ask prices. Securities that trade in multiple markets or on multiple exchanges are valued according to the broadest and most representative market. Certain equity securities are valued based upon fundamental characteristics or relationships to similar securities.
Investments in open-end mutual funds are valued at the closing NAV.
The Fund has procedures to determine the fair value of financial instruments for which market prices are not reliable or readily available. Under these procedures, the VC convenes on a regular basis to review such financial instruments and considers a number of factors, including significant unobservable valuation inputs, when arriving at fair value. The VC primarily employs a market-based approach which may use related or comparable assets or liabilities, recent transactions, market multiples, book values, and other relevant information for the investment to determine the fair value of the investment. An income-based valuation approach may also be used in which the anticipated future cash flows of the investment are discounted to calculate fair value. Discounts may also be applied due to the nature or duration of any restrictions on the disposition of the investments. Due to the inherent uncertainty of valuations of such investments, the fair values may differ significantly from the values that would have been used had an active market existed. The VC employs various methods for calibrating these valuation approaches including a regular review of key inputs and assumptions, transactional back-testing or disposition analysis, and reviews of any related market activity.
Trading in securities on foreign securities stock exchanges and OTC markets may be completed before 4 p.m. Eastern time. In addition, trading in certain foreign markets may not take place on every Fund’s business day. Occasionally, events occur between the time at which trading in a foreign security is completed and 4 p.m. Eastern time that might call into question the reliability of the value of a portfolio security held by the Fund. As a result, differences may arise between the value of the Fund’s portfolio securities as determined at the foreign market close and the latest indications of value at 4 p.m. Eastern time. In order to minimize the potential for these differences, the VC monitors price movements following the close of trading in foreign stock markets through a series of country specific market proxies (such as baskets of American Depositary Receipts, futures contracts and exchange traded funds). These price movements are measured against
| FRD-16 | Semiannual Report |
FRANKLIN TEMPLETON VARIABLE INSURANCE PRODUCTS TRUST
NOTES TO FINANCIAL STATEMENTS (UNAUDITED)
Franklin Rising Dividends VIP Fund (continued)
established trigger thresholds for each specific market proxy to assist in determining if an event has occurred that may call into question the reliability of the values of the foreign securities held by the Fund. If such an event occurs, the securities may be valued using fair value procedures, which may include the use of independent pricing services.
When the last day of the reporting period is a non-business day, certain foreign markets may be open on those days that the Fund’s NAV is not calculated, which could result in differences between the value of the Fund’s portfolio securities on the last business day and the last calendar day of the reporting period. Any significant security valuation changes due to an open foreign market are adjusted and reflected by the Fund for financial reporting purposes.
b. Foreign Currency Translation
Portfolio securities and other assets and liabilities denominated in foreign currencies are translated into U.S. dollars based on the exchange rate of such currencies against U.S. dollars on the date of valuation. The Fund may enter into foreign currency exchange contracts to facilitate transactions denominated in a foreign currency. Purchases and sales of securities, income and expense items denominated in foreign currencies are translated into U.S. dollars at the exchange rate in effect on the transaction date. Portfolio securities and assets and liabilities denominated in foreign currencies contain risks that those currencies will decline in value relative to the U.S. dollar. Occasionally, events may impact the availability or reliability of foreign exchange rates used to convert the U.S. dollar equivalent value. If such an event occurs, the foreign exchange rate will be valued at fair value using procedures established and approved by the Board.
The Fund does not separately report the effect of changes in foreign exchange rates from changes in market prices on securities held. Such changes are included in net realized and unrealized gain or loss from investments in the Statement of Operations.
Realized foreign exchange gains or losses arise from sales of foreign currencies, currency gains or losses realized between the trade and settlement dates on securities transactions and the difference between the recorded amounts of dividends, interest, and foreign withholding taxes and the U.S. dollar equivalent of the amounts actually received or paid. Net unrealized foreign exchange gains and losses arise from changes in foreign
exchange rates on foreign denominated assets and liabilities other than investments in securities held at the end of the reporting period.
c. Income and Deferred Taxes
It is the Fund’s policy to qualify as a regulated investment company under the Internal Revenue Code. The Fund intends to distribute to shareholders substantially all of its taxable income and net realized gains to relieve it from federal income and if applicable, excise taxes. As a result, no provision for U.S. federal income taxes is required.
The Fund may be subject to foreign taxation related to income received, capital gains on the sale of securities and certain foreign currency transactions in the foreign jurisdictions in which it invests. Foreign taxes, if any, are recorded based on the tax regulations and rates that exist in the foreign markets in which the Fund invests. When a capital gain tax is determined to apply, the Fund records an estimated deferred tax liability in an amount that would be payable if the securities were disposed of on the valuation date.
The Fund may recognize an income tax liability related to its uncertain tax positions under U.S. GAAP when the uncertain tax position has a less than 50% probability that it will be sustained upon examination by the tax authorities based on its technical merits. As of June 30, 2017, the Fund has determined that no tax liability is required in its financial statements related to uncertain tax positions for any open tax years (or expected to be taken in future tax years). Open tax years are those that remain subject to examination and are based on each tax jurisdiction’s statute of limitation.
d. Security Transactions, Investment Income, Expenses and Distributions
Security transactions are accounted for on trade date. Realized gains and losses on security transactions are determined on a specific identification basis. Estimated expenses are accrued daily. Dividend income is recorded on the ex-dividend date except for certain dividends from securities where the dividend rate is not available. In such cases, the dividend is recorded as soon as the information is received by the Fund. Distributions to shareholders are recorded on the ex-dividend date. Distributable earnings are determined according to income tax regulations (tax basis) and may differ from earnings recorded in accordance with U.S. GAAP. These differences may be permanent or temporary. Permanent differences are reclassified among capital
| Semiannual Report | FRD-17 |
FRANKLIN TEMPLETON VARIABLE INSURANCE PRODUCTS TRUST
NOTES TO FINANCIAL STATEMENTS (UNAUDITED)
Franklin Rising Dividends VIP Fund (continued)
1. Organization and Significant Accounting Policies (continued)
d. Security Transactions, Investment Income, Expenses and Distributions (continued)
accounts to reflect their tax character. These reclassifications have no impact on net assets or the results of operations. Temporary differences are not reclassified, as they may reverse in subsequent periods.
Common expenses incurred by the Trust are allocated among the Funds based on the ratio of net assets of each Fund to the combined net assets of the Trust. Fund specific expenses are charged directly to the Fund that incurred the expense.
Realized and unrealized gains and losses and net investment income, not including class specific expenses, are allocated daily to each class of shares based upon the relative proportion of net assets of each class. Differences in per share distributions, by class, are generally due to differences in class specific expenses.
e. Accounting Estimates
The preparation of financial statements in accordance with U.S. GAAP requires management to make estimates and assumptions that affect the reported amounts of assets and liabilities at the date of the financial statements and the amounts of income and expenses during the reporting period. Actual results could differ from those estimates.
f. Guarantees and Indemnifications
Under the Trust’s organizational documents, its officers and trustees are indemnified by the Trust against certain liabilities arising out of the performance of their duties to the Trust. Additionally, in the normal course of business, the Trust, on behalf of the Fund, enters into contracts with service providers that contain general indemnification clauses. The Trust’s maximum exposure under these arrangements is unknown as this would involve future claims that may be made against the Trust that have not yet occurred. Currently, the Trust expects the risk of loss to be remote.
2. Shares of Beneficial Interest
At June 30, 2017, there were an unlimited number of shares authorized (without par value). Transactions in the Fund’s shares were as follows:
| Six Months Ended June 30, 2017 | Year Ended December 31, 2016 | |||||||||||||||||||
| Shares | Amount | Shares | Amount | |||||||||||||||||
| Class 1 Shares: | ||||||||||||||||||||
Shares sold | 654,229 | $ | 17,307,518 | 1,408,862 | $ | 34,658,685 | ||||||||||||||
Shares issued in reinvestment of distributions | 394,680 | 10,399,801 | 944,162 | 22,480,486 | ||||||||||||||||
Shares redeemed | (447,140 | ) | (11,877,586 | ) | (931,787 | ) | (23,578,447 | ) | ||||||||||||
|
| |||||||||||||||||||
Net increase (decrease) | 601,769 | $ | 15,829,733 | 1,421,237 | $ | 33,560,724 | ||||||||||||||
|
| |||||||||||||||||||
| Class 2 Shares: | ||||||||||||||||||||
Shares sold | 1,093,070 | $ | 28,288,014 | 9,423,278 | $ | 238,665,574 | ||||||||||||||
Shares issued in reinvestment of distributions | 3,163,923 | 81,344,467 | 8,526,523 | 198,412,194 | ||||||||||||||||
Shares redeemed | (4,610,070 | ) | (119,795,621 | ) | (9,496,533 | ) | (233,823,066 | ) | ||||||||||||
|
| |||||||||||||||||||
Net increase (decrease) | (353,077 | ) | $ | (10,163,140 | ) | 8,453,268 | $ | 203,254,702 | ||||||||||||
|
| |||||||||||||||||||
| Class 4 Shares: | ||||||||||||||||||||
Shares sold | 137,271 | $ | 3,575,705 | 404,421 | $ | 9,995,211 | ||||||||||||||
Shares issued in reinvestment of distributions | 63,379 | 1,635,173 | 128,469 | 3,001,041 | ||||||||||||||||
Shares redeemed | (106,334 | ) | (2,749,408 | ) | (213,254 | ) | (5,296,402 | ) | ||||||||||||
|
| |||||||||||||||||||
Net increase (decrease) | 94,316 | $ | 2,461,470 | 319,636 | $ | 7,699,850 | ||||||||||||||
|
| |||||||||||||||||||
| FRD-18 | Semiannual Report |
FRANKLIN TEMPLETON VARIABLE INSURANCE PRODUCTS TRUST
NOTES TO FINANCIAL STATEMENTS (UNAUDITED)
Franklin Rising Dividends VIP Fund (continued)
3. Transactions with Affiliates
Franklin Resources, Inc. is the holding company for various subsidiaries that together are referred to as Franklin Templeton Investments. Certain officers and trustees of the Fund are also officers and/or directors of the following subsidiaries:
| Subsidiary | Affiliation | |
Franklin Advisory Services, LLC (Advisory Services) | Investment manager | |
Franklin Templeton Services, LLC (FT Services) | Administrative manager | |
Franklin Templeton Distributors, Inc. (Distributors) | Principal underwriter | |
Franklin Templeton Investor Services, LLC (Investor Services) | Transfer agent |
a. Management Fees
Effective May 1, 2017, the Fund pays an investment management fee to Advisory Services based on the average daily net assets of the Fund as follows:
| Annualized Fee Rate | Net Assets | |
0.750% | Up to and including $500 million | |
0.625% | Over $500 million, up to and including $1 billion | |
0.500% | Over $1 billion, up to and including $5 billion | |
0.490% | In excess of $5 billion |
Prior to May 1, 2017, the Fund paid fees to Advisory Services based on the average daily net assets of the Fund as follows:
| Annualized Fee Rate | Net Assets | |
0.750% | Up to and including $500 million | |
0.625% | Over $500 million, up to and including $1 billion | |
0.500% | In excess of $1 billion |
For the period ended June 30, 2017, the annualized effective investment management fee rate was 0.605% of the Fund’s average daily net assets.
b. Administrative Fees
Under an agreement with Advisory Services, FT Services provides administrative services to the Fund. The fee is paid by Advisory Services based on the Fund’s average daily net assets, and is not an additional expense of the Fund.
c. Distribution Fees
The Board has adopted distribution plans for Class 2 and Class 4 shares pursuant to Rule 12b-1 under the 1940 Act. Under the Fund’s compensation distribution plans, the Fund pays Distributors for costs incurred in connection with the servicing, sale and distribution of the Fund’s shares up to 0.35% per year of its average daily net assets of each class. The Board has agreed to limit the current rate to 0.25% per year for Class 2. The plan year, for purposes of monitoring compliance with the maximum annual plan rates, is February 1 through January 31.
d. Transfer Agent Fees
Investor Services, under terms of an agreement, performs shareholder servicing for the Fund and is not paid by the Fund for the services.
| Semiannual Report | FRD-19 |
FRANKLIN TEMPLETON VARIABLE INSURANCE PRODUCTS TRUST
NOTES TO FINANCIAL STATEMENTS (UNAUDITED)
Franklin Rising Dividends VIP Fund (continued)
3. Transactions with Affiliates (continued)
e. Investments in Affiliated Management Investment Companies
The Fund invests in one or more affiliated management investment companies for purposes other than exercising a controlling influence over the management or policies. Management fees paid by the Fund are waived on assets invested in the affiliated management investment companies, as noted in the Statement of Operations, in an amount not to exceed the management and administrative fees paid directly or indirectly by each affiliate. Prior to January 1, 2014, the waiver was accounted for as a reduction to management fees. During the period ended June 30, 2017, the Fund held investments in affiliated management investment companies as follows:
| Number of Shares Held at Beginning of Period | Gross Additions | Gross Reductions | Number of Shares Held at End of Period | Value at End of Period | Investment Income | Realized Gain (Loss) | %of Affiliated Fund Shares Outstanding Held at End of Period | |||||||||||||||||||||||||
Non-Controlled Affiliates | ||||||||||||||||||||||||||||||||
Institutional Fiduciary Trust Money Market Portfolio, 0.58% | 14,889,095 | 80,478,157 | (75,968,497 | ) | 19,398,755 | $ | 19,398,755 | $ | 31,560 | $ | — | 0.1% | ||||||||||||||||||||
|
| |||||||||||||||||||||||||||||||
4. Expense Offset Arrangement
The Fund has entered into an arrangement with its custodian whereby credits realized as a result of uninvested cash balances are used to reduce a portion of the Fund’s custodian expenses. During the period ended June 30, 2017, there were no credits earned.
5. Income Taxes
At June 30, 2017, the cost of investments and net unrealized appreciation (depreciation) for income tax purposes were as follows:
Cost of investments. | $ | 1,009,435,273 | ||
|
| |||
Unrealized appreciation | $ | 832,348,609 | ||
Unrealized depreciation | (47,573,430 | ) | ||
|
| |||
Net unrealized appreciation (depreciation) | $ | 784,775,179 | ||
|
|
Differences between income and/or capital gains as determined on a book basis and a tax basis are primarily due to differing treatments of corporate actions and wash sales.
6. Investment Transactions
Purchases and sales of investments (excluding short term securities) for the period ended June 30, 2017, aggregated $49,458,592 and $124,132,969, respectively.
7. Credit Facility
The Fund, together with other U.S. registered and foreign investment funds (collectively, Borrowers), managed by Franklin Templeton Investments, are borrowers in a joint syndicated senior unsecured credit facility totaling $2 billion (Global Credit Facility) which matures on February 9, 2018. This Global Credit Facility provides a source of funds to the Borrowers for temporary and emergency purposes, including the ability to meet future unanticipated or unusually large redemption requests.
| FRD-20 | Semiannual Report |
FRANKLIN TEMPLETON VARIABLE INSURANCE PRODUCTS TRUST
NOTES TO FINANCIAL STATEMENTS (UNAUDITED)
Franklin Rising Dividends VIP Fund (continued)
Under the terms of the Global Credit Facility, the Fund shall, in addition to interest charged on any borrowings made by the Fund and other costs incurred by the Fund, pay its share of fees and expenses incurred in connection with the implementation and maintenance of the Global Credit Facility, based upon its relative share of the aggregate net assets of all of the Borrowers, including an annual commitment fee of 0.15% based upon the unused portion of the Global Credit Facility. These fees are reflected in other expenses in the Statement of Operations. During the period ended June 30, 2017, the Fund did not use the Global Credit Facility.
8. Fair Value Measurements
The Fund follows a fair value hierarchy that distinguishes between market data obtained from independent sources (observable inputs) and the Fund’s own market assumptions (unobservable inputs). These inputs are used in determining the value of the Fund’s financial instruments and are summarized in the following fair value hierarchy:
| • | Level 1 – quoted prices in active markets for identical financial instruments |
| • | Level 2 – other significant observable inputs (including quoted prices for similar financial instruments, interest rates, prepayment speed, credit risk, etc.) |
| • | Level 3 – significant unobservable inputs (including the Fund’s own assumptions in determining the fair value of financial instruments) |
The input levels are not necessarily an indication of the risk or liquidity associated with financial instruments at that level.
For movements between the levels within the fair value hierarchy, the Fund has adopted a policy of recognizing the transfers as of the date of the underlying event which caused the movement.
At June 30, 2017, all of the Fund’s investments in financial instruments carried at fair value were valued using Level 1 inputs. For detailed categories, see the accompanying Statement of Investments.
9. Investment Company Reporting Modernization
In October 2016, the U.S. Securities and Exchange Commission adopted new rules and amended existing rules (together, final rules) intended to modernize the reporting and disclosure of information by registered investment companies. In part, the final rules amend Regulation S-X and require standardized, enhanced disclosures about derivatives in investment company financial statements, as well as other amendments. The compliance date for the amendments to Regulation S-X is August 1, 2017. Management has reviewed the requirements and believes the adoption of the amendments to Regulation S-X will not have a material impact on the Fund’s financial statements and related disclosures.
10. Subsequent Events
The Fund has evaluated subsequent events through the issuance of the financial statements and determined that no events have occurred that require disclosure.
Abbreviations
| Selected Portfolio | ||||
| ADR | American Depositary Receipt | |||
| Semiannual Report | FRD-21 |
This page intentionally left blank.
Franklin Small Cap Value VIP Fund
This semiannual report for Franklin Small Cap Value VIP Fund covers the period ended June 30, 2017.
Class 1 Performance Summary as of June 30, 2017
The Fund’s Class 1 Shares delivered a +0.33% total return* for the six-month period ended June 30, 2017.
*The Fund has a fee waiver associated with any investment it makes in a Franklin Templeton money fund and/or other Franklin Templeton fund, contractually guaranteed through 4/30/18. Fund investment results reflect the fee waiver; without this waiver, the results would have been lower.
Performance reflects the Fund’s Class 1 operating expenses, but does not include any contract fees, expenses or sales charges. If they had been included, performance would be lower. These charges and deductions, particularly for variable life policies, can have a significant effect on contract values and insurance benefits. See the contract prospectus for a complete description of these expenses, including sales charges.
Performance data represent past performance, which does not guarantee future results. Investment return and principal value will fluctuate, and you may have a gain or loss when you sell your shares. Current performance may differ from figures shown.
| Semiannual Report | FSV-1 |
FRANKLIN SMALL CAP VALUE VIP FUND
Fund Goal and Main Investments
The Fund seeks long-term total return. Under normal market conditions, the Fund invests at least 80% of its net assets in investments of small capitalization companies. For this Fund, small capitalization companies are those with market capitalizations not exceeding either the highest market capitalization in the Russell 2000TM Index or the 12-month average of the highest market capitalization in the Russell 2000® Index, whichever is greater, at the time of purchase. The Fund generally invests in equity securities of companies that the manager believes are undervalued and have the potential for capital appreciation.
Fund Risks
All investments involve risks, including possible loss of principal. The Fund’s investments in smaller company stocks carry special risks as such stocks have historically exhibited greater price volatility than large-company stocks, particularly over the short term. Additionally, smaller companies often have relatively small revenues, limited product lines and a small market share. In addition, the Fund may invest up to 25% of its total assets in foreign securities, which involve special risks, including currency fluctuations and economic and political uncertainty. The Fund also may invest in equity real estate investment trusts (REITs). The Fund is actively managed but there is no guarantee that the manager’s investment decisions will produce the desired results. The Fund’s prospectus also includes a description of the main investment risks.
Performance Overview
You can find the Fund’s six-month total return in the Performance Summary. In comparison, the Fund’s new benchmark, the Russell 2000TM Value Index posted a +0.54% total return for the same period, while its old benchmark, the Russell 2500TM Value Index, had a +1.95% total return.1 We believe the composition of the new index aligns more closely with the Fund’s portfolio. Please note the Fund employs a bottom-up stock selection process, and the managers invest in securities without regard to benchmark comparisons.
Economic and Market Overview
U.S. economic growth decelerated in 2017’s first quarter, largely due to slower growth in consumer spending and declines in private inventory investment and government spending. However, growth accelerated in the second quarter due to increases in consumer spending, business investment and federal government spending. The manufacturing sector generally expanded, and the services sector also continued to grow. The unemployment rate decreased from 4.7% in December 2016 to 4.4% at period-end.2 Monthly retail sales were volatile, but grew for most of the period. Annual inflation, as measured by the Consumer Price Index, decreased from 2.1% to 1.6% during the period.
The U.S. Federal Reserve (Fed), at its March meeting, increased the federal funds target rate from 0.50%–0.75% to 0.75%–1.00%. The Fed again increased its target range by a quarter point to 1.00%–1.25% at its June meeting. The Fed made both of these increases amid signs of a growing U.S. economy, a strengthening labor market and an improvement in business spending.
U.S. equity markets rose during the period, benefiting from mostly upbeat economic data, better U.S. corporate earnings and signs of improvement in the Chinese and European economies. Investor optimism arising from pro-growth and pro-business policy plans in the U.S. and the victory of Emmanuel Macron as France’s President also helped U.S. equities. However, concerns about the terms of the U.K.’s exit from the European Union (also known as “Brexit”), uncertainty about President Trump’s ability to implement reforms, and geopolitical tensions in the Middle East and the Korean peninsula curbed market sentiment. The broad U.S. stock market, as measured by the Standard & Poor’s® 500 Index, generated a +9.34% total return for the period.3
Investment Strategy
We generally invest in stocks that we believe are undervalued and have the potential for capital appreciation. We consider a stock price a “value” when it trades at less than the price at which we believe it would trade if the market reflected all factors relating to the company’s worth. Accordingly, we invest in companies that we believe have, for example, stock prices
1. Source: Morningstar.
One cannot invest directly in an index, and an index is not representative of the Fund’s portfolio. Please see Index Descriptions following the Fund Summaries.
2. Source: Bureau of Labor Statistics.
3. Please see Index Descriptions following the Fund Summaries.
The dollar value, number of shares or principal amount, and names of all portfolio holdings are listed in the Fund’s Statement of Investments (SOI).
| FSV-2 | Semiannual Report |
FRANKLIN SMALL CAP VALUE VIP FUND
that are low relative to current or historical or future earnings, book value, cash flow or sales; recent sharp price declines but the potential for good long-term earnings prospects; and valuable intangibles not reflected in the stock price. Companies in which we may invest include those that may be considered out of favor, such as companies attempting to recover from bankruptcy, business setbacks, adverse events or cyclical downturns, or that may be considered potential takeover targets.
Manager’s Discussion
For the period ended June 30, 2017, some contributors to absolute Fund performance included Hill-Rom Holdings, BRP and Maple Leaf Foods.
Hill-Rom Holdings is a manufacturer of medical equipment including hospital beds, surgical tables and diagnostic tools. The company’s shares rose due to stability in hospital capital spending, which led to modest growth in its U.S. patient support business. Hill-Rom’s international business recovered with strong organic growth during its quarter ended March 2017 and management expected the momentum to continue through the remainder of the year. The company completed the acquisition of Mortara Instruments,4 a provider of diagnostic cardiology and patient monitoring technology, services and devices. Mortara will complement Hill-Rom’s Welch Allyn4 business, and analysts believe it could be additive to earnings. Additionally, Hill-Rom launched a new bed system for higher acuity patients in intensive and acute care settings and also introduced a new air-fluidized therapy bed for wound care during the period. The company continues to focus on reducing the debt incurred from the Welch and Mortara acquisitions, improving overall margins through operational efficiencies, bringing out new products in 2017 and increasing the penetration of its existing suite of products.
BRP is a leading manufacturer of powersport vehicles and equipment, primarily for the off-road, snowmobile and personal watercraft markets. BRP reported a strong quarter, beating earnings per share estimates and raising its full-year outlook. New product introductions of side-by-side off-road vehicles and a significantly weakened competitor drove sales and market share gains. Additionally, management announced a large share repurchase program, which could shrink its share count. Finally, a quarterly dividend was initiated for the first time in the company’s history, which signaled management’s
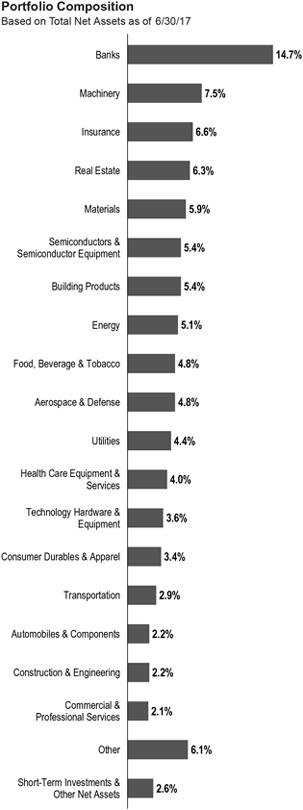
4. Not a Fund holding.
| Semiannual Report | FSV-3 |
FRANKLIN SMALL CAP VALUE VIP FUND
confidence in its business model to deliver strong operating performance and free cash flow generation.
Maple Leaf Foods, a Canadian-based producer of fresh and packaged meats, experienced stronger-than-expected adjusted earnings due to the elimination of duplicate costs stemming from its recently completed multi-year manufacturing and network optimization plan. Favorable pork processing costs also boosted margins. We believe the company is now completely focused on driving growth through new product innovation and acquisitions such as the purchase of Lightlife Foods,4 a plant-based protein foods company. In addition, Maple Leaf possesses a cash rich balance sheet, which it used to opportunistically repurchase shares, while growing its dividend.
Detractors from absolute Fund performance included Oil States International, Unit Corp. and First Horizon National.
Oil States International is a provider of onshore and offshore well-completion services and deep-water connection products and services. A decline in the company’s stock price was due to a weaker-than-expected order outlook for its offshore products business as low oil prices continued to dampen activity.
Unit Corp., a domestic land-based drilling and exploration and production company, saw its share price decline substantially in 2017 after having more than doubled in 2016, closely mirroring the direction of oil prices during these periods. The upward movement in crude oil prices in 2016 was primarily due to investors’ initial hope that an agreement by the Organization of the Petroleum Exporting Countries to limit output would reduce inventories. The drop in 2017 was caused by the ultimate failure of domestic inventories to decline in a meaningful way as production by U.S. shale drillers increased at a faster rate than expected.
First Horizon National is a regional bank concentrated in Tennessee. In May, First Horizon announced the acquisition of Capital Bank Financial,4 which we believe appears strategically sound and should increase earnings per share. However, the transaction is relatively large relative to First Horizon’s balance sheet and introduces an elevated level of integration risk, which pressured the stock’s valuation. Additionally, First Horizon’s fixed income capital markets4 segment has been negatively impacted by a low level of market volatility, which resulted in lower-than-expected fixed income trading activity and revenues during the period.
During the reporting period, we added some new positions with the largest purchases including Glacier Bancorp, a multi-bank holding company headquartered in Montana; Titan
| Top 10 Holdings | ||||
| 6/30/17 | ||||
| Company Sector/Industry | % of Total Net Assets | |||
| AAR Corp. Aerospace & Defense | 2.9% | |||
| Maple Leaf Foods Inc. Food, Beverage & Tobacco | 2.7% | |||
| LTC Properties Inc. Real Estate | 2.6% | |||
| Sensient Technologies Corp. Materials | 2.5% | |||
| Simpson Manufacturing Co. Inc. Building Products | 2.2% | |||
| Columbia Banking System Inc. Banks | 2.1% | |||
| IDACORP Inc. Utilities | 2.1% | |||
| Chemical Financial Corp. Banks | 2.1% | |||
| Hill-Rom Holdings Inc. Health Care Equipment & Services | 2.1% | |||
| First Horizon National Corp. Banks | 2.0% | |||
International, a manufacturer of mounted tire and wheel systems for off highway equipment; Highwoods Properties, a real estate investment trust company; The Manitowoc Co., a manufacturer of cranes and lift solutions; and Access National, a bank holding company. The Fund also added to several holdings including Zebra Technologies, a manufacturer of marking, tracking and computer printing technologies; Simpson Manufacturing, an engineering firm and building materials producer; and the aforementioned First Horizon National. Conversely, we exited some positions including Omega Protein, Cato, Brunswick, Genesco and West Marine. We also reduced our positions in Carlisle Cos., the aforementioned Unit Corp. and MKS Instruments, among others. Additionally, during the period, three cash takeovers were completed: Endurance Specialty Holdings, EverBank Financial and Mentor Graphics.
Thank you for your participation in Franklin Small Cap Value VIP Fund. We look forward to serving your future investment needs.
| FSV-4 | Semiannual Report |
FRANKLIN SMALL CAP VALUE VIP FUND
The foregoing information reflects our analysis, opinions and portfolio holdings as of June 30, 2017, the end of the reporting period. The way we implement our main investment strategies and the resulting portfolio holdings may change depending on factors such as market and economic conditions. These opinions may not be relied upon as investment advice or an offer for a particular security. The information is not a complete analysis of every aspect of any market, country, industry, security or the Fund. Statements of fact are from sources considered reliable, but the investment manager makes no representation or warranty as to their completeness or accuracy. Although historical performance is no guarantee of future results, these insights may help you understand our investment management philosophy.
| Semiannual Report | FSV-5 |
FRANKLIN SMALL CAP VALUE VIP FUND
Class 1 Fund Expenses
As an investor in a variable insurance contract (Contract) that indirectly provides for investment in an underlying mutual fund, you can incur transaction and/or ongoing expenses at both the Fund level and the Contract Level: (1) transaction expenses can include sales charges (loads) on purchases, surrender fees, transfer fees and premium taxes; and (2) ongoing expenses can include management fees, distribution and service (12b-1) fees, contract fees, annual maintenance fees, mortality and expense risk fees and other fees and expenses. All mutual funds and Contracts have some types of ongoing expenses. The table below shows Fund-level ongoing expenses and can help you understand these costs and compare them with those of other mutual funds offered through the Contract. The table assumes a $1,000 investment held for the six months indicated. Please refer to the Fund prospectus for additional information on operating expenses.
Actual Fund Expenses
The table below provides information about the actual account values and actual expenses in the columns under the heading “Actual.” In these columns the Fund’s actual return, which includes the effect of ongoing Fund expenses but does not include the effect of ongoing Contract expenses, is used to calculate the “Ending Account Value.” You can estimate the Fund-level expenses you paid during the period by following these steps (of course, your account value and expenses will differ from those in this illustration): Divide your account value by $1,000 (if your account had an $8,600 value, then $8,600 ÷ $1,000 = 8.6). Then multiply the result by the number under the headings “Actual” and “Fund-Level Expenses Paid During Period” (if Fund-Level Expenses Paid During Period were $ 7.50, then 8.6 × $7.50 = $64.50). In this illustration, the estimated expenses paid this period at the Fund level are $64.50.
Hypothetical Example for Comparison with Other Mutual Funds
Under the heading “Hypothetical” in the table, information is provided about hypothetical account values and hypothetical expenses based on the Fund’s actual expense ratio and an assumed rate of return of 5% per year before expenses, which is not the Fund’s actual return. This information may not be used to estimate the actual ending account balance or expenses you paid for the period, but it can help you compare ongoing costs of investing in the Fund with those of other mutual funds offered through the Contract. To do so, compare this 5% hypothetical example with the 5% hypothetical examples that appear in the shareholder reports of other funds offered through the Contract.
Please note that expenses shown in the table are meant to highlight ongoing costs at the Fund level only and do not reflect any ongoing expenses at the Contract level, or transaction expenses at either the Fund or Contract levels. In addition, while the Fund does not have transaction expenses, if the transaction and ongoing expenses at the Contract level were included, the expenses shown below would be higher. You should consult your Contract prospectus or disclosure document for more information.
| Actual (actual return after expenses) | Hypothetical (5% annual return before expenses) | |||||||||||||||||||||||
| Share Class | | Beginning Account Value 1/1/17 | | | Ending Account Value 6/30/17 | | | Fund-Level Expenses Paid During Period 1/1/17–6/30/17 | 1,2 | | Ending Account Value 6/30/17 | | | Fund-Level Expenses Paid During Period 1/1/17–6/30/17 | 1,2 | | Net Annualized Expense Ratio | 2 | ||||||
Class 1 | $ | 1,000 | $ | 1,003.30 | $ | 3.18 | $ | 1,021.62 | $ | 3.21 | 0.64% | |||||||||||||
1. Expenses are equal to the annualized expense ratio for the six-month period as indicated above — in the far right column — multiplied by the simple average account value over the period indicated, and then multiplied by 181/365 to reflect the one-half year period.
2. Reflects expenses after fee waivers and expense reimbursements. Does not include any ongoing expenses of the Contract for which the Fund is an investment option or acquired fund fees and expenses.
| FSV-6 | Semiannual Report |
FSV1 P1 P2 P4 06/17
TO THE PROSPECTUSES
DATED MAY 1, 2017
OF
FRANKLIN SMALL CAP VALUE VIP FUND
(a series of Franklin Templeton Variable Insurance Products Trust)
Effective June 30, 2017, the Prospectus is amended as follows:
I. The section in the Fund Summary under the heading “Portfolio Managers” on page FSV-S5 is revised as follows:
Portfolio Managers
Steven B. Raineri Vice President of Advisory Services and portfolio manager of the Fund since 2012.
Christopher Meeker, CFA Portfolio Manager of Advisory Services and portfolio manager of the Fund since 2015.
II. In the Fund Details, under the heading “Management”, the portfolio manager information on page FSV-D5 is revised as follows:
Franklin Advisory Services, LLC (Advisory Services), 101 John F. Kennedy Parkway, Short Hills, NJ 07078, is the Fund’s investment manager.
The Fund is managed by a team of dedicated professionals focused on investments of small cap value companies. The portfolio managers of the team are as follows:
Steven B. Raineri Vice President of Advisory Services | Mr. Raineri has been a lead portfolio manager of the Fund since 2012. Mr. Raineri has primary responsibility for the investments of the Fund. He has final authority over all aspects of the Fund’s investment portfolio, including but not limited to, purchases and sales of individual securities, portfolio risk assessment, and the management of daily cash balances in accordance with anticipated investment management requirements. The degree to which he may perform these functions, and the nature of these functions, may change from time to time. He joined Franklin Templeton Investments in 2005. |
Christopher Meeker, CFA Portfolio Manager of Advisory Services | Mr. Meeker has been a portfolio manager of the Fund since 2015, providing support to the lead portfolio manager(s) as needed. He joined Franklin Templeton Investments in 2012. Prior to joining Franklin Templeton Investments, he worked as a senior buy-side analyst at Federated Global Investment Management with a focus on the international markets and coverage of the industrial, consumer and technology sectors. |
Please keep this supplement with your prospectus for future reference.
| FSV-7 |
FRANKLIN TEMPLETON VARIABLE INSURANCE PRODUCTS TRUST
Financial Highlights
Franklin Small Cap Value VIP Fund
Six Months Ended (unaudited) | Year Ended December 31, | |||||||||||||||||||||||
| 2016 | 2015 | 2014 | 2013 | 2012 | ||||||||||||||||||||
| Class 1 | ||||||||||||||||||||||||
Per share operating performance (for a share outstanding throughout the period) | ||||||||||||||||||||||||
Net asset value, beginning of period | $19.93 | $18.12 | $22.81 | $24.54 | $18.58 | $15.82 | ||||||||||||||||||
|
| |||||||||||||||||||||||
| Income from investment operationsa: | ||||||||||||||||||||||||
Net investment incomeb | 0.12 | 0.15 | 0.21 | 0.19 | 0.19 | 0.29 | c | |||||||||||||||||
Net realized and unrealized gains (losses) | (0.04 | ) | 4.79 | (1.53 | ) | 0.06 | 6.45 | 2.64 | ||||||||||||||||
|
| |||||||||||||||||||||||
Total from investment operations | 0.08 | 4.94 | (1.32 | ) | 0.25 | 6.64 | 2.93 | |||||||||||||||||
|
| |||||||||||||||||||||||
| Less distributions from: | ||||||||||||||||||||||||
Net investment income | (0.15 | ) | (0.21 | ) | (0.20 | ) | (0.20 | ) | (0.32 | ) | (0.17 | ) | ||||||||||||
Net realized gains | (1.38 | ) | (2.92 | ) | (3.17 | ) | (1.78 | ) | (0.36 | ) | — | |||||||||||||
|
| |||||||||||||||||||||||
Total distributions | (1.53 | ) | (3.13 | ) | (3.37 | ) | (1.98 | ) | (0.68 | ) | (0.17 | ) | ||||||||||||
|
| |||||||||||||||||||||||
Net asset value, end of period | $18.48 | $19.93 | $18.12 | $22.81 | $24.54 | $18.58 | ||||||||||||||||||
|
| |||||||||||||||||||||||
Total returnd | 0.33% | 30.54% | (7.18)% | 0.88% | 36.50% | 18.75% | ||||||||||||||||||
| Ratios to average net assetse | ||||||||||||||||||||||||
Expenses before waiver and payments by affiliates | 0.65% | 0.66% | 0.65% | 0.63% | 0.63% | 0.67% | ||||||||||||||||||
Expenses net of waiver and payments by affiliates | 0.64% | 0.64% | f | 0.64% | f | 0.63% | f,g | 0.63% | 0.67% | |||||||||||||||
Net investment income | 1.19% | 0.84% | 1.04% | 0.82% | 0.90% | 1.70% | c | |||||||||||||||||
| Supplemental data | ||||||||||||||||||||||||
Net assets, end of period (000’s) | $48,226 | $47,831 | $45,897 | $57,843 | $62,408 | $40,133 | ||||||||||||||||||
Portfolio turnover rate | 11.44% | 34.60% | 27.05% | 19.45% | 10.44% | 5.84% | ||||||||||||||||||
aThe amount shown for a share outstanding throughout the period may not correlate with the Statement of Operations for the period due to the timing of sales and repurchases of the Fund’s shares in relation to income earned and/or fluctuating fair value of the investments of the Fund.
bBased on average daily shares outstanding.
cNet investment income per share includes approximately $0.10 per share related to income received in the form of special dividends in connection with certain fund holdings. Excluding this amount, the ratio of net investment income to average net assets would have been 1.10%.
dTotal return does not include fees, charges or expenses imposed by the variable annuity and life insurance contracts for which Franklin Templeton Variable Insurance Products Trust serves as an underlying investment vehicle. Total return is not annualized for periods less than one year.
eRatios are annualized for periods less than one year.
fBenefit of expense reduction rounds to less than 0.01%.
gBenefit of waiver and payments by affiliates rounds to less than 0.01%.
| FSV-8 | Semiannual Report | The accompanying notes are an integral part of these financial statements. |
FRANKLIN TEMPLETON VARIABLE INSURANCE PRODUCTS TRUST
FINANCIAL HIGHLIGHTS
Franklin Small Cap Value VIP Fund (continued)
Six Months Ended (unaudited) | Year Ended December 31, | |||||||||||||||||||||||
| 2016 | 2015 | 2014 | 2013 | 2012 | ||||||||||||||||||||
| Class 2 | ||||||||||||||||||||||||
Per share operating performance (for a share outstanding throughout the period) | ||||||||||||||||||||||||
Net asset value, beginning of period | $19.36 | $17.68 | $22.32 | $24.07 | $18.23 | $15.53 | ||||||||||||||||||
|
| |||||||||||||||||||||||
| Income from investment operationsa: | ||||||||||||||||||||||||
Net investment incomeb | 0.09 | 0.10 | 0.16 | 0.13 | 0.14 | 0.24 | c | |||||||||||||||||
Net realized and unrealized gains (losses) | (0.03 | ) | 4.66 | (1.49 | ) | 0.05 | 6.34 | 2.59 | ||||||||||||||||
|
| |||||||||||||||||||||||
Total from investment operations | 0.06 | 4.76 | (1.33 | ) | 0.18 | 6.48 | 2.83 | |||||||||||||||||
|
| |||||||||||||||||||||||
| Less distributions from: | ||||||||||||||||||||||||
Net investment income | (0.10 | ) | (0.16 | ) | (0.14 | ) | (0.15 | ) | (0.28 | ) | (0.13 | ) | ||||||||||||
Net realized gains | (1.38 | ) | (2.92 | ) | (3.17 | ) | (1.78 | ) | (0.36 | ) | — | |||||||||||||
|
| |||||||||||||||||||||||
Total distributions | (1.48 | ) | (3.08 | ) | (3.31 | ) | (1.93 | ) | (0.64 | ) | (0.13 | ) | ||||||||||||
|
| |||||||||||||||||||||||
Net asset value, end of period | $17.94 | $19.36 | $17.68 | $22.32 | $24.07 | $18.23 | ||||||||||||||||||
|
| |||||||||||||||||||||||
Total returnd | 0.20% | 30.19% | (7.39)% | 0.57% | 36.24% | 18.39% | ||||||||||||||||||
| Ratios to average net assetse | ||||||||||||||||||||||||
Expenses before waiver and payments by affiliates | 0.90% | 0.91% | 0.90% | 0.88% | 0.88% | 0.92% | ||||||||||||||||||
Expenses net of waiver and payments by affiliates | 0.89% | 0.89% | f | 0.89% | f | 0.88% | f,g | 0.88% | 0.92% | |||||||||||||||
Net investment income | 0.94% | 0.59% | 0.79% | 0.57% | 0.65% | 1.45% | c | |||||||||||||||||
| Supplemental data | ||||||||||||||||||||||||
Net assets, end of period (000’s) | $1,268,816 | $1,366,807 | $1,172,173 | $1,445,325 | $1,606,802 | $1,286,573 | ||||||||||||||||||
Portfolio turnover rate | 11.44% | 34.60% | 27.05% | 19.45% | 10.44% | 5.84% | ||||||||||||||||||
aThe amount shown for a share outstanding throughout the period may not correlate with the Statement of Operations for the period due to the timing of sales and repurchases of the Fund’s shares in relation to income earned and/or fluctuating fair value of the investments of the Fund.
bBased on average daily shares outstanding.
cNet investment income per share includes approximately $0.10 per share related to income received in the form of special dividends in connection with certain fund holdings. Excluding this amount, the ratio of net investment income to average net assets would have been 0.85%.
dTotal return does not include fees, charges or expenses imposed by the variable annuity and life insurance contracts for which Franklin Templeton Variable Insurance Products Trust serves as an underlying investment vehicle. Total return is not annualized for periods less than one year.
eRatios are annualized for periods less than one year.
fBenefit of expense reduction rounds to less than 0.01%.
gBenefit of waiver and payments by affiliates rounds to less than 0.01%.
| The accompanying notes are an integral part of these financial statements. | Semiannual Report | FSV-9 |
FRANKLIN TEMPLETON VARIABLE INSURANCE PRODUCTS TRUST
FINANCIAL HIGHLIGHTS
Franklin Small Cap Value VIP Fund (continued)
Six Months Ended (unaudited) | Year Ended December 31, | |||||||||||||||||||||||
| 2016 | 2015 | 2014 | 2013 | 2012 | ||||||||||||||||||||
| Class 4 | ||||||||||||||||||||||||
Per share operating performance (for a share outstanding throughout the period) | ||||||||||||||||||||||||
Net asset value, beginning of period | $19.74 | $17.96 | $22.63 | $24.37 | $18.44 | $15.71 | ||||||||||||||||||
|
| |||||||||||||||||||||||
| Income from investment operationsa: | ||||||||||||||||||||||||
Net investment incomeb | 0.08 | 0.09 | 0.14 | 0.11 | 0.12 | 0.22 | c | |||||||||||||||||
Net realized and unrealized gains (losses) | (0.03 | ) | 4.75 | (1.52 | ) | 0.05 | 6.42 | 2.63 | ||||||||||||||||
|
| |||||||||||||||||||||||
Total from investment operations | 0.05 | 4.84 | (1.38 | ) | 0.16 | 6.54 | 2.85 | |||||||||||||||||
|
| |||||||||||||||||||||||
| Less distributions from: | ||||||||||||||||||||||||
Net investment income | (0.09 | ) | (0.14 | ) | (0.12 | ) | (0.12 | ) | (0.25 | ) | (0.12 | ) | ||||||||||||
Net realized gains | (1.38 | ) | (2.92 | ) | (3.17 | ) | (1.78 | ) | (0.36 | ) | — | |||||||||||||
|
| |||||||||||||||||||||||
Total distributions | (1.47 | ) | (3.06 | ) | (3.29 | ) | (1.90 | ) | (0.61 | ) | (0.12 | ) | ||||||||||||
|
| |||||||||||||||||||||||
Net asset value, end of period | $18.32 | $19.74 | $17.96 | $22.63 | $24.37 | $18.44 | ||||||||||||||||||
|
| |||||||||||||||||||||||
Total returnd | 0.17% | 30.12% | (7.52)% | 0.48% | 36.12% | 18.27% | ||||||||||||||||||
| Ratios to average net assetse | ||||||||||||||||||||||||
Expenses before waiver and payments by affiliates | 1.00% | 1.01% | 1.00% | 0.98% | 0.98% | 1.02% | ||||||||||||||||||
Expenses net of waiver and payments by affiliates | 0.99% | 0.99% | f | 0.99% | f | 0.98% | f,g | 0.98% | 1.02% | |||||||||||||||
Net investment income | 0.84% | 0.49% | 0.69% | 0.47% | 0.55% | 1.35% | c | |||||||||||||||||
| Supplemental data | ||||||||||||||||||||||||
Net assets, end of period (000’s) | $30,988 | $32,751 | $26,128 | $30,452 | $35,936 | $32,424 | ||||||||||||||||||
Portfolio turnover rate | 11.44% | 34.60% | 27.05% | 19.45% | 10.44% | 5.84% | ||||||||||||||||||
aThe amount shown for a share outstanding throughout the period may not correlate with the Statement of Operations for the period due to the timing of sales and repurchases of the Fund’s shares in relation to income earned and/or fluctuating fair value of the investments of the Fund.
bBased on average daily shares outstanding.
cNet investment income per share includes approximately $0.10 per share related to income received in the form of special dividends in connection with certain fund holdings. Excluding this amount, the ratio of net investment income to average net assets would have been 0.75%.
dTotal return does not include fees, charges or expenses imposed by the variable annuity and life insurance contracts for which Franklin Templeton Variable Insurance Products Trust serves as an underlying investment vehicle. Total return is not annualized for periods less than one year.
eRatios are annualized for periods less than one year.
fBenefit of expense reduction rounds to less than 0.01%.
gBenefit of waiver and payments by affiliates rounds to less than 0.01%.
| FSV-10 | Semiannual Report | The accompanying notes are an integral part of these financial statements. |
FRANKLIN TEMPLETON VARIABLE INSURANCE PRODUCTS TRUST
Statement of Investments, June 30, 2017 (unaudited)
Franklin Small Cap Value VIP Fund
| ||||||||||
| Shares | Value | |||||||||
Common Stocks 96.5% | ||||||||||
Aerospace & Defense 4.8% | ||||||||||
AAR Corp. | 1,110,000 | $ | 38,583,600 | |||||||
Cubic Corp. | 246,400 | 11,408,320 | ||||||||
| a | Esterline Technologies Corp. | 154,200 | 14,618,160 | |||||||
|
| |||||||||
| 64,610,080 | ||||||||||
|
| |||||||||
Automobiles & Components 2.2% | ||||||||||
Gentex Corp. | 36,000 | 682,920 | ||||||||
LCI Industries | 131,800 | 13,496,320 | ||||||||
Thor Industries Inc. | 123,300 | 12,887,316 | ||||||||
Winnebago Industries Inc. | 87,900 | 3,076,500 | ||||||||
|
| |||||||||
| 30,143,056 | ||||||||||
|
| |||||||||
Banks 14.7% | ||||||||||
Access National Corp. | 228,121 | 6,049,769 | ||||||||
Bryn Mawr Bank Corp. | 175,250 | 7,448,125 | ||||||||
Chemical Financial Corp. | 591,154 | 28,617,765 | ||||||||
Columbia Banking System Inc. | 722,100 | 28,775,685 | ||||||||
First Horizon National Corp. | 1,579,037 | 27,506,824 | ||||||||
First of Long Island Corp. | 439,022 | 12,556,029 | ||||||||
German American Bancorp Inc. | 152,723 | 5,206,327 | ||||||||
Glacier Bancorp Inc. | 383,100 | 14,025,291 | ||||||||
Lakeland Financial Corp. | 551,400 | 25,298,232 | ||||||||
Peoples Bancorp Inc. | 248,712 | 7,991,117 | ||||||||
Pinnacle Financial Partners Inc. | 349,802 | 21,967,566 | ||||||||
TrustCo Bank Corp. NY | 684,300 | 5,303,325 | ||||||||
Washington Trust Bancorp Inc. | 134,900 | 6,954,095 | ||||||||
|
| |||||||||
| 197,700,150 | ||||||||||
|
| |||||||||
Building Products 5.4% | ||||||||||
| a | Armstrong Flooring Inc. | 262,320 | 4,713,890 | |||||||
| a | Gibraltar Industries Inc. | 361,200 | 12,876,780 | |||||||
Griffon Corp. | 290,700 | 6,380,865 | ||||||||
Insteel Industries Inc. | 195,000 | 6,429,150 | ||||||||
Simpson Manufacturing Co. Inc. | 665,000 | 29,067,150 | ||||||||
Universal Forest Products Inc. | 151,700 | 13,244,927 | ||||||||
|
| |||||||||
| 72,712,762 | ||||||||||
|
| |||||||||
Commercial & Professional Services 2.1% | ||||||||||
| a | Huron Consulting Group Inc. | 92,400 | 3,991,680 | |||||||
McGrath RentCorp | 452,218 | 15,660,310 | ||||||||
MSA Safety Inc. | 103,713 | 8,418,384 | ||||||||
|
| |||||||||
| 28,070,374 | ||||||||||
|
| |||||||||
Construction & Engineering 2.2% | ||||||||||
Argan Inc. | 19,516 | 1,170,960 | ||||||||
EMCOR Group Inc. | 256,400 | 16,763,432 | ||||||||
Granite Construction Inc. | 240,346 | 11,594,291 | ||||||||
|
| |||||||||
| 29,528,683 | ||||||||||
|
| |||||||||
Consumer Durables & Apparel 3.4% | ||||||||||
BRP Inc. (Canada) | 800,300 | 23,456,696 | ||||||||
Hooker Furniture Corp. | 158,800 | 6,534,620 | ||||||||
La-Z-Boy Inc. | 196,400 | 6,383,000 | ||||||||
| a | M/I Homes Inc. | 347,700 | 9,926,835 | |||||||
|
| |||||||||
| 46,301,151 | ||||||||||
|
| |||||||||
| Semiannual Report | FSV-11 |
FRANKLIN TEMPLETON VARIABLE INSURANCE PRODUCTS TRUST
STATEMENT OF INVESTMENTS (UNAUDITED)
Franklin Small Cap Value VIP Fund (continued)
| Shares | Value | |||||||||
| Common Stocks (continued) | ||||||||||
Consumer Services 0.4% | ||||||||||
Brinker International Inc. | 124,100 | $ | 4,728,210 | |||||||
|
| |||||||||
Electrical Equipment 1.2% | ||||||||||
Encore Wire Corp. | 17,600 | 751,520 | ||||||||
EnerSys | 140,710 | 10,194,440 | ||||||||
Regal Beloit Corp. | 68,600 | 5,594,330 | ||||||||
|
| |||||||||
| 16,540,290 | ||||||||||
|
| |||||||||
Energy 4.4% | ||||||||||
| a | Energen Corp. | 340,507 | 16,810,831 | |||||||
| a | Helix Energy Solutions Group Inc. | 30,800 | 173,712 | |||||||
| a | Hunting PLC (United Kingdom) | 2,349,039 | 14,925,416 | |||||||
| a | Natural Gas Services Group Inc. | 145,100 | 3,605,735 | |||||||
| a | Oil States International Inc. | 492,500 | 13,371,375 | |||||||
| a | Rowan Cos. PLC | 192,016 | 1,966,244 | |||||||
| a | Unit Corp. | 434,715 | 8,142,212 | |||||||
|
| |||||||||
| 58,995,525 | ||||||||||
|
| |||||||||
Food, Beverage & Tobacco 4.8% | ||||||||||
AGT Food and Ingredients Inc. (Canada) | 170,500 | 3,062,331 | ||||||||
Dairy Crest Group PLC (United Kingdom) | 1,370,000 | 10,689,116 | ||||||||
GrainCorp Ltd. (Australia) | 408,300 | 2,972,643 | ||||||||
| a | Landec Corp. | 848,600 | 12,601,710 | |||||||
Maple Leaf Foods Inc. (Canada) | 1,422,800 | 35,939,106 | ||||||||
|
| |||||||||
| 65,264,906 | ||||||||||
|
| |||||||||
Health Care Equipment & Services 4.0% | ||||||||||
Hill-Rom Holdings Inc. | 352,600 | 28,070,486 | ||||||||
STERIS PLC | 313,100 | 25,517,650 | ||||||||
|
| |||||||||
| 53,588,136 | ||||||||||
|
| |||||||||
Industrial Conglomerates 0.9% | ||||||||||
Carlisle Cos. Inc. | 123,600 | 11,791,440 | ||||||||
|
| |||||||||
Insurance 6.6% | ||||||||||
Arthur J. Gallagher & Co. | 147,400 | 8,438,650 | ||||||||
Aspen Insurance Holdings Ltd. | 389,600 | 19,421,560 | ||||||||
The Hanover Insurance Group Inc. | 199,100 | 17,646,233 | ||||||||
Horace Mann Educators Corp. | 293,100 | 11,079,180 | ||||||||
Old Republic International Corp. | 763,300 | 14,907,249 | ||||||||
Validus Holdings Ltd. | 346,300 | 17,997,211 | ||||||||
|
| |||||||||
| 89,490,083 | ||||||||||
|
| |||||||||
Machinery 7.3% | ||||||||||
Astec Industries Inc. | 198,100 | 10,996,531 | ||||||||
Federal Signal Corp. | 417,100 | 7,240,856 | ||||||||
Franklin Electric Co. Inc. | 64,514 | 2,670,880 | ||||||||
Hillenbrand Inc. | 79,200 | 2,859,120 | ||||||||
Kennametal Inc. | 356,800 | 13,351,456 | ||||||||
Lindsay Corp. | 55,300 | 4,935,525 | ||||||||
| a | The Manitowoc Co. Inc. | 976,700 | 5,869,967 | |||||||
Mueller Industries Inc. | 449,900 | 13,699,455 | ||||||||
Mueller Water Products Inc., A | 2,089,700 | 24,407,696 | ||||||||
Titan International Inc. | 872,000 | 10,472,720 | ||||||||
Watts Water Technologies Inc., A | 40,700 | 2,572,240 | ||||||||
|
| |||||||||
| 99,076,446 | ||||||||||
|
| |||||||||
| FSV-12 | Semiannual Report |
FRANKLIN TEMPLETON VARIABLE INSURANCE PRODUCTS TRUST
STATEMENT OF INVESTMENTS (UNAUDITED)
Franklin Small Cap Value VIP Fund (continued)
| Shares | Value | |||||||||
Common Stocks (continued) | ||||||||||
| Materials 5.9% | ||||||||||
A Schulman Inc. | 13,866 | $ | 443,712 | |||||||
AptarGroup Inc. | 65,000 | 5,645,900 | ||||||||
| a | Detour Gold Corp. (Canada) | 776,900 | 9,098,748 | |||||||
H.B. Fuller Co. | 52,200 | 2,667,942 | ||||||||
| a | Ingevity Corp. | 168,200 | 9,654,680 | |||||||
Minerals Technologies Inc. | 45,600 | 3,337,920 | ||||||||
OceanaGold Corp. (Australia) | 2,985,200 | 9,005,232 | ||||||||
Reliance Steel & Aluminum Co. | 47,400 | 3,451,194 | ||||||||
Sensient Technologies Corp. | 424,300 | 34,168,879 | ||||||||
Stepan Co. | 18,300 | 1,594,662 | ||||||||
|
| |||||||||
| 79,068,869 | ||||||||||
|
| |||||||||
| Pharmaceuticals, Biotechnology & Life Sciences 1.9% | ||||||||||
Gerresheimer AG (Germany) | 326,200 | 26,242,355 | ||||||||
|
| |||||||||
| Real Estate 6.3% | ||||||||||
Brandywine Realty Trust | 1,359,300 | 23,828,529 | ||||||||
Highwoods Properties Inc. | 128,900 | 6,536,519 | ||||||||
LTC Properties Inc. | 689,800 | 35,448,822 | ||||||||
Sunstone Hotel Investors Inc. | 1,223,800 | 19,727,656 | ||||||||
|
| |||||||||
| 85,541,526 | ||||||||||
|
| |||||||||
| Retailing 0.8% | ||||||||||
Caleres Inc. | 308,200 | 8,561,796 | ||||||||
The Finish Line Inc., A | 184,300 | 2,611,531 | ||||||||
|
| |||||||||
| 11,173,327 | ||||||||||
|
| |||||||||
| Semiconductors & Semiconductor Equipment 5.4% | ||||||||||
Cohu Inc. | 642,800 | 10,117,672 | ||||||||
| a | Kulicke and Soffa Industries Inc. (Singapore) | 633,100 | 12,041,562 | |||||||
MKS Instruments Inc. | 321,200 | 21,616,760 | ||||||||
| a | Photronics Inc. | 1,000,800 | 9,407,520 | |||||||
Versum Materials Inc. | 621,238 | 20,190,235 | ||||||||
|
| |||||||||
| 73,373,749 | ||||||||||
|
| |||||||||
| Technology Hardware & Equipment 3.6% | ||||||||||
| a | NetScout Systems Inc. | 574,100 | 19,749,040 | |||||||
| a | Plexus Corp. | 65,400 | 3,438,078 | |||||||
| a | Rogers Corp. | 61,500 | 6,680,130 | |||||||
| a | Zebra Technologies Corp., A | 185,500 | 18,646,460 | |||||||
|
| |||||||||
| 48,513,708 | ||||||||||
|
| |||||||||
| Telecommunication Services 0.9% | ||||||||||
| a | ORBCOMM Inc. | 1,042,000 | 11,774,600 | |||||||
|
| |||||||||
| Transportation 2.9% | ||||||||||
| a | SAIA Inc. | 384,000 | 19,699,200 | |||||||
| a | Spirit Airlines Inc. | 370,900 | 19,156,985 | |||||||
|
| |||||||||
| 38,856,185 | ||||||||||
|
| |||||||||
| Utilities 4.4% | ||||||||||
Connecticut Water Service Inc. | 47,200 | 2,620,072 | ||||||||
IDACORP Inc. | 336,289 | 28,702,266 | ||||||||
Spire Inc. | 392,500 | 27,376,875 | ||||||||
|
| |||||||||
| 58,699,213 | ||||||||||
|
| |||||||||
Total Common Stocks (Cost $931,586,142) | 1,301,784,824 | |||||||||
|
| |||||||||
| Semiannual Report | FSV-13 |
FRANKLIN TEMPLETON VARIABLE INSURANCE PRODUCTS TRUST
STATEMENT OF INVESTMENTS (UNAUDITED)
Franklin Small Cap Value VIP Fund (continued)
| Principal Amount | Value | |||||||||
| Corporate Bonds 0.9% | ||||||||||
| Energy 0.7% | ||||||||||
Unit Corp., senior sub. note, 6.625%, 5/15/21 | $ | 9,632,000 | $ | 9,270,800 | ||||||
|
| |||||||||
| Machinery 0.2% | ||||||||||
Mueller Industries Inc., 6.00%, 3/01/27 | 2,378,000 | 2,449,340 | ||||||||
|
| |||||||||
Total Corporate Bonds (Cost $11,573,506) | 11,720,140 | |||||||||
|
| |||||||||
Total Investments before Short Term Investments (Cost $943,159,648) | 1,313,504,964 | |||||||||
|
| |||||||||
| Shares | ||||||||||
Short Term Investments (Cost $42,774,480) 3.2% | ||||||||||
Money Market Funds 3.2% | ||||||||||
| b,c | Institutional Fiduciary Trust Money Market Portfolio, 0.58% | 42,774,480 | 42,774,480 | |||||||
|
| |||||||||
Total Investments (Cost $985,934,128) 100.6% | 1,356,279,444 | |||||||||
Other Assets, less Liabilities (0.6)% | (8,248,381 | ) | ||||||||
|
| |||||||||
Net Assets 100.0% | $ | 1,348,031,063 | ||||||||
|
| |||||||||
aNon-income producing.
bSee Note 3(e) regarding investments in affiliated management investment companies.
cThe rate shown is the annualized seven-day yield at period end.
| FSV-14 | Semiannual Report | The accompanying notes are an integral part of these financial statements. |
FRANKLIN TEMPLETON VARIABLE INSURANCE PRODUCTS TRUST
Financial Statements
Statement of Assets and Liabilities
June 30, 2017 (unaudited)
Franklin Small Cap Value VIP Fund | ||||
Assets: | ||||
Investments in securities: | ||||
Cost - Unaffiliated issuers | $ | 943,159,648 | ||
Cost - Non-controlled affiliates (Note 3e) | 42,774,480 | |||
|
| |||
Total cost of investments | $ | 985,934,128 | ||
|
| |||
Value - Unaffiliated issuers | $ | 1,313,504,964 | ||
Value - Non-controlled affiliates (Note 3e) | 42,774,480 | |||
|
| |||
Total value of investments | 1,356,279,444 | |||
Cash | 102,344 | |||
Receivables: | ||||
Investment securities sold | 3,645,987 | |||
Capital shares sold | 109,954 | |||
Dividends and interest | 1,026,413 | |||
Other assets | 937 | |||
|
| |||
Total assets | 1,361,165,079 | |||
|
| |||
Liabilities: | ||||
Payables: | ||||
Investment securities purchased | 10,587,830 | |||
Capital shares redeemed | 1,119,991 | |||
Management fees | 689,898 | |||
Distribution fees | 555,825 | |||
Accrued expenses and other liabilities | 180,472 | |||
|
| |||
Total liabilities | 13,134,016 | |||
|
| |||
Net assets, at value | $ | 1,348,031,063 | ||
|
| |||
Net assets consist of: | ||||
Paid-in capital | $ | 904,716,052 | ||
Undistributed net investment income | 7,322,593 | |||
Net unrealized appreciation (depreciation) | 370,349,134 | |||
Accumulated net realized gain (loss) | 65,643,284 | |||
|
| |||
Net assets, at value | $ | 1,348,031,063 | ||
|
| |||
| Class 1: | ||||
Net assets, at value | $ | 48,226,475 | ||
|
| |||
Shares outstanding | 2,609,617 | |||
|
| |||
Net asset value and maximum offering price per share | $ | 18.48 | ||
|
| |||
| Class 2: | ||||
Net assets, at value | $ | 1,268,816,492 | ||
|
| |||
Shares outstanding | 70,745,150 | |||
|
| |||
Net asset value and maximum offering price per share | $ | 17.94 | ||
|
| |||
| Class 4: | ||||
Net assets, at value | $ | 30,988,096 | ||
|
| |||
Shares outstanding | 1,691,513 | |||
|
| |||
Net asset value and maximum offering price per share | $ | 18.32 | ||
|
| |||
| The accompanying notes are an integral part of these financial statements. | Semiannual Report | FSV-15 |
FRANKLIN TEMPLETON VARIABLE INSURANCE PRODUCTS TRUST
FINANCIAL STATEMENTS
Statement of Operations
for the six months ended June 30, 2017 (unaudited)
Franklin Small Cap Value VIP Fund | ||||
Investment income: | ||||
Dividends: | ||||
Unaffiliated issuers | $ | 12,216,761 | ||
Non-controlled affiliates (Note 3e) | 56,409 | |||
Interest | 407,962 | |||
|
| |||
Total investment income | 12,681,132 | |||
|
| |||
Expenses: | ||||
Management fees (Note 3a) | 4,323,837 | |||
Distribution fees: (Note 3c) | ||||
Class 2 | 1,632,087 | |||
Class 4 | 54,971 | |||
Custodian fees (Note 4) | 11,091 | |||
Reports to shareholders | 145,480 | |||
Professional fees | 31,122 | |||
Trustees’ fees and expenses | 3,021 | |||
Other | 16,029 | |||
|
| |||
Total expenses | 6,217,638 | |||
Expenses waived/paid by affiliates | (65,396 | ) | ||
|
| |||
Net expenses | 6,152,242 | |||
|
| |||
Net investment income | 6,528,890 | |||
|
| |||
Realized and unrealized gains (losses): | ||||
Net realized gain (loss) from: | ||||
Investments | 66,429,171 | |||
Realized gain distributions from REITs | 737,835 | |||
Foreign currency transactions | 11,336 | |||
|
| |||
Net realized gain (loss) | 67,178,342 | |||
|
| |||
Net change in unrealized appreciation (depreciation) on: | ||||
Investments | (70,866,113 | ) | ||
Translation of other assets and liabilities denominated in foreign currencies | 9,136 | |||
|
| |||
Net change in unrealized appreciation (depreciation) | (70,856,977 | ) | ||
|
| |||
Net realized and unrealized gain (loss) | (3,678,635 | ) | ||
|
| |||
Net increase (decrease) in net assets resulting from operations | $ | 2,850,255 | ||
|
| |||
| FSV-16 | Semiannual Report | The accompanying notes are an integral part of these financial statements. |
FRANKLIN TEMPLETON VARIABLE INSURANCE PRODUCTS TRUST
FINANCIAL STATEMENTS
Statements of Changes in Net Assets
| Franklin Small Cap Value VIP Fund | ||||||||
| Six Months Ended June 30, 2017 (unaudited) | Year Ended 2016 | |||||||
Increase (decrease) in net assets: | ||||||||
Operations: | ||||||||
Net investment income | $ | 6,528,890 | $ | 7,749,254 | ||||
Net realized gain (loss) | 67,178,342 | 96,362,922 | ||||||
Net change in unrealized appreciation (depreciation) | (70,856,977 | ) | 243,787,716 | |||||
|
| |||||||
Net increase (decrease) in net assets resulting from operations | 2,850,255 | 347,899,892 | ||||||
|
| |||||||
Distributions to shareholders from: | ||||||||
Net investment income: | ||||||||
Class 1 | (357,335 | ) | (515,097 | ) | ||||
Class 2 | (6,657,162 | ) | (10,103,275 | ) | ||||
Class 4 | (135,525 | ) | (189,568 | ) | ||||
Net realized gains: | ||||||||
Class 1 | (3,344,065 | ) | (7,134,342 | ) | ||||
Class 2 | (91,049,189 | ) | (185,669,944 | ) | ||||
Class 4 | (2,178,641 | ) | (4,020,473 | ) | ||||
|
| |||||||
Total distributions to shareholders | (103,721,917 | ) | (207,632,699 | ) | ||||
|
| |||||||
Capital share transactions: (Note 2) | ||||||||
Class 1 | 3,927,170 | (2,877,866 | ) | |||||
Class 2 | (2,885,923 | ) | 62,430,130 | |||||
Class 4 | 473,137 | 3,371,117 | ||||||
|
| |||||||
Total capital share transactions | 1,514,384 | 62,923,381 | ||||||
|
| |||||||
Net increase (decrease) in net assets | (99,357,278 | ) | 203,190,574 | |||||
Net assets: | ||||||||
Beginning of period | 1,447,388,341 | 1,244,197,767 | ||||||
|
| |||||||
End of period | $ | 1,348,031,063 | $ | 1,447,388,341 | ||||
|
| |||||||
Undistributed net investment income included in net assets: | ||||||||
End of period | $ | 7,322,593 | $ | 7,943,725 | ||||
|
| |||||||
| The accompanying notes are an integral part of these financial statements. | Semiannual Report | FSV-17 |
FRANKLIN TEMPLETON VARIABLE INSURANCE PRODUCTS TRUST
Notes to Financial Statements (unaudited)
Franklin Small Cap Value VIP Fund
1. Organization and Significant Accounting Policies
Franklin Templeton Variable Insurance Products Trust (Trust) is registered under the Investment Company Act of 1940 (1940 Act) as an open-end management investment company, consisting of eighteen separate funds and applies the specialized accounting and reporting guidance in U.S. Generally Accepted Accounting Principles (U.S. GAAP). Franklin Small Cap Value VIP Fund (Fund) is included in this report. Shares of the Fund are generally sold only to insurance company separate accounts to fund the benefits of variable life insurance policies or variable annuity contracts. The Fund offers three classes of shares: Class 1, Class 2 and Class 4. Each class of shares may differ by its distribution fees, voting rights on matters affecting a single class and its exchange privilege.
The following summarizes the Fund’s significant accounting policies.
a. Financial Instrument Valuation
The Fund’s investments in financial instruments are carried at fair value daily. Fair value is the price that would be received to sell an asset or paid to transfer a liability in an orderly transaction between market participants on the measurement date. The Fund calculates the net asset value (NAV) per share as of 4 p.m. Eastern time each day the New York Stock Exchange (NYSE) is open for trading. Under compliance policies and procedures approved by the Trust’s Board of Trustees (the Board), the Fund’s administrator has responsibility for oversight of valuation, including leading the cross-functional Valuation Committee (VC). The VC provides administration and oversight of the Fund’s valuation policies and procedures, which are approved annually by the Board. Among other things, these procedures allow the Fund to utilize independent pricing services, quotations from securities and financial instrument dealers, and other market sources to determine fair value.
Equity securities listed on an exchange or on the NASDAQ National Market System are valued at the last quoted sale price or the official closing price of the day, respectively. Foreign equity securities are valued as of the close of trading on the foreign stock exchange on which the security is primarily traded, or as of 4 p.m. Eastern time. The value is then converted into its U.S. dollar equivalent at the foreign exchange rate in effect at 4 p.m. Eastern time on the day that the value of the security is determined. Over-the-counter (OTC) securities are
valued within the range of the most recent quoted bid and ask prices. Securities that trade in multiple markets or on multiple exchanges are valued according to the broadest and most representative market. Certain equity securities are valued based upon fundamental characteristics or relationships to similar securities.
Debt securities generally trade in the OTC market rather than on a securities exchange. The Fund’s pricing services use multiple valuation techniques to determine fair value. In instances where sufficient market activity exists, the pricing services may utilize a market-based approach through which quotes from market makers are used to determine fair value. In instances where sufficient market activity may not exist or is limited, the pricing services also utilize proprietary valuation models which may consider market characteristics such as benchmark yield curves, credit spreads, estimated default rates, anticipated market interest rate volatility, coupon rates, anticipated timing of principal repayments, underlying collateral, and other unique security features in order to estimate the relevant cash flows, which are then discounted to calculate the fair value.
Investments in open-end mutual funds are valued at the closing NAV.
The Fund has procedures to determine the fair value of financial instruments for which market prices are not reliable or readily available. Under these procedures, the VC convenes on a regular basis to review such financial instruments and considers a number of factors, including significant unobservable valuation inputs, when arriving at fair value. The VC primarily employs a market-based approach which may use related or comparable assets or liabilities, recent transactions, market multiples, book values, and other relevant information for the investment to determine the fair value of the investment. An income-based valuation approach may also be used in which the anticipated future cash flows of the investment are discounted to calculate fair value. Discounts may also be applied due to the nature or duration of any restrictions on the disposition of the investments. Due to the inherent uncertainty of valuations of such investments, the fair values may differ significantly from the values that would have been used had an active market existed. The VC employs various methods for calibrating these valuation approaches including a regular review of key inputs and assumptions, transactional back-testing or disposition analysis, and reviews of any related market activity.
| FSV-18 | Semiannual Report |
FRANKLIN TEMPLETON VARIABLE INSURANCE PRODUCTS TRUST
NOTES TO FINANCIAL STATEMENTS (UNAUDITED)
Franklin Small Cap Value VIP Fund (continued)
Trading in securities on foreign securities stock exchanges and OTC markets may be completed before 4 p.m. Eastern time. In addition, trading in certain foreign markets may not take place on every Fund’s business day. Occasionally, events occur between the time at which trading in a foreign security is completed and 4 p.m. Eastern time that might call into question the reliability of the value of a portfolio security held by the Fund. As a result, differences may arise between the value of the Fund’s portfolio securities as determined at the foreign market close and the latest indications of value at 4 p.m. Eastern time. In order to minimize the potential for these differences, the VC monitors price movements following the close of trading in foreign stock markets through a series of country specific market proxies (such as baskets of American Depositary Receipts, futures contracts and exchange traded funds). These price movements are measured against established trigger thresholds for each specific market proxy to assist in determining if an event has occurred that may call into question the reliability of the values of the foreign securities held by the Fund. If such an event occurs, the securities may be valued using fair value procedures, which may include the use of independent pricing services.
When the last day of the reporting period is a non-business day, certain foreign markets may be open on those days that the Fund’s NAV is not calculated, which could result in differences between the value of the Fund’s portfolio securities on the last business day and the last calendar day of the reporting period. Any significant security valuation changes due to an open foreign market are adjusted and reflected by the Fund for financial reporting purposes.
b. Foreign Currency Translation
Portfolio securities and other assets and liabilities denominated in foreign currencies are translated into U.S. dollars based on the exchange rate of such currencies against U.S. dollars on the date of valuation. The Fund may enter into foreign currency exchange contracts to facilitate transactions denominated in a foreign currency. Purchases and sales of securities, income and expense items denominated in foreign currencies are translated into U.S. dollars at the exchange rate in effect on the transaction date. Portfolio securities and assets and liabilities denominated in foreign currencies contain risks that those currencies will decline in value relative to the U.S. dollar. Occasionally, events may impact the availability or reliability of foreign exchange
rates used to convert the U.S. dollar equivalent value. If such an event occurs, the foreign exchange rate will be valued at fair value using procedures established and approved by the Board.
The Fund does not separately report the effect of changes in foreign exchange rates from changes in market prices on securities held. Such changes are included in net realized and unrealized gain or loss from investments in the Statement of Operations.
Realized foreign exchange gains or losses arise from sales of foreign currencies, currency gains or losses realized between the trade and settlement dates on securities transactions and the difference between the recorded amounts of dividends, interest, and foreign withholding taxes and the U.S. dollar equivalent of the amounts actually received or paid. Net unrealized foreign exchange gains and losses arise from changes in foreign exchange rates on foreign denominated assets and liabilities other than investments in securities held at the end of the reporting period.
c. Securities Lending
The Fund participates in an agency based securities lending program to earn additional income. The Fund receives cash collateral against the loaned securities in an amount equal to at least 102% of the fair value of the loaned securities. Collateral is maintained over the life of the loan in an amount not less than 100% of the fair value of loaned securities, as determined at the close of Fund business each day; any additional collateral required due to changes in security values is delivered to the Fund on the next business day. The collateral is deposited into a joint cash account with other funds and is used to invest in a money market fund managed by Franklin Advisers, Inc., an affiliate of the Fund, and/or a joint repurchase agreement. The Fund may receive income from the investment of cash collateral, in addition to lending fees and rebates paid by the borrower. Income from securities loaned, net of fees paid to the securities lending agent and/or third-party vendor, is reported separately in the Statement of Operations. The Fund bears the market risk with respect to the collateral investment, securities loaned, and the risk that the agent may default on its obligations to the Fund. If the borrower defaults on its obligation to return the securities loaned, the Fund has the right to repurchase the securities in the open market using the collateral received. The securities lending agent has agreed to indemnify the Fund in the event of default by a third party borrower. At June 30, 2017, the Fund had no securities on loan.
| Semiannual Report | FSV-19 |
FRANKLIN TEMPLETON VARIABLE INSURANCE PRODUCTS TRUST
NOTES TO FINANCIAL STATEMENTS (UNAUDITED)
Franklin Small Cap Value VIP Fund (continued)
1. Organization and Significant Accounting
Policies (continued)
d. Income and Deferred Taxes
It is the Fund’s policy to qualify as a regulated investment company under the Internal Revenue Code. The Fund intends to distribute to shareholders substantially all of its taxable income and net realized gains to relieve it from federal income and if applicable, excise taxes. As a result, no provision for U.S. federal income taxes is required.
The Fund may be subject to foreign taxation related to income received, capital gains on the sale of securities and certain foreign currency transactions in the foreign jurisdictions in which it invests. Foreign taxes, if any, are recorded based on the tax regulations and rates that exist in the foreign markets in which the Fund invests. When a capital gain tax is determined to apply, the Fund records an estimated deferred tax liability in an amount that would be payable if the securities were disposed of on the valuation date.
The Fund may recognize an income tax liability related to its uncertain tax positions under U.S. GAAP when the uncertain tax position has a less than 50% probability that it will be sustained upon examination by the tax authorities based on its technical merits. As of June 30, 2017, the Fund has determined that no tax liability is required in its financial statements related to uncertain tax positions for any open tax years (or expected to be taken in future tax years). Open tax years are those that remain subject to examination and are based on each tax jurisdiction’s statute of limitation.
e. Security Transactions, Investment Income, Expenses and Distributions
Security transactions are accounted for on trade date. Realized gains and losses on security transactions are determined on a specific identification basis. Interest income and estimated expenses are accrued daily. Amortization of premium and accretion of discount on debt securities are included in interest income. Dividend income and realized gain distributions are recorded on the ex-dividend date except for certain dividends from securities where the dividend rate is not available. In such cases, the dividend is recorded as soon as the information is
received by the Fund. Distributions to shareholders are recorded on the ex-dividend date. Distributable earnings are determined according to income tax regulations (tax basis) and may differ from earnings recorded in accordance with U.S. GAAP. These differences may be permanent or temporary. Permanent differences are reclassified among capital accounts to reflect their tax character. These reclassifications have no impact on net assets or the results of operations. Temporary differences are not reclassified, as they may reverse in subsequent periods.
Common expenses incurred by the Trust are allocated among the Funds based on the ratio of net assets of each Fund to the combined net assets of the Trust. Fund specific expenses are charged directly to the Fund that incurred the expense.
Realized and unrealized gains and losses and net investment income, not including class specific expenses, are allocated daily to each class of shares based upon the relative proportion of net assets of each class. Differences in per share distributions, by class, are generally due to differences in class specific expenses.
f. Accounting Estimates
The preparation of financial statements in accordance with U.S. GAAP requires management to make estimates and assumptions that affect the reported amounts of assets and liabilities at the date of the financial statements and the amounts of income and expenses during the reporting period. Actual results could differ from those estimates.
g. Guarantees and Indemnifications
Under the Trust’s organizational documents, its officers and trustees are indemnified by the Trust against certain liabilities arising out of the performance of their duties to the Trust. Additionally, in the normal course of business, the Trust, on behalf of the Fund, enters into contracts with service providers that contain general indemnification clauses. The Trust’s maximum exposure under these arrangements is unknown as this would involve future claims that may be made against the Trust that have not yet occurred. Currently, the Trust expects the risk of loss to be remote.
| FSV-20 | Semiannual Report |
FRANKLIN TEMPLETON VARIABLE INSURANCE PRODUCTS TRUST
NOTES TO FINANCIAL STATEMENTS (UNAUDITED)
Franklin Small Cap Value VIP Fund (continued)
2. Shares of Beneficial Interest
At June 30, 2017, there were an unlimited number of shares authorized (without par value). Transactions in the Fund’s shares were as follows:
| Six Months Ended June 30, 2017 | Year Ended December 31, 2016 | |||||||||||||||||||
| Shares | Amount | Shares | Amount | |||||||||||||||||
| Class 1 Shares: | ||||||||||||||||||||
Shares sold | 211,530 | $ | 4,187,580 | 219,629 | $ | 4,034,514 | ||||||||||||||
Shares issued in reinvestment of distributions | 198,148 | 3,701,400 | 456,683 | 7,649,439 | ||||||||||||||||
Shares redeemed | (200,291 | ) | (3,961,810 | ) | (809,509 | ) | (14,561,819 | ) | ||||||||||||
|
| |||||||||||||||||||
Net increase (decrease) | 209,387 | $ | 3,927,170 | (133,197 | ) | $ | (2,877,866 | ) | ||||||||||||
|
| |||||||||||||||||||
| Class 2 Shares: | ||||||||||||||||||||
Shares sold | 2,499,606 | $ | 48,225,645 | 7,124,811 | $ | 128,912,250 | ||||||||||||||
Shares issued in reinvestment of distributions | 5,389,209 | 97,706,351 | 12,018,000 | 195,773,219 | ||||||||||||||||
Shares redeemed | (7,735,893 | ) | (148,817,919 | ) | (14,862,137 | ) | (262,255,339 | ) | ||||||||||||
|
| |||||||||||||||||||
Net increase (decrease) | 152,922 | $ | (2,885,923 | ) | 4,280,674 | $ | 62,430,130 | |||||||||||||
|
| |||||||||||||||||||
| Class 4 Shares: | ||||||||||||||||||||
Shares sold | 143,557 | $ | 2,797,259 | 330,960 | $ | 6,027,880 | ||||||||||||||
Shares issued in reinvestment of distributions | 124,955 | 2,314,166 | 253,312 | 4,210,041 | ||||||||||||||||
Shares redeemed | (236,045 | ) | (4,638,288 | ) | (379,696 | ) | (6,866,804 | ) | ||||||||||||
|
| |||||||||||||||||||
Net increase (decrease) | 32,467 | $ | 473,137 | 204,576 | $ | 3,371,117 | ||||||||||||||
|
| |||||||||||||||||||
3. Transactions with Affiliates
Franklin Resources, Inc. is the holding company for various subsidiaries that together are referred to as Franklin Templeton Investments. Certain officers and trustees of the Fund are also officers and/or directors of the following subsidiaries:
| Subsidiary | Affiliation | |
Franklin Advisory Services, LLC (Advisory Services) | Investment manager | |
Franklin Templeton Services, LLC (FT Services) | Administrative manager | |
Franklin Templeton Distributors, Inc. (Distributors) | Principal underwriter | |
Franklin Templeton Investor Services, LLC (Investor Services) | Transfer agent |
a. Management Fees
The Fund pays an investment management fee to Advisory Services based on the average daily net assets of the Fund as follows:
| Annualized Fee Rate | Net Assets | |
0.750% | Up to and including $200 million | |
0.635% | Over $200 million, up to and including $700 million | |
0.600% | Over $700 million, up to and including $1.2 billion | |
0.575% | Over $1.2 billion, up to and including $1.3 billion | |
0.475% | In excess of $1.3 billion |
For the period ended June 30, 2017, the annualized effective investment management fee rate was 0.624% of the Fund’s average daily net assets.
| Semiannual Report | FSV-21 |
FRANKLIN TEMPLETON VARIABLE INSURANCE PRODUCTS TRUST
NOTES TO FINANCIAL STATEMENTS (UNAUDITED)
Franklin Small Cap Value VIP Fund (continued)
3. Transactions with Affiliates (continued)
b. Administrative Fees
Under an agreement with Advisory Services, FT Services provides administrative services to the Fund. The fee is paid by Advisory Services based on the Fund’s average daily net assets, and is not an additional expense of the Fund.
c. Distribution Fees
The Board has adopted distribution plans for Class 2 and Class 4 shares pursuant to Rule 12b-1 under the 1940 Act. Under the Fund’s compensation distribution plans, the Fund pays Distributors for costs incurred in connection with the servicing, sale and distribution of the Fund’s shares up to 0.35% per year of its average daily net assets of each class. The Board has agreed to limit the current rate to 0.25% per year for Class 2. The plan year, for purposes of monitoring compliance with the maximum annual plan rates, is February 1 through January 31.
d. Transfer Agent Fees
Investor Services, under terms of an agreement, performs shareholder servicing for the Fund and is not paid by the Fund for the services.
e. Investments in Affiliated Management Investment Companies
The Fund invests in one or more affiliated management investment companies for purposes other than exercising a controlling influence over the management or policies. Management fees paid by the Fund are waived on assets invested in the affiliated management investment companies, as noted in the Statements of Operations, in an amount not to exceed the management and administrative fees paid directly or indirectly by each affiliate. Prior to January 1,2014, the waiver was accounted for as a reduction to management fees. During the period ended June 30, 2017, the Fund held investments in affiliated management investment companies as follows:
| Number of Shares Held at Beginning of Period | Gross Additions | Gross Reductions | Number of Shares Held at End of Period | Value at End of Period | Investment Income | Realized Gain (Loss) | % of Affiliated Fund Shares Outstanding Held at End of Period | |||||||||||||||||||||||||
| Non-Controlled Affiliates | ||||||||||||||||||||||||||||||||
Institutional Fiduciary Trust Money Market Portfolio, 0.58% | 46,387,989 | 136,046,736 | (139,660,245 | ) | 42,774,480 | $ | 42,774,480 | $ | 56,409 | $ | — | 0.2% | ||||||||||||||||||||
|
| |||||||||||||||||||||||||||||||
4. Expense Offset Arrangement
The Fund has entered into an arrangement with its custodian whereby credits realized as a result of uninvested cash balances are used to reduce a portion of the Fund’s custodian expenses. During the period ended June 30, 2017, there were no credits earned.
5. Income Taxes
At June 30, 2017, the cost of investments, net unrealized appreciation (depreciation) for income tax purposes were as follows:
Cost of investments | $ | 986,727,494 | ||
|
| |||
Unrealized appreciation | $ | 387,354,772 | ||
Unrealized depreciation | (17,802,822 | ) | ||
|
| |||
Net unrealized appreciation (depreciation) | $ | 369,551,950 | ||
|
|
| FSV-22 | Semiannual Report |
FRANKLIN TEMPLETON VARIABLE INSURANCE PRODUCTS TRUST
NOTES TO FINANCIAL STATEMENTS (UNAUDITED)
Franklin Small Cap Value VIP Fund (continued)
Differences between income and/or capital gains as determined on a book basis and a tax basis are primarily due to differing treatments of wash sales.
6. Investment Transactions
Purchases and sales of investments (excluding short term securities) for the period ended June 30, 2017, aggregated $155,821,934 and $245,184,980, respectively.
7. Credit Facility
The Fund, together with other U.S. registered and foreign investment funds (collectively, Borrowers), managed by Franklin Templeton Investments, are borrowers in a joint syndicated senior unsecured credit facility totaling $2 billion (Global Credit Facility) which matures on February 9, 2018. This Global Credit Facility provides a source of funds to the Borrowers for temporary and emergency purposes, including the ability to meet future unanticipated or unusually large redemption requests.
Under the terms of the Global Credit Facility, the Fund shall, in addition to interest charged on any borrowings made by the Fund and other costs incurred by the Fund, pay its share of fees and expenses incurred in connection with the implementation and maintenance of the Global Credit Facility, based upon its relative share of the aggregate net assets of all of the Borrowers, including an annual commitment fee of 0.15% based upon the unused portion of the Global Credit Facility. These fees are reflected in other expenses in the Statement of Operations. During the period ended June 30, 2017, the Fund did not use the Global Credit Facility.
8. Fair Value Measurements
The Fund follows a fair value hierarchy that distinguishes between market data obtained from independent sources (observable inputs) and the Fund’s own market assumptions (unobservable inputs). These inputs are used in determining the value of the Fund’s financial instruments and are summarized in the following fair value hierarchy:
| • | Level 1 – quoted prices in active markets for identical financial instruments |
| • | Level 2 – other significant observable inputs (including quoted prices for similar financial instruments, interest rates, prepayment speed, credit risk, etc.) |
| • | Level 3 – significant unobservable inputs (including the Fund’s own assumptions in determining the fair value of financial instruments) |
The input levels are not necessarily an indication of the risk or liquidity associated with financial instruments at that level.
For movements between the levels within the fair value hierarchy, the Fund has adopted a policy of recognizing the transfers as of the date of the underlying event which caused the movement.
| Semiannual Report | FSV-23 |
FRANKLIN TEMPLETON VARIABLE INSURANCE PRODUCTS TRUST
NOTES TO FINANCIAL STATEMENTS (UNAUDITED)
Franklin Small Cap Value VIP Fund (continued)
8. Fair Value Measurements (continued)
A summary of inputs used as of June 30, 2017, in valuing the Fund’s assets carried at fair value, is as follows:
| Level 1 | Level 2 | Level 3 | Total | |||||||||||||
| Assets: | ||||||||||||||||
Investments in Securities: | ||||||||||||||||
Equity Investmentsa | $ | 1,301,784,824 | $ | — | $ | — | $ | 1,301,784,824 | ||||||||
Corporate Bonds | — | 11,720,140 | — | 11,720,140 | ||||||||||||
Short Term Investments | 42,774,480 | — | — | 42,774,480 | ||||||||||||
|
| |||||||||||||||
Total Investments in Securities | $ | 1,344,559,304 | $ | 11,720,140 | $ | — | $ | 1,356,279,444 | ||||||||
|
| |||||||||||||||
aFor detailed categories, see the accompanying Statement of Investments.
9. Investment Company Reporting Modernization
In October 2016, the U.S. Securities and Exchange Commission adopted new rules and amended existing rules (together, final rules) intended to modernize the reporting and disclosure of information by registered investment companies. In part, the final rules amend Regulation S-X and require standardized, enhanced disclosures about derivatives in investment company financial statements, as well as other amendments. The compliance date for the amendments to Regulation S-X is August 1, 2017. Management has reviewed the requirements and believes the adoption of the amendments to Regulation S-X will not have a material impact on the Fund’s financial statements and related disclosures.
10. Subsequent Events
The Fund has evaluated subsequent events through the issuance of the financial statements and determined that no events have occurred that require disclosure.
| FSV-24 | Semiannual Report |
Franklin Small-Mid Cap Growth VIP Fund
This semiannual report for Franklin Small-Mid Cap Growth VIP Fund covers the period ended June 30, 2017.
Class 1 Performance Summary as of June 30, 2017
The Fund’s Class 1 Shares delivered a +11.06% total return* for the six-month period ended June 30, 2017.
*The Fund has a fee waiver associated with any investment it makes in a Franklin Templeton money fund and/or other Franklin Templeton fund, contractually guaranteed through 4/30/18. Fund investment results reflect the fee waiver; without this waiver, the results would have been lower.
Performance reflects the Fund’s Class 1 operating expenses, but does not include any contract fees, expenses or sales charges. If they had been included, performance would be lower. These charges and deductions, particularly for variable life policies, can have a significant effect on contract values and insurance benefits. See the contract prospectus for a complete description of these expenses, including sales charges.
Performance data represent past performance, which does not guarantee future results. Investment return and principal value will fluctuate, and you may have a gain or loss when you sell your shares. Current performance may differ from figures shown.
| Semiannual Report | FSC-1 |
FRANKLIN SMALL-MID CAP GROWTH VIP FUND
Fund Goal and Main Investments
The Fund seeks long-term capital growth. Under normal market conditions, the Fund invests at least 80% of its net assets in equity securities of small-capitalization and mid-capitalization companies. For this Fund, small cap companies are those within the market capitalization range of companies in the Russell 2500TM Index at the time of purchase, and midcap companies are those within the market capitalization range of companies in the Russell Midcap® Index at the time of purchase.1
Fund Risks
All investments involve risks, including possible loss of principal. Growth stock prices reflect projections of future earnings or revenues, and can, therefore, fall dramatically if the company fails to meet those projections. Smaller, midsized or relatively new or unseasoned companies can be particularly sensitive to changing economic conditions, and their prospects for growth are less certain than those of larger, more established companies. Historically, these securities have experienced more price volatility than larger company stocks, especially over the short term. To the extent the Fund focuses on particular countries, regions, industries, sectors or types of investment from time to time, it may be subject to greater risk of adverse developments in such areas of focus than a fund that invests in a wider variety of countries, regions, industries, sectors or investments. From time to time, the trading market for a particular security or type of security in which the Fund invests may become less liquid or even illiquid. The Fund is actively managed but there is no guarantee that the manager’s investment decisions will produce the desired results. The Fund’s prospectus also includes a description of the main investment risks.
Performance Overview
You can find the Fund’s six-month total return in the Performance Summary. In comparison, the Fund’s narrow benchmark, the Russell Midcap® Growth Index, generated a +11.40% total return, and its broad benchmark, the Standard & Poor’s® 500 Index (S&P 500®), produced a +9.34% total return for the same period.2
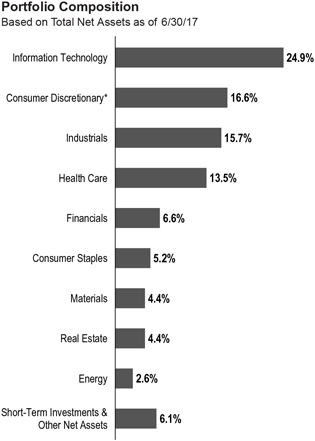
*Includes common and preferred stocks.
Economic and Market Overview
U.S. economic growth decelerated in 2017’s first quarter, largely due to slower growth in consumer spending and declines in private inventory investment and government spending. However, growth accelerated in the second quarter due to increases in consumer spending, business investment and federal government spending. The manufacturing sector generally expanded, and the services sector also continued to grow. The unemployment rate decreased from 4.7% in December 2016 to 4.4% at period-end.3 Monthly retail sales were volatile, but grew for most of the period. Annual inflation, as measured by the Consumer Price Index, decreased from 2.1% to 1.6% during the period.
The U.S. Federal Reserve (Fed), at its March meeting, increased the federal funds target rate from 0.50%–0.75% to
1. Please see Index Descriptions following the Fund Summaries.
2. Source: Morningstar.
One cannot invest directly in an index, and an index is not representative of the Fund’s portfolio. Please see Index Descriptions following the Fund Summaries.
3. Source: Bureau of Labor Statistics.
The dollar value, number of shares or principal amount, and names of all portfolio holdings are listed in the Fund’s Statement of Investments (SOI).
| FSC-2 | Semiannual Report |
FRANKLIN SMALL-MID CAP GROWTH VIP FUND
0.75%–1.00%. The Fed again increased its target range by a quarter point to 1.00%–1.25% at its June meeting. The Fed made both of these increases amid signs of a growing U.S. economy, a strengthening labor market and an improvement in business spending.
U.S. equity markets rose during the period, benefiting from mostly upbeat economic data, better U.S. corporate earnings and signs of improvement in the Chinese and European economies. Investor optimism arising from pro-growth and pro-business policy plans in the U.S. and the victory of Emmanuel Macron as France’s President also helped U.S. equities. However, concerns about the terms of the U.K.’s exit from the European Union (also known as “Brexit”), uncertainty about President Trump’s ability to implement reforms, and geopolitical tensions in the Middle East and the Korean peninsula curbed market sentiment. The broad U.S. stock market, as measured by the S&P 500, generated a +9.34% total return for the period.2
Investment Strategy
We use fundamental, bottom-up research to seek companies meeting our criteria of growth potential, quality and valuation. In seeking sustainable growth characteristics, we look for companies we believe can produce sustainable earnings and cash flow growth, evaluating the long-term market opportunity and competitive structure of an industry to target leaders and emerging leaders. We define quality companies as those with strong and improving competitive positions in attractive markets. We also believe important attributes of quality are experienced and talented management teams as well as financial strength reflected in the capital structure, gross and operating margins, free cash flow generation and returns on capital employed. Our valuation analysis includes a range of potential outcomes based on an assessment of multiple scenarios. In assessing value, we consider whether security prices fully reflect the balance of the sustainable growth opportunities relative to business and financial risks.
Manager’s Discussion
During the period under review, most sectors represented in the Fund’s portfolio had positive returns and contributed to absolute performance. Relative to the Fund’s narrow benchmark, the Russell MidCap Growth® Index, key contributors included stock selection in the information technology (IT), consumer staples and real estate sectors.
| Top 10 Holdings | ||||
| 6/30/17 | ||||
| Company Sector/Industry | % of Total Net Assets | |||
| Roper Technologies Inc. Industrials | 2.3% | |||
| Equinix Inc. Real Estate | 1.9% | |||
| Edwards Lifesciences Corp. Health Care | 1.6% | |||
| Axalta Coating Systems Ltd. Materials | 1.5% | |||
| Newell Brands Inc. Consumer Discretionary | 1.5% | |||
| Vantiv Inc. Information Technology | 1.5% | |||
| ServiceNow Inc. Information Technology | 1.5% | |||
| 2U Inc. Information Technology | 1.4% | |||
| Martin Marietta Materials Inc. Materials | 1.4% | |||
| Pinnacle Foods Inc. Consumer Staples | 1.3% | |||
In IT, positions in 2U,4 a provider of cloud-based software-as-a-service solutions for non-profit colleges and universities, and CoStar Group, a commercial real estate information company, contributed to the Fund’s relative performance. Since the start of the year, 2U has announced several new domestic graduate degree programs and disclosed its program launch schedule through 2020, which we believe can lead to significant revenue growth in coming years. CoStar Group’s stock rose amid favorable growth and profit margin expansion.
In the consumer staples and real estate sectors, contributors included food and beverage company TreeHouse Foods5 and real estate investment trust (REIT) SBA Communications, respectively. TreeHouse performed well as demand trends for private-label products picked up during the first half of the year. Shares of SBA, which operates wireless telecommunications infrastructure, rebounded after underperforming with the REIT sector after the U.S. presidential election in November 2016. Fundamentally, industry growth seems to be accelerating as carriers look to deploy many spectrum bands that were recently acquired or won.
4. Not part of the index.
5. No longer held by period-end.
| Semiannual Report | FSC-3 |
FRANKLIN SMALL-MID CAP GROWTH VIP FUND
Other notable contributors to the Fund’s relative performance included industrial goods manufacturer Roper Technologies and homebuilder NVR. Shares of Roper Technologies rose after the company reported better-than-estimated fourth-quarter 2016 and first-quarter 2017 revenue and earnings per share. In our view, Roper could potentially benefit as investors see a general improvement in economic activity. NVR’s shares performed well as the company reported stronger-than-expected earnings results and management stated robust order rates, indicating continued growth. Further supporting investor sentiment were fairly low interest rates and strong housing demand.
In contrast, key detractors from the Fund’s relative performance included stock selection in the health care sector and an overweighted position in the energy sector. Security selection in the industrials and consumer discretionary sectors also hampered relative results.
Notable detractors in health care included an underweighted position in genome sequencing company Illumina. Its shares performed well during the period and contributed to absolute performance, but our underweighted position dampened relative results.
In industrials, industrial products distributor HD Supply Holdings5 and commercial data and analytics provider Dun & Bradstreet detracted from results. HD Supply’s recent results missed investor expectations for the third time in a year. Shares of Dun & Bradstreet fell, as the company received notification that Salesforce.com will no longer provide sales support for new Data.com subscriptions beginning in mid-2017, which in our view will likely lead to a modest revenue headwind.
Detractors in the consumer discretionary sector included theater operator IMAX4 and sporting goods retailer Dick’s Sporting Goods. Shares of IMAX struggled during the period as the domestic summer box office has been disappointing relative to initial expectations, driven mostly by poorly reviewed films and franchise fatigue. Softer in-store traffic trends at Dick’s Sporting Goods has led to more sales promotions, which pressured profit margin.
Elsewhere, oilfield services provider Superior Energy Services detracted from the Fund’s relative performance.4 Its share price
declined as crude oil prices fell during the period, leading to investor concerns that there will be less demand for Superior’s oil exploration and production services.
Thank you for your participation in Franklin Small-Mid Cap Growth VIP Fund. We look forward to serving your future investment needs.
The foregoing information reflects our analysis, opinions and portfolio holdings as of June 30, 2017, the end of the reporting period. The way we implement our main investment strategies and the resulting portfolio holdings may change depending on factors such as market and economic conditions. These opinions may not be relied upon as investment advice or an offer for a particular security. The information is not a complete analysis of every aspect of any market, country, industry, security or the Fund. Statements of fact are from sources considered reliable, but the investment manager makes no representation or warranty as to their completeness or accuracy. Although historical performance is no guarantee of future results, these insights may help you understand our investment management philosophy.
| FSC-4 | Semiannual Report |
FRANKLIN SMALL-MID CAP GROWTH VIP FUND
Class 1 Fund Expenses
As an investor in a variable insurance contract (Contract) that indirectly provides for investment in an underlying mutual fund, you can incur transaction and/or ongoing expenses at both the Fund level and the Contract Level: (1) transaction expenses can include sales charges (loads) on purchases, surrender fees, transfer fees and premium taxes; and (2) ongoing expenses can include management fees, distribution and service (12b-1) fees, contract fees, annual maintenance fees, mortality and expense risk fees and other fees and expenses. All mutual funds and Contracts have some types of ongoing expenses. The table below shows Fund-level ongoing expenses and can help you understand these costs and compare them with those of other mutual funds offered through the Contract. The table assumes a $1,000 investment held for the six months indicated. Please refer to the Fund prospectus for additional information on operating expenses.
Actual Fund Expenses
The table below provides information about the actual account values and actual expenses in the columns under the heading “Actual.” In these columns the Fund’s actual return, which includes the effect of ongoing Fund expenses but does not include the effect of ongoing Contract expenses, is used to calculate the “Ending Account Value.” You can estimate the Fund-level expenses you paid during the period by following these steps (of course, your account value and expenses will differ from those in this illustration): Divide your account value by $1,000 (if your account had an $8,600 value, then $8,600 ÷ $1,000 = 8.6). Then multiply the result by the number under the headings “Actual” and “Fund-Level Expenses Paid During Period” (if Fund-Level Expenses Paid During Period were $ 7.50, then 8.6 × $7.50 = $64.50). In this illustration, the estimated expenses paid this period at the Fund level are $64.50.
Hypothetical Example for Comparison with Other Mutual Funds
Under the heading “Hypothetical” in the table, information is provided about hypothetical account values and hypothetical expenses based on the Fund’s actual expense ratio and an assumed rate of return of 5% per year before expenses, which is not the Fund’s actual return. This information may not be used to estimate the actual ending account balance or expenses you paid for the period, but it can help you compare ongoing costs of investing in the Fund with those of other mutual funds offered through the Contract. To do so, compare this 5% hypothetical example with the 5% hypothetical examples that appear in the shareholder reports of other funds offered through the Contract.
Please note that expenses shown in the table are meant to highlight ongoing costs at the Fund level only and do not reflect any ongoing expenses at the Contract level, or transaction expenses at either the Fund or Contract levels. In addition, while the Fund does not have transaction expenses, if the transaction and ongoing expenses at the Contract level were included, the expenses shown below would be higher. You should consult your Contract prospectus or disclosure document for more information.
| Actual (actual return after expenses) | Hypothetical (5% annual return before expenses) | |||||||||||||||||||||||
| Share Class | | Beginning Account Value 1/1/17 | | | Ending Account Value 6/30/17 | | | Fund-Level Expenses Paid During Period 1/1/17–6/30/17 | 1,2 | | Ending Account Value 6/30/17 |
| | Fund-Level Expenses Paid During Period 1/1/17–6/30/17 | 1,2 | | Net Annualized Expense Ratio | 2 | ||||||
Class 1 | $1,000 | $ | 1,110.60 | $ | 4.40 | $ | 1,020.63 | $ | 4.21 | 0.84% | ||||||||||||||
1. Expenses are equal to the annualized expense ratio for the six-month period as indicated above — in the far right column — multiplied by the simple average account value over the period indicated, and then multiplied by 181/365 to reflect the one-half year period.
2. Reflects expenses after fee waivers and expense reimbursements. Does not include any ongoing expenses of the Contract for which the Fund is an investment option or acquired fund fees and expenses.
| Semiannual Report | FSC-5 |
FRANKLIN TEMPLETON VARIABLE INSURANCE PRODUCTS TRUST
Financial Highlights
Franklin Small-Mid Cap Growth VIP Fund
Six Months Ended (unaudited) | Year Ended December 31, | |||||||||||||||||||||||
| 2016 | 2015 | 2014 | 2013 | 2012 | ||||||||||||||||||||
| Class 1 | ||||||||||||||||||||||||
Per share operating performance (for a share outstanding throughout the period) | ||||||||||||||||||||||||
Net asset value, beginning of period | $17.77 | $19.09 | $24.95 | $28.38 | $21.87 | $21.19 | ||||||||||||||||||
|
| |||||||||||||||||||||||
| Income from investment operationsa: | ||||||||||||||||||||||||
Net investment income (loss)b | (0.02 | ) | (0.03 | ) | — | c,d | (0.07 | ) | (0.09 | ) | (0.01 | )e | ||||||||||||
Net realized and unrealized gains (losses) | 1.99 | 0.77 | (0.03 | ) | 2.04 | 8.19 | 2.27 | |||||||||||||||||
|
| |||||||||||||||||||||||
Total from investment operations | 1.97 | 0.74 | (0.03 | ) | 1.97 | 8.10 | 2.26 | |||||||||||||||||
|
| |||||||||||||||||||||||
Less distributions from net realized gains | (1.76 | ) | (2.06 | ) | (5.83 | ) | (5.40 | ) | (1.59 | ) | (1.58 | ) | ||||||||||||
|
| |||||||||||||||||||||||
Net asset value, end of period | $17.98 | $17.77 | $19.09 | $24.95 | $28.38 | $21.87 | ||||||||||||||||||
|
| |||||||||||||||||||||||
Total returnf | 11.06% | 4.40% | (2.44)% | 7.78% | 38.50% | 11.12% | ||||||||||||||||||
| Ratios to average net assetsg | ||||||||||||||||||||||||
Expenses before waiver and payments by affiliates | 0.85% | 0.84% | 0.81% | 0.80% | 0.80% | 0.80% | ||||||||||||||||||
Expenses net of waiver and payments by affiliates | 0.84% | h | 0.82% | h | 0.81% | i | 0.80% | i | 0.80% | h | 0.80% | |||||||||||||
Net investment income (loss) | (0.22)% | (0.16)% | 0.01% | d | (0.29)% | (0.35)% | (0.03)% | e | ||||||||||||||||
| Supplemental data | ||||||||||||||||||||||||
Net assets, end of period (000’s) | $34,414 | $31,756 | $87,866 | $99,803 | $98,020 | $75,977 | ||||||||||||||||||
Portfolio turnover rate | 20.97% | 32.23% | j | 37.85% | 48.73% | 42.77% | 41.44% | |||||||||||||||||
aThe amount shown for a share outstanding throughout the period may not correlate with the Statement of Operations for the period due to the timing of sales and repurchases of the Fund’s shares in relation to income earned and/or fluctuating fair value of the investments of the Fund.
bBased on average daily shares outstanding.
cAmount rounds to less than $0.01 per share.
dNet investment income per share includes approximately $0.05 per share related to income received in the form of special dividends in connection with certain Fund holdings. Excluding this amount, the ratio of net investment income to average net assets would have been (0.24)%.
eNet investment income per share includes approximately $0.03 per share related to income received in the form of special dividends in connection with certain Fund holdings. Excluding this amount, the ratio of net investment income to average net assets would have been (0.16)%.
fTotal return does not include fees, charges or expenses imposed by the variable annuity and life insurance contracts for which Franklin Templeton Variable Insurance Products Trust serves as an underlying investment vehicle. Total return is not annualized for periods less than one year.
gRatios are annualized for periods less than one year.
hBenefit of expense reduction rounds to less than 0.01%.
iBenefit of waiver and payments by affiliates rounds to less than 0.01%.
jExcludes the value of portfolio securities delivered as a result of a redemption in-kind. See Note 9.
| FSC-6 | Semiannual Report | The accompanying notes are an integral part of these financial statements. |
FRANKLIN TEMPLETON VARIABLE INSURANCE PRODUCTS TRUST
FINANCIAL HIGHLIGHTS
Franklin Small-Mid Cap Growth VIP Fund (continued)
Six Months Ended (unaudited) | Year Ended December 31, | |||||||||||||||||||||||
| 2016 | 2015 | 2014 | 2013 | 2012 | ||||||||||||||||||||
| Class 2 | ||||||||||||||||||||||||
Per share operating performance (for a share outstanding throughout the period) | ||||||||||||||||||||||||
Net asset value, beginning of period | $16.27 | $17.69 | $23.56 | $27.16 | $21.04 | $20.49 | ||||||||||||||||||
|
| |||||||||||||||||||||||
| Income from investment operationsa: | ||||||||||||||||||||||||
Net investment income (loss)b | (0.04 | ) | (0.07 | ) | (0.05 | )c | (0.13 | ) | (0.14 | ) | (0.06 | )d | ||||||||||||
Net realized and unrealized gains (losses) | 1.82 | 0.71 | 0.01 | 1.93 | 7.85 | 2.19 | ||||||||||||||||||
|
| |||||||||||||||||||||||
Total from investment operations | 1.78 | 0.64 | (0.04 | ) | 1.80 | 7.71 | 2.13 | |||||||||||||||||
|
| |||||||||||||||||||||||
Less distributions from net realized gains | (1.76 | ) | (2.06 | ) | (5.83 | ) | (5.40 | ) | (1.59 | ) | (1.58 | ) | ||||||||||||
|
| |||||||||||||||||||||||
Net asset value, end of period | $16.29 | $16.27 | $17.69 | $23.56 | $27.16 | $21.04 | ||||||||||||||||||
|
| |||||||||||||||||||||||
Total returne | 10.91% | 4.17% | (2.66)% | 7.47% | 38.15% | 10.85% | ||||||||||||||||||
| Ratios to average net assetsf | ||||||||||||||||||||||||
Expenses before waiver and payments by affiliates | 1.10% | 1.09% | 1.06% | 1.05% | 1.05% | 1.05% | ||||||||||||||||||
Expenses net of waiver and payments by affiliates | 1.09% | g | 1.07% | g | 1.06% | h | 1.05% | h | 1.05% | g | 1.05% | |||||||||||||
Net investment income (loss) | (0.47)% | (0.41)% | (0.24)% | c | (0.54)% | (0.60)% | (0.28)% | d | ||||||||||||||||
| Supplemental data | ||||||||||||||||||||||||
Net assets, end of period (000’s) | $406,630 | $392,777 | $478,649 | $582,772 | $660,806 | $670,193 | ||||||||||||||||||
Portfolio turnover rate | 20.97% | 32.23% | i | 37.85% | 48.73% | 42.77% | 41.44% | |||||||||||||||||
aThe amount shown for a share outstanding throughout the period may not correlate with the Statement of Operations for the period due to the timing of sales and repurchases of the Fund’s shares in relation to income earned and/or fluctuating fair value of the investments of the Fund.
bBased on average daily shares outstanding.
cNet investment income per share includes approximately $0.05 per share related to income received in the form of special dividends in connection with certain Fund holdings. Excluding this amount, the ratio of net investment income to average net assets would have been (0.49)%.
dNet investment income per share includes approximately $0.03 per share related to income received in the form of special dividends in connection with certain Fund holdings. Excluding this amount, the ratio of net investment income to average net assets would have been (0.41)%.
eTotal return does not include fees, charges or expenses imposed by the variable annuity and life insurance contracts for which Franklin Templeton Variable Insurance Products Trust serves as an underlying investment vehicle. Total return is not annualized for periods less than one year.
fRatios are annualized for periods less than one year.
gBenefit of expense reduction rounds to less than 0.01%.
hBenefit of waiver and payments by affiliates rounds to less than 0.01%.
iExcludes the value of portfolio securities delivered as a result of a redemption in-kind. See Note 9.
| The accompanying notes are an integral part of these financial statements. | Semiannual Report | FSC-7 |
FRANKLIN TEMPLETON VARIABLE INSURANCE PRODUCTS TRUST
FINANCIAL HIGHLIGHTS
Franklin Small-Mid Cap Growth VIP Fund (continued)
Six Months Ended (unaudited) | Year Ended December 31, | |||||||||||||||||||||||
| 2016 | 2015 | 2014 | 2013 | 2012 | ||||||||||||||||||||
| Class 4 | ||||||||||||||||||||||||
Per share operating performance (for a share outstanding throughout the period) | ||||||||||||||||||||||||
Net asset value, beginning of period | $16.81 | $18.23 | $24.14 | $27.72 | $21.47 | $20.90 | ||||||||||||||||||
|
| |||||||||||||||||||||||
| Income from investment operationsa: | ||||||||||||||||||||||||
Net investment income (loss)b | (0.05 | ) | (0.09 | ) | (0.07 | )c | (0.16 | ) | (0.17 | ) | (0.09 | )d | ||||||||||||
Net realized and unrealized gains (losses) | 1.88 | 0.73 | (0.01 | ) | 1.98 | 8.01 | 2.24 | |||||||||||||||||
|
| |||||||||||||||||||||||
Total from investment operations | 1.83 | 0.64 | (0.08 | ) | 1.82 | 7.84 | 2.15 | |||||||||||||||||
|
| |||||||||||||||||||||||
| Less distributions from net realized gains | (1.76 | ) | (2.06 | ) | (5.83 | ) | (5.40 | ) | (1.59 | ) | (1.58 | ) | ||||||||||||
|
| |||||||||||||||||||||||
Net asset value, end of period | $16.88 | $16.81 | $18.23 | $24.14 | $27.72 | $21.47 | ||||||||||||||||||
|
| |||||||||||||||||||||||
Total returne | 10.86% | 4.04% | (2.77)% | 7.39% | 37.99% | 10.79% | ||||||||||||||||||
| Ratios to average net assetsf | ||||||||||||||||||||||||
Expenses before waiver and payments by affiliates | 1.20% | 1.19% | 1.16% | 1.15% | 1.15% | 1.15% | ||||||||||||||||||
Expenses net of waiver and payments by affiliates | 1.19% | g | 1.17% | g | 1.16% | h | 1.15% | h | 1.15% | g | 1.15% | |||||||||||||
Net investment income (loss) | (0.57)% | (0.51)% | (0.34)% | c | (0.64)% | (0.70)% | (0.38)% | d | ||||||||||||||||
| Supplemental data | ||||||||||||||||||||||||
Net assets, end of period (000’s) | $15,219 | $13,825 | $15,105 | $16,384 | $19,132 | $12,000 | ||||||||||||||||||
Portfolio turnover rate | 20.97% | 32.23% | i | 37.85% | 48.73% | 42.77% | 41.44% | |||||||||||||||||
aThe amount shown for a share outstanding throughout the period may not correlate with the Statement of Operations for the period due to the timing of sales and repurchases of the Fund’s shares in relation to income earned and/or fluctuating fair value of the investments of the Fund.
bBased on average daily shares outstanding.
cNet investment income per share includes approximately $0.05 per share related to income received in the form of special dividends in connection with certain Fund holdings. Excluding this amount, the ratio of net investment income to average net assets would have been (0.59)%.
dNet investment income per share includes approximately $0.03 per share related to income received in the form of special dividends in connection with certain Fund holdings. Excluding this amount, the ratio of net investment income to average net assets would have been (0.51)%.
eTotal return does not include fees, charges or expenses imposed by the variable annuity and life insurance contracts for which Franklin Templeton Variable Insurance Products Trust serves as an underlying investment vehicle. Total return is not annualized for periods less than one year.
fRatios are annualized for periods less than one year.
gBenefit of expense reduction rounds to less than 0.01%.
hBenefit of waiver and payments by affiliates rounds to less than 0.01%.
iExcludes the value of portfolio securities delivered as a result of a redemption in-kind. See Note 9.
| FSC-8 | Semiannual Report | The accompanying notes are an integral part of these financial statements. |
FRANKLIN TEMPLETON VARIABLE INSURANCE PRODUCTS TRUST
Statement of Investments, June 30, 2017 (unaudited)
| Franklin Small-Mid Cap Growth VIP Fund | ||||||||||
| Shares | Value | |||||||||
| Common Stocks 93.5% | ||||||||||
| Consumer Discretionary 16.2% | ||||||||||
| a | Burlington Stores Inc. | 23,500 | $ | 2,161,765 | ||||||
Delphi Automotive PLC | 67,377 | 5,905,594 | ||||||||
Dick’s Sporting Goods Inc. | 51,542 | 2,052,918 | ||||||||
| a | Dollar Tree Inc. | 66,811 | 4,671,425 | |||||||
Dominos Pizza Inc. | 15,000 | 3,172,950 | ||||||||
Expedia Inc. | 38,000 | 5,660,100 | ||||||||
| a | Global Eagle Entertainment Inc. | 87,868 | 312,810 | |||||||
| a | Grand Canyon Education Inc. | 63,357 | 4,967,822 | |||||||
Hanesbrands Inc. | 48,207 | 1,116,474 | ||||||||
| a | IMAX Corp. | 126,588 | 2,784,936 | |||||||
L Brands Inc. | 43,288 | 2,332,790 | ||||||||
| a | Laureate Education Inc., A | 81,000 | 1,419,930 | |||||||
| a | Liberty Broadband Corp., C | 55,150 | 4,784,263 | |||||||
Marriott International Inc., A | 50,267 | 5,042,283 | ||||||||
Newell Brands Inc. | 125,944 | 6,753,117 | ||||||||
| a | Norwegian Cruise Line Holdings Ltd. | 73,178 | 3,972,834 | |||||||
| a | NVR Inc. | 2,382 | 5,742,073 | |||||||
| a | O’Reilly Automotive Inc. | 14,707 | 3,217,009 | |||||||
Ross Stores Inc. | 59,485 | 3,434,069 | ||||||||
Thor Industries Inc. | 14,700 | 1,536,444 | ||||||||
Tractor Supply Co. | 49,137 | 2,663,717 | ||||||||
|
| |||||||||
| 73,705,323 | ||||||||||
|
| |||||||||
Consumer Staples 5.2% | ||||||||||
Church & Dwight Co. Inc. | 92,300 | 4,788,523 | ||||||||
| a | Hostess Brands Inc., A | 147,200 | 2,369,920 | |||||||
Molson Coors Brewing Co., B | 33,000 | 2,849,220 | ||||||||
| a | Monster Beverage Corp. | 69,416 | 3,448,587 | |||||||
Pinnacle Foods Inc. | 101,494 | 6,028,744 | ||||||||
| a | Post Holdings Inc. | 56,639 | 4,398,018 | |||||||
|
| |||||||||
| 23,883,012 | ||||||||||
|
| |||||||||
Energy 2.6% | ||||||||||
Cabot Oil & Gas Corp., A | 153,649 | 3,853,517 | ||||||||
| a | Jagged Peak Energy Inc. | 221,000 | 2,950,350 | |||||||
Noble Energy Inc. | 83,207 | 2,354,758 | ||||||||
| b | RPC Inc. | 46,700 | 943,807 | |||||||
| a | Superior Energy Services Inc. | 185,061 | 1,930,186 | |||||||
|
| |||||||||
| 12,032,618 | ||||||||||
|
| |||||||||
Financials 6.6% | ||||||||||
Affiliated Managers Group Inc. | 28,586 | 4,741,274 | ||||||||
Arthur J. Gallagher & Co. | 85,108 | 4,872,433 | ||||||||
CBOE Holdings Inc. | 5,200 | 475,280 | ||||||||
Lazard Ltd., A | 36,037 | 1,669,594 | ||||||||
MarketAxess Holdings Inc. | 18,696 | 3,759,765 | ||||||||
Moody’s Corp. | 23,809 | 2,897,079 | ||||||||
| a | Signature Bank | 29,079 | 4,173,709 | |||||||
| a | SVB Financial Group | 21,578 | 3,793,197 | |||||||
Willis Towers Watson PLC | 24,000 | 3,491,040 | ||||||||
|
| |||||||||
| 29,873,371 | ||||||||||
|
| |||||||||
| Semiannual Report | FSC-9 |
FRANKLIN TEMPLETON VARIABLE INSURANCE PRODUCTS TRUST
STATEMENT OF INVESTMENTS (UNAUDITED)
Franklin Small-Mid Cap Growth VIP Fund (continued)
| Shares | Value | |||||||||
| Common Stocks (continued) | ||||||||||
| Health Care 13.5% | ||||||||||
| a | Acadia Pharmaceuticals Inc. | 41,773 | $ | 1,165,049 | ||||||
| a | BioMarin Pharmaceutical Inc. | 20,408 | 1,853,455 | |||||||
| a | Cerner Corp. | 47,995 | 3,190,228 | |||||||
The Cooper Cos. Inc. | 15,972 | 3,824,016 | ||||||||
| a | DaVita Inc. | 63,392 | 4,105,266 | |||||||
| a | DexCom Inc. | 37,688 | 2,756,877 | |||||||
| a | Edwards Lifesciences Corp. | 61,121 | 7,226,947 | |||||||
| a,b | Heron Therapeutics Inc. | 68,230 | 944,985 | |||||||
| a | Hologic Inc. | 103,567 | 4,699,870 | |||||||
| a | Illumina Inc. | 24,600 | 4,268,592 | |||||||
| a | Incyte Corp. | 30,169 | 3,798,579 | |||||||
| a | Insulet Corp. | 37,288 | 1,913,247 | |||||||
| a | iRhythm Technologies Inc. | 24,900 | 1,058,001 | |||||||
| a | Jazz Pharmaceuticals PLC | 11,600 | 1,803,800 | |||||||
| a | Mednax Inc. | 20,703 | 1,249,840 | |||||||
| a | Mettler-Toledo International Inc. | 10,055 | 5,917,770 | |||||||
| a | Neurocrine Biosciences Inc. | 27,444 | 1,262,424 | |||||||
| a | Nevro Corp. | 28,181 | 2,097,512 | |||||||
| a | Penumbra Inc. | 21,648 | 1,899,612 | |||||||
| a | Revance Therapeutics Inc. | 44,372 | 1,171,421 | |||||||
| a | Tesaro Inc. | 12,924 | 1,807,551 | |||||||
| a | Waters Corp. | 20,500 | 3,768,720 | |||||||
|
| |||||||||
| 61,783,762 | ||||||||||
|
| |||||||||
Industrials 15.7% | ||||||||||
Acuity Brands Inc. | 17,707 | 3,599,479 | ||||||||
Alaska Air Group Inc. | 15,600 | 1,400,256 | ||||||||
Allegiant Travel Co. | 7,726 | 1,047,646 | ||||||||
BWX Technologies Inc. | 33,800 | 1,647,750 | ||||||||
Dun & Bradstreet Corp. | 32,442 | 3,508,602 | ||||||||
Equifax Inc. | 18,900 | 2,597,238 | ||||||||
Fortive Corp. | 46,800 | 2,964,780 | ||||||||
| a | Gardner Denver Holdings Inc. | 76,900 | 1,661,809 | |||||||
| a | Genesee & Wyoming Inc. | 39,816 | 2,723,016 | |||||||
Hexcel Corp. | 97,234 | 5,132,983 | ||||||||
IDEX Corp. | 20,200 | 2,282,802 | ||||||||
| a | IHS Markit Ltd. | 115,315 | 5,078,473 | |||||||
J.B. Hunt Transport Services Inc. | 36,846 | 3,366,987 | ||||||||
Robert Half International Inc. | 38,888 | 1,863,902 | ||||||||
Rockwell Automation Inc. | 36,400 | 5,895,344 | ||||||||
Roper Technologies Inc. | 46,343 | 10,729,795 | ||||||||
Stanley Black & Decker Inc. | 26,996 | 3,799,147 | ||||||||
Textron Inc. | 56,700 | 2,670,570 | ||||||||
| a | Univar Inc. | 83,000 | 2,423,600 | |||||||
| a | Verisk Analytics Inc. | 52,361 | 4,417,697 | |||||||
| a | WABCO Holdings Inc. | 22,400 | 2,856,224 | |||||||
|
| |||||||||
| 71,668,100 | ||||||||||
|
| |||||||||
Information Technology 24.9% | ||||||||||
| a | 2U Inc. | 133,879 | 6,281,603 | |||||||
| a | Alarm.com Holdings Inc. | 52,696 | 1,982,950 | |||||||
Alliance Data Systems Corp. | 10,266 | 2,635,180 | ||||||||
Amphenol Corp., A | 46,200 | 3,410,484 | ||||||||
| FSC-10 | Semiannual Report |
FRANKLIN TEMPLETON VARIABLE INSURANCE PRODUCTS TRUST
STATEMENT OF INVESTMENTS (UNAUDITED)
Franklin Small-Mid Cap Growth VIP Fund (continued)
| Shares | Value | |||||||||
| Common Stocks (continued) | ||||||||||
| Information Technology (continued) | ||||||||||
Analog Devices Inc. | 52,391 | $ | 4,076,020 | |||||||
| a | ANSYS Inc. | 19,669 | 2,393,324 | |||||||
| a | Atlassian Corp. PLC (Australia) | 75,082 | 2,641,385 | |||||||
| a | Autodesk Inc. | 55,000 | 5,545,100 | |||||||
| a | Bottomline Technologies (de) Inc. | 61,419 | 1,577,854 | |||||||
| a | Cavium Inc. | 32,000 | 1,988,160 | |||||||
Cognex Corp. | 64,148 | 5,446,165 | ||||||||
| a | CoStar Group Inc. | 19,635 | 5,175,786 | |||||||
CSRA Inc. | 147,455 | 4,681,696 | ||||||||
Fidelity National Information Services Inc. | 64,282 | 5,489,683 | ||||||||
| a | FleetCor Technologies Inc. | 23,995 | 3,460,319 | |||||||
| a | GoDaddy Inc., A | 127,917 | 5,426,239 | |||||||
| a | Inphi Corp. | 61,000 | 2,092,300 | |||||||
| a | Integrated Device Technology Inc. | 78,440 | 2,022,968 | |||||||
| a | IPG Photonics Corp. | 2,000 | 290,200 | |||||||
KLA-Tencor Corp. | 38,287 | 3,503,643 | ||||||||
Lam Research Corp. | 30,116 | 4,259,306 | ||||||||
Microchip Technology Inc. | 59,327 | 4,578,858 | ||||||||
Monolithic Power Systems | 21,000 | 2,024,400 | ||||||||
| a | Palo Alto Networks Inc. | 34,998 | 4,683,082 | |||||||
| a | Proofpoint Inc. | 27,124 | 2,355,177 | |||||||
| a | Q2 Holdings Inc. | 19,696 | 727,767 | |||||||
| a | ServiceNow Inc. | 62,537 | 6,628,922 | |||||||
| a | Square Inc., A | 72,500 | 1,700,850 | |||||||
| a | Vantiv Inc., A | 104,934 | 6,646,520 | |||||||
| a,b | ViaSat Inc. | 51,366 | 3,400,429 | |||||||
| a | Workday Inc., A | 41,143 | 3,990,871 | |||||||
| a | Zendesk Inc. | 90,500 | 2,514,090 | |||||||
|
| |||||||||
| 113,631,331 | ||||||||||
|
| |||||||||
Materials 4.4% | ||||||||||
| a | Axalta Coating Systems Ltd. | 219,007 | 7,016,984 | |||||||
| a | Ingevity Corp. | 59,121 | 3,393,546 | |||||||
International Flavors & Fragrances Inc. | 25,500 | 3,442,500 | ||||||||
Martin Marietta Materials Inc. | 28,191 | 6,274,753 | ||||||||
|
| |||||||||
| 20,127,783 | ||||||||||
|
| |||||||||
Real Estate 4.4% | ||||||||||
American Campus Communities Inc. | 43,000 | 2,033,900 | ||||||||
| a | CBRE Group Inc. | 93,321 | 3,396,885 | |||||||
Equinix Inc. | 20,553 | 8,820,526 | ||||||||
| a | SBA Communications Corp., A | 42,757 | 5,767,919 | |||||||
|
| |||||||||
| 20,019,230 | ||||||||||
|
| |||||||||
Total Common Stocks (Cost $308,839,532) | 426,724,530 | |||||||||
|
| |||||||||
Preferred Stocks 0.4% | ||||||||||
Consumer Discretionary 0.4% | ||||||||||
| a,c | DraftKings Inc., pfd., D | 115,528 | 383,147 | |||||||
| a,c | DraftKings Inc., pfd., D-1 | 284,105 | 1,295,720 | |||||||
|
| |||||||||
Total Preferred Stocks (Cost $2,800,003) | 1,678,867 | |||||||||
|
| |||||||||
Total Investments before Short Term Investments (Cost $311,639,535) | 428,403,397 | |||||||||
|
| |||||||||
| Semiannual Report | FSC-11 |
FRANKLIN TEMPLETON VARIABLE INSURANCE PRODUCTS TRUST
STATEMENT OF INVESTMENTS (UNAUDITED)
Franklin Small-Mid Cap Growth VIP Fund (continued)
| Shares | Value | |||||||||
Short Term Investments 7.1% | ||||||||||
| Money Market Funds (Cost $30,349,988) 6.6% | ||||||||||
| d,e | Institutional Fiduciary Trust Money Market Portfolio, 0.58% | 30,349,988 | $ | 30,349,988 | ||||||
|
| |||||||||
| f | Investments from Cash Collateral Received for Loaned Securities (Cost $2,297,750) 0.5% | |||||||||
Money Market Funds 0.5% | ||||||||||
| d,e | Institutional Fiduciary Trust Money Market Portfolio, 0.58% | 2,297,750 | 2,297,750 | |||||||
|
| |||||||||
Total Investments (Cost $344,287,273) 101.0% | 461,051,135 | |||||||||
Other Assets, less Liabilities (1.0)% | (4,787,450 | ) | ||||||||
|
| |||||||||
Net Assets 100.0% | $ | 456,263,685 | ||||||||
|
| |||||||||
aNon-income producing.
bA portion or all of the security is on loan at June 30, 2017. See Note 1(c).
cSee Note 7 regarding restricted securities.
dSee Note 3(e) regarding investments in affiliated management investment companies.
eThe rate shown is the annualized seven-day yield at period end.
fSee Note 1(c) regarding securities on loan.
| FSC-12 | Semiannual Report | The accompanying notes are an integral part of these financial statements. |
FRANKLIN TEMPLETON VARIABLE INSURANCE PRODUCTS TRUST
Financial Statements
Statement of Assets and Liabilities
June 30, 2017 (unaudited)
Franklin Small-Mid Cap Growth VIP Fund | ||||
Assets: | ||||
Investments in securities: | ||||
Cost - Unaffiliated issuers | $ | 311,639,535 | ||
Cost - Non-controlled affiliates (Note 3e) | 32,647,738 | |||
|
| |||
Total cost of investments | $ | 344,287,273 | ||
|
| |||
Value - Unaffiliated issuers | $ | 428,403,397 | ||
Value - Non-controlled affiliates (Note 3e) | 32,647,738 | |||
|
| |||
Total value of investments (includes securities loaned in the amount of $2,752,190) | 461,051,135 | |||
Receivables: | ||||
Investment securities sold | 5,051,555 | |||
Capital shares sold | 213,261 | |||
Dividends and interest | 84,525 | |||
Due from custodian | 530,400 | |||
Other assets | 294 | |||
|
| |||
Total assets | 466,931,170 | |||
|
| |||
Liabilities: | ||||
Payables: | ||||
Investment securities purchased | 6,837,956 | |||
Capital shares redeemed. | 400,633 | |||
Management fees | 297,801 | |||
Distribution fees | 180,287 | |||
Trustees’ fees and expenses | 157 | |||
Payable upon return of securities loaned | 2,828,150 | |||
Accrued expenses and other liabilities | 122,501 | |||
|
| |||
Total liabilities. | 10,667,485 | |||
|
| |||
Net assets, at value | $ | 456,263,685 | ||
|
| |||
Net assets consist of: | ||||
Paid-in capital | $ | 317,456,236 | ||
Undistributed net investment income (loss) | (1,015,846 | ) | ||
Net unrealized appreciation (depreciation) | 116,763,862 | |||
Accumulated net realized gain (loss) | 23,059,433 | |||
|
| |||
Net assets, at value | $ | 456,263,685 | ||
|
| |||
| Class 1: | ||||
Net assets, at value | $ | 34,414,305 | ||
|
| |||
Shares outstanding | 1,913,864 | |||
|
| |||
Net asset value and maximum offering price per share | $ | 17.98 | ||
|
| |||
| Class 2: | ||||
Net assets, at value | $ | 406,630,468 | ||
|
| |||
Shares outstanding | 24,967,195 | |||
|
| |||
Net asset value and maximum offering price per share | $ | 16.29 | ||
|
| |||
| Class 4: | ||||
Net assets, at value | $ | 15,218,912 | ||
|
| |||
Shares outstanding | 901,638 | |||
|
| |||
Net asset value and maximum offering price per share | $ | 16.88 | ||
|
| |||
| The accompanying notes are an integral part of these financial statements. | Semiannual Report | FSC-13 |
FRANKLIN TEMPLETON VARIABLE INSURANCE PRODUCTS TRUST
FINANCIAL STATEMENTS
Statement of Operations
for the six months ended June 30, 2017 (unaudited)
| Franklin Small-Mid Cap Growth VIP Fund | ||||
Investment income: | ||||
Dividends: | ||||
Unaffiliated issuers | $ | 1,378,895 | ||
Non-controlled affiliates (Note 3e) | 19,930 | |||
Income from securities loaned (net of fees and rebates) | 9,164 | |||
|
| |||
Total investment income | 1,407,989 | |||
|
| |||
Expenses: | ||||
Management fees (Note 3a) | 1,807,718 | |||
Distribution fees: (Note 3c) | ||||
Class 2 | 503,367 | |||
Class 4 | 25,717 | |||
Custodian fees (Note 4) | 1,871 | |||
Reports to shareholders | 79,407 | |||
Professional fees | 21,942 | |||
Trustees’ fees and expenses | 1,230 | |||
Other | 7,376 | |||
|
| |||
Total expenses | 2,448,628 | |||
Expense reductions (Note 4) | (60 | ) | ||
Expenses waived/paid by affiliates (Note 3e) | (24,733 | ) | ||
|
| |||
Net expenses | 2,423,835 | |||
|
| |||
Net investment income (loss) | (1,015,846 | ) | ||
|
| |||
Realized and unrealized gains (losses): | ||||
Net realized gain (loss) from: | ||||
Investments | 23,548,425 | |||
Foreign currency transactions | 290 | |||
|
| |||
Net realized gain (loss) | 23,548,715 | |||
|
| |||
Net change in unrealized appreciation (depreciation) on investments | 24,332,081 | |||
|
| |||
Net realized and unrealized gain (loss) | 47,880,796 | |||
|
| |||
Net increase (decrease) in net assets resulting from operations | $ | 46,864,950 | ||
|
| |||
| FSC-14 | Semiannual Report | The accompanying notes are an integral part of these financial statements. |
FRANKLIN TEMPLETON VARIABLE INSURANCE PRODUCTS TRUST
FINANCIAL STATEMENTS
Statements of Changes in Net Assets
| Franklin Small-Mid Cap Growth VIP Fund | ||||||||
| Six Months Ended June 30, 2017 (unaudited) | Year Ended 2016 | |||||||
Increase (decrease) in net assets: | ||||||||
Operations: | ||||||||
Net investment income (loss) | $ | (1,015,846 | ) | $ | (1,996,016 | ) | ||
Net realized gain (loss) | 23,548,715 | 66,637,011 | ||||||
Net change in unrealized appreciation (depreciation) | 24,332,081 | (44,367,102 | ) | |||||
|
| |||||||
Net increase (decrease) in net assets resulting from operations | 46,864,950 | 20,273,893 | ||||||
|
| |||||||
Distributions to shareholders from: | ||||||||
Net realized gains: | ||||||||
Class 1 | (3,085,657 | ) | (8,833,462 | ) | ||||
Class 2 | (39,960,537 | ) | (52,547,749 | ) | ||||
Class 4 | (1,450,459 | ) | (1,581,894 | ) | ||||
|
| |||||||
Total distributions to shareholders | (44,496,653 | ) | (62,963,105 | ) | ||||
|
| |||||||
Capital share transactions: (Note 2) | ||||||||
Class 1 | 2,275,016 | (50,265,073 | ) | |||||
Class 2 | 11,913,760 | (50,062,313 | ) | |||||
Class 4 | 1,348,827 | (245,962 | ) | |||||
|
| |||||||
Total capital share transactions | 15,537,603 | (100,573,348 | ) | |||||
|
| |||||||
Net increase (decrease) in net assets. | 17,905,900 | (143,262,560 | ) | |||||
Net assets: | ||||||||
Beginning of period | 438,357,785 | 581,620,345 | ||||||
|
| |||||||
End of period | $ | 456,263,685 | $ | 438,357,785 | ||||
|
| |||||||
Undistributed net investment income (loss) included in net assets: | ||||||||
End of period | $ | (1,015,846 | ) | $ | — | |||
|
| |||||||
| The accompanying notes are an integral part of these financial statements. | Semiannual Report | FSC-15 |
FRANKLIN TEMPLETON VARIABLE INSURANCE PRODUCTS TRUST
Notes to Financial Statements (unaudited)
Franklin Small-Mid Cap Growth VIP Fund
1. Organization and Significant Accounting Policies
Franklin Templeton Variable Insurance Products Trust (Trust) is registered under the Investment Company Act of 1940 (1940 Act) as an open-end management investment company, consisting of eighteen separate funds and applies the specialized accounting and reporting guidance in U.S. Generally Accepted Accounting Principles (U.S. GAAP). Franklin Small-Mid Cap Growth VIP Fund (Fund) is included in this report. Shares of the Fund are generally sold only to insurance company separate accounts to fund the benefits of variable life insurance policies or variable annuity contracts. At June 30, 2017, 45.8% of the Fund’s shares were held through one insurance company. Investment activities of these insurance company separate accounts could have a material impact on the Fund. The Fund offers three classes of shares: Class 1, Class 2 and Class 4. Each class of shares may differ by its distribution fees, voting rights on matters affecting a single class and its exchange privilege.
The following summarizes the Fund’s significant accounting policies.
a. Financial Instrument Valuation
The Fund’s investments in financial instruments are carried at fair value daily. Fair value is the price that would be received to sell an asset or paid to transfer a liability in an orderly transaction between market participants on the measurement date. The Fund calculates the net asset value (NAV) per share as of 4 p.m. Eastern time each day the New York Stock Exchange (NYSE) is open for trading. Under compliance policies and procedures approved by the Trust’s Board of Trustees (the Board), the Fund’s administrator has responsibility for oversight of valuation, including leading the cross-functional Valuation Committee (VC). The VC provides administration and oversight of the Fund’s valuation policies and procedures, which are approved annually by the Board. Among other things, these procedures allow the Fund to utilize independent pricing services, quotations from securities and financial instrument dealers, and other market sources to determine fair value.
Equity securities listed on an exchange or on the NASDAQ National Market System are valued at the last quoted sale price or the official closing price of the day, respectively. Foreign equity securities are valued as of the close of trading on the foreign stock exchange on which the security is primarily traded, or as of 4 p.m. Eastern time. The value is then converted
into its U.S. dollar equivalent at the foreign exchange rate in effect at 4 p.m. Eastern time on the day that the value of the security is determined. Over-the-counter (OTC) securities are valued within the range of the most recent quoted bid and ask prices. Securities that trade in multiple markets or on multiple exchanges are valued according to the broadest and most representative market. Certain equity securities are valued based upon fundamental characteristics or relationships to similar securities.
Investments in open-end mutual funds are valued at the closing NAV.
The Fund has procedures to determine the fair value of financial instruments for which market prices are not reliable or readily available. Under these procedures, the VC convenes on a regular basis to review such financial instruments and considers a number of factors, including significant unobservable valuation inputs, when arriving at fair value. The VC primarily employs a market-based approach which may use related or comparable assets or liabilities, recent transactions, market multiples, book values, and other relevant information for the investment to determine the fair value of the investment. An income-based valuation approach may also be used in which the anticipated future cash flows of the investment are discounted to calculate fair value. Discounts may also be applied due to the nature or duration of any restrictions on the disposition of the investments. Due to the inherent uncertainty of valuations of such investments, the fair values may differ significantly from the values that would have been used had an active market existed. The VC employs various methods for calibrating these valuation approaches including a regular review of key inputs and assumptions, transactional back-testing or disposition analysis, and reviews of any related market activity.
Trading in securities on foreign securities stock exchanges and OTC markets may be completed before 4 p.m. Eastern time. In addition, trading in certain foreign markets may not take place on every Fund’s business day. Occasionally, events occur between the time at which trading in a foreign security is completed and 4 p.m. Eastern time that might call into question the reliability of the value of a portfolio security held by the Fund. As a result, differences may arise between the value of the Fund’s portfolio securities as determined at the foreign market close and the latest indications of value at 4 p.m. Eastern time. In order to minimize the potential for these differences, the VC monitors price movements following the close of trading in foreign stock markets through a series of country
| FSC-16 | Semiannual Report |
FRANKLIN TEMPLETON VARIABLE INSURANCE PRODUCTS TRUST
NOTES TO FINANCIAL STATEMENTS (UNAUDITED)
Franklin Small-Mid Cap Growth VIP Fund (continued)
specific market proxies (such as baskets of American Depositary Receipts, futures contracts and exchange traded funds). These price movements are measured against established trigger thresholds for each specific market proxy to assist in determining if an event has occurred that may call into question the reliability of the values of the foreign securities held by the Fund. If such an event occurs, the securities may be valued using fair value procedures, which may include the use of independent pricing services.
When the last day of the reporting period is a non-business day, certain foreign markets may be open on those days that the Fund’s NAV is not calculated, which could result in differences between the value of the Fund’s portfolio securities on the last business day and the last calendar day of the reporting period. Any significant security valuation changes due to an open foreign market are adjusted and reflected by the Fund for financial reporting purposes.
b. Foreign Currency Translation
Portfolio securities and other assets and liabilities denominated in foreign currencies are translated into U.S. dollars based on the exchange rate of such currencies against U.S. dollars on the date of valuation. The Fund may enter into foreign currency exchange contracts to facilitate transactions denominated in a foreign currency. Purchases and sales of securities, income and expense items denominated in foreign currencies are translated into U.S. dollars at the exchange rate in effect on the transaction date. Portfolio securities and assets and liabilities denominated in foreign currencies contain risks that those currencies will decline in value relative to the U.S. dollar. Occasionally, events may impact the availability or reliability of foreign exchange rates used to convert the U.S. dollar equivalent value. If such an event occurs, the foreign exchange rate will be valued at fair value using procedures established and approved by the Board.
The Fund does not separately report the effect of changes in foreign exchange rates from changes in market prices on securities held. Such changes are included in net realized and unrealized gain or loss from investments in the Statement of Operations.
Realized foreign exchange gains or losses arise from sales of foreign currencies, currency gains or losses realized between the trade and settlement dates on securities transactions and the difference between the recorded amounts of dividends, interest, and foreign withholding taxes and the U.S. dollar equivalent of
the amounts actually received or paid. Net unrealized foreign exchange gains and losses arise from changes in foreign exchange rates on foreign denominated assets and liabilities other than investments in securities held at the end of the reporting period.
c. Securities Lending
The Fund participates in an agency based securities lending program to earn additional income. The Fund receives cash collateral against the loaned securities in an amount equal to at least 102% of the fair value of the loaned securities. Collateral is maintained over the life of the loan in an amount not less than 100% of the fair value of loaned securities, as determined at the close of Fund business each day; any additional collateral required due to changes in security values is delivered to the Fund on the next business day. The collateral is deposited into a joint cash account with other funds and is used to invest in a money market fund managed by Franklin Advisers, Inc., an affiliate of the Fund, and/or uninvested cash as included in due from custodian in the Statement of Assets and Liabilities. The Fund may receive income from the investment of cash collateral, in addition to lending fees and rebates paid by the borrower. Income from securities loaned, net of fees paid to the securities lending agent and/or third-party vendor, is reported separately in the Statement of Operations. The Fund bears the market risk with respect to the collateral investment, securities loaned, and the risk that the agent may default on its obligations to the Fund. If the borrower defaults on its obligation to return the securities loaned, the Fund has the right to repurchase the securities in the open market using the collateral received. The securities lending agent has agreed to indemnify the Fund in the event of default by a third party borrower.
d. Income and Deferred Taxes
It is the Fund’s policy to qualify as a regulated investment company under the Internal Revenue Code. The Fund intends to distribute to shareholders substantially all of its taxable income and net realized gains to relieve it from federal income and if applicable, excise taxes. As a result, no provision for U.S. federal income taxes is required.
The Fund may be subject to foreign taxation related to income received, capital gains on the sale of securities and certain foreign currency transactions in the foreign jurisdictions in which it invests. Foreign taxes, if any, are recorded based on the tax regulations and rates that exist in the foreign markets in which the Fund invests. When a capital gain tax is determined
| Semiannual Report | FSC-17 |
FRANKLIN TEMPLETON VARIABLE INSURANCE PRODUCTS TRUST
NOTES TO FINANCIAL STATEMENTS (UNAUDITED)
Franklin Small-Mid Cap Growth VIP Fund (continued)
1. Organization and Significant Accounting Policies (continued)
d. Income and Deferred Taxes (continued)
to apply, the Fund records an estimated deferred tax liability in an amount that would be payable if the securities were disposed of on the valuation date.
The Fund may recognize an income tax liability related to its uncertain tax positions under U.S. GAAP when the uncertain tax position has a less than 50% probability that it will be sustained upon examination by the tax authorities based on its technical merits. As of June 30, 2017, the Fund has determined that no tax liability is required in its financial statements related to uncertain tax positions for any open tax years (or expected to be taken in future tax years). Open tax years are those that remain subject to examination and are based on each tax jurisdiction’s statute of limitation.
e. Security Transactions, Investment Income, Expenses and Distributions
Security transactions are accounted for on trade date. Realized gains and losses on security transactions are determined on a specific identification basis. Estimated expenses are accrued daily. Dividend income is recorded on the ex-dividend date except for certain dividends from securities where the dividend rate is not available. In such cases, the dividend is recorded as soon as the information is received by the Fund. Distributions to shareholders are recorded on the ex-dividend date. Distributable earnings are determined according to income tax regulations (tax basis) and may differ from earnings recorded in accordance with U.S. GAAP. These differences may be permanent or temporary. Permanent differences are reclassified among capital accounts to reflect their tax character. These reclassifications have no impact on net assets or the results of operations. Temporary differences are not reclassified, as they may reverse in subsequent periods.
Common expenses incurred by the Trust are allocated among the Funds based on the ratio of net assets of each Fund to the combined net assets of the Trust. Fund specific expenses are charged directly to the Fund that incurred the expense.
Realized and unrealized gains and losses and net investment income, not including class specific expenses, are allocated daily to each class of shares based upon the relative proportion of net assets of each class. Differences in per share distributions, by class, are generally due to differences in class specific expenses.
f. Accounting Estimates
The preparation of financial statements in accordance with U.S. GAAP requires management to make estimates and assumptions that affect the reported amounts of assets and liabilities at the date of the financial statements and the amounts of income and expenses during the reporting period. Actual results could differ from those estimates.
g. Guarantees and Indemnifications
Under the Trust’s organizational documents, its officers and trustees are indemnified by the Trust against certain liabilities arising out of the performance of their duties to the Trust. Additionally, in the normal course of business, the Trust, on behalf of the Fund, enters into contracts with service providers that contain general indemnification clauses. The Trust’s maximum exposure under these arrangements is unknown as this would involve future claims that may be made against the Trust that have not yet occurred. Currently, the Trust expects the risk of loss to be remote.
| FSC-18 | Semiannual Report |
FRANKLIN TEMPLETON VARIABLE INSURANCE PRODUCTS TRUST
NOTES TO FINANCIAL STATEMENTS (UNAUDITED)
Franklin Small-Mid Cap Growth VIP Fund (continued)
2. Shares of Beneficial Interest
At June 30, 2017, there were an unlimited number of shares authorized (without par value). Transactions in the Fund’s shares were as follows:
| Six Months Ended June 30, 2017 | Year Ended December 31, 2016 | |||||||||||||||||||
| Shares | Amount | Shares | Amount | |||||||||||||||||
| Class 1 Shares: | ||||||||||||||||||||
Shares sold | 55,138 | $ | 1,054,408 | 134,053 | $ | 2,403,127 | ||||||||||||||
Shares issued in reinvestment of distributions | 170,856 | 3,085,657 | 521,763 | 8,833,462 | ||||||||||||||||
Shares redeemed in-kind | — | — | (2,772,844 | ) | (48,919,064 | ) | ||||||||||||||
Shares redeemed | (98,737 | ) | (1,865,049 | ) | (698,942 | ) | (12,582,598 | ) | ||||||||||||
|
| |||||||||||||||||||
Net increase (decrease) | 127,257 | $ | 2,275,016 | (2,815,970 | ) | $ | (50,265,073 | ) | ||||||||||||
|
| |||||||||||||||||||
| Class 2 Shares: | ||||||||||||||||||||
Shares sold | 383,661 | $ | 6,580,343 | 1,837,505 | $ | 30,239,284 | ||||||||||||||
Shares issued in reinvestment of distributions | 2,442,575 | 39,960,537 | 3,385,809 | 52,547,749 | ||||||||||||||||
Shares redeemed in-kind | — | — | (3,221,857 | ) | (52,049,416 | ) | ||||||||||||||
Shares redeemed | (2,003,656 | ) | (34,627,120 | ) | (4,916,789 | ) | (80,799,930 | ) | ||||||||||||
|
| |||||||||||||||||||
Net increase (decrease) | 822,580 | $ | 11,913,760 | (2,915,332 | ) | $ | (50,062,313 | ) | ||||||||||||
|
| |||||||||||||||||||
| Class 4 Shares: | ||||||||||||||||||||
Shares sold | 84,591 | $ | 1,514,880 | 147,333 | $ | 2,490,349 | ||||||||||||||
Shares issued in reinvestment of distributions | 85,574 | 1,450,459 | 98,560 | 1,581,894 | ||||||||||||||||
Shares redeemed | (90,889 | ) | (1,616,512 | ) | (252,259 | ) | (4,318,205 | ) | ||||||||||||
|
| |||||||||||||||||||
Net increase (decrease) | 79,276 | $ | 1,348,827 | (6,366 | ) | $ | (245,962 | ) | ||||||||||||
|
| |||||||||||||||||||
3. Transactions with Affiliates
Franklin Resources, Inc. is the holding company for various subsidiaries that together are referred to as Franklin Templeton Investments. Certain officers and trustees of the Fund are also officers and/or directors of the following subsidiaries:
| Subsidiary | Affiliation | |
Franklin Advisers, Inc. (Advisers) | Investment manager | |
Franklin Templeton Services, LLC (FT Services) | Administrative manager | |
Franklin Templeton Distributors, Inc. (Distributors) | Principal underwriter | |
Franklin Templeton Investor Services, LLC (Investor Services) | Transfer agent |
| Semiannual Report | FSC-19 |
FRANKLIN TEMPLETON VARIABLE INSURANCE PRODUCTS TRUST
NOTES TO FINANCIAL STATEMENTS (UNAUDITED)
Franklin Small-Mid Cap Growth VIP Fund (continued)
3. Transactions with Affiliates (continued)
a. Management Fees
The Fund pays an investment management fee to Advisers based on the average daily net assets of the Fund as follows:
| Annualized Fee Rate | Net Assets | |
0.800% | Up to and including $500 million | |
0.700% | Over $500 million, up to and including $1 billion | |
0.650% | Over $1 billion, up to and including $1.5 billion | |
0.600% | Over $1.5 billion, up to and including $6.5 billion | |
0.575% | Over $6.5 billion, up to and including $11.5 billion | |
0.550% | Over $11.5 billion, up to and including $16.5 billion | |
0.540% | Over $16.5 billion, up to and including $19 billion | |
0.530% | Over $19 billion, up to and including $21.5 billion | |
0.520% | In excess of $21.5 billion |
For the period ended June 30, 2017, the annualized effective investment management fee rate was 0.800% of the Fund’s average daily net assets.
b. Administrative Fees
Under an agreement with Advisers, FT Services provides administrative services to the Fund. The fee is paid by Advisers based on the Fund’s average daily net assets, and is not an additional expense of the Fund.
c. Distribution Fees
The Board has adopted distribution plans for Class 2 and Class 4 shares pursuant to Rule 12b-1 under the 1940 Act. Under the Fund’s compensation distribution plans, the Fund pays Distributors for costs incurred in connection with the servicing, sale and distribution of the Fund’s shares up to 0.35% per year of its average daily net assets of each class. The Board has agreed to limit the current rate to 0.25% per year for Class 2. The plan year, for purposes of monitoring compliance with the maximum annual plan rates, is February 1 through January 31.
d. Transfer Agent Fees
Investor Services, under terms of an agreement, performs shareholder servicing for the Fund and is not paid by the Fund for the services.
| FSC-20 | Semiannual Report |
FRANKLIN TEMPLETON VARIABLE INSURANCE PRODUCTS TRUST
NOTES TO FINANCIAL STATEMENTS (UNAUDITED)
Franklin Small-Mid Cap Growth VIP Fund (continued)
e. Investments in Affiliated Management Investment Companies
The Fund invests in one or more affiliated management investment companies for purposes other than exercising a controlling influence over the management or policies. Management fees paid by the Fund are waived on assets invested in the affiliated management investment companies, as noted in the Statement of Operations, in an amount not to exceed the management and administrative fees paid directly or indirectly by each affiliate. Prior to January 1, 2014, the waiver was accounted for as a reduction to management fees. During the period ended June 30, 2017, the Fund held investments in affiliated management investment companies as follows:
| Number of Shares Held at Beginning of Period | Gross Additions | Gross Reductions | Number of Shares Held at End of Period | Value at End of Period | Investment Income | Realized Gain (Loss) | % of Affiliated Fund Shares Outstanding Held at End of Period | |||||||||||||||||||||||
| Non-Controlled Affiliates | ||||||||||||||||||||||||||||||
Institutional Fiduciary Trust Money Market Portfolio, 0.58% | 19,269,553 | 83,204,860 | (69,826,675 | ) | 32,647,738 | $ | 32,647,738 | $ | 19,930 | $ | — | 0.2% | ||||||||||||||||||
|
|
|
|
|
| |||||||||||||||||||||||||
4. Expense Offset Arrangement
The Fund has entered into an arrangement with its custodian whereby credits realized as a result of uninvested cash balances are used to reduce a portion of the Fund’s custodian expenses. During the period ended June 30, 2017, the custodian fees were reduced as noted in the Statement of Operations.
5. Income Taxes
At June 30, 2017, the cost of investments and net unrealized appreciation (depreciation) for income tax purposes were as follows:
Cost of investments | $ | 344,762,541 | ||
|
| |||
Unrealized appreciation | $ | 126,464,980 | ||
Unrealized depreciation | (10,176,386 | ) | ||
|
| |||
Net unrealized appreciation (depreciation) | $ | 116,288,594 | ||
|
|
Differences between income and/or capital gains as determined on a book basis and a tax basis are primarily due to differing treatments of wash sales.
6. Investment Transactions
Purchases and sales of investments (excluding short term securities) for the period ended June 30, 2017, aggregated $92,162,896 and $136,647,017, respectively.
At June 30, 2017, in connection with securities lending transactions, the Fund loaned equity investments and received $2,828,150 of cash collateral. The gross amount of recognized liability for such transactions is included in payable upon return of securities loaned in the Statement of Assets and Liabilities. The agreements can be terminated at any time.
| Semiannual Report | FSC-21 |
FRANKLIN TEMPLETON VARIABLE INSURANCE PRODUCTS TRUST
NOTES TO FINANCIAL STATEMENTS (UNAUDITED)
Franklin Small-Mid Cap Growth VIP Fund (continued)
7. Restricted Securities
The Fund invests in securities that are restricted under the Securities Act of 1933 (1933 Act) or which are subject to legal, contractual, or other agreed upon restrictions on resale. Restricted securities are often purchased in private placement transactions, and cannot be sold without prior registration unless the sale is pursuant to an exemption under the 1933 Act. Disposal of these securities may require greater effort and expense, and prompt sale at an acceptable price may be difficult. The Fund may have registration rights for restricted securities. The issuer generally incurs all registration costs.
At June 30, 2017, investments in restricted securities, excluding certain securities exempt from registration under the 1933 Act deemed to be liquid, were as follows:
| Shares | Issuer | Acquisition Date | Cost | Value | ||||||||||
| 115,528 | DraftKings Inc., pfd., D | 8/07/15 | $ | 622,222 | $ | 383,147 | ||||||||
| 284,105 | DraftKings Inc., pfd., D-1 | 8/07/15 | 2,177,781 | 1,295,720 | ||||||||||
|
| |||||||||||||
Total Restricted Securities (Value is 0.4% of Net Assets) | $ | 2,800,003 | $ | 1,678,867 | ||||||||||
|
| |||||||||||||
8. Credit Facility
The Fund, together with other U.S. registered and foreign investment funds (collectively, Borrowers), managed by Franklin Templeton Investments, are borrowers in a joint syndicated senior unsecured credit facility totaling $2 billion (Global Credit Facility) which matures on February 9, 2018. This Global Credit Facility provides a source of funds to the Borrowers for temporary and emergency purposes, including the ability to meet future unanticipated or unusually large redemption requests.
Under the terms of the Global Credit Facility, the Fund shall, in addition to interest charged on any borrowings made by the Fund and other costs incurred by the Fund, pay its share of fees and expenses incurred in connection with the implementation and maintenance of the Global Credit Facility, based upon its relative share of the aggregate net assets of all of the Borrowers, including an annual commitment fee of 0.15% based upon the unused portion of the Global Credit Facility. These fees are reflected in other expenses in the Statement of Operations. During the period ended June 30, 2017, the Fund did not use the Global Credit Facility.
9. Redemption In-Kind
During the year ended December 31, 2016, the Fund realized $22,002,600 of net gains resulting from a redemption in-kind in which a shareholder redeemed fund shares for cash and securities held by the Fund. Because such gains are not taxable to the Fund and are not distributed to remaining shareholders, they have been reclassified from accumulated net realized gains to paid-in capital.
10. Fair Value Measurements
The Fund follows a fair value hierarchy that distinguishes between market data obtained from independent sources (observable inputs) and the Fund’s own market assumptions (unobservable inputs). These inputs are used in determining the value of the Fund’s financial instruments and are summarized in the following fair value hierarchy:
| • | Level 1 – quoted prices in active markets for identical financial instruments |
| • | Level 2 – other significant observable inputs (including quoted prices for similar financial instruments, interest rates, prepayment speed, credit risk, etc.) |
| • | Level 3 – significant unobservable inputs (including the Fund’s own assumptions in determining the fair value of financial instruments) |
| FSC-22 | Semiannual Report |
FRANKLIN TEMPLETON VARIABLE INSURANCE PRODUCTS TRUST
NOTES TO FINANCIAL STATEMENTS (UNAUDITED)
Franklin Small-Mid Cap Growth VIP Fund (continued)
The input levels are not necessarily an indication of the risk or liquidity associated with financial instruments at that level.
For movements between the levels within the fair value hierarchy, the Fund has adopted a policy of recognizing the transfers as of the date of the underlying event which caused the movement.
A summary of inputs used as of June 30, 2017, in valuing the Fund’s assets carried at fair value, is as follows:
| Level 1 | Level 2 | Level 3 | Total | |||||||||||||
| Assets: | ||||||||||||||||
Investments in Securities: | ||||||||||||||||
Equity Investments:a | ||||||||||||||||
Consumer Discretionary | $ | 73,705,323 | $ | — | $ | 1,678,867 | $ | 75,384,190 | ||||||||
All Other Equity Investmentsb | 353,019,207 | — | — | 353,019,207 | ||||||||||||
Short Term Investments | 32,647,738 | — | — | 32,647,738 | ||||||||||||
|
| |||||||||||||||
Total Investments in Securities | $ | 459,372,268 | $ | — | $ | 1,678,867 | $ | 461,051,135 | ||||||||
|
| |||||||||||||||
aIncludes common and preferred stocks.
bFor detailed categories, see the accompanying Statement of Investments.
A reconciliation of assets in which Level 3 inputs are used in determining fair value is presented when there are significant Level 3 financial instruments at the end of the period.
11. Investment Company Reporting Modernization
In October 2016, the U.S. Securities and Exchange Commission adopted new rules and amended existing rules (together, final rules) intended to modernize the reporting and disclosure of information by registered investment companies. In part, the final rules amend Regulation S-X and require standardized, enhanced disclosures about derivatives in investment company financial statements, as well as other amendments. The compliance date for the amendments to Regulation S-X is August 1, 2017. Management has reviewed the requirements and believes the adoption of the amendments to Regulation S-X will not have a material impact on the Fund’s financial statements and related disclosures.
12. Subsequent Events
The Fund has evaluated subsequent events through the issuance of the financial statements and determined that no events have occurred that require disclosure.
| Semiannual Report | FSC-23 |
This page intentionally left blank.
Franklin Strategic Income VIP Fund
This semiannual report for Franklin Strategic Income VIP Fund covers the period ended June 30, 2017.
Class 1 Performance Summary as of June 30, 2017
The Fund’s Class 1 Shares delivered a +3.14% total return* for the six-month period ended June 30, 2017.
*The Fund has a fee waiver associated with any investment it makes in a Franklin Templeton money fund and/or other Franklin Templeton fund, contractually guaranteed through its current fiscal year-end. Fund investment results reflect the fee waiver; without this waiver, the results would have been lower.
Performance reflects the Fund’s Class 1 operating expenses, but does not include any contract fees, expenses or sales charges. If they had been included, performance would be lower. These charges and deductions, particularly for variable life policies, can have a significant effect on contract values and insurance benefits. See the contract prospectus for a complete description of these expenses, including sales charges.
Performance data represent past performance, which does not guarantee future results. Investment return and principal value will fluctuate, and you may have a gain or loss when you sell your shares. Current performance may differ from figures shown.
| Semiannual Report | FSI-1 |
FRANKLIN STRATEGIC INCOME VIP FUND
Fund Goal and Main Investments
The Fund seeks a high level of current income, with capital appreciation over the long term as a secondary goal. Under normal market conditions, the Fund invests primarily to predominantly in U.S. and foreign debt securities, including those in emerging markets.
Fund Risks
All investments involve risks, including possible loss of principal. Bond prices generally move in the opposite direction of interest rates. Thus, as prices of bonds in the Fund adjust to a rise in interest rates, the Fund’s share price may decline. Changes in the financial strength of a bond issuer or in a bond’s credit rating may affect its value. High yields reflect the higher credit risks associated with certain lower rated securities held in the portfolio. Floating rate loans and high yield corporate bonds are rated below investment grade and are subject to greater risk of default, which could result in loss of principal — a risk that may be heightened in a slowing economy. The risks of foreign securities include currency fluctuations and political uncertainty. Investments in developing markets involve heightened risks related to the same factors, in addition to those associated with their relatively small size and lesser liquidity. Investing in derivative securities and the use of foreign currency techniques involve special risks as such may not achieve the anticipated benefits and/or may result in losses to the Fund. The Fund is actively managed but there is no guarantee that the manager’s investment decisions will produce the desired results. The Fund’s prospectus also includes a description of the main investment risks.
Performance Overview
You can find the Fund’s six month total return in the Performance Summary. For comparison, the Fund’s benchmark, the Bloomberg Barclays U.S. Aggregate Index, delivered a +2.27% total return for the period under review.1 The Fund’s peers, as measured by the Lipper Multi-Sector Income Funds Classification Average, produced a +3.60% return.2
Economic and Market Overview
U.S. economic growth decelerated in 2017’s first quarter, largely due to slower growth in consumer spending and declines in private inventory investment and government spending. However, growth accelerated in the second quarter due to increases in consumer spending, business investment and federal government spending. The manufacturing sector generally expanded, and the services sector also continued to grow. The unemployment rate decreased from 4.7% in December 2016 to 4.4% at period-end.3 Monthly retail sales were volatile, but grew for most of the period. Annual inflation, as measured by the Consumer Price Index, decreased from 2.1% to 1.6% during the period.
The U.S. Federal Reserve (Fed), at its March meeting, increased the federal funds target rate from 0.50%–0.75% to 0.75%–1.00%. The Fed again increased its target range by a quarter point to 1.00%–1.25% at its June meeting. The Fed made both of these increases amid signs of a growing U.S. economy, a strengthening labor market and an improvement in business spending.
The 10-year Treasury yield, which moves inversely to its price, shifted throughout the period. It increased early during the period amid expectations of rate hikes by the Fed and upbeat economic data. During the latter part of the period, U.S. political uncertainty and geopolitical tensions in the Middle East and the Korean peninsula resulted in a decline in the yield. However, in June, the yield rose again due to renewed optimism for improvement in economic growth. Overall, the U.S. Treasury yield fell from 2.45% on December 30, 2016, to 2.31% at period-end.
Investment Strategy
We allocate our investments among the various types of debt available based on our assessment of changing economic, global market, industry and issuer conditions. We use a top-down analysis of macroeconomic trends, combined with a bottom-up fundamental analysis of market sectors, industries and issuers, seeking to take advantage of varying sector reactions to economic events. For example, we may evaluate business cycles, yield curves, country risk, and the relative interest rates among currencies, and values between and within
1. Source: Morningstar.
2. Source: Lipper, a Thomson Reuters Company.
One cannot invest directly in an index, and an index is not representative of the Fund’s portfolio. Please see Index Descriptions following the Fund Summaries.
3. Source: Bureau of Labor Statistics.
The dollar value, number of shares or principal amount, and names of all portfolio holdings are listed in the Fund’s Statement of Investments (SOI).
| FSI-2 | Semiannual Report |
FRANKLIN STRATEGIC INCOME VIP FUND
markets. In selecting debt securities, we generally conduct our own analysis of the security’s intrinsic value rather than simply relying on the coupon rate or rating. We may also enter into various transactions involving certain currency-, interest rate-or credit-related derivative instruments.
What is the yield curve?
A yield curve is a line that plots the yield to maturity of bonds having equal credit quality against their maturity dates.
Manager’s Discussion
The Fund allocated assets across the broad fixed income markets. During the period, we maintained large allocations to credit-sensitive sector securities, primarily noninvestment-grade corporate credit, with a smaller exposure to investment-grade corporate bonds. The Fund also held positions in select non-U.S. dollar global government bonds. Additionally, the Fund sought to maintain a relatively low sensitivity to U.S. interest rates.
The Fund’s non-U.S. dollar yield curve positioning posted strong positive returns and delivered positive absolute performance. The Fund’s exposure to corporate credit provided a significant boost to absolute performance, led by senior-secured floating-rate bank loans, while investment-grade corporate bond, high-yield corporate bonds and collateralized loan obligations also benefited returns. In addition, performance was supported by our exposures to non-agency residential mortgage-backed securities, currency positions and commercial mortgage-backed securities.
In contrast, our non-US dollar denominated emerging-market debt, and Treasury-Inflation Protected-Securities also weighed on returns.
The Fund utilized derivatives, including credit default swaps, currency forwards and government bond futures, primarily as a tool for efficient portfolio management and to manage overall portfolio risk. These derivative transactions may provide the same, or similar, net long or short exposure to select currencies, interest rates, countries, duration or credit risks compared to holding securities.
What is a currency forward?
A currency forward is an agreement between the Fund and a counterparty to buy or sell a foreign currency in exchange for another currency at a specific exchange rate on a future date.
| Portfolio Composition* | ||||||||
| Based on Total Net Assets | ||||||||
| 6/30/17 | 12/31/16 | |||||||
| High-Yield Corporate Bonds | 27.5% | 25.6% | ||||||
| Investment-Grade Corporate Bonds | 17.2% | 16.9% | ||||||
| Floating-Rate Loans | 16.1% | 16.4% | ||||||
| Agency Mortgage-Backed Securities | 9.5% | 9.9% | ||||||
| U.S. Treasury Securities | 7.5% | 5.4% | ||||||
| International Government & Agency Bonds | 7.2% | 7.9% | ||||||
| Collateralized Loan Obligations | 3.8% | 3.9% | ||||||
| Residential Mortgage-Backed Securities | 3.4% | 1.6% | ||||||
| Other | 3.3% | 4.1% | ||||||
| Commercial Mortgage-Backed Securities | 2.9% | 2.1% | ||||||
| Asset-Backed Securities | 2.1% | 2.1% | ||||||
| Municipal Bonds | 1.8% | 1.9% | ||||||
| Short-Term Investments & Other Net Assets | -2.3% | 2.3% | ||||||
*Figures reflect certain derivatives held in the portfolio (or their underlying reference assets) and may not total 100% or may be negative due to rounding, use of derivatives, unsettled trades or other factors. The composition may not match the Statements of Investments (SOI).
What is a credit derivative?
A credit derivative is a contract agreement between the Fund and a counterparty that is principally used by the Fund to gain or increase exposure to certain financial assets and/or to hedge against credit risk.
What is meant by “hedge”?
To hedge an investment is to take a position intended to offset potential losses/gains that may be incurred by a companion financial instrument.
Thank you for your participation in Franklin Strategic Income VIP Fund. We look forward to serving your future investment needs.
The foregoing information reflects our analysis, opinions and portfolio holdings as of June 30, 2017, the end of the reporting period. The way we implement our main investment strategies and the resulting portfolio holdings may change depending on factors such as market and economic conditions. These opinions may not be relied upon as investment advice or an offer for a particular security. The information is not a complete analysis of every aspect of any market, country, industry, security or the Fund. Statements of fact are from sources considered reliable, but the investment manager makes no representation or warranty as to their completeness or accuracy. Although historical performance is no guarantee of future results, these insights may help you understand our investment management philosophy.
| Semiannual Report | FSI-3 |
FRANKLIN STRATEGIC INCOME VIP FUND
Class 1 Fund Expenses
As an investor in a variable insurance contract (Contract) that indirectly provides for investment in an underlying mutual fund, you can incur transaction and/or ongoing expenses at both the Fund level and the Contract Level: (1) transaction expenses can include sales charges (loads) on purchases, surrender fees, transfer fees and premium taxes; and (2) ongoing expenses can include management fees, distribution and service (12b-1) fees, contract fees, annual maintenance fees, mortality and expense risk fees and other fees and expenses. All mutual funds and Contracts have some types of ongoing expenses. The table below shows Fund-level ongoing expenses and can help you understand these costs and compare them with those of other mutual funds offered through the Contract. The table assumes a $1,000 investment held for the six months indicated. Please refer to the Fund prospectus for additional information on operating expenses.
Actual Fund Expenses
The table below provides information about the actual account values and actual expenses in the columns under the heading “Actual.” In these columns the Fund’s actual return, which includes the effect of ongoing Fund expenses but does not include the effect of ongoing Contract expenses, is used to calculate the “Ending Account Value.” You can estimate the Fund-level expenses you paid during the period by following these steps (of course, your account value and expenses will differ from those in this illustration): Divide your account value by $1,000 (if your account had an $8,600 value, then $8,600 ÷ $1,000 = 8.6). Then multiply the result by the number under the headings “Actual” and “Fund-Level Expenses Paid During Period” (if Fund-Level Expenses Paid During Period were $ 7.50, then 8.6 × $7.50= $64.50). In this illustration, the estimated expenses paid this period at the Fund level are $64.50.
Hypothetical Example for Comparison with Other Mutual Funds
Under the heading “Hypothetical” in the table, information is provided about hypothetical account values and hypothetical expenses based on the Fund’s actual expense ratio and an assumed rate of return of 5% per year before expenses, which is not the Fund’s actual return. This information may not be used to estimate the actual ending account balance or expenses you paid for the period, but it can help you compare ongoing costs of investing in the Fund with those of other mutual funds offered through the Contract. To do so, compare this 5% hypothetical example with the 5% hypothetical examples that appear in the shareholder reports of other funds offered through the Contract.
Please note that expenses shown in the table are meant to highlight ongoing costs at the Fund level only and do not reflect any ongoing expenses at the Contract level, or transaction expenses at either the Fund or Contract levels. In addition, while the Fund does not have transaction expenses, if the transaction and ongoing expenses at the Contract level were included, the expenses shown below would be higher. You should consult your Contract prospectus or disclosure document for more information.
| Actual (actual return after expenses) | Hypothetical (5% annual return before expenses) | |||||||||||||||||||||||
| Share Class | | Beginning Account Value 1/1/17 | | | Ending Account Value 6/30/17 | | | Fund-Level Expenses Paid During Period 1/1/17–6/30/17 | 1,2 | | Ending Account Value 6/30/17 | | | Fund-Level Expenses Paid During Period 1/1/17–6/30/17 | 1,2 | | Net Annualized Expense Ratio | 2 | ||||||
Class 1 | $1,000 | $1,031.40 | $3.07 | $1,021.77 | $3.06 | 0.61% | ||||||||||||||||||
1. Expenses are equal to the annualized expense ratio for the six-month period as indicated above — in the far right column — multiplied by the simple average account value over the period indicated, and then multiplied by 181/365 to reflect the one-half year period.
2. Reflects expenses after fee waivers and expense reimbursements. Does not include any ongoing expenses of the Contract for which the Fund is an investment option or acquired fund fees and expenses.
| FSI-4 | Semiannual Report |
FRANKLIN TEMPLETON VARIABLE INSURANCE PRODUCTS TRUST
Consolidated Financial Highlights
Franklin Strategic Income VIP Fund
| Six Months Ended June 30, 2017 (unaudited) | Year Ended December 31, | |||||||||||||||||||||||
| 2016 | 2015 | 2014 | 2013 | 2012 | ||||||||||||||||||||
| Class 1 | ||||||||||||||||||||||||
Per share operating performance (for a share outstanding throughout the period) | ||||||||||||||||||||||||
Net asset value, beginning of period | $11.01 | $10.55 | $11.90 | $12.64 | $13.17 | $12.55 | ||||||||||||||||||
|
| |||||||||||||||||||||||
| Income from investment operationsa: | ||||||||||||||||||||||||
Net investment incomeb | 0.23 | 0.48 | 0.53 | 0.54 | 0.59 | 0.65 | ||||||||||||||||||
Net realized and unrealized gains (losses) | 0.12 | 0.37 | (0.91 | ) | (0.25 | ) | (0.15 | ) | 0.92 | |||||||||||||||
|
| |||||||||||||||||||||||
Total from investment operations | 0.35 | 0.85 | (0.38 | ) | 0.29 | 0.44 | 1.57 | |||||||||||||||||
|
| |||||||||||||||||||||||
| Less distributions from: | ||||||||||||||||||||||||
Net investment income and net foreign currency gains | (0.35 | ) | (0.39 | ) | (0.77 | ) | (0.78 | ) | (0.80 | ) | (0.93 | ) | ||||||||||||
Net realized gains | — | — | (0.20 | ) | (0.25 | ) | (0.17 | ) | (0.02 | ) | ||||||||||||||
|
| |||||||||||||||||||||||
Total distributions | (0.35 | ) | (0.39 | ) | (0.97 | ) | (1.03 | ) | (0.97 | ) | (0.95 | ) | ||||||||||||
|
| |||||||||||||||||||||||
Net asset value, end of period | $11.01 | $11.01 | $10.55 | $11.90 | $12.64 | $13.17 | ||||||||||||||||||
|
| |||||||||||||||||||||||
Total returnc | 3.14% | 8.25% | (3.62)% | 2.12% | 3.52% | 13.12% | ||||||||||||||||||
| Ratios to average net assetsd | ||||||||||||||||||||||||
Expenses before waiver and payments by affiliates | 0.67% | 0.67% | 0.63% | 0.63% | 0.60% | 0.58% | ||||||||||||||||||
Expenses net of waiver and payments by affiliates | 0.61% | e | 0.60% | e | 0.62% | e | 0.62% | e | 0.60% | e | 0.58% | |||||||||||||
Net investment income | 4.07% | 4.42% | 4.71% | 4.34% | 4.58% | 5.04% | ||||||||||||||||||
| Supplemental data | ||||||||||||||||||||||||
Net assets, end of period (000’s) | $379,253 | $396,170 | $441,658 | $574,850 | $705,493 | $1,019,537 | ||||||||||||||||||
Portfolio turnover rate | 54.68% | 128.51% | 85.85% | 55.64% | 48.06% | 49.98% | ||||||||||||||||||
Portfolio turnover rate excluding mortgage dollar rollsf | 25.39% | 77.93% | 51.47% | 48.86% | 47.01% | 48.75% | ||||||||||||||||||
aThe amount shown for a share outstanding throughout the period may not correlate with the Consolidated Statement of Operations for the period due to the timing of sales and repurchases of the Fund’s shares in relation to income earned and/or fluctuating fair value of the investments of the Fund.
bBased on average daily shares outstanding.
cTotal return does not include fees, charges or expenses imposed by the variable annuity and life insurance contracts for which Franklin Templeton Variable Insurance Products Trust serves as an underlying investment vehicle. Total return is not annualized for periods less than one year.
dRatios are annualized for periods less than one year, except for non-recurring expenses, if any.
eBenefit of expense reduction rounds to less than 0.01%.
f See Note 1(h) regarding mortgage dollar rolls.
| The accompanying notes are an integral part of these consolidated financial statements. | Semiannual Report | FSI-5 |
FRANKLIN TEMPLETON VARIABLE INSURANCE PRODUCTS TRUST
CONSOLIDATED FINANCIAL HIGHLIGHTS
Franklin Strategic Income VIP Fund (continued)
| Six Months Ended June 30, 2017 (unaudited) | Year Ended December 31, | |||||||||||||||||||||||
| 2016 | 2015 | 2014 | 2013 | 2012 | ||||||||||||||||||||
| Class 2 | ||||||||||||||||||||||||
Per share operating performance (for a share outstanding throughout the period) | ||||||||||||||||||||||||
Net asset value, beginning of period | $10.64 | $10.21 | $11.55 | $12.30 | $12.84 | $12.27 | ||||||||||||||||||
|
| |||||||||||||||||||||||
| Income from investment operationsa: | ||||||||||||||||||||||||
Net investment incomeb | 0.21 | 0.43 | 0.49 | 0.49 | 0.54 | 0.60 | ||||||||||||||||||
Net realized and unrealized gains (losses) | 0.11 | 0.36 | (0.89 | ) | (0.24 | ) | (0.13 | ) | 0.89 | |||||||||||||||
|
| |||||||||||||||||||||||
Total from investment operations | 0.32 | 0.79 | (0.40 | ) | 0.25 | 0.41 | 1.49 | |||||||||||||||||
|
| |||||||||||||||||||||||
| Less distributions from: | ||||||||||||||||||||||||
Net investment income and net foreign currency gains | (0.32 | ) | (0.36 | ) | (0.74 | ) | (0.75 | ) | (0.78 | ) | (0.90 | ) | ||||||||||||
Net realized gains | — | — | (0.20 | ) | (0.25 | ) | (0.17 | ) | (0.02 | ) | ||||||||||||||
|
| |||||||||||||||||||||||
Total distributions | (0.32 | ) | (0.36 | ) | (0.94 | ) | (1.00 | ) | (0.95 | ) | (0.92 | ) | ||||||||||||
|
| |||||||||||||||||||||||
Net asset value, end of period | $10.64 | $10.64 | $10.21 | $11.55 | $12.30 | $12.84 | ||||||||||||||||||
|
| |||||||||||||||||||||||
Total returnc | 3.01% | 7.94% | (3.87)% | 1.86% | 3.32% | 12.75% | ||||||||||||||||||
| Ratios to average net assetsd | ||||||||||||||||||||||||
Expenses before waiver and payments by affiliates | 0.92% | 0.92% | 0.88% | 0.88% | 0.85% | 0.83% | ||||||||||||||||||
Expenses net of waiver and payments by affiliates | 0.86% | e | 0.85% | e | 0.87% | e | 0.87% | e | 0.85% | e | 0.83% | |||||||||||||
Net investment income | 3.82% | 4.17% | 4.46% | 4.09% | 4.33% | 4.79% | ||||||||||||||||||
| Supplemental data | ||||||||||||||||||||||||
Net assets, end of period (000’s) | $211,739 | $203,418 | $202,192 | $206,571 | $175,307 | $158,451 | ||||||||||||||||||
Portfolio turnover rate | 54.68% | 128.51% | 85.85% | 55.64% | 48.06% | 49.98% | ||||||||||||||||||
Portfolio turnover rate excluding mortgage dollar rollsf | 25.39% | 77.93% | 51.47% | 48.86% | 47.01% | 48.75% | ||||||||||||||||||
aThe amount shown for a share outstanding throughout the period may not correlate with the Consolidated Statement of Operations for the period due to the timing of sales and repurchases of the Fund’s shares in relation to income earned and/or fluctuating fair value of the investments of the Fund.
bBased on average daily shares outstanding.
cTotal return does not include fees, charges or expenses imposed by the variable annuity and life insurance contracts for which Franklin Templeton Variable Insurance Products Trust serves as an underlying investment vehicle. Total return is not annualized for periods less than one year.
dRatios are annualized for periods less than one year, except for non-recurring expenses, if any.
eBenefit of expense reduction rounds to less than 0.01%.
fSee Note 1(h) regarding mortgage dollar rolls.
| FSI-6 | Semiannual Report | The accompanying notes are an integral part of these consolidated financial statements. | |||
FRANKLIN TEMPLETON VARIABLE INSURANCE PRODUCTS TRUST
CONSOLIDATED FINANCIAL HIGHLIGHTS
Franklin Strategic Income VIP Fund (continued)
| Six Months Ended June 30, 2017 (unaudited) | Year Ended December 31, | |||||||||||||||||||||||
| 2016 | 2015 | 2014 | 2013 | 2012 | ||||||||||||||||||||
| Class 4 | ||||||||||||||||||||||||
Per share operating performance (for a share outstanding throughout the period) | ||||||||||||||||||||||||
Net asset value, beginning of period | $10.90 | $10.44 | $11.78 | $12.51 | $13.04 | $12.44 | ||||||||||||||||||
|
| |||||||||||||||||||||||
| Income from investment operationsa: | ||||||||||||||||||||||||
Net investment incomeb | 0.20 | 0.43 | 0.49 | 0.49 | 0.54 | 0.60 | ||||||||||||||||||
Net realized and unrealized gains (losses) | 0.13 | 0.38 | (0.91 | ) | (0.25 | ) | (0.14 | ) | 0.91 | |||||||||||||||
|
| |||||||||||||||||||||||
Total from investment operations | 0.33 | 0.81 | (0.42 | ) | 0.24 | 0.40 | 1.51 | |||||||||||||||||
|
| |||||||||||||||||||||||
| Less distributions from: | ||||||||||||||||||||||||
Net investment income and net foreign currency gains | (0.30 | ) | (0.35 | ) | (0.72 | ) | (0.72 | ) | (0.76 | ) | (0.89 | ) | ||||||||||||
Net realized gains | — | — | (0.20 | ) | (0.25 | ) | (0.17 | ) | (0.02 | ) | ||||||||||||||
|
| |||||||||||||||||||||||
Total distributions | (0.30 | ) | (0.35 | ) | (0.92 | ) | (0.97 | ) | (0.93 | ) | (0.91 | ) | ||||||||||||
|
| |||||||||||||||||||||||
Net asset value, end of period | $10.93 | $10.90 | $10.44 | $11.78 | $12.51 | $13.04 | ||||||||||||||||||
|
| |||||||||||||||||||||||
Total returnc | 2.95% | 7.86% | (3.98)% | 1.75% | 3.17% | 12.67% | ||||||||||||||||||
| Ratios to average net assetsd | ||||||||||||||||||||||||
Expenses before waiver and payments by affiliates | 1.02% | 1.02% | 0.98% | 0.98% | 0.95% | 0.93% | ||||||||||||||||||
Expenses net of waiver and payments by affiliates | 0.96% | e | 0.95% | e | 0.97% | e | 0.97% | e | 0.95% | e | 0.93% | |||||||||||||
Net investment income | 3.72% | 4.07% | 4.36% | 3.99% | 4.23% | 4.69% | ||||||||||||||||||
| Supplemental data | ||||||||||||||||||||||||
Net assets, end of period (000’s) | $76,283 | $80,175 | $92,965 | $113,986 | $134,970 | $196,479 | ||||||||||||||||||
Portfolio turnover rate | 54.68% | 128.51% | 85.85% | 55.64% | 48.06% | 49.98% | ||||||||||||||||||
Portfolio turnover rate excluding mortgage dollar rollsf | 25.39% | 77.93% | 51.47% | 48.86% | 47.01% | 48.75% | ||||||||||||||||||
aThe amount shown for a share outstanding throughout the period may not correlate with the Consolidated Statement of Operations for the period due to the timing of sales and repurchases of the Fund’s shares in relation to income earned and/or fluctuating fair value of the investments of the Fund.
bBased on average daily shares outstanding.
cTotal return does not include fees, charges or expenses imposed by the variable annuity and life insurance contracts for which Franklin Templeton Variable Insurance Products Trust serves as an underlying investment vehicle. Total return is not annualized for periods less than one year.
dRatios are annualized for periods less than one year, except for non-recurring expenses, if any.
eBenefit of expense reduction rounds to less than 0.01%.
fSee Note 1(h) regarding mortgage dollar rolls.
| The accompanying notes are an integral part of these consolidated financial statements. | Semiannual Report | FSI-7 |
FRANKLIN TEMPLETON VARIABLE INSURANCE PRODUCTS TRUST
Consolidated Statement of Investments, June 30, 2017 (unaudited)
Franklin Strategic Income VIP Fund
| Country | Shares/ Units/ Warrants | Value | ||||||||||||
Common Stocks and Other Equity Interests 1.9% | ||||||||||||||
Consumer Services 1.3% | ||||||||||||||
| a,b,c | Turtle Bay Resort | United States | 1,901,449 | $ | 8,841,736 | |||||||||
|
| |||||||||||||
Energy 0.4% | ||||||||||||||
| a | CHC Group LLC | Cayman Islands | 17,097 | 196,615 | ||||||||||
| a | Energy XXI Gulf Coast Inc. | United States | 26,029 | 483,359 | ||||||||||
| a | Energy XXI Gulf Coast Inc., wts., 12/30/21 | United States | 4,009 | 4,009 | ||||||||||
| a | Halcon Resources Corp. | United States | 97,655 | 443,354 | ||||||||||
| a | Halcon Resources Corp., wts., 9/09/20 | United States | 8,155 | 7,013 | ||||||||||
| a | Linn Energy Inc. | United States | 23,266 | 710,544 | ||||||||||
| a | Midstates Petroleum Co. Inc. | United States | 682 | 8,641 | ||||||||||
| a,d | Midstates Petroleum Co. Inc., wts., 4/21/20 | United States | 4,836 | 3,553 | ||||||||||
| a | Penn Virginia Corp. | United States | 18,797 | 690,790 | ||||||||||
| a | W&T Offshore Inc. | United States | 85,100 | 166,796 | ||||||||||
|
| |||||||||||||
| 2,714,674 | ||||||||||||||
|
| |||||||||||||
Materials 0.1% | ||||||||||||||
| a | Verso Corp., A | United States | 6,954 | 32,614 | ||||||||||
| a | Verso Corp., wts., 7/25/23 | United States | 732 | 110 | ||||||||||
| e | Warrior Met Coal Inc. | United States | 20,905 | 341,985 | ||||||||||
|
| |||||||||||||
| 374,709 | ||||||||||||||
|
| |||||||||||||
Retailing 0.0%† | ||||||||||||||
| a,e | Holdco 2, A | South Africa | 14,792,309 | 11,296 | ||||||||||
| a,e | Holdco 2, B | South Africa | 1,472,041 | 1,124 | ||||||||||
|
| |||||||||||||
| 12,420 | ||||||||||||||
|
| |||||||||||||
Transportation 0.0%† | ||||||||||||||
| a,d | CEVA Holdings LLC | United States | 224 | 56,070 | ||||||||||
|
| |||||||||||||
Utilities 0.1% | ||||||||||||||
Vistra Energy Corp. | United States | 25,689 | 431,318 | |||||||||||
|
| |||||||||||||
Total Common Stocks and Other Equity Interests | 12,430,927 | |||||||||||||
|
| |||||||||||||
Management Investment Companies 6.3% | ||||||||||||||
Diversified Financials 6.3% | ||||||||||||||
| f | Franklin Lower Tier Floating Rate Fund | United States | 2,081,861 | 21,942,813 | ||||||||||
| f | Franklin Middle Tier Floating Rate Fund | United States | 2,024,951 | 20,330,512 | ||||||||||
|
| |||||||||||||
Total Management Investment Companies | 42,273,325 | |||||||||||||
|
| |||||||||||||
Convertible Preferred Stocks 0.0%† | ||||||||||||||
Transportation 0.0%† | ||||||||||||||
| a,d | CEVA Holdings LLC, cvt. pfd., A-1 | United States | 6 | 2,250 | ||||||||||
| a,d | CEVA Holdings LLC, cvt. pfd., A-2 | United States | 486 | 135,943 | ||||||||||
|
| |||||||||||||
Total Convertible Preferred Stocks | 138,193 | |||||||||||||
|
| |||||||||||||
| FSI-8 | Semiannual Report |
FRANKLIN TEMPLETON VARIABLE INSURANCE PRODUCTS TRUST
CONSOLIDATED STATEMENT OF INVESTMENTS (UNAUDITED)
Franklin Strategic Income VIP Fund (continued)
| Country | Principal Amount* | Value | ||||||||||||
| Convertible Bonds (Cost $1,626,587) 0.2% | ||||||||||||||
| Energy 0.2% | ||||||||||||||
CHC Group LLC/CHC Finance Ltd., cvt., zero cpn., 10/01/20 | Cayman Islands | 879,236 | $ | 1,376,004 | ||||||||||
|
| |||||||||||||
| Corporate Bonds 45.0% | ||||||||||||||
| Automobiles & Components 0.9% | ||||||||||||||
Fiat Chrysler Automobiles NV, senior note, 5.25%, 4/15/23 | United Kingdom | 2,700,000 | 2,748,965 | |||||||||||
Ford Motor Credit Co. LLC, senior note, 3.096%, 5/04/23 | United States | 1,400,000 | 1,385,090 | |||||||||||
The Goodyear Tire & Rubber Co., | ||||||||||||||
senior bond, 5.00%, 5/31/26 | United States | 1,300,000 | 1,348,750 | |||||||||||
senior note, 5.125%, 11/15/23 | United States | 700,000 | 735,000 | |||||||||||
|
| |||||||||||||
| 6,217,805 | ||||||||||||||
|
| |||||||||||||
| Banks 4.7% | ||||||||||||||
Bank of America Corp., | ||||||||||||||
senior note, 7.75%, 4/30/18 | United States | 500,000 | GBP | 687,636 | ||||||||||
senior note, 5.65%, 5/01/18 | United States | 750,000 | 773,715 | |||||||||||
senior note, 3.50%, 4/19/26 | United States | 4,800,000 | 4,825,886 | |||||||||||
CIT Group Inc., senior note, 5.00%, 8/15/22. | United States | 2,500,000 | 2,700,000 | |||||||||||
Citigroup Inc., | ||||||||||||||
senior note, 3.875%, 10/25/23 | United States | 3,000,000 | 3,134,697 | |||||||||||
senior note, 3.30%, 4/27/25 | United States | 300,000 | 300,630 | |||||||||||
senior note, 3.40%, 5/01/26 | United States | 3,100,000 | 3,072,723 | |||||||||||
sub. bond, 5.50%, 9/13/25 | United States | 500,000 | 556,988 | |||||||||||
sub. note, 4.05%, 7/30/22 | United States | 300,000 | 313,939 | |||||||||||
JPMorgan Chase & Co., | ||||||||||||||
| g | junior sub. bond, R, 6.00% to 8/01/23, FRN thereafter, Perpetual | United States | 1,500,000 | 1,618,125 | ||||||||||
| g | junior sub. bond, X, 6.10% to 10/01/24, FRN thereafter, Perpetual | United States | 500,000 | 543,125 | ||||||||||
senior bond, 3.30%, 4/01/26 | United States | 400,000 | 397,689 | |||||||||||
senior bond, 3.20%, 6/15/26 | United States | 1,500,000 | 1,484,264 | |||||||||||
senior note, 4.25%, 10/15/20 | United States | 1,000,000 | 1,062,283 | |||||||||||
sub. note, 3.375%, 5/01/23 | United States | 1,000,000 | 1,015,959 | |||||||||||
sub. note, 3.875%, 9/10/24 | United States | 1,000,000 | 1,032,796 | |||||||||||
Royal Bank of Scotland Group PLC, sub. note, 5.125%, 5/28/24 | United Kingdom | 500,000 | 525,585 | |||||||||||
Wells Fargo & Co., | ||||||||||||||
| g | junior sub. bond, S, 5.90% to 6/15/24, FRN thereafter, Perpetual | United States | 1,500,000 | 1,608,375 | ||||||||||
senior note, 2.60%, 7/22/20 | United States | 700,000 | 710,123 | |||||||||||
senior note, 3.00%, 4/22/26 | United States | 5,000,000 | 4,889,380 | |||||||||||
|
| |||||||||||||
| 31,253,918 | ||||||||||||||
|
| |||||||||||||
| Capital Goods 1.4% | ||||||||||||||
Aircastle Ltd., senior note, 4.125%, 5/01/24 | United States | 1,600,000 | 1,630,000 | |||||||||||
| h | Vertiv Group Corp., senior note, 144A, 9.25%, 10/15/24 | United States | 1,600,000 | 1,736,000 | ||||||||||
Navistar International Corp., senior bond, 8.25%, 11/01/21 | United States | 1,400,000 | 1,421,000 | |||||||||||
| h | Tennant Co., senior note, 144A, 5.625%, 5/01/25 | United States | 1,000,000 | 1,055,000 | ||||||||||
| h | Terex Corp., senior note, 144A, 5.625%, 2/01/25 | United States | 1,400,000 | 1,442,000 | ||||||||||
TransDigm Inc., | ||||||||||||||
senior sub. bond, 6.50%, 7/15/24 | United States | 500,000 | 517,500 | |||||||||||
senior sub. bond, 6.50%, 5/15/25 | United States | 200,000 | 204,000 | |||||||||||
senior sub. bond, 6.375%, 6/15/26 | United States | 900,000 | 915,750 | |||||||||||
senior sub. note, 6.00%, 7/15/22 | United States | 400,000 | 413,000 | |||||||||||
|
| |||||||||||||
| 9,334,250 | ||||||||||||||
|
| |||||||||||||
Commercial & Professional Services 0.3% | ||||||||||||||
United Rentals North America Inc., senior bond, 5.875%, 9/15/26 | United States | 1,600,000 | 1,710,000 | |||||||||||
|
| |||||||||||||
| Semiannual Report | FSI-9 |
FRANKLIN TEMPLETON VARIABLE INSURANCE PRODUCTS TRUST
CONSOLIDATED STATEMENT OF INVESTMENTS (UNAUDITED)
Franklin Strategic Income VIP Fund (continued)
| Country | Principal Amount* | Value | ||||||||||||
Corporate Bonds (continued) | ||||||||||||||
Consumer Durables & Apparel 0.8% | ||||||||||||||
| h | Hanesbrands Inc., senior bond, 144A, 4.875%, 5/15/26 | United States | 2,000,000 | $ | 2,040,000 | |||||||||
KB Home, | ||||||||||||||
senior note, 4.75%, 5/15/19 | United States | 1,000,000 | 1,035,000 | |||||||||||
senior note, 7.00%, 12/15/21 | United States | 1,200,000 | 1,356,000 | |||||||||||
Toll Brothers Finance Corp., senior bond, 5.625%, 1/15/24 | United States | 1,100,000 | 1,189,375 | |||||||||||
|
| |||||||||||||
| 5,620,375 | ||||||||||||||
|
| |||||||||||||
Consumer Services 2.0% | ||||||||||||||
| h | 1011778 BC ULC/New Red Finance Inc., | |||||||||||||
secured note, second lien, 144A, 6.00%, 4/01/22 | Canada | 2,000,000 | 2,077,500 | |||||||||||
senior secured note, first lien, 144A, 4.25%, 5/15/24 | Canada | 900,000 | 896,571 | |||||||||||
| h | International Game Technology PLC, senior secured bond, 144A, 6.50%, 2/15/25 | United States | 3,300,000 | 3,634,125 | ||||||||||
| h | KFC Holding Co./Pizza Hut Holdings LLC/Taco Bell of America LLC, | |||||||||||||
senior note, 144A, 5.00%, 6/01/24 | United States | 900,000 | 940,500 | |||||||||||
senior note, 144A, 5.25%, 6/01/26 | United States | 800,000 | 844,000 | |||||||||||
Marriott International Inc., senior bond, 3.75%, 10/01/25 | United States | 3,000,000 | 3,091,392 | |||||||||||
MGM Resorts International, senior note, 6.75%, 10/01/20 | United States | 200,000 | 222,080 | |||||||||||
| h | Wynn Las Vegas LLC/Wynn Las Vegas Capital Corp., senior bond, 144A, 5.50%, 3/01/25 | United States | 700,000 | 738,062 | ||||||||||
| h | Wynn Macau Ltd., senior note, 144A, 5.25%, 10/15/21 | Macau | 1,000,000 | 1,030,000 | ||||||||||
|
| |||||||||||||
| 13,474,230 | ||||||||||||||
|
| |||||||||||||
Diversified Financials 3.0% | ||||||||||||||
Capital One Financial Corp., senior note, 3.20%, 2/05/25 | United States | 2,000,000 | 1,961,164 | |||||||||||
The Goldman Sachs Group Inc., | ||||||||||||||
senior note, 3.50%, 1/23/25 | United States | 3,000,000 | 3,035,763 | |||||||||||
senior note, 3.75%, 2/25/26 | United States | 1,500,000 | 1,530,261 | |||||||||||
| h | Lincoln Finance Ltd., senior secured note, 144A, 6.875%, 4/15/21 | Netherlands | 600,000 | EUR | 736,340 | |||||||||
Morgan Stanley, | ||||||||||||||
senior note, 3.875%, 1/27/26 | United States | 4,200,000 | 4,328,940 | |||||||||||
sub. bond, 3.95%, 4/23/27 | United States | 1,000,000 | 1,008,426 | |||||||||||
Navient Corp., | ||||||||||||||
senior note, 6.625%, 7/26/21 | United States | 800,000 | 863,000 | |||||||||||
senior note, 7.25%, 9/25/23 | United States | 2,500,000 | 2,693,750 | |||||||||||
senior note, 6.125%, 3/25/24 | United States | 500,000 | 517,500 | |||||||||||
| h | Park Aerospace Holdings Ltd., | |||||||||||||
senior note, 144A, 5.25%, 8/15/22 | Ireland | 700,000 | 733,943 | |||||||||||
senior note, 144A, 5.50%, 2/15/24 | Ireland | 1,300,000 | 1,358,630 | |||||||||||
| h | Transurban Finance Co. Pty. Ltd., 144A, 3.375%, 3/22/27 | Australia | 1,100,000 | 1,072,180 | ||||||||||
|
| |||||||||||||
| 19,839,897 | ||||||||||||||
|
| |||||||||||||
Energy 3.9% | ||||||||||||||
Apache Corp., senior bond, 2.625%, 1/15/23 | United States | 1,900,000 | 1,856,515 | |||||||||||
| i | BreitBurn Energy Partners LP/BreitBurn Finance Corp., senior bond, 7.875%, 4/15/22 | United States | 1,200,000 | 324,000 | ||||||||||
| h | California Resources Corp., secured note, second lien, 144A, 8.00%, 12/15/22 | United States | 716,000 | 455,555 | ||||||||||
Cheniere Corpus Christi Holdings LLC, | ||||||||||||||
senior note, first lien, 7.00%, 6/30/24 | United States | 800,000 | 896,000 | |||||||||||
senior secured note, first lien, 5.875%, 3/31/25 | United States | 700,000 | 749,000 | |||||||||||
CONSOL Energy Inc., senior note, 5.875%, 4/15/22 | United States | 2,500,000 | 2,468,750 | |||||||||||
Energy Transfer Equity LP, senior note, first lien, 7.50%, 10/15/20 | United States | 1,900,000 | 2,132,750 | |||||||||||
| FSI-10 | Semiannual Report |
FRANKLIN TEMPLETON VARIABLE INSURANCE PRODUCTS TRUST
CONSOLIDATED STATEMENT OF INVESTMENTS (UNAUDITED)
Franklin Strategic Income VIP Fund (continued)
| Country | Principal Amount* | Value | ||||||||||||
Corporate Bonds (continued) | ||||||||||||||
Energy (continued) | ||||||||||||||
Energy Transfer Partners LP, senior note, 5.20%, 2/01/22 | United States | 1,000,000 | $ | 1,076,121 | ||||||||||
| h,j | EnQuest PLC, 144A, PIK, 8.00%, 10/15/23 | United Kingdom | 1,178,610 | 879,407 | ||||||||||
| h,k | Gaz Capital SA, (OJSC Gazprom), loan participation, senior note, 144A, 3.85%, 2/06/20 | Russia | 1,500,000 | 1,520,325 | ||||||||||
Kinder Morgan Inc., | ||||||||||||||
senior bond, 4.30%, 6/01/25 | United States | 2,000,000 | 2,082,922 | |||||||||||
senior note, 6.50%, 9/15/20 | United States | 1,500,000 | 1,666,959 | |||||||||||
Martin Midstream Partners LP/Martin Midstream Finance Corp., senior note, 7.25%, 2/15/21 | United States | 2,000,000 | 2,030,000 | |||||||||||
Regency Energy Partners LP/Regency Energy Finance Corp., | ||||||||||||||
senior note, 5.875%, 3/01/22 | United States | 200,000 | 220,510 | |||||||||||
senior note, 5.00%, 10/01/22 | United States | 500,000 | 536,787 | |||||||||||
Sabine Pass Liquefaction LLC, | ||||||||||||||
first lien, 5.625%, 2/01/21 | United States | 2,000,000 | 2,178,836 | |||||||||||
first lien, 5.625%, 4/15/23 | United States | 900,000 | 1,001,520 | |||||||||||
Sanchez Energy Corp., senior note, 6.125%, 1/15/23 | United States | 300,000 | 241,500 | |||||||||||
| h,j | W&T Offshore Inc., | |||||||||||||
secured note, second lien, 144A, PIK, 9.00%, 5/15/20 | United States | 459,137 | 376,031 | |||||||||||
senior secured note, third lien, 144A, PIK, 10.00%, 6/15/21 | United States | 410,888 | 290,520 | |||||||||||
Weatherford International Ltd., | ||||||||||||||
senior note, 7.75%, 6/15/21 | United States | 800,000 | 807,000 | |||||||||||
senior note, 8.25%, 6/15/23 | United States | 1,000,000 | 1,002,500 | |||||||||||
| h | Woodside Finance Ltd., senior note, 144A, 3.70%, 9/15/26 | Australia | 1,300,000 | 1,282,693 | ||||||||||
|
| |||||||||||||
| 26,076,201 | ||||||||||||||
|
| |||||||||||||
Food & Staples Retailing 0.7% | ||||||||||||||
Kroger Co., senior bond, 2.65%, 10/15/26 | United States | 1,400,000 | 1,293,893 | |||||||||||
Walgreens Boots Alliance Inc., senior note, 3.80%, 11/18/24 | United States | 3,200,000 | 3,328,979 | |||||||||||
|
| |||||||||||||
| 4,622,872 | ||||||||||||||
|
| |||||||||||||
Food, Beverage & Tobacco 1.6% | ||||||||||||||
Anheuser-Busch InBev Finance Inc., senior note, 3.30%, 2/01/23 | Belgium | 1,300,000 | 1,340,136 | |||||||||||
| h | Imperial Brands Finance PLC, senior note, 144A, 3.50%, 2/11/23 | United Kingdom | 2,100,000 | 2,152,928 | ||||||||||
| h | JBS USA LLC/Finance Inc., | |||||||||||||
senior note, 144A, 8.25%, 2/01/20 | United States | 1,500,000 | 1,507,500 | |||||||||||
senior note, 144A, 5.75%, 6/15/25 | United States | 500,000 | 472,500 | |||||||||||
Kraft Heinz Foods Co., senior bond, 3.00%, 6/01/26 | United States | 2,400,000 | 2,300,700 | |||||||||||
| h | Lamb Weston Holdings Inc., | |||||||||||||
senior note, 144A, 4.625%, 11/01/24 | United States | 600,000 | 621,000 | |||||||||||
senior note, 144A, 4.875%, 11/01/26 | United States | 1,400,000 | 1,457,750 | |||||||||||
| h | Post Holdings Inc., | |||||||||||||
senior note, 144A, 6.00%, 12/15/22 | United States | 500,000 | 531,875 | |||||||||||
senior note, 144A, 5.50%, 3/01/25 | United States | 500,000 | 516,875 | |||||||||||
|
| |||||||||||||
| 10,901,264 | ||||||||||||||
|
| |||||||||||||
Health Care Equipment & Services 1.6% | ||||||||||||||
CHS/Community Health Systems Inc., | ||||||||||||||
senior note, 6.875%, 2/01/22 | United States | 400,000 | 351,000 | |||||||||||
senior secured note, first lien, 6.25%, 3/31/23 | United States | 500,000 | 518,050 | |||||||||||
DaVita Inc., | ||||||||||||||
senior bond, 5.125%, 7/15/24 | United States | 500,000 | 508,438 | |||||||||||
senior bond, 5.00%, 5/01/25 | United States | 900,000 | 904,500 | |||||||||||
senior note, 5.75%, 8/15/22 | United States | 1,500,000 | 1,543,125 | |||||||||||
| Semiannual Report | FSI-11 |
FRANKLIN TEMPLETON VARIABLE INSURANCE PRODUCTS TRUST
CONSOLIDATED STATEMENT OF INVESTMENTS (UNAUDITED)
Franklin Strategic Income VIP Fund (continued)
| Country | Principal Amount* | Value | ||||||||||||
Corporate Bonds (continued) | ||||||||||||||
| Health Care Equipment & Services (continued) | ||||||||||||||
HCA Inc., | ||||||||||||||
senior bond, 5.875%, 5/01/23 | United States | 1,500,000 | $ | 1,636,875 | ||||||||||
senior secured bond, first lien, 5.875%, 3/15/22 | United States | 450,000 | 500,063 | |||||||||||
senior secured bond, first lien, 5.25%, 4/15/25 | United States | 600,000 | 646,500 | |||||||||||
senior secured bond, first lien, 5.50%, 6/15/47 | United States | 1,200,000 | 1,245,000 | |||||||||||
| h | MPH Acquisition Holdings LLC, senior note, 144A, 7.125%, 6/01/24 | United States | 900,000 | 961,875 | ||||||||||
Stryker Corp., senior bond, 3.50%, 3/15/26 | United States | 500,000 | 513,075 | |||||||||||
Tenet Healthcare Corp., | ||||||||||||||
senior note, 5.50%, 3/01/19 | United States | 300,000 | 312,000 | |||||||||||
senior note, 8.125%, 4/01/22 | United States | 1,000,000 | 1,065,000 | |||||||||||
|
| |||||||||||||
| 10,705,501 | ||||||||||||||
|
| |||||||||||||
| Household & Personal Products 0.3% | ||||||||||||||
The Procter & Gamble Co., senior note, 2.45%, 11/03/26 | United States | 1,800,000 | 1,761,383 | |||||||||||
|
| |||||||||||||
| Insurance 1.1% | ||||||||||||||
MetLife Inc., | ||||||||||||||
senior note, 3.60%, 4/10/24 | United States | 2,400,000 | 2,524,342 | |||||||||||
senior note, 3.00%, 3/01/25 | United States | 300,000 | 301,226 | |||||||||||
| h | Nippon Life Insurance Co., sub. bond, 144A, 5.10% to 10/16/24, FRN thereafter, 10/16/44 | Japan | 3,500,000 | 3,741,570 | ||||||||||
Prudential Financial Inc., 3.50%, 5/15/24 | United States | 800,000 | 834,198 | |||||||||||
|
| |||||||||||||
| 7,401,336 | ||||||||||||||
|
| |||||||||||||
| Materials 5.7% | ||||||||||||||
ArcelorMittal, | ||||||||||||||
senior note, 6.00%, 3/01/21 | France | 1,800,000 | 1,948,005 | |||||||||||
senior note, 6.125%, 6/01/25 | France | 300,000 | 337,500 | |||||||||||
| h | Ardagh Packaging Finance PLC/Ardagh MP Holdings USA Inc., | |||||||||||||
senior note, 144A, 6.00%, 6/30/21 | Luxembourg | 1,300,000 | 1,343,062 | |||||||||||
senior note, 144A, 6.00%, 2/15/25 | Luxembourg | 400,000 | 421,000 | |||||||||||
| h | BWAY Holding Co., senior note, 144A, 7.25%, 4/15/25 | United States | 2,200,000 | 2,238,500 | ||||||||||
| h | Cemex Finance LLC, senior secured note, first lien, 144A, 6.00%, 4/01/24 | Mexico | 1,000,000 | 1,064,290 | ||||||||||
| h | Cemex SAB de CV, senior secured bond, first lien, 144A, 5.70%, 1/11/25 . | Mexico | 1,500,000 | 1,599,390 | ||||||||||
| h | Ceramtec Group GmbH, senior note, 144A, 8.25%, 8/15/21 | Germany | 1,200,000 | EUR | 1,442,936 | |||||||||
The Chemours Co., senior note, 6.625%, 5/15/23 | United States | 2,000,000 | 2,125,000 | |||||||||||
| h | First Quantum Minerals Ltd., | |||||||||||||
senior note, 144A, 7.00%, 2/15/21 | Zambia | 625,000 | 643,750 | |||||||||||
senior note, 144A, 7.25%, 4/01/23 | Zambia | 800,000 | 788,000 | |||||||||||
| h | FMG Resources (August 2006) Pty. Ltd., senior note, 144A, 5.125%, 5/15/24 | Australia | 800,000 | 802,000 | ||||||||||
Freeport-McMoRan Inc., senior note, 4.55%, 11/14/24 | United States | 2,500,000 | 2,368,750 | |||||||||||
| h | Glencore Finance Canada Ltd., senior bond, 144A, 4.95%, 11/15/21 | Switzerland | 1,000,000 | 1,070,550 | ||||||||||
| h | Glencore Funding LLC, | |||||||||||||
senior note, 144A, 4.125%, 5/30/23 | Switzerland | 600,000 | 616,457 | |||||||||||
senior note, 144A, 4.625%, 4/29/24 | Switzerland | 250,000 | 261,713 | |||||||||||
| h | INVISTA Finance LLC, senior secured note, 144A, 4.25%, 10/15/19 | United States | 3,000,000 | 3,105,600 | ||||||||||
LYB International Finance BV, senior note, 4.00%, 7/15/23 | United States | 2,100,000 | 2,230,326 | |||||||||||
| h | New Gold Inc., senior note, 144A, 6.375%, 5/15/25 | Canada | 700,000 | 722,750 | ||||||||||
| h | Novelis Corp., senior bond, 144A, 5.875%, 9/30/26 | United States | 2,000,000 | 2,065,000 | ||||||||||
| FSI-12 | Semiannual Report |
FRANKLIN TEMPLETON VARIABLE INSURANCE PRODUCTS TRUST
CONSOLIDATED STATEMENT OF INVESTMENTS (UNAUDITED)
Franklin Strategic Income VIP Fund (continued)
| Country | Principal Amount* | Value | ||||||||||||
| Corporate Bonds (continued) | ||||||||||||||
| Materials (continued) | ||||||||||||||
| h | Owens-Brockway Glass Container Inc., | |||||||||||||
senior note, 144A, 5.00%, 1/15/22 | United States | 1,400,000 | $ | 1,485,750 | ||||||||||
senior note, 144A, 5.875%, 8/15/23 | United States | 700,000 | 773,062 | |||||||||||
Reynolds Group Issuer Inc./Reynolds Group Issuer LLC/Reynolds Group Issuer Luxembourg SA, | ||||||||||||||
first lien, 5.75%, 10/15/20 | United States | 700,000 | 717,213 | |||||||||||
| h | first lien, 144A, 5.125%, 7/15/23. | United States | 700,000 | 728,000 | ||||||||||
| h | senior note, 144A, 7.00%, 7/15/24 | United States | 500,000 | 537,295 | ||||||||||
| h | Sealed Air Corp., | |||||||||||||
senior bond, 144A, 5.125%, 12/01/24 | United States | 1,000,000 | 1,077,500 | |||||||||||
senior bond, 144A, 5.50%, 9/15/25 | United States | 400,000 | 438,000 | |||||||||||
senior note, 144A, 4.875%, 12/01/22 | United States | 1,000,000 | 1,068,750 | |||||||||||
Steel Dynamics Inc., | ||||||||||||||
senior bond, 5.50%, 10/01/24 | United States | 1,000,000 | 1,065,000 | |||||||||||
senior note, 5.125%, 10/01/21 | United States | 1,000,000 | 1,029,480 | |||||||||||
| h | SunCoke Energy Partners LP/SunCoke Energy Partners Finance Corp., senior note, 144A, 7.50%, 6/15/25. | United States | 900,000 | 893,250 | ||||||||||
| h | Valvoline Inc., senior note, 144A, 5.50%, 7/15/24 | United States | 700,000 | 742,000 | ||||||||||
|
| |||||||||||||
| 37,749,879 | ||||||||||||||
|
| |||||||||||||
| Media 5.0% | ||||||||||||||
21st Century Fox America Inc., senior note, 3.00%, 9/15/22 | United States | 500,000 | 507,830 | |||||||||||
| h | Altice U.S. Finance I Corp., senior secured bond, 144A, 5.50%, 5/15/26 | United States | 1,700,000 | 1,789,250 | ||||||||||
AMC Networks Inc., senior note, 5.00%, 4/01/24 | United States | 2,000,000 | 2,052,500 | |||||||||||
CCO Holdings LLC/CCO Holdings Capital Corp., | ||||||||||||||
senior bond, 5.25%, 9/30/22 | United States | 2,000,000 | 2,063,800 | |||||||||||
| h | senior bond, 144A, 5.375%, 5/01/25 | United States | 900,000 | 960,750 | ||||||||||
Clear Channel Worldwide Holdings Inc., | ||||||||||||||
senior note, 6.50%, 11/15/22 | United States | 1,000,000 | 1,032,700 | |||||||||||
senior sub. note, 7.625%, 3/15/20 | United States | 200,000 | 198,000 | |||||||||||
senior sub. note, 7.625%, 3/15/20 | United States | 500,000 | 499,375 | |||||||||||
CSC Holdings LLC, senior note, 6.75%, 11/15/21 | United States | 2,000,000 | 2,220,000 | |||||||||||
DISH DBS Corp., | ||||||||||||||
senior note, 6.75%, 6/01/21 | United States | 500,000 | 556,250 | |||||||||||
senior note, 5.875%, 7/15/22 | United States | 500,000 | 538,750 | |||||||||||
senior note, 5.875%, 11/15/24 | United States | 500,000 | 535,360 | |||||||||||
iHeartCommunications Inc., | ||||||||||||||
senior secured bond, first lien, 9.00%, 3/01/21 | United States | 1,000,000 | 753,750 | |||||||||||
senior secured note, first lien, 9.00%, 9/15/22 | United States | 700,000 | 520,625 | |||||||||||
| h | Nexstar Broadcasting Inc., senior note, 144A, 5.625%, 8/01/24 | United States | 1,600,000 | 1,624,000 | ||||||||||
| h | Sirius XM Radio Inc., | |||||||||||||
senior bond, 144A, 6.00%, 7/15/24 | United States | 1,700,000 | 1,810,500 | |||||||||||
senior bond, 144A, 5.375%, 4/15/25 | United States | 800,000 | 829,000 | |||||||||||
Tegna Inc., | ||||||||||||||
senior bond, 6.375%, 10/15/23 | United States | 1,000,000 | 1,058,750 | |||||||||||
| h | senior bond, 144A, 5.50%, 9/15/24 | United States | 300,000 | 310,125 | ||||||||||
senior note, 5.125%, 7/15/20 | United States | 1,000,000 | 1,026,250 | |||||||||||
Time Warner Cable LLC, senior note, 4.00%, 9/01/21 | United States | 1,300,000 | 1,360,001 | |||||||||||
Time Warner Inc., senior bond, 2.95%, 7/15/26 | United States | 2,500,000 | 2,363,367 | |||||||||||
| h | Unitymedia Hessen GmbH & Co. KG/Unitymedia NRW GmbH, senior secured note, first lien, 144A, 5.625%, 4/15/23 | Germany | 560,000 | EUR | 678,056 | |||||||||
| h | Unitymedia KabelBW GmbH, senior bond, 144A, 6.125%, 1/15/25 | Germany | 1,700,000 | 1,831,750 | ||||||||||
| Semiannual Report | FSI-13 |
FRANKLIN TEMPLETON VARIABLE INSURANCE PRODUCTS TRUST
CONSOLIDATED STATEMENT OF INVESTMENTS (UNAUDITED)
Franklin Strategic Income VIP Fund (continued)
| Country | Principal Amount* | Value | ||||||||||||
| Corporate Bonds (continued) | ||||||||||||||
Media (continued) | ||||||||||||||
| h | Univision Communications Inc., senior secured note, first lien, 144A, 5.125%, 2/15/25 | United States | 2,500,000 | $ | 2,484,375 | |||||||||
| h | Virgin Media Finance PLC, senior bond, 144A, 6.375%, 10/15/24 | United Kingdom | 900,000 | GBP | 1,265,885 | |||||||||
| h | Virgin Media Secured Finance PLC, senior secured bond, first lien, 144A, 5.50%, 1/15/25 | United Kingdom | 1,900,000 | 1,980,750 | ||||||||||
| h | Ziggo Secured Finance BV, senior secured bond, 144A, 4.25%, 1/15/27 | Netherlands | 700,000 | EUR | 848,377 | |||||||||
|
| |||||||||||||
| 33,700,126 | ||||||||||||||
|
| |||||||||||||
Pharmaceuticals, Biotechnology & Life Sciences 1.7% | ||||||||||||||
Actavis Funding SCS, senior bond, 3.80%, 3/15/25 | United States | 2,200,000 | 2,279,446 | |||||||||||
Baxalta Inc., senior note, 4.00%, 6/23/25 | United States | 2,500,000 | 2,612,088 | |||||||||||
Biogen Inc., senior note, 3.625%, 9/15/22 | United States | 1,500,000 | 1,570,458 | |||||||||||
| h,j | Eagle Holdings Co. II LLC, senior note, 144A, PIK, 7.625%, 5/15/22 | United States | 200,000 | 206,250 | ||||||||||
| h | Endo Dac/Endo Finance LLC/Endo Finco Inc., senior bond, 144A, 6.00%, 2/01/25 | |||||||||||||
senior bond, 144A, 6.00%, 2/01/25 | United States | 1,200,000 | 984,000 | |||||||||||
senior note, 144A, 6.00%, 7/15/23 | United States | 400,000 | 338,200 | |||||||||||
| h | Jaguar Holding Co. II/Pharmaceutical Product Development LLC, senior note, 144A, 6.375%, 8/01/23 | United States | 1,200,000 | 1,267,500 | ||||||||||
| h | Valeant Pharmaceuticals International, senior note, 144A, 6.375%, 10/15/20 | United States | 1,100,000 | 1,071,125 | ||||||||||
| h | Valeant Pharmaceuticals International Inc., | |||||||||||||
senior bond, 144A, 6.125%, 4/15/25 | United States | 300,000 | 255,000 | |||||||||||
senior note, 144A, 5.50%, 3/01/23 | United States | 400,000 | 341,496 | |||||||||||
senior note, 144A, 7.00%, 3/15/24 | United States | 200,000 | 210,750 | |||||||||||
|
| |||||||||||||
| 11,136,313 | ||||||||||||||
|
| |||||||||||||
Real Estate 0.9% | ||||||||||||||
American Tower Corp., senior bond, 3.375%, 10/15/26 | United States | 2,400,000 | 2,353,018 | |||||||||||
Equinix Inc., senior bond, 5.375%, 4/01/23 | United States | 2,500,000 | 2,609,375 | |||||||||||
MPT Operating Partnership LP/MPT Finance Corp., senior bond, 5.25%, 8/01/26 | United States | 800,000 | 833,320 | |||||||||||
|
| |||||||||||||
| 5,795,713 | ||||||||||||||
|
| |||||||||||||
Retailing 0.6% | ||||||||||||||
Home Depot Inc., senior note, 2.125%, 9/15/26 | United States | 1,500,000 | 1,404,174 | |||||||||||
| h,j | K2016470219 South Africa Ltd., senior secured note, 144A, PIK, 3.00%, 12/31/22 | South Africa | 1,104,601 | 49,707 | ||||||||||
| h,j | K2016740260 South Africa Ltd., senior secured note, 144A, PIK, 25.00%, 12/31/22 | South Africa | 173,896 | 161,723 | ||||||||||
Netflix Inc., senior bond, 5.875%, 2/15/25 | United States | 2,300,000 | 2,553,000 | |||||||||||
|
| |||||||||||||
| 4,168,604 | ||||||||||||||
|
| |||||||||||||
Semiconductors & Semiconductor Equipment 0.2% | ||||||||||||||
Qorvo Inc., senior bond, 7.00%, 12/01/25 | United States | 1,400,000 | 1,596,000 | |||||||||||
|
| |||||||||||||
Software & Services 1.1% | ||||||||||||||
| h | BMC Software Finance Inc., senior note, 144A, 8.125%, 7/15/21 | United States | 1,900,000 | 1,976,608 | ||||||||||
| h | First Data Corp., | |||||||||||||
secured note, second lien, 144A, 5.75%, 1/15/24 | United States | 2,100,000 | 2,189,250 | |||||||||||
senior note, 144A, 7.00%, 12/01/23 | United States | 700,000 | 749,000 | |||||||||||
Fiserv Inc., senior bond, 3.85%, 6/01/25 | United States | 600,000 | 624,368 | |||||||||||
Infor (U.S.) Inc., senior note, 6.50%, 5/15/22 | United States | 1,000,000 | 1,040,000 | |||||||||||
| h | Symantec Corp., senior note, 144A, 5.00%, 4/15/25 | United States | 500,000 | 524,530 | ||||||||||
|
| |||||||||||||
| 7,103,756 | ||||||||||||||
|
| |||||||||||||
| FSI-14 | Semiannual Report |
FRANKLIN TEMPLETON VARIABLE INSURANCE PRODUCTS TRUST
CONSOLIDATED STATEMENT OF INVESTMENTS (UNAUDITED)
Franklin Strategic Income VIP Fund (continued)
| Country | Principal Amount* | Value | ||||||||||||
| Corporate Bonds (continued) | ||||||||||||||
Technology Hardware & Equipment 0.6% | ||||||||||||||
| h | CommScope Technologies LLC, | |||||||||||||
senior bond, 144A, 6.00%, 6/15/25 | United States | 1,400,000 | $ | 1,501,500 | ||||||||||
senior bond, 144A, 5.00%, 3/15/27 | United States | 1,700,000 | 1,700,000 | |||||||||||
| h | Diamond 1 Finance Corp./Diamond 2 Finance Corp., | |||||||||||||
senior note, 144A, 5.875%, 6/15/21 | United States | 300,000 | 315,000 | |||||||||||
senior note, 144A, 7.125%, 6/15/24 | United States | 200,000 | 219,956 | |||||||||||
|
| |||||||||||||
| 3,736,456 | ||||||||||||||
|
| |||||||||||||
Telecommunication Services 3.3% | ||||||||||||||
AT&T Inc., senior bond, 3.40%, 5/15/25 | United States | 1,900,000 | 1,871,234 | |||||||||||
CenturyLink Inc., | ||||||||||||||
senior bond, 6.75%, 12/01/23 | United States | 500,000 | 540,315 | |||||||||||
senior bond, 5.625%, 4/01/25 | United States | 300,000 | 300,624 | |||||||||||
| h | Digicel Group Ltd., senior note, 144A, 8.25%, 9/30/20 | Bermuda | 1,200,000 | 1,125,978 | ||||||||||
| h | Digicel Ltd., senior note, 144A, 6.00%, 4/15/21 | Bermuda | 1,000,000 | 961,290 | ||||||||||
Hughes Satellite Systems Corp., senior bond, 6.625%, 8/01/26 | United States | 1,600,000 | 1,724,000 | |||||||||||
Intelsat Jackson Holdings SA, | ||||||||||||||
senior note, 7.25%, 10/15/20 | Luxembourg | 1,000,000 | 950,000 | |||||||||||
senior note, 7.50%, 4/01/21 | Luxembourg | 500,000 | 463,750 | |||||||||||
| h | Millicom International Cellular SA, senior note, 144A, 6.625%, 10/15/21 | Colombia | 2,200,000 | 2,292,356 | ||||||||||
Sprint Communications Inc., | ||||||||||||||
senior note, 6.00%, 11/15/22 | United States | 500,000 | 531,250 | |||||||||||
| h | senior note, 144A, 9.00%, 11/15/18 | United States | 148,000 | 160,811 | ||||||||||
| h | senior note, 144A, 7.00%, 3/01/20 | United States | 800,000 | 880,000 | ||||||||||
Sprint Corp., senior bond, 7.875%, 9/15/23 | United States | 500,000 | 576,250 | |||||||||||
| h | Sprint Spectrum Co. LLC/Sprint Spectrum Co. II LLC, first lien, 144A, 3.36%, 3/20/23 | United States | 1,800,000 | 1,815,873 | ||||||||||
T-Mobile USA Inc., | ||||||||||||||
senior bond, 6.50%, 1/15/24 | United States | 500,000 | 538,750 | |||||||||||
senior bond, 6.375%, 3/01/25 | United States | 1,300,000 | 1,408,875 | |||||||||||
senior note, 6.125%, 1/15/22 | United States | 200,000 | 210,687 | |||||||||||
senior note, 6.00%, 4/15/24 | United States | 200,000 | 214,500 | |||||||||||
Verizon Communications Inc., senior note, 5.15%, 9/15/23 | United States | 2,000,000 | 2,224,246 | |||||||||||
| h | Wind Acquisition Finance SA, | |||||||||||||
senior secured note, 144A, 4.00%, 7/15/20 | Italy | 1,200,000 | EUR | 1,387,292 | ||||||||||
senior secured note, 144A, 7.00%, 4/23/21 | Italy | 1,500,000 | EUR | 1,786,862 | ||||||||||
|
| |||||||||||||
| 21,964,943 | ||||||||||||||
|
| |||||||||||||
Transportation 0.7% | ||||||||||||||
FedEx Corp., senior bond, 3.25%, 4/01/26 | United States | 2,500,000 | 2,526,375 | |||||||||||
| h | Florida East Coast Holdings Corp., | |||||||||||||
secured note, first lien, 144A, 6.75%, 5/01/19 | United States | 900,000 | 923,423 | |||||||||||
senior note, 144A, 9.75%, 5/01/20 | United States | 400,000 | 429,750 | |||||||||||
United Airlines Pass Through Trust, second lien, 2016-1, A, 3.45%, 1/07/30 | United States | 1,000,000 | 1,011,250 | |||||||||||
|
| |||||||||||||
| 4,890,798 | ||||||||||||||
|
| |||||||||||||
Utilities 2.9% | ||||||||||||||
Calpine Corp., | ||||||||||||||
senior bond, 5.75%, 1/15/25 | United States | 1,200,000 | 1,129,500 | |||||||||||
senior note, 5.375%, 1/15/23 | United States | 1,300,000 | 1,272,375 | |||||||||||
Dominion Energy Inc., senior bond, 2.85%, 8/15/26 | United States | 1,100,000 | 1,050,742 | |||||||||||
| h | Dynegy Inc., senior note, 144A, 8.00%, 1/15/25 | United States | 2,000,000 | 1,950,000 | ||||||||||
| Semiannual Report | FSI-15 |
FRANKLIN TEMPLETON VARIABLE INSURANCE PRODUCTS TRUST
CONSOLIDATED STATEMENT OF INVESTMENTS (UNAUDITED)
Franklin Strategic Income VIP Fund (continued)
| Country | Principal Amount* | Value | ||||||||||||
| Corporate Bonds (continued) | ||||||||||||||
| Utilities (continued) | ||||||||||||||
| g,h | EDF SA, sub. note, 144A, 5.25% to 1/29/23, FRN thereafter, Perpetual | France | 3,000,000 | $ | 3,080,505 | |||||||||
Exelon Corp., senior bond, 3.95%, 6/15/25 | United States | 1,800,000 | 1,865,961 | |||||||||||
| h | InterGen NV, secured bond, 144A, 7.00%, 6/30/23 | Netherlands | 2,500,000 | 2,418,750 | ||||||||||
Sempra Energy, | ||||||||||||||
senior bond, 3.55%, 6/15/24 | United States | 700,000 | 718,042 | |||||||||||
senior note, 3.75%, 11/15/25 | United States | 1,100,000 | 1,135,333 | |||||||||||
The Southern Co., senior bond, 3.25%, 7/01/26 | United States | 3,600,000 | 3,528,900 | |||||||||||
| h | Talen Energy Supply LLC, senior note, 144A, 9.50%, 7/15/22 | United States | 1,400,000 | 1,211,000 | ||||||||||
|
| |||||||||||||
| 19,361,108 | ||||||||||||||
|
| |||||||||||||
Total Corporate Bonds (Cost $296,729,917) | 300,122,728 | |||||||||||||
|
| |||||||||||||
| l,m | Senior Floating Rate Interests 10.0% | |||||||||||||
Automobiles & Components 0.4% | ||||||||||||||
The Goodyear Tire & Rubber Co., Second Lien Term Loan, 3.12%, 4/30/19 | United States | 158,771 | 160,193 | |||||||||||
TI Group Automotive Systems LLC, Initial US Term Loan, 3.976%, 6/30/22 | United States | 2,245,142 | 2,247,948 | |||||||||||
|
| |||||||||||||
| 2,408,141 | ||||||||||||||
|
| |||||||||||||
Capital Goods 0.2% | ||||||||||||||
Allison Transmission Inc., Term Loans, 3.22%, 9/23/22 | United States | 853,436 | 859,545 | |||||||||||
Doncasters U.S. Finance LLC, Second Lien Term Loan, 9.546%, 10/09/20 | United States | 76,701 | 73,441 | |||||||||||
Harsco Corp., Initial Term Loan, 6.25%, 11/02/23 | United States | 232,588 | 236,949 | |||||||||||
Leidos (Abacus Innovations Corp.), B Term Loan, 3.50%, 8/16/23 | United States | 160,958 | 162,347 | |||||||||||
|
| |||||||||||||
| 1,332,282 | ||||||||||||||
|
| |||||||||||||
Commercial & Professional Services 0.1% | ||||||||||||||
KAR Auction Services Inc., Term Loan B, 3.813%, 3/09/23 | United States | 693,048 | 698,246 | |||||||||||
Ventia Pty. Ltd., Term B Loans (USD), 4.796%, 5/21/22 | Australia | 83,512 | 84,451 | |||||||||||
|
| |||||||||||||
| 782,697 | ||||||||||||||
|
| |||||||||||||
Consumer Services 0.7% | ||||||||||||||
Aristocrat Technologies Inc., Tranche B-2 Loans, 3.406%, 10/20/21 | United States | 166,886 | 167,804 | |||||||||||
Avis Budget Car Rental LLC, Tranche B Term Loan, 3.30%, 3/15/22 | United States | 733,118 | 731,468 | |||||||||||
| n | Caesars Entertainment Operating Co. LLC, Term B Loans, 5.63%, 8/31/24 | United States | 141,555 | 141,289 | ||||||||||
Eldorado Resorts Inc., Initial Term Loan, 3.375%, 4/17/24 | United States | 521,702 | 518,686 | |||||||||||
Fitness International LLC, Term A Loan, 4.476%, 4/01/20 | United States | 2,789,554 | 2,792,171 | |||||||||||
Greektown Holdings LLC, Initial Term Loan, 4.226%, 4/25/24 | United States | 282,692 | 283,090 | |||||||||||
| n | NVA Holdings Inc., Second Lien Term Loan, 10.13%, 8/14/22 | United States | 53,412 | 54,013 | ||||||||||
|
| |||||||||||||
| 4,688,521 | ||||||||||||||
|
| |||||||||||||
Diversified Financials 0.1% | ||||||||||||||
Russell Investments US Institutional Holdco Inc., Initial Term Loan, 6.976%, 6/01/23 | United States | 330,823 | 334,752 | |||||||||||
|
| |||||||||||||
Energy 1.6% | ||||||||||||||
Bowie Resource Holdings LLC, | ||||||||||||||
First Lien Initial Term Loan, 6.976%, 8/14/20 | United States | 2,592,029 | 2,509,947 | |||||||||||
Second Lien Initial Term Loan, 11.976%, 2/16/21 | United States | 1,248,332 | 1,165,630 | |||||||||||
| FSI-16 | Semiannual Report |
FRANKLIN TEMPLETON VARIABLE INSURANCE PRODUCTS TRUST
CONSOLIDATED STATEMENT OF INVESTMENTS (UNAUDITED)
Franklin Strategic Income VIP Fund (continued)
| Country | Principal Amount* | Value | ||||||||||||
| l,m | Senior Floating Rate Interests (continued) | |||||||||||||
Energy (continued) | ||||||||||||||
| n | Fieldwood Energy LLC, Loans, 4.171%, 10/01/18 | United States | 4,096,974 | $ | 3,950,167 | |||||||||
| n | Foresight Energy LLC, Term Loans, 8.88%, 3/28/22 | United States | 1,243,347 | 1,192,318 | ||||||||||
| n | International Seaways Inc., Initial Term Loans, 8.63%, 6/22/22 | United States | 850,000 | 841,500 | ||||||||||
OSG Bulk Ships Inc., Initial Term Loan, 5.43%, 8/05/19 | United States | 990,092 | 940,587 | |||||||||||
UTEX Industries Inc., First Lien Initial Term Loan, 5.226%, 5/21/21 | United States | 189,437 | 170,335 | |||||||||||
|
| |||||||||||||
| 10,770,484 | ||||||||||||||
|
| |||||||||||||
| Food & Staples Retailing 0.3% | ||||||||||||||
Aramark Corp., U.S. Term A Loan, 2.976%, 3/28/22 | United States | 602,475 | 604,546 | |||||||||||
Smart and Final LLC, First Lien Term Loan, 4.726%–4.796%, 11/15/22 | United States | 1,157,580 | 1,120,923 | |||||||||||
|
| |||||||||||||
| 1,725,469 | ||||||||||||||
|
| |||||||||||||
| Food, Beverage & Tobacco 0.3% | ||||||||||||||
JBS USA LUX SA, New Initial Term Loans, 5.75%, 10/30/22 | Brazil | 1,739,470 | 1,697,886 | |||||||||||
|
| |||||||||||||
| Health Care Equipment & Services 0.1% | ||||||||||||||
U.S. Renal Care Inc., Intial Term Loan, 5.546%, 12/31/22 | United States | 890,198 | 866,831 | |||||||||||
|
| |||||||||||||
| Household & Personal Products 0.1% | ||||||||||||||
Spectrum Brands Inc., USD Term Loans, 3.172%–3.179%, 6/23/22 | United States | 952,841 | 957,367 | |||||||||||
|
| |||||||||||||
| Materials 0.8% | ||||||||||||||
Chemours Co., Tranche B-1 US Term Loans, 3.57%, 5/12/22 | United States | 2,704,206 | 2,717,727 | |||||||||||
Cyanco Intermediate Corp., Initial Term Loan, 5.726%, 5/01/20 | United States | 758,509 | 762,934 | |||||||||||
Huntsman International LLC, 2015 Extended Term B Dollar Loan, | United States | 100,667 | 101,150 | |||||||||||
OCI Beaumont LLC, Term B-3 Loan, 7.929%, 8/20/19 | United States | 929,240 | 940,855 | |||||||||||
Oxbow Carbon LLC, | ||||||||||||||
Tranche A-1 Term Loan, 3.976%, 10/21/19 | United States | 465,454 | 466,036 | |||||||||||
Tranche B Term Loan, 4.726%, 1/19/20 | United States | 565,610 | 570,559 | |||||||||||
|
| |||||||||||||
| 5,559,261 | ||||||||||||||
|
| |||||||||||||
| Media 0.7% | ||||||||||||||
Altice U.S. Finance I Corp., March 2017 Refinancing TL Commitments, 3.466%, 7/28/25 | United States | 200,109 | 200,258 | |||||||||||
AMC Entertainment Holdings Inc., | ||||||||||||||
2016 Incremental Term Loans, 3.466%, 12/15/23 | United States | 77,724 | 77,967 | |||||||||||
Initial Term Loans, 3.459%, 12/15/22 | United States | 121,283 | 121,775 | |||||||||||
Charter Communications Operating LLC (CCO Safari), Term Loan A-1, | United States | 956,250 | 958,214 | |||||||||||
CSC Holdings LLC (Cablevision), March 2017 Incremental Term Loans, 3.459%, 7/17/25 | United States | 1,234,200 | 1,232,272 | |||||||||||
Gray Television Inc., Term B-2 Loan, 3.551%, 2/07/24 | United States | 904,545 | 911,556 | |||||||||||
Lions Gate Entertainment Corp., Term A Loan, 3.226%, 12/08/21 | United States | 528,252 | 530,068 | |||||||||||
Live Nation Entertainment Inc., Term B-2 Loans, 3.313%, 10/31/23 | United States | 77,529 | 77,698 | |||||||||||
UPC Financing Partnership (UPC Broadband Holdings BV), Facility AP, 3.909%, 4/15/25 | United States | 303,920 | 304,642 | |||||||||||
|
| |||||||||||||
| 4,414,450 | ||||||||||||||
|
| |||||||||||||
| Pharmaceuticals, Biotechnology & Life Sciences 0.9% | ||||||||||||||
Endo Luxembourg Finance Co. I S.A.R.L. and Endo LLC, Initial Term | ||||||||||||||
Loans, 5.50%, 4/27/24 | United States | 2,260,321 | 2,282,041 | |||||||||||
Grifols Worldwide Operations USA Inc., Tranche B Term Loan, 3.436%, 1/31/25 | United States | 2,353,127 | 2,359,603 | |||||||||||
RPI Finance Trust, Term A-3 Loan, 3.046%, 10/14/21 | United States | 363,782 | 364,236 | |||||||||||
| Semiannual Report | FSI-17 |
FRANKLIN TEMPLETON VARIABLE INSURANCE PRODUCTS TRUST
CONSOLIDATED STATEMENT OF INVESTMENTS (UNAUDITED)
Franklin Strategic Income VIP Fund (continued)
| Country | Principal Amount* | Value | ||||||||||||
| l,m | Senior Floating Rate Interests (continued) | |||||||||||||
Pharmaceuticals, Biotechnology & Life Sciences (continued) | ||||||||||||||
Valeant Pharmaceuticals International Inc., Series F Tranche B Term Loan, 5.83%, 4/01/22 | United States | 1,277,144 | $ | 1,295,858 | ||||||||||
|
| |||||||||||||
| 6,301,738 | ||||||||||||||
|
| |||||||||||||
Retailing 0.8% | ||||||||||||||
Ascena Retail Group Inc., Tranche B Term Loan, 5.625%, 8/21/22 | United States | 3,436,848 | 2,927,050 | |||||||||||
Dollar Tree Inc., Term A-1 Loans, 2.938%, 7/06/20 | United States | 536,903 | 535,722 | |||||||||||
| n | PetSmart Inc., Tranche B-2 Loans, 4.22%, 3/11/22 | United States | 1,940,396 | 1,806,842 | ||||||||||
|
| |||||||||||||
| 5,269,614 | ||||||||||||||
|
| |||||||||||||
Semiconductors & Semiconductor Equipment 0.3% | ||||||||||||||
MKS Instruments Inc., Tranche B-2 Term Loans, 3.976%, 5/01/23 | United States | 431,948 | 434,648 | |||||||||||
ON Semiconductor Corp., 2017 Replacement Term Loans, 3.476%, 3/31/23 | United States | 1,813,150 | 1,818,251 | |||||||||||
|
| |||||||||||||
| 2,252,899 | ||||||||||||||
|
| |||||||||||||
Software & Services 0.5% | ||||||||||||||
Global Payments Inc., Term A-2 Loan, 2.939%, 5/02/22 | United States | 627,658 | 627,658 | |||||||||||
MoneyGram International Inc., Term Loan, 4.546%, 3/27/20 | United States | 2,241,590 | 2,243,457 | |||||||||||
Rackspace Hosting Inc., 2017 Term Loans, 4.172%, 11/03/23 | United States | 388,621 | 390,038 | |||||||||||
|
| |||||||||||||
| 3,261,153 | ||||||||||||||
|
| |||||||||||||
Technology Hardware & Equipment 0.4% | ||||||||||||||
Ciena Corp., Refinancing Term Loan, 3.712%, 1/28/22 | United States | 182,233 | 183,144 | |||||||||||
CommScope Inc., Tranche 5 Term Loans, 3.296%, 12/29/22 | United States | 148,379 | 149,214 | |||||||||||
Dell International LLC, Term A-3 Loan, 3.23%, 12/31/18 | United States | 971,147 | 973,676 | |||||||||||
Western Digital Corp., US Term B-2 Loan, 3.976%, 4/29/23 | United States | 943,956 | 951,109 | |||||||||||
Zebra Technologies Corp., Second Amendment Refinancing Term Loan, 3.723%, 10/27/21 | United States | 281,739 | 283,325 | |||||||||||
|
| |||||||||||||
| 2,540,468 | ||||||||||||||
|
| |||||||||||||
Telecommunication Services 0.1% | ||||||||||||||
Consolidated Communications Inc., Initial Term Loan, 4.23%, 10/05/23 | United States | 238,460 | 240,070 | |||||||||||
Global Tel*Link Corp., Term Loan, 5.046%, 5/23/20 | United States | 277,134 | 277,394 | |||||||||||
|
| |||||||||||||
| 517,464 | ||||||||||||||
|
| |||||||||||||
Transportation 0.5% | ||||||||||||||
Air Canada, Term Loan, 3.46%, 10/06/23 | Canada | 49,550 | 49,819 | |||||||||||
The Hertz Corp., Tranche B-1 Term Loan, 3.976%, 6/30/23 | United States | 1,724,242 | 1,721,952 | |||||||||||
Navios Maritime Midstream Partners LP and Navios Maritime Midstream Partners Finance (US) Inc., Term Loan, 5.78%, 6/18/20 | Marshall Islands | 1,279,033 | 1,278,500 | |||||||||||
United Airlines Inc., Class B Term Loans, 3.422%, 4/01/24 | United States | 294,303 | 295,738 | |||||||||||
XPO Logistics Inc., Loans, 3.405%, 11/01/21 | United States | 93,651 | 94,002 | |||||||||||
|
| |||||||||||||
| 3,440,011 | ||||||||||||||
|
| |||||||||||||
Utilities 1.1% | ||||||||||||||
Calpine Construction Finance Co. LP, Term B-1 Loan, 3.48%, 5/03/20 | United States | 994,819 | 994,663 | |||||||||||
EFS Cogen Holdings I LLC (Linden), Term B Advance, 4.80%, 6/28/23 | United States | 3,012,253 | 3,036,728 | |||||||||||
Lightstone Holdco LLC, | ||||||||||||||
Initial Term B Loan, 5.726%, 1/30/24 | United States | 2,343,297 | 2,293,828 | |||||||||||
Initial Term C Loan, 5.726%, 1/30/24 | United States | 144,928 | 141,868 | |||||||||||
NRG Energy Inc., Term Loans, 3.546%, 6/30/23 | United States | 861,300 | 860,685 | |||||||||||
|
| |||||||||||||
| 7,327,772 | ||||||||||||||
|
| |||||||||||||
Total Senior Floating Rate Interests (Cost $66,822,584) | 66,449,260 | |||||||||||||
|
| |||||||||||||
| FSI-18 | Semiannual Report |
FRANKLIN TEMPLETON VARIABLE INSURANCE PRODUCTS TRUST
NOTES TO FINANCIAL STATEMENTS
Franklin Strategic Income VIP Fund (continued)
| Country | Principal Amount* | Value | ||||||||||||
| Foreign Government and Agency Securities 7.6% | ||||||||||||||
Government of Hungary, senior note, 6.25%, 1/29/20 | Hungary | 1,500,000 | $ | 1,642,140 | ||||||||||
Government of Indonesia, | ||||||||||||||
6.125%, 5/15/28. | Indonesia | 34,000,000,000 | IDR | 2,356,594 | ||||||||||
FR34, 12.80%, 6/15/21 | Indonesia | 17,235,000,000 | IDR | 1,566,796 | ||||||||||
senior bond, FR53, 8.25%, 7/15/21 | Indonesia | 46,000,000,000 | IDR | 3,648,274 | ||||||||||
senior bond, FR70, 8.375%, 3/15/24. | Indonesia | 26,500,000,000 | IDR | 2,155,086 | ||||||||||
Government of Malaysia, senior note, 4.012%, 9/15/17 | Malaysia | 10,400,000 | MYR | 2,427,555 | ||||||||||
Government of Mexico, | ||||||||||||||
7.75%, 12/14/17. | Mexico | 345,000 | o MXN | 1,909,087 | ||||||||||
senior note, 8.50%, 12/13/18 | Mexico | 2,305,000 | o MXN | 12,994,365 | ||||||||||
| h | Government of Serbia, | |||||||||||||
senior note, 144A, 4.875%, 2/25/20 | Serbia | 4,000,000 | 4,176,600 | |||||||||||
senior note, 144A, 7.25%, 9/28/21 | Serbia | 200,000 | 231,301 | |||||||||||
| h | Government of Ukraine, | |||||||||||||
144A, 7.75%, 9/01/22 | Ukraine | 200,000 | 201,515 | |||||||||||
144A, 7.75%, 9/01/23 | Ukraine | 369,000 | 366,232 | |||||||||||
144A, 7.75%, 9/01/24 | Ukraine | 369,000 | 362,696 | |||||||||||
144A, 7.75%, 9/01/25 | Ukraine | 369,000 | 361,164 | |||||||||||
144A, 7.75%, 9/01/26 | Ukraine | 369,000 | 359,784 | |||||||||||
144A, 7.75%, 9/01/27 | Ukraine | 369,000 | 358,447 | |||||||||||
| a,p | 144A, VRI, GDP Linked Security, 5/31/40 | Ukraine | 1,952,000 | 764,559 | ||||||||||
Nota Do Tesouro Nacional, | ||||||||||||||
10.00%, 1/01/21. | Brazil | 13,600 | q BRL | 4,111,654 | ||||||||||
10.00%, 1/01/23. | Brazil | 9,000 | q BRL | 2,683,054 | ||||||||||
| r | Index Linked, 6.00%, 8/15/18 | Brazil | 5,525 | q BRL | 5,059,403 | |||||||||
| r | Index Linked, 6.00%, 5/15/23 | Brazil | 3,350 | q BRL | 3,083,594 | |||||||||
|
| |||||||||||||
Total Foreign Government and Agency Securities (Cost $50,541,947) | 50,819,900 | |||||||||||||
|
| |||||||||||||
| U.S. Government and Agency Securities 7.4% | ||||||||||||||
U.S. Treasury Bond, | ||||||||||||||
7.875%, 2/15/21. | United States | 900,000 | 1,094,695 | |||||||||||
6.50%, 11/15/26. | United States | 2,400,000 | 3,259,219 | |||||||||||
3.00%, 11/15/45. | United States | 5,000,000 | 5,159,570 | |||||||||||
| s | Index Linked, 0.625%, 1/15/24 | United States | 8,341,038 | 8,462,734 | ||||||||||
| s | Index Linked, 2.375%, 1/15/25 | United States | 3,113,050 | 3,547,611 | ||||||||||
U.S. Treasury Note, | ||||||||||||||
3.75%, 11/15/18. | United States | 7,000,000 | 7,228,186 | |||||||||||
2.75%, 2/15/24. | United States | 1,000,000 | 1,040,273 | |||||||||||
2.25%, 11/15/25. | United States | 8,500,000 | 8,502,490 | |||||||||||
| s | Index Linked, 0.125%, 7/15/24 | United States | 8,773,109 | 8,620,615 | ||||||||||
| s | Index Linked, 0.625%, 7/15/21 | United States | 1,735,705 | 1,779,599 | ||||||||||
| s | `Index Linked, 2.125%, 1/15/19 | United States | 797,160 | 823,361 | ||||||||||
|
| |||||||||||||
Total U.S. Government and Agency Securities | 49,518,353 | |||||||||||||
|
| |||||||||||||
| Semiannual Report | FSI-19 |
FRANKLIN TEMPLETON VARIABLE INSURANCE PRODUCTS TRUST
CONSOLIDATED STATEMENT OF INVESTMENTS (UNAUDITED)
Franklin Strategic Income VIP Fund (continued)
| Country | Principal Amount* | Value | ||||||||||||
Asset-Backed Securities and Commercial Mortgage - Backed Securities 12.3% | ||||||||||||||
| Banks 1.4% | ||||||||||||||
Banc of America Commercial Mortgage Trust, 2006-4, AJ, 5.695%, 7/10/46 | United States | 229,463 | $ | 229,099 | ||||||||||
| l | Bear Stearns ARM Trust, 2004-4, A6, FRN, 3.363%, 6/25/34 | United States | 1,250,210 | 1,270,959 | ||||||||||
Bear Stearns Commercial Mortgage Securities Trust, 2006-PW13, AJ, 5.611%, 9/11/41 | United States | 23,889 | 24,035 | |||||||||||
| l | Citibank Credit Card Issuance Trust, | |||||||||||||
2013-A2, A2, FRN, 1.496%, 5/26/20 | United States | 650,000 | 651,244 | |||||||||||
2013-A4, A4, FRN, 1.636%, 7/24/20 | United States | 710,000 | 712,683 | |||||||||||
Citigroup Commercial Mortgage Trust, | ||||||||||||||
2006-C5, AJ, 5.482%, 10/15/49 | United States | 1,263,072 | 1,198,529 | |||||||||||
| l | 2007-C6, AM, FRN, 5.691%, 12/10/49 | United States | 1,700,000 | 1,703,261 | ||||||||||
| l | Commercial Mortgage Trust, 2006-GG7, AJ, FRN, 5.759%, 7/10/38 | United States | 1,215,000 | 1,149,346 | ||||||||||
CSAIL Commercial Mortgage Trust, 2015-C1, A4, 3.505%, 4/15/50 | United States | 915,000 | 947,159 | |||||||||||
| l | CWABS Asset-Backed Certificates Trust, 2005-11, AF4, FRN, 4.673%, 3/25/34 | United States | 1,275,000 | 1,284,787 | ||||||||||
| l | Merrill Lynch Mortgage Investors Trust, 2005-A6, 2A3, FRN, 1.596%, 8/25/35 | United States | 183,439 | 179,089 | ||||||||||
| l | Morgan Stanley Capital I Trust, 2006-HQ8, AJ, FRN, 5.461%, 3/12/44 | United States | 32,115 | 32,096 | ||||||||||
|
| |||||||||||||
| 9,382,287 | ||||||||||||||
|
| |||||||||||||
| Diversified Financials 10.9% | ||||||||||||||
| h,l | Ares Enhanced Loan Investment Strategy IR Ltd., 2013-IRAR, A2A, 144A, FRN, 3.053%, 7/23/25 | Cayman Islands | 740,000 | 743,974 | ||||||||||
| h,l | Atrium VIII, | |||||||||||||
8A, BR, 144A, FRN, 3.053%, 10/23/24 | Cayman Islands | 350,000 | 352,891 | |||||||||||
8A, CR, 144A, FRN, 3.653%, 10/23/24 | Cayman Islands | 470,000 | 473,530 | |||||||||||
| h,l | Atrium XI, 11A, CR, 144A, FRN, 3.303%, 10/23/25 | Cayman Islands | 1,820,000 | 1,820,000 | ||||||||||
Banc of America Commercial Mortgage Trust, | ||||||||||||||
2015-UBS7, A3, 3.441%, 9/15/48 | United States | 1,050,000 | 1,083,088 | |||||||||||
2015-UBS7, A4, 3.705%, 9/15/48 | United States | 1,170,000 | 1,227,331 | |||||||||||
l2015-UBS7, B, FRN, 4.366%, 9/15/48 | United States | 760,000 | 800,452 | |||||||||||
| l | Bank of America Credit Card Trust, 2005-A1, A, FRN, 1.489%, 6/15/20 | United States | 800,000 | 801,320 | ||||||||||
| h,l | BCAP LLC Trust, 2009-RR1, 2A2, 144A, FRN, 3.208%, 5/26/35 | United States | 440,000 | 416,593 | ||||||||||
| h | BlueMountain CLO Ltd., | |||||||||||||
| l | 2012-2A, BR, 144A, FRN, 3.072%, 11/20/28 | Cayman Islands | 510,000 | 512,545 | ||||||||||
2012-2A, CR, 144A, 3.772%, 11/20/28 | Cayman Islands | 270,000 | 272,395 | |||||||||||
| h,l | Burnham Park CLO Ltd., | |||||||||||||
2016-1A, A, 144A, FRN, 2.586%, 10/20/29 | Cayman Islands | 350,000 | 351,533 | |||||||||||
2016-1A, B, 144A, FRN, 2.956%, 10/20/29 | Cayman Islands | 460,000 | 458,634 | |||||||||||
2016-1A, C, 144A, FRN, 3.556%, 10/20/29 | Cayman Islands | 460,000 | 460,547 | |||||||||||
| l | Capital One Multi-Asset Execution Trust, | |||||||||||||
2014-A3, A3, FRN, 1.539%, 1/18/22 | United States | 370,000 | 371,700 | |||||||||||
2016-A1, A1, FRN, 1.609%, 2/15/22 | United States | 2,950,000 | 2,968,309 | |||||||||||
2016-A2, A2, FRN, 1.789%, 2/15/24 | United States | 3,990,000 | 4,046,881 | |||||||||||
| h,l | Carlyle Global Market Strategies CLO Ltd., | |||||||||||||
2012-4A, BR, 144A, FRN, 3.056%, 1/20/29 | United States | 500,000 | 502,740 | |||||||||||
2012-4A, C1R, 144A, FRN, 3.756%, 1/20/29 | United States | 480,000 | 482,150 | |||||||||||
| h,l | Carlyle U.S. CLO Ltd., 2017-2A, A1B, 144A, FRN, 2.551%, 7/20/31 | Cayman Islands | 1,150,000 | 1,150,218 | ||||||||||
| h,l | Catamaran CLO Ltd., | |||||||||||||
2013-1A, C, 144A, FRN, 3.77%, 1/27/25 | United States | 1,130,000 | 1,127,186 | |||||||||||
2014-2A, BR, 144A, FRN, 4.108%, 10/18/26 | Cayman Islands | 1,550,000 | 1,557,827 | |||||||||||
| FSI-20 | Semiannual Report |
FRANKLIN TEMPLETON VARIABLE INSURANCE PRODUCTS TRUST
CONSOLIDATED STATEMENT OF INVESTMENTS (UNAUDITED)
Franklin Strategic Income VIP Fund (continued)
| Country | Principal Amount* | Value | ||||||||||||
| Asset-Backed Securities and Commercial Mortgage - Backed Securities (continued) | ||||||||||||||
Diversified Financials (continued) | ||||||||||||||
| h,l | Cent CDO Ltd., 2007-15A, A2B, 144A, FRN, 1.568%, 3/11/21 | United States | 1,251,000 | $ | 1,224,954 | |||||||||
| h,l | Cent CLO LP, | |||||||||||||
2013-17A, B, 144A, FRN, 4.17%, 1/30/25 | United States | 784,314 | 785,867 | |||||||||||
2014-22A, A2AR, 144A, FRN, 3.129%, 11/07/26 | Cayman Islands | 392,000 | 394,289 | |||||||||||
2014-22A, BR, 144A, FRN, 4.129%, 11/07/26 | Cayman Islands | 340,000 | 343,475 | |||||||||||
| h,l | CGRBS Commercial Mortgage Trust, 2013-VN05, C, 144A, FRN, 3.584%, 3/13/35 | United States | 870,000 | 885,813 | ||||||||||
| l | Chase Issuance Trust, | |||||||||||||
2012-A10, A10, FRN, 1.419%, 12/16/19 | United States | 470,000 | 470,527 | |||||||||||
2013-A6, A6, FRN, 1.579%, 7/15/20 | United States | 1,090,000 | 1,093,653 | |||||||||||
| h,l | Cole Park CLO Ltd., 15-1A, B, 144A, FRN, 3.406%, 10/20/28 | Cayman Islands | 270,000 | 274,352 | ||||||||||
| l | COMM Mortgage Trust, 2014-CR19, B, FRN, 4.703%, 8/10/47 | United States | 870,000 | 933,082 | ||||||||||
| h | Core Industrial Trust, 2015-CALW, A, 144A, 3.04%, 2/10/34 | United States | 1,410,000 | 1,448,191 | ||||||||||
| h,l | Cumberland Park CLO Ltd., | |||||||||||||
2015-2A, B, 144A, FRN, 3.256%, 7/20/26 | United States | 1,080,000 | 1,088,543 | |||||||||||
2015-2A, C, 144A, FRN, 4.006%, 7/20/26 | United States | 190,000 | 190,920 | |||||||||||
| l | Discover Card Execution Note Trust, 2016-A2, A2, FRN, 1.699%, 9/15/21 | United States | 2,950,000 | 2,970,584 | ||||||||||
| h,l | Dryden 33 Senior Loan Fund, | |||||||||||||
2014-33A, BR, 144A, FRN, 3.008%, 10/15/28 | Cayman Islands | 535,000 | 535,642 | |||||||||||
2014-33A, CR, 144A, FRN, 3.658%, 10/15/28 | United States | 270,000 | 270,008 | |||||||||||
| h,l | Dryden 34 Senior Loan Fund, 14-34A, AR, 144A, FRN, 2.318%, 10/15/26 | Cayman Islands | 200,000 | 200,062 | ||||||||||
| h,l | Dryden XXV Senior Loan Fund, 2012-25A, CR, 144A, FRN, 3.658%, 1/15/25 | Cayman Islands | 378,000 | 379,848 | ||||||||||
| h,l | Dryden XXVIII Senior Loan Fund, 2013-28A, A3L, 144A, FRN, 3.882%, 8/15/25 | Cayman Islands | 1,000,000 | 999,980 | ||||||||||
| h,l | Eleven Madison Trust Mortgage Trust, 2015-11MD, A, 144A, FRN, 3.555%, 9/10/35 | United States | 1,350,000 | 1,404,455 | ||||||||||
| l | FHLMC Structured Agency Credit Risk Debt Notes, | |||||||||||||
2014-DN1, M2, FRN, 3.416%, 2/25/24 | United States | 1,483,910 | 1,525,862 | |||||||||||
2014-DN4, M3, FRN, 5.766%, 10/25/24 | United States | 762,807 | 841,381 | |||||||||||
2014-HQ2, M2, FRN, 3.416%, 9/25/24 | United States | 1,000,000 | 1,027,623 | |||||||||||
2015-HQ1, M2, FRN, 3.416%, 3/25/25 | United States | 596,572 | 603,609 | |||||||||||
2015-HQ1, M3, FRN, 5.016%, 3/25/25 | United States | 370,000 | 402,689 | |||||||||||
| h,l | Flagship CLO VIII Ltd., 2014-8A, AR, 144A, FRN, 2.408%, 1/16/26 | Cayman Islands | 540,000 | 541,696 | ||||||||||
| h,l | Flatiron CLO Ltd., 2014-1A, A1R, 144A, FRN, 2.338%, 7/17/26 | Cayman Islands | 1,640,000 | 1,641,919 | ||||||||||
| l | FNMA Connecticut Avenue Securities, | |||||||||||||
2014-C03, 1M2, FRN, 4.216%, 7/25/24 | United States | 670,000 | 714,910 | |||||||||||
2015-C01, 1M2, FRN, 5.516%, 2/25/25 | United States | 1,145,963 | 1,247,716 | |||||||||||
2015-C01, 2M2, FRN, 5.766%, 2/25/25 | United States | 1,930,871 | 2,087,228 | |||||||||||
2015-C02, 1M2, FRN, 5.216%, 5/25/25 | United States | 1,193,218 | 1,289,899 | |||||||||||
2015-C02, 2M2, FRN, 5.216%, 5/25/25 | United States | 1,324,138 | 1,418,950 | |||||||||||
2015-C03, 2M2, FRN, 6.216%, 7/25/25 | United States | 2,450,000 | 2,719,551 | |||||||||||
2017-C01, 1M2, FRN, 4.766%, 7/25/29 | United States | 1,890,000 | 1,998,306 | |||||||||||
| h,l | Galaxy CLO Ltd., | |||||||||||||
2014-17A, AR, 144A, FRN, 2.558%, 7/15/26 | Cayman Islands | 720,000 | 719,338 | |||||||||||
2014-17A, BR, 144A, FRN, 2.958%, 7/15/26 | Cayman Islands | 470,000 | 472,806 | |||||||||||
2014-17A, C1R, 144A, FRN, 3.558%, 7/15/26 | Cayman Islands | 250,000 | 248,785 | |||||||||||
| h | G-Force LLC, 2005-RRA, C, 144A, 5.20%, 8/22/36 | United States | 1,964,439 | 1,933,228 | ||||||||||
GS Mortgage Securities Trust, | ||||||||||||||
l 2016-GS3, B, FRN, 3.395%, 10/10/49 | United States | 900,000 | 887,505 | |||||||||||
2017-GS6, B, 3.869%, 5/10/50 | United States | 870,000 | 891,997 | |||||||||||
| Semiannual Report | FSI-21 |
FRANKLIN TEMPLETON VARIABLE INSURANCE PRODUCTS TRUST
CONSOLIDATED STATEMENT OF INVESTMENTS (UNAUDITED)
Franklin Strategic Income VIP Fund (continued)
| Country | Principal Amount* | Value | ||||||||||||
| Asset-Backed Securities and Commercial Mortgage- Backed Securities (continued) | ||||||||||||||
Diversified Financials (continued) | ||||||||||||||
| l | Impac Secured Assets Trust, 2007-2, FRN, 1.466%, 4/25/37 | United States | 162,039 | $ | 160,268 | |||||||||
| h,l | Invitation Homes Trust, 2015-SFR1, A, 144A, FRN, 2.659%, 3/17/32 | United States | 1,425,212 | 1,439,262 | ||||||||||
| h,l | J.P. Morgan Chase Commercial Mortgage Securities, 2016-Nine, B, 144A, | |||||||||||||
FRN, 2.854%, 10/06/38 | United States | 1,200,000 | 1,160,816 | |||||||||||
JP Morgan Chase Commercial Mortgage Securities Trust, 2006-CB17, | ||||||||||||||
AM, 5.464%, 12/12/43 | United States | 41,268 | 41,248 | |||||||||||
JPMCC Commercial Mortgage Securities Trust, 2017-JP6, B, 3.946%, 7/15/50 | United States | 1,040,000 | 1,069,745 | |||||||||||
| h,l | LCM XVI LP, 2016A, BR, 144A, FRN, 2.658%, 7/15/26 | Cayman Islands | 570,000 | 569,766 | ||||||||||
| h,l | LCM XVII LP, | |||||||||||||
2017A, BR, 144A, FRN, 3.008%, 10/15/26 | United States | 350,000 | 351,305 | |||||||||||
2017A, CR, 144A, FRN, 3.658%, 10/15/26 | United States | 320,000 | 320,733 | |||||||||||
| h,l,t | Madison Park Funding XXIII Ltd., | |||||||||||||
2017-23A, B, 144A, FRN, 3.009%, 7/27/30 | Cayman Islands | 400,000 | 400,000 | |||||||||||
2017-23A, C, 144A, FRN, 3.659%, 7/27/30 | Cayman Islands | 500,000 | 500,000 | |||||||||||
| l | MortgageIT Trust, 2004-1, A2, FRN, 2.116%, 11/25/34 | United States | 232,960 | 224,223 | ||||||||||
| h,l | Octagon Investment Partners XX Ltd., 2014-1A, AR, 144A, FRN, 2.311%, 8/12/26 | Cayman Islands | 900,000 | 901,701 | ||||||||||
| h,l | Octagon Investment Partners XXIII Ltd., 2015-1A, B, 144A, FRN, 3.158%, 7/15/27 | Cayman Islands | 400,000 | 399,772 | ||||||||||
| l | Opteum Mortgage Acceptance Corp. Trust, 2005-4, 1APT, FRN, 1.526%, 11/25/35 | United States | 359,344 | 346,029 | ||||||||||
| l | Structured Asset Securities Corp., 2005-2XS, 2A2, FRN, 2.551%, 2/25/35 | United States | 240,905 | 232,933 | ||||||||||
| l | Thornburg Mortgage Securities Trust, 2005-1, A3, FRN, 3.098%, 4/25/45 | United States | 212,046 | 213,124 | ||||||||||
| h,l | Voya CLO Ltd., | |||||||||||||
2013-1A, B, 144A, FRN, 4.058%, 4/15/24 | United States | 270,000 | 270,472 | |||||||||||
2013-2A, B, 144A, FRN, 3.836%, 4/25/25 | United States | 1,080,000 | 1,084,028 | |||||||||||
2015-2A, B, 144A, FRN, 3.133%, 7/23/27 | United States | 820,000 | 821,378 | |||||||||||
Wells Fargo Mortgage Backed Securities Trust, | ||||||||||||||
| l | 2004-W, A9, FRN, 3.03%, 11/25/34 | United States | 621,319 | 633,486 | ||||||||||
2007-3, 3A1, 5.50%, 4/25/22 | United States | 132,113 | 135,336 | |||||||||||
|
| |||||||||||||
| 72,366,712 | ||||||||||||||
|
| |||||||||||||
Total Asset-Backed Securities and Commercial Mortgage-Backed Securities (Cost $80,430,160) | 81,748,999 | |||||||||||||
|
| |||||||||||||
Mortgage-Backed Securities 9.5% | ||||||||||||||
Federal Home Loan Mortgage Corp. (FHLMC) Adjustable Rate 0.0%† | ||||||||||||||
FHLMC, 2.957%, 1/01/33 | United States | 26,711 | 27,604 | |||||||||||
|
| |||||||||||||
Federal Home Loan Mortgage Corp. (FHLMC) Fixed Rate 4.4% | ||||||||||||||
FHLMC Gold 15 Year, 5.50%, 9/01/17–7/01/19 | United States | 22,234 | 22,729 | |||||||||||
FHLMC Gold 30 Year, 3.00%, 1/01/47 | United States | 586,854 | 586,057 | |||||||||||
| u | FHLMC Gold 30 Year, 3.00%, 7/01/47 | United States | 7,250,000 | 7,233,574 | ||||||||||
FHLMC Gold 30 Year, 3.50%, 6/01/47 | United States | 4,576,083 | 4,704,934 | |||||||||||
| u | FHLMC Gold 30 Year, 3.50%, 7/01/47 | United States | 4,200,000 | 4,313,859 | ||||||||||
| u | FHLMC Gold 30 Year, 4.00%, 7/01/46 | United States | 1,400,000 | 1,472,242 | ||||||||||
FHLMC Gold 30 Year, 4.00%, 3/01/47 | United States | 9,099,426 | 9,579,951 | |||||||||||
FHLMC Gold 30 Year, 4.00%, 6/01/47 | United States | 797,548 | 839,665 | |||||||||||
FHLMC Gold 30 Year, 5.00%, 4/01/34–8/01/35 | United States | 282,162 | 308,660 | |||||||||||
FHLMC Gold 30 Year, 5.50%, 3/01/33–1/01/35 | United States | 197,732 | 219,974 | |||||||||||
| FSI-22 | Semiannual Report |
FRANKLIN TEMPLETON VARIABLE INSURANCE PRODUCTS TRUST
CONSOLIDATED STATEMENT OF INVESTMENTS (UNAUDITED)
Franklin Strategic Income VIP Fund (continued)
| Country | Principal Amount* | Value | ||||||||||||
| Mortgage-Backed Securities (continued) | ||||||||||||||
| Federal Home Loan Mortgage Corp. (FHLMC) Fixed Rate (continued) | ||||||||||||||
FHLMC Gold 30 Year, 6.00%, 4/01/33–2/01/36 | United States | 183,811 | $ | 207,567 | ||||||||||
FHLMC Gold 30 Year, 6.50%, 11/01/27–6/01/36 | United States | 37,352 | 41,441 | |||||||||||
FHLMC Gold 30 Year, 7.00%, 9/01/21–4/01/30 | United States | 15,654 | 16,818 | |||||||||||
FHLMC Gold 30 Year, 7.50%, 8/01/30–7/01/31 | United States | 1,052 | 1,126 | |||||||||||
|
| |||||||||||||
| 29,548,597 | ||||||||||||||
|
| |||||||||||||
| Federal National Mortgage Association (FNMA) Adjustable Rate 0.0%† | ||||||||||||||
FNMA, 2.787%–2.955%, 4/01/20–12/01/34 | United States | 106,017 | 111,062 | |||||||||||
|
| |||||||||||||
| Federal National Mortgage Association (FNMA) Fixed Rate 3.3% | ||||||||||||||
FNMA 15 Year, 2.50%, 7/01/22–6/01/27 | United States | 371,258 | 375,704 | |||||||||||
FNMA 15 Year, 4.50%, 6/01/19–3/01/20 | United States | 39,396 | 40,358 | |||||||||||
FNMA 15 Year, 5.00%, 10/01/17–6/01/18 | United States | 14,831 | 15,193 | |||||||||||
FNMA 15 Year, 5.50%, 7/01/17–11/01/18 | United States | 38,635 | 39,074 | |||||||||||
| u | FNMA 30 Year, 3.00%, 7/01/46 | United States | 8,050,000 | 8,038,051 | ||||||||||
FNMA 30 Year, 3.00%, 3/01/47 | United States | 592,774 | 592,451 | |||||||||||
| u | FNMA 30 Year, 3.50%, 7/01/46 | United States | 4,200,000 | 4,312,745 | ||||||||||
FNMA 30 Year, 3.50%, 5/01/47 | United States | 5,921,343 | 6,085,423 | |||||||||||
| u | FNMA 30 Year, 4.00%, 7/01/46 | United States | 1,700,000 | 1,786,859 | ||||||||||
FNMA 30 Year, 4.00%, 5/01/47 | United States | 198,899 | 209,240 | |||||||||||
FNMA 30 Year, 5.00%, 4/01/30 | United States | 68,721 | 75,088 | |||||||||||
FNMA 30 Year, 6.50%, 6/01/28–10/01/37 | United States | 186,579 | 211,586 | |||||||||||
|
| |||||||||||||
| 21,781,772 | ||||||||||||||
|
| |||||||||||||
| Government National Mortgage Association (GNMA) Fixed Rate 1.8% | ||||||||||||||
GNMA I SF 30 Year, 5.00%, 11/15/33–7/15/34 | United States | 265,023 | 291,724 | |||||||||||
GNMA I SF 30 Year, 6.50%, 2/15/32 | United States | 1,021 | 1,117 | |||||||||||
GNMA I SF 30 Year, 7.00%, 10/15/28–6/15/32 | United States | 16,759 | 17,058 | |||||||||||
GNMA I SF 30 Year, 7.50%, 9/15/30 | United States | 1,292 | 1,492 | |||||||||||
GNMA II SF 30 Year, 3.00%, 5/20/47 | United States | 398,754 | 403,289 | |||||||||||
| u | GNMA II SF 30 Year, 3.00%, 7/01/47 | United States | 5,400,000 | 5,454,422 | ||||||||||
| u | GNMA II SF 30 Year, 3.50%, 7/01/46 | United States | 1,700,000 | 1,760,563 | ||||||||||
GNMA II SF 30 Year, 3.50%, 2/20/47 | United States | 3,420,481 | 3,546,870 | |||||||||||
GNMA II SF 30 Year, 3.50%, 5/20/47 | United States | 399,138 | 413,886 | |||||||||||
GNMA II SF 30 Year, 5.00%, 9/20/33–11/20/33 | United States | 75,402 | 83,883 | |||||||||||
GNMA II SF 30 Year, 6.00%, 11/20/34 | United States | 93,853 | 106,583 | |||||||||||
GNMA II SF 30 Year, 6.50%, 4/20/31–2/20/34 | United States | 47,127 | 54,575 | |||||||||||
GNMA II SF 30 Year, 7.50%, 1/20/28–4/20/32 | United States | 11,343 | 13,006 | |||||||||||
|
| |||||||||||||
| 12,148,468 | ||||||||||||||
|
| |||||||||||||
| Total Mortgage-Backed Securities (Cost $63,659,832) | 63,617,503 | |||||||||||||
|
| |||||||||||||
| Municipal Bonds 1.8% | ||||||||||||||
California State GO, Various Purpose, Refunding, 5.00%, 9/01/29 | United States | 1,650,000 | 1,996,071 | |||||||||||
California Statewide CDA, PCR, Southern California Edison Co., | ||||||||||||||
Mandatory Put 12/01/23, Refunding, Series D, 2.625%, 11/01/33 | United States | 390,000 | 400,787 | |||||||||||
Clark County School District GO, Refunding, Series D, 5.00%, 6/15/23 | United States | 1,500,000 | 1,775,820 | |||||||||||
Denver City and County Airport System Revenue, Refunding, Series A, 5.00%, 11/15/25 | United States | 210,000 | 256,456 | |||||||||||
Minnesota State GO, Refunding, Series D, 5.00%, 8/01/25 | United States | 830,000 | 1,030,055 | |||||||||||
New York City HDC Capital Fund Grant Program Revenue, New York City Housing Authority Program, Series B1, 5.00%, 7/01/33 | United States | 500,000 | 557,900 | |||||||||||
| Semiannual Report | FSI-23 |
FRANKLIN TEMPLETON VARIABLE INSURANCE PRODUCTS TRUST
CONSOLIDATED STATEMENT OF INVESTMENTS (UNAUDITED)
Franklin Strategic Income VIP Fund (continued)
| Country | Principal Amount* | Value | ||||||||||
| Municipal Bonds (continued) | ||||||||||||
New York State Dormitory Authority State Personal Income Tax Revenue, | United States | 930,000 | $ | 1,119,116 | ||||||||
Port Authority of New York and New Jersey Revenue, Consolidated, One | United States | 1,490,000 | 1,590,351 | |||||||||
| i | Puerto Rico Electric Power Authority Power Revenue, | |||||||||||
Series A, 6.75%, 7/01/36 | United States | 3,465,000 | 2,122,312 | |||||||||
Series XX, 5.25%, 7/01/40 | United States | 165,000 | 101,063 | |||||||||
University of Texas Revenue, Series J, 5.00%, 8/15/25 | United States | 960,000 | 1,184,266 | |||||||||
|
| |||||||||||
Total Municipal Bonds (Cost $12,894,009) | 12,134,197 | |||||||||||
|
| |||||||||||
| Shares | ||||||||||||
Escrows and Litigation Trusts 0.0%† | ||||||||||||
| a,d | Midstates Petroleum Co. Inc./Midstates Petroleum Co. LLC, Escrow Account | United States | 1,500,000 | — | ||||||||
| a,d | NewPage Corp., Litigation Trust | United States | 2,500,000 | — | ||||||||
| a | Penn Virginia Corp., Escrow Account | United States | 1,500,000 | 22,500 | ||||||||
| a,d | Vistra Energy Corp., Escrow Account | United States | 3,000,000 | 34,800 | ||||||||
|
| |||||||||||
Total Escrows and Litigation Trusts (Cost $91,006) | 57,300 | |||||||||||
|
| |||||||||||
Total Investments before Short Term Investments (Cost $680,614,137) | 680,686,689 | |||||||||||
|
| |||||||||||
| Principal Amount* | ||||||||||||
| Short Term Investments 2.6% | ||||||||||||
| U.S. Government and Agency Securities (Cost $369,620) 0.1% | ||||||||||||
| v,w | U.S. Treasury Bill, 8/17/17 | United States | 370,000 | 369,588 | ||||||||
|
| |||||||||||
Total Investments before Money Market Funds (Cost $680,983,757) | 681,056,277 | |||||||||||
|
| |||||||||||
| Shares | ||||||||||||
| Money Market Funds (Cost $16,814,541) 2.5% | ||||||||||||
| f,x | Institutional Fiduciary Trust Money Market Portfolio, 0.58% | United States | 16,814,541 | 16,814,541 | ||||||||
|
| |||||||||||
Total Investments (Cost $697,798,298) 104.6% | 697,870,818 | |||||||||||
Other Assets, less Liabilities (4.6)% | (30,596,472 | ) | ||||||||||
|
| |||||||||||
Net Assets 100.0% | $ | 667,274,346 | ||||||||||
|
| |||||||||||
| FSI-24 | Semiannual Report |
FRANKLIN TEMPLETON VARIABLE INSURANCE PRODUCTS TRUST
CONSOLIDATED STATEMENT OF INVESTMENTS (UNAUDITED)
Franklin Strategic Income VIP Fund (continued)
†Rounds to less than 0.1% of net assets.
*The principal amount is stated in U.S. dollars unless otherwise indicated.
aNon-income producing.
bThe security is owned by FT Holdings Corporation lll, a wholly-owned subsidiary of the Fund. See Note 1(f).
cAt June 30, 2017, pursuant to the Fund’s policies and the requirements of applicable securities law, the Fund is restricted from trading these securities at period end.
dSecurity has been deemed illiquid because it may not be able to be sold within seven days. At June 30, 2017, the aggregate value of these securities was $232,616, representing less than 0.1% of net assets.
eSee Note 8 regarding restricted securities.
fSee Note 3(e) regarding investments in affiliated management investment companies.
gPerpetual security with no stated maturity date.
hSecurity was purchased pursuant to Rule 144A under the Securities Act of 1933 and may be sold in transactions exempt from registration only to qualified institutional buyers or in a public offering registered under the Securities Act of 1933. These securities have been deemed liquid under guidelines approved by the Trust’s Board of Trustees. At June 30, 2017, the aggregate value of these securities was $155,998,628, representing 23.4% of net assets.
iSee Note 7 regarding defaulted securities.
jIncome may be received in additional securities and/or cash.
kSee Note 1(e) regarding loan participation notes.
lThe coupon rate shown represents the rate at period end.
mSee Note 1(h) regarding senior floating rate interests.
nA portion or all of the security purchased on a delayed delivery basis. See Note 1(c).
oPrincipal amount is stated in 100 Mexican Peso Units.
pThe principal represents the notional amount. See Note 1(d) regarding value recovery instruments.
qPrincipal amount is stated in 1,000 Brazilian Real Units.
rRedemption price at maturity is adjusted for inflation. See Note 1(j).
sPrincipal amount of security is adjusted for inflation. See Note 1(j).
tSecurity purchased on a when-issued basis. See Note 1(c).
uSecurity purchased on a to-be-announced (TBA) basis. See Note 1(c).
vThe security was issued on a discount basis with no stated coupon rate.
wA portion or all of the security has been segregated as collateral for open future contracts. At June 30, 2017, the value of this security and/or cash pledged amounted to $268,772, representing less than 0.1% of net assets.
xThe rate shown is the annualized seven-day yield at period end.
| Semiannual Report | FSI-25 |
FRANKLIN TEMPLETON VARIABLE INSURANCE PRODUCTS TRUST
CONSOLIDATED STATEMENT OF INVESTMENTS (UNAUDITED)
Franklin Strategic Income VIP Fund (continued)
At June 30, 2017, the Fund had the following futures contracts outstanding. See Note 1(d).
| Futures Contracts | ||||||||||||||||||||||||
| Description | Type | Number of Contracts | Notional Value | Expiration Date | Unrealized Appreciation | Unrealized Depreciation | ||||||||||||||||||
Interest Rate Contracts | ||||||||||||||||||||||||
Euro-Bund | Long | 13 | $ | 2,403,648 | 9/07/17 | $ | — | $ | (41,013 | ) | ||||||||||||||
Long Gilt | Long | 46 | 7,523,816 | 9/27/17 | — | (134,885 | ) | |||||||||||||||||
U.S. Treasury 10 Yr. Note Ultra | Long | 14 | 1,887,375 | 9/20/17 | — | (584 | ) | |||||||||||||||||
U.S. Treasury Long Bond | Long | 22 | 3,381,125 | 9/20/17 | 26,753 | — | ||||||||||||||||||
|
| |||||||||||||||||||||||
Total Futures Contracts |
| $ | 26,753 | $ | (176,482 | ) | ||||||||||||||||||
|
| |||||||||||||||||||||||
Net unrealized appreciation (depreciation) |
| $ | (149,729 | ) | ||||||||||||||||||||
|
| |||||||||||||||||||||||
| At June 30, 2017, the Fund had the following forward exchange contracts outstanding. See Note 1(d). |
| Forward Exchange Contracts | ||||||||||||||||||||||||||||
| Currency | Counterpartya | Type | Quantity | Contract Amount* | Settlement Date | Unrealized Appreciation | Unrealized Depreciation | |||||||||||||||||||||
OTC Forward Exchange Contracts | ||||||||||||||||||||||||||||
Argentine Peso | JPHQ | Buy | 27,000,000 | 1,641,337 | 8/23/17 | $ | — | $ | (63,313 | ) | ||||||||||||||||||
Argentine Peso | JPHQ | Buy | 5,500,000 | 324,675 | 9/25/17 | — | (8,838 | ) | ||||||||||||||||||||
Colombian Peso | JPHQ | Buy | | 3,000,000,000 | | | 970,874 | | 9/25/17 | | 2,828 | | — | |||||||||||||||
Australian Dollar | DBAB | Sell | 8,308,345 | 6,113,530 | 10/26/17 | — | (264,297 | ) | ||||||||||||||||||||
Australian Dollar | JPHQ | Sell | 7,050,000 | 5,192,572 | 10/26/17 | — | (219,298 | ) | ||||||||||||||||||||
British Pound | DBAB | Buy | 1,100,000 | 1,407,890 | 10/26/17 | 30,191 | — | |||||||||||||||||||||
British Pound | DBAB | Sell | 2,700,000 | 3,511,755 | 10/26/17 | — | (18,080 | ) | ||||||||||||||||||||
British Pound | JPHQ | Sell | 337,472 | 438,928 | 10/26/17 | — | (2,265 | ) | ||||||||||||||||||||
British Pound | JPHQ | Sell | 1,300,000 | 14,926,644 | SEK | 10/26/17 | 85,276 | — | ||||||||||||||||||||
Canadian Dollar | JPHQ | Sell | 4,600,000 | 3,378,627 | 10/26/17 | — | (176,440 | ) | ||||||||||||||||||||
Euro | BZWS | Sell | 2,561,255 | 2,805,022 | 10/26/17 | — | (139,522 | ) | ||||||||||||||||||||
Euro | CITI | Sell | 2,131,200 | 2,334,559 | 10/26/17 | — | (115,573 | ) | ||||||||||||||||||||
Euro | DBAB | Sell | 992,876 | 1,088,887 | 10/26/17 | — | (52,572 | ) | ||||||||||||||||||||
Euro | GSCO | Sell | 369,000 | 404,313 | 10/26/17 | — | (19,907 | ) | ||||||||||||||||||||
Euro | HSBK | Sell | 142,717 | 156,317 | 10/26/17 | — | (7,758 | ) | ||||||||||||||||||||
Euro | JPHQ | Sell | 17,878,207 | 19,592,191 | 10/26/17 | — | (961,472 | ) | ||||||||||||||||||||
Indian Rupee | CITI | Buy | 4,537,000 | 68,915 | 10/26/17 | 363 | — | |||||||||||||||||||||
Indian Rupee | DBAB | Buy | 345,556,000 | 5,258,604 | 10/26/17 | 17,839 | — | |||||||||||||||||||||
Indian Rupee | HSBK | Buy | 144,338,000 | 2,192,587 | 10/26/17 | 11,372 | — | |||||||||||||||||||||
Japanese Yen | BZWS | Sell | 60,047,000 | 530,490 | 10/26/17 | — | (6,277 | ) | ||||||||||||||||||||
Japanese Yen | CITI | Sell | 42,830,000 | 378,420 | 10/26/17 | — | (4,442 | ) | ||||||||||||||||||||
Japanese Yen | DBAB | Sell | 540,993,500 | 4,778,039 | 10/26/17 | — | (57,968 | ) | ||||||||||||||||||||
Japanese Yen | HSBK | Sell | 147,626,000 | 1,304,117 | 10/26/17 | — | (15,530 | ) | ||||||||||||||||||||
Japanese Yen | JPHQ | Sell | | 1,136,286,000 | | | 10,038,527 | | 10/26/17 | | — | | (118,872 | ) | ||||||||||||||
Mexican Peso | JPHQ | Buy | 54,000,000 | 2,943,341 | 10/26/17 | — | (22,956 | ) | ||||||||||||||||||||
British Pound | JPHQ | Sell | 1,250,000 | 1,649,375 | 8/15/18 | 631 | — | |||||||||||||||||||||
|
| |||||||||||||||||||||||||||
Total Forward Exchange Contracts | $ | 148,500 | $ | (2,275,380 | ) | |||||||||||||||||||||||
|
| |||||||||||||||||||||||||||
Net unrealized appreciation (depreciation) | $ | (2,126,880 | ) | |||||||||||||||||||||||||
|
| |||||||||||||||||||||||||||
*In U.S. dollars unless otherwise indicated.
aMay be comprised of multiple contracts with the same counterparty, currency and settlement date.
| FSI-26 | Semiannual Report |
FRANKLIN TEMPLETON VARIABLE INSURANCE PRODUCTS TRUST
CONSOLIDATED STATEMENT OF INVESTMENTS (UNAUDITED)
Franklin Strategic Income VIP Fund (continued)
At June 30, 2017, the Fund had the following credit default swap contracts outstanding. See Note 1(d).
Credit Default Swap Contracts
| Description | | Periodic Payment Rate | | | Counter- party/ Exchange | | | Notional Amount | a | | Expiration Date | | | Unamortized Upfront Payments (Receipts) | | | Unrealized Appreciation | | | Unrealized Depreciation | | Value | Ratingb | |||||||||||||
| Centrally Cleared Swap Contracts | ||||||||||||||||||||||||||||||||||||
| Contracts to Sell Protectionc | ||||||||||||||||||||||||||||||||||||
| Traded Index | ||||||||||||||||||||||||||||||||||||
CDX.NA.HY.28 | 5.00 | % | ICE | $ | 3,400,000 | 6/20/22 | $ | 257,657 | $ | — | $ | (17,323 | ) | $ | 240,334 | Non- | ||||||||||||||||||||
|
| |||||||||||||||||||||||||||||||||||
| Investment | ||||||||||||||||||||||||||||||||||||
| Grade | ||||||||||||||||||||||||||||||||||||
| OTC Swap Contracts | ||||||||||||||||||||||||||||||||||||
| Contracts to Buy Protection | ||||||||||||||||||||||||||||||||||||
| Single Name | ||||||||||||||||||||||||||||||||||||
Best Buy Co. Inc. | 5.00 | % | CITI | 2,000,000 | 6/20/22 | (350,107 | ) | — | (5,572 | ) | (355,679 | ) | ||||||||||||||||||||||||
Kohl’s Corp. | 1.00 | % | CITI | 1,300,000 | 6/20/22 | 71,495 | 11,477 | — | 82,972 | |||||||||||||||||||||||||||
Macy’s Retail Holdings Inc. | 1.00 | % | CITI | 1,100,000 | 6/20/22 | 80,347 | 4,454 | — | 84,801 | |||||||||||||||||||||||||||
| Contracts to Sell Protectionc | ||||||||||||||||||||||||||||||||||||
| Single Name | ||||||||||||||||||||||||||||||||||||
Government of Argentina | 5.00 | % | CITI | 2,000,000 | 6/20/22 | 155,684 | 564 | — | 156,248 | B | ||||||||||||||||||||||||||
Government of Argentina | 5.00 | % | JPHQ | 1,700,000 | 6/20/22 | 145,564 | — | (12,753 | ) | 132,811 | B | |||||||||||||||||||||||||
Government of Brazil | 1.00 | % | FBCO | 2,000,000 | 6/20/22 | (128,174 | ) | 1,416 | — | (126,758 | ) | BB | ||||||||||||||||||||||||
Government of Colombia | 1.00 | % | JPHQ | 3,700,000 | 6/20/22 | (53,075 | ) | — | (8,918 | ) | (61,993 | ) | BBB | |||||||||||||||||||||||
Government of Mexico | 1.00 | % | FBCO | 1,700,000 | 6/20/22 | (6,431 | ) | — | (3,350 | ) | (9,781 | ) | BBB+ | |||||||||||||||||||||||
| Traded Index | ||||||||||||||||||||||||||||||||||||
Citibank Bespoke 58 IG/42 HY Equity Tranche 0-3% Index | 0.00 | % | CITI | 530,000 | 6/20/19 | (123,688 | ) | 29,475 | — | (94,213 | ) | Non- | ||||||||||||||||||||||||
| Investment | ||||||||||||||||||||||||||||||||||||
| Grade | ||||||||||||||||||||||||||||||||||||
MCDX.NA.28 | 1.00 | % | CITI | 3,025,000 | 6/20/22 | 46,172 | 2,766 | — | 48,938 | Investment | ||||||||||||||||||||||||||
|
| |||||||||||||||||||||||||||||||||||
| Grade | ||||||||||||||||||||||||||||||||||||
Total OTC Swap Contracts | $ | (162,213 | ) | $ | 50,152 | $ | (30,593 | ) | $ | (142,654 | ) | |||||||||||||||||||||||||
|
| |||||||||||||||||||||||||||||||||||
Total Credit Default Swap Contracts | $95,444 | $ | 50,152 | $ | (47,916 | ) | $97,680 | |||||||||||||||||||||||||||||
|
| |||||||||||||||||||||||||||||||||||
Net unrealized appreciation (depreciation) | $2,236 | |||||||||||||||||||||||||||||||||||
|
| |||||||||||||||||||||||||||||||||||
aFor contracts to sell protection, the notional amount is equal to the maximum potential amount of the future payments and no recourse provisions have been entered into in association with the contracts.
bBased on Standard and Poor’s (S&P) Rating for single name swaps and internal ratings for index swaps. Internal ratings based on mapping into equivalent ratings from external vendors.
cThe fund enters contracts to sell protection to create a long credit position. Performance triggers include default, bankruptcy or restructuring for single name swaps and failure to pay or bankruptcy of the underlying securities for traded index swaps.
See Note 9 regarding other derivative information.
See Abbreviations on page FSI-49.
| The accompanying notes are an integral part of these consolidated financial statements. | Semiannual Report | FSI-27 |
FRANKLIN TEMPLETON VARIABLE INSURANCE PRODUCTS TRUST
Consolidated Financial Statements
Consolidated Statement of Assets and Liabilities
June 30, 2017 (unaudited)
| Franklin Strategic Income VIP Fund | ||||
Assets: | ||||
Investments in securities: | ||||
Cost - Unaffiliated issuers | $ | 640,398,536 | ||
Cost - Non-controlled affiliates (Note 3e) | 57,399,762 | |||
|
| |||
Total cost of investments | $ | 697,798,298 | ||
|
| |||
Value - Unaffiliated issuers | $ | 638,782,952 | ||
Value - Non-controlled affiliates (Note 3e) | 59,087,866 | |||
|
| |||
Total value of investments | 697,870,818 | |||
Cash | 558,978 | |||
Foreign currency, at value (cost $16,360) | 16,336 | |||
Receivables: | ||||
Investment securities sold | 3,297,024 | |||
Capital shares sold | 531,331 | |||
Dividends and interest | 6,312,410 | |||
Due from brokers | 1,762,389 | |||
OTC swap contracts (upfront payments $509,705) | 499,262 | |||
Unrealized appreciation on OTC forward exchange contracts | 148,500 | |||
Unrealized appreciation on OTC swap contracts | 50,152 | |||
|
| |||
Total assets | 711,047,200 | |||
|
| |||
Liabilities: | ||||
Payables: | ||||
Investment securities purchased | 38,755,451 | |||
Capital shares redeemed | 1,334,845 | |||
Management fees | 306,096 | |||
Distribution fees | 134,069 | |||
Variation margin | 22,575 | |||
OTC swap contracts (upfront receipts $689,557) | 661,475 | |||
Unrealized depreciation on OTC forward exchange contracts | 2,275,380 | |||
Unrealized depreciation on OTC swap contracts | 30,593 | |||
Deferred tax | 70,043 | |||
Accrued expenses and other liabilities | 182,327 | |||
|
| |||
Total liabilities | 43,772,854 | |||
|
| |||
Net assets, at value | $ | 667,274,346 | ||
|
| |||
Net assets consist of: | ||||
Paid-in capital | $ | 693,003,582 | ||
Undistributed net investment income | 7,093,159 | |||
Net unrealized appreciation (depreciation) | (2,294,824 | ) | ||
Accumulated net realized gain (loss) | (30,527,571 | ) | ||
|
| |||
Net assets, at value | $ | 667,274,346 | ||
|
| |||
| FSI-28 | Semiannual Report | The accompanying notes are an integral part of these consolidated financial statements. |
FRANKLIN TEMPLETON VARIABLE INSURANCE PRODUCTS TRUST
CONSOLIDATED FINANCIAL STATEMENTS
Consolidated Statement of Assets and Liabilities (continued)
June 30, 2017 (unaudited)
| Franklin Strategic Income VIP Fund | ||||
| Class 1: | ||||
Net assets, at value | $ | 379,252,685 | ||
|
| |||
Shares outstanding | 34,447,004 | |||
|
| |||
Net asset value and maximum offering price per share | $ | 11.01 | ||
|
| |||
| Class 2: | ||||
Net assets, at value | $ | 211,739,091 | ||
|
| |||
Shares outstanding | 19,891,201 | |||
|
| |||
Net asset value and maximum offering price per share | $ | 10.64 | ||
|
| |||
| Class 4: | ||||
Net assets, at value | $ | 76,282,570 | ||
|
| |||
Shares outstanding | 6,981,075 | |||
|
| |||
Net asset value and maximum offering price per share | $ | 10.93 | ||
|
| |||
| The accompanying notes are an integral part of these consolidated financial statements. | Semiannual Report | FSI-29 |
FRANKLIN TEMPLETON VARIABLE INSURANCE PRODUCTS TRUST
CONSOLIDATED FINANCIAL STATEMENTS
| Consolidated Statement of Operations | ||||
| for the six months ended June 30, 2017 (unaudited) |
| Franklin Strategic Income VIP Fund | ||||
Investment income: | ||||
Dividends: | ||||
Unaffiliated issuers | $ | 347,217 | ||
Non-controlled affiliates (Note 3e) | 1,779,855 | |||
Interest | 13,646,437 | |||
|
| |||
Total investment income | 15,773,509 | |||
|
| |||
Expenses: | ||||
Management fees (Note 3a) | 2,009,150 | |||
Distribution fees: (Note 3c) | ||||
Class 2 | 258,085 | |||
Class 4 | 136,362 | |||
Custodian fees (Note 4) | 13,956 | |||
Reports to shareholders | 83,958 | |||
Professional fees | 47,585 | |||
Trustees’ fees and expenses | 1,644 | |||
Other | 144,273 | |||
|
| |||
Total expenses | 2,695,013 | |||
Expense reductions (Note 4) | (889 | ) | ||
Expenses waived/paid by affiliates (Note 3e) | (183,291 | ) | ||
|
| |||
Net expenses | 2,510,833 | |||
|
| |||
Net investment income | 13,262,676 | |||
|
| |||
Realized and unrealized gains (losses): | ||||
Net realized gain (loss) from: | ||||
Investments: | ||||
Unaffiliated issuers | (9,304,401 | ) | ||
Non-controlled affiliates (Note 3e) | 332,845 | |||
Foreign currency transactions | 2,499,158 | |||
Futures contracts | 594,361 | |||
Swap contracts | 45,207 | |||
|
| |||
Net realized gain (loss) | (5,832,830 | ) | ||
|
| |||
Net change in unrealized appreciation (depreciation) on: | ||||
Investments | 19,353,716 | |||
Translation of other assets and liabilities denominated in foreign currencies | (5,655,197 | ) | ||
Futures contracts | (235,198 | ) | ||
Swap contracts | 39,348 | |||
Change in deferred taxes on unrealized appreciation | (41,940 | ) | ||
|
| |||
Net change in unrealized appreciation (depreciation) | 13,460,729 | |||
|
| |||
Net realized and unrealized gain (loss) | 7,627,899 | |||
|
| |||
Net increase (decrease) in net assets resulting from operations | $ | 20,890,575 | ||
|
| |||
| FSI-30 | Semiannual Report | The accompanying notes are an integral part of these consolidated financial statements. |
FRANKLIN TEMPLETON VARIABLE INSURANCE PRODUCTS TRUST
CONSOLIDATED FINANCIAL STATEMENTS
Consolidated Statements of Changes in Net Assets
| Franklin Strategic Income VIP Fund | ||||||||
| Six Months Ended June 30, 2017 (unaudited) | Year Ended December 31, 2016 | |||||||
Increase (decrease) in net assets: | ||||||||
Operations: | ||||||||
Net investment income | $ | 13,262,676 | $ | 30,329,844 | ||||
Net realized gain (loss) | (5,832,830 | ) | (23,035,691 | ) | ||||
Net change in unrealized appreciation (depreciation) | 13,460,729 | 47,403,999 | ||||||
|
| |||||||
Net increase (decrease) in net assets resulting from operations | 20,890,575 | 54,698,152 | ||||||
|
| |||||||
Distributions to shareholders from: | ||||||||
Net investment income: | ||||||||
Class 1 | (11,689,930 | ) | (15,028,686 | ) | ||||
Class 2 | (6,228,631 | ) | (6,934,919 | ) | ||||
Class 4 | (2,076,378 | ) | (2,790,452 | ) | ||||
|
| |||||||
Total distributions to shareholders | (19,994,939 | ) | (24,754,057 | ) | ||||
|
| |||||||
Capital share transactions: (Note 2) | ||||||||
Class 1 | (17,505,504 | ) | (63,348,838 | ) | ||||
Class 2 | 8,281,516 | (7,135,423 | ) | |||||
Class 4 | (4,160,566 | ) | (16,512,240 | ) | ||||
|
| |||||||
Total capital share transactions | (13,384,554 | ) | (86,996,501 | ) | ||||
|
| |||||||
Net increase (decrease) in net assets | (12,488,918 | ) | (57,052,406 | ) | ||||
Net assets: | ||||||||
Beginning of period | 679,763,264 | 736,815,670 | ||||||
|
| |||||||
End of period | $ | 667,274,346 | $ | 679,763,264 | ||||
|
| |||||||
Undistributed net investment income included in net assets: | ||||||||
End of period | $ | 7,093,159 | $ | 13,825,422 | ||||
|
| |||||||
| The accompanying notes are an integral part of these consolidated financial statements. | Semiannual Report | FSI-31 |
FRANKLIN TEMPLETON VARIABLE INSURANCE PRODUCTS TRUST
Notes to Consolidated Financial Statements (unaudited)
Franklin Strategic Income VIP Fund
1. Organization and Significant Accounting Policies
Franklin Templeton Variable Insurance Products Trust (Trust) is registered under the Investment Company Act of 1940 (1940 Act) as an open-end management investment company, consisting of eighteen separate funds and applies the specialized accounting and reporting guidance in U.S. Generally Accepted Accounting Principles (U.S. GAAP). Franklin Strategic Income VIP Fund (Fund) is included in this report. Shares of the Fund are generally sold only to insurance company separate accounts to fund the benefits of variable life insurance policies or variable annuity contracts. At June 30, 2017, 69.0% of the Fund’s shares were held through one insurance company. Investment activities of these insurance company separate accounts could have a material impact on the Fund. The Fund offers three classes of shares: Class 1, Class 2 and Class 4. Each class of shares may differ by its distribution fees, voting rights on matters affecting a single class and its exchange privilege.
The following summarizes the Fund’s significant accounting policies.
a. Financial Instrument Valuation
The Fund’s investments in financial instruments are carried at fair value daily. Fair value is the price that would be received to sell an asset or paid to transfer a liability in an orderly transaction between market participants on the measurement date. The Fund calculates the net asset value (NAV) per share as of 4 p.m. Eastern time each day the New York Stock Exchange (NYSE) is open for trading. Under compliance policies and procedures approved by the Trust’s Board of Trustees (the Board), the Fund’s administrator has responsibility for oversight of valuation, including leading the cross-functional Valuation Committee (VC). The VC provides administration and oversight of the Fund’s valuation policies and procedures, which are approved annually by the Board. Among other things, these procedures allow the Fund to utilize independent pricing services, quotations from securities and financial instrument dealers, and other market sources to determine fair value.
Equity securities and derivative financial instruments listed on an exchange or on the NASDAQ National Market System are valued at the last quoted sale price or the official closing price of the day, respectively. Foreign equity securities are valued as of the close of trading on the foreign stock exchange on which the security is primarily traded, or as of 4 p.m. Eastern time.
The value is then converted into its U.S. dollar equivalent at the foreign exchange rate in effect at 4 p.m. Eastern time on the day that the value of the security is determined. Over-the-counter (OTC) securities are valued within the range of the most recent quoted bid and ask prices. Securities that trade in multiple markets or on multiple exchanges are valued according to the broadest and most representative market. Certain equity securities are valued based upon fundamental characteristics or relationships to similar securities.
Debt securities generally trade in the OTC market rather than on a securities exchange. The Fund’s pricing services use multiple valuation techniques to determine fair value. In instances where sufficient market activity exists, the pricing services may utilize a market-based approach through which quotes from market makers are used to determine fair value. In instances where sufficient market activity may not exist or is limited, the pricing services also utilize proprietary valuation models which may consider market characteristics such as benchmark yield curves, credit spreads, estimated default rates, anticipated market interest rate volatility, coupon rates, anticipated timing of principal repayments, underlying collateral, and other unique security features in order to estimate the relevant cash flows, which are then discounted to calculate the fair value. Securities denominated in a foreign currency are converted into their U.S. dollar equivalent at the foreign exchange rate in effect at 4 p.m. Eastern time on the date that the values of the foreign debt securities are determined.
Investments in open-end mutual funds are valued at the closing NAV.
Certain derivative financial instruments are centrally cleared or traded in the OTC market. The Fund’s pricing services use various techniques including industry standard option pricing models and proprietary discounted cash flow models to determine the fair value of those instruments. The Fund’s net benefit or obligation under the derivative contract, as measured by the fair value of the contract, is included in net assets.
The Fund has procedures to determine the fair value of financial instruments for which market prices are not reliable or readily available. Under these procedures, the VC convenes on a regular basis to review such financial instruments and considers a number of factors, including significant unobservable valuation inputs, when arriving at fair value. The VC primarily employs a market-based approach which may use related or comparable assets or liabilities, recent transactions, market
| FSI-32 | Semiannual Report |
FRANKLIN TEMPLETON VARIABLE INSURANCE PRODUCTS TRUST
NOTES TO CONSOLIDATED FINANCIAL STATEMENTS (UNAUDITED)
Franklin Strategic Income VIP Fund (continued)
multiples, book values, and other relevant information for the investment to determine the fair value of the investment. An income-based valuation approach may also be used in which the anticipated future cash flows of the investment are discounted to calculate fair value. Discounts may also be applied due to the nature or duration of any restrictions on the disposition of the investments. Due to the inherent uncertainty of valuations of such investments, the fair values may differ significantly from the values that would have been used had an active market existed. The VC employs various methods for calibrating these valuation approaches including a regular review of key inputs and assumptions, transactional back-testing or disposition analysis, and reviews of any related market activity.
Trading in securities on foreign securities stock exchanges and OTC markets may be completed before 4 p.m. Eastern time. In addition, trading in certain foreign markets may not take place on every Fund’s business day. Occasionally, events occur between the time at which trading in a foreign security is completed and 4 p.m. Eastern time that might call into question the reliability of the value of a portfolio security held by the Fund. As a result, differences may arise between the value of the Fund’s portfolio securities as determined at the foreign market close and the latest indications of value at 4 p.m. Eastern time. In order to minimize the potential for these differences, the VC monitors price movements following the close of trading in foreign stock markets through a series of country specific market proxies (such as baskets of American Depositary Receipts, futures contracts and exchange traded funds). These price movements are measured against established trigger thresholds for each specific market proxy to assist in determining if an event has occurred that may call into question the reliability of the values of the foreign securities held by the Fund. If such an event occurs, the securities may be valued using fair value procedures, which may include the use of independent pricing services.
When the last day of the reporting period is a non-business day, certain foreign markets may be open on those days that the Fund’s NAV is not calculated, which could result in differences between the value of the Fund’s portfolio securities on the last business day and the last calendar day of the reporting period. Any significant security valuation changes due to an open foreign market are adjusted and reflected by the Fund for financial reporting purposes.
b. Foreign Currency Translation
Portfolio securities and other assets and liabilities denominated in foreign currencies are translated into U.S. dollars based on the exchange rate of such currencies against U.S. dollars on the date of valuation. The Fund may enter into foreign currency exchange contracts to facilitate transactions denominated in a foreign currency. Purchases and sales of securities, income and expense items denominated in foreign currencies are translated into U.S. dollars at the exchange rate in effect on the transaction date. Portfolio securities and assets and liabilities denominated in foreign currencies contain risks that those currencies will decline in value relative to the U.S. dollar. Occasionally, events may impact the availability or reliability of foreign exchange rates used to convert the U.S. dollar equivalent value. If such an event occurs, the foreign exchange rate will be valued at fair value using procedures established and approved by the Board.
The Fund does not separately report the effect of changes in foreign exchange rates from changes in market prices on securities held. Such changes are included in net realized and unrealized gain or loss from investments in the Consolidated Statement of Operations.
Realized foreign exchange gains or losses arise from sales of foreign currencies, currency gains or losses realized between the trade and settlement dates on securities transactions and the difference between the recorded amounts of dividends, interest, and foreign withholding taxes and the U.S. dollar equivalent of the amounts actually received or paid. Net unrealized foreign exchange gains and losses arise from changes in foreign exchange rates on foreign denominated assets and liabilities other than investments in securities held at the end of the reporting period.
c. Securities Purchased on a When-Issued or Delayed Delivery and TBA Basis
The Fund purchases securities on a when-issued or delayed delivery and TBA basis, with payment and delivery scheduled for a future date. These transactions are subject to market fluctuations and are subject to the risk that the value at delivery may be more or less than the trade date purchase price. Although the Fund will generally purchase these securities with the intention of holding the securities, it may sell the securities before the settlement date.
| Semiannual Report | FSI-33 |
FRANKLIN TEMPLETON VARIABLE INSURANCE PRODUCTS TRUST
NOTES TO CONSOLIDATED FINANCIAL STATEMENTS (UNAUDITED)
Franklin Strategic Income VIP Fund (continued)
1. Organization and Significant Accounting Policies (continued)
d. Derivative Financial Instruments
The Fund invested in derivative financial instruments in order to manage risk or gain exposure to various other investments or markets. Derivatives are financial contracts based on an underlying or notional amount, require no initial investment or an initial net investment that is smaller than would normally be required to have a similar response to changes in market factors, and require or permit net settlement. Derivatives contain various risks including the potential inability of the counterparty to fulfill their obligations under the terms of the contract, the potential for an illiquid secondary market, and/or the potential for market movements which expose the Fund to gains or losses in excess of the amounts shown in the Consolidated Statement of Assets and Liabilities. Realized gain and loss and unrealized appreciation and depreciation on these contracts for the period are included in the Consolidated Statement of Operations.
Derivative counterparty credit risk is managed through a formal evaluation of the creditworthiness of all potential counter-parties. The Fund attempts to reduce its exposure to counterparty credit risk on OTC derivatives, whenever possible, by entering into International Swaps and Derivatives Association (ISDA) master agreements with certain counterparties. These agreements contain various provisions, including but not limited to collateral requirements, events of default, or early termination. Termination events applicable to the counterparty include certain deteriorations in the credit quality of the counterparty. Termination events applicable to the Fund include failure of the Fund to maintain certain net asset levels and/or limit the decline in net assets over various periods of time. In the event of default or early termination, the ISDA master agreement gives the non-defaulting party the right to net and close-out all transactions traded, whether or not arising under the ISDA agreement, to one net amount payable by one counterparty to the other. However, absent an event of default or early termination, OTC derivative assets and liabilities are presented gross and not offset in the Consolidated Statement of Assets and Liabilities. Early termination by the counterparty may result in an immediate payment by the Fund of any net liability owed to that counterparty under the ISDA agreement.
Collateral requirements differ by type of derivative. Collateral or initial margin requirements are set by the broker or exchange clearing house for exchange traded and centrally cleared derivatives. Initial margin deposited is held at the exchange and
can be in the form of cash and/or securities. For OTC derivatives traded under an ISDA master agreement, posting of collateral is required by either the Fund or the applicable counterparty if the total net exposure of all OTC derivatives with the applicable counterparty exceeds the minimum transfer amount, which typically ranges from $100,000 to $250,000, and can vary depending on the counterparty and the type of the agreement. Generally, collateral is determined at the close of Fund business each day and any additional collateral required due to changes in derivative values may be delivered by the Fund or the counterparty the next business day, or within a few business days. Collateral pledged and/or received by the Fund for OTC derivatives, if any, is held in segregated accounts with the Fund’s custodian/counterparty broker and can be in the form of cash and/or securities. Unrestricted cash may be invested according to the Fund’s investment objectives. To the extent that the amounts due to the Fund from its counterparties are not subject to collateralization or are not fully collateralized, the Fund bears the risk of loss from counterparty non-performance.
The Fund entered into exchange traded futures contracts primarily to manage and/or gain exposure to interest rate risk. A futures contract is an agreement between the Fund and a counterparty to buy or sell an asset at a specified price on a future date. Required initial margins are pledged by the Fund, and the daily change in fair value is accounted for as a variation margin payable or receivable.
The Fund entered into OTC forward exchange contracts primarily to manage and/or gain exposure to certain foreign currencies. A forward exchange contract is an agreement between the Fund and a counterparty to buy or sell a foreign currency at a specific exchange rate on a future date.
The Fund entered into credit default swap contracts primarily to manage exposure to credit risk. A credit default swap is an agreement between the Fund and a counterparty whereby the buyer of the contract receives credit protection and the seller of the contract guarantees the credit worthiness of a referenced debt obligation. These agreements may be privately negotiated in the over-the-counter market (OTC credit default swaps) or may be executed in a multilateral trade facility platform, such as a registered exchange (centrally cleared credit default swaps). The underlying referenced debt obligation may be a single issuer of corporate or sovereign debt, a credit index, a basket of issuers or indices, or a tranche of a credit index or basket of issuers or indices. In the event of a default of the underlying referenced debt obligation, the buyer is entitled to receive the
| FSI-34 | Semiannual Report |
FRANKLIN TEMPLETON VARIABLE INSURANCE PRODUCTS TRUST
NOTES TO CONSOLIDATED FINANCIAL STATEMENTS (UNAUDITED)
Franklin Strategic Income VIP Fund (continued)
notional amount of the credit default swap contract from the seller in exchange for the referenced debt obligation, a net settlement amount equal to the notional amount of the credit default swap less the recovery value of the referenced debt obligation, or other agreed upon amount. For centrally cleared credit default swaps, required initial margins are pledged by the Fund, and the daily change in fair value is accounted for as a variation margin payable or receivable in the Consolidated Statement of Assets and Liabilities. Over the term of the contract, the buyer pays the seller a periodic stream of payments, provided that no event of default has occurred. Such periodic payments are accrued daily as an unrealized appreciation or depreciation until the payments are made, at which time they are realized. Upfront payments and receipts are reflected in the Consolidated Statement of Assets and Liabilities and represent compensating factors between stated terms of the credit default swap agreement and prevailing market conditions (credit spreads and other relevant factors). These upfront payments and receipts are amortized over the term of the contract as a realized gain or loss in the Consolidated Statement of Operations.
The Fund invests in value recovery instruments (VRI) primarily to gain exposure to growth risk. Periodic payments from VRI are dependent on established benchmarks for underlying variables. VRI has a notional amount, which is used to calculate amounts of payments to holders. Payments are recorded upon receipt as realized gains in the Consolidated Statement of Operations. The risks of investing in VRI include growth risk, liquidity, and the potential loss of investment.
See Note 9 regarding other derivative information.
e. Loan Participation Notes
The Fund invests in loan participation notes (Participations). Participations are loans originally issued to a borrower by one or more financial institutions (the Lender) and subsequently sold to other investors, such as the Fund. Participations typically result in the Fund having a contractual relationship only with the Lender and not with the borrower. The Fund has the right to receive from the Lender any payments of principal, interest and fees which the Lender received from the borrower. The Fund generally has no rights to either enforce compliance by the borrower with the terms of the loan agreement or to any collateral relating to the original loan. As a result, the Fund assumes the credit risk of both the borrower and the Lender that
is selling the Participation. The Participations may also involve interest rate risk and liquidity risk, including the potential default or insolvency of the borrower and/or the Lender.
f. Investments in FT Holdings Corporation III (FT Subsidiary)
The Fund invests in certain financial instruments through its investment in FT subsidiary. FT subsidiary is a Delaware Corporation, is a wholly-owned subsidiary of the Fund, and is able to invest in certain financial instruments consistent with the investment objective of the Fund. At June 30, 2017, FT Subsidiary’s investment, Turtle Bay Resort, as well as any other assets and liabilities of FT subsidiary are reflected in the Fund’s Consolidated Statement of Investments and Consolidated Statement of Assets and Liabilities. The financial statements have been consolidated and include the accounts of the Fund and FT subsidiary. All intercompany transactions and balances have been eliminated. At June 30, 2017, the net assets of FT subsidiary were $8,904,907, representing 1.3% of the Fund’s consolidated net assets. The Fund’s investment in FT subsidiary is limited to 25% of consolidated assets.
g. Mortgage Dollar Rolls
The Fund enters into mortgage dollar rolls, typically on a TBA basis. Mortgage dollar rolls are agreements between the Fund and a financial institution where the Fund sells (or buys) mortgage-backed securities for delivery on a specified date and simultaneously contracts to repurchase (or sell) substantially similar (same type, coupon, and maturity) securities at a future date and at a predetermined price. Gains or losses are realized on the initial sale, and the difference between the repurchase price and the sale price is recorded as an unrealized gain or loss to the Fund upon entering into the mortgage dollar roll. In addition, the Fund may invest the cash proceeds that are received from the initial sale. During the period between the sale and repurchase, the Fund is not entitled to principal and interest paid on the mortgage backed securities. Transactions in mortgage dollar rolls are accounted for as purchases and sales and may result in an increase to the Fund’s portfolio turnover rate. The risks of mortgage dollar roll transactions include the potential inability of the counterparty to fulfill its obligations.
h. Senior Floating Rate Interests
The Fund invests in senior secured corporate loans that pay interest at rates which are periodically reset by reference to a base lending rate plus a spread. These base lending rates are
| Semiannual Report | FSI-35 |
FRANKLIN TEMPLETON VARIABLE INSURANCE PRODUCTS TRUST
NOTES TO CONSOLIDATED FINANCIAL STATEMENTS (UNAUDITED)
Franklin Strategic Income VIP Fund (continued)
1. Organization and Significant Accounting Policies (continued)
h. Senior Floating Rate Interests (continued)
generally the prime rate offered by a designated U.S. bank or the London InterBank Offered Rate (LIBOR). Senior secured corporate loans often require prepayment of principal from excess cash flows or at the discretion of the borrower. As a result, actual maturity may be substantially less than the stated maturity. Senior secured corporate loans in which the Fund invests are generally readily marketable, but may be subject to certain restrictions on resale.
i. Income and Deferred Taxes
It is the Fund’s policy to qualify as a regulated investment company under the Internal Revenue Code. The Fund intends to distribute to shareholders substantially all of its taxable income and net realized gains to relieve it from federal income and if applicable, excise taxes. As a result, no provision for U.S. federal income taxes is required.
The Fund may be subject to foreign taxation related to income received, capital gains on the sale of securities and certain foreign currency transactions in the foreign jurisdictions in which it invests. Foreign taxes, if any, are recorded based on the tax regulations and rates that exist in the foreign markets in which the Fund invests. When a capital gain tax is determined to apply, the Fund records an estimated deferred tax liability in an amount that would be payable if the securities were disposed of on the valuation date.
The Fund may recognize an income tax liability related to its uncertain tax positions under U.S. GAAP when the uncertain tax position has a less than 50% probability that it will be sustained upon examination by the tax authorities based on its technical merits. As of June 30, 2017, the Fund has determined that no tax liability is required in its financial statements related to uncertain tax positions for any open tax years (or expected to be taken in future tax years). Open tax years are those that remain subject to examination and are based on each tax jurisdiction’s statute of limitation.
j. Security Transactions, Investment Income, Expenses and Distributions
Security transactions are accounted for on trade date. Realized gains and losses on security transactions are determined on a specific identification basis. Interest income and estimated
expenses are accrued daily. Amortization of premium and accretion of discount on debt securities are included in interest income. Paydown gains and losses are recorded as an adjustment to interest income. Facility fees are recognized as income over the expected term of the loan. Dividend income is recorded on the ex-dividend date. Distributions to shareholders are recorded on the ex-dividend date. Distributable earnings are determined according to income tax regulations (tax basis) and may differ from earnings recorded in accordance with U.S. GAAP. These differences may be permanent or temporary. Permanent differences are reclassified among capital accounts to reflect their tax character. These reclassifications have no impact on net assets or the results of operations. Temporary differences are not reclassified, as they may reverse in subsequent periods.
Common expenses incurred by the Trust are allocated among the Funds based on the ratio of net assets of each Fund to the combined net assets of the Trust. Fund specific expenses are charged directly to the Fund that incurred the expense.
Realized and unrealized gains and losses and net investment income, not including class specific expenses, are allocated daily to each class of shares based upon the relative proportion of net assets of each class. Differences in per share distributions, by class, are generally due to differences in class specific expenses.
Inflation-indexed bonds are adjusted for inflation through periodic increases or decreases in the security’s interest accruals, face amount, or principal redemption value, by amounts corresponding to the rate of inflation as measured by an index. Any increase or decrease in the face amount or principal redemption value will be included as interest income in the Consolidated Statement of Operations.
k. Accounting Estimates
The preparation of financial statements in accordance with U.S. GAAP requires management to make estimates and assumptions that affect the reported amounts of assets and liabilities at the date of the financial statements and the amounts of income and expenses during the reporting period. Actual results could differ from those estimates.
| FSI-36 | Semiannual Report |
FRANKLIN TEMPLETON VARIABLE INSURANCE PRODUCTS TRUST
NOTES TO CONSOLIDATED FINANCIAL STATEMENTS (UNAUDITED)
Franklin Strategic Income VIP Fund (continued)
l. Guarantees and Indemnifications
Under the Trust’s organizational documents, its officers and trustees are indemnified by the Trust against certain liabilities arising out of the performance of their duties to the Trust. Additionally, in the normal course of business, the Trust, on behalf of the Fund, enters into contracts with service providers
that contain general indemnification clauses. The Trust’s maximum exposure under these arrangements is unknown as this would involve future claims that may be made against the Trust that have not yet occurred. Currently, the Trust expects the risk of loss to be remote.
2. Shares of Beneficial Interest
At June 30, 2017, there were an unlimited number of shares authorized (without par value). Transactions in the Fund’s shares were as follows:
| Six Months Ended June 30, 2017 | Year Ended December 31, 2016 | |||||||||||||||||||
| Shares | Amount | Shares | Amount | |||||||||||||||||
| Class 1 Shares: | ||||||||||||||||||||
Shares sold | 341,390 | $ | 3,804,879 | 468,712 | $ | 5,060,377 | ||||||||||||||
Shares issued in reinvestment of distributions | 1,057,912 | 11,689,929 | 1,427,226 | 15,028,686 | ||||||||||||||||
Shares redeemed | (2,951,081 | ) | (33,000,312 | ) | (7,769,695 | ) | (83,437,901 | ) | ||||||||||||
|
| |||||||||||||||||||
Net increase (decrease) | (1,551,779 | ) | $ | (17,505,504 | ) | (5,873,757 | ) | $ | (63,348,838 | ) | ||||||||||
|
| |||||||||||||||||||
| Class 2 Shares: | ||||||||||||||||||||
Shares sold | 1,947,827 | $ | 21,055,464 | 2,848,537 | $ | 29,648,040 | ||||||||||||||
Shares issued in reinvestment of distributions | 583,205 | 6,228,631 | 679,894 | 6,934,919 | ||||||||||||||||
Shares redeemed | (1,759,175 | ) | (19,002,579 | ) | (4,217,745 | ) | (43,718,382 | ) | ||||||||||||
|
| |||||||||||||||||||
Net increase (decrease) | 771,857 | $ | 8,281,516 | (689,314 | ) | $ | (7,135,423 | ) | ||||||||||||
|
| |||||||||||||||||||
| Class 4 Shares: | ||||||||||||||||||||
Shares sold | 155,424 | $ | 1,717,526 | 197,446 | $ | 2,112,111 | ||||||||||||||
Shares issued in reinvestment of distributions | 189,278 | 2,076,378 | 267,029 | 2,790,452 | ||||||||||||||||
Shares redeemed | (718,470 | ) | (7,954,470 | ) | (2,012,761 | ) | (21,414,803 | ) | ||||||||||||
|
| |||||||||||||||||||
Net increase (decrease) | (373,768 | ) | $ | (4,160,566 | ) | (1,548,286 | ) | $ | (16,512,240 | ) | ||||||||||
|
| |||||||||||||||||||
3. Transactions with Affiliates
Franklin Resources, Inc. is the holding company for various subsidiaries that together are referred to as Franklin Templeton Investments. Certain officers and trustees of the Fund are also officer and/or directors of the following subsidiaries:
| Subsidiary | Affiliation | |
Franklin Advisers, Inc. (Advisers) | Investment manager | |
Franklin Templeton Services, LLC (FT Services) | Administrative manager | |
Franklin Templeton Distributors, Inc. (Distributors) | Principal underwriter | |
Franklin Templeton Investor Services, LLC (Investor Services) | Transfer agent |
| Semiannual Report | FSI-37 |
FRANKLIN TEMPLETON VARIABLE INSURANCE PRODUCTS TRUST
NOTES TO CONSOLIDATED FINANCIAL STATEMENTS (UNAUDITED)
Franklin Strategic Income VIP Fund (continued)
3. Transactions with Affiliates (continued)
a. Management Fees
The Fund pays an investment management fee to Advisers based on the average daily net assets of the Fund as follows:
| Annualized Fee Rate | Net Assets | |
0.625% | Up to and including $500 million | |
0.525% | Over $500 million, up to and including $1 billion | |
0.480% | Over $1 billion, up to and including $1.5 billion | |
0.435% | Over $1.5 billion, up to and including $6.5 billion | |
0.415% | Over $6.5 billion, up to and including $11.5 billion | |
0.400% | Over $11.5 billion, up to and including $16.5 billion | |
0.390% | Over $16.5 billion, up to and including $19 billion | |
0.380% | Over $19 billion, up to and including $21.5 billion | |
0.370% | In excess of $21.5 billion |
For the period ended June 30, 2017, the annualized effective investment management fee rate was 0.599% of the Fund’s average daily net assets.
b. Administrative Fees
Under an agreement with Advisers, FT Services provides administrative services to the Fund. The fee is paid by Advisers based on the Fund’s average daily net assets, and is not an additional expense of the Fund.
c. Distribution Fees
The Board has adopted distribution plans for Class 2 and Class 4 shares pursuant to Rule 12b-1 under the 1940 Act. Under the Fund’s compensation distribution plans, the Fund pays Distributors for costs incurred in connection with the servicing, sale and distribution of the Fund’s shares up to 0.25% and 0.35% per year of its average daily net assets of Class 2 and Class 4, respectively. The plan year, for purposes of monitoring compliance with the maximum annual plan rates, is February 1 through January 31.
d. Transfer Agent Fees
Investor Services, under terms of an agreement, performs shareholder servicing for the Fund and is not paid by the Fund for the services.
e. Investments in Affiliated Management Investment Companies
The Fund invests in one or more affiliated management investment companies for purposes other than exercising a controlling influence over the management or policies. Management fees paid by the Fund are waived on assets invested in the affiliated management investment companies, as noted in the Consolidated Statement of Operations, in an amount not to exceed the management and administrative fees paid directly or indirectly by each affiliate. Prior to January 1, 2014, the waiver was accounted for as a reduction to management fees. During the period ended June 30, 2017, the Fund held investments in affiliated management investment companies as follows:
| FSI-38 | Semiannual Report |
FRANKLIN TEMPLETON VARIABLE INSURANCE PRODUCTS TRUST
NOTES TO CONSOLIDATED FINANCIAL STATEMENTS (UNAUDITED)
Franklin Strategic Income VIP Fund (continued)
| Number of Shares Held at Beginning of Period | Gross Additions | Gross Reductions | Number Held at | Value at End of Period | Investment Income | Realized Gain (Loss) | % of Affiliated Fund Shares Outstanding Held at End of Period | |||||||||||||||||||||||||
| Non-Controlled Affiliates | ||||||||||||||||||||||||||||||||
Franklin Lower Tier Floating Rate Fund | 2,590,404 | — | (508,543 | ) | 2,081,861 | $ | 21,942,813 | $ | 1,015,897 | $ | 310,211 | 6.4% | ||||||||||||||||||||
Franklin Middle Tier Floating Rate Fund | 2,175,846 | — | (150,895 | ) | 2,024,951 | 20,330,512 | 716,353 | 22,634 | 6.7% | |||||||||||||||||||||||
Institutional Fiduciary Trust Money Market Portfolio, 0.58% | 27,288,407 | 79,977,678 | (90,451,544 | ) | 16,814,541 | 16,814,541 | 47,605 | — | 0.1% | |||||||||||||||||||||||
|
| |||||||||||||||||||||||||||||||
Total | $ | 59,087,866 | $ | 1,779,855 | $ | 332,845 | ||||||||||||||||||||||||||
|
| |||||||||||||||||||||||||||||||
4. Expense Offset Arrangement
The Fund has entered into an arrangement with its custodian whereby credits realized as a result of uninvested cash balances are used to reduce a portion of the Fund’s custodian expenses. During the period ended June 30, 2017, the custodian fees were reduced as noted in the Consolidated Statement of Operations.
5. Income Taxes
For tax purposes, capital losses may be carried over to offset future capital gains, if any. At December 31, 2016, the capital loss carryforwards were as follows:
Capital loss carryforwards: | ||||
Short term | 1,731,758 | |||
Long term | 22,864,360 | |||
|
| |||
Total capital loss carryforwards | 24,596,118 | |||
|
|
At June 30, 2017, the cost of investments and net unrealized appreciation (depreciation) for income tax purposes were as follows:
Cost of investments | $ | 700,063,407 | ||
|
| |||
Unrealized appreciation | $ | 25,281,304 | ||
Unrealized depreciation | (27,473,893 | ) | ||
|
| |||
Net unrealized appreciation (depreciation) | $ | (2,192,589 | ) | |
|
|
Differences between income and/or capital gains as determined on a book basis and a tax basis are primarily due to differing treatment of foreign currency transactions and bond discounts and premiums.
6. Investment Transactions
Purchases and sales of investments (excluding short term securities) for the period ended June 30, 2017, aggregated $371,492,085 and $369,803,636, respectively.
7. Credit Risk and Defaulted Securities
At June 30, 2017, the Fund had 42.0% of its portfolio invested in high yield, senior secured floating rate notes, or other securities rated below investment grade and unrated securities, if any. These securities may be more sensitive to economic conditions causing greater price volatility and are potentially subject to a greater risk of loss due to default than higher rated securities.
| Semiannual Report | FSI-39 |
FRANKLIN TEMPLETON VARIABLE INSURANCE PRODUCTS TRUST
NOTES TO CONSOLIDATED FINANCIAL STATEMENTS (UNAUDITED)
Franklin Strategic Income VIP Fund (continued)
7. Credit Risk and Defaulted Securities (continued)
The Fund held defaulted securities and/or other securities for which the income has been deemed uncollectible. At June 30, 2017, the aggregate value of these securities was $2,547,375, representing 0.4% of the Fund’s net assets. The Fund discontinues accruing income on securities for which income has been deemed uncollectible and provides an estimate for losses on interest receivable. The securities have been identified in the accompanying Consolidated Statement of Investments.
8. Restricted Securities
The Fund invests in securities that are restricted under the Securities Act of 1933 (1933 Act) or which are subject to legal, contractual, or other agreed upon restrictions on resale. Restricted securities are often purchased in private placement transactions, and cannot be sold without prior registration unless the sale is pursuant to an exemption under the 1933 Act. Disposal of these securities may require greater effort and expense, and prompt sale at an acceptable price may be difficult. The Fund may have registration rights for restricted securities. The issuer generally incurs all registration costs.
At June 30, 2017, investments in restricted securities, excluding certain securities exempt from registration under the 1933 Act deemed to be liquid, were as follows:
| Shares | Issuer | Acquisition Date | Cost | Value | ||||||||||
| 14,792,309 | Holdco 2, A | 2/08/13 - 2/01/17 | $ | 114,768 | $ | 11,296 | ||||||||
| 1,472,041 | Holdco 2, B | 2/01/17 | 1,093 | 1,124 | ||||||||||
| 20,905 | Warrior Met Coal Inc. | 5/29/14 - 11/13/14 | 2,911,693 | 341,985 | ||||||||||
|
| |||||||||||||
Total Restricted Securities (Value is 0.1% of Net Assets) | $ | 3,027,554 | $ | 354,405 | ||||||||||
|
| |||||||||||||
9. Other Derivative Information
At June 30, 2017, the Fund’s investments in derivative contracts are reflected in the Consolidated Statement of Assets and
Liabilities as follows:
Asset Derivatives | Liability Derivatives | |||||||||||
Derivative Contracts Not Accounted for as Hedging Instruments | Consolidated Statement of Assets and Liabilities Location | Fair Value | Consolidated Statement of Assets and Liabilities Location | Fair Value | ||||||||
Interest rate contracts | Variation margin | $ | 26,753 | a | Variation margin | $ | 176,482 | a | ||||
Foreign exchange contracts | Unrealized appreciation on OTC forward exchange contracts | 148,500 | Unrealized depreciation on OTC forward exchange contracts | 2,275,380 | ||||||||
Credit contracts | Variation margin | 17,323 | a | |||||||||
| OTC swap contracts (Upfront payments) | 499,262 | OTC swap contracts (Upfront receipts) | 661,475 | |||||||||
| Unrealized appreciation on OTC swap contracts | 50,152 | Unrealized depreciation on OTC swap contract | 30,593 | |||||||||
Value recovery instruments | Investments in securities, at value | 764,559 | ||||||||||
|
|
|
| |||||||||
Totals | $ | 1,489,226 | $ | 3,161,253 | ||||||||
|
|
|
| |||||||||
aThis amount reflects the cumulative appreciation (depreciation) of futures contracts and centrally cleared swap contracts as reported in the Consolidated Statement of Investments. Only the variation margin receivable/payable at period end is separately reported within the Consolidated Statement of Assets and Liabilities. Prior variation margin movements were recorded to cash upon receipt or payment.
| FSI-40 | Semiannual Report |
FRANKLIN TEMPLETON VARIABLE INSURANCE PRODUCTS TRUST
NOTES TO CONSOLIDATED FINANCIAL STATEMENTS (UNAUDITED)
Franklin Strategic Income VIP Fund (continued)
For the period ended June 30, 2017, the effect of derivative contracts in the Fund’s Consolidated Statement of Operations was as follows:
Derivative Contracts Not Accounted for as Hedging Instruments | Consolidated Statement of Operations Locations | Net Realized Gain (Loss) for the Period | Consolidated Statement of Operations Locations | Net Change in Unrealized Appreciation (Depreciation) for the Period | ||||||||
| Net realized gain (loss) from: | Net change in unrealized appreciation (depreciation) on: | |||||||||||
Interest rate contracts | Futures contracts | $ | 594,361 | Futures contracts | $ | (235,198 | ) | |||||
Foreign exchange contracts | Foreign currency transactions | 2,610,364 | a | Translation of other assets and liabilities denominated in foreign currencies | (5,673,784 | )a | ||||||
Credit contracts | Swap contracts | 45,207 | Swap contracts | 39,348 | ||||||||
Value recovery instruments | Investments | 169,199 | ||||||||||
|
|
|
| |||||||||
Totals | $ | 3,249,932 | $ | (5,700,435 | ) | |||||||
|
|
|
| |||||||||
aForward exchange contracts are included in net realized gain (loss) from foreign currency transactions and net change in unrealized appreciation (depreciation) on translation of other assets and liabilities denominated in foreign currencies in the Consolidated Statement of Operations.
For the period ended June 30, 2017, the average month end notional amount of futures contracts and swap contracts and the average month end contract value for forward exchange contracts, and average month end fair value of VRI, were as follows:
Futures Contracts | $ | 18,216,884 | ||
Swap contracts | $ | 9,641,579 | ||
Forward exchange contracts | $ | 81,242,068 | ||
VRI | $ | 667,581 |
| Gross Amounts of Assets and Liabilities Presented in the Consolidated Statement of Assets and Liabilities | ||||||||
| Assets | a | Liabilities | a | |||||
| Derivatives | ||||||||
Forward exchange contracts | $ | 148,500 | $ | 2,275,380 | ||||
Swap contracts | 549,414 | 692,068 | ||||||
|
| |||||||
Total | $ | 697,914 | $ | 2,967,448 | ||||
|
| |||||||
aAbsent an event of default or early termination, OTC derivative assets and liabilities are presented gross and not offset in the Consolidated Statement of Assets and Liabilities.
| Semiannual Report | FSI-41 |
FRANKLIN TEMPLETON VARIABLE INSURANCE PRODUCTS TRUST
NOTES TO CONSOLIDATED FINANCIAL STATEMENTS (UNAUDITED)
Franklin Strategic Income VIP Fund (continued)
9. Other Derivative Information (continued)
At June 30, 2017, the Fund’s OTC derivative assets, which may be offset against the Fund’s OTC derivative liabilities and collateral received from the counterparty, are as follows:
| Amounts Not Offset in the Consolidated Statement of Assets and Liabilities | ||||||||||||||||||||
| | Gross Amounts of Assets Presented in | | | Financial Instruments Available for Offset | | | Financial Instruments Collateral Received | | | Cash Collateral Received | b | | Net Amount (Not less than zero) | | ||||||
| Counterparty | ||||||||||||||||||||
BZWS | $ | — | $ | — | $ | — | $ | — | $ | — | ||||||||||
CITI | 402,797 | (402,797 | ) | — | — | — | ||||||||||||||
DBAB | 48,030 | (48,030 | ) | — | — | — | ||||||||||||||
FBCO | 1,416 | (1,416 | ) | — | — | — | ||||||||||||||
GSCO | — | — | — | — | — | |||||||||||||||
HSBK | 11,372 | (11,372 | ) | — | — | — | ||||||||||||||
JPHQ | 234,299 | (234,299 | ) | — | — | — | ||||||||||||||
|
| |||||||||||||||||||
Total | $ | 697,914 | $ | (697,914 | ) | $ | — | $ | — | $ | — | |||||||||
|
| |||||||||||||||||||
At June 30, 2017, the Fund’s OTC derivative liabilities, which may be offset against the Fund’s OTC derivative assets and collateral pledged to the counterparty, are as follows:
| Amounts Not Offset in the Consolidated Statement of Assets and Liabilities | ||||||||||||||||||||
| | Gross Amounts of Liabilities Presented in the |
| | Financial Instruments Available for Offset | | | Financial Instruments Collateral Pledged | | | Cash Collateral Pledged | b | | Net Amount (Not less than zero) | | ||||||
| Counterparty | ||||||||||||||||||||
BZWS | $ | 145,799 | $ | — | $ | — | $ | — | $ | 145,799 | ||||||||||
CITI | 599,382 | (402,797 | ) | — | — | 196,585 | ||||||||||||||
DBAB | 392,917 | (48,030 | ) | — | (240,000 | ) | 104,887 | |||||||||||||
FBCO | 137,955 | (1,416 | ) | — | (130,000 | ) | 6,539 | |||||||||||||
GSCO | 19,907 | — | — | — | 19,907 | |||||||||||||||
HSBK | 23,288 | (11,372 | ) | — | — | 11,916 | ||||||||||||||
JPHQ | 1,648,200 | (234,299 | ) | — | (1,210,000 | ) | 203,901 | |||||||||||||
|
| |||||||||||||||||||
Total | $ | 2,967,448 | $ | (697,914 | ) | $ | — | $ | (1,580,000 | ) | $ | 689,534 | ||||||||
|
| |||||||||||||||||||
bIn some instances, the collateral amounts disclosed in the table above were adjusted due to the requirement to limit collateral amounts to avoid the effect of overcollateralization. Actual collateral received and/or pledged may be more than the amounts disclosed herein.
See Note 1(d) regarding derivative financial instruments.
See Abbreviations on page FSI-46.
10. Credit Facility
The Fund, together with other U.S. registered and foreign investment funds (collectively, Borrowers), managed by Franklin Templeton Investments, are borrowers in a joint syndicated senior unsecured credit facility totaling $2 billion (Global Credit Facility) which matures on February 9, 2018. This Global Credit Facility provides a source of funds to the Borrowers for temporary and emergency purposes, including the ability to meet future unanticipated or unusually large redemption requests.
| FSI-42 | Semiannual Report |
FRANKLIN TEMPLETON VARIABLE INSURANCE PRODUCTS TRUST
NOTES TO CONSOLIDATED FINANCIAL STATEMENTS (UNAUDITED)
Franklin Strategic Income VIP Fund (continued)
Under the terms of the Global Credit Facility, the Fund shall, in addition to interest charged on any borrowings made by the Fund and other costs incurred by the Fund, pay its share of fees and expenses incurred in connection with the implementation and maintenance of the Global Credit Facility, based upon its relative share of the aggregate net assets of all of the Borrowers, including an annual commitment fee of 0.15% based upon the unused portion of the Global Credit Facility. These fees are reflected in other expenses in the Consolidated Statement of Operations. During the period ended June 30, 2017, the Fund did not use the Global Credit Facility.
11. Fair Value Measurements
The Fund follows a fair value hierarchy that distinguishes between market data obtained from independent sources (observable inputs) and the Fund’s own market assumptions (unobservable inputs). These inputs are used in determining the value of the Fund’s financial instruments and are summarized in the following fair value hierarchy:
| • | Level 1 – quoted prices in active markets for identical financial instruments |
| • | Level 2 – other significant observable inputs (including quoted prices for similar financial instruments, interest rates, prepayment speed, credit risk, etc.) |
| • | Level 3 – significant unobservable inputs (including the Fund’s own assumptions in determining the fair value of financial instruments) |
The input levels are not necessarily an indication of the risk or liquidity associated with financial instruments at that level.
For movements between the levels within the fair value hierarchy, the Fund has adopted a policy of recognizing the transfers as of the date of the underlying event which caused the movement.
| Semiannual Report | FSI-43 |
FRANKLIN TEMPLETON VARIABLE INSURANCE PRODUCTS TRUST
NOTES TO CONSOLIDATED FINANCIAL STATEMENTS (UNAUDITED)
Franklin Strategic Income VIP Fund (continued)
11. Fair Value Measurements (continued)
A summary of inputs used as of June 30, 2017, in valuing the Fund’s assets and liabilities carried at fair value, is as follows:
| Level 1 | Level 2 | Level 3 | Total | |||||||||||||
| Assets: | ||||||||||||||||
Investments in Securities: | ||||||||||||||||
Equity Investments:a | ||||||||||||||||
Consumer Services | $ | — | $ | — | $ | 8,841,736 | $ | 8,841,736 | ||||||||
Energy | 2,514,506 | 196,615 | 3,553 | 2,714,674 | ||||||||||||
Materials | 32,614 | 110 | 341,985 | 374,709 | ||||||||||||
Retailing | — | — | 12,420 | 12,420 | ||||||||||||
Transportation | — | 194,263 | — | 194,263 | ||||||||||||
All Other Equity Investmentsb | 42,704,643 | — | — | 42,704,643 | ||||||||||||
Convertible Bonds | — | 1,376,004 | — | 1,376,004 | ||||||||||||
Corporate Bonds | — | 300,073,021 | 49,707 | 300,122,728 | ||||||||||||
Senior Floating Rate Interests | — | 66,449,260 | c | — | 66,449,260 | |||||||||||
Foreign Government and Agency Securities | — | 50,819,900 | — | 50,819,900 | ||||||||||||
U.S. Government and Agency Securities | — | 49,518,353 | — | 49,518,353 | ||||||||||||
Asset-Backed Securities and Commercial Mortgage-Backed Securities | — | 81,748,999 | — | 81,748,999 | ||||||||||||
Mortgage-Backed Securities | — | 63,617,503 | — | 63,617,503 | ||||||||||||
Municipal Bonds | — | 12,134,197 | — | 12,134,197 | ||||||||||||
Escrows and Litigation Trusts | — | 22,500 | 34,800c | 57,300 | ||||||||||||
Short Term Investments | 17,184,129 | — | — | 17,184,129 | ||||||||||||
|
| |||||||||||||||
Total Investments in Securities | $ | 62,435,892 | $ | 626,150,725 | $ | 9,284,201 | $ | 697,870,818 | ||||||||
|
| |||||||||||||||
Other Financial Instruments: | ||||||||||||||||
Futures Contracts | $ | 26,753 | $ | — | $ | — | $ | 26,753 | ||||||||
Forward Exchange Contracts | — | 148,500 | — | 148,500 | ||||||||||||
Swap Contracts | — | 50,152 | — | 50,152 | ||||||||||||
|
| |||||||||||||||
Total Other Financial Instruments | $ | 26,753 | $ | 198,652 | $ | — | $ | 225,405 | ||||||||
|
| |||||||||||||||
| Liabilities: | ||||||||||||||||
Other Financial Instruments: | ||||||||||||||||
Futures Contracts | $ | 176,482 | $ | — | $ | — | $ | 176,482 | ||||||||
Forward Exchange Contracts | — | 2,275,380 | — | 2,275,380 | ||||||||||||
Swap Contracts | — | 47,916 | — | 47,916 | ||||||||||||
|
| |||||||||||||||
Total Other Financial Instruments | $ | 176,482 | $ | 2,323,296 | $ | — | $ | 2,499,778 | ||||||||
|
| |||||||||||||||
aIncludes common and convertible preferred stocks and management investment companies as well as other equity interests.
bFor detailed categories, see the accompanying Consolidated Statement of Investments.
cIncludes securities determined to have no value at June 30, 2017.
| FSI-44 | Semiannual Report |
FRANKLIN TEMPLETON VARIABLE INSURANCE PRODUCTS TRUST
NOTES TO CONSOLIDATED FINANCIAL STATEMENTS (UNAUDITED)
Franklin Strategic Income VIP Fund (continued)
A reconciliation of assets in which Level 3 inputs are used in determining fair value is presented when there are significant Level 3 financial instruments at the end of the period. At June 30, 2017, the reconciliation of assets is as follows:
| | Balance at Beginning of Period | | Purchases | Sales | | Transfer Into Level 3 | a | | Transfer Out of Level 3 | b | | Cost Basis Adjustments | | | Net Realized Gain (Loss) | | | Net Unrealized Appreciation (Depreciation) | | | Balance at End of Period | | | Net Change in Unrealized Appreciation (Depreciation) on Assets Held at Period End | | |||||||||||||||
| Assets: | ||||||||||||||||||||||||||||||||||||||||
Investments in Securities: | ||||||||||||||||||||||||||||||||||||||||
Equity Investments:c | ||||||||||||||||||||||||||||||||||||||||
Consumer Services | $ | 8,913,040 | $ | — | $ | — | $ | — | $ | — | $ | — | $ | — | $ | (71,304 | ) | $ | 8,841,736 | $ | (71,304 | ) | ||||||||||||||||||
Energy | 1,305,543 | d | — | — | — | (1,051,255 | ) | — | — | (250,735 | ) | 3,553 | 3,553 | |||||||||||||||||||||||||||
Materials | — | — | — | 357,475 | — | — | — | (15,490 | ) | 341,985 | (15,490 | ) | ||||||||||||||||||||||||||||
Retailing | — | — | — | 12,097 | — | — | — | 323 | 12,420 | 323 | ||||||||||||||||||||||||||||||
Corporate Bonds | — | — | — | 49,707 | — | — | — | — | 49,707 | — | ||||||||||||||||||||||||||||||
Escrows and Litigation Trusts | 72,300 | d | — | — | — | (37,500 | ) | — | — | — | 34,800d | — | ||||||||||||||||||||||||||||
|
| |||||||||||||||||||||||||||||||||||||||
Total | $ | 10,290,883 | $ | — | $ | — | $ | 419,279 | $ | (1,088,755 | ) | $ | — | $ | — | $ | (337,206 | ) | $ | 9,284,201 | $ | (82,918 | ) | |||||||||||||||||
|
| |||||||||||||||||||||||||||||||||||||||
aThe investments were transferred into Level 3 as result of the unavailability of other significant observable valuation inputs. May include amounts related to a corporate action.
bThe investments were transferred out of Level 3 as a result of the removal of a significant unobservable valuation input. May include amounts related to a corporate action.
cIncludes common as well as other equity investments.
dIncludes securities determined to have no value.
Level 3 investments include financial instruments with values derived using prior transaction prices or third party pricing information without adjustment for which such inputs are unobservable. They may also include fair value of immaterial financial instruments and/or other assets developed using various valuation techniques and unobservable inputs.
12. New Accounting Pronouncements
In March 2017, the Financial Accounting Standards Board (FASB) issued Accounting Standards Update (ASU) No. 2017-08, Receivables — Nonrefundable Fees and Other Costs (Subtopic 310-20): Premium Amortization on Purchased Callable Debt Securities. The amendments in the ASU shorten the amortization period for certain callable debt securities, held at a premium, to be amortized to the earliest call date. The ASU does not require an accounting change for securities held at a discount; which continues to be amortized to maturity. The ASU is effective for fiscal years and interim periods within those fiscal years beginning after December 15, 2018. Management is currently evaluating the impact, if any, of applying this provision.
13. Investment Company Reporting Modernization
In October 2016, the U.S. Securities and Exchange Commission adopted new rules and amended existing rules (together, final rules) intended to modernize the reporting and disclosure of information by registered investment companies. In part, the final rules amend Regulation S-X and require standardized, enhanced disclosures about derivatives in investment company financial statements, as well as other amendments. The compliance date for the amendments to Regulation S-X is August 1, 2017. Management has reviewed the requirements and believes the adoption of the amendments to Regulation S-X will not have a material impact on the Fund’s financial statements and related disclosures.
| Semiannual Report | FSI-45 |
FRANKLIN TEMPLETON VARIABLE INSURANCE PRODUCTS TRUST
NOTES TO CONSOLIDATED FINANCIAL STATEMENTS (UNAUDITED)
Franklin Strategic Income VIP Fund (continued)
14. Subsequent Events
The Fund has evaluated subsequent events through the issuance of the financial statements and determined that no events have occurred that require disclosure.
Abbreviations
| Counterparty/Exchange | Currency | Selected Portfolio | ||||||||
| BZWS | Barclays Bank PLC | BRL | Brazilian Real | ARM | Adjustable Rate Mortgage | |||||
| CITI | Citigroup, Inc. | EUR | Euro | CDA | Community Development Authority/Agency | |||||
| DBAB | Deutsche Bank AG | GBP | British Pound | CDO | Collateralized Debt Obligation | |||||
| FBCO | Credit Suisse International | IDR | Indonesian Rupiah | CLO | Collateralized Loan Obligation | |||||
| GSCO | The Goldman Sachs Group, Inc. | MXN | Mexican Peso | FRN | Floating Rate Note | |||||
| HSBK | HSBC Bank PLC | MYR | Malaysian Ringgit | GDP | Gross Domestic Product | |||||
| ICE | Intercontinental Exchange | SEK | Swedish krona | GO | General Obligation | |||||
| JPHQ | JP Morgan Chase & Co. | HDC | Housing Development Corp. | |||||||
| PCR | Pollution Control Revenue | |||||||||
| PIK | Payment-In-Kind | |||||||||
| SF | Single Family | |||||||||
| VRI | Value Recovery Instruments | |||||||||
| Index Abbreviation | ||
| CDX.NA.HY.28 | CDX North America High Yield Index | |
| MCDX.NA.28 | MCDX North America Index | |
| FSI-46 | Semiannual Report |
Franklin U.S. Government Securities VIP Fund
This semiannual report for Franklin U.S. Government Securities VIP Fund covers the period ended June 30, 2017.
Class 1 Performance Summary as of June 30, 2017
The Fund’s Class 1 Shares delivered a +0.92% total return for the six-month period ended June 30, 2017.
Performance reflects the Fund’s Class 1 operating expenses, but does not include any contract fees, expenses or sales charges. If they had been included, performance would be lower. These charges and deductions, particularly for variable life policies, can have a significant effect on contract values and insurance benefits. See the contract prospectus for a complete description of these expenses, including sales charges.
Performance data represent past performance, which does not guarantee future results. Investment return and principal value will fluctuate, and you may have a gain or loss when you sell your shares. Current performance may differ from figures shown.
| Semiannual Report | FUS-1 |
FRANKLIN U.S. GOVERNMENT SECURITIES VIP FUND
Fund Goal and Main Investments
The Fund seeks income. Under normal market conditions, the Fund invests at least 80% of its net assets in U.S. government securities.
Fund Risks
All investments involve risks, including possible loss of principal. The Fund’s share price and yield will be affected by interest rate movements and mortgage prepayments. Bond prices generally move in the opposite direction of interest rates. Thus, as prices of bonds in the Fund adjust to a rise in interest rates, the Fund’s share price may decline. Changes in the financial strength of a bond issuer or in a bond’s credit rating may affect its value. The Fund is actively managed but there is no guarantee that the manager’s investment decisions will produce the desired results. The Fund’s prospectus also includes a description of the main investment risks.
Performance Overview
You can find the Fund’s six month total return in the Performance Summary. In comparison, the Fund’s primary benchmark, the Bloomberg Barclays U.S. Government Index: Intermediate Component, produced a +1.20% total return.1 The Fund’s secondary benchmark, the Lipper VIP General U.S. Government Funds Classification Average, posted a +1.84% total return.2 Funds in the Lipper average may allocate as much as 35% of their investments in asset types other than U.S. government and agency mortgage-backed securities.
Economic and Market Overview
U.S. economic growth decelerated in 2017’s first quarter, largely due to slower growth in consumer spending and declines in private inventory investment and government spending. However, growth accelerated in the second quarter due to increases in consumer spending, business investment and federal government spending. The manufacturing sector generally expanded, and the services sector also continued to grow. The unemployment rate decreased from 4.7% in December 2016 to 4.4% at period-end.3 Monthly retail sales were volatile, but grew for most of the period. Annual inflation,
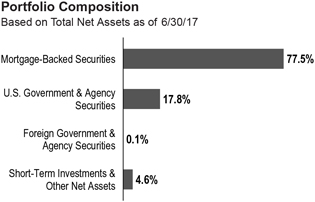
as measured by the Consumer Price Index, decreased from 2.1% to 1.6% during the period.
The U.S. Federal Reserve (Fed), at its March meeting, increased the federal funds target rate from 0.50%–0.75% to 0.75%–1.00%. The Fed again increased its target range by a quarter point to 1.00%–1.25% at its June meeting. The Fed made both of these increases amid signs of a growing U.S. economy, a strengthening labor market and an improvement in business spending.
The 10-year Treasury yield, which moves inversely to its price, shifted throughout the period. It increased early during the period amid expectations of rate hikes by the Fed and upbeat economic data. During the latter part of the period, U.S. political uncertainty and geopolitical tensions in the Middle East and the Korean peninsula resulted in a decline in the yield. However, in June, the yield rose again due to renewed optimism for improvement in economic growth. Overall, the U.S. Treasury yield fell from 2.45% on December 30, 2016, to 2.31% at period-end.
1. Source: Morningstar.
2. Source: Lipper, a Thomson Reuters Company.
One cannot invest directly in an index, and an index is not representative of the Fund’s portfolio. Please see Index Descriptions following the Fund Summaries.
3. Source: Bureau of Labor Statistics.
The dollar value, number of shares or principal amount, and names of all portfolio holdings are listed in the Fund’s Statement of Investments (SOI).
| FUS-2 | Semiannual Report |
FRANKLIN U.S. GOVERNMENT SECURITIES VIP FUND
Investment Strategy
Using our straightforward investment approach, we seek to produce current income with a high degree of credit safety from a conservatively managed portfolio of U.S. government securities. Analyzing securities using proprietary and nonproprietary research, we seek to identify attractive investment opportunities.
Manager’s Discussion
The overall mortgage market provided mixed results during the period as Treasuries outperformed mortgage-backed securities (MBS). In contrast, asset-backed securities, U.S. agency securities and commercial MBS outpaced Treasuries. U.S. economic indicators were generally encouraging during the reporting period. Steady growth in the services sector created new jobs and boosted employment levels. Retail sales grew for most of the period. Low energy prices pulled inflation lower. In this environment, home sales grew early in the period, but slowed by period-end because of low supply levels and rising prices.
The Fund maintains a consistent and disciplined approach to our investment strategy. The Fund’s investment process and strategy have not changed, and the team continues to look for strong cash flow fundamentals and valuations seeking to uncover opportunities across the agency mortgage and agency debenture universe. The Fund emphasizes agency pass-throughs and invests in other agency securities for diversification purposes.
Within the agency mortgage pass-through sector, Freddie Mac MBS had positive excess returns, while Ginnie Mae (GNMA) MBS and Fannie Mae MBS had negative excess returns. All had positive total returns during the period.
During the period, we were more weighted toward GNMA IIs (pools of mortgages from multiple issuers) than GNMA Is (pools of mortgages from single issuers). Over the period, we increased exposure to GNMA II 3.0% coupons, while reducing the exposure to 3.5% and 4.0% coupons. At period-end, our heaviest exposures were in 3.5% and 4.0% coupons. Based on excess returns over Treasuries, coupon performance was mixed. GN I 5.0% securities were among the best performers while GN I & II 5.5% securities lagged.
The Fund’s U.S. yield curve positioning was a contributor during the period as yield curve movements had a positive impact relative to the benchmark. Our exposure to Fannie Mae DUS also helped results. In contrast, our exposure to fixed-rate
agency MBS and Treasury Inflation Protected Securities were detractors.
Thank you for your participation in Franklin U.S. Government Securities VIP Fund. We look forward to serving your future investment needs.
The foregoing information reflects our analysis, opinions and portfolio holdings as of June 30, 2017, the end of the reporting period. The way we implement our main investment strategies and the resulting portfolio holdings may change depending on factors such as market and economic conditions. These opinions may not be relied upon as investment advice or an offer for a particular security. The information is not a complete analysis of every aspect of any market, country, industry, security or the Fund. Statements of fact are from sources considered reliable, but the investment manager makes no representation or warranty as to their completeness or accuracy. Although historical performance is no guarantee of future results, these insights may help you understand our investment management philosophy.
| Semiannual Report | FUS-3 |
FRANKLIN U.S. GOVERNMENT SECURITIES VIP FUND
Class 1 Fund Expenses
As an investor in a variable insurance contract (Contract) that indirectly provides for investment in an underlying mutual fund, you can incur transaction and/or ongoing expenses at both the Fund level and the Contract Level: (1) transaction expenses can include sales charges (loads) on purchases, surrender fees, transfer fees and premium taxes; and (2) ongoing expenses can include management fees, distribution and service (12b-1) fees, contract fees, annual maintenance fees, mortality and expense risk fees and other fees and expenses. All mutual funds and Contracts have some types of ongoing expenses. The table below shows Fund-level ongoing expenses and can help you understand these costs and compare them with those of other mutual funds offered through the Contract. The table assumes a $1,000 investment held for the six months indicated. Please refer to the Fund prospectus for additional information on operating expenses.
Actual Fund Expenses
The table below provides information about the actual account values and actual expenses in the columns under the heading “Actual.” In these columns the Fund’s actual return, which includes the effect of ongoing Fund expenses but does not include the effect of ongoing Contract expenses, is used to calculate the “Ending Account Value.” You can estimate the Fund-level expenses you paid during the period by following these steps (of course, your account value and expenses will differ from those in this illustration): Divide your account value by $1,000 (if your account had an $8,600 value, then $8,600 ÷ $1,000 = 8.6). Then multiply the result by the number under the headings “Actual” and “Fund-Level Expenses Paid During Period” (if Fund-Level Expenses Paid During Period were $7.50, then 8.6 × $7.50 = $64.50). In this illustration, the estimated expenses paid this period at the Fund level are $64.50.
Hypothetical Example for Comparison with Other Mutual Funds
Under the heading “Hypothetical” in the table, information is provided about hypothetical account values and hypothetical expenses based on the Fund’s actual expense ratio and an assumed rate of return of 5% per year before expenses, which is not the Fund’s actual return. This information may not be used to estimate the actual ending account balance or expenses you paid for the period, but it can help you compare ongoing costs of investing in the Fund with those of other mutual funds offered through the Contract. To do so, compare this 5% hypothetical example with the 5% hypothetical examples that appear in the shareholder reports of other funds offered through the Contract.
Please note that expenses shown in the table are meant to highlight ongoing costs at the Fund level only and do not reflect any ongoing expenses at the Contract level, or transaction expenses at either the Fund or Contract levels. In addition, while the Fund does not have transaction expenses, if the transaction and ongoing expenses at the Contract level were included, the expenses shown below would be higher. You should consult your Contract prospectus or disclosure document for more information.
| Actual (actual return after expenses) | Hypothetical (5% annual return before expenses) | |||||||||||||||||||||||
| Share Class | | Beginning Account Value 1/1/17 | | | Ending Account Value 6/30/17 | | | Fund-Level Expenses Paid During Period 1/1/17–6/30/17 | 1,2 | | Ending Account Value 6/30/17 | | | Fund-Level Expenses Paid During Period 1/1/17–6/30/17 | 1,2 | | Annualized Expense Ratio | 2 | ||||||
Class 1 | $1,000 | $1,009.20 | $2.49 | $1,022.32 | $2.51 | 0.50% | ||||||||||||||||||
1. Expenses are equal to the annualized expense ratio for the six-month period as indicated above — in the far right column — multiplied by the simple average account value over the period indicated, and then multiplied by 181/365 to reflect the one-half year period.
2. Does not include any ongoing expenses of the Contract for which the Fund is an investment option.
| FUS-4 | Semiannual Report |
FRANKLIN TEMPLETON VARIABLE INSURANCE PRODUCTS TRUST
Financial Highlights
Franklin U.S. Government Securities VIP Fund
Six Months Ended (unaudited) | Year Ended December 31, | |||||||||||||||||||||||
| 2016 | 2015 | 2014 | 2013 | 2012 | ||||||||||||||||||||
| Class 1 | ||||||||||||||||||||||||
Per share operating performance (for a share outstanding throughout the period) | ||||||||||||||||||||||||
Net asset value, beginning of period | $12.51 | $12.74 | $13.00 | $12.91 | $13.57 | $13.67 | ||||||||||||||||||
|
| |||||||||||||||||||||||
| Income from investment operationsa: | ||||||||||||||||||||||||
Net investment incomeb | 0.12 | 0.22 | 0.21 | 0.24 | 0.24 | 0.32 | ||||||||||||||||||
Net realized and unrealized gains (losses) | (— | )c | (0.10 | ) | (0.12 | ) | 0.22 | (0.51 | ) | (0.03 | ) | |||||||||||||
|
| |||||||||||||||||||||||
Total from investment operations | 0.12 | 0.12 | 0.09 | 0.46 | (0.27 | ) | 0.29 | |||||||||||||||||
|
| |||||||||||||||||||||||
| Less distributions from net investment income | (0.36 | ) | (0.35 | ) | (0.35 | ) | (0.37 | ) | (0.39 | ) | (0.39 | ) | ||||||||||||
|
| |||||||||||||||||||||||
Net asset value, end of period | $12.27 | $12.51 | $12.74 | $13.00 | $12.91 | $13.57 | ||||||||||||||||||
|
| |||||||||||||||||||||||
Total returnd | 0.92% | 0.90% | 0.71% | 3.64% | (1.99)% | 2.12% | ||||||||||||||||||
| Ratios to average net assetse | ||||||||||||||||||||||||
Expenses | 0.50%f | 0.50%f | 0.50%f | 0.49%f | 0.49%f | 0.50% | ||||||||||||||||||
Net investment income | 1.97% | 1.75% | 1.64% | 1.84% | 1.84% | 2.36% | ||||||||||||||||||
| Supplemental data | ||||||||||||||||||||||||
Net assets, end of period (000’s) | $71,153 | $73,695 | $79,620 | $90,656 | $99,947 | $126,536 | ||||||||||||||||||
Portfolio turnover rate | 35.07% | 86.28% | 61.91% | 42.88% | 69.47% | 45.89% | ||||||||||||||||||
Portfolio turnover rate excluding mortgage dollar rollsg | 35.07% | 86.28% | 61.91% | 42.88% | 67.80% | 45.89% | ||||||||||||||||||
aThe amount shown for a share outstanding throughout the period may not correlate with the Statement of Operations for the period due to the timing of sales and repurchases of the Fund’s shares in relation to income earned and/or fluctuating fair value of the investments of the Fund.
bBased on average daily shares outstanding.
cAmount rounds to less than $0.01 per share.
dTotal return does not include fees, charges or expenses imposed by the variable annuity and life insurance contracts for which Franklin Templeton Variable Insurance Products Trust serves as an underlying investment vehicle. Total return is not annualized for periods less than one year.
eRatios are annualized for periods less than one year.
fBenefit of expense reduction rounds to less than 0.01%.
gSee Note 1(c) regarding mortgage dollar rolls.
| The accompanying notes are an integral part of these financial statements. | Semiannual Report | FUS-5 |
FRANKLIN TEMPLETON VARIABLE INSURANCE PRODUCTS TRUST
FINANCIAL HIGHLIGHTS
Franklin U.S. Government Securities VIP Fund (continued)
Six Months Ended (unaudited) | Year Ended December 31, | |||||||||||||||||||||||
| 2016 | 2015 | 2014 | 2013 | 2012 | ||||||||||||||||||||
| Class 2 | ||||||||||||||||||||||||
| Per share operating performance (for a share outstanding throughout the period) | ||||||||||||||||||||||||
Net asset value, beginning of period | $12.24 | $12.47 | $12.73 | $12.65 | $13.31 | $13.42 | ||||||||||||||||||
|
| |||||||||||||||||||||||
| Income from investment operationsa: | ||||||||||||||||||||||||
Net investment incomeb | 0.11 | 0.19 | 0.18 | 0.20 | 0.21 | 0.28 | ||||||||||||||||||
Net realized and unrealized gains (losses) | (0.02 | ) | (0.10 | ) | (0.12 | ) | 0.22 | (0.50 | ) | (0.03 | ) | |||||||||||||
|
| |||||||||||||||||||||||
Total from investment operations | 0.09 | 0.09 | 0.06 | 0.42 | (0.29 | ) | 0.25 | |||||||||||||||||
|
| |||||||||||||||||||||||
Less distributions from net investment income | (0.32 | ) | (0.32 | ) | (0.32 | ) | (0.34 | ) | (0.37 | ) | (0.36 | ) | ||||||||||||
|
| |||||||||||||||||||||||
Net asset value, end of period | $12.01 | $12.24 | $12.47 | $12.73 | $12.65 | $13.31 | ||||||||||||||||||
|
| |||||||||||||||||||||||
Total returnc | 0.75% | 0.66% | 0.47% | 3.38% | (2.24)% | 1.89% | ||||||||||||||||||
| Ratios to average net assetsd | ||||||||||||||||||||||||
Expenses | 0.75% | e | 0.75% | e | 0.75% | e | 0.74% | e | 0.74% | e | 0.75% | |||||||||||||
Net investment income | 1.72% | 1.50% | 1.39% | 1.59% | 1.59% | 2.11% | ||||||||||||||||||
| Supplemental data | ||||||||||||||||||||||||
Net assets, end of period (000’s) | $1,252,604 | $1,268,963 | $1,311,974 | $1,369,037 | $1,267,994 | $1,206,089 | ||||||||||||||||||
Portfolio turnover rate | 35.07% | 86.28% | 61.91% | 42.88% | 69.47% | 45.89% | ||||||||||||||||||
Portfolio turnover rate excluding mortgage dollar rollsf | 35.07% | 86.28% | 61.91% | 42.88% | 67.80% | 45.89% | ||||||||||||||||||
aThe amount shown for a share outstanding throughout the period may not correlate with the Statement of Operations for the period due to the timing of sales and repurchases of the Fund’s shares in relation to income earned and/or fluctuating fair value of the investments of the Fund.
bBased on average daily shares outstanding.
cTotal return does not include fees, charges or expenses imposed by the variable annuity and life insurance contracts for which Franklin Templeton Variable Insurance Products Trust serves as an underlying investment vehicle. Total return is not annualized for periods less than one year.
dRatios are annualized for periods less than one year.
eBenefit of expense reduction rounds to less than 0.01%.
fSee Note 1(c) regarding mortgage dollar rolls.
| FUS-6 | Semiannual Report | The accompanying notes are an integral part of these financial statements. |
FRANKLIN TEMPLETON VARIABLE INSURANCE PRODUCTS TRUST
Statement of Investments, June 30, 2017 (unaudited)
Franklin U.S. Government Securities VIP Fund
| ||||||||||
| Principal Amount* | Value | |||||||||
| Mortgage-Backed Securities 77.5% | ||||||||||
| a | Federal Home Loan Mortgage Corp. (FHLMC) Adjustable Rate 1.5% | |||||||||
FHLMC, 3.369%, 4/01/40 | $ | 8,280,668 | $ | 8,722,204 | ||||||
FHLMC, 3.377%, 6/01/37 | 6,131,651 | 6,452,228 | ||||||||
FHLMC, 2.953% - 3.66%, 3/01/36 - 5/01/38 | 4,605,550 | 4,886,834 | ||||||||
|
| |||||||||
| 20,061,266 | ||||||||||
|
| |||||||||
| Federal Home Loan Mortgage Corp. (FHLMC) Fixed Rate 9.6% | ||||||||||
FHLMC Gold 15 Year, 4.50%, 3/01/25 - 4/01/25 | 1,367,270 | 1,437,264 | ||||||||
FHLMC Gold 30 Year, 3.00%, 5/01/43 | 519,813 | 521,960 | ||||||||
FHLMC Gold 30 Year, 3.00%, 6/01/46 | 40,917,927 | 40,862,343 | ||||||||
FHLMC Gold 30 Year, 3.00%, 10/01/46 | 28,841,129 | 28,801,951 | ||||||||
FHLMC Gold 30 Year, 3.50%, 3/01/32 - 5/01/43 | 4,460,227 | 4,655,998 | ||||||||
FHLMC Gold 30 Year, 3.50%, 6/01/47 | 8,316,279 | 8,550,445 | ||||||||
FHLMC Gold 30 Year, 4.00%, 9/01/40 - 3/01/47 | 12,401,419 | 13,083,899 | ||||||||
FHLMC Gold 30 Year, 4.00%, 6/01/47 | 14,954,022 | 15,743,717 | ||||||||
FHLMC Gold 30 Year, 4.50%, 5/01/40 - 7/01/41 | 2,975,804 | 3,195,247 | ||||||||
FHLMC Gold 30 Year, 5.00%, 9/01/33 - 4/01/40 | 5,363,617 | 5,877,857 | ||||||||
FHLMC Gold 30 Year, 5.50%, 7/01/33 - 5/01/38 | 1,488,050 | 1,664,142 | ||||||||
FHLMC Gold 30 Year, 6.00%, 1/01/24 - 8/01/35 | 978,866 | 1,105,989 | ||||||||
FHLMC Gold 30 Year, 6.50%, 12/01/23 - 5/01/35 | 489,986 | 542,789 | ||||||||
FHLMC Gold 30 Year, 7.00%, 4/01/24 - 6/01/32 | 213,455 | 233,796 | ||||||||
FHLMC Gold 30 Year, 7.50%, 12/01/22 - 5/01/24 | 1,799 | 1,825 | ||||||||
FHLMC Gold 30 Year, 8.00%, 9/01/21 - 5/01/22 | 3,472 | 3,790 | ||||||||
FHLMC Gold 30 Year, 8.50%, 10/01/21 - 7/01/31 | 346,929 | 415,236 | ||||||||
FHLMC PC 30 Year, 8.50%, 9/01/20 | 159 | 160 | ||||||||
|
| |||||||||
| 126,698,408 | ||||||||||
|
| |||||||||
| a | Federal National Mortgage Association (FNMA) Adjustable Rate 5.2% | |||||||||
FNMA, 2.774%, 7/01/38 | 6,220,094 | 6,551,282 | ||||||||
FNMA, 1.833% - 3.079%, 11/01/17 - 10/01/44 | 11,625,897 | 12,124,570 | ||||||||
FNMA, 3.097%, 10/01/35 | 6,811,286 | 7,192,767 | ||||||||
FNMA, 3.188%, 8/01/36 | 7,407,352 | 7,804,541 | ||||||||
FNMA, 3.08% - 3.431%, 1/01/19 - 9/01/40 | 10,907,650 | 11,439,184 | ||||||||
FNMA, 3.474%, 9/01/37 | 20,261,701 | 21,513,565 | ||||||||
FNMA, 3.433% - 7.22%, 8/01/18 - 3/01/47 | 2,778,016 | 2,914,487 | ||||||||
|
| |||||||||
| 69,540,396 | ||||||||||
|
| |||||||||
| Federal National Mortgage Association (FNMA) Fixed Rate 7.3% | ||||||||||
FNMA 15 Year, 2.64%, 7/01/25 | 2,500,000 | 2,508,060 | ||||||||
FNMA 15 Year, 2.77%, 4/01/25 | 3,500,000 | 3,523,759 | ||||||||
FNMA 15 Year, 2.99%, 11/01/24 | 3,000,000 | 3,081,345 | ||||||||
FNMA 15 Year, 3.14%, 10/01/25 | 4,000,000 | 4,088,332 | ||||||||
FNMA 15 Year, 3.28%, 7/01/27 | 4,000,000 | 4,111,644 | ||||||||
FNMA 15 Year, 3.51%, 8/01/23 | 3,000,000 | 3,188,739 | ||||||||
FNMA 15 Year, 5.50%, 11/01/17 - 1/01/25 | 1,382,497 | 1,472,651 | ||||||||
FNMA 15 Year, 6.00%, 8/01/17 - 9/01/17 | 4,236 | 4,238 | ||||||||
FNMA 30 Year, 3.00%, 12/01/42 | 222,987 | 223,697 | ||||||||
FNMA 30 Year, 3.50%, 7/01/45 | 39,638,424 | 40,736,800 | ||||||||
FNMA 30 Year, 4.00%, 1/01/41 - 8/01/41 | 9,206,687 | 9,722,226 | ||||||||
FNMA 30 Year, 4.50%, 8/01/40 - 6/01/41 | 9,121,184 | 9,862,653 | ||||||||
FNMA 30 Year, 5.00%, 3/01/34 - 7/01/41 | 5,473,203 | 5,987,073 | ||||||||
FNMA 30 Year, 5.50%, 12/01/32 - 8/01/35 | 2,184,465 | 2,438,746 | ||||||||
FNMA 30 Year, 6.00%, 1/01/24 - 8/01/38 | 2,698,474 | 3,066,289 | ||||||||
FNMA 30 Year, 6.50%, 1/01/24 - 9/01/36 | 525,346 | 584,694 | ||||||||
| Semiannual Report | FUS-7 |
FRANKLIN TEMPLETON VARIABLE INSURANCE PRODUCTS TRUST
STATEMENT OF INVESTMENTS (UNAUDITED)
Franklin U.S. Government Securities VIP Fund (continued)
| Principal Amount* | Value | |||||||||
| Mortgage-Backed Securities (continued) | ||||||||||
| Federal National Mortgage Association (FNMA) Fixed Rate (continued) | ||||||||||
FNMA 30 Year, 7.50%, 4/01/23 - 8/01/25 | $ | 18,247 | $ | 18,858 | ||||||
FNMA 30 Year, 8.00%, 3/01/22 - 2/01/25 | 92,018 | 94,520 | ||||||||
FNMA 30 Year, 8.50%, 3/01/20 - 6/01/21 | 461 | 482 | ||||||||
FNMA 30 Year, 9.00%, 10/01/26 | 86,241 | 91,789 | ||||||||
FNMA GL 30 Year, 8.00%, 8/01/19. | 1,626 | 1,630 | ||||||||
FNMA PL 30 Year, 5.50%, 4/01/34 | 1,263,708 | 1,362,592 | ||||||||
|
| |||||||||
| 96,170,817 | ||||||||||
|
| |||||||||
| Government National Mortgage Association (GNMA) Fixed Rate 53.9% | ||||||||||
GNMA I SF 30 Year, 3.00%, 7/15/42 | 589,157 | 597,498 | ||||||||
GNMA I SF 30 Year, 4.00%, 10/15/40 - 8/15/45 | 12,381,340 | 13,120,209 | ||||||||
GNMA I SF 30 Year, 4.00%, 9/15/45 - 8/15/46 | 985,066 | 1,043,430 | ||||||||
GNMA I SF 30 Year, 4.50%, 1/15/39 - 5/15/40 | 12,163,146 | 13,166,323 | ||||||||
GNMA I SF 30 Year, 4.50%, 5/15/40 - 6/15/41 | 6,756,623 | 7,317,740 | ||||||||
GNMA I SF 30 Year, 5.00%, 6/15/30 - 10/15/39 | 11,409,337 | 12,561,712 | ||||||||
GNMA I SF 30 Year, 5.00%, 10/15/39 - 3/15/40 | 10,689,336 | 11,856,538 | ||||||||
GNMA I SF 30 Year, 5.00%, 3/15/40 - 9/15/40 | 5,738,996 | 6,345,510 | ||||||||
GNMA I SF 30 Year, 5.50%, 12/15/28 - 10/15/39 | 6,684,740 | 7,509,554 | ||||||||
GNMA I SF 30 Year, 6.00%, 11/15/23 - 11/15/38 | 3,607,346 | 4,118,921 | ||||||||
GNMA I SF 30 Year, 6.50%, 6/15/23 - 9/15/38 | 1,813,066 | 2,013,647 | ||||||||
GNMA I SF 30 Year, 7.00%, 9/15/22 - 1/15/32 | 482,015 | 506,994 | ||||||||
GNMA I SF 30 Year, 7.50%, 2/15/22 - 8/15/33 | 515,556 | 590,380 | ||||||||
GNMA I SF 30 Year, 8.00%, 12/15/21 - 5/15/24 | 126,287 | 130,166 | ||||||||
GNMA I SF 30 Year, 8.50%, 6/15/22 - 12/15/24 | 47,656 | 48,721 | ||||||||
GNMA I SF 30 Year, 9.00%, 9/15/19 - 3/15/20 | 1,219 | 1,224 | ||||||||
GNMA I SF 30 Year, 9.50%, 3/15/18 - 12/15/20 | 24,910 | 25,363 | ||||||||
GNMA I SF 30 Year, 10.00%, 9/15/18 - 8/15/21 | 11,558 | 11,705 | ||||||||
GNMA II SF 30 Year, 3.00%, 12/20/42 - 2/20/45 | 3,075,322 | 3,110,929 | ||||||||
GNMA II SF 30 Year, 3.00%, 9/20/45 | 12,056,799 | 12,193,899 | ||||||||
GNMA II SF 30 Year, 3.00%, 8/20/46 | 12,440,927 | 12,582,394 | ||||||||
GNMA II SF 30 Year, 3.00%, 10/20/46 | 12,192,161 | 12,330,800 | ||||||||
GNMA II SF 30 Year, 3.50%, 12/20/40 - 8/20/43 | 3,144,834 | 3,271,445 | ||||||||
GNMA II SF 30 Year, 3.50%, 8/20/42 | 8,725,725 | 9,076,955 | ||||||||
GNMA II SF 30 Year, 3.50%, 9/20/42 | 25,243,005 | 26,259,100 | ||||||||
GNMA II SF 30 Year, 3.50%, 10/20/42 | 7,676,891 | 7,985,909 | ||||||||
GNMA II SF 30 Year, 3.50%, 11/20/42 | 14,995,265 | 15,598,870 | ||||||||
GNMA II SF 30 Year, 3.50%, 12/20/42 | 11,328,523 | 11,784,536 | ||||||||
GNMA II SF 30 Year, 3.50%, 1/20/43 | 18,948,335 | 19,711,074 | ||||||||
GNMA II SF 30 Year, 3.50%, 3/20/43 | 6,877,334 | 7,154,179 | ||||||||
GNMA II SF 30 Year, 3.50%, 4/20/43 | 8,644,416 | 8,992,398 | ||||||||
GNMA II SF 30 Year, 3.50%, 5/20/43 | 15,791,757 | 16,427,462 | ||||||||
GNMA II SF 30 Year, 3.50%, 6/20/43 | 7,235,921 | 7,527,210 | ||||||||
GNMA II SF 30 Year, 3.50%, 2/20/47 | 109,149,816 | 113,182,986 | ||||||||
GNMA II SF 30 Year, 3.50%, 5/20/47 | 147,611,175 | 153,065,522 | ||||||||
GNMA II SF 30 Year, 4.00%, 11/20/39 - 3/20/41 | 12,258,122 | 13,005,529 | ||||||||
GNMA II SF 30 Year, 4.00%, 7/20/41 - 2/20/44 | 6,863,562 | 7,273,848 | ||||||||
GNMA II SF 30 Year, 4.00%, 11/20/41 | 8,622,592 | 9,131,736 | ||||||||
GNMA II SF 30 Year, 4.00%, 3/20/47 | 74,437,686 | 78,435,966 | ||||||||
GNMA II SF 30 Year, 4.00%, 5/20/47 | 14,969,866 | 15,805,130 | ||||||||
GNMA II SF 30 Year, 4.50%, 10/20/39 - 5/20/41 | 9,270,091 | 9,975,239 | ||||||||
GNMA II SF 30 Year, 4.50%, 6/20/41 - 10/20/41 | 10,190,313 | 10,951,903 | ||||||||
GNMA II SF 30 Year, 4.50%, 9/20/41 | 6,893,181 | 7,408,876 | ||||||||
| FUS-8 | Semiannual Report |
FRANKLIN TEMPLETON VARIABLE INSURANCE PRODUCTS TRUST
STATEMENT OF INVESTMENTS (UNAUDITED)
Franklin U.S. Government Securities VIP Fund (continued)
| Principal Amount* | Value | |||||||||
| Mortgage-Backed Securities (continued) | ||||||||||
| Government National Mortgage Association (GNMA) Fixed Rate (continued) | ||||||||||
GNMA II SF 30 Year, 4.50%, 3/20/42 - 10/20/44 | $ | 11,381,685 | $ | 12,155,611 | ||||||
GNMA II SF 30 Year, 5.00%, 9/20/33 - 10/20/42 | 11,541,051 | 12,704,781 | ||||||||
GNMA II SF 30 Year, 5.00%, 6/20/44 | 3,810,156 | 4,130,617 | ||||||||
GNMA II SF 30 Year, 5.50%, 5/20/34 - 6/20/38 | 5,653,333 | 6,300,028 | ||||||||
GNMA II SF 30 Year, 6.00%, 11/20/23 - 7/20/39 | 3,577,183 | 4,080,330 | ||||||||
GNMA II SF 30 Year, 6.50%, 12/20/27 - 4/20/34 | 553,365 | 635,200 | ||||||||
GNMA II SF 30 Year, 7.00%, 5/20/32 | 9,248 | 10,966 | ||||||||
GNMA II SF 30 Year, 7.50%, 12/20/17 - 5/20/33 | 100,828 | 112,684 | ||||||||
GNMA II SF 30 Year, 8.00%, 8/20/26 | 6,429 | 7,631 | ||||||||
GNMA II SF 30 Year, 9.50%, 4/20/25 | 2,197 | 2,207 | ||||||||
|
| |||||||||
| 713,349,585 | ||||||||||
|
| |||||||||
Total Mortgage-Backed Securities (Cost $1,027,870,624) | 1,025,820,472 | |||||||||
|
| |||||||||
Foreign Government and Agency Securities (Cost $1,760,153) 0.1% | ||||||||||
| b | International Bank for Reconstruction and Development, Principal Strip, 7/15/17 (Supranational) | 1,761,000 | 1,760,527 | |||||||
|
| |||||||||
| U.S. Government and Agency Securities 17.8% | ||||||||||
Federal Agricultural Mortgage Corp., | ||||||||||
4.30%, 5/13/19 | 1,010,000 | 1,061,952 | ||||||||
1.41%, 3/06/20 | 10,000,000 | 9,927,050 | ||||||||
2.66%, 4/12/22 | 7,000,000 | 7,145,936 | ||||||||
FHLB, 2.625%, 9/12/25 | 20,000,000 | 20,115,100 | ||||||||
FICO, | ||||||||||
1P, Strip, 5/11/18 | 10,000,000 | 9,877,350 | ||||||||
12, Strip, 6/06/18 | 4,627,000 | 4,565,253 | ||||||||
13P, Strip, 12/27/18 | 2,500,000 | 2,444,470 | ||||||||
15P, Strip, 3/07/19 | 1,798,000 | 1,751,448 | ||||||||
A-P, Strip, 2/08/18 | 1,000,000 | 992,226 | ||||||||
B-P, Strip, 4/06/18 | 1,405,000 | 1,390,833 | ||||||||
D-P, Strip, 9/26/19 | 7,605,000 | 7,323,463 | ||||||||
E-P, Strip, 11/02/18 | 8,896,000 | 8,720,802 | ||||||||
Israel Government Agency for International Development Bond, | ||||||||||
5.50%, 9/18/23 | 12,000,000 | 14,294,904 | ||||||||
7-Z, U.S. Government Guaranteed, Strip, 8/15/22 | 5,619,000 | 5,046,402 | ||||||||
New Valley Generation IV, secured bond, 4.687%, 1/15/22 | 1,873,266 | 1,988,334 | ||||||||
Overseas Private Investment Corp., | ||||||||||
A, zero cpn., 2/19/18 | 682,174 | 725,330 | ||||||||
A, zero cpn., 11/15/20 | 2,575,000 | 3,100,936 | ||||||||
Private Export Funding Corp., | ||||||||||
secured bond, 2.80%, 5/15/22 | 9,000,000 | 9,294,093 | ||||||||
secured note, 4.30%, 12/15/21 | 1,865,000 | 2,044,877 | ||||||||
secured note, LL, 2.25%, 3/15/20 | 1,700,000 | 1,723,467 | ||||||||
senior secured note, MM, 2.30%, 9/15/20 | 3,500,000 | 3,541,594 | ||||||||
SBA, | ||||||||||
| a | FRN, 3.875%, 3/25/18 | 53,536 | 53,492 | |||||||
PC, 1997-20G, 1, 6.85%, 7/01/17 | 11,384 | 11,387 | ||||||||
PC, 1998-20I, 1, 6.00%, 9/01/18 | 103,722 | 104,740 | ||||||||
Tunisia Government Agency for International Development Bonds, 1.686%, 7/16/19 | 7,000,000 | 7,050,253 | ||||||||
| Semiannual Report | FUS-9 |
FRANKLIN TEMPLETON VARIABLE INSURANCE PRODUCTS TRUST
STATEMENT OF INVESTMENTS (UNAUDITED)
Franklin U.S. Government Securities VIP Fund (continued)
| Principal Amount* | Value | |||||||||
| U.S. Government and Agency Securities (continued) | ||||||||||
TVA, | ||||||||||
1.875%, 8/15/22 | $ | 6,000,000 | $ | 5,970,684 | ||||||
5.88%, 4/01/36 | 5,000,000 | 6,873,390 | ||||||||
Strip, 11/01/18 | 2,644,000 | 2,589,502 | ||||||||
Strip, 6/15/19 | 5,973,000 | 5,774,296 | ||||||||
Strip, 6/15/20 | 6,138,000 | 5,798,182 | ||||||||
U.S. Treasury Bond, | ||||||||||
2.50%, 2/15/46 | 4,000,000 | 3,730,468 | ||||||||
| c | Index Linked, 2.375%, 1/15/25 | 12,192,781 | 13,894,808 | |||||||
| c | Index Linked, 2.00%, 1/15/26 | 13,550,654 | 15,192,479 | |||||||
| c | Index Linked, 1.75%, 1/15/28 | 9,336,670 | 10,413,888 | |||||||
| c | Index Linked, 3.625%, 4/15/28 | 7,558,424 | 9,881,581 | |||||||
| c | U.S. Treasury Note, | |||||||||
Index Linked, 0.125%, 4/15/19 | 10,434,459 | 10,442,901 | ||||||||
Index Linked, 0.125%, 7/15/24 | 15,960,469 | 15,683,044 | ||||||||
Ukraine Government Agency for International Development Bonds, 1.844%, 5/16/19 | 5,000,000 | 5,057,210 | ||||||||
|
| |||||||||
Total U.S. Government and Agency Securities | 235,598,125 | |||||||||
|
| |||||||||
Total Investments before Short Term Investments | 1,263,179,124 | |||||||||
|
| |||||||||
Short Term Investments (Cost $57,294,355) 4.4% | ||||||||||
| Repurchase Agreements 4.4% | ||||||||||
| d | Joint Repurchase Agreement, 1.058%, 7/03/17 (Maturity Value $57,299,407) | |||||||||
BNP Paribas Securities Corp. (Maturity Value $25,709,098) Deutsche Bank Securities Inc. (Maturity Value $5,881,211) HSBC Securities (USA) Inc. (Maturity Value $16,068,473) | ||||||||||
| e | Collateralized by U.S. Government Agency Securities, 0.875% - 1.875%, 12/15/17 - 6/11/21; U.S. Treasury Bill, 11/30/17 - 1/04/18; and U.S. Treasury Note, 0.75% - 4.00%, 4/30/18 - 8/15/21 (valued at $58,499,661) | 57,294,355 | 57,294,355 | |||||||
|
| |||||||||
Total Investments (Cost $1,321,514,807) 99.8% | 1,320,473,479 | |||||||||
Other Assets, less Liabilities 0.2% | 3,283,203 | |||||||||
|
| |||||||||
Net Assets 100.0% | $ | 1,323,756,682 | ||||||||
|
| |||||||||
See Abbreviations on page FUS-19.
*The principal amount is stated in U.S. dollars unless otherwise indicated.
aThe coupon rate shown represents the rate at period end.
bA supranational organization is an entity formed by two or more central governments through international treaties.
cPrincipal amount of security is adjusted for inflation. See Note 1(e).
dSee Note 1(b) regarding joint repurchase agreement.
eThe security was issued on a discount basis with no stated coupon rate.
| FUS-10 | Semiannual Report | The accompanying notes are an integral part of these financial statements. |
FRANKLIN TEMPLETON VARIABLE INSURANCE PRODUCTS TRUST
Financial Statements
Statement of Assets and Liabilities
June 30, 2017 (unaudited)
| Franklin U.S. Government Securities VIP Fund | ||||
Assets: | ||||
Investments in securities: | ||||
Cost - Unaffiliated issuers | $ | 1,264,220,452 | ||
Cost - Repurchase agreements | 57,294,355 | |||
|
| |||
Total cost of investments | $ | 1,321,514,807 | ||
|
| |||
Value - Unaffiliated issuers | $ | 1,263,179,124 | ||
Value - Repurchase agreements | 57,294,355 | |||
|
| |||
Total value of investments | 1,320,473,479 | |||
Receivables: | ||||
Investment securities sold | 909,531 | |||
Capital shares sold | 50,887 | |||
Interest | 4,168,688 | |||
Other assets | 864 | |||
|
| |||
Total assets | 1,325,603,449 | |||
|
| |||
Liabilities: | ||||
Payables: | ||||
Capital shares redeemed | 631,008 | |||
Management fees | 515,565 | |||
Distribution fees | 529,779 | |||
Reports to shareholders | 102,588 | |||
Accrued expenses and other liabilities | 67,827 | |||
|
| |||
Total liabilities | 1,846,767 | |||
|
| |||
Net assets, at value | $ | 1,323,756,682 | ||
|
| |||
Net assets consist of: | ||||
Paid-in capital | $ | 1,390,475,980 | ||
Undistributed net investment income | 6,543,431 | |||
Net unrealized appreciation (depreciation) | (1,041,328 | ) | ||
Accumulated net realized gain (loss) | (72,221,401 | ) | ||
|
| |||
Net assets, at value | $ | 1,323,756,682 | ||
|
| |||
| Class 1: | ||||
Net assets, at value | $ | 71,152,625 | ||
|
| |||
Shares outstanding | 5,798,170 | |||
|
| |||
Net asset value and maximum offering price per share | $ | 12.27 | ||
|
| |||
| Class 2: | ||||
Net assets, at value | $ | 1,252,604,057 | ||
|
| |||
Shares outstanding | 104,281,600 | |||
|
| |||
Net asset value and maximum offering price per share | $ | 12.01 | ||
|
| |||
| The accompanying notes are an integral part of these financial statements. | Semiannual Report | FUS-11 |
FRANKLIN TEMPLETON VARIABLE INSURANCE PRODUCTS TRUST
FINANCIAL STATEMENTS
Statement of Operations
for the six months ended June 30, 2017 (unaudited)
| Franklin U.S. Government Securities VIP Fund | ||||
Investment income: | ||||
Interest | $ | 21,017,211 | ||
Paydown gain (loss) | (4,620,524 | ) | ||
|
| |||
Total investment income | 16,396,687 | |||
|
| |||
Expenses: | ||||
Management fees (Note 3a) | 3,115,231 | |||
Distribution fees - Class 2 (Note 3c) | 1,570,644 | |||
Custodian fees (Note 4) | 6,113 | |||
Reports to shareholders | 72,476 | |||
Professional fees | 32,077 | |||
Trustees’ fees and expenses | 2,999 | |||
Other | 83,326 | |||
|
| |||
Total expenses | 4,882,866 | |||
Expense reductions (Note 4) | (477 | ) | ||
|
| |||
Net expenses | 4,882,389 | |||
|
| |||
Net investment income | 11,514,298 | |||
|
| |||
Realized and unrealized gains (losses): | ||||
Net realized gain (loss) from investments | (8,543,682 | ) | ||
Net change in unrealized appreciation (depreciation) on investments | 7,571,380 | |||
|
| |||
Net realized and unrealized gain (loss) | (972,302 | ) | ||
|
| |||
Net increase (decrease) in net assets resulting from operations | $ | 10,541,996 | ||
|
| |||
| FUS-12 | Semiannual Report | The accompanying notes are an integral part of these financial statements. |
FRANKLIN TEMPLETON VARIABLE INSURANCE PRODUCTS TRUST
FINANCIAL STATEMENTS
Statements of Changes in Net Assets
| Franklin U.S. Government Securities VIP Fund | ||||||||
| Six Months Ended June 30, 2017 (unaudited) | Year Ended December 31, 2016 | |||||||
Increase (decrease) in net assets: | ||||||||
Operations: | ||||||||
Net investment income | $ | 11,514,298 | $ | 21,356,404 | ||||
Net realized gain (loss) | (8,543,682 | ) | 3,288,253 | |||||
Net change in unrealized appreciation (depreciation) | 7,571,380 | (15,237,134 | ) | |||||
|
| |||||||
Net increase (decrease) in net assets resulting from operations | 10,541,996 | 9,407,523 | ||||||
|
| |||||||
Distributions to shareholders from: | ||||||||
Net investment income: | ||||||||
Class 1 | (2,011,168 | ) | (2,105,837 | ) | ||||
Class 2 | (33,122,555 | ) | (33,509,223 | ) | ||||
|
| |||||||
Total distributions to shareholders | (35,133,723 | ) | (35,615,060 | ) | ||||
|
| |||||||
Capital share transactions: (Note 2) | ||||||||
Class 1 | (1,183,467 | ) | (4,571,855 | ) | ||||
Class 2 | 6,874,062 | (18,157,380 | ) | |||||
|
| |||||||
Total capital share transactions | 5,690,595 | (22,729,235 | ) | |||||
|
| |||||||
Net increase (decrease) in net assets | (18,901,132 | ) | (48,936,772 | ) | ||||
Net assets: | ||||||||
Beginning of period | 1,342,657,814 | 1,391,594,586 | ||||||
|
| |||||||
End of period | $ | 1,323,756,682 | $ | 1,342,657,814 | ||||
|
| |||||||
Undistributed net investment income included in net assets: | ||||||||
End of period | $ | 6,543,431 | $ | 30,162,856 | ||||
|
| |||||||
| The accompanying notes are an integral part of these financial statements. | Semiannual Report | FUS-13 |
FRANKLIN TEMPLETON VARIABLE INSURANCE PRODUCTS TRUST
Notes to Financial Statements (unaudited)
Franklin U.S. Government Securities VIP Fund
1. Organization and Significant Accounting Policies
Franklin Templeton Variable Insurance Products Trust (Trust) is registered under the Investment Company Act of 1940 (1940 Act) as an open-end management investment company, consisting of eighteen separate funds and applies the specialized accounting and reporting guidance in U.S. Generally Accepted Accounting Principles (U.S. GAAP). Franklin U.S. Government Securities VIP Fund (Fund) is included in this report. Shares of the Fund are generally sold only to insurance company separate accounts to fund the benefits of variable life insurance policies or variable annuity contracts. At June 30, 2017, 41.9% of the Fund’s shares were held through one insurance company. Investment activities of these insurance company separate accounts could have a material impact on the Fund. The Fund offers two classes of shares: Class 1 and Class 2. Each class of shares may differ by its distribution fees, voting rights on matters affecting a single class and its exchange privilege.
The following summarizes the Fund’s significant accounting policies.
a. Financial Instrument Valuation
The Fund’s investments in financial instruments are carried at fair value daily. Fair value is the price that would be received to sell an asset or paid to transfer a liability in an orderly transaction between market participants on the measurement date. The Fund calculates the net asset value (NAV) per share as of 4 p.m. Eastern time each day the New York Stock Exchange (NYSE) is open for trading. Under compliance policies and procedures approved by the Trust’s Board of Trustees (the Board), the Fund’s administrator has responsibility for oversight of valuation, including leading the cross-functional Valuation Committee (VC). The VC provides administration and oversight of the Fund’s valuation policies and procedures, which are approved annually by the Board. Among other things, these procedures allow the Fund to utilize independent pricing services, quotations from securities and financial instrument dealers, and other market sources to determine fair value.
Debt securities generally trade in the over-the-counter market rather than on a securities exchange. The Fund’s pricing services use multiple valuation techniques to determine fair value. In instances where sufficient market activity exists, the pricing services may utilize a market-based approach through which quotes from market makers are used to determine fair
value. In instances where sufficient market activity may not exist or is limited, the pricing services also utilize proprietary valuation models which may consider market characteristics such as benchmark yield curves, credit spreads, estimated default rates, anticipated market interest rate volatility, coupon rates, anticipated timing of principal repayments, underlying collateral, and other unique security features in order to estimate the relevant cash flows, which are then discounted to calculate the fair value.
Investments in repurchase agreements are valued at cost, which approximates fair value.
The Fund has procedures to determine the fair value of financial instruments for which market prices are not reliable or readily available. Under these procedures, the VC convenes on a regular basis to review such financial instruments and considers a number of factors, including significant unobservable valuation inputs, when arriving at fair value. The VC primarily employs a market-based approach which may use related or comparable assets or liabilities, recent transactions, market multiples, book values, and other relevant information for the investment to determine the fair value of the investment. An income-based valuation approach may also be used in which the anticipated future cash flows of the investment are discounted to calculate fair value. Discounts may also be applied due to the nature or duration of any restrictions on the disposition of the investments. Due to the inherent uncertainty of valuations of such investments, the fair values may differ significantly from the values that would have been used had an active market existed. The VC employs various methods for calibrating these valuation approaches including a regular review of key inputs and assumptions, transactional back-testing or disposition analysis, and reviews of any related market activity.
b. Joint Repurchase Agreement
The Fund enters into a joint repurchase agreement whereby its uninvested cash balance is deposited into a joint cash account with other funds managed by the investment manager or an affiliate of the investment manager and is used to invest in one or more repurchase agreements. The value and face amount of the joint repurchase agreement are allocated to the funds based on their pro-rata interest. A repurchase agreement is accounted for as a loan by the Fund to the seller, collateralized by securities which are delivered to the Fund’s custodian. The fair value, including accrued interest, of the initial collateralization is required to be at least 102% of the dollar amount invested by
| FUS-14 | Semiannual Report |
FRANKLIN TEMPLETON VARIABLE INSURANCE PRODUCTS TRUST
NOTES TO FINANCIAL STATEMENTS (UNAUDITED)
Franklin U.S. Government Securities VIP Fund (continued)
the funds, with the value of the underlying securities marked to market daily to maintain coverage of at least 100%. Repurchase agreements are subject to the terms of Master Repurchase Agreements (MRAs) with approved counterparties (sellers). The MRAs contain various provisions, including but not limited to events of default and maintenance of collateral for repurchase agreements. In the event of default by either the seller or the Fund, certain MRAs may permit the non-defaulting party to net and close-out all transactions, if any, traded under such agreements. The Fund may sell securities it holds as collateral and apply the proceeds towards the repurchase price and any other amounts owed by the seller to the Fund in the event of default by the seller. This could involve costs or delays in addition to a loss on the securities if their value falls below the repurchase price owed by the seller. The joint repurchase agreement held by the Fund at period end, as indicated in the Statement of Investments, had been entered into on June 30, 2017.
c. Mortgage Dollar Rolls
The Fund enters into mortgage dollar rolls, typically on a TBA basis. Mortgage dollar rolls are agreements between the Fund and a financial institution where the Fund sells (or buys) mortgage-backed securities for delivery on a specified date and simultaneously contracts to repurchase (or sell) substantially similar (same type, coupon, and maturity) securities at a future date and at a predetermined price. Gains or losses are realized on the initial sale, and the difference between the repurchase price and the sale price is recorded as an unrealized gain or loss to the Fund upon entering into the mortgage dollar roll. In addition, the Fund may invest the cash proceeds that are received from the initial sale. During the period between the sale and repurchase, the Fund is not entitled to principal and interest paid on the mortgage backed securities. Transactions in mortgage dollar rolls are accounted for as purchases and sales and may result in an increase to the Fund’s portfolio turnover rate. The risks of mortgage dollar roll transactions include the potential inability of the counterparty to fulfill its obligations.
d. Income Taxes
It is the Fund’s policy to qualify as a regulated investment company under the Internal Revenue Code. The Fund intends to distribute to shareholders substantially all of its taxable income and net realized gains to relieve it from federal income and if applicable, excise taxes. As a result, no provision for U.S. federal income taxes is required.
The Fund may recognize an income tax liability related to its uncertain tax positions under U.S. GAAP when the uncertain tax position has a less than 50% probability that it will be sustained upon examination by the tax authorities based on its technical merits. As of June 30, 2017, the Fund has determined that no tax liability is required in its financial statements related to uncertain tax positions for any open tax years (or expected to be taken in future tax years). Open tax years are those that remain subject to examination and are based on each tax jurisdiction’s statute of limitation.
e. Security Transactions, Investment Income, Expenses and Distributions
Security transactions are accounted for on trade date. Realized gains and losses on security transactions are determined on a specific identification basis. Interest income and estimated expenses are accrued daily. Amortization of premium and accretion of discount on debt securities are included in interest income. Paydown gains and losses are recorded separately in the Statement of Operations. Distributions to shareholders are recorded on the ex-dividend date. Distributable earnings are determined according to income tax regulations (tax basis) and may differ from earnings recorded in accordance with U.S. GAAP. These differences may be permanent or temporary. Permanent differences are reclassified among capital accounts to reflect their tax character. These reclassifications have no impact on net assets or the results of operations. Temporary differences are not reclassified, as they may reverse in subsequent periods.
Common expenses incurred by the Trust are allocated among the Funds based on the ratio of net assets of each Fund to the combined net assets of the Trust. Fund specific expenses are charged directly to the Fund that incurred the expense.
Realized and unrealized gains and losses and net investment income, not including class specific expenses, are allocated daily to each class of shares based upon the relative proportion of net assets of each class. Differences in per share distributions, by class, are generally due to differences in class specific expenses.
Inflation-indexed bonds are adjusted for inflation through periodic increases or decreases in the security’s interest accruals, face amount, or principal redemption value, by amounts corresponding to the rate of inflation as measured by
| Semiannual Report | FUS-15 |
FRANKLIN TEMPLETON VARIABLE INSURANCE PRODUCTS TRUST
NOTES TO FINANCIAL STATEMENTS (UNAUDITED)
Franklin U.S. Government Securities VIP Fund (continued)
1. Organization and Significant Accounting
Policies (continued)
e. Security Transactions, Investment Income, Expenses and Distributions (continued)
an index. Any increase or decrease in the face amount or principal redemption value will be included as interest income in the Statement of Operations.
f. Accounting Estimates
The preparation of financial statements in accordance with U.S. GAAP requires management to make estimates and assumptions that affect the reported amounts of assets and liabilities at the date of the financial statements and the amounts of income and expenses during the reporting period. Actual results could differ from those estimates.
g. Guarantees and Indemnifications
Under the Trust’s organizational documents, its officers and trustees are indemnified by the Trust against certain liabilities arising out of the performance of their duties to the Trust. Additionally, in the normal course of business, the Trust, on behalf of the Fund, enters into contracts with service providers that contain general indemnification clauses. The Trust’s maximum exposure under these arrangements is unknown as this would involve future claims that may be made against the Trust that have not yet occurred. Currently, the Trust expects the risk of loss to be remote.
2. Shares of Beneficial Interest
At June 30, 2017, there were an unlimited number of shares authorized (without par value). Transactions in the Fund’s shares were as follows:
| Six Months Ended June 30, 2017 | Year Ended December 31, 2016 | |||||||||||||||||||
| Shares | Amount | Shares | Amount | |||||||||||||||||
| Class 1 Shares: | ||||||||||||||||||||
Shares sold | 131,627 | $ | 1,652,445 | 351,919 | $ | 4,501,949 | ||||||||||||||
Shares issued in reinvestment of distributions | 163,377 | 2,011,168 | 166,207 | 2,105,837 | ||||||||||||||||
Shares redeemed | (386,199 | ) | (4,847,080 | ) | (876,092 | ) | (11,179,641 | ) | ||||||||||||
|
| |||||||||||||||||||
Net increase (decrease) | (91,195 | ) | $ | (1,183,467 | ) | (357,966 | ) | $ | (4,571,855 | ) | ||||||||||
|
| |||||||||||||||||||
| Class 2 Shares: | ||||||||||||||||||||
Shares sold | 5,078,302 | $ | 62,315,681 | 17,880,837 | $ | 224,111,450 | ||||||||||||||
Shares issued in reinvestment of distributions | 2,748,760 | 33,122,555 | 2,700,179 | 33,509,223 | ||||||||||||||||
Shares redeemed | (7,231,163 | ) | (88,564,174 | ) | (22,088,516 | ) | (275,778,053 | ) | ||||||||||||
|
| |||||||||||||||||||
Net increase (decrease) | 595,899 | $ | 6,874,062 | (1,507,500 | ) | $ | (18,157,380 | ) | ||||||||||||
|
| |||||||||||||||||||
3. Transactions with Affiliates
Franklin Resources, Inc. is the holding company for various subsidiaries that together are referred to as Franklin Templeton Investments. Certain officers and trustees of the Fund are also officers and/or directors of the following subsidiaries:
| Subsidiary | Affiliation | |
Franklin Advisers, Inc. (Advisers) | Investment manager | |
Franklin Templeton Services, LLC (FT Services) | Administrative manager | |
Franklin Templeton Distributors, Inc. (Distributors) | Principal underwriter | |
Franklin Templeton Investor Services, LLC (Investor Services) | Transfer agent |
| FUS-16 | Semiannual Report |
FRANKLIN TEMPLETON VARIABLE INSURANCE PRODUCTS TRUST
NOTES TO FINANCIAL STATEMENTS (UNAUDITED)
Franklin U.S. Government Securities VIP Fund (continued)
a. Management Fees
The Fund pays an investment management fee to Advisers based on the average daily net assets of the Fund as follows:
| Annualized Fee Rate | Net Assets | |
0.625% | Up to and including $100 million | |
0.500% | Over $100 million, up to and including $250 million | |
0.450% | Over $250 million, up to and including $7.5 billion | |
0.440% | Over $7.5 billion, up to and including $10 billion | |
0.430% | Over $10 billion, up to and including $12.5 billion | |
0.420% | Over $12.5 billion, up to and including $15 billion | |
0.400% | In excess of $15 billion |
For the period ended June 30, 2017, the annualized effective investment management fee rate was 0.469% of the Fund’s average daily net assets.
b. Administrative Fees
Under an agreement with Advisers, FT Services provides administrative services to the Fund. The fee is paid by Advisers based on the Fund’s average daily net assets, and is not an additional expense of the Fund.
c. Distribution Fees
The Board has adopted a distribution plan for Class 2 shares pursuant to Rule 12b-1 under the 1940 Act. Under the Fund’s compensation distribution plan, the Fund pays Distributors for costs incurred in connection with the servicing, sale and distribution of the Fund’s shares up to 0.35% per year of its average daily net assets. The Board has agreed to limit the current rate to 0.25% per year for Class 2. The plan year, for purposes of monitoring compliance with the maximum annual plan rate, is February 1 through January 31.
d. Transfer Agent Fees
Investor Services, under terms of an agreement, performs shareholder servicing for the Fund and is not paid by the Fund for the services.
4. Expense Offset Arrangement
The Fund has entered into an arrangement with its custodian whereby credits realized as a result of uninvested cash balances are used to reduce a portion of the Fund’s custodian expenses. During the period ended June 30, 2017, the custodian fees were reduced as noted in the Statement of Operations.
5. Income Taxes
For tax purposes, capital losses may be carried over to offset future capital gains. Capital loss carryforwards with no expiration, if any, must be fully utilized before those losses with expiration dates.
| Semiannual Report | FUS-17 |
FRANKLIN TEMPLETON VARIABLE INSURANCE PRODUCTS TRUST
NOTES TO FINANCIAL STATEMENTS (UNAUDITED)
Franklin U.S. Government Securities VIP Fund (continued)
5. Income Taxes (continued)
At December 31, 2016, capital loss carryforwards were as follows:
Capital loss carryforwards subject to expiration: | ||||
2017 | 401,851 | |||
2018 | 426,637 | |||
Capital loss carryforwards not subject to expiration: | ||||
Short term | 22,594,468 | |||
Long term | 40,093,383 | |||
|
| |||
Total capital loss carryforwards | $ | 63,516,339 | ||
|
|
At June 30, 2017, the cost of investments and net unrealized appreciation (depreciation) for income tax purposes were as follows:
Cost of investments. | $ | 1,324,128,864 | ||
|
| |||
Unrealized appreciation | $ | 11,093,611 | ||
Unrealized depreciation | (14,748,996 | ) | ||
|
| |||
Net unrealized appreciation (depreciation) | $ | (3,655,385 | ) | |
|
|
Differences between income and/or capital gains as determined on a book basis and a tax basis are primarily due to differing treatments of paydown losses and bond discounts and premiums.
6. Investment Transactions
Purchases and sales of investments (excluding short term securities) for the period ended June 30, 2017, aggregated $452,261,385 and $493,656,375, respectively.
7. Credit Facility
The Fund, together with other U.S. registered and foreign investment funds (collectively, Borrowers), managed by Franklin Templeton Investments, are borrowers in a joint syndicated senior unsecured credit facility totaling $2 billion (Global Credit Facility) which matures on February 9, 2018. This Global Credit Facility provides a source of funds to the Borrowers for temporary and emergency purposes, including the ability to meet future unanticipated or unusually large redemption requests.
Under the terms of the Global Credit Facility, the Fund shall, in addition to interest charged on any borrowings made by the Fund and other costs incurred by the Fund, pay its share of fees and expenses incurred in connection with the implementation and maintenance of the Global Credit Facility, based upon its relative share of the aggregate net assets of all of the Borrowers, including an annual commitment fee of 0.15% based upon the unused portion of the Global Credit Facility. These fees are reflected in other expenses in the Statement of Operations. During the period ended June 30, 2017, the Fund did not use the Global Credit Facility.
8. Fair Value Measurements
The Fund follows a fair value hierarchy that distinguishes between market data obtained from independent sources (observable inputs) and the Fund’s own market assumptions (unobservable inputs). These inputs are used in determining the value of the Fund’s financial instruments and are summarized in the following fair value hierarchy:
| • | Level 1 – quoted prices in active markets for identical financial instruments |
| FUS-18 | Semiannual Report |
FRANKLIN TEMPLETON VARIABLE INSURANCE PRODUCTS TRUST
NOTES TO FINANCIAL STATEMENTS (UNAUDITED)
Franklin U.S. Government Securities VIP Fund (continued)
| • | Level 2 – other significant observable inputs (including quoted prices for similar financial instruments, interest rates, prepayment speed, credit risk, etc.) |
| • | Level 3 – significant unobservable inputs (including the Fund’s own assumptions in determining the fair value of financial instruments) |
The input levels are not necessarily an indication of the risk or liquidity associated with financial instruments at that level.
For movements between the levels within the fair value hierarchy, the Fund has adopted a policy of recognizing the transfers as of the date of the underlying event which caused the movement.
At June 30, 2017, all of the Fund’s investments in financial instruments carried at fair value were valued using Level 2 inputs.
9. New Accounting Pronouncements
In March 2017, the Financial Accounting Standards Board (FASB) issued Accounting Standards Update (ASU) No. 2017-08, Receivables — Nonrefundable Fees and Other Costs (Subtopic 310-20): Premium Amortization on Purchased Callable Debt Securities. The amendments in the ASU shorten the amortization period for certain callable debt securities, held at a premium, to be amortized to the earliest call date. The ASU does not require an accounting change for securities held at a discount; which continues to be amortized to maturity. The ASU is effective for fiscal years and interim periods within those fiscal years beginning after December 15, 2018. Management is currently evaluating the impact, if any, of applying this provision.
10. Investment Company Reporting Modernization
In October 2016, the U.S. Securities and Exchange Commission adopted new rules and amended existing rules (together, final rules) intended to modernize the reporting and disclosure of information by registered investment companies. In part, the final rules amend Regulation S-X and require standardized, enhanced disclosures about derivatives in investment company financial statements, as well as other amendments. The compliance date for the amendments to Regulation S-X is August 1, 2017. Management has reviewed the requirements and believes the adoption of the amendments to Regulation S-X will not have a material impact on the Fund’s financial statements and related disclosures.
11. Subsequent Events
The Fund has evaluated subsequent events through the issuance of the financial statements and determined that no events have occurred that require disclosure.
Abbreviations
| Selected Portfolio | ||
| FHLB | Federal Home Loan Bank | |
| FICO | Financing Corp. | |
| FRN | Floating Rate Note | |
| GL | Government Loan | |
| PC | Participation Certificate | |
| PL | Project Loan | |
| SBA | Small Business Administration | |
| SF | Single Family | |
| TVA | Tennessee Valley Authority | |
| Semiannual Report | FUS-19 |
This page intentionally left blank.
Templeton Developing Markets VIP Fund
We are pleased to bring you Templeton Developing Markets VIP Fund’s semiannual report for the period ended June 30, 2017.
Class 1 Performance Summary as of June 30, 2017
The Fund’s Class 1 Shares delivered a +21.28% total return* for the six-month period ended June 30, 2017.
*The Fund has a fee waiver associated with any investment it makes in a Franklin Templeton money fund and/or other Franklin Templeton fund, contractually guaranteed through 4/30/18. Fund investment results reflect the fee waiver; without this waiver, the results would have been lower.
Performance reflects the Fund’s Class 1 operating expenses, but does not include any contract fees, expenses or sales charges. If they had been included, performance would be lower. These charges and deductions, particularly for variable life policies, can have a significant effect on contract values and insurance benefits. See the contract prospectus for a complete description of these expenses, including sales charges.
Performance data represent past performance, which does not guarantee future results. Investment return and principal value will fluctuate, and you may have a gain or loss when you sell your shares. Current performance may differ from figures shown.
| Semiannual Report | TD-1 |
TEMPLETON DEVELOPING MARKETS VIP FUND
Fund Goal and Main Investments
The Fund seeks long-term capital appreciation. Under normal market conditions, the Fund invests at least 80% of its net assets in emerging market investments.
Fund Risks
All investments involve risks, including possible loss of principal. Special risks are associated with foreign investing, including currency fluctuations, economic instability and political developments. Investments in developing markets, of which frontier markets are a subset, involve heightened risks related to the same factors, in addition to those associated with these markets’ smaller size, lesser liquidity and lack of established legal, political, business and social frameworks to support securities markets. Because these frameworks are typically even less developed in frontier markets, as well as various factors including the increased potential for extreme price volatility, illiquidity, trade barriers and exchange controls, the risks associated with developing markets are magnified in frontier markets. The Fund is designed for the aggressive portion of a well-diversified portfolio. The Fund is actively managed but there is no guarantee that the manager’s investment decisions will produce the desired results. The Fund’s prospectus also includes a description of the main investment risks.
Performance Overview
You can find the Fund’s six-month total return in the Performance Summary. In comparison, the MSCI Emerging Markets (EM) Index generated a +18.60% total return, and the Standard & Poor’s®/International Finance Corporation Investable Composite Index produced a +18.74% total return for the same period.1 Please note, index performance numbers are for reference and we do not attempt to track an index but rather undertake investments on the basis of fundamental research.
Economic and Market Overview
Emerging market economies in general continued to grow faster than developed market economies during the six months under review. China’s economy grew faster in the first half of 2017 compared to the first half of 2016, driven by solid growth in industrial production, services, fixed-asset investment, retail
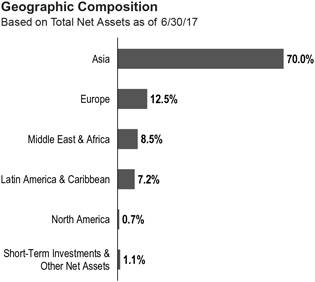
sales, and imports and exports. India’s economy grew at a slower pace in the March 2017 quarter compared to the prior-year period, as consumer spending growth slowed and investment declined following the government’s demonetization program that recalled large-denominated currency notes from circulation. Russia’s economy grew in the first quarter of 2017 compared to the prior-year period, driven by growth in mining, manufacturing, trade and transportation. Brazil’s economy contracted at a slower rate in 2017’s first quarter compared to the prior-year period, but it grew compared to the previous quarter, as export growth offset a small decline in consumer spending and contraction in investment and public spending. Following a quarterly decline in 2016’s fourth quarter, South Africa’s economy fell into recession in 2017’s first quarter as gross domestic product contracted due largely to trade and manufacturing declines. Among other emerging markets, South Korea’s, Taiwan’s and Hungary’s economies continued to grow.
Several central banks, including those of Mexico and Turkey, raised their benchmark interest rates to control inflation and support their currencies, while some, including those of Chile, lowered their benchmark interest rates to promote economic growth. The Bank of Russia reduced its key interest rate several times, but noted at its June meeting that it would implement moderately tight monetary conditions to maintain inflation. Brazil’s central bank cut its benchmark interest rate several times during the period to spur economic growth. China’s,
1. Source: Morningstar.
One cannot invest directly in an index, and an index is not representative of the Fund’s portfolio. Please see Index Descriptions following the Fund Summaries.
The dollar value, number of shares or principal amount, and names of all portfolio holdings are listed in the Fund’s Statement of Investments (SOI).
| TD-2 | Semiannual Report |
TEMPLETON DEVELOPING MARKETS VIP FUND
India’s and South Africa’s central banks left their benchmark interest rates unchanged during the period.
Emerging market stocks rose significantly during the six months under review, as corporate earnings growth and encouraging economic data from China and other emerging market countries helped offset investor concerns about lower commodity prices and various geopolitical tensions. Further supporting stocks were emerging market currencies’ overall strength against the U.S. dollar and subsiding concerns about the potential for a protectionist U.S. trade policy. In this environment, emerging market stocks, as measured by the MSCI EM Index, generated a +18.60% total return for the six months ended June 30, 2017.1
Investment Strategy
We employ a fundamental research, value-oriented, long-term investment approach. We focus on the market price of a company’s securities relative to our evaluation of its long-term earnings, asset value and cash flow potential. We also consider a company’s profit and loss outlook, balance sheet strength, cash flow trends and asset value in relation to the current price. Our analysis considers the company’s corporate governance behavior as well as its position in its sector, the economic framework and political environment. We invest in securities without regard to benchmark comparisons.
Manager’s Discussion
During the six months under review, key contributors to the Fund’s absolute performance included investments in Samsung Electronics, Tencent Holdings and Brilliance China Automotive Holdings.
Samsung Electronics is a major South Korea-based manufacturer of consumer electronics. It is one of the world’s largest manufacturers of mobile phones, smartphones, tablets and televisions. The company is also a leading supplier of memory chips for high-end phones and is a key provider of organic light-emitting diodes (OLED) displays. Key drivers of the stock price included strong first-quarter 2017 corporate results, robust second-quarter earnings guidance, proposed share buybacks and announcement of a cancelation of all existing Treasury shares. Strong demand for Samsung’s new high-end smartphone, the Galaxy S8, which was released in March 2017, also supported sentiment.
Tencent is one of the world’s largest and most widely used Internet service portals. The company provides value-added Internet, mobile and telecommunication services and online advertising under the strategic goal of providing users with
| Top 10 Countries | ||||
| 6/30/2017 | ||||
| % of Total Net Assets | ||||
| China | 21.3% | |||
| South Korea | 16.7% | |||
| Taiwan | 12.0% | |||
| India | 7.9% | |||
| South Africa | 6.9% | |||
| Russia | 6.4% | |||
| Brazil | 4.5% | |||
| Thailand | 3.9% | |||
| Indonesia | 3.5% | |||
| U.K. | 3.3% | |||
“one-stop online lifestyle services.” Over the last decade, Tencent has maintained steady growth under its user-oriented operating strategies. Internet stocks in China rebounded in the first half of 2017 following pressure in the fourth quarter of 2016. Tencent’s shares further benefited from a better-than-expected double-digit increase in first-quarter revenues, driven by the online gaming, online advertising and social networking segments.
Brilliance China Automotive manufactures and sells automobiles to the Chinese domestic market, predominantly through its joint venture with German luxury car manufacturer BMW. The company announced an in-line set of figures for 2016, and better-than-expected first-quarter 2017 earnings growth driven by strong sales growth. Expectations for a continuation of strong sales momentum in the second half of 2017, supported by resilient luxury car demand and the continued rise of China’s upper middle class also drove share price performance over the period. An encouraging outlook based upon new vehicle launches, increased financing revenues, a supportive macroeconomic environment and attractive valuations further supported investor sentiment in the stock.
In contrast, key detractors included positions in IMAX, LUKOIL and Glenmark Pharmaceuticals.
IMAX is one of the world’s leading entertainment technology companies, specializing in immersive motion picture technologies. The company combines proprietary software, theater architecture and equipment to create high-quality motion picture experiences. Its systems are used globally, including a notable market position in China. Gross profit margin for first-quarter 2017 was down from first-quarter 2016, when box-office figures were helped by a stronger movie slate.
| Semiannual Report | TD-3 |
TEMPLETON DEVELOPING MARKETS VIP FUND
In June, the company announced a cost-cutting program and proposed further share buybacks.
LUKOIL is a Russia-based energy company primarily involved in the exploration, production, marketing and refining of oil and oil-related products. The company is one of the world’s largest oil companies in terms of reserves. Although the company delivered first-quarter 2017 results that beat expectations, its shares underperformed due to weak investor sentiment in the Russian market in general and a decline in crude oil prices. After surging 55.93% in U.S. dollar terms in 2016, the Russian market gave back some of those gains in the first half of 2017, with the MSCI Russia Index declining 13.96%. Key reasons for the correction were a decline in oil prices and geopolitical worries, including additional U.S. sanctions.
Glenmark Pharmaceuticals is an Indian manufacturer of generic drugs and pharmaceutical ingredients. Glenmark produces formulation products in areas such as oncology, respiratory and cardiac. It also researches and develops its own chemical and biological entities. In addition to India, the U.S. is its main market. Its share price declined significantly in May as the company announced weaker-than-expected first-quarter 2017 operating performance with disappointing revenue growth. Sales in India were impacted by the government’s demonetization program to recall large-denominated currency notes, while price declines and lower sales for a cholesterol-lowering drug pressured sales in the U.S.
It is important to recognize the effect of currency movements on the Fund’s performance. In general, if the value of the U.S. dollar goes up compared with a foreign currency, an investment traded in that foreign currency will go down in value because it will be worth fewer U.S. dollars. This can have a negative effect on Fund performance. Conversely, when the U.S. dollar weakens in relation to a foreign currency, an investment traded in that foreign currency will increase in value, which can contribute to Fund performance. For the six months ended June 30, 2017, the U.S. dollar declined in value relative to most currencies. As a result, the Fund’s performance was positively affected by the portfolio’s investment predominantly in securities with non-U.S. currency exposure. However, one cannot expect the same result in future periods.
| Top 10 Holdings | ||||
| 6/30/17 | ||||
| Company Sector/Industry, Country | % of Total Net Assets | |||
Samsung Electronics Co. Ltd. Technology Hardware, Storage & Peripherals, South Korea | 7.4% | |||
| Taiwan Semiconductor Manufacturing Co. Ltd. Semiconductors & Semiconductor Equipment, Taiwan | 6.2% | |||
Naspers Ltd. Media, South Africa | 5.5% | |||
| Brilliance China Automotive Holdings Ltd. Automobiles, China | 4.7% | |||
Alibaba Group Holding Ltd. Internet Software & Services, China | 3.4% | |||
Unilever PLC Personal Products, U.K. | 3.2% | |||
Tencent Holdings Ltd. Internet Software & Services, China | 3.1% | |||
Hon Hai Precision Industry Co. Ltd. Electronic Equipment, Instruments & Components, Taiwan | 3.0% | |||
ICICI Bank Ltd. Banks, India | 2.4% | |||
Astra International Tbk PT Automobiles, Indonesia | 2.0% | |||
During the past six months, we increased the Fund’s holdings in Russia, South Korea, Mexico and the Czech Republic as we continued to invest in opportunities we considered to be attractive. In sector terms, we added to the Fund’s holdings in financials, health care and materials.2 Key purchases included a new position in Sberbank of Russia, the country’s leading bank. We also increased investments in South Korea-listed POSCO, one of the world’s largest steel producers, and Alibaba Group Holding, China’s largest e-commerce company.
Conversely, we conducted some sales to focus on stocks we considered to be more attractively valued within our investment universe. We reduced the Fund’s investments in Brazil, South Africa and the U.K. and made some sales in China. In sector terms, we reduced holdings in industrials and consumer staples and conducted some sales in information technology (IT).3 Key sales included reducing holdings in the aforementioned Tencent and in Brazilian financial conglomerate Itau Unibanco Holding.
2. The financials sector comprises banks, diversified financial services and insurance in the SOI. The health care sector comprises biotechnology and pharmaceuticals in the SOI. The materials sector comprises chemicals, construction materials, and metals and mining in the SOI.
3. The industrials sector comprises construction and engineering, distributors, trading companies and distributors, and transportation infrastructure in the SOI. The consumer staples sector comprises beverages, food and staples retailing, food products and personal products in the SOI. The IT sector comprises electronic equipment, instruments and components; Internet software and services; IT services; semiconductors and semiconductor equipment; and technology hardware, storage and peripherals in the SOI.
| TD-4 | Semiannual Report |
TEMPLETON DEVELOPING MARKETS VIP FUND
We also closed the Fund’s position in Remgro, a South African holding company with interests in food, finance and health care.
Thank you for your participation in Templeton Developing Markets VIP Fund. We look forward to serving your future investment needs.
The foregoing information reflects our analysis, opinions and portfolio holdings as of June 30, 2017, the end of the reporting period. The way we implement our main investment strategies and the resulting portfolio holdings may change depending on factors such as market and economic conditions. These opinions may not be relied upon as investment advice or an offer for a particular security. The information is not a complete analysis of every aspect of any market, country, industry, security or the Fund. Statements of fact are from sources considered reliable, but the investment manager makes no representation or warranty as to their completeness or accuracy. Although historical performance is no guarantee of future results, these insights may help you understand our investment management philosophy.
| Semiannual Report | TD-5 |
TEMPLETON DEVELOPING MARKETS VIP FUND
Class 1 Fund Expenses
As an investor in a variable insurance contract (Contract) that indirectly provides for investment in an underlying mutual fund, you can incur transaction and/or ongoing expenses at both the Fund level and the Contract Level: (1) transaction expenses can include sales charges (loads) on purchases, surrender fees, transfer fees and premium taxes; and (2) ongoing expenses can include management fees, distribution and service (12b-1) fees, contract fees, annual maintenance fees, mortality and expense risk fees and other fees and expenses. All mutual funds and Contracts have some types of ongoing expenses. The table below shows Fund-level ongoing expenses and can help you understand these costs and compare them with those of other mutual funds offered through the Contract. The table assumes a $1,000 investment held for the six months indicated. Please refer to the Fund prospectus for additional information on operating expenses.
Actual Fund Expenses
The table below provides information about the actual account values and actual expenses in the columns under the heading “Actual.” In these columns the Fund’s actual return, which includes the effect of ongoing Fund expenses but does not include the effect of ongoing Contract expenses, is used to calculate the “Ending Account Value.” You can estimate the Fund-level expenses you paid during the period by following these steps (of course, your account value and expenses will differ from those in this illustration): Divide your account value by $1,000 (if your account had an $8,600 value, then $8,600 ÷ $1,000 = 8.6). Then multiply the result by the number under the headings “Actual” and “Fund-Level Expenses Paid During Period” (if Fund-Level Expenses Paid During Period were $7.50, then 8.6 × $7.50 = $64.50). In this illustration, the estimated expenses paid this period at the Fund level are $64.50.
Hypothetical Example for Comparison with Other Mutual Funds
Under the heading “Hypothetical” in the table, information is provided about hypothetical account values and hypothetical expenses based on the Fund’s actual expense ratio and an assumed rate of return of 5% per year before expenses, which is not the Fund’s actual return. This information may not be used to estimate the actual ending account balance or expenses you paid for the period, but it can help you compare ongoing costs of investing in the Fund with those of other mutual funds offered through the Contract. To do so, compare this 5% hypothetical example with the 5% hypothetical examples that appear in the shareholder reports of other funds offered through the Contract.
Please note that expenses shown in the table are meant to highlight ongoing costs at the Fund level only and do not reflect any ongoing expenses at the Contract level, or transaction expenses at either the Fund or Contract levels. In addition, while the Fund does not have transaction expenses, if the transaction and ongoing expenses at the Contract level were included, the expenses shown below would be higher. You should consult your Contract prospectus or disclosure document for more information.
| Actual (actual return after expenses) | Hypothetical (5% annual return before expenses) | |||||||||||||||||||||||
| Share Class | | Beginning Account Value 1/1/17 | | | Ending Account Value 6/30/17 | | | Fund-Level Expenses Paid During Period 1/1/17–6/30/17 | 1,2 | | Ending Account Value 6/30/17 | | | Fund-Level Expenses Paid During Period 1/1/17–6/30/17 | 1,2 | | Net Annualized Expense Ratio | 2 | ||||||
Class 1 | $1,000 | $1,212.80 | $7.41 | $1,018.10 | $6.76 | 1.35% | ||||||||||||||||||
1. Expenses are equal to the annualized expense ratio for the six-month period as indicated above — in the far right column — multiplied by the simple average account value over the period indicated, and then multiplied by 181/365 to reflect the one-half year period.
2. Reflects expenses after fee waivers and expense reimbursements. Does not include any ongoing expenses of the Contract for which the Fund is an investment option or acquired fund fees and expenses.
| TD-6 | Semiannual Report |
FRANKLIN TEMPLETON VARIABLE INSURANCE PRODUCTS TRUST
Financial Highlights
Templeton Developing Markets VIP Fund
Six Months Ended (unaudited) | Year Ended December 31, | |||||||||||||||||||||||
| 2016 | 2015 | 2014 | 2013 | 2012 | ||||||||||||||||||||
Class 1 | ||||||||||||||||||||||||
Per share operating performance (for a share outstanding throughout the period) | ||||||||||||||||||||||||
Net asset value, beginning of period | $7.42 | $6.37 | $9.27 | $10.26 | $10.58 | $9.50 | ||||||||||||||||||
|
| |||||||||||||||||||||||
| Income from investment operationsa: | ||||||||||||||||||||||||
Net investment incomeb | 0.04 | 0.05 | 0.06 | 0.15 | c | 0.13 | 0.19 | |||||||||||||||||
Net realized and unrealized gains (losses) | 1.54 | 1.08 | (1.63 | ) | (0.97 | ) | (0.22 | ) | 1.06 | |||||||||||||||
|
| |||||||||||||||||||||||
Total from investment operations | 1.58 | 1.13 | (1.57 | ) | (0.82 | ) | (0.09 | ) | 1.25 | |||||||||||||||
|
| |||||||||||||||||||||||
Less distributions from: | ||||||||||||||||||||||||
Net investment income | (0.11 | ) | (0.08 | ) | (0.20 | ) | (0.17 | ) | (0.23 | ) | (0.17 | ) | ||||||||||||
Net realized gains | — | — | (1.13 | ) | — | — | — | |||||||||||||||||
|
| |||||||||||||||||||||||
Total distributions | (0.11 | ) | (0.08 | ) | (1.33 | ) | (0.17 | ) | (0.23 | ) | (0.17 | ) | ||||||||||||
|
| |||||||||||||||||||||||
Redemption fees | — | — | — | — | d | — | d | — | d | |||||||||||||||
|
| |||||||||||||||||||||||
Net asset value, end of period | $8.89 | $7.42 | $6.37 | $9.27 | $10.26 | $10.58 | ||||||||||||||||||
|
| |||||||||||||||||||||||
Total returne | 21.28% | 17.79% | (19.42)% | (8.09)% | (0.73)% | 13.40% | ||||||||||||||||||
| Ratios to average net assetsf | ||||||||||||||||||||||||
Expenses before waiver and payments by affiliates | 1.36% | 1.38% | 1.33% | 1.36% | 1.35% | 1.35% | ||||||||||||||||||
Expenses net of waiver and payments by affiliates | 1.35% | g | 1.36% | 1.32% | 1.36% | h | 1.35% | 1.35% | ||||||||||||||||
Net investment income | 1.03% | 0.79% | 0.74% | 1.51% | c | 1.25% | 1.93% | |||||||||||||||||
| Supplemental data | ||||||||||||||||||||||||
Net assets, end of period (000’s) | $96,653 | $82,596 | $77,000 | $114,487 | $145,707 | $203,568 | ||||||||||||||||||
Portfolio turnover rate | 8.54% | 26.78% | 71.69% | 82.87% | 44.59% | 24.45% | ||||||||||||||||||
aThe amount shown for a share outstanding throughout the period may not correlate with the Statement of Operations for the period due to the timing of sales and repurchases of the Fund’s shares in relation to income earned and/or fluctuating fair value of the investments of the Fund.
bBased on average daily shares outstanding.
cNet investment income per share includes approximately $0.04 per share related to income received in the form of special dividends in connection with certain Fund holdings. Excluding this amount, the ratio of net investment income to average net assets would have been 1.11%.
dAmount rounds to less than $0.01 per share.
eTotal return does not include fees, charges or expenses imposed by the variable annuity and life insurance contracts for which Franklin Templeton Variable Insurance Products Trust serves as an underlying investment vehicle. Total return is not annualized for periods less than one year.
fRatios are annualized for periods less than one year.
gBenefit of expense reduction rounds to less than 0.01%.
hBenefit of waiver and payments by affiliates rounds to less than 0.01%.
| The accompanying notes are an integral part of these financial statements. | Semiannual Report | TD-7 |
FRANKLIN TEMPLETON VARIABLE INSURANCE PRODUCTS TRUST
FINANCIAL HIGHLIGHTS
Templeton Developing Markets VIP Fund (continued)
Six Months Ended (unaudited) | Year Ended December 31, | |||||||||||||||||||||||
| 2016 | 2015 | 2014 | 2013 | 2012 | ||||||||||||||||||||
| Class 2 | ||||||||||||||||||||||||
Per share operating performance (for a share outstanding throughout the period) | ||||||||||||||||||||||||
Net asset value, beginning of period | $7.36 | $6.32 | $9.20 | $10.19 | $10.50 | $9.42 | ||||||||||||||||||
|
| |||||||||||||||||||||||
| Income from investment operationsa: | ||||||||||||||||||||||||
Net investment incomeb | 0.03 | 0.04 | 0.04 | 0.12 | c | 0.10 | 0.17 | |||||||||||||||||
Net realized and unrealized gains (losses) | 1.53 | 1.06 | (1.61 | ) | (0.96 | ) | (0.21 | ) | 1.05 | |||||||||||||||
|
| |||||||||||||||||||||||
| Total from investment operations | 1.56 | 1.10 | (1.57 | ) | (0.84 | ) | (0.11 | ) | 1.22 | |||||||||||||||
|
| |||||||||||||||||||||||
| Less distributions from: | ||||||||||||||||||||||||
Net investment income | (0.09 | ) | (0.06 | ) | (0.18 | ) | (0.15 | ) | (0.20 | ) | (0.14 | ) | ||||||||||||
Net realized gains | — | — | (1.13 | ) | — | — | — | |||||||||||||||||
|
| |||||||||||||||||||||||
| Total distributions | (0.09 | ) | (0.06 | ) | (1.31 | ) | (0.15 | ) | (0.20 | ) | (0.14 | ) | ||||||||||||
|
| |||||||||||||||||||||||
| Redemption fees | — | — | — | — | d | — | d | — | d | |||||||||||||||
|
| |||||||||||||||||||||||
| Net asset value, end of period | $8.83 | $7.36 | $6.32 | $9.20 | $10.19 | $10.50 | ||||||||||||||||||
|
| |||||||||||||||||||||||
Total returne | 21.19% | 17.44% | (19.60)% | (8.39)% | (0.92)% | 13.16% | ||||||||||||||||||
| Ratios to average net assetsf | ||||||||||||||||||||||||
Expenses before waiver and payments by affiliates | 1.61% | 1.63% | 1.58% | 1.61% | 1.60% | 1.60% | ||||||||||||||||||
Expenses net of waiver and payments by affiliates | 1.60% | g | 1.61% | 1.57% | 1.61% | h | 1.60% | 1.60% | ||||||||||||||||
Net investment income | 0.78% | 0.54% | 0.49% | 1.26% | c | 1.00% | 1.68% | |||||||||||||||||
| Supplemental data | ||||||||||||||||||||||||
Net assets, end of period (000’s) | $241,493 | $205,151 | $192,120 | $250,813 | $274,683 | $291,638 | ||||||||||||||||||
Portfolio turnover rate | 8.54% | 26.78% | 71.69% | 82.87% | 44.59% | 24.45% | ||||||||||||||||||
aThe amount shown for a share outstanding throughout the period may not correlate with the Statement of Operations for the period due to the timing of sales and repurchases of the Fund’s shares in relation to income earned and/or fluctuating fair value of the investments of the Fund.
bBased on average daily shares outstanding.
cNet investment income per share includes approximately $0.04 per share related to income received in the form of special dividends in connection with certain Fund holdings. Excluding this amount, the ratio of net investment income to average net assets would have been 0.86%.
dAmount rounds to less than $0.01 per share.
eTotal return does not include fees, charges or expenses imposed by the variable annuity and life insurance contracts for which Franklin Templeton Variable Insurance Products Trust serves as an underlying investment vehicle. Total return is not annualized for periods less than one year.
fRatios are annualized for periods less than one year.
gBenefit of expense reduction rounds to less than 0.01%.
hBenefit of waiver and payments by affiliates rounds to less than 0.01%.
| TD-8 | Semiannual Report | The accompanying notes are an integral part of these financial statements. |
FRANKLIN TEMPLETON VARIABLE INSURANCE PRODUCTS TRUST
FINANCIAL HIGHLIGHTS
Templeton Developing Markets VIP Fund (continued) |
Six Months Ended (unaudited) | Year Ended December 31, | |||||||||||||||||||||||
| 2016 | 2015 | 2014 | 2013 | 2012 | ||||||||||||||||||||
| Class 4 | ||||||||||||||||||||||||
| Per share operating performance (for a share outstanding throughout the period) | ||||||||||||||||||||||||
Net asset value, beginning of period | $7.39 | $6.34 | $9.22 | $10.20 | $10.50 | $9.42 | ||||||||||||||||||
|
| |||||||||||||||||||||||
| Income from investment operationsa: | ||||||||||||||||||||||||
Net investment incomeb | 0.03 | 0.03 | 0.03 | 0.12 | c | 0.10 | 0.16 | |||||||||||||||||
Net realized and unrealized gains (losses) | 1.54 | 1.06 | (1.62 | ) | (0.97 | ) | (0.21 | ) | 1.04 | |||||||||||||||
|
| |||||||||||||||||||||||
Total from investment operations | 1.57 | 1.09 | (1.59 | ) | (0.85 | ) | (0.11 | ) | 1.20 | |||||||||||||||
|
| |||||||||||||||||||||||
| Less distributions from: | ||||||||||||||||||||||||
Net investment income | (0.08 | ) | (0.04 | ) | (0.16 | ) | (0.13 | ) | (0.19 | ) | (0.12 | ) | ||||||||||||
Net realized gains | — | — | (1.13 | ) | — | — | — | |||||||||||||||||
|
| |||||||||||||||||||||||
Total distributions | (0.08 | ) | (0.04 | ) | (1.29 | ) | (0.13 | ) | (0.19 | ) | (0.12 | ) | ||||||||||||
|
| |||||||||||||||||||||||
Redemption fees | — | — | — | — | d | — | d | — | d | |||||||||||||||
|
| |||||||||||||||||||||||
Net asset value, end of period | $8.88 | $7.39 | $6.34 | $9.22 | $10.20 | $10.50 | ||||||||||||||||||
|
| |||||||||||||||||||||||
Total returne | 21.20% | 17.32% | (19.70)% | (8.48)% | (1.07)% | 13.06% | ||||||||||||||||||
| Ratios to average net assetsf | ||||||||||||||||||||||||
Expenses before waiver and payments by affiliates | 1.71% | 1.73% | 1.68% | 1.71% | 1.70% | 1.70% | ||||||||||||||||||
Expenses net of waiver and payments by affiliates | 1.70% | g | 1.71% | 1.67% | 1.71% | h | 1.70% | 1.70% | ||||||||||||||||
Net investment income | 0.68% | 0.44% | 0.39% | 1.16% | c | 0.90% | 1.58% | |||||||||||||||||
| Supplemental data | ||||||||||||||||||||||||
Net assets, end of period (000’s) | $6,602 | $6,377 | $7,109 | $11,106 | $15,225 | $23,341 | ||||||||||||||||||
Portfolio turnover rate | 8.54% | 26.78% | 71.69% | 82.87% | 44.59% | 24.45% | ||||||||||||||||||
aThe amount shown for a share outstanding throughout the period may not correlate with the Statement of Operations for the period due to the timing of sales and repurchases of the Fund’s shares in relation to income earned and/or fluctuating fair value of the investments of the Fund.
bBased on average daily shares outstanding.
cNet investment income per share includes approximately $0.04 per share related to income received in the form of special dividends in connection with certain Fund holdings. Excluding this amount, the ratio of net investment income to average net assets would have been 0.76%.
dAmount rounds to less than $0.01 per share.
eTotal return does not include fees, charges or expenses imposed by the variable annuity and life insurance contracts for which Franklin Templeton Variable Insurance Products Trust serves as an underlying investment vehicle. Total return is not annualized for periods less than one year.
fRatios are annualized for periods less than one year.
gBenefit of expense reduction rounds to less than 0.01%.
hBenefit of waiver and payments by affiliates rounds to less than 0.01%.
| The accompanying notes are an integral part of these financial statements. | Semiannual Report | TD-9 |
FRANKLIN TEMPLETON VARIABLE INSURANCE PRODUCTS TRUST
Statement of Investments, June 30, 2017 (unaudited)
| Templeton Developing Markets VIP Fund | ||||||||||||
| Industry | Shares | Value | ||||||||||
| Common Stocks 94.3% | ||||||||||||
| Belgium 1.0% | ||||||||||||
Anheuser-Busch InBev SA/NV | Beverages | 31,970 | $ | 3,531,630 | ||||||||
Brazil 1.1% | ||||||||||||
| a | B2W Cia Digital | Internet & Direct Marketing Retail | 183,800 | 648,853 | ||||||||
B3 SA - Brasil Bolsa Balcao | Capital Markets | 55,400 | 330,135 | |||||||||
M Dias Branco SA | Food Products | 136,200 | 2,025,997 | |||||||||
Mahle-Metal Leve SA | Auto Components | 136,600 | 801,650 | |||||||||
|
| |||||||||||
| 3,806,635 | ||||||||||||
|
| |||||||||||
Cambodia 0.7% | ||||||||||||
NagaCorp Ltd. | Hotels, Restaurants & Leisure | 4,824,000 | 2,533,176 | |||||||||
|
| |||||||||||
China 21.3% | ||||||||||||
| a | Alibaba Group Holding Ltd., ADR | Internet Software & Services | 82,310 | 11,597,479 | ||||||||
BAIC Motor Corp. Ltd., H | Automobiles | 1,686,100 | 1,634,757 | |||||||||
| a | Baidu Inc., ADR | Internet Software & Services | 19,190 | 3,432,323 | ||||||||
Bloomage Biotechnology Corp. Ltd. | Chemicals | 772,000 | 1,483,142 | |||||||||
Brilliance China Automotive Holdings Ltd. | Automobiles | 8,909,300 | 16,226,217 | |||||||||
China Life Insurance Co. Ltd., H | Insurance | 539,000 | 1,646,460 | |||||||||
China Mobile Ltd. | Wireless Telecommunication Services | 490,500 | 5,204,819 | |||||||||
China Petroleum & Chemical Corp., H | Oil, Gas & Consumable Fuels | 5,918,000 | 4,616,006 | |||||||||
CNOOC Ltd. | Oil, Gas & Consumable Fuels | 1,465,500 | 1,604,819 | |||||||||
COSCO Shipping Ports Ltd. | Transportation Infrastructure | 1,069,334 | 1,254,535 | |||||||||
Dah Chong Hong Holdings Ltd. | Distributors | 1,746,100 | 800,620 | |||||||||
Inner Mongolia Yitai Coal Co. Ltd., B | Oil, Gas & Consumable Fuels | 556,500 | 573,195 | |||||||||
NetEase Inc., ADR | Internet Software & Services | 13,224 | 3,975,531 | |||||||||
Ping An Insurance Group Co. of China Ltd., A | Insurance | 611,929 | 4,476,055 | |||||||||
Poly Culture Group Corp. Ltd., H | Media | 229,200 | 542,489 | |||||||||
Tencent Holdings Ltd. | Internet Software & Services | 299,900 | 10,724,227 | |||||||||
Uni-President China Holdings Ltd. | Food Products | 3,563,300 | 2,879,757 | |||||||||
Weifu High-Technology Co. Ltd., B | Auto Components | 334,339 | 790,483 | |||||||||
|
| |||||||||||
| 73,462,914 | ||||||||||||
|
| |||||||||||
Czech Republic 0.4% | ||||||||||||
Moneta Money Bank AS | Banks | 390,403 | 1,308,060 | |||||||||
|
| |||||||||||
Hong Kong 2.5% | ||||||||||||
Dairy Farm International Holdings Ltd. | Food & Staples Retailing | 149,333 | 1,176,744 | |||||||||
MGM China Holdings Ltd. | Hotels, Restaurants & Leisure | 1,731,200 | 3,849,205 | |||||||||
Sands China Ltd. | Hotels, Restaurants & Leisure | 807,600 | 3,697,826 | |||||||||
|
| |||||||||||
| 8,723,775 | ||||||||||||
|
| |||||||||||
Hungary 1.4% | ||||||||||||
Richter Gedeon Nyrt | Pharmaceuticals | 177,170 | 4,631,514 | |||||||||
|
| |||||||||||
India 7.9% | ||||||||||||
Bajaj Holdings & Investment Ltd. | Diversified Financial Services | 35,390 | 1,157,130 | |||||||||
Biocon Ltd. | Biotechnology | 889,725 | 4,558,085 | |||||||||
Coal India Ltd. | Oil, Gas & Consumable Fuels | 338,475 | 1,279,364 | |||||||||
Glenmark Pharmaceuticals Ltd. | Pharmaceuticals | 292,323 | 2,862,612 | |||||||||
ICICI Bank Ltd. | Banks | 1,806,409 | 8,110,950 | |||||||||
Infosys Ltd. | IT Services | 183,099 | 2,650,855 | |||||||||
Reliance Industries Ltd. | Oil, Gas & Consumable Fuels | 118,700 | 2,534,912 | |||||||||
Tata Chemicals Ltd. | Chemicals | 238,500 | 2,240,136 | |||||||||
Tata Motors Ltd., A | Automobiles | 401,271 | 1,635,015 | |||||||||
|
| |||||||||||
| 27,029,059 | ||||||||||||
|
| |||||||||||
| TD-10 | Semiannual Report |
FRANKLIN TEMPLETON VARIABLE INSURANCE PRODUCTS TRUST
STATEMENT OF INVESTMENTS (UNAUDITED)
Templeton Developing Markets VIP Fund (continued)
| Industry | Shares | Value | ||||||||||||
| Common Stocks (continued) | ||||||||||||||
| Indonesia 3.5% | ||||||||||||||
Astra International Tbk PT | Automobiles | 10,115,100 | $ | 6,773,759 | ||||||||||
Bank Danamon Indonesia Tbk PT | Banks | 5,707,000 | 2,194,588 | |||||||||||
Perusahaan Gas Negara (Persero) Tbk PT | Gas Utilities | 6,697,400 | 1,130,681 | |||||||||||
Semen Indonesia (Persero) Tbk PT | Construction Materials | 2,764,700 | 2,074,432 | |||||||||||
|
| |||||||||||||
| 12,173,460 | ||||||||||||||
|
| |||||||||||||
| Kenya 0.4% | ||||||||||||||
Equity Group Holdings Ltd. | Banks | 3,712,900 | 1,351,610 | |||||||||||
|
| |||||||||||||
| Mexico 1.9% | ||||||||||||||
Grupo Financiero Santander Mexico SAB de CV, B, ADR | Banks | 545,057 | 5,254,349 | |||||||||||
Nemak SAB de CV | Auto Components | 1,426,300 | 1,368,299 | |||||||||||
|
| |||||||||||||
| 6,622,648 | ||||||||||||||
|
| |||||||||||||
| Nigeria 0.0%† | ||||||||||||||
Nigerian Breweries PLC | Beverages | 170,327 | 73,447 | |||||||||||
|
| |||||||||||||
| Pakistan 1.2% | ||||||||||||||
Habib Bank Ltd. | Banks | 1,550,000 | 3,988,966 | |||||||||||
|
| |||||||||||||
| Peru 0.8% | ||||||||||||||
Compania de Minas Buenaventura SA, ADR | Metals & Mining | 243,390 | 2,798,985 | |||||||||||
|
| |||||||||||||
| Philippines 0.2% | ||||||||||||||
BDO Unibank Inc. | Banks | 327,469 | 805,350 | |||||||||||
|
| |||||||||||||
| Russia 6.4% | ||||||||||||||
Gazprom PAO, ADR | Oil, Gas & ConsumableFuels | 666,900 | 2,639,590 | |||||||||||
LUKOIL PJSC, ADR | Oil, Gas & Consumable Fuels | 56,700 | 2,761,290 | |||||||||||
LUKOIL PJSC, ADR (London Stock Exchange) | Oil, Gas & Consumable Fuels | 38,600 | 1,879,820 | |||||||||||
| a,b | Mail.Ru Group Ltd., GDR, Reg S | Internet Software & Services | 179,485 | 4,729,430 | ||||||||||
MMC Norilsk Nickel PJSC, ADR | Metals & Mining | 137,400 | 1,896,120 | |||||||||||
Sberbank of Russia PJSC, ADR | Banks | 402,166 | 4,162,418 | |||||||||||
| a | Yandex NV, A | Internet Software & Services | 150,078 | 3,938,047 | ||||||||||
|
| |||||||||||||
| 22,006,715 | ||||||||||||||
|
| |||||||||||||
| Singapore 0.1% | ||||||||||||||
DBS Group Holdings Ltd. | Banks | 25,706 | 387,233 | |||||||||||
|
| |||||||||||||
| South Africa 6.9% | ||||||||||||||
Massmart Holdings Ltd. | Food & Staples Retailing | 293,714 | 2,366,220 | |||||||||||
MTN Group Ltd. | Wireless Telecommunication Services | 276,096 | 2,405,601 | |||||||||||
Naspers Ltd., N | Media | 97,448 | 18,938,197 | |||||||||||
|
| |||||||||||||
| 23,710,018 | ||||||||||||||
|
| |||||||||||||
| South Korea 16.7% | ||||||||||||||
Daelim Industrial Co. Ltd. | Construction & Engineering | 53,442 | 4,154,261 | |||||||||||
Fila Korea Ltd. | Textiles, Apparel & Luxury Goods | 33,470 | 2,499,441 | |||||||||||
Hankook Tire Co. Ltd. | Auto Components | 21,600 | 1,199,864 | |||||||||||
Hanon Systems | Auto Components | 292,362 | 2,630,142 | |||||||||||
Hite Jinro Co. Ltd. | Beverages | 64,320 | 1,308,950 | |||||||||||
Hyundai Development Co-Engineering & Construction | Construction & Engineering | 126,830 | 5,200,902 | |||||||||||
iMarketkorea Inc. | Trading Companies & Distributors | 70,490 | 837,312 | |||||||||||
Interpark Holdings Corp. | Internet & Direct Marketing Retail | 142,053 | 750,632 | |||||||||||
KT Skylife Co. Ltd. | Media | 176,060 | 2,514,198 | |||||||||||
POSCO | Metals & Mining | 13,592 | 3,407,111 | |||||||||||
Samsung Electronics Co. Ltd. | Technology Hardware, Storage & Peripherals | 12,367 | 25,675,246 | |||||||||||
SK Hynix Inc. | Semiconductors & Semiconductor Equipment | 113,860 | 6,702,737 | |||||||||||
| Semiannual Report | TD-11 |
FRANKLIN TEMPLETON VARIABLE INSURANCE PRODUCTS TRUST
STATEMENT OF INVESTMENTS (UNAUDITED)
Templeton Developing Markets VIP Fund (continued)
| Industry | Shares | Value | ||||||||||||
| Common Stocks (continued) | ||||||||||||||
South Korea (continued) | ||||||||||||||
Youngone Corp. | Textiles, Apparel & Luxury Goods | 22,200 | $ | 661,193 | ||||||||||
|
| |||||||||||||
| 57,541,989 | ||||||||||||||
|
| |||||||||||||
| Taiwan 12.0% | ||||||||||||||
Catcher Technology Co. Ltd. | Technology Hardware, Storage & Peripherals | 357,000 | 4,269,576 | |||||||||||
Hon Hai Precision Industry Co. Ltd. | | Electronic Equipment, Instruments & Components |
| 2,700,500 | 10,395,423 | |||||||||
Largan Precision Co. Ltd. | | Electronic Equipment, Instruments & Components |
| 14,000 | 2,233,994 | |||||||||
Pegatron Corp. | Technology Hardware, Storage & Peripherals | 973,800 | 3,053,338 | |||||||||||
Taiwan Semiconductor Manufacturing Co. Ltd. | Semiconductors & Semiconductor Equipment | 3,100,000 | 21,265,710 | |||||||||||
|
| |||||||||||||
| 41,218,041 | ||||||||||||||
|
| |||||||||||||
| Thailand 3.9% | ||||||||||||||
Kasikornbank PCL, fgn | Banks | 619,500 | 3,643,581 | |||||||||||
Kiatnakin Bank PCL, fgn | Banks | 1,009,800 | 2,128,558 | |||||||||||
Land and Houses PCL, fgn | Real Estate Management & Development | 4,853,900 | 1,459,604 | |||||||||||
PTT Exploration and Production PCL, fgn | Oil, Gas & Consumable Fuels | 584,500 | 1,486,236 | |||||||||||
Siam Commercial Bank PCL, fgn | Banks | 306,400 | 1,404,635 | |||||||||||
Thai Beverage PCL, fgn | Beverages | 5,290,600 | 3,458,411 | |||||||||||
|
| |||||||||||||
| 13,581,025 | ||||||||||||||
|
| |||||||||||||
| United Kingdom 3.3% | ||||||||||||||
Unilever PLC | Personal Products | 206,804 | 11,192,430 | |||||||||||
|
| |||||||||||||
| United States 0.7% | ||||||||||||||
| a | IMAX Corp | Media | 114,064 | 2,509,408 | ||||||||||
|
| |||||||||||||
Total Common Stocks (Cost $249,026,842) | 324,988,088 | |||||||||||||
|
| |||||||||||||
| c | Participatory Notes 1.2% | |||||||||||||
| Saudi Arabia 1.2% | ||||||||||||||
Deutsche Bank AG/London, Samba Financial Group, 8/03/20 | Banks | 143,055 | 989,901 | |||||||||||
HSBC Bank PLC, Saudi Basic Industries Corp., 1/22/18 | Chemicals | 118,213 | 3,215,265 | |||||||||||
|
| |||||||||||||
Total Participatory Notes (Cost $3,355,684) | 4,205,166 | |||||||||||||
|
| |||||||||||||
Preferred Stocks 3.4% | ||||||||||||||
| Brazil 3.4% | ||||||||||||||
| d | Banco Bradesco SA, 4.12%, ADR, pfd | Banks | 627,815 | 5,336,428 | ||||||||||
| d | Itau Unibanco Holding SA, 5.137%, ADR, pfd | Banks | 589,962 | 6,519,080 | ||||||||||
|
| |||||||||||||
Total Preferred Stocks (Cost $6,333,400) | 11,855,508 | |||||||||||||
|
| |||||||||||||
Total Investments before Short Term Investments (Cost $258,715,926) | 341,048,762 | |||||||||||||
|
| |||||||||||||
| TD-12 | Semiannual Report |
FRANKLIN TEMPLETON VARIABLE INSURANCE PRODUCTS TRUST
STATEMENT OF INVESTMENTS (UNAUDITED)
Templeton Developing Markets VIP Fund (continued)
| Shares | Value | |||||||||
Short Term Investments (Cost $3,394,033) 1.0% | ||||||||||
Money Market Funds 1.0% | ||||||||||
| United States 1.0% | ||||||||||
| e,f | Institutional Fiduciary Trust Money Market Portfolio, 0.58% | 3,394,033 | $ | 3,394,033 | ||||||
|
| |||||||||
Total Investments (Cost $262,109,959) 99.9% | 344,442,795 | |||||||||
Other Assets, less Liabilities 0.1% | 304,507 | |||||||||
|
| |||||||||
Net Assets 100.0% | $ | 344,747,302 | ||||||||
|
| |||||||||
See Abbreviations on page TD-23.
†Rounds to less than 0.1% of net assets.
aNon-income producing.
bSecurity was purchased pursuant to Regulation S under the Securities Act of 1933, which exempts from registration securities offered and sold outside of the United States. Such a security cannot be sold in the United States without either an effective registration statement filed pursuant to the Securities Act of 1933, or pursuant to an exemption from registration. This security has been deemed liquid under guidelines approved by the Trust’s Board of Trustees. At June 30, 2017, the value of this security was $4,729,430, representing 1.4% of net assets.
cSee Note 1(c) regarding Participatory Notes.
dVariable rate security. The rate shown represents the yield at period end.
eSee Note 3(e) regarding investments in affiliated management investment companies.
fThe rate shown is the annualized seven-day yield at period end.
| The accompanying notes are an integral part of these financial statements. | Semiannual Report | TD-13 |
FRANKLIN TEMPLETON VARIABLE INSURANCE PRODUCTS TRUST
Financial Statements
Statement of Assets and Liabilities
June 30, 2017 (unaudited)
| Templeton Developing Markets VIP Fund | ||||
Assets: | ||||
Investments in securities: | ||||
Cost - Unaffiliated issuers | $ | 258,715,926 | ||
Cost - Non-controlled affiliates (Note 3e) | 3,394,033 | |||
|
| |||
Total cost of investments | $ | 262,109,959 | ||
|
| |||
Value - Unaffiliated issuers | $ | 341,048,762 | ||
Value - Non-controlled affiliates (Note 3e) | 3,394,033 | |||
|
| |||
Total value of investments | 344,442,795 | |||
Receivables: | ||||
Investment securities sold | 117,889 | |||
Capital shares sold | 231,148 | |||
Dividends | 1,267,290 | |||
Foreign tax | 23,735 | |||
Other assets | 202 | |||
|
| |||
Total assets | 346,083,059 | |||
|
| |||
Liabilities: | ||||
Payables: | ||||
Investment securities purchased | 83,938 | |||
Capital shares redeemed | 416,379 | |||
Management fees | 352,000 | |||
Distribution fees | 105,050 | |||
Reports to shareholders | 73,589 | |||
Deferred tax | 236,544 | |||
Accrued expenses and other liabilities | 68,257 | |||
|
| |||
Total liabilities | 1,335,757 | |||
|
| |||
Net assets, at value | $ | 344,747,302 | ||
|
| |||
Net assets consist of: | ||||
Paid-in capital | $ | 294,801,597 | ||
Distributions in excess of net investment income | (3,913,862 | ) | ||
Net unrealized appreciation (depreciation) | 82,066,897 | |||
Accumulated net realized gain (loss) | (28,207,330 | ) | ||
|
| |||
Net assets, at value | $ | 344,747,302 | ||
|
| |||
| Class 1: | ||||
Net assets, at value | $ | 96,653,027 | ||
|
| |||
Shares outstanding | 10,866,797 | |||
|
| |||
Net asset value and maximum offering price per share | $ | 8.89 | ||
|
| |||
| Class 2: | ||||
Net assets, at value | $ | 241,492,621 | ||
|
| |||
Shares outstanding | 27,348,017 | |||
|
| |||
Net asset value and maximum offering price per share | $ | 8.83 | ||
|
| |||
| Class 4: | ||||
Net assets, at value | $ | 6,601,654 | ||
|
| |||
Shares outstanding | 743,522 | |||
|
| |||
Net asset value and maximum offering price per share | $ | 8.88 | ||
|
| |||
| TD-14 | Semiannual Report | The accompanying notes are an integral part of these financial statements. |
FRANKLIN TEMPLETON VARIABLE INSURANCE PRODUCTS TRUST
FINANCIAL STATEMENTS
Statement of Operations
for the six months ended June 30, 2017 (unaudited)
| Templeton Developing Markets VIP Fund | ||||
Investment income: | ||||
Dividends: (net of foreign taxes of $671,504) | ||||
Unaffiliated issuers | $ | 3,883,788 | ||
Non-controlled affiliates (Note 3e) | 7,086 | |||
|
| |||
Total investment income | 3,890,874 | |||
|
| |||
Expenses: | ||||
Management fees (Note 3a) | 2,033,073 | |||
Distribution fees: (Note 3c) | ||||
Class 2 | 286,240 | |||
Class 4 | 11,451 | |||
Custodian fees (Note 4) | 52,054 | |||
Reports to shareholders | 84,976 | |||
Registration and filing fees | 1,189 | |||
Professional fees | 33,436 | |||
Trustees’ fees and expenses | 662 | |||
Other | 12,256 | |||
|
| |||
Total expenses | 2,515,337 | |||
Expense reductions (Note 4) | (92 | ) | ||
Expenses waived/paid by affiliates (Note 3e) | (8,295 | ) | ||
|
| |||
Net expenses | 2,506,950 | |||
|
| |||
Net investment income | 1,383,924 | |||
|
| |||
Realized and unrealized gains (losses): | ||||
Net realized gain (loss) from: | ||||
Investments | 11,089,640 | |||
Foreign currency transactions | 104,255 | |||
|
| |||
Net realized gain (loss) | 11,193,895 | |||
|
| |||
Net change in unrealized appreciation (depreciation) on: | ||||
Investments | 49,611,553 | |||
Translation of other assets and liabilities denominated in foreign currencies | 4,184 | |||
Change in deferred taxes on unrealized appreciation. | 32,849 | |||
|
| |||
Net change in unrealized appreciation (depreciation) | 49,648,586 | |||
|
| |||
Net realized and unrealized gain (loss) | 60,842,481 | |||
|
| |||
Net increase (decrease) in net assets resulting from operations | $ | 62,226,405 | ||
|
| |||
| The accompanying notes are an integral part of these financial statements. | Semiannual Report | TD-15 |
FRANKLIN TEMPLETON VARIABLE INSURANCE PRODUCTS TRUST
FINANCIAL STATEMENTS
Statements of Changes in Net Assets
| Templeton Developing Markets VIP Fund | ||||||||
| Six Months Ended June 30, 2017 (unaudited) | Year Ended 2016 | |||||||
Increase (decrease) in net assets: | ||||||||
Operations: | ||||||||
Net investment income | $ | 1,383,924 | $ | 1,776,761 | ||||
Net realized gain (loss) | 11,193,895 | 10,092,119 | ||||||
Net change in unrealized appreciation (depreciation) | 49,648,586 | 34,428,227 | ||||||
|
| |||||||
Net increase (decrease) in net assets resulting from operations | 62,226,405 | 46,297,107 | ||||||
|
| |||||||
Distributions to shareholders from: | ||||||||
Net investment income: | ||||||||
Class 1 | (1,158,124 | ) | (875,959 | ) | ||||
Class 2 | (2,409,152 | ) | (1,674,699 | ) | ||||
Class 4 | (56,318 | ) | (44,436 | ) | ||||
|
| |||||||
Total distributions to shareholders | (3,623,594 | ) | (2,595,094 | ) | ||||
|
| |||||||
Capital share transactions: (Note 2) | ||||||||
Class 1 | (2,213,100 | ) | (6,421,627 | ) | ||||
Class 2 | (4,783,739 | ) | (17,591,736 | ) | ||||
Class 4 | (982,491 | ) | (1,794,556 | ) | ||||
|
| |||||||
Total capital share transactions | (7,979,330 | ) | (25,807,919 | ) | ||||
|
| |||||||
Net increase (decrease) in net assets | 50,623,481 | 17,894,094 | ||||||
Net assets: | ||||||||
Beginning of period | 294,123,821 | 276,229,727 | ||||||
|
| |||||||
End of period | $ | 344,747,302 | $ | 294,123,821 | ||||
|
| |||||||
Distributions in excess of net investment income included in net assets: | ||||||||
End of period | $ | (3,913,862 | ) | $ | (1,674,192 | ) | ||
|
| |||||||
| TD-16 | Semiannual Report | The accompanying notes are an integral part of these financial statements. |
FRANKLIN TEMPLETON VARIABLE INSURANCE PRODUCTS TRUST
Notes to Financial Statements (unaudited)
Templeton Developing Markets VIP Fund
1. Organization and Significant Accounting Policies
Franklin Templeton Variable Insurance Products Trust (Trust) is registered under the Investment Company Act of 1940 (1940 Act) as an open-end management investment company, consisting of eighteen separate funds and applies the specialized accounting and reporting guidance in U.S. Generally Accepted Accounting Principles (U.S. GAAP). Templeton Developing Markets VIP Fund (Fund) is included in this report. Shares of the Fund are generally sold only to insurance company separate accounts to fund the benefits of variable life insurance policies or variable annuity contracts. The Fund offers three classes of shares: Class 1, Class 2 and Class 4. Each class of shares may differ by its distribution fees, voting rights on matters affecting a single class and its exchange privilege.
The following summarizes the Fund’s significant accounting policies.
a. Financial Instrument Valuation
The Fund’s investments in financial instruments are carried at fair value daily. Fair value is the price that would be received to sell an asset or paid to transfer a liability in an orderly transaction between market participants on the measurement date. The Fund calculates the net asset value (NAV) per share as of 4 p.m. Eastern time each day the New York Stock Exchange (NYSE) is open for trading. Under compliance policies and procedures approved by the Trust’s Board of Trustees (the Board), the Fund’s administrator has responsibility for oversight of valuation, including leading the cross-functional Valuation Committee (VC). The VC provides administration and oversight of the Fund’s valuation policies and procedures, which are approved annually by the Board. Among other things, these procedures allow the Fund to utilize independent pricing services, quotations from securities and financial instrument dealers, and other market sources to determine fair value.
Equity securities listed on an exchange or on the NASDAQ National Market System are valued at the last quoted sale price or the official closing price of the day, respectively. Foreign equity securities are valued as of the close of trading on the foreign stock exchange on which the security is primarily traded, or as of 4 p.m. Eastern time. The value is then converted into its U.S. dollar equivalent at the foreign exchange rate in effect at 4 p.m. Eastern time on the day that the value of the security is determined. Over-the-counter (OTC) securities are
valued within the range of the most recent quoted bid and ask prices. Securities that trade in multiple markets or on multiple exchanges are valued according to the broadest and most representative market. Certain equity securities are valued based upon fundamental characteristics or relationships to similar securities.
Investments in open-end mutual funds are valued at the closing NAV.
The Fund has procedures to determine the fair value of financial instruments for which market prices are not reliable or readily available. Under these procedures, the VC convenes on a regular basis to review such financial instruments and considers a number of factors, including significant unobservable valuation inputs, when arriving at fair value. The VC primarily employs a market-based approach which may use related or comparable assets or liabilities, recent transactions, market multiples, book values, and other relevant information for the investment to determine the fair value of the investment. An income-based valuation approach may also be used in which the anticipated future cash flows of the investment are discounted to calculate fair value. Discounts may also be applied due to the nature or duration of any restrictions on the disposition of the investments. Due to the inherent uncertainty of valuations of such investments, the fair values may differ significantly from the values that would have been used had an active market existed. The VC employs various methods for calibrating these valuation approaches including a regular review of key inputs and assumptions, transactional back-testing or disposition analysis, and reviews of any related market activity.
Trading in securities on foreign securities stock exchanges and OTC markets may be completed before 4 p.m. Eastern time. In addition, trading in certain foreign markets may not take place on every Fund’s business day. Occasionally, events occur between the time at which trading in a foreign security is completed and 4 p.m. Eastern time that might call into question the reliability of the value of a portfolio security held by the Fund. As a result, differences may arise between the value of the Fund’s portfolio securities as determined at the foreign market close and the latest indications of value at 4 p.m. Eastern time. In order to minimize the potential for these differences, the VC monitors price movements following the close of trading in foreign stock markets through a series of country specific market proxies (such as baskets of American Depositary Receipts, futures contracts and exchange traded funds). These price movements are measured against
| Semiannual Report | TD-17 |
FRANKLIN TEMPLETON VARIABLE INSURANCE PRODUCTS TRUST
NOTES TO FINANCIAL STATEMENTS (UNAUDITED)
Templeton Developing Markets VIP Fund (continued)
1. Organization and Significant Accounting Policies (continued)
a. Financial Instrument Valuation (continued)
established trigger thresholds for each specific market proxy to assist in determining if an event has occurred that may call into question the reliability of the values of the foreign securities held by the Fund. If such an event occurs, the securities may be valued using fair value procedures, which may include the use of independent pricing services.
When the last day of the reporting period is a non-business day, certain foreign markets may be open on those days that the Fund’s NAV is not calculated, which could result in differences between the value of the Fund’s portfolio securities on the last business day and the last calendar day of the reporting period. Any significant security valuation changes due to an open foreign market are adjusted and reflected by the Fund for financial reporting purposes.
b. Foreign Currency Translation
Portfolio securities and other assets and liabilities denominated in foreign currencies are translated into U.S. dollars based on the exchange rate of such currencies against U.S. dollars on the date of valuation. The Fund may enter into foreign currency exchange contracts to facilitate transactions denominated in a foreign currency. Purchases and sales of securities, income and expense items denominated in foreign currencies are translated into U.S. dollars at the exchange rate in effect on the transaction date. Portfolio securities and assets and liabilities denominated in foreign currencies contain risks that those currencies will decline in value relative to the U.S. dollar. Occasionally, events may impact the availability or reliability of foreign exchange rates used to convert the U.S. dollar equivalent value. If such an event occurs, the foreign exchange rate will be valued at fair value using procedures established and approved by the Board.
The Fund does not separately report the effect of changes in foreign exchange rates from changes in market prices on securities held. Such changes are included in net realized and unrealized gain or loss from investments in the Statement of Operations.
Realized foreign exchange gains or losses arise from sales of foreign currencies, currency gains or losses realized between the trade and settlement dates on securities transactions and the difference between the recorded amounts of dividends, interest, and foreign withholding taxes and the U.S. dollar equivalent of
the amounts actually received or paid. Net unrealized foreign exchange gains and losses arise from changes in foreign exchange rates on foreign denominated assets and liabilities other than investments in securities held at the end of the reporting period.
c. Participatory Notes
The Fund invests in Participatory Notes (P-Notes). P-Notes are promissory notes that are designed to offer a return linked to the performance of a particular underlying equity security or market. P-Notes are issued by banks or broker-dealers and allow the Fund to gain exposure to common stocks in markets where direct investment is not allowed. Income received from P-Notes is recorded as dividend income in the Statement of Operations. P-Notes may contain various risks including the potential inability of the counterparty to fulfill their obligations under the terms of the contract. These securities may be more volatile and less liquid than other investments held by the Fund.
d. Income and Deferred Taxes
It is the Fund’s policy to qualify as a regulated investment company under the Internal Revenue Code. The Fund intends to distribute to shareholders substantially all of its taxable income and net realized gains to relieve it from federal income and if applicable, excise taxes. As a result, no provision for U.S. federal income taxes is required.
The Fund may be subject to foreign taxation related to income received, capital gains on the sale of securities and certain foreign currency transactions in the foreign jurisdictions in which it invests. Foreign taxes, if any, are recorded based on the tax regulations and rates that exist in the foreign markets in which the Fund invests. When a capital gain tax is determined to apply, the Fund records an estimated deferred tax liability in an amount that would be payable if the securities were disposed of on the valuation date.
The Fund may recognize an income tax liability related to its uncertain tax positions under U.S. GAAP when the uncertain tax position has a less than 50% probability that it will be sustained upon examination by the tax authorities based on its technical merits. As of June 30, 2017, the Fund has determined that no tax liability is required in its financial statements related to uncertain tax positions for any open tax years (or expected to be taken in future tax years). Open tax years are those that remain subject to examination and are based on each tax jurisdiction’s statute of limitation.
| TD-18 | Semiannual Report |
FRANKLIN TEMPLETON VARIABLE INSURANCE PRODUCTS TRUST
NOTES TO FINANCIAL STATEMENTS (UNAUDITED)
Templeton Developing Markets VIP Fund (continued)
e. Security Transactions, Investment Income, Expenses and Distributions
Security transactions are accounted for on trade date. Realized gains and losses on security transactions are determined on a specific identification basis. Estimated expenses are accrued daily. Dividend income is recorded on the ex-dividend date except for certain dividends from securities where the dividend rate is not available. In such cases, the dividend is recorded as soon as the information is received by the Fund. Distributions to shareholders are recorded on the ex-dividend date. Distributable earnings are determined according to income tax regulations (tax basis) and may differ from earnings recorded in accordance with U.S. GAAP. These differences may be permanent or temporary. Permanent differences are reclassified among capital accounts to reflect their tax character. These reclassifications have no impact on net assets or the results of operations. Temporary differences are not reclassified, as they may reverse in subsequent periods.
Common expenses incurred by the Trust are allocated among the Funds based on the ratio of net assets of each Fund to the combined net assets of the Trust. Fund specific expenses are charged directly to the Fund that incurred the expense.
Realized and unrealized gains and losses and net investment income, not including class specific expenses, are allocated daily to each class of shares based upon the relative proportion
of net assets of each class. Differences in per share distributions, by class, are generally due to differences in class specific expenses.
f. Accounting Estimates
The preparation of financial statements in accordance with U.S. GAAP requires management to make estimates and assumptions that affect the reported amounts of assets and liabilities at the date of the financial statements and the amounts of income and expenses during the reporting period. Actual results could differ from those estimates.
g. Guarantees and Indemnifications
Under the Trust’s organizational documents, its officers and trustees are indemnified by the Trust against certain liabilities arising out of the performance of their duties to the Trust. Additionally, in the normal course of business, the Trust, on behalf of the Fund, enters into contracts with service providers that contain general indemnification clauses. The Trust’s maximum exposure under these arrangements is unknown as this would involve future claims that may be made against the Trust that have not yet occurred. Currently, the Trust expects the risk of loss to be remote.
2. Shares of Beneficial Interest
At June 30, 2017, there were an unlimited number of shares authorized (without par value). Transactions in the Fund’s shares were as follows:
| Six Months Ended June 30, 2017 | Year Ended December 31, 2016 | |||||||||||||||||||
| Shares | Amount | Shares | Amount | |||||||||||||||||
| Class 1 Shares: | ||||||||||||||||||||
Shares sold | 689,630 | $ | 5,752,411 | 1,670,412 | $ | 11,807,302 | ||||||||||||||
Shares issued in reinvestment of distributions | 132,055 | 1,158,124 | 130,351 | 875,960 | ||||||||||||||||
Shares redeemed | (1,090,182 | ) | (9,123,635 | ) | (2,747,707 | ) | (19,104,889 | ) | ||||||||||||
|
| |||||||||||||||||||
Net increase (decrease) | (268,497 | ) | $ | (2,213,100 | ) | (946,944 | ) | $ | (6,421,627 | ) | ||||||||||
|
| |||||||||||||||||||
| Class 2 Shares: | ||||||||||||||||||||
Shares sold | 3,923,463 | $ | 32,364,912 | 6,851,485 | $ | 48,325,937 | ||||||||||||||
Shares issued in reinvestment of distributions | 276,596 | 2,409,152 | 251,080 | 1,674,699 | ||||||||||||||||
Shares redeemed | (4,732,334 | ) | (39,557,803 | ) | (9,617,120 | ) | (67,592,372 | ) | ||||||||||||
|
| |||||||||||||||||||
Net increase (decrease) | (532,275 | ) | $ | (4,783,739 | ) | (2,514,555 | ) | $ | (17,591,736 | ) | ||||||||||
|
| |||||||||||||||||||
| Semiannual Report | TD-19 |
FRANKLIN TEMPLETON VARIABLE INSURANCE PRODUCTS TRUST
NOTES TO FINANCIAL STATEMENTS (UNAUDITED)
Templeton Developing Markets VIP Fund (continued)
2. Shares of Beneficial Interest (continued)
| Six Months Ended June 30, 2017 | Year Ended December 31, 2016 | |||||||||||||||||||
| Shares | Amount | Shares | Amount | |||||||||||||||||
| Class 4 Shares: | ||||||||||||||||||||
Shares sold | 24,562 | $ | 206,936 | 84,033 | $ | 595,503 | ||||||||||||||
Shares issued in reinvestment of distributions | 6,436 | 56,318 | 6,622 | 44,436 | ||||||||||||||||
Shares redeemed | (150,274 | ) | (1,245,745 | ) | (348,788 | ) | (2,434,495 | ) | ||||||||||||
|
| |||||||||||||||||||
Net increase (decrease) | (119,276 | ) | $ | (982,491 | ) | (258,133 | ) | $ | (1,794,556 | ) | ||||||||||
|
| |||||||||||||||||||
3. Transactions with Affiliates
Franklin Resources, Inc. is the holding company for various subsidiaries that together are referred to as Franklin Templeton Investments. Certain officers and trustees of the Fund are also officers and/or trustees of the following subsidiaries:
| Subsidiary | Affiliation | |
Templeton Asset Management Ltd. (TAML) | Investment manager | |
Franklin Templeton Services, LLC (FT Services) | Administrative manager | |
Franklin Templeton Distributors, Inc. (Distributors) | Principal underwriter | |
Franklin Templeton Investor Services, LLC (Investor Services) | Transfer agent |
a. Management Fees
The Fund pays an investment management fee to TAML based on the average daily net assets of the Fund as follows:
| Annualized Fee Rate | Net Assets | |
1.250% | Up to and including $200 million | |
1.235% | Over $200 million, up to and including $700 million | |
1.200% | Over $700 million, up to and including $1 billion | |
1.150% | Over $1 billion, up to and including $1.2 billion | |
1.125% | Over $1.2 billion, up to and including $5 billion | |
1.075% | Over $5 billion, up to and including $10 billion | |
1.025% | Over $10 billion, up to and including $15 billion | |
0.975% | Over $15 billion, up to and including $20 billion | |
0.925% | In excess of $20 billion |
For the period ended June 30, 2017, the annualized effective investment management fee rate was 1.243% of the Fund’s average daily net assets.
b. Administrative Fees
Under an agreement with TAML, FT Services provides administrative services to the Fund. The fee is paid by TAML based on the Fund’s average daily net assets, and is not an additional expense of the Fund.
| TD-20 | Semiannual Report |
FRANKLIN TEMPLETON VARIABLE INSURANCE PRODUCTS TRUST
NOTES TO FINANCIAL STATEMENTS (UNAUDITED)
Templeton Developing Markets VIP Fund (continued)
c. Distribution Fees
The Board has adopted distribution plans for Class 2 and Class 4 shares pursuant to Rule 12b-1 under the 1940 Act. Under the Fund’s compensation distribution plans, the Fund pays Distributors for costs incurred in connection with the servicing, sale and distribution of the Fund’s shares up to 0.25% and 0.35% per year of its average daily net assets of Class 2 and Class 4, respectively. The plan year, for purposes of monitoring compliance with the maximum annual plan rates, is February 1 through January 31.
d. Transfer Agent Fees
Investor Services, under terms of an agreement, performs shareholder servicing for the Fund and is not paid by the Fund for the services.
e. Investments in Affiliated Management Investment Companies
The Fund invests in one or more affiliated management investment companies for purposes other than exercising a controlling influence over the management or policies. Management fees paid by the Fund are waived on assets invested in the affiliated management investment companies, as noted in the Statement of Operations, in an amount not to exceed the management and administrative fees paid directly or indirectly by each affiliate. Prior to January 1, 2014, the waiver was accounted for as a reduction to management fees. During the period ended June 30, 2017, the Fund held investments in affiliated management investment companies as follows:
| Number of Shares Held at Beginning of Period | Gross Additions | Gross Reductions | Number of Shares Held at End of Period | Value at End of Period | Investment Income | Realized Gain (Loss) | % of Affiliated Fund Shares Outstanding Held at End of Period | |||||||||||||||||||||||||
| Non-Controlled Affiliates | ||||||||||||||||||||||||||||||||
Institutional Fiduciary Trust Money Market Portfolio, 0.58% | 4,395,622 | 33,884,277 | (34,885,866 | ) | 3,394,033 | $ | 3,394,033 | $ | 7,086 | $ | — | 0.0%a | ||||||||||||||||||||
|
| |||||||||||||||||||||||||||||||
aRounds to less than 0.1%.
4. Expense Offset Arrangement
The Fund has entered into an arrangement with its custodian whereby credits realized as a result of uninvested cash balances are used to reduce a portion of the Fund’s custodian expenses. During the period ended June 30, 2017, the custodian fees were reduced as noted in the Statement of Operations.
5. Income Taxes
For tax purposes, capital losses may be carried over to offset future capital gains, if any. At December 31, 2016, the capital loss carryforwards were as follows:
Capital loss carryforwards not subject to expiration: | ||
Short term | $19,728,638 | |
Long term | 13,677,912 | |
| ||
Total capital loss carryforwards | $33,406,550 | |
|
| Semiannual Report | TD-21 |
FRANKLIN TEMPLETON VARIABLE INSURANCE PRODUCTS TRUST
NOTES TO FINANCIAL STATEMENTS (UNAUDITED)
Templeton Developing Markets VIP Fund (continued)
5. Income Taxes (continued)
At June 30, 2017, the cost of investments and net unrealized appreciation (depreciation) for income tax purposes were as follows:
Cost of investments | $ | 272,491,891 | ||
|
| |||
Unrealized appreciation | $ | 94,555,997 | ||
Unrealized depreciation | (22,605,093 | ) | ||
|
| |||
Net unrealized appreciation (depreciation) | $ | 71,950,904 | ||
|
|
Differences between income and/or capital gains as determined on a book basis and a tax basis are primarily due to differing treatments of corporate actions and wash sales.
6. Investment Transactions
Purchases and sales of investments (excluding short term securities) for the period ended June 30, 2017, aggregated $27,509,930 and $36,956,196, respectively.
7. Concentration of Risk
Investing in foreign securities may include certain risks and considerations not typically associated with investing in U.S. securities, such as fluctuating currency values and changing local and regional economic, political and social conditions, which may result in greater market volatility. In addition, certain foreign securities may not be as liquid as U.S. securities.
The United States and other nations have imposed and could impose additional sanctions on certain issuers in Russia due to regional conflicts. These sanctions could result in the devaluation of Russia’s currency, a downgrade in Russian issuers’ credit ratings, or a decline in the value and liquidity of Russian stocks or other securities. Such sanctions could also adversely affect Russia’s economy, possibly forcing the economy into a recession. The Fund may be prohibited from investing in securities issued by companies subject to such sanctions. In addition, if the Fund holds the securities of an issuer that is subject to such sanctions, an immediate freeze of that issuer’s securities could result, impairing the ability of the Fund to buy, sell, receive or deliver those securities. There is also the risk that countermeasures could be taken by Russia’s government, which could involve the seizure of the Fund’s assets. These risks could affect the value of the Fund’s portfolio. While the Fund holds securities of certain companies impacted by the sanctions, the restrictions do not impact the existing investments in those issuers. At June 30, 2017, the Fund had 6.4% of its net assets invested in Russia.
8. Credit Facility
The Fund, together with other U.S. registered and foreign investment funds (collectively, Borrowers), managed by Franklin Templeton Investments, are borrowers in a joint syndicated senior unsecured credit facility totaling $2 billion (Global Credit Facility) which matures on February 9, 2018. This Global Credit Facility provides a source of funds to the Borrowers for temporary and emergency purposes, including the ability to meet future unanticipated or unusually large redemption requests.
Under the terms of the Global Credit Facility, the Fund shall, in addition to interest charged on any borrowings made by the Fund and other costs incurred by the Fund, pay its share of fees and expenses incurred in connection with the implementation and maintenance of the Global Credit Facility, based upon its relative share of the aggregate net assets of all of the Borrowers, including an annual commitment fee of 0.15% based upon the unused portion of the Global Credit Facility. These fees are reflected in other expenses in the Statement of Operations. During the period ended June 30, 2017, the Fund did not use the Global Credit Facility.
| TD-22 | Semiannual Report |
FRANKLIN TEMPLETON VARIABLE INSURANCE PRODUCTS TRUST
NOTES TO FINANCIAL STATEMENTS (UNAUDITED)
Templeton Developing Markets VIP Fund (continued)
9. Fair Value Measurements
The Fund follows a fair value hierarchy that distinguishes between market data obtained from independent sources (observable inputs) and the Fund’s own market assumptions (unobservable inputs). These inputs are used in determining the value of the Fund’s financial instruments and are summarized in the following fair value hierarchy:
| • | Level 1 – quoted prices in active markets for identical financial instruments |
| • | Level 2 – other significant observable inputs (including quoted prices for similar financial instruments, interest rates, prepayment speed, credit risk, etc.) |
| • | Level 3 – significant unobservable inputs (including the Fund’s own assumptions in determining the fair value of financial instruments) |
The input levels are not necessarily an indication of the risk or liquidity associated with financial instruments at that level.
For movements between the levels within the fair value hierarchy, the Fund has adopted a policy of recognizing the transfers as of the date of the underlying event which caused the movement.
A summary of inputs used as of June 30, 2017, in valuing the Fund’s assets carried at fair value, is as follows:
| Level 1 | Level 2 | Level 3 | Total | |||||||||||||
| Assets: | ||||||||||||||||
Investments in Securities: | ||||||||||||||||
Equity Investmentsa,b | $ | 336,843,596 | $ | — | $ | — | $ | 336,843,596 | ||||||||
Participatory Notes | — | 4,205,166 | — | 4,205,166 | ||||||||||||
Short Term Investments | 3,394,033 | — | — | 3,394,033 | ||||||||||||
|
| |||||||||||||||
Total Investments in Securities | $ | 340,237,629 | $ | 4,205,166 | $ | — | $ | 344,442,795 | ||||||||
|
| |||||||||||||||
aIncludes common and preferred stocks.
bFor detailed categories, see the accompanying Statement of Investments.
10. Investment Company Reporting Modernization
In October 2016, the U.S. Securities and Exchange Commission adopted new rules and amended existing rules (together, final rules) intended to modernize the reporting and disclosure of information by registered investment companies. In part, the final rules amend Regulation S-X and require standardized, enhanced disclosures about derivatives in investment company financial statements, as well as other amendments. The compliance date for the amendments to Regulation S-X is August 1, 2017. Management has reviewed the requirements and believes the adoption of the amendments to Regulation S-X will not have a material impact on the Fund’s financial statements and related disclosures.
11. Subsequent Events
The Fund has evaluated subsequent events through the issuance of the financial statements and determined that no events have occurred that require disclosure.
Abbreviations
| Selected Portfolio | ||
| ADR | American Depositary Receipt | |
| GDR | Global Depositary Receipt | |
| Semiannual Report | TD-23 |
FRANKLIN TEMPLETON VARIABLE INSURANCE PRODUCTS TRUST
Tax Information (unaudited)
Templeton Developing Markets VIP Fund
At December 31, 2016, more than 50% of the Fund’s total assets were invested in securities of foreign issuers. In most instances, foreign taxes were withheld from income paid to the Fund on these investments. As shown in the table below, the Fund hereby reports to shareholders the foreign source income and foreign taxes paid, pursuant to Section 853 of the Internal Revenue Code. This written statement will allow shareholders of record on June 14, 2017, to treat their proportionate share of foreign taxes paid by the Fund as having been paid directly by them. The shareholder shall consider these amounts as foreign taxes paid in the tax year in which they receive the Fund distribution.
The following table provides a detailed analysis of foreign tax paid, and foreign source income as reported by the Fund, to Class 1, Class2, and Class 4 shareholders of record.
| Class | Foreign Tax Paid Per Share | Foreign Source Income Per Share | ||
Class 1 | $0.0202 | $0.1271 | ||
Class 2 | $0.0202 | $0.1083 | ||
Class 4 | $0.0202 | $0.0952 |
Foreign Tax Paid Per Share (Column 1) is the amount per share available to you, as a tax credit (assuming you held your shares in the Fund for a minimum of 16 days during the 31-day period beginning 15 days before the ex-dividend date of the Fund’s distribution to which the foreign taxes relate), or, as a tax deduction.
Foreign Source Income Per Share (Column 2) is the amount per share of income dividends attributable to foreign securities held by the Fund, plus any foreign taxes withheld on these dividends.
| TD-24 | Semiannual Report |
This semiannual report for Templeton Foreign VIP Fund covers the period ended June 30, 2017.
Class 1 Performance Summary as of June 30, 2017
The Fund’s Class 1 Shares delivered a +10.06% total return* for the six-month period ended June 30, 2017.
*The Fund has a fee waiver associated with any investment it makes in a Franklin Templeton money fund and/or other Franklin Templeton fund, contractually guaranteed through 4/30/18. Fund investment results reflect the fee waiver; without this waiver, the results would have been lower.
Performance reflects the Fund’s Class 1 operating expenses, but does not include any contract fees, expenses or sales charges. If they had been included, performance would be lower. These charges and deductions, particularly for variable life policies, can have a significant effect on contract values and insurance benefits. See the contract prospectus for a complete description of these expenses, including sales charges.
Performance data represent past performance, which does not guarantee future results. Investment return and principal value will fluctuate, and you may have a gain or loss when you sell your shares. Current performance may differ from figures shown.
| Semiannual Report | TF-1 |
TEMPLETON FOREIGN VIP FUND
Fund Goal and Main Investments
The Fund seeks long-term capital growth. Under normal market conditions, the Fund invests at least 80% of its net assets in investments of issuers located outside the U.S., including those in emerging markets.
Fund Risks
All investments involve risks, including possible loss of principal. Special risks are associated with foreign investing, including currency fluctuations, economic instability and political developments; investments in emerging markets involve heightened risks related to the same factors. In addition, smaller company stocks have historically experienced more price volatility than larger company stocks, especially over the short term. To the extent the Fund focuses on particular countries, regions, industries, sectors or types of investment from time to time, it may be subject to greater risks of adverse developments in such areas of focus than a fund that invests in a wider variety of countries, regions, industries, sectors or investments. The Fund is actively managed but there is no guarantee that the manager’s investment decisions will produce the desired results. The Fund’s prospectus also includes a description of the main investment risks.
Performance Overview
You can find the Fund’s six-month total return in the Performance Summary. In comparison, the Fund’s benchmark, the MSCI All Country (ACWI) ex USA Index, generated a +14.45% total return for the same period.1 Please note, index performance information is provided for reference and we do not attempt to track the index but rather undertake investments on the basis of fundamental research.
Economic and Market Overview
The global economy generally expanded during the period under review. In this environment, global developed and emerging market stocks rose, as measured by the MSCI ACWI.2 Global markets were aided by improved industrial commodity prices at certain points during the period, generally upbeat economic data across regions, investor optimism about pro-growth and pro-business policies in the U.S, hopes of tax reforms under the Trump administration, Emmanuel Macron’s
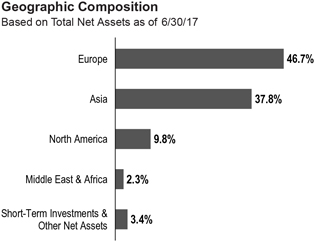
election as France’s president and encouraging corporate earnings reports.
However, investors expressed concerns about the timing and economic effects of the U.K.’s exit from the European Union (also known as “Brexit”) and the U.S. executive order banning entry from some Muslim-majority countries. Other headwinds included the health of European banks, concerns about political uncertainty in the U.S. and European Union, geopolitical tensions in certain regions, worries about global oversupply in oil production despite a pact to extend cuts, and hawkish comments from key central bankers around the world toward period-end.
U.S. economic growth decelerated in 2017’s first quarter, largely due to slower growth in consumer spending and declines in private inventory investment and government spending. However, growth accelerated in the second quarter due to increases in consumer spending, business investment and federal government spending. The unemployment rate decreased from 4.7% in December 2016 to 4.4% at period-end.3 Annual inflation, as measured by the Consumer Price Index, decreased from 2.1% to 1.6% during the period. After increasing its benchmark interest rate in March, the U.S. Federal Reserve (Fed), at its June meeting, made the widely anticipated increase to its target range for the federal funds rate from 0.75%–1.00% to 1.00%–1.25%, amid signs of a growing U.S. economy, a strengthening labor market and an improvement in business spending.
1. Source: Morningstar.
One cannot invest directly in an index, and an index is not representative of the Fund’s portfolio. Please see Index Descriptions following the Fund Summaries.
2. Please see Index Descriptions following the Fund Summaries.
3. Source: Bureau of Labor Statistics.
The dollar value, number of shares or principal amount, and names of all portfolio holdings are listed in the Fund’s Statement of Investments (SOI).
| TF-2 | Semiannual Report |
TEMPLETON FOREIGN VIP FUND
In Europe, the U.K.’s economy grew at a slower rate in 2017’s first quarter over the previous quarter, largely due to slower growth in household spending. The eurozone’s growth increased in the first quarter over the previous quarter. The bloc’s annual inflation rate fluctuated during the reporting period and ended slightly higher from where it began. During the period, the European Central Bank kept its key policy rates unchanged.
In Asia, Japan’s quarterly gross domestic product (GDP) remained unchanged in 2017’s first quarter compared to 2016’s fourth quarter. In April 2017, the Bank of Japan (BOJ) slightly increased its GDP forecasts for the 2017–2018 fiscal year. However, the BOJ lowered its inflation forecast.
In emerging markets, Brazil’s quarterly GDP grew for the first time in two years, as its first-quarter 2017 GDP grew compared to the previous quarter. The country’s central bank cut its benchmark interest rate four times between January and June 2017 to spur economic growth. Russia’s GDP grew in 2017’s first quarter compared to the prior-year period. The Bank of Russia reduced its key interest rate in March, April and June 2017 to try to revive its economy. China’s economy grew faster in the first half of 2017 compared to the first half of 2016, driven by solid growth in industrial production, services, fixed-asset investment, retail sales, and imports and exports. The People’s Bank of China left its benchmark interest rate unchanged during the period. Overall, emerging market stocks, as measured by the MSCI Emerging Markets Index, rose during the period.2
Investment Strategy
Our investment philosophy is bottom up, value oriented and long term. In choosing investments, we generally focus on the market price of a company’s securities relative to our evaluation of the company’s potential long-term earnings, asset value and cash flow. Among factors we consider are a company’s historical value measures, including price/earnings ratio, profit margins and liquidation value. We do in-depth research to construct a bargain list from which we buy.
Manager’s Discussion
During the six months under review, most sectors represented in the Fund’s portfolio generated positive returns and contributed to absolute performance. Relative to the Fund’s benchmark, the MSCI ACWI ex USA Index, key contributors
| Top 10 Holdings | ||||
| 6/30/17 | ||||
Company Sector/Industry, Country | % of Total Net Assets | |||
Samsung Electronics Co. Ltd. Technology Hardware, Storage & Peripherals, | 3.7% | |||
SoftBank Group Corp. Wireless Telecommunication Services, Japan | 2.7% | |||
BP PLC Oil, Gas & Consumable Fuels, U.K. | 2.5% | |||
Wheaton Precious Metals Corp. Metals & Mining, Canada | 2.5% | |||
Standard Chartered PLC Banks, U.K. | 2.3% | |||
Teva Pharmaceutical Industries Ltd. Pharmaceuticals, Israel | 2.3% | |||
Royal Dutch Shell PLC Oil, Gas & Consumable Fuels, U.K. | 2.2% | |||
Roche Holding AG Pharmaceuticals, Switzerland | 2.2% | |||
Baidu Inc. Internet Software & Services, China | 2.1% | |||
SBM Offshore NV Energy Equipment & Services, Netherlands | 2.1% | |||
included stock selection in the financials sector, especially in banks.4 Notably, our positions in South Korean banking firms Hana Financial Group and KB Financial Group helped performance. Shares of both banks benefited from solid earnings reports and the general belief among market participants that interest rates and net interest margins in South Korea are improving. Further supporting share prices were signs that South Korea’s new government would pursue fiscal stimulus measures, reform the rigid corporate chaebol (large, mostly family-owned, business conglomerates) structure and normalize economic ties with China.
Stock selection in the telecommunication services sector also supported relative performance, notably SoftBank Group (Japan).5 Its shares rose to the highest levels in nearly two decades after the firm’s majority-owned U.S. telecommunications subsidiary, Sprint,6 reported better-than-expected sales and subscriber growth. The higher share price also reflected rising optimism that SoftBank might be able to execute a long-desired merger between Sprint and another major U.S. mobile operator, T-Mobile U.S.,6 under a new Republican administration. SoftBank Chairman Masayoshi Son recently
4. The financials sector comprises banks, capital markets and insurance in the SOI.
5. The telecommunication services sector comprises diversified telecommunication services and wireless telecommunication services in the SOI.
6. Not a Fund holding.
| Semiannual Report | TF-3 |
TEMPLETON FOREIGN VIP FUND
met with President Donald Trump and pledged to invest US$50 billion and create 50,000 jobs in the U.S., an indication that SoftBank is working to curry favor with the new administration to facilitate a deal that, if executed, we believe could represent a potential share price catalyst. Elsewhere at SoftBank, the core Japanese telecommunications business is providing strong, stable free cash flow; Chinese technology subsidiary Alibaba Group Holding6 continues to realize outsized growth; and the newly acquired U.K. semiconductor manufacturer ARM Holdings,6 while expensive and value-destructive in the near term, in our view, offers another exciting long-term growth driver.
Key individual contributors included investments in semiconductor and consumer electronics company Samsung Electronics (South Korea); technology hardware, storage and peripherals company Catcher Technology (Taiwan); home electric appliance company Haier Electronics Group (China); biotechnology company MorphoSys7 (Germany); and banking firm Standard Chartered (U.K.). Samsung’s stock benefited from record first-quarter earnings and the company’s cancelation of billions of U.S. dollars’ worth of its Treasury shares, which sparked a raft of earnings upgrades from Wall Street analysts. Although sentiment on the stock is beginning to improve as results highlight operational progress, our analysis indicates to us that the market continues to undervalue the sustainability of Samsung’s dominant, low-cost position in core markets due to excessive focus on problem areas of lesser business impact. With its shares trading at what we considered low valuation multiples and the company holding a large net cash position, Samsung’s improving business mix shift and increasing focus on shareholder returns remain significantly undervalued, in our analysis.
In contrast, stock selection and an overweighting in the energy sector weighed on relative results.8 Within energy, our positions in energy equipment and services companies Petrofac9 (U.K.) and Precision Drilling7 (Canada); and oil and gas companies Cenovus Energy (Canada), BP (U.K.) and Royal Dutch Shell (U.K.) hurt relative returns.
Stock selection in the materials sector also hampered relative results, notably our positions in gold producer Eldorado Gold (Canada) and precious metals company Wheaton Precious Metals (Canada).10
Key individual detractors included drugmaker Teva Pharmaceutical Industries (Israel), insurance firm Aegon (Netherlands) and automobile producer Nissan Motor (Japan). Teva’s share price fell after the company reported declining profits and investors worried about an ongoing leadership transition and the loss of U.S. patent protection on a key multiple sclerosis drug. Many market participants remained concerned about Teva’s ability to bring new products to fruition and grow its global generic franchise.
From a geographic perspective, stock selection in Asia contributed to relative performance, particularly investments in South Korea, Taiwan and Japan, although positions in China and Hong Kong hindered results. In contrast, stock selection in Europe detracted from relative performance, especially positions in the U.K., Italy and the Netherlands, although investments in Germany aided results. Stock selection and an overweighting in North America hindered results, particularly holdings in Canada. Our exposure to Israel also weighed on performance.
It is important to recognize the effect of currency movements on the Fund’s performance. In general, if the value of the U.S. dollar goes up compared with a foreign currency, an investment traded in that foreign currency will go down in value because it will be worth fewer U.S. dollars. This can have a negative effect on Fund performance. Conversely, when the U.S. dollar weakens in relation to a foreign currency, an investment traded in that foreign currency will increase in value, which can contribute to Fund performance. For the six months ended June 30, 2017, the U.S. dollar declined in value relative to many currencies in which the Fund’s investments were traded. As a result, the Fund’s performance was negatively affected by the portfolio’s investment predominantly in securities with non-U.S. currency exposure.
Thank you for your participation in Templeton Foreign VIP Fund. We look forward to serving your future investment needs.
7. Not part of the index.
8. The energy sector comprises energy equipment and services and oil, gas and consumable fuels in the SOI.
9. No longer held by period-end.
10. The materials sector comprises chemicals and metals and mining in the SOI.
| TF-4 | Semiannual Report |
TEMPLETON FOREIGN VIP FUND
The foregoing information reflects our analysis, opinions and portfolio holdings as of June 30, 2017, the end of the reporting period. The way we implement our main investment strategies and the resulting portfolio holdings may change depending on factors such as market and economic conditions. These opinions may not be relied upon as investment advice or an offer for a particular security. The information is not a complete analysis of every aspect of any market, country, industry, security or the Fund. Statements of fact are from sources considered reliable, but the investment manager makes no representation or warranty as to their completeness or accuracy. Although historical performance is no guarantee of future results, these insights may help you understand our investment management philosophy.
| Semiannual Report | TF-5 |
TEMPLETON FOREIGN VIP FUND
Class 1 Fund Expenses
As an investor in a variable insurance contract (Contract) that indirectly provides for investment in an underlying mutual fund, you can incur transaction and/or ongoing expenses at both the Fund level and the Contract Level: (1) transaction expenses can include sales charges (loads) on purchases, surrender fees, transfer fees and premium taxes; and (2) ongoing expenses can include management fees, distribution and service (12b-1) fees, contract fees, annual maintenance fees, mortality and expense risk fees and other fees and expenses. All mutual funds and Contracts have some types of ongoing expenses. The table below shows Fund-level ongoing expenses and can help you understand these costs and compare them with those of other mutual funds offered through the Contract. The table assumes a $1,000 investment held for the six months indicated. Please refer to the Fund prospectus for additional information on operating expenses.
Actual Fund Expenses
The table below provides information about the actual account values and actual expenses in the columns under the heading “Actual.” In these columns the Fund’s actual return, which includes the effect of ongoing Fund expenses but does not include the effect of ongoing Contract expenses, is used to calculate the “Ending Account Value.” You can estimate the Fund-level expenses you paid during the period by following these steps (of course, your account value and expenses will differ from those in this illustration): Divide your account value by $1,000 (if your account had an $8,600 value, then $8,600 ÷ $1,000 = 8.6). Then multiply the result by the number under the headings “Actual” and “Fund-Level Expenses Paid During Period” (if Fund-Level Expenses Paid During Period were $7.50, then 8.6 × $7.50 = $64.50). In this illustration, the estimated expenses paid this period at the Fund level are $64.50.
Hypothetical Example for Comparison with Other Mutual Funds
Under the heading “Hypothetical” in the table, information is provided about hypothetical account values and hypothetical expenses based on the Fund’s actual expense ratio and an assumed rate of return of 5% per year before expenses, which is not the Fund’s actual return. This information may not be used to estimate the actual ending account balance or expenses you paid for the period, but it can help you compare ongoing costs of investing in the Fund with those of other mutual funds offered through the Contract. To do so, compare this 5% hypothetical example with the 5% hypothetical examples that appear in the shareholder reports of other funds offered through the Contract.
Please note that expenses shown in the table are meant to highlight ongoing costs at the Fund level only and do not reflect any ongoing expenses at the Contract level, or transaction expenses at either the Fund or Contract levels. In addition, while the Fund does not have transaction expenses, if the transaction and ongoing expenses at the Contract level were included, the expenses shown below would be higher. You should consult your Contract prospectus or disclosure document for more information.
| Actual (actual return after expenses) | Hypothetical (5% annual return before expenses) | |||||||||||||||||||||||
| Share Class | | Beginning Account Value 1/1/17 | | | Ending Account Value 6/30/17 | | | Fund-Level Expenses Paid During Period 1/1/17–6/30/17 | 1,2 | | Ending Account Value 6/30/17 | | | Fund-Level Expenses Paid During Period 1/1/17–6/30/17 | 1,2 | | Net Annualized Expense Ratio | 2 | ||||||
Class 1 | $1,000 | $1,100.60 | $4.11 | $1,020.88 | $3.96 | 0.79% | ||||||||||||||||||
1. Expenses are equal to the annualized expense ratio for the six-month period as indicated above — in the far right column — multiplied by the simple average account value over the period indicated, and then multiplied by 181/365 to reflect the one-half year period.
2. Reflects expenses after fee waivers and expense reimbursements. Does not include any ongoing expenses of the Contract for which the Fund is an investment option or acquired fund fees and expenses.
| TF-6 | Semiannual Report |
TF P1 P2 P4 07/17
SUPPLEMENT DATED JULY 11, 2017
TO THE PROSPECTUSES DATED MAY 1, 2017
TEMPLETON FOREIGN VIP FUND
(A series of Franklin Templeton Variable Insurance Products Trust)
The prospectus is amended as follows:
I. Cindy L. Sweeting, CFA, President of Investment Counsel and portfolio manager of the Fund, will be retiring effective December 31, 2017. Effective January 1, 2018, it is anticipated that she will no longer be a portfolio manager of the Fund, and Peter A. Nori will continue to be lead portfolio manager of the Fund.
II. Effective January 1, 2018, the portfolio management team under the “FUND SUMMARIES – Templeton Foreign VIP Fund – Portfolio Managers” section on page TF-S5 is replaced with the following:
Portfolio Managers
Peter A. Nori, CFA Executive Vice President/Portfolio Manager – Research Analyst of Investment Counsel and portfolio manager of the Fund since 1999.
Matthew R. Nagle, CFA Portfolio Manager of Investment Counsel and portfolio manager of the Fund since January 2018.
Heather Waddell, CFA Portfolio Manager of Investment Counsel and portfolio manager of the Fund since January 2018.
III. Effective January 1, 2018, the portfolio management team under the “FUND DETAILS – Templeton Foreign VIP Fund – Management” section on page TF-D8 is replaced with the following:
The Fund is managed by a team of dedicated professionals focused on global investment of issuers outside the U.S. The portfolio managers are as follows:
Peter A. Nori, CFA Executive Vice President/Portfolio Manager – Research Analyst of Investment Counsel
Mr. Nori has been the lead portfolio manager of the Fund since 1999. He has primary responsibility for the investment of the Fund. He has final authority over all aspects of the Fund’s investment portfolio, including but not limited to, purchases and sales of individual securities, portfolio risk assessment, and the management of daily cash balances in accordance with anticipated investment management requirements. The degree to which he may perform these functions, and the nature of these functions, may change from time to time. He joined Franklin Templeton Investments in 1987.
Matthew R. Nagle, CFA Portfolio Manager of Investment Counsel
Mr. Nagle has been a portfolio manager of the Fund since January 2018, providing research and advice on the purchases and sales of individual securities, and portfolio risk assessment. He joined Franklin Templeton Investments in 2003.
Heather Waddell, CFA Portfolio Manager of Investment Counsel
Ms. Waddell has been a portfolio manager of the Fund since January 2018, providing research and advice on the purchases and sales of individual securities, and portfolio risk assessment. She joined Franklin Templeton Investments in 1996.
CFA® and Chartered Financial Analyst® are trademarks owned by CFA Institute.
Please keep this supplement with your prospectus for future reference.
| TF-7 |
FRANKLIN TEMPLETON VARIABLE INSURANCE PRODUCTS TRUST
Financial Highlights
Templeton Foreign VIP Fund
| Six Months Ended June 30, 2017 | Year Ended December 31, | |||||||||||||||||||||||
| (unaudited) | 2016 | 2015 | 2014 | 2013 | 2012 | |||||||||||||||||||
| Class 1 | ||||||||||||||||||||||||
Per share operating performance (for a share outstanding throughout the period) | ||||||||||||||||||||||||
Net asset value, beginning of period | $13.89 | $13.46 | $15.34 | $17.56 | $14.63 | $12.78 | ||||||||||||||||||
|
| |||||||||||||||||||||||
| Income from investment operationsa: | ||||||||||||||||||||||||
Net investment incomeb | 0.22 | 0.33 | 0.31 | 0.53 | c | 0.34 | 0.38 | |||||||||||||||||
Net realized and unrealized gains (losses) | 1.17 | 0.62 | (1.16 | ) | (2.39 | ) | 3.00 | 1.91 | ||||||||||||||||
|
| |||||||||||||||||||||||
Total from investment operations | 1.39 | 0.95 | (0.85 | ) | (1.86 | ) | 3.34 | 2.29 | ||||||||||||||||
|
| |||||||||||||||||||||||
| Less distributions from: | ||||||||||||||||||||||||
Net investment income | (0.42 | ) | (0.29 | ) | (0.53 | ) | (0.36 | ) | (0.41 | ) | (0.44 | ) | ||||||||||||
Net realized gains | — | (0.23 | ) | (0.50 | ) | — | — | — | ||||||||||||||||
|
| |||||||||||||||||||||||
Total distributions | (0.42 | ) | (0.52 | ) | (1.03 | ) | (0.36 | ) | (0.41 | ) | (0.44 | ) | ||||||||||||
|
| |||||||||||||||||||||||
Redemption fees | — | — | — | — | d | — | d | — | d | |||||||||||||||
|
| |||||||||||||||||||||||
Net asset value, end of period | $14.86 | $13.89 | $13.46 | $15.34 | $17.56 | $14.63 | ||||||||||||||||||
|
| |||||||||||||||||||||||
Total returne | 10.06% | 7.49% | (6.31)% | (10.89)% | 23.27% | 18.60% | ||||||||||||||||||
| Ratios to average net assetsf | ||||||||||||||||||||||||
Expenses before waiver and payments by affiliates | 0.81% | 0.80% | 0.78% | 0.77% | 0.78% | 0.79% | ||||||||||||||||||
Expenses net of waiver and payments by affiliates | 0.79% | g | 0.78% | 0.78% | h | 0.77% | h | 0.78% | 0.79% | |||||||||||||||
Net investment income | 2.90% | 2.38% | 2.05% | 3.11% | c | 2.16% | 2.84% | |||||||||||||||||
| Supplemental data | ||||||||||||||||||||||||
Net assets, end of period (000’s) | $141,982 | $133,218 | $214,172 | $248,355 | $298,468 | $265,924 | ||||||||||||||||||
Portfolio turnover rate | 17.05% | 20.93% | 15.15% | 25.71% | 23.61% | 12.53% | ||||||||||||||||||
aThe amount shown for a share outstanding throughout the period may not correlate with the Statement of Operations for the period due to the timing of sales and repurchases of the Fund’s shares in relation to income earned and/or fluctuating fair value of the investments of the Fund.
bBased on average daily shares outstanding.
cNet investment income per share includes approximately $0.16 per share related to income received in the form of special dividends in connection with certain Fund holdings. Excluding these amounts, the ratio of net investment income to average net assets would have been 2.13%.
dAmount rounds to less than $0.01 per share.
eTotal return does not include fees, charges or expenses imposed by the variable annuity and life insurance contracts for which Franklin Templeton Variable Insurance Products Trust serves as an underlying investment vehicle. Total return is not annualized for periods less than one year.
fRatios are annualized for periods less than one year.
gBenefit of expense reduction rounds to less than 0.01%.
hBenefit of waiver and payments by affiliates rounds to less than 0.01%.
| TF-8 | Semiannual Report | The accompanying notes are an integral part of these financial statements. |
FRANKLIN TEMPLETON VARIABLE INSURANCE PRODUCTS TRUST
FINANCIAL HIGHLIGHTS
Templeton Foreign VIP Fund (continued)
Six Months Ended June 30, 2017 (unaudited) | Year Ended December 31, | |||||||||||||||||||||||
| 2016 | 2015 | 2014 | 2013 | 2012 | ||||||||||||||||||||
| Class 2 | ||||||||||||||||||||||||
Per share operating performance (for a share outstanding throughout the period) | ||||||||||||||||||||||||
Net asset value, beginning of period | $13.61 | $13.20 | $15.05 | $17.24 | $14.37 | $12.56 | ||||||||||||||||||
|
| |||||||||||||||||||||||
| Income from investment operationsa: | ||||||||||||||||||||||||
Net investment incomeb | 0.20 | 0.28 | 0.27 | 0.48 | c | 0.30 | 0.34 | |||||||||||||||||
Net realized and unrealized gains (losses) | 1.15 | 0.62 | (1.13 | ) | (2.35 | ) | 2.94 | 1.87 | ||||||||||||||||
|
| |||||||||||||||||||||||
| Total from investment operations | 1.35 | 0.90 | (0.86 | ) | (1.87 | ) | 3.24 | 2.21 | ||||||||||||||||
|
| |||||||||||||||||||||||
| Less distributions from: | ||||||||||||||||||||||||
Net investment income | (0.38 | ) | (0.26 | ) | (0.49 | ) | (0.32 | ) | (0.37 | ) | (0.40 | ) | ||||||||||||
Net realized gains | — | (0.23 | ) | (0.50 | ) | — | — | — | ||||||||||||||||
|
| |||||||||||||||||||||||
| Total distributions | (0.38 | ) | (0.49 | ) | (0.99 | ) | (0.32 | ) | (0.37 | ) | (0.40 | ) | ||||||||||||
|
| |||||||||||||||||||||||
| Redemption fees | — | — | — | — | d | — | d | — | d | |||||||||||||||
|
| |||||||||||||||||||||||
| Net asset value, end of period | $14.58 | $13.61 | $13.20 | $15.05 | $17.24 | $14.37 | ||||||||||||||||||
|
| |||||||||||||||||||||||
Total returne | 9.98% | 7.18% | (6.49)% | (11.13)% | 22.97% | 18.23% | ||||||||||||||||||
| Ratios to average net assetsf | ||||||||||||||||||||||||
Expenses before waiver and payments by affiliates | 1.06% | 1.05% | 1.03% | 1.02% | 1.03% | 1.04% | ||||||||||||||||||
Expenses net of waiver and payments by affiliates | 1.04% | g | 1.03% | 1.03% | h | 1.02% | h | 1.03% | 1.04% | |||||||||||||||
Net investment income | 2.65% | 2.13% | 1.80% | 2.86% | c | 1.91% | 2.59% | |||||||||||||||||
| Supplemental data | ||||||||||||||||||||||||
Net assets, end of period (000’s) | $1,386,563 | $1,436,518 | $1,456,854 | $1,645,571 | $1,873,586 | $1,744,231 | ||||||||||||||||||
Portfolio turnover rate | 17.05% | 20.93% | 15.15% | 25.71% | 23.61% | 12.53% | ||||||||||||||||||
aThe amount shown for a share outstanding throughout the period may not correlate with the Statement of Operations for the period due to the timing of sales and repurchases of the Fund’s shares in relation to income earned and/or fluctuating fair value of the investments of the Fund.
bBased on average daily shares outstanding.
cNet investment income per share includes approximately $0.16 per share related to income received in the form of special dividends in connection with certain Fund holdings. Excluding these amounts, the ratio of net investment income to average net assets would have been 1.88%.
dAmount rounds to less than $0.01 per share.
eTotal return does not include fees, charges or expenses imposed by the variable annuity and life insurance contracts for which Franklin Templeton Variable Insurance Products Trust serves as an underlying investment vehicle. Total return is not annualized for periods less than one year.
fRatios are annualized for periods less than one year.
gBenefit of expense reduction rounds to less than 0.01%.
hBenefit of waiver and payments by affiliates rounds to less than 0.01%.
| The accompanying notes are an integral part of these financial statements. | Semiannual Report | TF-9 |
FRANKLIN TEMPLETON VARIABLE INSURANCE PRODUCTS TRUST
FINANCIAL HIGHLIGHTS
Templeton Foreign VIP Fund (continued)
Six Months Ended June 30, 2017 | Year Ended December 31, | |||||||||||||||||||||||
| 2016 | 2015 | 2014 | 2013 | 2012 | ||||||||||||||||||||
| Class 4 | ||||||||||||||||||||||||
Per share operating performance (for a share outstanding throughout the period) | ||||||||||||||||||||||||
Net asset value, beginning of period | $13.71 | $13.29 | $15.16 | $17.37 | $14.48 | $12.66 | ||||||||||||||||||
|
| |||||||||||||||||||||||
| Income from investment operationsa: | ||||||||||||||||||||||||
Net investment incomeb | 0.14 | 0.26 | 0.25 | 0.46 | c | 0.28 | 0.33 | |||||||||||||||||
Net realized and unrealized gains (losses) | 1.22 | 0.63 | (1.14 | ) | (2.36 | ) | 2.97 | 1.89 | ||||||||||||||||
|
| |||||||||||||||||||||||
Total from investment operations | 1.36 | 0.89 | (0.89 | ) | (1.90 | ) | 3.25 | 2.22 | ||||||||||||||||
|
| |||||||||||||||||||||||
| Less distributions from: | ||||||||||||||||||||||||
Net investment income | (0.26 | ) | (0.24 | ) | (0.48 | ) | (0.31 | ) | (0.36 | ) | (0.40 | ) | ||||||||||||
Net realized gains | — | (0.23 | ) | (0.50 | ) | — | — | — | ||||||||||||||||
|
| |||||||||||||||||||||||
Total distributions | (0.26 | ) | (0.47 | ) | (0.98 | ) | (0.31 | ) | (0.36 | ) | (0.40 | ) | ||||||||||||
|
| |||||||||||||||||||||||
Redemption fees | — | — | — | — | d | — | d | — | d | |||||||||||||||
|
| |||||||||||||||||||||||
Net asset value, end of period | $14.81 | $13.71 | $13.29 | $15.16 | $17.37 | $14.48 | ||||||||||||||||||
|
| |||||||||||||||||||||||
Total returne | 9.94% | 7.09% | (6.65 | )% | (11.22)% | 22.86% | 18.14% | |||||||||||||||||
| Ratios to average net assetsf | ||||||||||||||||||||||||
Expenses before waiver and payments by affiliates | 1.16% | 1.15% | 1.13% | 1.12% | 1.13% | 1.14% | ||||||||||||||||||
Expenses net of waiver and payments by affiliates | 1.14% | g | 1.13% | 1.13% | h | 1.12% | h | 1.13% | 1.14% | |||||||||||||||
Net investment income | 2.55% | 2.03% | 1.70% | 2.76% | c | 1.81% | 2.49% | |||||||||||||||||
| Supplemental data | ||||||||||||||||||||||||
Net assets, end of period (000’s) | $152,544 | $484,763 | $472,189 | $503,143 | $513,098 | $416,277 | ||||||||||||||||||
Portfolio turnover rate | 17.05% | 20.93% | 15.15% | 25.71% | 23.61% | 12.53% | ||||||||||||||||||
aThe amount shown for a share outstanding throughout the period may not correlate with the Statement of Operations for the period due to the timing of sales and repurchases of the Fund’s shares in relation to income earned and/or fluctuating fair value of the investments of the Fund.
bBased on average daily shares outstanding.
cNet investment income per share includes approximately $0.16 per share related to income received in the form of special dividends in connection with certain Fund holdings. Excluding these amounts, the ratio of net investment income to average net assets would have been 1.78%.
dAmount rounds to less than $0.01 per share.
eTotal return does not include fees, charges or expenses imposed by the variable annuity and life insurance contracts for which Franklin Templeton Variable Insurance Products Trust serves as an underlying investment vehicle. Total return is not annualized for periods less than one year.
fRatios are annualized for periods less than one year.
gBenefit of expense reduction rounds to less than 0.01%.
hBenefit of waiver and payments by affiliates rounds to less than 0.01%.
| TF-10 | Semiannual Report | The accompanying notes are an integral part of these financial statements. |
FRANKLIN TEMPLETON VARIABLE INSURANCE PRODUCTS TRUST
Statement of Investments, June 30, 2017 (unaudited)
Templeton Foreign VIP Fund
| ||||||||||||||
| Country | Shares | Value | ||||||||||||
| Common Stocks 96.6% | ||||||||||||||
| Aerospace & Defense 2.7% | ||||||||||||||
BAE Systems PLC | United Kingdom | 2,720,370 | $ | 22,447,554 | ||||||||||
Cobham PLC | United Kingdom | 5,307,199 | 8,959,109 | |||||||||||
| a | Rolls-Royce Holdings PLC | United Kingdom | 1,153,600 | 13,388,360 | ||||||||||
|
| |||||||||||||
| 44,795,023 | ||||||||||||||
|
| |||||||||||||
| Auto Components 2.5% | ||||||||||||||
Cie Generale des Etablissements Michelin, B | France | 67,168 | 8,930,516 | |||||||||||
Hyundai Mobis Co. Ltd. | South Korea | 93,646 | 20,447,975 | |||||||||||
Sumitomo Rubber Industries Ltd. | Japan | 712,200 | 12,004,545 | |||||||||||
|
| |||||||||||||
| 41,383,036 | ||||||||||||||
|
| |||||||||||||
| Automobiles 3.2% | ||||||||||||||
Hero Motocorp Ltd. | India | 154,059 | 8,824,300 | |||||||||||
Hyundai Motor Co. | South Korea | 89,304 | 12,440,925 | |||||||||||
Nissan Motor Co. Ltd. | Japan | 3,254,400 | 32,345,817 | |||||||||||
|
| |||||||||||||
| 53,611,042 | ||||||||||||||
|
| |||||||||||||
| Banks 13.4% | ||||||||||||||
Bangkok Bank PCL, fgn | Thailand | 3,144,600 | 18,263,154 | |||||||||||
Barclays PLC | United Kingdom | 5,761,190 | 15,214,844 | |||||||||||
BNP Paribas SA | France | 427,800 | 30,814,556 | |||||||||||
Hana Financial Group Inc. | South Korea | 714,850 | 28,252,349 | |||||||||||
HSBC Holdings PLC | United Kingdom | 3,364,400 | 31,305,262 | |||||||||||
ING Groep NV | Netherlands | 1,074,304 | 18,529,568 | |||||||||||
Kasikornbank PCL, fgn | Thailand | 249,500 | 1,467,431 | |||||||||||
KB Financial Group Inc., ADR | South Korea | 557,806 | 28,163,625 | |||||||||||
| a | Standard Chartered PLC | United Kingdom | 3,816,307 | 38,634,076 | ||||||||||
United Overseas Bank Ltd. | Singapore | 916,700 | 15,393,743 | |||||||||||
|
| |||||||||||||
| 226,038,608 | ||||||||||||||
|
| |||||||||||||
| Beverages 1.9% | ||||||||||||||
Kirin Holdings Co. Ltd. | Japan | 709,500 | 14,437,885 | |||||||||||
Suntory Beverage & Food Ltd. | Japan | 363,800 | 16,882,571 | |||||||||||
|
| |||||||||||||
| 31,320,456 | ||||||||||||||
|
| |||||||||||||
| Capital Markets 1.9% | ||||||||||||||
Credit Suisse Group AG | Switzerland | 501,113 | 7,244,252 | |||||||||||
GAM Holding AG | Switzerland | 505,360 | 6,773,273 | |||||||||||
UBS Group AG | Switzerland | 1,060,280 | 17,959,788 | |||||||||||
|
| |||||||||||||
| 31,977,313 | ||||||||||||||
|
| |||||||||||||
| Chemicals 1.3% | ||||||||||||||
Johnson Matthey PLC | United Kingdom | 325,061 | 12,156,050 | |||||||||||
Yara International ASA | Norway | 266,170 | 10,000,469 | |||||||||||
|
| |||||||||||||
| 22,156,519 | ||||||||||||||
|
| |||||||||||||
| Construction & Engineering 0.9% | ||||||||||||||
Sinopec Engineering Group Co. Ltd. | China | 17,492,000 | 15,771,980 | |||||||||||
|
| |||||||||||||
| Diversified Telecommunication Services 3.3% | ||||||||||||||
China Telecom Corp. Ltd., H | China | 46,766,357 | 22,221,918 | |||||||||||
Singapore Telecommunications Ltd. | Singapore | 3,003,400 | 8,485,783 | |||||||||||
Telefonica Deutschland Holding AG | Germany | 2,094,590 | 10,462,601 | |||||||||||
Telenor ASA | Norway | 879,834 | 14,599,424 | |||||||||||
|
| |||||||||||||
| 55,769,726 | ||||||||||||||
|
| |||||||||||||
| Semiannual Report | TF-11 |
FRANKLIN TEMPLETON VARIABLE INSURANCE PRODUCTS TRUST
STATEMENT OF INVESTMENTS (UNAUDITED)
Templeton Foreign VIP Fund (continued)
| Country | Shares | Value | ||||||||||||
| Common Stocks (continued) | ||||||||||||||
| Electrical Equipment 0.8% | ||||||||||||||
ABB Ltd. | Switzerland | 520,159 | $ | 12,847,317 | ||||||||||
|
| |||||||||||||
| Energy Equipment & Services 3.8% | ||||||||||||||
Ensign Energy Services Inc. | Canada | 1,552,600 | 8,301,137 | |||||||||||
| a | Precision Drilling Corp. | Canada | 3,319,200 | 11,344,409 | ||||||||||
SBM Offshore NV | Netherlands | 2,224,690 | 35,652,364 | |||||||||||
Tenaris SA | Italy | 525,742 | 8,197,218 | |||||||||||
|
| |||||||||||||
| 63,495,128 | ||||||||||||||
|
| |||||||||||||
| Health Care Equipment & Supplies 0.7% | ||||||||||||||
Getinge AB, B | Sweden | 569,660 | 11,154,418 | |||||||||||
|
| |||||||||||||
| Health Care Providers & Services 2.0% | ||||||||||||||
Shanghai Pharmaceuticals Holding Co. Ltd., H | China | 5,083,800 | 15,138,593 | |||||||||||
Sinopharm Group Co. Ltd. | China | 3,996,400 | 18,068,319 | |||||||||||
|
| |||||||||||||
| 33,206,912 | ||||||||||||||
|
| |||||||||||||
| Household Durables 0.7% | ||||||||||||||
Haier Electronics Group Co. Ltd. | China | 4,501,000 | 11,702,513 | |||||||||||
|
| |||||||||||||
| Industrial Conglomerates 2.2% | ||||||||||||||
CK Hutchison Holdings Ltd. | Hong Kong | 2,021,500 | 25,373,123 | |||||||||||
Siemens AG | Germany | 85,456 | 11,747,618 | |||||||||||
|
| |||||||||||||
| 37,120,741 | ||||||||||||||
|
| |||||||||||||
| Insurance 6.1% | ||||||||||||||
Aegon NV | Netherlands | 5,251,690 | 26,820,379 | |||||||||||
Aviva PLC | United Kingdom | 2,528,220 | 17,321,881 | |||||||||||
AXA SA | France | 722,428 | 19,763,381 | |||||||||||
China Life Insurance Co. Ltd., H | China | 4,639,000 | 14,170,555 | |||||||||||
Chubb Ltd | United States | 113,369 | 16,481,585 | |||||||||||
Dongbu Insurance Co. Ltd. | South Korea | 147,418 | 8,755,491 | |||||||||||
|
| |||||||||||||
| 103,313,272 | ||||||||||||||
|
| |||||||||||||
| Internet Software & Services 2.1% | ||||||||||||||
| a | Baidu Inc., ADR | China | 201,130 | 35,974,112 | ||||||||||
|
| |||||||||||||
| Life Sciences Tools & Services 2.1% | ||||||||||||||
| a | MorphoSys AG | Germany | 202,180 | 14,341,380 | ||||||||||
QIAGEN NV | Netherlands | 616,864 | 20,521,851 | |||||||||||
|
| |||||||||||||
| 34,863,231 | ||||||||||||||
|
| |||||||||||||
| Media 0.8% | ||||||||||||||
SES SA, IDR | Luxembourg | 546,940 | 12,822,834 | |||||||||||
|
| |||||||||||||
| Metals & Mining 6.6% | ||||||||||||||
Alamos Gold Inc., A | Canada | 2,101,752 | 15,090,580 | |||||||||||
Barrick Gold Corp. | Canada | 1,314,020 | 20,906,058 | |||||||||||
Eldorado Gold Corp. | Canada | 3,898,300 | 10,346,142 | |||||||||||
Sumitomo Metal Mining Co. Ltd. | Japan | 1,039,000 | 13,859,799 | |||||||||||
Tahoe Resources Inc. | Canada | 956,400 | 8,249,471 | |||||||||||
Wheaton Precious Metals Corp. | Canada | 2,109,400 | 41,922,728 | |||||||||||
|
| |||||||||||||
| 110,374,778 | ||||||||||||||
| Multi-Utilities 0.9% | ||||||||||||||
|
| |||||||||||||
innogy SE | Germany | 406,610 | 16,007,278 | |||||||||||
|
| |||||||||||||
| TF-12 | Semiannual Report |
FRANKLIN TEMPLETON VARIABLE INSURANCE PRODUCTS TRUST
STATEMENT OF INVESTMENTS (UNAUDITED)
Templeton Foreign VIP Fund (continued)
| Country | Shares | Value | ||||||||||||
| Common Stocks (continued) | ||||||||||||||
| Oil, Gas & Consumable Fuels 10.6% | ||||||||||||||
BP PLC | United Kingdom | 7,393,705 | $ | 42,644,611 | ||||||||||
Cenovus Energy Inc. | Canada | 1,082,702 | 7,985,674 | |||||||||||
Eni SpA | Italy | 1,507,144 | 22,655,403 | |||||||||||
| a | Husky Energy Inc. | Canada | 733,000 | 8,324,469 | ||||||||||
INPEX Corp. | Japan | 1,331,900 | 12,799,786 | |||||||||||
Kunlun Energy Co. Ltd. | China | 7,166,000 | 6,075,876 | |||||||||||
PTT Exploration and Production PCL, fgn | Thailand | 3,183,300 | 8,094,329 | |||||||||||
Royal Dutch Shell PLC, A | United Kingdom | 16,803 | 445,395 | |||||||||||
Royal Dutch Shell PLC, B | United Kingdom | 1,390,353 | 37,351,966 | |||||||||||
Suncor Energy Inc. | Canada | 529,200 | 15,469,960 | |||||||||||
Total SA | France | 332,436 | 16,436,397 | |||||||||||
|
| |||||||||||||
| 178,283,866 | ||||||||||||||
|
| |||||||||||||
| Pharmaceuticals 11.5% | ||||||||||||||
Astellas Pharma Inc. | Japan | 1,689,500 | 20,644,688 | |||||||||||
Bayer AG | Germany | 198,000 | 25,601,934 | |||||||||||
GlaxoSmithKline PLC | United Kingdom | 398,895 | 8,497,743 | |||||||||||
Merck KGaA | Germany | 151,830 | 18,339,992 | |||||||||||
Novartis AG | Switzerland | 128,920 | 10,730,447 | |||||||||||
Roche Holding AG | Switzerland | 143,560 | 36,565,687 | |||||||||||
Sanofi | France | 352,215 | 33,698,120 | |||||||||||
Teva Pharmaceutical Industries Ltd., ADR | Israel | 1,161,238 | 38,576,326 | |||||||||||
|
| |||||||||||||
| 192,654,937 | ||||||||||||||
|
| |||||||||||||
| Professional Services 0.6% | ||||||||||||||
Capita PLC | United Kingdom | 1,051,471 | 9,470,740 | |||||||||||
|
| |||||||||||||
| Semiconductors & Semiconductor Equipment 1.8% | ||||||||||||||
Infineon Technologies AG | Germany | 590,665 | 12,471,591 | |||||||||||
Taiwan Semiconductor Manufacturing Co. Ltd. | Taiwan | 2,587,000 | 17,746,578 | |||||||||||
|
| |||||||||||||
| 30,218,169 | ||||||||||||||
|
| |||||||||||||
| Specialty Retail 0.7% | ||||||||||||||
Kingfisher PLC | United Kingdom | 3,066,896 | 12,012,320 | |||||||||||
|
| |||||||||||||
| Technology Hardware, Storage & Peripherals 5.8% | ||||||||||||||
Catcher Technology Co. Ltd. | Taiwan | 1,963,000 | 23,476,689 | |||||||||||
Quanta Computer Inc. | Taiwan | 5,640,000 | 13,360,532 | |||||||||||
Samsung Electronics Co. Ltd. | South Korea | 29,598 | 61,448,688 | |||||||||||
|
| |||||||||||||
| 98,285,909 | ||||||||||||||
|
| |||||||||||||
| Trading Companies & Distributors 1.4% | ||||||||||||||
Posco Daewoo Corp. | South Korea | 671,448 | 13,077,909 | |||||||||||
SIG PLC | United Kingdom | 5,760,800 | 11,150,544 | |||||||||||
|
| |||||||||||||
| 24,228,453 | ||||||||||||||
|
| |||||||||||||
| Wireless Telecommunication Services 4.3% | ||||||||||||||
China Mobile Ltd. | China | 1,394,500 | 14,797,391 | |||||||||||
SoftBank Group Corp. | Japan | 565,100 | 45,701,335 | |||||||||||
Vodafone Group PLC, ADR | United Kingdom | 434,503 | 12,483,271 | |||||||||||
|
| |||||||||||||
| 72,981,997 | ||||||||||||||
|
| |||||||||||||
Total Common Stocks (Cost $1,343,744,798) | 1,623,842,628 | |||||||||||||
|
| |||||||||||||
| Semiannual Report | TF-13 |
FRANKLIN TEMPLETON VARIABLE INSURANCE PRODUCTS TRUST
STATEMENT OF INVESTMENTS (UNAUDITED)
Templeton Foreign VIP Fund (continued)
| Country | Shares | Value | ||||||||||||
Short Term Investments (Cost $50,345,936) 3.0% | ||||||||||||||
Money Market Funds 3.0% | ||||||||||||||
| b,c | Institutional Fiduciary Trust Money Market Portfolio, 0.58% | United States | 50,345,936 | $ | 50,345,936 | |||||||||
|
| |||||||||||||
Total Investments (Cost $1,394,090,734) 99.6% | 1,674,188,564 | |||||||||||||
Other Assets, less Liabilities 0.4% | 6,901,354 | |||||||||||||
|
| |||||||||||||
Net Assets 100.0% | $ | 1,681,089,918 | ||||||||||||
|
| |||||||||||||
See Abbreviations on page TF-25.
aNon-income producing.
bSee Note 3(e) regarding investments in affiliated management investment companies.
cThe rate shown is the annualized seven-day yield at period end.
| TF-14 | Semiannual Report | The accompanying notes are an integral part of these financial statements. |
FRANKLIN TEMPLETON VARIABLE INSURANCE PRODUCTS TRUST
Financial Statements
Statement of Assets and Liabilities
June 30, 2017 (unaudited)
Templeton VIP Fund | ||||
Assets: | ||||
Investments in securities: | ||||
Cost - Unaffiliated issuers | $ | 1,343,744,798 | ||
Cost - Non-controlled affiliates (Note 3e) | 50,345,936 | |||
|
| |||
Total cost of investments | $ | 1,394,090,734 | ||
|
| |||
Value - Unaffiliated issuers | $ | 1,623,842,628 | ||
Value - Non-controlled affiliates (Note 3e) | 50,345,936 | |||
|
| |||
Total value of investments | 1,674,188,564 | |||
Receivables: | ||||
Investment securities sold | 57,828 | |||
Capital shares sold | 230,938 | |||
Dividends | 7,115,853 | |||
European Union tax reclaims | 2,837,275 | |||
Other assets | 1,363 | |||
|
| |||
Total assets | 1,684,431,821 | |||
|
| |||
Liabilities: | ||||
Payables: | ||||
Investment securities purchased | 410,188 | |||
Capital shares redeemed | 791,924 | |||
Management fees | 1,062,381 | |||
Distribution fees | 681,000 | |||
Reports to shareholders | 201,608 | |||
Accrued expenses and other liabilities | 194,802 | |||
|
| |||
Total liabilities | 3,341,903 | |||
|
| |||
Net assets, at value | $ | 1,681,089,918 | ||
|
| |||
Net assets consist of: | ||||
Paid-in capital | $ | 1,465,342,022 | ||
Undistributed net investment income | 26,908,679 | |||
Net unrealized appreciation (depreciation) | 280,288,014 | |||
Accumulated net realized gain (loss) | (91,448,797 | ) | ||
|
| |||
Net assets, at value | $ | 1,681,089,918 | ||
|
| |||
| Class 1: | ||||
Net assets, at value | $ | 141,982,175 | ||
|
| |||
Shares outstanding | 9,553,313 | |||
|
| |||
Net asset value and maximum offering price per share | $ | 14.86 | ||
|
| |||
| Class 2: | ||||
Net assets, at value | $ | 1,386,563,414 | ||
|
| |||
Shares outstanding | 95,124,478 | |||
|
| |||
Net asset value and maximum offering price per share | $ | 14.58 | ||
|
| |||
| Class 4: | ||||
Net assets, at value | $ | 152,544,329 | ||
|
| |||
Shares outstanding | 10,300,834 | |||
|
| |||
Net asset value and maximum offering price per share | $ | 14.81 | ||
|
| |||
| The accompanying notes are an integral part of these financial statements. | Semiannual Report | TF-15 |
FRANKLIN TEMPLETON VARIABLE INSURANCE PRODUCTS TRUST
FINANCIAL STATEMENTS
Statement of Operations
for the six months ended June 30, 2017 (unaudited)
| Templeton Foreign VIP Fund | ||||
Investment income: | ||||
Dividends: (net of foreign taxes of $3,605,273) | ||||
Unaffiliated issuers | $ | 33,638,393 | ||
Non-controlled affiliates (Note 3e) | 94,031 | |||
Income from securities loaned (net of fees and rebates) | 227,392 | |||
|
| |||
Total investment income | 33,959,816 | |||
|
| |||
Expenses: | ||||
Management fees (Note 3a) | 7,050,361 | |||
Distribution fees: (Note 3c) | ||||
Class 2 | 1,759,800 | |||
Class 4 | 500,632 | |||
Custodian fees (Note 4) | 121,301 | |||
Reports to shareholders | 179,117 | |||
Professional fees | 64,203 | |||
Trustees’ fees and expenses | 4,855 | |||
Other | 37,548 | |||
|
| |||
Total expenses | 9,717,817 | |||
Expense reductions (Note 4) | (268 | ) | ||
Expenses waived/paid by affiliates (Note 3e) | (162,263 | ) | ||
|
| |||
Net expenses | 9,555,286 | |||
|
| |||
Net investment income | 24,404,530 | |||
|
| |||
Realized and unrealized gains (losses): | ||||
Net realized gain (loss) from: | ||||
Investments | (18,956,367 | ) | ||
Foreign currency transactions | 1,402,239 | |||
|
| |||
Net realized gain (loss) | (17,554,128 | ) | ||
|
| |||
Net change in unrealized appreciation (depreciation) on: | ||||
Investments | 176,064,873 | |||
Translation of other assets and liabilities denominated in foreign currencies | 417,992 | |||
|
| |||
Net change in unrealized appreciation (depreciation) | 176,482,865 | |||
|
| |||
Net realized and unrealized gain (loss) | 158,928,737 | |||
|
| |||
Net increase (decrease) in net assets resulting from operations | $ | 183,333,267 | ||
|
| |||
| TF-16 | Semiannual Report | The accompanying notes are an integral part of these financial statements. |
FRANKLIN TEMPLETON VARIABLE INSURANCE PRODUCTS TRUST
FINANCIAL STATEMENTS
Statements of Changes in Net Assets
| Templeton Foreign VIP Fund | ||||||||
| Six Months Ended June 30, 2017 (unaudited) | Year Ended December 31, 2016 | |||||||
Increase (decrease) in net assets: | ||||||||
Operations: | ||||||||
Net investment income | $ | 24,404,530 | $ | 44,630,962 | ||||
Net realized gain (loss) | (17,554,128 | ) | (69,896,957 | ) | ||||
Net change in unrealized appreciation (depreciation) | 176,482,865 | 170,488,749 | ||||||
|
| |||||||
Net increase (decrease) in net assets resulting from operations | 183,333,267 | 145,222,754 | ||||||
|
| |||||||
Distributions to shareholders from: | ||||||||
Net investment income: | ||||||||
Class 1 | (3,928,195 | ) | (4,469,747 | ) | ||||
Class 2 | (35,708,156 | ) | (28,417,976 | ) | ||||
Class 4 | (2,623,801 | ) | (8,605,853 | ) | ||||
Net realized gains: | ||||||||
Class 1 | — | (3,504,221 | ) | |||||
Class 2 | — | (25,453,391 | ) | |||||
Class 4 | — | (8,118,929 | ) | |||||
|
| |||||||
Total distributions to shareholders | (42,260,152 | ) | (78,570,117 | ) | ||||
|
| |||||||
Capital share transactions: (Note 2) | ||||||||
Class 1 | (597,022 | ) | (85,110,427 | ) | ||||
Class 2 | (150,407,798 | ) | (66,083,288 | ) | ||||
Class 4 | (363,477,608 | ) | (4,174,320 | ) | ||||
|
| |||||||
Total capital share transactions | (514,482,428 | ) | (155,368,035 | ) | ||||
|
| |||||||
Net increase (decrease) in net assets | (373,409,313 | ) | (88,715,398 | ) | ||||
Net assets: | ||||||||
Beginning of period | 2,054,499,231 | 2,143,214,629 | ||||||
|
| |||||||
End of period | $ | 1,681,089,918 | $ | 2,054,499,231 | ||||
|
| |||||||
Undistributed net investment income included in net assets: | ||||||||
End of period | $ | 26,908,679 | $ | 44,764,301 | ||||
|
| |||||||
| The accompanying notes are an integral part of these financial statements. | Semiannual Report | TF-17 |
FRANKLIN TEMPLETON VARIABLE INSURANCE PRODUCTS TRUST
Notes to Financial Statements (unaudited)
Templeton Foreign VIP Fund
1. Organization and Significant Accounting Policies
Franklin Templeton Variable Insurance Products Trust (Trust) is registered under the Investment Company Act of 1940 (1940 Act) as an open-end management investment company, consisting of eighteen separate funds and applies the specialized accounting and reporting guidance in U.S. Generally Accepted Accounting Principles (U.S. GAAP). Templeton Foreign VIP Fund (Fund) is included in this report. Shares of the Fund are generally sold only to insurance company separate accounts to fund the benefits of variable life insurance policies or variable annuity contracts. The Fund offers three classes of shares: Class 1, Class 2 and Class 4. Each class of shares may differ by its distribution fees, voting rights on matters affecting a single class and its exchange privilege.
The following summarizes the Fund’s significant
accounting policies.
a. Financial Instrument Valuation
The Fund’s investments in financial instruments are carried at fair value daily. Fair value is the price that would be received to sell an asset or paid to transfer a liability in an orderly transaction between market participants on the measurement date. The Fund calculates the net asset value (NAV) per share as of 4 p.m. Eastern time each day the New York Stock Exchange (NYSE) is open for trading. Under compliance policies and procedures approved by the Trust’s Board of Trustees (the Board), the Fund’s administrator has responsibility for oversight of valuation, including leading the cross-functional Valuation Committee (VC). The VC provides administration and oversight of the Fund’s valuation policies and procedures, which are approved annually by the Board. Among other things, these procedures allow the Fund to utilize independent pricing services, quotations from securities and financial instrument dealers, and other market sources to determine fair value.
Equity securities listed on an exchange or on the NASDAQ National Market System are valued at the last quoted sale price or the official closing price of the day, respectively. Foreign equity securities are valued as of the close of trading on the foreign stock exchange on which the security is primarily traded, or as of 4 p.m. Eastern time. The value is then converted into its U.S. dollar equivalent at the foreign exchange rate in effect at 4 p.m. Eastern time on the day that the value of the security is determined. Over-the-counter (OTC) securities are
valued within the range of the most recent quoted bid and ask prices. Securities that trade in multiple markets or on multiple exchanges are valued according to the broadest and most representative market. Certain equity securities are valued based upon fundamental characteristics or relationships to similar securities.
Investments in open-end mutual funds are valued at the closing NAV.
The Fund has procedures to determine the fair value of financial instruments for which market prices are not reliable or readily available. Under these procedures, the VC convenes on a regular basis to review such financial instruments and considers a number of factors, including significant unobservable valuation inputs, when arriving at fair value. The VC primarily employs a market-based approach which may use related or comparable assets or liabilities, recent transactions, market multiples, book values, and other relevant information for the investment to determine the fair value of the investment. An income-based valuation approach may also be used in which the anticipated future cash flows of the investment are discounted to calculate fair value. Discounts may also be applied due to the nature or duration of any restrictions on the disposition of the investments. Due to the inherent uncertainty of valuations of such investments, the fair values may differ significantly from the values that would have been used had an active market existed. The VC employs various methods for calibrating these valuation approaches including a regular review of key inputs and assumptions, transactional back-testing or disposition analysis, and reviews of any related market activity.
Trading in securities on foreign securities stock exchanges and OTC markets may be completed before 4 p.m. Eastern time. In addition, trading in certain foreign markets may not take place on every Fund’s business day. Occasionally, events occur between the time at which trading in a foreign security is completed and 4 p.m. Eastern time that might call into question the reliability of the value of a portfolio security held by the Fund. As a result, differences may arise between the value of the Fund’s portfolio securities as determined at the foreign market close and the latest indications of value at 4 p.m. Eastern time. In order to minimize the potential for these differences, the VC monitors price movements following the close of trading in foreign stock markets through a series of country specific market proxies (such as baskets of American Depositary Receipts, futures contracts and exchange traded funds). These price movements are measured against
| TF-18 | Semiannual Report |
FRANKLIN TEMPLETON VARIABLE INSURANCE PRODUCTS TRUST
NOTES TO FINANCIAL STATEMENTS (UNAUDITED)
Templeton Foreign VIP Fund (continued)
established trigger thresholds for each specific market proxy to assist in determining if an event has occurred that may call into question the reliability of the values of the foreign securities held by the Fund. If such an event occurs, the securities may be valued using fair value procedures, which may include the use of independent pricing services.
When the last day of the reporting period is a non-business day, certain foreign markets may be open on those days that the Fund’s NAV is not calculated, which could result in differences between the value of the Fund’s portfolio securities on the last business day and the last calendar day of the reporting period. Any significant security valuation changes due to an open foreign market are adjusted and reflected by the Fund for financial reporting purposes.
b. Foreign Currency Translation
Portfolio securities and other assets and liabilities denominated in foreign currencies are translated into U.S. dollars based on the exchange rate of such currencies against U.S. dollars on the date of valuation. The Fund may enter into foreign currency exchange contracts to facilitate transactions denominated in a foreign currency. Purchases and sales of securities, income and expense items denominated in foreign currencies are translated into U.S. dollars at the exchange rate in effect on the transaction date. Portfolio securities and assets and liabilities denominated in foreign currencies contain risks that those currencies will decline in value relative to the U.S. dollar. Occasionally, events may impact the availability or reliability of foreign exchange rates used to convert the U.S. dollar equivalent value. If such an event occurs, the foreign exchange rate will be valued at fair value using procedures established and approved by the Board.
The Fund does not separately report the effect of changes in foreign exchange rates from changes in market prices on securities held. Such changes are included in net realized and unrealized gain or loss from investments in the Statement of Operations.
Realized foreign exchange gains or losses arise from sales of foreign currencies, currency gains or losses realized between the trade and settlement dates on securities transactions and the difference between the recorded amounts of dividends, interest, and foreign withholding taxes and the U.S. dollar equivalent of the amounts actually received or paid. Net unrealized foreign exchange gains and losses arise from changes in foreign
exchange rates on foreign denominated assets and liabilities other than investments in securities held at the end of the reporting period.
c. Securities Lending
The Fund participates in an agency based securities lending program to earn additional income. The Fund receives cash collateral against the loaned securities in an amount equal to at least 102% of the fair value of the loaned securities. Collateral is maintained over the life of the loan in an amount not less than 100% of the fair value of loaned securities, as determined at the close of Fund business each day; any additional collateral required due to changes in security values is delivered to the Fund on the next business day. The collateral is deposited into a joint cash account with other funds and is used to invest in a money market fund managed by Franklin Advisers, Inc., an affiliate of the Fund. The Fund may receive income from the investment of cash collateral, in addition to lending fees and rebates paid by the borrower. Income from securities loaned, net of fees paid to the securities lending agent and/or third-party vendor, is reported separately in the Statement of Operations. The Fund bears the market risk with respect to the collateral investment, securities loaned, and the risk that the agent may default on its obligations to the Fund. If the borrower defaults on its obligation to return the securities loaned, the Fund has the right to repurchase the securities in the open market using the collateral received. The securities lending agent has agreed to indemnify the Fund in the event of default by a third party borrower. At June 30, 2017, the Fund had no securities on loan.
d. Income and Deferred Taxes
It is the Fund’s policy to qualify as a regulated investment company under the Internal Revenue Code. The Fund intends to distribute to shareholders substantially all of its taxable income and net realized gains to relieve it from federal income and if applicable, excise taxes. As a result, no provision for U.S. federal income taxes is required.
The Fund may be subject to foreign taxation related to income received, capital gains on the sale of securities and certain foreign currency transactions in the foreign jurisdictions in which it invests. Foreign taxes, if any, are recorded based on the tax regulations and rates that exist in the foreign markets in which the Fund invests. When a capital gain tax is determined to apply, the Fund records an estimated deferred tax liability in an amount that would be payable if the securities were disposed of on the valuation date. As a result of several court cases, in
| Semiannual Report | TF-19 |
FRANKLIN TEMPLETON VARIABLE INSURANCE PRODUCTS TRUST
NOTES TO FINANCIAL STATEMENTS (UNAUDITED)
Templeton Foreign VIP Fund (continued)
1. Organization and Significant Accounting Policies (continued)
d. Income and Deferred Taxes (continued)
certain countries across the European Union, the Fund filed additional tax reclaims for previously withheld taxes on dividends earned in those countries (EU reclaims). These additional filings are subject to various administrative proceedings by the local jurisdictions’ tax authorities within the European Union, as well as a number of related judicial proceedings. Income recognized, if any, for EU reclaims is reflected as other income in the Statement of Operations and any related receivable, if any, is reflected as European Union tax reclaims in the Statement of Assets and Liabilities. When uncertainty exists as to the ultimate resolution of these proceedings, the likelihood of receipt of these EU reclaims, and the potential timing of payment, no amounts are reflected in the financial statements. For U.S. income tax purposes, when EU reclaims are received by the Fund and the Fund previously passed foreign tax credit on to its shareholders, the Fund must either amend historic tax reporting to shareholders or enter into a closing agreement with the Internal Revenue Service (IRS) in order to pay the associated tax liability on behalf of the Fund’s shareholders.
The Fund may recognize an income tax liability related to its uncertain tax positions under U.S. GAAP when the uncertain tax position has a less than 50% probability that it will be sustained upon examination by the tax authorities based on its technical merits. As of June 30, 2017, the Fund has determined that no tax liability is required in its financial statements related to uncertain tax positions for any open tax years (or expected to be taken in future tax years). Open tax years are those that remain subject to examination and are based on each tax jurisdiction’s statute of limitation.
e. Security Transactions, Investment Income, Expenses and Distributions
Security transactions are accounted for on trade date. Realized gains and losses on security transactions are determined on a specific identification basis. Estimated expenses are accrued daily. Dividend income is recorded on the ex-dividend date except for certain dividends from securities where the dividend rate is not available. In such cases, the dividend is recorded as soon as the information is received by the Fund. Distributions to shareholders are recorded on the ex-dividend date. Distributable earnings are determined according to income tax regulations
(tax basis) and may differ from earnings recorded in accordance with U.S. GAAP. These differences may be permanent or temporary. Permanent differences are reclassified among capital accounts to reflect their tax character. These reclassifications have no impact on net assets or the results of operations. Temporary differences are not reclassified, as they may reverse in subsequent periods.
Common expenses incurred by the Trust are allocated among the Funds based on the ratio of net assets of each Fund to the combined net assets of the Trust. Fund specific expenses are charged directly to the Fund that incurred the expense.
Realized and unrealized gains and losses and net investment income, not including class specific expenses, are allocated daily to each class of shares based upon the relative proportion of net assets of each class. Differences in per share distributions, by class, are generally due to differences in class specific expenses.
f. Accounting Estimates
The preparation of financial statements in accordance with U.S. GAAP requires management to make estimates and assumptions that affect the reported amounts of assets and liabilities at the date of the financial statements and the amounts of income and expenses during the reporting period. Actual results could differ from those estimates.
g. Redemption Fees
Redemptions and exchanges of interests in an insurance company subaccount that invested in Class 3 shares of the Fund were subject to a 1.0% short term trading fee if the interest in the subaccount had been held for less than 60 days. Such fees were retained by the Fund and accounted for as an addition to paid-in capital, allocated to each class of shares based upon the relative proportion of net assets of each class. There were no redemption fees for the period.
h. Guarantees and Indemnifications
Under the Trust’s organizational documents, its officers and trustees are indemnified by the Trust against certain liabilities arising out of the performance of their duties to the Trust. Additionally, in the normal course of business, the Trust, on behalf of the Fund, enters into contracts with service providers that contain general indemnification clauses. The Trust’s maximum exposure under these arrangements is unknown as
| TF-20 | Semiannual Report |
FRANKLIN TEMPLETON VARIABLE INSURANCE PRODUCTS TRUST
NOTES TO FINANCIAL STATEMENTS (UNAUDITED)
Templeton Foreign VIP Fund (continued)
this would involve future claims that may be made against the Trust that have not yet occurred. Currently, the Trust expects the risk of loss to be remote.
2. Shares of Beneficial Interest
At June 30, 2017, there were an unlimited number of shares authorized (without par value). Transactions in the Fund’s shares were as follows:
| Six Months Ended June 30, 2017 | Year Ended December 31, 2016 | |||||||||||||||||||
| Shares | Amount | Shares | Amount | |||||||||||||||||
| Class 1 Shares: | ||||||||||||||||||||
Shares sold | 286,184 | $ | 4,197,990 | 398,476 | $ | 5,247,673 | ||||||||||||||
Shares issued in reinvestment of distributions | 267,406 | 3,928,195 | 633,861 | 7,973,968 | ||||||||||||||||
Shares redeemed | (593,951 | ) | (8,723,207 | ) | (7,350,785 | ) | (98,332,068 | ) | ||||||||||||
|
| |||||||||||||||||||
Net increase (decrease) | (40,361 | ) | $ | (597,022 | ) | (6,318,448 | ) | $ | (85,110,427 | ) | ||||||||||
|
| |||||||||||||||||||
| Class 2 Shares: | ||||||||||||||||||||
Shares sold | 2,311,425 | $ | 33,338,337 | 12,602,852 | $ | 163,261,270 | ||||||||||||||
Shares issued in reinvestment of distributions | 2,478,012 | 35,708,156 | 4,365,589 | 53,871,367 | ||||||||||||||||
Shares redeemed | (15,226,977 | ) | (219,454,291 | ) | (21,800,082 | ) | (283,215,925 | ) | ||||||||||||
|
| |||||||||||||||||||
Net increase (decrease) | (10,437,540 | ) | $ | (150,407,798 | ) | (4,831,641 | ) | $ | (66,083,288 | ) | ||||||||||
|
| |||||||||||||||||||
| Class 4 Shares: | ||||||||||||||||||||
Shares sold | 962,151 | $ | 13,955,052 | 4,242,533 | $ | 54,403,633 | ||||||||||||||
Shares issued in reinvestment of distributions | 179,221 | 2,623,801 | 1,344,436 | 16,724,782 | ||||||||||||||||
Shares redeemed | (26,199,367 | ) | (380,056,461 | ) | (5,754,548 | ) | (75,302,735 | ) | ||||||||||||
|
| |||||||||||||||||||
Net increase (decrease) | (25,057,995 | ) | $ | (363,477,608 | ) | (167,579 | ) | $ | (4,174,320 | ) | ||||||||||
|
| |||||||||||||||||||
3. Transactions with Affiliates
Franklin Resources, Inc. is the holding company for various subsidiaries that together are referred to as Franklin Templeton Investments. Certain officers and trustees of the Fund are also officers and/or directors of the following subsidiaries:
| Subsidiary | Affiliation | |||
Templeton Investment Counsel, LLC (TIC) | Investment manager | |||
Franklin Templeton Services, LLC (FT Services) | Administrative manager | |||
Franklin Templeton Distributors, Inc. (Distributors) | Principal underwriter | |||
Franklin Templeton Investor Services, LLC (Investor Services) | Transfer agent |
| Semiannual Report | TF-21 |
FRANKLIN TEMPLETON VARIABLE INSURANCE PRODUCTS TRUST
NOTES TO FINANCIAL STATEMENTS (UNAUDITED)
Templeton Foreign VIP Fund (continued)
3. Transactions with Affiliates (continued)
a. Management Fees
The Fund pays an investment management fee to TIC based on the average daily net assets of the Fund as follows:
| Annualized Fee Rate | Net Assets | |
0.900% | Up to and including $200 million | |
0.810% | Over $200 million, up to and including $700 million | |
0.775% | Over $700 million, up to and including $1.2 billion | |
0.750% | Over $1.2 billion, up to and including $1.3 billion | |
0.675% | Over $1.3 billion, up to and including $10 billion | |
0.655% | Over $10 billion, up to and including $15 billion | |
0.635% | Over $15 billion, up to and including $20 billion | |
0.615% | In excess of $20 billion |
For the period ended June 30, 2017, the annualized effective investment management fee rate was 0.768% of the Fund’s average daily net assets.
b. Administrative Fees
Under an agreement with TIC, FT Services provides administrative services to the Fund. The fee is paid by TIC based on the Fund’s average daily net assets, and is not an additional expense of the Fund.
c. Distribution Fees
The Board has adopted distribution plans for Class 2 and Class 4 shares pursuant to Rule 12b-1 under the 1940 Act. Under the Fund’s compensation distribution plans, the Fund pays Distributors for costs incurred in connection with the servicing, sale and distribution of the Fund’s shares up to 0.25% and 0.35% per year of its average daily net assets of Class 2 and Class 4, respectively. The plan year, for purposes of monitoring compliance with the maximum annual plan rates, is February 1 through January 31.
d. Transfer Agent Fees
Investor Services, under terms of an agreement, performs shareholder servicing for the Fund and is not paid by the Fund for the services.
| TF-22 | Semiannual Report |
FRANKLIN TEMPLETON VARIABLE INSURANCE PRODUCTS TRUST
NOTES TO FINANCIAL STATEMENTS (UNAUDITED)
Templeton Foreign VIP Fund (continued)
e. Investments in Affiliated Management Investment Companies
The Fund invests in one or more affiliated management investment companies for purposes other than exercising a controlling influence over the management or policies. Management fees paid by the Fund are waived on assets invested in the affiliated management investment companies, as noted in the Statement of Operations, in an amount not to exceed the management and administrative fees paid directly or indirectly by each affiliate. Prior to January 1, 2014, the waiver was accounted for as a reduction to management fees. During the period ended June 30, 2017, the Fund held investments in affiliated management investment companies as follows:
| Number of Shares Held at Beginning of Period | Gross Additions | Gross Reductions | Number of Shares Held at End of Period | Value at End of Period | Investment Income | Realized Gain (Loss) | % of Affiliated Fund Shares Outstanding Held at End of Period | |||||||||||||||||||||||
| Non-Controlled Affiliates | ||||||||||||||||||||||||||||||
Institutional Fiduciary Trust Money Market Portfolio, 0.58% | 111,135,782 | 727,102,142 | (787,891,988 | ) | 50,345,936 | $ | 50,345,936 | $ | 94,031 | $ | — | 0.3% | ||||||||||||||||||
|
| |||||||||||||||||||||||||||||
f. Interfund Transactions
The Fund engaged in purchases and sales of investments with funds or other accounts that have common investment managers (or affiliated investment managers), directors, trustees or officers. During the period ended June 30, 2017, the purchase and sale transactions aggregated $0 and $375,044,374, respectively.
4. Expense Offset Arrangement
The Fund has entered into an arrangement with its custodian whereby credits realized as a result of uninvested cash balances are used to reduce a portion of the Fund’s custodian expenses. During the period ended June 30, 2017, the custodian fees were reduced as noted in the Statement of Operations.
5. Income Taxes
For tax purposes, capital losses may be carried over to offset future capital gains, if any. At December 31, 2016, the capital loss carryforwards were as follows:
Capital loss carryforwards: | ||||
Short term | $ | 1,095,327 | ||
Long term | 68,138,792 | |||
|
| |||
Total capital loss carryforwards | $ | 69,234,119 | ||
|
|
At June 30, 2017, the cost of investments and net unrealized appreciation (depreciation) for income tax purposes were as follows:
Cost of investments. | $ | 1,398,821,252 | ||
|
| |||
Unrealized appreciation | $ | 364,105,277 | ||
Unrealized depreciation | (88,737,965 | ) | ||
|
| |||
Net unrealized appreciation (depreciation) | $ | 275,367,312 | ||
|
|
Differences between income and/or capital gains as determined on a book basis and a tax basis are primarily due to differing treatments of EU reclaims and foreign capital gains tax.
| Semiannual Report | TF-23 |
FRANKLIN TEMPLETON VARIABLE INSURANCE PRODUCTS TRUST
NOTES TO FINANCIAL STATEMENTS (UNAUDITED)
Templeton Foreign VIP Fund (continued)
6. Investment Transactions
Purchases and sales of investments (excluding short term securities) for the period ended June 30, 2017, aggregated $302,484,971 and $787,641,694, respectively.
7. Concentration of Risk
Investing in foreign securities may include certain risks and considerations not typically associated with investing in U.S. securities, such as fluctuating currency values and changing local and regional economic, political and social conditions, which may result in greater market volatility. In addition, certain foreign securities may not be as liquid as U.S. securities.
8. Credit Facility
The Fund, together with other U.S. registered and foreign investment funds (collectively, Borrowers), managed by Franklin Templeton Investments, are borrowers in a joint syndicated senior unsecured credit facility totaling $2 billion (Global Credit Facility) which matures on February 9, 2018. This Global Credit Facility provides a source of funds to the Borrowers for temporary and emergency purposes, including the ability to meet future unanticipated or unusually large redemption requests.
Under the terms of the Global Credit Facility, the Fund shall, in addition to interest charged on any borrowings made by the Fund and other costs incurred by the Fund, pay its share of fees and expenses incurred in connection with the implementation and maintenance of the Global Credit Facility, based upon its relative share of the aggregate net assets of all of the Borrowers, including an annual commitment fee of 0.15% based upon the unused portion of the Global Credit Facility. These fees are reflected in other expenses in the Statement of Operations. During the period ended June 30, 2017, the Fund did not use the Global Credit Facility.
9. Fair Value Measurements
The Fund follows a fair value hierarchy that distinguishes between market data obtained from independent sources (observable inputs) and the Fund’s own market assumptions (unobservable inputs). These inputs are used in determining the value of the Fund’s financial instruments and are summarized in the following fair value hierarchy:
| • | Level 1 – quoted prices in active markets for identical financial instruments |
| • | Level 2 – other significant observable inputs (including quoted prices for similar financial instruments, interest rates, prepayment speed, credit risk, etc.) |
| • | Level 3 – significant unobservable inputs (including the Fund’s own assumptions in determining the fair value of financial instruments) |
The input levels are not necessarily an indication of the risk or liquidity associated with financial instruments at that level.
For movements between the levels within the fair value hierarchy, the Fund has adopted a policy of recognizing the transfers as of the date of the underlying event which caused the movement.
At June 30, 2017, all of the Fund’s investments in financial instruments carried at fair value were valued using Level 1 inputs. For detailed categories, see the accompanying Statement of Investments.
| TF-24 | Semiannual Report |
FRANKLIN TEMPLETON VARIABLE INSURANCE PRODUCTS TRUST
NOTES TO FINANCIAL STATEMENTS (UNAUDITED)
Templeton Foreign VIP Fund (continued)
10. Investment Company Reporting Modernization
In October 2016, the U.S. Securities and Exchange Commission adopted new rules and amended existing rules (together, final rules) intended to modernize the reporting and disclosure of information by registered investment companies. In part, the final rules amend Regulation S-X and require standardized, enhanced disclosures about derivatives in investment company financial statements, as well as other amendments. The compliance date for the amendments to Regulation S-X is August 1, 2017. Management has reviewed the requirements and believes the adoption of the amendments to Regulation S-X will not have a material impact on the Fund’s financial statements and related disclosures.
11. Subsequent Events
The Fund has evaluated subsequent events through the issuance of the financial statements and determined that no events have occurred that require disclosure.
Abbreviations
| Selected Portfolio | ||
| ADR | American Depositary Receipt | |
| IDR | International Depositary Receipt | |
| Semiannual Report | TF-25 |
FRANKLIN TEMPLETON VARIABLE INSURANCE PRODUCTS TRUST
Tax Information (unaudited)
Templeton Foreign VIP Fund
At December 31, 2016, more than 50% of the Fund’s total assets were invested in securities of foreign issuers. In most instances, foreign taxes were withheld from income paid to the Fund on these investments. As shown in the table below, the Fund hereby reports to shareholders the foreign source income and foreign taxes paid, pursuant to Section 853 of the Internal Revenue Code. This written statement will allow shareholders of record on June 14, 2017, to treat their proportionate share of foreign taxes paid by the Fund as having been paid directly by them. The shareholder shall consider these amounts as foreign taxes paid in the tax year in which they receive the Fund distribution.
The following table provides a detailed analysis of foreign tax paid, and foreign source income as reported by the Fund, to Class 1, Class 2, and Class 4 shareholders of record.
| Class | Foreign Tax Paid Per Share | Foreign Per Share | ||
Class 1 | $0.0414 | $0.4624 | ||
Class 2 | $0.0414 | $0.4245 | ||
Class 4 | $0.0414 | $0.3024 |
Foreign Tax Paid Per Share (Column 1) is the amount per share available to you, as a tax credit (assuming you held your shares in the Fund for a minimum of 16 days during the 31-day period beginning 15 days before the ex-dividend date of the Fund’s distribution to which the foreign taxes relate), or, as a tax deduction.
Foreign Source Income Per Share (Column 2) is the amount per share of income dividends attributable to foreign securities held by the Fund, plus any foreign taxes withheld on these dividends.
| TF-26 | Semiannual Report |
Templeton Global Bond VIP Fund
This semiannual report for Templeton Global Bond VIP Fund covers the period ended June 30, 2017.
Class 1 Performance Summary as of June 30, 2017
The Fund’s Class 1 Shares delivered a +3.05% total return* for the six-month period ended June 30, 2017.
*The Fund has a fee waiver associated with any investment it makes in a Franklin Templeton money fund and/or other Franklin Templeton fund, contractually guaranteed through 4/30/18. Fund investment results reflect the fee waiver; without this waiver, the results would have been lower.
Performance reflects the Fund’s Class 1 operating expenses, but does not include any contract fees, expenses or sales charges. If they had been included, performance would be lower. These charges and deductions, particularly for variable life policies, can have a significant effect on contract values and insurance benefits. See the contract prospectus for a complete description of these expenses, including sales charges.
Performance data represent past performance, which does not guarantee future results. Investment return and principal value will fluctuate, and you may have a gain or loss when you sell your shares. Current performance may differ from figures shown.
| Semiannual Report | TGB-1 |
TEMPLETON GLOBAL BOND VIP FUND
Fund Goal and Main Investments
The Fund seeks high current income, consistent with preservation of capital, with capital appreciation as a secondary consideration. Under normal market conditions, the Fund invests at least 80% of its net assets in bonds, which include debt securities of any maturity, such as bonds, notes, bills and debentures.
Fund Risks
All investments involve risks, including possible loss of principal. Currency rates may fluctuate significantly over short periods of time, and can reduce returns. Derivatives, including currency management strategies, involve costs and can create economic leverage in the portfolio that may result in significant volatility and cause the Fund to participate in losses (as well as enable gains) on an amount that exceeds the Fund’s initial investment. The Fund may not achieve the anticipated benefits and may realize losses when a counterparty fails to perform as promised. Foreign securities involve special risks, including currency fluctuations and economic and political uncertainties. Investments in emerging markets involve heightened risks related to the same factors, in addition to those associated with these markets’ smaller size and lesser liquidity. Sovereign debt securities are subject to various risks in addition to those relating to debt securities and foreign securities generally, including, but not limited to, the risk that a governmental entity may be unwilling or unable to pay interest and repay principal on its sovereign debt, or otherwise meet its obligations when due. Investments in lower rated bonds include higher risk of default and loss of principal. Changes in interest rates will affect the value of the Fund’s portfolio and its share price and yield. Bond prices generally move in the opposite direction of interest rates. As prices of bonds in the Fund adjust to a rise in interest rates, the Fund’s share price may decline. The Fund is also nondiversified, which involves the risk of greater price fluctuation than a more diversified portfolio. Changes in the financial strength of a bond issuer or in a bond’s credit rating may affect its value. The Fund is actively managed but there is no guarantee that the manager’s investment decisions will produce the desired results. The Fund’s prospectus also includes a description of the main investment risks.
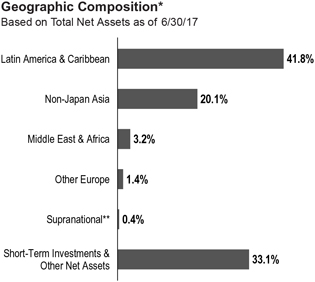
*Figures represent the net Fund exposure and include certain derivatives held in the portfolio (or their underlying reference assets) and may not total 100% or may be negative due to rounding, use of any derivatives or other factors.
**The Fund’s supranational investment was denominated in the Mexican peso.
Performance Overview
You can find the Fund’s six-month total return in the Performance Summary. For comparison, the J.P. Morgan (JPM) Global Government Bond Index (GGBI) produced a +4.07% total return and the Citigroup World Government Bond Index posted a +4.49% total return for the same period.1
Economic and Market Overview
In the months before the reporting period began, global bond markets shifted significantly, setting new valuation levels that meaningfully impacted markets during the six-month reporting period. In November 2016, a sharp correction to U.S. Treasury valuations manifested quickly after the results of the U.S. election, driving yields higher based on growing investor expectations for a December rate hike and a recognition that inflation pressures were rising. A number of emerging markets saw currency depreciations from broad-based strengthening of the U.S. dollar and fears over potential protectionist trade shocks.
However, during the first three months of the reporting period, several local-currency emerging markets significantly rebounded from trade concerns, particularly in select areas of Latin America and Asia. Local-currency bond markets in
1. Source: Morningstar.
One cannot invest directly in an index, and an index is not representative of the Fund’s portfolio. Please see Index Descriptions following the Fund Summaries.
The dollar value, number of shares or principal amount, and names of all portfolio holdings are listed in the Fund’s Statement of Investments (SOI).
| TGB-2 | Semiannual Report |
TEMPLETON GLOBAL BOND VIP FUND
Brazil, Colombia, Indonesia and India notably strengthened during the six-month period. Additionally, the Mexican peso recovered significantly after reaching its lowest valuation on record in the days leading up to President Trump’s inauguration on January 20. After breaching 22 pesos per U.S. dollar in January, the peso strengthened more than 21% through the remainder of the period, ending around 18 pesos per dollar.
In developed markets, U.S. Treasury yields initially rose significantly in the weeks leading up to the U.S. Federal Reserve (Fed’s) March 15 meeting, with the 10-year U.S. Treasury note reaching its highest yield of the reporting period on the day before the meeting, at 2.63%. The Fed hiked the federal funds target rate 25 basis points (bps) to a range of 0.75% to 1.00%, as largely expected by markets. However, yields declined during the second half of the month based on U.S. policy uncertainties and less hawkish-sounding language than anticipated in the Fed’s forward guidance. Consumer Price Index figures also began to moderate from a peak of 2.7% year-over-year in February to 2.4% in March, eventually dropping to 1.9% in May.
On March 29, U.K. Prime Minister Theresa May formally triggered Article 50 to begin the U.K.’s exit from the European Union (also known as “Brexit”) in a written letter to Donald Tusk, president of the European Council, largely spurring a protracted decline in the yield on 10-year British government bonds. In April, the European Central Bank (ECB) reduced its pace of monthly quantitative easing purchases to € 60 billion from its previous € 80 billion a month pace, but kept policy rates unchanged. In early May, Emmanuel Macron won the French presidential election over Marine Le Pen, resulting in strengthening European market sentiment, appreciation of the euro and a rise in European bond yields. The reporting period ended with Europe in a cyclical upswing and the euro 8.6% stronger against the U.S. dollar than when the period began.
The Fed raised its policy rate 25 basis points (to a range of 1.00% to 1.25%) at its June 14 meeting and appeared more committed to tightening policy than it has been in recent years, specifically stating its intentions to begin unwinding its balance sheet later this year, while remaining on course for three rate hikes in 2017 and highlighting the need to strengthen financial market stability. However, it was not until the last week of June that markets began to react to the renewed determination from the Fed, only after similar comments on potential policy direction were made by the heads of the ECB, Bank of England and Bank of Canada. U.S. Treasury yields rose sharply during late June, with the yield on the 10-year U.S. Treasury note increasing 17 bps over the final four days of the month. The 10-year U.S. Treasury note finished the reporting period at
2.31%. As the period came to an end, rates in developed markets were largely trending higher, while select local-currency emerging markets in Latin America and Asia remained resilient.
| Currency Composition* | ||||
| 6/30/17 | ||||
| % of Total Net Assets | ||||
| Americas | 158.0% | |||
| U.S. Dollar | 113.7% | |||
| Mexican Peso | 22.8% | |||
| Brazilian Real | 12.6% | |||
| Argentinian Peso | 4.5% | |||
| Colombian Peso | 4.0% | |||
| Chilean Peso | 0.3% | |||
| Peruvian Neuvo Sol | 0.1% | |||
| Middle East & Africa | 3.2% | |||
| Ghanaian Cedi | 1.6% | |||
| South African Rand | 1.6% | |||
| Australia & New Zealand | -9.4% | |||
| New Zealand Dollar | 0.0% | ** | ||
| Australian Dollar | -9.4% | |||
| Asia Pacific | -14.1% | |||
| Indonesian Rupiah | 11.2% | |||
| Indian Rupee | 10.0% | |||
| Philippine Peso | 2.3% | |||
| Malaysian Ringgit | 0.1% | |||
| South Korean Won | -7.3% | |||
| Japanese Yen | -30.4% | |||
| Europe | -37.7% | |||
| Euro | -37.7% | |||
*Figures represent the net Fund exposure and include certain derivatives held in the portfolio (or their underlying reference assets) and may not total 100% or may be negative due to rounding, use of any derivatives or other factors.
**Rounds to less than 0.1%.
Investment Strategy
We invest selectively in bonds around the world based upon our assessment of changing market, political and economic conditions. While seeking opportunities, we monitor various factors including changes in interest rates, currency exchange rates and credit risks. We seek to manage the Fund’s exposure to various currencies and regularly utilize currency and cross currency forward contracts and may also use currency and
| Semiannual Report | TGB-3 |
TEMPLETON GLOBAL BOND VIP FUND
currency index futures contracts and other derivative instruments.
What is a currency forward contract?
A currency forward contract is an agreement between the Fund and a counterparty to buy or sell a foreign currency in exchange for another currency at a specific exchange rate on a future date.
What is a futures contract?
A futures contract is an agreement between the Fund and a counterparty made through a U.S. or foreign futures exchange to buy or sell an underlying instrument or asset at a specific price on a future date.
Manager’s Discussion
On the whole, we continued to position the Fund for rising rates by maintaining low portfolio duration and aiming at a negative correlation with U.S. Treasury returns. We also continued to actively seek select duration exposures that we believe can offer positive real yields without taking undue interest-rate risk, favoring countries that we believe have solid underlying fundamentals and prudent fiscal, monetary and financial policies. When investing globally, investment opportunities may take time to materialize, which may require weathering short-term volatility as the longer term investing theses develop. During the period, we added to some of our strongest investment convictions as prices became cheaper during periods of heightened volatility. We also maintained exposures to a number of emerging market currencies that we believe remained fundamentally undervalued. Overall, we were positioned for depreciation of the euro and Japanese yen, rising U.S. Treasury yields and currency appreciation in select emerging markets. During the period, we used forward currency exchange contracts to actively manage currencies. We also used interest-rate swaps to tactically manage duration exposures.
What is duration?
Duration is a measure of a bond’s price sensitivity to interest-rate changes. In general, a portfolio of securities with a lower duration can be expected to be less sensitive to interest-rate changes than a portfolio with a higher duration.
During the period, the Fund’s positive absolute performance was primarily attributable to interest-rate strategies, followed by currency positions. Sovereign credit exposures had a largely neutral effect on absolute results. The Fund maintained a defensive approach regarding interest rates in developed and
What is an interest-rate swap?
An interest-rate swap is an agreement between two parties to exchange interest rate payment obligations, generally one based on an interest rate fixed to maturity and the other based on an interest rate that changes in accordance with changes in a designated benchmark (for example, LIBOR, prime, commercial paper or other benchmarks).
emerging markets. Select duration exposures in Latin America (Brazil) and Asia ex-Japan (Indonesia) contributed to absolute performance, while negative duration exposure to U.S. Treasuries detracted. Among currencies, positions in Latin America (Mexican peso) and Asia ex-Japan (Indian rupee) contributed to absolute results. However, the Fund’s net-negative positions in the euro, the Japanese yen and the Australian dollar detracted from absolute performance.
On a relative basis, the Fund’s underperformance was primarily due to currency positions. Interest-rate strategies contributed to relative results, while sovereign credit exposures had a largely neutral effect. Among currencies, the Fund’s underweighted positions in the euro, the Japanese yen and the Australian dollar detracted from relative performance. However, overweighted currency positions in Latin America (Mexican peso) and Asia ex-Japan (Indian rupee) contributed to relative results. The Fund maintained a defensive approach regarding interest rates in developed and emerging markets. Select overweighted duration exposures in Latin America (Brazil) and Asia ex-Japan (Indonesia) contributed to relative performance. However, underweighted duration exposure in the U.S. detracted from relative results.
Thank you for your participation in Templeton Global Bond VIP Fund. We look forward to serving your future investment needs.
The foregoing information reflects our analysis, opinions and portfolio holdings as of June 30, 2017, the end of the reporting period. The way we implement our main investment strategies and the resulting portfolio holdings may change depending on factors such as market and economic conditions. These opinions may not be relied upon as investment advice or an offer for a particular security. The information is not a complete analysis of every aspect of any market, country, industry, security or the Fund. Statements of fact are from sources considered reliable, but the investment manager makes no representation or warranty as to their completeness or accuracy. Although historical performance is no guarantee of future results, these insights may help you understand our investment management philosophy.
| TGB-4 | Semiannual Report |
TEMPLETON GLOBAL BOND VIP FUND
Class 1 Fund Expenses
As an investor in a variable insurance contract (Contract) that indirectly provides for investment in an underlying mutual fund, you can incur transaction and/or ongoing expenses at both the Fund level and the Contract Level: (1) transaction expenses can include sales charges (loads) on purchases, surrender fees, transfer fees and premium taxes; and (2) ongoing expenses can include management fees, distribution and service (12b-1) fees, contract fees, annual maintenance fees, mortality and expense risk fees and other fees and expenses. All mutual funds and Contracts have some types of ongoing expenses. The table below shows Fund-level ongoing expenses and can help you understand these costs and compare them with those of other mutual funds offered through the Contract. The table assumes a $1,000 investment held for the six months indicated. Please refer to the Fund prospectus for additional information on operating expenses.
Actual Fund Expenses
The table below provides information about the actual account values and actual expenses in the columns under the heading “Actual.” In these columns the Fund’s actual return, which includes the effect of ongoing Fund expenses but does not include the effect of ongoing Contract expenses, is used to calculate the “Ending Account Value.” You can estimate the Fund-level expenses you paid during the period by following these steps (of course, your account value and expenses will differ from those in this illustration): Divide your account value by $1,000 (if your account had an $8,600 value, then $8,600 ÷ $1,000 = 8.6). Then multiply the result by the number under the headings “Actual” and “Fund-Level Expenses Paid During Period” (if Fund-Level Expenses Paid During Period were $ 7.50, then 8.6 × $7.50 = $64.50). In this illustration, the estimated expenses paid this period at the Fund level are $64.50.
Hypothetical Example for Comparison with Other Mutual Funds
Under the heading “Hypothetical” in the table, information is provided about hypothetical account values and hypothetical expenses based on the Fund’s actual expense ratio and an assumed rate of return of 5% per year before expenses, which is not the Fund’s actual return. This information may not be used to estimate the actual ending account balance or expenses you paid for the period, but it can help you compare ongoing costs of investing in the Fund with those of other mutual funds offered through the Contract. To do so, compare this 5% hypothetical example with the 5% hypothetical examples that appear in the shareholder reports of other funds offered through the Contract.
Please note that expenses shown in the table are meant to highlight ongoing costs at the Fund level only and do not reflect any ongoing expenses at the Contract level, or transaction expenses at either the Fund or Contract levels. In addition, while the Fund does not have transaction expenses, if the transaction and ongoing expenses at the Contract level were included, the expenses shown below would be higher. You should consult your Contract prospectus or disclosure document for more information.
| Actual (actual return after expenses) | Hypothetical (5% annual return before expenses) | |||||||||||||||||||||||
| Share Class | | Beginning Account Value 1/1/17 | | | Ending Account Value 6/30/17 | | | Fund-Level Expenses Paid During Period 1/1/17–6/30/17 | 1,2 | | Ending Account Value 6/30/17 |
| | Fund-Level Expenses Paid During Period 1/1/17–6/30/17 | 1,2 | | Net Annualized Expense Ratio | 2 | ||||||
Class 1 | $1,000 | $1,030.50 | $2.27 | $1,022.56 | $2.26 | 0.45% | ||||||||||||||||||
1. Expenses are equal to the annualized expense ratio for the six-month period as indicated above–in the far right column–multiplied by the simple average account value over the period indicated, and then multiplied by 181/365 to reflect the one-half year period.
2. Reflects expenses after fee waivers and expense reimbursements. Does not include any ongoing expenses of the Contract for which the Fund is an investment option or acquired fund fees and expenses.
| Semiannual Report | TGB-5 |
FRANKLIN TEMPLETON VARIABLE INSURANCE PRODUCTS TRUST
Financial Highlights
Templeton Global Bond VIP Fund
Six Months Ended (unaudited) | Year Ended December 31, | |||||||||||||||||||||||
| 2016 | 2015 | 2014 | 2013 | 2012 | ||||||||||||||||||||
| Class 1 | ||||||||||||||||||||||||
Per share operating performance (for a share outstanding throughout the period) | ||||||||||||||||||||||||
Net asset value, beginning of period | $ | 16.85 | $ | 16.34 | $ | 18.56 | $ | 19.15 | $ | 20.01 | $ | 18.61 | ||||||||||||
|
| |||||||||||||||||||||||
| Income from investment operationsa: | ||||||||||||||||||||||||
Net investment incomeb | 0.41 | 0.62 | 0.52 | 0.58 | 0.64 | 0.72 | ||||||||||||||||||
Net realized and unrealized gains (losses) | 0.10 | (0.10 | ) | (1.22 | ) | (0.16 | ) | (0.30 | ) | 1.99 | ||||||||||||||
|
| |||||||||||||||||||||||
Total from investment operations | 0.51 | 0.52 | (0.70 | ) | 0.42 | 0.34 | 2.71 | |||||||||||||||||
|
| |||||||||||||||||||||||
| Less distributions from: | ||||||||||||||||||||||||
Net investment income and net foreign currency gains. | — | — | (1.43 | ) | (1.01 | ) | (0.96 | ) | (1.28 | ) | ||||||||||||||
Net realized gains | (0.05 | ) | (0.01 | ) | (0.09 | ) | — | (0.24 | ) | (0.03 | ) | |||||||||||||
|
| |||||||||||||||||||||||
Total distributions | (0.05 | ) | (0.01 | ) | (1.52 | ) | (1.01 | ) | (1.20 | ) | (1.31 | ) | ||||||||||||
|
| |||||||||||||||||||||||
Redemption fees | — | — | — | — | c | — | c | — | c | |||||||||||||||
|
| |||||||||||||||||||||||
Net asset value, end of period | $ | 17.31 | $ | 16.85 | $ | 16.34 | $ | 18.56 | $ | 19.15 | $ | 20.01 | ||||||||||||
|
| |||||||||||||||||||||||
Total returnd | 3.05% | 3.21% | (4.10)% | 2.12% | 1.89% | 15.31% | ||||||||||||||||||
| Ratios to average net assetse | ||||||||||||||||||||||||
Expenses before waiver and payments by affiliates | 0.52% | 0.53% | 0.52% | 0.51% | 0.51% | 0.55% | ||||||||||||||||||
Expenses net of waiver and payments by affiliatesf | 0.45% | 0.48% | 0.52% | g | 0.51% | 0.51% | 0.55% | |||||||||||||||||
Net investment income | 4.81% | 3.88% | 2.99% | 3.08% | 3.26% | 3.71% | ||||||||||||||||||
| Supplemental data | ||||||||||||||||||||||||
Net assets, end of period (000’s) | $ | 261,770 | $ | 241,792 | $ | 292,802 | $ | 323,491 | $ | 280,963 | $ | 307,142 | ||||||||||||
Portfolio turnover rate | 15.84% | 59.00% | 51.58% | 39.14% | 34.39% | 43.26% | ||||||||||||||||||
aThe amount shown for a share outstanding throughout the period may not correlate with the Statement of Operations for the period due to the timing of sales and repurchases of the Fund’s shares in relation to income earned and/or fluctuating fair value of the investments of the Fund.
bBased on average daily shares outstanding.
cAmount rounds to less than $0.01 per share.
dTotal return does not include fees, charges or expenses imposed by the variable annuity and life insurance contracts for which Franklin Templeton Variable Insurance Products Trust serves as an underlying investment vehicle. Total return is not annualized for periods less than one year.
eRatios are annualized for periods less than one year.
fBenefit of expense reduction rounds to less than 0.01%.
gBenefit of waiver and payments by affiliates rounds to less than 0.01%.
| TGB-6 | Semiannual Report | The accompanying notes are an integral part of these financial statements. |
FRANKLIN TEMPLETON VARIABLE INSURANCE PRODUCTS TRUST
FINANCIAL HIGHLIGHTS
Templeton Global Bond VIP Fund (continued)
| Six Months Ended June 30, 2017 (unaudited) | Year Ended December 31, | |||||||||||||||||||||||
| 2016 | 2015 | 2014 | 2013 | 2012 | ||||||||||||||||||||
| Class 2 | ||||||||||||||||||||||||
Per share operating performance (for a share outstanding throughout the period) | ||||||||||||||||||||||||
Net asset value, beginning of period | $ | 16.25 | $ | 15.80 | $ | 17.99 | $ | 18.60 | $ | 19.47 | $ | 18.15 | ||||||||||||
|
| |||||||||||||||||||||||
| Income from investment operationsa: | ||||||||||||||||||||||||
Net investment incomeb | 0.38 | 0.56 | 0.46 | 0.52 | 0.57 | 0.65 | ||||||||||||||||||
Net realized and unrealized gains (losses) | 0.09 | (0.10 | ) | (1.17 | ) | (0.17 | ) | (0.27 | ) | 1.94 | ||||||||||||||
|
| |||||||||||||||||||||||
Total from investment operations | 0.47 | 0.46 | (0.71 | ) | 0.35 | 0.30 | 2.59 | |||||||||||||||||
|
| |||||||||||||||||||||||
| Less distributions from: | ||||||||||||||||||||||||
Net investment income and net foreign currency gains | — | — | (1.39 | ) | (0.96 | ) | (0.93 | ) | (1.24 | ) | ||||||||||||||
Net realized gains | (0.05 | ) | (0.01 | ) | (0.09 | ) | — | (0.24 | ) | (0.03 | ) | |||||||||||||
|
| |||||||||||||||||||||||
Total distributions | (0.05 | ) | (0.01 | ) | (1.48 | ) | (0.96 | ) | (1.17 | ) | (1.27 | ) | ||||||||||||
|
| |||||||||||||||||||||||
Redemption fees | — | — | — | — | c | — | c | — | c | |||||||||||||||
|
| |||||||||||||||||||||||
Net asset value, end of period | $ | 16.67 | $ | 16.25 | $ | 15.80 | $ | 17.99 | $ | 18.60 | $ | 19.47 | ||||||||||||
|
| |||||||||||||||||||||||
Total returnd | 2.91% | 2.94% | (4.30)% | 1.83% | 1.63% | 15.07% | ||||||||||||||||||
| Ratios to average net assetse | ||||||||||||||||||||||||
Expenses before waiver and payments by affiliates | 0.77% | 0.78% | 0.77% | 0.76% | 0.76% | 0.80% | ||||||||||||||||||
Expenses net of waiver and payments by affiliatesf | 0.70% | 0.73% | 0.77% | g | 0.76% | 0.76% | 0.80% | |||||||||||||||||
Net investment income | 4.56% | 3.63% | 2.74% | 2.83% | 3.01% | 3.46% | ||||||||||||||||||
| Supplemental data | ||||||||||||||||||||||||
Net assets, end of period (000’s) | $ | 2,793,645 | $ | 2,812,535 | $ | 2,971,667 | $ | 3,177,638 | $ | 2,826,039 | $ | 2,418,229 | ||||||||||||
Portfolio turnover rate | 15.84% | 59.00% | 51.58% | 39.14% | 34.39% | 43.26% | ||||||||||||||||||
aThe amount shown for a share outstanding throughout the period may not correlate with the Statement of Operations for the period due to the timing of sales and repurchases of the Fund’s shares in relation to income earned and/or fluctuating fair value of the investments of the Fund.
bBased on average daily shares outstanding.
cAmount rounds to less than $0.01 per share.
dTotal return does not include fees, charges or expenses imposed by the variable annuity and life insurance contracts for which Franklin Templeton Variable Insurance Products Trust serves as an underlying investment vehicle. Total return is not annualized for periods less than one year.
eRatios are annualized for periods less than one year.
fBenefit of expense reduction rounds to less than 0.01%.
gBenefit of waiver and payments by affiliates rounds to less than 0.01%.
| The accompanying notes are an integral part of these financial statements. | Semiannual Report | TGB-7 |
FRANKLIN TEMPLETON VARIABLE INSURANCE PRODUCTS TRUST
FINANCIAL HIGHLIGHTS
Templeton Global Bond VIP Fund (continued)
Six Months Ended (unaudited) | Year Ended December 31, | |||||||||||||||||||||||
| 2016 | 2015 | 2014 | 2013 | 2012 | ||||||||||||||||||||
| Class 4 | ||||||||||||||||||||||||
Per share operating performance (for a share outstanding throughout the period) | ||||||||||||||||||||||||
Net asset value, beginning of period | $ | 16.62 | $ | 16.18 | $ | 18.38 | $ | 18.97 | $ | 19.82 | $ | 18.44 | ||||||||||||
|
| |||||||||||||||||||||||
| Income from investment operationsa: | ||||||||||||||||||||||||
Net investment incomeb | 0.38 | 0.56 | 0.46 | 0.51 | 0.56 | 0.64 | ||||||||||||||||||
Net realized and unrealized gains (losses) | 0.10 | (0.11 | ) | (1.21 | ) | (0.18 | ) | (0.28 | ) | 1.98 | ||||||||||||||
|
| |||||||||||||||||||||||
| Total from investment operations | 0.48 | 0.45 | (0.75 | ) | 0.33 | 0.28 | 2.62 | |||||||||||||||||
|
| |||||||||||||||||||||||
| Less distributions from: | ||||||||||||||||||||||||
Net investment income and net foreign currency gains | — | — | (1.36 | ) | (0.92 | ) | (0.89 | ) | (1.21 | ) | ||||||||||||||
Net realized gains | (0.05 | ) | (0.01 | ) | (0.09 | ) | — | (0.24 | ) | (0.03 | ) | |||||||||||||
|
| |||||||||||||||||||||||
| Total distributions | (0.05 | ) | (0.01 | ) | (1.45 | ) | (0.92 | ) | (1.13 | ) | (1.24 | ) | ||||||||||||
|
| |||||||||||||||||||||||
| Redemption fees | — | — | — | — | c | — | c | — | c | |||||||||||||||
|
| |||||||||||||||||||||||
| Net asset value, end of period | $ | 17.05 | $ | 16.62 | $ | 16.18 | $ | 18.38 | $ | 18.97 | $ | 19.82 | ||||||||||||
|
| |||||||||||||||||||||||
| Total returnd | 2.85% | 2.87% | (4.39)% | 1.69% | 1.54% | 14.97% | ||||||||||||||||||
| Ratios to average net assetse | ||||||||||||||||||||||||
Expenses before waiver and payments by affiliates | 0.87% | 0.88% | 0.87% | 0.86% | 0.86% | 0.90% | ||||||||||||||||||
Expenses net of waiver and payments by affiliatesf | 0.80% | 0.83% | 0.87% | g | 0.86% | 0.86% | 0.90% | |||||||||||||||||
Net investment income | 4.46% | 3.53% | 2.64% | 2.73% | 2.91% | 3.36% | ||||||||||||||||||
| Supplemental data | ||||||||||||||||||||||||
Net assets, end of period (000’s) | $ | 97,697 | $ | 96,798 | $ | 103,045 | $ | 111,199 | $ | 118,145 | $ | 163,241 | ||||||||||||
Portfolio turnover rate | 15.84% | 59.00% | 51.58% | 39.14% | 34.39% | 43.26% | ||||||||||||||||||
aThe amount shown for a share outstanding throughout the period may not correlate with the Statement of Operations for the period due to the timing of sales and repurchases of the Fund’s shares in relation to income earned and/or fluctuating fair value of the investments of the Fund.
bBased on average daily shares outstanding.
cAmount rounds to less than $0.01 per share.
dTotal return does not include fees, charges or expenses imposed by the variable annuity and life insurance contracts for which Franklin Templeton Variable Insurance Products Trust serves as an underlying investment vehicle. Total return is not annualized for periods less than one year.
eRatios are annualized for periods less than one year.
fBenefit of expense reduction rounds to less than 0.01%.
gBenefit of waiver and payments by affiliates rounds to less than 0.01%.
| TGB-8 | Semiannual Report | The accompanying notes are an integral part of these financial statements. |
FRANKLIN TEMPLETON VARIABLE INSURANCE PRODUCTS TRUST
Statement of Investments, June 30, 2017 (unaudited)
| Templeton Global Bond VIP Fund | ||||||||
| Principal Amount* | Value | |||||||||||||
Foreign Government and Agency Securities 66.9% | ||||||||||||||
| Argentina 4.5% | ||||||||||||||
Argentine Bonos del Tesoro, | ||||||||||||||
21.20%, 9/19/18 | 44,122,000 | ARS | $ | 2,678,159 | ||||||||||
18.20%, 10/03/21 | 798,350,000 | ARS | 51,113,174 | |||||||||||
16.00%, 10/17/23 | 240,805,000 | ARS | 15,561,104 | |||||||||||
senior note, 15.50%, 10/17/26 | 1,067,286,000 | ARS | 71,684,267 | |||||||||||
| a | Government of Argentina, FRN, 21.472%, 4/03/22 | 24,036,000 | ARS | 1,403,091 | ||||||||||
|
| |||||||||||||
| 142,439,795 | ||||||||||||||
|
| |||||||||||||
| Brazil 12.6% | ||||||||||||||
Letra Tesouro Nacional, | ||||||||||||||
Strip, 1/01/19 | 38,960 | b | BRL | 10,349,634 | ||||||||||
Strip, 7/01/19 | 102,840 | b | BRL | 26,047,747 | ||||||||||
Strip, 7/01/20 | 259,441 | b | BRL | 59,132,615 | ||||||||||
Nota Do Tesouro Nacional, | ||||||||||||||
10.00%, 1/01/21 | 38,520 | b | BRL | 11,645,655 | ||||||||||
10.00%, 1/01/23 | 522,145 | b | BRL | 155,660,347 | ||||||||||
10.00%, 1/01/25 | 69,029 | b | BRL | 20,364,969 | ||||||||||
10.00%, 1/01/27 | 260,633 | b | BRL | 76,422,690 | ||||||||||
| c | Index Linked, 6.00%, 5/15/19 | 2,087 | b | BRL | 1,928,115 | |||||||||
| c | Index Linked, 6.00%, 8/15/22 | 18,002 | b | BRL | 16,568,182 | |||||||||
| c | Index Linked, 6.00%, 5/15/23 | 4,510 | b | BRL | 4,151,346 | |||||||||
| c | Index Linked, 6.00%, 8/15/24 | 3,110 | b | BRL | 2,882,896 | |||||||||
| c | Index Linked, 6.00%, 5/15/45 | 5,285 | b | BRL | 4,990,409 | |||||||||
senior note, 10.00%, 1/01/19 | 21,390 | b | BRL | 6,553,067 | ||||||||||
|
| |||||||||||||
| 396,697,672 | ||||||||||||||
|
| |||||||||||||
| Colombia 3.9% | ||||||||||||||
Government of Colombia, | ||||||||||||||
senior bond, 7.75%, 4/14/21. | 2,386,000,000 | COP | 835,119 | |||||||||||
senior bond, 4.375%, 3/21/23 | 362,000,000 | COP | 110,061 | |||||||||||
senior bond, 9.85%, 6/28/27. | 576,000,000 | COP | 243,528 | |||||||||||
Titulos de Tesoreria, | ||||||||||||||
B, 5.00%, 11/21/18 | 2,882,000,000 | COP | 948,525 | |||||||||||
B, 7.75%, 9/18/30 | 140,945,200,000 | COP | 50,416,479 | |||||||||||
B, 7.00%, 6/30/32 | 5,967,000,000 | COP | 1,974,962 | |||||||||||
senior bond, B, 11.25%, 10/24/18 | 5,135,000,000 | COP | 1,822,493 | |||||||||||
senior bond, B, 11.00%, 7/24/20 | 9,167,000,000 | COP | 3,461,277 | |||||||||||
senior bond, B, 7.00%, 5/04/22 | 10,237,000,000 | COP | 3,529,044 | |||||||||||
senior bond, B, 10.00%, 7/24/24 | 40,977,000,000 | COP | 16,376,278 | |||||||||||
senior bond, B, 7.50%, 8/26/26 | 77,594,200,000 | COP | 27,176,911 | |||||||||||
senior bond, B, 6.00%, 4/28/28 | 42,303,600,000 | COP | 13,247,144 | |||||||||||
senior note, B, 7.00%, 9/11/19 | 4,056,000,000 | COP | 1,377,435 | |||||||||||
|
| |||||||||||||
| 121,519,256 | ||||||||||||||
|
| |||||||||||||
| Ghana 1.6% | ||||||||||||||
Government of Ghana, | ||||||||||||||
24.75%, 3/01/21 | 80,000 | GHS | 21,254 | |||||||||||
24.50%, 6/21/21 | 80,000 | GHS | 21,244 | |||||||||||
24.75%, 7/19/21 | 80,000 | GHS | 21,406 | |||||||||||
18.75%, 1/24/22 | 26,840,000 | GHS | 6,255,654 | |||||||||||
19.75%, 3/25/24 | 26,840,000 | GHS | 6,529,851 | |||||||||||
19.00%, 11/02/26 | 80,510,000 | GHS | 19,062,147 | |||||||||||
senior bond, 19.75%, 3/15/32 | 80,510,000 | GHS | 19,502,234 | |||||||||||
| Semiannual Report | TGB-9 |
FRANKLIN TEMPLETON VARIABLE INSURANCE PRODUCTS TRUST
STATEMENT OF INVESTMENTS (UNAUDITED)
Templeton Global Bond VIP Fund (continued)
| Principal Amount* | Value | |||||||||||
| Foreign Government and Agency Securities (continued) | ||||||||||||
| Ghana (continued) | ||||||||||||
Government of Ghana, (continued) | ||||||||||||
senior note, 21.50%, 3/09/20 | 520,000 | GHS | $ | 125,838 | ||||||||
|
| |||||||||||
| 51,539,628 | ||||||||||||
|
| |||||||||||
India 7.6% | ||||||||||||
Government of India, | ||||||||||||
senior bond, 7.80%, 5/03/20 | 270,800,000 | INR | 4,326,933 | |||||||||
senior bond, 8.20%, 2/15/22 | 353,000,000 | INR | 5,781,399 | |||||||||
senior bond, 8.35%, 5/14/22 | 212,700,000 | INR | 3,516,989 | |||||||||
senior bond, 8.08%, 8/02/22 | 622,000,000 | INR | 10,182,319 | |||||||||
senior bond, 8.13%, 9/21/22 | 28,000,000 | INR | 459,410 | |||||||||
senior bond, 9.15%, 11/14/24 | 2,409,000,000 | INR | 42,021,057 | |||||||||
senior note, 7.28%, 6/03/19 | 28,000,000 | INR | 440,127 | |||||||||
senior note, 8.27%, 6/09/20 | 1,222,000,000 | INR | 19,788,685 | |||||||||
senior note, 8.12%, 12/10/20 | 844,000,000 | INR | 13,688,552 | |||||||||
senior note, 7.80%, 4/11/21 | 1,980,300,000 | INR | 31,859,478 | |||||||||
senior note, 8.79%, 11/08/21 | 653,000,000 | INR | 10,894,247 | |||||||||
senior note, 8.15%, 6/11/22 | 1,621,000,000 | INR | 26,585,704 | |||||||||
senior note, 7.16%, 5/20/23 | 133,700,000 | INR | 2,107,948 | |||||||||
senior note, 8.83%, 11/25/23 | 2,983,900,000 | INR | 50,909,157 | |||||||||
senior note, 7.68%, 12/15/23 | 1,062,000,000 | INR | 17,221,837 | |||||||||
|
| |||||||||||
| 239,783,842 | ||||||||||||
|
| |||||||||||
Indonesia 6.1% | ||||||||||||
Government of Indonesia, | ||||||||||||
6.125%, 5/15/28 | 37,000,000 | IDR | 2,564 | |||||||||
8.375%, 3/15/34 | 81,180,000,000 | IDR | 6,566,277 | |||||||||
FR34, 12.80%, 6/15/21 | 392,506,000,000 | IDR | 35,681,857 | |||||||||
FR35, 12.90%, 6/15/22 | 71,229,000,000 | IDR | 6,733,755 | |||||||||
FR43, 10.25%, 7/15/22 | 147,832,000,000 | IDR | 12,734,958 | |||||||||
FR52, 10.50%, 8/15/30 | 6,960,000,000 | IDR | 658,217 | |||||||||
senior bond, 9.00%, 3/15/29 | 51,222,000,000 | IDR | 4,395,810 | |||||||||
senior bond, 8.75%, 5/15/31 | 85,845,000,000 | IDR | 7,278,548 | |||||||||
senior bond, FR39, 11.75%, 8/15/23 | 5,491,000,000 | IDR | 507,039 | |||||||||
senior bond, FR40, 11.00%, 9/15/25 | 46,856,000,000 | IDR | 4,348,546 | |||||||||
senior bond, FR44, 10.00%, 9/15/24 | 4,454,000,000 | IDR | 388,306 | |||||||||
senior bond, FR46, 9.50%, 7/15/23 | 226,780,000,000 | IDR | 19,227,769 | |||||||||
senior bond, FR47, 10.00%, 2/15/28 | 12,000,000 | IDR | 1,094 | |||||||||
senior bond, FR56, 8.375%, 9/15/26 | 525,219,000,000 | IDR | 43,595,856 | |||||||||
senior bond, FR59, 7.00%, 5/15/27 | 47,752,000,000 | IDR | 3,636,711 | |||||||||
senior bond, FR61, 7.00%, 5/15/22 | 244,849,000,000 | IDR | 18,642,705 | |||||||||
senior bond, FR63, 5.625%, 5/15/23 | 258,951,000,000 | IDR | 18,178,619 | |||||||||
senior bond, FR70, 8.375%, 3/15/24 | 136,475,000,000 | IDR | 11,098,693 | |||||||||
|
| |||||||||||
| 193,677,324 | ||||||||||||
|
| |||||||||||
Mexico 20.7% | ||||||||||||
Government of Mexico, | ||||||||||||
7.75%, 12/14/17 | 30,626,300 | d | MXN | 169,473,233 | ||||||||
M, 4.75%, 6/14/18 | 6,775,400 | d | MXN | 36,608,366 | ||||||||
senior note, 8.50%, 12/13/18 | 60,159,700 | d | MXN | 339,148,412 | ||||||||
senior note, M, 5.00%, 12/11/19 | 18,742,300 | d | MXN | 99,600,226 | ||||||||
| TGB-10 | Semiannual Report |
FRANKLIN TEMPLETON VARIABLE INSURANCE PRODUCTS TRUST
STATEMENT OF INVESTMENTS (UNAUDITED)
Templeton Global Bond VIP Fund (continued)
| Principal Amount* | Value | |||||||||||
| Foreign Government and Agency Securities (continued) | ||||||||||||
| Mexico (continued) | ||||||||||||
| e | Mexican Udibonos, | |||||||||||
Index Linked, 3.50%, 12/14/17 | 648,817 | f | MXN | $ | 3,595,915 | |||||||
Index Linked, 4.00%, 6/13/19 | 445,332 | f | MXN | 2,495,704 | ||||||||
Index Linked, 2.50%, 12/10/20 | 350,721 | f | MXN | 1,897,215 | ||||||||
|
| |||||||||||
| 652,819,071 | ||||||||||||
|
| |||||||||||
| Peru 0.1% | ||||||||||||
Government of Peru, senior bond, 7.84%, 8/12/20 | 11,090,000 | PEN | 3,795,779 | |||||||||
|
| |||||||||||
| Philippines 1.7% | ||||||||||||
Government of the Philippines, | ||||||||||||
senior note, 5.875%, 1/31/18 | 81,610,000 | PHP | 1,642,971 | |||||||||
senior note, 3.375%, 8/20/20 | 1,102,110,000 | PHP | 21,556,702 | |||||||||
senior note, 5-72, 2.125%, 5/23/18 | 686,978,000 | PHP | 13,545,375 | |||||||||
senior note, 7-51, 5.00%, 8/18/18 | 64,060,000 | PHP | 1,289,333 | |||||||||
senior note, 7-56, 3.875%, 11/22/19 | 813,510,000 | PHP | 16,165,539 | |||||||||
|
| |||||||||||
| 54,199,920 | ||||||||||||
|
| |||||||||||
| South Africa 1.6% | ||||||||||||
Government of South Africa, | ||||||||||||
8.00%, 1/31/30 | 141,289,000 | ZAR | 9,761,937 | |||||||||
7.00%, 2/28/31 | 100,900,000 | ZAR | 6,305,489 | |||||||||
8.25%, 3/31/32 | 181,200,000 | ZAR | 12,484,272 | |||||||||
8.875%, 2/28/35 | 79,858,000 | ZAR | 5,669,143 | |||||||||
8.50%, 1/31/37 | 42,938,000 | ZAR | 2,912,617 | |||||||||
R186, 10.50%, 12/21/26 | 100,497,000 | ZAR | 8,514,522 | |||||||||
senior bond, 6.25%, 3/31/36 | 89,397,000 | ZAR | 4,816,665 | |||||||||
|
| |||||||||||
| 50,464,645 | ||||||||||||
|
| |||||||||||
| South Korea 4.7% | ||||||||||||
Korea Treasury Bond, | ||||||||||||
senior note, 1.375%, 9/10/21 | 45,614,300,000 | KRW | 39,066,436 | |||||||||
senior note, 1.875%, 3/10/22 | 124,352,000,000 | KRW | 108,560,502 | |||||||||
|
| |||||||||||
| 147,626,938 | ||||||||||||
|
| |||||||||||
| g | Supranational 0.4% | |||||||||||
Inter-American Development Bank, senior bond, 7.50%, 12/05/24. | 200,000,000 | MXN | 11,405,885 | |||||||||
|
| |||||||||||
| Ukraine 1.4% | ||||||||||||
| h | Government of Ukraine, | |||||||||||
144A, 7.75%, 9/01/24 | 3,147,000 | 3,093,234 | ||||||||||
144A, 7.75%, 9/01/25 | 8,515,000 | 8,334,184 | ||||||||||
144A, 7.75%, 9/01/26 | 9,566,000 | 9,327,089 | ||||||||||
144A, 7.75%, 9/01/27 | 11,581,000 | 11,249,783 | ||||||||||
| i,j | 144A, VRI, GDP Linked Security, 5/31/40 | 29,978,000 | 11,741,783 | |||||||||
|
| |||||||||||
| 43,746,073 | ||||||||||||
|
| |||||||||||
Total Foreign Government and Agency Securities | 2,109,715,828 | |||||||||||
|
| |||||||||||
| Short Term Investments 23.0% | ||||||||||||
Foreign Government and Agency Securities 2.4% | ||||||||||||
| Argentina 0.0%† | ||||||||||||
Argentine Bonos del Tesoro, 22.75%, 3/05/18 | 2,617,000 | ARS | 158,373 | |||||||||
|
| |||||||||||
| Semiannual Report | TGB-11 |
FRANKLIN TEMPLETON VARIABLE INSURANCE PRODUCTS TRUST
STATEMENT OF INVESTMENTS (UNAUDITED)
Templeton Global Bond VIP Fund (continued)
| Principal Amount* | Value | |||||||||||||
| Foreign Government and Agency Securities (continued) | ||||||||||||||
Colombia 0.1% | ||||||||||||||
Colombian Tes Corto Plazo, Strip, 9/12/17–3/13/18 | 9,908,000,000 | COP | $ | 3,187,800 | ||||||||||
|
| |||||||||||||
Mexico 1.7% | ||||||||||||||
| k | Mexico Treasury Bill, 7/06/17–4/26/18 | 98,582,640 | l | MXN | 53,335,518 | |||||||||
|
| |||||||||||||
Philippines 0.6% | ||||||||||||||
| k | Philippine Treasury Bill, 7/19/17–9/27/17. | 948,920,000 | PHP | 18,793,434 | ||||||||||
|
| |||||||||||||
Total Foreign Government and Agency Securities (Cost $75,005,886) | 75,475,125 | |||||||||||||
|
| |||||||||||||
Total Investments before Money Market Funds (Cost $2,135,757,225) | 2,185,190,953 | |||||||||||||
|
| |||||||||||||
| Shares | ||||||||||||||
Money Market Funds (Cost $649,035,632) 20.6% | ||||||||||||||
United States 20.6% | ||||||||||||||
| m,n | Institutional Fiduciary Trust Money Market Portfolio, 0.58% | 649,035,632 | 649,035,632 | |||||||||||
|
| |||||||||||||
Total Investments (Cost $2,784,792,857) 89.9% | 2,834,226,585 | |||||||||||||
Other Assets, less Liabilities 10.1% | 318,884,966 | |||||||||||||
|
| |||||||||||||
Net Assets 100.0% | $ | 3,153,111,551 | ||||||||||||
|
| |||||||||||||
†Rounds to less than 0.1% of net assets.
*The principal amount is stated in U.S. dollars unless otherwise indicated.
aThe coupon rate shown represents the rate at period end.
bPrincipal amount is stated in 1,000 Brazilian Real Units.
cRedemption price at maturity is adjusted for inflation. See Note 1(e).
dPrincipal amount is stated in 100 Mexican Peso Units.
ePrincipal amount of security is adjusted for inflation. See Note 1(e).
fPrincipal amount is stated in 100 Unidad de Inversion Units.
gA supranational organization is an entity formed by two or more central governments through international treaties.
hSecurity was purchased pursuant to Rule 144A under the Securities Act of 1933 and may be sold in transactions exempt from registration only to qualified institutional buyers or in a public offering registered under the Securities Act of 1933. These securities have been deemed liquid under guidelines approved by the Trust’s Board of Trustees.
iNon-income producing.
jThe principal represents the notional amount. See Note 1(c) regarding value recovery instruments.
kThe security was issued on a discount basis with no stated coupon rate.
lPrincipal amount is stated in 10 Mexican Peso Units.
mSee Note 3(e) regarding investments in affiliated management investment companies.
nThe rate shown is the annualized seven-day yield at period end.
| TGB-12 | Semiannual Report |
FRANKLIN TEMPLETON VARIABLE INSURANCE PRODUCTS TRUST
STATEMENT OF INVESTMENTS (UNAUDITED)
Templeton Global Bond VIP Fund (continued)
At June 30, 2017, the Fund had the following forward exchange contracts outstanding. See Note 1(c).
| Forward Exchange Contracts | ||||||||||||||||||||||||||||||||
| Currency | Counterparty | a | Type | Quantity | | Contract Amount | * | | Settlement Date | | | Unrealized Appreciation | | | Unrealized Depreciation | | ||||||||||||||||
| OTC Forward Exchange Contracts | ||||||||||||||||||||||||||||||||
Chilean Peso | DBAB | Buy | 4,683,134,000 | 7,017,087 | 7/03/17 | $ | 25,717 | $ | — | |||||||||||||||||||||||
Chilean Peso | DBAB | Sell | 4,683,134,000 | 7,061,314 | 7/03/17 | 18,509 | — | |||||||||||||||||||||||||
Euro | GSCO | Buy | 463,000 | 528,052 | 7/03/17 | 899 | — | |||||||||||||||||||||||||
Euro | GSCO | Sell | 463,000 | 499,021 | 7/03/17 | — | (29,929 | ) | ||||||||||||||||||||||||
Euro | DBAB | Buy | 2,579,651 | 2,945,703 | 7/05/17 | 1,729 | — | |||||||||||||||||||||||||
Euro | DBAB | Sell | 2,579,651 | 2,766,289 | 7/05/17 | — | (181,144 | ) | ||||||||||||||||||||||||
Euro | HSBK | Buy | 18,537,726 | 21,157,107 | 7/05/17 | 23,550 | — | |||||||||||||||||||||||||
Euro | HSBK | Sell | 18,537,726 | 19,907,108 | 7/05/17 | — | (1,273,549 | ) | ||||||||||||||||||||||||
Chilean Peso | JPHQ | Buy | 1,792,000,000 | 2,715,563 | 7/07/17 | — | (20,949 | ) | ||||||||||||||||||||||||
Chilean Peso | JPHQ | Sell | 1,792,000,000 | 2,754,000 | 7/07/17 | 59,386 | — | |||||||||||||||||||||||||
Euro | DBAB | Sell | 1,536,000 | 1,730,273 | 7/07/17 | — | (24,912 | ) | ||||||||||||||||||||||||
Euro | BOFA | Sell | 11,879,864 | 12,714,781 | 7/10/17 | — | (862,608 | ) | ||||||||||||||||||||||||
Euro | HSBK | Sell | 15,262,292 | 16,336,757 | 7/10/17 | — | (1,106,378 | ) | ||||||||||||||||||||||||
Euro | JPHQ | Sell | 32,859,900 | 35,175,866 | 7/10/17 | — | (2,379,416 | ) | ||||||||||||||||||||||||
Euro | SCNY | Sell | 2,400,751 | 2,570,496 | 7/10/17 | — | (173,300 | ) | ||||||||||||||||||||||||
Chilean Peso | GSCO | Buy | 4,809,568,000 | 7,281,708 | 7/11/17 | — | (50,445 | ) | ||||||||||||||||||||||||
Euro | BOFA | Sell | 2,643,000 | 2,828,750 | 7/11/17 | — | (192,080 | ) | ||||||||||||||||||||||||
Japanese Yen | BZWS | Sell | 1,689,110,000 | 14,647,600 | 7/11/17 | — | (376,314 | ) | ||||||||||||||||||||||||
Japanese Yen | DBAB | Sell | 770,370,000 | 6,664,100 | 7/11/17 | — | (188,013 | ) | ||||||||||||||||||||||||
Japanese Yen | GSCO | Sell | 329,010,000 | 2,849,632 | 7/11/17 | — | (76,771 | ) | ||||||||||||||||||||||||
Japanese Yen | JPHQ | Sell | 2,831,950,000 | 24,478,779 | 7/11/17 | — | (710,209 | ) | ||||||||||||||||||||||||
Euro | GSCO | Sell | 8,105,300 | 8,626,957 | 7/12/17 | — | (637,556 | ) | ||||||||||||||||||||||||
Euro | SCNY | Sell | 15,572,000 | 16,576,394 | 7/12/17 | — | (1,222,701 | ) | ||||||||||||||||||||||||
Euro | JPHQ | Sell | 36,882,000 | 39,326,539 | 7/13/17 | — | (2,832,661 | ) | ||||||||||||||||||||||||
Japanese Yen | BZWS | Sell | 1,089,820,000 | 9,494,322 | 7/13/17 | — | (200,055 | ) | ||||||||||||||||||||||||
Japanese Yen | BZWS | Sell | 1,426,300,000 | 12,999,927 | 7/13/17 | 312,429 | — | |||||||||||||||||||||||||
Japanese Yen | CITI | Sell | 138,680,000 | 1,203,851 | 7/13/17 | — | (29,762 | ) | ||||||||||||||||||||||||
Japanese Yen | HSBK | Sell | 536,380,000 | 4,658,341 | 7/13/17 | — | (112,970 | ) | ||||||||||||||||||||||||
Japanese Yen | JPHQ | Sell | 708,450,000 | 6,923,866 | 7/14/17 | 621,636 | — | |||||||||||||||||||||||||
Euro | JPHQ | Sell | 15,313,111 | 16,660,068 | 7/17/17 | — | (848,025 | ) | ||||||||||||||||||||||||
Euro | SCNY | Sell | 4,975,000 | 5,417,427 | 7/17/17 | — | (270,690 | ) | ||||||||||||||||||||||||
Indian Rupee | JPHQ | Buy | 82,107,000 | 1,257,574 | 7/17/17 | 10,426 | — | |||||||||||||||||||||||||
Malaysian Ringgit | JPHQ | Buy | 1,700,000 | 421,094 | 7/17/17 | — | (25,917 | ) | ||||||||||||||||||||||||
Chilean Peso | DBAB | Buy | 1,828,805,000 | 2,766,013 | 7/18/17 | — | (16,935 | ) | ||||||||||||||||||||||||
Chilean Peso | DBAB | Sell | 470,022,000 | 710,110 | 7/18/17 | 3,568 | — | |||||||||||||||||||||||||
Euro | GSCO | Sell | 2,279,000 | 2,427,067 | 7/18/17 | — | (178,752 | ) | ||||||||||||||||||||||||
Euro | JPHQ | Sell | 36,334,000 | 38,692,077 | 7/18/17 | — | (2,852,372 | ) | ||||||||||||||||||||||||
Euro | UBSW | Sell | 599,610 | 638,902 | 7/18/17 | — | (46,694 | ) | ||||||||||||||||||||||||
Chilean Peso | DBAB | Buy | 1,757,372,000 | 2,664,098 | 7/20/17 | — | (22,552 | ) | ||||||||||||||||||||||||
Chilean Peso | DBAB | Sell | 1,525,306,000 | 2,309,845 | 7/20/17 | 17,123 | — | |||||||||||||||||||||||||
Indian Rupee | DBAB | Buy | 491,655,000 | 7,538,906 | 7/20/17 | 51,096 | — | |||||||||||||||||||||||||
Japanese Yen | SCNY | Sell | 707,660,000 | 6,289,752 | 7/20/17 | — | (7,190 | ) | ||||||||||||||||||||||||
Malaysian Ringgit | DBAB | Buy | 11,455,000 | 2,543,408 | EUR | 7/20/17 | — | (246,683 | ) | |||||||||||||||||||||||
Euro | DBAB | Sell | 14,940,282 | 16,124,598 | 7/24/17 | — | (963,939 | ) | ||||||||||||||||||||||||
Euro | JPHQ | Sell | 300,000 | 324,248 | 7/24/17 | — | (18,889 | ) | ||||||||||||||||||||||||
Indian Rupee | JPHQ | Buy | 358,075,000 | 5,488,581 | 7/24/17 | 36,586 | — | |||||||||||||||||||||||||
Japanese Yen | DBAB | Sell | 858,140,000 | 7,511,006 | 7/24/17 | — | (126,352 | ) | ||||||||||||||||||||||||
South Korean Won | HSBK | Sell | 59,965,000,000 | 52,573,207 | 7/24/17 | 201,387 | — | |||||||||||||||||||||||||
| Semiannual Report | TGB-13 |
FRANKLIN TEMPLETON VARIABLE INSURANCE PRODUCTS TRUST
STATEMENT OF INVESTMENTS (UNAUDITED)
Templeton Global Bond VIP Fund (continued)
| Forward Exchange Contracts (continued) | ||||||||||||||
| Currency | Counterparty | a | Type | Quantity | | Contract Amount | * | | Settlement Date | | | Unrealized Appreciation | | | Unrealized Depreciation | | ||||||||||||
| OTC Forward Exchange Contracts (continued) | ||||||||||||||||||||||||||||
Japanese Yen | CITI | Sell | 913,412,000 | 8,748,319 | 7/25/17 | $ | 618,671 | $ | — | |||||||||||||||||||
Japanese Yen | JPHQ | Sell | 1,407,000,000 | 12,522,306 | 7/25/17 | — | (427 | ) | ||||||||||||||||||||
Euro | GSCO | Sell | 4,711,000 | 5,155,907 | 7/27/17 | — | (233,393 | ) | ||||||||||||||||||||
Indian Rupee | DBAB | Buy | 838,950,988 | 12,933,282 | 7/27/17 | 7,202 | — | |||||||||||||||||||||
Japanese Yen | GSCO | Sell | 944,420,000 | 8,401,977 | 7/27/17 | — | (4,426 | ) | ||||||||||||||||||||
Japanese Yen | JPHQ | Sell | 490,100,000 | 4,363,232 | 7/27/17 | 789 | — | |||||||||||||||||||||
Indian Rupee | HSBK | Buy | 679,529,000 | 10,403,874 | 7/28/17 | 76,324 | — | |||||||||||||||||||||
Euro | BOFA | Sell | 65,140,400 | 71,214,091 | 7/31/17 | — | (3,321,640 | ) | ||||||||||||||||||||
Euro | CITI | Sell | 132,315,770 | 144,734,267 | 7/31/17 | — | (6,665,672 | ) | ||||||||||||||||||||
Euro | DBAB | Sell | 27,189,556 | 29,742,927 | 7/31/17 | — | (1,368,233 | ) | ||||||||||||||||||||
Indonesian Rupiah | HSBK | Buy | 424,000,000,000 | 30,372,493 | 7/31/17 | 1,328,363 | — | |||||||||||||||||||||
Japanese Yen | BZWS | Sell | 1,079,470,000 | 10,393,060 | 7/31/17 | 782,844 | — | |||||||||||||||||||||
Japanese Yen | DBAB | Sell | 897,860,782 | 8,648,745 | 7/31/17 | 655,344 | — | |||||||||||||||||||||
Japanese Yen | HSBK | Sell | 1,162,462,488 | 10,192,569 | 7/31/17 | — | (156,506 | ) | ||||||||||||||||||||
Euro | GSCO | Sell | 41,639,000 | 45,511,427 | 8/02/17 | — | (2,138,000 | ) | ||||||||||||||||||||
Euro | HSBK | Sell | 25,974,891 | 28,384,582 | 8/02/17 | — | (1,339,683 | ) | ||||||||||||||||||||
Euro | JPHQ | Sell | 11,263,000 | 12,293,722 | 8/02/17 | — | (595,048 | ) | ||||||||||||||||||||
South Korean Won | HSBK | Sell | 15,755,000,000 | 13,988,280 | 8/02/17 | 227,493 | — | |||||||||||||||||||||
Euro | BOFA | Sell | 32,701,000 | 35,849,125 | 8/03/17 | — | (1,574,002 | ) | ||||||||||||||||||||
Euro | DBAB | Sell | 12,156,556 | 13,361,271 | 8/08/17 | — | (554,199 | ) | ||||||||||||||||||||
Euro | GSCO | Sell | 2,045,000 | 2,248,477 | 8/08/17 | — | (92,410 | ) | ||||||||||||||||||||
Indian Rupee | DBAB | Buy | 497,366,494 | 7,678,371 | 8/08/17 | — | (17,268 | ) | ||||||||||||||||||||
Japanese Yen | SCNY | Sell | 1,720,000,000 | 15,414,742 | 8/08/17 | 97,107 | — | |||||||||||||||||||||
Euro | DBAB | Sell | 13,483,000 | 14,842,356 | 8/09/17 | — | (592,249 | ) | ||||||||||||||||||||
Japanese Yen | JPHQ | Sell | 1,723,960,000 | 15,452,309 | 8/09/17 | 98,787 | — | |||||||||||||||||||||
Euro | GSCO | Sell | 5,023,100 | 5,527,922 | 8/10/17 | — | (222,537 | ) | ||||||||||||||||||||
Euro | HSBK | Sell | 1,800,000 | 1,977,188 | 8/10/17 | — | (83,456 | ) | ||||||||||||||||||||
Japanese Yen | CITI | Sell | 683,420,000 | 6,072,955 | 8/14/17 | — | (14,790 | ) | ||||||||||||||||||||
Euro | BOFA | Sell | 21,007,276 | 22,915,997 | 8/15/17 | — | (1,139,186 | ) | ||||||||||||||||||||
Euro | CITI | Sell | 37,063,039 | 40,440,223 | 8/15/17 | — | (2,000,225 | ) | ||||||||||||||||||||
Euro | DBAB | Sell | 50,881,000 | 55,523,179 | 8/15/17 | — | (2,740,053 | ) | ||||||||||||||||||||
Euro | DBAB | Sell | 5,008,730 | 5,496,340 | 8/16/17 | — | (239,384 | ) | ||||||||||||||||||||
Euro | GSCO | Sell | 3,797,000 | 4,164,018 | 8/16/17 | — | (184,099 | ) | ||||||||||||||||||||
Euro | JPHQ | Sell | 8,370,000 | 9,177,646 | 8/16/17 | — | (407,220 | ) | ||||||||||||||||||||
Euro | SCNY | Sell | 657,000 | 720,749 | 8/16/17 | — | (31,612 | ) | ||||||||||||||||||||
Indian Rupee | DBAB | Buy | 239,338,000 | 3,671,673 | 8/16/17 | 11,602 | — | |||||||||||||||||||||
Indian Rupee | HSBK | Buy | 402,232,000 | 6,176,781 | 8/16/17 | 13,340 | — | |||||||||||||||||||||
Japanese Yen | GSCO | Sell | 1,205,250,280 | 10,719,148 | 8/16/17 | — | (17,809 | ) | ||||||||||||||||||||
Japanese Yen | JPHQ | Sell | 2,553,380,000 | 22,702,462 | 8/16/17 | — | (44,290 | ) | ||||||||||||||||||||
Euro | BOFA | Sell | 561,829 | 619,063 | 8/17/17 | — | (24,345 | ) | ||||||||||||||||||||
Euro | GSCO | Sell | 3,095,000 | 3,409,916 | 8/17/17 | — | (134,485 | ) | ||||||||||||||||||||
South Korean Won | HSBK | Sell | 75,818,000,000 | 67,191,593 | 8/17/17 | 947,228 | — | |||||||||||||||||||||
Indian Rupee | JPHQ | Buy | 378,455,000 | 5,854,811 | 8/18/17 | — | (31,919 | ) | ||||||||||||||||||||
Japanese Yen | DBAB | Sell | 838,612,000 | 8,491,414 | 8/18/17 | 1,020,044 | — | |||||||||||||||||||||
Euro | JPHQ | Sell | 11,580,291 | 12,928,295 | 8/21/17 | — | (336,130 | ) | ||||||||||||||||||||
Euro | DBAB | Sell | 9,037,398 | 10,096,192 | 8/22/17 | — | (256,040 | ) | ||||||||||||||||||||
Euro | HSBK | Sell | 19,488,000 | 21,771,701 | 8/22/17 | — | (551,572 | ) | ||||||||||||||||||||
Euro | UBSW | Sell | 3,245,000 | 3,625,801 | 8/22/17 | — | (91,308 | ) | ||||||||||||||||||||
Japanese Yen | HSBK | Sell | 1,621,372,000 | 16,443,935 | 8/22/17 | 1,996,453 | — | |||||||||||||||||||||
| TGB-14 | Semiannual Report |
FRANKLIN TEMPLETON VARIABLE INSURANCE PRODUCTS TRUST
STATEMENT OF INVESTMENTS (UNAUDITED)
Templeton Global Bond VIP Fund (continued)
| Forward Exchange Contracts (continued) | ||||||||||||||||||||||||||||
| Currency | Counterpartya | Type | Quantity | Contract Amount* | Settlement Date | Unrealized Appreciation | Unrealized Depreciation | |||||||||||||||||||||
| OTC Forward Exchange Contracts (continued) | ||||||||||||||||||||||||||||
Japanese Yen | JPHQ | Sell | 1,135,828,000 | 11,520,313 | 8/22/17 | $ | 1,399,345 | $ | — | |||||||||||||||||||
Euro | DBAB | Sell | 3,887,000 | 4,372,020 | 8/23/17 | — | (80,715 | ) | ||||||||||||||||||||
Euro | JPHQ | Sell | 28,236,000 | 31,754,488 | 8/23/17 | — | (591,130 | ) | ||||||||||||||||||||
Euro | UBSW | Sell | 678,250 | 761,919 | 8/23/17 | — | (15,047 | ) | ||||||||||||||||||||
Euro | BZWS | Sell | 7,066,000 | 7,982,778 | 8/24/17 | — | (112,049 | ) | ||||||||||||||||||||
Japanese Yen | BZWS | Sell | 376,247,000 | 3,809,267 | 8/24/17 | 456,389 | — | |||||||||||||||||||||
Japanese Yen | DBAB | Sell | 371,821,000 | 3,769,933 | 8/24/17 | 456,497 | — | |||||||||||||||||||||
Euro | GSCO | Sell | 4,454,000 | 5,006,964 | 8/28/17 | — | (96,568 | ) | ||||||||||||||||||||
Euro | JPHQ | Sell | 4,730,771 | 5,319,397 | 8/28/17 | — | (101,268 | ) | ||||||||||||||||||||
Indian Rupee | JPHQ | Buy | 139,661,000 | 2,133,532 | 8/28/17 | 12,864 | — | |||||||||||||||||||||
Japanese Yen | BZWS | Sell | 343,460,000 | 3,071,412 | 8/28/17 | 10,215 | — | |||||||||||||||||||||
Japanese Yen | JPHQ | Sell | 1,135,833,000 | 11,497,158 | 8/28/17 | 1,373,684 | — | |||||||||||||||||||||
Euro | BOFA | Sell | 2,680,925 | 3,014,164 | 8/30/17 | — | (58,048 | ) | ||||||||||||||||||||
Euro | BZWS | Sell | 744,197 | 836,998 | 8/30/17 | — | (15,816 | ) | ||||||||||||||||||||
Euro | DBAB | Sell | 837,570 | 942,132 | 8/30/17 | — | (17,683 | ) | ||||||||||||||||||||
Euro | SCNY | Sell | 13,581,483 | 15,259,203 | 8/30/17 | — | (304,527 | ) | ||||||||||||||||||||
Japanese Yen | DBAB | Sell | 685,950,000 | 6,961,027 | 8/30/17 | 846,733 | — | |||||||||||||||||||||
Japanese Yen | JPHQ | Sell | 751,903,000 | 7,614,979 | 8/30/17 | 912,806 | — | |||||||||||||||||||||
Euro | BOFA | Sell | 2,694,506 | 3,029,433 | 8/31/17 | — | (58,514 | ) | ||||||||||||||||||||
Euro | DBAB | Sell | 1,530,900 | 1,722,002 | 8/31/17 | — | (32,434 | ) | ||||||||||||||||||||
Euro | SCNY | Sell | 11,263,000 | 12,654,375 | 8/31/17 | — | (253,204 | ) | ||||||||||||||||||||
Japanese Yen | BZWS | Sell | 1,576,550,000 | 14,158,764 | 8/31/17 | 105,323 | — | |||||||||||||||||||||
Japanese Yen | DBAB | Sell | 229,660,000 | 2,065,474 | 9/01/17 | 18,174 | — | |||||||||||||||||||||
Japanese Yen | HSBK | Sell | 1,247,125,000 | 12,384,558 | 9/01/17 | 1,267,088 | — | |||||||||||||||||||||
South Korean Won | HSBK | Sell | 42,561,000,000 | 38,058,660 | 9/05/17 | 857,699 | — | |||||||||||||||||||||
Euro | UBSW | Sell | 8,311,299 | 9,361,224 | 9/06/17 | — | (166,841 | ) | ||||||||||||||||||||
Euro | UBSW | Sell | 6,231,299 | 7,039,685 | 9/07/17 | — | (104,268 | ) | ||||||||||||||||||||
South Korean Won | GSCO | Sell | 44,346,000,000 | 39,173,181 | 9/07/17 | 410,890 | — | |||||||||||||||||||||
Euro | BOFA | Sell | 11,879,864 | 13,440,284 | 9/08/17 | — | (180,298 | ) | ||||||||||||||||||||
Euro | BZWS | Sell | 7,003,000 | 7,891,597 | 9/08/17 | — | (137,530 | ) | ||||||||||||||||||||
Japanese Yen | BZWS | Sell | 1,712,605,900 | 15,146,221 | 9/11/17 | — | (128,193 | ) | ||||||||||||||||||||
Japanese Yen | DBAB | Sell | 595,700,000 | 5,238,572 | 9/13/17 | — | (74,883 | ) | ||||||||||||||||||||
Euro | MSCO | Sell | 13,171,500 | 14,848,891 | 9/14/17 | — | (257,636 | ) | ||||||||||||||||||||
Indian Rupee | DBAB | Buy | 258,123,000 | 3,974,792 | 9/14/17 | — | (15,061 | ) | ||||||||||||||||||||
Euro | BOFA | Sell | 17,769,000 | 20,032,771 | 9/15/17 | — | (347,811 | ) | ||||||||||||||||||||
Euro | HSBK | Sell | 8,692,000 | 9,785,845 | 9/15/17 | — | (183,653 | ) | ||||||||||||||||||||
Euro | JPHQ | Sell | 5,636,000 | 6,353,012 | 9/15/17 | — | (111,334 | ) | ||||||||||||||||||||
Euro | JPHQ | Sell | 17,833,294 | 20,162,322 | 9/18/17 | — | (295,423 | ) | ||||||||||||||||||||
Euro | MSCO | Sell | 17,573,000 | 19,894,393 | 9/18/17 | — | (264,751 | ) | ||||||||||||||||||||
Euro | JPHQ | Sell | 11,580,290 | 12,979,884 | 9/19/17 | — | (305,369 | ) | ||||||||||||||||||||
Euro | UBSW | Sell | 11,641,500 | 13,058,503 | 9/19/17 | — | (296,972 | ) | ||||||||||||||||||||
Japanese Yen | CITI | Sell | 286,112,008 | 2,830,200 | 9/19/17 | 277,427 | — | |||||||||||||||||||||
South Korean Won | CITI | Sell | 11,790,000,000 | 10,294,937 | 9/20/17 | — | (12,508 | ) | ||||||||||||||||||||
South Korean Won | HSBK | Sell | 7,007,000,000 | 6,113,244 | 9/20/17 | — | (12,649 | ) | ||||||||||||||||||||
Japanese Yen | BZWS | Sell | 981,707,504 | 8,774,372 | 9/21/17 | 14,446 | — | |||||||||||||||||||||
Japanese Yen | BZWS | Sell | 983,714,840 | 8,925,700 | 9/25/17 | 146,154 | — | |||||||||||||||||||||
Japanese Yen | MSCO | Sell | 575,230,000 | 5,156,424 | 9/25/17 | 22,559 | — | |||||||||||||||||||||
South Korean Won | HSBK | Sell | 70,417,000,000 | 62,917,262 | 9/27/17 | 1,348,692 | — | |||||||||||||||||||||
Euro | BZWS | Sell | 44,246,134 | 50,550,544 | 9/29/17 | — | (238,323 | ) | ||||||||||||||||||||
| Semiannual Report | TGB-15 |
FRANKLIN TEMPLETON VARIABLE INSURANCE PRODUCTS TRUST
STATEMENT OF INVESTMENTS (UNAUDITED)
Templeton Global Bond VIP Fund (continued)
Forward Exchange Contracts (continued)
| ||||||||||||||||||||||||||||
| Currency | Counterpartya | Type | Quantity | Contract Amount* | Settlement Date | Unrealized Appreciation | Unrealized Depreciation | |||||||||||||||||||||
| OTC Forward Exchange Contracts (continued) | ||||||||||||||||||||||||||||
Japanese Yen | JPHQ | Sell | 172,207,000 | 1,562,918 | 9/29/17 | $ | 25,686 | $ | — | |||||||||||||||||||
Euro | GSCO | Sell | 463,000 | 530,621 | 10/03/17 | — | (965 | ) | ||||||||||||||||||||
Euro | DBAB | Sell | 2,579,651 | 2,959,634 | 10/05/17 | — | (2,492 | ) | ||||||||||||||||||||
Euro | HSBK | Sell | 18,537,726 | 21,260,177 | 10/05/17 | — | (26,061 | ) | ||||||||||||||||||||
Australian Dollar | GSCO | Sell | 127,700,540 | 96,694,849 | 10/06/17 | — | (1,357,952 | ) | ||||||||||||||||||||
Japanese Yen | JPHQ | Sell | 2,831,950,000 | 26,823,030 | 10/10/17 | 1,528,820 | — | |||||||||||||||||||||
Japanese Yen | HSBK | Sell | 2,816,800,000 | 25,607,273 | 10/11/17 | 447,077 | — | |||||||||||||||||||||
Japanese Yen | SCNY | Sell | 415,980,000 | 3,769,403 | 10/12/17 | 53,598 | — | |||||||||||||||||||||
South Korean Won | CITI | Sell | 8,844,000,000 | 7,907,018 | 10/16/17 | 171,516 | — | |||||||||||||||||||||
South Korean Won | HSBK | Sell | 5,991,000,000 | 5,246,519 | 10/18/17 | 6,221 | — | |||||||||||||||||||||
Japanese Yen | JPHQ | Sell | 1,886,055,000 | 17,471,723 | 10/20/17 | 617,278 | — | |||||||||||||||||||||
Japanese Yen | BZWS | Sell | 735,200,000 | 6,799,286 | 10/24/17 | 227,923 | — | |||||||||||||||||||||
Indian Rupee | DBAB | Buy | 79,271,000 | 1,200,894 | 10/25/17 | 9,665 | — | |||||||||||||||||||||
Indian Rupee | JPHQ | Buy | 60,607,000 | 926,146 | 11/02/17 | — | (1,437 | ) | ||||||||||||||||||||
Indian Rupee | HSBK | Buy | 240,033,500 | 3,665,753 | 11/08/17 | — | (5,906 | ) | ||||||||||||||||||||
Japanese Yen | CITI | Sell | 341,992,119 | 3,332,412 | 11/09/17 | 273,087 | — | |||||||||||||||||||||
Japanese Yen | CITI | Sell | 683,420,000 | 6,102,782 | 11/14/17 | — | (12,404 | ) | ||||||||||||||||||||
Japanese Yen | CITI | Sell | 796,524,000 | 7,765,057 | 11/14/17 | 637,826 | — | |||||||||||||||||||||
Japanese Yen | JPHQ | Sell | 335,950,000 | 3,280,714 | 11/14/17 | 274,661 | — | |||||||||||||||||||||
Australian Dollar | JPHQ | Sell | 100,287,000 | 73,924,556 | 11/15/17 | — | (3,040,537 | ) | ||||||||||||||||||||
Japanese Yen | GSCO | Sell | 490,555,000 | 4,335,555 | 11/15/17 | — | (54,118 | ) | ||||||||||||||||||||
South Korean Won | CITI | Sell | 11,823,000,000 | 10,443,424 | 11/15/17 | 96,272 | — | |||||||||||||||||||||
Japanese Yen | CITI | Sell | 366,680,000 | 3,461,825 | 11/16/17 | 180,463 | — | |||||||||||||||||||||
Japanese Yen | JPHQ | Sell | 355,193,000 | 3,171,904 | 11/16/17 | — | (6,663 | ) | ||||||||||||||||||||
Japanese Yen | SCNY | Sell | 340,600,700 | 3,028,423 | 11/16/17 | — | (19,559 | ) | ||||||||||||||||||||
South Korean Won | CITI | Sell | 13,902,000,000 | 12,289,604 | 11/16/17 | 122,735 | — | |||||||||||||||||||||
Japanese Yen | CITI | Sell | 1,599,308,500 | 14,209,129 | 11/20/17 | — | (105,799 | ) | ||||||||||||||||||||
Japanese Yen | DBAB | Sell | 796,770,000 | 7,427,429 | 11/21/17 | 295,412 | — | |||||||||||||||||||||
Japanese Yen | HSBK | Sell | 207,909,000 | 1,886,652 | 11/27/17 | 25,046 | — | |||||||||||||||||||||
Japanese Yen | SCNY | Sell | 937,086,000 | 8,601,459 | 11/27/17 | 210,843 | — | |||||||||||||||||||||
South Korean Won | HSBK | Sell | 35,277,000,000 | 31,549,434 | 11/27/17 | 668,806 | — | |||||||||||||||||||||
Japanese Yen | CITI | Sell | 1,370,500,000 | 12,634,422 | 12/08/17 | 356,042 | — | |||||||||||||||||||||
Japanese Yen | HSBK | Sell | 2,052,400,000 | 18,916,129 | 12/11/17 | 525,711 | — | |||||||||||||||||||||
Japanese Yen | CITI | Sell | 2,595,800,000 | 23,180,822 | 12/12/17 | — | (79,909 | ) | ||||||||||||||||||||
Japanese Yen | CITI | Sell | 310,702,000 | 2,836,101 | 12/13/17 | 51,784 | — | |||||||||||||||||||||
Japanese Yen | HSBK | Sell | 1,798,900,000 | 16,460,856 | 12/13/17 | 340,239 | — | |||||||||||||||||||||
Japanese Yen | JPHQ | Sell | 1,666,680,000 | 14,772,782 | 12/13/17 | — | (162,962 | ) | ||||||||||||||||||||
Japanese Yen | JPHQ | Sell | 702,800,000 | 6,446,731 | 12/18/17 | 147,043 | — | |||||||||||||||||||||
Japanese Yen | MSCO | Sell | 300,000,000 | 2,764,467 | 12/18/17 | 75,358 | — | |||||||||||||||||||||
Indian Rupee | CITI | Buy | 69,318,000 | 1,055,711 | 12/19/17 | — | (3,627 | ) | ||||||||||||||||||||
South Korean Won | DBAB | Sell | 13,919,000,000 | 12,493,493 | 12/20/17 | 303,685 | — | |||||||||||||||||||||
Japanese Yen | JPHQ | Sell | 652,895,000 | 5,869,722 | 1/22/18 | 6,720 | — | |||||||||||||||||||||
Japanese Yen | DBAB | Sell | 8,368,505,770 | 74,632,175 | 1/30/18 | — | (548,330 | ) | ||||||||||||||||||||
Japanese Yen | JPHQ | Sell | 1,719,500,000 | 15,617,408 | 2/08/18 | 162,628 | — | |||||||||||||||||||||
Japanese Yen | BZWS | Sell | 1,720,220,000 | 15,584,526 | 2/09/18 | 122,471 | — | |||||||||||||||||||||
Japanese Yen | CITI | Sell | 366,860,000 | 3,327,951 | 2/09/18 | 30,460 | — | |||||||||||||||||||||
Japanese Yen | CITI | Sell | 751,731,000 | 6,848,081 | 2/13/18 | 89,803 | — | |||||||||||||||||||||
Japanese Yen | CITI | Sell | 689,390,000 | 6,190,226 | 2/14/18 | — | (7,912 | ) | ||||||||||||||||||||
Japanese Yen | HSBK | Sell | 1,035,240,000 | 9,301,348 | 2/16/18 | — | (7,212 | ) | ||||||||||||||||||||
| TGB-16 | Semiannual Report |
FRANKLIN TEMPLETON VARIABLE INSURANCE PRODUCTS TRUST
STATEMENT OF INVESTMENTS (UNAUDITED)
Templeton Global Bond VIP Fund (continued)
| Forward Exchange Contracts (continued) | ||||||||||||||||||||||||||||
| Currency | Counterpartya | Type | Quantity | Contract Amount* | Settlement Date | Unrealized Appreciation | Unrealized Depreciation | |||||||||||||||||||||
| OTC Forward Exchange Contracts (continued) | ||||||||||||||||||||||||||||
Japanese Yen | JPHQ | Sell | 353,873,000 | 3,171,900 | 2/16/18 | $ | — | $ | (10,017 | ) | ||||||||||||||||||
Australian Dollar | CITI | Sell | 13,307,000 | 9,828,949 | 2/22/18 | — | (371,183 | ) | ||||||||||||||||||||
Japanese Yen | HSBK | Sell | 1,131,678,000 | 10,236,798 | 2/27/18 | 55,268 | — | |||||||||||||||||||||
Japanese Yen | JPHQ | Sell | 372,662,000 | 3,380,798 | 2/28/18 | 27,842 | — | |||||||||||||||||||||
Japanese Yen | JPHQ | Sell | 848,300,000 | 7,604,764 | 3/05/18 | — | (29,645 | ) | ||||||||||||||||||||
Japanese Yen | HSBK | Sell | 400,800,000 | 3,571,238 | 3/06/18 | — | (36,012 | ) | ||||||||||||||||||||
Australian Dollar | CITI | Sell | 58,003,000 | 43,076,218 | 3/13/18 | — | (1,374,415 | ) | ||||||||||||||||||||
Australian Dollar | JPHQ | Sell | 86,973,000 | 64,360,020 | 3/13/18 | — | (2,291,789 | ) | ||||||||||||||||||||
Japanese Yen | DBAB | Sell | 725,287,000 | 6,565,228 | 3/22/18 | 32,108 | — | |||||||||||||||||||||
Japanese Yen | CITI | Sell | 1,866,452,000 | 16,883,711 | 3/23/18 | 70,517 | — | |||||||||||||||||||||
Japanese Yen | JPHQ | Sell | 285,510,329 | 2,618,244 | 3/26/18 | 45,935 | — | |||||||||||||||||||||
Japanese Yen | CITI | Sell | 261,800,000 | 2,410,348 | 4/13/18 | 49,288 | — | |||||||||||||||||||||
Japanese Yen | DBAB | Sell | 1,406,600,000 | 12,955,816 | 4/13/18 | 270,300 | — | |||||||||||||||||||||
Japanese Yen | BOFA | Sell | 700,840,000 | 6,454,774 | 4/18/18 | 132,430 | — | |||||||||||||||||||||
Japanese Yen | JPHQ | Sell | 917,650,000 | 8,567,961 | 4/23/18 | 287,432 | — | |||||||||||||||||||||
Indonesian Rupiah | JPHQ | Buy | 1,721,000,000,000 | 123,991,354 | 5/03/18 | 487,022 | — | |||||||||||||||||||||
Japanese Yen | HSBK | Sell | 413,563,000 | 3,697,479 | 5/15/18 | — | (38,967 | ) | ||||||||||||||||||||
Japanese Yen | SCNY | Sell | 366,681,000 | 3,274,551 | 5/15/18 | — | (38,327 | ) | ||||||||||||||||||||
Japanese Yen | BOFA | Sell | 1,105,661,700 | 9,924,259 | 5/18/18 | — | (66,821 | ) | ||||||||||||||||||||
Japanese Yen | CITI | Sell | 1,599,298,500 | 14,346,508 | 5/18/18 | — | (105,218 | ) | ||||||||||||||||||||
South Korean Won | DBAB | Sell | 13,920,000,000 | 12,530,381 | 5/18/18 | 304,864 | — | |||||||||||||||||||||
Japanese Yen | BOFA | Sell | 1,102,846,375 | 10,045,282 | 5/21/18 | 77,962 | — | |||||||||||||||||||||
Japanese Yen | HSBK | Sell | 1,106,730,400 | 10,102,514 | 5/21/18 | 100,091 | — | |||||||||||||||||||||
Japanese Yen | BOFA | Sell | 1,105,842,500 | 10,134,187 | 5/22/18 | 139,228 | — | |||||||||||||||||||||
Japanese Yen | JPHQ | Sell | 715,709,000 | 6,559,067 | 5/22/18 | 90,260 | — | |||||||||||||||||||||
Japanese Yen | BOFA | Sell | 1,085,075,000 | 9,936,584 | 5/25/18 | 127,676 | — | |||||||||||||||||||||
Japanese Yen | HSBK | Sell | 1,455,540,000 | 13,558,826 | 6/18/18 | 383,209 | — | |||||||||||||||||||||
Japanese Yen | DBAB | Sell | 1,453,310,000 | 13,399,996 | 6/19/18 | 243,826 | — | |||||||||||||||||||||
Japanese Yen | CITI | Sell | 1,086,780,000 | 9,949,464 | 6/20/18 | 110,774 | — | |||||||||||||||||||||
Japanese Yen | DBAB | Sell | 1,455,820,000 | 13,275,761 | 6/22/18 | 94,644 | — | |||||||||||||||||||||
|
| |||||||||||||||||||||||||||
Total Forward Exchange Contracts |
| $ | 30,418,172 | $ | (60,187,073 | ) | ||||||||||||||||||||||
|
| |||||||||||||||||||||||||||
Net unrealized appreciation (depreciation) |
| $ | (29,768,901 | ) | ||||||||||||||||||||||||
|
| |||||||||||||||||||||||||||
*In U.S. dollars unless otherwise indicated.
aMay be comprised of multiple contracts with the same counterparty, currency and settlement date.
At June 30, 2017, the Fund had the following interest rate swap contracts outstanding. See Note 1(c).
| Interest Rate Swap Contracts | ||||||||||||||||||||
| Description | Counterparty/ Exchange | Notional Amount | Expiration Date | Unrealized Appreciation | Unrealized Depreciation | |||||||||||||||
| Centrally Cleared Swap Contracts | ||||||||||||||||||||
Receive Floating rate 3-month USD BBA LIBOR | LCH | $ | 183,490,000 | 10/17/17 | $ | 309,262 | $ | — | ||||||||||||
Receive Floating rate 3-month USD BBA LIBOR | LCH | 3,240,000 | 3/04/21 | — | (234,643 | ) | ||||||||||||||
| Semiannual Report | TGB-17 |
FRANKLIN TEMPLETON VARIABLE INSURANCE PRODUCTS TRUST
STATEMENT OF INVESTMENTS (UNAUDITED)
Templeton Global Bond VIP Fund (continued)
| Interest Rate Swap Contracts (continued) | ||||||||||||||||||||
| Description | Counterparty/ Exchange | Notional Amount | Expiration Date | Unrealized Appreciation | Unrealized Depreciation | |||||||||||||||
| Centrally Cleared Swap Contracts (continued) | ||||||||||||||||||||
Receive Floating rate 3-month USD BBA LIBOR | CME | $ | 13,090,000 | 10/04/23 | $ | — | $ | (607,053 | ) | |||||||||||
Receive Floating rate 3-month USD BBA LIBOR | CME | 13,090,000 | 10/04/23 | — | (623,186 | ) | ||||||||||||||
Receive Floating rate 3-month USD BBA LIBOR | CME | 13,090,000 | 10/07/23 | — | (597,606 | ) | ||||||||||||||
Receive Floating rate 3-month USD BBA LIBOR | LCH | 34,000,000 | 7/07/24 | — | (1,734,742 | ) | ||||||||||||||
Receive Floating rate 3-month USD BBA LIBOR | LCH | 114,670,000 | 1/22/25 | 1,176,630 | — | |||||||||||||||
Receive Floating rate 3-month USD BBA LIBOR | LCH | 143,340,000 | 1/23/25 | 877,886 | — | |||||||||||||||
Receive Floating rate 3-month USD BBA LIBOR | LCH | 84,590,000 | 1/27/25 | 514,012 | — | |||||||||||||||
Receive Floating rate 3-month USD BBA LIBOR | LCH | 21,150,000 | 1/29/25 | 186,432 | — | |||||||||||||||
Receive Floating rate 3-month USD BBA LIBOR | LCH | 17,910,000 | 1/30/25 | 154,196 | — | |||||||||||||||
Receive Floating rate 3-month USD BBA LIBOR | LCH | 28,210,000 | 2/03/25 | 508,953 | — | |||||||||||||||
Receive Floating rate 3-month USD BBA LIBOR | LCH | 7,460,000 | 2/25/41 | — | (2,636,609 | ) | ||||||||||||||
Receive Floating rate 3-month USD BBA LIBOR | LCH | 5,600,000 | 2/28/41 | — | (1,956,958 | ) | ||||||||||||||
Receive Floating rate 3-month USD BBA LIBOR | LCH | 1,870,000 | 3/01/41 | — | (643,132 | ) | ||||||||||||||
Receive Floating rate 3-month USD BBA LIBOR | CME | 6,370,000 | 10/04/43 | — | (1,496,086 | ) | ||||||||||||||
Receive Floating rate 3-month USD BBA LIBOR | CME | 6,370,000 | 10/04/43 | — | (1,520,067 | ) | ||||||||||||||
Receive Floating rate 3-month USD BBA LIBOR | CME | 6,370,000 | 10/07/43 | — | (1,504,005 | ) | ||||||||||||||
Receive Floating rate 3-month USD BBA LIBOR | LCH | 122,400,000 | 11/18/46 | 3,904,246 | — | |||||||||||||||
Receive Floating rate 3-month USD BBA LIBOR | LCH | 72,700,000 | 4/13/47 | — | (298,454 | ) | ||||||||||||||
|
| |||||||||||||||||||
Total Centrally Cleared Swap Contracts |
| 7,631,617 | (13,852,541 | ) | ||||||||||||||||
|
| |||||||||||||||||||
| OTC Swap Contracts | ||||||||||||||||||||
Receive Floating rate 3-month USD BBA LIBOR | DBAB | 14,630,000 | 3/28/21 | — | (1,031,212 | ) | ||||||||||||||
Receive Floating rate 3-month USD BBA LIBOR | CITI | 7,460,000 | 2/25/41 | — | (2,632,870 | ) | ||||||||||||||
|
| |||||||||||||||||||
Total OTC Swap Contracts |
| — | (3,664,082 | ) | ||||||||||||||||
|
| |||||||||||||||||||
Total Interest Rate Swap Contracts |
| $ | 7,631,617 | $ | (17,516,623 | ) | ||||||||||||||
|
| |||||||||||||||||||
Net unrealized appreciation (depreciation) |
| $ | (9,885,006 | ) | ||||||||||||||||
|
| |||||||||||||||||||
See Abbreviations on page TGB-33.
| TGB-18 | Semiannual Report | The accompanying notes are an integral part of these financial statements. |
FRANKLIN TEMPLETON VARIABLE INSURANCE PRODUCTS TRUST
Financial Statements
Statement of Assets and Liabilities
June 30, 2017 (unaudited)
Templeton Global Bond VIP Fund | ||||
Assets: | ||||
Investments in securities: | ||||
Cost - Unaffiliated issuers | $ | 2,135,757,225 | ||
Cost - Non-controlled affiliates (Note 3e) | 649,035,632 | |||
|
| |||
Total cost of investments | $ | 2,784,792,857 | ||
|
| |||
Value - Unaffiliated issuers | $ | 2,185,190,953 | ||
Value - Non-controlled affiliates (Note 3e) | 649,035,632 | |||
|
| |||
Total value of investments | 2,834,226,585 | |||
Cash | 3,545,995 | |||
Foreign currency, at value (cost $2,140,997) | 2,141,115 | |||
Receivables: | ||||
Investment securities sold | 222,714,664 | |||
Capital shares sold | 1,055,648 | |||
Interest | 39,064,148 | |||
Due from brokers | 89,850,046 | |||
Variation margin | 2,776,215 | |||
Unrealized appreciation on OTC forward exchange contracts | 30,418,172 | |||
Other assets | 2,618 | |||
|
| |||
Total assets | 3,225,795,206 | |||
|
| |||
Liabilities: | ||||
Payables: | ||||
Capital shares redeemed | 1,587,343 | |||
Management fees | 1,018,621 | |||
Distribution fees | 1,231,158 | |||
Unrealized depreciation on OTC forward exchange contracts | 60,187,073 | |||
Unrealized depreciation on OTC swap contracts | 3,664,082 | |||
Deferred tax | 3,624,531 | |||
Accrued expenses and other liabilities | 1,370,847 | |||
|
| |||
Total liabilities | 72,683,655 | |||
|
| |||
Net assets, at value | $ | 3,153,111,551 | ||
|
| |||
Net assets consist of: | ||||
Paid-in capital | $ | 3,260,804,810 | ||
Accumulated net investment loss | (98,467,306 | ) | ||
Net unrealized appreciation (depreciation) | 3,934,955 | |||
Accumulated net realized gain (loss) | (13,160,908 | ) | ||
|
| |||
Net assets, at value | $ | 3,153,111,551 | ||
|
| |||
| The accompanying notes are an integral part of these financial statements. | Semiannual Report | TGB-19 |
FRANKLIN TEMPLETON VARIABLE INSURANCE PRODUCTS TRUST
FINANCIAL STATEMENTS
Statement of Assets and Liabilities (continued)
June 30, 2017 (unaudited)
Templeton Global Bond VIP Fund | ||||
| Class 1: | ||||
Net assets, at value | $ | 261,769,950 | ||
|
| |||
Shares outstanding | 15,121,957 | |||
|
| |||
Net asset value and maximum offering price per share | $ | 17.31 | ||
|
| |||
| Class 2: | ||||
Net assets, at value | $ | 2,793,645,038 | ||
|
| |||
Shares outstanding | 167,594,737 | |||
|
| |||
Net asset value and maximum offering price per share | $ | 16.67 | ||
|
| |||
| Class 4: | ||||
Net assets, at value | $ | 97,696,563 | ||
|
| |||
Shares outstanding | 5,730,732 | |||
|
| |||
Net asset value and maximum offering price per share | $ | 17.05 | ||
|
| |||
| TGB-20 | Semiannual Report | The accompanying notes are an integral part of these financial statements. |
FRANKLIN TEMPLETON VARIABLE INSURANCE PRODUCTS TRUST
FINANCIAL STATEMENTS
Statement of Operations
for the six months ended June 30, 2017 (unaudited)
Templeton Global Bond VIP Fund | ||||
Investment income: | ||||
Dividends from non-controlled affiliates (Note 3e) | $ | 934,011 | ||
Interest | 81,802,497 | |||
|
| |||
Total investment income | 82,736,508 | |||
|
| |||
Expenses: | ||||
Management fees (Note 3a) | 7,194,718 | |||
Distribution fees: (Note 3c) | ||||
Class 2 | 3,491,466 | |||
Class 4 | 169,806 | |||
Custodian fees (Note 4) | 671,882 | |||
Reports to shareholders | 203,187 | |||
Professional fees | 61,095 | |||
Trustees’ fees and expenses | 7,489 | |||
Other | 130,825 | |||
|
| |||
Total expenses | 11,930,468 | |||
Expense reductions (Note 4) | (54,000 | ) | ||
Expenses waived/paid by affiliates (Note 3e) | (1,051,101 | ) | ||
|
| |||
Net expenses | 10,825,367 | |||
|
| |||
Net investment income | 71,911,141 | |||
|
| |||
Realized and unrealized gains (losses): | ||||
Net realized gain (loss) from: | ||||
Investments | (33,258,771 | ) | ||
Foreign currency transactions | 24,437,019 | |||
Swap contracts | (4,330,467 | ) | ||
|
| |||
Net realized gain (loss) | (13,152,219 | ) | ||
|
| |||
Net change in unrealized appreciation (depreciation) on: | ||||
Investments | 195,163,320 | |||
Translation of other assets and liabilities denominated in foreign currencies | (156,948,648 | ) | ||
Swap contracts | (4,874,179 | ) | ||
Change in deferred taxes on unrealized appreciation | (967,005 | ) | ||
|
| |||
Net change in unrealized appreciation (depreciation) | 32,373,488 | |||
|
| |||
Net realized and unrealized gain (loss) | 19,221,269 | |||
|
| |||
Net increase (decrease) in net assets resulting from operations | $ | 91,132,410 | ||
|
| |||
| The accompanying notes are an integral part of these financial statements. | Semiannual Report | TGB-21 |
FRANKLIN TEMPLETON VARIABLE INSURANCE PRODUCTS TRUST
FINANCIAL STATEMENTS
Statements of Changes in Net Assets
| Templeton Global Bond VIP Fund | ||||||||
| Six Months Ended June 30, 2017 (unaudited) | Year Ended December 31, 2016 | |||||||
Increase (decrease) in net assets: | ||||||||
Operations: | ||||||||
Net investment income | $ | 71,911,141 | $ | 116,633,475 | ||||
Net realized gain (loss) | (13,152,219 | ) | (287,949,944 | ) | ||||
Net change in unrealized appreciation (depreciation) | 32,373,488 | 258,515,773 | ||||||
|
| |||||||
Net increase (decrease) in net assets resulting from operations | 91,132,410 | 87,199,304 | ||||||
|
| |||||||
Distributions to shareholders from: | ||||||||
Net realized gains: | ||||||||
Class 1 | (806,829 | ) | (230,624 | ) | ||||
Class 2 | (8,999,053 | ) | (2,445,769 | ) | ||||
Class 4 | (307,109 | ) | (81,295 | ) | ||||
|
| |||||||
Total distributions to shareholders | (10,112,991 | ) | (2,757,688 | ) | ||||
|
| |||||||
Capital share transactions: (Note 2) | ||||||||
Class 1 | 13,688,252 | (58,117,212 | ) | |||||
Class 2 | (91,174,504 | ) | (233,957,681 | ) | ||||
Class 4 | (1,546,222 | ) | (8,756,905 | ) | ||||
|
| |||||||
Total capital share transactions | (79,032,474 | ) | (300,831,798 | ) | ||||
|
| |||||||
Net increase (decrease) in net assets. | 1,986,945 | (216,390,182 | ) | |||||
Net assets: | ||||||||
Beginning of period | 3,151,124,606 | 3,367,514,788 | ||||||
|
| |||||||
End of period | $ | 3,153,111,551 | $ | 3,151,124,606 | ||||
|
| |||||||
Accumulated net investment loss included in net assets: | ||||||||
End of period | $ | (98,467,306 | ) | $ | (170,378,447 | ) | ||
|
| |||||||
| TGB-22 | Semiannual Report | The accompanying notes are an integral part of these financial statements. |
FRANKLIN TEMPLETON VARIABLE INSURANCE PRODUCTS TRUST
Notes to Financial Statements (unaudited)
Templeton Global Bond VIP Fund
1. Organization and Significant Accounting Policies
Franklin Templeton Variable Insurance Products Trust (Trust) is registered under the Investment Company Act of 1940 (1940 Act) as an open-end management investment company, consisting of eighteen separate funds and applies the specialized accounting and reporting guidance in U.S. Generally Accepted Accounting Principles (U.S. GAAP). Templeton Global Bond VIP Fund (Fund) is included in this report. Shares of the Fund are generally sold only to insurance company separate accounts to fund the benefits of variable life insurance policies or variable annuity contracts. The Fund offers three classes of shares: Class 1, Class 2 and Class 4. Each class of shares may differ by its distribution fees, voting rights on matters affecting a single class and its exchange privilege.
The following summarizes the Fund’s significant accounting policies.
a. Financial Instrument Valuation
The Fund’s investments in financial instruments are carried at fair value daily. Fair value is the price that would be received to sell an asset or paid to transfer a liability in an orderly transaction between market participants on the measurement date. The Fund calculates the net asset value (NAV) per share as of 4 p.m. Eastern time each day the New York Stock Exchange (NYSE) is open for trading. Under compliance policies and procedures approved by the Trust’s Board of Trustees (the Board), the Fund’s administrator has responsibility for oversight of valuation, including leading the cross-functional Valuation Committee (VC). The VC provides administration and oversight of the Fund’s valuation policies and procedures, which are approved annually by the Board. Among other things, these procedures allow the Fund to utilize independent pricing services, quotations from securities and financial instrument dealers, and other market sources to determine fair value.
Debt securities generally trade in the over-the-counter (OTC) market rather than on a securities exchange. The Fund’s pricing services use multiple valuation techniques to determine fair value. In instances where sufficient market activity exists, the pricing services may utilize a market-based approach through which quotes from market makers are used to determine fair value. In instances where sufficient market activity may not exist or is limited, the pricing services also utilize proprietary valuation models which may consider market characteristics
such as benchmark yield curves, credit spreads, estimated default rates, anticipated market interest rate volatility, coupon rates, anticipated timing of principal repayments, underlying collateral, and other unique security features in order to estimate the relevant cash flows, which are then discounted to calculate the fair value. Securities denominated in a foreign currency are converted into their U.S. dollar equivalent at the foreign exchange rate in effect at 4 p.m. Eastern time on the date that the values of the foreign debt securities are determined.
Investments in open-end mutual funds are valued at the closing NAV.
Derivative financial instruments listed on an exchange are valued at the official closing price of the day. Certain derivative financial instruments are centrally cleared or trade in the OTC market. The Fund’s pricing services use various techniques including industry standard option pricing models and proprietary discounted cash flow models to determine the fair value of those instruments. The Fund’s net benefit or obligation under the derivative contract, as measured by the fair value of the contract, is included in net assets.
The Fund has procedures to determine the fair value of financial instruments for which market prices are not reliable or readily available. Under these procedures, the VC convenes on a regular basis to review such financial instruments and considers a number of factors, including significant unobservable valuation inputs, when arriving at fair value. The VC primarily employs a market-based approach which may use related or comparable assets or liabilities, recent transactions, market multiples, book values, and other relevant information for the investment to determine the fair value of the investment. An income-based valuation approach may also be used in which the anticipated future cash flows of the investment are discounted to calculate fair value. Discounts may also be applied due to the nature or duration of any restrictions on the disposition of the investments. Due to the inherent uncertainty of valuations of such investments, the fair values may differ significantly from the values that would have been used had an active market existed. The VC employs various methods for calibrating these valuation approaches including a regular review of key inputs and assumptions, transactional back-testing or disposition analysis, and reviews of any related market activity.
| Semiannual Report | TGB-23 |
FRANKLIN TEMPLETON VARIABLE INSURANCE PRODUCTS TRUST
NOTES TO FINANCIAL STATEMENTS (UNAUDITED)
Templeton Global Bond VIP Fund (continued)
1. Organization and Significant Accounting Policies (continued)
b. Foreign Currency Translation
Portfolio securities and other assets and liabilities denominated in foreign currencies are translated into U.S. dollars based on the exchange rate of such currencies against U.S. dollars on the date of valuation. The Fund may enter into foreign currency exchange contracts to facilitate transactions denominated in a foreign currency. Purchases and sales of securities, income and expense items denominated in foreign currencies are translated into U.S. dollars at the exchange rate in effect on the transaction date. Portfolio securities and assets and liabilities denominated in foreign currencies contain risks that those currencies will decline in value relative to the U.S. dollar. Occasionally, events may impact the availability or reliability of foreign exchange rates used to convert the U.S. dollar equivalent value. If such an event occurs, the foreign exchange rate will be valued at fair value using procedures established and approved by the Board.
The Fund does not separately report the effect of changes in foreign exchange rates from changes in market prices on securities held. Such changes are included in net realized and unrealized gain or loss from investments in the Statement of Operations.
Realized foreign exchange gains or losses arise from sales of foreign currencies, currency gains or losses realized between the trade and settlement dates on securities transactions and the difference between the recorded amounts of dividends, interest, and foreign withholding taxes and the U.S. dollar equivalent of the amounts actually received or paid. Net unrealized foreign exchange gains and losses arise from changes in foreign exchange rates on foreign denominated assets and liabilities other than investments in securities held at the end of the reporting period.
c. Derivative Financial Instruments
The Fund invested in derivative financial instruments in order to manage risk or gain exposure to various other investments or markets. Derivatives are financial contracts based on an underlying or notional amount, require no initial investment or an initial net investment that is smaller than would normally be required to have a similar response to changes in market factors, and require or permit net settlement. Derivatives contain various risks including the potential inability of the counterparty to fulfill their obligations under the terms of the contract, the potential for an illiquid secondary market, and/or the potential
for market movements which expose the Fund to gains or losses in excess of the amounts shown in the Statement of Assets and Liabilities. Realized gain and loss and unrealized appreciation and depreciation on these contracts for the period are included in the Statement of Operations.
Derivative counterparty credit risk is managed through a formal evaluation of the creditworthiness of all potential counter-parties. The Fund attempts to reduce its exposure to counterparty credit risk on OTC derivatives, whenever possible, by entering into International Swaps and Derivatives Association (ISDA) master agreements with certain counterparties. These agreements contain various provisions, including but not limited to collateral requirements, events of default, or early termination. Termination events applicable to the counterparty include certain deteriorations in the credit quality of the counterparty. Termination events applicable to the Fund include failure of the Fund to maintain certain net asset levels and/or limit the decline in net assets over various periods of time. In the event of default or early termination, the ISDA master agreement gives the non-defaulting party the right to net and close-out all transactions traded, whether or not arising under the ISDA agreement, to one net amount payable by one counterparty to the other. However, absent an event of default or early termination, OTC derivative assets and liabilities are presented gross and not offset in the Statement of Assets and Liabilities. Early termination by the counterparty may result in an immediate payment by the Fund of any net liability owed to that counterparty under the ISDA agreement.
Collateral requirements differ by type of derivative. Collateral or initial margin requirements are set by the broker or exchange clearing house for exchange traded and centrally cleared derivatives. Initial margin deposited is held at the exchange and can be in the form of cash and/or securities. For OTC derivatives traded under an ISDA master agreement, posting of collateral is required by either the Fund or the applicable counterparty if the total net exposure of all OTC derivatives with the applicable counterparty exceeds the minimum transfer amount, which typically ranges from $100,000 to $250,000, and can vary depending on the counterparty and the type of the agreement. Generally, collateral is determined at the close of Fund business each day and any additional collateral required due to changes in derivative values may be delivered by the Fund or the counterparty the next business day, or within a few business days. Collateral pledged and/or received by the Fund for OTC derivatives, if any, is held in segregated accounts with
| TGB-24 | Semiannual Report |
FRANKLIN TEMPLETON VARIABLE INSURANCE PRODUCTS TRUST
NOTES TO FINANCIAL STATEMENTS (UNAUDITED)
Templeton Global Bond VIP Fund (continued)
the Fund’s custodian/counterparty broker and can be in the form of cash and/or securities. Unrestricted cash may be invested according to the Fund’s investment objectives. To the extent that the amounts due to the Fund from its counterparties are not subject to collateralization or are not fully collateralized, the Fund bears the risk of loss from counterparty non-performance.
The Fund entered into OTC forward exchange contracts primarily to manage and/or gain exposure to certain foreign currencies. A forward exchange contract is an agreement between the Fund and a counterparty to buy or sell a foreign currency at a specific exchange rate on a future date.
The Fund entered into interest rate swap contracts primarily to manage interest rate risk. An interest rate swap is an agreement between the Fund and a counterparty to exchange cash flows based on the difference between two interest rates, applied to a notional amount. These agreements may be privately negotiated in the over-the-counter market (OTC interest rate swaps) or may be executed on a registered exchange (centrally cleared interest rate swaps). For centrally cleared interest rate swaps, required initial margins are pledged by the Fund, and the daily change in fair value is accounted for as a variation margin payable or receivable in the Statement of Assets and Liabilities. Over the term of the contract, contractually required payments to be paid and to be received are accrued daily and recorded as unrealized depreciation and appreciation until the payments are made, at which time they are realized.
The Fund invests in value recovery instruments (VRI) primarily to gain exposure to growth risk. Periodic payments from VRI are dependent on established benchmarks for underlying variables. VRI has a notional amount, which is used to calculate amounts of payments to holders. Payments are recorded upon receipt as realized gains in the Statement of Operations. The risks of investing in VRI include growth risk, liquidity, and the potential loss of investment.
See Note 9 regarding other derivative information.
d. Income and Deferred Taxes
It is the Fund’s policy to qualify as a regulated investment company under the Internal Revenue Code. The Fund intends to distribute to shareholders substantially all of its taxable income and net realized gains to relieve it from federal income and if applicable, excise taxes. As a result, no provision for U.S. federal income taxes is required.
The Fund may be subject to foreign taxation related to income received, capital gains on the sale of securities and certain foreign currency transactions in the foreign jurisdictions in which it invests. Foreign taxes, if any, are recorded based on the tax regulations and rates that exist in the foreign markets in which the Fund invests. When a capital gain tax is determined to apply, the Fund records an estimated deferred tax liability in an amount that would be payable if the securities were disposed of on the valuation date.
The Fund may recognize an income tax liability related to its uncertain tax positions under U.S. GAAP when the uncertain tax position has a less than 50% probability that it will be sustained upon examination by the tax authorities based on its technical merits. As of June 30, 2017, the Fund has determined that no tax liability is required in its financial statements related to uncertain tax positions for any open tax years (or expected to be taken in future tax years). Open tax years are those that remain subject to examination and are based on each tax jurisdiction’s statute of limitation.
e. Security Transactions, Investment Income, Expenses and Distributions
Security transactions are accounted for on trade date. Realized gains and losses on security transactions are determined on a specific identification basis. Interest income and estimated expenses are accrued daily. Amortization of premium and accretion of discount on debt securities are included in interest income. Dividend income is recorded on the ex-dividend date. Distributions to shareholders are recorded on the ex-dividend date. Distributable earnings are determined according to income tax regulations (tax basis) and may differ from earnings recorded in accordance with U.S. GAAP. These differences may be permanent or temporary. Permanent differences are reclassified among capital accounts to reflect their tax character. These reclassifications have no impact on net assets or the results of operations. Temporary differences are not reclassified, as they may reverse in subsequent periods.
Common expenses incurred by the Trust are allocated among the Funds based on the ratio of net assets of each Fund to the combined net assets of the Trust. Fund specific expenses are charged directly to the Fund that incurred the expense.
Realized and unrealized gains and losses and net investment income, not including class specific expenses, are allocated daily to each class of shares based upon the relative proportion
| Semiannual Report | TGB-25 |
FRANKLIN TEMPLETON VARIABLE INSURANCE PRODUCTS TRUST
NOTES TO FINANCIAL STATEMENTS (UNAUDITED)
Templeton Global Bond VIP Fund (continued)
1. Organization and Significant Accounting
Policies (continued)
e. Security Transactions, Investment Income, Expenses and Distributions (continued)
of net assets of each class. Differences in per share distributions, by class, are generally due to differences in class specific expenses.
Inflation-indexed bonds are adjusted for inflation through periodic increases or decreases in the security’s interest accruals, face amount, or principal redemption value, by amounts corresponding to the rate of inflation as measured by an index. Any increase or decrease in the face amount or principal redemption value will be included as interest income in the Statement of Operations.
f. Accounting Estimates
The preparation of financial statements in accordance with U.S. GAAP requires management to make estimates and assumptions that affect the reported amounts of assets and
liabilities at the date of the financial statements and the amounts of income and expenses during the reporting period. Actual results could differ from those estimates.
g. Guarantees and Indemnifications
Under the Trust’s organizational documents, its officers and trustees are indemnified by the Trust against certain liabilities arising out of the performance of their duties to the Trust. Additionally, in the normal course of business, the Trust, on behalf of the Fund, enters into contracts with service providers that contain general indemnification clauses. The Trust’s maximum exposure under these arrangements is unknown as this would involve future claims that may be made against the Trust that have not yet occurred. Currently, the Trust expects the risk of loss to be remote.
2. Shares of Beneficial Interest
At June 30, 2017, there were an unlimited number of shares authorized (without par value). Transactions in the Fund’s shares were as follows:
| Six Months Ended June 30, 2017 | Year Ended December 31, 2016 | |||||||||||||||||||
| Shares | Amount | Shares | Amount | |||||||||||||||||
| Class 1 Shares: | ||||||||||||||||||||
Shares sold | 1,921,419 | $ | 33,302,536 | 2,249,431 | $ | 36,190,152 | ||||||||||||||
Shares issued in reinvestment of distributions | 46,290 | 806,829 | 14,671 | 230,624 | ||||||||||||||||
Shares redeemed | (1,194,464 | ) | (20,421,113 | ) | (5,831,060 | ) | (94,537,988 | ) | ||||||||||||
|
| |||||||||||||||||||
Net increase (decrease) | 773,245 | $ | 13,688,252 | (3,566,958 | ) | $ | (58,117,212 | ) | ||||||||||||
|
| |||||||||||||||||||
| Class 2 Shares: | ||||||||||||||||||||
Shares sold | 4,852,402 | $ | 81,006,223 | 12,422,365 | $ | 192,901,752 | ||||||||||||||
Shares issued in reinvestment of distributions | 535,977 | 8,999,053 | 161,118 | 2,445,769 | ||||||||||||||||
Shares redeemed | (10,887,065 | ) | (181,179,780 | ) | (27,589,750 | ) | (429,305,202 | ) | ||||||||||||
|
| |||||||||||||||||||
Net increase (decrease) | (5,498,686 | ) | $ | (91,174,504 | ) | (15,006,267 | ) | $ | (233,957,681 | ) | ||||||||||
|
| |||||||||||||||||||
| Class 4 Shares: | ||||||||||||||||||||
Shares sold | 487,619 | $ | 8,316,260 | 793,050 | $ | 12,575,365 | ||||||||||||||
Shares issued in reinvestment of distributions | 17,886 | 307,109 | 5,231 | 81,295 | ||||||||||||||||
Shares redeemed | (597,221 | ) | (10,169,591 | ) | (1,344,557 | ) | (21,413,565 | ) | ||||||||||||
|
| |||||||||||||||||||
Net increase (decrease) | (91,716 | ) | $ | (1,546,222 | ) | (546,276 | ) | $ | (8,756,905 | ) | ||||||||||
|
| |||||||||||||||||||
| TGB-26 | Semiannual Report |
FRANKLIN TEMPLETON VARIABLE INSURANCE PRODUCTS TRUST
NOTES TO FINANCIAL STATEMENTS (UNAUDITED)
Templeton Global Bond VIP Fund (continued)
3. Transactions with Affiliates
Franklin Resources, Inc. is the holding company for various subsidiaries that together are referred to as Franklin Templeton Investments. Certain officers and trustees of the Fund are also officers and/or directors of the following subsidiaries:
| Subsidiary | Affiliation | |
Franklin Advisers, Inc. (Advisers) | Investment manager | |
Franklin Templeton Services, LLC (FT Services) | Administrative manager | |
Franklin Templeton Distributors, Inc. (Distributors) | Principal underwriter | |
Franklin Templeton Investor Services, LLC (Investor Services) | Transfer agent |
a. Management Fees
The Fund pays an investment management fee to Advisers based on the average daily net assets of the Fund as follows:
| Annualized Fee Rate | Net Assets | |
0.625% | Up to and including $100 million | |
0.500% | Over $100 million, up to and including $250 million | |
0.450% | Over $250 million, up to and including $7.5 billion | |
0.440% | Over $7.5 billion, up to and including $10 billion | |
0.430% | Over $10 billion, up to and including $12.5 billion | |
0.420% | Over $12.5 billion, up to and including $15 billion | |
0.400% | In excess of $15 billion |
For the period ended June 30, 2017, the annualized effective investment management fee rate was 0.458% of the Fund’s average daily net assets.
b. Administrative Fees
Under an agreement with Advisers, FT Services provides administrative services to the Fund. The fee is paid by Advisers based on the Fund’s average daily net assets, and is not an additional expense of the Fund.
c. Distribution Fees
The Board has adopted distribution plans for Class 2 and Class 4 shares pursuant to Rule 12b-1 under the 1940 Act. Under the Fund’s compensation distribution plans, the Fund pays Distributors for costs incurred in connection with the servicing, sale and distribution of the Fund’s shares up to 0.25% and 0.35% per year of its average daily net assets of Class 2 and Class 4, respectively. The plan year, for purposes of monitoring compliance with the maximum annual plan rates, is February 1 through January 31.
d. Transfer Agent Fees
Investor Services, under terms of an agreement, performs shareholder servicing for the Fund and is not paid by the Fund for the services.
| Semiannual Report | TGB-27 |
FRANKLIN TEMPLETON VARIABLE INSURANCE PRODUCTS TRUST
NOTES TO FINANCIAL STATEMENTS (UNAUDITED)
Templeton Global Bond VIP Fund (continued)
3. Transactions with Affiliates (continued)
e. Investments in Affiliated Management Investment Companies
The Fund invests in one or more affiliated management investment companies for purposes other than exercising a controlling influence over the management or policies. Management fees paid by the Fund are waived on assets invested in the affiliated management investment companies, as noted in the Statement of Operations, in an amount not to exceed the management and administrative fees paid directly or indirectly by each affiliate. During the period ended June 30, 2017, the Fund held investments in affiliated management investment companies as follows:
Number of Shares | Gross Additions | Gross Reductions | Number of Shares | Value at End of Period | Investment Income | Realized Gain (Loss) | % of Affiliated Fund Shares Outstanding Held at End of Period | |||||||||||||||||||||||||
| Non-Controlled Affiliates | ||||||||||||||||||||||||||||||||
Institutional Fiduciary Trust Money Market Portfolio, 0.58% | 436,780,215 | 591,026,045 | (378,770,628 | ) | 649,035,632 | $ | 649,035,632 | $ | 934,011 | $ | — | 3.4% | ||||||||||||||||||||
|
| |||||||||||||||||||||||||||||||
f. Interfund Transactions
The Fund engaged in purchases and sales of investments with funds or other accounts that have common investment managers (or affiliated investment managers), directors, trustees or officers. During the period ended June 30, 2017, the purchase and sale transactions aggregated $- and $8,246,196, respectively.
4. Expense Offset Arrangement
The Fund has entered into an arrangement with its custodian whereby credits realized as a result of uninvested cash balances are used to reduce a portion of the Fund’s custodian expenses. During the period ended June 30, 2017, the custodian fees were reduced as noted in the Statement of Operations.
5. Income Taxes
At June 30, 2017, the cost of investments and net unrealized appreciation (depreciation) for income tax purposes were as follows:
Cost of investments. | $ | 2,815,575,413 | ||
|
| |||
Unrealized appreciation | $ | 111,398,751 | ||
Unrealized depreciation | (92,747,579 | ) | ||
|
| |||
Net unrealized appreciation (depreciation) | $ | 18,651,172 | ||
|
|
Differences between income and/or capital gains as determined on a book basis and a tax basis are primarily due to differing treatments of foreign currency transactions and bond discounts and premiums.
6. Investment Transactions
Purchases and sales of investments (excluding short term securities) for the period ended June 30, 2017, aggregated $357,685,034 and $622,866,820, respectively.
| TGB-28 | Semiannual Report |
FRANKLIN TEMPLETON VARIABLE INSURANCE PRODUCTS TRUST
NOTES TO FINANCIAL STATEMENTS (UNAUDITED)
Templeton Global Bond VIP Fund (continued)
7. Credit Risk
At June 30, 2017, the Fund had 22.4% of its portfolio invested in high yield or other securities rated below investment grade and unrated securities, if any. These securities may be more sensitive to economic conditions causing greater price volatility and are potentially subject to a greater risk of loss due to default than higher rated securities.
8. Concentration of Risk
Investing in foreign securities may include certain risks and considerations not typically associated with investing in U.S. securities, such as fluctuating currency values and changing local and regional economic, political and social conditions, which may result in greater market volatility. In addition, certain foreign securities may not be as liquid as U.S. securities.
9. Other Derivative Information
At June 30, 2017, the Fund’s investments in derivative contracts are reflected in the Statement of Assets and Liabilities as follows:
Asset Derivatives | Liability Derivatives | |||||||||||
Derivative Contracts Not Accounted for as Hedging Instruments | Statement of Assets and Liabilities Location | Fair Value | Statement of Assets and Liabilities Location | Fair Value | ||||||||
Interest rate contracts | Variation margin | $ | 7,631,617 | a | Variation margin | $ | 13,852,541 | a | ||||
| Unrealized depreciation on OTC swap contracts | 3,664,082 | |||||||||||
Foreign exchange contracts | Unrealized appreciation on OTC forward exchange contracts | 30,418,172 | Unrealized depreciation on OTC forward exchange contracts | 60,187,073 | ||||||||
Value recovery instruments | Investments in securities, at value | 11,741,783 | ||||||||||
|
|
|
| |||||||||
Totals | $ | 49,791,572 | $ | 77,703,696 | ||||||||
|
|
|
| |||||||||
aThis amount reflects the cumulative appreciation (depreciation) of centrally cleared swap contracts as reported in the Statement of Investments. Only the variation margin receivable/payable at period end is separately reported within the Statement of Assets and Liabilities. Prior variation margin movements were recorded to cash upon receipt or payment.
For the period ended June 30, 2017, the effect of derivative contracts in the Fund’s Statement of Operations was as follows:
Derivative Contracts as Hedging Instruments | Statement of Operations Location | Net Realized Gain (Loss) for the Period | Statement of Operations Location | Net Change in Unrealized Appreciation (Depreciation) for the Period | ||||||||
| Net realized gain (loss) from: | Net change in unrealized appreciation (depreciation) on: | |||||||||||
Interest rate contracts | Swap contracts | $ | (4,330,467 | ) | Swap contracts | $ | (4,874,179 | ) | ||||
Foreign exchange contracts | Foreign currency transactions | 20,704,148 | a | Translation of other assets and liabilities denominated in foreign currencies | (154,923,103 | )a | ||||||
Value recovery instruments | Investments | 2,598,493 | ||||||||||
|
|
|
| |||||||||
Totals | $ | 16,373,681 | $ | (157,198,789 | ) | |||||||
|
|
|
| |||||||||
aForward exchange contracts are included in net realized gain (loss) from foreign currency transactions and net change in unrealized appreciation (depreciation) on translation of other assets and liabilities denominated in foreign currencies in the Statement of Operations.
| Semiannual Report | TGB-29 |
FRANKLIN TEMPLETON VARIABLE INSURANCE PRODUCTS TRUST
NOTES TO FINANCIAL STATEMENTS (UNAUDITED)
Templeton Global Bond VIP Fund (continued)
9. Other Derivative Information (continued)
For the period ended June 30, 2017, the average month end notional amount of swap contracts represented $879,557,143. The average month end contract value and fair value of forward exchange contracts and VRI was $3,404,454,907 and $10,252,433, respectively.
At June 30, 2017, the Fund’s OTC derivative assets and liabilities are as follows:
| Gross Amounts of Assets and Liabilities Presented in the Statement of Assets and Liabilities | ||||||||
| Assetsa | Liabilitiesa | |||||||
| Derivatives | ||||||||
Forward exchange contracts | $ | 30,418,172 | $ | 60,187,073 | ||||
Swap contracts | — | 3,664,082 | ||||||
|
| |||||||
Total | $ | 30,418,172 | $ | 63,851,155 | ||||
|
| |||||||
aAbsent an event of default or early termination, OTC derivative assets and liabilities are presented gross and not offset in the Statement of Assets and Liabilities.
At June 30, 2017, the Fund’s OTC derivative assets, which may be offset against the Fund’s OTC derivative liabilities and collateral received from the counterparty, are as follows:
| Amounts Not Offset in the Statement of Assets and Liabilities | ||||||||||||||||||||
| Gross Amounts of Assets Presented in the Statement of Assets and Liabilities | Financial Instruments Available for Offset | Financial Instruments Collateral Receivedb | Cash Collateral Received | Net Amount (Not less than zero) | ||||||||||||||||
| Counterparty | ||||||||||||||||||||
BOFA | $ | 477,296 | $ | (477,296 | ) | $ | — | $ | — | $ | — | |||||||||
BZWS | 2,178,194 | (1,208,280 | ) | — | — | 969,914 | ||||||||||||||
CITI | 3,136,665 | (3,136,665 | ) | — | — | — | ||||||||||||||
DBAB | 4,687,842 | (4,687,842 | ) | — | — | — | ||||||||||||||
GSCO | 411,789 | (411,789 | ) | — | — | — | ||||||||||||||
HSBK | 10,839,285 | (4,934,574 | ) | (4,201,960 | ) | — | 1,702,751 | |||||||||||||
JPHQ | 8,227,636 | (8,227,636 | ) | — | — | — | ||||||||||||||
MSCO | 97,917 | (97,917 | ) | — | — | — | ||||||||||||||
SCNY | 361,548 | (361,548 | ) | — | — | — | ||||||||||||||
UBSW | — | — | — | — | — | |||||||||||||||
|
| |||||||||||||||||||
Total | $ | 30,418,172 | $ | (23,543,547 | ) | $ | (4,201,960 | ) | $ | — | $ | 2,672,665 | ||||||||
|
| |||||||||||||||||||
| TGB-30 | Semiannual Report |
FRANKLIN TEMPLETON VARIABLE INSURANCE PRODUCTS TRUST
NOTES TO FINANCIAL STATEMENTS (UNAUDITED)
Templeton Global Bond VIP Fund (continued)
At June 30, 2017, the Fund’s OTC derivative liabilities, which may be offset against the Fund’s OTC derivative assets and collateral pledged to the counterparty, are as follows:
| Amounts Not Offset in the Statement of Assets and Liabilities | ||||||||||||||||||||
Gross Amounts of Liabilities | Financial Instruments Available for Offset | Financial Instruments Collateral Pledged | Cash Collateral Pledgedc | Net Amount (Not less than zero) | ||||||||||||||||
| Counterparty | ||||||||||||||||||||
BOFA | $ | 7,825,353 | $ | (477,296 | ) | $ | — | $ | (7,348,057 | ) | $ | — | ||||||||
BZWS | 1,208,280 | (1,208,280 | ) | — | — | — | ||||||||||||||
CITI | 13,416,294 | (3,136,665 | ) | — | (9,980,000 | ) | 299,629 | |||||||||||||
DBAB | 9,340,766 | (4,687,842 | ) | — | (4,630,000 | ) | 22,924 | |||||||||||||
GSCO | 5,510,215 | (411,789 | ) | — | (5,050,000 | ) | 48,426 | |||||||||||||
HSBK | 4,934,574 | (4,934,574 | ) | — | — | — | ||||||||||||||
JPHQ | 18,051,046 | (8,227,636 | ) | — | (7,880,000 | ) | 1,943,410 | |||||||||||||
MSCO | 522,387 | (97,917 | ) | — | (310,000 | ) | 114,470 | |||||||||||||
SCNY. | 2,321,110 | (361,548 | ) | — | (1,959,562 | ) | — | |||||||||||||
UBSW | 721,130 | — | — | (721,130 | ) | — | ||||||||||||||
|
| |||||||||||||||||||
Total | $ | 63,851,155 | $ | (23,543,547 | ) | $ | — | $ | (37,878,749 | ) | $ | 2,428,859 | ||||||||
|
| |||||||||||||||||||
bAt June 30, 2017, the Fund received United Kingdom Treasury Bonds and Notes as collateral for derivatives.
cIn some instances, the collateral amounts disclosed in the table above were adjusted due to the requirement to limit collateral amounts to avoid the effect of overcollateralization. Actual collateral received and/or pledged may be more than the amounts disclosed herein.
See Note 1(e) regarding derivative financial instruments.
See Abbreviations on page TGB-33.
10. Credit Facility
The Fund, together with other U.S. registered and foreign investment funds (collectively, Borrowers), managed by Franklin Templeton Investments, are borrowers in a joint syndicated senior unsecured credit facility totaling $2 billion (Global Credit Facility) which matures on February 9, 2018. This Global Credit Facility provides a source of funds to the Borrowers for temporary and emergency purposes, including the ability to meet future unanticipated or unusually large redemption requests.
Under the terms of the Global Credit Facility, the Fund shall, in addition to interest charged on any borrowings made by the Fund and other costs incurred by the Fund, pay its share of fees and expenses incurred in connection with the implementation and maintenance of the Global Credit Facility, based upon its relative share of the aggregate net assets of all of the Borrowers, including an annual commitment fee of 0.15% based upon the unused portion of the Global Credit Facility. These fees are reflected in other expenses in the Statement of Operations. During the period ended June 30, 2017, the Fund did not use the Global Credit Facility.
11. Fair Value Measurements
The Fund follows a fair value hierarchy that distinguishes between market data obtained from independent sources (observable inputs) and the Fund’s own market assumptions (unobservable inputs). These inputs are used in determining the value of the Fund’s financial instruments and are summarized in the following fair value hierarchy:
| • | Level 1 – quoted prices in active markets for identical financial instruments |
| • | Level 2 – other significant observable inputs (including quoted prices for similar financial instruments, interest rates, prepayment speed, credit risk, etc.) |
| Semiannual Report | TGB-31 |
FRANKLIN TEMPLETON VARIABLE INSURANCE PRODUCTS TRUST
NOTES TO FINANCIAL STATEMENTS (UNAUDITED)
| • | Level 3 – significant unobservable inputs (including the Fund’s own assumptions in determining the fair value of financial instruments) |
The input levels are not necessarily an indication of the risk or liquidity associated with financial instruments at that level.
For movements between the levels within the fair value hierarchy, the Fund has adopted a policy of recognizing the transfers as of the date of the underlying event which caused the movement.
A summary of inputs used as of June 30, 2017, in valuing the Fund’s assets and liabilities carried at fair value, is as follows:
| Level 1 | Level 2 | Level 3 | Total | |||||||||||||
| Assets: | ||||||||||||||||
Investments in Securities: | ||||||||||||||||
Foreign Government and Agency Securitiesa | $ | — | $ | 2,109,715,828 | $ | — | $ | 2,109,715,828 | ||||||||
Short Term Investments | 649,035,632 | 75,475,125 | — | 724,510,757 | ||||||||||||
|
| |||||||||||||||
Total Investments in Securities | $ | 649,035,632 | $ | 2,185,190,953 | $ | — | $ | 2,834,226,585 | ||||||||
|
| |||||||||||||||
Other Financial Instruments: | ||||||||||||||||
Forward Exchange Contracts | $ | — | $ | 30,418,172 | $ | — | $ | 30,418,172 | ||||||||
Swap Contracts. | — | 7,631,617 | — | 7,631,617 | ||||||||||||
|
| |||||||||||||||
Total Other Financial Instruments | $ | — | $ | 38,049,789 | $ | — | $ | 38,049,789 | ||||||||
|
| |||||||||||||||
| Liabilities: | ||||||||||||||||
Other Financial Instruments: | ||||||||||||||||
Forward Exchange Contracts | $ | — | $ | 60,187,073 | $ | — | $ | 60,187,073 | ||||||||
Swap Contracts. | — | 17,516,623 | — | 17,516,623 | ||||||||||||
|
| |||||||||||||||
Total Other Financial Instruments | $ | — | $ | 77,703,696 | $ | — | $ | 77,703,696 | ||||||||
|
| |||||||||||||||
aFor detailed categories, see the accompanying Statement of Investments.
12. New Accounting Pronouncements
In March 2017, the Financial Accounting Standards Board (FASB) issued Accounting Standards Update (ASU) No. 2017-08, Receivables — Nonrefundable Fees and Other Costs (Subtopic 310-20): Premium Amortization on Purchased Callable Debt Securities. The amendments in the ASU shorten the amortization period for certain callable debt securities, held at a premium, to be amortized to the earliest call date. The ASU does not require an accounting change for securities held at a discount; which continues to be amortized to maturity. The ASU is effective for fiscal years and interim periods within those fiscal years beginning after December 15, 2018. Management is currently evaluating the impact, if any, of applying this provision.
13. Investment Company Reporting Modernization
In October 2016, the U.S. Securities and Exchange Commission adopted new rules and amended existing rules (together, final rules) intended to modernize the reporting and disclosure of information by registered investment companies. In part, the final rules amend Regulation S-X and require standardized, enhanced disclosures about derivatives in investment company financial statements, as well as other amendments. The compliance date for the amendments to Regulation S-X is August 1, 2017. Management has reviewed the requirements and believes the adoption of the amendments to Regulation S-X will not have a material impact on the Fund’s financial statements and related disclosures.
| TGB-32 | Semiannual Report |
FRANKLIN TEMPLETON VARIABLE INSURANCE PRODUCTS TRUST
NOTES TO FINANCIAL STATEMENTS (UNAUDITED)
Templeton Global Bond VIP Fund (continued)
14. Subsequent Events
The Fund has evaluated subsequent events through the issuance of the financial statements and determined that no events have occurred that require disclosure.
Abbreviations
| Counterparty/Exchange | Currency | Selected Portfolio | ||||||||
| BOFA | Bank of America, N.A. | ARS | Argentine Peso | BBA | British Bankers Association | |||||
| BZWS | Barclays Bank PLC | BRL | Brazilian Real | FRN | Floating Rate Note | |||||
| CITI | Citibank, N.A. | COP | Colombian Peso | GDP | Gross Domestic Product | |||||
| CME | Chicago Mercantile Exchange | EUR | Euro | LIBOR | London InterBank Offered Rate | |||||
| DBAB | Deutsche Bank, AG | GHS | Ghanaian Cedi | VRI | Value Recovery Instruments | |||||
| GSCO | Goldman Sachs Bank USA | IDR | Indonesian Rupiah | |||||||
| HSBK | HSBC Bank PLC | INR | Indian Rupee | |||||||
| JPHQ | JP Morgan Chase Bank, N.A. | KRW | South Korean Won | |||||||
| LCH | LCH Clearnet LLC | MXN | Mexican Peso | |||||||
| MSCO | Morgan Stanley & Co. LLC | PEN | Peruvian Nuevo Sol | |||||||
| SCNY | Standard Chartered Bank | PHP | Philippine Peso | |||||||
| UBSW | UBS AG | USD | United States Dollar | |||||||
| ZAR | South African Rand | |||||||||
| Semiannual Report | TGB-33 |
This page intentionally left blank.
This semiannual report for Templeton Growth VIP Fund covers the period ended June 30, 2017.
Class 1 Performance Summary as of June 30, 2017
The Fund’s Class 1 Shares delivered a +11.02% total return for the six-month period ended June 30, 2017.
Performance reflects the Fund’s Class 1 operating expenses, but does not include any contract fees, expenses or sales charges. If they had been included, performance would be lower. These charges and deductions, particularly for variable life policies, can have a significant effect on contract values and insurance benefits. See the contract prospectus for a complete description of these expenses, including sales charges.
Performance data represent past performance, which does not guarantee future results. Investment return and principal value will fluctuate, and you may have a gain or loss when you sell your shares. Current performance may differ from figures shown.
| Semiannual Report | TG-1 |
TEMPLETON GROWTH VIP FUND
Fund Goal and Main Investments
The Fund seeks long-term capital growth. Under normal market conditions, the Fund invests predominantly in equity securities of companies located anywhere in the world, including developing markets.
Fund Risks
All investments involve risks, including possible loss of principal. Special risks are associated with foreign investing, including currency fluctuations, economic instability and political developments; investments in emerging markets involve heightened risks related to the same factors. In addition, smaller and midsized-company stocks have historically experienced more price volatility than larger company stocks, especially over the short term. Value securities may not increase in price as anticipated or may decline further in value. To the extent the Fund focuses on particular countries, regions, industries, sectors or types of investments from time to time, it may be subject to greater risks of adverse developments in such areas of focus than a fund that invests in a wider variety of countries, regions, industries, sectors or investments. Derivatives, including currency management strategies, involve costs and can create economic leverage in the portfolio, which may result in significant volatility and cause the Fund to participate in losses (as well as enable gains) on an amount that exceeds the Fund’s initial investment. The Fund is actively managed but there is no guarantee that the manager’s investment decisions will produce the desired results. The Fund’s prospectus also includes a description of the main investment risks.
Performance Overview
You can find the Fund’s six-month total return in the Performance Summary. For comparison, the Fund’s benchmark, the MSCI All country World Index (ACWI), returned +11.82% for the period under review.1
Economic and Market Overview
The global economy generally expanded during the period under review. In this environment, global developed and emerging market stocks rose, as measured by the MSCI ACWI. Global markets were aided by improved industrial commodity prices at certain points during the period, generally upbeat
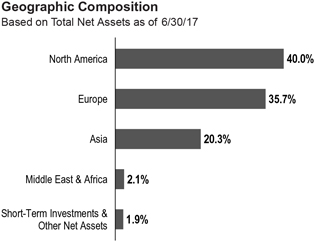
economic data across regions, investor optimism about pro-growth and pro-business policies in the U.S, hopes of tax reforms under the Trump administration, Emmanuel Macron’s election as France’s president and encouraging corporate earnings reports.
However, investors expressed concerns about the timing and economic effects of the U.K.’s exit from the European Union (also known as “Brexit”) and the U.S. executive order banning entry from some Muslim-majority countries. Other headwinds included the health of European banks, concerns about political uncertainty in the U.S. and European Union, geopolitical tensions in certain regions, worries about global oversupply in oil production despite a pact to extend cuts, and hawkish comments from key central bankers around the world toward period-end.
U.S. economic growth decelerated in 2017’s first quarter, largely due to slower growth in consumer spending and declines in private inventory investment and government spending. However, growth accelerated in the second quarter due to increases in consumer spending, business investment and federal government spending. The unemployment rate decreased from 4.7% in December 2016 to 4.4% at period-end.2 Annual inflation, as measured by the Consumer Price Index, decreased from 2.1% to 1.6% during the period. After increasing its benchmark interest rate in March, the U.S. Federal Reserve (Fed), at its June meeting, made the widely anticipated increase to its target range for the federal funds rate from 0.75%–1.00% to 1.00%–1.25%, amid signs of a growing
1. Source: Morningstar.
One cannot invest directly in an index, and an index is not representative of the Fund’s portfolio. Please see Index Descriptions following the Fund Summaries.
2. Source: Bureau of Labor Statistics.
The dollar value, number of shares or principal amount, and names of all portfolio holdings are listed in the Fund’s Statement of Investments (SOI).
| TG-2 | Semiannual Report |
TEMPLETON GROWTH VIP FUND
U.S. economy, a strengthening labor market and an improvement in business spending.
In Europe, the U.K.’s economy grew at a slower rate in 2017’s first quarter over the previous quarter, largely due to slower growth in household spending. The eurozone’s growth increased in the first quarter over the previous quarter. The bloc’s annual inflation rate fluctuated during the reporting period and ended slightly higher from where it began. During the period, the European Central Bank kept its key policy rates unchanged.
In Asia, Japan’s quarterly gross domestic product (GDP) remained unchanged in 2017’s first quarter compared to 2016’s fourth quarter. In April 2017, the Bank of Japan (BOJ) slightly increased its GDP forecasts for the 2017–2018 fiscal year. However, the BOJ lowered its inflation forecast.
In emerging markets, Brazil’s quarterly GDP grew for the first time in two years, as its first-quarter 2017 GDP grew compared to the previous quarter. The country’s central bank cut its benchmark interest rate four times between January and June 2017 to spur economic growth. Russia’s GDP grew in 2017’s first quarter compared to the prior-year period. The Bank of Russia reduced its key interest rate in March, April and June 2017 to try to revive its economy. China’s economy grew faster in the first half of 2017 compared to the first half of 2016, driven by solid growth in industrial production, services, fixed-asset investment, retail sales, and imports and exports. The People’s Bank of China left its benchmark interest rate unchanged during the period. Overall, emerging market stocks, as measured by the MSCI Emerging Markets Index, rose during the period.3
Investment Strategy
Our investment philosophy is bottom up, value oriented and long term. In choosing investments, we will focus on the market price of a company’s securities relative to our evaluation of the company’s potential long-term earnings, asset value and cash flow. Among factors we may consider are a company’s historical value measures, including price/earnings ratio, profit margins and liquidation value. We do in-depth research to construct a bargain list from which we buy.
Manager’s Discussion
The Fund delivered double-digit absolute gains but slightly trailed its official benchmark, the MSCI ACWI, during the
reporting period. Although stocks sustained upward momentum through the bulk of the period, market leadership transitioned from cyclical, value-oriented stocks back to defensive, growth-oriented issues as the period progressed. The market’s increasingly defensive posture was consistent with mixed global economic and political newsflow. Growth slowed in the world’s two largest economies (the U.S. and China), major central banks incrementally tightened policy and political tensions in key markets such as the U.S., Japan and the U.K remained elevated. Yet, investors focused more on positive factors: continued corporate earnings strength, still abundant liquidity and a favorable election outcome in France, which creates a window of opportunity for structural change and further European reform and integration. We, too, have been encouraged by positive political and economic developments in Europe (discussed in greater detail herein), which rewarded our long-standing overweighted allocation to the region.
An overweighted energy position detracted from the Fund’s relative performance as oil fell briefly into bear market territory amid the worst start to a year since 1997.4 The sector accounted for four of the Fund’s biggest detractors during the period, including U.S.-based exploration and production firms Apache and ConocoPhillips, U.S.-based oil services firm Halliburton and U.K.-based oil major Royal Dutch Shell. Apache was one of the Fund’s biggest laggards, declining after the firm reported an unexpected loss and disappointing 2017 production guidance. We continue to like Apache’s longer term prospects, given the strong cash-flow generating capabilities of its low-cost international assets (in Egypt and the North Sea) and an attractive growth pipeline in U.S. shale, including a potential major new discovery in the Permian Basin. We initially invested in Apache on the premise that its attractive growth pipeline was deeply undervalued by a short-term-oriented market; the market now ascribes a higher value to these assets, and although the stock is no longer an outright bargain in our view, it remains a core holding with potential for future appreciation as value materializes.
More generally, we believe the current pessimism in oil markets is misplaced, and we view near-term concerns about rising North American supply as overblown in the context of our long-term investment outlook. The rise in U.S. inventories is partially a seasonal event, and we expect some drawdown of stockpiles in the second half of 2017, countering the perception of a supply glut. In any event, more comprehensive data on global inventories paint the picture of a tighter market than the
3. Please see Index Descriptions following the Fund Summaries.
4. The energy sector comprises energy equipment and services and oil, gas and consumable fuels in the SOI.
| Semiannual Report | TG-3 |
TEMPLETON GROWTH VIP FUND
one suggested by U.S. data. We could also begin to see falling output from North American shale fields if sustained low prices discourage investment in future production. Financial speculation has further pressured oil, with net positioning in futures markets revealing one of the highest levels of short trades on record, a potential contrarian indicator. We also observe that geopolitical relations among the world’s largest oil producers are mostly stable, with compliance to the Organization of the Petroleum Exporting Countries (OPEC) production cuts above 100% and Russia apparently making good on its pledge to constrain output in line with OPEC. Finally, the world’s largest oil producer, Saudi Arabia, is preparing to conduct an initial public offering (IPO) of one of the world’s most valuable companies, Saudi Arabian Oil Co. (commonly known as Saudi Aramco). Riyadh seems to hope to maximize proceeds from this historic IPO, and therefore has every incentive to wish for a more buoyant price environment.
An underweighted position and stock selection in consumer staples also detracted during a period when the defensive sector came back into favor.5 We continue to believe that the historic valuation premium commanded by consumer staples stocks is likely to limit long-term investment returns in a commoditized sector subject to extreme pricing pressure and deteriorating earnings trends. For exposure to quality stocks with defensive characteristics, we continue to prefer health care to consumer staples given, among other things, the near-record valuation gap between the two sectors.
However, the Fund’s health care holdings also came under pressure during the review period, largely due to stock-specific weakness.6 Shares of Israel-based drugmaker Teva Pharmaceutical Industries led the sector lower after the company reported declining profits and investors worried about an ongoing leadership transition and the loss of U.S. patent protection on a key multiple sclerosis drug. Many market participants remained concerned about Teva’s ability to bring new products to fruition and grow its global generic franchise. However, we are more interested in Teva’s cash-generating abilities than its growth profile. With a relatively high free cash flow yield in 2017, in our assessment, Teva’s core businesses generate enough cash to healthily reward shareholders, while steadily bringing down elevated debt stemming from the recent acquisition of U.S. biotechnology firm Allergan’s generics business. We believe the market is excessively punishing Teva
| Top 10 Holdings | ||||
| 6/30/17 | ||||
| Company Sector/Industry, Country | % of Total Net Assets | |||
| Oracle Corp. Software, U.S. | 3.1% | |||
| Samsung Electronics Co. Ltd. Technology Hardware, Storage & Peripherals, South Korea | 2.9% | |||
| Citigroup Inc. Banks, U.S. | 2.5% | |||
| Royal Dutch Shell PLC Oil, Gas & Consumable Fuels, U.K. | 2.5% | |||
| Teva Pharmaceutical Industries Ltd. Pharmaceuticals, Israel | 2.1% | |||
| KB Financial Group Inc. Banks, South Korea | 2.0% | |||
| Amgen Inc. Biotechnology, U.S. | 1.9% | |||
| Allergan PLC Pharmaceuticals, U.S. | 1.8% | |||
| Standard Chartered PLC Banks, U.K. | 1.8% | |||
| Alphabet Inc. Internet Software & Services, U.S. | 1.7% | |||
amid concerns about the company’s growth profile and competitive threats associated with a key patent’s expiration, and we feel the stock represents compelling value trading at an all-time low multiple relative to 2017 earnings. More broadly, our analysis indicates that the defensive growth prospects of the entire health care sector remain materially undervalued amid excessive political concerns, and we continue to find sufficient bottom-up bargains to justify an overweighted allocation. Within the sector, we continue to favor innovative companies we feel have portfolios of high-margin, long-duration products and think are facing little competition or have demonstrable advantages over existing therapies.
Stock selection in the materials7 sector detracted, pressured by Russian nickel miner MMC Norilsk Nickel and Canadian gold miner Barrick Gold.8 Norilsk declined as nickel prices lagged due to loosening concentrate export restrictions in Indonesia and the removal of a hardline mining minister in the Philippines, events likely to increase global nickel supply. Although we continue to like Norilsk for its quality asset
5. The consumer staples sector comprises food and staples retailing and personal products in the SOI.
6. The health care sector comprises biotechnology, health care equipment and supplies, health care providers and services, life sciences tools and services, and pharmaceuticals in the SOI.
7. The materials sector comprises chemicals, construction materials, and metals and mining in the SOI.
8. Not part of the index.
| TG-4 | Semiannual Report |
TEMPLETON GROWTH VIP FUND
portfolio, attractive cost position and prolific cash flow generation, we believe the stock is not as cheap as it seems on headline earnings ratios given the firm’s practice of under-depreciating capital expenditure, and we worry about the sustainability of the double-digit dividend yield at spot metals prices. Although we continue to hold Norilsk in anticipation of a better exit opportunity, we have been more active buyers of Barrick thus far in 2017. Barrick’s stock came under pressure from both weaker gold prices and company-specific issues that included a cyanide spill at an Argentinian mine and a dispute with the government of Tanzania about the declared value of gold bullion exported by Acacia Mining,9 Barrick’s subsidiary. We expect such issues to ultimately prove transitory, and remain encouraged by the solid progress Barrick continues to make executing its overarching corporate strategy. Costs are trending down, the balance sheet is improving and management is pursuing a number of value-adding strategic partnerships with Goldcorp, Antofagasta, Zijin Mining Group and Shandong Gold Mining.9 We have used the recent weakness in gold prices and lull in market volatility to moderately increase exposure to select precious metals holdings, including Barrick.
Turning to contributors, we were encouraged by the outperformance of the Fund’s overweighted financials holdings.10 Sector outperformance during the period was led by European and Asian lenders, which offered more exposure to tailwinds associated with the French election outcome than the headwinds stemming from doubts about the viability of the global reflation trade. French bank Credit Agricole finished as the Fund’s top contributor among European banks, rallying on both the French election outcome and earnings results that exceeded expectations amid stronger performance from the firm’s capital markets division. Efforts to simplify Credit Agricole’s complex corporate structure and refocus on core French and Italian markets are progressing well, and we see additional scope for outperformance. We are encouraged by the continued progress in the European banking sector more generally, where earnings revisions have returned to a positive trajectory, regulatory capital has been largely rebuilt and the bulk of post-crisis re-regulation efforts are now complete. As economic data have picked up and certain risky political events have been favorably resolved, demand for credit has increased. Indeed, private loan growth is steadily rising in Europe, with favorable implications for bank earnings. Yet, little of this good news has made it into the price of European bank shares, which continue to look undervalued to us based on price-to-earnings
ratio, price-to-book value and dividend yields, relative to both their own history and to their U.S. peers. South Korean lender KB Financial Group was the top contributor among the Fund’s Asian financials holdings, rallying amid signs that a new government in South Korea could deliver fiscal stimulus, reform the rigid corporate chaebol structure (large, mostly family-owned conglomerates) and normalize economic ties with China. Prospects for improving corporate governance and political stability have combined with rising interest rates and genuine economic growth to benefit the banking sector in emerging Asia more generally. South Korea in particular is an excellent example of a banking market subject to all of these cyclical and structural tailwinds, but still trading at what we considered low valuation multiples.
We also continue to find value outside of the financials sector in South Korea, and note that South Korean semiconductor and consumer electronics manufacturer Samsung Electronics finished among the Fund’s top contributors during the period. Its stock benefited from the aforementioned macroeconomic tailwinds in addition to record first-quarter earnings and the company’s cancelation of billions of U.S. dollars’ worth of its Treasury shares, which sparked a raft of earnings upgrades from Wall Street analysts. Although sentiment on the stock is beginning to improve as results highlight operational progress, our analysis indicates to us that the market continues to undervalue the sustainability of Samsung’s dominant, low-cost position in core markets due to excessive focus on problem areas of lesser business impact. With its shares trading at what we considered low valuation multiples and the company holding a large net cash position, Samsung’s improving business mix shift and increasing focus on shareholder returns remain significantly undervalued, in our analysis.
Stock selection among overweighted telecommunication services holdings notably contributed, led by Japanese mobile operator and technology conglomerate SoftBank Group.11 Its shares rose to the highest levels in nearly two decades after the firm’s majority-owned U.S. telecommunications subsidiary, Sprint,9 reported better-than-expected sales and subscriber growth. The higher share price also reflected rising optimism that SoftBank might be able to execute a long-desired merger between Sprint and another major U.S. mobile operator, T-Mobile U.S.,9 under a new Republican administration. SoftBank Chairman Masayoshi Son recently met with President Donald Trump and pledged to invest US$50 billion and create
9. Not a Fund holding.
10. The financials sector comprises banks, capital markets, consumer finance and insurance in the SOI.
11. The telecommunication services sector comprises diversified telecommunication services and wireless telecommunication services in the SOI.
| Semiannual Report | TG-5 |
TEMPLETON GROWTH VIP FUND
50,000 jobs in the U.S., an indication that SoftBank is working to curry favor with the new administration to facilitate a deal that, if executed, we believe could represent a potential share price catalyst. Elsewhere at SoftBank, the core Japanese telecommunications business is providing strong, stable free cash flow; Chinese technology subsidiary Alibaba Group Holding9 continues to realize outsized growth; and the newly acquired U.K. semiconductor manufacturer ARM Holdings,9 while expensive and value-destructive in the near term, in our view, offers another exciting long-term growth driver. SoftBank’s stock remains excessively cheap on a sum-of-the-parts basis, in our analysis.
From a regional standpoint, stock selection drove outperformance among overweight Asian holdings. Stock-specific weakness offset the benefit of an underweighted allocation in the U.S. and an overweighted allocation in Europe. We were encouraged by positive developments in Europe and continue to find what we consider attractive bottom-up bargains in the region. Although economic indicators in the U.S. are softening and the political environment remains hostile, Europe is experiencing an encouraging combination of genuine economic momentum and a political climate now conducive to structural reform. To the first point, unemployment in Europe recently hit an eight-year low, gross domestic product growth in 2016 outpaced the U.S. for the first time since the global financial crisis, and corporate profits are solidly accelerating. Encouragingly, European equity markets attracted record weekly investment inflows during 2017’s second quarter. On the political front, Emmanuel Macron’s victory in the French presidential election (and subsequent success in parliamentary votes) creates a historic opportunity for genuine reform and closer European integration.
It is important to recognize the effect of currency movements on the Fund’s performance. In general, if the value of the U.S. dollar goes up compared with a foreign currency, an investment traded in that foreign currency will go down in value because it will be worth fewer U.S. dollars. This can have a negative effect on Fund performance. Conversely, when the U.S. dollar weakens in relation to a foreign currency, an investment traded in that foreign currency will increase in value, which can contribute to Fund performance. For the six months ended June 30, 2017, the U.S. dollar declined in value relative to most currencies. As a result, the Fund’s performance was positively affected by the portfolio’s substantial investment in securities with non-U.S. currency exposure. However, one cannot expect the same result in future periods.
More broadly, we continue to stress the value of fundamental investing, active stock picking and disciplined risk management in the current environment. Overall, we assess that equities offer selectively attractive opportunities and could continue to generate investor interest in a lower-yield, lower-return environment in which asset owners are under pressure to meet challenging return targets. However, in our opinion, this is not the point in the cycle to buy equities indiscriminately. We believe monetary policy has never been so loose and experimental, artificially depressing the price of money and skewing the risk-free rate (and therefore the assets that are priced off of it). Global debt levels have never been so high, generating a flood of liquidity that has saturated many financial assets. Political tensions remain elevated, and policymakers may struggle to turn pro-growth campaign promises into actual legislation. Meanwhile, we believe stocks have become commoditized into “factor buckets,” and are thought of today not as ownership stakes in long-term, cash-generating businesses, but instead as high-or-low-beta, high-or-low-quality, defensive-or-aggressive, risk-on-or-off, etc. These are all unusual conditions that create additional challenges for fundamentally oriented security analysts. Yet, it is our belief that all of these trends are temporary, as price eventually converges with value over time and a healthy market needs investors with the ability to facilitate price discovery. After a long, fallow period for active value investors, we were encouraged by 2016’s value rally and, despite the more recent pull-back, we anticipate a supportive environment for value investing over our long-term horizon.
Thank you for your participation in Templeton Growth VIP Fund. We look forward to serving your future investment needs.
The foregoing information reflects our analysis, opinions and portfolio holdings as of June 30, 2017, the end of the reporting period. The way we implement our main investment strategies and the resulting portfolio holdings may change depending on factors such as market and economic conditions. These opinions may not be relied upon as investment advice or an offer for a particular security. The information is not a complete analysis of every aspect of any market, country, industry, security or the Fund. Statements of fact are from sources considered reliable, but the investment manager makes no representation or warranty as to their completeness or accuracy. Although historical performance is no guarantee of future results, these insights may help you understand our investment management philosophy.
| TG-6 | Semiannual Report |
TEMPLETON GROWTH VIP FUND
Class 1 Fund Expenses
As an investor in a variable insurance contract (Contract) that indirectly provides for investment in an underlying mutual fund, you can incur transaction and/or ongoing expenses at both the Fund level and the Contract Level: (1) transaction expenses can include sales charges (loads) on purchases, surrender fees, transfer fees and premium taxes; and (2) ongoing expenses can include management fees, distribution and service (12b-1) fees, contract fees, annual maintenance fees, mortality and expense risk fees and other fees and expenses. All mutual funds and Contracts have some types of ongoing expenses. The table below shows Fund-level ongoing expenses and can help you understand these costs and compare them with those of other mutual funds offered through the Contract. The table assumes a $1,000 investment held for the six months indicated. Please refer to the Fund prospectus for additional information on operating expenses.
Actual Fund Expenses
The table below provides information about the actual account values and actual expenses in the columns under the heading “Actual.” In these columns the Fund’s actual return, which includes the effect of ongoing Fund expenses but does not include the effect of ongoing Contract expenses, is used to calculate the “Ending Account Value.” You can estimate the Fund-level expenses you paid during the period by following these steps (of course, your account value and expenses will differ from those in this illustration): Divide your account value by $1,000 (if your account had an $8,600 value, then $8,600 ÷ $1,000 = 8.6). Then multiply the result by the number under the headings “Actual” and “Fund-Level Expenses Paid During Period” (if Fund-Level Expenses Paid During Period were $7.50, then 8.6 × $7.50 = $64.50). In this illustration, the estimated expenses paid this period at the Fund level are $64.50.
Hypothetical Example for Comparison with Other Mutual Funds
Under the heading “Hypothetical” in the table, information is provided about hypothetical account values and hypothetical expenses based on the Fund’s actual expense ratio and an assumed rate of return of 5% per year before expenses, which is not the Fund’s actual return. This information may not be used to estimate the actual ending account balance or expenses you paid for the period, but it can help you compare ongoing costs of investing in the Fund with those of other mutual funds offered through the Contract. To do so, compare this 5% hypothetical example with the 5% hypothetical examples that appear in the shareholder reports of other funds offered through the Contract.
Please note that expenses shown in the table are meant to highlight ongoing costs at the Fund level only and do not reflect any ongoing expenses at the Contract level, or transaction expenses at either the Fund or Contract levels. In addition, while the Fund does not have transaction expenses, if the transaction and ongoing expenses at the Contract level were included, the expenses shown below would be higher. You should consult your Contract prospectus or disclosure document for more information.
| Actual (actual return after expenses) | Hypothetical (5% annual return before expenses) | |||||||||||||||||||||||
| Share Class | | Beginning Account Value 1/1/17 |
| | Ending Account Value 6/30/17 |
| | Fund-Level Expenses Paid During Period 1/1/17–6/30/17 |
1,2 | | Ending Account Value 6/30/17 | | | Fund-Level Expenses Paid During Period 1/1/17–6/30/17 |
1,2 | | Net Annualized Expense Ratio |
2 | ||||||
Class 1 | $1,000 | $1,110.20 | $4.24 | $1,020.78 | $4.06 | 0.81% | ||||||||||||||||||
1. Expenses are equal to the annualized expense ratio for the six-month period as indicated above — in the far right column — multiplied by the simple average account value over the period indicated, and then multiplied by 181/365 to reflect the one-half year period.
2. Reflects expenses after fee waivers and expense reimbursements. Does not include any ongoing expenses of the Contract for which the Fund is an investment option or acquired fund fees and expenses.
| Semiannual Report | TG-7 |
FRANKLIN TEMPLETON VARIABLE INSURANCE PRODUCTS TRUST
Financial Highlights
Templeton Growth VIP Fund
Six Months Ended (unaudited) | Year Ended December 31, | |||||||||||||||||||||||
| 2016 | 2015 | 2014 | 2013 | 2012 | ||||||||||||||||||||
| Class 1 | ||||||||||||||||||||||||
Per share operating performance (for a share outstanding throughout the period) | ||||||||||||||||||||||||
Net asset value, beginning of period | $13.93 | $13.54 | $14.85 | $15.47 | $12.16 | $10.27 | ||||||||||||||||||
|
| |||||||||||||||||||||||
| Income from investment operationsa: | ||||||||||||||||||||||||
Net investment incomeb | 0.19 | 0.26 | 0.28 | 0.38 | c | 0.22 | 0.27 | |||||||||||||||||
Net realized and unrealized gains (losses) | 1.34 | 0.96 | (1.17 | ) | (0.75 | ) | 3.49 | 1.88 | ||||||||||||||||
|
| |||||||||||||||||||||||
Total from investment operations | 1.53 | 1.22 | (0.89 | ) | (0.37 | ) | 3.71 | 2.15 | ||||||||||||||||
|
| |||||||||||||||||||||||
| Less distributions from: | ||||||||||||||||||||||||
Net investment income | (0.28 | ) | (0.31 | ) | (0.42 | ) | (0.25 | ) | (0.40 | ) | (0.26 | ) | ||||||||||||
Net realized gains | — | (0.52 | ) | — | — | — | — | |||||||||||||||||
|
| |||||||||||||||||||||||
Total distributions | (0.28 | ) | (0.83 | ) | (0.42 | ) | (0.25 | ) | (0.40 | ) | (0.26 | ) | ||||||||||||
|
| |||||||||||||||||||||||
Net asset value, end of period | $15.18 | $13.93 | $13.54 | $14.85 | $15.47 | $12.16 | ||||||||||||||||||
|
| |||||||||||||||||||||||
Total returnd | 11.02% | 9.90% | (6.24)% | (2.53)% | 31.05% | 21.40% | ||||||||||||||||||
| Ratios to average net assetse | ||||||||||||||||||||||||
Expenses | 0.81% | f,g | 0.82% | f | 0.80% | f | 0.78% | 0.78% | g | 0.78% | g | |||||||||||||
Net investment income | 2.53% | 2.01% | 1.96% | 2.46% | c | 1.62% | 2.31% | |||||||||||||||||
| Supplemental data | ||||||||||||||||||||||||
Net assets, end of period (000’s) | $472,768 | $453,997 | $468,548 | $572,860 | $588,409 | $476,954 | ||||||||||||||||||
Portfolio turnover rate | 16.05% | 22.88% | 20.92% | 17.46% | 11.60% | 18.73% | h | |||||||||||||||||
aThe amount shown for a share outstanding throughout the period may not correlate with the Statement of Operations for the period due to the timing of sales and repurchases of the Fund’s shares in relation to income earned and/or fluctuating fair value of the investments of the Fund.
bBased on average daily shares outstanding.
cNet investment income per share includes approximately $0.09 per share related to income received in the form of special dividends in connection with certain Fund holdings. Excluding this amount, the ratio of net investment income to average net assets would have been 1.88%.
dTotal return does not include fees, charges or expenses imposed by the variable annuity and life insurance contracts for which Franklin Templeton Variable Insurance Products Trust serves as an underlying investment vehicle. Total return is not annualized for periods less than one year.
eRatios are annualized for periods less than one year.
fBenefit of waiver and payments by affiliates rounds to less than 0.01%.
gBenefit of expense reduction rounds to less than 0.01%.
hExcludes the value of portfolio securities delivered as a result of a redemption in-kind.
| TG-8 | Semiannual Report | The accompanying notes are an integral part of these financial statements. |
FRANKLIN TEMPLETON VARIABLE INSURANCE PRODUCTS TRUST
FINANCIAL HIGHLIGHTS
Templeton Growth VIP Fund (continued)
Six Months Ended (unaudited) | Year Ended December 31, | |||||||||||||||||||||||
| 2016 | 2015 | 2014 | 2013 | 2012 | ||||||||||||||||||||
| Class 2 | ||||||||||||||||||||||||
Per share operating performance (for a share outstanding throughout the period) | ||||||||||||||||||||||||
Net asset value, beginning of period | $13.70 | $13.32 | $14.61 | $15.23 | $11.97 | $10.11 | ||||||||||||||||||
|
| |||||||||||||||||||||||
| Income from investment operationsa: | ||||||||||||||||||||||||
Net investment incomeb | 0.16 | 0.23 | 0.25 | 0.34 | c | 0.19 | 0.21 | |||||||||||||||||
Net realized and unrealized gains (losses) | 1.33 | 0.94 | (1.16 | ) | (0.75 | ) | 3.44 | 1.88 | ||||||||||||||||
|
| |||||||||||||||||||||||
Total from investment operations | 1.49 | 1.17 | (0.91 | ) | (0.41 | ) | 3.63 | 2.09 | ||||||||||||||||
|
| |||||||||||||||||||||||
| Less distributions from: | ||||||||||||||||||||||||
Net investment income | (0.24 | ) | (0.27 | ) | (0.38 | ) | (0.21 | ) | (0.37 | ) | (0.23 | ) | ||||||||||||
Net realized gains | — | (0.52 | ) | — | — | — | — | |||||||||||||||||
|
| |||||||||||||||||||||||
Total distributions | (0.24 | ) | (0.79 | ) | (0.38 | ) | (0.21 | ) | (0.37 | ) | (0.23 | ) | ||||||||||||
|
| |||||||||||||||||||||||
Net asset value, end of period | $14.95 | $13.70 | $13.32 | $14.61 | $15.23 | $11.97 | ||||||||||||||||||
|
| |||||||||||||||||||||||
Total returnd | 10.93% | 9.62% | (6.49)% | (2.81)% | 30.82% | 21.07% | ||||||||||||||||||
| Ratios to average net assetse | ||||||||||||||||||||||||
Expenses | 1.06% | f,g | 1.07% | f | 1.05% | f | 1.03% | 1.03% | g | 1.03% | g | |||||||||||||
Net investment income | 2.28% | 1.76% | 1.71% | 2.21% | c | 1.37% | 2.06% | |||||||||||||||||
| Supplemental data | ||||||||||||||||||||||||
Net assets, end of period (000’s) | $892,615 | $876,128 | $921,895 | $1,171,896 | $1,450,304 | $1,352,554 | ||||||||||||||||||
Portfolio turnover rate | 16.05% | 22.88% | 20.92% | 17.46% | 11.60% | 18.73% | h | |||||||||||||||||
aThe amount shown for a share outstanding throughout the period may not correlate with the Statement of Operations for the period due to the timing of sales and repurchases of the Fund’s shares in relation to income earned and/or fluctuating fair value of the investments of the Fund.
bBased on average daily shares outstanding.
cNet investment income per share includes approximately $0.09 per share related to income received in the form of special dividends in connection with certain Fund holdings. Excluding this amount, the ratio of net investment income to average net assets would have been 1.63%.
dTotal return does not include fees, charges or expenses imposed by the variable annuity and life insurance contracts for which Franklin Templeton Variable Insurance Products Trust serves as an underlying investment vehicle. Total return is not annualized for periods less than one year.
eRatios are annualized for periods less than one year.
fBenefit of waiver and payments by affiliates rounds to less than 0.01%.
gBenefit of expense reduction rounds to less than 0.01%.
hExcludes the value of portfolio securities delivered as a result of a redemption in-kind.
| The accompanying notes are an integral part of these financial statements. | Semiannual Report | TG-9 |
FRANKLIN TEMPLETON VARIABLE INSURANCE PRODUCTS TRUST
FINANCIAL HIGHLIGHTS
Templeton Growth VIP Fund (continued)
Six Months Ended (unaudited) | Year Ended December 31, | |||||||||||||||||||||||
| 2016 | 2015 | 2014 | 2013 | 2012 | ||||||||||||||||||||
| Class 4 | ||||||||||||||||||||||||
Per share operating performance (for a share outstanding throughout the period) | ||||||||||||||||||||||||
Net asset value, beginning of period | $13.83 | $13.44 | $14.73 | $15.35 | $12.07 | $10.19 | ||||||||||||||||||
|
| |||||||||||||||||||||||
| Income from investment operationsa: | ||||||||||||||||||||||||
Net investment incomeb | 0.16 | 0.22 | 0.23 | 0.33 | c | 0.17 | 0.20 | |||||||||||||||||
Net realized and unrealized gains (losses) | 1.34 | 0.94 | (1.16 | ) | (0.76 | ) | 3.47 | 1.90 | ||||||||||||||||
|
| |||||||||||||||||||||||
Total from investment operations | 1.50 | 1.16 | (0.93 | ) | (0.43 | ) | 3.64 | 2.10 | ||||||||||||||||
|
| |||||||||||||||||||||||
| Less distributions from: | ||||||||||||||||||||||||
Net investment income | (0.22 | ) | (0.25 | ) | (0.36 | ) | (0.19 | ) | (0.36 | ) | (0.22 | ) | ||||||||||||
Net realized gains | — | (0.52 | ) | — | — | — | — | |||||||||||||||||
|
| |||||||||||||||||||||||
Total distributions | (0.22 | ) | (0.77 | ) | (0.36 | ) | (0.19 | ) | (0.36 | ) | (0.22 | ) | ||||||||||||
|
| |||||||||||||||||||||||
Net asset value, end of period | $15.11 | $13.83 | $13.44 | $14.73 | $15.35 | $12.07 | ||||||||||||||||||
|
| |||||||||||||||||||||||
Total returnd | 10.89% | 9.47% | (6.54)% | (2.88)% | 30.64% | 21.02% | ||||||||||||||||||
| Ratios to average net assetse | ||||||||||||||||||||||||
Expenses | 1.16% | f,g | 1.17% | f | 1.15% | f | 1.13% | 1.13% | g | 1.13% | g | |||||||||||||
Net investment income | 2.18% | 1.66% | 1.61% | 2.11% | c | 1.27% | 1.96% | |||||||||||||||||
| Supplemental data | ||||||||||||||||||||||||
Net assets, end of period (000’s) | $41,221 | $43,286 | $47,777 | $59,989 | $72,683 | $67,158 | ||||||||||||||||||
Portfolio turnover rate | 16.05% | 22.88% | 20.92% | 17.46% | 11.60% | 18.73% | h | |||||||||||||||||
aThe amount shown for a share outstanding throughout the period may not correlate with the Statement of Operations for the period due to the timing of sales and repurchases of the Fund’s shares in relation to income earned and/or fluctuating fair value of the investments of the Fund.
bBased on average daily shares outstanding.
cNet investment income per share includes approximately $0.09 per share related to income received in the form of special dividends in connection with certain Fund holdings. Excluding this amount, the ratio of net investment income to average net assets would have been 1.53%.
dTotal return does not include fees, charges or expenses imposed by the variable annuity and life insurance contracts for which Franklin Templeton Variable Insurance Products Trust serves as an underlying investment vehicle. Total return is not annualized for periods less than one year.
eRatios are annualized for periods less than one year.
fBenefit of waiver and payments by affiliates rounds to less than 0.01%.
gBenefit of expense reduction rounds to less than 0.01%.
hExcludes the value of portfolio securities delivered as a result of a redemption in-kind.
| TG-10 | Semiannual Report | The accompanying notes are an integral part of these financial statements. |
FRANKLIN TEMPLETON VARIABLE INSURANCE PRODUCTS TRUST
Statement of Investments, June 30, 2017 (unaudited)
Templeton Growth VIP Fund
| ||||||||||||||
| Country | Shares | Value | ||||||||||||
| Common Stocks 97.4% | ||||||||||||||
Aerospace & Defense 1.3% | ||||||||||||||
BAE Systems PLC | United Kingdom | 2,298,132 | $ | 18,963,392 | ||||||||||
|
| |||||||||||||
Air Freight & Logistics 0.8% | ||||||||||||||
United Parcel Service Inc., B | United States | 99,220 | 10,972,740 | |||||||||||
|
| |||||||||||||
Airlines 0.7% | ||||||||||||||
Deutsche Lufthansa AG | Germany | 447,422 | 10,183,025 | |||||||||||
|
| |||||||||||||
Automobiles 3.7% | ||||||||||||||
Hero Motocorp Ltd. | India | 281,730 | 16,137,130 | |||||||||||
Hyundai Motor Co. | South Korea | 140,600 | 19,586,962 | |||||||||||
Nissan Motor Co. Ltd. | Japan | 1,696,510 | 16,861,787 | |||||||||||
|
| |||||||||||||
| 52,585,879 | ||||||||||||||
|
| |||||||||||||
Banks 15.8% | ||||||||||||||
Bangkok Bank PCL, fgn | Thailand | 1,230,200 | 7,144,735 | |||||||||||
Bangkok Bank PCL, NVDR | Thailand | 913,600 | 4,982,783 | |||||||||||
Barclays PLC | United Kingdom | 4,370,990 | 11,543,436 | |||||||||||
BNP Paribas SA | France | 243,927 | 17,570,131 | |||||||||||
Citigroup Inc. | United States | 532,290 | 35,599,555 | |||||||||||
Credit Agricole SA | France | 970,876 | 15,620,027 | |||||||||||
DBS Group Holdings Ltd. | Singapore | 932,690 | 14,049,964 | |||||||||||
HSBC Holdings PLC | United Kingdom | 2,362,494 | 21,982,670 | |||||||||||
ING Groep NV | Netherlands | 737,796 | 12,725,487 | |||||||||||
JPMorgan Chase & Co. | United States | 169,570 | 15,498,698 | |||||||||||
KB Financial Group Inc. | South Korea | 552,314 | 27,834,468 | |||||||||||
| a | Standard Chartered PLC | United Kingdom | 2,433,563 | 24,635,978 | ||||||||||
SunTrust Banks Inc. | United States | 218,530 | 12,395,022 | |||||||||||
|
| |||||||||||||
| 221,582,954 | ||||||||||||||
|
| |||||||||||||
Biotechnology 3.9% | ||||||||||||||
Amgen Inc. | United States | 155,440 | 26,771,431 | |||||||||||
| a | Celgene Corp. | United States | 60,320 | 7,833,759 | ||||||||||
Gilead Sciences Inc. | United States | 283,260 | 20,049,143 | |||||||||||
|
| |||||||||||||
| 54,654,333 | ||||||||||||||
|
| |||||||||||||
Capital Markets 1.6% | ||||||||||||||
Man Group PLC | United Kingdom | 2,385,372 | 4,809,739 | |||||||||||
UBS Group AG | Switzerland | 887,140 | 15,027,018 | |||||||||||
Value Partners Group Ltd. | Hong Kong | 2,850,000 | 2,595,306 | |||||||||||
|
| |||||||||||||
| 22,432,063 | ||||||||||||||
|
| |||||||||||||
Chemicals 1.3% | ||||||||||||||
Akzo Nobel NV | Netherlands | 208,005 | 18,078,505 | |||||||||||
|
| |||||||||||||
Communications Equipment 2.6% | ||||||||||||||
Cisco Systems Inc. | United States | 633,880 | 19,840,444 | |||||||||||
Ericsson, B | Sweden | 1,947,362 | 13,932,027 | |||||||||||
| a | NetScout Systems Inc. | United States | 86,600 | 2,979,040 | ||||||||||
|
| |||||||||||||
| 36,751,511 | ||||||||||||||
|
| |||||||||||||
Construction Materials 0.2% | ||||||||||||||
CRH PLC | Ireland | 61,741 | 2,184,470 | |||||||||||
|
| |||||||||||||
Consumer Finance 1.3% | ||||||||||||||
Ally Financial Inc. | United States | 160,390 | 3,352,151 | |||||||||||
Capital One Financial Corp. | United States | 187,470 | 15,488,771 | |||||||||||
|
| |||||||||||||
| 18,840,922 | ||||||||||||||
|
| |||||||||||||
| Semiannual Report | TG-11 |
FRANKLIN TEMPLETON VARIABLE INSURANCE PRODUCTS TRUST
STATEMENT OF INVESTMENTS (UNAUDITED)
Templeton Growth VIP Fund (continued)
| Country | Shares | Value | ||||||||||||
| Common Stocks (continued) | ||||||||||||||
Diversified Telecommunication Services 3.2% | ||||||||||||||
| b | China Telecom Corp. Ltd., ADR | China | 179,195 | $ | 8,588,816 | |||||||||
China Telecom Corp. Ltd., H | China | 2,006,000 | 953,189 | |||||||||||
Singapore Telecommunications Ltd. | Singapore | 7,861,800 | 22,212,669 | |||||||||||
Telefonica SA | Spain | 1,290,675 | 13,324,484 | |||||||||||
|
| |||||||||||||
| 45,079,158 | ||||||||||||||
|
| |||||||||||||
Energy Equipment & Services 0.7% | ||||||||||||||
Halliburton Co. | United States | 217,950 | 9,308,645 | |||||||||||
Helmerich & Payne Inc. | United States | 19,100 | 1,037,894 | |||||||||||
|
| |||||||||||||
| 10,346,539 | ||||||||||||||
|
| |||||||||||||
Food & Staples Retailing 2.0% | ||||||||||||||
Metro AG | Germany | 269,320 | 9,092,027 | |||||||||||
| a | Tesco PLC | United Kingdom | 2,246,078 | 4,938,462 | ||||||||||
Walgreens Boots Alliance Inc. | United States | 173,340 | 13,574,256 | |||||||||||
|
| |||||||||||||
| 27,604,745 | ||||||||||||||
|
| |||||||||||||
Health Care Equipment & Supplies 1.8% | ||||||||||||||
Getinge AB, B | Sweden | 925,050 | 18,113,251 | |||||||||||
Medtronic PLC | United States | 74,440 | 6,606,550 | |||||||||||
|
| |||||||||||||
| 24,719,801 | ||||||||||||||
|
| |||||||||||||
Health Care Providers & Services 2.2% | ||||||||||||||
AmerisourceBergen Corp. | United States | 160,900 | 15,209,877 | |||||||||||
Cardinal Health Inc. | United States | 196,970 | 15,347,902 | |||||||||||
|
| |||||||||||||
| 30,557,779 | ||||||||||||||
|
| |||||||||||||
Household Durables 1.3% | ||||||||||||||
Panasonic Corp. | Japan | 1,349,530 | 18,284,071 | |||||||||||
|
| |||||||||||||
Industrial Conglomerates 1.1% | ||||||||||||||
Siemens AG | Germany | 107,392 | 14,763,155 | |||||||||||
|
| |||||||||||||
Insurance 5.1% | ||||||||||||||
Aegon NV | Netherlands | 2,505,936 | 12,797,814 | |||||||||||
American International Group Inc. | United States | 312,040 | 19,508,741 | |||||||||||
AXA SA | France | 790,268 | 21,619,273 | |||||||||||
China Life Insurance Co. Ltd., H | China | 6,041,230 | 18,453,887 | |||||||||||
|
| |||||||||||||
| 72,379,715 | ||||||||||||||
|
| |||||||||||||
Internet Software & Services 2.9% | ||||||||||||||
| a | Alphabet Inc., A | United States | 25,760 | 23,948,557 | ||||||||||
| a | Baidu Inc., ADR | China | 97,340 | 17,410,232 | ||||||||||
|
| |||||||||||||
| 41,358,789 | ||||||||||||||
|
| |||||||||||||
IT Services 0.5% | ||||||||||||||
DXC Technology Co. | United States | 92,729 | 7,114,169 | |||||||||||
|
| |||||||||||||
Life Sciences Tools & Services 0.5% | ||||||||||||||
QIAGEN NV | Netherlands | 205,690 | 6,842,901 | |||||||||||
|
| |||||||||||||
Machinery 1.1% | ||||||||||||||
| a | Navistar International Corp. | United States | 598,440 | 15,697,081 | ||||||||||
|
| |||||||||||||
Media 4.7% | ||||||||||||||
Comcast Corp., A | United States | 594,404 | 23,134,204 | |||||||||||
SES SA, IDR | Luxembourg | 295,280 | 6,922,745 | |||||||||||
Sky PLC | United Kingdom | 1,499,257 | 19,411,402 | |||||||||||
| TG-12 | Semiannual Report |
FRANKLIN TEMPLETON VARIABLE INSURANCE PRODUCTS TRUST
STATEMENT OF INVESTMENTS (UNAUDITED)
Templeton Growth VIP Fund (continued)
| Country | Shares | Value | ||||||||||||
Common Stocks (continued) | ||||||||||||||
Media (continued) | ||||||||||||||
Twenty-First Century Fox Inc., A | United States | 591,972 | $ | 16,776,486 | ||||||||||
|
| |||||||||||||
| 66,244,837 | ||||||||||||||
|
| |||||||||||||
Metals & Mining 2.9% | ||||||||||||||
Barrick Gold Corp. | Canada | 865,310 | 13,767,082 | |||||||||||
MMC Norilsk Nickel PJSC, ADR | Russia | 695,600 | 9,599,280 | |||||||||||
Sumitomo Metal Mining Co. Ltd. | Japan | 276,500 | 3,688,387 | |||||||||||
Wheaton Precious Metals Corp. | Canada | 680,489 | 13,524,204 | |||||||||||
|
| |||||||||||||
| 40,578,953 | ||||||||||||||
|
| |||||||||||||
Multiline Retail 0.3% | ||||||||||||||
Ryohin Keikaku Co. Ltd. | Japan | 19,340 | 4,826,188 | |||||||||||
|
| |||||||||||||
Multi-Utilities 1.3% | ||||||||||||||
innogy SE | Germany | 410,700 | 16,168,292 | |||||||||||
Veolia Environnement SA | France | 91,200 | 1,927,204 | |||||||||||
|
| |||||||||||||
| 18,095,496 | ||||||||||||||
|
| |||||||||||||
Oil, Gas & Consumable Fuels 10.1% | ||||||||||||||
Apache Corp. | United States | 221,140 | 10,599,240 | |||||||||||
BP PLC | United Kingdom | 3,841,161 | 22,154,633 | |||||||||||
Cenovus Energy Inc. | Canada | 108,800 | 802,475 | |||||||||||
ConocoPhillips | United States | 361,710 | 15,900,772 | |||||||||||
Eni SpA | Italy | 1,331,279 | 20,011,799 | |||||||||||
Galp Energia SGPS SA, B | Portugal | 1,013,670 | 15,347,495 | |||||||||||
| a | Husky Energy Inc. | Canada | 616,720 | 7,003,910 | ||||||||||
Kunlun Energy Co. Ltd. | China | 17,103,030 | 14,501,240 | |||||||||||
Royal Dutch Shell PLC, A | United Kingdom | 15,359 | 407,119 | |||||||||||
Royal Dutch Shell PLC, B | United Kingdom | 1,303,219 | 35,011,103 | |||||||||||
|
| |||||||||||||
| 141,739,786 | ||||||||||||||
|
| |||||||||||||
Personal Products 0.3% | ||||||||||||||
Coty Inc., A | United States | 236,700 | 4,440,492 | |||||||||||
|
| |||||||||||||
Pharmaceuticals 9.1% | ||||||||||||||
Allergan PLC | United States | 106,454 | 25,877,903 | |||||||||||
Eli Lilly & Co. | United States | 192,470 | 15,840,281 | |||||||||||
Merck KGaA | Germany | 127,234 | 15,368,968 | |||||||||||
Perrigo Co. PLC | United States | 192,570 | 14,542,886 | |||||||||||
Roche Holding AG | Switzerland | 45,563 | 11,605,199 | |||||||||||
Sanofi | France | 146,857 | 14,050,523 | |||||||||||
Teva Pharmaceutical Industries Ltd., ADR | Israel | 904,490 | 30,047,158 | |||||||||||
|
| |||||||||||||
| 127,332,918 | ||||||||||||||
|
| |||||||||||||
Semiconductors & Semiconductor Equipment 0.2% | ||||||||||||||
| a | First Solar Inc. | United States | 74,720 | 2,979,834 | ||||||||||
|
| |||||||||||||
Software 4.6% | ||||||||||||||
Microsoft Corp. | United States | 311,849 | 21,495,752 | |||||||||||
Oracle Corp. | United States | 857,350 | 42,987,529 | |||||||||||
|
| |||||||||||||
| 64,483,281 | ||||||||||||||
|
| |||||||||||||
Specialty Retail 0.7% | ||||||||||||||
Kingfisher PLC | United Kingdom | 2,677,124 | 10,485,674 | |||||||||||
|
| |||||||||||||
| Semiannual Report | TG-13 |
FRANKLIN TEMPLETON VARIABLE INSURANCE PRODUCTS TRUST
STATEMENT OF INVESTMENTS (UNAUDITED)
Templeton Growth VIP Fund (continued)
| Country | Shares | Value | ||||||||||||
Common Stocks (continued) | ||||||||||||||
| Technology Hardware, Storage & Peripherals 4.7% | ||||||||||||||
Apple Inc. | United States | 164,980 | $ | 23,760,420 | ||||||||||
Hewlett Packard Enterprise Co. | United States | 100,890 | 1,673,765 | |||||||||||
Samsung Electronics Co. Ltd. | South Korea | 19,450 | 40,380,329 | |||||||||||
|
| |||||||||||||
| 65,814,514 | ||||||||||||||
|
| |||||||||||||
| Wireless Telecommunication Services 2.9% | ||||||||||||||
China Mobile Ltd. | China | 636,000 | 6,748,756 | |||||||||||
SoftBank Group Corp. | Japan | 247,120 | 19,985,337 | |||||||||||
Turkcell Iletisim Hizmetleri AS, ADR | Turkey | 830,743 | 6,812,093 | |||||||||||
Vodafone Group PLC | United Kingdom | 2,681,677 | 7,606,048 | |||||||||||
|
| |||||||||||||
| 41,152,234 | ||||||||||||||
|
| |||||||||||||
Total Common Stocks (Cost $1,100,242,083) | 1,370,151,904 | |||||||||||||
|
| |||||||||||||
| Principal Amount | ||||||||||||||
Corporate Bonds (Cost $8,457,000) 0.7% | ||||||||||||||
Oil, Gas & Consumable Fuels 0.7% | ||||||||||||||
| c | Chesapeake Energy Corp., secured note, second lien, 144A, 8.00%, 12/15/22 | United States | $ | 9,117,000 | 9,675,416 | |||||||||
|
| |||||||||||||
Total Investments before Short Term Investments | 1,379,827,320 | |||||||||||||
|
| |||||||||||||
Short Term Investments 1.9% | ||||||||||||||
Time Deposits 1.9% | ||||||||||||||
Bank of Montreal, 1.00%, 7/03/17 | United States | 10,000,000 | 10,000,000 | |||||||||||
Royal Bank of Canada, 1.02%, 7/03/17 | United States | 16,800,000 | 16,800,000 | |||||||||||
|
| |||||||||||||
Total Time Deposits (Cost $26,800,000) | 26,800,000 | |||||||||||||
|
| |||||||||||||
| d | Investments from Cash Collateral Received for Loaned Securities (Cost $333,200) 0.0%† | |||||||||||||
| Shares | ||||||||||||||
Money Market Funds 0.0%† | ||||||||||||||
| e,f | Institutional Fiduciary Trust Money Market Portfolio, 0.58% | United States | 333,200 | 333,200 | ||||||||||
|
| |||||||||||||
Total Investments (Cost $1,135,832,283) 100.0% | 1,406,960,520 | |||||||||||||
Other Assets, less Liabilities (0.0)%† | (356,005 | ) | ||||||||||||
|
| |||||||||||||
Net Assets 100.0% | $ | 1,406,604,515 | ||||||||||||
|
| |||||||||||||
See Abbreviations on page TG-25.
†Rounds to less than 0.1% of net assets.
aNon-income producing.
bA portion or all of the security is on loan at June 30, 2017. See Note 1(c).
cSecurity was purchased pursuant to Rule 144A under the Securities Act of 1933 and may be sold in transactions exempt from registration only to qualified institutional buyers or in a public offering registered under the Securities Act of 1933. This security has been deemed liquid under guidelines approved by the Trust’s Board of Trustees.
dSee Note 1(c) regarding securities on loan.
eSee Note 3(e) regarding investments in affiliated management investment companies.
fThe rate shown is the annualized seven-day yield at period end.
| TG-14 | Semiannual Report | The accompanying notes are an integral part of these financial statements. |
FRANKLIN TEMPLETON VARIABLE INSURANCE PRODUCTS TRUST
Financial Statements
Statement of Assets and Liabilities
June 30, 2017 (unaudited)
Templeton Growth VIP Fund | ||||
Assets: | ||||
Investments in securities: | ||||
Cost - Unaffiliated issuers | $ | 1,135,499,083 | ||
Cost - Non-controlled affiliates (Note 3e) | 333,200 | |||
|
| |||
Total cost of investments | $ | 1,135,832,283 | ||
|
| |||
Value - Unaffiliated issuers | $ | 1,406,627,320 | ||
Value - Non-controlled affiliates (Note 3e) | 333,200 | |||
|
| |||
Total value of investments (includes securities loaned in the amount of $325,924) | 1,406,960,520 | |||
Cash | 195,573 | |||
Foreign currency, at value (cost $13,131) | 13,131 | |||
Receivables: | ||||
Investment securities sold | 3,335,095 | |||
Capital shares sold | 199,456 | |||
Dividends and interest | 4,172,303 | |||
European Union tax reclaims | 825,248 | |||
Other assets | 903 | |||
|
| |||
Total assets | 1,415,702,229 | |||
|
| |||
Liabilities: | ||||
Payables: | ||||
Investment securities purchased | 6,579,390 | |||
Capital shares redeemed | 581,909 | |||
Management fees | 899,854 | |||
Distribution fees | 398,997 | |||
Payable upon return of securities loaned | 333,200 | |||
Deferred tax | 48,836 | |||
Accrued expenses and other liabilities | 255,528 | |||
|
| |||
Total liabilities | 9,097,714 | |||
|
| |||
Net assets, at value | $ | 1,406,604,515 | ||
|
| |||
Net assets consist of: | ||||
Paid-in capital | $ | 1,082,199,845 | ||
Undistributed net investment income | 18,159,949 | |||
Net unrealized appreciation (depreciation) | 271,124,226 | |||
Accumulated net realized gain (loss) | 35,120,495 | |||
|
| |||
Net assets, at value | $ | 1,406,604,515 | ||
|
| |||
| Class 1: | ||||
Net assets, at value | $ | 472,768,230 | ||
|
| |||
Shares outstanding | 31,135,566 | |||
|
| |||
Net asset value and maximum offering price per share | $ | 15.18 | ||
|
| |||
| Class 2: | ||||
Net assets, at value | $ | 892,615,437 | ||
|
| |||
Shares outstanding | 59,702,574 | |||
|
| |||
Net asset value and maximum offering price per share | $ | 14.95 | ||
|
| |||
| Class 4: | ||||
Net assets, at value | $ | 41,220,848 | ||
|
| |||
Shares outstanding | 2,728,532 | |||
|
| |||
Net asset value and maximum offering price per share | $ | 15.11 | ||
|
| |||
| The accompanying notes are an integral part of these financial statements. | Semiannual Report | TG-15 |
FRANKLIN TEMPLETON VARIABLE INSURANCE PRODUCTS TRUST
FINANCIAL STATEMENTS
Statement of Operations
for the six months ended June 30, 2017 (unaudited)
| Templeton Growth VIP Fund | ||||
Investment income: | ||||
Dividends (net of foreign taxes of $2,065,266) | $ | 22,360,577 | ||
Interest | 755,954 | |||
Income from securities loaned (net of fees and rebates) | 127,579 | |||
|
| |||
Total investment income | 23,244,110 | |||
|
| |||
Expenses: | ||||
Management fees (Note 3a) | 5,419,292 | |||
Distribution fees: (Note 3c) | ||||
Class 2 | 1,103,308 | |||
Class 4 | 74,094 | |||
Custodian fees (Note 4) | 51,900 | |||
Reports to shareholders | 105,771 | |||
Professional fees | 64,604 | |||
Trustees’ fees and expenses | 3,150 | |||
Other | 20,901 | |||
|
| |||
Total expenses | 6,843,020 | |||
Expense reductions (Note 4) | (7,797 | ) | ||
Expenses waived/paid by affiliates (Note 3e) | (18,200 | ) | ||
|
| |||
Net expenses | 6,817,023 | |||
|
| |||
Net investment income | 16,427,087 | |||
|
| |||
Realized and unrealized gains (losses): | ||||
Net realized gain (loss) from: | ||||
Investments | 53,354,700 | |||
Foreign currency transactions | 93,162 | |||
|
| |||
Net realized gain (loss) | 53,447,862 | |||
|
| |||
Net change in unrealized appreciation (depreciation) on: | ||||
Investments | 75,672,097 | |||
Translation of other assets and liabilities denominated in foreign currencies | 213,059 | |||
Change in deferred taxes on unrealized appreciation | (48,836 | ) | ||
|
| |||
Net change in unrealized appreciation (depreciation) | 75,836,320 | |||
|
| |||
Net realized and unrealized gain (loss) | 129,284,182 | |||
|
| |||
Net increase (decrease) in net assets resulting from operations | $ | 145,711,269 | ||
|
| |||
| TG-16 | Semiannual Report | The accompanying notes are an integral part of these financial statements. |
FRANKLIN TEMPLETON VARIABLE INSURANCE PRODUCTS TRUST
FINANCIAL STATEMENTS
Statements of Changes in Net Assets
| Templeton Growth VIP Fund | ||||||||
| Six Months Ended June 30, 2017 (unaudited) | Year Ended December 31, 2016 | |||||||
Increase (decrease) in net assets: | ||||||||
Operations: | ||||||||
Net investment income | $ | 16,427,087 | $ | 24,853,200 | ||||
Net realized gain (loss) | 53,447,862 | (7,519,261 | ) | |||||
Net change in unrealized appreciation (depreciation) | 75,836,320 | 106,000,252 | ||||||
|
| |||||||
Net increase (decrease) in net assets resulting from operations | 145,711,269 | 123,334,191 | ||||||
|
| |||||||
Distributions to shareholders from: | ||||||||
Net investment income: | ||||||||
Class 1 | (8,645,537 | ) | (10,324,588 | ) | ||||
Class 2 | (14,420,565 | ) | (17,569,556 | ) | ||||
Class 4 | (607,359 | ) | (854,329 | ) | ||||
Net realized gains: | ||||||||
Class 1 | — | (17,221,955 | ) | |||||
Class 2 | — | (33,791,595 | ) | |||||
Class 4 | — | (1,749,580 | ) | |||||
|
| |||||||
Total distributions to shareholders | (23,673,461 | ) | (81,511,603 | ) | ||||
|
| |||||||
Capital share transactions: (Note 2) | ||||||||
Class 1 | (21,721,782 | ) | (29,290,497 | ) | ||||
Class 2 | (61,234,691 | ) | (71,266,569 | ) | ||||
Class 4 | (5,888,489 | ) | (6,073,422 | ) | ||||
|
| |||||||
Total capital share transactions | (88,844,962 | ) | (106,630,488 | ) | ||||
|
| |||||||
Net increase (decrease) in net assets | 33,192,846 | (64,807,900 | ) | |||||
Net assets: | ||||||||
Beginning of period | 1,373,411,669 | 1,438,219,569 | ||||||
|
| |||||||
End of period | $ | 1,406,604,515 | $ | 1,373,411,669 | ||||
|
| |||||||
Undistributed net investment income included in net assets: | ||||||||
End of period | $ | 18,159,949 | $ | 25,406,323 | ||||
|
| |||||||
| The accompanying notes are an integral part of these financial statements. | Semiannual Report | TG-17 |
FRANKLIN TEMPLETON VARIABLE INSURANCE PRODUCTS TRUST
Notes to Financial Statements (unaudited)
Templeton Growth VIP Fund
1. Organization and Significant Accounting Policies
Franklin Templeton Variable Insurance Products Trust (Trust) is registered under the Investment Company Act of 1940 (1940 Act) as an open-end management investment company, consisting of eighteen separate funds and applies the specialized accounting and reporting guidance in U.S. Generally Accepted Accounting Principles (U.S. GAAP). Templeton Growth VIP Fund (Fund) is included in this report. Shares of the Fund are generally sold only to insurance company separate accounts to fund the benefits of variable life insurance policies or variable annuity contracts. The Fund offers three classes of shares: Class 1, Class 2 and Class 4. Each class of shares differs by its distribution fees, voting rights on matters affecting a single class and its exchange privilege.
The following summarizes the Fund’s significant accounting policies.
a. Financial Instrument Valuation
The Fund’s investments in financial instruments are carried at fair value daily. Fair value is the price that would be received to sell an asset or paid to transfer a liability in an orderly transaction between market participants on the measurement date. The Fund calculates the net asset value (NAV) per share as of 4 p.m. Eastern time each day the New York Stock Exchange (NYSE) is open for trading. Under compliance policies and procedures approved by the Trust’s Board of Trustees (the Board), the Fund’s administrator has responsibility for oversight of valuation, including leading the cross-functional Valuation Committee (VC). The VC provides administration and oversight of the Fund’s valuation policies and procedures, which are approved annually by the Board. Among other things, these procedures allow the Fund to utilize independent pricing services, quotations from securities and financial instrument dealers, and other market sources to determine fair value.
Equity securities listed on an exchange or on the NASDAQ National Market System are valued at the last quoted sale price or the official closing price of the day, respectively. Foreign equity securities are valued as of the close of trading on the foreign stock exchange on which the security is primarily traded, or as of 4 p.m. Eastern time. The value is then converted into its U.S. dollar equivalent at the foreign exchange rate in effect at 4 p.m. Eastern time on the day that the value of the security is determined. Over-the-counter (OTC) securities are
valued within the range of the most recent quoted bid and ask prices. Securities that trade in multiple markets or on multiple exchanges are valued according to the broadest and most representative market. Certain equity securities are valued based upon fundamental characteristics or relationships to similar securities.
Debt securities generally trade in the OTC market rather than on a securities exchange. The Fund’s pricing services use multiple valuation techniques to determine fair value. In instances where sufficient market activity exists, the pricing services may utilize a market-based approach through which quotes from market makers are used to determine fair value. In instances where sufficient market activity may not exist or is limited, the pricing services also utilize proprietary valuation models which may consider market characteristics such as benchmark yield curves, credit spreads, estimated default rates, anticipated market interest rate volatility, coupon rates, anticipated timing of principal repayments, underlying collateral, and other unique security features in order to estimate the relevant cash flows, which are then discounted to calculate the fair value.
Investments in open-end mutual funds are valued at the closing NAV. Investments in time deposits are valued at cost, which approximates fair value.
The Fund has procedures to determine the fair value of financial instruments for which market prices are not reliable or readily available. Under these procedures, the VC convenes on a regular basis to review such financial instruments and considers a number of factors, including significant unobservable valuation inputs, when arriving at fair value. The VC primarily employs a market-based approach which may use related or comparable assets or liabilities, recent transactions, market multiples, book values, and other relevant information for the investment to determine the fair value of the investment. An income-based valuation approach may also be used in which the anticipated future cash flows of the investment are discounted to calculate fair value. Discounts may also be applied due to the nature or duration of any restrictions on the disposition of the investments. Due to the inherent uncertainty of valuations of such investments, the fair values may differ significantly from the values that would have been used had an active market existed. The VC employs various methods for calibrating these valuation approaches including a regular review of key inputs and assumptions, transactional back-testing or disposition analysis, and reviews of any related market activity.
| TG-18 | Semiannual Report |
FRANKLIN TEMPLETON VARIABLE INSURANCE PRODUCTS TRUST
NOTES TO FINANCIAL STATEMENTS (UNAUDITED)
Templeton Growth VIP Fund (continued)
Trading in securities on foreign securities stock exchanges and OTC markets may be completed before 4 p.m. Eastern time. In addition, trading in certain foreign markets may not take place on every Fund’s business day. Occasionally, events occur between the time at which trading in a foreign security is completed and 4 p.m. Eastern time that might call into question the reliability of the value of a portfolio security held by the Fund. As a result, differences may arise between the value of the Fund’s portfolio securities as determined at the foreign market close and the latest indications of value at 4 p.m. Eastern time. In order to minimize the potential for these differences, the VC monitors price movements following the close of trading in foreign stock markets through a series of country specific market proxies (such as baskets of American Depositary Receipts, futures contracts and exchange traded funds). These price movements are measured against established trigger thresholds for each specific market proxy to assist in determining if an event has occurred that may call into question the reliability of the values of the foreign securities held by the Fund. If such an event occurs, the securities may be valued using fair value procedures, which may include the use of independent pricing services.
When the last day of the reporting period is a non-business day, certain foreign markets may be open on those days that the Fund’s NAV is not calculated, which could result in differences between the value of the Fund’s portfolio securities on the last business day and the last calendar day of the reporting period. Any significant security valuation changes due to an open foreign market are adjusted and reflected by the Fund for financial reporting purposes.
b. Foreign Currency Translation
Portfolio securities and other assets and liabilities denominated in foreign currencies are translated into U.S. dollars based on the exchange rate of such currencies against U.S. dollars on the date of valuation. The Fund may enter into foreign currency exchange contracts to facilitate transactions denominated in a foreign currency. Purchases and sales of securities, income and expense items denominated in foreign currencies are translated into U.S. dollars at the exchange rate in effect on the transaction date. Portfolio securities and assets and liabilities denominated in foreign currencies contain risks that those currencies will decline in value relative to the U.S. dollar. Occasionally, events may impact the availability or reliability of foreign exchange
rates used to convert the U.S. dollar equivalent value. If such an event occurs, the foreign exchange rate will be valued at fair value using procedures established and approved by the Board.
The Fund does not separately report the effect of changes in foreign exchange rates from changes in market prices on securities held. Such changes are included in net realized and unrealized gain or loss from investments in the Statement of Operations.
Realized foreign exchange gains or losses arise from sales of foreign currencies, currency gains or losses realized between the trade and settlement dates on securities transactions and the difference between the recorded amounts of dividends, interest, and foreign withholding taxes and the U.S. dollar equivalent of the amounts actually received or paid. Net unrealized foreign exchange gains and losses arise from changes in foreign exchange rates on foreign denominated assets and liabilities other than investments in securities held at the end of the reporting period.
c. Securities Lending
The Fund participates in an agency based securities lending program to earn additional income. The Fund receives cash collateral against the loaned securities in an amount equal to at least 102% of the fair value of the loaned securities. Collateral is maintained over the life of the loan in an amount not less than 100% of the fair value of loaned securities, as determined at the close of Fund business each day; any additional collateral required due to changes in security values is delivered to the Fund on the next business day. The collateral is deposited into a joint cash account with other funds and is used to invest in a money market fund managed by Franklin Advisers, Inc., an affiliate of the Fund. The Fund may receive income from the investment of cash collateral, in addition to lending fees and rebates paid by the borrower. Income from securities loaned, net of fees paid to the securities lending agent and/or third-party vendor, is reported separately in the Statement of Operations. The Fund bears the market risk with respect to the collateral investment, securities loaned, and the risk that the agent may default on its obligations to the Fund. If the borrower defaults on its obligation to return the securities loaned, the Fund has the right to repurchase the securities in the open market using the collateral received. The securities lending agent has agreed to indemnify the Fund in the event of default by a third party borrower.
| Semiannual Report | TG-19 |
FRANKLIN TEMPLETON VARIABLE INSURANCE PRODUCTS TRUST
NOTES TO FINANCIAL STATEMENTS (UNAUDITED)
Templeton Growth VIP Fund (continued)
1. Organization and Significant Accounting Policies (continued)
d. Income and Deferred Taxes
It is the Fund’s policy to qualify as a regulated investment company under the Internal Revenue Code. The Fund intends to distribute to shareholders substantially all of its taxable income and net realized gains to relieve it from federal income and if applicable, excise taxes. As a result, no provision for U.S. federal income taxes is required.
The Fund may be subject to foreign taxation related to income received, capital gains on the sale of securities and certain foreign currency transactions in the foreign jurisdictions in which it invests. Foreign taxes, if any, are recorded based on the tax regulations and rates that exist in the foreign markets in which the Fund invests. When a capital gain tax is determined to apply, the Fund records an estimated deferred tax liability in an amount that would be payable if the securities were disposed of on the valuation date. As a result of several court cases, in certain countries across the European Union, the Fund filed additional tax reclaims for previously withheld taxes on dividends earned in those countries (EU reclaims). These additional filings are subject to various administrative proceedings by the local jurisdictions’ tax authorities within the European Union, as well as a number of related judicial proceedings. Income recognized, if any, for EU reclaims is reflected as other income in the Statement of Operations and any related receivable, if any, is reflected as European Union tax reclaims in the Statement of Assets and Liabilities. When uncertainty exists as to the ultimate resolution of these proceedings, the likelihood of receipt of these EU reclaims, and the potential timing of payment, no amounts are reflected in the financial statements. For U.S. income tax purposes, when EU reclaims are received by the Fund and the Fund previously passed foreign tax credit on to its shareholders, the Fund must either amend historic tax reporting to shareholders or enter into a closing agreement with the Internal Revenue Service (IRS) in order to pay the associated tax liability on behalf of the Fund’s shareholders.
The Fund may recognize an income tax liability related to its uncertain tax positions under U.S. GAAP when the uncertain tax position has a less than 50% probability that it will be sustained upon examination by the tax authorities based on its technical merits. As of June 30, 2017, the Fund has determined that no tax liability is required in its financial statements related to uncertain tax positions for any open tax years (or expected to
be taken in future tax years). Open tax years are those that remain subject to examination and are based on each tax jurisdiction’s statute of limitation.
e. Security Transactions, Investment Income, Expenses and Distributions
Security transactions are accounted for on trade date. Realized gains and losses on security transactions are determined on a specific identification basis. Interest income and estimated expenses are accrued daily. Amortization of premium and accretion of discount on debt securities are included in interest income. Dividend income is recorded on the ex-dividend date except for certain dividends from securities where the dividend rate is not available. In such cases, the dividend is recorded as soon as the information is received by the Fund. Distributions to shareholders are recorded on the ex-dividend date. Distributable earnings are determined according to income tax regulations (tax basis) and may differ from earnings recorded in accordance with U.S. GAAP. These differences may be permanent or temporary. Permanent differences are reclassified among capital accounts to reflect their tax character. These reclassifications have no impact on net assets or the results of operations. Temporary differences are not reclassified, as they may reverse in subsequent periods.
Common expenses incurred by the Trust are allocated among the Funds based on the ratio of net assets of each Fund to the combined net assets of the Trust. Fund specific expenses are charged directly to the Fund that incurred the expense.
Realized and unrealized gains and losses and net investment income, not including class specific expenses, are allocated daily to each class of shares based upon the relative proportion of net assets of each class. Differences in per share distributions, by class, are generally due to differences in class specific expenses.
f. Accounting Estimates
The preparation of financial statements in accordance with U.S. GAAP requires management to make estimates and assumptions that affect the reported amounts of assets and liabilities at the date of the financial statements and the amounts of income and expenses during the reporting period. Actual results could differ from those estimates.
| TG-20 | Semiannual Report |
FRANKLIN TEMPLETON VARIABLE INSURANCE PRODUCTS TRUST
NOTES TO FINANCIAL STATEMENTS (UNAUDITED)
Templeton Growth VIP Fund (continued)
g. Guarantees and Indemnifications
Under the Trust’s organizational documents, its officers and trustees are indemnified by the Trust against certain liabilities arising out of the performance of their duties to the Trust. Additionally, in the normal course of business, the Trust, on behalf of the Fund, enters into contracts with service providers
that contain general indemnification clauses. The Trust’s maximum exposure under these arrangements is unknown as this would involve future claims that may be made against the Trust that have not yet occurred. Currently, the Trust expects the risk of loss to be remote.
2. Shares of Beneficial Interest
At June 30, 2017, there were an unlimited number of shares authorized (without par value). Transactions in the Fund’s shares were as follows:
| Six Months Ended June 30, 2017 | Year Ended December 31, 2016 | |||||||||||||||||||
| Shares | Amount | Shares | Amount | |||||||||||||||||
| Class 1 Shares: | ||||||||||||||||||||
Shares sold | 196,844 | $ | 2,864,766 | 110,663 | $ | 1,440,832 | ||||||||||||||
Shares issued in reinvestment of distributions | 578,684 | 8,645,537 | 2,252,375 | 27,546,543 | ||||||||||||||||
Shares redeemed | (2,233,010 | ) | (33,232,085 | ) | (4,377,350 | ) | (58,277,872 | ) | ||||||||||||
|
| |||||||||||||||||||
Net increase (decrease) | (1,457,482 | ) | $ | (21,721,782 | ) | (2,014,312 | ) | $ | (29,290,497 | ) | ||||||||||
|
| |||||||||||||||||||
| Class 2 Shares: | ||||||||||||||||||||
Shares sold | 597,550 | $ | 8,642,207 | 3,935,051 | $ | 50,119,612 | ||||||||||||||
Shares issued in reinvestment of distributions | 980,324 | 14,420,565 | 4,262,336 | 51,361,152 | ||||||||||||||||
Shares redeemed | (5,811,515 | ) | (84,297,463 | ) | (13,462,698 | ) | (172,747,333 | ) | ||||||||||||
|
| |||||||||||||||||||
Net increase (decrease) | (4,233,641 | ) | $ | (61,234,691 | ) | (5,265,311 | ) | $ | (71,266,569 | ) | ||||||||||
|
| |||||||||||||||||||
| Class 4 Shares: | ||||||||||||||||||||
Shares sold | 12,724 | $ | 190,131 | 280,303 | $ | 3,402,727 | ||||||||||||||
Shares issued in reinvestment of distributions | 40,845 | 607,359 | 213,961 | 2,603,908 | ||||||||||||||||
Shares redeemed | (454,526 | ) | (6,685,979 | ) | (920,832 | ) | (12,080,057 | ) | ||||||||||||
|
| |||||||||||||||||||
Net increase (decrease) | (400,957 | ) | $ | (5,888,489 | ) | (426,568 | ) | $ | (6,073,422 | ) | ||||||||||
|
| |||||||||||||||||||
3. Transactions with Affiliates
Franklin Resources, Inc. is the holding company for various subsidiaries that together are referred to as Franklin Templeton Investments. Certain officers and trustees of the Fund are also officers and/or directors of the following subsidiaries:
| Subsidiary | Affiliation | |
Templeton Global Advisors Limited (TGAL) | Investment manager | |
Franklin Templeton Services, LLC (FT Services) | Administrative manager | |
Franklin Templeton Distributors, Inc. (Distributors) | Principal underwriter | |
Franklin Templeton Investor Services, LLC (Investor Services) | Transfer agent |
| Semiannual Report | TG-21 |
FRANKLIN TEMPLETON VARIABLE INSURANCE PRODUCTS TRUST
NOTES TO FINANCIAL STATEMENTS (UNAUDITED)
Templeton Growth VIP Fund (continued)
3. Transactions with Affiliates (continued)
a. Management Fees
The Fund pays an investment management fee to TGAL based on the average daily net assets of the Fund as follows:
| Annualized Fee Rate | Net Assets | |
1.000% | Up to and including $100 million | |
0.900% | Over $100 million, up to and including $250 million | |
0.800% | Over $250 million, up to and including $500 million | |
0.750% | Over $500 million, up to and including $1 billion | |
0.700% | Over $1 billion, up to and including $5 billion | |
0.675% | Over $5 billion, up to and including $10 billion | |
0.655% | Over $10 billion, up to and including $15 billion | |
0.635% | Over $15 billion, up to and including $20 billion | |
0.615% | In excess of $20 billion |
For the period ended June 30, 2017, the annualized effective investment management fee rate was 0.778% of the Fund’s average daily net assets.
b. Administrative Fees
Under an agreement with TGAL, FT Services provides administrative services to the Fund. The fee is paid by TGAL based on the Fund’s average daily net assets, and is not an additional expense of the Fund.
c. Distribution Fees
The Board has adopted distribution plans for Class 2 and Class 4 shares pursuant to Rule 12b-1 under the 1940 Act. Under the Fund’s compensation distribution plans, the Fund pays Distributors for costs incurred in connection with the servicing, sale and distribution of the Fund’s shares up to 0.35% per year of its average daily net assets of each class. The Board has agreed to limit the current rate to 0.25% per year for Class 2. The plan year, for purposes of monitoring compliance with the maximum annual plan rates, is February 1 through January 31.
d. Transfer Agent Fees
Investor Services, under terms of an agreement, performs shareholder servicing for the Fund and is not paid by the Fund for the services.
e. Investments in Affiliated Management Investment Companies
The Fund invests in one or more affiliated management investment companies for purposes other than exercising a controlling influence over the management or policies. Management fees paid by the Fund are waived on assets invested in the affiliated management investment companies, as noted in the Statement of Operations, in an amount not to exceed the management and administrative fees paid directly or indirectly by each affiliate. During the period ended June 30, 2017, the Fund held investments in affiliated management investment companies as follows:
| TG-22 | Semiannual Report |
FRANKLIN TEMPLETON VARIABLE INSURANCE PRODUCTS TRUST
NOTES TO FINANCIAL STATEMENTS (UNAUDITED)
Templeton Growth VIP Fund (continued)
| Number of Shares Held at Beginning of Period | Gross Additions | Gross Reductions | Number of Shares Held at End of Period | Value at End of Period | Investment Income | Realized Gain (Loss) | % of Affiliated Fund Shares Outstanding Held at End of Period | |||||||||||||||||||||||||
| Non-Controlled Affiliates | ||||||||||||||||||||||||||||||||
Institutional Fiduciary Trust Money Market Portfolio, 0.58% | — | 156,998,655 | (156,665,455 | ) | 333,200 | $ | 333,200 | $ | — | $ | — | 0.0%a | ||||||||||||||||||||
|
| |||||||||||||||||||||||||||||||
aRounds to less than 0.1%.
f. Other Affiliated Transactions
At June 30, 2017, Franklin Templeton Variable Insurance Products Trust – Franklin Founding Funds Allocation VIP Fund owned
24.1% of the Fund’s outstanding shares.
4. Expense Offset Arrangement
The Fund has entered into an arrangement with its custodian whereby credits realized as a result of uninvested cash balances are used to reduce a portion of the Fund’s custodian expenses. During the period ended June 30, 2017, the custodian fees were reduced as noted in the Statement of Operations.
5. Income Taxes
For tax purposes, capital losses may be carried over to offset future capital gains. At December 31, 2016, the Fund had long-term capital loss carryforwards of $11,285,978.
At June 30, 2017, the cost of investments and net unrealized appreciation (depreciation) for income tax purposes were as follows:
Cost of investments. | $ | 1,142,897,905 | ||
|
| |||
Unrealized appreciation | $ | 333,248,122 | ||
Unrealized depreciation | (69,185,507 | ) | ||
|
| |||
Net unrealized appreciation (depreciation) | $ | 264,062,615 | ||
|
|
Differences between income and/or capital gains as determined on a book basis and a tax basis are primarily due to differing treatment of wash sales.
6. Investment Transactions
Purchases and sales of investments (excluding short term securities) for the period ended June 30, 2017, aggregated $218,806,394 and $274,507,720, respectively.
At June 30, 2017, in connection with securities lending transactions, the Fund loaned equity investments and received $333,200 of cash collateral. The gross amount of recognized liability for such transactions is included in payable upon return of securities loaned in the Statement of Assets and Liabilities. The agreements can be terminated at any time.
| Semiannual Report | TG-23 |
FRANKLIN TEMPLETON VARIABLE INSURANCE PRODUCTS TRUST
NOTES TO FINANCIAL STATEMENTS (UNAUDITED)
Templeton Growth VIP Fund (continued)
7. Concentration of Risk
Investing in foreign securities may include certain risks and considerations not typically associated with investing in U.S. securities, such as fluctuating currency values and changing local and regional economic, political and social conditions, which may result in greater market volatility. In addition, certain foreign securities may not be as liquid as U.S. securities.
8. Credit Facility
The Fund, together with other U.S. registered and foreign investment funds (collectively, Borrowers), managed by Franklin Templeton Investments, are borrowers in a joint syndicated senior unsecured credit facility totaling $2 billion (Global Credit Facility) which matures on February 9, 2018. This Global Credit Facility provides a source of funds to the Borrowers for temporary and emergency purposes, including the ability to meet future unanticipated or unusually large redemption requests.
Under the terms of the Global Credit Facility, the Fund shall, in addition to interest charged on any borrowings made by the Fund and other costs incurred by the Fund, pay its share of fees and expenses incurred in connection with the implementation and maintenance of the Global Credit Facility, based upon its relative share of the aggregate net assets of all of the Borrowers, including an annual commitment fee of 0.15% based upon the unused portion of the Global Credit Facility. These fees are reflected in other expenses in the Statement of Operations. During the period ended June 30, 2017, the Fund did not use the Global Credit Facility.
9. Fair Value Measurements
The Fund follows a fair value hierarchy that distinguishes between market data obtained from independent sources (observable inputs) and the Fund’s own market assumptions (unobservable inputs). These inputs are used in determining the value of the Fund’s financial instruments and are summarized in the following fair value hierarchy:
| • | Level 1 – quoted prices in active markets for identical financial instruments |
| • | Level 2 – other significant observable inputs (including quoted prices for similar financial instruments, interest rates, prepayment speed, credit risk, etc.) |
| • | Level 3 – significant unobservable inputs (including the Fund’s own assumptions in determining the fair value of financial instruments) |
The input levels are not necessarily an indication of the risk or liquidity associated with financial instruments at that level.
For movements between the levels within the fair value hierarchy, the Fund has adopted a policy of recognizing the transfers as of the date of the underlying event which caused the movement.
A summary of inputs used as of June 30, 2017, in valuing the Fund’s assets carried at fair value, is as follows:
| Level 1 | Level 2 | Level 3 | Total | |||||||||||||
| Assets: | ||||||||||||||||
Investments in Securities: | ||||||||||||||||
Equity Investmentsa | $ | 1,370,151,904 | $ | — | $ | — | $ | 1,370,151,904 | ||||||||
Corporate Bonds | — | 9,675,416 | — | 9,675,416 | ||||||||||||
Short Term Investments | 333,200 | 26,800,000 | — | 27,133,200 | ||||||||||||
|
| |||||||||||||||
Total Investments in Securities | $ | 1,370,485,104 | $ | 36,475,416 | $ | — | $ | 1,406,960,520 | ||||||||
|
| |||||||||||||||
aFor detailed categories, see the accompanying Statement of Investments.
| TG-24 | Semiannual Report |
FRANKLIN TEMPLETON VARIABLE INSURANCE PRODUCTS TRUST
NOTES TO FINANCIAL STATEMENTS (UNAUDITED)
Templeton Growth VIP Fund (continued)
10. Investment Company Reporting Modernization
In October 2016, the U.S. Securities and Exchange Commission adopted new rules and amended existing rules (together, final rules) intended to modernize the reporting and disclosure of information by registered investment companies. In part, the final rules amend Regulation S-X and require standardized, enhanced disclosures about derivatives in investment company financial statements, as well as other amendments. The compliance date for the amendments to Regulation S-X is August 1, 2017. Management has reviewed the requirements and believes the adoption of the amendments to Regulation S-X will not have a material impact on the Fund’s financial statements and related disclosures.
11. Subsequent Events
The Fund has evaluated subsequent events through the issuance of the financial statements and determined that no events have occurred that require disclosure.
Abbreviations
| Selected Portfolio | ||||||||||
| ADR | American Depositary Receipt | |||||||||
| IDR | International Depositary Receipt | |||||||||
| NVDR | Non-Voting Depositary Receipt | |||||||||
| Semiannual Report | TG-25 |
FRANKLIN TEMPLETON VARIABLE INSURANCE PRODUCTS TRUST
Tax Information (unaudited)
Templeton Growth VIP Fund
At December 31, 2016, more than 50% of the Fund’s total assets were invested in securities of foreign issuers. In most instances, foreign taxes were withheld from income paid to the Fund on these investments. As shown in the table below, the Fund hereby reports to shareholders the foreign source income and foreign taxes paid, pursuant to Section 853 of the Internal Revenue Code. This written statement will allow shareholders of record on June 14, 2017, to treat their proportionate share of foreign taxes paid by the Fund as having been paid directly by them. The shareholder shall consider these amounts as foreign taxes paid in the tax year in which they receive the Fund distribution.
The following table provides a detailed analysis of foreign tax paid, and foreign source income as reported by the Fund, to Class 1, Class 2, and Class 4 shareholders of record.
| Class | Foreign Tax Paid Per Share | Foreign Source Income Per Share | ||
Class 1 | $0.0221 | $0.2302 | ||
Class 2 | $0.0221 | $0.2029 | ||
Class 4 | $0.0221 | $0.1868 |
Foreign Tax Paid Per Share (Column 1) is the amount per share available to you, as a tax credit (assuming you held your shares in the Fund for a minimum of 16 days during the 31-day period beginning 15 days before the ex-dividend date of the Fund’s distribution to which the foreign taxes relate), or, as a tax deduction.
Foreign Source Income Per Share (Column 2) is the amount per share of income dividends attributable to foreign securities held by the Fund, plus any foreign taxes withheld on these dividends.
| TG-26 | Semiannual Report |
FRANKLIN TEMPLETON VARIABLE INSURANCE PRODUCTS TRUST
The indexes are unmanaged and include reinvestment of any income or distributions. They do not reflect any fees, expenses or sales charges.
For Russell Indexes: Russell Investment Group is the source and owner of the trademarks, service marks and copyrights related to the Russell Indexes. Russell® is a trademark of Russell Investment Group.
See www.franklintempletondatasources.com for additional data provider information.
Bloomberg Barclays U.S. Aggregate Bond Index is a market capitalization-weighted index representing the U.S. investment-grade, fixed-rate, taxable bond market with index components for government and corporate, mortgage pass-through and asset-backed securities. All issues included are SEC registered, taxable, dollar denominated and nonconvertible, must have at least one year to final maturity and must be rated investment grade (Baa3/BBB-/BBB- or higher) using the middle rating of Moody’s, Standard & Poor’s and Fitch, respectively.
Bloomberg Barclays U.S. Government Index: Intermediate Component is the intermediate component of the Barclays U.S. Government Index, which includes public obligations of the U.S. Treasury with at least one year to final maturity and publicly issued debt of U.S. government agencies, quasi-federal corporations, and corporate or foreign debt guaranteed by the U.S. government.
Citigroup World Government Bond Index is a market capitalization-weighted index consisting of investment-grade world government bond markets.
Consumer Price Index (CPI) is a commonly used measure of the inflation rate.
FTSE® EPRA®/NAREIT® Developed Index is a free float-adjusted index designed to measure the performance of publicly traded real estate securities in the North American, European and Asian real estate markets.
J.P. Morgan (JPM) Global Government Bond Index (GGBI) tracks total returns for liquid, fixed-rate, domestic government bonds with maturities greater than one year issued by developed countries globally.
Lipper Multi-Sector Income Funds Classification Average is calculated by averaging the total returns of all funds within the Lipper Multi-Sector Income Funds classification in the Lipper Open-End underlying funds universe. Lipper Multi-Sector Income Funds are defined as funds that seek current income by allocation assets among different fixed income securities sectors (not primarily in one sector except for defensive purposes), including U.S. and foreign governments, with a significant portion rated below investment grade. For the six-month period ended 6/30/17, there were 344 funds in this category. Lipper calculations do not include contract fees, expenses or sales charges, and may have been different if such charges had been considered.
Lipper VIP Equity Income Funds Classification Average is an equally weighted average calculation of performance figures for all funds within the Lipper Equity Income Funds classification in the Lipper VIP underlying funds universe. Lipper Equity Income Funds seek relatively high current income and growth of income through investing 60% or more of their portfolios in equities. For the six-month period ended 6/30/17, there were 75 funds in this category. Lipper calculations do not include contract fees, expenses or sales charges, and may have been different if such charges had been considered.
Lipper VIP General U.S. Government Funds Classification Average is an equally weighted average calculation of performance figures for all funds within the Lipper General U.S. Government Funds classification in the Lipper VIP underlying funds universe. Lipper General U.S. Government Funds invest primarily in U.S. government and agency issues. For the six-month period ended 6/30/17, there were 55 funds in this category. Lipper calculations do not include contract fees, expenses or sales charges, and may have been different if such charges had been considered.
MSCI All Country World Index (ACWI) is a free float-adjusted, market capitalization-weighted index designed to measure equity market performance in global developed and emerging markets.
MSCI All Country World Index (ACWI) ex USA Index captures large- and mid-capitalization representation across 22 of 23 developed markets countries (excluding the U.S.) and 23 emerging markets countries. The index covers approximately 85% of the global equity opportunity set outside the U.S.
| Semiannual Report | I-1 |
FRANKLIN TEMPLETON VARIABLE INSURANCE PRODUCTS TRUST
Index Descriptions
MSCI Emerging Markets (EM) Index is a free float-adjusted, market capitalization-weighted index designed to measure equity market performance in global emerging markets.
MSCI World Index is a free float-adjusted, market capitalization-weighted index designed to measure equity market performance in global developed markets.
Russell 1000® Growth Index is market capitalization weighted and measures performance of those Russell 1000® Index companies with higher price-to-book ratios and higher forecasted growth values.
Russell 1000® Index is market capitalization weighted and measures performance of the largest companies in the Russell 3000® Index, which represents the majority of the U.S. market’s total capitalization.
Russell 1000TM Value Index is market capitalization weighted and measures performance of those Russell 1000TM Index companies with lower price-to-book ratios and lower forecasted growth values.
Russell 2000® Index is market capitalization weighted and measures performance of the 2,000 smallest companies in the Russell 3000® Index, which represent a small amount of the total market capitalization of the Russell 3000® Index.
Russell 2000TM Value Index is market capitalization weighted and measures performance of those Russell 2000TM Index companies with lower price-to-book ratios and lower forecasted growth values.
Russell 2500® Index is market capitalization weighted and measures performance of the smallest companies in the Russell 3000® Index, which represent a modest amount of the Russell 3000® Index’s total market capitalization.
Russell 2500TM Value Index is market capitalization weighted and measures performance of those Russell 2500TM Index companies with lower price-to-book ratios and lower forecasted growth values.
Russell 3000® Growth Index is market capitalization weighted and measures performance of those Russell 3000® Index companies with higher price-to-book ratios and higher forecasted growth values.
Russell Midcap® Growth Index is market capitalization weighted and measures performance of those Russell Midcap® Index companies with higher price-to-book ratios and higher forecasted growth values.
Russell Midcap® Index is market capitalization weighted and measures performance of the smallest companies in the Russell 1000® Index, which represents a modest amount of the Russell 1000® Index’s total market capitalization.
Standard & Poor’s® 500 Index (S&P 500®) is a market capitalization-weighted index of 500 stocks designed to measure total U.S. equity market performance.
Standard & Poor’s®/International Finance Corporation Investable (S&P/IFCI) Composite Index is a free float-adjusted, market capitalization-weighted index designed to measure equity performance in global emerging markets.
| I-2 | Semiannual Report |
FRANKLIN TEMPLETON VARIABLE INSURANCE PRODUCTS TRUST
Board Approval of Investment Management Agreements
FRANKLIN TEMPLETON VARIABLE INSURANCE PRODUCTS TRUST
Franklin Flex Cap Growth VIP Fund
Franklin Global Real Estate VIP Fund
Franklin Growth and Income VIP Fund
Franklin Income VIP Fund
Franklin Large Cap Growth VIP Fund
Franklin Mutual Global Discovery VIP Fund
Franklin Mutual Shares VIP Fund
Franklin Rising Dividends VIP Fund
Franklin Small Cap Value VIP Fund
Franklin Small-Mid Cap Growth VIP Fund
Franklin Strategic Income VIP Fund
Franklin U.S. Government Securities VIP Fund
Franklin VolSmart Allocation VIP Fund
Templeton Developing Markets VIP Fund
Templeton Foreign VIP Fund
Templeton Global Bond VIP Fund
Templeton Growth VIP Fund
(each a Fund)
At an in-person meeting held on April 18, 2017 (Meeting), the Board of Trustees (Board) of Franklin Templeton Variable Insurance Products Trust (Trust), including a majority of the trustees who are not “interested persons” as defined in the Investment Company Act of 1940 (Independent Trustees), reviewed and approved the continuance of the (i) investment management agreement between Franklin Advisers, Inc. (FAI) and each of Franklin Flex Cap Growth VIP Fund, Franklin Growth and Income VIP Fund, Franklin Income VIP Fund, Franklin Large Cap Growth VIP Fund, Franklin Small Mid-Cap Growth VIP Fund, Franklin Strategic Income VIP Fund, Franklin U.S. Government Securities VIP Fund, Franklin VolSmart Allocation VIP Fund, and Templeton Global Bond VIP Fund; (ii) the investment sub-advisory agreements between FAI and each of Franklin Advisory Services, LLC and K2/D&S Management Co., L.L.C. (each a Sub-Adviser), affiliates of FAI, on behalf of the Franklin VolSmart Allocation VIP Fund; (iii) the investment management agreement between Franklin Templeton Institutional, LLC (FTIL) and Franklin Global Real Estate VIP Fund; (iv) the investment management agreement between Franklin Mutual Advisers, LLC (FMA) and each of Franklin Mutual Global Discovery VIP Fund and Franklin Mutual Shares VIP Fund; (v) the investment management agreement between Franklin Advisory Services,
LLC (FAS) and each of Franklin Rising Dividends VIP Fund and Franklin Small Cap Value VIP Fund; (vi) the investment management agreement between Templeton Asset Management Ltd. (TAML) and Templeton Developing Markets VIP Fund; (vii) the investment management agreement between Templeton Investment Counsel, LLC (TICL) and Templeton Foreign VIP Fund; and (viii) the investment management agreement between Templeton Global Advisors Limited (TGAL) and Templeton Growth VIP Fund (each a Management Agreement) for an additional one-year period. The Independent Trustees received advice from and met separately with Independent Trustee counsel in considering whether to approve the continuation of each Management Agreement. Although the Management Agreements for the Funds were considered at the same Board meeting, the Board considered the information provided to it about the Funds together and with respect to each Fund separately as the Board deemed appropriate. FAI, FTIL, FMA, FAS, TAML, TICL, TGAL and the Sub-Advisers are each referred to herein as a Manager.
In considering the continuation of each Management Agreement, the Board reviewed and considered information provided by each Manager at the Meeting and throughout the year at meetings of the Board and its committees. The Board also reviewed and considered information provided in response to a detailed set of requests for information submitted to each Manager by Independent Trustee counsel on behalf of the Independent Trustees in connection with the annual contract renewal process. In addition, prior to the Meeting, the Independent Trustees held a telephonic contract renewal meeting at which the Independent Trustees conferred amongst themselves and Independent Trustee counsel about contract renewal matters. The Board reviewed and considered all of the factors it deemed relevant in approving the continuance of each Management Agreement, including, but not limited to: (i) the nature, extent, and quality of the services provided by each Manager; (ii) the investment performance of each Fund; (iii) the costs of the services provided and profits realized by each Manager and its affiliates from the relationship with each Fund; (iv) the extent to which economies of scale are realized as each Fund grows; and (v) whether fee levels reflect these economies of scale for the benefit of Fund investors.
In approving the continuance of each Management Agreement, the Board, including a majority of the Independent Trustees, determined that the existing management fees are fair and reasonable and that the continuance of such Management Agreement is in the interests of the applicable Fund and its
| Semiannual Report | SI-1 |
FRANKLIN TEMPLETON VARIABLE INSURANCE PRODUCTS TRUST
SHAREHOLDER INFORMATION
shareholders. While attention was given to all information furnished, the following discusses some primary factors relevant to the Board’s determination.
Nature, Extent and Quality of Services
The Board reviewed and considered information regarding the nature, extent and quality of investment management services provided by each Manager and its affiliates to the Funds and their shareholders. This information included, among other things, the qualifications, background and experience of the senior management and investment personnel of each Manager; the structure of investment personnel compensation; oversight of third-party service providers; investment performance reports and related financial information for each Fund; reports on expenses, shareholder services, marketing support payments made to financial intermediaries and third party servicing arrangements; legal and compliance matters; risk controls; pricing and other services provided by each Manager and its affiliates; and management fees charged by each Manager and its affiliates to U.S. funds and other accounts, including management’s explanation of differences among accounts where relevant. The Board noted management’s continual efforts and expenditures in establishing effective business continuity plans and developing strategies to address areas of heightened concern in the mutual fund industry, such as cybersecurity, derivatives and liquidity risk management.
The Board also reviewed and considered the benefits provided to Fund shareholders of investing in a fund that is part of the Franklin Templeton family of funds. The Board noted the financial position of Franklin Resources, Inc. (FRI), the Managers’ parent, and its commitment to the mutual fund business as evidenced by its continued introduction of new funds, reassessment of the fund offerings in response to the market environment and project initiatives and capital investments relating to the services provided to the Funds by the Franklin Templeton Investments (FTI) organization.
Following consideration of such information, the Board was satisfied with the nature, extent and quality of services provided by each Manager and its affiliates to the Funds and their shareholders.
Fund Performance
The Board reviewed and considered the performance results of each Fund over various time periods ended January 31, 2017. The Board considered the performance returns for each Fund in comparison to the performance returns of mutual funds deemed comparable to the Fund included in a universe (Performance Universe) selected by Broadridge Financial Solutions, Inc.
(Broadridge), an independent provider of investment company data. The Board received a description of the methodology used by Broadridge to select the mutual funds included in a Performance Universe. The Board also reviewed and considered Fund performance reports provided and discussions that occurred with portfolio managers at Board meetings throughout the year. A summary of each Fund’s performance results is below.
Franklin Flex Cap Growth VIP Fund – The Performance Universe for this Fund included the Fund and all multi-cap growth funds underlying variable insurance products (VIPs). The Board noted that the Fund’s annualized total return for the one-, three-, five- and 10-year periods was below the median of its Performance Universe. The Board concluded that the Fund’s performance was acceptable. In doing so, the Board noted the actions management has taken in an effort to address the Fund’s performance, including changes to the Fund’s portfolio management team and enhancements to the team’s security selection process. The Board also noted that the Fund’s annualized total return for each period, while below the median, was positive.
Franklin Global Real Estate VIP Fund – The Performance Universe for this Fund included the Fund and all global real estate funds underlying VIPs. The Board noted that the Fund’s annualized total return for the one-, three- and five-year periods was above the median of its Performance Universe, but for the
10-year period was below the median of its Performance Universe. The Board concluded that the Fund’s performance was satisfactory.
Franklin Growth and Income VIP Fund – The Performance Universe for this Fund included the Fund and all equity income funds underlying VIPs. The Board noted that the Fund’s annualized income return for the one-, three-, five- and 10-year periods was above the median of its Performance Universe. The Board also noted that the Fund’s annualized total return for the one-, three- and five-year periods was below the median of its Performance Universe, but for the 10-year period was equal to the median of its Performance Universe. Given the Fund’s income-oriented investment objective, the Board concluded that the Fund’s performance was satisfactory. In doing so, the Board noted that the Fund’s annualized total return for each of the one-, three- and five-year periods, while below the median, exceeded 8.2%.
Franklin Income VIP Fund and Franklin Strategic Income VIP Fund – The Performance Universe for the Franklin Income VIP Fund included the Fund and all mixed-asset target allocation
| SI-2 | Semiannual Report |
FRANKLIN TEMPLETON VARIABLE INSURANCE PRODUCTS TRUST
SHAREHOLDER INFORMATION
moderate funds underlying VIPs. The Performance Universe for the Franklin Strategic Income VIP Fund included the Fund and all general bond funds underlying VIPs. The Board noted that the Funds’ annualized income returns for the one-, three-, five- and 10-year periods were above the medians of their respective Performance Universes. The Board also noted that the Funds’ annualized total returns for the one-, five- and 10-year periods were above the medians of their respective Performance Universes, but for the three-year period were below the medians of their respective Performance Universes. Given the Funds’ income-oriented investment objective, the Board concluded that the Funds’ performance was satisfactory.
Franklin Large Cap Growth VIP Fund – The Performance Universe for this Fund included the Fund and all multi-cap growth funds underlying VIPs. The Board noted that the Fund’s annualized total return for the one-, five- and 10-year periods was below the median of its Performance Universe, but for the three-year period was above the median of its Performance Universe. The Board concluded that the Fund’s performance was acceptable. In doing so, the Board noted the actions management has taken in an effort to address the Fund’s performance, including the addition of a portfolio manager and the repositioning of certain of the Fund’s portfolio holdings. The Board also noted that the Fund’s annualized total return for the one-, five- and 10-year periods, while below the median, exceeded 13.4%, 11.2%, and 5.8%, respectively.
Franklin Mutual Global Discovery VIP Fund – The Performance Universe for this Fund included the Fund and all global multi-cap value funds underlying VIPs. The Board noted that the Fund’s annualized total return for the one-year period was below the median of its Performance Universe, but for the three-, five- and 10-year periods was above the median and in the first quintile of its Performance Universe. The Board concluded that the Fund’s performance was satisfactory. In doing so, the Board noted that the Fund’s annualized total return for the one-year period, while below the median, exceeded 21.1%.
Franklin Mutual Shares VIP Fund and Templeton Developing Markets VIP Fund – The Performance Universe for the Franklin Mutual Shares VIP Fund included the Fund and all large-cap value funds underlying VIPs. The Performance Universe for the Templeton Developing Markets VIP Fund included the Fund and all emerging markets funds underlying VIPs. The Board noted that the Funds’ annualized total returns for the one-year period were above the medians of their respective Performance Universes, but for the three-, five- and 10-year
periods were below the medians of their respective Performance Universes. The Board concluded that the Funds’ performance was acceptable. In doing so, the Board noted that the annualized total returns for the one-year period exceeded 23.8% for the Franklin Mutual Shares VIP Fund and 30.6% for the Templeton Developing Markets VIP Fund. The Board also acknowledged management’s explanation that the Franklin Mutual Shares VIP Fund is managed conservatively and has historically held higher cash weightings than its peers, detracting from relative performance in sharply rising markets. The Board further noted recent and expected portfolio management team changes for the Templeton Developing Markets VIP Fund. In light of such changes, the Board determined that additional time will be needed to evaluate the effectiveness of management’s actions.
Franklin Rising Dividends VIP Fund – The Performance Universe for this Fund included the Fund and all multi-cap core funds underlying VIPs. The Board noted that the Fund’s annualized total return for the one-, three- and 10-year periods was above the median of its Performance Universe, but for the five-year period was below the median of its Performance Universe. The Board concluded that the Fund’s performance was satisfactory. In doing so, the Board noted that the Fund’s annualized total return for the five-year period, while below the median, exceeded 11.9%.
Franklin Small Cap Value VIP Fund – The Performance Universe for this Fund included the Fund and all small-cap value funds underlying VIPs. The Board noted that the Fund’s annualized total return for the one-, five- and 10-year periods was above the median of its Performance Universe, but for the three-year period was below the median of its Performance Universe. The Board concluded that the Fund’s performance was satisfactory. In doing so, the Board noted that effective September 30, 2016, the Fund changed its definition of small-capitalization companies and changed its primary benchmark from the Russell 2500 Value Index to the Russell 2000 Value Index. The Board also noted that the definition of “small-capitalization companies” was changed from those with market capitalizations of under $3.5 billion, at the time of purchase, to those with market capitalizations not exceeding either (1) the highest market capitalization in the Russell 2000 Index or (2) the 12-month average of the highest market capitalization in the Russell 2000 Index, whichever is greater, at the time of purchase. The Board further noted that, in light of the change to the definition of small-capitalization companies, the Russell 2000 Value Index will provide a more appropriate
| Semiannual Report | SI-3 |
FRANKLIN TEMPLETON VARIABLE INSURANCE PRODUCTS TRUST
SHAREHOLDER INFORMATION
comparison for performance purposes and is more commonly used in the Fund’s small cap value peer group.
Franklin Small-Mid Cap Growth VIP Fund – The Performance Universe for this Fund included the Fund and all mid-cap growth funds underlying VIPs. The Board noted that the Fund’s annualized total return for the one-year period was equal to the median of its Performance Universe, but for the three-, five- and 10-year periods was below the median of its Performance Universe. The Board concluded that the Fund’s performance was acceptable. In doing so, the Board noted management’s explanation that the Fund’s positioning in the health care sector was a primary detractor from benchmark relative performance over the one-, three-, and five-year periods, particularly as a result of recent pricing pressure and public scrutiny on drug price increases for several holdings within the pharmaceutical industry. Management further explained that avoiding certain benchmark holdings due to high valuations also contributed to underperformance, as those companies ultimately performed better than expected. The Board then noted that the investment team continues to believe its approach to active management will contribute to stronger performance over the long-term. The Board also noted that the Fund’s annualized total return for the one-year period exceeded 19.4%.
Franklin U.S. Government Securities VIP Fund – The Performance Universe for this Fund included the Fund and all general U.S. government funds underlying VIPs. The Board noted that the Fund’s annualized income return for the one-, three-, five- and 10-year periods was above the median of its Performance Universe. The Board also noted that the Fund’s annualized total return for the one- and 10-year periods was above the median of its Performance Universe, but for the three- and five-year periods was below the median of its Performance Universe. The Board concluded that the Fund’s performance was satisfactory given the Fund’s income-oriented investment objective and the nature of the Fund’s investments, which are primarily in U.S. mortgage-backed securities.
Franklin VolSmart Allocation VIP Fund – The Performance Universe for this Fund included the Fund and all flexible portfolio funds underlying VIPs. The Fund has been in operation for less than five years. The Board noted that the Fund’s annualized total return for the one- and three-year periods was below the median of its Performance Universe. The Board concluded that the Fund’s performance was acceptable given its short period of operation. In doing so, the Board noted that the Fund’s current portfolio management team
began managing the Fund in May 2015. The Board further noted that Fund’s annualized total return for the one-year period, while below the median, exceeded 8.1%.
Templeton Foreign VIP Fund – The Performance Universe for this Fund included the Fund and all international multi-cap value funds underlying VIPs. The Board noted that the Fund’s annualized total return for one- and 10-year periods was above the median of its Performance Universe, but for the three- and five-year periods was below the median of its Performance Universe. The Board concluded that the Fund’s performance was satisfactory. In doing so, the Board noted that the Fund’s annualized total return for the one-year period was 20.39%.
Templeton Global Bond VIP Fund – The Performance Universe for this Fund included the Fund and all global income funds underlying VIPs. The Board noted that the Fund’s annualized income return for the one-year period was below the median of its Performance Universe, but for the three-, five- and 10-year periods was above the median and in the first quintile of its Performance Universe. The Board also noted that the Fund’s annualized total return for the one-, three-, five- and 10-year periods was above the median of its Performance Universe. Given the Fund’s income-oriented investment objective, the Board concluded that the Fund’s performance was satisfactory.
Templeton Growth VIP Fund – The Performance Universe for this Fund included the Fund and all global multi-cap value funds underlying VIPs. The Board noted that the Fund’s annualized total return for the one- and five-year periods was above the median and in the second quintile of its Performance Universe, for the three-year period was equal to the median of its Performance Universe, and for the 10-year period was below the median of its Performance Universe. The Board concluded that the Fund’s performance was satisfactory. In doing so, the Board noted that the Fund’s annualized total return for the one-year period exceeded 22.5%. The Board noted that in the second half of 2016, the MSCI All Country World Index replaced the MSCI World Index as the Fund’s primary benchmark.
Comparative Fees and Expenses
The Board reviewed and considered information regarding each Fund’s actual total expense ratio and its various components, including, as applicable, management fees; transfer agent expenses; underlying fund expenses; Rule 12b-1 and non-Rule 12b-1 service fees; and other non-management fees. The Board also noted that at its February meeting each year, it receives an annual report on all marketing support payments made by FTI to financial intermediaries. The Board considered
| SI-4 | Semiannual Report |
FRANKLIN TEMPLETON VARIABLE INSURANCE PRODUCTS TRUST
SHAREHOLDER INFORMATION
the actual total expense ratio and, separately, the contractual management fee rate, without the effect of fee waivers, if any (Management Rate) of each Fund, in comparison to the median ratio and median Management Rate, respectively, of other mutual funds deemed comparable to and with a similar expense structure as the Fund selected by Broadridge (Expense Group). Broadridge fee and expense data is based upon information taken from each fund’s most recent annual report, which reflects historical asset levels that may be quite different from those currently existing, particularly in a period of market volatility. While recognizing such inherent limitation and the fact that expense ratios and Management Rates generally increase as assets decline and decrease as assets grow, the Board believed the independent analysis conducted by Broadridge to be an appropriate measure of comparative fees and expenses. The Broadridge Management Rate includes administrative charges. The Board received a description of the methodology used by Broadridge to select the mutual funds included in an Expense Group.
Franklin Flex Cap Growth VIP Fund – The Expense Group for the Fund included the Fund and nine other multi-cap growth funds underlying VIPs. The Board noted that the Management Rate for the Fund was above the median of its Expense Group, but its actual total expense ratio was below the median of its Expense Group. The Board concluded that the Management Rate charged to the Fund is fair and reasonable. In doing so, the Board noted that the Fund’s actual total expense ratio reflected a fee waiver from management.
Franklin Growth and Income VIP Fund, Franklin Income VIP Fund, Franklin Rising Dividends VIP Fund, Franklin Small Cap Value VIP Fund, Franklin Strategic Income VIP Fund, Franklin U.S. Government Securities VIP Fund, Templeton Foreign VIP Fund and Templeton Global Bond VIP Fund – The Expense Group for the Franklin Growth and Income VIP Fund included the Fund and six other equity income funds underlying VIPs. The Expense Group for the Franklin Income VIP Fund included the Fund and five other mixed-asset target allocation moderate funds underlying VIPs. The Expense Group for the Franklin Rising Dividends VIP Fund included the Fund and eight other multi-cap core funds underlying VIPs. The Expense Group for the Franklin Small Cap Value VIP Fund included the Fund and seven other small-cap value funds underlying VIPs. The Expense Group for the Franklin Strategic Income VIP Fund included the Fund and eight other general bond funds underlying VIPs. The Expense Group for the Franklin U.S. Government Securities VIP Fund included the Fund and six other general U.S. government funds underlying
VIPs. The Expense Group for the Templeton Foreign VIP Fund included the Fund, five other international multi-cap value funds underlying VIPs and four international multi-cap core funds underlying VIPs. The Expense Group for the Templeton Global Bond VIP Fund included the Fund and six other global income funds underlying VIPs. The Board noted that the Management Rates and actual total expense ratios for these Funds were below the medians of their respective Expense Groups. The Board concluded that the Management Rates charged to these Funds are fair and reasonable. In doing so, the Board noted that, effective May 1, 2017, management agreed to add an additional breakpoint level of 0.4900% on assets that exceed $5 billion to the Franklin Rising Dividends VIP Fund’s Management Rate. The Board also noted that the Franklin Growth and Income VIP Fund’s actual total expense ratio reflected a fee waiver from management.
Franklin Small-Mid Cap Growth VIP Fund – The Expense Group for the Fund included the Fund and ten other mid-cap growth funds underlying VIPs. The Board noted that the Management Rate and actual total expense ratio for the Fund were each equal to the medians of its Expense Group. The Board concluded that the Management Rate charged to the Fund is fair and reasonable.
Franklin VolSmart Allocation VIP Fund – The Expense Group for the Fund included the Fund and four other flexible portfolio funds underlying VIPs. The Board noted the small size of the Expense Group. The Board also noted that the Management Rate for the Fund was below the median of its Expense Group and its actual total expense ratio (including underlying fund expenses) was equal to the median of its Expense Group. The Board concluded that the Management Rate charged to the Fund is fair and reasonable. In doing so, the Board noted that the Fund’s actual total expense ratio reflected a fee waiver from management and that the Sub-Advisers were paid by FAI out of the management fee FAI received from the Fund.
Franklin Global Real Estate VIP Fund, Franklin Large Cap Growth VIP Fund, Franklin Mutual Global Discovery VIP Fund, Franklin Mutual Shares VIP Fund, Templeton Developing Markets VIP Fund and Templeton Growth VIP Fund – The Expense Group for the Franklin Global Real Estate VIP Fund included the Fund and five other global real estate funds underlying VIPs. The Expense Group for the Franklin Large Cap Growth VIP Fund included the Fund and 10 other multi-cap growth funds underlying VIPs. The Expense Group for the Franklin Mutual Global Discovery VIP Fund included the Fund, two other global multi-cap value funds underlying
| Semiannual Report | SI-5 |
FRANKLIN TEMPLETON VARIABLE INSURANCE PRODUCTS TRUST
SHAREHOLDER INFORMATION
VIPs and four global multi-cap core funds underlying VIPs. The Expense Group for the Franklin Mutual Shares VIP Fund included the Fund and eight other large-cap value funds underlying VIPs. The Expense Group for the Templeton Developing Markets VIP Fund included the Fund and nine other emerging markets funds underlying VIPs. The Expense Group for the Templeton Growth VIP Fund included the Fund, two other global multi-cap value funds underlying VIPs, four global multi-cap core funds underlying VIPs and two global multi-cap growth funds underlying VIPs. The Board noted that the Management Rates and actual total expense ratios for these Funds were above the medians of their respective Expense Groups. The Board concluded that the Management Rates charged to the Funds are fair and reasonable. In doing so, the Board noted that the Management Rate for the Franklin Large Cap Growth VIP Fund was only one basis point above the median of its Expense Group. With respect to the Franklin Mutual Shares VIP Fund and the Franklin Mutual Global Discovery VIP Fund, the Board took into account management’s explanation that the portfolio management team makes investments in distressed securities and merger arbitrage that are specialist in nature and therefore merit a higher Management Rate. In the case of each of the Franklin Mutual Shares VIP Fund and the Templeton Growth VIP Fund, the respective Fund’s actual total expense ratio was only one basis point above the median ratio of the Fund’s Expense Group. Finally, with respect to the Franklin Global Real Estate VIP Fund, the Board accepted management’s explanation that the portfolio managers’ rigorous fundamental analysis with the inclusion of more active risk controls merits a higher Management Rate.
Profitability
The Board reviewed and considered information regarding the profits realized by each Manager and its affiliates in connection with the operation of each Fund. In this respect, the Board considered the Fund profitability analysis provided by each Manager that addresses the overall profitability of FTI’s U.S. fund business, as well as its profits in providing investment management and other services to each of the individual funds during the 12-month period ended September 30, 2016, being the most recent fiscal year-end for FRI. The Board noted that although management continually makes refinements to its methodologies used in calculating profitability in response to organizational and product related changes, the overall methodology has remained consistent with that used in the Funds’ profitability report presentations from prior years. Additionally, the Funds’ independent registered public accounting firm has been engaged by each Manager to
periodically review the reasonableness of the allocation methodologies to be used solely by the Funds’ Board with respect to the profitability analysis.
The Board noted management’s belief that costs incurred in establishing the infrastructure necessary for the type of mutual fund operations conducted by each Manager and its affiliates may not be fully reflected in the expenses allocated to each Fund in determining its profitability, as well as the fact that the level of profits, to a certain extent, reflected operational cost savings and efficiencies initiated by management. The Board also noted management’s expenditures in improving shareholder services provided to the Funds, as well as the need to implement systems and meet additional regulatory and compliance requirements resulting from recent SEC and other regulatory requirements.
The Board also considered the extent to which each Manager and its affiliates might derive ancillary benefits from fund operations, including revenues generated from transfer agent services, potential benefits resulting from personnel and systems enhancements necessitated by fund growth, as well as increased leverage with service providers and counterparties. Based upon its consideration of all these factors, the Board concluded that the level of profits realized by each Manager and its affiliates from providing services to each Fund was not excessive in view of the nature, quality and extent of services provided to each Fund.
Economies of Scale
The Board reviewed and considered the extent to which each Manager may realize economies of scale, if any, as each Fund grows larger and whether the Fund’s management fee structure reflects any economies of scale for the benefit of shareholders. With respect to possible economies of scale, the Board noted the existence of management fee breakpoints for each Fund (except for the Franklin VolSmart Allocation VIP Fund), which operate generally to share any economies of scale with a Fund’s shareholders by reducing the Fund’s effective management fees as the Fund grows in size. The Board considered each Manager’s view that any analyses of potential economies of scale in managing a particular fund are inherently limited in light of the joint and common costs and investments each Manager incurs across the Franklin Templeton family of funds as a whole. The Board concluded that to the extent economies of scale may be realized by each Manager and its affiliates, each Fund’s management fee structure (except that of the Franklin VolSmart Allocation VIP Fund) provided a sharing of benefits with the Fund and its shareholders as the Fund grows.
| SI-6 | Semiannual Report |
FRANKLIN TEMPLETON VARIABLE INSURANCE PRODUCTS TRUST
SHAREHOLDER INFORMATION
The Board recognized that there would not likely be any economies of scale for each of the Franklin Flex Cap Growth VIP Fund and Franklin VolSmart Allocation VIP Fund until the Fund’s assets grow.
Conclusion
Based on its review, consideration and evaluation of all factors it believed relevant, including the above-described factors and conclusions, the Board unanimously approved the continuation of each Management Agreement for an additional one-year period.
Board Approval of Investment Management Agreements
FRANKLIN TEMPLETON VARIABLE INSURANCE PRODUCTS TRUST
Franklin Rising Dividends VIP Fund
(Fund)
At a meeting held on May 23, 2017 (Meeting), the Board of Trustees (Board) of Franklin Templeton Variable Insurance Products Trust (Trust), including a majority of the trustees who are not “interested persons” as defined in the Investment Company Act of 1940 (Independent Trustees), reviewed and approved, and recommended to shareholders the approval of, a new investment management agreement between Franklin Advisers, Inc. (Manager) and the Fund (Management Agreement) for an initial two year period effective on or about December 1, 2017. The Independent Trustees received advice from and met separately with Independent Trustee counsel in considering whether to approve the Management Agreement.
The Board reviewed and considered information provided by the Manager at the Meeting. The Board also considered a form of Management Agreement, which is consistent with the agreements used across the Franklin Templeton Investments (FTI) organization, as well as the Code of Ethics and Insider Trading Compliance Policies and Procedures applied to the employees of the Manager. The Board discussed with FTI the reasons for its request that the Board approve the Management Agreement, including the benefits of the current portfolio management team, who would become employees of the Manager, having access to additional resources. The Board reviewed and considered all of the factors it deemed relevant in approving the Management Agreement, including, but not limited to: (i) the nature, extent, and quality of the services to be provided by the Manager; and (ii) the costs of the services, which are to remain unchanged. The Board also considered that
the change in the investment manager for the Fund facilitates a restructuring of the Fund’s current investment manager, Franklin Advisory Services, LLC (FASL), and the relocation of substantially all of the Fund’s current portfolio management team from FASL to the Manager. In determining that the Management Agreement is fair and reasonable, the Board also noted that the Management Agreement is substantially the same as the Fund’s current investment management agreement with FASL and does not reflect a substantially new or different level of services to or fees payable by the Fund.
Nature, Extent and Quality of Services
The Board considered information regarding the nature, extent and quality of investment management services to be provided by the Manager and its affiliates to the Fund and its shareholders. In particular, the Board took into account that the Fund will have the same investment goals, principal investment policies, and service provider arrangements (except with respect to the Manager) and other key factors. The Board discussed the fact that the same portfolio management team would serve the Fund but that there would be benefits to having them join the investment professionals at the Manager with a similar investment style. This realignment would promote greater collaboration through the sharing of resources and investment ideas. It also noted the Manager’s experience as manager of other funds and accounts, including those within the Franklin Templeton Investments (FTI) organization; the personnel, operations, financial condition, and investment management capabilities, methodologies and resources of the Manager and the Manager’s capabilities, as demonstrated by, among other things, its policies and procedures designed to prevent violations of the Federal securities laws, which had previously been approved by the Board in connection with its oversight of other funds in the FTI organization.
Following consideration of such information, the Board was satisfied with the nature, extent and quality of services to be provided by the Manager and its affiliates to the Fund and its shareholders.
Fund Performance
The Board noted that in connection with the restructuring of FASL that substantially all of the Fund’s current portfolio management team would be relocated from FASL to the Manager. The Board considered the track record of such portfolio management team in managing the Fund, which was reviewed most recently by the Board in April 2017 as part of the annual contract renewal process. With that, and the additional resources available to the portfolio management
| Semiannual Report | SI-7 |
FRANKLIN TEMPLETON VARIABLE INSURANCE PRODUCTS TRUST
SHAREHOLDER INFORMATION
team by joining the Manager, the Board was confident in the abilities of such portfolio management team to continue the investment approach of the Fund and to provide quality services to the Fund and its shareholders.
Comparative Fees and Expenses
The Board reviewed and considered information regarding the investment management fee to be charged by the Manager. The Board noted that the management fee to be paid by the Fund under the Management Agreement is identical to the management fee the Fund currently pays FASL, which fee was found to be acceptable in connection with the April 2017 annual contract renewal process. The Board concluded that the proposed investment management fee is fair and reasonable.
Management Profitability and Economies of Scale
The Board determined that its conclusions regarding profitability and economies of scale reached in connection with the April 2017 annual contract renewal of the existing investment management agreement with FASL that would continue in effect until the date the new Management Agreement becomes effective had not changed as a result of the proposed retention of the Manager in connection with the restructuring of FASL.
Conclusion
Based on its review, consideration and evaluation of all factors it believed relevant, including the above-described factors and conclusions, the Board unanimously approved the new Management Agreement for an initial two year period effective on or about December 1, 2017.
Board Approval of Investment Management Agreements
FRANKLIN TEMPLETON VARIABLE INSURANCE PRODUCTS TRUST
Templeton Developing Markets VIP Fund
(Fund)
At an in-person meeting held on May 23, 2017 (Meeting), the Board of Trustees (Board) of the Franklin Templeton Variable Insurance Products Trust, including a majority of the trustees who are not “interested persons” as defined in the Investment Company Act of 1940 (Independent Trustees), reviewed and approved, and recommended shareholder approval of, a new investment sub-advisory agreement between Templeton Asset Management Ltd. (Manager), the Fund’s investment manager, and Franklin Templeton Investment Management Limited (Sub-Adviser), an affiliate of the Manager, on behalf of the
Fund (Sub-Advisory Agreement) for an initial two year period. The Independent Trustees received advice from and met separately with Independent Trustee counsel in considering whether to approve the Sub-Advisory Agreement.
The Board reviewed and considered information provided by the Manager at the Meeting with respect to the Sub-Advisory Agreement. The Board reviewed and considered the factors it deemed relevant in approving the Sub-Advisory Agreement, including, but not limited to: (i) the nature, extent, and quality of the services to be provided by the Sub-Adviser; and (ii) the costs of the services to be provided by the Sub-Adviser. The Board considered that management proposed that the Board approve the Sub-Advisory Agreement in order to facilitate certain portfolio management team enhancements.
In approving the Sub-Advisory Agreement, the Board, including a majority of the Independent Trustees, determined that the proposed investment sub-advisory fees are fair and reasonable and that the approval of such Sub-Advisory Agreement is in the interests of the Fund and its shareholders. While attention was given to all information furnished, the following discusses some primary factors relevant to the Board’s determination.
Nature, Extent and Quality of Services
The Board reviewed and considered information regarding the nature, extent and quality of investment management services to be provided by the Sub-Adviser and currently being provided by the Manager and its affiliates to the Fund and its shareholders. In particular, with respect to the Sub-Adviser, the Board took into account that the Sub-Advisory Agreement would not affect how the Fund is managed or the Fund’s investment goal, principal investment strategies or principal risks associated with an investment in the Fund. The Board reviewed and considered information regarding the nature, quality and extent of investment sub-advisory services to be provided by the Sub-Adviser to the Fund and its shareholders under the Sub-Advisory Agreement; the Sub-Adviser’s experience as manager of other funds and accounts, including those within the Franklin Templeton Investments (FTI) organization; the personnel, operations, financial condition, and investment management capabilities, methodologies and resources of the Sub-Adviser and the Sub-Adviser’s capabilities, as demonstrated by, among other things, its policies and procedures designed to prevent violations of the Federal securities laws, which had previously been approved by the Board in connection with its oversight of other funds in the FTI organization.
| SI-8 | Semiannual Report |
FRANKLIN TEMPLETON VARIABLE INSURANCE PRODUCTS TRUST
SHAREHOLDER INFORMATION
The Board also reviewed and considered the benefits provided to Fund shareholders of investing in a fund that is part of the Franklin Templeton family of funds. The Board noted the financial position of Franklin Resources, Inc. (FRI), the Manager’s and the Sub-Adviser’s parent, and its commitment to the mutual fund business as evidenced by its continued introduction of new funds, reassessment of the fund offerings in response to the market environment and project initiatives and capital investments relating to the services provided to the Fund by the (FTI) organization.
Following consideration of such information, the Board was satisfied with the nature, extent and quality of services to be provided by the Sub-Adviser to the Fund and its shareholders.
Fund Performance
The Board noted its review and consideration of the performance results of the Fund in connection with the April 2017 annual contract renewal. The Board recalled its conclusion at that time that the Fund’s performance was acceptable. The Board further recalled recent and expected portfolio management team changes for the Fund and again determined that, in light of these changes, additional time will be needed to evaluate the effectiveness of management’s actions.
Comparative Fees and Expenses
The Board reviewed and considered information regarding the investment sub-advisory fee to be charged by the Sub-Adviser. The Board noted that the addition of the Sub-Adviser will have no impact on the amount of management fees that are currently paid by the Fund as the Sub-Adviser will be paid by the Manager out of the management fee that the Manager receives from the Fund. The Board further noted that the allocation of the fee between the Manager and the Sub-Adviser reflected the services to be provided by each. The Board concluded that the proposed investment sub-advisory fee is fair and reasonable.
Management Profitability and Economies of Scale
The Board determined that its conclusions regarding profitability and economies of scale reached in connection with the April 2017 annual contract renewal of the existing investment management agreement with the Manager had not changed as a result of the proposal to approve the Sub-Advisory Agreement.
Conclusion
Based on its review, consideration and evaluation of all factors it believed relevant, including the above-described factors and
conclusions, the Board unanimously approved the Sub-Advisory Agreement for an initial two year period.
Proxy Voting Policies and Procedures
The Trust’s investment manager has established Proxy Voting Policies and Procedures (Policies) that the Trust uses to determine how to vote proxies relating to portfolio securities. Shareholders may view the Trust’s complete Policies online at franklintempleton.com. Alternatively, shareholders may request copies of the Policies free of charge by calling the Proxy Group collect at (954) 527-7678 or by sending a written request to: Franklin Templeton Companies, LLC, 300 S.E. 2nd Street, Fort Lauderdale, FL 33301, Attention: Proxy Group. Copies of the Trust’s proxy voting records are also made available online at franklintempleton.com and posted on the U.S. Securities and Exchange Commission’s website at sec.gov and reflect the most recent 12-month period ended June 30.
Quarterly Statement of Investments
The Trust files a complete statement of investments with the U.S. Securities and Exchange Commission for the first and third quarters for each fiscal year on Form N-Q. Shareholders may view the filed Form N-Q by visiting the Commission’s website at sec.gov. The filed form may also be viewed and copied at the Commission’s Public Reference Room in Washington, DC. Information regarding the operations of the Public Reference Room may be obtained by calling (800) SEC-0330.
| Semiannual Report | SI-9 |
This page intentionally left blank.

Semiannual Report
Franklin Templeton Variable Insurance Products Trust
Investment Managers
Franklin Advisers, Inc.
Franklin Advisory Services, LLC
Franklin Mutual Advisers, LLC
Franklin Templeton Institutional, LLC
Templeton Asset Management Ltd.
Templeton Global Advisors Limited
Templeton Investment Counsel, LLC
Fund Administrator
Franklin Templeton Services, LLC
Distributor
Franklin Templeton Distributors, Inc.
Franklin Templeton Variable Insurance Products Trust (FTVIP) shares are not offered to the public; they are offered and sold only to: (1) insurance company separate accounts (Separate Account) to serve as the underlying investment vehicle for variable contracts; (2) certain qualified plans; and (3) other mutual funds (funds of funds).
Authorized for distribution to investors in Separate Accounts only when accompanied or preceded by the current prospectus for the applicable contract, which includes the Separate Account and the FTVIP prospectuses. Investors should carefully consider a fund’s investment goals, risks, charges and expenses before investing. The prospectus contains this and other information; please read it carefully before investing.
To help ensure we provide you with quality service, all calls to and from our service areas are monitored and/or recorded.
| © 2017 Franklin Templeton Investments. All rights reserved. | VIP1 S 08/17 |
| Item 2. | Code of Ethics. |
| (a) | The Registrant has adopted a code of ethics that applies to its principal executive officers and principal financial and accounting officer. |
| (c) | N/A |
| (d) | N/A |
| (f) | Pursuant to Item 12 (a) (1), the Registrant is attaching as an exhibit a copy of its code of ethics that applies to its principal executive officers and principal financial and accounting officer. |
| Item 3. | Audit Committee Financial Expert. |
(a) (1) The Registrant has an audit committee financial expert serving on its audit committee.
| (2) | The audit committee financial expert is John B. Wilson and he is “independent” as defined under the relevant Securities and Exchange Commission Rules and Releases. |
| Item 4. | Principal Accountant Fees and Services. | N/A |
| Item 5. | Audit Committee of Listed Registrants. | N/A | ||
| Item 6. | Schedule of Investments. | N/A | ||
| Item 7. | Disclosure of Proxy Voting Policies and Procedures for Closed-End Management Investment Companies. | N/A | ||
| Item 8. | Portfolio Managers of Closed-End Management Investment Companies. | N/A | ||
| Item 9. | Purchases of Equity Securities by Closed-End Management Investment Company and Affiliated Purchasers. | N/A | ||
| Item 10. | Submission of Matters to a Vote of Security Holders. | |||
There have been no changes to the procedures by which shareholders may recommend nominees to the Registrant’s Board of Trustees that would require disclosure herein.
| Item 11. | Controls and Procedures. |
(a) Evaluation of Disclosure Controls and Procedures. The Registrant maintains disclosure controls and procedures that are designed to ensure that information required to be disclosed in the Registrant’s filings under the Securities Exchange Act of 1934 and the Investment Company Act of 1940 is recorded, processed, summarized and reported within the periods specified in the rules and forms of the Securities and Exchange Commission. Such information is accumulated and communicated to the Registrant’s management, including its principal executive officer and principal financial officer, as appropriate, to allow timely decisions regarding required disclosure. The Registrant’s management, including the principal executive officer and the principal financial officer, recognizes that any set of controls and procedures, no matter how well designed and operated, can provide only reasonable assurance of achieving the desired control objectives.
Within 90 days prior to the filing date of this Shareholder Report on Form N-CSR, the Registrant had carried out an evaluation, under the supervision and with the participation of the Registrant’s management, including the Registrant’s principal executive officer and the Registrant’s principal financial officer, of the effectiveness of the design and operation of the Registrant’s disclosure controls and procedures. Based on such evaluation, the Registrant’s principal executive officer and principal financial officer concluded that the Registrant’s disclosure controls and procedures are effective.
(b) Changes in Internal Controls. There have been no changes in the Registrant’s internal controls or in other factors that could materially affect the internal controls over financial reporting subsequent to the date of their evaluation in connection with the preparation of this Shareholder Report on Form N-CSR.
| Item 12. | Exhibits. |
(a) (1) Code of Ethics
(a) (2) Certifications pursuant to Section 302 of the Sarbanes-Oxley Act of 2002 of Matthew T. Hinkle, Chief Executive Officer - Finance and Administration, and Gaston Gardey, Chief Financial Officer and Chief Accounting Officer
(b) Certifications pursuant to Section 906 of the Sarbanes-Oxley Act of 2002 of Matthew T. Hinkle , Chief Executive Officer - Finance and Administration, and Gaston Gardey, Chief Financial Officer and Chief Accounting Officer
SIGNATURES
Pursuant to the requirements of the Securities Exchange Act of 1934 and the Investment Company Act of 1940, the registrant has duly caused this report to be signed on its behalf by the undersigned, thereunto duly authorized.
Franklin Templeton Variable Insurance Products Trust
| By | /s/ Matthew T. Hinkle | |
| Matthew T. Hinkle | ||
| Chief Executive Officer – | ||
| Finance and Administration | ||
| Date August 25, 2017 | ||
Pursuant to the requirements of the Securities Exchange Act of 1934 and the Investment Company Act of 1940, this report has been signed below by the following persons on behalf of the registrant and in the capacities and on the dates indicated.
| By | /s/ Matthew T. Hinkle | |
| Matthew T. Hinkle | ||
| Chief Executive Officer – | ||
| Finance and Administration | ||
| Date August 25, 2017 | ||
| By | /s/ Gaston Gardey | |
| Gaston Gardey | ||
| Chief Financial Officer and | ||
| Chief Accounting Officer | ||
| Date August 25, 2017 | ||